WDP-98 - World Bank Documents
284
WDP-98 SECOND GLOBAL PROSPECTS CONFERENCE Background Papers 98 U231 World Bank Discussion Papers Problems of Developing Countries in the 1990s Volume II Country Studies F. Desmond McCarthy Public Disclosure Authorized Public Disclosure Authorized Public Disclosure Authorized Public Disclosure Authorized
-
Upload
khangminh22 -
Category
Documents
-
view
0 -
download
0
Transcript of WDP-98 - World Bank Documents

WDP-98SECOND GLOBAL PROSPECTS CONFERENCE
Background Papers
98 U231 World Bank Discussion Papers
Problems ofDeveloping Countriesin the 1990s
Volume IICountry Studies
F. Desmond McCarthy
Pub
lic D
iscl
osur
e A
utho
rized
Pub
lic D
iscl
osur
e A
utho
rized
Pub
lic D
iscl
osur
e A
utho
rized
Pub
lic D
iscl
osur
e A
utho
rized
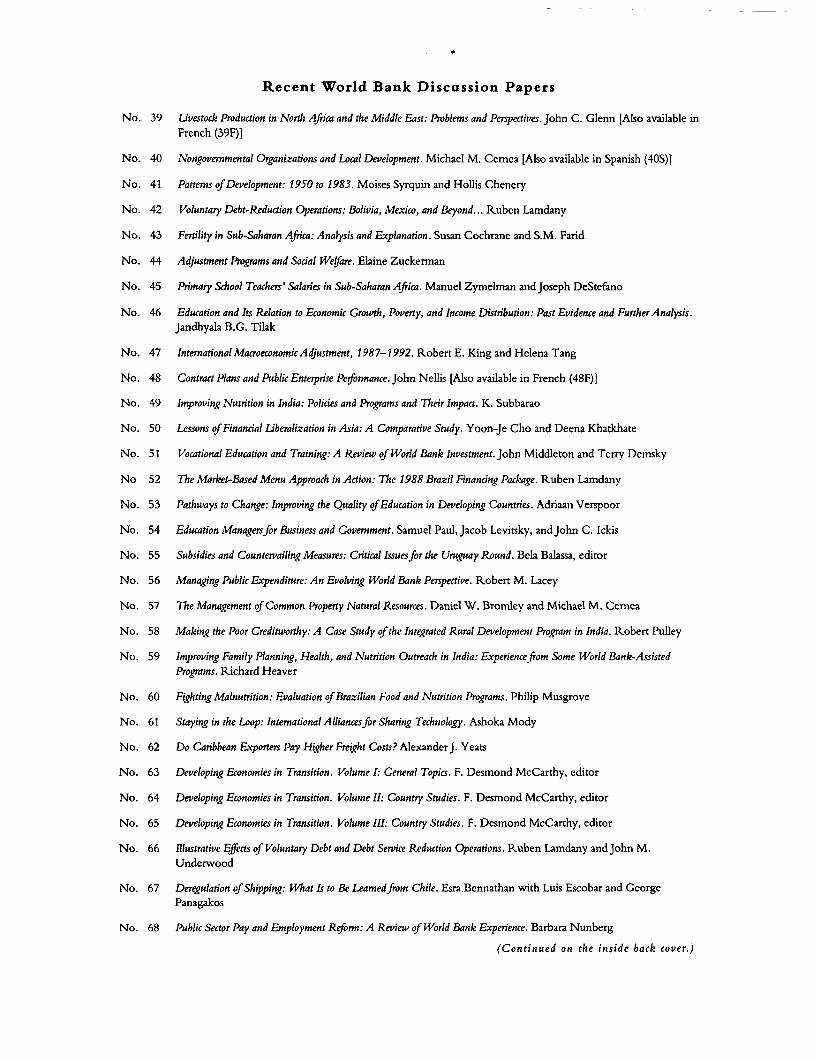
Recent World Bank Discussion Papers
No. 39 Livestock Production in North Africa and the Middle East: Problems and Perspectives. John C. Glenn [Also available inFrench (39F)]
No. 40 Nongovemmental Organizations and Local Development. Michael M. Cernea [Also available in Spanish (40S)]
No. 41 Patters of Development: 1950 to 1983. Moises Syrquin and Hollis Chenery
No. 42 Voluntary Debt-Reduaion Operations: Bolivia, Mexico, and Beyond... Ruben Lamdany
No. 43 Fertility in Sub-Saharan Africa: Analysis and Explanation. Susan Cochrane and S.M. Farid
No. 44 Adjustment Programs and Social Welfare. Elaine Zuckerman
No. 45 Primary School Teachers' Salaries in Sub-Saharan Africa. Manuel Zymelman and Joseph DeStefano
No. 46 Education and Its Relation to Economic Growth, Poverty, and Income Distribution: Past Evidence and Further Analysis.Jandhyala B.G. Tilak
No. 47 International Maaoeconomic Adjustment, 1987-1992. Robert E. King and Helena Tang
No. 48 Contract Plans and Public Enterprise Pe!formance. John Nellis [Also available in French (48F)]
No. 49 Improving Nutrition in India: Policies and Programs and Their Impact. K. Subbarao
No. 50 Lessons of Financial Liberalization in Asia: A Comparative Study. Yoon-Je Cho and Deena Khatkhate
No. 51 Vocational Education and Training: A Review of World Bank Investment. John Middleton and Terry Demsky
No 52 The Market-Based Menu Approach in Action: The 1988 Brazil Financing Package. Ruben Lamdany
No. 53 Pathways to Change: Improving the Quality of Education in Developing Countries. Adriaan Verspoor
No. 54 Education Managersfor Business and Govemment. Samuel Paul, Jacob Levitsky, andJohn C. Ickis
No. 55 Subsidies and Countervailing Measures: Critical Issuesfor the Uruguay Round. Bela Balassa, editor
No. 56 Managing Public Expenditure: An Evolving World Bank Perspective. Robert M. Lacey
No. 57 The Management of Common Property Natural Resources. Daniel W. Bromnley and Michael M. Cernea
No. 58 Making the Poor Creditworthy: A Case Study of the Integrated Rural Development Program in India. Robert Pulley
No. 59 Improving Family Planning, Health, and Nutrition Outreach in India: Experiencefrom Some World Bank-AssistedPrograms. Richard Heaver
No. 60 Fighting Malnutrition: Evaluation of Brazilian Food and Nutrition Programs. Philip Musgrove
No. 61 Staying in the Loop: International Alliancesfor Sharing Technology. Ashoka Mody
No. 62 Do Caribbean Exporters Pay Higher Freight Costs? AlexanderJ. Yeats
No. 63 Developing Economies in Transition. Volume I: General Topics. F. Desmond McCarthy, editor
No. 64 Developing Economies in Transition. Volume II: Country Studies. F. Desmond McCarthy, editor
No. 65 Developing Economies in Transition. Volume III: Country Studies. F. Desmond McCarthy, editor
No. 66 Illustrative Effects of Voluntary Debt and Debt Service Reduction Operations. Ruben Lamdany and John M.Underwood
No. 67 Deregulation of Shipping: What Is to Be Learnedfrom Chile. Esra.Bennathan with Luis Escobar and GeorgePanagakos
No. 68 Public Sector Pay and Employment Reform: A Review of World Bank Experience. Barbara Nunberg
(Continued on the inside back cover.)
SECOND GLOBAL PROSPECTS CONFERENCE
Background Papers
98 = World Bank Discussion Papers
Problems ofDeveloping Countnresin the 1990s
Volume IICountry Studies
F. Desmond McCarthy, editor
The World BankWashington, D.C.
Copyright C 1990The International Bank for Reconstructionand Development/THE WORLD BANK1818 H Street, N.W.Washington, D.C. 20433, U.S.A.
All rights reservedManufactured in the United States of AmericaFirst printing November 1990
Discussion Papers present results of country analysis or research that is circulated to encourage discussionand comnment within the development community. To present these results with the least possible delay, thetypescript of this paper has not been prepared in accordance with the procedures appropriate to fomialprinted texts, alnd the World Bank accepts no responsibility for errors.
The findings, interpretations, and conclusions expressed in this paper are entirely those of the author(s) andshould not be attributed in any manner to the World Bank, to its affiliated organizations, or to members ofits Board of Executive Directors or the countries they represenit. The World Bank does not guarantee theaccuracy of the data included in this publication and accepts no responsibility whatsoever for anyconsequence of their use. Any maps that accompany the text have been prepared solely for the convenienceof readers; the designations and presenltatioml of material in them do not imply the expression of any opinionwhatsoever on the part of the World BanLk, its affiliates, or its Board or member countries concerning thelegal status of any country, territory, city, or area or of the authorities thereof or concerning the delimitationof its boundaries or its national affiliation.
The material in this publication is copyrighted. Requests for permission to reproduce portions of it shouldbe sent to Director, Publications Departnment, at the address shown in the copyright notice above. TheWorld Bank encourages dissemination of its work and will normally give permission promptly and, when thereproduction is for noncommercial purposes, without asking a fee. Pemlission to photocopy portions forclassroom use is not required, though notification of such use having been made will be appreciated.
The complete backlist of publications from the World Bank is shown in the annual Index of Publications,which contains an alphabetical title list (with full ordering information) and indexes of subjects, authors, andcountries and regions. The latest edition is available free of charge from the Publications Sales Unlit,Department F, The World Bank, 1818 H Street, N.W., Washington, D.C. 20433, U.S.A., or fromPublications, The World Bank, 66, avenue d'1ena, 75116 Paris, France.
ISSN: 0259-210X
F. Desmond McCarthy is principal econonmist in the Internationial Economic Analysis and ProspectsDivision of the World Bank's International Economics Department.
Library of Congress Cataloging-in-Publication Data
Global Prospects Conference (2nd : 1990 : World Bank)Problems of developing countries in the 1990s / F. Desmond
McCarthy, editor.p. cm. -- (World Bank discussion papers ; 97-98)
At head of title: Second Global Prospects Conference, backgroundpapers.Conference held at the World Bank, Washington, D.C., Apr. 30-May
1, 1990.Contents: v. 1. General topics -- v. 2. Country studies.ISBN (invalid) 0-8213-1623-X (v. 1). -- ISBN 0-8213-1633-8 (v. 2)1. Economic forecasting--Developing countries--Congresses.
2. Developing countries--Economic conditions--Congresses.3. Economic forecasting--Europe, Eastern--Congresses. 4. Europe,Eastern--Economic conditions--1989- --Congresses. I. McCarthy, F.Desmond, 1936- . II. Title. III. Series.HC59.7.C57 1990330.9'009172'4--dc20 90-12855
CIP
- iii -
ACKNOWLEDGMENTS
The second Global Prospects Conference was held at the World Bank,Washington, D.C. on April 30-May 1, 1990. It was sponsored by the InternationalEconomics Department (IEC) and Development Economics (DEC). The stated purposeof the conference was to help strengthen the analysis and forecasting capabilityfor global sample of countries: (a) in their view what will be the leadingeconomic issues of the nineties at the country and global level; (b) how eachviews his own economy evolving; and (c) how they view the linkage to the globaleconomy.
There were nine country studies presented at the conference byrepresentatives from selected developing countries while two papers by Bankstaff were on the economic issues for the nineties and the global accountingframework: DEC analytical database. The conference closed with a round tablediscussion on methodology and developing country policy issues. Three othergeneral topics were discussed by representatives from academia: (a) foreignresource flows and developing country growth; (b) problems and prospects forEastern Europe in the 1990s; and (c) role of government.
Volume 1 contains an overview paper, two Bank staff papers, andgeneral topics.
Volume 2 contains an overview paper, nine country studies and notesfrom the Round Table discussion.
I would like to thank Ms. Milagros Divino and Ms. Allison Strongfor their contribution in the preparation of these two volumes.

- iv -
CONFERENCE PARTICIPANTS
Johannes Linn, Director, IECPaul Armington, Division Chief, IECAPCharles Blitzer, Principal Industrial Economist, LACF. Desmond McCarthy, Principal Economist, IECAP*Shahrokh Fardoust, Senior Economist, IECAP*Richard Eckaus, Chairman, MIT Department of Economics**Korkut Boratav, Professor, University of Ankara, Turkey*James Hanson, Lead Economist, IECDI**Stanley Fischer, Vice President and Chief Economist, DECVPLance Taylor, Professor, MIT*Sweder van Wijnbergen, Lead Economist, LA2CO**Michael Gavin, Professor, Columbia University*Sue Collins, Professor, Harvard University/CEA**Felipe Morande, ILADES/Georgetown University, Chile*Luca Barbone, Senior Economist, LAC**Miroslaw Gronicki, Professor, University of Pennsylvania*Timothy King, Division Chief, EDIST**Azizur Rahman Khan, Professor, University of California, Riverside, California*Nora Lustig, Brookings Institute*V. Fitzgerald, Professor, Institute of Social Studies, The Hague**Claudio Frischtak, Principal Industrial Economist, IENINJ. Dirck Stryker, Professor, Tufts University*Patrick Honohan, Senior Economist, CECFP**Kenneth K. Meyers, Consultant, World Bank*Charles Humphreys, Principal Economist, AFTTF**Helen Shapiro, Professor, Harvard University*Enzo Grilli, Chief Economist, EAS**V.N. Gnanathurai, EPU, Government of Malysia*Frank Lysy, Principal Economist, LA3C1Andrew Steer, Economic Adviser, DECVPManuel Montes, East-West Center, Hawaii*Rob Vos, Professor, Institute of Social Studies, The Hague**E. Mick Riordan, Consultant, IECAP*D.C. Rao, Director, FRS
* Presentor of paper** Lead discussant of paper

CONTENTS OF THE SERIES
VOLUME 1. GENERAL TOPICS
ACKNOWLEDGMENTS
CONFERENCE PARTICIPANTS
OVERVIEW OF THE CONFERENCEF. Desmond McCarthy
ECONOMIC ISSUES FOR THE NINETIESby F. Desmond McCarthy and Shahrokh Fardoust(Discussant: Richard Eckaus)
FOREIGN RESOURCE FLOWS AND DEVELOPINGCOUNTRY GROWTH: A THREE-GAP MODEL
by Lance Taylor(Discussant: Sweder van Wijnbergen)
PROBLEMS AND PROSPECTS FOR ECONOMICDEVELOPMENT IN EASTERN EUROPE IN THE 1990s
by Miroslaw Gronicki and Joshua Charap(Discussant: Timothy King)
RENT SEEKING OR RENT REDISTRIBUTION?AUTOMOBILE FIRMS AND THE BRAZILIAN STATE1956-68
by Helen Shapiro(Discussant: Enzo Grilli)
GLOBAL ACCOUNTING FRAMEWORK: DECANALYTICAL DATABASE
by E. Mick Riordan(Discussant: Rob Vos)
VOLUME 2. COUNTRY STUDIES
CHILE: RECENT PAST, PROSPECTS, AND CHALLENGESby Felipe Morande(Discussant: Luca Barbone)
JAMAICA: CAN THE RECOVERY BE SUSTAINED?by Michael Gavin(Discussant: Sue Collins)
THE MEXICAN ECONOMY IN THE EIGHTIES: ANOVERVIEW
by Nora Lustig(Discussant: V. Fitzgerald)
- vi-
ECONOMIC PERFORMANCE IN BANGLADESH DURINGTHE 1970s AND THE 1980s AND PROSPECTS FOR THEFUTURE
by Azizur Rahman Khan(Discussant: Richard Eckaus)
MALAYSIA: PATHWAYS TO STABLE GROWTH WITHEQUITY
by V.N. Gnanathurai(Discussant: Frank Lysy)
THE PHILIPPINE ECONOMY IN 1990: RECOVERY ANDRESTORATION
by Manuel Montes(Discussant: Rob Vos)
ADJUSTMENT IN WEST AFRICA: THE GUINEAEXPERIENCE
by J. Dirck Stryker(Discussant: Patrick Honohan)
EMERGING MAIAWIby Kenneth K. Meyers(Discussant: Charles Humphreys)
THE MEDIUM-TERM PROSPECTS FOR THE TURKISHECONOMY
by Korkut Boratav(Discussant: James Hanson)
ROUND TABLE DISCUSSIONChaired by: Paul Armington

- vii -
TABLE OF CONTENTS
Page No.
ACKNOWLEDGMENTS . . . . . . . . . . . . . . . . . . . . . . . . iii
CONFERENCE PARTICIPANTS ... . . . . . . . . . . . . . . . . . iv
OVERVIEW OF THE CONFERENCE ................F. Desmond McCarthy
CHILE: RECENT PAST, PROSPECTS, AND CHALLENGES . . . . . .7by Felipe MorandeDiscussant: Luca Barbone
JAMAICA: CAN THE RECOVERY BE SUSTAINED? . . . . . . . . . . . 37by Michael GavinDiscussant: Sue Collins
THE MEXICAN ECONOMY IN THE EIGHTIES: AN OVERVIEW . . . . . . . 71by Nora LustigDiscussant: V. Fitzgerald
ECONOMIC PERFORMANCE IN BANGLADESH DURING THE 1970s ANDTHE 1980s AND PROSPECTS FOR THE FUTURE . . . . . . . . . . . . 99
by Azizur Rahman KhanDiscussant: Richard Eckaus
MALAYSIA: PATHWAYS TO STABLE GROWTH WITH EQUITY . . . . . . . 121by V.N. GnanathuraiDiscussant: Frank Lysy
THE PHILIPPINE ECONOMY IN 1990: RECOVERY AND RESTORATION . . . 151
by Manuel MontesDiscussant: Rob Vos
ADJUSTMENT IN WEST AFRICA: THE GUINEA EXPERIENCE . . . . . . . 183by J. Dirck StrykerDiscussant: Patrick Honohan
EMERGING MALAWI .... . . . . . . . . . . . . . . . . . . . . 203by Kenneth K. MeyersDiscussant: Charles Humphreys
THE MEDIUM-TERM PROSPECTS FOR THE TURKISH ECONOMY . . . . . . . 229by Korkut BoratavDiscussant: James Hanson
ROUND TABLE DISCUSSION . . . . . . . . . . . . . . . . . . . . 257Chaired by: Paul Armington


OVERVIEW
OF THE SECOND GLOBAL PROSPECTS CONFERENCE
APRIL 30-MAY 1, 1990
PROBLEMS OF DEVELOPING COUNTRIES IN THE 1990s
F. Desmond McCarthy

- 3 -
SECOND GLOBAL PROSPECTS CONFERENCE
Problems for the Nineties
The decade of the nineties is expected to result in significantimprovement over what has now come to be known as the 'lost decade of theeighties. " The Second Global Prospects Conference sought to address the problemsfacing developing countries for the coming decade by inviting a number of expertsto present views on selected topics of general interest together with arepresentative sample of country studies. The broad objective was to identifyand discuss the problems of development to be faced by policy makers in thenineties with a bias towards the practical perspective.
There were five papers on general topics: economic issues for thenineties, role of government, foreign resource flows and developing countrygrowth, Eastern Europe and finally a paper updating work on the global accountingframework. There were nine country studies. The countries were chosen toreflect a number of criteria--offer a reasonable geographic distribution,successful and not so successful experiences, small and large countries, togetherwith some of the less fashionable countries. From Latin America, Mexico andChile were chosen; from the Caribbean, Jamaica; from South Asia, Bangladesh; fromSouth East Asia, Malaysia and the Philippines; from the Mediterranean region,Turkey, while East and West Africa were represented by Malawi and Guinearespectively. Each paper had an official discussant and the conference concludedwith a Round Table discussion on issues for the nineties.
General Topics
The opening paper provided a review of global economic developmentsin the eighties together with a broad tour d'horizon of economic issues for thenineties. The industrial countries enjoyed a strong performance largelyresulting from policy changes introduced at the beginning of the decade.Typically these involved restrictive monetary policy to contain inflationarypressures and a wide range of structural reforms to enhance supply conditionsand improve the functioning of markets. The performance among developingcountries varied greatly. Those that did well, largely in Asia, had investmentto GDP ratios above 22 percent and were able to achieve a policy mix that enabledthem to take advantage of opportunities in the global market. In the ninetiesthis broad pattern is expected to continue. The industrial countries areprojected to maintain robust growth but at a slightly lower level than in thelate eighties. Increased globalization of the world economy is expected astrade, financial and production linkages are intensified. Among developingcountries the more dynamic economies especially in Asia are expected to achievegrowth rates of around 6 percent while the prospects for many of the countriesin Latin America and especially in Africa are about half that level. When onefactors in population growth rates the new decade does not hold too much promisefor many of the poorer countries in Africa. The financing of development hasundergone major changes during the past decade. The most notable change hasbeen the precipitous decline of flows from commercial banks compared with the

- 4 -
levels earlier in the decade. This in turn has led to an increasing role forthe official lending agencies. In short this means that for the great majorityof developing countries resources for development will have to be increasinglygenerated domestically. This in turn implies the need for a credible governmentpolicy that can ensure the flow of adequate fiscal resources and at the same timeprovide the right milieu for private investors. Among events on theinternational scale are Europe '92 and structural changes in Eastern Europe.The former is expected to lead to a larger and freer market in Europe in a morecompetitive environment. There is also increasing discussion of reciprocitywhich may be a vehicle for some protectionist forces. This may lead to somedifficulties especially for the dynamic export-oriented economies of Asia.Developments in Eastern Europe are likely to lead to some resources beingchanneled in that direction. Over time it is expected that this region willattract significant direct investment flows and maybe some redirection of flowsto other LMICs. As these economies restructure it is expected that they willgenerate increased competition in the global economy but over time it is alsoexpected that increased effective demand will result. Perhaps an even moreinteresting fallout will be the lessons or new paradigms that may result fordevelopment from the rapid changes occurring in Eastern Europe.
A major theme that pervaded a number of the papers was what shouldbe the appropriate role of the state. The paper by Shapiro offered anilluminating case study of the automobile industry in Brazil in the period 1956-1968. The analysis indicated that in this instance the state was able to extractrents from the private sector and use them to shape investment behavior. Thusshe argues that, with stable policy and concomitant credibility, the state wasable to reduce the role of uncertainty and essentially eliminate the role ofdirectly unproductive rent seeking activities. This offers one possible approachto ensure that state intervention does not necessarily lead to an inefficientoutcome in either a static or dynamic sense.
The paper by Taylor focussed on the role of foreign resource flowsin the growth of developing countries. Based on a set of studies of 17developing countries he estimated that an additional inflow of about US$40billion would be needed to support an extra one percentage point in fastercapacity growth in the medium term. In order to restore historical growth ratesto Sub-Saharan Africa and Latin America much larger transfers would be needed.
Gronicki discussed the recent changes in Eastern Europe and thelikely economic evolution in the next few years. The demise of the centralplanning paradigm in those countries marks a watershed in economic policy making.The debate will continue on the appropriate role for the state and how to easethe transition towards more market-based economies. Many problems remain to beaddressed, from determining the ownership of property to putting some form ofsecurity net in place, to moderate the social costs and concomitant pressuresfrom the consequences of restructuring the economy. The problems faced by policymakers vary across these countries from the relatively well managedCzechoslovakia to the impoverished Romania.
In a somewhat more technical vein Riordan reviewed progress on theGlobal Accounting Framework. This is part of an ongoing effort at the World

-5
Bank to develop a unified data system for all major global economic accounts.The author indicated that country-specific data bases are now being added andhe provided examples of both cross-section and time-series views of selectedcountry databases. It is expected that this data base will be made availableto the public at large in a format that can be readily adopted to suit individualcountry groupings.
Country Studies
There were three Latin American studies which covered a wide rangeof experiences: Chile, Jamaica and Mexico. Chile has managed to generate astable economic milieu while Mexico, after rescheduling its external debt, isbeginning to resume growth. Jamaica had a number of stabilization plans in theearly eighties which failed to induce the needed reforms. Presently it seemsthat it will need some restructuring of its official debt.
The two African case studies were symptomatic of many of the problemsof that continent. Guinea has seemingly a whole plethora of problems ofunderdevelopment ranging from poor institutions through illiteracy tomalnutrition. In addition Malawi is faced by a major challenge from the AIDSepidemic.
The one country from the Mediterranean region, Turkey, presented aninteresting analysis of winners and losers under a structural reform program.It was argued that the traditional rentiers, the industrialists, were graduallyreplaced by financiers.
The three countries from Asia were Bangladesh, Malaysia and thePhilippines. Bangladesh continues to face major problems of poverty exacerbatedby a high population growth rate. The Philippines is torn by domestic politicalstrife. Perhaps one of the few good stories is Malaysia, where a pragmaticpolicy mix seems to be achieving remarkable results.
In short, many of the problems of the eighties are still with us aswe enter the nineties. In many countries these have become exacerbated.However, the debate has become less polemical and more practical. Perhaps thenineties will see a much more pragmatic approach to policy so that the majorproblems of development will begin to be redressed.
Economists studying the development process have always been readyto admit that economics is only part of the problem. Social, legal andinstitutional factors, together with the historical perspectives, were recognizedby many to be of major importance. However, it now seems that economists maynot be able to solve even the economic problems; in many instances a new paradigmis needed. Countries such as Malawi seem to have followed the "right"prescription but with little success while Malaysia seems to have achieved agreat deal of success with policies that traditionalists might eschew.

CHILE
RECENT PAST, PROSPECTS, AND CHALLENGES
Felipe Morande
With commentary by Luca Barbone


- 9 -
ACKNOWLEDGMENTS
The author wishes to thank Klaus Schmidt-Hebbel and Raimundo Soto forhelpful comments, and Eduardo Saavedra for comments and research assistance.

- 11 -
TABLE OF CONTENTS
Page No.
MACROECONOMIC VARIABLES IN THE LAST TWO DECADES . . . . . . . . . . . 13
ECONOMIC POLICIES IN RECENT YEARS . . . . . . . . . . . . . . . . . . 15
MAIN PROBLEMS AND RISKS FOR THE FUTURE . . . . . . . . . . . . . . . 18
POLITICS AND THE SOCIAL COSTS OF ADJUSTMENT . . . . . . . . . . . . . 21
CLOSING REMARKS . . . . . . . . . . . . . . . . . . . . . . . . . . . 23
TABLES
1 National Accounts . . . . . . . . . . . . . . . . . . . . . . . . 242 Current Account Data . . . . . . . . . . . . . . . . . . . . . . . 253 Public Sector . . . . . . . . . . . . . . . . . . . . . . . . . . 264 Incentive Indicators Prices . . . . . . . . . . . . . . . . . . . . 27
CHARTS
1 Gross Domestic Product . . . . . . . . . . . . . . . . . . . . . . 282 Investment .... . . . . . . . . . . . . . . . . . . . . . . . . 283 Inflation .... . . . . . . . . . . . . . . . . . . . . . . . . 294 Real Copper Prices . . . . . . . . . . . . . . . . . . . . . . . . 305 Real Exchange Rate Index ... . . . . . . . . . . . . . . . . . . 306 Exports of Goods . . . . . . . . . . . . . . . . . . . . . . . . . 317 Imports of Goods . . . . . . . . . . . . . . . . . . . . . . . . . 318 Foreign Debt . . . . . . . . . . . . . . . . . . . . . . . . . . . 32
APPENDIX . . . . . . . . . . . . . . . . . . . . . . . . . . . . . . 33
COMMENTARY BY LUCA BARBONE ..................... 35


- 13 -
In recent years, the performance of the Chilean economy has beenpositive--a sharp contrast to the rest of Latin America. While the rest of theregion has been beset by severe recession and widespread inflation, Chile hasenjoyed significant growth for six years, while inflation has been kept undercontrol at rates close to or below 20 percent per year. In the meantime,progress in servicing foreign debt has helped widen access to foreign creditmarkets.
This economic improvement was achieved through structural reformscarried out in the last two decades. This paper discusses the strengths andshortcomings of these reforms.
The strong recent macroeconomic performance of the Chilean economy isno guarantee of sustained growth and stable prices in the 1990s. Severalproblems may hamper future progress, ranging from insufficient national savingsand investment to the recurrence of external shocks. The social cost of theadjustment undertaken since 1982-83 deserves a special mention. Chile's worstdepression since the 1930s left many people feeling that the gains from recoverywere unevenly distributed among the population. This discontent played a keyrole in the political reforms that began in 1988, culminating with free electionsat the end of 1989. Now, the greatest challenge facing the new government ishow to balance a popularly mandated income redistribution effort with the needfor sustained economic growth.
MACROECONOMIC VARIABLES IN THE LAST TWO DECADES
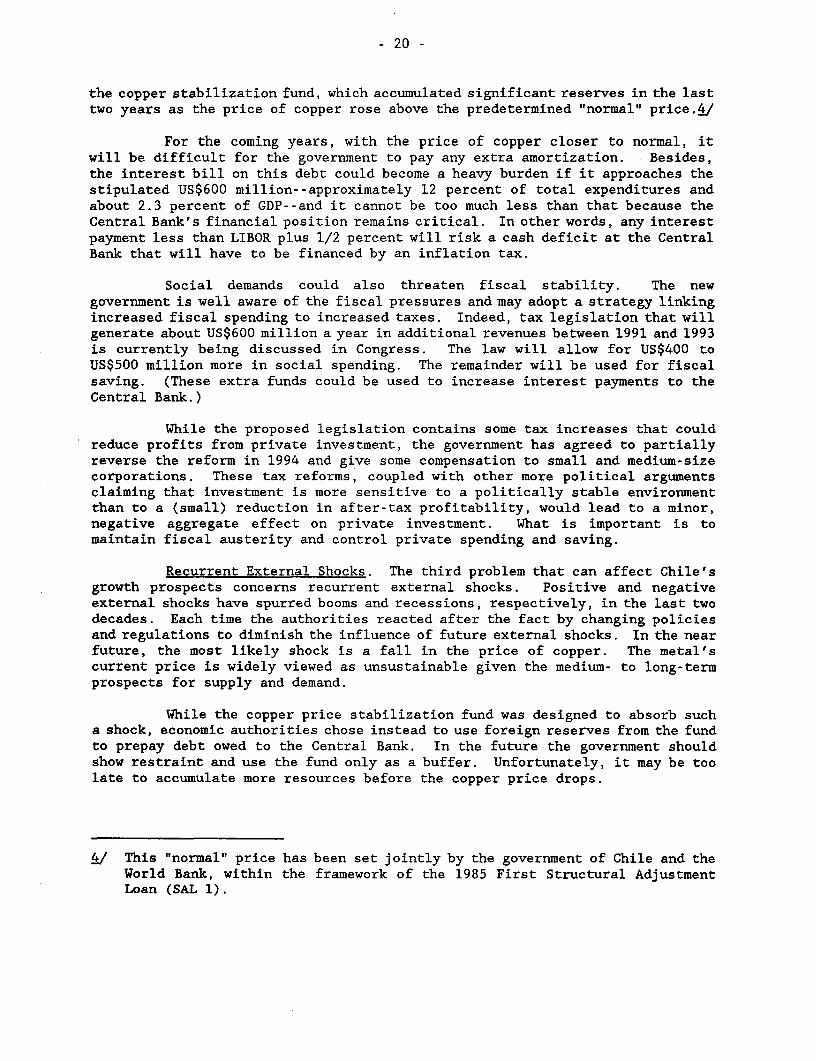
Sharp macroeconomic fluctuations have been the hallmark of the Chileaneconomy in the last two decades. After mediocre but sustained growth at ratesaround 4 percent per year from the late 1940s to the late 1960s, the 1970s inChile saw an early fiscal spending-led miniboom in 1971 followed by severeinflation and an economic crisis, with the public sector deficit growing to 25percent of gross domestic product (GDP) in 1973. Pursuant cuts in public sectorexpenditures, tax reforms, and a sharp decline in terms of trade in 1975 led toa severe recession: GDP plunged more than 12 percent in a single year. A strongrecovery followed in 1977, then evolved into a significant boom, with privatespending rising dramatically and incomes increasing moderately. The boom lastedfrom 1978 to 1981 and ended abruptly in 1982 when the Chilean economy experiencedits worst depression since the 1930s: GDP dropped by 14.1 percent in 1982 anda further 0.7 percent in 1983. The business cycle entered another expansionaryphase in 1984; this time it is lasting longer than ever before. It prevailedlast year, and growth of at least 4 percent is expected this year. From 1984to 1987, expansion was led by growth in exports, while from 1988 to the presentit has been spurred by improved terms of trade primarily in the price of copper.
Unemployment trends over the last two decades have followed closely thefortunes of economic activity, although some qualifications should be made.Indeed, it is clear that structural reforms carried out in the second half ofthe 1970s--ranging from trade reforms to a complete overhaul of the publicsector--had a significant effect on unemployment rates; they went up from

- 14 -
historical rates of between 4 and 5 percent to close to 23 percent during the1975-76 recession. Even when the economy experienced a boom in 1978-81, ratesnever fell below 11 percent (and were greater if emergency employment programswere included). Since the 1984 expansionary phase began, unemployment rates havedeclined steadily from a high of 25.2 percent in September 1982 (more than 30percent if emergency programs are included) to about 6 percent by the end of lastyear.
Inflation remains a persistent problem. It was exacerbated in theearly 1970s, and was close to 1,000 percent in 1973. Then it dropped graduallyfrom 375 percent in 1974 to 39 percent in 1979 as a result of a contractionaryfiscal policy that turned the prospects of a huge deficit in 1975 to surplusesafter 1976. In early 1978, when trade reform was close to completion and tariffson most imports were approaching a flat rate of 10 percent, economic authoritiesjudged that Chile's economy was "open." Following this diagnosis, an activeexchange rate policy was initiated with the aim of stabilizing prices. First,it involved predetermined, monthly minidevaluations, and, after June 1979, theexchange rate was pegged to the U.S. dollar. However, domestic inflation easedslowly and did not fall below two digits until 1981. When the fixed rate wasabandoned in June 1982 and a passive crawling peg system was adopted, inflationincreased rapidly to levels close to 20 percent per year. These levels havepersisted, except in 1988, when they fell to 12.7 percent.
Chile's debt position during this period followed a similar pattern tothat of other Latin American countries: as petrodollars were recycled in thelate 1970s and world liquidity increased, Chile borrowed enough to triple itsforeign debt in just six years. The composition of Chile's foreign debt was,however, very different from that of other highly-indebted countries. Indeed,of the US$9.6 billion!/ increase in foreign debt between 1976 and 1982, US$6.8billion (71 percent) was private sector debt. For most other Latin Americancountries, most foreign debt was incurred by the public sector.
When the Chilean government refinanced and rescheduled its foreign debtfollowing the 1982 crisis, the public sector incurred new debt--mostly withmultilateral agencies--to ease the burden of the private sector. Thus, by 1989,more than 85 percent of total foreign debt was held by the public sector.
As a result of a very aggressive debt conversion program started in1985, total foreign debt has declined in the last few years, from a peak ofUS$17.8 billion in December 1986, to US$13.5 billion in November 1989. Theamount converted in the same period was much higher, though, reaching almost US$9billion through various mechanisms implemented by the economic authorities.
While external factors have played an important role in the economicfluctuations and recurrent crises during the last two decades, the most criticalelement contributing to economic instability was government waste andmismanagement. External factors prompted needed adjustments in domesticpolicies. Indeed, the 1975 recession was the result of a deep contraction in
1/ All foreign debt figures correspond to medium- and long-term obligations.
- 15 -
public sector spending, as the authorities tried to compensate for a sharpdecline in the price of copper. The ensuing "miniboom" of 1978-81 was spurredpartly by the wide availability of foreign savings, but there were also someinternal factors that activated domestic private spending. Similarly, while the1982-83 depression occurred as a result of foreign financing being abruptly cut,domestic authorities created the conditions for disaster: first, they alloweduncontrolled spending during the 1970s, and subsequently they contracted moneysupply and fiscal spending, and increased taxes in hopes of preventing recessionin 1982.
The sharp drop in the price of copper between 1984 and 1987, combinedwith problems in servicing foreign debt, pushed up the real exchange rate (tothe U.S. dollar) by more than 40 percent. In 1988 and 1989 economic activitypicked up and export prices (particularly copper) increased sharply. Domesticmoney supply also expanded significantly.
ECONOMIC POLICIES IN RECENT YEARS
Economic policies in recent years have been shaped mainly by twofactors: first, that the most important structural reforms were carried out inthe late 1970s, and second, the deep depression suffered in 1982-83.
The three stages that should have characterized adjustment followingthe 1982-83 depression were stabilization, recovery, and growth. The typicalWorld Bank prescription is that stabilization requires spending cuts (typicallyon the fiscal side) and expenditure switching policies (primarily realdevaluations). The recovery and growth stages require structural reforms toreduce public sector waste and reforms to allow relative prices to truly reflectcomparative advantages and scarcity. Most Latin American countries have foundit difficult to sustain initial stabilization and have realized that maintaininga "high" real exchange rate is not sufficient to significantly increaseproduction of tradeable goods. What are lacking in many Latin American countriesare reforms to liberalize the economy. Such reforms could include measures toloosen trade restrictions and reduce the size of the government. Strong interestgroups are likely to resist such reforms, and may be powerful enough to preventthem.
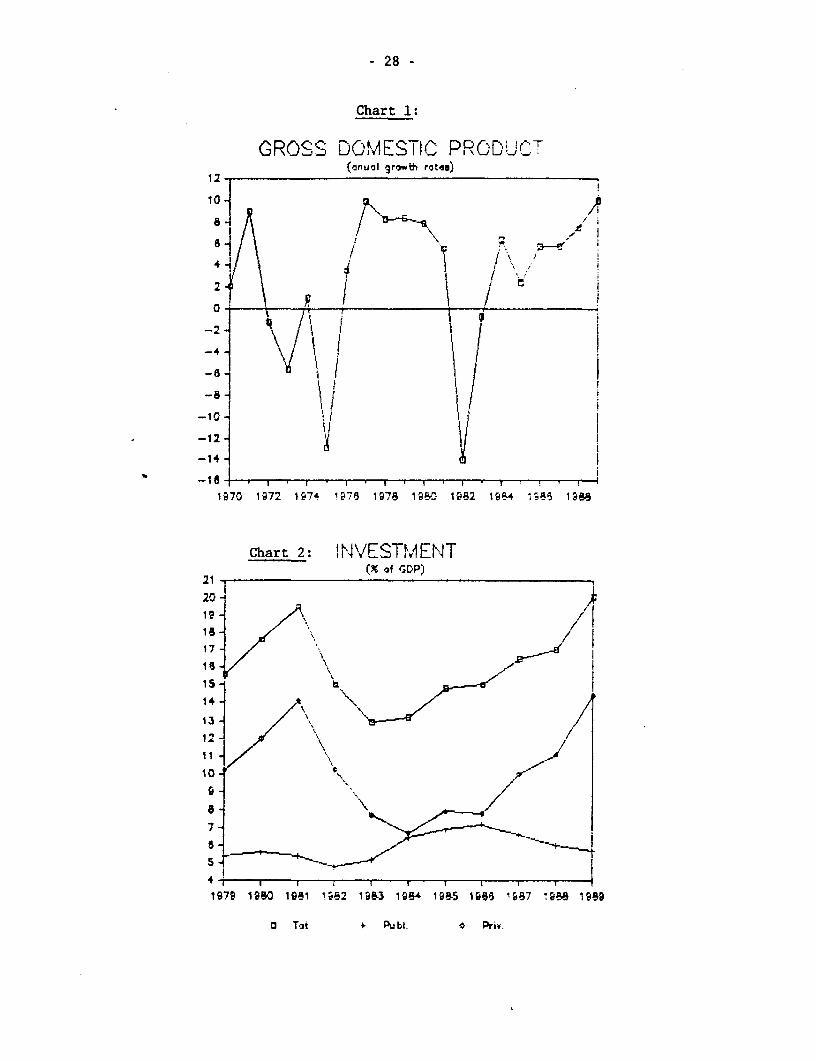
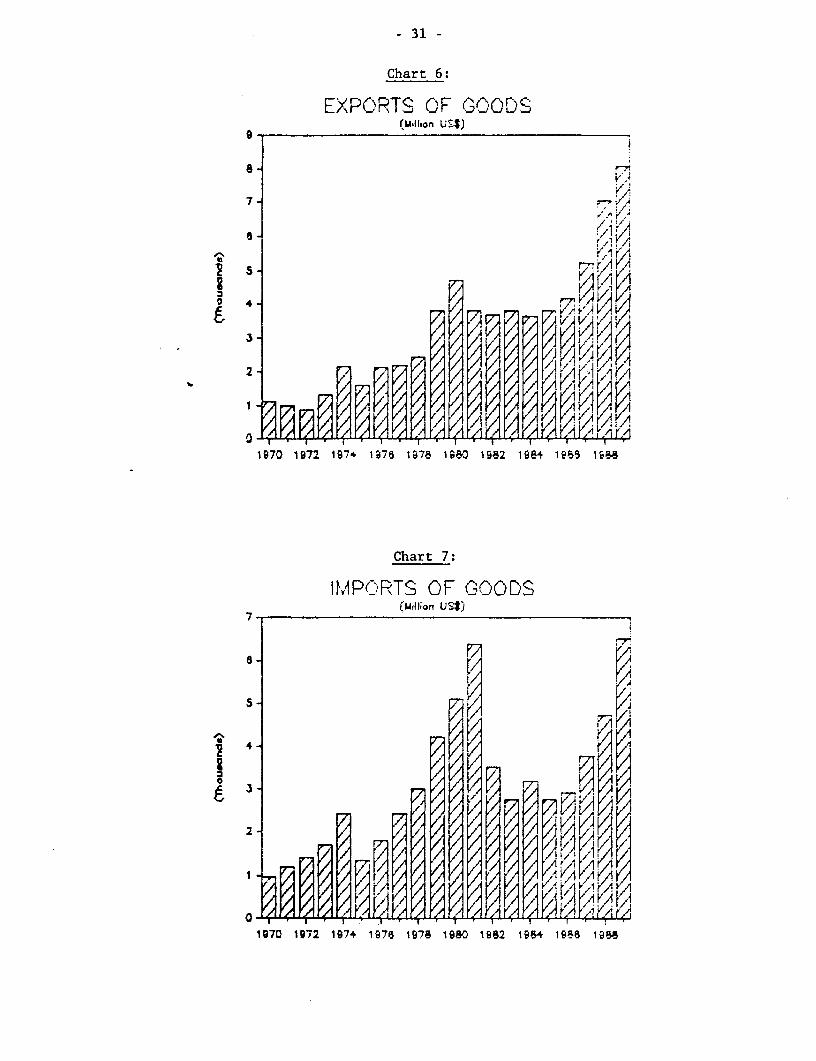
By contrast, Chile achieved recovery and growth more easily because itsliberalizing reforms occurred in the late 1970s. Consequently, the bulk of theadjustment in Chile in 1982-85 focused on allowing the real exchange rate toreflect the new external payments situation--an absence of voluntary foreignlending and depressed terms of trade. Soon after, the volume of exportsincreased, in index terms, from 88.2 in 1983 to approximately 130 in 1989, whileindustrial production increased 50 percent, agricultural production 44 percent,and general tradeable production 41 percent.
The 1982-83 crisis changed the design of economic policies in manyways. Perhaps the most drastic was in the exchange rate policy. After threeyears of a policy that pegged the exchange rate to the U.S. dollar, in June 1982there was a 15 percent devaluation (judged clearly as insufficient by the privatesector), then a move toward a floating rate, and then a crawling peg mechanism

- 16 -
that started at almost twice the initial value, all in a span of five months.The passive crawling peg involves adjusting the nominal exchange rate accordingto the previous month's domestic inflation rate less an arbitrary estimation ofthe world inflation rate. The estimated world inflation rate has beenartificially manipulated from time to time to effect gradual real devaluationsor revaluations (in terms of deviations of a PPP rate).
The peso depreciated by about 50 percent between 1982 and 1987--aperiod when the foreign exchange constraint was most acute. Subsequently, termsof trade improved and pressure for a real appreciation grew, despite theexistence of a copper price stabilization fundZ/ (most of the fund's resourceshave been spent). By the end of 1989, the real exchange rate was about 40percent higher than in 1982. The economic authorities have been reluctant,however, to allow a drastic and more significant real appreciation, althoughimproved external conditions and strong export performance may have led to thatunder a floating system. As a result of not appreciating further, inflation hassurged. This, in turn, will lead to a real appreciation, despite thegovernment's exchange rate policies.
The crisis also affected monetary policy. Between 1978 and 1982,domestic credit was consistently decreased in real terms in order to balanceincreases in base money caused by the massive inflows of foreign capital.Despite this effort, total Ml went up in real terms by 41 percent between 1978and 1982. A significant demonetization of the economy occurred in 1982, withMl falling 16 percent in three years. Between 1983 and 1985, monetary policywas strongly determined by the authorities' decision to allow the Central Bankto bail out certain domestic debtors who suffered as a result of the domesticfinancial crisis.
In 1985, a new team at the Central Bank and the Ministry of Financeinitiated a monetary policy to manage domestic credit based on manipulatinginterest rates, inflation, and imports. Lower foreign exchange reserves duringthat period made the policy easier to implement. This policy is, to some extent,credited with achieving a relatively stable inflation rate of around 20 percentbetween 1985 and 1989.
In the case of fiscal policy, the 1982-83 crisis put strong pressureon the government to increase spending. This was especially acute after thegovernment's bail-out of the banking system in January 1983, which revealed themagnitude of Chile's domestic debt. Prior to the banking crisis, declining taxrevenues had already put the fiscal sector in deficit--something the governmentdid not want to reveal during its negotiations with the IMF and the World Bank.Ultimately, over four years, the domestic debt crisis and bail-outs by theCentral Bank resulted in accumulated quasi-fiscal losses of close to US$5
./ The fund was created in 1985 to provide a buffer stock of foreign exchangereserves that accumulate when the price of copper is above a "normal" level,and which can be spent when the price of copper temporarily falls below thatnormal level. In 1988 and 1989, this money was used by fiscal authoritiesto prepay Central Bank debt.

- 17 -
billion. In 1988 the government agreed to treat the US$5 billion as debt owedto the Central Bank.
A related policy matter was the regulation of capital markets. Indeed,many analysts attribute the rising debt between 1978 and 1982 to the lack ofappropriate regulations over domestic financial activities. Domestic banks didnot adhere to conservative lending criteria and distortions of relative pricesled to unrealistic valuations of assets. Further, regulations on banks' loansto related corporations were minimal. In some cases, more than one third of thebanks' portfolios were loans to corporations whose owners were the same as thebanks'. In addition, it was widely believed that deposits in private financialinstitutions were insured by the state. Such a ubiquitous insurance mechanismfacilitated risk-taking by banks' managers as depositors did not discriminatebetween institutions by the quality of their portfolios.
The link between inadequate regulations and high indebtedness promptedradical legislative reforms. In 1986, new laws were enacted that set stricterregulations for all types of financial activities. One law forbids a bank tolend more than 2 percent of its capital to related corporations. Another lawdecrees that the state can only insure demand deposits of private financialinstitutions. It is early to say yet whether the new legislation has beeneffective, but it seems to have helped.
However, perhaps the most relevant feature of the depression-inducedpolicy changes was that they left untouched the basic resource allocationmechanisms implemented by the structural reforms of the late 1970s. In effect,in spite of strong pressures to swiftly increase the involvement of the statein economic activities and reverse the liberalization of prices, trade, andinterest rates--in Chilean words, to abandon the "modelo neo-liberal"--thegovernment only introduced some marginal and transitory counterreforms. Forinstance, in the case of trade policy, tariffs were increased from flat ratesof 10 percent to 20 percent in 1982; then to a cascade structure with a maximumof 35 percent for a brief period in 1984; and then back to the 20 percent flatrate in 1985. They were reduced a further 5 percent in 1987. No quantitativerestrictions were enacted during this period.
Following the crisis, the price of most consumer goods continued to bedetermined by supply and demand. The only exceptions are prices of certainagricultural products, such as wheat and corn, which were benefitted by "bandas."
The size and role of the state has not changed significantly althoughthe bail-outs of several financial institutions in early 1983 put the governmentin the position of virtually controlling more than 50 percent of the financialsystem. This was transitory, however, and after three to four years, all of theinstitutions involved had been sold or dissolved.
In the end, the crisis was overcome by correcting the policyinstruments that helped to bring the crisis in the first place, but not byreversing the liberalizing reforms of the 1970s. This strategy is to some extentresponsible for the depression's depth. For example, calls for massive domesticdebt bail-outs, which would have required a revision in fiscal reforms but would

- 18 -
have alleviated the need for reducing private spending, were resisted; also,pressures for stricter regulations or more state intervention in labor marketsto "protect" employment were also resisted. Ultimately, the response to thecrisis played a key role in the quick restoration of economic activity and thestrong supply response of tradeable goods.
MAIN PROBLEMS AND RISKS FOR THE FUTURE
Four main problems can affect Chile's prospects for medium- to long-term growth. First are the chronic low rates of national saving and domesticinvestment; second is the fragile fiscal situation. The third one concerns therecurrence of external shocks. And the fourth problem relates to politics andthe social cost of adjustment, which will be key issues for Chile in the 1990s.I will refer to the first three now and take up the latter in the next section.
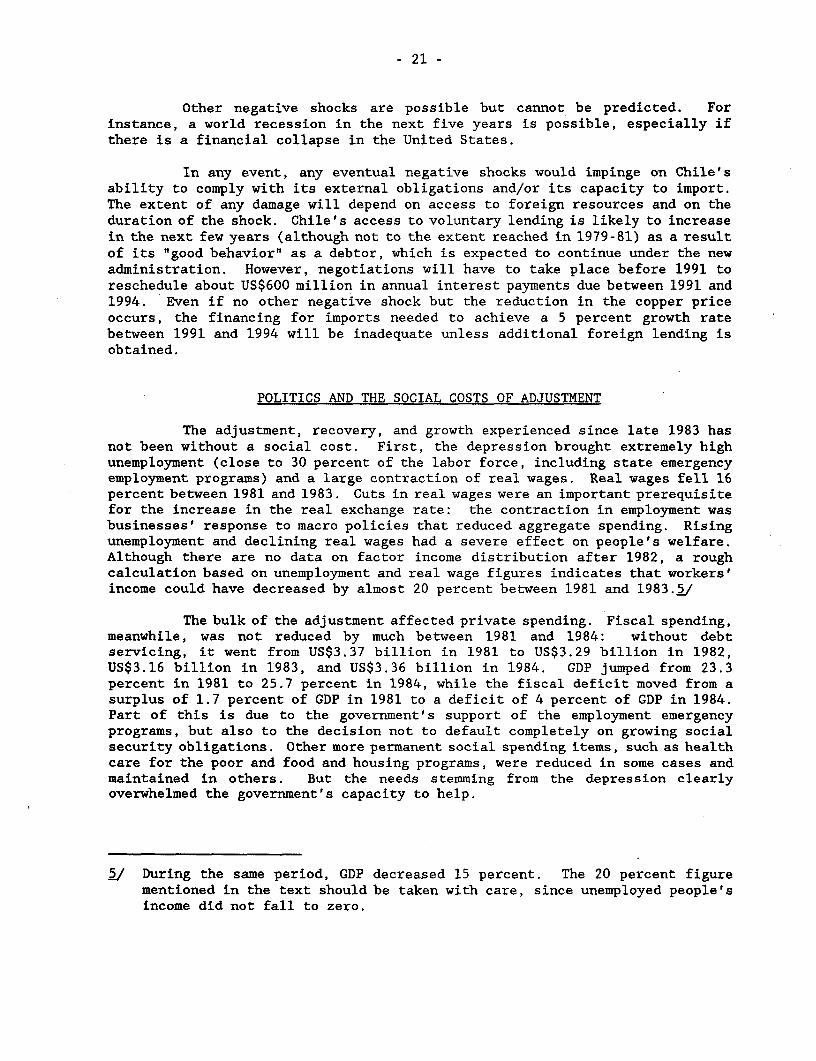
Saving and Investment. The prospects of growth for the Chilean economyare to a large extent constrained by low domestic saving and investment rates.In the 1970s, the domestic saving rate fell to 12 percent of GDP, then droppedto 8.5 percent in the 1980s. During the 1980s, gross investment as a percentageof GDP reached a 16.3 percent average, which compares favorably to the 14.8percent during the 1970s. However, based on the experience of other countries,these rates are not high enough to sustain long-term growth in Chile. Besides,20 years ago, when Chile had a 14 percent national saving rate and a 15 percentgross investment rate, it was able to sustain only modest average growth ratesof 4 percent a year.
In the last three years, both investment and saving seem to haveimproved significantly, although it is uncertain whether the higher rates willpersist once the current expansion and the copper price bonanza end. Nationalsaving was 16.3 percent in 1988 and was estimated at 17 percent in 1988, whilegross investment grew by 17 percent in 1988 and an estimated 20.1 percent lastyear.2/ Several studies on prospects for economic growth in Chile concur thatthese rates are barely sufficient to sustain a 5 percent growth rate (or a 3.3percent growth rate in per capita terms). However, there is less agreement onthe effects that decontrolled prices will have on resource allocation andefficiency.
A key question is whether the structural reforms and the businessclimate, combined with a 20 percent investment to GDP ratio, will yield a growthrate of more than 5 percent. While data are available on the effects ofstructural reforms, information tracing the climate for business is scarce. Thebusiness climate has been volatile, first during the depression (1982-83), andthen during the recent political upheaval. Structural reforms and an appropriatebusiness climate during the 1990s are essential to Chile's economic growth.
Low saving and investment ratios must also be corrected. It seems thatin Chile (as in several other Latin American countries) saving--particularly
.i/ These figures include inventory changes.
- 19 -
household saving- -is low because the cultural incentive to save is not as strongas in, say, industrializing Asian countries. This can also be attributed tothe strong dependence on the state. In this sense, a more frugal governmentwould help reverse this low-saving tradition.
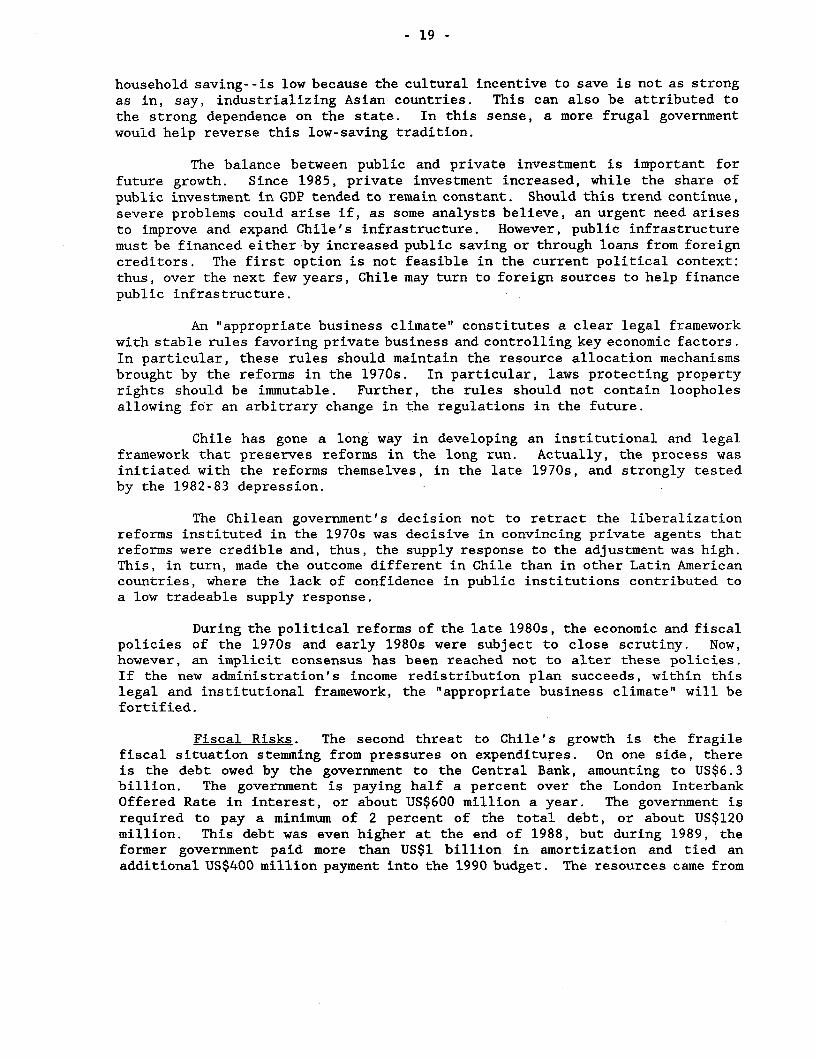
The balance between public and private investment is important forfuture growth. Since 1985, private investment increased, while the share ofpublic investment in GDP tended to remain constant. Should this trend continue,severe problems could arise if, as some analysts believe, an urgent need arisesto improve and expand Chile's infrastructure. However, public infrastructuremust be financed either by increased public saving or through loans from foreigncreditors. The first option is not feasible in the current political context:thus, over the next few years, Chile may turn to foreign sources to help financepublic infrastructure.
An "appropriate business climate" constitutes a clear legal frameworkwith stable rules favoring private business and controlling key economic factors.In particular, these rules should maintain the resource allocation mechanismsbrought by the reforms in the 1970s. In particular, laws protecting propertyrights should be immutable. Further, the rules should not contain loopholesallowing for an arbitrary change in the regulations in the future.
Chile has gone a long way in developing an institutional and legalframework that preserves reforms in the long run. Actually, the process wasinitiated with the reforms themselves, in the late 1970s, and strongly testedby the 1982-83 depression.
The Chilean government's decision not to retract the liberalizationreforms instituted in the 1970s was decisive in convincing private agents thatreforms were credible and, thus, the supply response to the adjustment was high.This, in turn, made the outcome different in Chile than in other Latin Americancountries, where the lack of confidence in public institutions contributed toa low tradeable supply response.
During the political reforms of the late 1980s, the economic and fiscalpolicies of the 1970s and early 1980s were subject to close scrutiny. Now,however, an implicit consensus has been reached not to alter these policies.If the new administration's income redistribution plan succeeds, within thislegal and institutional framework, the "appropriate business climate" will befortified.
Fiscal Risks. The second threat to Chile's growth is the fragilefiscal situation stemming from pressures on expenditures. On one side, thereis the debt owed by the government to the Central Bank, amounting to US$6.3billion. The government is paying half a percent over the London InterbankOffered Rate in interest, or about US$600 million a year. The government isrequired to pay a minimum of 2 percent of the total debt, or about US$120million. This debt was even higher at the end of 1988, but during 1989, theformer government paid more than US$1 billion in amortization and tied anadditional US$400 million payment into the 1990 budget. The resources came from
- 20 -
the copper stabilization fund, which accumulated significant reserves in the lasttwo years as the price of copper rose above the predetermined "normal" price.V/
For the coming years, with the price of copper closer to normal, itwill be difficult for the government to pay any extra amortization. Besides,the interest bill on this debt could become a heavy burden if it approaches thestipulated US$600 million--approximately 12 percent of total expenditures andabout 2.3 percent of GDP--and it cannot be too much less than that because theCentral Bank's financial position remains critical. In other words, any interestpayment less than LIBOR plus 1/2 percent will risk a cash deficit at the CentralBank that will have to be financed by an inflation tax.
Social demands could also threaten fiscal stability. The newgovernment is well aware of the fiscal pressures and may adopt a strategy linkingincreased fiscal spending to increased taxes. Indeed, tax legislation that willgenerate about US$600 million a year in additional revenues between 1991 and 1993is currently being discussed in Congress. The law will allow for US$400 toUS$500 million more in social spending. The remainder will be used for fiscalsaving. (These extra funds could be used to increase interest payments to theCentral Bank.)
While the proposed legislation contains some tax increases that couldreduce profits from private investment, the government has agreed to partiallyreverse the reform in 1994 and give some compensation to small and medium-sizecorporations. These tax reforms, coupled with other more political argumentsclaiming that investment is more sensitive to a politically stable environmentthan to a (small) reduction in after-tax profitability, would lead to a minor,negative aggregate effect on private investment. What is important is tomaintain fiscal austerity and control private spending and saving.
Recurrent External Shocks. The third problem that can affect Chile'sgrowth prospects concerns recurrent external shocks. Positive and negativeexternal shocks have spurred booms and recessions, respectively, in the last twodecades. Each time the authorities reacted after the fact by changing policiesand regulations to diminish the influence of future external shocks. In the nearfuture, the most likely shock is a fall in the price of copper. The metal'scurrent price is widely viewed as unsustainable given the medium- to long-termprospects for supply and demand.
While the copper price stabilization fund was designed to absorb sucha shock, economic authorities chose instead to use foreign reserves from the fundto prepay debt owed to the Central Bank. In the future the government shouldshow restraint and use the fund only as a buffer. Unfortunately, it may be toolate to accumulate more resources before the copper price drops.
V./ This "normal" price has been set jointly by the government of Chile and theWorld Bank, within the framework of the 1985 First Structural AdjustmentLoan (SAL 1).
- 21 -
Other negative shocks are possible but cannot be predicted. Forinstance, a world recession in the next five years is possible, especially ifthere is a financial collapse in the United States.
In any event, any eventual negative shocks would impinge on Chile'sability to comply with its external obligations and/or its capacity to import.The extent of any damage will depend on access to foreign resources and on theduration of the shock. Chile's access to voluntary lending is likely to increasein the next few years (although not to the extent reached in 1979-81) as a resultof its "good behavior" as a debtor, which is expected to continue under the newadministration. However, negotiations will have to take place before 1991 toreschedule about US$600 million in annual interest payments due between 1991 and1994. Even if no other negative shock but the reduction in the copper priceoccurs, the financing for imports needed to achieve a 5 percent growth ratebetween 1991 and 1994 will be inadequate unless additional foreign lending isobtained.
POLITICS AND THE SOCIAL COSTS OF ADJUSTMENT
The adjustment, recovery, and growth experienced since late 1983 hasnot been without a social cost. First, the depression brought extremely highunemployment (close to 30 percent of the labor force, including state emergencyemployment programs) and a large contraction of real wages. Real wages fell 16percent between 1981 and 1983. Cuts in real wages were an important prerequisitefor the increase in the real exchange rate: the contraction in employment wasbusinesses' response to macro policies that reduced aggregate spending. Risingunemployment and declining real wages had a severe effect on people's welfare.Although there are no data on factor income distribution after 1982, a roughcalculation based on unemployment and real wage figures indicates that workers'income could have decreased by almost 20 percent between 1981 and 1983.V/
The bulk of the adjustment affected private spending. Fiscal spending,meanwhile, was not reduced by much between 1981 and 1984: without debtservicing, it went from US$3.37 billion in 1981 to US$3.29 billion in 1982,US$3.16 billion in 1983, and US$3.36 billion in 1984. GDP jumped from 23.3percent in 1981 to 25.7 percent in 1984, while the fiscal deficit moved from asurplus of 1.7 percent of GDP in 1981 to a deficit of 4 percent of GDP in 1984.Part of this is due to the government's support of the employment emergencyprograms, but also to the decision not to default completely on growing socialsecurity obligations. Other more permanent social spending items, such as healthcare for the poor and food and housing programs, were reduced in some cases andmaintained in others. But the needs stemming from the depression clearlyoverwhelmed the government's capacity to help.
2/ During the same period, GDP decreased 15 percent. The 20 percent figurementioned in the text should be taken with care, since unemployed people'sincome did not fall to zero.

- 22 -
The problems of unemployment and low real wages have eased, althoughat different rates. Employment generation has been very strong since 1985(close to 900,000 new jobs through 1989), and unemployment declined to 6 percentlast year. Meanwhile, real wages have been increasing more slowly. By the endof 1989, after two years of growth that put GDP beyond the 1981 level of 23.1percent, real wages were still 3 percent lower than in 1981. The per capitaincome for Chileans has dropped 10 percent since 1981, and real incomes haverisen only 3.1 percent since 1981.
On the fiscal side, spending on health, welfare, and educationalprograms has decreased by more than 20 percent between 1984 and 1989 (28 percentper capita) ..6/ Much of this decrease was forced by the big deficit of the socialsecurity system (21 percent increase), but also by a 108 percent increase inhousing programs.
Despite these reductions in social spending, hard evidence that thequality of life has declined is lacking, although improvements in livingstandards have slowed since the depression.
Nonetheless, despite strong macroeconomic performance in the last fewyears, low- and middle-income people have not regained the living standards(measured by income) that they had in 1981. Some people assert that a "socialdebt" is owed to those groups, who constitute the majority of Chile's population.These social inequities provided the backdrop to the 1988 and 1989 electionresults, which granted the new government a mandate to carry out an incomeredistribution program that will involve fiscal and tax reforms. At the sametime, people have grown accustomed to moderate inflation rates and recognize thebenefits of economic growth. With this in mind, the new administration will alsomaintain the macroeconomic policies that have so profoundly changed Chile'seconomy.
The big challenge for the new administration will be how to balancesocial and economic policy goals in a democratic context. The previousadministration left behind strong macroeconomic indicators, and any worseningof them could be politically dangerous. Besides, it is clear that newpolicymakers are eager to demonstrate that they could be at least as efficientin administering the state as their predecessors and that Chile will not fallinto the economic morass of some of its neighbors.
In contrast, the previous administration's performance on the socialside was inadequate, at least according to Chile's tradition of state welfaresupport and income distribution favoring the poor. Much can be done to correctmany of these social "debts." However, the extent to which the cost of improvingsocial services will be detrimental to private sector growth and investment isunknown.
i./ The figures are more dramatic if one compares 1989 with 1981, before thecrisis.

- 23 -
CLOSING REMARKS
Chile's prospects for the 1990s are fairly good, if policymakersconfront the main problems affecting the economy and find an appropriate mix ofpolicies that spur national savings and private investment, keep the fiscalbudget under tight control, permit a flexible absorption of eventual negativeexternal shocks, and contribute to a more equitable society. A basic frameworkshould be the liberalized economy inherited from the 1980s, amended in a way thatshows more solidarity with the poor. In the end, this would be the only roadto a modern and economically sound democracy.

- 24 -
Table I : NATITNAL ACCOUNTS
1980 1985 1986 1987 1988 1933 1990
GDPLocal Currency (NMMS) 363.4 356.4 376.6 398.2 427.5 470.2MM uss 27571 16018 16825 18959 22084 25536
Share to GDP (2)Consumption 83.17 83.53 81.57 79 75.83 76.3
Private 70.72 69.2E 68.92 67.58 65.32 66.41Public 12.45 14.25 12.65 11.42 10.51 9.89
Investment a/ 17.6 14.8 15 16.5 17 20.1Private 12 7.9 7.8 10 11.1 14.4Public 5.6 6.9 7.2 6.5 5.9 5.7
Exports 22.82 29.08 30.63 33.52 37.37 37.67Imports 27 26.32 26.81 29.42 30.18 34.4
Real 6rowth Rate 7.8 2.4 5.7 5.7 7.4 10.1Consumption 6.8 -1.1 4.9 4.8 9.6 8.3Investsent 21.9 14.8 7.1 16.2 10.7 20.8Goverment -8.1 -0.3 -2.1 -2.1 4.7 0.9Exports 14.3 6.9 9.8 8.8 6.1 16.2Imports 18.7 -11 9.7 17 12.1 25.3
Population (thousands) 11144.8 12127.7 12327 12536.4 12748.2 12963.6
a/ Gross fixed capital formation.

- 25 -
Table 2: CURRENT ACCOUNT DATA (fMUSS)
1980 1965 1986 1987 1988 1989 1990 1995-2000
Exports USS Current 4705 3084 4199 5224 7051 80980leports USS Current 5469 2955 3099 3994 4833 6502Factor Service Payments 1320 2097 2108 1878 2101 1987factor Service Receips 197 221 178 181 339Current Account Balance -1971 -1329 -1137 -888 -167 -622
Direct Investaent 170 26 57 98 117 20uOfficial flow 85 1144 450 603 298 n.aPrivate Flow 1003 10 88 -85 111 n.aErrors and Omissions 50 -3 -49 -91 -110 52.9Change in Reserves a/ 1244 -99 -228 45 732 437.4
External Debts 11084 17431 18887 19444 17649 16250
a/ Balance of payments.

- 26 -
Table 3: PUBLIC SECTOR(All Data as % of GDP)
Consolicated Non-Financiai Puolic Sector
(including Public Enterprises)Financ:ng of Deficit
Central 6overeent ------------------------------------------------------------------------------- ------------------------------------ Doaestic External Inflation
Revenue Expenditure Baiance ;eyenue cxpenditure Deficit Loss Loss Loss CtnerCurrent Capital (deficit" a/ Current Capital &2)
1981 32.1 26.6 2.6 -2.9 34.2 29.1 4.7 -0.4 -3.6 2.71982 29.9 31.9 0.3 2.3 33.9 35 .2 2.6 3.9 1.1 2.219B3 27.7 30.5 0.2 3.0 3.3.5 34.0 3.v 3.5 ¢ -1384 28.7 30.7 1.5 3.5 34.3 33.8 4.9 4.5 1.7 2.71985 28.6 29.6 2.7 3.7 36.7 33.1 6.4 2.9 -1.4 4.11986 28.2 26.6 2.7 1.1 i.5 -1.0 3.11987 28.7 25.9 2.6 -0.2 -0.3 -2.5 2.21988 28.7 23.3 2.1 - -3.6 -7.3 3.71989
a/ Revenue between 1986-88 corresponds to the saving (net current income)..QTES: Capital Expenditure is investsent i2,- net capital expenditures

- 27 -
Table 4 : INCENTIVE iNDICATORS PRICES
1380 1985 19E6 1987 1988 198 13C 1995-2010
Iiflation Rate 31.2 26.4 17.4 21.5 12.7 21.4 25
Real Eff. Exchange Rate 100 :58.92 i7h.36 170.64 178.28 172.06(1980=100)
ILdex Real Wages 100 93.21 95.06 94.9 101.12 103.06(1980:100)
Real Eff. Interest RateBorrowing rates 5.03 4.13 1.47 3.15 2.03 5.08LOaning rates 12.23 11.05 7.64 3.39 7.44 11.83
Ritio: Donestic-ForeingEnergy PriceGasolineOther
Uneaployuent Rate 10.4 12 6.8 7.9 6.3 6
- 28 -
Chart 1:
GROSS -DOMESTIC PRODUCT(Onual growth roteeu)
-12l
, g *~j I fll
-14l
1970 1972 1974 1978 1978 1280 1982 19A_4 1X68
Chart 2: INVESTM-AENT(X of GOP)
11,
15'
14
17-
12 -
7-~~~~~~~~~~~~~~~~~~~~~~~~~~~~..
179 1980 i9:i 1;,8 l2 3i 191 5 19686 1987 ISe.8 1ie19
O To t 4 Pu bII Priv.

- 29 -
Chart 3a: INFLAT,'ON(Dea to C'a X tanation)
5000
400-
200-
10017 'I r-r
i970 1972 1974 1978 1978 1Wj 1962 19+4 1966 1696.
Chart 3b: INFLATIONa(o. to Dea. X variation)
GO I
sro
40
30 1
20-
10
0'1077 19781979 1960&D1961 1962 19&3 1964 195196881987 1968 1296

- 30 -
Chart 4:
cUES oanta jr Pound, 1-;ja)
750
1-OI |r [E
1.30
120
1000
190 17- i7 1?75 /97 /~018-!
Io / I.
1970 1972 1;-74 ?975 197Ri 1980 1982 19 ,A 1 9A6
Chart 5:
sREAL -IHA.NGr -ZATCE
1 S^L
1 40-
130
VAV
.,~~~~~~~~~~~~~~~~~i
170 -
100
190 17 174-7498 SO18 1/*./ !I5 i/-i8
- 31 -
Chart 6:
EXPORTS CF GOODSrmsilion USS)
4- 4
7 A~~~~~~~~~~73 x~~~~~~~~~~~~A
2
1970 1972 1974 1976 1978 1980 1982 1984 1985 l1938
Chart 7:
It-,PcRTS OF GOODS(Million USt)
7-i
2
100197 2 1974 1976 1978 1980 1982 198-4 19856 1938

- 32 -
Chart 8:
FOREIGN DEBT(Million UZI)
17 -~
14 -
13 t
12 --
-~11
4 - ~ ~ ~ ~ ~ ~ ~ 4
2-
1970 1972 1974 1976 1978 1 980 1E82 19634 186 1988
0 Tota! * Priv. Pubi.
- 33 - APPENIXPage 1 of 2
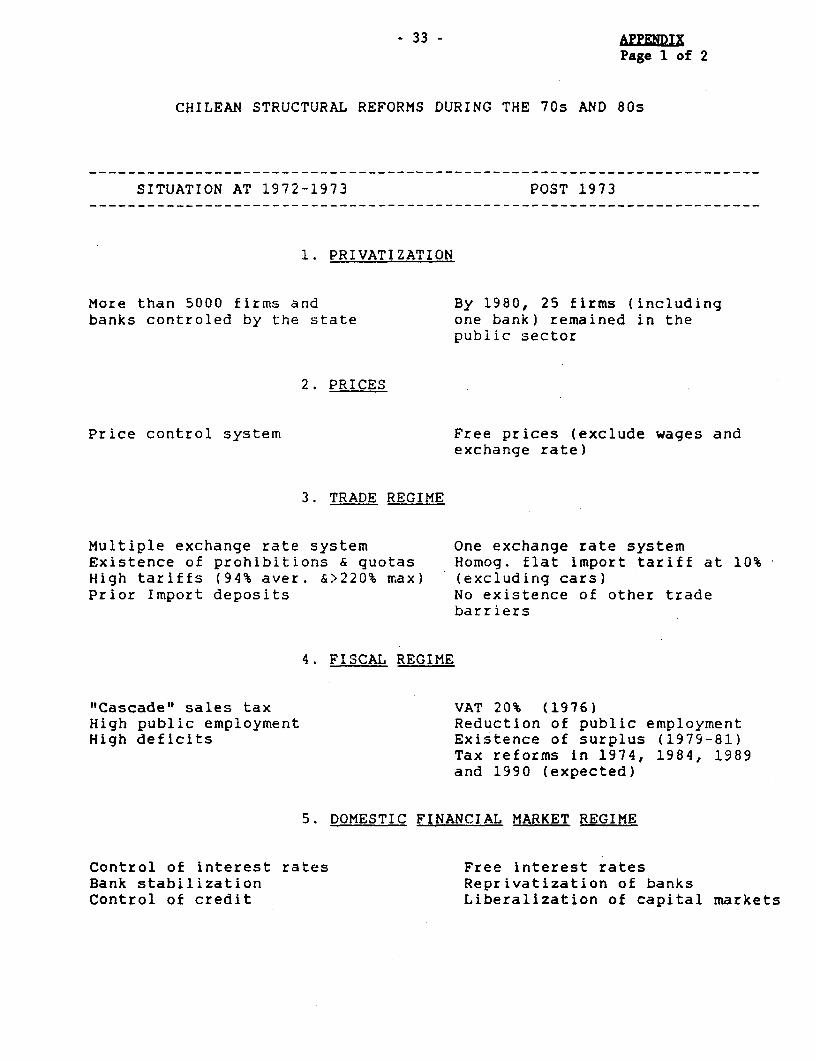
CHILEAN STRUCTURAL REFORMS DURING THE 70s AND 80s
SITUATION AT 1972-1973 POST 1973
1. PRIVATIZATION
More than 5000 firms and By 1980, 25 firms (includingbanks controled by the state one bank) remained in the
public sector
2. PRICES
Price control system Free prices (exclude wages andexchange rate)
3. TRADE REGIME
Multiple exchange rate system One exchange rate systemExistence of prohibitions & quotas Homog. flat import tariff at 10%High tariffs (94% aver. &>220% max) (excluding cars)Prior Import deposits No existence of other trade
barriers
4. FISCAL REGIME
"Cascade" sales tax VAT 20% (1976)High public employment Reduction of public employmentHigh deficits Existence of surplus (1979-81)
Tax reforms in 1974, 1984, 1989and 1990 (expected)
5. DOMESTIC FINANCIAL MARKET REGIME
Control of interest rates Free interest ratesBank stabilization Reprivatization of banksControl of credit Liberalization of capital markets
'34 'APPENDIXPage 2 of 2
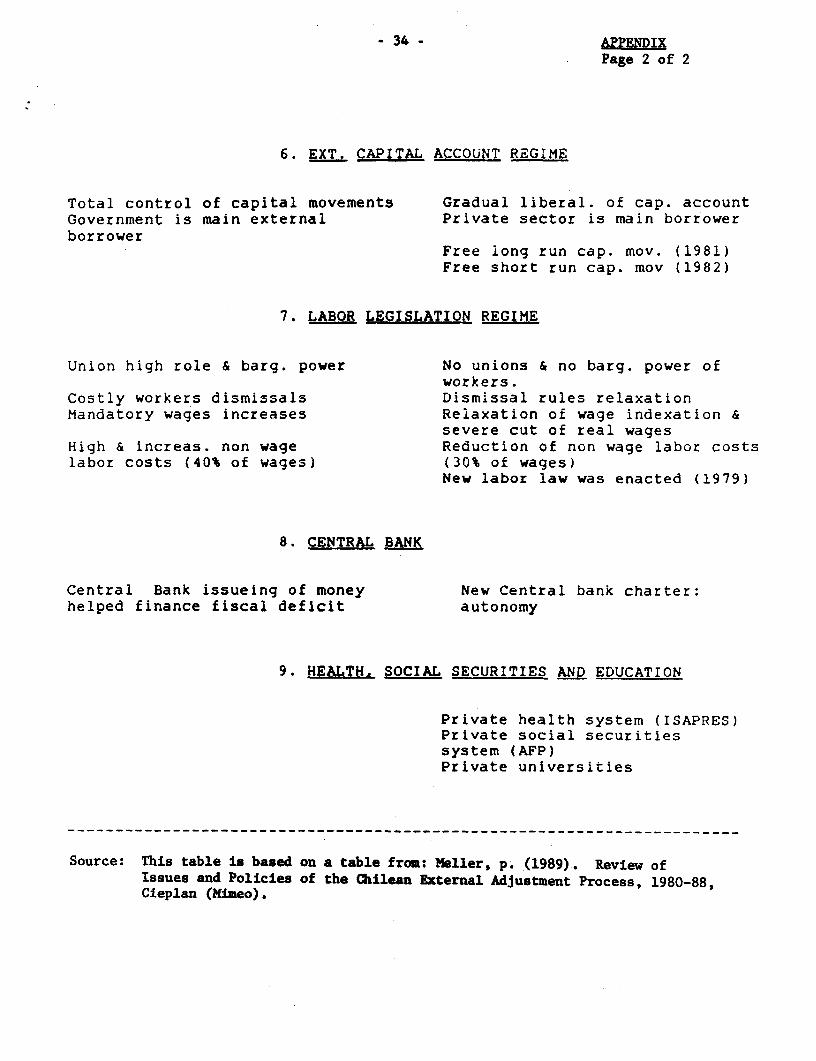
6. EXT. CAPITAL ACCOUNT REGIME
Total control of capital movements Gradual liberal. of cap. accountGovernment is main external Private sector is main borrowerborrower
Free long run cap. mov. (1981)Free short run cap. mov (1982)
7. LABOR LEGISLATION REGIME
Union high role & barg. power No unions & no barg. power ofworkers.
Costly workers dismissals Dismissal rules relaxationMandatory wages increases Relaxation of wage indexation &
severe cut of real wagesHigh & increas. non wage Reduction of non wage labor costslabor costs (40% of wages) (30% of wages)
New labor law was enacted (1979)
8. CENTRAL BANK
Central Bank issueing of money New Central bank charter:helped finance fiscal deficit autonomy
9. HEALTH. SOCIAL SECURITIES AND EDUCATION
Private health system (ISAPRES)Private social securitiessystem (AFP)Private universities
Source: This table is based on a table from: Meller, p. (1989). Review ofIssues and Policies of the Chilean External Adjustment Process, 1980-88,Cieplan (Mimeo).

- 35 -
COMMENTARY BY LUCA BARBONE
I found this paper quite interesting. Most people who has beenworking on Latin America in the past few years view Chile as an outlier, astumbling block in the comparison of growth and economic performance. Althoughit is true that other countries in Latin America have enjoyed relatively goodperformance--Colombia or Paraguay--it is also easy to come up with very specificreasons for their performance that make them less of a challenge in terms ofdefining a paradigm of what good economic management in a Latin American country,in particular, may mean.
I have two sets of comments.
The first is on some of the interpretation in the paper as to thereasons for the economic success in Chile.
And second, to draw some lessons. The lessons may be more grim thanthe interpretation.
Let me start by the two elements that I think the paper rightlydispels as not being relevant, not being a sufficient condition for explainingChile's performance. As it is made clear, an authoritarian government is nota sufficient condition for good performance, nor is the ability to compress realwages as low as they can go.
Although these features were present in Chile, they have also beenpresent in most Latin American countries, including those with the leastenjoyable economic records such as Argentina or Brazil, or even Peru.
Where a military government does help is being able to guaranteecontinuity in economic management. The paper rightly stresses that the abilityto insist on certain basic parameters, despite setbacks along the way, is oneof the key aspects that contributed to the successful restoration of what hasbeen defined as the appropriate business climate.
Thus, while I agree with the basic message of the paper, namely thatgood and consistent economic management is eventually rewarded by good economicperformance, I would have liked to see a more focused analysis on two relevantissues: (a) the relative role played by the reversal of macroeconomic policies,particularly the exchange rate policy, in obtaining a turnaround in performanceafter the banking crisis; and (b) the extent to which "excessive" structuraladjustment policies may have contributed to the crisis, or reinforced the effectsof inappropriate macro policies. In fact, if we had been here in 1983, probablythe consensus would have been that the experiment was a disaster and the adviceof this group to the government would have been to try to change policies asquickly as possible to avoid a serious depression. In fact, the government didchange policies after 1982. Although the emphasis on free markets, the emphasison reducing the role of the state, the emphasis on deregulation remained to alarge extent, some excesses that led to the banking crisis were pruned, andmacroeconomic policies (particularly the exchange rate policy) reoriented. Thus,

- 36 -
the question remains as to which of these two elements was crucial in allowingChile to recover from the 1982-83 crisis.
But still, one must agree that consistency of policies is somethingthat has also given an important contribution (with a bit of luck coming fromexternal conditions) to the average 4 or 5 percent per capita growth in the lastfive years. One aspect that remains striking, however, and that might be ofcrucial importance in deciding whether the current economic success is likelyto be sustainable in the future, relates to the external vulnerability of Chile,which is underlined in this paper. Unlike Mexico, for instance, which has beenable to diversify its exports to an extent that was certainly unimaginable a mere10 years ago, Chile still has basically half of its export revenues dependenton one commodity, copper, and that, despite the enormous growth in non-traditional exports. Can we consider the process of structural reform completedunder these conditions? If the answer is yes, i.e., that heavy dependence onone or few commodities is not something of concern for an economy where marketsignals have been allowed to operate freely, then I think this carriesimplications for a number of other countries where structural adjustment policiesare routinely identified with policies for diversification of exports.
New for the political economy lessons, particularly for LatinAmerica, I think that the paper gives a sobering message although severalcountries are now, for own conviction or for lack of alternative, being pushedtowards adopting the same type of policies that Chile adopted in the seventiesand in the early eighties. It is very difficult to envisage--at least for anumber of them--that the same conditions of stability and economic managementmay prevail for a sufficiently long period of time, if it is true that it takesa long time for the shift from a constellation of policies where the priceincentives and the market incentives are wrong to a constellation of policieswhere the right price and market incentives take effect on output and employmentand stability.
In this sense, I read the message of the paper as one of extremedifficulty for the task ahead, as the lags between the implementation ofstructural adjustment policies and any rewards are sufficiently long andunpredictable that the political cycle may make a reversal much more likely thanone would like to expect.
JAMAICA: CAN THE RECOVERY BE SUSTAINED?
Michael Gavin
With commentary by Sue Collins


- 39 -
TABLE OF CONTENTS
Page No.
CRISIS AND RECOVERY . . . . . . . . . . . . . . . . . . . . . . . 42
Economic Crisis and Collapse, 1972-80 . . . . . . . . . . . . 42Recovery, 1980-88 .... . . . . . . . . . . . . . . . . . . 44
OUTLOOK: CAN THE RECOVERY BE SUSTAINED? . . . . . . . . . . . . . 54
REFERENCES .56
TABLES
1 Macroeconomic Performance in Jamaica . . . . . . . . . . . . . 572 The Bauxite Sector in Jamaica. . . . . . . . . . . . . . . . . 573 Accounts of the Central Government . . . . . . . . . . . . . . 584 Economic Growth in Jamaica .... . . . . . . . . . . . . . . 595 National Accounts .... . . . . . . . . . . . . . . . . . . 596 External Trade and Payments ... . . . . . . . . . . . . . . 607 The Real and Nominal Prime Lending Rate, 1982-1988 . . . . . . 608 Employment and Unemployment, 1983-1988 . . . . . . . . . . . . 619 External Public Debt, 1977-1987 . . . . . . . . . . . . . . . 61
CHARTS
1 Terms of Trade: Jamaica . . . . . . . . . . . . . . . . . . . 622 Real Exchange Rate: Jamaica . . . . . . . . . . . . . . . . . 633 Net Investment in Jamaica ..... . . . . . .. . . . . . . 644 Private and Public Saving . . . . . . . . . . . . . . . . . . 655 Real GDP in Jamaica, 1964-1987 ..... . . . . . . . . . . . 66
COMMENTARY BY SUE COLLINS . . . . . . . . . . . . . . . . . . . . 67

I
- 41 -
Jamaica relies heavily on international trade: its imports andexports equal roughly half the GDP. The country's bauxite reserves and beacheswould have little value without foreign markets, and there are no domesticsubstitutes for such imported goods as petroleum. But with gains from tradecomes a vulnerability to external macroeconomic events, vulnerability worsenedby Jamaica's immense foreign debt.
Jamaica is poor but not desperately poor. Its GDP of roughly US$1,000per capita places the country in the ranks of the lower-middle-income countries.But the highly skewed income distribution means that much of the population livesin genuine poverty, and past and contemplated austerity measures threaten theprecarious living conditions of that group. Even so, the long-standingcommitment of the two major Jamaican political parties to a welfare state,combined with the gentle Caribbean environment, makes Jamaica compare favorablyto wealthier countries in such development indicators as education, infantmortality, and the availability of doctors and nurses. The life expectancy of74 years compares well with many industrial countries.
Jamaica enjoyed, in the quarter century to 1973, robust economicgrowth, driven by high rates of savings and investment, in an environment ofstable prices and generally manageable external deficits (Table 1). Jamaica'seconomic decline began abruptly in 1973. Indeed, production fell dramaticallyduring most of the 1970s, making only a feeble recovery in the 1980s. Savingsand investment collapsed, inflation accelerated, and external imbalancesintensified and became chronic. By the end of 1988 the country's external debtwas nearly 150 percent of GDP. If that decline now seems inevitable to someobservers, it certainly was not foreseen in 1973. For example, 1974 World Bankanalysis of economic prospects for Jamaica presented optimistic and pessimisticscenarios for 1972-80. The pessimistic scenario foresaw growth of "only" 5.7percent a year, the optimistic scenario 7 percent a year.;/ In fact, real GDPdeclined an average of 2.5 percent a year over this period, winding up in 1980almost 20 percent below the 1972 level. This outcome would have been viewed asincredible in the early 1970s.
Which is the real Jamaica? Did the halting but real recovery thatJamaica experienced in the 1980s lay the foundation for renewed growth in the1990s - growth that Jamaica has shown itself capable of achieving? Or was itmerely a brief interruption of a secular decline? The answer depends on domesticpolicy and the external environment. This paper lays out recent historicalexperience and prospects for both determinants of Jamaican economic growth anddevelopment. It presents a brief overview of Jamaica's recent economic history,which illustrates the role of various determinants and explains how Jamaicareached its current macroeconomic position. The paper then discusses prospectsfor the future and emphasizes problems and risks that the Jamaican policymakersmust cope with in the 1990s.
.1/ World Bank 1974.

- 42 -
CRISIS AND RECOVERY
The watershed years, 1972-80, created the conditions with which recenteconomic policy has had to cope. After a brief discussion of 1972-80, the paperdetails economic policy and its outcomes in the 1980s, setting the stage for adiscussion of economic prospects for the 1990s.
Economic Crisis and Collapse. 1972-80
When Michael Manley led the Peoples National Party (PNP) to victory inthe 1972 elections, he inherited an economy that seemed sound. The Jamaicaneconomy had for a quarter century experienced rapid growth, substantial monetaryand financial stability, and a fairly strong international payments position.To be sure, worrisome trends can with hindsight be identified. The governmenthad since the early 1960s been increasingly active in economic affairs, reflectedin gradually growing government expenditures. Extending to a wide variety ofmicroeconomic, trade, and industrial policies,2/ this more active role of thegovernment was not always conducive to economic efficiency and growth. On thecontrary, it was widely believed that the government was rewarding politicalsupporters and punishing political opponents.i./ But increased governmentspending was not matched by increased revenues, and the trend throughout the1960s was increased budgetary deficits and rapid monetary growth and inflation.
In addition, the gradual decline in the terms of trade during the 1960sthreatened the generally strong international payments positioniJ (see Chart 1).In particular, the petroleum price increases that rocked the world economy in1973 were painful for Jamaica because it depends on imported petroleum for nearlyall its domestic energy needs. These increases occurred while Jamaica was inthe midst of a payments crisis that, while then minor, was an ominous harbingerof subsequent developments.
With the benefit of hindsight, the basis for economic growth wasdangerously narrow, as Jamaica's growth depended heavily on bauxite and tourism.But it is also possible to make too much of this dependence. The bauxite andtourism boom were major factors in the buoyant postwar years, but economic growthextended to all major sectors of the economy, including manufacturing,construction, and agriculture. In the late 1960s the bauxite sector contributedonly about 13 percent of Jamaica's GDP, 1 percent of employment, 14 percent ofgovernment revenue, and less than 20 percent of retained foreign exchange
2./ See Wellisz and Stone 1989 for a comprehensive, and critical, summary ofgovernment economic policies during this period.
iJ/ Wellisz and Stone 1989.
i/ See, for example, Jefferson 1972.
- 43 -
earnings.5/ And the petroleum price increases, though painful, were offset byfavorable trends in Jamaica's export prices. Indeed, although Jamaica's termsof trade were substantially less favorable than in the 1950s and early 1960s,they show no further decline until after 1978, long after the start of Jamaica'seconomic decline.V/
There were, in fact, many positive aspects of the economic situationthat the PNP government inherited in 1972. The government's external andinternal debt amounted to only about one fourth of GDP at the beginning of the1970s.7/ Until about 1969, almost all of Jamaica's current accounts had beenfinanced by direct foreign investment, and at the end of 1972 the public-sectorexternal debt amounted to only about US$200 million, less than 15 percent of GDP.Jamaica's international payments problems in 1972 and 1973 were clearlyassociated with a temporary investment boom and the completion of some bauxiteprojects.f./ In brief, while the international economic environment of the 1970swas in many respects more hostile toward Jamaica than that of the 1960s, theeconomy that the PNP inherited was basically sound. Nothing in Jamaica'seconomic development during the previous decades made subsequent disastrousevents inevitable.2/
Manley and the PNP came to office committed to the establishment ofdemocratic socialism. This translated into, among other things, a desire toreduce economic inequalities within Jamaica and throughout the world, and toreduce the role of markets and capital--particularly foreign capital--in thenational economy. From the time the PNP took power to just after the December1976 elections, the government made economic policy in a relatively unconstrainedenvironment. It made no effort to adjust to the 1973 petroleum price increases,sponsored massive wage increases, and engaged in a dramatic expansion of thepublic sector. Government consumption rose from 18 percent of GDP in 1972, to27 percent in 1976, and 32 percent in 1978. Revenue did not keep pace with therise in government spending, and the result was the familiar pattern of public-sector deficits, monetary and price inflation, exchange-rate overvaluation, andexternal deficits. This situation was exacerbated in Jamaica by emigration ofthe professional and business class to the United States and Canada as economicprospects deteriorated.
5. Jefferson 1972.
ii World Bank data. Measurement of Jamaica's terms of trade is complicatedby the fact that its major merchandise export, bauxite, is not traded ina world commodity market but is transferred to aluminum refineries inNorth America.
Z/ World Bank 1971.
.t./ Real investment in 1973 was over two and a half times the 1987 rate.
i~./ The events of the following eight years have been documented elsewhereand need no detailed discussion here. See, for example, Sharpley 1983,Gavin 1989, and Wellisz and Stone 1989, and references cited therein.
- 44 -
The response of the PNP government to the rapidly growing and clearlyunsustainable balance of payments deficits was to tighten administrative controlsover international trade. To counter the ongoing inflation, the governmentresorted to price controls in 1976 and subsidized many basic commodities. Theseadministrative measures did little to correct the growing and fundamentalimbalance between domestic production and domestic consumption. The restrictionson capital goods imports, high wages, the threat of nationalization, and variousother impediments to investment combined to cause a massive decline ininvestment. In real terms, fixed investment fell nearly 30 percent in 1976 andanother 30 percent in 1977. The allocation of import permits introducedsubstantial uncertainty about the availability of imported intermediate goods,and led to charges that the allocations were influenced by political interests.By 1977 the import restrictions were constraining production in several importantsectors of the economy, and yet no progress had been made toward a sustainablebalance of international payments.
By mid-1977 the external deficits had risen to crisis proportions.When attempts to obtain financial support from sympathetic governments failed,Jamaica was forced into the arms of the International Monetary Fund (IMF). Fromthen to the end of the PNP government's tenure, domestic economic policy was atendentious tug-of-war between the Manley government and the IMF. The IMF triedto enforce orthodox solutions to Jamaica's economic ills; the Manley governmentresponded with passive resistance--doing nothing to reverse its distortionaryinterventions in the marketplace, relent in its hostility to capitalist or marketapproaches to economic development, or eliminate the chronic imbalance in thepublic finances. The overall fiscal deficit, after reaching 15.5 percent of GDPin 1976, stabilized at about that level through 1979 and then increased sharplyin 1980.
Divided by internal disputes, the PNP government was unable to agreeon a positive plan of action to resolve the crisis--at least, on a plan thatcould satisfy the IMF--and the economy wallowed in this unsatisfactory statusquo until the elections of 1980. Output continued to decline while capital andskilled labor fled the country. Budgetary imbalances persisted, and partialmonetization of the deficits led to inflationary pressures. Stubborn resistanceto devaluation combined with high domestic inflation to create an overvalued realexchange rate. The balance of payments remained in fundamental disequilibrium,with the current account remaining under control only because of severequantitative restrictions on international trade. The exchange-rate devaluationof 1978 was insufficient to restore a balance to Jamaica's internationalpayments. Instead, the government resorted to increasingly restrictive pricecontrols and quantitative restrictions on international trade- -restrictions thatwere inconsistent with a resumption of normal economic activity.
Recovery. 1980-88
The Jamaica Labor Party (JLP) defeated the PNP government in 1980, andEdward Seaga became prime minister. The economic strategy of the JLP governmentwas based on the belief that relaxing the administrative restrictions on theeconomy would generate economic growth through favorable supply-side effects.

- 45 -
Such a relaxation would increase imports--most of the restrictions were tocompress import demand--while the supply-side effects on production would takelonger to realize. Participation of foreign lenders was crucial: withoutadjustment finance, the strategy had no hope of succeeding. Here, the Seagagovernment--identified by multilateral lending agencies and the U.S. governmentas having procapitalist policies--had a natural advantage over the socialistPNP. Foreign finance was readily available, perhaps too readily, to support theSeaga government's economic program.
The Seaga government's supply-side gamble did not fully pay off. TheJLP strategy did not take into account the impact that the distortions of the1970s had on demand. The combination of price controls and expansionary monetaryand fiscal policy had led to an economy in which an artificially high domesticpurchasing power was held in check only by government rationing of foreignexchange, and by the virtual disappearance of goods from stores' shelves at theunrealistically low, regulated prices. Thus, major macroeconomic reforms wereneeded to make the liberalization strategy viable.
There was some progress in containing budgetary expenditures, but thesenecessary macroeconomic reforms were not undertaken during the first three yearsof Seaga's term in office. Seaga pledged early to refrain from exchange-ratedevaluation, and he ruled out reductions in public-sector employment, whicheliminated prospects for a big improvement in the government's hemorrhagingbudget. The failure of the JLP government to take early action to curtailexcessive domestic demand, both private and public, was a fatal flaw in itspolicies during the first three years.
Because of this failure to address macroeconomic policy imbalances andbecause of some dramatically unfavorable external outcomes during 1981-83,Jamaica's economic situation became increasingly untenable. As 1983 progressedand the depth of the economic crisis facing Jamaica became clear to Jamaicanpolicymakers (and to the World Bank and IMF), the government responded with amajor reform of economic policy. These policy initiatives focused on themacroeconomic policy adjustments neglected during the first stage of the JLPgovernment's tenure. This reform was developed in consultation with, and underpressure from, the IMF and the World Bank. It was wide-ranging, and by 1986 itincluded: (a) a restructuring of the foreign exchange system and a massiveexchange-rate depreciation; (b) a major fiscal contraction, which brought thecentral government from an unsustainable deficit of 16 percent of GDP to a moresustainable 3 percent of GDP; (c) a comprehensive tax reform that reduceddistortions and led to a large increase in government revenue; (d) arationalization and liberalization of the tariff regime; and (e) a liberalizationof the domestic capital market.
The External Environment. The late 1970s and early 1980s weredifficult for Jamaica. The terms of trade deteriorated sharply between 1977 and1981, falling to a level lower than in any year since 1950, and stagnated through1985 (Chart 1). This decline reflected the second petroleum price shock andunfavorable prices for Jamaica's commodity exports.

- 46 -
A second adverse external development during the early 1980s was alarge increase in world interest rates. Because of the large and persistentcurrent-account deficits during the 1970s, Jamaica entered the 1980ssubstantially more exposed to international interest rate movements than in 1972.From 1970 to 1980 the public external debt rose from US$162 million to US$1,438million.10/ Thus, Jamaica was hit hard when international interest rates rosein the Volcker and Thatcher stabilizations of the late 1970s and early 1980s.
But the most significant external development for Jamaica during thefirst half of the 1980s was the precipitous decline of bauxite. Due to worldwidedeclines in demand, increased production in such competing countries as Guineaand Australia, and possibly the continued effect of the bauxite levy onproduction in Jamaica, bauxite production declined rapidly in the first severalyears of the Seaga regime. Having been fairly stable at about 12 million tonsa year from 1978 to 1981, production plummeted 28 percent to 8.4 million tonsin 1982 and dropped another 8 percent in 1983. By 1984 the bauxite sector wasoperating at about half its capacity (Table 2).
This decline in production had major implications for aggregate output,the balance of payments, and the government's budget. The 30 percent declinein real value-added in the bauxite sector in 1982 corresponds to an adverse"supply shock" of more than 2.5 percent of GDP. Gross export revenue frombauxite fell from US$760 million in 1981 to less than US$300 million in 1985 and1986.1i/ And the government budget suffered because a significant fraction ofthe central government's revenue came from taxation of bauxite earnings.
So, in the first half of the 1980s the JLP government was swimmingagainst a strong international tide, trying to raise output and stabilize theexternal accounts in the face of low demand for and low prices of Jamaicanexports. Aggravating these adverse external developments was a hurricane thatwiped out a substantial fraction of Jamaica's export crops in 1980. The bananaindustry had not yet fully recovered from this disaster when an even moredestructive hurricane hit Jamaica in 1988.
The external environment began to improve for Jamaica in the secondhalf of the 1980s. The generally declining trend in oil prices, the longeconomic expansion in the United States and other industrial economies, the
10/ The increase in public debt was a reflection of nationalizations duringthe 1970s. To the extent that the nationalized properties earned foreignexchange, the associated government debt could be serviced automatically.But, in practice, many nationalized firms were unprofitable or becameunprofitable.
L/ These numbers overstate the impact of the decline in bauxite productionon the Jamaican balance of payments because with the decline came aconcomitant decline in imported intermediate inputs and in profitremittances to foreign-owned aluminum companies. Nevertheless, the dataare sufficiently precise to show the magnitude of the external shock toJamaica.

- 47 -
reduction in international interest rates from the peaks during thestabilizations of the early 1980s, and some recent recovery in the market forbauxite have all been beneficial for Jamaica. In 1989 bauxite production roseto roughly 9.5 million tons, and the outlook is for further improvement in 1990.These relatively favorable developments provided a significant boost to Jamaica'sadjustment efforts after 1985.
The supportive attitude taken by international lenders to the Jamaicangovernment's economic program is one aspect of the external environment that washighly favorable to Jamaica. When Jamaica approached the IMF in 1980 tonegotiate a lending agreement, there was no difficulty reaching agreement on apackage that was politically advantageous for Jamaica. At first, there were nodemands for further devaluation, and the fiscal targets were rather lenient.One reason for the IMF's lenient attitude was Jamaica's special situation, inwhich recovery clearly demanded supply-side initiatives and in which demandconstraints might backfire by reducing the likelihood of the investment andproduction response required for success. There probably were other reasons aswell: the Jamaican program was widely viewed as a prototype for supply-sidereforms in developing economies, and the U.S. government had an interest inhelping Jamaica succeed. Whatever the reason or combination of reasons, theJLP's relations with the IMF were far easier, at first, than those of the PNPgovernment.
Economic Policies and Outcomes. 1981-83. The PNP and the JLP agreedon the undesirability of exchange-rate devaluation and public-sector layoffs.Pledges by the Seaga government to refrain from these actions greatly impededefforts to bring the government's fiscal position toward balance and the externalaccounts into equilibrium.
The Seaga government did implement some measure of austerity in thebudgets for 1982, 1983, and 1984, but the modest reductions in spending wereroughly offset by an increase in the government's interest bill (Table 3).Noninterest current expenditure declined from 24.8 percent of GDP in the 1981fiscal year to 21.3 percent in the 1984 fiscal year, but interest payments rosefrom 7.9 percent of GDP to 10.4 percent, driven by rising public debt and higherworld interest rates. Although current expenditure fell slightly during thisperiod, so did revenue, largely due to the depression in bauxite. In fiscal 1982the bauxite levy yielded 5.6 percent of GDP in tax revenue for the centralgovernment, but as the bauxite sector in Jamaica fell into depression, revenuefrom the bauxite levy collapsed, declining to 2.6 percent of GDP in fiscal 1984.Revenue from other sources declined in this year as well, for reasons that areunclear. The bottom line was a record fiscal deficit on current account of 8.0percent of GDP, slightly larger than the 7.8 percent of GDP that was recordedin fiscal 1981.
Offsetting this deterioration of the recurrent fiscal deficit was somereduction in capital spending, which fell from 11.9 percent of GDP in 1982 to7.8 percent in 1984. The net effect was an overall fiscal deficit of about thesame magnitude as those in the latter years of the Manley government: 15.9percent of GDP in 1982, 14.1 percent in 1983, and 15.8 percent in 1984. Thus,during the first three years of the Seaga government, fiscal policy remained more
- 48 -
or less the same as that inherited from the Manley government. Adverse externaldevelopments, particularly in the bauxite sector, swamped painful but inadequatemovements toward fiscal restraint.
The Seaga government also followed a relatively passive policy in itsexchange-rate policy in its early years. During 1980-83 there was no adjustmentin the nominal Jamaican exchange rate, although inflation was substantiallyhigher in Jamaica than in its trading partners (Chart 2). There was thus acontinual and substantial decline in Jamaican competitiveness. By the end of1983 international competitiveness had declined to the levels reached at the endof 1978, just before the Manley devaluation.
The real exchange-rate appreciation contributed to the huge externaldeficits of the early 1980s. In the first years of the Seaga government, theexternal deficits and exchange-rate overvaluation worsened, and the publicrealized that the government's exchange-rate policy was unsustainable. Theunviability of the exchange-rate policy was revealed first in the emergence ofa black market in foreign exchange around 1981, which the government eventuallysanctioned as a legal "parallel" market, where foreign exchange traded at roughly50 percent above the official exchange rate. This de facto devaluation did notapply to all international transactions, and it was insufficient to restoreequilibrium to Jamaica's international payments.
The government's exchange-rate policy had two results: it reducedJamaican producers' ability to compete in international markets, and it createdexpectations of future devaluation. The first effect--on internationalpayments--is obvious. Less obvious is the impact of expected depreciation.Domestic residents who anticipated a large exchange-rate depreciation had twoways to insure themselves against it: to buy foreign securities (capitalflight), or to buy durable consumer goods for use after the depreciation, whenthe goods would have become more expensive. Capital flight and a bulge inspending on consumer durables were important features of the crisis leading upto the reforms by the government in 1984 and after.
Although the government's macroeconomic policy record in these earlyyears can with hindsight be criticized, the government did many things right,as favorable outcomes in growth and investment attest. The major thrust of thegovernment's policy was to liberate the private sector from the constraints ofintrusive government regulation and to promote sectoral growth through WorldBank-financed investments, particularly in agriculture.
The first policy thrust was important. During the last years of thePNP government, the private sector was forced to operate in an atmosphere hostileto capitalist endeavor. In competition with the state for domestic and foreignresources, the business sector lost. The surge of migration is the best measureof the Jamaicans' discouragement at the obstacles placed in their way by thegovernment policies of the late 1970s. The Seaga government reversed thishostility toward the private sector, eliminated the fear of nationalization andprice controls, and returned to the private sector the access to resourcesrequired for production. The most important step taken to open access toresources was the dismantling of the import licensing system and the elimination
- 49 -
of most quantitative restrictions on imports. This allowed firms in Jamaica toobtain intermediate inputs, and removed a time-consuming, bureaucratic obstacleto private production.
It is difficult to quantify the magnitude of the economicliberalizations undertaken by the Seaga government in its early years, much lessto estimate their effect on the economy. But it is equally difficult to disputeJLP's effectiveness in reviving the moribund economy it inherited. For, despitethe adverse external developments discussed above, the Seaga program ofliberalization was initially successful in reviving economic growth. Real GDProse by 2.5 percent in 1981, more rapidly than had been expected. Jamaica easilypassed the liberal 1981 performance criteria of the IMF adjustment program. And,despite ups and downs associated with later adjustment efforts, economic growthwas, on average, positive during the JLP rule. Most of the economic growth,averaging 2 percent a year, occurred in the first three years of the Seagagovernment. This growth was despite a depression in the bauxite sector thatpulled output down an average of 10 percent a year.
The economic recovery during 1981-88 was weak, especially compared withthe robust growth rates experienced before 1972 (Table 4). But growth waswidespread, with only the mining and government sectors showing declines inoutput. Tourism grew particularly rapidly (as seen in the category "hotels andrestaurants"). Tourists tripled from 0.5 million in 1980 to about 1.5 millionin the late 1980s. Travel income now accounts for about US$550 million inexports, rivaling bauxite as the most important earner of foreign exchange.
The recovery of output and employment was associated with a welcomerecovery of domestic investment. The recovery of investment from the depressedlevels of 1977-80 was rapid and substantial (Chart 3). By 1985, net investmentwas about 17 percent of GDP--far below the heady days of the late 1960s, but inline with a long-run historical average and enough to finance economic growth.
But domestic savings remained low during 1981-85, due to low governmentsaving. Private saving responded well to the stabilization and liberalizationof the economy under the JLP government, gradually rising from the depressedlevels of the late 1970s (Chart 4). The low national savings--due to thegovernment's inability to bring its fiscal accounts into balance and therelatively robust domestic investment--created large current-account deficits.The current-account deficit averaged US$350 million in each of the years 1981to 1985--well in excess of 10 percent of GDP in each of the five years (Table6). These deficits added US$1,743 million to Jamaica's foreign debt in only fiveyears.
As noted above, this decline in government saving is closely relatedto the decline in the bauxite sector, and the resulting reduction in bauxiteexports (Table 6). Bauxite exports declined from US$760 million in 1981 toUS$425 million in 1983, and to less than US$290 million in 1985. Meanwhile, debtservice steadily increased as Jamaica's international borrowing continued torise. Despite significant rises in travel income--from US$285 million in 1981to US$400 million in 1983--the current account plunged into deficit. As thenecessity for dramatic reform--and the associated probability of
- 50 -
depreciation--became clear, private capital flowed out of Jamaica, and in 1983the external imbalances simply could no longer be financed. Reserves declinedby almost US$150 million in 1983, and almost US$200 million in payments arrearswere accumulated despite the receipt of large loans for balance of paymentssupport.
The dimensions of the fiscal and payments crisis were not fullyrecognized by the government until the end of 1983, although the need for policyreforms had become apparent before then. Negotiations with the IMF had beenunder way as a result of Jamaica's failure in 1982 to satisfy performancecriteria attached to an IMF standby agreement. During 1983 the governmentresisted some of the abrupt and extreme stabilization measures the IMF proposed.But as the severity of the crisis facing the country became clear, the governmentcommitted to a wide-ranging and ambitious reform.
The economic policy reforms instituted after 1983 were far-reaching,encompassing fiscal policy, the exchange-rate system, the domestic tax system,the tariff system, the authority and independence of the central bank,liberalization of the domestic financial market, and government divestment ofsuch commercial activities as hotels. The tax, budgetary, monetary,. andexchange-rate policy changes were the most wrenching adjustments, and the mostimportant in shaping outcomes in recent years.
During 1984-88 the government staged a remarkably successful attack onthe budgetary imbalances that persisted for nearly fifteen years prior to the1983 crisis. The government was helped in its stabilization effort by the littleor no parliamentary opposition to its policies, since the PNP did not participatein the 1984 elections. Whatever the reason, the turnaround in the fiscalsituation is impressive. Noninterest recurrent expenditures fell from 21.3percent of GDP in the 1984 fiscal year to 15.8 percent in 1988, while revenuerose from 23.6 percent to 29.8 percent of GDP (Table 3). Capital expenditurewas slashed as well, resulting in a reduction in the overall budget deficit fromabout 16 percent of GDP in 1984 to 6.5 percent in the next two years, and roughly3 percent in the 1987 and 1988 fiscal years.
The budgetary correction took place in two stages. Spending reductionswere the emphasis in the first two years of the program. Major reductions inpublic-sector employment were implemented, so that central government wagepayments fell from about 13 percent of GDP to about 11 percent in 1985 and 9percent in 1985. Other noninterest spending fell as well, but less dramatically.In addition there were major cuts in the government's investment spending, fromthe low level of 8 percent of GDP in 1984, to about 5 percent in 1985 and 1986.This reduction in government investment was undesirable and unsustainable. Butit was also the only feasible short-run response to the 1983 crisis, given theneed for immediate, decisive action.
During the first two years of stabilization, enhanced enforcementraised the share of government revenue somewhat, though most of the budgetarygains came from reduced expenditure. The second stage of the stabilizationcoincides with implementation of the reformed personal and corporate tax systemsin 1986. The personal income tax reform replaced a complicated and highly

- 51 -
progressive system with a simpler system with a broader base, a higher initialtax threshold, and flat rate of 33 percent above the threshold. These taxreforms raised central government revenue dramatically. Exclusive of the bauxitelevy, central government revenue rose from 23 percent of GDP in fiscal 1986 to28 percent in 1988 and 1989. During this second stage of the budgetary reform,the reduction in the government wage bill continued, until in fiscal 1988 it fellalmost to the pre-1976 level. Other categories of government spending increasedsomewhat from the depressed levels of 1985 and 1986, especially in fiscal 1989.
In addition to the improvement in central government finances, priceswere increased for the services of many quasi-governmental entities, includinggasoline and public utilities. These price increases raised the cost of livingand were highly unpopular, leading in some cases to demonstrations. The priceincreases stuck, and the financial condition of the public enterprises improveddramatically.
The government also undertook a dramatic change in exchange-ratepolicy, substituting a chronically overvalued currency with realisticallyvalued--even undervalued--currency. The first step toward devaluation was theinstitution of a parallel market in foreign exchange in January 1983. This movelegalized the existing black market in foreign exchange, and moved the previouslyclandestine transactions into the domestic banking sector. But in negotiationstoward a new standby agreement in 1983, the IMF insisted on the unification ofthe dual exchange-rate regime and the institution of a free market in foreignexchange. With the exchange rate no longer set by the government, the exchangerate would instead reflect market judgments about the equilibrium value of thecurrency.
Upon institution of this market in November 1989, the exchange ratejumped to J$5.50 to the U.S. dollar, approximately halving in value. Theexchange rate continued to depreciate rapidly until the dollar reached J$6.50.The government stepped in and, through a combination of exchange-marketintervention and political pressure on the banks that make up the foreignexchange market, set the exchange rate at J$5.50 to the U.S. dollar. It remainedat that level until another devaluation in February 1990 raised the price of U.S.dollars to J$7.00.
While the IMF's experiment of an auction market in foreign exchange wasshort-lived, the depreciation was sustained. The depreciation of the Jamaicandollar was large, bringing its real value far below any level it had reachedbefore (Chart 2). In 1987 and 1988 the real exchange rate stabilized about 40percent weaker than the level of the late 1960s, and about 30 percent weaker thanits previous low point in 1979.
The exchange-rate depreciation raised the cost of imported inputs andconsumption goods, raising business costs and reducing standards of living.These generated inflationary pressures, with a sharp spike in the inflation ratein the immediate aftermath of the exchange-rate depreciation. These inflationarypressures were exacerbated by the public-sector price increases enacted at thesame time. But a generally tight monetary policy prevented the inflationarypressures from degenerating too completely.
- 52 -
The ex-post real interest rate, one indicator of monetary policy inthose years, declined precipitously during the recession years 1984 and 1985,but interest rates maintained a high level during the recovery years 1986-88(Table 7). These high rates may have slowed the recovery of investment andoutput. But the restrained monetary policy prevented cost disturbances arisingfrom the exchange-rate depreciation and the public-sector price increasesspilling over into a generalized inflation. Indeed, inflation rapidly declinedto moderate rates by 1987 and 1988.
The budgetary, monetary, and exchange-rate policies pursued by theSeaga government had major effects on growth, savings, and investment in theyears following their enactment. The short-run reaction to the shock treatmentimposed by the government and the long-run, more favorable responses must bedistinguished. The initial impact of the budgetary and exchange-rate policieswas adverse for economic growth (Chart 5). Real GDP fell by 0.9 percent in 1984and 4.6 percent in 1985, for an average rate of decline equal to 2.8 percent ayear. Most major sectors experienced declines in output, except agriculture,where output increased 3 percent a year in 1983-85. The short-run contractionaryimpact of the policy changes were to be expected. Tax and public-sector priceincreases, reductions in government subsidies, and layoffs in the public sectorreduced consumers' purchasing power, and reductions in government investment andconsumption-reduced demand for domestically produced goods.
The recession hit investment and government consumption hardest (Table5). Real investment fell more than 10 percent in 1984, was flat in 1985,declined almost 20 percent in 1986, rebounded in 1987, and fell another 18percent in 1988.12. Private consumption rose in every year except 1985. Butchanges in consumption were unevenly distributed across the population--peopledependent on government subsidies were particularly-hard hit.
Exports responded quickly to the new policy regime, and the real valueof exports grew rapidly through 1987 (Table 5). After 1985 the economy recoveredits momentum and entered two years of export-led growth. Investment recoveredlater than the rest of the economy, but rose in both 1987 and 1988.
Economic growth in this second stage of adjustment to the Seagagovernment's economic policy reforms was widespread. Leading sectors weremanufacturing, construction--where output rose at an annual rate of 10 percentin 1985-88--and tourism--which grew almost 10 percent a year in 1985-87. Theworldwide recovery of the aluminum market after 1985 affected Jamaica. Outputin the bauxite sector recovered somewhat from the extremely depressed levels of1985. These output increases are expected to continue in the near future, andshould significantly ease pressures on the government budget and internationalpayments.
J2/ Data from the Statistical Institute of Jamaica, Economic and SocialSurvev.

- 53 -
Despite short-term, cyclical setbacks to investment, by 1987 netinvestment had recovered to 16 percent of GDP. Much of the financing came fromdomestic savings, which rose from the negligible levels of the late 1970s andearly 1980s to roughly 8 percent of GDP in 1986 and 1987. These increases insavings were primarily due to the major increase in government savings, butprivate savings also improved relative to the levels of the late 1970s and early1980s. A variety of factors were probably responsible for the increase inprivate savings. These included a substantial increase in real returns tosaving, a need to reconstitute asset positions after price increases associatedwith depreciation had eroded their real value, and perhaps some increase inconfidence about the future once the adverse impacts of the stabilization hadpassed.
Along with the recovery in production came significant increases inJamaican employment (Table 8). Employment grew, and unemployment fell, even inthe relatively bad years, 1984-85. Between 1983 and 1985 employment rose 5percent, even though real GDP fell a total of about 5 percent. This is probablydue to the sectoral composition of output changes, with labor-intensiveagriculture expanding while output in less labor-intensive sectors declined.
The Seaga government's inability to finance international paymentsimbalances made the early strategy of liberalization without fiscal reformunsustainable, and motivated the major policy changes adopted after 1983. Thenew policies were successful in restoring some balance to international payments.There was dramatic improvement in the Jamaican balance of payments from 1983 to1988, on both the current and capital account (Table 6). The current accountdeficit fell from about US$350 million in the first five years of the Seagagovernment's term to US$40 million in 1986 and US$100 million in 1987. Thecurrent account moved into surplus in 1988, reflecting a surge in foreign aidfor hurricane relief.
In the early years of the stabilization, progress was due to a drasticreduction in imports and an improvement in nonfactor services, reflecting thestrong growth in tourism. Exports declined in the first years of the program,though they increased substantially from 1986 through 1988. The aggregate datamask a significant diversification of Jamaica's export base during the past fiveyears. In 1981, before the bauxite depression, exports of bauxite and aluminamade up 55 percent of total exports of goods and services. Other traditionalexports (sugar, bananas, and some other agricultural goods) made up another 6percent. The value of nontraditional exports stagnated, and in 1984 they wereonly 10 percent higher than in 1979--a substantial decline in real terms.
By 1987 the picture was quite different. The incentives to exportprovided by the weak Jamaican dollar invigorated the previously stagnant exportsof nontraditional exports. Export revenue from nontraditional sources rose by64 percent in 1984-87. Exports of clothing, virtually nonexistent before 1984,rose to over US$100 million in 1987. While in 1981 tourism and nontraditionalexports accounted for less than 30 percent of gross exports of goods andservices, in 1987 these categories accounted for almost 55 percent of the total.In addition to raising income in world markets, the increase in export sales inthese lategories will reduce Jamaica's earlier excessive vulnerability to

- 54 -
developments in the world aluminum market. And because the move is away fromthe highly capital-intensive mining industry into more labor-intensive sectorslike clothing and nontraditional agriculture, the gains from economic growth maybe more widely spread across the population.
The long string of deficits in Jamaica's international payments hasleft a legacy of high international indebtedness (Table 9). In 1979, Jamaica'sexternal public debt was only one-fourth of its GDP, and interest payments onthat debt amounted to less than 10 percent of total exports. But in 1988 thenation's external public debt was a staggering 143.5 percent of its GDP, andinterest payments on that debt amounted to nearly 20 percent of exports of goodsand services, or over 8 percent of GDP.
OUTLOOK: CAN THE RECOVERY BE SUSTAINED?
This review of recent experience highlights Jamaica's vulnerability toexternal disturbances, particularly to oil prices, the bauxite market, and, morerecently, world interest rates. Yet the most devastating wounds were self-inflicted. While the external environment of the 1970s was clearly harsher thanthat of the 1960s, the external disturbances are insufficient to explainJamaica's catastrophic decline. And it was in the even harsher environment ofthe mid-1980s that Jamaica began, tentatively and slowly, to recover.
Thus the first question that must be addressed when discussingJamaica's economic prospects is the present government's intentions--especiallyits budgetary policy and views of private enterprise. So far, the outlookappears favorable. The Manley government has repeatedly committed itself tobudgetary discipline and the encouragement of private enterprise, and hasdemonstrated this commitment during the past two years. The quantitativeevidence is mixed here, as the 1988 fiscal outcomes are confused by the effectsof the 1988 hurricane, which required relief expenditure. The government hascommitted itself to painful fiscal measures designed to bring the fiscal deficitback to around 3.5 percent of GDP. These measures include institution of ageneral consumption tax, increases in insurance and electricity rates, andgradual elimination of food subsidies. A test of the government will come duringthe next few years as the pain from such measures intensifies and begins to erodepublic support for the government.
The Jamaican policymakers remain resistant to exchange-ratedepreciation, and persistent pressure is needed from Jamaica's official creditorsto maintain a realistically valued currency. The recent devaluation barelyrestored the real exchange rate to 1987 levels, and with Jamaican inflation inthe range of 14 percent, that real devaluation will be offset quickly unless thenominal exchange rate is adjusted with alacrity. Monetary policymakers face aserious dilemma. They would presumably like to use the nominal exchange rateas an instrument for disinflation, as inflation is high by Jamaican standardsand the alternative policy, monetary contraction, has already led to highinterest rates. But the dangers of such a policy for a highly open economy,especially one with Jamaica's history of chronic payments imbalances, are clear.Exchange-rate policy will remain a contentious issue in the 1990s.

- 55 -
The external environment looks favorable for Jamaica in the short term.The bauxite market has picked up considerably from the depression of the 1980s.Output increased from 7.4 million tons in 1988 to 9.5 million tons in 1989, andthe forecast is for a further increase in 1990 to perhaps 10.5 million tons.The Kaiser company added capacity in 1988, and discussions are under way forfurther, substantial investments in refining capacity. Prospects for the sectorwere further enhanced in December by an agreement to supply the Soviet Union withone million tons of bauxite a year. Bauxite can be expected to be a minorpositive factor for Jamaica rather than the depressing factor that it was in the1980s. This will provide substantial relief for Jamaica's external payments andfiscal accounts.
Prospects for tourism depend on macroeconomic outcomes in the UnitedStates and Western Europe. Economic growth is expected to be less rapid in theindustrial countries than it was during the early 1980s, but it should besufficient for continued growth in Jamaican tourism. Demand is unlikely to growas fast as in the 1980s. But, unlike during those years, Jamaican tourism iscapacity-constrained, and further growth will require investment in hotels andrestaurants--a good thing for the domestic construction industry, but pointingtoward slower growth in tourism revenues during the 1990s.
The darkest spot on the horizon is Jamaica's international debtservice. With debt equal to roughly one and a half times GDP, a one percentagepoint increase in the interest rate results in the transfer of an additional oneand a half percentage points of GDP to foreign creditors. The recent rise inworld interest rates is, therefore, cause for alarm. Interest payments nowaccount for nearly 40 percent of central government expenditure and are makingit increasingly difficult for the government to provide basic public servicesin health, education, and law enforcement. The ratio will rise as contemplatedspending reductions are implemented. The ratio will rise even more if worldinterest rates continue their upward drift, until at some point the Jamaicanpopulation will notice that its government has become little more than a moneymachine for foreign creditors. At that point, the conciliatory posture of theJamaican policymakers to their creditors will become untenable, no matter howsincerely they wish to maintain it. Few events would be as disruptive forJamaica's economic prospects as a feud with its foreign creditors, with all thatit may imply, and those in the world economy who wish Jamaica well should besearching for ways to reduce its debt burden to avert such a possibility.
- 56 -
REFERENCES
Fields, Gary S. 1988. "Changes in Poverty and Inequality in DevelopingCountries." Department of Economics, Cornell University.
Gavin, Michael. 1989. "Macroeconomic Policy in Jamaica: 1972-1988."Department of Economics, Columbia University.
Jefferson, Owen. 1972. The Post-War Economic Development of Jamaica. Jamaica:Institute of Social and Economic Research, University of the West Indies.
Looney, Robert E. 1987. The Jamaican Economy in the 1980's: Economic Declineand Structural Adjustment. Boulder: Westview Press.
Sharpley, Jennifer. 1983. "Economic Management and IMF Conditionality inJamaica." In John Williamson, ed., IMF Conditionality. Cambridge: MITPress.
Statistical Institute of Jamaica. Various years. Economic and Social Survey.
Wellisz, Stanislaw, and Carl Stone. 1989. "The Political Economy of Poverty,Equity, and Growth: Jamaica." Department of Economics, ColumbiaUniversity.
World Bank. 1968, 1971, 1974. "Current Economic Position and Prospects ofJamaica." Washington, D.C.
_ 1989. "Jamaica: Adjustment Under Changing Economic Conditions.'Washington, D.C.

- 57 -
Table 1:Macroeconomic Performance In Jamalca
,________________________ _ 1955-72 1972-80 1980-88
Real GDP growth 5.4% -2.5% 0.9%Net Investment: percent of GDP 17.5 12.0 15.4Consumer pnce mflation 3.8% 21.5% 14.1%External debt-GDP ratio: (end of period) 58.1% 71.4% 143.5%
Notes: The 1955-72 GDP growth rate is from Stone and Wellisz (1989). Other data are from IMIFInternational Financial Statistics, Statistical Institute of Jamaica National Income and Product, andWorld Bank World Debt Tables (various issues).
Table 2:The Bauxlte-secior In Jamaica
1197811979119801198111982119831198411985119861198
Production (mil. tons) 11.8 11.6 12.1 11.7 8.4 7.7 8.9 6.0 7.0 7.7 7.3Capacity Utilization (%) 88 91 89 93 90 64 59 69 46 53 59Contribution to Real GDP1974 J$: 143.2 141.6 158.3 160.5 112.3 112.8 113.8 91.8 97.9 102.6 n.a.Percent of Total GDP 7.2 7.3 8.7 8.6 5.9 5.8 5.9 5.0 5.2 5.2 n.a.
Export receipts:(mil. US. cfollars) 582.3 581.7 735.7 760.2 513.8 423.8 443.5 289.7 295.5 336.5 417.2
Source: World Bank (1989)
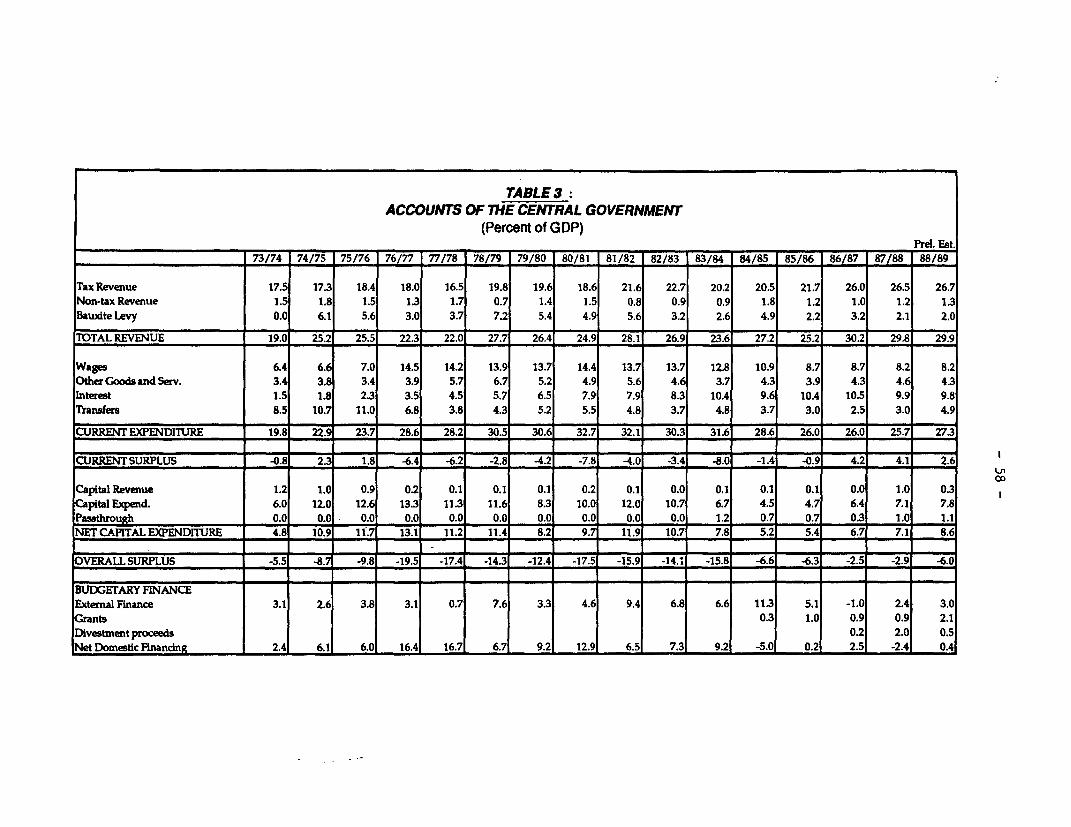
TABLE 3:ACCOUNTS OF THE CENTRAL GOVERNMENT
(Percent of GDP)___________________ ~~~~~~~~~~~~~~~~~~~~~~~~~~~~~~~~~~~~~~~~~~~Prel. Est..
_ 73/74 74/75 75/76 1 76/77 77/78 78/79 79/80 80/81 81/82 82/83 83/84 84/85 85/86 86/87 87/88 88/89
Tax Revenue 17.5 17.3 18.4 18.0 16.5 19.8 19.6 18.6 21.6 22.7 20.2 20.5 21.7 26.0 26.5 26.7Non-tax Revenue 1.5 1.8 1.5 1.3 1.7 0.7 1.4 1.5 0.8 0.9 0.9 1.8 1.2 1.0 1.2 1.3Bauxite Levy 0.0 6.1 5.6 3.0 3.7 7.2 5.4 4.9 5.6 3.2 2.6 4.9 2.2 3.2 2.1 2.0
TOTAL REVENUE 19.0 25.2 25.5 22.3 22.0 27.7 26.41 24.9 28.1 26.9 23.6 27.2 25.2 30.2 29.8 29.9
Wages 6.4 6.6 7.0 14.5 14.2 13.9 13.7 14.4 13.7 13.7 12.8 10.9 8 7 8.7 8.2 8.2Other Goods and Serv. 3.4 3.8 3.4 3.9 5.7 6.7 5.2 4.9 5.6 4.6 3.7 4.3 3.9 4.3 4.6 4.3Interest 1.5 1.8 2.3 3.5 4.5 5.7 6.5 7.9 7.9 8.3 10.4 9.6 10A 10.5 9.9 9.8Transfers 8.5 10.7 11.0 6.8 3.8 4.3 5.2 5.5 4.8 3.7 4.8 3.7 3.0 2.5 3.0 4.9
CURRENT EXPENDITURE 19.8 22.9 23.7 28.6 28.2 30.5 30.6 32.7 32.1 30.3 31.6 28.6 26.0 26.0 25.7 27.3
CURRENTSURPLUS -0.8 2.3 1.8 -6.4 -6.2 -2.8 -4.2 -7.8 -4.0 -3.4 -8.0 -1.4 -0.9 4.2 4.1 2.6
Capital Revenue 1.2 1.0 0.9 0.2 0.1 0.1 0.1 0.2 0.1 0.0 0.1 0.1 0.1 0.0 1.0 0.3 1Capital Expend. 6.0 120 12.6 13.3 11.3 11.6 8.3 10.0 12.0 10.7 6.7 4.5 4.7 6.4 7.1 7.8
Passthrough 0.0 00 0.0 0.0 0.0 0.0 0.0 0.0 0.0 0.0 1.2 0.7 0.7 0.3 1.0 1.1NET CAPITAL EXPENDITURE 4.8 10.9 11.7 13.1 11.2 11.4 8.2 9.7 11.9 10.7 7.8 5.2 5.4 6.7 7.1 8.6
OVERALL SURPLUS -5.5 -8.7 -9.8 -195 -17.4 -14.3 -12.4 -17.5 -15.9 -14._ -15.8 -6.6 -6.3 -2.5 -2.9 -6.0
BUDGETARY FINANCEExternal Finance 3.1 2.6 3.8 3.1 0.7 7.6 3.3 4.6 9.4 6.8 6.6 11.3 5.1 -1.0 2.4 3.0
rants 0.3 1.0 0.9 0.9 2.1Divestment proceeds 0.2 2.0 0.5Net Domestic FinancinR 2.4 6.1 6.0 16. 16.7 6.7 9.2 12.9 6.5 7.3 9.2 -5.0 0.2 2.5 -2.4 0.4

- 59 -
Table 4:Economic Growth in Jamaica
1955-72 1972-80 1980-88
Real GOP growth 5.4% -2.5% 0.9%A'iculture 2.3 -1.4 1.1Mlning n.m. -4.3 -5.1ManuEacturing 7.3 4.2 1.9Construction 8.0 -11.2 1.8Government Services 9.8 9.5 -1.0Hotels and Restaurants n.a. -2.9 5.8Other 6.7 -3.5 2.0
Sources: Jefferson (1972), and Statistical Institute of Jamaica National Income and Product (variousissues). The 1955-72 growth rate for mining is not meaningful because the 1955 base is close to zero.
Table 5: National Accounts
1981 1982 1983 1984 1985 1986 1987 1988
GDPLocal Currency (mil.) 5,292 5,867 6,993 9,355 11,151 13,310 15,717 17,645U.S. Dollars (mil.) 2,742 2,948 3,252 2,372 2,006 2,430 2,864 3,215
Share to GDP (%)Consumption 90.0 90.7 89.8 83.6 85.3 79.3 77.1 81.3
Private (69.3) (68.8) (69.7) (67.1) (69.6) (63.9) (62.5) (65.9)Public (20.7) (22.0) (20.1) (16.6) (15.7) (15.4) (14.6) (15.5)
Investment 20.4 20.9 22.3 23.0 25.0 18.5 22.6 27.1Exports 47.4 38.2 37.5 53.0 58.5 54.8 54.8 48.8Imports 57.8 49.8 49.5 59.6 68.8 52.6 54.5 57.2
Real Growth RatePrivate Consumption -1.6 7.6 2.1 5.6 -2.4 0.2 5.9 - -
Investment 31.1 -4.2 3.7 -10.5 0.0 -18.9 21.3 - -
Govemment Consumption 2.2 1.6 -1.0 -6.7 -2.8 -0.6 1.7 - -
Exports 4.0 -12.4 9.4 17.7 11.2 6.7 12.0 - -
Imports 6.1 -2.8 6.1 18.3 14.6 -3.1 14.6 - -
Population (mil.) 2.16 2.20 2.24 2.28 2.31 2.34 2.41 2.45
Sources: IMF Intemational Financial Statistics and World Bank
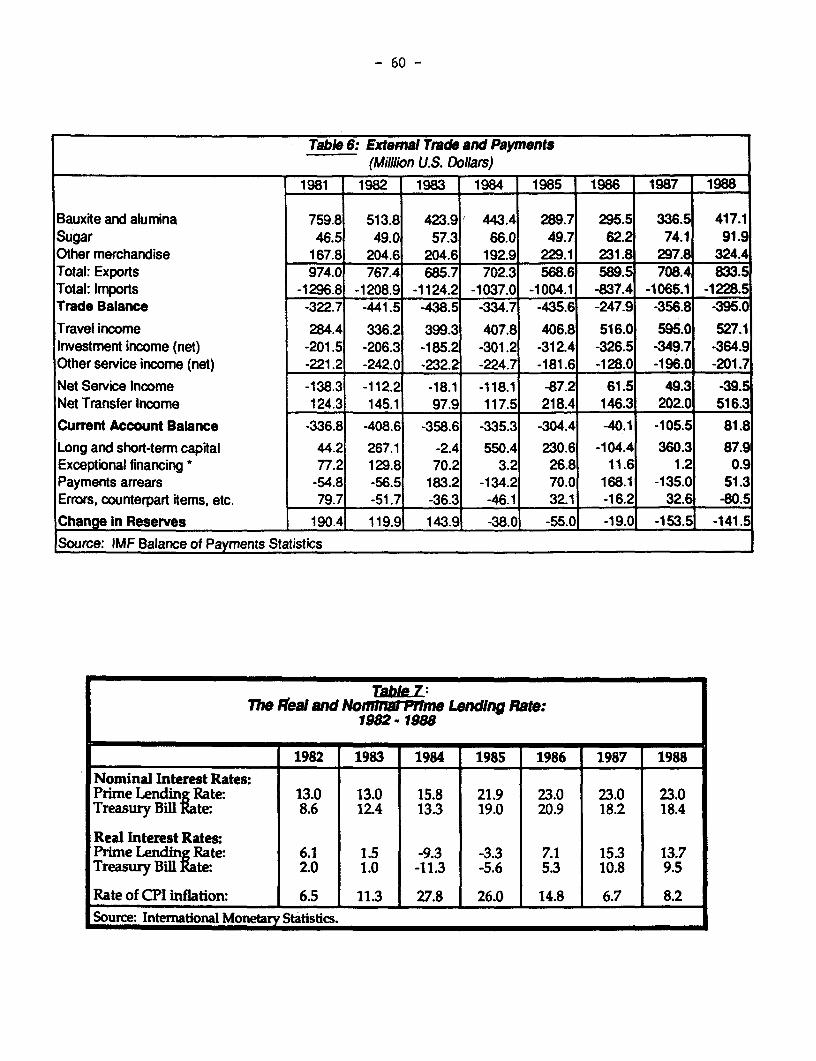
- 60 -
Table 6: Extemal Trade and Payments(Mililion U.S. Dollars)
1981 1982 1983 1984 1985 1986 1987 1988
Bauxite and alumina 759.8 513.8 423.9' 443.4 289.7 295.5 336.5 417.1Sugar 46.5 49.0 57.3 66.0 49.7 62.2 74.1 91.9Other merchandise 167.8 204.6 204.6 192.9 229.1 231.8 297.8 324.4Total: Exports 974.0 767.4 685.7 702.3 568.6 589.5 708.4 833.5Total: Imports -1296.8 -1208.9 -1124.2 -1037.0 -1004.1 -837.4 -1065.1 -1228.5Trade Balance -322.7 -441.5 -438.5 -334.7 -435.6 -247.9 -356.8 -395.0Travel income 284.4 336.2 399.3 407.8 406.8 516.0 595.0 527.1Investment income (net) -201.5 -206.3 -185.2 -301.2 -312.4 -326.5 -349.7 -364.9Other service income (net) -221.2 -242.0 -232.2 -224.71 -181.6 -128.0 -196.0 -201.71Net Service Income -138.3 -112.2 -18.1 -118.1 -87.2 61.5 49.3 -39.5Net Transfer Income 124.3 145.1 97.9 117.5 218.4 146.3 202.0 516.3Current Account Balance -336.8 -408.6 -358.6 -335.3 -304.4 -40.1 -105.5 81.8Long and short-term capital 44.2 267.1 -2.4 550.4 230.6 -104.4 360.3 87.9Exceptional financing * 77.2 129.8 70.2 3.2 26.8 11.6 1.2 0.9Payments arrears -54.8 -56.5 183.2 -134.2 70.0 168.1 -135.0 51.3Errors, counterpart items, etc. 79.7 -51.7 -36.3 -46.1 32.1 -16.2 32.6 -80.5Change in Reserves 190.4 119.9 143.9 -38.0 -55.0 -19.0 -153.5 -141.5Source: IMF Balance of Payments Statistics
Tahle 7:The Rreai and NomatPrme Lending Rate:
1982 - 198
1982 1983 1984 1985 1986 1987 1988
Nominal Interest Rates:Prime Lending Rate: 13.0 13.0 15.8 21.9 23.0 23.0 23.0Treasury Bill Rate: 8.6 12.4 13.3 19.0 20.9 18.2 18.4
Real Interest RatesPrime Lending Rate: 6.1 1.5 -9.3 -3.3 7.1 15.3 13.7Treasury Bill Rate: 2.0 1.0 -11.3 -5.6 5.3 10.8 9.5
Rate of CPI inflation: 6.5 11.3 27.8 26.0 14.8 6.7 8.2Source: International Monetary Statistics.

- 61 -
Table 8:Employment and Unemployment, 1983 - 1988
Labor Force 1008.4 1045.8 1042.4 1059.0 1069.7 1077.4Employed 743.2 778.9 781.7 808.5 845.4 874.3Unemployed 278.6 266.8 260.8 250.5 224.3 203.4(Of whiich job-seekers) 133.5 107.3 111.8 99.1 84.5 87.3(Of which non-seekers) 145.1 159.5 149.0 151.4 139.8 116.1
Employment ratio 73.7 74.5 75.0 76.3 79.0 81.1Unemployment ratio 27.6 25.5 25.0 23.7 21.0 18.9(Of which job-seekers) 13.2 10.3 10.7 9.4 7.9 8.1(Of which non-seekers) - 14.4 15.3 14.3 14.3 13.1 10.8 1
Table 9:Exteral Public Debt: 1977- 1987
(Million U.S. Dollars)
1977 1979 1981 1983 1985 1987 1988US$ Millions:Total external debt 1678.5 1706.9 2299.4 3313.5 3867.2 4494.0 4614.9Interest payments 1033A 115.3 151.3 224.7 289.9 297.9 271.4
PercentDebt/GDP 27.2 23.7 83.9 101.9 192.8 156.9 143.5Interest/Exports 10.9 9.9 10.8 18.4 24.7 19.6 17.4
Source: World Bank (1989). Exports refer to goods and nonfactor services.

- 62 -
Chart 1:Terms of Trade: Jamaical
180
140
120
100
80
60
40
20
50 52 54 56 58 60 62 64 66 68 70 72 74 76 78 80 82 84 86 88
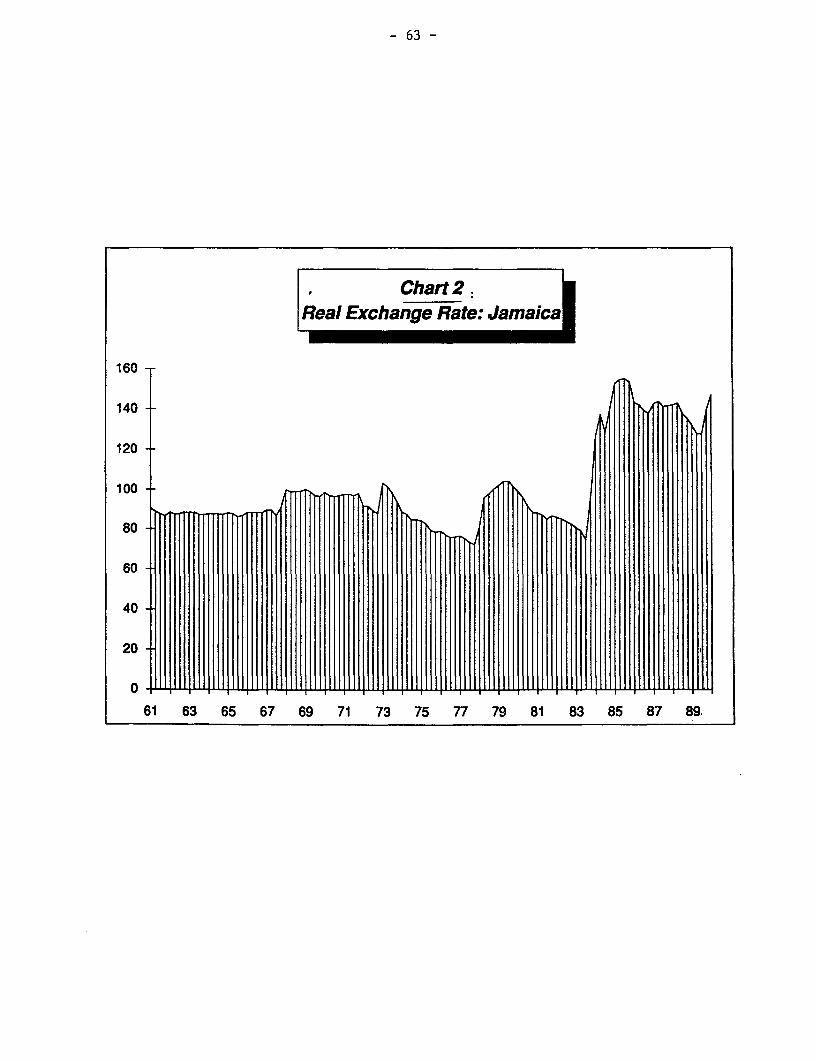
- 63 -
Chart 2LReal Exchange Rate: Jamaica
160
140
120
100
80
60
40
20
0
61 63 65 67 69 71 73 75 77 79 81 83 85 87 89.

- 64 -
p
Char't 3: Nept Investmxent In Jamaica
(Percent of GDP)f
25
20 -
15 O
10 " Ill5
51 53 55 57 59 61 63 65 67 69 71 73 75 77 79 81 83 85 87

- 65 -
Chart 4: te and Public Saving
LI(parcent of GDP)
12
10
8
6
4
2
0 P~258 60 62 64 66 68 70 72 74-4
-6
-8
Public sector Private sector

- 66 -
Chart 5:Real GDP In JamaIca:- 19619
2500000 -
2000000 -
1500000
1000000
500000 -
0 S i* S S . .
64 65 66 67 68 69 70 71 72 73 74 75 76 77 78 79 80 81 82 83 84 85 86 87

- 67 -
COMMENTARY BY SUE COLLINS
I agreed with a lot of the main conclusions that are in the paper. Ithought what I would do is to put a somewhat different light on them. I do notthink there is an issue in terms of the interpretation of the main periods andthe main developments that happened, but I think that, at least my perspectiveon some of the reasons for them is somewhat different, I think that raisesperhaps some different lessons and also some different issues in a slightly morepessimistic prospect for the coming years.
So what I thought I would do is just very quickly go through the variousstages that you have already heard but with a slightly different emphasis, inparticular focussing on some of the political economy aspects of why certainpolicies were or were not undertaken and then come back at the end to adiscussion of what some of the questions are--and I unfortunately don't haveanswers to them--and prospects.
I also think of recent history in terms of four different periods. Thefirst one is the experience pre-1972, which is pre-the Michael Manley governmenttaking office. And there we have an economy basically which was in quite goodshape. I mean, the prospects pre-'72 were really very favorable. Jamaicangrowth was quite strong. It was viewed as being an economy that had quite a bitof promise for a variety of different reasons.
The major problems were really social ones. There was a strong concernthat was widespread that had been there during the independence movement andpersisted throughout about income distribution problems. There was a realfeeling that one of the most important tasks of new governments, onceindependence had kind of settled down, was to address those distribution problemsand those issues. We saw then in the second period--the years in which MichaelManley and the People's National Party was in office, from 1972 to 1980--a realfocus explicitly on those social issues and a focus ignoring some of the macroeconomic balances and the basic constraints that I think have really become veryevident and very important throughout Jamaica's history.
The 1972 to 1980 period is really quite shocking, a period in which thereweren't major domestic political strifes or wars or anything like that but a realdecline of output of 20 percent. It really is a striking history.
There was really a widespread social consensus that said focusing on socialredistribution issues was really the important order of the day. I think therewas a feeling, at least among people in office and people in various parts ofthe government, that was really the be-all and end-all of policy.
I must agree with the description in the paper of the drearily familiarpattern of the increase in fiscal deficits, financed by money creation,inflation, overvaluation, the capital flight, the budget deficits, the accumula-tion of foreign debts, all of those things which, instead of adjustments, ledto increasing government control over a variety of different parts of the

- 68 -
economy, leading to black markets, to widespread shortages. It was prettytypical in the late 1970s for most of the suitcases for visitors going down toJamaica to be full of detergent and things like that.
The pervasiveness of the shortages was really quite extreme. Thesupermarkets were empty. That really led to an unsustainable crisis in politicalterms.
Now, what I think is quite interesting is that the next phase, which I callthe first period of the Edward Seaga administration, from 1980 to 1983, was onewhich took some steps away from the focus exclusively on social redistributionbut not a hundred percent. In particular what is quite interesting is that therewas a focus on advocating free market principles but not the macro adjustments.It focused on the supply side adjustments and not the demand side. I would saythe same thing in a slightly different way, focusing on a lot of micro economicadjustments and structural things but not adjusting the macro economicimbalances.
I think that is quite interesting, as I look back on that period again,in light of a number of things I read recently that focus on a number ofdeveloping countries today which people view as undertaking a lot-of the macroadjustments but not the micro adjustments. There is some interest in terms ofhow much growth you get, what the implications are, what the prospects are forexternal adjustment, etc., if you do one without the other. I think Jamaica,at least in that period, the early 1980s, provides an example of at least someprogress on the micro economic side, trade liberalization, encouragement ofinvestment, without much on the macro economic side.
It is also interesting to point out that it was an economy that got intotrouble before the 1982 crisis. In that sense, they still had access to foreignborrowing. In fact, there were large inflows of foreign borrowing, and one ofthe kind of most unrestrictive IMF standby arrangements in the early 1980scompared to a number of the other programs that we see more frequently. Itcalled in the short run for current account deficits to increase as imports wereexpanded to kind of retool industries and to reduce various gaps, etc. So, wehave a period in which there were large inflows, a lot of financing to try tohelp do adjustment. In fact, the macro adjustment wasn't undertaken at all.
Having also looked extensively at the Korean episode, the contrasts arereally very strong, especially in that period, where Korea also had theiradjustment eased by availability of foreign financing which allowed them to kindof adjust quickly. Of course, the Korean example is adjusting from just a oneyear decline and not an eight year period of a kind of structural, reduction incapital stocks and massive emigration, etc. But it really is a strikinglydifferent story there.
The paper argues that you can't overestimate the importance of the microeconomic incentives for helping to explain the growth revival in those earlyyears. I would argue that you shouldn't underestimate the role of the mass ofcapital inflows in trying to explain those. I would actually suggest that

- 69 -
perhaps the micro economic policies that were undertaken had less to do with therebound in growth in the early L980s than those massive capital inflows that camefrom a variety of different sources.
So in my view that period is one which is clearly not sustainable,certainly as the access to international credit markets dried up after 1982,something was going to have to happen. But it also left Jamaica even morevulnerable to international markets than it had been, going into that timeperiod.
The second period then is one in which the Seaga administration was forcedto do more adjustments in particular on the macro side. Up until then, theirfiscal adjustments had been very small. There had been little devaluation,little exchange rate movements. And post-83, that was a year in which there wasa runup in arrears, and that was how the balances were settled. But following1983, there was a major austerity program undertaken. There the politics is alsoquite interesting. That was undertaken after a change in--reelection of theSeaga administration, which was not contested. So, the political support fordoing a lot more was quite a bit stronger.
So what did we have? Well, you have already heard that there was aninitial period in which there was quite a sharp contraction and then the effectsof devaluation, etc., started to kick in 1986-87, and some revival in growth.
That leads to the recent period, which is striking. We have an economythat has done a lot of the hard work. After having years of real growthdeterioration, and especially in a circumstance where there is such extremeinequality of income, a lot of that real growth decline affected the poorerclasses.
The problem is that the 1988 hurricane was really, in a sense, a slap inthe face to all of these adjustment efforts because it slowed real growth,leading to per capita income declines. And one of the real issues, I think, inrecovering from that period, where we have seen an economy that has really done,as I have said already, a lot of the hard work both on the macro economic sideand on the micro economic side. There clearly are many other things that areleft to be done. But I think that the kind of political issues of how muchfurther belt tightening one can really undertake is really an open question.
The new government, Manley, is now back in power, in part because furtherhard work in the 1980s, I think, eroded support for Seaga beyond the level whichcould allow him to get reelected. But that leaves a couple of issues.
The first one is the Jamaican experience starkly points to how you can'tignore the kind of macro economic constraints. The second, a related issue, isit raises really difficult questions that I can't answer here. I don't know theanswers to them. Within the constraints that are raised by sensible, consistentmacro economic policy, how do you address the political constraints, especiallyin a country like Jamaica, which has done so much hard work? Unless there are

- 70 -
some benefits that come along quickly, it is, I think, very difficult to seehow easily the momentum for sustaining those difficult policies can be sustained.

THE MEXICAN ECONOMY IN THE EIGHTIES: AN OVERVIEW
Nora Lustig
With commentary by V. Fitzgerald


- 73 -
ACKNOWLEDGEMENT
The author wishes to thank Stasia Von Zwisler for her valuable assistance.

- 75 -
TABLE OF CONTENTS
Page No.
BACKGROUND ON MEXICO'S ECONOMIC PERFORMANCE: THE POSTWAR PERIOD . 77
THE OIL BOOM AND THE ONSET OF THE CRISIS: 1978-1982 . . . . . . . 79
STABILIZATION, ADJUSTMENT, AND STRUCTURAL CHANGE:1982 TO THE PRESENT . . . . . . . . . . . . . . . . . . . . . . . 84
Stabilization Results . . . . . . . . . . . . . . . . . . . . 85Real Wages, Unemployment, and Income Distribution . . . . . . 87Economic Reform and Structural Change . . . . . . . . . . . . 88
EPILOGUE .... . . . . . . . . . . . . . . . . . . . . . . . . . 90
REFERENCES . . . . . . . . . . . . . . . . . . . . . . . . . . . . 92
TABLES
1 Aggregate Performance of the Mexican Economy . . . . . . . . . . 942 Real Wages, Unemployment, Wage Share and Government
Expenditures on Social Development (GESD) . . . . . . . . . . 95
COMMENTARY BY E.V.K. FITZGERALD . . . . . . . . . . . . . . . . . . 96


- 77 -
The 1980s was a period of sharp contrasts for Mexico. Still enjoying thebenefits of the short-lived four-year oil boom,l/ Mexico grew at an average rateof 8 percent a year in 1980 and 1981. Since the economic crisis began in 1982,however, the economy has not grown at all, and it is unclear whether this canchange soon. The events of the past few years indicate that fundamental changesin both the domestic and world economies must occur for growth to resume andliving standards to improve.
Outsiders may wonder why the massive oil discoveries in the 1970s didnot translate into sustained growth but instead were the prelude to Mexico'sworst crisis since the Great Depression. They may also wonder why the economyhas not yet reestablished growth despite the adjustment efforts that Mexico hasmade since 1982. In a recent article, Dornbusch stated that "... the 1982 crisiswas 'made in Mexico.' By contrast, much of Mexico's difficulty adjusting after1982 was caused by an unfavorable external environment and the vulnerabilityimposed by a large debt."X2/ This is an accurate description of economic eventsin Mexico during 1982-88.
BACKGROUND ON MEXICO' S ECONOMIC PERFORMANCE: THE POSTWAR PERIOD
Between 1945 and 1970, Mexico underwent the process of becoming anindustrial country. Industry developed, and its agricultural and service sectorswere modernized. During this period, Mexico's per capita growth was 3 to 4percent. In the "golden years" of what has been called the stabilizingdevelopment period,2/ inflation hovered around 5 percent per year, a low figurecompared with other countries in the region.
Despite this high growth, and the structural transformation andmodernization of certain sectors, by the mid-1970s, the benefits of economicdevelopment still had not improved life for most Mexicans.V/ Unequal income anddistribution of wealth remained in the 1970s what it had been in the 1950s.5/Although government spending on education and health services helped improve theliving standards of the poor, particularly the urban poor, this spending could
1/ The oil boom lasted from 1978 to 1981.
2/ Dornbusch (1988), p. 246.
* The "stabilizing development" period lasted approximately from the mid-1950s to the late 1960s.
i/ See COPLAMAR (1982).
.2./ The Gini coefficient, for example, was close to 0.5 from the 1950s to the1970s.
- 78 -
not keep pace with the population growth. Many basic needs therefore remainedunfulfilled at the end of the 1970s.V/
Growth in the 1950s and 1960s took place under the protection of tradebarriers and with strong state participation, both directly and throughregulatory mechanisms. Industrialization to replace imports helped create aneconomic dynamism which seemed limitless. At some point in the process, however,the rents generated by the protectionist policies failed to increase productionand instead became a shelter against more efficient foreign competitors. As aresult, productivity began to decline at the end of the 1960s.
Protectionism need not be a mistake.]./ The Mexican government,however, made two vital policy errors. First, firms were not required to meetperformance criteria in exchange for the benefits of protected markets, andowners were allowed to think of the rents from these markets as a permanentbonus. Second, the agricultural sector, to compensate for the cost of industrialprotection, was heavily taxed.
The state responded to the economic decline by direct intervention andhigher spending, hoping to break through bottlenecks and improve livingstandards. The resulting policy mix, however, exacerbated the fragility ofpublic finances. The inward-oriented development process, combined with adisregard for efficiency, fueled a disequilibrium in the balance of trade. Theexpansionary policy and consequent exchange rate appreciation in the early 1970sfurther aggravated the situation.5./
At its peak in 1976, however, the balance of payments problem wentbeyond trade. Luis Echeverria's expansionary policies, together with his"leftist" rhetoric,2/ alienated an already antagonized private capital sector.Investors resorted to capital flight to protect their wealth against possiblecurrency devaluation, and also as a political weapon. They confronted Echeverriaover what they saw as excessive interventionist behavior. And they opposedfiscal reform that would have increased their property taxes.
Although internal policies clearly contributed to macroeconomicimbalances, all the blame does not rest with policy mismanagement. Externalshocks, especially those from the world recession after oil prices rose in 1973,
i/ For a summary of Mexico's income distribution and satisfaction of basicneeds, see, for example, Altimir (1982), Garcia-Rocha (1986), and Lustig(1988).
L/ In fact, the Japanese experience is an example of how protectionism canfoster sustained growth of output and productivity over time.
t./ For the relationship of internal versus external shocks to the currentaccount deficit within the 1973-76 period, see Zedillo (1986), pp. 964-70.
2/ Luis Echeverria was president of Mexico between 1971 and 1976.

- 79 -
also had a strong impact.1Q/ Faced with the negative effects of slower externalgrowth, the government tried to implement a risky policy mix: a rising fiscaldeficit along with increased foreign loans to finance it.
As a ratio of gross domestic product (GDP), the overall financialdeficit of the public sector rose from 2.5 percent in 1971 to 10 percent in1975.Ll/ The foreign public debt also rose during this period, from US$6.7billion to US$15.7 billion. The debt rose sharply again in 1976, primarily dueto capital flight. By the end of that year, the stock of public sector foreigndebt was almost US$21 billion.
The situation became unsustainable. In 1976, the government ran outof reserves and the peso was devalued after 22 years at a fixed, freelyconvertible exchange rate.12/ The economy was in crisis.
Mexico was experiencing a process that has been repeated throughoutLatin America since the Second World War. A wealthy private sector had emergedwith the help of the state. But the state did not impose efficiency criteriaon its own structure or on those enjoying its subsidies. This process erodedthe state's economic base and its legitimacy and strength. It also underminedthe state's ability to impose new (or even old) taxes on those who controlledprivate sector capital.
Mexico was rescued from this crisis by the discovery of oil, and after1976, economic policy changed dramatically. Rather than adjusting to scarcity,the new challenge was to "administer the abundance.'iX./ Analysts believed thatMexico would be able to grow quickly beginning in 1978 with no externalconstraints.14/
Unfortunately, though, the country's vulnerability to external shocksincreased during the oil boom. Rising interest rates abroad increased the burdenof debt servicing, and falling international oil prices led to the crisis of1982.
.iQ/ Zedillo estimates that external factors contributed two thirds to thebalance of payments disequilibrium in 1975. This was twice as high as theimpact of domestic policy action (see Zedillo, op. cit., Table 1, p. 965).
1j/ See Zedillo, op. cit., table 4, p. 968. The financial deficit is notcorrected for the effect of inflation on revenues and outlays.
2/ After some initial fluctuation, the devaluation was close to 100 percent.
13/ This phrase is typical of Lopez Portillo, president of Mexico between 1977and 1982.
14/ Proven reserves rose from 6 billion barrels in 1975 to 40 billion in 1978.By 1982, proven reserves were slightly over 70 billion. (See Garcia andSerra-Puche (1984), Table 13.
- 80 -
Successive Mexican governments have wanted to make Mexico lesseconomically dependent. Many leaders believed that this required an integrateddomestic economy, one that could create goods for all the stages of theproduction chain: consumer, intermediate, and capital. This required an inwarddevelopment strategy with little foreign capital, and strong direct and indirectstate participation.
Ironically, this has increased dependency and jeopardized long-termgrowth, and it has hurt the state's ability to help develop social programs andthe infrastructure.
This poorly managed state intervention has increased the foreign debt,the servicing of which undermines business confidence and inhibits growth andstability. In fact, the search for economic independence through ill-conceivedstate participation has made it more difficult for Mexico to exercise autonomyand self-determination, in both economic and foreign policy, than it was before.
THE OIL BOOM AND THE ONSET OF THE CRISIS: 1978-1982
Shortly after Lopez Portillo became President in December 1976, hedecided to exploit Mexico's vast oil reserves to foster growth. As a tradeablegood under the control of PEMEX, the state-run oil company, oil was expected toeliminate both external and fiscal constraints very quickly. In 1978,consequently, both the public and private sectors went on an investment spree.1 5/This spending increased as oil prices rose in 1979.
This "public expenditure-led growth"I 6 during the four years of theoil boom led to impressive results in aggregate output, investment, andemployment. For example, GDP grew at an average of 8 percent a year, and totalinvestment increased more than 15 percent a year. Real minimum wages rose onlyslightly, but employment expanded rapidly.
Behind this optimistic picture, however, some disquieting processeswere occurring. As the price of oil continued to rise, so did the size of thecumulative imbalances; these imbalances became more acute the first two to twoand a half years of the boom. Mexican policymakers believed that oil priceswould remain at high levels, and so in the second half of 1980 and the beginningof 1981, they further accelerated spending based on mistaken forecasts of somecrucial variables. For instance, the international price of oil was expectedto increase while external interest rates were expected to fall. In both cases,the opposite occurred.
15 The average price of crude oil was US$13 a barrel from early 1977 to early1979, US$22 a barrel by mid-1979, and more than US$30 a barrel by February1980.
§_/ See Zedillo, op. cit.
- 81 -
As public spending increased during this period, public revenues laggedbehind despite the oil money. From 1978 to 1980, the deficit remained at 7percent of GDP. This relatively high level could have been corrected, but wasnot, by changing part of the subsidies scheme.17/ By 1981, public sectorborrowing was 14.1 percent of GDP (see Table 1).
The deficit was partly financed by borrowing from foreign commercialbanks. From 1978 to 1980, the average net flow of aggregate public debt wasUS$3.3 billion, which was reasonable given Mexico's prospects as a major oilexporter. Foreign lenders also competed with each other to lend money toMexico's public and private sectors.
Between 1978 and 1980, Mexico's public foreign debt increased fromUS$26.4 billion to US$33.9 billion, and the private foreign debt went from US$5.2billion to US$17.5 billion. The ratio of total external debt to GDP, however,declined from 35.8 percent in 1977 to 31.3 percent in 1980.1i8/ Analysts agreethat the size of the foreign debt up to the end of 1980 was' not unmanageable.The problem was the upward tendency of the debt, which was fueled by expansionarygovernment policies.
These policies exacerbated the problems of a boom based on naturalresources. A well-known effect of a positive, large external shock is thatincreased absorptionl.9/ generates inflation pressures in the nontradeable sector,and a consequent appreciation in the exchange rate.0/ In addition to thedollars from oil exports, foreign borrowing allowed for further absorption. Thisincreased internal inflation and further worsened trade performance.
High rates of absorption and an overvalued exchange rate hurt non-oilexports, and stimulated import desubstitution, because production and investmentwere geared to satisfying the internal market. The trade balance went fromUS$-0.5 billion in 1978 to US$-2.1 billion in 1980, then to US$-5.3 billion in1981. Due to the interest that had to be paid on an increasing stock of debtthat year, the account deficit rose to US$12.5 billion.
1Z/ For example, by charging more for domestic gasoline.
1fi/ These figures on private and public foreign debt come from Zedillo op. cit.p. 972.
2/ That is, total aggregate demand whether satisfied by domestic or importedgoods.
ZQ/ According to various estimates, the exchange rate appreciation was 25percent by 1981.

- 82 -
As a result of the poor performance of the non-oil trade balance, theexternal account became more dependent on oil exports,Z1/ and therefore moresensitive to fluctuations in oil prices. An increasing foreign debt, on theother hand, meant that a larger sum had to be devoted to servicing the debt, aprocess exacerbated by rising interest rates.
Under these circumstances, capital flight accelerated sharply when theprice of oil began to drop in mid-1981,22/ and an appropriate shift in policydid not follow. For a few months, the government sustained the value of the pesoby continuing to borrow abroad. This aggravated the already precarious externalcondition, since capital flight had to be financed with short-term debt fromabroad. Eventually this process became unsustainable; by mid-February 1982, theBank of Mexico withdrew from the exchange market. The exchange rate went from28 pesos to the dollar to 45 pesos to the dollar almost overnight.
The policies that the government implemented have been called"disorderly";23/ they did not follow a consistent pattern for restoring financialstability and adjusting to the new adverse external conditions. With thestrained relationship between government and the private sector, businessmenwould no longer work with the government in the "alliance for production." Andwithin the government, advisors to Lopez Portillo could not agree about whatshould be done. In the meantime, capital flight continued, so that by August1982 the government had to freeze dollar-denominated accounts and declare amoratorium on its foreign debt. On September 1, 1982, three months before thenew government took office, Mexico nationalized its banking system, which furtherexacerbated the distrust and resentment of the private sector.
The debt crisis began in August 1982, when Mexico declared it could notmeet payments on its foreign debt. The days of a bullish lender's market ended,not only for Mexico but for other Third World debtors as well. Borrowing becamedifficult. Mexico's involuntary moratorium was initially considered a cash flowproblem, and creditor banks, under pressure from their governments, agreed tocontinue lending to the country and to reschedule payments. By 1988, however,even the most dedicated advocates of the initial debt strategy believed thatMexico was suffering from a serious debt overhang. They thought that unlessthe debt service were reduced (i.e., *the net resource transfer diminished),business confidence and growth could never be restored despite price stabilityand radical reforms in the regulatory framework.
21/ Oil exports reached 72 percent of total goods and services exports in 1981.
22/ The initial decline seems very small compared with subsequent events,especially the sharp fall in oil prices in 1986. The difference is thatin 1986, the economy was so cooled down that a complete turnaround was notrequired, as it was in 1981.
23/ See Zedillo, op. cit.

- 83 -
Most analysts concur that the Mexican crisis was caused by internalpolicies.24/ All agree that the expansionary policies of the public sector hada negative effect on inflation and the balance of payments. Although they thinkthe policies should have been less expansionary, they disagree about whichpolicies should have been followed. Some analysts would have preferred aggregatefiscal and relative price adjustments to curb inflation and keep the tradebalance in check; others would have preferred more selective policies.
The disagreement between these two schools of thought was evidentthroughout the Lopez Portillo sexenio. Initially, the debate concerned tradepolicy with some wanting to eliminate quantity restrictions and have freer trade,and others opposing it. The analysts also could not agree on expansionarypolicies, or on how to tackle the balance of trade disequilibrium. One groupurged fiscal moderation and exchange rate depreciation; the other insisted onquantitative controls. Their differences were rooted in a fundamentaldisagreement over the role the state should play vis-a-vis market forces ineconomic life.
These differences were so fundamental that, as the price of oil startedto slide in mid-1981, the situation required prompt action. If the governmenthad followed a more prudent fiscal and exchange rate policy in 1980 and early1981, the negative effects of the external shocks would have been milder. Butthe government's inaction after the decline in oil prices was in itself verydamaging. The economy became mired in the worst of situations: freeconvertibility of currency with an overvalued exchange rate and a growing fiscaldeficit due in part to inertia. During 1981, capital flight became rampant.25/
A final point is that, despite the consensus that the 1982 crisis was"made in Mexico," some counterfactual exercises show that any fiscal adjustmentwould have been costly to Mexico in terms of inflation, a negative effect ongrowth of output.26/
On the other hand, much of the spending euphoria during the oil boomwas directed toward investment rather than toward the conspicuous consumptionor military build-up that occurred in other countries during the same period,when foreign lending was inexpensive. But a large proportion of the investmentwent either to nontradeables, to sectors like oil which later underwent drasticprice changes, or to projects that had long maturation periods. Although some
Z/ See for example, Alberro and Cambiazo (1986), Barker and Brailovsky (1983),Bazdresch (1983), Cordoba (1986), Dornbusch (1988), Garcia and Serra(1984), Ize and Ortiz (1985), Ize (1988), Ros (1986), Taylor (1985), andZedillo oR. cit.
2/ Dornbusch (1988, oR. cit.) estimates that capital flight was between U$17.3and US$23.4 billion from 1980 to 1982 (see Table 6).
/ See Cordoba, op cit., Tables 1 and 2, for the results of a simulationmodel used by the Ministry of Budget and Programming.
- 84 -
sectors, such as automobiles and auto parts, increased their capacity to generatenet exports, the macroeconomic capacity to simultaneously generate a tradesurplus to service debt and expand domestic output was not created.2Z/
STABILIZATION. ADJUSTMENT. AND STRUCTURAL CHANGE: 1982 TO THE PRESENT
When the De la Madrid administration took office in December 1982, itannounced a stabilization program to cope with the short-run crisis, and amedium-run strategy for structural change. De la Madrid associated the crisiswith the macroeconomic imbalances that had been fueled by the deficit andaggravated by adverse external shocks. Some of his policymakers also thoughtit derived from the past protectionism and state intervention in the economy.
The high inflation, exchange rate instability, and severe imbalance ofpayments that characterized the crisis were to be counteracted in the short runby an orthodox program to restore price and exchange rate stability and balanceof payments equilibrium. De la Madrid's economic team believed that price andfinancial stability would be restored through a drastic permanent cut in thegovernment deficit, and that an undervalued exchange rate would curtailspeculation.8/ They thought that both policy measures would help generate theneeded surplus in the trade account. For these measures to be effective,however, real wages had to be reduced or a true devaluation would not bepossible.
In contrast to what happened during the Lopez Portillo administration,De la Madrid's policymakers agreed on goals, and on the means of achieving short-run stabilization and medium-run structural changes. In the short run, priceand exchange rate stability needed to be reestablished. The medium-run goalswere to increase the competitiveness of the Mexican economy, define new termsby which to finance development (relying more on internal than on externalsavings), and deregulate and decentralize economic life.
The medium-run development strategy addressed structural problemsassociated with Mexico's inefficient production structure and overextendedcondition. The strategy was to redefine Mexico's position in the internationaldivision of labor. The country was to develop an outward-oriented economy witha more limited state role. These goals were to be achieved through tradeliberalization, general deregulation, and by restructuring public enterprises,some of which would be privatized.
ZZ/ It is possible that, given the characteristics of the investments madeduring the oil boom, the incremental capital output ratio rose, therebyrequiring more savings per additional unit of output than before.
_/ In addition, an expensive dollar could allow for negative domestic interestrates and, therefore, ameliorate the impact of servicing the internal debtwithout fearing capital flight. This actually did happen, especially in1983.

- 85 -
De la Madrid clearly stated his willingness to negotiate the paymentson Mexico's US$60 billion public foreign debt. He ruled out unilateral defaultor the formulation of a "debtor's club" with other Latin American countries.Debt servicing was going to require a shift from a trade deficit to a surplusto meet interest payments. It implied a structural change in how investmentswere financed. Domestic savings were going to have to replace foreign savings,and would effectively become the ceiling to the amount of possible investment.
Despite reforms that complied with strict macroeconomic rules, anddespite success in recovering the political confidence of the capitalist sector,the economy has not returned to a path that can combine even moderate growth withprice stability. Servicing the foreign debt under adverse external conditions,especially trade conditions, is a fundamental obstacle. Maintaining financialstability under such external conditions also has been difficult. Capital flighthas begun again, at the least hint of trouble.29/ Consequently, the governmenthas reverted to using contractionary policies to offset financial instability.This has produced the trade surpluses to meet external obligations but has hurtbusiness confidence and hindered economic growth.
Stabilization Results
The first stabilization program, implemented in late 1982, was followedby several others.IO/ The first one, and another in mid-1985, included orthodoxprograms to reduce the government deficit and to devalue the currency.ljJ Inother programs, between early 1984 and early 1985, and again in 1987, thegovernment tried to fight inflation with more gradual policies, such as settingkey prices (public prices, the exchange rate, and the minimum wage). In November1987, speculation against the peso was stopped by a stepwise devaluation; thisbrought back high inflation. Then a heterodox program was adopted on March 1,1988.
~.9/ Capital flight between 1976 and 1987 was US$60 billion, US$35 billion ofwhich corresponded to outflows between 1983 and 1987 (see Dornbusch 1989).
.QJ Several authors have written on the characteristics and implementation ofthe stabilization programs of 1983-86. See, for example, Alberro andCambiazo, op. cit.; Dornbusch, op. cit.; Cordoba, op. cit.; Lustig and Ros,oR. cit.; Zedillo, op. cit.
j1/ The first program, in 1982, reduced the public sector borrowing requirementas a percentage of GDP by half. The second one did not. In fact, the ratiowas substantially higher in 1986 than in 1985 due to the impact thatdeclining oil prices had on government revenues. When the government'soperational deficit is corrected for inflation, the resulting ratio ofrevenues to GDP is even lower in 1986 than it was in 1983 (see Banco deMexico, Informe Anual, 1988).
- 86 -
The implementation of these combined stabilization and adjustmentpolicies contained inflation spurts and kept the balance of payments crisis incheck. At the same time, however, the policies caused the economy to stagnate.Investment contracted, and wages fell (see Table 2).
The worst years of the crisis were 1983, when output contracted by 4.2percent and wages by 26.5 percent; and 1986, when output decreased by 3.7 percentand wages by 9.9 percent12/ (see Tables 1 and 2). In both these years, sharpdeflationary policies followed one or more years of domestic imbalances,financial instability, and adverse external conditions. In 1986, the economyalso had to adjust to a decline in the international price of oil.
The most recent stabilization program, which began in March 1987,combined fiscal restraint and trade liberalization with a concerted incomespolicy.1.3 The program brought inflation down from 159.2 percent a year inDecember 1987 to 20 percent a year since the last quarter of 1988. Output,however, has grown only 1.1 percent in 1988, and wages have continued todecline.34/
This stabilization program, called the Economic Solidarity Pact, wasmore successful than the 1983 program in reducing inflation and in raising outputand wages. The Pact was launched when foreign reserves were US$13 billion andincreasing. These reserves were the basis for maintaining a fixed nominalexchange rate as import tariffs were reduced, and while demand and output wereexpanding.
A year later, in March 1989, foreign reserves were US$6 billion. Thatis, the cost of the stabilization program has been US$10 billion. If thedownward trend in inflation can be sustained, this loss of reserves will havebeen a good investment; but if price instability reappears, analysts may concludethat the reserves should have been used differently. The verdict will dependupon the current debt negotiations. If they succeed, growth with price stabilitywill probably resume; if they do not, the effort and sacrifice of the EconomicSolidarity Pact may go unrewarded.
2./ The wage figures correspond to the National Accounts definition of averagewages.
23/ The "concerted" incomes policy refers to the agreement among government,labor, and private sector capitalists on, respectively, exchange rates andpublic prices, minimum wages, and prices in general.
14/ The decline in the minimum wage has been close to 13 percent. A similarreduction has been estimated for construction workers in the public sector.In the manufacturing sector, the indicator of wages, salaries and fringebenefits contracted 0.1 percent during the first nine months of 1988compared to the same period in 1987.

- 87 -
Another result of the current stabilization program has been a highdomestic interest rate,15/ caused by tight monetary policy and an uncertainexchange rate. Again, the debt negotiations will determine the exchange rateand the flexibility of public finances in relation to net resource transfer.One would expect the negotiations to help reduce the domestic interest rates.
The short-run programs have kept the destabilizing processes in check.Nevertheless, financial stability is still fragile, and the impact on the realeconomy so far has been negative in the aggregate. Total output has remainedstagnant, public and private investment have contracted throughout most of theperiod,26/ social expenditures and real wages have fallen, and equitable incomedistribution has worsened.
Although essential to financial confidence, the cooled-down economy hashad a negative effect on private investment (see Table 1). Traditionalinvestment opportunities have not been replaced by a booming export sector. Thisis due to uncertainty about the exchange rate and the availability of foreignfinancing, and to the fact that such a shift requires new skills, expertise, andnetworks, all of which take time to consolidate. The decline in investment whichoccurred during this period will probably result in additional medium-run costsin growth.
Real Wages. Unem lovment. and Income Distribution
The economic crisis has caused a contraction of minimum and averagewages of close to 50 percent for 1983-88 (see Table 2).J7/ For workers in themodern sector, this decline was offset by a rise in fringe benefits, as therelevant indicators show.
Open unemployment has not increased as much as some analysts expected(see Table 2). One reason was that the decline in wages enabled firms to keepwage costs in check while demand declined and enabled the government to reduceexpenditures without resorting to massive layoffs. Another reason was thatunemployed wagb earners who had no unemployment benefits began to work in theinformal sector at whatever jobs and wages were available. Underemployment hasincreased, but income from informal employment has helped compensate for the wageloss within household units.
Net food producers and subsistence peasants have been better able toinsulate themselves from the impact of the crisis than have landless peasants
.3. The compounded real domestic interest rate reached 40 percent a year ()by the second quarter of 1989.
1_/ In 1988, however, private investment was positive, perhaps indicating a newtrend.
i7/ For a more detailed discussion of the impact of the crisis on livingstandards, see, for example, Lustig, op. cit., and Samaniego (1986).

- 88 -
and urban wage earners. Agriculture has performed better than the overalleconomy.18/ Terms of trade for agriculture may have improved due to alignmentof internal with international prices and the effect of devaluation on the priceof the tradeable commodities.
Government expenditures on social development!9/ have been sharplyreduced under the stabilization program. Physical resources for providingservices have not been reduced, however.AJO The reduction in spending reflectsthe contraction of wages and of public investment in the social developmentsector. Both may have a long-term impact on social services that is difficultto estimate.
The economic crisis and subsequent adjustment caused income to shiftfrom within the country to the external sector, from wage-earners to nonearners(see Table 2), and from nonsavers to savers. The effect on income distributioncannot be assessed at this point because a large proportion of the poor in Mexicoare not wage-earners, and nonwage income cannot be analyzed by income category.
Economic Reform and Structural Change
The new strategy under the Economic Solidarity Pact requiredfundamental changes in the state apparatus and in the state's relationship withthe private capitalist sector. The consensus within the De la Madrid4il/government was that public-expenditure-led growth could not continue, that thestate had tolerated inefficiency within its own structure and had protectedinefficiency among some private investors, and that regulatory mechanisms hadbecome an obstacle to efficiency rather than an instrument of positive stateintervention.i2
18/ From 1982 to 1988, overall growth was 0.02 percent while that ofagriculture was 3.6 percent (see Table 1).
29/ That is, education, health services, and social security.
it/ Hospital beds and doctors per patient, the ratio of students to teachers,etc.
41/ The consensus has remained unchanged under the new administration of CarlosSalinas de Gortari.
Aj/ Although traditionally the antistatist position has been identified with.the ultraliberal "right wing" position a la Hayek or Nozic, at presentthere has been a new current emeiging from the social democratic "left,"which also proposes the reduction of state participation and regulationas part of a necessary development strategy. Among Mexican decisionmakersboth "ideological" positions coexist and effectively agree on policydecisions given the current consensus of both camps with respect to therole of the state.

- 89 -
On the other hand, the government had to regain the private sectorafter it nationalized the banking system. In economic terms, this would comewith the right mix of policies. Politically, the new government needed toconvince the private sector that it would not redistribute assets throughexpropriation.
Between 1982 and 1988, the most visible change in the public sector'srole was the reduction of the government's primary deficit42/ as a proportionof GDP. The latter was 7.3 percent in 1982. After 1983, the primary accountsshowed a surplus that peaked in 1988 at 7.4 percent, an adjustment of 14percent.L4/
The structural allocation of programmable expenditures,44/ however, hasremained the same. The most prominent change within each sector is the declinein public investment in relation to current expenditures.
The government has succeeded in reducing programmable expenditures inthe aggregate, but has not achieved a structural reallocation of thoseexpenditures. If foreign debt negotiations result in reduced interest payments,a smooth reallocation from current to investment outlays and to priority sectorsmay be possible.44/ This is an example of how short-run constraints affectstructural changes if reallocation costs are considered.
Between 1982 and 1988, the government also improved tax collection andbroadened its tax base. It also began to privatize and restructure publicenterprises.
A fundamental component of the new development strategy was its outwardorientation. This came about with the government's effort to maintain an
4L./ The primary deficit does not include interest payments on internal andexternal debt.
L4/ The high ratio of financial deficit to GDP (see Table 1) is the result ofadding interest payments, including their inflationary component, to theprimary deficit. In fact, the overall operational deficit, corrected forinflation, was 0.88 percent in 1988 (Banco de Mexico, Informe Anual, 1989,p. 268). The financial deficit for the same year was 12.8 percent.
45/ That is, those which do not include interest payments.
A6/ An arrangement with the external commercial banks would not only reduceinterest payments on the external debt, but would help bring down domesticreal interest rates once the uncertainty created by the debt is eliminated.

- 90 -
attractive exchange rate and liberalize trade,Ay/ and with its decision in 1986to join GATT. At the same time, the government simplified bureaucraticprocedures pertaining to imports and exports. Export promotion policies,including the requirement of net export performance in exchange for domesticprotection (as with automobiles and auto parts), were also implemented.
Between 1983 and 1988, manufacturing and other non-oil exports grew by20 percent a year, and manufactured exports alone grew even faster. Althoughone is tempted to associate this growth with the policies mentioned above, itresulted more from the contraction of internal demand. Though the reforms maybe essential to an outward-oriented strategy, the proof of this will come overthe longer term. As in the case of the exchange rates, short-run needs imposedby stabilization may again run counter to the overall strategy.L8/
An export-led strategy requires that a widespread positive feedbacktake place between exports and investment. This has not happened in Mexico.The virtuous spiral of exports, investment, productivity, and growth has not beenestablished. The need to stabilize the economy under current externalconstraints may be the major obstacle to achieving this goal, because the balanceof payments cannot sustain the initial required expansion of investment andgrowth.
EPILOGUE
The experience of Mexico between 1982 and 1988 clearly showed that itcould not simultaneously establish price stability, restore growth, and meetforeign obligations. Whenever the economy began to expand even moderately,compared with historical averages, the country faced a balance of payments crisisand a resumption of inflation and other destabilizing processes.L9/ Thissituation could not be sustained. Growth had to be resumed and, to achieve thisgoal, net resource transfers abroad reduced.
The combination of a reluctant external financial market, high worldinterest rates, and domestic capital flight have produced a change in the net
y/ Quantitative restrictions on imports were reduced in mid-1985. In 1988,tariffs were reduced, and so was tariff dispersion. The maximum tariffwas set at 20 percent.
AJ8 Export promotion requires an undervalued and stable exchange rate, whereasstabilization requires that the exchange rate appreciate. Appreciationis the unavoidable outcome of fixing the exchange rate in nominal termswhile there is still inflation. A stabilization program cannot work ifthe exchange rate is not temporarily fixed in nominal terms.
A2J The external environment did not help, since the terms of tradedeteriorated sharply during the entire period (see Table 1).

- 91 -
resource transfer abroad. It went from being a large inflow to a net outflowaveraging 6 percent a year between 1983 and 1988 (see Table 1).
Net resource outflows could be reduced through two paths: reducingdebt service to commercial banks under the Brady Plan and increasing capitalinflow in the form of direct investment and repatriation. In addition,multilateral official support, especially from the World Bank, would provide asizable amount of "new money" for 1989-91.
The results of the debt agreement imply a net cash-flow relief of aboutUS$1 billion a year (or 10 percent on total interest payments) for the first fiveperiods counted since the agreement in principle was reached in July 1989.Multilateral net lending will be about US$1 billion for 1989-91. An averagegrowth rate of 4 percent for 1989-94 will require an additional net inflow ofabout US$4 billion a year, assuming that exports continue to be strong and thatimports level off.
It is difficult to predict the trend in foreign direct investment andcapital repatriation. The Mexican government has been taking a series ofdecisions to increase the attractiveness of Mexico. Prominent among them arereforms in trade policy and foreign investment regulations. Two recentlyproposed steps are directed particularly to this end: the reprivatization ofbanking and a free trade agreement with the United States..20/ The hope is thatprivate investors, Mexican and foreign, will react positively to the presentconditions. The economy's performance during 1989 gives some credibility to thishope. If private investors fail to sustain and expand this response, however,Mexico's adjustment efforts and accomplishments will continue unrewarded.
E.Q/ In April and June 1990, respectively.
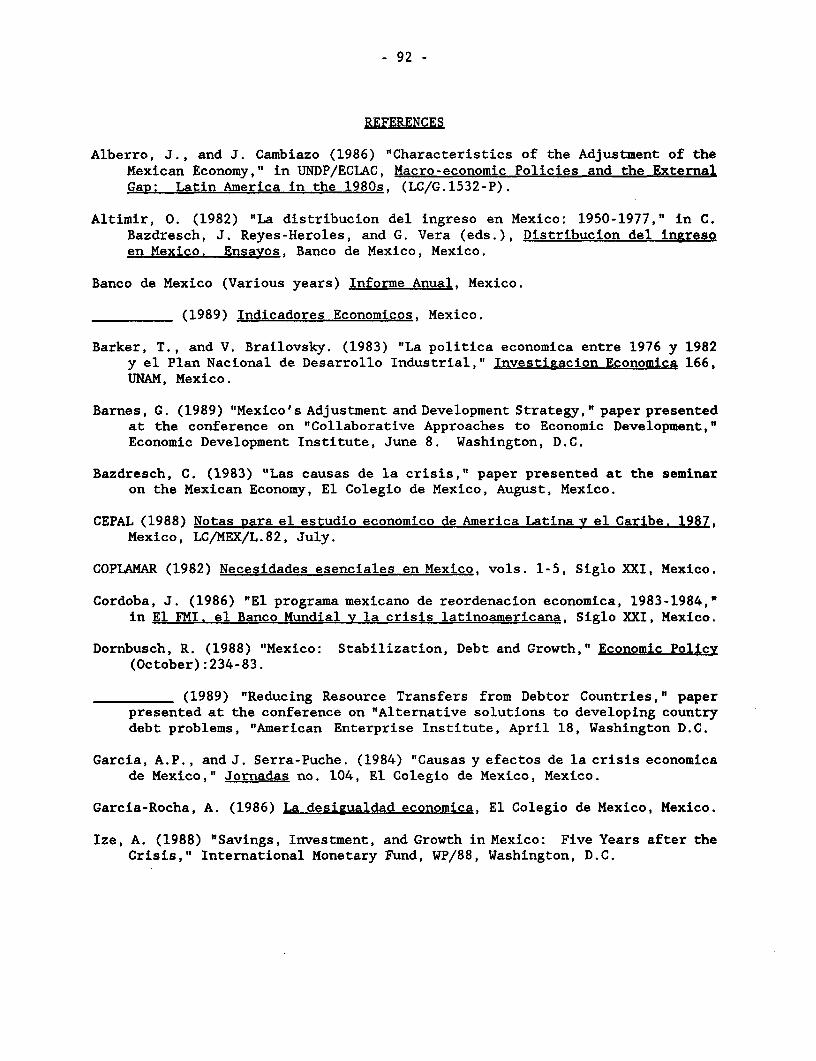
- 92 -
REFERENCES
Alberro, J., and J. Cambiazo (1986) "Characteristics of the Adjustment of theMexican Economy," in UNDP/ECLAC, Macro-economic Policies and the ExternalGap: Latin America in the 1980s, (LC/G.1532-P).
Altimir, 0. (1982) "La distribucion del ingreso en Mexico: 1950-1977," in C.Bazdresch, J. Reyes-Heroles, and G. Vera (eds.), Distribucion del ingresoen Mexico. Ensayos, Banco de Mexico, Mexico.
Banco de Mexico (Various years) Informe Anual, Mexico.
(1989) Indicadores Economicos, Mexico.
Barker, T., and V. Brailovsky. (1983) "La politica economica entre 1976 y 1982y el Plan Nacional de Desarrollo Industrial," Investigacion Economica 166,UNAM, Mexico.
Barnes, G. (1989) "Mexico's Adjustment and Development Strategy, " paper presentedat the conference on "Collaborative Approaches to Economic Development,"Economic Development Institute, June 8. Washington, D.C.
Bazdresch, C. (1983) "Las causas de la crisis," paper presented at the seminaron the Mexican Economy, El Colegio de Mexico, August, Mexico.
CEPAL (1988) Notas Rara el estudio economico de America Latina y el Caribe. 1987,Mexico, LC/MEX/L.82, July.
COPLAMAR (1982) Necesidades esenciales en Mexico, vols. 1-5, Siglo XXI, Mexico.
Cordoba, J. (1986) "El programa mexicano de reordenacion economica, 1983-1984,"in El FMI. el Banco Mundial y la crisis latinoamericana, Siglo XXI, Mexico.
Dornbusch, R. (1988) "Mexico: Stabilization, Debt and Growth," Economic Policy(October):234-83.
(1989) "Reducing Resource Transfers from Debtor Countries, I paperpresented at the conference on "Alternative solutions to developing countrydebt problems, "American Enterprise Institute, April 18, Washington D.C.
Garcia, A.P., and J. Serra-Puche. (1984) "Causas y efectos de la crisis economicade Mexico," Jornadas no. 104, El Colegio de Mexico, Mexico.
Garcia-Rocha, A. (1986) La desigualdad economica, El Colegio de Mexico, Mexico.
Ize, A. (1988) "Savings, Investment, and Growth in Mexico: Five Years after theCrisis," International Monetary Fund, WP/88, Washington, D.C.
- 93 -
Ize, A., and G. Ortiz (1985) "Default through Overshooting. The Case of Mexico,"paper presented at the seminar on the Mexican Economy, El Colegio de Mexico,August, Mexico.
Lustig, N. (1989) "The Impact of the Crisis on Living Standards in Mexico: 1982-1985," Brookings Institution, Washington D.C.
Lustig, N., and J. Ros (1987) Stabilization and Adjustment Policies andProgrammes. Country Study 7. Mexico, World Institute for DevelopmentEconomics Research Institute (WIDER), Helsinki.
Ros, J. (1986) "Mexico from the Oil Boom to the Debt Crisis. An Analysis ofPolicy Responses to External Shocks 1978-1985," in R. Thorp and L. Whitehead(eds.), The Latin American Debt Crisis, London: MacMillan.
Samaniego, N. (1986) "Los efectos de la crisis de 1982-1986 en las condicionesde vida de la poblacion en Mexico," CEPAL, LC/R. 539.
Taylor, L. (1985) "The Crisis and Thereafter: Macroeconomic Policy Problems inMexico," in P. Musgrave (ed.), Mexico and the United States: Studies inEconomic Interaction. Boulder, Colorado: Westview Press.
Zedillo, E. (1986) "Mexico's Recent Balance of Payments Experience and Prospectsfor Growth," World DeveloRment 14(8).
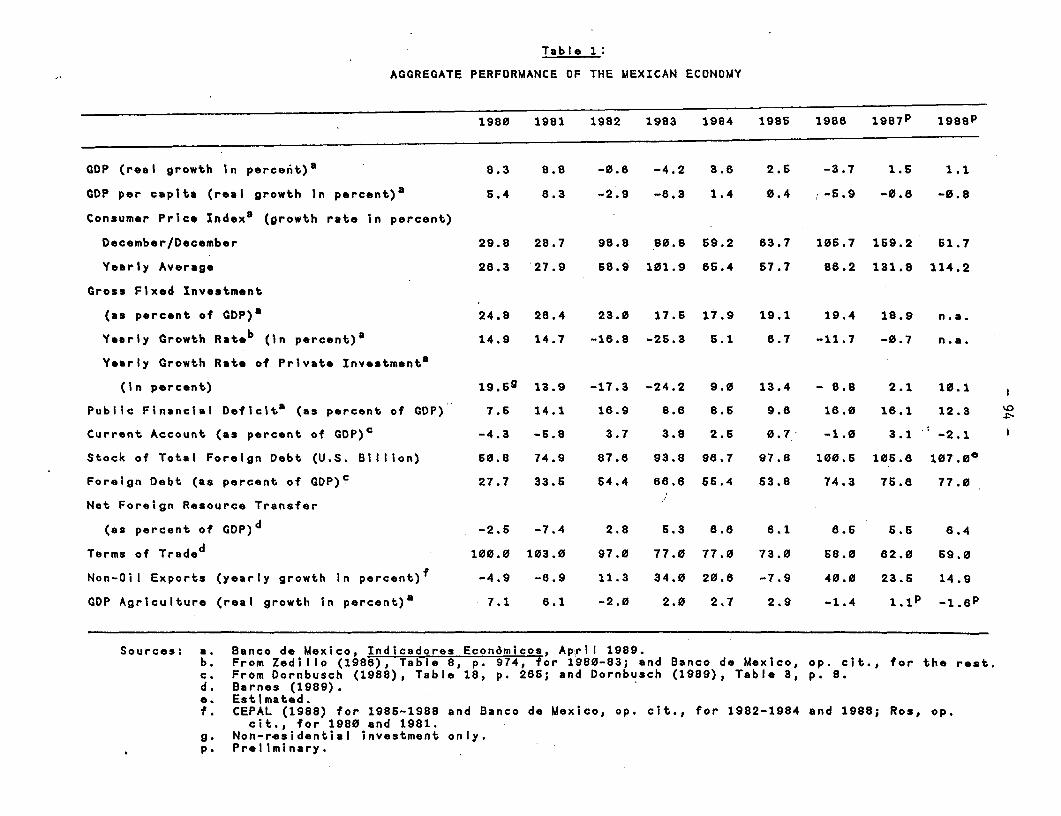
Table 1:
AGGREGATE PERFORMANCE OF THE MEXICAN ECONOMY
1980 1981 1982 1983 1984 198S 1986 1 98 7P 1g9sP
GDP (real growth In percent) 8.3 8.8 -0.6 -4.2 3.6 2.5 -3.7 1.5 1.1
CDP per capita (roal growth in percent)a 5.4 8.3 -2.9 -8.3 1.4 0.4 -5.9 -0.8 -0.8
Consumer Price Indexa (growth rate in percent)
December/December 29.8 28.7 98.8 80.8 69.2 63.7 106.7 169.2 61.7
Yearly Average 28.3 27.9 58.9 101.9 65.4 57.7 88.2 131.8 114.2
Gross Fixed Investment
(as percent of GDP)a 24.8 28.4 23.0 17.6 17.9 19.1 19.4 18.9 n.a.
Yearly Growth Rateb (in percent) 5 14.9 14.7 -18.8 -26.3 5.1 6.7 -11.7 -0.7 n.a.
Yearly Growth Rate of Private Investments
(in percent) 19.69 13.9 -17.3 -24.2 9.0 13.4 - 8.8 2.1 10.1
Public Financial Deficita (as percent of GDP) 7.5 14.1 18.9 8.6 8.5 9.8 16.0 18.1 12.3 >
Current Account (as percent of GDP)c -4.3 -5.8 3.7 3.8 2.6 0.7 -1.0 3.1 -2.1
Stock of Total Foreign Debt (U.S. Billion) 50.8 74.9 87.8 93.8 96.7 97.8 100.6 106.8 107.0e
Foreign Debt (as percent of GDP)5 27.7 33.6 54.4 66.B 66.4 63.8 74.3 75.8 77.0
Net Foreign Resource Transfer
(as percent of GDP)d -2.6 -7.4 2.8 5.3 8.8 8.1 8.6 6.6 8.4
Terms of Traded 100.0 103.0 97.0 77.0 77.0 73.0 68.0 62.0 69.0
Non-Oil Exports (yearly growth in percent)f -4.9 -6.9 11.3 34.0 20.6 -7.9 40.0 23.6 14.9
GDP Agriculture (real growth in percent)a 7.1 6.1 -2.0 2.0 2.7 2.9 -1.4 1 .1P -1.6P
Sources: a. Banco de Mexico, Indicadores Econ6micos, Ap~ril 1989.b. From Zedillo (1988), Table 8, p. 974, for 1980-83; and Banco de Mexico, op. cit., for the rest.c. From Dornbusch (1988), Table 18, p. 286; and Dornbusch (1989), Table 3, p. 8.d. Barnes (1989).e. Estimated.f. CEPAL (1988) for 1985-1988 and Banco de Mexico, op. cit., for 1982-1984 and 1988; Ros, op.
cit., for 1980 and 1981.g. Non-residential investment only.p. Preliminary.

Table2
REAL WAGES, UNEMPLOYMENT, WAGE SHARE AND GOVERNMENT EXPENDITURES ON SOCIAL DEVELOPMENT (GESD)
(in percentages)
1980 1981 1982 1983 1984 1985 1986 1987P 1988P
Real Minimum Wages (yearly growth rates)a - 7.4 1.3 3.3 -25.2 - 8.3 - 1.2 -10.8 - 4.7 -12.7
Real Average Wages (yearly growth rates)b - 0.8 4.2 - 2.4 -26.6 - 4.9 1.0 - 9.9 6.6P n.a.
Open Unemployment Ratem 4.6 4.2 4.2 8.8 6.7 4.4 4.3 3 .gP 3.5 P
Wage ShareC 38.9 42.7 38.2 31.7 30.8 31.2 30.8 n.a. n.a. Un
Real GESD per capita (yearly growth rates)d 16.2 - 0.7 -27.8 - 0.3 0.7 - 6.2 - 6.4 n.a.
Sources: a. CEPAL (1988); Banco de Mexico, Informe Anual for 1988.
b. Banco de Mexico, Economic Indicators.
c. Calculated from National Accounts Ratio over the sum of wage plus non-wage income.
d. De Ia Madrid, Informe, various years.
p. Preliminary.
n.a. Not available

- 96 -
COMMENTARY BY DR. E.V.K. FITZGERALD
In this useful survey of the vicissitudes of Mexican macroeconomicmanagement during the 1980s, Dr. Nora Lustig makes a number of important points.She shows that the consequences of the 1978-82 oil boom go well beyond the debtoverhang itself. They include the sidetracking of a macroeconomic adjustmentprocess already under way by the mid-seventies, the halting of exportdiversification by an overvalued exchange rate, and the business dislocationcaused by bank nationalization and debt moratorium. She argues thatstabilization policies since 1982 have involved not only government expenditurecuts but also reserve management and labor negotiation. However, despite theconversion of the excessive 1982 primary budget deficit into a surplus by 1988,which sharply reduced inflation, this effort did not lead to adjustment becauseincreased profitability restored neither private investment nor export growth.Finally, she suggests that the expected social consequences of the halving ofreal wages and the growth of underemployment may have been mitigated by laborretention in large firms and relatively high output growth in agriculture.Nonetheless, some aspects of this perceptive analysis do require furtherdiscussion--particularly the treatment of the fiscal crisis, private sectorresponse to macropolicy and the linkage between the Mexican and U.S. economies.
Tax pressure in Mexico remains extremely low by internationalstandards: non-oil tax revenues are only 10 percent of GDP and with income fromPemex total revenues reach only 18 percent, compared to an average of nearly 25percent in middle-income LDCs. The causes are to be found in the tax base, whichessentially excludes large parts of the economy--such as most public enterprise,agriculture, the informal sector, flight capital, interest income and exportindustry--and still largely relies on a narrow range of "excisable" products.Despite the very low level of welfare provision and defense expenditure (andleaving aside the issue of state enterprise efficiency) the Mexican fiscal systemis still based on unrequited transfers from the financial system.
Even in the "golden age" of desarrollo estabilizador bank reserverequirements were a major source of public finance. However, before the oilboom this transfer institutionally negotiated and could have been complementedby oil revenues had they been stable and public investment been kept undercontrol in the 1980s. Instead, the public sector borrowing requirement not onlyincreased but fluctuated wildly during the 1980s, leading to major financialimbalances in the private sector. If we compare 1980 and 1982 with 1988 (usingthe data in Table 1 of the paper), we find that the budgetary turnaround is stillreflected as a public sector financial deficit of 12 percent of GDP in 1988compared to 17 percent in 1982 and 8 percent in 1980. Meanwhile, the externalaccount (which the Bank terms the "resource balance") had moved in the oppositedirection, from -4 percent of GDP in 1980 to +4 percent in 1982 and -2 percentin 1988. National accounting rules mean that the combination of these externaland fiscal shocks was accompanied by a drastic shifts in the private sectorinvestment-savings surplus from 4 percent of GDP in 1980 to 21 percent in 1982and back to 10 percent in 1988.

- 97 -
(e.g. those of the Bank of Mexico) before the oil boom was that domestic savingswere limited, so that fiscal deficits crowded out private investment;subsequently a monetarist view has prevailed to the effect that fiscal deficitsare reflected in the balance of payments while the private sector maintains astable financial balance. However, the evidence suggests that in fact theMexican private sector adjusts actively: between 1980 and 1988 the savings rateeven rose slightly from 21 percent to 22 percent of GDP, while the privateinvestment rate fell from 17 percent to 12 percent. The paper suggests (Table2) that these savings are probably due to increased profits derived from thefalling wage share in national income. A significant use of these funds, despite(or perhaps because of) attempts by the Mexican authorities to absorb them, isthe acquisition of assets abroad. These holdings are minimally estimated atUS$50 millions in bank deposits alone (as large as total assets in the domesticmonetary system), and are probably twice this size--a figure comparable to thepublic foreign debt. What is more, the interest and profit income from theseassets may well exceed US$10 billion a year, equivalent to almost half ofrecorded export income.
Finally, a crucial factor omitted from the paper is the linkage ofthe Mexican economy to the U.S. market, which takes over three-quarters ofMexican exports and provides a similar proportion of imports. Moreover, muchof the non-oil trade appears to take the form of intra-firm transactions. Asis well known, Mexican GDP growth is closely correlated with that in the U.S.A.through demand transmission; but relative prices in the traded sector of theMexican economy are also largely determined within the U.S.A., or by U.S. tradingprices with the rest of the world. The drastic decline in the external termsof trade (Table 1) and the sharp increase in interest rates on the debt whichhave exacerbated the Mexican crisis can be interpreted as a consequence of theadjustment of the U.S. economy itself. Moreover, the flow of funds between thetwo countries are largely autonomous of official financial controls, not leastbecause large parts of the Mexican enterprise sector is now effectively"dollarized".
In sum, these three structural characteristics of the Mexican economylimit the scope for an independent monetary policy- -whether orthodox orheterodox. As Dr. Lustig points out in her conclusions,
"it is impossible for Mexico to simultaneously establish pricestability, restore growth, and meet foreign obligations under presentcircumstances. Whenever the economy began to expand ... (it) faceda balance of payments crisis and/or the resumption of inflation..."
She argues that the present government will continue to maintaindebt service and very high real interest rates in order to improve relationswith U.S. banks and stabilize money markets, but that the combination of outwardresource transfer and dear money will prevent the recovery of private investmentand growth. Wage controls designed to maintain the real exchange rate will leadto labor unrest and undermine political support for adjustment. Her paperconcludes that a necessary condition for recovery is a negotiated reduction ofthe net resource transfer from 4 percent to 2 percent of GDP--although whetherthis is sufficient depends upon private sector response.

- 98 -
This conclusion is realistically premised on poor prospects forfurther external borrowing, and is undoubtedly correct in itself. However,economic recovery will probably require at least two further changes. On theone hand, the resolution of the systemic fiscal deficit is not just a financialissue: it is central to the construction of a modern state in Mexico which couldunderwrite the social consensus necessary to restore investor confidence. Onlythe corresponding acceptance of a "normal" tax burden can create a sound basisfor the domestic finance of essential infrastructure and minimal welfare serviceswithout destabilizing monetary consequences. On the other hand, the probableestablishment of the North American Free Trade Area during this decade openspossibilities not only for increased trade, but also the reversal of the resourcetransfer through Federal funding of public works and the return of flight capitalunder joint legal protection. It might also permit the establishment ofappropriate double-taxation agreements to support fiscal reform. Above all,further research on the Mexican private sector is necessary in order to designan effective macroeconomic adjustment policy.

ECONOMIC PERFORMANCE IN BANGLADESHDURING THE 1970s AND 1980s
AND PROSPECTS FOR THE FUTURE
Azizur Rahman Khan
With comoentary by Richard Eckaus

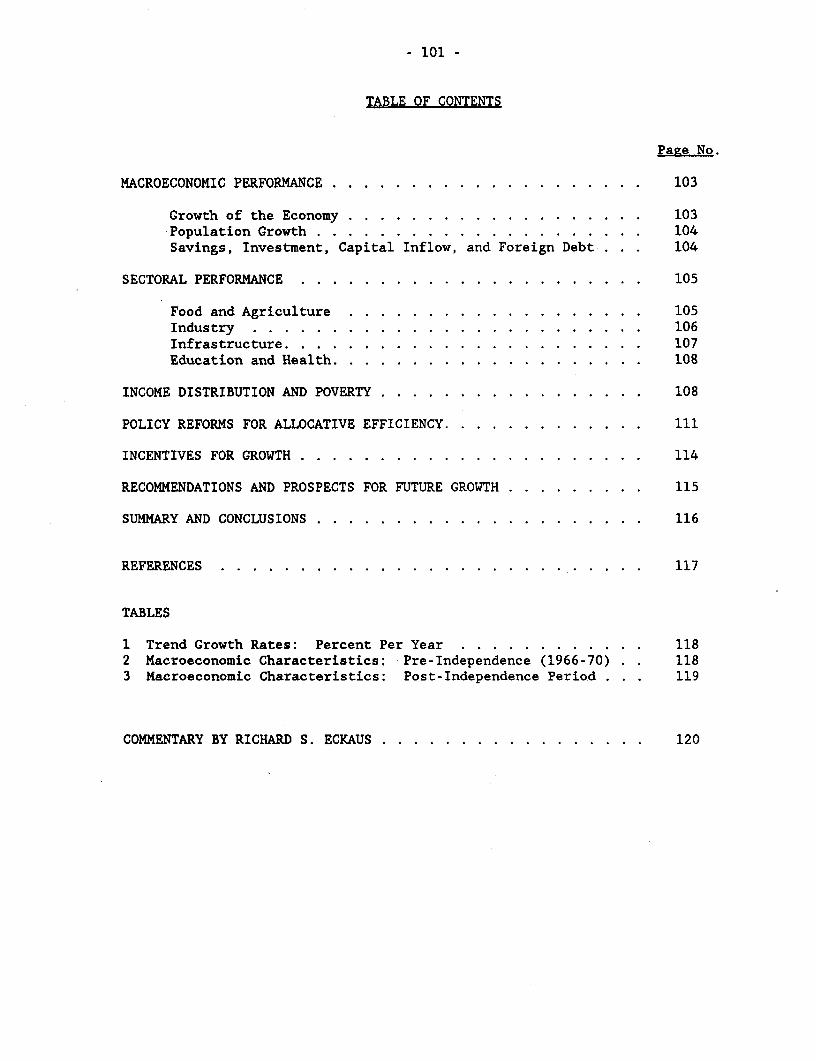
- 101 -
TABLE OF CONTENTS
Page No.
MACROECONOMIC PERFORMANCE ... . . . . . . . . . . . . . . . . . 103
Growth of the Economy ... . . . . . . . . . . . . . . . . 103Population Growth .... . . . . . . . . . . . . . . . . . 104Savings, Investment, Capital Inflow, and Foreign Debt . . . 104
SECTORAL PERFORMANCE .... . . . . . . . . . . . . . . . . . . 105
Food and Agriculture ... . . . . . . . . . . . . . . . . 105Industry .... . . . . . . . . . . . . . . . . . . . . . 106Infrastructure . . . . . . . . . . . . . . . . . . . . . . . 107Education and Health . . . . . . . . . . . . . . . . . . . . 108
INCOME DISTRIBUTION AND POVERTY ... . . . . . . . . . . . . . . 108
POLICY REFORMS FOR ALLOCATIVE EFFICIENCY. . . . . . . . . . . . . Ill
INCENTIVES FOR GROWTH .... . . . . . . . . . . . . . . . . . . 114
RECOMMENDATIONS AND PROSPECTS FOR FUTURE GROWTH . . . . . . . . . 115
SUMMARY AND CONCLUSIONS .... . . . . . . . . . . . . . . . . . 116
REFERENCES .117
TABLES
1 Trend Growth Rates: Percent Per Year . . . . . . . . . . . . 1182 Macroeconomic Characteristics: Pre-Independence (1966-70) . . 1183 Macroeconomic Characteristics: Post-Independence Period . . . 119
COMMENTARY BY RICHARD S. ECKAUS ... . . . . . . . . . . . . . . 120

- 103 -
With a population of about 110 million and a per capita gross domesticproduct (GDP) of about US$180 in 1989, Bangladesh is the ninth largest and oneof the poorest of the countries of the world. About one-third of the populationsuffers from moderate to severe starvation and another third is malnourished.Life expectancy is 51 years, well below the average of other low-incomecountries. Only 32 percent of the people over fifteen can read and write. Thepeople of Bangladesh are becoming poorer and their standard of living has fallenover the past 160 years.
In 1958 the average income of a Bangladeshi was 74 percent of the incomeof a Pakistani, 65 percent of the income of a Thai, and half the income of aSouth Korean. In 1985 the average income of a Bangladeshi was 40 percent of aPakistani's, 19 percent of a Thai's, and 7 percent of a South Korean's. 1/
A review of rural incomes shows that a day's agricultural wage could buy6 kgs of rice in the 1830s and over 5 kgs in the late 1990s. By contrast, inthe early 1980s, a day's agricultural wage bought less than 3 kgs of rice.Further evidence shows that an average person in rural Bangladesh has a lowerlevel of nutrition today than at any other time in the past 160 years.Z/
Bangladesh was led to independence in December 1971 by a stronglynationalistic movement committed to representative democracy. Shortly afterindependence the movement lapsed into one-party authoritarian rule which wasended by a military coup in August 1975. Ever since the armed forces have playeda dominant role in government. Successive administrations have been toopreoccupied with survival to address key issues of long-term development. Asa result, there are no effective policies to regulate the private sector.
MACROECONOMIC PERFORMANCE
Growth of the Economy
During the post-independence period (1973-87)1/ GDP in Bangladesh grewby about 4 percent per year compared to 3.2 percent per year during the periodbefore independence (1950-70).4/ However, the higher growth rate in 1973-87 issomewhat misleading. There was an initial decline in the level of GDPimmediately after independence, and thus depressed income levels. In 1988-89
1/ A.R. Khan and M. Hossain (1989). (This paper draws heavily on this book).
2.1 A. R. Khan and M. Hossain (1989) and A. R. Khan (1984).
iJ Fiscal years run from July 1 to June 30.
i/ Some analysts suggest that official GDP growth rates are underestimatedbecause of the downward bias in the estimates of industrial output. Agenerous adjustment for this bias makes the trend growth rate in GDP 4.3percent per year. See Khan and Hossain (1989), annex to chapter 2 for adiscussion of these issues.

- 104 -
GDP growth barely kept pace with population. This decline in economic growthis often attributed to the stagnation in agricultural production caused bycatastrophic floods. At the same time, stagnation was also occurring in theindustrial sector.
Population Growth
One of the factors behind the higher growth rate of per capita incomefollowing independence is the decline in the rate of population growth. Thetrend in population growth has, however, been complex and uncertain. This hasbeen compounded by periodic revisions in official estimates.
According to official estimates the population growth rate peaked in thelate 1960s, reaching 3 percent per year. At that time the birth rate wassomewhere between 45 and 50 per thousand and the death rate was close to 20 perthousand.
In the first decade after independence the rate of population growthdeclined substantially to about 2.3 percent per year. This was due to a sharpdecline in the birth rate to well below 40 per thousand and a smaller declinein the death rate to about 15 per thousand.
This slowed population growth did not last: In the early 1980s itincreased significantly to more than 2.5 percent per year. The reasons for thisrise are not clear. It seems unlikely that it is due entirely or mainly to afurther decline in mortality since there has been no apparent decline in thedeath rate in the 1980s. Thus, it appears that the birth rate in the 1980s rosesignificantly and is higher than it was in the 1970s.
One explanation for the erratic birth rate is that in the early 1970s,in the wake of the sharp increase in the incidence of poverty immediately afterindependence, there was a poverty-induced decline in fertility. In the early1980s the incidence of poverty declined by comparison: This led to a recoveryin the fertility rate.
Savings. Investment. Capital Inflow. and Foreign Debt
Macroeconomic indicators relating to savings, investment, capital inflow,and debt service in Bangladesh underwent profound changes after independence.Comparisons of indicators in the five years prior to independence (1966-70) andthe most recent six years after independence for which detailed information isavailable (1981-86) highlight these changes. Per capita income in the secondperiod was about 5 percent higher than in the first period. Per capitaconsumption in the second period was, however, 12 percent higher than in thefirst period. This represents a sharp decline in the domestic saving rate, frommore than 8 percent of GDP in the pre-independence period to 2 percent in thepost-independence period.
Investment increased from 12 percent of GDP in the pre-independenceperiod to 14 percent in the post-independence period. This was financed by threesources: domestic savings (2 percent of GDP), income remitted by Bangladeshis
- 105 -
working abroad (3 percent of GDP), and net capital inflow (8 percent of GDP).For the pre-independence period no estimate is available for workers' remittancethough it appears reasonable to assume that it was insignificant. Investmentwas financed by domestic savings (over 8 percent of GDP) and net capital inflow(3 percent of GDP).
Thus, Bangladesh has become overwhelmingly dependent on foreign capitalsince independence. In recent years domestic savings have financed only 16percent of domestic investment as compared to 72 percent before independence.Net foreign capital inflow has financed nearly 60 percent of domestic investmentin recent years as compared to only 28 percent before independence. Thetransformation from a relatively self-reliant to a massively aid-dependenteconomy is the country's most outstanding-macroeconomic feature. This dependencehas led to, at best, a marginal gain in the economic growth rate.
A very high, though gradually declining, proportion of capital inflowhas been in the form of outright grant. The terms of long- and medium-term loanshave also been very favorable; an average repayment period of 39 years, a graceperiod of nine years, and an average interest rate of 1.5 percent. And yet theprolonged inflow of foreign capital at a high rate has created a substantial andrapidly increasing burden of debt service. Interest and repayment of medium-and long-term (M<) debt was 13 percent of foreign exchange earnings (consistingof merchandise exports and workers' remittances) in 1986 and rose to 19 percentin 1989. Including the interest and repayment on short-term debt, total debtservice in 1989 was 31 percent of foreign exchange earnings.
SECTORAL PERFORMANCE
Food and Agriculture
Like most other sectors of the economy, agriculture experienced anabsolute fall in output immediately after independence when per capita productionand consumption of foodgrains fell. Between 1973 and 1987 growth in overallagricultural production was at least as high as the growth in population whilethe growth in foodgrain (cereal) production was higher than the growth inpopulation. Since 1987, food and agricultural production have stagnated. Whileunusually severe flooding has been blamed for this, there are indications thatother problems had been threatening the progress in agriculture.
Increased production of cereals--through the adoption of a technologybased on the use of the high-yielding variety of seed, controlled water, andfertilizer--has been the main source of agricultural growth during post-independence. Concentration on cereals was largely due to the government's heavysubsidization of inputs. This support was prompted by the perception thatattaining self-sufficiency in the production of foodgrains was the highestpriority in agriculture. Moreover, the technology to raise the yield of cerealswas readily available.
The rate of output growth was much faster in the 1970s than in the 1980sand the rate of increase in production has gradually slowed. The target of
- 106 -
achieving self-sufficiency in the production of foodgrains has proved elusive;imports as a proportion of total domestic consumption has shown no tendency todecline. Cereal imports as a proportion of total domestic availability was 11.5percent during 1984-88, exactly the same as the five years immediately afterindependence (1974-78). In the 1980s per capita consumption of foodgrains washigher than in the 1970s but still significantly lower than in the pre-independence years.
The pattern of agricultural growth has almost certainly aggravatedinequality in the distribution of income. The benefits of fertilizer subsidiesappear to have been rather widely distributed thanks to the high rate of HYV.adoption by small farmers. The high rate of adoption on their part, in turn,was facilitated by: the provision of irrigation water by the public sector; andthe instinct for survival on the part of small farmers faced with a decliningland/person ratio and--in the case of the tenants--by a push by the owners ofland (who appropriated much of the gain from increased output). Since the late1970s the emphasis in irrigation has shifted to the promotion of privateownership of highly subsidized equipment. In more recent years subsidies onfertilizers have been drastically curtailed, while subsidies on irrigation wereretained. Richer farmers have acquired irrigation equipment with the help ofcredit from public lending institutions. While massively defaulting on therepayment of credit, these farmers have sold water to the smaller farmers at veryhigh prices. Growing land scarcity has raised the value added factor share ofagricultural land. Given the continuation of extreme inequality in thedistribution of land, this growing share of output accruing as rents hascontinued to be very unequally distributed.
In recent years the area under wheat, the most rapidly rising componentof agricultural growth, has begun to stagnate. The demand for irrigationequipment has slackened since the expansion of the credit program came to a halt,a halt that was induced by an attempt to tighten credit and improve repaymentrates. This in turn has led to concern that it may not be possible to maintainthe moderate progress made in the sector since independence.
Industry
Industrial policy in post-independence Bangladesh has been characterizedby the use of state power to create a mechanism for private enrichment. Thisis just as true during the early period of nationalization as duringprivatization later on. Largely as a direct consequence of this strategy, thenationalized industries were inefficient and incurred large operating losses.
During the 1980s, wide-ranging reforms have been made to the industrialsector with the aim of promoting growth and efficiency. These measures,discussed more fully later, have included substantial privatization, widespreadreforms of the foreign exchange regime, and other steps to promote allocativeefficiency. The accumulated riches in private hands have not, however,contributed to productive industrial investment. Reasons for this include: theabsence of a regulatory framework to ensure stability and monitor the processof accumulation; the divorce between production and accumulation (with the

- 107 -
process of accumulation serving as a disincentive to invest); and the inadequacyof physical infrastructure.
While there is some controversy about the rate at which the industrialsector has grown, observers agree that the rate has not been particularly high.Moreover, much of the growth has originated in small-scale and cottageindustries, which did not receive much support from the government.
According to official estimates, value added in large and mediumindustries--the main focus of public policy--has grown at a lower rate than GDP.Once upward adjustments are made in these estimates to compensate for allegedunderstatement of industrial growth,V/ the value added appears to have grownslightly faster than GDP in the 1980s. With rare exceptions, value added perworker in these industries has declined over prolonged periods.
Small industries--predominantly based in urban areas and using non-traditional technology--appear to have grown rapidly, though it is impossibleto precisely quantify their growth. Traditional cottage industries--based inrural and semi-urban areas--appear to have grown very rapidly, largely due toan influx of labor that the agriculture sector failed to absorb. Thus, theperformance of cottage industries is more a reflection of the attempt of low-income people to survive by finding work in a sector of residual employmentcategory, than of vigorous and dynamic growth. The rewards from growth in theseindustries, in the form of wages and earnings per worker, were dismally low.
Infrastructure
Inadequate physical infrastructure is a serious obstacle to economicdevelopment. Erratic power supply is a major hindrance to the utilization ofindustrial capacity; the lack of access to power is an obstacle to thedevelopment of rural industries. The depletion of natural energy resources andthe high cost of transmitting commercial energy have created a serious shortagein rural areas and caused considerable environmental damage. Expansion in theuse of gas--a relatively plentiful source of indigenous energy--and in the supplyof electricity, generated largely from gas, have not relieved the shortage. Thisis because the cost of transmitting commercial energy to rural areas isprohibitively high.
In transport, roads have expanded significantly, although growth has notkept up with demand. The expansion of roads has been imbalanced: Feeder roadshave received much less attention than arterial roads. As a result, seriousbottlenecks have arisen because of the difficulty in getting agricultural goodsto market. Arterial road transport has suffered from the inadequacy of ferryservices, railways have stagnated, and the use of natural waterways has beenlimited by the lack of investment.
5/ See A.R. Khan and M. Hossain (1989), annex to chapter 2 for a backgroundto this issue.

- 108 -
Some progress has been made in harnessing the rivers, controlling floods,and reducing waterlogging and salinity.
Education and Health
Education and health have suffered from comparative neglect. Theirshares of public expenditure are low and have declined over time. The allocationof resources for education has not been consistent with the principles ofefficiency and equity. Higher education, which has a low return (it producesfewer employable people) and tends to benefit the middle- to upper-classes, hasreceived most of the funds, while primary education--with apparent high returnaccruing mainly to the poorer groups--has suffered. Moreover, access to allforms of higher education has narrowed and is inequitable. The primary schoolenrollment rate has been falling for boys and overall, though rising for girls.One redeeming feature of educational development is the rapid growth of highertechnical education. While the quality of this vocational education has notdeteriorated, the quality of other forms of post-secondary education has.Graduates from post-secondary institutions acquire few usable or employableskills.
While certain factors such as improved life expectancy (particularly forwomen) and lower infant mortality indicate advances in health, Bangladeshcontinues to rank well below other low-income countries in terms of theseindicators. Basic rural health services have expanded, yet these increases havenot been significant in comparison with what is needed. The improved lifeexpectancy and reduced infant mortality rate is probably due to increased accessto safe drinking water and better control of epidemic diseases.
INCOME DISTRIBUTION AND POVERTY
The economy of Bangladesh has experienced some growth during the post-independence period, with average per capita consumption during the 1980s 12percent above per capita consumption in the second half of the 1960s. Was thisimprovement in per capita consumption shared by the poor with a consequentdecline in the proportion of the population in absolute poverty?
Using a level of food consumption that provides kilocalories of energybelow what is required, and the head count method, the incidence of poverty canbe measured from the Household Expenditure Surveys (HES) for 1974, 1982, 1984,and 1986. These estimates show that the incidence of rural poverty: (a)increased between 1974 and 1982; (b) declined dramatically in a very short periodbetween 1982 and 1984; and (c) registered a small decline between 1984 and 1986.
- 109 -
Changes estimated from the HES data between 1974 and 1982 and between1984 and 1986 are not difficult to accept.V/ It is the change between 1982 and1984 that is far more dramatic than what one is led to expect from other evidence(e.g., change in real wages in agriculture). Indeed, the anomalous reductionin rural poverty between 1982 and 1984 is probably due to a bias created bychanges HES made to its methodology, beginning in 1984.2/
Once the improvement between 1982 and 1984 is largely discounted, therewould be no basis to conclude from the HES data that the incidence of ruralpoverty declined in the period since independence: poverty increased quitesharply between 1974 and 1982 and declined modestly between 1984 and 1986. Ifthere was no more than a moderate decline in the extent of poverty between 1982and 1984, then the incidence of rural poverty between 1974 and 1986 could nothave changed significantly. This would be a remarkable finding because 1974 wasa depressed year, which led to a severe famine, and 1986 was an unusually goodyear in which a number of favorable factors coincided to produce a short-livedpeak in real wages. Between these two years per capita income increased by 26percent.
Other available evidence suggests that the incidence of poverty couldnot have declined in any significant way in the years since independence. Themost important piece of evidence is the movement in real wages. Estimates ofreal wages for agricultural workers are available for four decades, from 1949to 1989..g/ Over this period the estimated rate of change in real wages is astatistically significant -1.7 percent per year. Immediately after independence,real wages declined sharply, by 29 percent between 1971 and 1973. Even whenthe highly depressed 1973 level is used as the point of departure, the rate ofchange following independence is not significantly different. Average real wagesfrom 1982-87 were about 27 percent lower than in the second half of the 1960s.From the mid-1960s to 1987, national per capita real consumption increased by
k/ The increase in poverty between 1974 and 1982 may seem unlikely since therewas a catastrophic famine in 1974 and no other major disasters occurredbetween 1975 and 1982. In 1982 crop output declined absolutely and percapita output in agriculture fell. Yet evidence suggests that per capitarural income in 1982 was higher than in 1974. The HES measurement ofpoverty between these years would thus imply that the distribution of incomechanged adversely for the poor. The 12 percent decline in the real wagerate in agriculture between 1974 and 1982 supports this. Assuming that theHES evidence is accurate, the experience demonstrates that the incidenceof steady but slow hunger and the incidence of sudden and massive hunger(as in a famine) are not necessarily highly correlated, a point to whichAmartya Sen (1982) has drawn attention. Questions, of course, remain tobe answered about the accuracy of the HES measurements.
1/ See A.R. Khan and M. Hossain (1989), p. 148 for an account of the changesand the bias due to them.
L/ See A.R. Khan and M. Hossain (1989).

- 110 -
12 percent and consumption in the rural areas probably increased even more.2/Meanwhile, per capita income during 1975-89 increased at a highly significantrate of 1.64 percent per year.
The distribution of urban income appears to have followed the same courseas in rural areas: inequality has increased, perhaps more than in rural areas,and real wages have declined.LO/
Additional evidence on the changing distribution of income and povertyis provided by taking a closer look at the trend of income and the consumptionand price of foodgrains (primarily rice and wheat). Rice represents over 80percent of grain consumption: It has accounted for more than 55 percent of theexpenditure and 75 percent of the kilocalories consumed by poor households inBangladesh in recent years. At prevailing low levels of food consumption theincome elasticity of demand for cereals should be high. A poor family, with aninadequate intake of food, is likely to spend a large portion of its income onrice and wheat. This effect would be particularly strong if the relative priceof the grains remained the same.
Available evidence shows that the relative prices of both coarse andmedium varieties of rice have fallen over time.i1/ Both varieties have beencheaper in the 1980s than in the 1970s relative to consumption in general.L2/This would lead one to expect a fairly high observed "income elasticity" ofdemand for rice (and total cereals) in the period since independence. Variouscross-sectional estimates suggest that the income elasticity of demand forcereals in Bangladesh is somewhere between 0.53 and 0.73.11/ In view of the lowaverage consumption and falling relative price of cereals, the income elasticityof demand for cereals should give a higher estimate than the lower limit of thisrange (assuming no change in the distribution of income), yet such an estimateturns out to be statistically insignificant.]4/
2/ Between these two periods the rural-urban income disparity appears to havedeclined. See A.R. Khan and M. Hossain (1989), chapter 7.
1Q/ See A.R. Khan and M. Hossain (1989), chapter 7.
11/ See Khan (1989).
1a2/ These relative prices are the ratios of the retail prices of rice to therural cost of living index.
1J/ See A.R. Khan and M. Hossain (1989), chapter 3.
L4/ The double logarithmic fit (implying a constant elasticity) gives anelasticity of 0.16 and a semi-logarithmic fit gives an elasticity of 0.17at the average of the annual per capita incomes during 1973-88. None ofthe estimated regression coefficients is, however, significantly differentfrom zero at any reasonable level of probability.

- ll -
The insignificant income elasticity of demand for cereals can only beexplained by a deterioration in the distribution of income. As is well known,the income elasticity of demand for cereals is lower for higher income groups.The observed insignificance of the elasticity suggests that the distribution ofincome had shifted in favor of the high income groups. Indeed, the result isquite consistent with a net decline in the per capita income of the poor. Inany case, it is inconceivable that the poor experienced a significant improvementin real income and yet decided not to increase the consumption of cereals,especially since cereals had also become cheaper relative to other goods. ./
POLICY REFORMS FOR ALLOCATIVE EFFICIENCY
During the 1980s, Bangladesh implemented a wide range of measures topromote economic efficiency, including a substantial privatization of industry,trade, and finance, and a variety of policies to improve allocative efficiency.
The adoption of the New Industrial Policy in June 1982 led to theprivatization of a number of large-scale industries, notably jute and cottontextiles. Prior to these reforms, at one point public ownership accounted for92 percent of the assets of large-scale industries. By 1985 public ownershiphad declined to about 40 percent of the assets of these industries.Privatization has also affected a number of banks and financial institutions,and by the late 1970s had already been extended to the marketing of agriculturalinputs and the ownership of irrigation equipment.
During the 1980s the interest rates on deposits were generally negativein real terms and rates on lending were either negative or insignificant. By1980, the rates on deposits and loans were raised to a level that was positivein real terms.
Starting in 1976 steps were taken to reduce subsidies on agriculturalinputs, particularly fertilizers. By 1986 subsidies on fertilizers had all butvanished. Subsidized distribution of foodgrains through statutory rationing wasalso drastically curtailed. On the other hand, subsidies on irrigation equipmentwere retained at a high rate.
i5. The appropriateness of the cross-section elasticity as an indicator ofconsumption behavior over time may be questioned. It is, however, unclearin what direction the cross-section elasticity would be biased. Thetraditional consensus seems to be that it would be an underestimate. Thisis because the cross-section elasticity measures the difference between theconsumption behavior of a poor consumer and a richer consumer at a givenpoint in time. As the poor consumer becomes better off over time he or shewould take time to acquire the consumption pattern of a richer consumer.For food, this would mean that the use of cross-section elasticity wouldunderestimate the growth in demand for food over time, other things beingequal.

- 112 -
According to orthodox development theory, a country's foreign exchangeregime decisively influences its growth and the efficiency of itsindustrialization. Attention has long been focused on the overvalued exchangerates and quantitative restrictions on imports in developing countries. Criticsassert that such policies: discriminate against exports; inevitably promote non-uniform protection for different products, which in turn encourages amisallocation of resources; and are restrictive and represent an obstacle toindustrial growth and efficiency.
Very important changes have taken place in the foreign exchange regimeof Bangladesh. First, the comparison of the wage earners' scheme (WES) rate ofexchangeL6/ and the official rate of exchange shows that the extent ofovervaluation in the latter is low and has declined sharply over time. In 1980the ("free market") WES rate was about 25 percent above the official rate. By1989 the difference had been reduced to 2 percent. Further, a variety ofincentives for exports had substantially reduced the difference between the realeffective exchange rates (REER) for exports and imports. The difference betweenthe REER for exports and the REER for imports has narrowed considerably in the1980s, although a significant disparity still exists.lL/
Finally, the level of protection for domestic industries has drasticallydeclined. A recent study showed that the overall wholesale trade margin onimports to Bangladesh fell by nearly a half between 1979 and 1984.i8/
The international donor community, led by the World Bank and the IMF,strongly promoted these measures, insisting that they were essential to efficientgrowth. However, there has been little evidence to date that they have worked.
The effects of privatization have yet to be carefully analyzed.Preliminary studies show that it did not improve performance in large-scaleindustries. On the other hand, the new system of marketing in agriculture, whichended the monopoly of the parastatals, has been widely welcomed by the peasants.
1§/ WES rate of exchange is the free market price of foreign exchange remittedby the Bangladeshis working abroad. The purchase of foreign exchangeremitted under WES entitles the buyer to import a wide variety of goods andservices. Imports under WES have accounted for about a quarter of allimports and well over half of all private imports in recent years.
17] See A.R. Khan and M. Hossain (1989), pp.92-95. Note that the estimates ofREER for imports are overstated because the rates of statutory protection(import duties and taxes) that are used to calculate them have been foundto be higher than the rates of actual protection. The estimates of REERfor exports, on the other hand, are understated, because they do not takeinto account numerous export benefits (e.g., tax holidays, access to bondedwarehouses, interest rate subsidies and several other incentives).
8J./ See Bhuyan, Haq and Rashid (1985).
- 113 -
The reduction in disincentives for exports may have aided some exportpromotion, but the drastic reduction in the level of protection and the changein the foreign exchange regime have not led to any efficient restructuring orexplosive industrial growth. Moreover, it is hard to argue that there has beensignificant diversification and growth in exports. Before independence raw andmanufactured jute accounted for about two-thirds of exports (to the then WestPakistan and the rest of the world together). The percentage of jute as a shareof total exports increased immediately after independence due to the loss ofcertain exports to Pakistan. By 1989 the share had declined to less than athird. This apparent diversification of exports needs some seriousqualification, however. First, exports have grown rather slowly, at about 8percent per year in nominal dollar value. Second, the drastic reduction in theshare of jute has partly been at the cost of an absolute decline in the valueof jute exports. Possibly, more sensible policies would have permitted anavoidance of such a decline. Most importantly, the diversification is largelydue to the rapid, sustained increase in the export of ready-made garments, withonly periodic spurts in the export earnings of a few other items, notably, fishand leather.
Garments accounted for more than one third of merchandise exports in1989. The rapid expansion in the export of garments has occurred becauseentrepreneurs from East Asia had hit import ceilings imposed by the developedcountries on their exports. These entrepreneurs transferred some of theiroperations to Bangladesh where quotas did not apply. The value added and netforeign exchange earned from the garments are limited because of the high costof the inputs needed to produce them.19/
While Bangladesh has made impressive progress in implementing prescribedreforms, other macroeconomic measures are required. The country needs a properincentive system to ensure allocative efficiency; and, for such a system toinduce growth, two preconditions are needed:
(a) an institutional framework that will make economic agents respond tothe incentive system; and
(b) a complementary system of incentives to promote growth.
The importance of the first condition has been underlined by Kornai inthe case of the socialist countries. He has argued that the "soft budgetconstraints" that the enterprises in such countries are subject to make itimpossible for them to respond to price and profit incentives. In such asituation it is meaningless to reform prices and profit signals without changingthe institutions and regulations that make the budget constraint soft.
Another example is interest rate reforms in Bangladesh, which weredesigned to price funds more realistically, thereby encouraging saving and moreprudent investment. Its success depended on getting the economic agents to pay
j,_/ Imported current inputs accounted for as much as 70 percent of the valueof the output of the garments. See McKay (1984), pp. 35 and 39.
- 114 -
higher real interest on borrowed funds. When the lending institutions, mostlyin the public sector, tried to enforce the higher rates, there was massivedefault by lenders in agriculture and industry. The entire credit system wasclogged, then ground to a halt. To date, the government has lacked the strengthneeded to implement and enforce clear financial regulations.
INCENTIVES FOR GROWTH
In examining incentives for growth, a useful starting point is the systemof primary accumulation needed during the initial phase of industrialization.
For example, the system of primary accumulation that financed the initialindustrialization of Pakistan consisted of a highly overvalued exchange ratebuttressed by strict licensing of all imports. Licensed importers appropriatedlarge scarcity premia, only a part of which went to the treasury in the form ofimport taxes. This constituted a concealed tax on the producers of exports,mainly the peasants. Domestic industries were highly protected, which encouragedtraders- -the beneficiaries of the accumulation process- -to channel their surplusinto industrial investment. The system led to inequitable growth and bredinefficiency because protection was too high to permit healthy competition. Onthe other hand, it created a strong incentive to invest in productive sectors.
In Bangladesh state power was used for the enrichment of privilegedgroups, initially by tapping the potential surplus of nationalized industries;and by appropriating scarcity premia on imports. Soon, however, the system beganto fall apart. Because of mismanagement and inefficiency, nationalizedindustries incurred heavy losses and could no longer serve as a source of surplusgeneration for those in control. To appropriate surplus from import trade itis essential to have a high scarcity premium at the official price of foreignexchange. For a number of reasons, this became increasingly difficult tomaintain. Remittances increased rapidly to become the single largest source offoreign exchange earnings. Subjecting remittances to surplus extraction wouldonly drive them into illegal channels or out of the country. Jute textiles, theremaining source of export earnings, are also difficult to subject to surplusextraction. The jute industry was incurring large losses, partly because it wasless protected following the dismantling of a dual exchange rate prior toindependence. Traditional exports provided too narrow a base for such a system.Moreover, there was pressure from the donor community to revise the overvaluedexchange rate.
Public sector imports became the alternative source of surplusextraction. Financed by foreign aid, these imports are subject to high agencyfees and premia charged by the local agents of foreign suppliers. The localagents tend not to reinvest their profits in productive sectors. These highcosts were passed on to the government.
The pre-independence system of accumulation (when Bangladesh was partof Pakistan) and the present system differ in certain fundamental ways. First,the number of beneficiaries is smaller, although the stake each one has islarger. Most importantly, the present system does not have a system of

- 115 -
incentives directing the surplus to productive investment. The new system nolonger depends on a large scarcity premium on imports, nor does it provide highprotection for domestic industries. Rather, it depends on a large volume ofimports in the public sector, which is consistent with a low degree ofprotection.
The loss of protection was not countered by a compensatory package ofpromotion. The general chaos and arbitrariness under which the system functionedmade it impossible for cohesive regulations to emerge. Successive governments,tainted by arbitrariness and illegitimate practices that inevitably characterizesuch a mechanism of surplus generation, failed to instill confidence andstability. The other impediment to the development of a system of promotion wasthe serious inadequacy of infrastructure, which affected profitability.
Little information is available on where the surplus went. It is,however, possible that much of it was channeled into higher consumption, luxuryhousing, foreign travel, and capital flight.
RECOMMENDATIONS AND PROSPECTS FOR FUTURE GROWTH
Economic growth in Bangladesh is not likely to accelerate significantlyunless the following preconditions are met:
(a) The emergence of a stable government capable of designing andimplementing financial regulations to control and protect business andindustry. Such a government should instill confidence in businessmenand workers that they will benefit from their efforts.
(b) The setting-up of a growth-oriented system of accumulation and incentivesthat would direct entrepreneurial effort towards productive activities.
(c) The removal of infrastructure bottlenecks by substantially increasinginvestment in transport, energy, and other related services.
Without meeting these preconditions, Bangladesh may not even be able tosustain the rate of growth that it achieved during the last two decades. Indeed,there were signs of deceleration even before the devastating floods in the lastfew years. Achieving higher growth while avoiding increased inequality andpoverty is likely to be a particularly difficult problem in Bangladesh in viewof the growing population and the inequitable distribution of agricultural land.The inability to improve the incomes of the poor may constrain agriculturalgrowth. There is some evidence that the failure to achieve self-sufficiency infoodgrains is largely due to insufficient effective demand, which is aconsequence of inequitable growth. It might be possible to overcome the problemof deficient effective demand by shifting the emphasis of agriculturaldevelopment away from foodgrains--a non-tradable good for all practical
- 116 -
purposes--to exports. However, unless this can only be done at the cost ofincreasing poverty. 2/
Bangladesh's future development depends primarily on internal forces.External changes, such as in the world demand for jute and other key exports,the extent of trade barriers, and the volume and terms of foreign trade, wouldcertainly influence, but alone could not affect, long-term growth.
Per capita external assistance--averaging approximately US$10 per yearin the 1980s--is not unjustifiably high, given the extreme poverty of thecountry. But rather than complementing domestic savings and contributing toraising the rate of investment, foreign assistance has become a substitute fordomestic savings. If the country could achieve the saving rate of the pre-independence period, domestic investment would be close to 50 percent more thanit is today (given the current rate of capital inflow). Without a change in theexisting system of accumulation and incentives, an increase in foreign aid wouldhave a limited effect and would not lead to self-sustaining growth in investment.
The change in the system of accumulation and incentives is not a matterfor the donor community to settle through policy dialogue and conditionality.Only determined domestic leadership can bring about the changes. Until then,policy measures to improve allocative efficiency will at best have a very limitedeffect.
SUMMARY AND CONCLUSIONS
Bangladesh has achieved a moderate rate of economic growth in the periodsince independence. While this growth has not met the expectations of those whofought for the country's independence, it must have surprised many who expectedBangladesh to become an "international basket case."
Apart from the failure to achieve a higher rate of growth, the economyhas been characterized by a number of shortcomings. These include: a sharpdecline in the domestic saving rate, an extreme dependence on external borrowing,increased inequality in the distribution of income, continued and undiminishedpoverty and malnutrition, lagging education and health services, and a failureto substantially reduce the population growth rate.
At the urging of donors, the country's. development policy has emphasizedmeasures to promote allocative efficiency. In the absence of institutionalpreconditions and a system of accumulation and incentives oriented towardproductive investment, these measures have not produced much success.
2I/ Some of these issues have been discussed in A. R. Khan (1989).

- 117 -
REFERENCES
Bhuyan, A.R., A.T.M.Z. Haq, and M.A. Rashid (1985), A Study on the DomesticPrices of Imports in Bangladesh and the Derivation of Shadow Prices ofForeign Exchange. Labor. and Some Major Inputs and Commodities, The PlanningCommission, Dhaka.
Khan, A.R. (1984), "Real Wages of Agricultural Workers in Bangladesh," in Khan,A.R. and Eddy Lee (eds.), Poverty in Rural Asia, I.L.O./A.R.T.E.P., Bangkok.
Khan, A.R. (1989), Poverty in Bangladesh. A Consequence of and a Constraint onGrowth, University of California, Riverside (mimeo).
Khan, A.R., and M. Hossain (1989), The Strategy of Development in Bangladesh,Macmillan, London.
McKay, Lloyd (1984), ReRort of ReadSmade Garments Industry, Trade and IndustryReform Project, Government of Bangladesh, Dhaka (mimeo).
Sen, Amartya (1982), "How is India Doing?" New York Review of Books, December16.
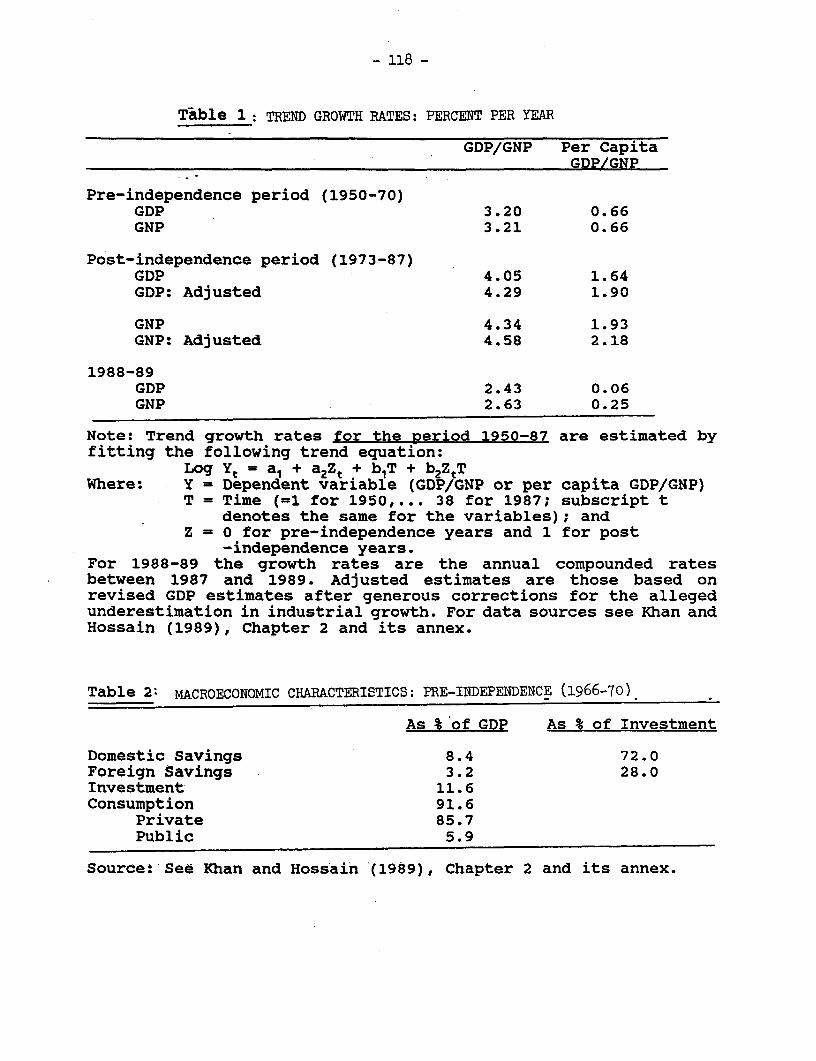
- 118 -
Table 1 TREND GROWTH RATES: PERCENT PER YEAR
GDP/GNP Per CapitaGDP/GNP
Pre-independence period (1950-70)GDP 3.20 0.66GNP 3.21 0.66
Post-independence period (1973-87)GDP 4.05 1.64GDP: Adjusted 4.29 1.90
GNP 4.34 1.93GNP: Adjusted 4.58 2.18
1988-89GDP 2.43 0.06GNP 2.63 0.25
Note: Trend growth rates for the period 1950-87 are estimated byfitting the following trend equation:
Log Yt = a, + a 2Z; + b1T + b2ztTWhere: Y = Dependent variable (GDP/GNP or per capita GDP/GNP)
T = Time (=1 for 1950,... 38 for 1987; subscript tdenotes the same for the variables); and
Z = 0 for pre-independence years and 1 for post-independence years.
For 1988-89 the growth rates are the annual compounded ratesbetween 1987 and 1989. Adjusted estimates are those based onrevised GDP estimates after generous corrections for the allegedunderestimation in industrial growth. For data sources see Khan andHossain (1989), Chapter 2 and its annex.
Table 2: MACROECONOMIC CHARACTERISTICS: PRE-INDEPENDENCE (1966-70)
As % of GDP As % of Investment
Domestic Savings 8.4 72.0Foreign Savings 3.2 28.0Investment 11.6Consumption 91.6
Private 85.7Public 5.9
Source: See Khan and Hossain (1989), Chapter 2 and its annex.
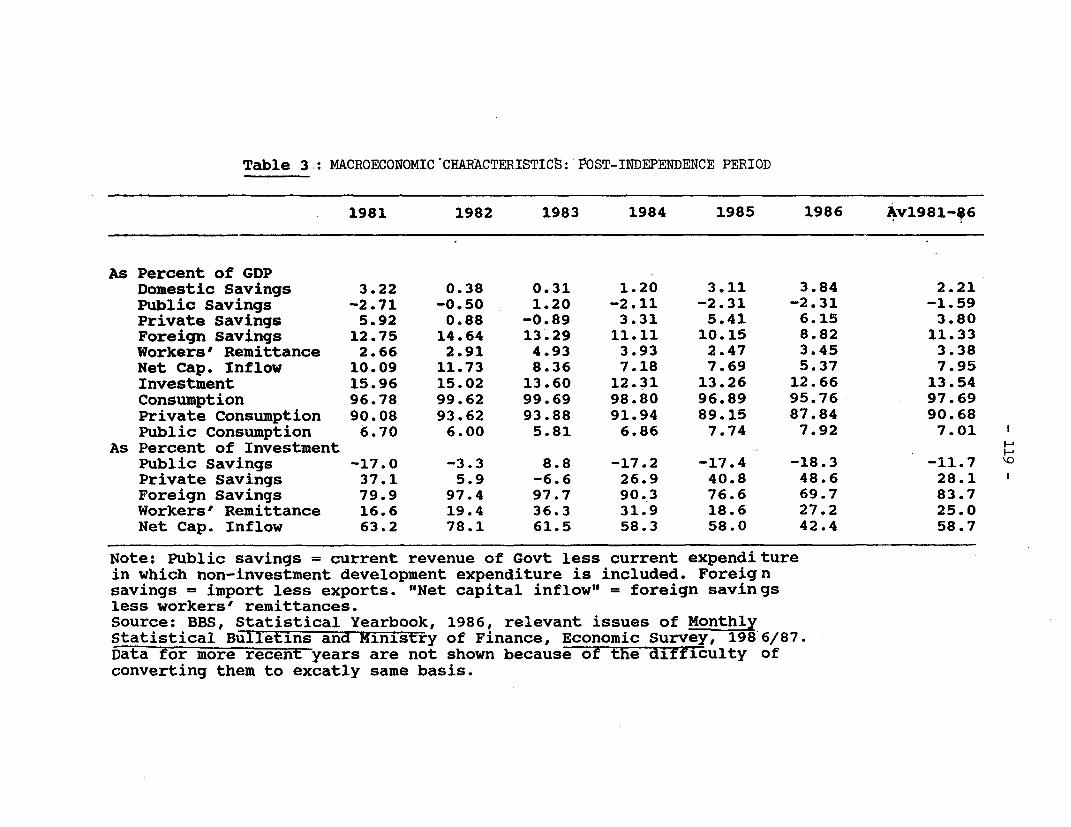
Table 3: MACROECONOMIC CHARACTERISTIC8: POST-INDEPENDENCE PERIOD
1981 1982 1983 1984 1985 1986 Av1981-46
As Percent of GDPDomestic Savings 3.22 0.38 0.31 1.20 3.11 3.84 2.21Public Savings -2.71 -0.50 1.20 -2.11 -2.31 -2.31 -1.59Private Savings 5.92 0.88 -0.89 3.31 5.41 6.15 3.80Foreign savings 12.75 14.64 13.29 11.11 10.15 8.82 11.33Workers' Remittance 2.66 2.91 4.93 3.93 2.47 3.45 3.38Net Cap. Inflow 10.09 11.73 8.36 7.18 7.69 5.37 7.95Investment 15.96 15.02 13.60 12.31 13.26 12.66 13.54Consumption 96.78 99.62 99.69 98.80 96.89 95.76 97.69Private Consumption 90.08 93.62 93.88 91.94 89.15 87.84 90.68Public Consumption 6.70 6.00 5.81 6.86 7.74 7.92 7.01
As Percent of Investment IPublic Savings -17.0 -3.3 8.8 -17.2 -17.4 -18.3 -11.7Private Savings 37.1 5.9 -6.6 26.9 40.8 48.6 28.1Foreign Savings 79.9 97.4 97.7 90.3 76.6 69.7 83.7Workers' Remittance 16.6 19.4 36.3 31.9 18.6 27.2 25.0Net Cap. Inflow 63.2 78.1 61.5 58.3 58.0 42.4 58.7
Note: Public savings = current revenue of Govt less current expenditurein which non-investment development expenditure is included. Foreignsavings = import less exports. "Net capital inflow" = foreign savingsless workers' remittances.Source: BBS, Statistical Yearbook, 1986, relevant issues of MonthlyStatistical Bulletins and Ministry of Finance, Economic Survey, 1986/87.Data for more recent years are not shown because of the di-fficulty ofconverting them to excatly same basis.

- 120 -
COMMENTARY BY RICHARD S. ECKAUS
Mr. Khan gives us few reasons to be optimistic about Bangladesh.Neither the government nor markets, such as they. are, work well in hisdescription of the economy. The recent history of economic ineptitude, pervasivecorruption and the bleak prospects for improvement provide incentives for capitalflight rather than the domestic investment that would help generate growth.
His passing comment on the effect of changes in poverty on fertilityindicates his belief that Bangladesh is, in effect, a Malthusian country.Successful attempts to improve output are eaten up by increases in population,at least among wage earners.
On the other hand, Khan's frequent references to the rapaciouseffectiveness of landowners and large merchants in appropriating surplusessuggest the possibility of high savings rates among these groups. It is somewhatpuzzling that this possibility is either not realized or not reflected in theofficial savings statistics. These statistics indicate that the Bangladeshsavings rate is one of the lowest, if not the lowest, in the world, except forcountries involved in foreign or civil warfare.
Foreign grants and loans have come to finance the overwhelming shareof investment in Bangladesh since its independence. It would be easy to arguethat here is an outstanding case of the counterproductiveness of foreign economicassistance. It would be more to the point to argue that it is thecounterproductiveness of domestic economic policy that is at fault. Khan'saccount does not give any ground for hope that, if there were no foreign economicassistance, there would have been a substantially better economic policy.
In Khan's account, the large merchants and agents handling imports,the large landowners and any other group that can appropriate public resources,do so. There are no effective constraints. However, it is also true that, withMalthusian pressures keeping wage incomes low, good markets would also lead tolarge "surpluses", i.e., non-labor incomes.
In this situation there is little that outside agencies can do exceptto continue to provide international "welfare" payments and exert whateverinfluence those give them in the direction of the political reforms that mustprecede the economic reforms.
MALAYSIA: PATHWAYS TO STABLE GROWTHWITH EQUITY
V. N. Gnanathurai
With commentary by Frank Lysy


- 123 -
TABLE OF CONTENTS
Page No.
FACTORS INFLUENCING DEVELOPMENT PLANNING . . . . . . . . . . . . 125
RECENT ECONOMIC DEVELOPMENTS ... . . . . . . . . . . . . . . . 126
Growth . . . . . . . . . . . . . . . . . . . . . . . . . . 128Inflation Performance .... . . . . . . . . . . . . . . . 129Employment Performance .... . . . . . . . . . . . . . . 130Balance of Payments Performance . . . . . . . . . . . . . . 130Income Distribution Performance . . . . . . . . . . . . . . 132
PROSPECTS FOR THE FUTURE .... . . . . . . . . . . . . . . . . 132
Global Economic Prospects . . . . . . . . . . . . . . . . . 132Prospects for the Malaysian Economy . . . . . . . . . . . . 134
PROBLEMS AND RISKS .... . . . . . . . . . . . . . . . . . . . 135
CONCLUSION .... . . . . . . . . . . . . . . . . . . . . . . . 136
TABLES
1 Key Economic Indicators . . . . . . . . . . . . . . . . . . . 1382 Economic Imbalances .... . . . . . . . . . . . . . . . . . 1393 Public Sector .... . . . . . . . . . . . . . . . . . . . . 1404 Average Per Capita Household Incomes, Peninsular
Malaysia: 1970 and 1987 ... . . . . . . . . . . . . . . . 1415 Per Capita Household Incomes by Income Deciles,
Peninsular Malaysia: 1987. . . . . . . . . . . . . . . . . . 1426 Selected Socio-Economic Indicators . . . . . . . . . . . . . 1437 National Accounts ....... .. .. ... .. .. .. . . 1448 Incentive Indicators Prices ..... . . . . . .. . . . . . 1459 Current Account Data ...... .. .. .. . .. .. .. . 146
COMMENTARY BY FRANK LYSY . . . . . . . . . . . 147


- 125 -
The economic system of Malaysia is based on private enterprise,although the government plays an active role in economic planning anddevelopment. The country has used and developed rich natural resources,including the literate population. This and prudent fiscal and monetarymanagement in a politically stable environment have made Malaysia one of thefastest growing economies in the Asia-Pacific region. With an estimatedpopulation of 17.5 million, Malaysia's 1989 per capita GNP in current terms wasjust over US$2000.
Malaysia's growth and continuing vitality are the result of pragmaticand flexible government policies and fast-growing foreign and domestic privateinvestment. Investors have committed substantial capital and modern technologyto developing the country's abundant resources, while the government has promotedsustained, balanced economic growth, with a view to eradicating poverty andrestructuring society. Concern for equity in distributing resources within theframework of macroeconomic policy has reinforced Malaysia's political and socialstability and helped improve the business climate.
FACTORS INFLUENCING DEVELOPMENT PLANNING
Development planning in Malaysia is influenced by three fundamentalfactors. The most important is the multi-ethnic composition of the populationand the disparities in income and economic opportunities between and within theethnic groups.i/ Despite the progress over the past 20 years in developing theeconomy and redressing social imbalances, poverty and ethnic disparities remainthe major problems of development planning. With an expanding economy and moreopportunities for employment, the government will be able to assist the lessadvantaged groups in society.
The second important factor in development planning is the open natureof the Malaysian economy. Exports and imports represent about 79 percent and75 percent, respectively, of gross national product (GNP). The economy,consequently, is subject to instability from fluctuations in internationaldemand, export prices, and foreign investment. Economic planners under suchcircumstances must be flexible to cope with these external shocks.
A third factor is the mixed nature of the economy. The planningprocess is neither entirely state controlled nor completely laissez-faire.Policy decisions are nevertheless based on free market principles; when the stateintervenes in key sectors of the economy, it does so to achieve sociallydesirable objectives. The state encourages competition to increase productivityand efficient allocation of resources, but does not discourage privateentrepreneurship or dampen the business climate.
1/ Of a population of 17.4 million in 1989, Malays and other Bumiputeras(indigenous people) comprised 56 percent, Chinese 34 percent, andIndians and others the remaining 10 percent.
- 126 -
RECENT ECONOMIC DEVELOPMENTS
The period 1981-85 was marked by a slowdown in the Malaysian economy.Average growth in real gross domestic product (GDP) tapered from 7.6 percent ayear during the 1970s to 5.1 percent a year (see Table 1). This was largely dueto the economic slowdown in the industrial countries, which dampened externaltrade, reduced private investment, and increased imbalances in external payments.This recession lasted an unusually long time, from the latter half of 1979 untilthe end of 1982. Despite this adverse global environment, Malaysia achieved anaverage growth rate of 6.7 percent between 1981 and 1984.
This impressive growth was largely due to the expansionary counter-cyclical public expenditure policies that Malaysia adopted to cushion the adverseeffects of the global recession. This expansionary, growth-oriented strategygave rise to imbalances, however, in both the public sector and externalaccounts. As a result, the public sector borrowed heavily from external sourcesto finance the growing gap between saving and investment. Planners perceivedthat this strategy, if continued, would hurt Malaysia's economic and financialstability..Z/
The government made major adjustments in domestic expenditure policybeginning in 1983 to ensure long-term viability of the economy. The governmentreduced the budget deficit from 20.4 percent of GNP in 1981 to 4.7 percent in1985, and reduced the current account deficit from a peak 14.1 percent of GNPin 1982 to 2.1 percent in 1985 (see Table 2).
Despite these improvements, however, economic conditions in 1986, whenthe Fifth Malaysia Plan (1986-90) was launched, were more severe than expected.International commodity prices, after recovering in 1983-84, collapsed across-the-board in 1985-86, severely affecting personal incomes and government revenue.The property market, after a boom in the early 1980s, experienced a similar fate.Private investment activity collapsed as profit margins were squeezed and otherstructural problems dampened the business climate. The slow growth in governmentrevenues during this period caused the government to intensify efforts toconsolidate public sector finances. It revised downward the public sectordevelopment expenditure for the Plan period from US$74 billion to US$47.7billion. Table 3 shows the decline since 1984 in capital or developmentexpenditure as percent of GDP for the federal government and for the entirepublic sector (federal government, state government, statutory bodies, and non-financial public enterprises). The deflationary impact of all these developmentsled to a negative economic growth of -1 percent in 1985 and a positive growthof a mere 1.2 percent in 1986.
2. By late 1982, the expansionary countercyclical policies of earlier yearsseemed sustainable without at the same time incurring a balance ofpayments problem. It was also evident that the timing of thecountercyclical policies, given the usual time lag between decisions andimplementations, had instead a procyclical impact on the economy.

- 127 -
To compensate for the slowed public spending and to speed economicrecovery, planners encouraged the private sector to take the lead in fosteringgrowth. The government recognized that several structural constraints in theMalaysian economy would constrain growth and equitable distribution; so plannersintroduced policy changes aimed at enabling the private sector to expand itsactivities, particularly in agriculture, manufacturing, construction and tourism.
Believing that macroeconomic measures alone could not solveunemployment or slow growth, the government gave equal emphasis to microeconomicreforms that enhanced efficiency and productivity.
Monetary policy during the Fifth Malaysian Plan facilitated growth andprovided liquidity for private investment. Interest rates were brought down anda New Investment Fund was set up to channel funds into the productive sectors.Exchange rate policy was reoriented to allow the ringgit to find its equilibriumlevel according to market fundamentals. Tax incentives were improved,particularly by reducing corporate tax rates. Industrial licensing practicesand guidelines on foreign equity, acquisition of assets, and expatriateemployment were deregulated. All these liberalization and deregulatory measuresimproved the investment climate and helped Malaysia to compete in exportproduction and in attracting new foreign investment..2/
While the world economy continues to face uncertainties and there aresigns of softening in the prices of major commodities, the Malaysian economy hasgrown remarkably since 1987. The economy is increasingly driven by domesticdemand, and this is likely to be sustained over the medium term. This domesticexpansion stems from increased private sector production and from increasedprivate consumption as profits from the export-led recovery in 1987 and 1988 arefully transmitted to the rest of the economy. In addition, increased efficiencyand competitiveness by many private enterprises has helped Malaysia capture alarger share of foreign markets. Based on these factors, overall output overthe 1986-90 period increased by an estimated 6.4 percent. The original FifthPlan target was 5 percent. This was no small achievement considering that theeconomy was in its deepest recession in post-Independence history at thebeginning of the Plan period. Per capita income in current dollar terms rose37.8 percent over the five-year period. The challenge for the future is toformulate policies that build on success, by continuing to enhancecompetitiveness and business confidence.
The objectives of eradicating poverty and restructuring society did notreceive the attention they deserved during the recession. The governmentemphasized growth first, as there could be nothing to redistribute withoutgrowth. With the easing of short-term pressures, more attention is now being
i/ The value of total gross exports (excluding services) increased almost80 percent from M$38 billion in 1985 to M$68.1 billion in 1989. Overthe same period of comparison, foreign direct investments in Malaysiaincreased more than seven-fold from M$1.2 billion in 1985 to M$8.6billion in 1989.
- 128 -
given to equitable distribution. This will help foster the socially andpolitically stable environment in which growth can proceed unhampered.
Despite the disruption caused by the recession, substantial progresshas been made over the last 20 years in laying a solid foundation for growth.Imbalances in income distribution have been reduced; a substantial proportionof the population is now above the poverty line. Per capita household incomegrew.3.75 percent annually over the last 20 years (see Table 4). The incidenceof poverty has been reduced from 49 percent of households in 1970 to 15 percentby the end of 1989, exceeding the target of 17 percent set when the New EconomicPolicy (NEP) was initiated.
Generally, tax, monetary, trade, and social welfare policies have beenappropriate to effect the objective of income improvement. Despite declines inthe terms of trade of 1.2 percent in the late 1980s, real income growth has beenfairly strong at 5 percent a year as output increases improved the income termsof trade.
Inter-ethnic income inequalities are narrowing. Household income amongBumiputeras grew almost 6 percent a year since the NEP was launched, faster thanthat for other ethnic groups. Still, as of 1990, the average Bumiputerahousehold income remained below that of Chinese and Indian households. The typesof economic activities of each community and the level of asset ownership accountin part for the different income levels. Self-employment in agriculture, forexample, accounts for a larger proportion of Bumiputera rural household incomethan it does for other ethnic groups. And in paid employment, Bumiputeras earnmost of their income from the service sector, including government. The Chinese,on the other hand, obtain theirs from trade, transport, and financial servicesin urban and rural areas.
An area of concern is the inequality between the richest and pooresthouseholds and within each community (see Table 5). The mean income of the top10 percent of households throughout the country, at M$9,415, is about 18.5 timesthat of the bottom 10 percent, at M$510. The range of inequality is greatestwithin the Malay community.
It is useful to examine in more detail the effect of the government'sNEP on Malaysia's growth, inflation, unemployment, balance of payments, incomedistribution and quality of life.
Growth
On a philosophical plane, there are two diametrically opposed analysesof NEP and growth:
(a) that the NEP has been a serious impediment to growth, directly andindirectly. Indirectly, it alienates most dynamic makers of growth sothat they do not maximize the full potential for rapid and dynamicgrowth. It is also argued that by not concentrating single-mindedlyon growth, by being diverted by objectives that are not based on

- 129 -
efficiency considerations, Malaysia has denied itself the growth thatit is fully capable of achieving.
(b) that the NEP has been positive for growth. Government investment andintervention have helped the economy when there has been a failure orshortfall in the private sector. It has been shown empirically thatthere is a strong positive correlation between government spending andprivate investment.4/ Another aspect of this argument is that withoutan effective program of affirmative action, Malaysia would havesuffered either ethnic violence or chronic political instability,making sustained growth impossible. The NEP is therefore seen as anecessary precondition for healthy and sustained growth, and a policyof pursuing growth without adequate equity consideration is seen asthe ultimate antigrowth policy.
Average annual growth of 6.5 percent over the last 20 years, comparedwith the original NEP target of 8 percent, is therefore seen as creditableperformance for any developing country. That such growth took place despite theturbulent external economic environment of the 1970s and 1980s is a tribute todevelopment planning in Malaysia. What is more, this growth occurred along withprice stability and improved income distribution.
Inflation Performance
Inflation in Malaysia was generally under control except during 1973-74 and 1980-82. During these periods, inflation was of the cost-push varietyand was due to the rising cost of imports. Demand-pull inflation, resulting fromthe government's reliance on money creation to finance its budget deficits orthe banking system's reliance on money creation to finance its credits toindustries, is virtually unknown in Malaysia. The Central Bank has almostcomplete control over both money creation processes and its policy has been topreserve price stability. The Central Bank controls the cash reserve ratio andsometimes imposes direct ceilings on each bank's credit expansion.
Government deficits are funded mainly from social securitycontributions and other non-inflationary forms of financing. Net domestic creditis therefore not synonymous with government deficits in Malaysia. The relationbetween NEP objectives and inflation hinges on the amount of government fundsrequired to support the NEP. If the policy leads to large government deficitsthat contribute to increasing net domestic credits, then it may increaseinflation. The record of price increases in Malaysia since the implementationof the NEP in 1971 does not indicate that the policy has contributed toinflation.
i/ See for instance "Malaysia: Matching Risks and Rewards in a MixedEconomy," Report No. 7208-MA, World Bank, Washington, D.C., October1988.

- 130 -
Employment Performance
Development planning with respect to employment changed considerablyafter 1971. Emphasis shifted from rapid economic growth to solving the nation'ssocioeconomic problems. The government became particularly concerned withemployment, and began implementing programs to increase and redefine employmentopportunities in favor of the Bumiputeras. One strategy was export-orientedindustrialization, which expanded labor demand because of Malaysia's comparativeadvantage in labor-intensive manufacturing. Export-processing free trade zoneswere established starting in 1972 to absorb surplus labor from the agriculturalsector. In 1971, the government also tried to rectify capital bias ofmanufacturing sector incentives by repealing the payroll tax and offering suchincentives as Labor Utilization Relief.
Under the NEP, the government expanded its involvement in the economy.It accelerated public spending and increased public ownership in the industrialand commercial sectors. Public expenditure was designed to expand andrestructure employment in favor of the Bumiputeras; but the sharp expansion ofemployment opportunities benefited the other ethnic groups as well. Between 1970and 1980, employment for all of Peninsular Malaysia grew at an average annualrate of 3.5 percent, while the labor force grew at 3.2 percent. Unemploymentduring this period consequently fell from 8.1 percent to 6.5 percent for theBumiputeras, from 7 percent to 3.9 percent for the Chinese, and from 11 percentto 6.3 percent for the Indians.
The NEP expedited the normal process of change in the sectoral,occupational, and ethnic composition of employment brought about by economicgrowth. In 1970, the primary sector accounted for 56 percent of totalemployment. By 1988, only 36 percent were employed in the primary sector--a 20percent decline. The secondary and services sectors absorbed relatively moreof the labor force.
On the supply side, better education for all ethnic groups, especiallythe Bumiputeras, helped to change the ethnic composition of the labor force andcreate a more equitable employment profile. Education has been an important toolfor upward social mobility under the NEP, and therefore the government has beenemphasizing formal education.
Balance of Pavments Performance
The main factors in Malaysia's balance of payments are merchandise;services; long-term capital movements such as public borrowing and corporateinvestment; and private capital and unrecorded transactions such as short-termcapital movements by commercial banks.
Malaysia's balance of payments since the NEP was implemented in 1971has been largely favorable. In the 1970s, Malaysia amassed surpluses in itsmerchandise balance; the 1980s were also good years except for small deficitsduring the global recession years of 1981 and 1982. In contrast to merchandise,though, Malaysia's services account has continually run at a deficit. Thisdeficit has escalated from US$862 million in 1970 to an estimated US$10.8 billion

- 131 -
in 1989. Services have been the weak spot in Malaysia's balance of paymentsposition; in most cases, favorable surpluses in its merchandise accounts havebeen adversely affected by equally large deficits in the services accounts.Fortunately, however, Malaysia's merchandise balances have fully offset theservices account deficits in most years.
In terms of Malaysia's overall balance of payments, deficits in thecurrent account were financed more than adequately by the inflow of foreigncapital in the 1970s. Private investments made up the bulk of this capital.In the 1980s, however, the inflow of private investment was not sufficient tofinance the deficit, which had become larger. As a result, Malaysia had toborrow heavily outside the country, which increased payments on the servicesaccount through loan servicing. Between 1981 and 1983, external borrowingsdoubled, from M$3 billion to M$6.2 billion. Starting in 1984, Malaysia adoptedmeasures to consolidate public sector finances. Coupled with improvements inthe merchandise balance, the measures helped improve the overall balance ofpayments.
A major contributor to the services outflow is investment income, whichhas accounted for more than 50 percent of the services deficit since 1983. Netinvestment income outflow increased from M$355 million in 1970 to an estimatedM$5.8 million in 1989. It has been argued that net investment income outflowscould have been slower if the NEP had not inhibited reinvestments by foreignfirms operating in Malaysia. This argument is not convincing for at least tworeasons. First, the problem with all "could have been" propositions is that theyrely on deductive logic rather than inductive analysis and empirical evidence.Empirical evidence shows that an established firm's decision to expand operationsor initiate new productive activities is based on the profitability of theproject rather than on the NEP. Second, if foreign firms operating in Malaysiawere attracted in the first instance by the high rate of return on theirinvestments, it is only natural that they repatriate profits to pay shareholders.As Malaysian multinationals grow in strength and invest abroad, a trend that isalready evident, growth in net investment income outflows may gradually bereduced.
Another significant contributor to the service account deficit istravel, which includes remittances to Malaysian students studying abroad. In1981, travel outflow was M$672 million; it reached M$1.6 billion in 1988. Thisincrease was due to the large increase in the number of Malaysian students thegovernment sent overseas for education in the 1980s. The relationship of travelto the NEP can be seen from two perspectives. First, the NEP sought torestructure employment and create viable commerce and industry in the Bumiputeracommunity. To the extent that the government, in pursuing this goal, sponsorsa large number of students in their studies overseas, it may exacerbate thetravel component of the deficit. Second, the lack of higher educationopportunities for non-Bumiputeras in local institutions necessitates their goingabroad on private funding. This indirectly relates to the social engineeringobjective of the NEP, and also exacerbates the travel outflows.
Balances on long-term capital accounts have been more favorable toMalaysia since the NEP was implemented. Easy and preferential access to capital
- 132 -
markets has ensured a sufficient flow of long-term official capital fordevelopment, except for 1987-89, when prepayment and repayments of long-termloans exceeded the income from new loans. Coupled with a steady inflow ofcorporate investments, which reflect Malaysia's generally good business climate,the overall balance has been in surplus in all years except 1988.
On the whole, the pursuit of NEP objectives can therefore be said tohave had no negative effect on Malaysia's balance of payments.
Income Distribution Performance
Since 1970, the government has implemented a number of incomegenerating and other programs to eradicate absolute poverty. Agriculturaldevelopment is the core of the strategy. Target groups also receive subsidies,public housing, and other basic amenities. The reduction in poverty since 1970has contributed to improvements in income distribution.
Also helping to even out income distribution are rising income levels,corporate ownership and management, greater regional balance, and socialengineering programs in such areas as employment by sector and occupation.Social programs that emphasize production are important since ownership ofproductive assets allows the expansion and deepening of human and non-humancapital formation, higher output, and greater social mobility.
Improvements in the entire range of socioeconomic indicators over thepast 20 years testify to the enhanced quality of life of all Malaysians,irrespective of race (see Table 6). The various programs under the NEP mighthave benefited some segments of the population more than others, but this wasdue to the overzealousness of some administrators rather than to the design oftheir programs.
PROSPECTS FOR THE FUTURE
Malaysia's prospects for the 1990s will depend on the internationaleconomy, and on further reforms aimed at attaining sectoral targets for thecoming decade. Policymakers now see the economy's exposure to the externalenvironment not as a handicap but as a challenge to growth. Since fluctuationsin commodity prices and foreign investment are a reality, policymakers will betrying to increase efficiency within the economy to strengthen Malaysia'scompetitiveness in the international arena. Government policy will concentrateon maintaining an appropriate fiscal, monetary and trade policy mix. It willsupport and help revitalize the primary sector, expand and upgrade the physicaland social infrastructure to avoid bottlenecks and interruptions in production,and improve the environment for small- and medium-scale businesses.
Global Economic Prospects
Several fundamental economic issues remain unresolved and make growthprospects of developing countries, including Malaysia, uncertain. Although therecovery of industrial countries from the recession of 1980-82 has been strong
- 133 -
so far, the mix of fiscal, monetary and trade policies, and the resulting patternof world trade and growth has changed. Prospects for sustained growth of theworld economy in the 1990s will be influenced by current international effortsto contain inflation, bring down real interest rates, resume the flow offinancial resources to developing countries, stem the rising tide ofprotectionism, and reverse the decline in real commodity prices.
Recent efforts to address these issues augurs well for the sustainedgrowth of the world economy, at least over the next three years. Stabilizationand restructuring efforts in many countries have been completed or are under way.These measures, aimed at improving efficiency in resource allocation andincreasing productivity, have helped allay the threat of another world recession.An encouraging trend is that most countries, irrespective of income level orideological persuasion, are relying more on the private sector and market signalsto direct the allocation of resources. If successfully implemented, thesereforms should result in sustained global economic growth as the 21st centuryapproaches.
The creation of a unified market by 1992 in Western Europe under theSingle European Act would stimulate growth in the region and boost demand forthe exports of developing countries. Although there is some threat of greaterprotectionism if "Fortress Europe" materializes, this is not a likely trend giventhe trade liberalization policies of many European Community members.
The recent political events in Eastern Europe and the structuralreforms being undertaken along free market principles also augur well forexpanded trade opportunities for the developing world. Many of the developingcountries would be in an advantageous position to supply goods to meet unleashedconsumer demand in these countries. Developing countries are concerned that thediversion of financial and investment flows from them to Eastern Europe mightslow their own capacity to spur growth. However, this is unlikely in theimmediate future given the lag time needed by Eastern European countries todevelop entrepreneurial skills, infrastructure and the right regulatory frameworkto absorb foreign direct investment.
To take advantage of the new opportunities, developing countries musttake a proactive stance and develop new trading and production arrangementsthrough joint ventures and integrated production processes to expand their marketshares in Western and Eastern Europe. The upper-middle-income countries of thedeveloping world are already strengthening their trade and investment ties withEurope to establish an early market presence in the region. This will enhancethe expansion of world trade and their own growth prospects. Malaysia hasalready embarked on such a strategy.
There are several downside risks to this optimistic forecast for theworld economy over the medium term. First, differences in productivity growthamong the leading industrial countries on the one hand, and between the leadingindustrial countries and the more successful developing countries on the otherhand, could create tension and increase protectionism. Second, a lack of policycoordination on the monetary front could cause price pressures to escalate.Third, currency market fluctuations could exacerbate the global debt problem and
- 134 -
affect the management of structural adjustment programs in developing countries.Finally, developing countries' capacity to absorb new technologies and foreigndirect investment depends on availability of external financing. If suchresources are not readily available, the technology and income gaps betweendeveloped and developing countries, particularly those that are debt-ridden,could widen.
Prospects for the Malaysian Economy
Given the openness of the Malaysian economy, its growth in the 1990swill depend on the country's ability to take advantage of an expansion in worldtrade. Stabilization and structural reform measures since the 1985-86 recessionhave put the economy on a solid footing for broad-based sustained growth in the1990s. Real GDP growth on average for the 1990s is projected at 6-7 percentyearly. This is premised on several factors. First, the high rates of savingand investment over the past three years are expected to increase. Second, thegovernment's microeconomic reforms, especially in public enterprise management,labor legislation, and financial services, have improved domestic macroeconomicmanagement. Third, efforts to develop human resources have helped eliminateskill shortages and have created an increasingly well-educated and diligent workforce. Fourth, monetary and tax policies will continue to emphasize thecompetitiveness of manufactured exports, which will capture an increasing shareof total exports. Finally,, political stability is expected to be maintaineddespite minor upheavals from opposition parties before this year's elections.
The economic structure that is likely to emerge in Malaysia by the year2000 will be the result of sectoral developments that are now taking place.These trends are expected to continue into the next decade. While the primarysector (agriculture and mining) provided the thrust for growth in the 1970s and1980s, the secondary sector (manufacturing and construction) will assume thisrole in the 1990s. The closely related tertiary sector will show similarvitality.
The recovery in private consumption will continue over the medium term,as a delayed response to the higher incomes of the past three years. Theconsumption growth has resulted not only from the increase in commodity prices,but also from public and private sector wage adjustments, and from a wage policyincreasingly tied to profitability and productivity, both of which have increasedin recent years (see Table 7).
Another stimulus to growth will be increased investment, both privateinvestment in manufacturing and government investment in the physical and socialinfrastructure. Increased private investment in manufacturing, construction,transport and other services will occur for several reasons. First, the moremature Asian economies, notably Japan, Taiwan, and Korea, have tried tocompensate for the disadvantages of strong currencies and rising labor costs bymanufacturing overseas. Second, Malaysia, with its well developed anddiversified infrastructure and political stability, has a comparative advantagein attracting such investment. Third, with tourism increasing, investment inrelated services and in hotel and resort construction will continue through the
- 135 -
1990s. More government expenditure will be needed to eliminate infrastructuralbottlenecks to enable the private sector to continue to expand (see Table 7).
The external sector will be a drag on growth in the short to mediumterm and a boost to growth over the long term. The trade surplus is decliningfrom its peak in 1987 because imports are growing faster than exports. Thistrend reflects the higher level of private investment and the resulting increaseover the short term in capital and intermediate goods imports. Over a longerperiod, this will change, as intermediate goods come increasingly from domesticindustries, reducing imports, and as the value-added from manufacturingincreases, enhancing exports.
PROBLEMS AND RISKS
The main risk to the Malaysian economy is its exposure to externalprice shocks. Both the agricultural and mining sectors will face decliningprices of major commodities from the peaks reached in 1988 and 1989. The priceof crude oil will stabilize at US$15-16 a barrel because of surplus productionby OPEC, slower growth and consequent lower usage in the OECD countries, and moreefficient use of oil. The prices of palm oil, rubber, and cocoa will also facelong-term declines, due to supply exceeding demand or the increased use ofcheaper substitutes. The only bright spot is timber, for which currentconservation efforts will curtail supply and lead to a 40-50 percent priceincrease over the medium term. The economy might not be damaged from pricedeclines, however, since producers tend to increase output (as with crude oil),and agricultural production will increase naturally as a result of earlierefforts to expand planted acreage.
Inflationary pressures also could hamper sustained economic growth.Inflation has increased moderately over the past two years due to depreciationof the ringgit, to wage adjustments, and to the increase in aggregate domesticdemand that accompanied the economic recovery (see Table 8). Price increaseson imports have also contributed to inflation. Two factors that might mitigateinflationary pressures are the recent appreciation of the ringgit, which isexpected to continue in the short term, and the slack residential housing market,which will keep residential rents and property prices low. About 30 percent ofthe consumer price index (CPI) is influenced by import prices; rent carries aweight of about 15 percent.
Unemployment will stay high at 6-8 percent throughout the 1990s (seeTable 8). The labor force is growing rapidly at 2.9 percent, or 200,000 personsa year. This does not include the inflow of illegal foreign workers. Assumingthat the current labor demand elasticity of nearly 0.5 prevails during the 1990s,a GDP growth of 6-7 percent annually would imply labor demand growing at the samerate as the labor force. Consequently, the absolute level of unemployment willnot change. Unless GDP growth can be kept above 7 percent, the chances ofbringing down unemployment are not bright. The structural problems ofunemployment will be alleviated by policy reforms in human resource developmentto eliminate skill shortages in specific sectors of high growth industries. More
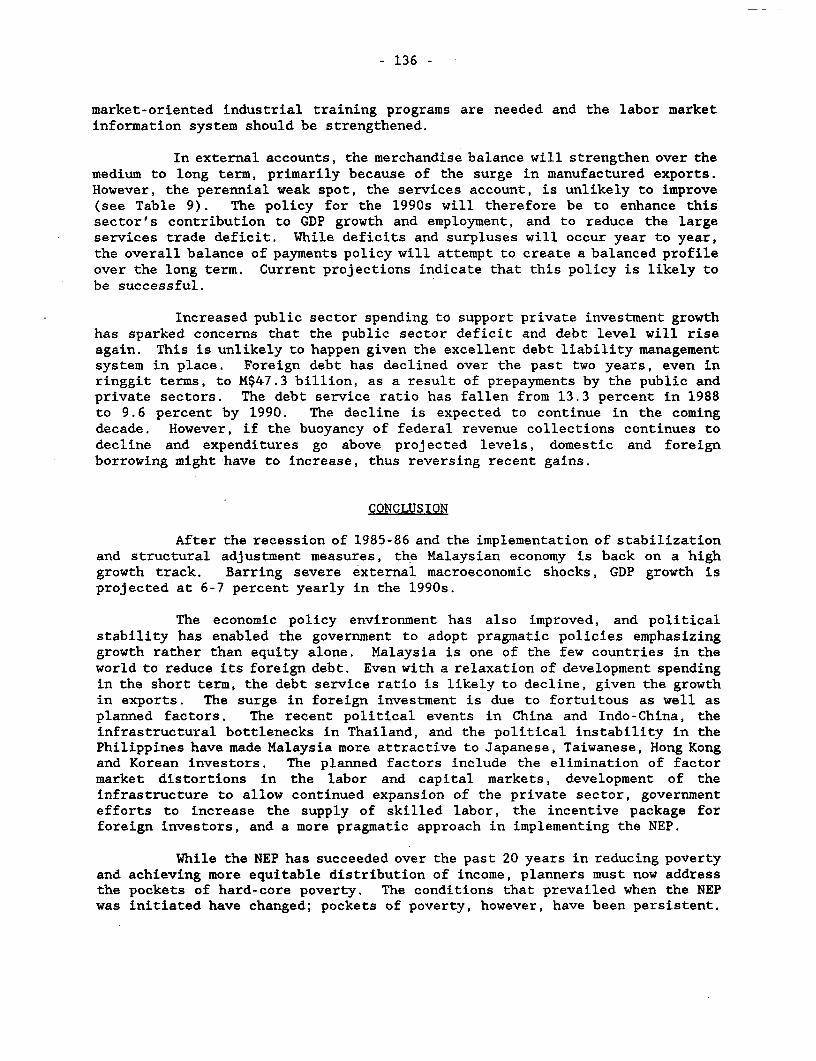
- 136 -
market-oriented industrial training programs are needed and the labor marketinformation system should be strengthened.
In external accounts, the merchandise balance will strengthen over themedium to long term, primarily because of the surge in manufactured exports.However, the perennial weak spot, the services account, is unlikely to improve(see Table 9). The policy for the 1990s will therefore be to enhance thissector's contribution to GDP growth and employment, and to reduce the largeservices trade deficit. While deficits and surpluses will occur year to year,the overall balance of payments policy will attempt to create a balanced profileover the long term. Current projections indicate that this policy is likely tobe successful.
Increased public sector spending to support private investment growthhas sparked concerns that the public sector deficit and debt level will riseagain. This is unlikely to happen given the excellent debt liability managementsystem in place. Foreign debt has declined over the past two years, even inringgit terms, to M$47.3 billion, as a result of prepayments by the public andprivate sectors. The debt service ratio has fallen from 13.3 percent in 1988to 9.6 percent by 1990. The decline is expected to continue in the comingdecade. However, if the buoyancy of federal revenue collections continues todecline and expenditures go above projected levels, domestic and foreignborrowing might have to increase, thus reversing recent gains.
CONCLUSION
After the recession of 1985-86 and the implementation of stabilizationand structural adjustment measures, the Malaysian economy is back on a highgrowth track. Barring severe external macroeconomic shocks, GDP growth isprojected at 6-7 percent yearly in the 1990s.
The economic policy environment has also improved, and politicalstability has enabled the government to adopt pragmatic policies emphasizinggrowth rather than equity alone. Malaysia is one of the few countries in theworld to reduce its foreign debt. Even with a relaxation of development spendingin the short term, the debt service ratio is likely to decline, given the growthin exports. The surge in foreign investment is due to fortuitous as well asplanned factors. The recent political events in China and Indo-China, theinfrastructural bottlenecks in Thailand, and the political instability in thePhilippines have made Malaysia more attractive to Japanese, Taiwanese, Hong Kongand Korean investors. The planned factors include the elimination of factormarket distortions in the labor and capital markets, development of theinfrastructure to allow continued expansion of the private sector, governmentefforts to increase the supply of skilled labor, the incentive package forforeign investors, and a more pragmatic approach in implementing the NEP.
While the NEP has succeeded over the past 20 years in reducing povertyand achieving more equitable distribution of income, planners must now addressthe pockets of hard-core poverty. The conditions that prevailed when the NEPwas initiated have changed; pockets of poverty, however, have been persistent.
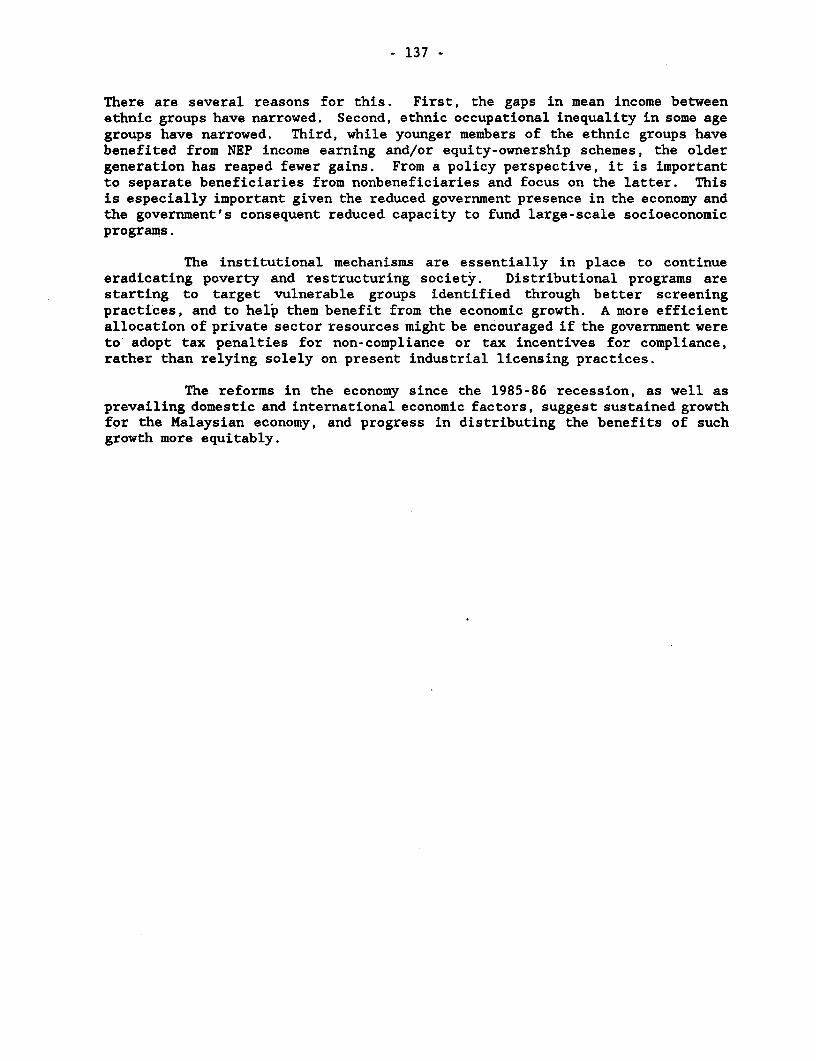
- 137 -
There are several reasons for this. First, the gaps in mean income betweenethnic groups have narrowed. Second, ethnic occupational inequality in some agegroups have narrowed. Third, while younger members of the ethnic groups havebenefited from NEP income earning and/or equity-ownership schemes, the oldergeneration has reaped fewer gains. From a policy perspective, it is importantto separate beneficiaries from nonbeneficiaries and focus on the latter. Thisis especially important given the reduced government presence in the economy andthe government's consequent reduced capacity to fund large-scale socioeconomicprograms.
The institutional mechanisms are essentially in place to continueeradicating poverty and restructuring society. Distributional programs arestarting to target vulnerable groups identified through better screeningpractices, and to help them benefit from the economic growth. A more efficientallocation of private sector resources might be encouraged if the government wereto adopt tax penalties for non-compliance or tax incentives for compliance,rather than relying solely on present industrial licensing practices.
The reforms in the economy since the 1985-86 recession, as well asprevailing domestic and international economic factors, suggest sustained growthfor the Malaysian economy, and progress in distributing the benefits of suchgrowth more equitably.

Table 1: KEY ECONOMIC INDICATORS
1956-60 1961-65 1966-70 1971-75 1976-80 1981-85 1986-90
MIP GRowTH(% PER ANNUM) 4.1 5.0 5.4 6.6 8.5 5.1 6.4
CUJRRENTkAcouNTr(M$ BILLION) 1.25 -0.41 0.87 -3.28 4.91 -27.60 9.4 H
OVERALL EXTERNALPAYMENTS-(ME BILLION) 0.69 0.29 0.58 1:79 6.23 1.76 14.4
CONSUMERPRtICES(% PER ANNUM) 0.4 0.5 1.4 7.4 4.5 4.6 2.5
Source: Bank Negara Malaysia, Annual Report 1989.EPU, Government of Malaysia

Table 2: ECONOMIC IMBALANCES
1981 1982 1983 1984 1985 1986 1987 1988 1989 1990
BALANCE OF PAYMENTSCUJRRENT AccouNT(MC BILLION) -5.6 -8.4 -8.1 -3.9 -1.5 -0.3 6.6 4.9 -0.4 -2.0
(% OF GNP) -10.1 -14.1 -12.4 -5.3 -2.1 -0.5 8.6 5.5 -0.4 -1.9 w
GOVERNMENT BUDGETCURRENT ACCOUNT(M$ BILLION) 1.0 1.5 1.7 2.2 4.1 1.6 1.1 3.5 3.9 4.0
(Z OF GNP). 1.9 2.6 2.6 2.9 5.6 2.4 1.5 4.1 4.1 3.7
GOVERNMENT BUDGETOVERALL DEFICIT(M$ BILLION) -11.4 -11.3 -11.1 -9.8 -3.4 -6.7 -3.9 -1.7 -2.6 -4.6
(% OF GNP) -20.4 -18.9 -17.0 -13.2 -4.7 -10.1 -5.3 -2.0 -2.7 -4.3
FOREIGN DEBT(M$ BILLION) 15.4 24.3 31.7 37.1 42.2 50.4 50.1 46.7 41.8 37.9
DEBT SERVICE RATIO 7.1 9.3 9.8 11.8 15.8 18.0 16.2 13.0 9.3 10.3
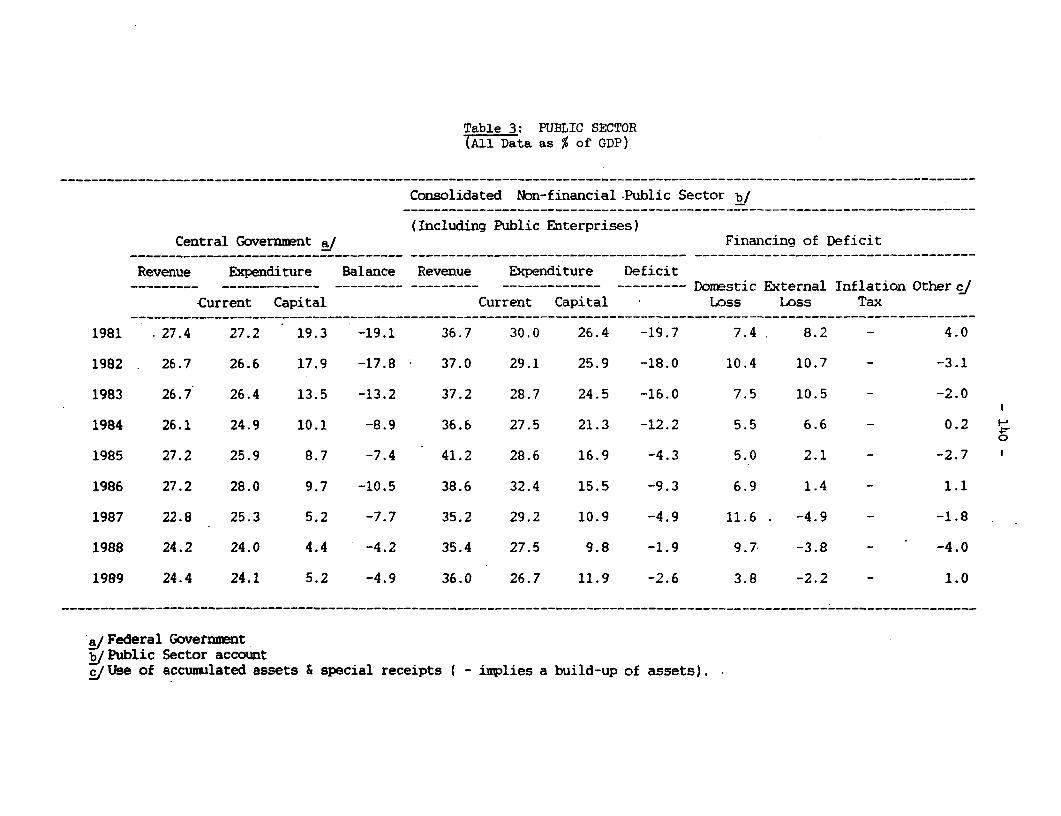
Table 3: PUBLIC SECTOR(All Data as % of GDP)
Consolidated Non-financial.Public Sector b/
(Including Public Enterprises)Central Government a/ Financing of Deficit
Revenue Expenditure Balance Revenue Expenditure Deficit----------------------------------- Dorrstic External Inflation Other CJ
Current Capital Current Capital Loss Loss Tax
1981 27.4 27.2 19.3 -19.1 36.7 30.0 26.4 -19.7 7.4 8.2 - 4.0
1982 26.7 26.6 17.9 -17.8 37.0 29.1 25.9 -18.0 10.4 10.7 - -3.1
1983 26.7 26.4 13.5 -13.2 37.2 28.7 24.5 -16.0 7.5 10.5 - -2.0
1984 26.1 24.9 10.1 -8.9 36.6 27.5 21.3 -12.2 5.5 6.6 - 0.2 H0
1985 27.2 25.9 8.7 -7.4 41.2 28.6 16.9 -4.3 5.0 2.1 - -2.7
1986 27.2 28.0 9.7 -10.5 38.6 32.4 15.5 -9.3 6.9 1.4 - 1.1
1987 22.8 25.3 5.2 -7.7 35.2 29.2 10.9 -4.9 11.6 . -4.9 - -1.8
1988 24.2 24.0 4.4 -4.2 35.4 27.5 9.8 -1.9 9.7 -3.8 - -4.0
1989 24.4 24.1 5.2 -4.9 36.0 26.7 11.9 -2.6 3.8 -2.2 - 1.0
,a Federal Governmentk/Public Sector account£1 Use of accunulated assets & special receipts t - inplies a build-up of assets).

- 141 -
Table 4: AVERAGE PER CAPITA HOUSEHOLD INCOMESPENINSULAR MALAYSIA : 1970 AND 1987
ANNUAL GROWTH RELATIVE ToANNUAL INCOME CONSTANT PRICES OVERALL
(M$) (%) (%)
1970 1987 1970 1987
OVERALL 744 2,761 3.75 100.0 100.0
MALAY 492 2,246 5.97 66.1 81.3
CHINESE 1.032 3,715 3.46 138 7 134 6
INDIAN 948 2,640 1.35 127.4 95.6
Source: Economic Planning UnitHuman Resources Development Report, 1989

- 142 -
Table 5: PER CAPITA HOUSEHOLD INCOMES BY INCOMEDECILES PENINSULAR MALAYSIA : 1987
(RINGGIT PER YEAR)
INCOMEPERCENTILE
(%) OVERALL MALAY CHINESE INDIAN
1 - 10 510 433 875 596
11 - 20 845 704 1,327 906
21 - 30 1,110 915 1,673 1,120
31 - 40 1,388 1,134 2,022 1.337
41 - 50 1,708 1,390 2,413 1,601
51 - 60 2,089 1,706 2,909 1,927
61 - 70 2,592 2,112 3,579 2,370
71 - 80 3,355 2,715 4,478 3,028
81 - 90 4,610 3,798 5,953 4,212
91 - 100 9,415 7,564 11,957 9.353
1 - 100 2,761 2,246 3,715 2,640
Source: Economic Planning UnitHuman Resources Development Report

- 143 -
Table 6: SELECTED SOCIO-ECONOMIC INDICATORS
1970 1975 1980 1985 1987
PRIMARY SCHOOL
ENROLMENT RATIO a/ 88.2 96.0 93.6 95.4 97.1
PUPIL/TEACHER RATIO(PRIMARY AND SECONDARY LEVEL) 28.9 30.5 26.5 23.4 21.5
NUMBER OF GOVERNMENTHOSPITALS AND CLINICS 359 451 1,042 1,282 1,320
POPULATION PER DOCTOR 4,234 4,650 3,800 3,174 2.853
CRUDE BIRTH RATE(PER 1000 POPULATION) 32.4 30.7 30.9 31.9 29.5
CRUDE DEATH RATE D(PER 1000 POPULATION) 6.7 6.0 5.3 5.0 4.7
INFANT MORTALITY RATE(PER 1000 LIVE BIRTHS) 39.39 32.14 23.85 16.45 15.24
LIFE EXPECTANCY(AGE IN YEARS)
MALES 61.6 64.3 66.4 67.7 68.4
FEMALES 65.6 68.7 70.5 72.4 73.0
a/ Primary school enrollment as a percent of primary school-age population,i.e., 6-11 years.
Source: Economic Report, 1988-89, Ministry of Finance, Government-of Malaysia
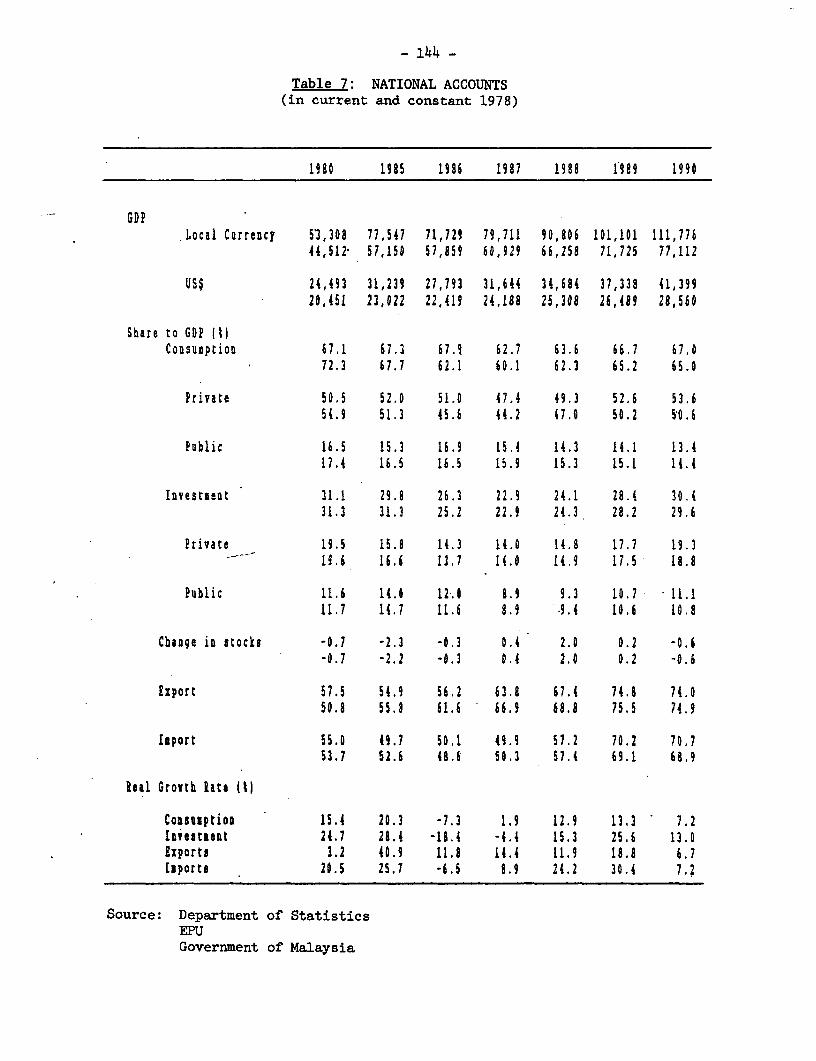
- 144 -
Table 7: NATIONAL ACCOUNTS(in current and constant 1978)
1980 1985 1986 1987 1988 1989 1990
GDPLocal Carrency 5'3,308 77,547 71,729 79,711 90,806 101,101 111,776
44,512- 57,150 57,859 60,929 66,258 71,725 77,112
US$ 24,493 31,239 27,793 31,644 34,684 37,338 41,39920,451 23,022 22,419 24,188 25,308 26,489 28,560
Share to GOP 1I)Consumption 67.1 67.3 67.9 62.7 63.6 66.7 67.0
72.3 67.7 62.1 60.1 62.3 65.2 65.0
Private 50.5 52.0 51.0 47.4 49.3 52.6 53.654.9 51.3 45.6 44.2 47.0 50.2 50.6
Public 16.5 15.3 16.9 15.4 14.3 14.1 13.417.4 16.5 16.5 15.9 15.3 15.1 14.4
Investient 31.1 29.8 26.3 22.9 24.1 28.4 30.431.3 31.3 25.2 22.9 24.3 28.2 29.6
Private 19.5 15.8 14.3 14.0 14.8 17.7 19.319.6 16.6 13.7 14.0 14.9 11.5 18.8
Public 11.6 14.8 12.0 8.9 9.3 10.7 11.111.7 14.7 11.6 8.9 .9.4 10.6 10.8
Change in stocks -0.7 -2.3 -0.3 0.4 2.0 0.2 -0.6-0.7 -2.2 -0.3 0.4 2.0 0.2 -0.6
Export 57.5 54.9 56.2 63.8 67.4 74.8 74.050.8 55.8 61.6 66.9 68.A 75.5 74.9
Isport 55.0 49.7 50.1 49.9 57.2 70.2 70.753.7 52.6 48.6 50.3 57.4 69.1 68.9
Real Grovth late (tl
Consuiption 15.4 20.3 -7.3 1.9 12.9 13.3 7.2Investient 24.7 28.4 -18.4 -4.4 15.3 25.6 13.0Esports 3.2 40.9 11.8 11.4 11.9 18.8 6.7Importo 20.5 25.7 -6.5 8.9 21.2 30.4 7.2
Source: Department of StatisticsEPUGovernment of Malaysia

Table 8: INCENTIVE INDICATORS PRICES
…-----------------------------------------------------------------------__---__----------------
1980 1985 1986 1987 1988 1989 199Of------------------------------------------------------------------ __---------__----------------
Inflation Rate 6.7 0.4 0.6 0.8 2.5 2.8 3.8
Real Effective Exchange Rate(1980=100) 100.0 115.2 93.8 86.8 78.3 75.8 n.a
Index Real Wages X 100 133.7 138.2 137.4 132.1 134.7 136.5(1980=100)
Real Interest rate * 3.5 7.8 8.55 2.38 1.86 2.43 2.43@
Real EffectiveInterest Rate - - - - - -
Ratio: Domestic toForeign Energy Price
- Gasoline - - - - - -
- Others - - - - - - -
Unemployment Rate 5.6 6.9 8.3 8.2 8.1 7.9 7.6…--------------------------------------------------------------------__------__----------------
f Projected@ Jan-February 1990* Monthly average wage per paid employee
** Based on 3 months inter bank rate minus inflation raten.a Not available
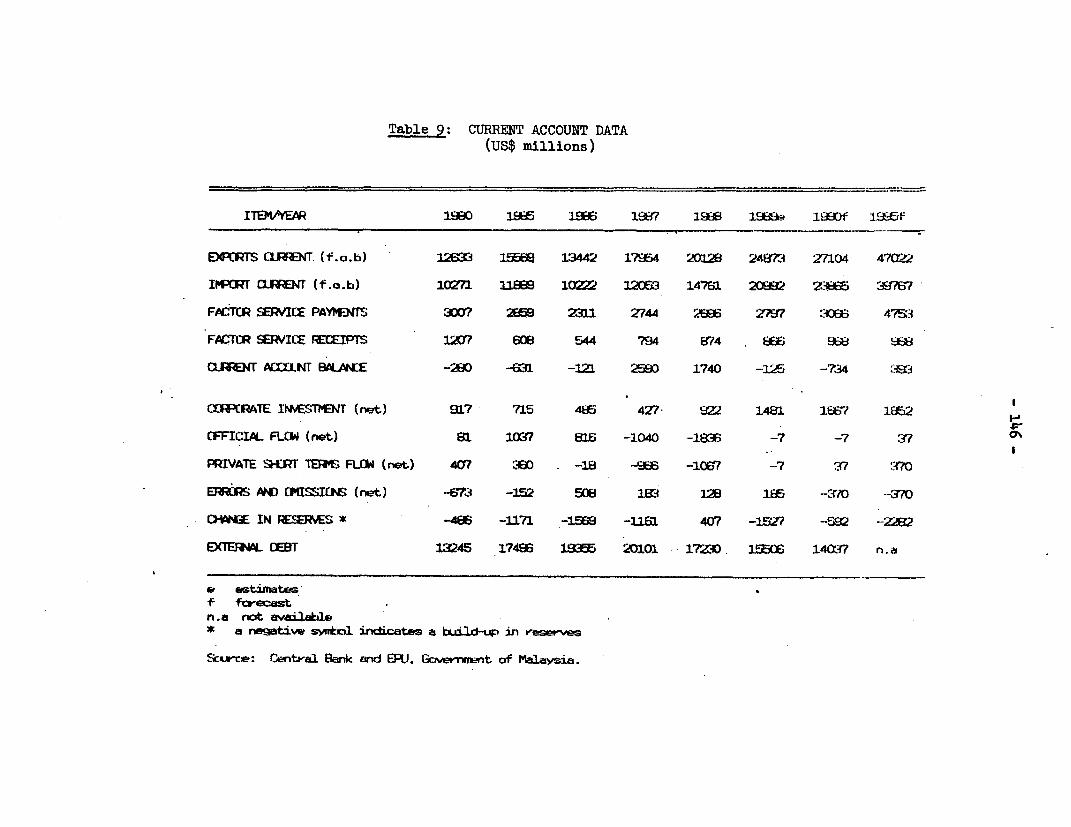
Table 9: CURRENT ACCOUNT DATA(US$ millions)
ITEKWR Em SE W 1990 lii 987 lEafE 1'EEK)f I.U@£if
EXPRTS ClfJNT. (f.a. b) 12ECi 1EEj 13442 17?54 2O13 2461?3 27104 47022
IMPfWT QJPNr (f.o.b) 10271 1189 l0YZ 12053 14761 *F&;5 397tS
FACT.R 5ERICE PAYMTS 3007 2EE5 231 2744 2Ei 2797 ::0 475.3
FACTCR SERVICE fE:IPTS 1207 G08 544 794 874 ; i 96B
CIF*NT ACIXLNT B ALACE -2(0 -E1 -12! 2cj0 1740 -l'FFi -7i34
CU~RATE IINESTMENT (net) 917 715 496 427 TZ2 1481 lE,7 18E52
(FFICIAL FLOI (net) e1 l(X? 816 -1040 -lis -7 -7 37i
PRIVATE %{RT 1EE; FLCO (net) 407 C*X) . -18 -Effi -1067 -7 3.? n o
EJ~RS {A) C"ISSICEI (net) -67z -152 50E3 19 128 1Efi -Cf70 -- 70
C-WNz IN 1ERVS *-486 -171 -1569 -1181 40? -15W7 -592 --22';
EXTERNA DEBT 13245 17496 SE 201013 17Ž30 EIJF 14W7 n.a
C estimatRsf fcrecastn .a not available* a negat4w sMcl in.cates a build-up _n resers
Scurc: Ca3ntral Bar-k and EPJ. G.trv,u:n,t c&f Ma1ay3ia.

- 147 -
COMMENTARY BY FRANK LYSY
First of all, I'd like to thank the conference organizers for theopportunity to comment on this very interesting paper. However, I should notepart of the disclaimer that my knowledge of Malaysia is from a period of the. mid-to late 1970s. I haven't really stayed current on what has been happening inthe 1980s in dealing with Latin America, Venezuela, most recently.
Now, I can't comment on the most recent developments or in mostdetails, but it must be an obvious sign of creeping old age when you can rememberstuff that is at least a decade out of date.
The paper before us I think presents a very good description ofdevelopments in Malaysia over the last two decades, on particularly thegovernment policies, and I think I agree basically with what Dr. Gnanathurai hasbeen saying. There is very little to quibble with. Instead, what I want to dois focus my remarks on the Malaysia case itself and particularly the long-termgrowth record of Malaysia over the last two decades. I think there's a lot thatcan be learned from this and I would recommend a similar type of analysis forother fast-growing economies in East Asia.
The purpose of the conference is global prospects; I mean, what maybe happening in the 1990s. But I think before you can project into the future,we should more or less try to understand what has been happening in the past andwhen you look at the record of Malaysia, I would come to the conclusion that aseconomists, we really don't know very much of what has worked in the past or why.We know very little about these long-run determinants of growth.
The growth record in Malaysia itself I think has been excellent inall respects. The figures I'll be citing are from some World Bank data. Theydiffer from, like most countries in the world, from some of the data courses,from national sources of the IMF or the UN and so on, but I think in the thrustit's basically the same. First of all, the long-term growth record has been thatover about three decades, 1960 to '89, they have had an average growth of GDPof 6.6 percent a year, 6.6 percent a year for 290 years means something grossfrom a one to a factor of 6.4, with population growth around 2.6 percent or soaverage during the period. You can work out--the per capita income would startfrom a level which is not too far above what the IDA cutoff is for countries tosomething that is pretty much approaching the IBRD graduation limit, all withina period of three decades or so.
That's a very impressive record. What I find even more surprisingis the steadiness of the growth. Over the 18 years where I had detailed data,the overall growth was also 6.6 percent, but they had only four years within thatperiod where the growth was less than 5.8 percent. Now, one of those was thegrowth of 5.7 percent--I mean 5.3 percent--I'm sorry, which I would not discount;and the other three years as Dr. Gnanathurai said, was in 1975, when it was .8percent, 85 and 86 when there was a recession. But except for those three years,basically, there has been an amazing long-term growth record over a period ofmore than two decades.
- 148 -
Also during this period, inflation has been very, very low. I speakto this coming from Latin America, but the domestic absorption deflator duringthis period grew at a rate of 4.4 percent over this period 1971 to '88, and itwas only four years where there was more than five and a half percent. And I
think the peak was 10.8 percent in 1973 or '74. It's also very low.
Such a growth record with this high average, very little volatility,low inflation, would be the envy of almost any country in the world, especiallyLatin America, and it's something I think we should try to explain. Now,
Malaysia specialists in general focus on what went wrong, and that's rightlyso; I mean, they can complain about the recession in '85-'86, but in the long
term perspective, it's still an extremely impressive record. I think of all the
countries that one might compare it to it may be matched only by perhaps
Singapore, it's neighbor. Higher growth in a few other countries in East Asialike Korea and Taiwan was also accompanied by greater volatility, higher
inflation. Even Japan had a lower growth rate.
Now, there were some problems, of course. There were the imbalances
that started to build in the early 1980s, '81 to '83, when the current accountdeficit went to over 10 percent of GDP. This culminated in an '85-'86 recessionthat it seems to be coming out of that now. But the question now that I'd liketo pose is why? Why did we get such a record?
If the record had been a poor one, I think we would have a lot ofreasons to explain why there was a poor record. You could start with commoditydependence. The terms of trade have been very volatile, so that over the period
'71 to '88, they've risen or fallen in some years by more than 8 percent.
Now, with exports starting at roughly 40 percent of GDP in the early70s growing to 74 percent by '89, these terms of trade changes have a very majorimpact on real national income, and if you look at the terms of trade adjustment,the amount that has changed in any year is added or subtracted to GDP by anamount that, in terms of the year to year changes, is more than 4 percent of GDP
for 9 out of the 18 years. These are very big shocks for any economy, and yetthey seem to have absorbed it without a whole lot of difficulty for some reasons.
Another excuse you might use is the fluctuating export growth ratesthemselves, with exports forming such a large share of GDP. That growth was morethan 10 percent per year in 11 out of those 19 years, and less than 2 percentin five out of the 19 years. So the fluctuations year to year, positive orminus, were very large. Yet, a similar thing with import growth. Nine out ofthe 19 years, it grew by more than 10 percent; it was negative in five out ofthe 19 years.
Fixed investment growth also showed a lot of volatility. The fixedinvestment share of GDP as a whole was not especially high for most of theperiod; it was around 22 to 26 percent. It was higher in the early 1980s to mid-1980s, which were the years of the deficits. What we found was that growthdidn't go higher; rather, the ICORs we calculated went higher and this culminatedinto the recession in '85-'86, and in a certain way it is not sustainable; you
- 149 -
can't really say the higher investment share helped growth. Savings alsofluctuated by enormous amounts year to year.
In addition, on the government itself, most of the basic theologyis that government deficits are very bad. If you look in the case of Malaysia,using some World Bank data, the government deficit, the overall public sectordeficit, was more than 5 percent of GDP in 15 out of 17 years. It was more than10 percent of GDP in four years out of those 17. Normally, we would say thatthe long run sustainable deficit would be far below this 5 percent, and yetMalaysia seems to have absorbed it pretty well.
There has been a large government in general. If you look at totalgovernment expenditures, they have been on the order of 25 to 43 percent of GDPduring this period. If you have advocates of larger governments or smallergovernments, you could probably find evidence supporting both opinions. In thecase of Malaysia, the government share was growing from the early 1970s to about1982; it has been falling from '82 until recently.
The deficits were clearly excessive in the period 1981-83 and ledto this recession in 1985-86 but it was really more the deficits, if you wantto blame anything than the size of government, I would say.
One would then ask, well, if you have large deficits won't you gethigh inflation and, of course, the answer is no. Inflation was low at 4.4percent a year. Money growth has been extremely rapid. It averaged 16 percenta year from 1971 to '88, obviously rising as a share of GDP as a result; and yet,with such a rapid growth of the money supply, inflation has been very moderate,one of the best records in the world.
Racial divisiveness could also be an area to blame. If growth hadbeen poor, you would say, well, the racial communities have led to divisionsand that's going to lead to problems. As the author knows, the Malays dominatein the government; the Chinese in trade, finance and industry, and since theearly 1970s, sparked by the ethnic riots in 1969, the government has followedstrong policies to promote the Malays and other indigenous groups. This hasbeen controversial, as the paper notes, and it led to a case where really theincome disparities among Malays were higher than among the other ethnics groups,as many of these policies were really helping people at the top end of thedistribution rather than more at the bottom end. I somewhat argue that thepolicies led to less investment by the Chinese and the private sector; you cannotsay the government was really pro private sector in a very strong sense, andyet the overall growth again, as I say, was quite strong, despite what one mighttry to blame here.
Finally, there is also government intervention, the topic of thisparticular session. The idea that government intervention isn't as bad forgrowth; it is not supported by the evidence here; the government has beenextremely interventionistic at times, but more recently, there has been a widelyheralded program of privatization which has reduced the scope of the publicsector.

- 150 -
They have had a very interventionist trade policy; and yet again,you have this very good growth record. You could probably go on but the pointis I really don't think that we have a very good explanation of understandingwhy you got this very good growth record despite what on the surface would seemlike a lot of problems for most countries.
Now, trade policy, I think, is obviously part of the answer. Theexport volume growth during the period was 8.4 percent on average which alloweda higher import growth rate of 8.3 percent, with GDP growth of 6.6 percent. Thatwas certainly important, but the question is really more cause and effect: didthe export growth lead to the higher GDP growth or did something else really leadto the growth of both of them, of exports and GDP?
The trade policy, as I said, was interventionist; they had importssubstituting at times; it was not laissez-faire. But I think the bestexplanation is really on the first page of Dr. Gnanathurai's paper. It says thegrowth may be traced to the pragmatic and flexible policies implemented by thegovernment. But even this is pretty limited. So I would end with the--I believethat we should really look more at what has been working in the past before westart worrying too much about trying to figure what is going to be happening overthe next decade.

THE PHILIPPINE ECONONY IN 1990:RECOVERY AND RESTORATION
Manuel Nontes
With comentary by Rob Vos

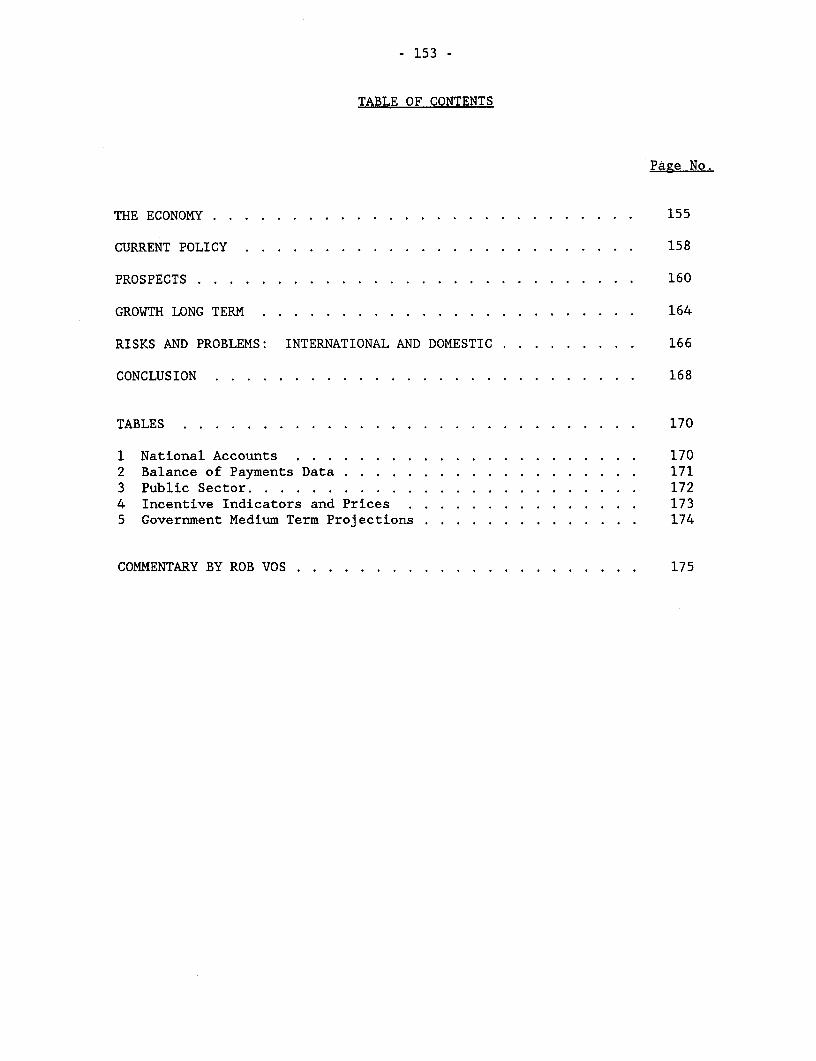
- 153 -
TABLE OF CONTENTS
Page No.
THE ECONOMY .... . . . . . . . . ..... . . . . . . . . . . 155
CURRENT POLICY . . . . . . . . . . . . . . . . . . . . . . . . . 158
PROSPECTS .... . . . . . . . . ..... . . . . . . . . . . . 160
GROWTH LONG TERM .... . . . . . . ..... . . . . . . . . . 164
RISKS AND PROBLEMS: INTERNATIONAL AND DOMESTIC . . . . . . . . . 166
CONCLUSION . . . . . . . . . . . . . . . . . . . . . . . . . . . 168
TABLES .... . . . . . . . . . . . . . . . . . . . . . . . . . 170
1 National Accounts .... . . . . . . . . . . . . . . . . . . 1702 Balance of Payments Data ... . . . . . . . . . . . . . . . . 1713 Public Sector . . . . . . . . . . . . . . . . . . . . . . . . . 1724 Incentive Indicators and Prices . . . . . . . . . . . . . . . 1735 Government Medium Term Projections . . . . . . . . . . . . . . 174
COMMENTARY BY ROB VOS . . . . . . . . . . . 175


- 155 -
Before the 1 December 1989 putsch, few professional observers wouldhave claimed that the Philippines' immediate economic prospects were anythingbut positive. The failed coup, however, appears to have jeopardized the nation'seconomic prospects.
This paper attempts to explain this paradox. The causes of theinstability of the economy are long-term problems of efficiency of the economyand the empowerment of the many. These basic problems can be hidden from viewas long as adequate foreign financing is available and a minimum degree ofcohesion prevails among the leading families in Philippine society.i/ TheDecember 1989 coup directs attention to a breakdown in ruling group cohesion.The upcoming difficulties in meeting the targets of the IMF Extended FundFacility program point to potential problems in maintaining foreign financing.
THE ECONOMY
Positive economic developments provided the basis for the optimismbefore December 1989. From the change in government in 1986 until 1989, thePhilippine economy exhibited annual growth of about 5 percent (Table 1).Merchandise exports grew from just below 14 percent of GNP in 1985 to almost 20percent of GNP in 1989. (Data on the balance of payments are given in Table 2.)
This growth was achieved with a relatively normal mode of servicing offoreign debt, which represented 33 percent of exports and 44 percent of nationalgovernment expenditures. There was a net resources outflow of 5 percent of GNPand some threat of an increase in international interest rates in 1988.
Between February 1986 and December 1989, the commercial bank debt wasrenegotiated twice. In the March 1987 negotiation, the Philippines chose notto bring up the question of new money with the commercial banks, even though thiswould have been consistent with the thrust of the Baker Plan. By December 1989,a new IMF Extended Fund Facility had been running for five months and, withinthis framework, a second set of negotiations had been completed on commercialbank debt in October 1989. In the latest commercial renegotiation, there wereindications of at least US$600 million of new money to be contributed by theprivate international banks. One Philippine observer noted in October 1989 that
1/ Gustav Ranis, who has a long involvement in Philippine economic reformefforts, discusses many of the connections between foreign financing andthe feasibility of reforms in a non-country-specific setting. See GustavRanis, "Adjustment, Growth and Debt-Fatigue: Can the Case-by-Case andGlobal Approaches Be Combined?" International Center for Economic Growth,Occasional Paper No. 17, August 1989.
- 156 -
the Philippines was on the threshold of a normalization of relations with thecommercial banks.2/
The level of net foreign direct investment increased sixfold to aboutUS$0.75 billion between 1986 and 1989 (Table 2). The country was being toutedas a recipient of a part of the large international capital flows in the regionthat began in 1986. In addition, there apparently was a reflow of capital flightfunds back into the country in 1987 and 1988; a recent IMF report estimatesreflow at about US$1 billion.
Development assistance commitments to the Philippines increased whenJapan's official development assistance (ODA) capabilities began to multiply in1985; after a brief period of hesitation in 1986, governments and multilateralsrushed to associate themselves with the Aquino government. Philippine governmentconsumption expenditures were boosted significantly in 1987 and 1988 (Table 1),and provided the basis for consumption-led growth made feasible by the unutilizedindustrial capacity left over from the 1984-86 stabilization period. Aconsortium for a "Multilateral Aid Initiative" to the Philippines was inauguratedwith great fanfare in early July 1989.
The country's ODA commitments were received in the context of aliberalization-inspired economic reform program. Marcos government interventionsthat had supported agricultural monopolies in sugar and coconut ended afterAquino took office. (The milling capacity in these industries has remainedconcentrated in essentially the same private hands.)
Although the World Bank has classified the Philippine trade regime asmoderately inward looking, the country has been implementing a wide-ranging tradeliberalization program since 1980, beginning in the last five years of the Marcosadministration. This program was suspended during the balance of payments crisisof 1984-85, but the Aquino government, immediately after the takeover, restartedthe program.
The new government cut the average tariff rate from 43 percent to 28percent, the maximum tariff rate from 100 percent to 50 percent, and the numberof categories from seven to six. If one were analyzing the issue in terms ofthe number of items liberalized, there was a rather rapid removal of importrestrictions during the first years of the new government: 1,229 items between1986 and April 1988, an additional 94 items in December 1988, an additional 63items by July 1989, and another 30 items in September 1989.
International oil prices actually declined in late 1987 and in 1988,permitting three rollbacks of retail prices in 1988. Prices of coconut productsrecovered from 1986 and remained high through 1989. The country benefited froman increase in the U.S. sugar quota.
2/ See Robert S. Dohner, "Philippine External Debt: Burdens, Possibilitiesand Prospects," Asian Update, The Asia Society, October 1989.
- 157 -
Those who took a longer term view, or whose progressive bent focusedmore on the distributional basis of the recovery, have not shared these reasonsfor optimism.
The Philippine economy has always managed to grow when the terms oftrade have been favorable; in 1986-88, terms of trade from oil and the country'sexports were favorable. Based on a recent IMF country report, the Philippines'terms of trade improved by 52.2 percent between end-1984 and end-1988 and thendeclined by 6.9 percent in 1989. During the years of recovery in 1987 and 1988,the current account deficit remained steady at about 1 percent of GNP; in 1989,however, the deficit increased to almost 4 percent of GNP.
The economy has always grown when tremendous foreign resources havebeen available to the government. The peculiar intensity of the recent recoverywas made possible by the unutilized individual capacity from 1986, a factor thatcannot be considered a permanent fixture.
The foreign direct investment performance has been heavily conditionedon the debt-to-equity program, suspended in 1989 to avoid injecting too muchliquidity in the system. At least 60 percent of the new foreign investmentappears to have been through the debt-to-equity program, which will be restartedunder the IMF's Extended Fund Facility. The issue remains whether a flow offoreign investment that genuinely improves outward orientation can be sustainedwithout the debt-to-equity program and other costly incentives programs. Thenew Omnibus Investment Incentives Act increases the capability of the governmentto limit entry into industrial sectors.
The net resource transfer from the debt problem continues. Before theExtended Fund Facility of June 1989, international reserves had been drawn tobelow two months of imports. Even if the new money were to reach US$700 million,financing would be inadequate as early as the last quarter of 1990. One can nowexpect the private commercial creditors to seek ways to postpone the actualremittance of the new money commitment. The trade deficit took a quantum leapfrom US$1,085 in 1988 to US$2,365 million in 1989.
Import liberalization was carried out in economic sectors with weakpolitical standing, and it has not yet been attempted in politically powerfulsectors. Imports of agricultural products were liberalized (imported apples,for example, often retail for less than Philippine mangoes). Tariff cuts,carried over from the Marcos regime, were deeper in the agricultural sector thanin other sectors; the average tariff cut for agriculture was 36 percent and forindustry, 17 percent.3/ Yet government-supported oligopolies in sectorsdominated by government supporters, such as flour and commercial banking,continue to operate. The domestic car manufacturing program, this time withJapanese instead of American participants, has been reestablished.
ii See Ramon L. Clarete, "The Economic Effects of Trade Liberalization ofPhilippine Agriculture," School of Economics, University of the Philippines,1989.
- 158 -
Significant additional foreign financing from the Multilateral AidInitiative has not materialized. The Philippine side of the process, dominatedby business interests in line with the preference of the administration, has hada difficult time identifying new projects that can be financed through theInitiative. The Initiative itself does not embody a new modality in terms offinancing. Cumbersome and bureaucratic restrictions imposed by donors have notresulted in a better flow per period than before the Initiative.
Inflation increased from practically zero in 1986 to 10.6 percent in1989. The 1990 IMF program target for the inflation rate for 1990 is 8 percent,a target that is unlikely to be met with current inflation running at over 12percent. The Philippines missed the chance to adjust its exchange rate to a morecompetitive level in 1988, when crude oil prices were falling. Instead thegovernment opted to increase growth by lowering domestic retail prices. Thegovernment now faces the dilemma that a devaluation and the adjustment of retailoil prices will worsen inflation.
The bad news continues. There is an electric power shortage in themetropolitan Manila area because the government failed to carry out the necessaryenergy upgrading program two years ago. Moreover, it appears that thePhilippines has once again squandered a period of favorable terms of tradethrough rapid growth, burgeoning trade deficits, and largely symbolic economicreform.
The country's long-term economic dilemmas have usually surfaced firstas political disagreements. If expressed vigorously enough, these disagreementshave reduced private investment (including foreign investment), provoked capitalflight, run up imports, and halted the growth process. (That politicaldisagreements have often precipitated economic crises has absolved inadequaciesin technically based analyses of the economy.) The December 1989 putsch, in asomewhat less intense way than the assassination of Aquino's husband in 1983,has provided such a spark.
The dispute in the Philippines at present is over opening, throughpolitical means, Pandora's box of troubles, thus releasing the long-term economicdilemmas of the country and halting the recovery. The Aquino government's stanceis understandable: keep the lid on. Government pronouncements emphasize thatprogress has been made since 1986 and that progress is continuing; the same typeof pronouncements were made by the Marcos government after 1981. Those who seekto open Pandora's box simply want to open it for political ends because of thenature of their constituency. If the experience of the past few years is anyindication, there is little basis for optimisim that the opposition will, or can,deal more forthrightly with these dilemmas.
CURRENT POLICY
The question of "policy" is the question of what the government isdoing. Whether the activities of the private sector actually correspond to theexpected response to government policy is another matter.
- 159 -
Sufficient foreign finance since 1986 and good export performance in1987-88 have permitted an intemperate fiscal stance to be combined with aconservative monetary stance. The conservative monetary stance is reflected innominal interest rates that have been maintained at 12 percent a year or moreto keep the peso from weakening (while maintaining foreign debt service) and tofulfill IMF program targets. (Table 4 contains data on the real exchange rateand on real interest rates.) The intemperate fiscal stance, reflected in aburgeoning budget deficit and growing current expenditures, emanates from thegovernment's inability to lessen the heavy demands of debt service,infrastructure maintenance, and social expenditures. (Table 3 summarizes keydata on the public sector.) There have been delays and failures to replacerevenues lost from the tariff reduction, to jettison public enterprises, and toimprove revenues from direct taxation. As the moral influence of theadministration weakens, its ability to deal with these imperatives diminishes.
The private sector has responded to the government stance with a boomin residential and commercial construction principally in the Manila area.Taiwanese investment and competition among large business conglomerates havefueled this boom, which has been sustained so far by the bidding up of landprices and rents. The risk is the private sector's, which means that in adownturn the costs will not result, as they did in the Marcos era, in a bloatedset of public enterprises arising from government guarantees on foreignborrowing.
There has been general agreement, however, that a shift from build-and-sell investment toward enterprise-oriented investment is needed if growthis to be sustained and the 800,000 new entrants to the labor market every yearare to be absorbed in the domestic economy. Such an investment profile isunfortunately not likely for the following reasons.
First, uncertainties in the agrarian reform program continue todiscourage agricultural investment. This problem should not be interpreted asan argument against agrarian reform, since the government itself has proclaimedagrarian reform to be the "centerpiece" of its economic program. An unambiguous,government-expedited program will not cause as much uncertainty as a half-hearted, protracted program. Recent guidelines exempt landlords from agrarianreform if they can demonstrate that they can utilize the land for higher valuethan if the land were redistributed.A/ Proving that such a higher value useexists will be complicated and will be resisted by affected tenants.
Second, although the government has been more eloquent than othergovernments in the region about how welcome foreign investment is, Board ofInvestment regulation has made genuinely new investment from abroad practicallyimpossible. As pointed out earlier, a large proportion of foreign investmenthas utilized the debt-to-equity swap route; indeed, most investment is bycompanies that already have business relationships in the country.
§/ These guidelines were necessitated by the industrial estate program of theDepartment of Trade and Industry. They were inspired by the agrarian reformprogram at the Hacienda Luisita, owned by the president's family.

- 160 -
Third, the trade liberalization program has lessened protection ofsectors with the greatest prospects for growth (say, processed foods andgarments) and increased the protection of sectors characterized by inefficientproduction. Based on a neoclassical model, static gains can still bedemonstrated from the crazy-quilt trade liberalization program.j/ However, therestructuring of enterprises and industries through investment (both fromdomestic and foreign sources) is more critical. The resulting structure ofprotection is not supportive of such investment because of the uncertaintygenerated by the uncompleted liberalization program and the inconsistencies inthe current structure of protection.
Fourth, the conservative monetary stance and the cartelized financialsystem, while able to support real-estate-oriented investment, are inconsistentwith overall industrial restructuring. The high cost of formal financing meansthat the necessary financial resources have not been available to respond tochanges in the structure of protection. With the recent decline in terms oftrade and greater dependence on an IMF style of macro-management, an even morerestrictive monetary stance is likely. In the last week of March 1990, reserverequirements were raised by 1 percentage point for commercial banks and the primerate increased to 24 percent in order to meet test-period targets for the IMFprogram review.
PROSPECTS
In the long term, the Philippines has structural economic problems thatmust be addressed by domestic actors. In the immediate period, as long aspolitical instability does not disrupt foreign financing, economic growth (ho-hum by Asian standards but notable by debt-distressed economy standards) islikely.
The Aquino administration forecasts a real rate of growth of 5.5percent for 1990,§/ a rate in the same order as that for 1989, 5.6 percent. Theforecasted rate of growth is lower than the 6.5 percent specified in the medium-term development plan, and it is based on a fall in the growth rate of fixedinvestment from 19.8 percent in 1989 to 11.6 percent in 1990. With tightermonetary policy in 1990, it is not likely that growth in 1989 will be matched.Tighter monetary policy and faster inflation in 1990 will constrict consumercredit and dampen export performance.
5/ See Clarete, 'Economic Effects of Trade Liberalization," 1989.
§./ See, for example, Barbara E. Palacios, "Summary Outlook for the PhilippineEconomy: 1990-1994," paper prepared for the Spring Meeting of Project Link,New York, 7-9 March 1990. For a somewhat less sanguine assessment, thoughbased on an equivalent GNP growth rate, see Josef T. Rap, "The Philippines:Recent Performance, Prospects for 1990-91, and Policy and DevelopmentIssues," Working Paper Series No. 90-01, Philippine Institute forDevelopment Studies, January 1990.

- 161 -
An expectation of a rate of growth of 4 percent is unduly pessimistic,unless one were implicitly assuming major political disruptions in 1990. In theurban areas, construction projects are in midstream and will be completed;foreign inflows impelled by real estate interests continue. Assuming thatdisruptive political events do not occur in 1989, 5 percent growth, based on a12 percent investment growth rate and a 5.2 percent growth in consumption, isa reasonable expectation. The lower growth will reduce the growth rate ofimports, but the trade deficit will still increase because of the slowdown inexports.
However, an unconstitutional attempt to change the government in 1990is quite likely. If it does not succeed and the Aquino government stays inpower, 5 percent growth is feasible. Even if it does succeed, the level ofdisruption does not have to be significant. The "retribution" cannot be muchmore than that during the Aquino takeover, which was mild and mostly carried outby various units of the U.S. government.
The forces that pose an immediate threat to the Aquino governmentprobably will support an economic program that is not significantly differentfrom that espoused by the Aquino administration, and they will seek to normalizethe atmosphere for investment as rapidly as possible. Unless the oppositionforces are patently more sincere about economic reform than the Aquino governmentwas,2/ the disruption of a takeover does not have to be pervasive.A/
There will still be a period of adjustment in the year that such atakeover occurs. Depending on the actual month of the year, growth can beexpected to fall between 3 and 4 percent.
The question of debt service will present the most immediate economicobstacle to sustaining the growth that has occurred since 1986, now that excessdomestic capacity has been spent and the trend in the terms of trade has turnednegative. At least US$600 million in additional financing needs to be identifiedfor 1990 if the economy is to grow at the 5 percent rate.2/ Even more important,the commercial banks must release their already committed US$700 million on atimely basis. If the economy manages to advance by 5 percent in 1990, theproblem of raising the needed financing for 1991 becomes more difficult than if1990 were a year of lower growth.
1/ The sincerity of the Aquino government's reform intentions were immediatelyput to doubt when it forecasted growth of 6.5 percent per year from 1987on.
.t./ There may be crackdowns and arrests in the labor unions and cause-orientedgroups, as occurred when martial law was imposed in 1972, but these actionsshould not have a significant impact on economic performance in 1990-91.
.2/ A calculation based on a gap-analysis is made in Manual F. Montes, JosephY. Lim, and Ma. Agnes R. Quisumbing, "The Possibilities of SustainableGrowth in the Philippines: A Three Gap Analysis," Working Paper, Schoolof Economics, University of the Philippines, January 1990.

- 162 -
Both the possibility of release of committed new money and theavailability of additional financing in 1990 will depend upon the accommodationprovided by the IMF under the current EFF program. A review is scheduled forthe first week of April 1990.
There is considerable evidence that the government will not be able tofulfill the fiscal targets under the EFF program. It is said in Asia that thePhilippines has been too sophisticated, compared with "simpler" countries suchas Thailand, for its own good. An understanding of the sophistication with whichthe Philippines is meeting and not meeting the fiscal targets under the EFFprogram provides insight into the elaborate patron-client relationship that everyPhilippine government has managed to develop with the IMF.
From 1985 to 1987, the consolidated public sector deficit fell due tothe overall recovery in the economy and the relative constancy of the dollarvalue of the peso. Both of these factors improved the cash position of the largepublic corporations (called the "fourteen monitored public corporations"). Inaddition, the asset restructuring of the two large financial corporations, thePhilippine National Bank (PNB) and the Development Bank of the Philippines (DBP),substantially improved the profitability of these financial institutions, thoughthe future costs of the debt obligations on their nonperforming assets weretransferred to the national treasury. Because of mandatory capital investmentsin energy and other utilities, the deficits of these large public corporationsbegan to increase again in 1988.
The increase in the national government deficit in 1986 was the resultof the increase in the debt service payments of the treasury on the debt thatit had accepted from PNB and DBP and of direct support for other governmentcorporations given in that year. This support was reduced in 1987 as theeconomic recovery improved the cash performance of these corporations. However,the government deficit stayed at around 3 percent of GNP because fiscalperformance worsened in 1988, the first year of the value added tax, and becausecollections in income taxes levelled off. The present EFF program seeks tomaintain the national government deficit at around the same level, whilenecessary capital expenditures and proportional increases in maintenance andsocial expenditures are carried out. The key to attaining this objective isimproved cost recovery in the public utilities and improved tax administration.
In 1989, with the EFF program in place, performance in the nationalgovernment worsened because of losses from the oil price stabilization fund,amounting to about 0.8 percent of GNP (due to inadequate adjustment of domesticoil prices to world crude oil prices), and the increase in government salarycosts under the compensation standardization program.
Moreover, the overall public sector deficit includes not only thedeficit of the public corporations and the national government but also thedeficit of the Central Bank, which amounts to about 2.5 percent of GNP. TheCentral Bank's deficit arises from interest payments on obligations andrepurchases of these obligations that were sold in 1982-84 during the IMFstabilization program. These obligations permitted the Central Bank to sterilize

- 163 -
cash and meet liquidity ceilings under the program, at the cost of paying highrates of interest. A precipitous reduction of these obligations (now being heldmainly as cash deposits of the national government with the Central Bank) will
have a large liquidity impact. In short, the national government earns intereston its Central Bank deposits (which helps reduce the treasury's deficit), butthe Central Bank deficit originates from these interest payments.
Although the public sector deficit is significant (though not large by
the standards of other indebted countries), the government's policy is rather
conservative because of the unutilized deposits of the national government withthe Central Bank. In the case of the national government alone, interestpayments on debt constitute 44 percent of the national government budget. Thekind of fiscal adjustment that appears to be required is not so much an overall
reduction in the claims of the government on the economy but a redistributionof these claims so that domestic interest rates can be lowered.
The fiscal targets in the EFF program, while not easy to attain, do not
involve abrupt, discontinuous changes. They involve many little reforms in abroad set of areas such as energy pricing, cash generation of public enterprises,
reduction of interest the Central Bank pays on government deposits, and
improvements in tax administration. A sophisticated government should be ableto achieve a success rate of at least 75 percent.
The government fell far short of the targets for the public sectordeficit for 1989; instead of declining, the overall deficit actually increased.The government has asked for a rather drastic postponement of the deadlines for
meeting the targets of the program.
The prolific actions by the Aquino government, including the abruptincrease in reserve requirements in recent weeks, are not consistent with the
basic premise of the EFF program - namely, that the government move towardgenerating a surplus (over and above the surplus already implicit due to thelarge portion of the budget devoted to debt service) and leave the freedresources for the "private sector" to utilize. One might disagree with thisbasic premise, or with the details on how to achieve it, but the Aquinogovernment publicly accepted the objective and designed the details. So far ithas carried out numerous evasive maneuvers not to attain it, except in form.
There is, of course, the standard resistance from consumer and laborunion groups to fiscal measures that increase public utility rates. These groupsrepresent mostly propertyless citizens who are attempting to maintain theirstandard of living relative to the other groups in Philippine society who havebenefited from the run-up in the value of their assets.
However, the greatest obstacles to genuine fiscal adjustment will beraised by the large private interests affected by the fiscal reforms. Forexample, it will be difficult to reduce the Central Bank deficit through interestreduction because such a move will require a faster devaluation of the peso inthe face of insufficient net foreign financing and export growth. Faster pesodevaluation is something that the large industrial interests cannot accept.The high rates of interest on government bills have provided steady and high
- 164 -
profits to the cartelized private banking sector, which must be kept indifferentabout whether its returns are obtained from exchange devaluation or from highinterest on peso-receivables.
The IMF, meanwhile, is in a difficult position. If it backs off fromsupporting the government's economic program, it risks accepting responsibilityfor throwing the recovery into reverse. How can it "nickel-and-dime" the fiscalprogram of a government that is basically taking a conservative stance, a stancethat originates from the private sector's sincere aversion to devaluing thecurrency?
A decision by the IMF to suspend the EFF program will seriously affectcapital flight and investment. The probability is very high that there will besome period of suspense (but not suspension) in relation with the IMF in 1990as the pretext is worked out for the nonattainment of targets. As explainedearlier, there are enough grounds to make the proverbial "judgment call" andcontinue the liberalization-inspired programs with the IMF and the World Bank.
Barring a breakdown in the relationship with the IMF, an annual rateof growth of 5 percent in 1990 and 1991 is a reasonable expectation. Growth willbe slower, between 3 and 4 percent, if there is an unconstitutional change ingovernment. A breakdown of relations between the current government and the IMFwill have an effect on economic activity not unlike that an unconstitutionaloverthrow of the Aquino administration might have.
The Aquino government's term of office ends in 1992. If there is nota coup in the meantime, the start-up of the election campaigns in 1991 shouldcreate positive but unsustainable, labor-intensive employment. The growthprospects for 1992 unfortunately depend on political developments: thedisposition of the U.S. bases issue and the nature of that year's elections.If political conditions do not unravel and the terms of trade turn once againin the country's favor, growth in the area of 6 to 7 percent will be possible.
GROWTH LONG TERM
The issue in the long term is whether growth can be accelerated tolevels experienced in the 1970s or to even higher levels so that the country canaspire to newly industrializing status.
The latest medium-term projections by the government show GNP growthrates of 6 percent or more, and GDP growth rates of 7 percent or more for theperiod 1991 to 1994 (Table 5). The external trade numbers in these projectionssuggest that only another turnaround in the terms of trade, plus a strong, steadyflow of net foreign financing, would make these growth rates attainable.
We prefer to think about the issue of growth in the 1990s in this way:With a national savings rate of around 17 percent, growth in the 4 to 5 percentrange is not problematical. Foreign financing has been difficult to obtain oflate, but is becoming less so. However, the levels of net foreign financing,through borrowing, achieved in the 1970s are not realistic in the 1990s.

- 165 -
Nevertheless, foreign financing, including equity investment, if only to theextent that it will permit the investment rate to equal the national savingsrate, is a realistic prospect for the Philippines.
How much growth in the Philippines can accelerate depends on how muchrestructuring the economy can absorb. The extent of restructuring depends, inturn, on the type of economic reforms that can be undertaken and the degree ofpolitical stability during the same period.
At least in the first half of the 1990s, the prospect for foreigninvestment inflows and for growth in manufactured exports will continue to befavorable for the Philippine economy. In such an atmosphere, economic reformscan be quite profitable. Because the Philippines will continue to be engagedwith the multilaterals and with bilateral aid, some type of economic reformprograms will continue. In many instances, reforms will be mandated by externaldevelopments. The issue is the kind of reforms the Philippines will actuallyput in place.
The liberalization agenda has been debated in the Philippines since atleast 1958. The focus has not been on the degree of outward orientation, as ithas been in Korea, but on the extent of government intervention. Politiciansoutside the government have consistently argued that less government is better;those inside it, that some government intervention is unavoidable.
Changes in administration have not materially changed the nature ofintervention, which can best be understood, not in terms of inward versus outwardorientation or more versus less intervention, but in terms of efforts toaccommodate families or groups supportive of the status quo.
When it assumed power in 1986, the Aquino government had to wrestlewith the agenda once again. The economic recovery owes a lot to theliberalization-privatization reforms undertaken by the new government. Tounderstand the current situation and the prospects of the Philippine economy,one must understand the nature of the liberalization-privatization that tookplace.
The Aquino government freed those sectors in the economy that werefettered by political imperatives of the Marcos regime. To make good onguarantees on foreign indebtedness after 1981, the Marcos government had takensignificant equity positions in many debt-distressed corporations; thesecorporations were granted special protection and exemptions so that they couldservice their debt. The government's exercise of power for these purposes wasenormously threatening to the portion of the private sector not explicitly alliedwith the Marcos government. The Aquino government's liberalizations reassuredthis threatened private sector that its traditional role in the moderatelyinward-looking economy would be protected. Without this type of reassurance,the vigorous growth from 1986 on would not have been possible. The nature ofthe liberalization provided its own limits, that it would not threaten thetraditional role of the private sector in the economy.
- 166 -
The problem is that the struggles over liberalization-privatization arepart of the cloth of political instability. A key example is ownership of UnitedCoconut Planters shares in the San Miguel Corporation. The government votesthese shares, which are about 30 percent of the company; this makes the controlof the government doubly attractive since whoever controls the government gainscontrol of corporations such as San Miguel. If the shares are immediatelyprivatized back to their nominal owners, control passes to opponents of theAquino government. This would be against the interests of important supportersof the administration who regained management of San Miguel with a minimalinvestment in 1986. The case is under litigation, with the issue being whetherthe funds used to buy these shares originally came from a public revenue program.
Because liberalization-privatization is part of the substance ofpolitical struggles, these economic reform programs are themselves a source ofuncertainty for investment, as pointed out earlier. From the point of view ofthe private sector, it is reasonable to expect that a change in government willresult in a different set of liberalizations.
RISKS AND PROBLEMS: INTERNATIONAL AND DOMESTIC
The political economy of genuine economic reform in the Philippines istherefore problematical. It would, however, be inaccurate to classify thePhilippine economy as a basket case for the 1990s. Mitigating circumstancesshould permit the country to manage its international economic relationsreasonably well.
As long as the United States continues to have defense interests in thePhilippines, the likelihood is high that the Bretton Woods agencies will beactively engaged with any moderately reformist government. As long as theBretton Woods agencies continue to be involved, the investment ratio probablywill not fall below 17 percent. Growth between 4 and 5 percent will then bepossible. The international debt burden will be an issue, but the Philippinegovernment has said that it will take advantage of whatever standardaccommodations are available in the international market. Bretton Woods supportshould be adequate to contain the risks from the debt. What will be needed isa reasonably equable relationship with the Bretton Woods agencies. For this theartful design and implementation of liberalization reform programs will beindispensable, as in the Marcos years. Continued growth in world trade and inthe Asian economy will provide some impetus to exports and capital inflow to theeconomy.
As in the Marcos years, the overall rate of growth and the overalllevel of financing are not as critical as the components of such growth. Thepotential risks and problems through the first half of the 1990s are as follows:
(a) Growth between 4 and 5 percent is barely sufficient to absorb newentrants to the labor force into the domestic economy. Will thedistribution of investment be sufficiently skewed toward sustainable,labor-intensive activities to absorb these new entrants?

- 167 -
(b) Will investment generate reasonable growth in productivity? (Therecord of the past is dismal.LO/) How will productivity in agriculturebe affected by rural agrarian reform?
(c) If total factor productivity grows, will the gains be shared moreextensively than they were in the past 20 years (through, say, steadyincreases in real wages)?
(d) Can education and basic social services (not necessarily provided bythe public sector in the Philippines) respond to the demands of agrowing population, or will these services become less available as thereal incomes of the majority are eroded?
These items, because they point to the basic issue of empowerment ofthe majority of Filipinos, raise questions about the political sustainabilityof 4 to 5 percent growth. If these issues are not addressed, abrupt variationsin political arrangements may occur. There is the distinct possibility of cyclesbetween authoritarian and "democratic" governments in the 1990s. But whatevergovernment is in power, it must wrestle with the following three problems:11/
(a) The need to install a government bureaucracy that is reasonablyefficient and that can implement genuine liberalizations as part of asocial program rather than as part of an effort motivated by theprivate sector.
The Marcos government was moderately serious about professionalizingthe bureaucracy until the last years of the regime. The Aquinogovernment found itself compelled to exclude from office those taintedby public association with the previous government and those with aknown progressive bent. Consequently it became overly dependent on"nonideological" private sector ("Makati-type") personalities who hadto learn on the job; because of frequent changes in cabinet officials,few stayed long enough to become effective.L2/ An aspiringauthoritarian government will face the same constraints and cannot hopeto be inherently more effective at governance (except, possibly, in the
1_/ See, for example, R. Hooley, Productivity Growth in PhilippineManufacturing: Retrospect and Future Prospects, Philippine Institute forDevelopment Studies, Makati, the Philippines, 1984.
11/ For a discussion of some of these problems from a political science pointof view, see Emmanuel C. Lallana, "Cory Aquino, the Military and PhilippineDemocracy," Working Paper, February 1990.
12/ These officials also learned, from experience, that the operating skillsrequired in the government sector are quite different from those that wouldbe considered effective in a private company.

- 168 -
suppression of unions and street protests) than the Aquino governmenthas been.ia/
(b) The need to regulate the political and economic role of provincialelites (some of whom can be called "warlords").
The authoritarian Marcos government had to accommodate these intereststhrough the formation of a ruling party (the "KBL"). The Aquinogovernment has accommodated these interests through the re-establishment of the Congress. The administration has slowed agrarianreform, restored foreclosed sugar lands, liberalized the export ofcopra, and maintained the high domestic price of sugar. Provincialelites are restive, and many support unconstitutional change. Theauthoritarian-inspired challengers of the Aquino administration willhave to turn against this group if they are to be more effective inimplementing agricultural/rural reforms than either the Marcos or theAquino administrations--an unlikely prospect.
(c) The need to reorient the traditional private sector toward efficientand sustainable investment.
Many of the members of the private sector have roots in the land andcontinue to be important landholders. The survival of their flagshipbusinesses is problematical should the protectionist system begenuinely reformed. Operating from a narrow social base, the Marcosgovernment attempted to create a new set of industrialists by utilizingforeign borrowings as a resource. Under its liberalization program,the Aquino government has restored the old set of industrialists. Anew authoritarian government undoubtedly would announce aliberalization-oriented economic reform program, but because its socialbasis would be narrower than that of the Aquino government, it wouldhave to find some dependable constituency in the business sector. Thelarger and more traditional this constituency is, the less it will beable to implement an effective liberalization program.
The nature of the Philippine private sector is a key issue in the longterm. All important economic reforms require an appropriate responsefrom the private sector. If the private sector is genuinely orientedtoward accumulation through enterprise, it should be able to providethe means by which foreign investors can break through the existingbureaucratic obstacles.
CONCLUSION
The next half year will have a crucial effect on the immediateprospects of the Philippine economy. The possibility of an attempt to change
1./ Such a government can be marginally more effective if it does not replaceofficials every time a military challenge erupts, so that learning by doingcan take place.

- 169 -
the government by unconstitutional means is high. Without additional foreignfinancing, the level of international reserves is adequate only until the thirdquarter of 1990. There is a positive, and probably small, probability of abreakdown of relations with the IMF.
In spite of the acute downside risks, we take the view that forpolitical reasons there will be enough "give" on foreign financing and that thepotential political disruptions will not be great, permitting positive growthof around 4 to 5 percent in 1990-91.
In the long term, if conflicts among the domestic elite and withforeign financiers are contained, economic prospects in the 1990s for thePhilippines are relatively good and pale only in comparison with those of theneighboring countries. These positive prospects are no cause for rejoicing,however, since they do not intrinsically address the long-term problems of theeconomy and the society.
Financing will be adequate for what we have called a "ho-hum" growthrate. In the meantime, the society's political arrangements can be rathervariable. As long as the nation's leading families, the Philippines'. thousandpoints of light, are involved in the political changes, variability in politicalarrangements is not expected to induce an equivalent amount of variability inthe economic rate of growth.
In contrast, a genuinely reform-minded government must be prepared toaccept lower growth during the period of reform because industrial restructuringand agrarian reform will cause disruptions and necessitate the establishment ofnew institutions. What is more likely, however, is that the government willstrive mightily, through artful liberalization programs, to resolve the internalcrisis by raising the foreign financing required. As in the past, this financingwill set up the conditions for the balance of payments crises that thePhilippines has experienced every eight to ten years.

- 170 -
Table 1: NATIONAL ACCOUNTS
1980 1985 1986 1987 1988 1989
GDP- Pesos (bill) 266.0 612.7 627.1 708.4 825.7 963.2- US $ (bill) 12.7 32.9 30.8 34.4 39.1 44.4
Share to GDP (Percent)Consumption 73.0 82.6 82.0 83.3 82.9 82.7
Private 64.0 73.5 73.1 74.1 73.6 73.3Government 9.0 9.1 9.0 9.2 9.3 9.4
Investment 24.6 13.2 11.0 12.2 13.7 15.5Private 19.3 10.6 8.7 9.8 11.4 13.2Government 5.3 2.6 2.4 2.4 2.3 2.3
Government 14.2 11.7 11.4 11.6 11.5 11.7
Exports 19.2 21.5 25.8 24.4 26.6 28.0
Imports 20.9 15.6 17.3 20.9 26.3 30.4
Real Growth RateConsumption 4.4 9.8 0.8 6.3 5.7 5.8Investment 6.9 -48.0 -15.0 15.6 19.3 19.8Exports 13.4 8.6 22.3 -1.3 15.9 11.7Imports 3.3 -27.8 12.9 26.5 33.4 22.5
Population (mill) 48.10 54.67'' 56.00 57.36 58.72
Source of basic data: National Accounts Staff, Reptublic of the Philippines

- 171 -
Table 2: BALANCE OF PAYMENTS DATA(Current US$ millions)
1980 1985 1986 1987 1988 1989* 1990**
Merchandise Export 5788 4629 4842 5720 7074 7890 8733
Merchandise Import 7727 5111 5044 6737 8159 10245 12089
Trade Balance -1939 -482 -202 -1017 -1085 -2355 -3356
Service Receipts 2222 3288 3791 3497 3590 4237 4669
Interest Payments 975 2395 1938 2051 2192 2465 2391
Other Payments 1646 893 1096 1522 1524 1808 2042
Direct Investment -106 12 127 326 986 757 750
Official Flow 5 872 1145
Private Flow -1758 -1482 -2587
Errors and 140 1110 -174 -222 123 151Omissions (net)
Change in Reserves 724 226 1411 -513 97 700 700
External Debt 17390 26252 28256 28649 27915 27161
*Estimate**Forecast
Source of historical data: Central Bank of the Philippines

- 172 -
Table 3: PUBLIC SECTOR(as % of GDP)
Central Government Consolidated Non-Financial Public Sector(14 Major Corporations) Financing of Deficit
Expenditure Expenditure Domestic External Inflation
Revenue Current Capitat Salance Revenue Current Capital Balance Loss Loss Tax
1980 13.1 9.3 4.9 -1.0
1981 11.8 8.6 6.8 -3.7
1982 11.2 9.3 5.5 -3.6
1983 11.9 9.0 4.2 -1.3
1984 10.5 7.9 3.6 -1.0
1985 11.3 9.0 3.8 -1.5 9.2 8.5 2.0 -1.3 0.6 -0.4 1.1
1986 12.6 11.3 3.5 -2.2 6.2 6.1 1.1 -1.1 1.6 -0.8 0.4
1987 15.5 14.5 2.9 -1.9 7.0 6.2 1.0 -0.2 1.2 0.0 -1.1
1988 14.8 13.6 3.0 -1.8 7.2 5.8 1.1 0.4 0.2 -0.4 -0.2
1989 16.3 15.6 2.8 -2.1 6.0 5.3 1.8 -1.1 0.6 0.3 0.2
Source of basic data: Department of the Budget and Management
a~ ~ ~ ~ ~~~~~~.

- 173 -
Table 4: INCENTIVE INDICATORS AND PRICES
1980 1985 1986 1987 1988 1989
Inflation Rate 18.6 23.1 0.8 3.8 8.8 10.6
Real EffectiveExchange Rate (IFS) 102.4 100.0 78.0 71.5 69.8 72.2
Index of Real Wages 100.0 84.8 80.6 92.7 118.5 128.1(minimum wage
including COLA)
Real Interest Rate 6.65 14.11 3.37 0.75 5.60(91-day Treasury Bills)
Unemployment Rate 5.0 12.1 11.5 9.1 8.3 8.6
Retail Price of (US $/gallon)Premium Gasoline 1.709 1.281 1.380 1.041 1.114Kerosene 1.290 0.893 0.975 0.664 0.731
Notes:
1. The inflation rate is based on the increase in the average consumerprice index for the period.
2. The real effective exchange rate for 1980-88 is taken from the IMFInternational Financial Statistics; the 1989 figure is estimated.
3. Minimum wages have a limited coverage even in the formal sector,where 95 percent of the establishments have 10 or less employees.
4. The 1980 unemployment rate is based on a different reference periodfor estimating who is unemployed.

- 174 -
Table 5: GOVERNMENT MEDIUM TERM PROJECTIONS(% annual rates of growth)
1989 1990 1991 1992 1993 1994
Agriculture 4.0 2.5 4.5 5.8 5.9 5.8Industry 7.1 7.1 7.2 8.8 8.8 9.4Services 6.4 5.4 6.2 6.2 6.3 6.6
G D P 6.0 5.2 6.1 7.0 7.1 7.3
Priv. Consump. 5.6 5.5 5.4 5.5 5.2 5.0Govt. Consump. 7.7 11.4 5.9 5.5 5.9 13.9
Fixed Investmnt. 19.8 11.6 8.3 16.2 15.1 14.3Priv. Construct. 14.0 15.5 15.5 11.9 12.2 11.5
Exports (g & s) 11.7 8.1 9.1 9.8 7.4 8.0Imports (g & s) 22.5 9.0 9.0 9.8 7.7 8.5
Merch. exports 11.5 13.0 14.4 18.0 14.4 15.4Merch. imports 25.6 12.1 13.6 14.3 12.6 13.4
Ratios to GNP:National saving 16.7 17.5 17.5 18.8 20.0 21.1Foreign saving 3.6 3.0 3.5 3.5 3.4 3.3
Source: Palacios (1990], op. cit., tables marked "Link Projections"
- 175 -
COMMENTARY BY ROB VOS
Dr. Montes has given us one of his insightful presentations of thepolitical economy of the Philippines. As the paper brings out clearly, thePhilippine medium-term growth prospects seem to depend on a number of paradoxicalconditions. At first sight, recent growth performance seems quite promising.Despite the economy's huge debt overhang, growth rates of around 6 percent perannum have been achieved since 1986 and even some of the more pessimisticscenarios predict possible growth rates only slightly below the current rate forthe coming years. Although this may not be an extraordinary record for East-Asian standards, it certainly outpaces growth in equally debt-ridden countriesin Latin America. At the same time, the paper warns us, serious doubts shouldbe casted around the sustainability of high growth rates. Major risks are thecountry's latent political instability and persistent structural developmentproblems. Due to these risks, the outcomes of more extreme, but neverthelessquite plausible scenarios are likely to lie in opposite directions. I think thepaper is very clear on these points. It suggests some directions of how theparadox can be resolved, but Dr. Montes seems himself sceptical whether this isthe most feasible scenario. Although I tend to agree with much of hisassessment, let me highlight a few critical points which might have been givensome closer consideration.
The "Filipino Policy Paradox"
The "Filipino paradox" of policy making appears to be the following.The current government, and even the Marcos regime, has emphasized the need forstructural reforms to create bases for sustainable growth and more equity.Critical preconditions to make the transformation are seen to be to sustainpolitical stability and sufficiently favourable external conditions. However,at the same time, the Philippine experience seems to have shown that with thesetwo preconditions present, the incentive to policy makers to actually implementstructural reforms appears to decline. As long as there is some reasonablegrowth--"ho-hum" growth as Montes cheerfully labels it--why risk politicaldestabilization by pushing through major reforms? This paradox does seem toprovide a valid description of the reluctance of policy makers to engage in moreserious attempts to remove structural development bottlenecks. However, put inthis way, the real underlying reasons for this paradox remain unrevealed, i.e.the fragile balance of power between the major economic interests and thesubsequent small room-to-manoeuvre of the state. The paper suggests morestructural reforms are required to reach a more sustainable and equitable growthpath, but it remains unclear about how to break out of the vicious circle inwhich the Philippine policy makers seem to be caught. Which are the actors thatcan be expected to take a longer-term perspective and become the carriers of thepolicy changes favoured by Montes? I do not have answers to these politicalquestions, but in forward looking excercises like the present one, they are atleast as important as the economic ones.
I share Montes' scepticism of reaching quick and successful reforms.I may even be more sceptical than he is. Let me comment briefly on four policyareas to make this clear: (a) trade policies; (b) foreign direct investment; (c)

- 176 -
public finance and debt management; and (d) structural reform and private sectorresponse.
Trade Policies
With the impressive, export-led growth performance in itsneighbouring countries (Thailand, Malaysia, Indonesia), Philippine ambitions tobecome a NIC as well are increasingly voiced. Montes' paper is no exception.Manufactured exports boosted in recent years and may give ground for thisoptimism. Credit may be given to trade policies as real exchange rate adjustmentand trade liberalization accompanied the export growth. A closer look at thefacts should give less rise to optimism. Firstly, export growth fell behindimport growth during 1986-90. Secondly, the growth of manufactured exports doesnot reflect a major diversification of the traded goods sector. Growth ofindustrial exports is concentrated in only two branches, garments and electronicsemi-conductors. These branches were already developed as export sectors in the1970s and moreover appear highly import intensive. The share of domestic valueadded in total is in the case of semi-conductors as low as 15 percent; in thecase of garments, 25 percent. There is thus no clear indication that the recentshifts in the trade regime have led to more export diversification, nor toenhanced industrial linkages; a direction to take if the country is to becomea NIC by the turn of the century.
Montes comments that the trade regime still reflects too high levelsof effective protection of industrial sectors with low growth potential andinefficient production. One would like to see more sectoral detail here, as wellas a discussion of the implications for alternative trade policies. In my view,and this does not only apply to the Philippines, the implications are twofold.Firstly, the current orthodoxy of giving primacy to trade policies over well-defined, long-run industrialization policies should be reversed. Secondly, muchmore sectoral detail and sectoral priorities should be embedded in macroeconomicpolicy management. Countries with a long tradition of import substitutionpolicies, like the Philippines, are likely to encounter significant transitionalproblems in reorienting industry towards export markets. Across-the-boardreduction of effective protection rates or exchange rate adjustment are likelyto be insufficient. Relative prices are important, but in the case of thePhilippines, competitive industrial development is hampered in the first place,however, by more institutional factors like the lack of appropriate exportfinancing schemes and inadequate infrastructure, including major bottlenecks inenergy supplies and location schemes. Moreover, if export promotion is to besimultaneously compatible with employment growth and enhanced domestic industriallinkages, as suggested by Montes as well as by government plans, more selectiveand targetted industrial policies are required given limited resources forindustrial support policies. The feasibility of export-led, labor-intensiveindustrialization, as propagated by Montes, requires in the first place anassessment of the possibilities of another industrialziation strategy, ratherthan a discussion of the limits to trade liberalization--the direction taken inthe paper.
- 177 -
Foreign Direct Investment
The past few years has shown an impressive increase in foreign directinvestment (FDI) to the Philippines. This has reduced to some extent theforeign-exchange constrained and, referring to the Filipino paradox, may havemitigated to necessity for immediate structural adjustment. The paper isambiguous about the role of FDI in the 1990s. On the one hand, FDI might playa positive role in the process of industrial transformation, but, on the otherhand, the factors that attracted FDI in the first place may not be sustainableand supportive to long-term growth.
With regard to the latter issue, Montes indicates as a point of factthat at least 60% of FDI over the past two years has been related to debt-conversion schemes; suggesting that without the scheme the actual amount of FDIwould not have materialized. I have some doubts, whether there has been a realproblem of "additionality" in the Philippine program of debt-equity swaps. Itis difficult to establish counterfactually that FDI has been attracted by theprogram or whether these would have taken place anyway. It would seem to methat foreign investors (and Philippine residents shifting foreign assets backhome) used the debt-conversion program simply as the cheapest way to financetheir ventures in the Philippines, but that the program hardly attracted anynew FDI. This presumption is based on three indicators. Firstly, Table 1 showsthat the share of debt-equity swaps in total FDI fell with the limitation of theprogram in 1989 (to avoid inflationary effects) and is expected to increaseagain with the broadening of the program in 1990, i.e. from 81.7 percent in 1988to 45.2 in 1989 and 58.0 in 1990. Secondly, measures of private foreign assetaccumulation ("capital flight"), show a tendency of a shift in private sectorportfolio preferences to hold assets at home in 1987 and 1988 (see Table 2).i/Thirdly, FDI in the Philippines follows a trend taking place in all ASEANcountries and seems associated with a process of restructuring of trade andindustry in the region. These three factors seem to reflect enhanced businessconfidence to invest in the Philippines.
On this basis, Montes' pessimism about the inflow of FDI in thecoming years seems unfounded. Worries may be ousted about the direction of FDI,however. Although about a third of approved FDI has been allocated tomanufacturing industry, the largest share is into real estate in Metro Manila.Booming non-traded sectors of this kind seem to counteract the desired sectoralshifts discussed in the previous section. A policy conclusion from this is thatFDI regulations need adjustment to fit the program of industrial priorities.
1/ Several estimates indicate a return of "capital flight" money in 1987 and1988 as shown in Table 2. However, if account is taken of underrecordingof workers' remittances from abroad in official balance of payments figures(cf. Vos-estimate in Table 2), then only 1987 shows a negative value forthe private capital outflow, although the 1988 outward movement is muchbelow that in preceding years.

- 178 -
Debt Management and Fiscal Policies
Montes' analysis of the 1986-89 growth performance concludes thateconomic recovery has been largely demand led. In the initial phase, demandimpulses came principally from fiscal expansion financed from increased inflowsof official capital. I disagree with this hypothesis. The fiscal impulse hasbeen financed by domestic financing. It is true that public borrowing fromabroad turned positive again in 1986 and thereafter. However, this externalmoney from debt rescheduling and increased support from the donor community wasused in effect to meet debt servicing obligations. As Table 3 shows, enhancedinterest payments has caused an increasing negative external transfer to thepublic sector. Increased public spending was thus financed from domesticresources. The economic recovery and increased public investment have clearly"crowded in" private investment over the past few years, but--given the tightmonetary policies--there has been "crowding out" through financial markets(higher interest rates and lesser credit availability). The debt burden willcontinue to put a strong limit to growth in the 1990s without major effectivedebt reduction. The paper de-emphasizes the importance of the problem bysuggesting that the Bretton Woods agencies will accommodate risks of reachingdebt repayment limits. Even if this were true for the bottom-line case, it maybe seriously doubted whether recue operations will be in time to avoiddestabilization and disrupture of development policies. However, the limits ongrowth caused by a continued magnitude of the external debt overhang can be shownwithout referring to the bottom-line case.
Firstly, simulations with the PIDS-NEDA macroeconometric model forthe Philippines (Yap 1990) show that if a can were placed on interest paymentson external debt at 15 percent of exports,Z/ a 1-2 percent point higher GNPgrowth could be achieved. Secondly, the size of the external debt makes theeconomy still highly vulnerable to external shocks, despite the preferentialposition within the Brady-plan scheme of debt reduction. This can be easilyillustrated by a likely outcome for 1990. For this year a debt buy-back schemehas been arranged of US$1.3 billion, implying a reduction of the debt owed tocommercial banks by about 10 percent. Interest savings are estimated at US$ 85million a year (assuming a 50 percent discount on the secondary market). A onepercent point increase in the international interest rate- -a very likely scenariowith the expected global effects of the upcoming monetary union between the twoGermany's--will raise the interest burden by US$130 million.
Both points indicate the continued risk and welfare costs posed bythe external debt problem. The current debt-reduction efforts may soon proveto be quite inadequate and halt economic recovery.
Structural Reforms and Private Sector Response
A final comment connects to the final remarks in the paper about"appropriate responses from the private sector". I agree with the observation
21 In 1988, the actual ratio of interest payments to exports of goods andservices was 21 percent.
- 179 -
that the success of liberalization measures and more efficient state interventiondo not merely depend on the pervasiveness with which these are implemented, butmore importantly with the way in which private sector agents (can) respond tothese. During the 1980s, the key word in orthodox adjustment policies has beenmarket orientation. But private sector responsiveness cannot be taken forgranted. Montes' main concern is how to convert (or replace) the traditionalelite (who Aquino allowed to trade places again with the former Marcos "cronies")into (by) an efficient business sector. Fighting corruption andprofessionalizing state bureaucracy may be one step in this direction. Two otherissues, not taken up in the paper, are probably at least as important. A firstissue is that the private sector response has to be made to work, not just byrelative price adjustments, but more importantly by well-directed infrastructuralsupport, credit policies and asset redistribution. Historical evidence can befound nearby (Korea, Taiwan).2/ A second issue is the heterogeneity of theprivate sector. In the Philippines, as well as in many other developingcountries, the bulk of employment and accumulation is generated in householdfirms. More than half of private savings in the Philippines belongs tohouseholds and unincorporated businesses (farms, small-scale industries andinformal traders). Liberalization measures, as well as public investmentprograms, are likely to affect the different segments of the private sector(e.g. modern corporations versus household firms) in different ways. Macro-policies have to take account of differences in the capacity to respond ofprivate agents. This should be a much more important area of concern to policymakers, in the Philippines and elsewhere, as well as to academic research. Mostattention in the 1980s has been directed to fiscal and public sector reform,while the private sector was mostly seen as a deus ex machina. Reliance on theprivate sector to achieve sustainable and equitable growth in the 1990s couldbe built on a blind confidence or, with more likely success, on a properunderstanding of the sector's operations and guided support.
2/ A more recent example may be Indonesia, where the recent impressive labor-intensive, export growth performance should not be assigned in the firstplace to recent exchange-rate and trade measures, but rather to publicinvestment efforts in supplying adequate (rural) infrastructure in thepreceding decades (see World Bank 1990).

- 180 -
REFERENCES
Boyce, J. and L. Zarsky (1988) "Capital flight form the Philippines,1962-86", Journal of PhilipRine Development, XV(2): 191-222.
Vos, R. (1990) "On the Measurement of Private Accumulation of Foreign Assets.The Case of the Philippines", Institute of Social Studies, The Hague(mimeo).
Yap, J. (1990) "An Assessment of the External Debt Management in the Philippines,1986-1988", PIDS Working paper Series No. 90-04, Manila: PhilippineInstitute of Development Studies.

- 181 -
Table 1: FOREIGN DIRECT INVESTMENT AND DEBT CONVERSION(US$ millions)
1988 1989 1990P
Foreign direct investment 986 757 891
of which: debt conversion 806 342 517
Debt conversion as X of FDI 81.7 45.2 58.0
Soureo: Contral Bank of The Philippines
Table 2: ESTIMATES OF PRIVATE FOREIGN ASSET ACCUMULATION(US$ millions)
1971-82 1983-86 1987 1988
Morgan Guarantee definition a/ 7660 156 -439 -545
=oyce and Zarsky (1988) b/ 8820 637 n.a. n.a.
Vos (1990) c/ 9367 3297 -102 322
Source: Boyce and Zarsky (1988) and Vos (1990).
Notes: Figures for 1971-82 and 1983-86 are cumulative totals for period.
a. Private, non-bank foreign asset accumulation derived residually as changein external debt plus not foreign investment inflow less currant account deficit
Less incroase in international roservos (official and banks; including
reserve valuation adjustments).
b. As (a), but includes change on foreign assets of commercial banks and an estimate for
trade misinvoicing.
c. As (a) but includes estimates for trade misinvoicing and for underrecording
of workers, ranittances abroad as sources of private capital outflows.
Table 3: NET EXTERNAL TRANSFER OF NATIONAL GOVERNMENT(in millions of pesos)
1985 1986 1987 1988 1989*
Not external transfer (1-2) -4.7 -2.3 -4.8 -8.8 -12.6
1. not external financing -0.3 3.6 7.7 4.2 4.1
2. Interest payments on
external debt of nat. government 4.4 5.9 12.5 13.0 16.7
Not external transfer as X of GNP -0.8 -0.4 -0.7 -1.1 -1.3
Source: Contral Bank of the Philippines.


ADJUSTMENT IN WEST AFRICA: THE GUINEA EXPERIENCE
J. Dirck Stryker
With commentary by Patrick Honohan


- 185 -
TABLE OF CONTENTS
Page No.
HERITAGE OF THE FIRST REPUBLIC ... . . . . . . . . . . . . . . . 187
ECONOMIC AND FINANCIAL REFORMS ... . . . . . . . . . . . . . . . 188
CURRENT PROBLEMS . . . . . . . . . . . . . . . . . . . . . . . . . 190
Debt Burden and Export Diversification . . . . . . . . . . . . 190Constraints on Efficient Resource Allocation . . . . . . . . . 192Lack of Rural Development and Prospects for the Future . . . . 194
LESSONS LEARNED AND ISSUES FOR THE FUTURE . . . . . . . . . . . . 195
STATISTICAL ANNEX. . . . . . . . . . . . . . . . . . . . . . . . . 197
COMMENTARY BY PATRICK HONOHAN .................. 201

- 187 -
This paper analyzes Guinea's structural adjustment and economic policyreform. In 1980, the economy of Guinea was one of the most distorted in WestAfrica; 10 years later, most distortions have been removed. Yet barriers toeconomic development remain. Outside the enclave mining sector, prospects forgrowth and diversification are limited. Foreign private investment could helpsolve the problem, but the investment will not be sustained unless the role ofthe public sector in Guinea's economy is defined.
This paper looks at Guinea's socialist First Republic and argues thatits policy was responsible for Guinea's poor economic performance. The reformmeasures initiated in 1985 under the Second Republic are described and remainingproblems discussed. Finally, the paper summarizes lessons from Guinea'sexperience and examines the major challenges for the future. Tables of nationalaccounts, balance of payments, and government budget data are in the annex.
HERITAGE OF THE FIRST REPUBLIC
Guinea's abundant water, rich mineral resources, and diverse topographyand soils give the country the potential to produce a wide variety of goods andservices for local consumption and for export. This potential, however, remainsuntapped. Per capita income in 1986 was less than US$300, one of the world'slowest. From 1960 to 1985 real gross domestic product (GDP) increased slightlymore quickly than the population, with growth concentrated in the bauxite miningenclave.!/ While bauxite and alumina production grew about 12 percent yearly,the agricultural sector, where the population is concentrated, stagnated, andits per capita output declined. The cash crop sector performed especiallypoorly: banana exports fell from 100,000 metric tons in 1955 to virtually zeroin 1985; coffee exports declined 80 percent from their 1960 level; and pineappleexports dropped to 10 percent of their 1971-72 peak. While Guinea's exports wereincreasingly concentrated in bauxite, the country depended more on imported food.Rice imports rose from 7,000 metric tons (mt) in 1958 to nearly 200,000 mt by1985.
Although the sudden departure of French technicians in 1958, droughtin the 1970s, and oil shocks in 1973-74 and 1979 contributed to the dismalperformance, the major culprit was the policy of Guinea's First Republic. Thecurrency exchange rate was overvalued, imports were rigidly restricted, andmarketing and input distribution were state-controlled. Agricultural andindustrial state enterprises were inefficient. The government forciblycollectivized agriculture, subsidized food prices to urban consumers, and gaveinadequate incentives to rural farmers. Barriers existed to private domestictrade. The country's transportation and communication systems deteriorated, andagricultural research and extension was neglected. Despite heavy investment inthe productive sectors of the economy, the government lacked the managementskills and administrative capacity to run a command economy. Cumbersomegovernment procedures and policies prevented the private sector from allocating
1/ World Bank, Sub-Saharan Africa: From Crisis to Sustainable Growth: ALong-Term PersRective Study, Washington: World Bank, 1989, p. 221.
- 188 -
resources to help the economy grow. Instead the public sector was bloated withpoorly trained and underused employees, who drained Guinea's resources andnecessitated increasing subsidies to the state enterprises. The difficulty ofimplementing projects under this system discouraged foreign investors and donorsfrom putting resources in Guinea. Yet Guinea, unable to mobilize domesticsavings, increased its heavy external debt burden. Much of the debt was linkedto unproductive public investments outside the mining sector.Z1
By the early 1980s, the economy was highly dualistic. The governmentdepended on the mining sector, largely owned and managed by foreigners, forrevenue and foreign exchange. The government allocated these resources througha complex system of quantitative controls and administered prices linked to theovervalued currency. The rest of the economy functioned outside the officialsector, using foreign exchange from clandestine exports and private transfersfrom abroad to smuggle imports over Guinea's borders.
In the late 1970s, the government's revenue and foreign exchangeearnings stagnated while its recurrent expenditures and external debt serviceexpanded. To address increasing financial difficulties, the government undertookseveral modest reforms. Private domestic trade was tolerated, and officialmarketing quotas were eliminated except for livestock. Many prices still wereregulated, however, and marketing reforms failed to revive the economy becauseof the severely overvalued currency (23 sylis/US$ officially compared with 400sylis/US$ on the black market).
As the gap between official and underground prices widened, fewer goodsflowed through official channels. State marketing agencies collected littleagricultural produce because the prices offered to farmers were too low. Importsand exports were officially monopolized by state agencies, but domestic inflationled to excess demand for imports at the official exchange rate. The situationnecessitated tighter import restrictions. The gap between official and parallelmarket prices grew, and the profitability of diverting imported goods fromofficial channels rose. By the early 1980s, 80 percent of urban demand andvirtually all demand for marketed consumer goods outside of Conakry was met fromnonofficial sources.
ECONOMIC AND FINANCIAL REFORMS
The Second Republic, established in 1984, initiated ambitious economicand financial reforms. These reforms were supported by a Structural AdjustmentCredit from the World Bank, several Stand-By and Structural Adjustment Facilityarrangements with the IMF, and substantial program aid from bilateral donors.
2] Details regarding these disastrous policies and their effects on theeconomy are contained in Revolutionary People's Republic of Guinea,Ministry of Agriculture, Water, Forests, and Processing, ONADER Project,Study of Prices and Rural Producer Incentives - Final Report, Associatesfor International Resources and Development, February 1983.

- 189 -
The objective of the reforms was to free the economy from state controland government intervention and to establish policies to encourage a marketeconomy. Measures designed to meet this broad goal were to:
(a) devalue and free up the exchange rate;
(b) replace the defunct state banking system with privately owned banks;
(c) eliminate price controls;
(d) liberalize external and internal trade;
(e) establish a legal/institutional environment conducive to privatesector savings and investment;
(f) reduce public sector employment, withdraw government from commercialand industrial activity, and make legitimate public sectoroperations more efficient; and
(g) shift public investment toward supporting productive private sectoractivities.
Implementation of these measures began after mid-1985.
In January 1986 the government replaced the syli with the Guinea franc,pegged to a basket of currencies at a rate reflecting the scarcity value offoreign exchange. In May 1986 the exchange rate was unified when the governmentand the private sector were required to purchase foreign exchange at a ratedetermined at weekly auctions, which were open for all current accounttransactions. In 1987 about 30 percent of the foreign exchange sold at theauction came from the private and parastatal sectors; the balance came from theCentral Bank's foreign exchange reserves, which were supplied from miningrevenues and donor balance-of-payments assistance.
All six state banks were closed at the end of 1985 and replaced by fiveprivate or joint-venture banks with majority private ownership. Almost all bankbranches, however, were located in Conakry.
Prices of goods except imported rice and petroleum products weredecontrolled in 1986. Rice and petroleum product prices were raised at leastfourfold at the same time to reflect the new exchange rate. Periodic adjustmentsin these prices have been made since to reflect changes in world prices, theexchange rate, and the level of indirect taxation. Tariffs on utilities andpublic services still are set administratively, with significantcross-subsidization.
The private sector was allowed to engage freely in internal andexternal marketing, and the state monopolies on long distance transport andstorage were eliminated. Import and export procedures were radically simplified.Import licensing was abolished and replaced with an import declaration grantedto all licensed traders. Import tariffs were simplified. Tariff rates were
- 190 -
reduced to compensate for the increase in the taxable base following devaluation,to dampen inflation resulting from the devaluation, to reduce tax evasion, andto avoid excessive import protection.
The government started building a more coherent legal/institutionalframework to support the private sector. Investment, mining, and petroleum codeswere adopted. Incentives under the investment code were time-bound and designednot to affect production decisions. A customs code and a land tenure code wereprepared, and laws regulating the banking sector and commercial activity wereadopted.
The government reduced public sector employment through a voluntarydeparture plan, forced retirement, the closing of public enterprises, andcompetitive examhinations. By mid-1989, public sector positions had decreasedfrom 90,000 to 62,000, though some of the cuts were held up pendingadministrative reorganization. Of 128 public enterprises, 69 were closed, 22were sold, and the rest were being privatized or otherwise restructured. Butthe public sector wage bill continued rising because of big pay increases tooffset inflation and provide public officials with better incentives.
The government adopted a three-year rolling public investment programfor 1987-89 to strengthen infrastructure, human resources, and public servicesin support of the private sector. But the government could not undertake allof the investment projects because of the size and complexity of the program,delays in mobilizing donor financing, and weakness in project preparation bytechnical ministries.
CURRENT PROBLEMS
Guinea's far-reaching policy reforms have created an incentivestructure favorable to economic growth. The exchange rate reflects reasonablywell the opportunity cost of foreign exchange, especially in comparison with theovervalued CFA franc, and institutional mechanisms provide exchange rateflexibility. Private banks serve the business community's credit needs. Withfew exceptions, prices move freely, external and internal trade have beenliberalized, and taxes on trade are low. The new legal/institutional structureshould facilitate private savings and investment. Public sector employment hasbeen reduced, public enterprises eliminated or privatized, and governmentefficiency increased. Finally,, the donor'community has provided abundantresources to finance the public investment program. Despite this, a number ofdisquieting problems remain.
Debt Burden and Export Diversification
First among these is the external debt burden, whose risks aremagnified by Guinea's lack of export diversification. Guinea's public andpublicly guaranteed medium and long-term debt outstanding at the end of 1985 wasUS$1,576 million, including US$280 million in payment arrears. This was morethan 90 percent of GDP. Debt service obligations in 1986, had they all been met,would have cost US$154 million, or 30 percent of the value of goods and services
- 191 -
exports. Although some of Guinea's debt to financial institutions has beenrescheduled and part of its commercial arrears eliminated, the external debtproblem remains thorny. The country incurred substantial external paymentsarrears in 1987 and 1988. Although it reduced arrears in 1989, Guinea's totalmedium and long-term public debt currently exceeds US$1,900 million.
This burden is particularly troublesome because Guinea depends heavilyon the mining sector to service the debt. In 1986, bauxite and alumina accountedfor 75 percent of the government's budgetary receipts. These resources enabledthe First Republic to survive for many years despite the near-total collapse ofthe rest of the economy. Today the mining sector accounts for 85 percent oftotal exports. Although in the short to medium term the prognosis is good forfavorable world market prices and expanded investment in the sector, lack ofexport diversification presents future risks.
Moreover, the government has limited ability to capture revenue throughother sources of direct or indirect taxes. Years of smuggling and corruptionhave established patterns of tax evasion that are hard to reverse. Tax rateson imports are low in part to reduce evasion, but this also reduces revenue.Tax revenue as a percentage of GDP is very low by African standards.
In addition, it is unclear whether the investment program outside ofmining is contributing to economic growth and to Guinea's ability to servicefuture external debt. Despite the recent agricultural census, the results ofwhich are not yet available, data on production in the rural and informal urbansectors are almost nonexistent. Individual projects collect data for monitoringand evaluation purposes, but these data cover only a fraction of the population,and collection and analysis methods are often poor. Thus it is difficult tomeasure the impact of public investment on a large part of Guinea's productiveactivity.
This is worrisome because near-term growth areas in the Guineaneconomy, outside of mining, are hard to identify. The most promising area isagricultural exports. However, the Agricultural Export Promotion Project,recently identified by the World Bank, anticipates the project will boost exportsfrom the current US$25 million to only US$75 million in five years. Thiscompares with 1989 mining exports of US$600 million. Part of the problem is thetime required for coffee and fruit trees--in which Guinea has its strongestcomparative advantage--to come into production. Also important in the long runare limitations on suitable land for planting these trees.
Although agricultural exports have more limited potential than miningexports, they have more links with the rest of the economy, creating a secondaryimpetus for growth. In addition, diversification of exports to include processedproducts can help train entrepreneurs and workers to produce and market moremanufactured exports. In summary, agricultural exports have an important roleto play in Guinea's long-term economic development but will not be a major sourceof growth for the next five to ten years.

- 192 -
Constraints on Efficient Resource Allocation
Despite Guinea's progress in eliminating distortion in the economy,impediments remain to the efficient allocation of resources.
Foreign Exchange Market. Because of the way the foreign exchangeauction is managed, the exchange rate does not necessarily reflect the long-runopportunity cost of the foreign exchange being sold. The demand for foreignexchange is determined by the sum of requests from private importers, publicsector import, and debt service obligations. This is matched against the foreignexchange available from private exporters. Since demand always exceeds supplyfrom this source, the balance is withdrawn from central bank reserves, whichare supplied by mining revenues and foreign assistance. The exchange rate,therefore, is not determined by market forces but by the central bank based onsuch criteria as the parallel market exchange rate, the rate of inflation, thelevel of foreign exchange reserves, past trends in the demand for foreignexchange, and the exchange rate between the US dollar and the French franc.
Not included in these criteria is the ability of the government toservice its external debt in the future. Thus foreign exchange is in danger ofbeing underpriced at present, leading to excessive inflows of consumer goods andcapital goods going to relatively unproductive investments. At the same time,lack of absorptive capacity in the public sector severely constrains thegovernmentIs ability to invest in infrastructure to raise productivity and createthe economic base for future debt service and improved living standards.
Lack of Credit for Investment. The new Guinean banking system isimproving the mobilization of financial resources and increasing the flow ofcredit to the private sector. But currency in circulation comprises up to 72percent of the total money supply, reflecting lack of confidence in the bankingsystem and low interest rates paid on deposits in the face of high inflation.2/
Bank loans are concentrated in short-term commercial credit sincecommercial banks are reluctant to undertake medium- and long-term lending,especially in rural areas. This is partly due to risk aversion, given the banks'limited experience with the Guinean market, as well as high administrative costsassociated with the small size of most agricultural and informal urban sectorloans. The reluctance also stems from the absence of a legal framework forbanking sureties, including rights to land.
Obstacles to Trade. Despite the freeing up of external trade,administrative hurdles remain. These take time and resources to overcome.Furthermore, goods transported internally are subject to bribes and delays. Themarketing of imported rice is disturbed by periodic arrivals of bulky food aidshipments, vacillating policies on official rice prices, and government effortsto regulate imported rice distribution outside of Conakry.
i/ The rate of inflation in 1988 was 24 percent, while the rate of interestpaid on term deposits of more than six months was only 17 percent.

- 193 -
Marketing Infrastructure. Guinea's physical infrastructuredeteriorated markedly during the First Republic and now is in very poorcondition, hindering export expansion except for bauxite. The condition of the1,000 kilometers of paved roads varies. Secondary and feeder roads are in poorcondition. Many roads and bridges are impassable during the rainy season.Communication has improved but is still inadequate to encourage trade andinvestment. Constant breakdowns in telephone and telex service increase costsand reduce efficiency for businesses, many of which are new and especiallyvulnerable to communication problems. Telephone service is limited in Conakryand nonexistent between Conakry and the interior. The country's water and energydistribution systems cannot meet private sector demands, and ports and railroadsneed major improvement.
Legal and Institutional Constraints. Although the legal andinstitutional framework to support the private sector is taking shape, the moveaway from a controlled economy is incomplete or in many cases ambiguous. Forexample, incentive structures overlap and conflict, attitudes towards privateforeign investment are mixed, and procedures for establishing enterprises areinconsistent and plagued by extra-legal barriers. The absence of clear rightsto land removes an important source of collateral for credit and discourageslong-term investments. There are problems in hiring and firing labor, and intransferring foreign exchange.
The investment code frequently conflicts with individual agreements andwith the incentive structure. The code provides for special treatment forcertain types of enterprises, without explaining why. Furthermore, eachincentive package or combination of packages under the code is complex andinvolves varied benefits. The system would be clearer if there were one packageof incentives for all approved projects. The incentives provided under the taxcode, the customs code, and general legislation would shape an incentive systemfor the long term. For these codes and legislation to be effective, however,implementing decrees are required in many cases.
Government Reform. The long-term sustainability of the reform processdepends on the government's ability to build a qualified, motivated civil servicethat can manage the national economy within the framework of a flexible,market-oriented structure. The public sector work force will have to be cut toabout 50,000, public sector wages and salaries raised to private sector levels,and liquidation or privatization of public enterprises completed. In addition,the administration of tax collection and public expenditure control needsimprovement.
Public Investment. Finally, the public sector's ability to programpublic investment in conformity with a viable macroeconomic framework must bestrengthened. The government must identify and prepare projects in accordancewith standard financial and economic criteria, prepare a comprehensive annualinvestment budget, and institute a system for the physical and financialmonitoring of projects. Without this capacity, public sector investment willremain a major bottleneck to the realization of Guinea's economic potential.
- 194 -
Lack of Rural Development and Prospects for the Future
Rural sector stagnation constrains economic development. Yields arelow, given Guinea's agricultural resource potential. Agricultural research andextension is limited to a few enclave projects. Farmers rarely use fertilizers,improved seeds, phytosanitary products, and farm machinery, in part because ofhigh transportation costs. This limits the market for such products and foragricultural ctedit. In turn, the low volume of rural credit, product marketing,and agricultural input distribution raises the unit cost of these to levels thatdiscourage commercialized agriculture.
The effects of this are clear. Agriculture employs 80 percent of thepopulation but generates only 40 percent of GDP. Although agricultural exportsare slowly rising, they account for 3 percent of export earnings and are wellbelow preindependence levels. Meanwhile, food imports have increased to 20percent of the total import bill. Rice imports have tripled in the last tenyears.
Guinea has the natural resources for agricultural development. Coffee,cocoa, oil palm, and rubber could be produced in the Forest Region. Tropicalfruits and vegetables can be grown in large quantities for export fresh orprocessed if the markets can be found. Guinea has a comparative advantage incotton, which can be grown for local demand and export, and in groundnuts. Thecountry can profitably produce coarse grains (maize, millet, sorghum, and fonio)for the domestic market, though growing rice for sale in Conakry is unprofitablein the fact of projected import prices. Finally, Guinea has an enormous untappedpotential in its large herd of trypano-tolerant N'Dama cattle, offshore fisheryresources, inshore coastal fisheries, and aquaculture.
The long time needed to develop manufacturing and the enclave natureof the mining sector make agricultural development vitally important to Guinea.Although agriculture is never likely to contribute as much to exports or topublic revenue as does mining, income-generated in the rural sector is widelyshared. Development of the sector increases employment, creates markets foragricultural inputs and consumer goods, and makes agricultural productionavailable for downstream processing and distribution. These intertwined effectsare essential to develop not only the rural economy but also industrial andservice activities in urban areas.
To absorb Guinea's growing population, farmers must intensify theircultivation techniques. Food crops need to be shifted from the hillsides tolowlands where the soil can be better conserved and water better managed.However, intensive use of fertilizers and other intermediate inputs is notprofitable because of the high cost of importing them and transporting theminland. Yields can be increased through selection of local seed varieties,better crop husbandry, and improved water control. Whether this will be adequateto sustain the increased population is unclear. There is little research inGuinea on ways to increase the productivity of local varieties.
The structure of Guinea's comparative advantage will change aspopulation density increases, land becomes scarcer, and cash crops are developed.

- 195 -
These developments will encourage intensification of cultivation as land valuerises in relation to that of labor and other inputs. In the future, Guinea maybe able to compete better with rice imports using intensive forms of ricecultivation. This comparative advantage gain might be offset by migration toneighboring countries where there is less of a land shortage. Land is becomingscarcer all over West Africa, however, so this safety valve may not be availableto relieve population pressure.
In the long run, economic development in Guinea must involveindustrialization. Even today the industrial sector should not be overlookedgiven the population growth and environmental risks that Guinea faces.Industrialization can for the next few years play a useful complementary rolepromoting agricultural development by processing outputs and producing inputs.But it is important that incentives to industry not discriminate againstagriculture and that they encourage employment as population grows.
LESSONS LEARNED AND ISSUES FOR THE FUTURE
A number of lessons can be learned from the Guinean experience withstructural adjustment and economic policy reform. First, it is possible toundertake dramatic reforms in a very short time. Guinea had three majoradvantages in doing this: (a) a complete change of government following thedeath of Sekou Toure, the previous president; (b) an economy that was sodistorted that virtually everyone lost under the old system; and (c) massiveforeign aid, which softened the impact of devaluation and the elimination ofprice controls.
Second, "getting prices right" is a necessary but not sufficientcondition for economic development. Guinea still faces many problems concerningexternal debt, constraints to efficient resource allocation, and lack of ruraldevelopment. Most important, the government's role in economic development hasyet to be defined, and government capacity to fulfill that role has not yet beenbuilt.
The government must define in broad terms the most desirable futurepath of Guinean development. While mining will for many years make a greatercontribution to exports and public revenue than agriculture or industry,agricultural production for export and sale to the urban market has more linksto the rest of the economy. Diversification into processed agricultural productscan train Guineans to produce and market a broader range of manufactured goods.Investment and policies to promote agricultural cash crop production must belong-term, however, since the gestation period for many of these crops is long.
A key issue in export promotion is the business climate and the roleof foreign private investment. Foreign partners can be especially important forpenetrating overseas markets, providing information on quality requirements, andhelping transfer technology. This is perhaps even more important than thecapital contribution that they make. There is a need, therefore, to create amore stable investment environment by permitting the repatriation of profits,providing guarantees on expropriation, establishing adequate land use rights,
- 196 -
avoiding overvaluation of the exchange rate and excessive protection againstimports, and generally creating a business atmosphere conducive to export growth.
The government must define the role of the public sector. Its mainactivities should be provision of public goods such as rural infrastructure(roads, telecommunications), research and extension, export quality surveillance,public health, and preservation of natural resources. An effective program ofpublic investment will require enhanced government capacity to program, identify,prepare, appraise, monitor, and evaluate investment projects. Another importantissue to be resolved is how banking services can be made more broadly available,especially in rural areas, without the use of public subsidies.
Nothing is of greater concern than preservation of Guinea's richnatural resource.base upon which future economic development depends. This baseis threatened by overexploitation and inadequate safeguarding against loss ofsoil fertility, deforestation, erosion, overfishing, and a host of otherenvironmental problems. Resource use rights must be more clearly defined, takinginto account the scarcity value of resources. Use rights might be defined forindividuals, local communities, national government, or internationalorganizations, depending on how far the effects of the use extend. Unlessindividuals and local communities have security of tenure and the authority tomanage the natural resources that they use, the chances for successful managementare poor. Spillover of the effects of natural resource use beyond local andnational borders requires management at the national and even internationallevel.

- 197 -
STATISTICAL ANNEX
Tables 1 through 3 provide basic information on Guinea's nationalaccounts, balance of payments, and public budget. These data should be treatedwith considerable caution. In particular, comparisons between the periods beforeand after the devaluation of 1986 are risky. The GDP deflator, for example, rosefrom 145.2 in 1985 to 1,773.7 in 1986 (1980 - 100). This exceeds the inflationrate in Guinea and stems from the large change in the exchange rate. As aresult, the deflator is not given for 1986 and 1987 in Table 1.

- 198 -
Table 1: NATIONAL ACCOUNTS
1980 3985 198h 1987
GDP- Sylis/FG (1980=100) 33465 -- 37267 39466- $US million (current) 1764 1982 1916 2166
GDP Deflator(natl currency 1980=100) 100 145.2 -- --
Share to GDP (%)Private Consumption 57.6 72.5 72.9 72.3
Government 20.8 14.5 12.2 10.6
Investment 15.8 9.4 17.5 16.8
Exports 28.1 25.4 30.1 30.2
Imports 22.3 21.8 32.6 29.9
Real Growth Rate (%) 1980-1985 1986 1987
Exports a/ 2.6 3.3 5.5
Imports a/ 6.2 13.7 3.7
Per Capita Total 0.7 -- --Consumption b/
Population 2.4 2.5 2.5
a! Average annual growth rate at constant 1980 Prices for 1980-1985.Figures for 1986 and 1987 based on current prices.
b/ $US (1980 constant).
Sources: World Bank (1989). Trends in Developing Economies 1989.Washington, D.C.
UNDP and World Bank (1989). African Economic and FinancialData. Washington, D.C.
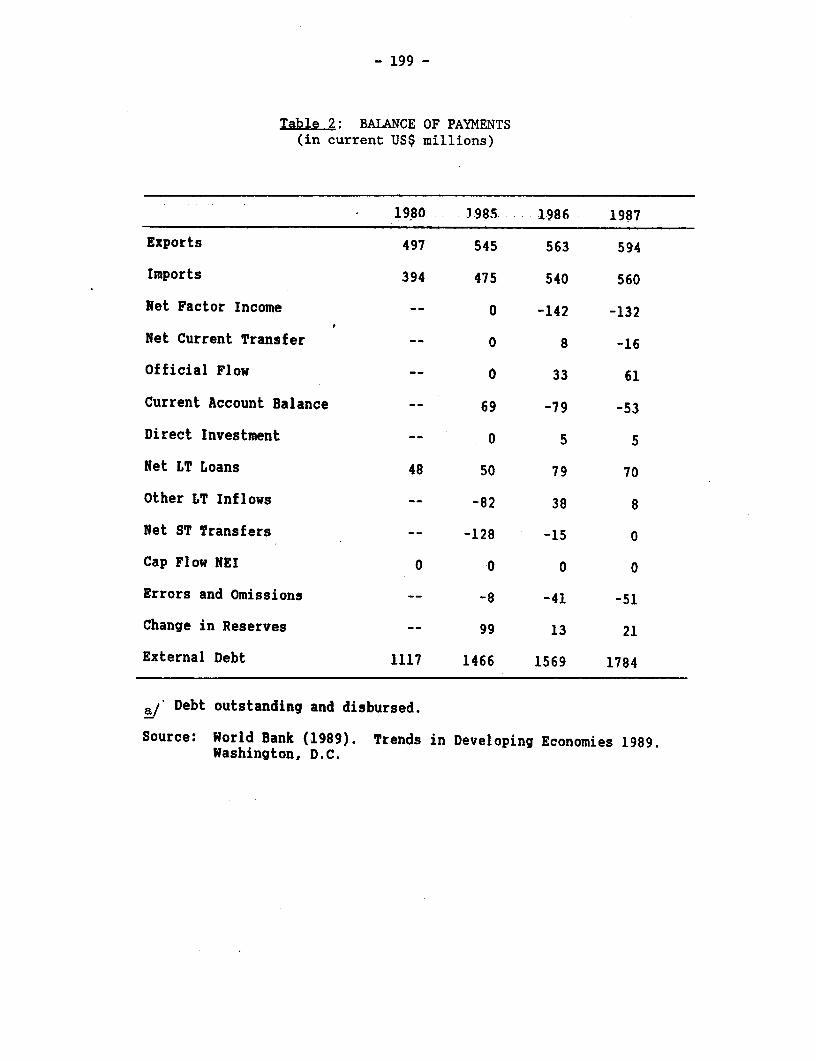
- 199 -
Table 2: BALANCE OF PAYMENTS(in current US$ millions)
1980 3.985 1.986 1987
Exports 497 545 563 594
Imports 394 475 540 560
Net Factor Income -- 0 -142 -132
Net Current Transfer -- 0 8 -16
Official Flow -- 0 33 61
Current Account Balance -- 69 -79 -53
Direct Investment -- 0 5 5
Net LT Loans 48 50 79 70
Other LT Inflows -- -82 38 8
Net ST Transfers -- -128 -15 0
Cap Flow NEI 0 0 0 0
Errors and Omissions -- -8 -41 -51
Change in Reserves -- 99 13 21
External Debt 1117 1466 1569 1784
a/' Debt outstanding and disbursed.
Source: World Bank (1989). Trends in Developing Economies 1989.Washington, D.C.

- 200 -
Table 3: PUBLIC SECTOR REVENUE AND EXPENDITURES(as a share of GDP)(%)
1986 1987
Revenue 11.8 13
ExpenditureCurrent 13.1 11.5Capital 7.7 8.5
Balance -9.1 -7
Source: World Bank (1989). Trends in Developing Economies 1989.Washington, D.C.
- 201 -
COMMENTARY BY PATRICK HONOHAN
This is an interesting paper throwing light on a country which I havealways regarded as a bit of a puzzle. The air of mystery surrounding Guinea isenhanced by the fact that it has never had a page of data to itself inInternational Financial Statistics. But more to the point, it is puzzlingbecause of the fact that Guinea's disappointing economic and social performanceis often laid at the door of the Sekou Toure administration (with the colonialpast being described in glowing terms), whereas the objective indicators on whichGuinea performs poorly have not deteriorated much in relative terms since themid-1950s. Dirck Stryker's paper too blames most of the present woes on theadministration that ended in 1984.
For instance, life expectancy at birth is lower in Guinea than inall but one other country in the World Development ReRort's tables, and infantmortality is not much better: fifth from the bottom. But these rankings werealmost the same a quarter of a century ago.
Furthermore, it appears that Guinea is far from being the poorestcountry in West Africa, so it seems that criticism of its performance must beby reference with an unrealized potential. And it is certainly true that Guineadoes have much by way of natural resources: not only bauxite and (since themiddle ages) gold, but also relatively good agricultural land.
I don't think that the poor performance can be blamed on therelatively small amount of aid by comparison with GNP. It is true thatneighboring Mali, Burkina Faso and Sierra Leone enjoy much higher proportionateamounts of aid, but the sums are not that different in dollars per head, andanyway the productivity of much of the aid going to pay the salaries ofexpatriate advisors might be questioned.
Nor do I think that Guinea has suffered unduly from its decision notto join the CFA zone--one of the most conspicuous differences of policy betweenit and the other francophone countries in West Africa. Guinea adopted its owncurrency soon after independence and it is true that the currency went the wayof virtually every other independent currency in Africa, falling to a fractionof its value. The official exchange rate was six times the parallel market rateby 1983, twelve times by 1985. So although there is some uncertainty about justhow and when inflation accelerated during the 1980s in Guinea, it is clear thatinflation was much higher than it would have been had Guinea stayed with the CFAfranc. Even now, after the reforms, inflation is running at 30 percent perannum. But against this higher inflation must be set the probability thatGuinea, as a small and relatively poor member of the UMOA, would have sufferedfrom the skewed distribution of credit between member states that hascharacterized the franc zone.
As an aside, I would not be as hard as Dirck was on the managementof the exchange auction. After all there is a sharp distinction to be madebetween the type of exchange rate overvaluation which Guinea (like Ghana and

- 202 -
Nigeria) had up to the mid-1980s, reflected in an absolute shortage of foreignexchange at the posted exchange rate, and by extensive rationing, and the othermilder type where, although competitiveness is being hampered by a high rate,nevertheless there is little rationing. It is the latter case that one is nowtalking about in Guinea (and in the CFA countries at present).
Professor Stryker points to a shortage of credit for development.The story of the Guinean banking system is a sad one (set out in an interestingunpublished paper by Roland Tenconi). It turns out to be linked with the rapidinflation of the 1980s. Because the government's finances were bolstered bybauxite revenues, the banking system was as not as severely affected bydelinquent loans to state enterprises or political figures as was the case inmany other countries. But what brought the banks down was widespread fraud onthe deposit side. The money supply was artificially swollen by these frauds,adding to inflationary pressure and finally resulting in the abrupt closure of95 percent of the banking system on a December day in 1985. The lack ofconfidence which this experience engendered has undoubtedly increased the usualconservatism of the banks which have come to replace those that failed. Having,by mid-1989, mobilized in deposits only one-third as much as the currency issue,their development effort has certainly been feeble.
If there is to be an explanation for the disappointing developmentof Guinea over the years it may be most easily attributed to the country'sreliance on bauxite. R.W. Austen has drawn a sharp distinction between, on theone hand, those African countries (many of them in West Africa) whose colonialand post-colonial development has followed the statist model and relied on thedevelopment of plantation agriculture and the other more mixed economies. Someof the statist economies have relied on minerals rather than plantationagriculture, and of these, the Guinean dependence of bauxite is the longeststanding and most egregious. Whereas it was natural for countries withplantation crops such as coffee and cocoa to diversify into other agriculturalventures and even to have some spinoff into processing, the bauxite business isinherently a large-scale enclave type of business offering no obvious spinoffs.Because the bauxite revenue was there, the government had no need to encouragethe development of other sources of revenue, and therefore the remainder of themodern economy never took off. There are parallels with the collapse of the non-oil economy in Nigeria after the oil boom, but the Guinean case is more extreme.Indeed, as Dirck Stryker points out, the non-bauxite economy slipped away fromthe control of government almost entirely during the Sekou Toure years: thegovernment did not need it, and it got nothing from government.
If this analysis is correct--and here I should stress that I do notclaim a detailed knowledge of the situation--there are deep-seated reasons fornot expecting any further strong rebound in Guinean growth over the next fewyears.

EMERGING HAIAWI
Kenneth K. Meyers
With commentary by Charles Humphreys


- 205 -
TABLE OF CONTENTS
Page No.
MALAWI'S ECONOMIC BACKGROUND . . . . . . . . . . . . . . . . . . 207
The Small-Scale Sector . . . . . . . . . . . . . . . . . . 207The Modern Sector .... . . . . . . . . . . . . . . . . 208
SUSPENDED TAKEOFF. . . . . . . . . . . . . . . . . . . . . . . . 210
PERFORMANCE IN THE 1980s - SMALLHOLDER SECTOR. . . . . . . . . . 211
PERFORMANCE IN THE 1980s - MODERN SECTOR . . . . . . . . . . . . 212
THE DOWNSIDE VIEW OF ECONOMIC PROSPECTS IN THE 1990s . . . . . . 216
EMERGING MALAWI ........................ . 218
REFERENCES . . 221
TABLES . . . 222
COMMENTARY BY CHARLES HUMPHREYS ................ . 226

- 207 -
Malawi's unique economic profile tends to resist comparison with othereconomies, especially those outside of eastern Africa. There are, however,important similarities between the strategy choices and issues in Eastern Europeand those in Malawi and other developing nations.l/
The similarity lies in the twin difficulties of identifying long-termcomparative advantages and financing entrepreneurial activity. These problemsarise against an historical background in which areas of predominant productiveactivity have been fixed, the availability of entrepreneurial capital is limited,and national productivity is well below potential.
The current focus of attention on Eastern Europe is seen by some asdisadvantageous to Africa--that it means a lessening of concern for its problems.However, given the intellectual energy directed toward those economies intransition, innovative approaches to developing profitable productive entities(where asset distribution and historic structure do not create a natural pathto such activities) may be created.
MALAWI'S ECONOMIC BACKGROUND
There are at least two more or less independent economies in Malawi.Like many developing nations, it has an extensive informal sector based onsmallholder agriculture and a relatively new and urban modern sector.
The country's natural features have been critical in determining itseconomic history. Malawi is relatively small, with a population of roughly 8million and an area of 118,000 square kilometers. Over one quarter of that areais taken up by Lake Malawi, the third largest lake in Africa. Because of itsrelatively high altitude, at the end of the Great Rift Valley, the climate istemperate. It is relatively poor in natural resources and while arable land iswell-suited for agriculture, no substantial mineral deposits have been exploiteduntil now.
The country is landlocked, with the closest ocean ports located inMozambique. However, their use is limited by the civil insurrection taking placethere.
The Small-scale Sector
The smallholder economy is central to the welfare of the nation.Although economic analyses of the Malawian economy focus on the modern sector,approximately 87 percent of the population is rural and most rural householdsdepend on smallholder agriculture for a significant proportion of theirsubsistence. Thus, until the rural economy becomes more dynamic, the nation'swelfare will not markedly improve.
1/ The discussion of this paper is one of economics rather than politics.Thus, this statement is not intended to reflect any comparison ofpolitical environments.

- 208 -
The smallholder economy is not homogenous. This is partly a resultof the country's topography: Population densities are greatest in the south andcenter of the country. The north, which is less planar and has poorer soils,is less densely populated. The lakeshore, which flows from the far north to thebottom center, defines its own smallholder economic zone.
The smallholder economy centers on four staple crops: maize(predominant in the center and south), cassava (primarily in the north andsoutheast), rice (lakeshores and the flood plains of the far south), andgroundnuts. Some cash crops are also produced, the most important of which aretobacco (dark fired varieties), tea, coffee, and some cotton. Groundnut andpulse surpluses are also sold for cash.
While this sector's welfare rises and falls with staple crop output,it is not isolated from the modern sector. Shifts in and out of various cropsand the use of fertilizers and insecticides depend closely on relative priceshifts (and variance), finance constraints, and government marketing and subsidypolicies. The sector as a whole, however, is not far from subsistence levels,and purchases from the modern sector are largely relegated to cooking oil, soap,and occasional yard goods.
There are more direct interactions between the smallholder populationand the modern sector, namely wage employment in the estate sector and migrantemployment in South African mines. Approximately 200,000 workers are employedby the estate sector; the work is seasonal and the pay is near subsistence. Mineworkers in South Africa have numbered in the thousands in recent years, withwages well above those available for unskilled labor within Malawi.
Savings from work in the mines are one major source for small-scaleinvestment in rural areas. Miners' savings are typically spent partly on smallconsumer items (radios, clothes), on improved housing, on family obligations,and, to a lesser degree, on establishing small-scale rural enterprises such asbottle shops (small retail outlets), milling (grain) machines, and tailoring.
There has been no large rural to urban migration. In part, this isdue to urban employment opportunities and to active discouragement ofconstruction of dwellings.
The Modern Sector
The modern sector consists of three sub-sectors: agriculturalestates, industry, and services. By the usual analyses of economic performance,the estate sector is by far the most critical. Estate crops are tobacco (burleyand flue-cured varieties), sugar, tea, and coffee. Macadamia nuts will alsobecome a major estate crop as trees mature in the next few years.
The estate sector is technically defined by the legal tenure of theland under cultivation, an estate being defined as freehold or leasehold land.There are approximately 4,000 estates in this category; the large majority areless than 5 hectares.

- 209 -
Small estate farming is distinguished from the smallholder sectorpartly by the greater distance from subsistence, but, more importantly, by thefact that only estate farmers have been entitled to market burley and flue-curedvarieties of tobacco. In recent years, substantial rents have accrued to thoselicensed to market those tobacco varieties.
The bedrock of the estate sector lies, however, in the large estateproducers. Growth in output generated by these producers, resulting fromextending the areas under cultivation, was primarily responsible for the highGDP growth statistics in the 1970s: The average growth for estate agriculturewas 11.8 percent per annum for the 1970-79 period. A rough estimate placesgrowth in the area under estate cultivation at 10.6 percent per annum for thatperiod. The growth rate for the economy as a whole was 7.0 percent during thattime.
Growth occurred in all three major crops: tobacco (flue-cured andburley varieties), tea, and sugar. Sugar production at independence wasnegligible. It reached 32,700 metric tons by 1970, climbed to 107,900 by 1979,and currently stands near 170,000. The climb in tobacco production has beensimilarly meteoric: Production stood at 3,400 metric tons at independence,reached 10,400 in 1970, 40,100 in 1979, and is likely to reach 80,000 in 1990.Tea, the traditional estate crop in Malawi, has grown from an output of 12,400metric tons at independence to 32,600 in 1979 and will be about 40,000 this year.
While the extension of land under cultivation no longer provides asimple growth route (as a result of population pressures), the estate sector hasmaintained some dynamic features, with significant growth of macadamia and coffeeproduction, and improved varieties of tea are being planted (reaching Kenyanquality on some estates). Moreover, the estate sector will continue to expandas more land is cultivated.
Growth in manufacturing averaged 6.5 percent between 1970 and 1979.Despite this impressive rate, the sector has until now been relativelyunimportant in Malawi in terms of the direction and health of the economy.Manufacturing constitutes about 12 percent of GDP and a similar share of totalwage employment is accounted for by the sector.
Manufacturing activity is concentrated on tea, coffee, tobacco, andsugar processing along with textile production (the most important product inthe manufacturing sector). A number of other activities, which add a limitedamount of value (eg., paint mixing, beverage production, oil extraction), wereassociated with the development of the private retail sector in the 1970s. Thelimited production in these areas mainly resulted from a decision to concentrateon wholesale/retail operations.
According to national accounts statistics, trade and finance have beenMalawi's most vibrant sector in the post-colonial period, with value addedaveraging 11.4 percent growth during 1970-79. Because it is difficult to measurethis sector's growth in real terms, it is possible the actual growth rate
- 210 -
differed somewhat from this figure. There is no doubt, however, that it wassubstantial.
Growth in trade was partly driven by income increases in estateagriculture, but was also generated as a matter of national development policy.Many activities were developed by the Press Group, headed by the President, andheld as a national trust; others stemmed from parastatals or indirect governmentactivities under the auspices of the Agricultural Marketing and DevelopmentCorporation (ADMARC) and the Malawi Development Corporation (MDC) (bothparastatals) or from joint ventures between government and the Press Group and/ormultinational corporations.
Post-independence activities in Malawi were supported and directed bythe government in a number of ways. One was through the economic activities ofthe civil service and parastatal bodies: Public administration and the defensecomponent of GDP grew at an average rate of 7.2 percent in the 1970-79 period.The spurt in the level of activity in this sector is more pronounced for the1975-79 period in which growth averaged 11.4 percent per annum. Once again,accounting for real growth in this sector is difficult and the true rate maydiffer. There can be no denying, however, that gr, th was substantial.
In addition, significant activity occurred in the social sectors, incommunications and power utilities, and in the rail, road, and air transportationnetwork. Moreover, a well-trained civil service, staffed mainly by Malawiannationals, was developed. In short, the infrastructural and administrativedevelopment that occurred in the 15 years following independence appeared to seta strong foundation for the rapid development of the modern economic sector inthe 1980s.
SUSPENDED TAKEOFF
The view that there would be strong growth in the Malawian economy waswidely held. This optimism was reflected in the World Bank's first structuraladjustment loan to the country in 1981, which was made at IBRD terms (withinterest rates not far below LIBOR). Lending at IBRD terms was very unusual fora country with Malawi's level of GDP per capita. The optimism turned out to beunsupported, however, as there was very little development during the 1980s.Understanding why this was so will help provide a clearer perspective on theMalawian economy.
It should be clear from the description of the country in thebackground section that Malawi is hardly ideal for development: The nation hasa limited natural resource base and a small domestic market, is surrounded bynations with weak economies, and is landlocked.
However, Malawi has had a relatively stable and pragmatic politicalenvironment since independence, has wasted few resources on the development of"white elephant" projects, and has managed an impressive level of growth in thedevelopment of its estate sector. Thus, there did not seem to be any constraintto extending growth performance to other sectors.

- 211 -
But this did not happen, and the standard explanation for theeconomy's poor performance in the 1980s rests on two assumptions.2/ First, theterms of trade for Malawi's major export commodities took a strong, negativeturn. Second, the insurrection in Mozambique cut off Malawi's rail links to aport and made transport margins for external trade among the highest in theworld. These factors, combined with others to be noted later, led to a balanceof payments crisis followed by a regime of ad hoc exchange controls and thethrottling of the development potential for the decade.
National accounts statistics show a sharp downturn in the terms oftrade beginning in 1979, with export prices (nominal) falling 2.8 percent whileimport prices rose 41.3 percent. This sharp drop was offset slightly in 1981when terms improved by 18 percent. Terms of trade for the decade as a whole werereported as significantly below levels for the 1970s.
The diversion of trade from rail routes through Mozambique was acontinuous process that began in 1981, increased sharply in 1983, and wascomplete by 1985. This re-routing sharply affected freight costs and unit valuesof both exports and imports. It also affected the quantities transported, withlevels dropping significantly in 1984 as alternate routes and supply sources werestill being identified and increased fighting forced a major drop in the use ofMozambican rail links.
The starkness of the terms of trade and transport factors hasstrongly colored most analyses of the Malawian economy in the 1980s; these haveoffered an uncomplicated explanation for the stagnant economic performance andled to straightforward targets aimed at invigorating growth in the 1990s.
The targets were to resolve the imbalances created as a result (directand indirect) of the trade and transport shocks; establish alternate transportroutes (including required infrastructure investment); support production andconsumption shifts in response to the changed economic environment (for the mostpart, through the use of price signals); and reestablish a stable environmentand infrastructure for continued growth (albeit at lower levels than seemedpossible at the end of the 1970s). Implementing this program, however, provedmore difficult than expected.
PERFORMANCE IN THE 1980s - SMALLHOLDER SECTOR
It is important to return to the issue of performance in thesmallholder sector before proceeding with a discussion of the more obvious issuesthat evolved in the modern sector. The general population of Malawi grew by 3.2percent per annum during the 1980s, increasing from 6 million in 1980 toapproximately 8 million in 1989. Part of this increase was due to an influx ofrefugees from neighboring Mozambique. During 1989, the number of refugees grewto over 600,000. Thus, to the extent that part of the increase includes a
2.! See Kydd and Hewitt 1986, for example.

* 212 -
transient refugee component, the growth rate is slightly exaggerated; the growthrate for the permanent population was probably about 2.7 percent per annum.
Since Malawi has restricted population growth in its urban centers,most of the increase has been rural. At the same time, growth in paid employmentopportunities for the rural population has been limited: Total paid employmentrose from 367,000 in 1980 to 407,000 in 1987, an increase of 40,000 jobs. Thenumber of agricultural workers remained relatively stable, at approximately180,000. Marketed smallholder production has fluctuated along with ADMARCmarketing policies. The total value of marketed smallholder output rose from29.3 million Kwacha in 1980 to 76.1 million Kwacha in 1987--roughly 12.1 Kwacha(US$5.46) per rural inhabitant.
The major indicator of change in the welfare of the smallholdersegment of the economy is production of staple foodstuffs; however, the sampleseries on production in this area does not extend very far into the past, makingcomparisons difficult. Table 5 presents production statistics for the largeststaple crops.
Output o-f maize, by far the most important food crop, was 8.7 percenthigher in 1989 than in 1984. (The latter figure is 5.5 percentage points lowerthan the increase in the population.) This represented a significant improvementover the preceding years, since output had actually declined from 1985 to 1987.
If maize production figures were not overly encouraging, output inother staple food crops was worse: Cassava, the second most important, was hitby the cassava mealie bug and production dropped from an estimated 339,000 metrictons in 1984 to only 155,000 in 1989.
Output in the other smallholder food crops did not make up for thepoor performance in maize and cassava. Thus, Malawi required emergency food aidin 1987 and again in 1988. "By the end of 1988, approximately 662,000 Malawianswere considered to be affected by acute food shortages brought about by droughtand the cassava crop destruction."!/
In fact, those registered as "affected by acute food shortages"reflect only the tip of the iceberg: the 1990 State of the World's Childrenreport indicated that 61 percent of children 0 to 5 years old were nutritionallystunted, among the highest rates in the world. The report also showed amortality rate for children under five years of age of 26.2 percent, anotherrather stark indication of the difficulties in Malawi's smallholder sector.
PERFORMANCE IN THE 1980s - MODERN SECTOR
The direction of the Malawian economy in the 1980s was signalled bya sharp drop in the terms of trade and a corresponding jump in the currentaccount deficit of the balance of payments. The latter actually began in 1978,
i/ Malawi, 1989, page 3.
- 213 -
when the balance registered US$-175.1 million, up from US$-61.8 million in 1977.The 1978 deficit, although partly due to poor export earnings on tea, sugar andgroundnuts, was largely the result of a leap in imports. However, it isdifficult to explain the increase in machinery, transport, and constructionmaterials that show up in the statistics, accounting for that surge in imports.
The current account balance did not show much improvement for the nextfive years, averaging US$-190.3 million between 1979 and 1983, or 13.8 percentof 1988 GDP. A deterioration in the terms of trade was responsible for part ofthe rise in current account deficits: IMF data show that the average terms oftrade for 1979-83 were 22.9 percent below the average for 1974-78. The otherfactor has to do with imports, which were significantly above historical levelsfrom 1978 through 1978, averaging 26.4 percent more than in the years from 1974to 1977. End-use categories that showed substantial increases were the same in1979 and 1980 as those noted earlier for 1978.
In terms of the Balassa external shocks analysis,/ Malawi had decidedto correct its terms of trade decline through additional external financing andby continuing a rapid growth path. This debt was accumulated by both thecommercial sector and the government and much of it was borrowed at market rates.
In 1981, the brakes were applied: GDP fell by 5.2 percent in realterms, and import volumes fell by 15.8 percent and remained at roughly the samelevel from 1981 to 1983.
Export volumes varied during this period, averaging 38.8 percent above1974-79 levels. There was also a partial recovery in the terms of trade,reaching 79.7 percent of 1978 levels by 1984. The current account deficitnarrowed from its 1979 peak of US$265.6 million to US$400,000 in 1984.
Despite the return to approximate balance on the current account, theeconomy was still not in good health. This was largely because in 1984Mozambique's rail lines stopped functioning, which limited trade. Import volumedropped by 20.3 percent and access to foreign exchange was subject to governmentrationing.
The 1984 cut in the transport lines is responsible for the largedeterioration in Malawi's terms of trade starting that year, since itsignificantly affected transport costs, especially of petroleum products andfertilizers (the latter were key factors in the profitability of both traditionaland prospective production activities and thus affected the level of economicgrowth that could be achieved).
Statistics detailing the size and dynamic profile of changes intransport costs have not been released and the robustness of cif/fob marginestimates are subject to question. While import stocks decreased substantially
i/ See Balassa 1983, for example.

- 214 -
between 1984-87,a/ it also seems likely that the decline in Malawi's terms oftrade since 1984 has been overstated, implying a larger volume increase inimports than indicated by current data.
The movement of terms of trade is an important element in the analysisof Malawi's economy. It shows, in part, the extent to which deterioration inits economic situation has been a result of exogenous factors. It also givessome idea of future potential for growth conditioned on possible re-opening ofrail lines and long-term prospects for commodity price movements. In this case,an overstatement of declines in terms of trade would lead to overly optimisticestimates of future growth. In fact, a number of other issues will affectconditions.
The domestic side of the economy also had difficulties during thedecade. Inflation (as measured by the retail price index) averaged 17.1 percentper annum for the period from 1980 to 1988 and roughly paralleled a rise in thegovernment budget deficit from 75.5 million Kwacha in 1979 to 241.8 millionKwacha in 1987. This correlation does not imply a straightforward causal linkbetween the two statistics. It is most likely that some of the inflationaryimpetus stemmed from rent-seeking resulting from foreign exchange controls.Additional pressure was added by weak performance in food production during theperiod.
Tax revenues were not buoyant, and the government borrowed from theReserve Bank to finance its deficits. Reserve money grew from 53.3 millionKwacha in 1980 to 495.7 million Kwacha in 1988.V/ Inflation peaked at 33.9percent in 1988.
GDP grew at an average rate of 2.2 percent per annum between 1980 and1988. It is fair to say, however, that the domestic economy was not healthydespite this rate of growth: In an environment characterized by transportdifficulties, exchange controls, and high inflation, little could be expectedin the way of expansion of activities outside the traditional production areas.
Some of the weaker elements in the modern sector surfaced during the1980s. In particular, commercial and parastatal activities required activeintervention by the government with the support of external organizations.
On the commercial side, the most important entity was the Press Group,which played a key role in the development of Malawi's commercial sector. Bythe end of the 1970s, however, it was unable to meet its financial obligations,
L./ Transport rolling stock and consumer goods seem to have sufferedrelatively more than other end-uses.
i) The interpretation of reserve money statistics is not straightforward.Extremely low foreign reserve levels led to arrears on interest paymentsand the payments of suppliers' credits in 1986 and 1987. Some of thegrowth in reserve money was accounted for by funds held against futurepayment of such claims.
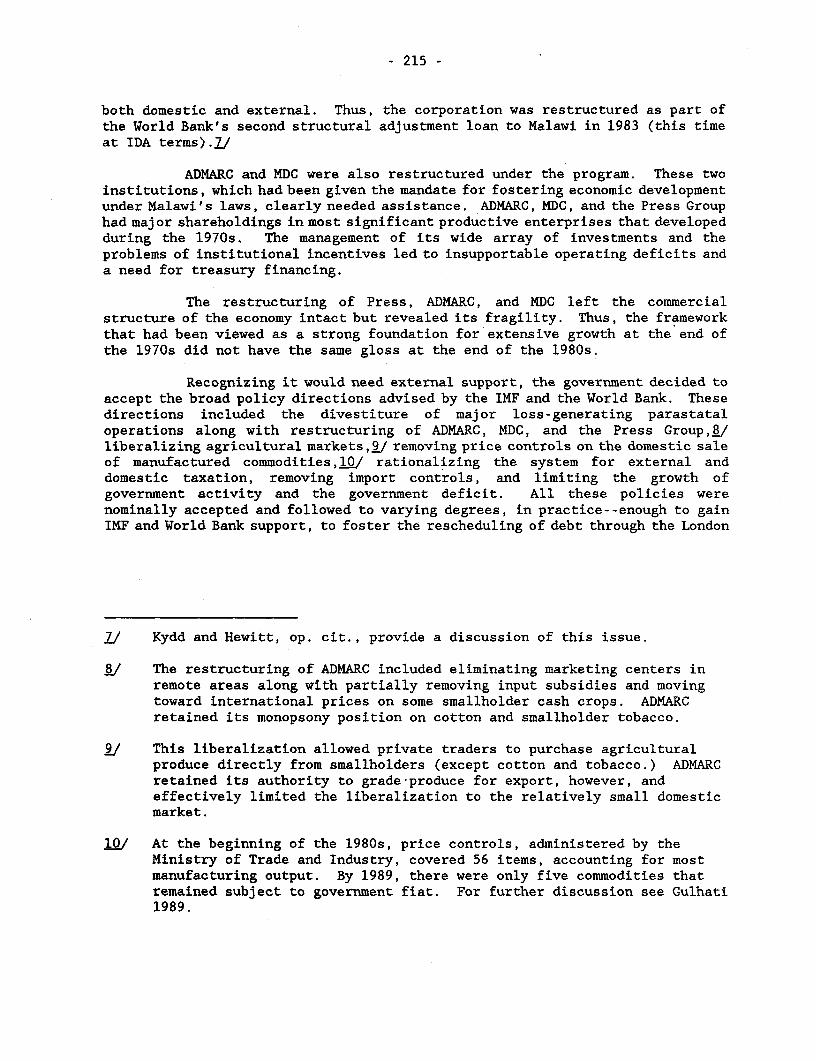
- 215 -
both domestic and external. Thus, the corporation was restructured as part ofthe World Bank's second structural adjustment loan to Malawi in 1983 (this timeat IDA terms).I/
ADMARC and MDC were also restructured under the program. These twoinstitutions, which had been given the mandate for fostering economic developmentunder Malawi's laws, clearly needed assistance. ADMARC, MDC, and the Press Grouphad major shareholdings in most significant productive enterprises that developedduring the 1970s. The management of its wide array of investments and theproblems of institutional incentives led to insupportable operating deficits anda need for treasury financing.
The restructuring of Press, ADMARC, and MDC left the commercialstructure of the economy intact but revealed its fragility. Thus, the frameworkthat had been viewed as a strong foundation for extensive growth at the end ofthe 1970s did not have the same gloss at the end of the 1980s.
Recognizing it would need external support, the government decided toaccept the broad policy directions advised by the IMF and the World Bank. Thesedirections included the divestiture of major loss-generating parastataloperations along with restructuring of ADMARC, MDC, and the Press Group, /liberalizing agricultural markets,2/ removing price controls on the domestic saleof manufactured commodities,LO/ rationalizing the system for external anddomestic taxation, removing import controls, and limiting the growth ofgovernment activity and the government deficit. All these policies werenominally accepted and followed to varying degrees, in practice--enough to gainIMF and World Bank support, to foster the rescheduling of debt through the London
./ Kydd and Hewitt, op. cit., provide a discussion of this issue.
t/ The restructuring of ADMARC included eliminating marketing centers inremote areas along with partially removing input subsidies and movingtoward international prices on some smallholder cash crops. ADMARCretained its monopsony position on cotton and smallholder tobacco.
i./ This liberalization allowed private traders to purchase agriculturalproduce directly from smallholders (except cotton and tobacco.) ADMARCretained its authority to grade-produce for export, however, andeffectively limited the liberalization to the relatively small domesticmarket.
1Q/ At the beginning of the 1980s, price controls, administered by theMinistry of Trade and Industry, covered 56 items, accounting for mostmanufacturing output. By 1989, there were only five commodities thatremained subject to government fiat. For further discussion see Gulhati1989.

- 216 -
and Paris clubs, and eventually to lead to the cancellation of debt owed toFrance and the United States.f11/
Net external flows in 1989 returned the foreign asset position of themonetary authorities to a working position, allowed for a large increase inimports (that corresponded to the import liberalization policy), and permittedpolicies that led to an inflation rate of 8 percent by the end of 1989 and a GDPgrowth rate of 4.3 percent for the year as a whole.
THE DOWNSIDE VIEW OF ECONOMIC PROSPECTS IN THE 1990s
While discussion of economic prospects for the 1990s centers on likelydevelopments in the modern sector of the economy, it is not accompanied by theoptimism of the 1970s. With hindsight, it seems clear that the expectations ofthat decade were not supported by the economic development that occurred. Theextensive development in estate agriculture was assisted by those managementresources freed as a result of the ongoing civil war in Zimbabwe (which had beena traditional exporter of tobacco). It also exhausted the land that could easilybe converted to estate tenure. There was no doubt that the experience in estategrowth could not be replicated in the 1990s.
The belief that rapid expansion in agro-processing and light industrycould occur rested on the unusually solid infrastructure, the able civil service,and the development of the commercial sector in the 1970s. However, the foreignexchange climate of the 1980s was not conducive to growth in these areas. Itis also evident that the structure of the economic activity that developed isfar from the competitive model that some believe would facilitate the expansionof economic activity.
The events of the past decade showed that the management base thatsupported the commercial sector was neither particularly strong nor deep. Theyalso highlighted the oligopolistic nature of the economy, in which control ofa broad spectrum of activities accrues to a small group either through directownership, through control of parastatal enterprises, or as a result ofagreements reached with the handful of multinational corporations operating inMalawi .W/
Policies and practices did not support an open economic environment:Any significant economic activity to be initiated required the agreement andinvolvement of those currently exercising controlling interests in the economy.Following independence, Malawi's population doubled; and the economic developmentof this era saw the creation of a productive base exploiting a clear comparativeadvantage and the growing labor pool. The interests that had been created in
.i1/ See World Bank, 1988, for an indication of the multilateral perspectiveon Malawi's adjustment process in the 1980s.
12/ The managed nature of Malawi's economy has been previously recognized.See Wolgin and others, 1983.

- 217 -
this process and the institutions that supported them were not particularlyamenable to the risks associated with unmanaged competition.
Malawi (often used as an example of market orientation in Africa) hasa basic foundation that depends on managed development. While experience hasshown that such management can produce good results, it has also shown that goodresults require strong breadth and depth in leadership. They also depend on the"vision" of the managing group and the system it creates in the expansion ofeconomic activity.
The nature of the vision and the shallow management skills in Malawipresent problems for the country's future for two reasons. First, Malawi'sdevelopment vision has strongly depended on the views of its president sinceindependence, whose age is reputedly between 84 and 92. While the rules forsuccession are spelled out in Malawi's constitution, few predict a smoothtransition.
Second, the extent to which the HIV virus has spread in Malawi'spopulation will affect the availability of management skills and significantlychange the country's longer-term prospects. Because data are very closely heldby Malawi's health authorities, speculation on the subject is based on anecdotalevidence from health workers and personal tales of loss. Estimates of HIVinfection rates for the active population range from a low of 17 percent to ahigh of 40 percent; and it is currently thought that one-sixth of the infectedpopulation will develop AIDS in any given year. Thus, the medium-term prospectsfor Malawi are truly tragic.
At present, the magnitude of the epidemic and its effects cannot beproperly quantified. However, some basics do seem clear. Deaths from AIDS willhave a devastating effect on the pool of individuals from which Malawi's futuremanagers and administrators will be chosen. Thus, Malawi will not havesufficient numbers of qualified nationals to staff the administrative andmanagement positions to support the strong, outward-oriented growth projectedfor its current program and borrowing agreements. For example, at the veryleast, we can expect that the country will not be able to service its externaldebt accrued under the prescribed adjustment strategy. This may be a minor pointbut external creditors, especially the multilaterals, should begin to examinethe conditions under which such obligations will be forgiven in light of thissituation.
The epidemic will also affect the medium-term future of the ruralsector. Aside from the human toll, there will be a marked decrease in theactive, working-age population. It also seems likely that there will be asignificant drop in the crude birthrate and some increase in the under-fivemortality rate. The traditional extended family system will mitigate the welfareeffects from the loss of working family members. But it is likely that in someinstances, extended family support may not survive the epidemic, and this willplace additional burdens on strained government services.
While a drop in population and birthrate levels may help ease landpressures for smallholder production, basic problems in smallholder cultivation
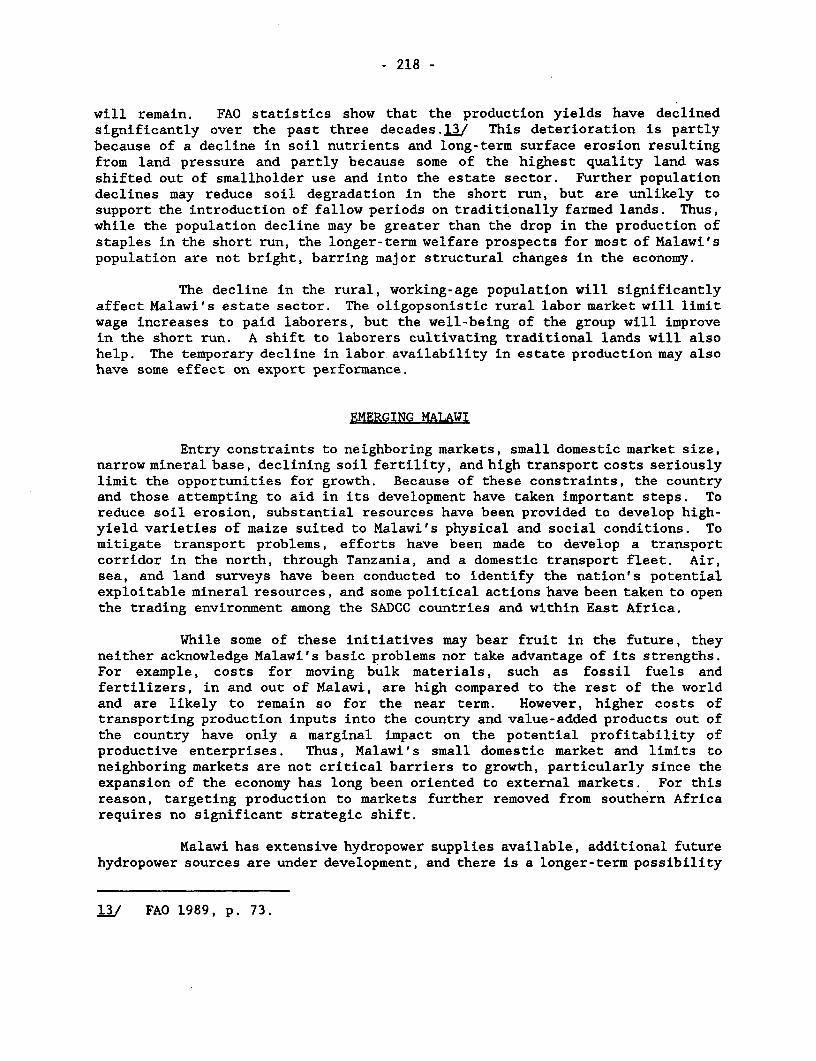
- 218 -
will remain. FAO statistics show that the production yields have declinedsignificantly over the past three decades.1.3/ This deterioration is partlybecause of a decline in soil nutrients and long-term surface erosion resultingfrom land pressure and partly because some of the highest quality land wasshifted out of smallholder use and into the estate sector. Further populationdeclines may reduce soil degradation in the short run, but are unlikely tosupport the introduction of fallow periods on traditionally farmed lands. Thus,while the population decline may be greater than the drop in the production ofstaples in the short run, the longer-term welfare prospects for most of Malawi'spopulation are not bright, barring major structural changes in the economy.
The decline in the rural, working-age population will significantlyaffect Malawi's estate sector. The oligopsonistic rural labor market will limitwage increases to paid laborers, but the well-being of the group will improvein the short run. A shift to laborers cultivating traditional lands will alsohelp. The temporary decline in labor availability in estate production may alsohave some effect on export performance.
EMERGING MALAWI
Entry constraints to neighboring markets, small domestic market size,narrow mineral base, declining soil fertility, and high transport costs seriouslylimit the opportunities for growth. Because of these constraints, the countryand those attempting to aid in its development have taken important steps. Toreduce soil erosion, substantial resources have been provided to develop high-yield varieties of maize suited to Malawi's physical and social conditions. Tomitigate transport problems, efforts have been made to develop a transportcorridor in the north, through Tanzania, and a domestic transport fleet. Air,sea, and land surveys have been conducted to identify the nation's potentialexploitable mineral resources, and some political actions have been taken to openthe trading environment among the SADCC countries and within East Africa.
While some of these initiatives may bear fruit in the future, theyneither acknowledge Malawi's basic problems nor take advantage of its strengths.For example, costs for moving bulk materials, such as fossil fuels andfertilizers, in and out of Malawi, are high compared to the rest of the worldand are likely to remain so for the near term. However, higher costs oftransporting production inputs into the country and value-added products out ofthe country have only a marginal impact on the potential profitability ofproductive enterprises. Thus, Malawi's small domestic market and limits toneighboring markets are not critical barriers to growth, particularly since theexpansion of the economy has long been oriented to external markets. For thisreason, targeting production to markets further removed from southern Africarequires no significant strategic shift.
Malawi has extensive hydropower supplies available, additional futurehydropower sources are under development, and there is a longer-term possibility
132 FAO 1989, p. 73.

- 219 -
of tapping into a rehabilitated Cabora Bassa network. These hydroelectricsources would certainly serve the basic energy needs of developing lightindustries.
Finally, there are the issues of soil degradation and the naturalresource base. It seems likely that resources identified as a result of thepreviously noted surveying activities will be exploited in the near future. Theextent to which they will improve Malawi's trade balance is not clear at present.(However, returns will probably not materialize in the near future or be largeenough to resolve looming balance of payments problems.) Soil degradation andfeeding the population are difficult to address but are not separate from thelarger strategic problem: In the future, rural Malawians must shift from thecurrent low-productivity farming activities by changing methods, and must alsoincrease non-farm production.
It now appears that large gains can be made through the developmentof assembly activities, light industry, and shifts in rural farming approaches.However, such gains are feasible only if various forms of support are introduced.
The first form of support has to do with the pool of availableadministrators and managers. USAID, UNDP, the World Bank, and others areactively supporting training activities, but they do not address the underlyingproblem in view of the likely toll from AIDS.i,4/ Accurate information on theextent of the epidemic needs to be made available and an assessment of its impacton the nation's labor skills needs to be developed. Based on that assessment,realistic plans are required to ensure the continuing operation of the nation'sinfrastructure. The training of adequate numbers of Malawians will have to beundertaken along with interim staffing by expatriates for critical skills. Thefinancial resources needed to support such activities are likely to be wellbeyond the currently identified transfer pipeline.
Second, creating the appropriate environment for the development ofprivate enterprise is critical. As was mentioned earlier, there is more thana passing resemblance between the issues in Malawi's development and those insome of Eastern Europe's emerging economies. Like Eastern Europe, Malawi mustdeal with the transition from a closely managed economy to an environment withsufficient independence and incentives to foster the growth of new production.It must decide how to allow expatriates to enter the economy, bringinginformation and financial resources, without losing sovereignty or antagonizingdominant interest groups. It must structure the environment in a way that allowsMalawians to improve their skills over time and increase the returns to theiractivities. Finally, Malawi must determine how to support the development andequitable distribution of its assets among its citizens, starting from anextremely skewed position.
14J In the ReRort to the Consultative Group... (World Bank 1988), forexample, the section on human resources contains no reference to AIDS-related problems.

- 220 -
The emerging nations of Eastern Europe are a few steps ahead of Malawi(and other African nations that can be seen in a similar light). In general,their skill level is already substantial. Perhaps more important, they all havelong histories as independent nations with a strong internal sense of futurepotential. They will also enjoy substantial resource transfers from thedeveloped economies that are supporting their historic shift in politicalalignment. Nevertheless, their future remains unclear.
In some sense, Malawi is more fortunate. "Back of the envelope"calculations indicate that the creation of 200,000-300,000 jobs in non-farmproduction over the next five years would set Malawi on a growth path that mightparallel the "Asian tigers." This number is quite large relative to Malawi'shistory of non-farm paid employment, but is minuscule (and therefore plausible)in global terms.
At present, Malawi lacks the characteristics necessary to lead a non-Malawian entrepreneur to establish business there (except under the types ofrent-sharing agreements that have characterized past transnational activities)rather than in established third world centers such as Mexico or Thailand.However, Malawi does have wage rates that more than offset added transportationcosts in establishing its competitiveness (even when wages are adjusted forproductivity). Further, it has an exceptional climate and abundant water.Moreover, the distance it must cover in adapting its political perspective toan environment supporting direct investment activities is far shorter than thatof many which have completed that journey. The fact that there has been littlepressure to create the conditions for growth is because the vision needed todefine what is possible (rather than popular views and traditions that arecontrary to the nature of such development) has been missing.
Questions on Malawi's emergence therefore must focus on the futureforces in the country's political economy. It seems clear that the forces ofthe 1990s differ substantially from those of the preceding decades and that nopopular vision of economic opportunity will emerge in the absence of dynamicleadership.. The prospects for increasing the productive output are limited inthe absence of an environment of opportunity and initiative.
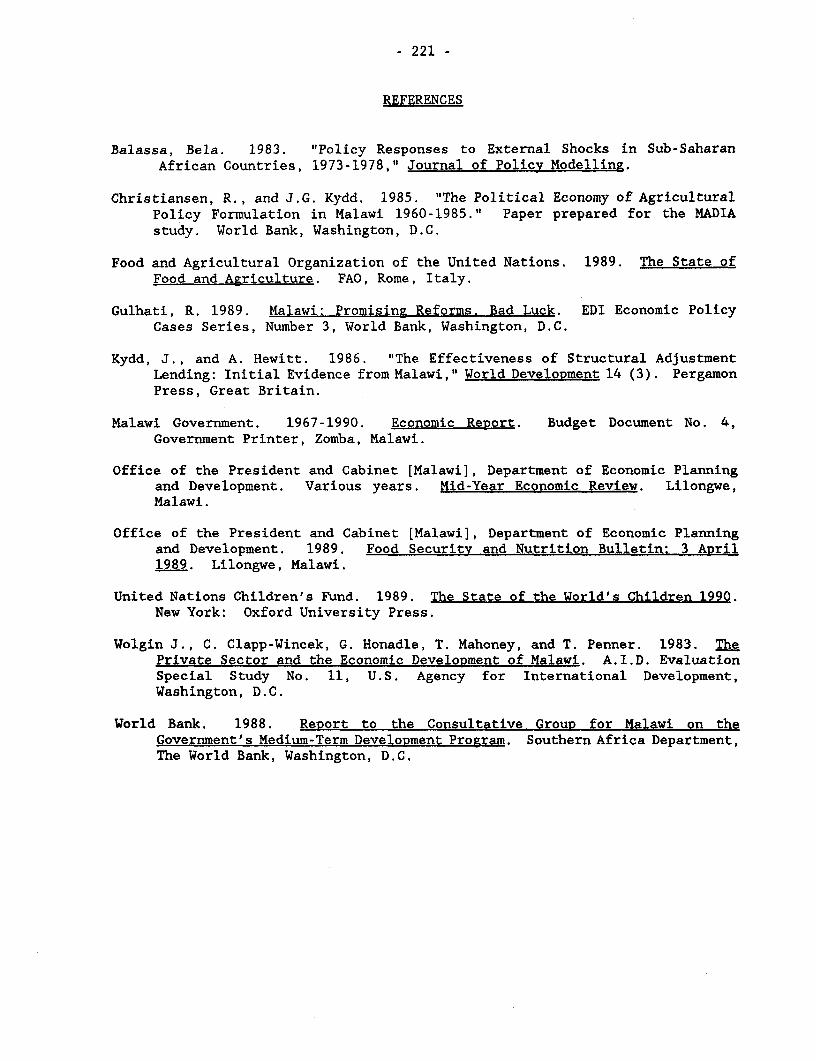
- 221 -
REFERENCES
Balassa, Bela. 1983. "Policy Responses to External Shocks in Sub-SaharanAfrican Countries, 1973-1978," Journal of Policy Modelling.
Christiansen, R., and J.G. Kydd. 1985. "The Political Economy of AgriculturalPolicy Formulation in Malawi 1960-1985." Paper prepared for the MADIAstudy. World Bank, Washington, D.C.
Food and Agricultural Organization of the United Nations. 1989. The State ofFood and Agriculture. FAO, Rome, Italy.
Gulhati, R. 1989. Malawi: Promising Reforms. Bad Luck. EDI Economic PolicyCases Series, Number 3, World Bank, Washington, D.C.
Kydd, J., and A. Hewitt. 1986. "The Effectiveness of Structural AdjustmentLending: Initial Evidence from Malawi," World Development 14 (3). PergamonPress, Great Britain.
Malawi Government. 1967-1990. Economic Report. Budget Document No. 4,Government Printer, Zomba, Malawi.
Office of the President and Cabinet [Malawi], Department of Economic Planningand Development. Various years. Mid-Year Economic Review. Lilongwe,Malawi.
Office of the President and Cabinet [Malawi), Department of Economic Planningand Development. 1989. Food Security and Nutrition Bulletin: 3 April1989. Lilongwe, Malawi.
United Nations Children's Fund. 1989. The State of the World's Children 1990.New York: Oxford University Press.
Wolgin J., C. Clapp-Wincek, G. Honadle, T. Mahoney, and T. Penner. 1983. ThePrivate Sector and the Economic Development of Malawi. A.I.D. EvaluationSpecial Study No. 11, U.S. Agency for International Development,Washington, D.C.
World Bank. 1988. Report to the Consultative Group for Malawi on theGovernment's Medium-Term Development Program. Southern Africa Department,The World Bank, Washington, D.C.
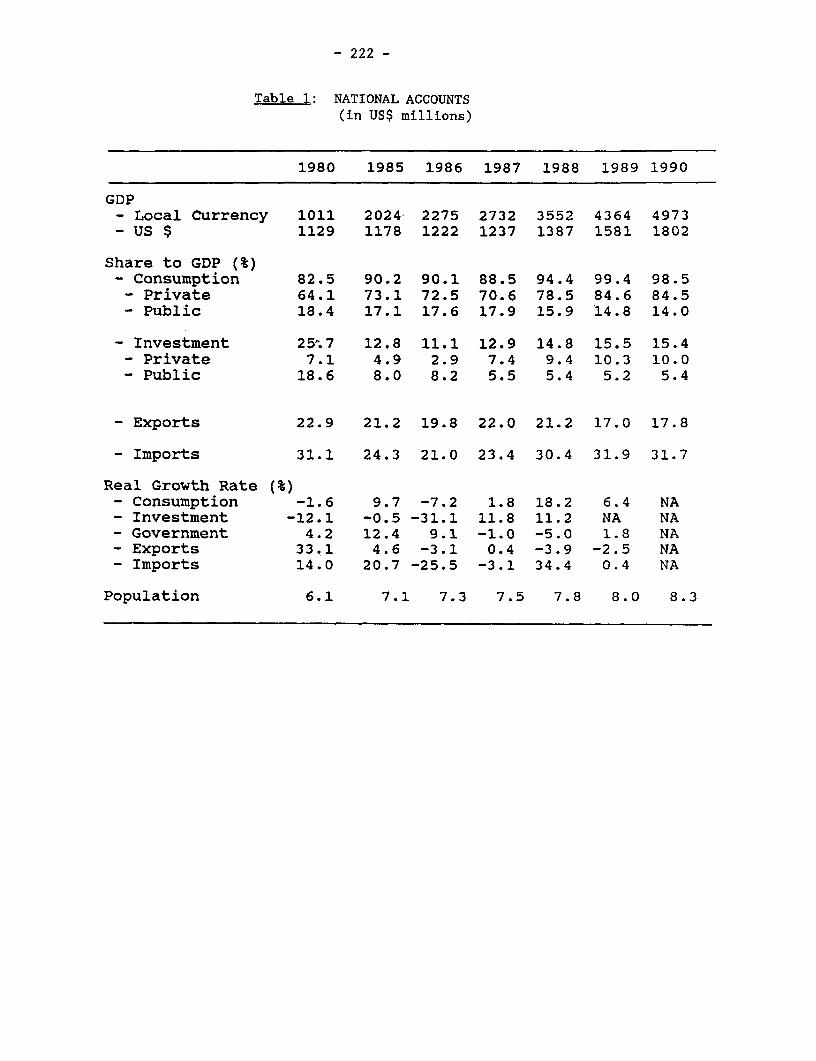
- 222 -
Table 1: NATIONAL ACCOUNTS(in US$ millions)
1980 1985 1986 1987 1988 1989 1990
GDP- Local Currency 1011 2024 2275 2732 3552 4364 4973- US $ 1129 1178 1222 1237 1387 1581 1802
Share to GDP (%)- Consumption 82.5 90.2 90.1 88.5 94.4 99.4 98.5
- Private 64.1 73.1 72.5 70.6 78.5 84.6 84.5- Public 18.4 17.1 17.6 17.9 15.9 14.8 14.0
- Investment 25;.7 12.8 11.1 12.9 14.8 15.5 15.4- Private 7.1 4.9 2.9 7.4 9.4 10.3 10.0- Public 18.6 8.0 8.2 5.5 5.4 5.2 5.4
- Exports 22.9 21.2 19.8 22.0 21.2 17.0 17.8
- Imports 31.1 24.3 21.0 23.4 30.4 31.9 31.7
Real Growth Rate (%)- Consumption -1.6 9.7 -7.2 1.8 18.2 6.4 NA- Investment -12.1 -0.5 -31.1 11.8 11.2 NA NA- Government 4.2 12.4 9.1 -1.0 -5.0 1.8 NA- Exports 33.1 4.6 -3.1 0.4 -3.9 -2.5 NA- Imports 14.0 20.7 -25.5 -3.1 34.4 0.4 NA
Population 6.1 7.1 7.3 7.5 7.8 8.0 8.3
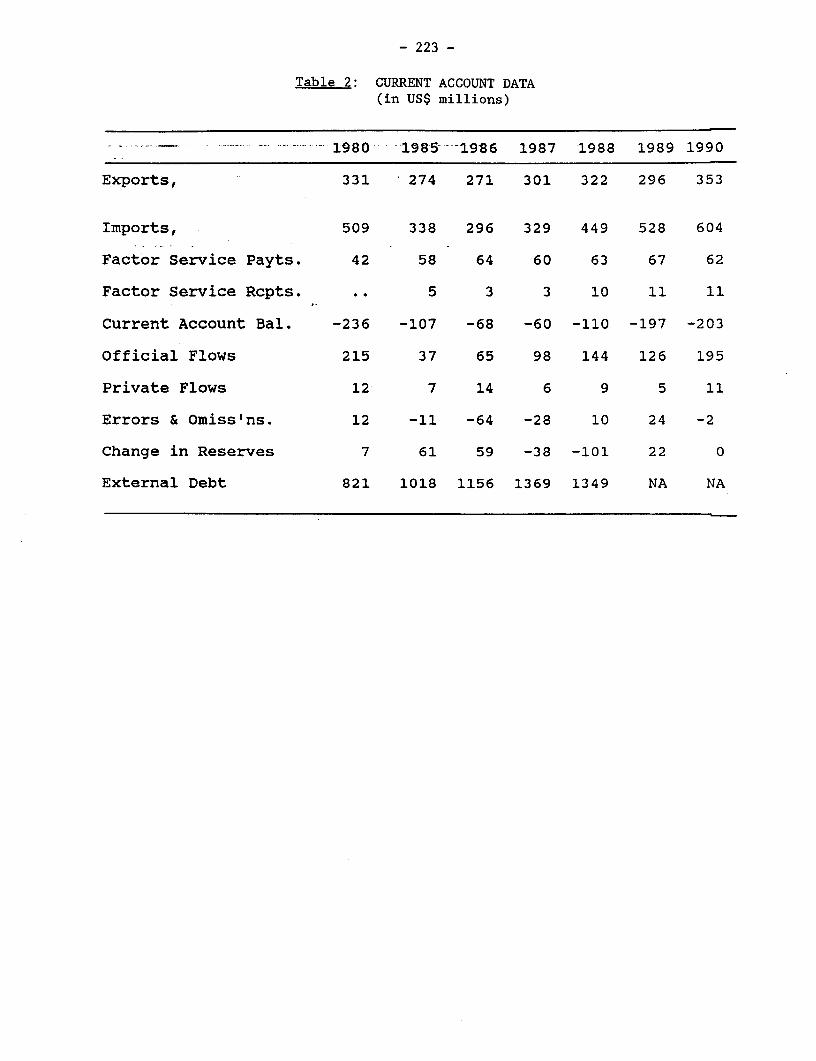
- 223 -
Table 2: CURRENT ACCOUNT DATA(in US$ millions)
1980 19 85- 1986 1987 1988 1989 1990
Exports, 331 274 271 301 322 296 353
Imports, 509 338 296 329 449 528 604
Factor Service Payts. 42 58 64 60 63 67 62
Factor Service Rcpts. 5 3 3 10 11 11
Current Account Bal. -236 -107 -68 -60 -110 -197 -203
Official Flows 215 37 65 98 144 126 195
Private Flows 12 7 14 6 9 5 11
Errors & Omiss'ns. 12 -11 -64 -28 10 24 -2
Change in Reserves 7 61 59 -38 -101 22 0
External Debt 821 1018 1156 1369 1349 NA NA

Table 3: PUBLIC SECTOR(All Data as % of GDP)
Consolidated Non-Financial Public Sector(Including Public Enterprises)
Financing of DeficitCentral Government Domestic External Inflation
Revenue Expenditure Balance Revenue Expenditure Deficit Loans Loans, Tax OtherCurrent Capital Current Capital
1981 23.8 23.9 11.7 11.8 36.5 37.8 14.4 15.7 .8.9 6.9 0.6 0.71982 23.0 20.6 8.3 5.9 36.1 35.5 13.8 13.2 '0 3.5 0.6 -2.11983 22.3 20.4 8.5 6.7 40.0 36.9 12.1 9.1 5.4 3.1 0.8 0.21984 23.0 18.8 9.0 4.7 38.2 37.1 10.4 9.3 2.6 4.6 1.1 -1.01985 25.1 21.7 9.5 6.1 41.0 41.5 11.0 11.5 4.9 3.2 0.9 -2.51986 24.9 24.4 9.5 9.0 42.8 43.2 11.2 11.6 2.4 6.9 1.1 -1.3
1987 23.9 22.6 7.6 6.3 40.9 38.2 11.5 8.8 3.4 2.9 2.6 0.1
1988 27.1 20.6 9.6 3.1 46.5 34.9 14.8 3.1 -1.5 4.6 4.0 3.9
1989 26.7 21.8 6.8 1.9 NA NA NA NA NA NA NA NA
Sources: Malawi Government Economic Report, International Financial Statistics
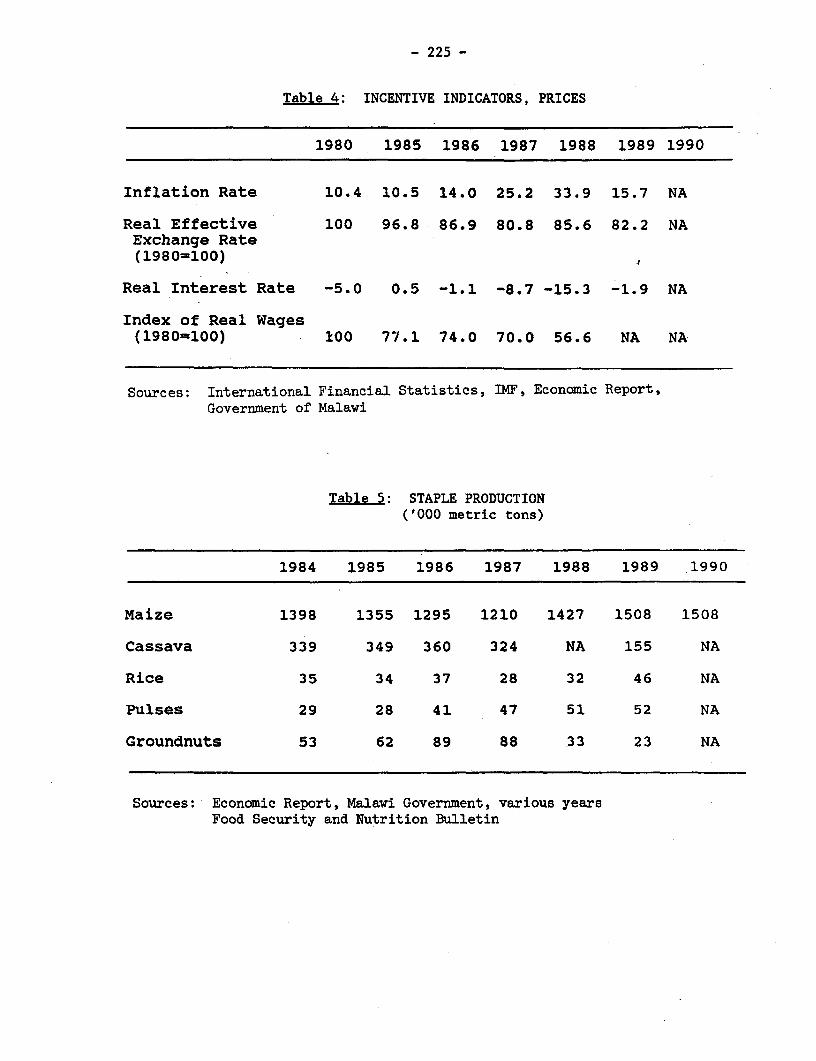
- 225 -
Table 4: INCENTIVE INDICATORS, PRICES
1980 1985 1986 1987 1988 1989 1990
Inflation Rate 10.4 10.5 14.0 25.2 33.9 15.7 NA
Real Effective 100 96.8 86.9 80.8 85.6 82.2 NAExchange Rate(1980=100)
Real Interest Rate -5.0 0.5 -1.1 -8.7 -15.3 -1.9 NA
Index of Real Wages(1980=100) 100 77.1 74.0 70.0 56.6 NA NA
Sources: International Financial Statistics, IMF, Economic Report,Government of Malawi
Table 5: STAPLE PRODUCTION('000 metric tons)
1984 1985 1986 1987 1988 1989 1990
Maize 1398 1355 1295 1210 1427 1508 1508
Cassava 339 349 360 324 NA 155 NA
Rice 35 34 37 28 32 46 NA
Pulses 29 28 41 47 51 52 NA
Groundnuts 53 62 89 88 33 23 NA
Sources: Economic Report, Malawi Government, various yearsFood Security and Nutrition Bulletin
- 226 -
COMMENTARY BY CHARLES HUMPHREYS
My comments deal mainly with the first part of Mr. Meyer'spresentation and focus on the experience in Malawi. He describes theexperience in Malawi as one of suspended takeoff, which seems to be explainedas a combination of a one-time shift in economic productivity-- moving outto the production frontier--coupled with deteriorating public economicmanagement, including parastatals. The productivity increase resulted frombringing most of the available high-productivity land under quasi-public,estate agriculture, so that further gains from that source of growth in thefuture are now limited. Economic management deteriorated as the state sectorbecame increasingly over-extended. The proposal for more and better managersstems from this assessment and is reinforced by the judgement that AIDS willreduce available management talent. Opening up the economy to more domesticparticipation, particularly in investment, as in Eastern Europe, is expectedto widen the pool of managers. I have no problem with the recommendations.However, I am not sure they flow from the analysis in the paper.
The paper presents Malawi as a different case. It is a successstory where there have not been very many successes, and it shows thatreforms and adjustment can lead to better growth. However, it might beuseful to chart how Malawi is different from other African countries and howit not. Looking at structural or economic performance measures, Malawi doesnot differ much from most other low-income African countries. It has a highshare of agricultural population. It has a low share of industry andmanufacturing in GDP--in fact, a little lower than the average for low-incomeAfrica. It has a very large services sector, 40 percent of GDP. The fiscaldeficits in Malawi in the 1980s were not much different from those in otherAfrican countries. The inflation rate -- at about 15 percent during the1980s--was about the median for low-income Africa. The country gets the samelevel of Official Development Assistance, per capita, as do other low-incomecountries--about US$35 a year. Life expectancy is only a little lower thanAfrica's average--at about 50 years. In many ways, Malawi is a typical,small, low-income country that is heavily dependent on aid flows, heavilydependent on agriculture, and has a very large services sector.
However--and I think this is important--some differences makeMalawi stand out from the typical low-income African country. First, it isa lot poorer, with a per capita income about half that of other low-incomeAfrican countries. When the base is so extremely low, a lot of growth stilldoes not raise incomes very much, which may explain why Malawi has not hadan extended, dramatic--or "unsuspended"--takeoff.
Second, there has been a much more limited shift to the urban areas(which may be one reason why the urban areas apparently seem so clean and towork so well). This has pluses and minuses. It makes less demand on urbanservices, but it makes it a lot more difficult to provide social services tothe poor, which are mostly in the rural areas. This may be one of thereasons why some of the social indicators, particularly on nutrition, seemto be so much worse in Malawi than elsewhere.
- 227 -
Third, the country has had much higher economic growth than otherAfrican countries, including much higher agricultural growth. To illustrate,the growth in the FAO agricultural production indices for 1975-80 averaged0.9 percent a year for the IDA recipients in Africa but 4.1 percent forMalawi, four times higher. In 1980-85, agricultural production grew at 1.6percent a year for the other Sub-Saharan IDA countries, but 2.7 percent forMalawi, twice as high. Clearly, in a continent that is characterized by pooragricultural performance, Malawi has done much better than the average. Thequestion is whether this is a one-time phenomenon--as suggested in thepaper--or whether it demonstrates there is a basis for continued growth ofthe agricultural sector.
Fourth, Malawi seems, by almost all accounts, to have much strongereconomic institutions and a better functioning- -and less corrupt- -government,which means that the enabling environment for private investment is betterthan in many--if not most--African countries. However, it is a differentquestion as to whether it is profitable to invest in Malawi, which isaffected by the country's growth prospects as well as its current prosperity.
Fifth, domestic savings in Malawi have been higher than mostAfrican low-income countries. During 1980-85, which was a tough period forMalawi as well as other countries, gross domestic savings (as a percent ofGDP) was seven percentage points higher than the average for low-incomeAfrican countries. This difference is quite a lot when the average savingsrate in low-income Africa is only about 7 or 8 percent, which means thesavings rate in Malawi was almost double. Half of this difference went topay higher interest abroad, because the country has a higher level ofcommercial debt than most low-income countries. But the country also hadhigher rates of domestic investment; and, looking to the longer term, thishigher rate of investment should facilitate recovery and continued highgrowth.
Thus, the picture of Malawi as different from other low-incomeAfrican countries, with an economy that is better run, is borne out by itsbetter macro-economic statistics. Given this, the question is: why hasMalawi had a "suspended" takeoff? It is on this point that I want take issuewith the paper's analysis.
The paper seemed to downplay the effect of the terms-of-tradeshock--or rather the combination of external shocks, including the increasein oil prices, the decline of export commodity prices, the disruption of railtransport, and an enormous influx of refugees. These shocks put a muchgreater strain on Malawi's domestic economy than most other countriesexperienced. However, the paper largely simply asserts that the importanceof the shift in terms of trade was in reality less than usually assessed,without much supporting analysis. The evidence suggests that the externalshocks were severe--compared either to the past or to other countries. Butperhaps more importantly, their negative effects may have been amplified bythe kind of reform measures the government took in response. The governmentfollowed a classic, traditional macro-economic stabilization approach, somuch so that by 1984, it had eliminated its current account deficit--adramatic macro-economic stabilization. When an extremely poor countryadjusts by compressing expenditures and national absorption to the point
- 228 -
where there are no longer any deficits, it is likely that most growthprospects have been wrung from the economy as well. This leads to threequestions.
First, if Malawi had taken a different reform approach--perhapssupported more generously from the beginning by additional foreignsavings--would its growth in the latter part of the 1980s have been better?A lesson may be that there could have been an alternative response to theparticular kind of external shock that Malawi faced, which would have beenmore growth-oriented.
The second question is whether the gains in agricultural growththat resulted from shifting high productivity land into quasi-public, buttechnologically more advanced, estate agriculture can be replicated on landof lower potential? It would be useful to analyze in more depth whetherMalawi's earlier large gains in agriculture were a one-time spurt that cannotbe sustained or whether they represent a basis for continued (or renewed)strong performance.
A third question is what exactly is the "managerial problem" inMalawi? The paper discusses two different views: that existing managementtalent is over-extended for the task required; and that prohibitions onoutsiders participating limit the pool of managerial talent. It is not clearwhether the problem is managing only public activities or also privateeconomic activities; nor is it clear from the paper whether public managerswere skilled but made the wrong decisions or simply not very good.
It may be useful to explore in more depth how the style of themanagement--which was described as oligopolistic and closed to outsiders--has affected economic performance. One possible effect is reduced investment(although investment in Malawi has been above the norm). However, in acountry that is extremely poor, that is land-locked, that has limited naturalresources, and that has a clear transportation problem for internationaltrade, the potential for increased foreign investment is likely to belimited. And it is not clear what would be the source of significantlyincreased domestic investment from the local private sector when incomes areso low. In short, it would be useful to describe how a different managementstyle would lead to larger and more diverse investment and wider options.
Answers to these questions might help explain what has been goingon in Malawi. I am perplexed by Malawi, because, on the one hand, it is anexample of a country that has had, by national accounts data, strong economicgrowth, despite some recent problems as in most countries. Yet by mostaccounts, it also has one of the worst set of social indicators in Africa.Why is there this divergence? It may mean that the transmission of growthto the poor is inadequate in Malawi, which is the crux of developmenteconomics. Answering questions about Malawi might shed new light on ourdevelopment theories.

THE MEDIUM-TERM PROSPECTSFOR THE TURKISH ECONOMY
Korkut Boratav
With commentary by James Hanson

- 231-
TABLE OF CONTENTS
Page No.
DISTRIBUTIONAL DYNAMICS .... . . . . . . . . . . . . . . . . . 234
PATTERNS OF ACCUMULATION AND POTENTIAL GROWTH . . . . . . . . . . 238
EXTERNAL LINKAGES AND SELF-RELIANCE . . . . . . . . . . . . . . . 242
CONCLUDING REMARKS . . . . . ... . . . . . . . . . . . . . . . 244
REFERENCES.245REFER NCES . . . . . . . . . . . . . . . . . . . . . . . . . . . 24
TABLES
1 Indicators of Distribution and of Sectoral Relative Prices . 2462 Potential and Actual GDP and Investments . . . . . . . . . . . 2473 Gross Fixed Capital Formation: 1977-89 .2484 Gross Fixed Capital Formation: 1977-89 .2495 Indices of Real Value Added per Worker in Manufacturing. . . . 2506 Balance of Payments: Current Account . . . . . . . . . . . . 2517 Balance of Payments: Capital Account . . . . . . . . . . . . 252
COMMENTARY BY JAMES HANSON ................... 253


- 233 -
Debates on economic policy in Turkey during the last decade havecentered predominantly on the short term. The stabilization paradigm is stillforemost 10 years after the adoption of the well-known stabilization program in1980. During the 1980s, policymakers in Turkey always addressed adjustmentissues in the short term. Strategic themes such as long-term growth, dynamicsof income distribution, and structural change favored by the founders ofpolitical economy and the grand old masters of development economics have beenabsent from the economic policy discourse. This paper moves against theprevailing current.
I will discuss the medium-term prospects for the Turkish economy, onthe basis of its performance since 1977. I will not discuss short-termperformance indicators of conventional policies but will investigate some oftheir medium- and long-term implications.
Growth, income distribution, and self-reliance are my choice ofperformance indicators and goals for the economy for the medium and long term.I will use them to assess past trends and to discuss medium-term prospects forthe Turkish economy. All such components of national or social welfare as pricestability, external equilibrium, and unemployment, although they seem absent fromthe foregoing categories, are incorporated in my performance indicators. And,as we move away from the short-term paradigm, it makes a great deal of differenceto perceive policy goals in terms of growth, income distribution, and self-reliance.
There should be no serious cause for disagreement in endorsing thesethree notions as long-term policy goals--even the controversial concept of self-reliance. When they are translated into operational categories, value judgmentsand ideological positions may create disagreements. Conscious that I am notimmune from such influences, I will clarify the three concepts.
As a policy goal and performance indicator of growth, I propose to usethe growth potential of the national economy, rather than actual growth ofnational income. In operational terms, potential growth rates will takeprecedence over actual GDP growth rates. This gives an analytical emphasis torates and patterns of capital accumulation and to its effectiveness, asrepresented by such measures as incremental capital output ratios (ICOR). Outputincreases resulting from increased capacity utilization or from once-and-for-all improvements in resource use are not considered positive performance if theytake place under declining potential growth rates. I will argue that this hasbeen the case for the Turkish economy since 1977. This approach is helpful whenwe move from a short-term to a long-term perspective.
For income distribution as a goal and performance indicator, I prefersocial classes and their socioeconomic groups as basic units of analysis. Suchan emphasis moves away from personal distribution of income toward a concept ofincome distribution akin to, but not identical to, functional distribution. Iconsider any distributional shift against labor income an adverse change. Anydecline in relative wages and relative prices in agriculture are considered

- 234 -
adverse distributional shifts because of Turkey's predominantly peasantagriculture. I do not take a normative position on the internal redistributionof the surplus, that is, redistribution in nonlabor income. I assess theincidence of such changes on our other performance indicators, particularlypotential growth.
Self-reliance as a policy goal and performance indicator implies nopreference for a "closed," or "autarkic," economic structure. I cannot elaborateon the concept without a semi-philosophical discussion of dependency themes.A full treatment of self-reliance requires an investigation of alternativepatterns of articulation in the world economy, of the resilience of internaleconomic structures faced by adverse economic changes abroad, and of issues oftechnological progress. I define self-reliance as an economy's ability tofulfill its external (import) requirements from internal sources, while attaininga socially acceptable medium-term growth rate and pattern. This interpretationfocuses on attaining external equilibrium under a "satisfactory" growth rate andpattern. The two opposite cases of low or negative growth under conditions ofexternal equilibrium (or of transfers abroad), and of high growth accompaniedby external disequilibrium, violate our norms of self-reliance. By thisinterpretation, self-reliance loses its conceptual purity and becomes intertwinedwith our other goal of growth.
Of the three indicators--growth, income distribution, and self-reliance--I prefer to discuss income distribution first, growth issues second,and, third, external linkages and their implications for self-reliance. To startwith income distribution may seem a questionable approach: you cannot distributewhat is not initially produced. I provide two justifications for this unorthodoxorder: first, following in the footsteps of Ricardo, who perceives "the lawswhich regulate distribution [as] the principal problem of political economy,"I feel that dynamics of distribution determine accumulation and growth ofnational product. Second, I believe that incomes policies and associateddistributional changes were the main cause of structural change in the 1980s.This will emerge from the following section. In the recent experience of theTurkish economy, distributional changes shaped patterns of capital accumulationand of growth. If this observation is correct, the analysis of the dynamics ofincome distribution should precede the other indicators.
In each section, the medium-term prospects for the economy are derivedfrom observations made on trends since 1977. The discussion of past performanceshould provide clues for the 1990s as well.
DISTRIBUTIONAL DYNAMICS
Table 1 presents the most significant indicators of income distributionbetween 1977 and the late 1980s. The table also includes terms of trade formajor sectors. I will show that they have definite distributional implications.I will not discuss the logic behind the choice and construction of the indicatorsor the theoretical interpretation of the more controversial ones (Boratav 1988),but I will make the following observations on changes in income distribution andtheir implications.

- 235 -
(a) Table 1 shows the large changes in income distribution during the lastdecade. The striking feature of the period is the drastic decline inlabor income, both in relative and absolute terms, as shown under rowsI-III. Both the size and the duration of the relative decline inworker and peasant incomes are without precedent during the republicanperiod (see Boratav 1987b). The secondary relations of distribution,such as internal division of the surplus, observed under rows IV-VI,show important changes during the period, particularly in the 1980s.
(b) I see two causes for these changes: the economic and social crisisof the late 1970s--particularly the deterioration of relative pricesfor peasants--and the economic policies of the 1980s. I have discussedelsewhere (Boratav 1988) the causality between economic policies andchanges in distribution during the 1980s--but I will briefly discusspolicies relevant to changes in the areas. Changes in distribution andin relative prices seem to have been persistent, and, following theinitial shocks, "corrections" and "returns to normalcy" have notmaterialized. Does this indicate fundamental relative pricedistortions during the late 1970s that have been "corrected" throughcrisis and deliberate policies? If so, the present pattern ofdistribution should be seen as a reflection of the natural conditionsof the Turkish economy. If not, the persistence of the patterns ofdistribution that emerged during the early 1980s can be attributed tothe coalition of social forces that controlled distribution almostfully during the last decade through the state apparatus. Theinstitutional, political, and legal framework shaped under the militaryregime during the mid-1980s established the means for this domination.I think that the second interpretation better fits the state of affairsat the end of 1987.
(c) The dramatic regression of wages, in relative terms, went on throughoutthe 1980s (Table 1: rows under I). This trend resulted from thesuspension of trade union activities and of collective bargaining underthe martial law period until the end of 1984, the authoritarianreorganization of labor market institutions within the framework of the1982 Constitution, and the labor legislation that accompanied it.The opposition of Motherland Party (MP) governments to trade unionssince 1984 was also instrumental.
Two qualifications are in order. First, there are a number ofindications that this trend reached its limits sometime in 1988; andthat policymakers, as well as business groups, agree that thedeterioration of the relative income of wage-earners has gone too far.Second, deteriorating wages are not reflected in household incomes ofurban workers. Urban working class families manage to make up forthe regression of wages through economic and social adaptivemechanisms, although they must accept a deterioration in their qualityof life. And although the MP governments were very rigid toward wagedemands of trade unions, they reached out to the urban poor throughmunicipal and social policies. This alleviated the adverse impact of
- 236 -
wage movements (Boratav and Yalman 1989). These factors, together withextremely repressive military measures against workers' movementsduring the early 1980s, explain in part why uneasy peace reigned onthe labor front up to 1987.
(d) Relative prices received by farmers, represented by terms of trade(Table 1: row IIA), their most comprehensive quantitative indicator,deteriorated dramatically throughout the period. Note that the majorpart of the regression takes place during the late 1970s. But, unlikecompensating relative price movements, which typically occur during theearlier phases of swift changes in internal terms of trade, thedeterioration continues to the end of 1988. Another indicator ofrelative prices for farmers, such as commercial margins foragriculture-based commodities, shows a similar tendency--significantlystrong with respect to the "price scissors" between unit export pricesreceived by farmers. I will try to show in the next section that thesedevelopments have taken their toll on agricultural investment. Farmersresponded by exploiting family labor and suppressing householdconsumption to sustain their level of current inputs. This explainsthe modest productivity increase achieved throughout the period despitedeteriorating relative prices (Boratav and Yalman 1989). Theseadaptive mechanisms were also at the cost of "the quality of life" inpeasant households.
What are the causes of this dramatic deterioration of agriculture'sterms of trade? A conventional analysis, structured around demandelasticities and supply and demand shifts, is not illuminating. From1977 to 1987, agricultural value added grew 2.9 percent annually,whereas the average growth rate of aggregate demand was 4 percent.Under any reasonable elasticity estimates, these growth rates cannotaccount for the dramatic deterioration of agriculture's terms oftrade--about 30-50 percent (Table 1: row VIIA)--or of industry'sterms of trade (Table 1: row VIIB). The explanation probably restson the gradual reduction of public support for agriculture during theperiod (Boratav 1988; Uygur 1987).
(e) During the 1980s the internal division of the surplus shifted in favorof rentiers (Table 1: rows under VI); in favor of financial capital(rows VA and VIIG); and, definitely, against net industrial profits(rows under VI). Extremely high interest rates prevented industrialcapital from preserving the huge profits that could have accrued to itthrough depressed wages. The largest private industrial firmsallocated one-half to two-thirds of their gross industrial profits totheir interest obligations (row IVA). Commercial margins changed infavor of traders, reflecting improvement in the relative economicposition of commercial capital (rows under III, in particular IIIE,IIIF, rows VB and VIIIE). Higher interest rates also imposed demandson the gross profits of this group.
These changes are clearly linked to the economic policies of theperiod: the liberalization of the financial system and the obsession
- 237 -
of policymakers with offering positive interest rates to savers.Rentier incomes from deposit interests and government bonds reached thespectacular ratio of 14 percent of GDP in 1988--a definite anomalywith serious long-term implications for the accumulation and growthprospects of the national economy. Policies also favored commercialover productive activities and favored large, specialized exportcorporations. I look at the long-term effects of these distributionalchanges in the next section.
(f) Major changes in sectoral terms of trade occurred (Table 1: rowsunder VII). At first glance, the most important change seems to be inthe relative prices in the agricultural and industrial sectors--adevelopment I have already discussed--while the service sector'srelative prices appear stable. The stability of the non-trade servicesector implies definite improvement vis-a-vis agriculture--a phenomenonrequiring explanation. The change in the relative price of a sectorcan be disaggregated into two major components: imported or localcosts, and gross distributive margins (or mark-ups). The latterreflects mainly the effects on distribution of relative price changes.Thus the dramatic improvement of relative industrial prices (row VIB)stems from increases in prices of imported inputs and from higher mark-ups. The average mark-up for private manufacturing increased from 26.5percent in 1975-77 to 32.1 percent in 1980-85 (Boratav 1988, TableVII). Due to increased interest charges, industry was unable to keepmost of this improvement in gross margins within the sector.
This observation becomes more evident once we disaggregate the servicesector into its subsectors. The stability of the terms of trade of theservice sector is due to the regression of the "relative prices" of thegovernment subsector, which merely reflects the real decline of thesalaries of civil servants. Once we separate "government" from theanalysis, a further regrouping also produces interesting results: therelative price movements of the construction subsector and transportand communications subsector--like industry's--reflect changes bothin distributive margins and in prices of imported and local goods.Relative price changes in the other four subsectors, on the other hand,reflect mainly distributional changes: commercial margins for trade,interest rates, residential rents, and fees for liberal (and self-employed) professions. A regrouping (row VIIK), in which these lastfour subsectors are labeled "unproductive," and in which agriculture,industry, construction, and transport and communications are labeled"productive" sectors, shows that relative prices for the former haveimproved by nearly 94 percent between 1977 and 1989. This outcomereflects distributive improvements that favor non-productiveservices--excluding government, where the reverse is true. Itconflicts with the predictions of the economists who expect relativeprice movements to be dominated by the effect of the "opening-up" ofthe Turkish economy to tradable and non-tradable activities during the1980s.
- 238 -
(g) Toward the end of the 1980s, the pattern and mechanisms that haddominated distributional dynamics during the early 1980s could nolonger be sustained. MP suffered a major defeat in the local electionsof March 1989. It responded to the defeat and to increased grass-roots workers' militancy by conceding wage increases of 142 percent(about 75 percent in real terms) to public sector workers. Supportprices for farmers were also increased--a factor that, coupled withdrought, led to an improvement in agriculture's terms of trade for1989. There are strong signs that distributional policies targetingworkers and peasants during the 1990s will be dominated by theconventional mechanisms of parliamentary populism.
Since 1988, the business community has not presented a unified positionon the distributional policies dominating the economy in the 1980s.Anomalously high interest charges on industrial profits were toleratedby the industrial lobby under the military regime and during theupswing of MP governments in 1985-87. But strong criticism of the samepolicies was voiced during the stagnant years of 1988-89. Prominentindustrialists claimed that pro-rentier policies undermined industrialexpansion, and they decried the unhealthy trade-off between wages andprofits, on the one hand, and interests on the other.
From my observations on the recent distributional dynamics and theirconsequences, I predict that the 1990s will differ markedly from the1980s. Workers', peasants', and industrialists' demands will have tobe accommodated by any government within a parliamentary framework.Policymakers will need to devise a growth pattern in which therelative--and absolute--economic positions of these groups can nolonger deteriorate and will instead have to improve significantly.
PATTERNS OF ACCUMULATION AND POTENTIAL GROWTH
Tables 2 through 5 provide quantitative information for an analysis ofthe accumulation and growth performance of the economy from 1977 to 1989.Potential growth, the only unconventional category, has been estimated bydetermining years of cyclical peaks in GDP series. They are 1977 and 1987.Corrections for agricultural output were made on the actual GDP for those years.The growth rate from 1977 to 1987 (4.03 percent) was assumed to be the steadypotential growth rate of the period up to 1989. The annual hypothetical GDPfigures thus estimated are the potential GDP figures in Table 2.
The following observations can be made on the accumulation and growthperformance of the economy and its implications for the 1990s.
(a) The potential growth rate of the economy during the 1980s definitelydeclined compared with the 15 years preceding the late 1970s. Duringthe first period, the growth potential of the national economy hadincreased about 6.5 percent annually whereas the corresponding growthrate during 1977-89 was 4 percent. The causes were declining rates ofaccumulation (from about 32 percent in 1977 to about 24 percent during

- 239 -
the second half of the 1980s, in 1987 prices--Table 2, row 5) and,more importantly, decreasing effectiveness of investment (higherICORs). The movement of investments away from sectors and subsectorswith lower capital/output ratios was probably a cause of declininginvestment effectiveness, but how much each factor contributed to thedecline of potential growth has not been calculated.
(b) Following the absolute declines in GDP in 1979 and 1980, the economyshifts to high actual GDP growth: 5.5 percent on average between 1981and 1989. About 1.5 percent of this growth performance is due tohigher rates of economy-wide capacity use (Table 2, row 3). Theincreased capacity use played an important role in the growth ratesrealized by the manufacturing industry--a sector that started fromextremely low rates of capacity use in 1979-80 and showed weakinvestment performance during the 1980s. Observe closely the boom of1985-87 in this context: the upswing started with surges (22 percentin 1986 and 14 percent in 1987) in private investments. The upswinghit the capacity ceiling in 1987, and stagflation resulted in 1988 and1989. This supports my estimates of potential GDP. It also suggeststhat, unless the growth potential of the economy expands significantly,any demand-induced expansion in the early 1990s will bog down in zerogrowth and higher inflation rates in a couple of years.
(c) If we move from rates of accumulation to trends in gross fixed capitalformation (GFCF) and in its internal distribution--both by subsectorand between public and private investment in real terms (Table 3)--wenote the following:
(i) In 1987 prices, total GFCF is about 15 percent higher in 1988-89 than in 1977. This is due to a combination of about 7percent decline in public GFCF and 43 percent increase inprivate GFCF. This may seem to provide intuitive support forthe so-called "crowding-out effect" between public and privateinvestment. However, this impression rests on base-andterminal-year values and disregards the complementaryrelationships between total public and private investment.These relationships were observed in 1985-87, as shown in 2above.
(ii) The entire picture changes when housing investment is excludedfrom private (and total) GFCF. This shows that 87 percent ofthe real increase in private GFCF between 1985 and 1989 is dueto increased housing investment. Also, between 1977 and 1989GFCF minus housing investment decreased 7.4 percent with respectto total GFCF, and 2 percent for private GFCF. Private GFCF(excluding housing), in 1987 prices, never reached the 1977level during the 1980s. In any analysis of investment functionsfor Turkey, it is appropriate to treat housing investmentseparately. Empirical studies suggest that determinants ofhousing investment differ from those of total investment inTurkey. Estimates of linkages between public and private

- 240 -
investment should exclude housing (Baratav, Ersel, and Kepenek1984).
(iii) How can we, then, explain the relative stagnation in total andin private investment throughout the 1980s? This was a periodof enforced industrial peace, of suppressed wages, and ofpolicies favoring private enterprise. Austerity (in the early1980s) and an ideological commitment against state investmentin productive sectors (after 1986), were the causes ofstagnation in public investment. In private investment thestagnation was caused by the dynamics of distribution for theinternal division of the surplus. When redistributive processesare not neutral among rentiers and among holders of financial,commercial, and industrial capital, and if these groups exhibitdifferent savings and investment propensities, total saving andaccumulation are bound to be affected. My emphasis here is oninvestment propensities. The redistribution of the surplusduring the 1980s, from industrial gross profits toward rentierincomes and finance, adversely affects the "animal spirits" ofinvestors. A similar observation can be made with respect tototal private savings (Boratav and Turel 1989b). In otherwords, the dramatic changes in income distribution of the lastdecade have not led to a pattern of resource use favoringcapital accumulation.
(iv) An investigation of the internal, subsectoral distribution ofGFCF strengthens the foregoing conclusions. For publicinvestments, the dramatic real decline (by 60 percent) of the"directly productive" (agriculture, manufacturing, mining)subgroup (Table 3, rows Al-3) between 1977 and 1989 is striking.This decline reached 83 percent in manufacturing. Publicinvestments in "infrastructure" (rows A4-5) and "services" (rowsA6-9) registered overall real increases and peaked in 1986-87.Their contribution did not prevent a decline in the series asa whole in 1977-89. In real movements of private GFCF, theforegoing thesis--on adversely affected "animal spirits"responding to the redistribution of the surplus againstindustrial profits--seems to be valid for private manufacturinginvestment. Investment in private manufacturing in 1989 was 19percent below that in 1977; after registering an upward trendbetween 1980 and 1986, it declined 10 percent by 1989 (row B3).The effect of declining relative agricultural prices on privateagricultural investments can be seen in the real and continuousdecline of GFCF by 56 percent (row B1) in the same period.Farmers used all their resources to sustain current inputs atthe expense of consumption. Capital formation has been thegreatest victim. Private investment in the "directlyproductive" subgroup declined 25 percent during the period.Infrastructure remained roughly stable. Real investments inservices increased nearly 50 percent by the end of the period.

- 241 -
Housing and tourism are the two most dynamic subsectors of thewhole series.
(d) The subsectors' changing shares of GFCF during 1977-89 (Table 4), in1987 prices, clearly shows the changing investment priorities of thegovernment and of the private sector.
(i) Priorities in public investment have changed from "directlyproductive" activities to infrastructure and services. The mainlosers are manufacturing (from 27 percent to 5 percent of publicinvestment) and mining. The main beneficiaries are transportand communications, other public services, and education andhealth. These changes reflect the new orientation ofpolicymakers (Table 4, rows under A).
(ii) Priorities in private GFCF have shifted from productiveactivities and infrastructure to services. Among subsectors,manufacturing, agriculture, and transport and communications arethe major losers. The privileged sectors are housing andtourism. The decline in investment shares of the directlyproductive activities, and of transport and communicationswithin the private sector, becomes dominant under MP governmentsafter 1983 (Table 4, rows under B).
(iii) Between the late 1970s and late 1980s, change in investmentshares favored services over productive activities. Thewithdrawal of the public sector from industrial investments hasnot induced the private sector to close the gap, although thismay have been the expectation of policymakers during the secondhalf of the 1980s. The net outcome was a slow process of de-industrialization in terms of productive capacities.
(e) In 1989, the Turkish economy was investing less in agriculture,manufacturing, and mining, in 1987 prices, than in 1971. The relativeGFCF shares of these three productive sectors shrank by more than halfduring the same period. These are drastic changes in economic structureand in resource use. Their consequences could have been alleviated ifefficiency in these sectors had significantly improved. Table 5 showslabor productivity for manufacturing for 1977-86. Disregarding theevidently erroneous 1986 figure for sector 35, note that productivityin 1985-86 is still significantly below the 1977 level. Productivityimproved between 1980 and 1986 due to increased capacity utilization.Under military rule, firms could not lay off workers without specialpermission from the regional martial law commanders. That is whyincreased rates of capacity use--with roughly the same number ofworkers--improved labor productivity (Table 5). This is evidently animprovement in productivity from artificially enforced low levels that,by itself, does not imply technological and managerial improvements.One must conclude that Turkey's manufacturing industry operated in thelate 1980s at a lower level of technical efficiency than in the pre-crisis years of the late 1970s- -with a capital stock becoming obsolete
- 242 -
due to low levels of investment. The improvements stemming from higherrates of capacity use have been exhausted, and future progress canonly be made if fixed capital formation accelerates significantly.
In agriculture, however, value added per active person rose by anaverage 2.8 percent annually between 1977 and 1985. Productivity perhectare of major crops showed similar increase between 1976-77 and1986-87. Annual growth in land productivity for tobacco, wheat,sunflowers, cotton, and potatoes ranged from 0.3 *percent to 2.7percent. The only crop with declining productivity is sugar beet(Boratav 1988; and Boratav and Turel 1989b). Considering the fall inrelative prices for farmers, and the declining real levels ofinvestment in agriculture, the positive productivity and output can beexplained by increasing marketed quantities at lower real prices in anattempt to preserve real income levels. I argued above that increasingexploitation of household labor and sustaining productive currentinputs through lower consumption and increased indebtedness wereprobably the means used. By the end of the 1980s, such adaptivemechanisms had probably reached their limits. Negative investmenttrends of the 1980s are bound to produce adverse effects on the sector.
Recent patterns of capital accumulation raise the question of whetherTurkey can afford to move into the next century as a "service economy."My response is categorically negative. But I doubt that such strategicquestions are being posed by policymakers, who seem fully content withtheir voluntary imprisonment in the short run. A mental break awayfrom the paradigms of the past decade is needed to bring thefundamental issues of growth, accumulation, and industrialization ontothe agenda of policymakers. They need a new approach to macro-management--a strategic orientation to the variables of capitalaccumulation and of domestic saving. An undogmatic approach thatfavors investment planning must be adopted. I shall take up thesethemes again in my final conclusions.
EXTERNAL LINKAGES AND SELF-RELIANCE
Turkey's external accounts of the past decade have been studiedextensively. I will refrain from repeating well-known points by limiting myobservations to a few issues directly relevant to self-reliance. Tables 6 and7 provide the quantitative background for the discussion that follows.
(a) Despite the upward bias of "fictitious exports," export performanceimproved significantly during the 1980s. This increased the self-reliance of the Turkish economy. Under the conditions of internationalcapital movements prevailing during the 1980s, Turkey would have beenunable to grow based on its export performance of the late 1970s. Thisresource shift toward external markets was realized by simultaneouslyrestraining domestic absorption and encouraging industrial exportsthrough exchange rate policies and strong subsidies. With stagnantinvestments in industry, and as capacity ceilings were reached toward
- 243 -
the end of the 1980s, it was inevitable that commodity export growthshould slow.
(b) Have the adjustments of the 1980s created an economic structure inwhich "socially acceptable" rates of growth can be sustained withexternal equilibrium? The answer depends on the kind of data used.With balance of payments figures, an optimistic picture emerges. Ifwe disregard debt service obligations, the economy seems (from 1984 on)capable of attaining a current account surplus, even during years ofhigh growth--a definite improvement over the late 1970s. But withexternal debt figures, we may arrive at a different conclusion. The1985-87 boom was accompanied by an increase in external debt of almostUS$20 billion between 1984 and 1987. Some of this increase was due toexchange rate fluctuations between major currencies. But the dramaticexpansion in the debt during the boom years suggests that high growthand external equilibrium are still as incompatible as ever.Conversely, low growth rates leading to declining per capita incomearrested the growth of the external debt and led to significantimprovements in the current account and in external reserves during1988 and 1989.
(c) Most of the improvement in the current account after 1987 is due notto the changes in the trade balance, but to tourism revenues (US$1.1billion increase in 1988-89), higher workers' remittances (US$1.3billion increase in 1989 alone), and the ill-defined category of "otherinvisible revenues" (US$1.9 billion increase in 1988-89). The last twoitems may include significant "disguised" capital movements respondingto the liberalized financial system and to the exchange rate regime.They cannot be considered stable items.
(d) There are strong signs that Turkey's external accounts in recent yearsare being influenced by uncontrolled, or unregistered, capitalmovements. There are striking discrepancies between the balance-of-payments data and external debt series. Calculations in Boratav andTurel (1989b) show that of the US$19.3 billion growth in Turkey'sexternal debt (old, uncorrected series) between 1984 and 1988, US$6.7billion are reflected in the debt-creating items of balance-of-paymentsseries; US$4.2 billion are due to exchange rate fluctuations of majorcurrencies on the debt stock. There remains an unexplained residualof US$8.4 billion. This residual arises from the unreliability ofTurkish balance-of-payments statistics (including problems of recordingand definitions) and reverse capital flight. Overinvoicing of exportsand other foreign exchange earnings observed in the notorious"fictitious exports" is the principal means to reduce CAD. Externaldebt figures do not reflect this reduction. This observation isimportant for the 1990s because it shows how easily uncontrolledcapital movements may be reversed. The present liberalization ofcapital movements carries a high degree of risk. The externalobligations of Turkey are large enough to lead to a major debt crisis.

- 244 -
(e) Although considered creditworthy by the international donor community,Turkey is among the top ten most indebted countries. In debt serviceand debt/GNP, Turkey is well over the "critical ratios" defined by theWorld Bank. Nobody should be surprised if the country moves into the"severely indebted countries" category in the early 1990s. Turkey hasbeen transferring net resources abroad because of its high externaldebt service obligations. Under normal conditions these transfers willcontinue during the early 1990s, and the burden will shift to specificcategories of domestic spending. I tried to explain above why morerelative and absolute pressure on labor incomes is unsustainable in thenear future. Consumption by the wealthy and capital accumulationremain the two areas from which transfers abroad can be financed.Depressed capital accumulation, particularly in productive sectors, isalready creating bottlenecks for increasing commodity exports and forservicing the external debt. Any further investment squeeze will causedeterioration in external accounts. We must find a strategic solutionthat will not create further declines in labor incomes and erosion ofthe rates of accumulation- -particularly in the tradable and productive-sectors.
CONCLUDING REMARKS
The Turkish economy faces two strategic options at the beginning of the1990s.
The first option consists of an optimistic reliance on capital inflows,particularly in the form of direct and portfolio investments. The presentpolicymakers seem to have committed themselves to this option for which theinstitutional framework and the incentive structure were built during the 1980s.Privatization of the large public sector was to bring portfolio investments.The prospect of full membership in the EEC was to provide the additionalinstitutional and political incentives unavailable to rivals of Turkey forWestern investment. Since there is little chance of EEC membership before 2000,the prospects for this option are cloudy. It requires competitive wagesuppression and violates my understanding of self-reliance. By the performancecriteria I have proposed, I consider this option undesirable.
The second strategic option should be to find ways to increase domesticsaving and accumulation. Given the debt service obligations and the constraintson distributional dynamics discussed above, transfers abroad and a sufficientrate of capital accumulation will have to be realized from non-productiveresource use out of non-labor incomes. A tax reform directed toward thisobjective will be the most crucial policy tool. In designing this tax reform,a distinction must be made in favor of industrial profits by targeting rentierincome and finance in particular, but I doubt that these categories of thesurplus are large enough to "finance" both debt service and higher accumulationrates. Investment planning aimed at increasing the effectiveness of investmentsmust be another strategic policy. Even if these policies are successful, somedebt relief seems necessary during the first half of the 1990s (see Boratav andTurel 1989a and 1989b).
- 245 -
REFERENCES
AkyUz, Y. 1988, "Financial System and Policies in Turkey in the 1980s" (mimeo).
Altay, 6. (1988), "Analysis of External Debts in Turkey" (mimeo, in Turkish),Central Bank.
Bacha, E.L. (1984), "Foreign Debt, Balance of Payments and Growth Prospects ofDeveloping Countries" (mimeo).
Boratav, K. (1987a), Stabilization and Adjustment Policies and Programmes,Country Study 5: Turkey, Wider, Helsinki.
(1987b), Die tu.rkische Wirtschaft im 20. Jahrhundert (1908-1980),Frankfurt, Dagyeli.
(1988), "Intra-class and Inter-class Relations of Distribution under'Structural Adjustment': Turkey during the 1980s," paper presented to theConference on Turkey's Economic Development in the 1980s at HarvardUniversity, April.
Boratav, K., H. Ersel, and Y. Kepenek (1984), A Model Proposal on the HousingSector and Housing Policies for the Fifth Five Year Plan (in Turkish),Kent-Koop Yayini.
Boratav, K., and 0. TUrel (1989a), "Growth Projections for the Turkish Economyunder Alternative Scenarios: 1987-1995" (mimeo), paper prepared for theWIDER Project on Medium-term Development Strategy.
(1989b), "Towards a Medium-term Development Strategy for the TurkishEconomy" (mimeo), paper prepared for the WIDER project on Medium-termDevelopment Strategy.
Boratav, K., and G. Yalman (1989), "A Study on the Political Economy ofStructural Adjustment: Workers and Peasants during a Major Reorientationof Economic Policies, Turkey 1980-1987" (mimeo), research paper prepared forIDRC, Canada.
Chhibber, A., and S. van Wijnbergen (1988), "Public Policy and Private Investmentin Turkey,' Working Paper No. 120, Washington, D.C., World Bank.
Conway, P. (1988), "The Record on Private Investment in Turkey" (mimeo).
Ugyer, E. (1987), Econometric Model of the Turkish Economy, Ankara, SESRTCIC.

- 246 -
Table 1: INDICATORS OF DISTRIBUTION AND OF SECTORAL RELATIVE PRICES
1977 1979 1980 1983 1984 1985 1986 1987 1988 1989
1. Industrial Wages
A. ReaL Wage IndexPublic/Turkey 100.0 96.9 94.6 89.8 73.9 70.3 72.0Private/Turkey 100.0 92.2 78.2 82.4 73.7 74.5 77.1Total/Turkey 100.0 93.8 84.7 84.0 72.6 71.6 73.8
B. Wages/Value Added (X)Public/Turkey 40.4 48.2 35.3 23.3 22.9 18.6 12.9Private/Turkey 34.6 31.8 27.6 26.0 23.8 22.8 18.2Total/Turkey 36.9 37.3 30.7 24.8 23.5 21.2 16.1Largest Private - - - 42.7 38.2 39.4 32.6 29.5 31.8Private Eskisehir - 62.7 60.6 50.5 45.0 47.0 43.9
II. Agriculture/Industry Terms of Trade
A. From GDP DefLators 100.0 66.6 57.2 49.6 51.2 47.5 46.7 48.9 43.8 42.7B. From SIS Study 100.0 69.5 69.7 68.8 65.1 61.8 62.7
III. CommerciaL Margins for Agriculture
A. Bread/Wheat 100.0 111.8 115.5 123.0 115.3 113.7 110.2B. Sugar/S. Beet 100.0 108.2 207.3 129.4 129.4 122.5 126.4C. CLoth/Cotton 100.0 77.0 76.8 108.6 105.4 130.0 116.0D. Margarine/Sunflower 100.0 105.7 134.9 129.5 214.7 161.1 142.6E. Tobacco/Export/Farm) 100.0 106.9 230.3 307.6 316.3F. Cotton (Export/Farm) 100.0 129.2 89.6 169.3 185.2
IV. Interest Payments/Industrial SurpLus (X)
A. Largest Private 52.6 54.1 60.4 67.6 50.1 56.3B. Private/Eskisehir 13.4 22.1 53.7 42.0 46.0 39.0
V. Trade & Finance in GDP
A. Finance/GDP (%) 2.5 1.8 1.8 1.9 2.7 2.9 2.9 2.8 2.8 3.1B. Trade/GDP (X) 13.5 15.0 15.9 17.6 18.1 17.2 17.1 17.6 17.6 17.5C. ReaL Bank Profits, Index 100.0 247.3 329.0 636.7 617.6 968.8 1310.4
VI. Rentier Incomes
A. Deposit Interests/GDP (%) .3 .8 1.4 5.6 7.7 10.8 9.2 7.7 10.6B. Real Deposit Int. Rate (%) -16.9 -47.9 -80.8 14.4 -7.0 15.0 21.3 8.0 .4C. Interest (Domestic) from
Budget/GDP .5 .5 .5 .7 1.0 1.0 1.8 2.4 3.5D. Total Interest Income/GDP (X) .8 1.3 1.9 6.3 8.7 11.8 11.0 10.1 14.1E. ReaL Int. Incomes, Index 100 112 246 938 1357 1919 1978 1939 2775
VII. Sector Terms of Trade
A. Agriculture/GDP 100.0 82.2 78.6 72.1 73.8 71.9 70.5 71.6 67.1 71.5B. Industry/GDP 100.0 123.6 137.4 145.4 144.1 151.4 150.9 146.5 153.3 149.9C. Services/GDP 100.0 100.5 97.9 97.7 96.7 94.3 95.4 95.8 96.4 97.6D. Construction/GDP 100.0 93.2 92.7 81.9 82.7 77.6 81.8 83.8 82.0 82.9E. Trade/GDP 100.0 113.8 123.1 128.0 129.0 122.1 119.0 118.8 119.8 121.7F. Comm. & Transport/GDP 100.0 115.4 120.0 130.0 125.2 128.3 127.5 124.9 128.3 130.4G. Finance/GDP 100.0 68.2 64.8 75.1 109.0 118.2 121.7 120.4 123.1 133.0H. Housing/GDP 100.0 95.4 100.2 92.4 95.7 96.1 102.1 103.1 110.8 112.51. Lib. Professions, etc./GDP 100.0 104.1 106.9 108.3 109.5 105.0 102.9 102.9 104.4 103.2J. Government/GDP 100.0 85.8 63.7 54.2 42.9 40.1 42.8 45.4 42.7 43.7K. Unproductive/Productive Sectors 100.0 105.4 107.6 106.4 109.5 108.7
Note: Rows under I are based on surveys and censuses of manufacturing industry undertaken by the State Institute ofStatistics. Rows IIIA-IIID are index numbers of the ratios between the index numbers of the relevant consumer pricesand of the prices received by farmers. Rows IIIE, IIIF are index numbers of the ratios between the index nunbersof the relevant unit export prices and of the prices received by farmers. Rows IVA, IVF are the percentage sharesof interest payments made by the relevant group of industrial firms within value added minus wages. Row VD is takenfrom baLance sheets of commercial banks as published by by the Union of Banks. Row VIA covers only time depositswithin the banking system and foreign exchange accounts and annual average interest rates for the relevant group isused in calculating total deposit interests. Row VIC covers consolidated public budget figures (excluding stateenterprises) on interest payments on domestic pubtic debt. Row VID = Rows VIA+VIC. Rows VIIA:VIIJ are index numbersbased on the ratios of implicit sectoral and overall GDP deflators from national accounts series. In Row VIIK, aLsocalculated from GDP sectoral deflators, "unproductive sectors" are defined as "services minus construction,communications, transport and goverrnment" and "productive sectors" are defined as agricuLture, industry, construction,communications and transport. Row VIC on budgetary interest payments from domestic debt is taken from an unpublishedstudy by Aykut Ekzen.
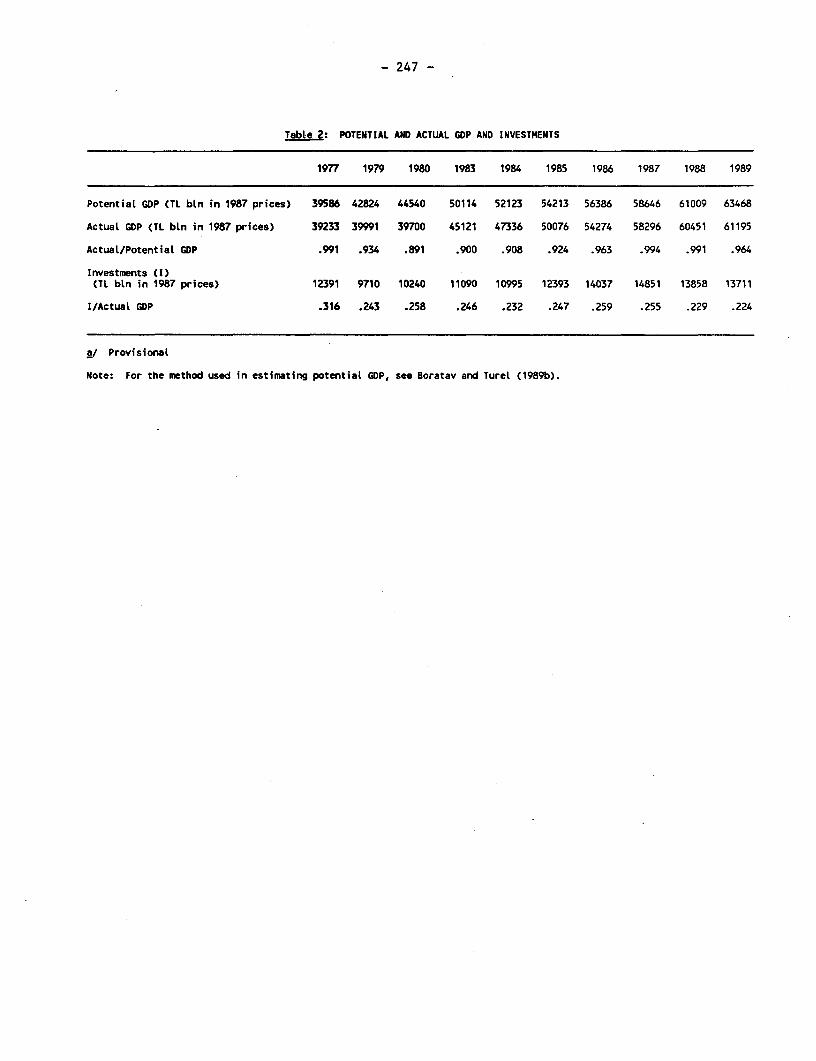
- 247 -
Table 2: POTENTIAL AND ACTUAL GOP AND INVESTMENTS
1977 1979 1980 1983 1984 1985 1986 1987 1988 1989
PotentiaL GDP (TL bLn in 1987 prices) 39586 42824 44540 50114 52123 54213 56386 58646 61009 63468
Actual GDP (TL bLn in 1987 prices) 39233 39991 39700 45121 47336 50076 54274 58296 60451 61195
ActuaL/Potential GDP .991 .934 .891 .900 .908 .924 .963 .994 .991 .964
Investments (I)(TL bin in 1987 prices) 12391 9710 10240 11090 10995 12393 14037 14851 13858 13711
I/ActuaL GDP .316 .243 .258 .246 .232 .247 .259 .255 .229 .224
a/ Provisional
Note: For the method used in estimating potential GDP, see Boratav and Turel (1989b).
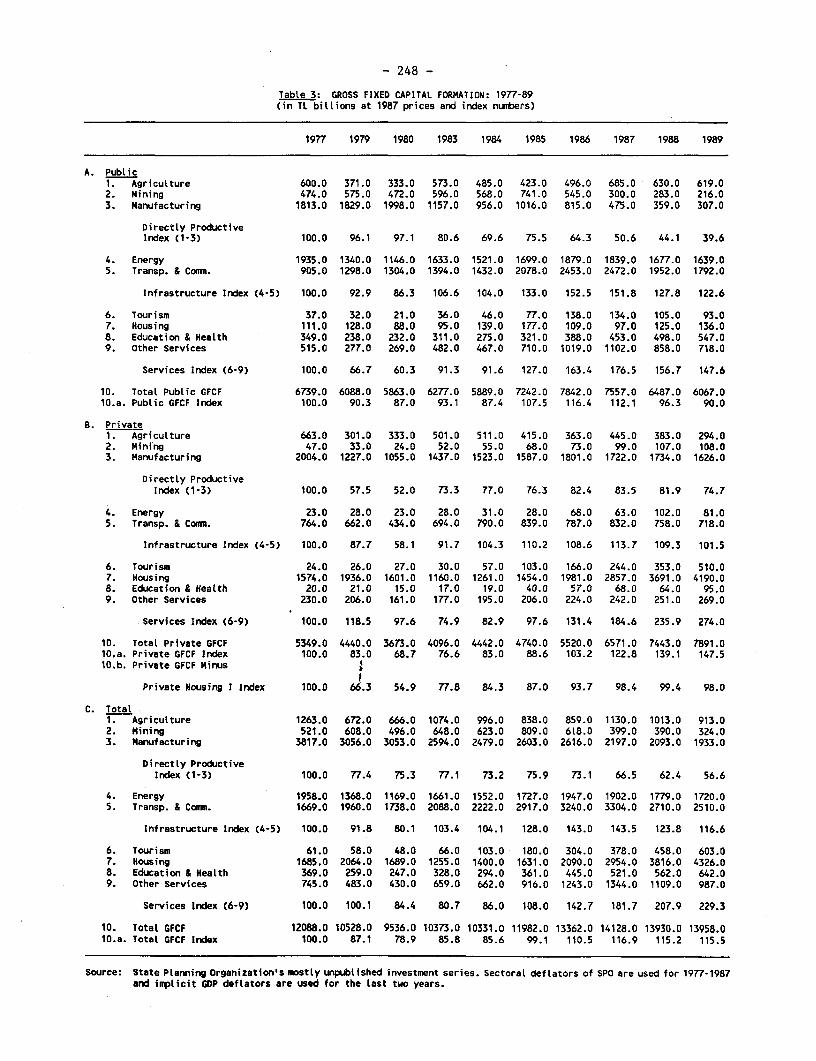
- 248 -
Table 3: GROSS FIXED CAPITAL FORMATION: 1977-89(in TL billions at 1987 prices and index numbers)
1977 1979 1980 1983 1984 1985 1986 1987 1988 1989
A. Public1. AgricuLture 600.0 371.0 333.0 573.0 485.0 423.0 496.0 685.0 630.0 619.02. Mining 474.0 575.0 472.0 596.0 568.0 741.0 545.0 300.0 283.0 216.03. Manufacturing 1813.0 1829.0 1998.0 1157.0 956.0 1016.0 815.0 475.0 359.0 307.0
Directly ProductiveIndex (1-3) 100.0 96.1 97.1 80.6 69.6 75.5 64.3 50.6 44.1 39.6
4. Energy 1935.0 1340.0 1146.0 1633.0 1521.0 1699.0 1879.0 1839.0 1677.0 1639.05. Transp. & Comm. 905.0 1298.0 1304.0 1394.0 1432.0 2078.0 2453.0 2472.0 1952.0 1792.0
Infrastructure Index (4-5) 100.0 92.9 86.3 106.6 104.0 133.0 152.5 151.8 127.8 122.6
6. Tourism 37.0 32.0 21.0 36.0 46.0 77.0 138.0 134.0 105.0 93.07. Housing 111.0 128.0 88.0 95.0 139.0 177.0 109.0 97.0 125.0 136.08. Education & Health 349.0 238.0 232.0 311.0 275.0 321.0 388.0 453.0 498.0 547.09. Other Services 515.0 277.0 269.0 482.0 467.0 710.0 1019.0 1102.0 858.0 718.0
Services Index (6-9) 100.0 66.7 60.3 91.3 91.6 127.0 163.4 176.5 156.7 147.6
10. Totat Public GFCF 6739.0 6088.0 5863.0 6277.0 5889.0 7242.0 7842.0 7557.0 6487.0 6067.010.a. Public GFCF Index 100.0 90.3 87.0 93.1 87.4 107.5 116.4 112.1 96.3 90.0
B. Private1. Agricutture 663.0 301.0 333.0 501.0 511.0 415.0 363.0 445.0 383.0 294.02. Minfng 47.0 33.0 24.0 52.0 55.0 68.0 73.0 99.0 107.0 108.03. Manufacturing 2004.0 1227.0 1055.0 1437.0 1523.0 1587.0 1801.0 1722.0 1734.0 1626.0
Directly ProductiveIndex (1-3) 100.0 57.5 52.0 73.3 77.0 76.3 82.4 83.5 81.9 74.7
4. Energy 23.0 28.0 23.0 28.0 31.0 28.0 68.0 63.0 102.0 81.05. Transp. & Comm. 764.0 662.0 434.0 694.0 790.0 839.0 787.0 832.0 758.0 718.0
Infrastructure Index (4-5) 100.0 87.7 58.1 91.7 104.3 110.2 108.6 113.7 109.3 101.5
6. Tourism 24.0 26.0 27.0 30.0 57.0 103.0 166.0 244.0 353.0 510.07. Housing 1574.0 1936.0 1601.0 1160.0 1261.0 1454.0 1981.0 2857.0 3691.0 4190.08. Education & Health 20.0 21.0 15.0 17.0 19.0 40.0 57.0 68.0 64.0 95.09. Other Services 230.0 206.0 161.0 177.0 195.0 206.0 224.0 242.0 251.0 269.0
Services Index (6-9) 100.0 118.5 97.6 74.9 82.9 97.6 131.4 184.6 235.9 274.0
10. Total Private GFCF 5349.0 4440.0 3673.0 4096.0 4442.0 4740.0 5520.0 6571.0 7443.0 7891.010.a. Private GFCF Index 100.0 83.0 68.7 76.6 83.0 88.6 103.2 122.8 139.1 147.510.b. Private GFCF Minus
Private Housing I Index 100.0 66.3 54.9 77.8 84.3 87.0 93.7 98.4 99.4 98.0
C. Totat1. Agriculture 1263.0 672.0 666.0 1074.0 996.0 838.0 859.0 1130.0 1013.0 913.02. Mining 521.0 608.0 496.0 648.0 623.0 809.0 618.0 399.0 390.0 324.03. Manufacturing 3817.0 3056.0 3053.0 2594.0 2479.0 2603.0 2616.0 2197.0 2093.0 1933.0
Directly ProductiveIndex (1-3) 100.0 77.4 75.3 77.1 73.2 75.9 73.1 66.5 62.4 56.6
4. Energy 1958.0 1368.0 1169.0 1661.0 1552.0 1727.0 1947.0 1902.0 1779.0 1720.05. Transp. & Comm. 1669.0 1960.0 1738.0 2088.0 2222.0 2917.0 3240.0 3304.0 2710.0 2510.0
Infrastructure Index (4-5) 100.0 91.8 80.1 103.4 104.1 128.0 143.0 143.5 123.8 116.6
6. Tourism 61.0 58.0 48.0 66.0 103.0 180.0 304.0 378.0 458.0 603.07. Housing 1685.0 2064.0 1689.0 1255.0 1400.0 1631.0 2090.0 2954.0 3816.0 4326.08. Education & Health 369.0 259.0 247.0 328.0 294.0 361.0 445.0 521.0 562.0 642.09. Other Services 745.0 483.0 430.0 659.0 662.0 916.0 1243.0 1344.0 1109.0 987.0
Services Index (6-9) 100.0 100.1 84.4 80.7 86.0 108.0 142.7 181.7 207.9 229.3
10. Total GFCF 12088.0 10528.0 9536.0 10373.0 10331.0 11982.0 13362.0 14128.0 13930.0 13958.010.a. TotaL GFCF Index 100.0 87.1 78.9 85.8 85.6 99.1 110.5 116.9 115.2 115.5
Source: State Planning Organization's mostly unpublished investment series. SectoraL deftators of SPO are used for 1977-1987and implicit GDP deflators are used for the Last two years.

- 249 -
Table 4: GROSS FIXED CAPITAL FORMATION: 1977-89(X shares in 1987 prices)
1977 1979 1980 1983 1984 1985 1986 1987 1988 1989
A. Public1. Agriculture 8.9 6.1 5.7 9.1 8.2 5.9 6.3 9.0 9.7 10.22. Mining 7.0 9.5 8.0 9.5 9.7 10.2 6.9 4.0 4.4 3.63. Manufacturing 26.9 30.0 34.1 18.4 16.2 14.0 10.4 6.3 5.5 5.14. Energy 28.7 22.0 19.5 26.0 25.8 23.5 24.0 24.3 25.9 27.05. Transp. & Comm. 13.4 21.3 22.2 22.2 24.3 28.7 31.3 32.7 30.1 29.66. Tourism .6 .5 .4 .6 .8 1.1 1.8 1.8 1.6 1.57. Housing 1.7 2.1 1.5 1.5 2.4 2.4 1.4 1.3 1.9 2.28. Education & Health 5.2 3.9 4.0 5.0 4.7 4.4 4.9 6.0 7.7 9.09. Other Services 7.6 4.6 4.6 7.7 7.9 9.8 13.0 14.6 13.2 11.8
10. Total Public 100.0 100.0 100.0 100.0 100.0 100.0 100.0 100.0 100.0 100.0Directly Productive (1-3) 42.8 45.6 47.8 37.1 34.2 30.1 23.7 19.3 19.6 18.9Infrastructure (4-5) 42.1 43.3 41.8 48.2 50.1 52.2 55.2 57.0 56.0 56.6Services (6-9) 15.1 11.1 10.4 14.7 15.7 17.7 21.1 23.6 24.4 24.5
B. Private1. Agriculture 12.4 6.8 9.1 12.2 11.5 8.8 6.6 6.8 5.1 3.72. Mining .9 .7 .7 1.3 1.2 1.4 1.3 1.5 1.4 1.43. Manufacturing 37.5 27.6 28.7 35.1 34.3 33.5 32.6 26.2 23.3 20.64. Energy .4 .6 .7 .7 1.3 .6 1.2 1.0 1.4 1.05. Transp. & Comr. 14.3 14.9 11.8 16.9 17.8 17.7 14.3 12.7 10.2 9.16. Tourism .4 .6 .7 .7 1.3 2.2 3.0 3.7 4.7 6.57. Housing 29.4 43.6 43.6 28.3 28.4 30.7 35.9 43.5 49.6 53.18. Education & Health .4 .5 .4 .4 .4 .8 1.0 1.0 .9 1.29. Other Services 4.3 4.6 4.4 4.3 4.4 4.3 4.1 3.7 3.4 3.4
10. TotaL Private 100.0 100.0 100.0 100.0 100.0 100.0 100.0 100.0 100.0 100.0Directly Productive (1-3) 50.8 35.2 38.5 48.6 47.0 43.7 40.5 34.5 29.8 25.7Infrastructure (4-5) 14.7 15.5 12.4 17.6 18.5 18.3 15.5 13.6 11.6 10.1Services (6-9) 34.5 49.3 49.1 30.0 34.5 38.0 44.0 51.9 58.6 64.2
C. Total1. Agriculture 10.4 6.4 7.0 10.4 9.6 7.0 6.4 8.0 7.3 6.52. Mining 4.3 5.8 5.2 6.2 6.0 6.8 4.6 2.8 2.8 2.33. Manufacturing 31.6 29.0 32.0 25.0 24.0 21.7 19.6 15.6 15.0 13.94. Energy 16.2 13.0 12.3 16.0 15.0 14.4 14.6 13.5 12.8 12.35. Transp. & Comm. 13.8 18.6 18.2 20.1 21.5 24.3 24.2 23.4 19.4 18.06. Tourism .5 .6 .5 .6 1.0 1.5 2.3 2.7 3.3 4.37. Housing 13.9 19.6 17.7 12.1 13.6 13.6 15.6 20.9 27.4 31.08. Education & Health 3.1 2.5 2.6 3.2 1.8 3.0 3.3 3.7 4.0 4.69. Other Services 6.2 4.6 4.5 6.4 6.4 7.6 9.3 9.5 8.0 7.110. Total GFCF 100.0 100.0 100.0 100.0 100.0 100.0 100.0 100.0 100.0 100.0
Directly Productive (1-3) 46.3 41.2 44.2 41.6 39.7 35.5 30.6 26.4 25.1 22.7Infrastructure (4-5) 30.0 3V.6 30.5 36.1 36.5 38.8 38.8 36.8 32.2 30.3Services (6-9) 23.7 21.2 25.3 22.3 23.8 25.7 30.5 36.8 42.7 47.0
Source: State Planning Organization's mostly unpublished investment series. Sectoral deflators of SPO are used for 1977-1987 and impLicit GDP deflators are used for the Last two years.
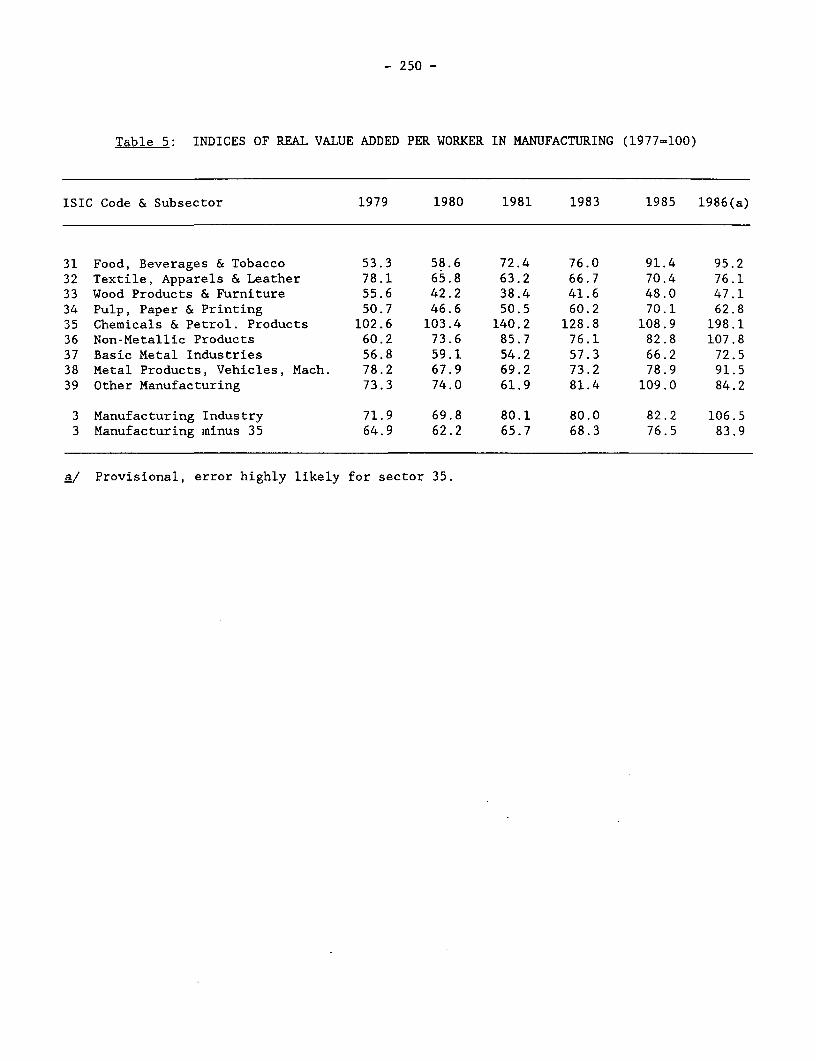
- 250 -
Table 5: INDICES OF REAL VALUE ADDED PER WORKER IN MANUFACTURING (1977=100)
ISIC Code & Subsector 1979 1980 1981 1983 1985 1986(a)
31 Food, Beverages & Tobacco 53.3 58.6 72.4 76.0 91.4 95.232 Textile, Apparels & Leather 78.1 65.8 63.2 66.7 70.4 76.133 Wood Products & Furniture 55.6 42.2 38.4 41.6 48.0 47.134 Pulp, Paper & Printing 50.7 46.6 50.5 60.2 70.1 62.835 Chemicals & Petrol. Products 102.6 103.4 140.2 128.8 108.9 198.136 Non-Metallic Products 60.2 73.6 85.7 76.1 82.8 107.837 Basic Metal Industries 56.8 59.1 54.2 57.3 66.2 72.538 Metal Products, Vehicles, Mach. 78.2 67.9 69.2 73.2 78.9 91.539 Other Manufacturing 73.3 74.0 61.9 81.4 109.0 84.2
3 Manufacturing Industry 71.9 69.8 80.1 80.0 82.2 106.53 Manufacturing minus 35 64.9 62.2 65.7 68.3 76.5 83.9
a/ Provisional, error highly likely for sector 35.
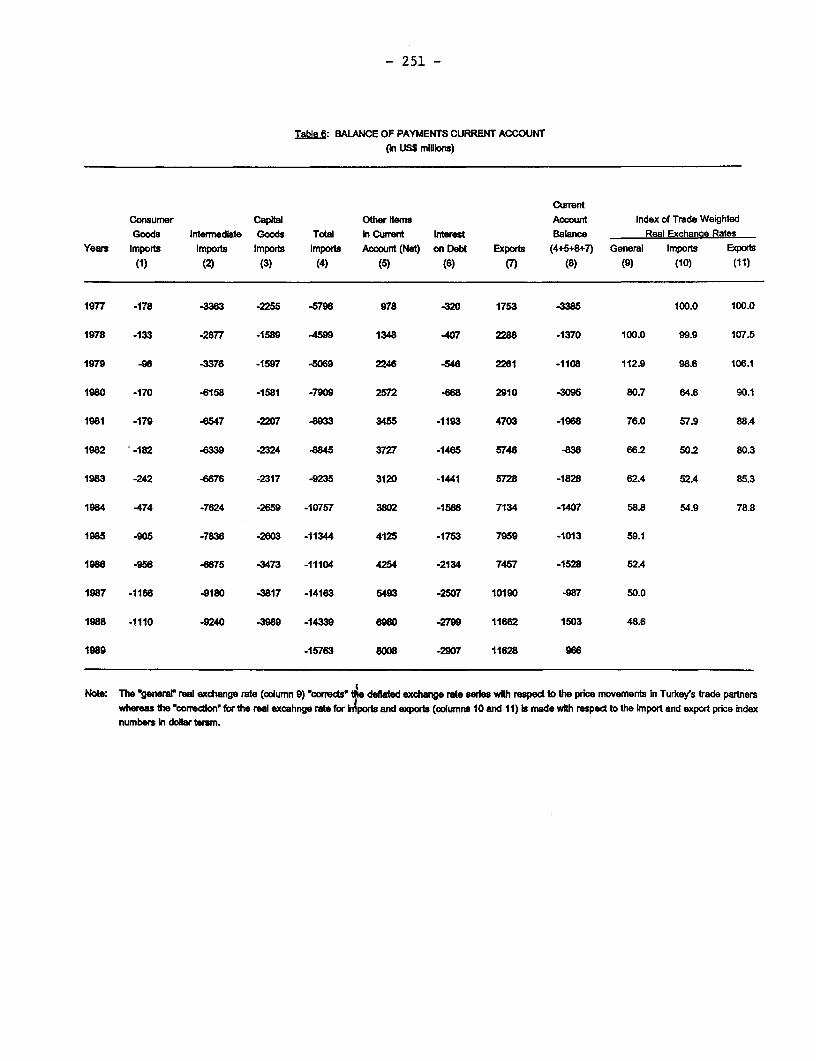
- 251 -
Table 6: BALANCE OF PAYMENTS CURRENT ACCOUNT(In US$ milbins)
CurrentConsumer Capital Other Items Account Index of Trade WeightedGoods Intermediate Goods Total hi Curnt Interest Balance Real Exchaance Rates
Years Imports Imports Imports Imports Account (Net) on Debt Exports (4+5+6+7) General Imports Exports(1) (2) (3) (4) (5) (6) (7) (8) (9) (10) (11)
1977 -178 -3363 -2255 .5796 978 -320 1753 -3385 100.0 100.0
1978 -133 -2877 -1589 -4599 1348 -407 2288 -1370 100.0 99.9 107.5
1979 -96 -3376 -1597 -5069 2246 -548 2261 -1108 112.9 98.6 106.1
1980 -170 -6158 -1581 -7909 2572 -668 2910 -3095 80.7 64.6 90.1
1981 -179 4547 -2207 -8933 3455 -1193 4703 -1968 76.0 57.9 884
1982 -- 182 -6339 -2324 845 3727 -1465 5746 -838 66.2 50.2 80.3
1983 -242 -6676 -2317 -9235 3120 -1441 5728 -1828 62.4 52.4 85.3
1984 -474 -7624 -2659 -10757 3802 -1586 7134 -1407 58.8 54.9 78.8
1985 -905 -7836 -2603 -11344 4125 -1753 7959 -1013 59.1
1986 -956 -6675 -3473 -11104 4254 -2134 7457 -1528 52.4
1987 .1166 -9180 -817 -14163 5493 -2507 10190 -987 50.0
1988 -1110 -9240 -3989 -14339 6980 -2799 11682 1503 48.6
1989 -15763 8008 -2907 11628 966
Note: The 'generar real exchange rate (column 9) 'corrects the deflated exchange rate series wlh respect t the price movements In Turkey's trade partnerswhereas the 'correctdnW for the real excahnge rate for hAports and exports (columns 10 and 11) Is made wikh respect to the Import and export price Indexnumbers hi dollar ternm.

- 252 -
Table 7: BALANCE OF PAYMENTS: CAPITAL ACCOUNT (USS million)
Capital CurrentInfLows Other Direct Net Errors Account Real CAD
to Increase Capital Foreign and Reserve Deficit (CAD) in 1987 ExternaLYear Debt (Net) Inflows Investment Omissions Movements (=1+2+3+4+5) Dollars Debt
(1) (2) (3) (4) (5) (6) (7) (8)
1977 3282 103 67 -663 566 3385 6234 11405
1978 1599 120 47 -231 -157 1370 2433 13794
1979 225 124 85 785 -111 1108 1625 13604
1980 2544 95 33 1030 -607 3095 3275 16247
1981 1023 69 44 1016 -184 1968 1851 16861
1982 1010 13 55 -75 -168 835 781 17619
1983 1266 161 46 507 -152 1828 1738 18385
1984 1082 -171 113 317 66 1407 1329 20659
1985 1627 223 99 -813 -123 1013 941 25476
1986 2003 251 125 -65 -786 1528 1607 32101
1987 2128 424 110 -682 -993 987 987 40228
1988 -1053 -261 352 347 -888 -1503 40722
1989 -1474 1637 663 974 -2766 -966 41021
Source: External debt figures are based on Central Bank reports for 1977-79, on Altay (1988)for 1980-83 and on the corrected Treasury figures for 1984-1989 as stated in Anka(22.3.1990). Trade-weighted general real exchange rate series for 1978-88 is basaedon Central Bank calculations. Real exchange rates for imports and exports (1977-1984)is from Boratav (1987a).

- 253 -
COMMENTARY BY JAMES A. HANSON
This paper presents a stimulating view of the Turkish economy.Strictly speaking it is more of a retrospective than a projection. However, theretrospective has been done with a view to the sustainability of the recentgrowth path which makes it required reading for any futurist. I will organizemy comments along the same lines as the paper, namely the implications of therecent Turkish process of growth in the areas of distribution, growth potentialand external dependence.
Distribution. The paper highlights the substantial shifts that haveoccurred in the distribution of income in the late 1970s and the 1980s.Table 1 suggests that real wages have fallen dramatically, the terms of tradehave turned against agriculture, and finance and interest income have growndramatically.
I have a few problems with this table, however. First, 1977 is thebase year. But, as the paper points out, 1977 was a "peak year". According tosome observers, the Turkish economy in 1977 was characterized by a bloated publicsector, real wages in the organized sector that were inflated beyond sustainablelevels, excessive investment in unproductive assets, and high protection thatencouraged static and dynamic inefficiency. In some sense 1977 marked the startof the Turkish debt crisis of the late 1970s. Thus, one must question thesustainability of many of the economic outcomes of 1977.
According to Table 1, real private sector wages declined sharply inthe late 1970s, but thereafter were roughly constant. Thus the decline in realprivate wages took place prior to the "liberalization". Public sector wages fellonly slightly in the late 1970s but continued to decline in the 1980s--this mayreflect the fact that even in 1980 workers in the Turkish public sector wereoverpaid compared to sustainable levels.
Regarding agricultural terms of trade with Turkey, they declinesharply up to 1983, but thereafter are roughly constant. International primaryproduct prices also declined in the 1980s, in fact perhaps more than occurredin Turkey. The government could have tried to insulate the farmers completelyfrom the worldwide shift in relative prices but by paying tremendous subsidies.Thus, any shift against agriculture must be evaluated in terms of the worldmarket as well as the internal terms of trade prevailing in 1977.
The decline in agricultural terms of trade seems somewhat large,given the usual view that Turkey has substantially liberalized its trade regime.Perhaps the liberalization of trade is less than generally thought.
There is no doubt that the finance sector, profits in the financesector, and interest earnings all have grown dramatically. However, thesechanges are relative to a financial system that was in difficult shape in theearly 1980s. Non-performing loans were enormous and the system was

- 254 -
decapitalized. The impact of the substantial bad debts probably is not reflectedin the indices of profits shown in Table 1. To put it another way, the system,to recapitalize itself without public funds, had to charge higher interest rates(there is a question of whether many borrowers actually paid the high loan ratesthat are often cited) and earn larger book profits.
I also would add that the use of national accounts data may overstatesubstantially the improvement of the terms of trade of the financial sector.I am not sure how the sectoral deflators of GNP are calculated in Turkey.However, national accounts data usually are not a good measure of the financialsector's real output and the problems of estimation carry over into the estimatesof implicit deflators. My own estimates for Turkey of bank margins--thedifference between interest paid and interest earned divided by bank assets, (theusual measure of bank spreads)--reach a peak of about 9 percent in the late 1970sand decline thereafter. The decline reflects an expansion of bank assets thatwas not matched by an expansion in inputs--personnel, buildings, or other realassets. Thus, my figures suggest a substantial increase in productivity in thefinancial sector, and thus, that there should have been a decline in the relativeprice of financial services. Of course the Turkish GNP data may also includeinterest earnings in the financial sector's GDP and these, unquestionably,increased in real terms.
Potential Income. The paper argues that much of the growth in theeconomy during the 1980s was the result of higher capacity utilization. However,moving from that observation, which probably contains an element of truth butsensitive to the choice of base year, to the conclusion that potential growthhas declined, is a different matter. I would argue that the paper pays toolittle attention to the possibility of static and dynamic efficiency improvementsand, hence, is probably too pessimistic regarding the impact of the recent growthprocess on potential future growth.
The argument that higher capacity utilization is responsible for muchof recent growth is based on standard peak to peak method. The paper suggeststhat 1977 and 1987 are two peaks, and growth rate between them--5.0 percent p.a.according to Table 2--is less than in the prior fifteen year period. Thiscomparison, strictly speaking, is not correct as there is no peak in the priorfifteen years. And, while 1977 is a peak, GDP hovers around that level until1980, then begins to takeoff as the paper itself points out. The 6.4 percentp.a. growth between 1980 and 1989 (Table 2) is not much different than the 6.7percent p.a. growth between 1963 and 1977 (IMF, International FinancialStatistics). Thus, depending on whether one starts from 1977 or 1980, it ispossible to argue that growth slowed substantially and was mainly based onincreased capacity utilization, or that capacity utilization and the growth ratehave remained roughly constant (with lower real investment).
Before discussing the argument that potential growth has declined,a comment is in order on the "quality" and sustainability of measured growth inthe pre and post 1977 periods. Even if measured growth did decline after 1977,one can easily argue that growth prior to 1977 was overstated. The reason isthat in periods of import substitution real growth is over estimated. Mostdeveloping countries simply to value the initial output of import substitutes

- 255 -
at their local cost, rather than the cost of the competitive import. Thisprocedure would overstate substantially Turkey's pre 1977 growth rate. Regardingsustainability, much of the growth up to 1977 was due to inefficient investmentin import substitutes, financed with foreign borrowing. It may even have beennecessary to writeoff some capital in order to shift to a more sustainable growthpath; the 1977-1980 period could be interpreted along these lines.
Turning now to the argument of declining potential growth, this viewis based on the argument that recent growth reflects increased capacityutilization and is buttressed by an apparent slowdown in gross investment(excluding housing). As noted, the capacity utilization argument is quitesensitive to the choice of the base year. Regarding the slowdown in investment,the growth in capital is only one element in the growth equation, the other isthe marginal capital output ratio. The new pattern of investment may be moreefficient in a macroeconomic sense--have a lower marginal capital to outputratio--than the old. This would mean that less investment and lesssaving/foreign borrowing are necessary to sustain a given growth rate. PotentialGDP may actually be growing faster, rather than slower.
In this context, I am less worried about the decline in publicdirectly productive investments than the paper. I would guess that a shift ofmuch of this investment to the private sector would lead to greater macroeconomicefficiency--in technical terms, a larger "residual"--and thus contribute tohigher growth from a given rate of investment. More worrisome is the absoluteslowdown in infrastructure investment.
The paper also raises the question of whether Turkey should shiftto a "service" economy and, in that context, questions the greater orientationof investment toward services in the 1980s. Engels curves imply that alleconomies eventually shift toward services. The real question is whether theshift out of agriculture and manufacturing into services is occurring "too"rapidly. To this question there is no clear cut answer. In part it depends onhow one views the service sector. The paper implies that services areunproductive and thus growing too fast. My own impression is that services liketransport, packaging, marketing are undeveloped in most developing countries andsubstantial upgrading is possible, which would benefit consumers and producers.
Self Reliance is difficult to define. Perhaps it is useful to dividethe concept into (a) the degree to which output growth is dependent on shiftsin real exports and imports and the terms of trade, given a balanced currentaccount; and (b) the dependence on external finance, as measured by capitalinflows.
The paper points out, correctly, that the pre 1980 pattern of slowexport growth was probably unsustainable given the decreased availability ofexternal finance in the 1980s. Also, the paper correctly notes that while someof the growth in exports was fictitious, there is no doubt that real exports havegrown substantially faster than in the 1970s. Next the paper raises the questionwhether high export growth is sustainable given growing capacity constraints.Of course capacity may not be such a constraint, as discussed earlier. I wouldadd here that continued high export growth will depend on finding alternatives

- 256 -
to the Middle Eastern markets that played an important role in the export growthof the 1980s.
Regarding dependence on external finance, it appears that the 1985-87 boom was accompanied by small current account deficits (US$1 billion per annumaccording to Table 7) and a build-up of international reserves (net). At firstglance, this suggests that external dependence on foreign funds has decreased.More detailed examination of the figures suggests, however, some potentialproblems. Debt in dollars grew from US$20 billion in 1983 to US$41 billion in1987 according to the World Bank's World Debt Tables. About half the increaserepresents dollar depreciation. This is not cause for great alarm, since asubstantial part of Turkish exports is to non-dollar areas. However, part ofthe remaining increase in debt represents private capital inflows; these may be"hot money" attracted by the high real interest rates in Turkey. And, with aUS$40 billion external debt, Turkey must pay close attention to its externalaccounts. Since 1987 external debt has stabilized in dollar terms, which is agood sign.
Finally, I would like to add my own assessment of Turkey's prospects.The paper intentionally focuses on the medium term. But, looking at the shortterm, I feel that there are a number of potential issues. Export markets andexternal capital flows have already been mentioned. A major short run issue isthe government's deficit. Large fiscal deficit generated high levels of domesticdemand and contributed to the boom of the 1980s. At the same time, observershave linked the government's substantial borrowing to the dramatic rise in realinterest rates. These rates attracted short term funds from abroad; suddenoutflows of these funds could be destabilizing. These rates also increased thecost of capital to private investors dramatically, which may explain part of theslowdown in private investment described in the paper. Unless the fiscal deficitis reduced to sustainable levels, so that inflation and real interest ratesdecline, it may be difficult to sustain the boom of the 1980s.
- 257 -
ROUND TABLE DISCUSSION
P. ARMINGTON: The question at issue: what will the rate of growth of thelow- and middle-income countries (LMICs) in the 1990s reallydepend on?
The range of possible outcomes seems wide. The 1908switnessed 4.3 percent average growth for LMICs (as definednow by the Bank- -it was even less if you include the Gulf oilexporters). In their paper, McCarthy and Fardoust project5.0 for the 1990s. The UN target for the "First DevelopmentDecade" (the 1960s) was 7.0, and I feel this is do-able inthe '90s with well-choreographed policies everywhere and withreasonable luck. On opposite assumptions, 3 percent growthcannot be excluded, especially if disruption and retrenchmentbecome the overriding responses to the revolutionary wavethat the global economy is now riding (like a novice surfer).
The stakes for long-range development, involved in this rangeof 5+2 for LMIC growth in the '90s, are huge. What's reallyat risk here is not only countries' near-term health but thecapacity to grow in the opening decades of the next century,and hence the quality of life possible for the cominggenerations.
There is a disconcertingly lengthy "Chinese menu" of sortsof answers to this question of what the outcome will reallydepend on: many dimensions of the argument that people makeabout what's critical for growth. We are thus left with aproblem of focusing the analytical debate, which translatesinto a lack of focus in the policy debate. One is remindedof poor Sargent Krupke in Leonard Bernstein's West Side Story:so many theories about what's wrong with youth, and so littlebasis for coming to practical terms with the issue.
Here is my menu of these discussions. They are partiallyoverlapping.
o External environment (OECD and international marketconditions) versus internal conditions (incl. domesticpolicies in the LMICs themselves).
o Allocation efficiency (getting prices right, buildingand fixing markets) versus animal spirits (drivingdynamic change and accumulation).
o Macro-conditions (fiscal and monetary rectitude,including right exchange rates) versus micro-conditions(development as self-realization of individuals).

- 258 -
o Quality of governance (secure government under law, smartpolicies) versus quantity of governance (e.g., the lessthe better).
O Rates of saving and investment (capital accumulation)versus rates of productivity growth (growth bang perbuck).
o Reduction of disequilibrium (prompt and efficientadjustment) versus using disequilibria creatively(joining the "flying geese," instead of shooting themout of the sky by protective reactions).
o Priority to social concerns (environment, poverty,inequality of opportunity, health, education, fendingoff Malthus) versus priority to private sectordevelopment.
o Restore the net transfer to LMICs (restore financeablecurrent deficits) versus extend the export-led growthparadigm (with no new borrowing).
o Growth through international integration (strengththrough blocs) versus growth through independence,pluralism, and competition.
O Growth through better understanding, advice, andmanagement versus historical determinism (the view thattrends and cycles matter, not leadership--intellectualor otherwise).
Perhaps in our later review of the proceedings of the lasttwo days and of the papers submitted, we shall be able tosummarize the participants' viewpoints in terms of thesedimensions. In this final session Professors Boratav,Fitzgerald, and Taylor may wish to fill in some of theremaining gaps, as they see them now.
I would like to add only a half-baked thought on the issueof governance..!/ This idea may be conveyed by a doodle thatoccurred to me during Professor Shapiro's fascinatingpresentation this morning on the role of government in thedevelopment of Brazil's auto industry.
This argument was made informally after the session, to Boratav andFitzgerald.

- 259 -
The Cycle of Governance in Development
Political StyleResponsive Not Responsive
Economic 2 1Management:
Forceful
Not 3 4Forceful
Four styles of "regime" are defined in this picture by twodimensions, one representing governance that is responsiveor not to the will of the governed, and the other representingeconomic management by government that is forceful or not.Countries find themselves in different regimes in differentepoques. An example of regime 1 (see picture) would be pre-glasnost USSR. Regime 2, Gorbachev's desired destination,is now occupied by a number of NIEs, among others. Some ofEurope's parliamentary democracies now occupy regime 3, whichmay also be the destination of maturing regime 2 countriesas laws and rules become more important in steering theireconomies. Finally, as Mancur Olsen's disease graduallyinvades the body politic (arteriosclerotic syndicalism breaksdown the capacity of the political system to form coherentprograms and set priorities), regime 4 tends to result.Rejuvenation from this state probably awaits a shock that isso challenging to the system's enfeebled capacity to takeaction that forceful management is re-installed. While thedesireable evolution may then be from 4 to 2, this transitionis extremely difficult to achieve politically, and regime 1is the more likely next stop. Hence, we have the makings ofa cycle (following the arrows).
Sustained high growth tends to be most likely in regime 2,becomes less likely as we move to regimes 3 and 4, and isleast likely in regime 1. A complication is that transitionstoward rejuvenation will tend to be destructive to output inthe short run. Long-run growth forecasting may in part be

- 260 -
seen as a matter of keeping your map of the world up to datein terms of countries' actual and prospective situations onthis grid.
A final cautionary note: doctrines of governance adapt to thehost regime. For example, during the last 15 years U.S.economists have shaped doctrines that explain and validateregime 4. Such doctrines have little currency in anevolutionary-distant regime (e.g., 2). The regime-relativismof doctrines about governance should be borne in mind bystudents of global development.
LANCE TAYLOR: I would like to talk about four areas that people havementioned in some of the country papers and in the discussionsand also in this last session.
One has to do, so to speak, with how the north and south hangtogether and sort of what we know and what we don't know.Second, really has to do with industrial policy, again, andsome of the questions that arise in that area. Third, therole of the state and finally I would like to make a fewobservations about some of the regions of the world.
In terms of prospects for the 1990s one obvious amendment to
the previous remarks is that we really have todistinguish--as I mentioned in the context of my paper--between capacity growth on the one hand--and we can argueabout how we measure it--and output growth on the other.
In that, again in many corners of the world, most notably Sub-Saharan Africa and Latin America, the 1980s produced majorexcess capacity overhang and there is output growth that canbe made up in principle with existing capacity which is adegree of freedom that some countries have inherited.
It is not necessarily a degree of freedom you want to have,but if you have it, it is something to think about.
On sort of north/south issues, which sort of come out of thelast session, it seems to me that there are a lot of thingsthat we really don't know very much about. And about whichmaybe the World Bank could enlighten us. And just let me lista few of the unknowns.
First, of course nobody really knows that much about termsof trade dynamics and if you look at the growth patterns indeveloping countries, they are obviously in the '70s and '80squite closely linked to what has been going on with the termsof trade.

- 261 -
The Bank already puts a lot of work into that and it seemsto me that has to be an ongoing research effort. How thatfits into these global data and global modeling exercises,but it is something that also has to be thought through.
There is another issue. What do the terms of trade do to thenorth? There are at least two views in the world. One,obviously that the improvement in developing country termsof trade is going to benefit northern economies by creatingdemand for their products. And the other view is that termsof trade increases are a kind of cost push and they are likelyto be both inflationary and contractionary. How that feedbackworks is an issue that I think nobody understands very welland is worth considering.
Secondly, there is this whole question about whether thereis global Keynesianism in the section, in the one paragraphof the Brandt Report that talked about that (which a lot ofpeople picked up) increased transfers to the south would, infact, have an overall expansionary effect, or on the otherhand, are increased transfers to the south if they arefinanced by borrowing in financial markets going to drive upinterest rates enough to destabilize the south.
That is again a question to my knowledge, nobody has a veryclear answer. The model simulations most recently seem toindicate that the interest rate crowding out effect might bemost important but I would argue to a large extent that isbuilt into those models by their specification and it issomething that we should worry about.
Another point which Fitzgerald and Vos have pointed to intheir writings is that the global macro system is just highlyunstable. World GDP is US$15 trillion or something like that.If you look at recent shocks in the past, the oil shocks,the Volker shock, the U.S. -linked trade deficits, that linkedtrade and fiscal deficits, you are sort of talking about 1percent shocks which had major impacts on the globalsystem.
I think, if you look forward to what may happen in the 1990sthere is bound to be some kind of a shock. We cannotanticipate what it will be but if the system is thatsensitive, looking for and understanding the points ofsensitivities seems to me a sort of useful research project.
Quite clearly one can worry about other dimensions. I willjust mention two. One would be likely trends in technologicalchange in the 1990s. Is there going to continue to besubstitution against materials, which is not going to do very

- 262 -
much either for export volume or terms of trade of thedeveloping countries.
Another issue has to do with direct foreign investment. Iwill say a little bit more about that in the country context,but historically direct foreign investment flows have not beenthat big. The north/south direct investment flow might havebeen of the order of US$10 billion in a good year. Is thatgoing to get bigger with the Taiwanese, Japanese, Germans andwhat will be the implications of that?
A second issue has to do with industrial policy or industrialstrategy. I am not sure it is the job of this particular partof the Bank, but it seems to me that there is a crying needto sort of build up useful generalizations about, so to speak,boundary conditions, and initial conditions in a specificcountry which will make some kinds of industrial policy morehelpful and other kinds less helpful.
There are a few generalizations kicking around. All of thoseendless regressions of Hollis Chenery, my old thesis advisorand former Vice President of this institution, in fact, dotell you something about patterns of structural change, andby extension, how being a large country or a small countryor being more or less open, is likely to influence yourprospects.
Alice Ansden has capitalized in the last six months oncleverly inventing the notion that the Koreans got theirprices wrong and arguing that, in many cases, that is whatyou want to do, or in some cases at least, and I won't tryto replicate her argument here since it is readily available.
Some of Helen Shapiro's work and other historically orientedscholars have produced, I think leads in the direction offormulating generalizations about industrial strategy, butwe are a long way from that goal.
And it seems to me that is a useful research endeavor.
And then finally, I guess, Enzo Grilli is not here, but hewas saying that if you are a small, open economy, that alreadybiases the desirable industrial strategy in a laissez fairedirection. Well, I don't know, I find it difficult to seeany small, open economies around the world. If you look, forexample, at the rich European economies, their governmentsare quite interventionist in a variety of ways. They havenow evolved to be relatively open to trade, but there are allkinds of both social policy and industrial policyinterventions which play a major role in how those economiesoperate.

- 263 -
Malaysia has been quite interventionist in periods. MaybeMalawi is a small, open economy in the traditional sense ofthe word, but even that seems unlikely so that I am not surethat particular generalization holds a lot of water, althoughit is one that still seems to have some weight around thisinstitution.
With regard to the weight of the state more generally, wherewe all really go back to is Gerschenkron and first whetherhe was correct in some sense, in his vision of Europeanindustrialization. But then there is a question, does itgeneralize? Can we learn something from or are thereGerschenkron kinds of generalizations about industrializationand the role of the state that are applicable in thedeveloping country context?
Finally, just let me add a few words about some of the countryresults and for convenience sake more than anything else, letme say something very brief about Asia and Sub-Saharan Africaand Latin America, somewhat flexibly defined.
For example, I might choose to adjoin Turkey and thePhilippines to Latin America, in exchange for Chile andColombia.
Let me just sort of mention a few things that come out interms of the papers on these general areas. First with regardto Asia, I mean the Asian paper of Manuel Montes who is sortof between pessimistic and optimistic. But in the generalview of Asia there is not much consideration of down-siderisk.
You read papers about Malaysia, Thailand, and all of thesewonderful export numbers in the 1980s and projected into the1990s. Now, is this really going to work one asks oneself,I ask myself?
What about competition from Eastern Europe if they get theiract into gear? What about a world recession? The geese maybe flying sort of happily along together, but you know, underwhat circumstances might the geese crash? There has not beenmuch discussion of that.
Sub-Saharan Africa, you know, you have got to ask in ReggeGreen's phrase about adjustment fatigue, how important isthat? And what about absorptive capacity? It is easy enoughto do GAF models to show that one way or another if thetransfer to Sub-Saharan Africa were to increase from let'ssay from US$5 billion or increase by say, US$5 billion, thatcould pay off a considerable growth dividend if you believe

- 264 -
the model--sort of sprinkle US$50 million here and US$100million there.
But is that really feasible in terms of the capacities ofthese countries given the dismantlement of the public sectorsthat has occurred? If increased overseas official developmentassistance is on the cards, which it may or may not be, canit usefully be used and what modalities would be necessaryfor it to be used?
And Latin America, so to speak, one can view as flying onmaybe one half of a wing and a big prayer. The one half ofthe wing is the Brady Plan, of course, which reduces thetransfer, if you think a reasonable position might be zeronet transfer, instead of sort of 2-to-3 percent of GDP nettransfer away from these countries.
If you go back to negative transfers that raises all kindsof questions about aid and capital inflows which are quiteserious, but sort of current account or trade balance mightbe a useful medium term goal.
Is there any way that is going to happen? The Brady Plan isobviously not going to provide enough resources. Then thatcomes back to the direct foreign investment issue, plus somerepatriation of the capital flight. Does recovery in Mexicoand perhaps the azalea miracle if it actually happens providea basis for some kind of major flows into the two bigcountries in the region.
Finally, just let me make just one additional observationabout Eastern Europe, about which I know very little, but whenI was growing up, my mother always accused me of going througha phase of some kind of horrible behavior and I think in manyways what you have got in Eastern Europe now is that they havegot to go through a phase of rediscovering the market, as ifsort of laissez-faire capitalism had not been adequatelydescribed by Engels and Marx, they have to go back and lookat it themselves.
You have got to have the free market chaos, that is going totake a year or two and then you are going to have to recoverfrom that. That is going to take three or four or five years,until you get back to some sort of managed capitalism whichis probably where those countries, like most countries in theworld are going to end up.
This, as I have indicated, is likely to be a long andexpensive process. It is certainly going to be long and onecan think about sort of a big, black hole there just beyondBerlin which is going to absorb a lot of money.

- 265 -
Would that money be better absorbed, for example, in Mexicoor Brazil, and some of the other official borrower countries,which in fact, at one point had a fairly effective managedcapitalism? Is that a decision that this institution is goingto have to think about and if so, how?
MR. BORATAV: I will take only one of the issues you have posed in twodifferent terms.
It refers to improving the market, or allocative efficiencyversus animal spirits, which I think is very closely relatedto your productivity versus saving and investment rates issue.Although when you added technology and technological transferissues to your productivity dimension, then it diverges alittle bit from the standard type of allocative efficiency
discourse.
But anyway, I was--well, a little bit interested to noticethat for two days now we have been discussing among otherthings the question why, despite the fact that prices havebeen corrected and structural adjustment has been, wellsuccessful in many cases, why private investment is not comingup? Why aren't entrepreneurs or private sectors peoplereluctant to invest?
Now, this I think also raises the question of what are theagents of a new surge in development process?
Now, this is closely related to the issue of allocativeefficiency and also brings us to Lance's problem of the roleof the state. I think here, as was developed by ProfessorShapiro's observations, we need first a theory of the state.Secondly, we need another thing, a theory but before a theory,a set of observations, generalizations and elements of theory,maybe hypothesis, on patterns of behavior, anatomy of theprivate sector, or if you will, the bourgeois in under-developed countries, developing countries and maybe ofpotential bourgeoisie in Eastern Europe.
Now, this type of investigation, I think will be on the agendaof many researchers in the coming years, if not on theresearch agenda of the World Bank.
Now, here we have the problem in which there is notnecessarily a confrontation between the two poles of theeconomic life. The state, it is not the state versus theprivate sector.
I think it should be directed towards an analysis ofunderstanding the linkages between the two. And the theory

- 266 -
of the state, for example, the steps which have been takenin that direction, during the past decade within thisinstitution and through its influence, cover only a veryminimal part of the theory of the state, namely, publicenterprise and its malfunctioning, efficiency,inefficiency,functions, etc.
But that is only part of the story. For example, the theoryof the state has to investigate the organic links of thepolitical component of the state, political power with thebusiness community, with the bourgeois also and with theprivate sector.
Also it has to cover the layer of bureaucracy which comes inbetween the two components, the private sector with its linksinto the state structure, definitely the way Manuel haddepicted for the Philippines.
And if you have, for example, as observed in many Asiancountries, a stable, well-paid, well-functioning bureaucracy,also with the ideological misperception that it owns thestate and it has to protect the interests of the state, itcreates a totally different picture, than for example in thePhilippine case where that layer has been either absent ordestroyed or disintegrated.
In many countries in Africa, for example, the recent yearsof very fast erosion of the economic positions of the civilservice has destroyed that layer. At the end it becomes acase in which the state or the people who fill in the statesstructure, the politicians, become the direct continuationsof the interest groups in the society.
This, of course, is a totally unstable situation because thestate engages in an exercise in which it distributes ranksaccording to its individual linkages. It destroys stabilityconditions in the business community. The typical grant-seeking behavior is, I think, developing into a totallymaligned manner and the whole picture, of course, becomeunmanageable.
Whereas the traditional bureaucracy's function in manycountries with long traditions of state maybe with the helpof the implantation of an English, British type ofbureaucratic structure also. Probably the Indian experiencebenefits from both sides--a long tradition of state and alsothe English system often neutral, stable bureaucracy createsconditions in which the so-called grants are distributedneutrally. This neutralizes the conditions of distributionof positions of advantage, which creates conditions ofstability and probably a condition in which the overall

- 267 -
environment will be much more conducive for private investment
behavior and animal spirits, than the other condition of totaldisruption of a neutral state structure.
Now, this, of course, I went beyond the depiction of possibleresearch agenda for the future, but I think that this willbe on our research, individual research agendas of manydeveloping countries.
I think the two elements of such a broad research project,namely analysis of a theory of the state, its composition andits analysis, which public enterprise problems will occupya part but not the central part; and on the other hand, ananatomy of the private sector, its behavioral patterns--firsta descriptive analysis and then elements of a theory--shouldbe a priority research agenda for the near future.
E.V.K. FITZGERALD: The papers presented to this Conference have revealed theremarkable degree of stabilization achieved during the pastten years by LDCs, under very difficult circumstances.Primary fiscal and trade gaps have been closed, and theprofitability of traded production restored; but this painfuladjustment effort has not yet led to a recovery of theproductive investment required for sustained growth andemployment creation. Indeed, the Conference contributorsconcurred on the extreme difficulty of converting anyadjustment programme into a coherent development policy inthe medium term. In my closing comments, therefore, I shalloutline three policy areas for further research that mightbe useful: (a) the restructuring of public finance; (b)private sector response to adjustment; and (c) the linkbetween macroeconomic management and poverty.
Restructuring Public Finance. The relationship between thedebt crisis and public finance has been a recurrent topic inthis Conference. External public liabilities are no longergrowing significantly, but despite imaginative initiativesto reduce them, debt service remains a major burden on thebalance of payments and government expenditure. In contrast,external private assets on any reasonable estimate (such asthe Bank definition of capital flight and BIS records ofoverseas deposits) are of a comparable order of magnitude topublic liabilities and generate considerable investment incomerelative to exports. The problems arising from thedistribution of financial stocks and flows betweeninstitutional sectors may become, therefore, a major issuefor the 1990s.
The need for a renewal of positive net capital flows towardsLDCs is undisputed, but concern has been expressed by manycontributors at the evident reluctance of commercial banks

- 268 -
to return to former LDC clients and the emergence of EasternEurope and the USSR as new destinations. However, theparticipation of private banks is likely to be limited totrade finance and multinational company projects; it ismultilateral lending from Brussels and Washington that willprobably be diverted to the repair of deteriorated SecondWorld infrastructure and environment. The semi-industrial"middle income" countries will be the main losers, for aidto the low-income countries is underwritten by specificlobbies within the OECD. The trade effects of the proposedaccess of ex-CMEA members to European markets will probablyhave a similarly discriminatory effect--reducing NIE exportdemand while increasing the demand for tropical products fromthe poorest countries. Realistic world-economy models mighthelp to gauge the scale of these effects.
Despite the considerable success in reducing primary publicsector deficits, a major transfer problem remains due tooutstanding debt. It is now clear that fiscal adjustment--as opposed to stabilization--will have to be based on taxreform as well as the restructuring of public expenditure.The "Tanzi effect" of inflation on tax yields is probablyreversible, but tax bases themselves have been structurallyundermined by trade liberalization, investment incentives,informalization and capital flight during the 1980s. On thereasonable assumption that expenditure cannot be furthercompressed, at least another 5 points must be added toexisting government revenues (which average almost 20 percentof GNP according to the World Tables), in order to underpina stable public savings rate sufficient to fund infrastructurerehabilitation and debt service domestically. Moreover, suchresource mobilization must yield foreign exchange for boththese purposes, and thus should be levied directly orindirectly on traded consumption. The Bank could play anextremely important role not only in researching improved taxstructures but also in implementation, by legitimatingdomestic reform and promoting international tax cooperation.
Private Sector Res-ponse to Adjustment. If the key tostabilization is the reduction of government expenditure and"getting prices right", adjustment itself requires a recoveryof private savings and investment. Private savings rates haverisen during the 1980s, not least because of inflationarydeterioration of real wages as the real exchange rate has beenrestored, although the wealth effect may also be significant.None the less, rates of gross fixed capital formation (andnet rates a fortiori) in the private sector of most LDCs havefallen steadily through the 1980s despite risingprofitability. Moreover, to the extent that these higherprivate savings are "forced" as the external gap is closed
- 269 -
(by lack of finance) more rapidly than the fiscal gap, theymay not be sustainable in the longer run.
The financial assets held abroad (or as hoarded foreignexchange) by the private sector now make up a large part ofLDC business portfolios, and in a number of cases exceed thedomestic quasi-money stock. An obvious consequence of suchoverseas holdings is to reduce the scope of domestic monetarypolicy, and the outflow is also usually regarded as a resourceloss to the economy. None the less, from the point of viewof the private sector they are a valid defensive response touncertainty. Moreover, the opening of the LDC private sectorto world trade requires overseas asset holdings in order toprovide working capital for export and import operations.Similarly, the relative deterioration of welfare services byinternational standards, appears to have led to professionaland managerial classes holding assets overseas in order toguarantee their "life cycle" expenditure on education andhealth abroad.
In other words, private fixed investment in the domesticeconomy is not savings-constrained as such but rather aquestion of portfolio structure related to enterprise andhousehold strategies. However, the lack of fiscal incidenceon such patterns of asset accumulation does shift the burdenof debt service away from those best able to bear the cost.The repatriation of private capital after a decade of debtcrisis probably requires much more than a change ofmacroeconomic management- -possibly even the external guaranteeof property and income therefrom within recognized fiscalrules, which would imply modification of internationalcommercial law.
Despite the emphasis currently placed by internationaldevelopment agencies on the private sector as the major agentof economic development, its behavior is not clearly specifiedin policy models where it tends to be treated as a "black box"suffering from crowding-out, lack of confidence or whatever.Considerable analytical work has been done in recent yearson the microeconomic behavior of peasant farmers and smallindustrialists, but this has not yet been built into themacro-models which underpin adjustment policy. We have evenless systematic information on the way large domestic firms(including banks) actually behave in practice and theimplications of multinational intra-firm trade, and thus oncorporate response to adjustment policy. A first step wouldbe to strengthen national accounts systems so that privateenterprise and household balances are reliably recorded.The World Bank's new General Accounting Framework (GAF) whichdistinguishes between the public and private sector for all

- 270 -
the macroeconomic aggregates is a useful step forward in thisrespect.
Macroeconomic Management and Povertv. Poverty (or rather itsreduction) has not been an explicit theme of this Conference,except insofar as social resistance to unemployment and realwage cuts has made effective adjustment more difficult duringthe 1980s by undermining the political consensus required toimplement economic policy. Falling real wages have beenreported at this Conference to have helped public expenditurereduction and thus control excess demand, although pressureto maintain government employment has prevented a more radicalrestructuring of the state, while low earnings have lead towidespread civil service demoralization. In the privatesector, lower real wages do not appear to have promoted moreemployment, probably because there is less scope for factorsubstitution than many economists had believed and privateinvestment has yet to recover. However, it may well be thatspecific "meso-policy" intervention is required forappropriate technologies to be taken up. To the extent thatthe burden of the transfer problem has been born by householdsrather than by enterprises, this may explain why adjustmentis widely believed to have negative consequences for womenand children.
The survival strategies of the poor may well be the invisibleface of adjustment, but they have changed the ways in whichLDC macroeconomies function. Not only the increasinginformalization of such economies, but also the recourse ofthe poor to international migration and environmentaldegradation have serious long-term implications. Moreover,the impression is now growing, among European aid agenciesat least, that attempts to channel aid to the poorest throughnon-governmental organizations (so as to avoid increasinglyineffective public institutions) have in practice oftenundermined social welfare provision systems as a whole. Thereinstatement of poverty to the development agenda for the1990s presumably means that employment creation and basicneeds provision will have to be integrated to macro-economicpolicy analysis. Here too the Bank could give a lead insupporting appropriate data systems (such as the SocialAccounting Matrices) and planning models based on the observedbehavior of the private sector rather than an abstract notionof "the market".
Distributors of World Bank PublicationsARGENTINA FINLAND MEXICO SPAINCmo lHEnc SRL 1s ( a INPCrEC Mundi-PUams lbrog, SAGdwlaG0inxm P.O. Box 12 Apmrtdo Posl 2246D0 Cb.d137FPoida 165,4tkhFoPrOft 4S3/465 SP-00I0 14060TIalp1MxO.P. 2sD Maid1333 EumoAim Nok M 210
MOROCCO tfaloWa dkngozal AEIDOAUSTRALIA. PAPUA NEWGUINBA. FRANCS So &EhWm Mk M r dne CouDI de Ce. 391FPl, SOOMON ISLANDs, Wor2dBlck Publkctt 12rmt MmestBd.dAfa 0d'911rdoVANUATU, AND WESTIEN SAMOA 64s muedI&x CoacbImDA.Br**&Jmm. 75116 Pas SRI LANKA AND tINE MAAlDIVES6"a Whitehorsd NETHERILANDS Lake Housew ockhopMidiam 3132 GERMANY, FEDRDAL REPUBLIC OF IOr.PobUk&rb.v P.O. box 244Vicodl UNO-Vedag P* Pm14 IOD, SirChttamA.Gardiner
Poppelidotfot AIfSS 7240 BA Lacios M rlw.AUSTRIA D9 rI Cdombra 2Gedd and Co NEW ZIEALANDGnben 31 GREEE HUis lbxray and lolirmtion Sevic SWEDENA,IO1 Winr KEME w.6 jws
24, Wpdnmou Street Flail Plasim New Mar" Prtmo Fbks1-etgtSANRAIN Adma-11635 Adckbmd Regs, tn 2 Fox 16356BdhrWnResearch asndanltanry S-il327Stoddhim
Aodxisx Lid. GUATEMALA NIGEIUAP.O. Box 2103 lUbemiPiedraSants Udivesty Pm Lmid Fa otManama Tawn 317 So. CrIe 7-SS Thre C BosSuilding8jfich. Wernen-WitlamosAB
Zon. I rilvateMsI.0 191ag Box EEBANGLADESH GuabenalaCily ibadan SI04255tchchmMicrondbifd ewdmet
Asistance Sodety IDOAS) HONG KONG, MACAO NORWAY SWITZERLANDHouseS5, Rsd 16 Asia 311 Lid. NarInforntatko, Ceer FuMql s14ti .LraomoxdJ FR/Am 6 1,146 Prhce Edward BDepatment Librai ryt
Dhaka 1209 Roasd,W. PF.O B 6125 EFtem- 6un GremuKowloon NIXOd020o 6 Cue postale
3S
Br Hong XK-g CHi21 Gaevosai156, NrnAhmd Sak OMANOCitt1gg 4DOD HUNGARY MBMRB Inforati Seinvsf Pais Fe Gol. od
KaiIwr P.O. Box 1613, SebAhport LlbriuePayot76, KDA Avem.. P.O. Box 149 Mut Semis, de Abontment,K.fm 1389 Bud" 62 Cue podati 3312
PAKISTAN CH 1l02 LauoneBELGIUM INDIA Ml.. Book AgamyPubEralon. dleeNatiooxns ni, Allie Publishun Private Ltd. Q; -QAh6Qa1A TANZANIAAv. du Rd 202 751 MorntRoad PO Box NNo 729 drxdUiverity,Pas10omamBuds Md-6DD2 LAhore3 PD. Box S299
Dar e SSaam
Publko.Tomdcicate nua-d 152].N HerdiaMar1 Ediota Dmondlo SA THAILANDLtds. Said Estate Apt.do 3124 Certral DOearnt Sa.
RuN Pbot Gmlde 209 Bsnby -40D 038 Itma 306 SiLn R.ad
01409Sao a"SP 13/14Aad AR Road PHILIPPINESCANADA NewD0db -I1D02 Nais lBodk Store TRNIDAD & TOAGO, ANTIGUAL DIHEI 51 RtlzalAvoxue BARBUDA, BARBADOS,Cr.S5 ,1 9trt eAm1rke 17CldttnpnAvmnue P.O. Box1934 DOMINICA,GRENADA,GUYANA,
ooudkrvil. Qiu6ec Calcutta} 700072 MCoMMnilh JAMAICA, MONTSERRAT, ST.Jo E6 KTS 4& NEVIS. ST. LUCIA4
jaysdev. Hostl Buiding POLAND ST.VINCENT&GRENADWESCiGiNA Sti Main R-os G..,dluiager ORPAN Syusteinalsfirxi16mUnitCtiD. Inndal & Ecoeml bibdx Bgalor- SS09 Pala KulturyiNauld 09Wdb Stret
Honda. 51-60 Waruaws CorepS,DoFSiDcOgJie 3-5-1129 Xadlguds COr Road Trivided. WestIndiesBdjt Hydbenbd - 5El 027 PORTUGAL
UvreIa Pt.tuga TURKERYCOLOMBIA Potnh PlHats, rd Flor Ru Do Carno70-74 Hadetltai4 AS.EnIsceLgda. cT%akorTeEn% Navrao&,ura 120011 LAr 1ilda lCadde No. 469Aprtado Aot. 3400 Almedaiad-380009eB%taeDI E SAUDI ARABIA. QATAR Istanbul
COTDIYVdIRE I6-A AshkMurg P.O. ,396,P UGANDACaenre d'Edium e .de Diffusion IuLwatow- 2261111 F4ad 11471 Uganda FonkaiaP
AhkaLMneeCCEDA) P.O. Box 714504 B .541 INDONESIA MEMRB huftrm S.ie KmpzalaAbidim 04 PIme.u Pt Mdlir limited B5osuaff :
A. Sn Rang 27 AAlsStreet UNIED ARAEBMIRATESC US P.O. Box lI Al ua Ccter MBMR Gulf Co.MBMRB rInfoibnxSltvlcn Jakb Posd Fsse lotor P.O. Box 697P.O. Fox 2BI PJ.O.Box7l8SS)oNicots ITALY RB 7S
Liass ColiflsidOnAxiA SaUnad SP'A UNrW ICiNGDOMDENMARK Vit BnedfttoFdn,120/10 H# dAbduhAlihA hBuulng MrolloLtd.SamhmdsLilaotarw CCaseimPombde,552 Iong kQad Skeet P.O. Bx 3RosmmomnA]1,11 9125 Floreorm P.O. Box 369 Altos, d eGU34 2PG
DK-1g70PmAer*mbmSC JAPANDanu,Eg-DOMINICAN REYPUBIC Eutn Book Snado. 33, Mohumned Haman Awad Slreet URUGUAYEdiar TT*er,rCpozrA 374 H}go 3.Qtee, Bunkyoe 113 P.O. BM 978 InaithtoNociaui ddliboRestaurad6o eliabella CaIdca 309 Tokyo ledd Slo Jse 1116Apattado FPo"a 1190 MoutevidemSmoi.Draniago KENYA SINGAPORE, TAIWAN, MYANMAS,
EL SALVAOkS,Foo Ionia A.) Ltd. *RUNEI VENEZUELAEL SALVAtIOR PD.O Box 45245 InomnAbonPuL,blcaons Luau. del StePosades Naivebte PirFis tAd. Apido. 6D337AvaFdda Manuel Enriqe iAm ISESI 02-061.1 FL, Pd-f. Industrial Catracs 1060-Adfido SE1A, la. Pl.o KOREK, REWBUC OF SW&
R, Seivradqr P x oCaI c pema mt 24NewInduat"Road YUGOSLAVIA
EGYYT, AtA REPULIC OF roox 101, K.nOsn S pes 193 oU K36 gaAl Alurmms SOSriT AFRICA, BOTSWANA Tog RepbuukeAl Galas Strhet XUWAIT Fors YllQDBelrdeC o MBMRB InW-mmaon Serlcm COddUz darveyP, SBgthed
P.O. BOx565 W.AfriTlxeMidde Eat Obsever P.O. BoK 11418 tCawa rcet iMALAYSIA CApeToWn tctro UntvemotydMdsysCoopeartix
Bookeh, Ltndied F er ' arPrD. Box 1127, Jal Pal FnBa .terndioa act on S
Knh Lvur P.O Box 41095
J.hammegu 2D24


Recent World Bank Discussion Papers (continued)
No. 69 A Multilevel Model of School Effectiveness in a Developing Country. Marlaine E. Lockheed and Nicholas T. Longford
No. 70 User Groups as Producers in Participatory Afforestation Strategies. Michael M. Cemea
No. 71 How Adjustment Programs Can Help the Poor: The World Bank's Experience. Helena Ribe, Soniya Carvalho,Robert Liebenthal, Peter Nicholas, and Elaine Zuckerman
No. 72 Export Catalysts in Low-Income Countries: A Review of Eleven Success Stories, Yung Whee Rhee and Therese Belot
No. 73 Information Systems and Basic Statistics in Sub-Saharan Africa: A Review and Strategyfor Improvement. RameshChander
No. 74 Costs and Benefits of Rent Control in Kumasi, Ghana. Stephen Malpezzi, A. Graham Tipple, and Kenneth G.Willis
No. 75 Ecuador's Amazon Region: Development Issues and Options. James F. Hicks, Herman E. Daly, Shelton H. Davis,and Maria de Lourdes de Freitas [Also available in Spanish (75S)]
No. 76 Debt Equity Conversion Analysis: A Case Study of the Philippine Program. John D. Shilling, Anthony Toft, andWoonki Sung
No. 77 Higher Education in Latin America: Issues of Efficiency and Equity. Donald R. Winkler
No. 78 The Greenhouse Effect: Implicationsfor Economic Development. Erik Arrhenius and Thomas W. Waltz
No. 79 Analyzing Taxes on Business Income with the Marginal Effective Tax Rate Model. David Dunn and AnthonyPellechio
No. 80 Environmental Management in Development: The Evolution of Paradigms. Michael E. Colby
No. 81 Latin America's Banking Systems in the 1980s: A Cross Country Comparison. Felipe Morris, Mark Dorfinan,Jose Pedro Ortiz, and others.
No. 82 Why Educational Polides Can Fail: An Overview of Selected African Experiences. George Psacharopoulos
No. 83 Comparative African Experiences in Implementing Educational Policies. John Craig
No. 84 Implementing Educational Polides in Ethiopia. Fassil R. Kiros
No. 85 Implementing Educational Polides in Kenya. G. S. Eshiwani
No. 86 Implementing Educational Policies in Tanzania. C. J. Galabawa
No. 87 Implementing Educational Polides in Lesotho. T. Sohl Thelejani
No. 88 Implementing Educational Polides in Swaziland. Cisco Magalula
No. 89 Implementing Educational Polides in Uganda. Cooper F. Odaet
No. 90 Implementing Educational Polides in Zambia. Paul P. W. Achola
No. 91 Implementing Educational Polides in Zimbabwe. 0. E. Maravanyika
No. 92 Institutional Reforms in Sector Adjustment Operations: The World Bank's Experience. Samuel Paul
No. 93 Assessment of the Private Sector: A Case Study and Its Methodological Implications. Samuel Paul
No. 94 Reaching the Poor through Rural Public Employment: A Survey of Theory and Evidence. Martin Ravallion
No. 95 Education and Development: Evidencefor New Priorities. Wadi D. Haddad and others
No. 96 Household Food Security and the Role of Women. J. Price Gittinger and others
No. 97 Problems of Developing Countries in the 1990s. Volume 1: General Topics. F. Desmond McCarthy, editor

The World BankHeadquarters European Office Tokyo Office U1818 H Street, N.W. 66, avenue d'1ena Kokusai BuildingWashington, D.C. 20433, U.S.A. 75116 Paris, France 1-1 Marunouchi 3-chome
Chiyoda-ku, Tokyo 100,JapanTelephone: (202) 477-1234 Telephone: (1) 40.69.30.00Facsimile: (202) 477-6391 Facsimile: (1) 47.20.19.66 Telephone: (3) 214-5001Telex: wur 64145 WORLDBANK Telex: 842-620628 Facsimile: (3) 214-3657
RcA 248423 WORLDBK Telex: 781-26838Cable Address: INTBAFRAD
WASHINGTONDC
ISBN 0-8213-1633-8