JAERI-Conf 98-004 - OSTI.GOV
200
JAERI-Conf--98-004 JAERI-Conf 98-004 JP9808042 PROCEEDINGS OF THE FIRST JAERI-KANSAI INTERNATIONAL WORKSHOP ON ULTRASHORT-PULSE ULTRAHIGH-POWER LASERS AND SIMULATION FOR LASER-PLASMA INTERACTIONS JULY 14-18,1997, KYOTO RESEARCH PARK, KYOTO, JAPAN March 1998 Kansai Research Establishment 29-43 H * HI ? »flf SS Pff Japan Atomic Energy Research Institute
-
Upload
khangminh22 -
Category
Documents
-
view
0 -
download
0
Transcript of JAERI-Conf 98-004 - OSTI.GOV

JAERI-Conf--98-004
JAERI-Conf98-004
JP9808042
PROCEEDINGS OF THE FIRST JAERI-KANSAI INTERNATIONALWORKSHOP ON ULTRASHORT-PULSE ULTRAHIGH-POWER LASERS
AND SIMULATION FOR LASER-PLASMA INTERACTIONSJULY 14-18,1997,
KYOTO RESEARCH PARK, KYOTO, JAPAN
March 1998
Kansai Research Establishment
2 9 - 4 3 H * HI ? »flf SS PffJapan Atomic Energy Research Institute

(T319-1195
- (T319-H95 ^
li
This report is issued irregularly. I
Inquiries about availability of the reports should be addressed to Research Information j
Division, Department of Intellectual Resources, Japan Atomic Energy Research Institute,
Tokai-mura, Naka-gun, Ibaraki-ken, 319-1195, Japan.
©Japan Atomic Energy Research Institute, 1998 [

JAERI-Conf 98-004
Proceedings ofthe First JAERI-Kansai International Workshop
on
Ultrashort-Pulse Ultrahigh-Power Lasersand
Simulation for Laser-Plasma Interactions
in
Joint ICFA/JAERI-Kansai International Workshop '97
14 to 18 July 1997
Kyoto Research Park
Kyoto, JAPAN
Japan Atomic Energy Research Institute
JAERI-Conf 98-004
t - V-liiik'rf.fV'"1
COa.CO
o- 4 - 1
o
oo
I
a.o
o
COc:oCO
c:
toc
I
o

JAERI-Conf 98-004
Proceedings of the First JAERI-Kansai International Workshop onUltrashort-Pulse Ultrahigh-Power Lasers and Simulation for Laser-Plasma Interactions
July 14-18, 1997, Kyoto Research Park, Kyoto, Japan
Kansai Research Establishment
Japan Atomic Energy Research Institute
Higashisiokoji-cho, Simogyo-ku, Kyoto-shi, Kyoto-fu
(Received February 5, 1998)
Records of the First JAERI-Kansai International Workshop, which focused on the subject of
"Ultrashort-Pulse Ultrahigh-Power Lasers and Simulation for Laser-Plasma Interactions", are
contained in this issue. The First JAERI-Kansai International Workshop was held as Joint ICFA/
JAERI-Kansai International Workshop '97 with International Committee for Future
Accelerators(ICFA). The number of oral presentations was 27 at the First JAERI-Kansai International
Workshop. This report consists of 24 contributed papers.
Keywords: JAERI-Kansai, Ultrashort-Pulse Lasers, Ultrahigh-Power Lasers, Simulation,
Laser-Plasma Interactions

JABRI-Conf 98-004
V- i/ a V
1997^ 7 /§ 140-18a^ M
(1998^2^5
—9*—
©r—- > J / g
Accelerators)
' 97) t
a v ~?
(International Committee for Future
(Joint ICFA/JAERI-Kansai International Workshop
1 d ] K B W ^ P i T H ^ 7 - ^ i/ a
: T600-8216 - 9
JAERI-Conf 98-004
Contents
1. Photon Acceleration Versus Frequency-domain Interferometry for Laser Wakefield
Diagnostics ,..., 1
J.M. Dias (Institute Superior Tecnico), L.O. Silva (Institute Superior Tecnico/UCLA) and
J.T. Mendonca (Institute Superior Tecnico)
2. Staged Electron Laser Accelerator (STELLA) Experiment at Brookhaven ATF 25
I.V. Pogorelsky, A.van Steenbergen, J.C. Gallardo, V. Yakimenko, M. Babzien,
K.P. Kusche, J. Skaritka (BNL), W.D. RLmura, D.C. Quimby, K.E. Robinson,
S.C. Gottschalk, L.J. Pastwick, L.C. Steinhauser (STI Optronics Inc.), D.B. Cline, Y. Liu,
P.He (UCLA), F. Camino, I. Ben-Zvi (SUNY at Stony Brook), R.B. Fiorito, D.W. Rule
(NSWC), R.H. Pantell (Stanford Univ.) and J. Sandweiss (Yale Univ.)
3. Simulation of Intense Laser-Dense Matter Interactions
- X ray production and Laser absorption - ., , , 31
Yutaka UESHIMA, Yasuaki KISHIMOTO, Akira SASAKI (JAERI),
Yasuhiko SENTOKU (ILE, Osaka Univ.) and Toshiki TAJIMA (JAERI/Univ. of Texas)
4. Pondermotive Absorption of a Short Intense Laser Pulse in a Non-uniform Plasma 37
A.A. Andreev, K.Yu. Platonov (Vavilov State Optical Institute) and
K.A. TANAKA (ILE, Osaka Univ.)
5. Integrated Code Development for Studying Laser Driven Plasmas 41
Hideaki TAKABE, Hideo NAGATOMO, Atsusi SUNAHARA, Naofumi OHNISHI,
Syuji NARUO and Kunioki MIMA (ILE, Osaka Univ.)
6. 3d Particle Simulations on Ultra Short Laser Interaction 52
Katsunobu NISHIHARA, Takashi OKAMOTO and Hidekazu YASUI (ILE, Osaka Univ.)
7. Ultra Fast Atomic Process in X-ray Emission by Inner-shell Ionization 58
Kengo MORIBAYASHI, Akira SASAKI (JAERI) and
Toshiki TAJIMA (JAERI/Univ. of Texas)
8. Stimulated Raman Backscattering at High Laser Intensities 64
Milos M. SKORIC (Vinca Institute), Toshiki TAJIMA, Akira SASAKI (JAERI),
Aleksandra MALUCKOV and Moma JOVANOVIC (Univ. of Nis)
9. Plasma Simulation with the Differential Algebraic Cubic Interpolated Propagation Scheme .... 70
Takayuki UTSUMI (JAERI)
10. Correlations in a Partially Degenerate Electron Plasma ... 76
Junzo CHIHARA (JAERI)
11. Time-dependent H-like and He-like Al lines produced by Ultra-short Pulse Laser 82
Takako KATO and Masatoshi KATO (NIFS), Ronnie SHEPHERD, Bruce YOUNG,
Richard MORE and Al OSTERHELD (LLNL)

JAERI-Conf 98-004
12. Theory and Simulation of Ultra-short Pulse Laser Interactions 88
Richard MORE, Rosemary WALLING, Dwight PRICE, Gary GUETHLEIN,
Rick STEWART, Steven LIBBY, Frank GRAZIANI and Joann LEVATIN (LLNL)
13. Modeling of Collisional Excited X-ray Lasers using Short Pulse Laser Pumping 96
Akira SASAKI, Kengo MORIBAYASHI, Takayuki UTSUMI and
Toshiki TAJIMA (JAERI)
14. Optical Properties of Cluster Plasma 102
Yasuaki KISHIMOTO (JAERI), Toshiki TAJIMA (JAERI/Univ. of Texas) and
Mike C. DOWNER (Univ. of Texas)
15. Array Processors Based on Gaussian Fraction-free Method 112
Shietung Peng (Univ. of Aizu), Igor Sedukhin (Hiwada Electoronic Corp.) and
Stanislav Sedukhin (Univ. of Aizu)
16. Numerical Simulation of Extremely Chirped Pulse Formation with an Optical Fiber 118
Tamitake ITOH, Akihiko NISHIMURA, Kazuyoku TEI, Tohru MATOBA,
Hiroshi TAKUMA (JAERI), Mikio YAMASHITA and Ryuji MORITA (Hokkaido Univ.)
17. Emerging Terawatt Picosecond CO2 Laser Technology 125
I.V. Pogorelsky (BNL)
18. Next Generation Chirped Pulse Amplification 131
John NEES, Subrat BISWAL, Gerard MOUROU (Univ. Michigan),
Akihiko NISHIMURA and Hiroshi TAKUMA (JAERI)
19. Flashlamp Pumped Ti-sapphire Laser for Ytterbium Glass Chirped Pulse Amplification 136
Akihiko NISHIMURA, Akira OHZU, Akira SUGIYAMA, Yoichiro MARUYAMA,
Takashi ARISAWA, Hiroshi TAKUMA (JAERI), Edward ERICKSON (EEA),
Susumu OWADA, Sousuke SATOU (EASEL), John NEES, Subrat BISWAL and
Gerard MOUROU (Univ. Michigan)
20. Efficient Chirped-Pulse Amplification of Sub-20fs Laser Pulses 139
Shinichi MATSUOKA and Koichi YAMAKAWA (JAERI)
21. Development of Laser Diode-Pumped High Average Power Solid-State Laser for the
Pumping of Ti:sapphire CPA System 145
Yoichiro MARUYAMA, Kazuyoku TEI, Masaaki KATO, Yoshito NIWA,
Sayaka HARAYAMA, Masaki OBA, Tohru MATOBA, Takashi ARISAWA and
Hiroshi TAKUMA (JAERI)
22. Development of All Solid-State, High Average Power Ultra-Short Pulse Laser for X-ray Generation
-High Average Power CPA System and Wavefront Control of Ultra Short Laser Pulse- 150
Sayaka HARAYAMA, Katsuaki AKAOKA, Kazuyoku TEI, Masaaki KATO,
Yoshito NIWA, Yoichiro MARUYAMA, Toru MATOBA, Takashi ARISAWA and
Hiroshi TAKUMA (JAERI)
IV
JAERI-Conf 98-004
23. 80-W cw TEMoo IR Beam Generation by use of a Laser-diode-side-pumped Nd:YAG
Rod Laser 156
Susumu KONNO, Shuichi FUJIKAWA and Koji YASUI (Advanced Technology R&D
Center, Mitsubishi Electric Corporation)
24. Reliability of Czochralski-grown p -BaB2O4(BBO) Devices 162
Nobuhiko UMEZU, Tatsuo FUKUI, Tsutomu OKAMOTO, Hiroyuki WADA,
Kouichi TATSUKI, Kenji KONDO and Shigeo KUBOTA (Research Center, Sony Corporation)
Appendix Program of Joint ICFA/JAERI-Kansai International Workshop '97 168
Author Index 184
Keyword Index 187

JAERI-Conf 98-004
1 . Photon Acceleration versus Frequency-domain Interferometry
for Laser Wakefield Diagnostics
J. M. Dias1, L. Oliveira e Silva1'2, and J. T. Mendonc.a1
1 GoLP/Centro de Fisica de Plasmas, Institute Superior Tecnico, 1096 Lisboa Codex, Portugal
2Department of Physics and Astronomy, University of California at Los Angeles,
Los Angeles, CA 90095, U.S.A.
Abstract
A detailed comparison between the photon acceleration diagnostic tech-
nique and the frequency-domain interferometric technique for laser wakefield
diagnostics, by using ray-tracing equations is presented here. The dispersion
effects on the probe beam and the implications of an arbitrary phase veloc-
ity of the plasma wave are discussed for both diagnostic techniques. In the
presence of large amplitude plasma wave and long interaction distances sig-
nificant frequency shifts can be observed. The importance of this effect on
the determination of the phase and frequency shifts measurements given by
each of the two diagnostic techniques, is also analyzed. The accuracy of both
diagnostic techniques is discussed and some of their technical problems are
reviewed.
- 1 -
JAERI-Conf 98-004
I. INTRODUCTION
In recent years, there has been great interest in the generation of large amplitude elec-
tron plasma waves because of their potential application for particle acceleration. One of
the most promising schemes of electron plasma waves production is the laser wakefield ac-
celerator. One of the most important goals of the research in this field is the development of
experimental techniques to characterize the plasma wave generated by the laser. The first
measurements of the temporal and spatial characteristics of the electron density perturba-
tion in a laser wakefield accelerator, were reported recently. These experiments, carried out
by researchers at the Ecole Polytechnique de Paris [1] and at the University of Texas at
Austin [2], were based on the measurement of the phase shift suffered by a probe laser pulse
in the laser wakefield, using the frequency-domain interferometric technique [3,4].
In parallel, another experiment was performed by our group in collaboration with the
Laboratoire de Optique Appliquee in France with the aim of studying the photon acceleration
mechanism in the interaction of short laser pulses with relativistic ionization fronts [5]. We
were able to obtain an estimate for the velocity of the ionization front and its maximum
electron density, clearly pointing out the feasibility of a new diagnostic tool based on the
measurement of the frequency-shift suffered by a probe laser pulse interacting with coherent
relativistic structures (e.g. laser wakefleld) in laser produced plasmas.
In this paper a detailed comparison of this two diagnostic techniques is carried out. A
numerical simulation based on the ray tracing equations for the probe laser pulse is employed
to calculate the frequency shift due to photon acceleration of the laser pulse co-propagating
with the plasma wave. The same simulation also allow us to determine the phase shift
of the laser pulse propagating in the laser wakefield relative to another laser pulse which
propagates in the unperturbed plasma. Comparing both results we are then able to evaluate
the importance of the frequency shift, induced by the plasma wave, on the determination of
the phase shift. On the other hand, due to nonlinear effects [6] and 3D effects [7], it is clear
that the group velocity of the driving beam, responsible for the wakefield excitation, can

JAERI-Conf 98-004
be considerably different from the velocity obtained from the linear dispersion relation in a
plasma (vgunear — cJl — tj^/u)2, where u>p is the plasma frequency and u> is the laser pulse
frequency). Due to this difference we have analyzed the regimes where the phase velocity of
the wakefield is different from the group velocity of the probe pulse (which obeys the linear
dispersion relation).
This paper is organized as follows. In Section II, we present the working principles of
the two diagnostics, stressing the major technical characteristics of the frequency-domain
interferometric technique and pointing out the most important aspects of a photon acceler-
ation diagnostic. In Section III we first present, for the sake of completeness, the ray tracing
equations used in the simulations and the calculation of the relative phase shift. The ex-
pressions for the wakefield scaling laws are also given and the results of the simulations are
presented for several scenarios corresponding to different wakefield time/length scales and
phase velocities. Finally, in the last section, we state the conclusions.
II. DIAGNOSTIC PRINCIPLES
A, Frequency-domain Interferometry
The objective of this diagnostic technique is to measure the phase shift suffered by a
probe laser pulse travelling in a plasma perturbation (laser wakefield), relatively to another
unaffected laser pulse (reference pulse). The experimental principal is at follows: An high-
intense and ultra-short laser pulse (pump pulse) ionizes a gas at the focal region and excites
the electron density perturbation called laser wakefield. A double pulse beam (probe and
reference pulses) is focused on the same axis. Co-propagating with the plasma density wave
ne(z,t) the probe pulse will experience an optical phase shift A<f> proportional to ne{z, t),
while the reference pulse, which precedes the pump pulse, passes the interaction region
unperturbed. The relative phase shift between these two probing pulses is then measured
by the frequency-domain interferometric technique. The relative position in time of the
- 3 -
JAERI-Conf 98-004
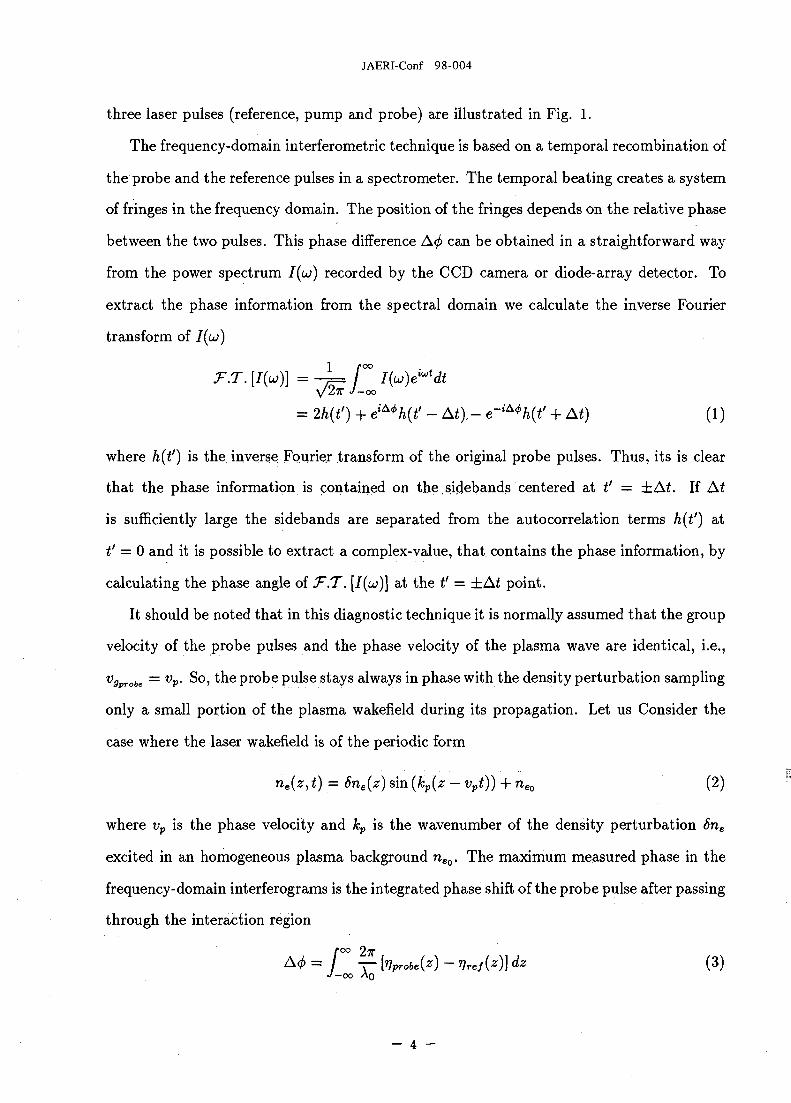
three laser pulses (reference, pump and probe) are illustrated in Fig. 1.
The frequency-domain interferometric technique is based on a temporal recombination of
the probe and the reference pulses in a spectrometer. The temporal beating creates a system
of fringes in the frequency domain. The position of the fringes depends on the relative phase
between the two pulses. This phase difference A<j> can be obtained in a straightforward way
from the power spectrum 7(u>) recorded by the CCD camera or diode-array detector. To
extract the phase information from the spectral domain we calculate the inverse Fourier
transform of 7(ti>)
= 2h{t') + eiMh(t' - At)- e~iA4lh(t' + At) (1)
where h(t') is the inverse Fourier transform of the original probe pulses. Thus, its is clear
that the phase information is contained on the sidebands centered at t' = ±Ai. If At
is sufficiently large the sidebands are separated from the autocorrelation terms h{t') at
t' = 0 and it is possible to extract a complex-value, that contains the phase information, by
calculating the phase angle of T.T. [/(u;)] at the t' = ±At point.
It should be noted that in this diagnostic technique it is normally assumed that the group
velocity of the probe pulses and the phase velocity of the plasma wave are identical, i.e.,v9Probe = vp- So, the probe pulse stays always in phase with the density perturbation sampling
only a small portion of the plasma wakefield during its propagation. Let us Consider the
case where the laser wakefield is of the periodic form
ne(z, t) = 6ne(z) sin (kp(z - vpt)) + neo (2)
where vp is the phase velocity and kp is the wavenumber of the density perturbation 6ne
excited in an homogeneous plasma background neo. The maximum measured phase in the
frequency-domain interferograms is the integrated phase shift of the probe pulse after passing
through the interaction region
/•co 2TT
A<f>= — [r)probe{z) - r)ref(z)] dz (3)•/-co AQ
- 4 -

JAERI-Conf 98-004
where Ao is the wavelength of the probe and reference pulses. The plasma refractive index
seen by the probe pulse r)probe(z) = Jl n*(z)+n*Q a n d the plasma refractive index r}ref(z) =
Jl — ^p- seen by the reference laser pulse are determined by the amplitude of the laser
wakefield 8ne{z) and by the unmodulated plasma neo, respectively (where nc is the critical
density for the two laser pulses).
Finally, by sweeping the probe pulse along a period or more of the plasma wave with
a time delay line, it is possible to reconstruct the wakefield oscillation with an amplitude
given by eq.(3) and a wavelength identical to that of the plasma wave, \p = 2ir/kp.
At this point it is important to notice that the above description [1,2] of the phase
shift, suffered by the probe pulse, leaves out the contribution of the frequency shift of the
pulse. The dependence of the group velocity of the probe pulse on the local plasma density
Vgprobe(8ne) is also not taken into account.
Apart from these two weaknesses, one of the most important characteristics of this
diagnostic technique is its high sensitivity to small density perturbations. This comes from
the fact that in this interferometric technique the signal is placed on a carrier (frequency-
domain fringes) and uses phase-sensitive lock-in detection in order to avoid stray light, pump
leakage and detector defects problems.
B. Photon acceleration technique
Strictly speaking, photon acceleration was the name initially proposed by Wilks et al.
[8] to label the frequency shift produced by a wakefield. But it can also be used to describe
the frequency shift in other configurations [9]- [11].
Let us consider a plasma wave described by Sne = 6neo sin (fcPC)> where £ = z — vpt is the
perturbation frame, and assume a low-intensity probe laser pulse centered around £ = 0,
with a pulse length az <C 2ir/kp. As we can see by the illustration of Fig.2, the local density
at the front of the laser pulse will be less than that at the back of the pulse. Since the phase
velocity is proportional to the plasma density, the phase velocity of the pulse at the front
- 5 -

JAERI-Conf 98-004
is slower than at the back of the pulse. Hence, the phase peaks at the back move faster
than those at the front of the laser pulse (represented here as a wave packet) the wavelength
decreases and the frequency increases. For small shifts and considering that the laser pulse
stays in phase with the plasma wave {vgprobe = vp), the frequency will be up-shifted according
to [12]
AzJLcos(iLC) • (4)2u>0 neo
where u>p is the plasma frequency of the unperturbed plasma, u;0 the frequency of the laser
pulse, and Az is the propagation distance.
From eq.(4) we can easily map the plasma wave (i.e., plasma wakefield) by putting the
probe laser pulse at different positions of the plasma oscillation £, like in the frequency-
domain interferometry diagnostic technique, described in the previous sub-section. Notice
that eq.(4) is only valid for very small frequency shift Aw •< u0. This is usually true for
the present laser wakefield experiments, but in future experiments with long propagation
distances and large plasma wave amplitudes the frequency shifts can be of the order the
frequency of the laser pulse. In this picture a more general theory must be used. Recently, a
new approach to describe this phenomenon using the Hamiltonian formulation of photon or
ray-tracing equations [11,13] provided a more general description of the photon acceleration
mechanism. Generally, the solution of the ray-tracing equations set can only be obtained
numerically, but fully analytical results can, however, be achieved for some electron density
perturbation like a ionization front. For instance, we can easily calculate the frequency shift
which occurs when a wave packet (classical analog of a photon) crosses over an ionization
front without reflection [11]
where the initial frequency of the photon, is much higher then maximal frequency of the
plasma behind the ionization front, i.e., u>o ;> a>po- The signs + (respectively, —) pertain to
the counter-propagation (respectively, co-propagation) case where the velocity propagation
of the ionization front is vp = j3c.
/?
JAERI-Conf 98-004
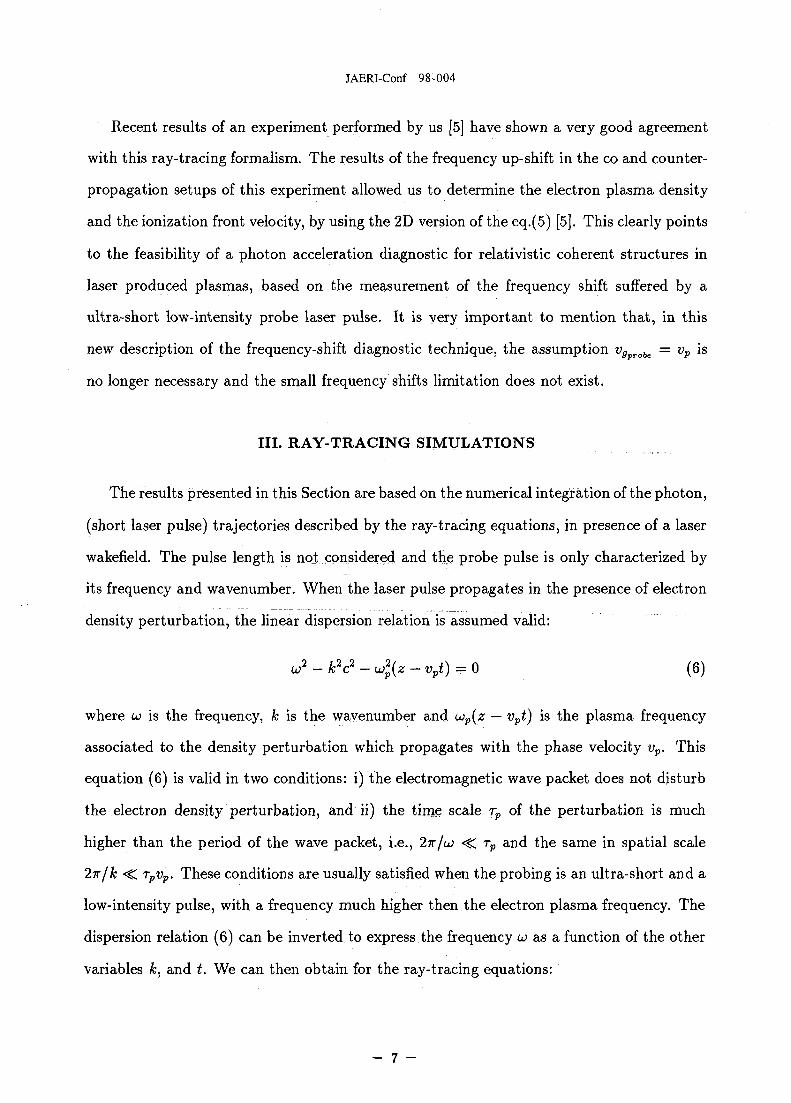
Recent results of an experiment performed by us [5] have shown a very good agreement
with this ray-tracing formalism. The results of the frequency up-shift in the co and counter-
propagation setups of this experiment allowed us to determine the electron plasma density
and the ionization front velocity, by using the 2D version of the eq.(5) [5]. This clearly points
to the feasibility of a photon acceleration diagnostic for relativistic coherent structures in
laser produced plasmas, based on the measurement of the frequency shift suffered by a
ultra-short low-intensity probe laser pulse. It is very important to mention that, in this
new description of the frequency-shift diagnostic technique, the assumption v9probe = vp is
no longer necessary and the small frequency shifts limitation does not exist.
III. RAY-TRACING SIMULATIONS
The results presented in this Section are based on the numerical integration of the photon,
(short laser pulse) trajectories described by the ray-tracing equations, in presence of a laser
wakefield. The pulse length is not considered and the probe pulse is only characterized by
its frequency and wavenumber. When the laser pulse propagates in the presence of electron
density perturbation, the linear dispersion relation is assumed valid:
OJ2 - k2c2 - u2p{z - vpt) = 0 (6)
where u> is the frequency, A; is the wavenumber and UJP(Z — vpi) is the plasma frequency
associated to the density perturbation which propagates with the phase velocity vp. This
equation (6) is valid in two conditions: i) the electromagnetic wave packet does not disturb
the electron density perturbation, and ii) the time scale rp of the perturbation is much
higher than the period of the wave packet, i.e., 2W/<JJ -C rp and the same in spatial scale
2ir/k <C TpVp. These conditions are usually satisfied when the probing is an ultra-short and a
low-intensity pulse, with a frequency much higher then the electron plasma frequency. The
dispersion relation (6) can be inverted to express the frequency w a s a function of the other
variables k, and t. We can then obtain for the ray-tracing equations:
- 7 -
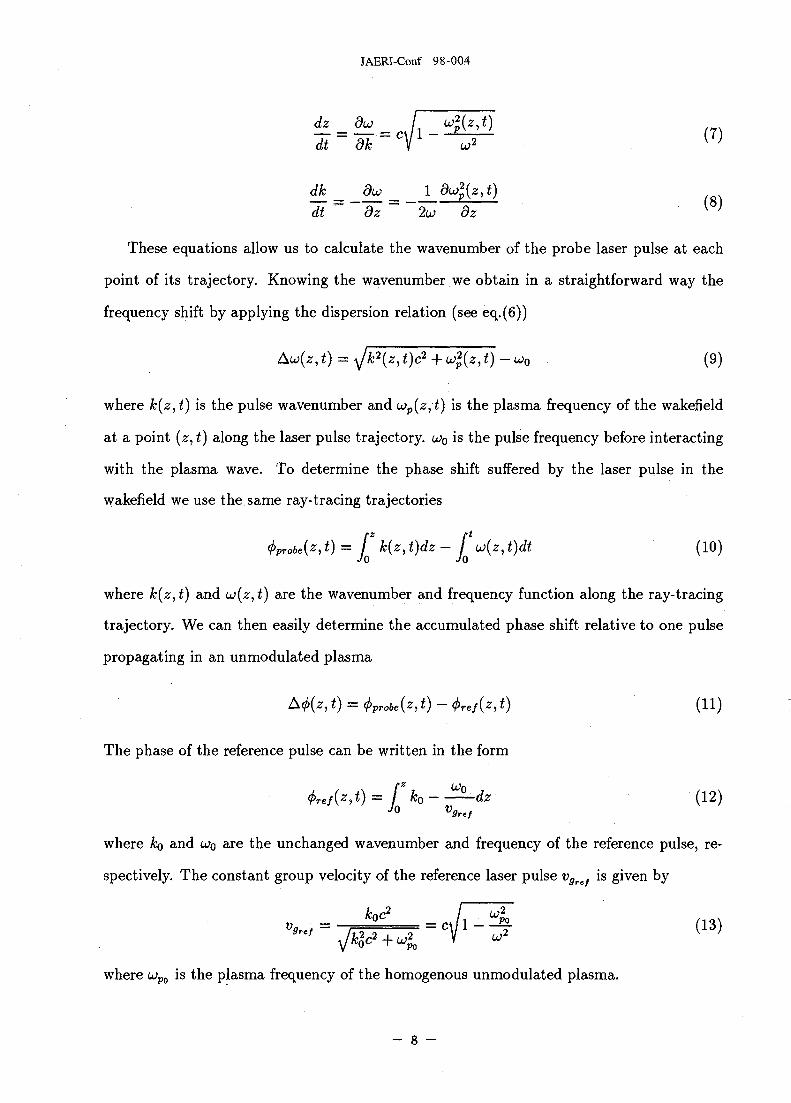
JAERI-Conf 98-004
d k d u 1
These equations allow us to calculate the wavenumber of the probe laser pulse at each
point of its trajectory. Knowing the wavenumber we obtain in a straightforward way the
frequency shift by applying the dispersion relation (see eq.(6))
u*(z,t) -wo (9)
where k(z, t) is the pulse wavenumber and cop(z,t) is the plasma frequency of the wakefield
at a point (z, t) along the laser pulse trajectory. u>0 is the pulse frequency before interacting
with the plasma wave. To determine the phase shift suffered by the laser pulse in the
wakefield we use the same ray-tracing trajectories
<f>probe{z, t) = f k(z, t)dz - f U>{z, t)dt (10)Jo Jo
where k(z,t) and u>(z, i) are the wavenumber and frequency function along the ray-tracing
trajectory. We can then easily determine the accumulated phase shift relative to one pulse
propagating in an unmodulated plasma
A<f>{Z,t) = (j>probe{z,t) - <j>ref{z,t) (11)
The phase of the reference pulse can be written in the form
^-dz (12)V9ref
where ko and u0 are the unchanged wavenumber and frequency of the reference pulse, re-
spectively. The constant group velocity of the reference laser pulse v3ref is given by
where u;po is the plasma frequency of the homogenous unmodulated plasma.
- 8 -

JAERI-Conf 98-004
The numerical simulations were based on the classical fourth-order Runge-Kutta method
with a time step of dt = 0.1 fs to integrate the ray-tracing equations (see eq.(7)-(8)). We
applied the trivial trapezoidal rule of the Newton-cotes formulas [14] to determine the phase
shift integrals,(10) and (12).
A brief description of the laser wakefield scaling laws is shown in the next sub-section.
The simulations presented in the others sub-sections are divided in two parts. First, we will
discuss the importance of not considering the group velocity of the probe pulse constant and
equal to the phase velocity of the wakefield (vgprobe(z,t) ^ vp). The trajectories with large
frequency shifts are analyzed in the second part of the numerical results, where the impact
of this effect on the two diagnostic techniques is also discussed.
A. Laser Wakefield Scaling Laws
Here we present the expressions for the laser wakefield excitation in the linear nonrela-
tivistic two-dimensional (2D) regime. Using the solution of the linearized 2D fluid equations
given by [15,16], we have in terms of the normalized vector potential ai, of the pump pulse,
the second-order density perturbation
(.4)4 f | dCrdr or 2 J
where £ is the longitudinal speed-of-light-frame coordinate ( = z — vpt. Now assuming that
the pump beam is Gaussian in the radial direction and that the longitudinal pulse shape is
also Gaussian, we have:
4(C0 = e-^)2e-^)2 (15)
Substituting in (14) we can obtain [2]
9 -
JAERI-Conf 98-004
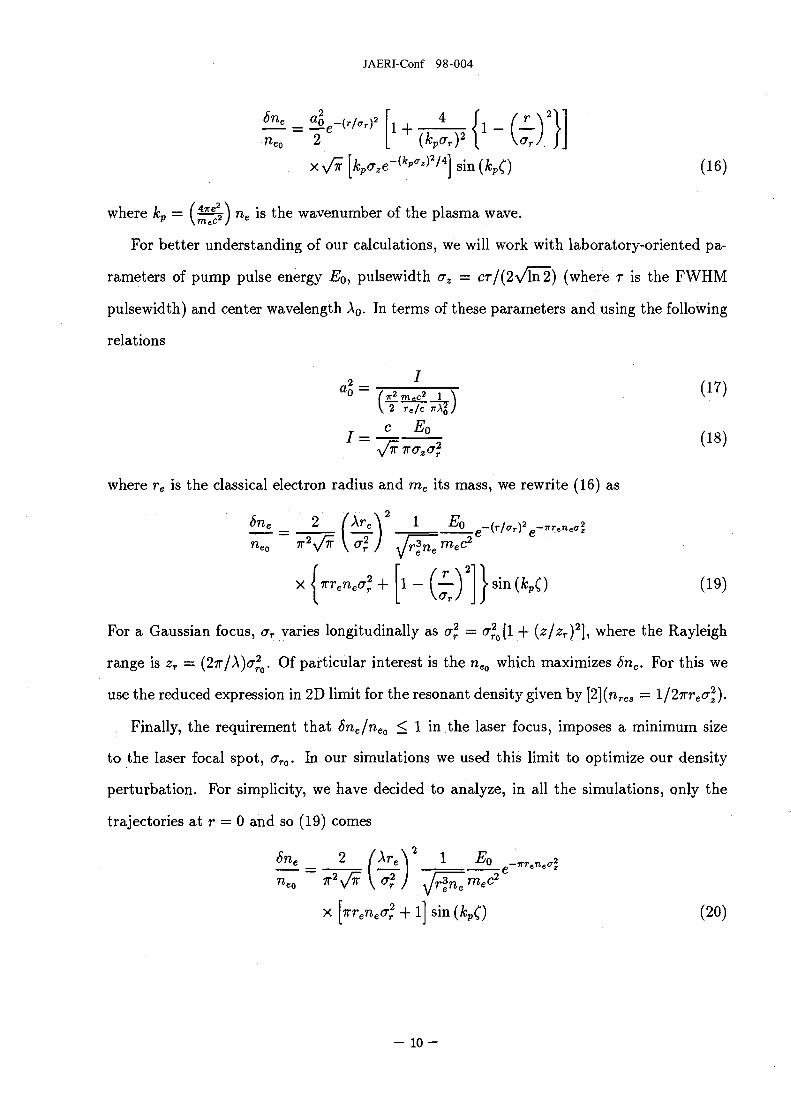
neo 2 [ (V , ) 2 i U/jJx V^F [jfcp<r,c-(*^^3^] sin (JbPC) (16)
where kv = \ -*) ne is the wavenumber of the plasma wave.
For better understanding of our calculations, we will work with laboratory-oriented pa-
rameters of pump pulse energy Eo, pulsewidth az = CT/(2\/ln 2) (where r is the FWHM
pulsewidth) and center wavelength Ao. In terms of these parameters and using the following
relations
S522 re/c
where re is the classical electron radius and me its mass, we rewrite (16) as
6n* 2 f i l l V J ^ - ( f / ' r ) a - i r r . n « ^
-&\}<x Iirrenea2
r + 1 - ( — J |s in(fcp() (19)
For a Gaussian focus, ar varies longitudinally as of = of0[l + (z/zr)2], where the Rayleigh
range is zr — (27T/A)<T^0. Of particular interest is the neo which maximizes 6ne. For this we
use the reduced expression in 2D limit for the resonant density given by [2](nrea = \j2'Krea2z).
Finally, the requirement that Sne/neo < 1 in the laser focus, imposes a minimum size
to the laser focal spot, <rro. In our simulations we used this limit to optimize our density
perturbation. For simplicity, we have decided to analyze, in all the simulations, only the
trajectories at r = 0 and so (19) comes
r c\ / \ \ 2 .,
= , ^ , &
nP "~ '
X [nrenecr? + l] sin (kpQ (20)
- 1 0 -
JAERI-Conf 98-004
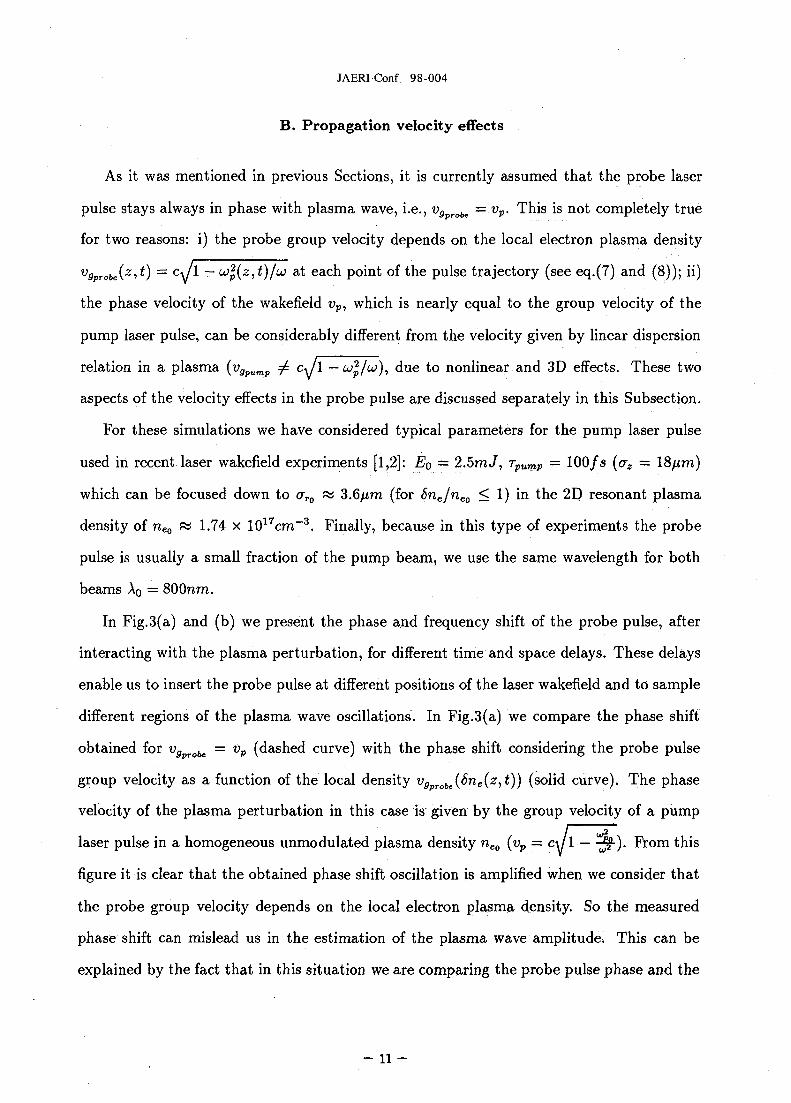
B. Propagation velocity effects
As it was mentioned in previous Sections, it is currently assumed that the probe laser
pulse stays always in phase with plasma wave, i.e., v9prob<, = vp. This is not completely true
for two reasons: i) the probe group velocity depends on the local electron plasma density
Vgprobe(z,t) = cJl — u}p(z,t)I'UJ at each point of the pulse trajectory (see eq.(7) and (8)); ii)
the phase velocity of the wakefield vp, which is nearly equal to the group velocity of the
pump laser pulse, can be considerably different from the velocity given by linear dispersion
relation in a plasma (vgpump ^ cJl — OJ^/CO), due to nonlinear and 3D effects. These two
aspects of the velocity effects in the probe pulse are discussed separately in this Subsection.
For these simulations we have considered typical parameters for the pump laser pulse
used in recent laser wakefield experiments [1,2]: Eo = 2.5mJ, rpump = 100/s (erz ~ 18/*m)
which can be focused down to <rro « 3.6/mi (for Sne/neo < 1) in the 2D resonant plasma
density of neo ?a 1.74 x 1017cm"3. Finally, because in this type of experiments the probe
pulse is usually a small fraction of the pump beam, we use the same wavelength for both
beams Ao = 800nm.
In Fig.3(a) and (b) we present the phase and frequency shift of the probe pulse, after
interacting with the plasma perturbation, for different time and space delays. These delays
enable us to insert the probe pulse at different positions of the laser wakefield and to sample
different regions of the plasma wave oscillations. In Fig.3(a) we compare the phase shift
obtained for vgprobe = vp (dashed curve) with the phase shift considering the probe pulse
group velocity as a function of the local density vgprobe(6ne(z,t)) (solid curve). The phase
velocity of the plasma perturbation in this case is given by the group velocity of a pump
laser pulse in a homogeneous unmodulated plasma density neo (vp = cyl —Jp-). From this
figure it is clear that the obtained phase shift oscillation is amplified when we consider that
the probe group velocity depends on the local electron plasma density. So the measured
phase shift can mislead us in the estimation of the plasma wave amplitude; This can be
explained by the fact that in this situation we are comparing the probe pulse phase and the
- 1 1 -
JAERI-Conf 98-004
reference pulse phase at the same spatial point but at different times, due to the difference
in their group velocities. On the other hand, the frequency shift [see Fig.3(b)] remains the
same in both cases.
Now, let us assume that the phase velocity vp of the wakefield is no longer equal by the
group velocity of the pump, but is an independent parameter. For vp = 0.9c the simulations
are shown (solid curves) in Fig.4(a) and (b) for the probe pulse phase and frequency shifts,
respectively. Comparing these results with the previous ones (dashed curves), we notice that
the wavelength of the phase shift oscillation, as well as the frequency shift oscillation, are
enlarged by nearly 12 percent, and that the amplitudes are slightly smaller. So, in this case,
the wavelength measured by the probe pulse phase or by the frequency shift will be larger
than the wavelength plasma wakefield (\measured w 1.12AP for vp — 0.9c). To overcome this
problem we need an independent measure of the phase velocity of the plasma wakefield,
which can be obtain by comparing the frequency shift in co and in counter-propagation, as
demonstrated in recent photon acceleration experiments [5].
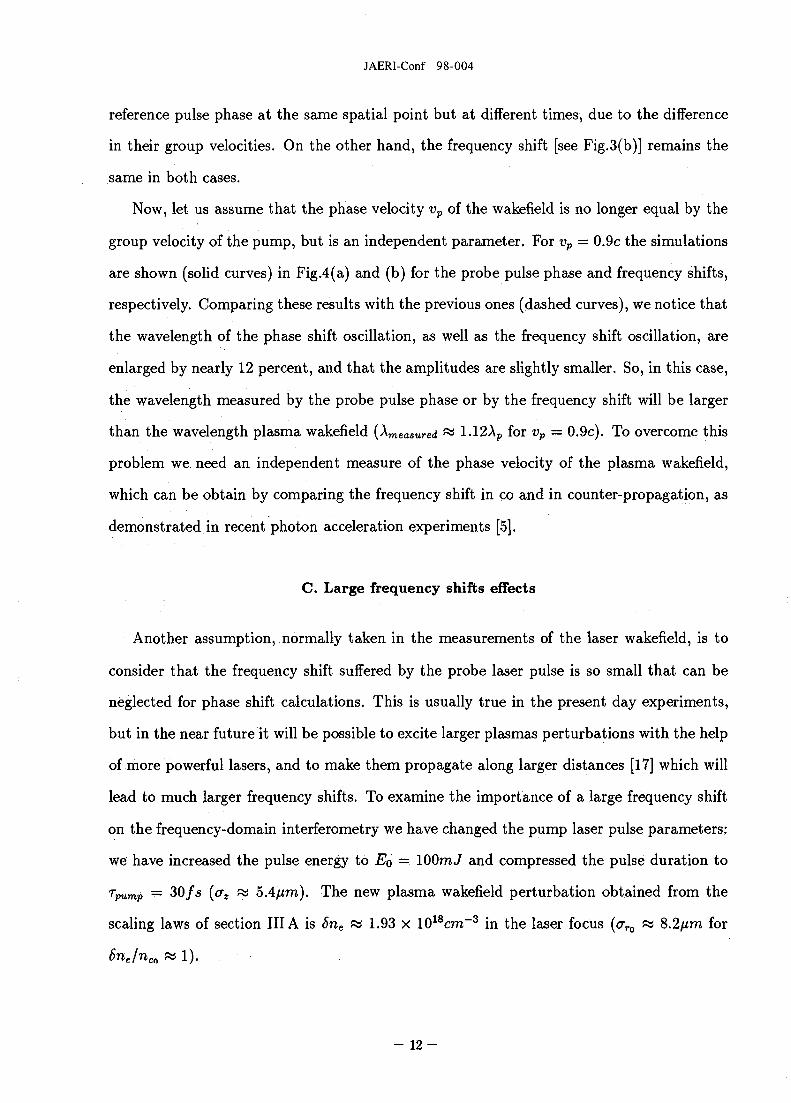
C. Large frequency shifts effects
Another assumption, normally taken in the measurements of the laser wakefield, is to
consider that the frequency shift suffered by the probe laser pulse is so small that can be
neglected for phase shift calculations. This is usually true in the present day experiments,
but in the near future it will be possible to excite larger plasmas perturbations with the help
of more powerful lasers, and to make them propagate along larger distances [17] which will
lead to much larger frequency shifts. To examine the importance of a large frequency shift
on the frequency-domain interferometry we have changed the pump laser pulse parameters:
we have increased the pulse energy to EQ = lOOraJ and compressed the pulse duration to
Tpump ~ 30/s (<xz Ri 5.4//ra). The new plasma wakefield perturbation obtained from the
scaling laws of section III A is Sne w 1.93 x 1018cm~3 in the laser focus (aro « 8.2/wm for
8ne/nen w 1).
- 1 2 -

JAERI-Conf 98-004
From Fig.5(b) we can see that the frequency shift suffered by the probe pulse is of the
same order of its initial frequency. In this simulation, the frequency shift can go up to
AA PS 200nro for a probe laser wavelength of Ao = 800rcm, in case of red-shift. Like in the
simulations of Fig.3, the frequency shift reaches its positive and negative maximum values
when the pulse is positioned in the regions of the strongest negative and positive gradients of
the electron density perturbation, respectively. But, in the present situation the maximum
up-shift (AA+ ~ 113nm) is much smaller than the maximum downshift (AA_ ~ 196nm).
This nonlinear effect comes from the fact that the frequency shift at each point of the ray-
tracing trajectory of the probe pulse is inversely proportional to its frequency (see eq.(8)).
The curves presented in the Fig.5(a) are the phase shifts of the probe pulse given by the
eq.(10)-(12) where the frequency shift contribution is taken into account (solid curve) and
the phase shifts obtained by neglecting these using (3) (dashed curve). Comparing these
two curves we can notice that not only the phase shift oscillations become much stronger,
but it also reveals a similar nonlinear behavior, e.g, A^>~ > A(j>+. This can be explained by
observing Fig.6.
This is a typical plot of the frequency-shift AA (solid) and phase-shift A<f> (dashed)
along the probe pulse trajectory through the laser wakefield. From this plot it is visible
that the phase shift of the probe pulse does not tend to a constant value, in contrast with
the frequency-shift. This is due to the fact that the final frequency of the probe pulse is
very different from the reference pulse frequency (which is constant) and the phase difference
between these two pulses continuously increases as long as they propagate inside the plasma.
So, the consequence of this is that for large frequency-shift, the measured phase shift will
be strongly dependent on the plasma length.
This can lead to phase shifts several times larger than it. For instance, in the simulations
of Fig.5, where the total propagation distance inside the plasma is Az PS 30zr, the phase shift
oscillations reach amplitudes of « l l x (peak to peak). This is an additional difficulty for the
frequency-domain interferometry diagnostic technique. In fact, to map the wakefield oscilla-
tions the time delay step At, for this diagnostic technique, must be small enough to enable
- 1 3 -

JAERI-Conf 98-004
us to count all the displaced fringes in the frequency-domain interferograms. Theoretically
the upper limit for the time delay step At is given by
where Tp = Xp/vp is the plasma wave period and A<j>pp is the expected phase shift oscillation
amplitude (peak to peak).
Before the conclusions we should discuss the limits of viability for each of the two di-
agnostic techniques. In order to illustrate these limits we build up a map representing the
pump laser parameters, energy Ep versus pulse length rp (see Fig.7). For each set of pa-
rameters, the corresponding laser wakefield scaling is obtained for the optimized situation
6ne/neo fa 1 at the 2D limit for the resonant density, as already discussed in section III A.
We will now explain the criteria used to define the limiting curves. The solid curve is given
when the frequency shift Aw^/ j measured by the photon acceleration technique equals the
spectral width of the probe pulse AOJPFWHM
Aajshift = AUJPFWHM (22)
Because it is very difficult to measure a frequency shift smaller then the spectral width, this
technique is only valid above this curve.
The frequency-domain interferometry technique is limited by the measured phase shift
A<f>, which should stay lower then 2TT. We have plotted two curves above which this diag-
nostic technique is not valid: one (dotted curve) considering the phase shift as given by the
refraction index A ^ (see eq.(3)) and the other (dashed curve) retaining the contribution of
the frequency variation A<f>k,w (see eq. (10)-(12)). In this map we also represent two lines
which define the goal of lOOGeV/m for accelerating gradients, already obtained in recent
experiments [18]. The lines correspond to the 2D and ID limits of the resonant density. A
close analysis of this map clearly shows that the more favorable diagnostic technique for the
future laser wakefield accelerators is photon acceleration .
- 14 -

JAERI-Conf 98-004
IV. CONCLUTIONS
In this work we have presented a detailed comparison between two different diagnostic
techniques for plasma wakefields. Using the ray-tracing equations we were able to analyze
the dispersion (group velocity) and frequency-shift effects, that are neglected in the cur-
rent literature on frequency-domain interferometry, but can be of great importance in the
interpretation of future experiments. By simulating the time-delay scanning of the plasma
oscillations we where able to identified these effects in both diagnostic techniques.
Our numerical simulations show that, for frequency-domain interferometry, the wakefield
oscillation reconstructed from the measured phase shifts is significantly modified in both
amplitude and frequency, if we include the dispersion effects in the probe beam and assume
that the plasma wave phase velocity is different from the group velocity of the driver laser
beam. On the contrary, for the photon acceleration technique, the results are not affected
by these dispersion effects and the phase velocity of the laser wakefield can be determined
by complementing the co-propagation with the counter-propagation measurements.
We have also considered that for future laser wakefield experiments (with more powerful
laser beams which will excite larger plasma waves over longer distances) the frequency shift of
the probe beam cannot be considered negligible. In fact, we were able to identify for the first
time the non-linear effect of the frequency shift given by the photon acceleration mechanism
for both diagnostic techniques. Moreover, we have also studied the influence of a large
frequency shift on the phase measurements made with the frequency-domain interferometry.
In this case the frequency of the probe pulse is completely different from that of reference
one. So the phase difference will depend, not only the plasma length, as we have noticed,
but also on the dispersive optics which are in their path before reaching the detector device.
This fact added to the complexity of measuring phase shifts much higher then TT and the
difficulty of using the frequency-domain interferometry of two laser beam with very different
frequencies, will be the major drawback of this laser wakefield diagnostic technique. On the
other hand, the large frequency shifts play in favor of the photon acceleration diagnostic
- 1 5 -

JAERI-Conf 98-004
technique due to the fact that the external contributions for the of data, such as, stray
light, pump leakage and detector defects are no longer a technical problem. For all the
reasons discussed above we believe that photon acceleration will become the most powerful
diagnostic technique, in future laser wakefield accelerator experiments.
- 1 6 -

JAERI-Conf 98-004
REFERENCES
[1] J.R. Marques et al, "Temporal and Spatial Measurements of the Electron Density Per-
turbation Produced in the Wake of an Ultrashort Laser Pulse," Phys. Rev. Lett., vol.
76, pp. 3566-3569, 1996.
[2] C.W. Siders et al, "Laser Wakefield Excitation and Measurement by Femtosecond Lon-
gitudinal Interferometry," Phys. Rev. Lett., vol. 76, pp. 3570-3573, 1996; C.W. Siders
et al, "Plasma-Based Accelerator Diagnostics Based upon Longitudinal Interferometry
with Ultrashort Optical Pulses," IEEE Trans, Plasma Sci., vol. 24, no. 2, pp. 301-315,
April 1996.
[3] E. Tokunaga, A. Terasaki, and T. Kobayashi, "Frequency-domain interferometer for
femtosecond time-resolved phase spectroscopy," Opt. Lett., vol. 17, pp. 1131-1133, Aug.
1992; "Femtosecond phase spectroscopy by use of frequency-domain interference," J.
Opt. Soc. Amer. B, vol. 12, no. 5, pp. 753-771, 1995.
[4] J.P. Geindre et al, "Frequency-domain interferometer for measuring the phase and am-
plitude of a femtosecond pulse probing a laser-produced plasma," Opt. Lett., vol. 19,
pp. 1997-1999, Dec. 1994.
[5] J.M. Dias et al, "Experimental Evidence of Photon Acceleration of Ultrashort Laser
Pulses in Relativistic Ionization Fronts," Phys. Rev. Lett., vol. 78, no. 25, pp. 4773-
4776, June 1997.
[6] CD. Decker and W.B. Mori, "Group velocity of large amplitude electromagnetic waves
in a plasma," Phys. Rev. Lett., vol. 72, pp. 490-493, 1994; Phys. Rev. E, vol. 51, pp.
1364-1375, 1995.
[7] E. Esarey, P. Sprangle, M. Pilloff, and J. Krall, "Theory and group velocity of ultrashort,
tightly focused laser pulses," J. Opt. Soc. Amer. B, vol. 12, pp. 1695-1703, 1995.
[8] S.C. Wilks et al, "Photon accelerator," Phys. Rev. Lett., vol. 62, no. 22, pp. 2600-2603,
- 1 7 -

JAERI-Conf 98-004
1989;
[9] M. Lampe, E. Ott and J.H. Walker, "Interaction of electromagnetic waves with a moving
ionization front," Phys. Fluids, vol. 10, pp. 42-54, 1978.
[10] J.T. Mendonca , "Nonlinear interaction of wavepackets," J. Plasma Phys., vol. 22, pp.
15, April 1979.
[11] J.T. Mendonca and L. Oliveira e Silva, "Regular and stochastic acceleration of photons,"
Phys. Rev. E, vol. 49, no. 4, pp. 3520-3523, April 1994.
[12] E.Esarey, A.Ting, and P.Sprangle, "Frequency shifts induced in laser pulses by plasma
waves," Phys. Rev. A, vol. 42, pp. 3526-3531, 1990.
[13] L. Oliveira e Silva and J.T. Mendonga, "Photon Acceleration in Superluminous and
Accelerated Ionization Fronts," IEEE Trans. Plasma Sci., vol. 24, no. 2, pp. 316-322,
April 1996.
[14] W.H. Press, S.A. Teukolsky, W.T. Vetterling, and B.P. Flannery, "Numerical Recipes
in C. The art of scientific computing", Cambridge Univ. Press, 2nd Edition, 1992.
[15] L.M. Gorbunov and V.I. Kirsanov, "Excitation of plasma waves by an electromagnetic
wave packet," Sov. Phys. JETP, vol. 66, no. 2, pp. 290-294, Aug. 1987.;
[16] E. Esarey, A. Ting, P. Sprangle, and G. Joyce, "The laser Wakefield," Comments Plasma
Phys. Controlled Fusion, vol. 12, no. 4, pp. 192-204, 1989.;
[17] P.Sprangle, E.Esarey, J. Krall, A. Ting, and G. Joyce, "Propagation and guiding of
intense laser pulses in plasmas," Phys. Rev. Lett., vol. 69, pp. 2200-2203, 1993.
[18] A. Modena et al, "Electron acceleration from the breaking of relativistic plasma waves,"
Nature, vol. 337, pp. 606-608, 1995.
1 8 -

JAERI-Conf 98-004
FIGURES
FIG. 1. Schematic visualization of the pump pulse, trailing wakefield, and two probe pulses.
FIG. 2. Schematic of laser pulse frequency upshifting by a plasma wave where vgprobe ~ vp ~ c.
FIG. 3. Wakefield oscillation map given by the numerical results for phase shift (a) and fre-
quency shift (b) for different space delays, assuming that vgprobi = vp (dashed curves) or that probe
the pulse group velocity depends on the local plasma density vgprobe(6ne(z,t)) (solid curves). In
(b) the dashed curve and the solid overlap.
FIG. 4. Wakefield oscillation map giving the phase shift (a) and the frequency shift (b) for
the propagation velocity of the plasma wave of vp = 0.9c (solid curves) different from the group
velocity of a laser pulse (dashed curves).
FIG. 5. Wakefield oscillation map giving the phase shift (a) and the frequency shift (b) for the
new pump laser pulse parameters: EQ = 100m7, Tpump = 30/s. The calculated phase shifts at (a)
are obtained by neglecting the frequency shift of the probe pulse (dashed curve) and by retaining
it (solid curve).
FIG. 6. Typical plot of the frequency-shift AA (solid) and phase-shift A<f> (dashed) at each
point of the probe pulse trajectory through the laser wakefield centered at z/zr = 0.
FIG. 7. Map of the pump laser pulse parameters (pulse energy versus length). Solid curve
defines the limit where the frequency shift is equal the spectral width of the probe pulse (defines
the zone where the photon acceleration technique is applicable, Aojahift > Au>PFWHM). Dashed and
dotted curves limit the zone of applicability of the frequency-domain interferometry. The vertical
lines indicate the lOOGeV/m goal for the future plasma accelerators as predicted by the 2D and
ID scaling laws.
- 1 9 -

JAERI-Conf 98-004
n
o
pump
Fig. 1
5«.(0
n
Fig. 2
- 2 0 -

JAERI-Conf 98-004
0,0 0,5 1,0 1,5 2,0
Delay (xj
Fig. 3
- 21 -

JAERI-Conf 98-004
n 1*••> •
l i 0,0
-0,1
0,4
| 0,0
-0,4
•
•
/ / * "
/ /
; /; /
/ /t /
/ /
» \
\ '
I\
II
I
>
^ \\ \
\ \
\ \I \\ \\ \
\ \
\
1.12 kp
\\\\
\ i1 \ /• \ I< \ /> \ /» \ /» \ '
xj
#f
i J
1 I' /
; /i j
i
' /
f
/ /
/ / '/ // // /
1 / \1
I////
1
\
/ \ \r \ \
t \^ \
\ \
\ \«
i\\
\ .
\
\
\
\\
i \» \\ \ /
i \ .*\ \ i
\ V* X
T t —\ , '
1
/
//
f
>'
1f
V ' /\ 1 /\ ! /V /
(a) •
(b) -
•
0,0 0,5 1,0 1,5
Delay ( y
Fig. 4
2,0
- 2 2 -

JAERI-Conf 98-004
10
< -10
-20
100
c
-iuu
-200
-
•
•
•
s.
\
\
\
V
\
j
/J/
11//
V\
\\Vy
/
/
//
(a) .
•
•
•
(b)
•
•
-
0,0 0,5 1,0
Delay
Fig. 5
1,5 2,0
- 2 3 -

JAERI-Conf 98-004
15
Fig. 6
1800
Fig. 7
- 2 4 -

JAERI-Conf 98-004
2 . Staged Electron Laser Accelerator (STELLA) Experiment at Brookhaven ATF
I.V. Pogorelsky*8, A. vanSteenbergen8, J.C. Gallardoa, V. Yakimenkoa, M. Babzien8, K.P. Kuschea>b,J. Skaritka4, W.D. Kimurab, D.C. Quimbyb, K.E. Robinsonb, S.C. Gottschalkb, L.J. Pastwickb,
L.C. Steinhauerb, D.B. Clinec, Y. Liuc, P. Hec, F. Caminod, I. Ben-Zvid, R.B. Fiorito6, D. W. Rulee, R.H.Pantellf, and J. Sandweiss*
a - Brookhaven National Laboratory, b - 577 Optronics Inc., c - UCLA, d - SUNYat Stony Brook,e - Naval Surface Warfare Center, f - Stanford University, g - Yale University
Abstract. The STELLA experiment is being prepared at the BNL Accelerator Test Facility (ATF).The goal of the experiment is to demonstrate quasi-monochromatic inverse Cherenkov acceleration(ICA) of electrons bunched to the laser wavelength period. Microbunches on the order of 2 \aa inlength separated by 10.6 \xm will be produced using an inverse free electron laser (IFEL) acceleratordriven by a CO2 laser. The design and simulations for two phases of this experiment includingdemonstration of 10 MeV and 100 MeV acceleration are presented.
1. INTRODUCTION
The STELLA experiment is a program to demonstrate inverse Cherenkov acceleration ofmicrobunches produced during the IFEL acceleration process. Generation of microbunches much shorterthan the oscillating driver field period is a prerequisite for producing highly monochromatic, low emittanceelectron beams in accelerators. This problem has not been addressed yet for laser linac schemes, such asICA [1] or IFEL [2], driven at optical or IR frequencies, which are at least 10,000 times faster thanconventional RF linac fields. Note also that generation of femtosecond electron bunches, which will beaccomplished during the STELLA program, has potential applications beyond laser acceleration. Forexample, via Compton scattering such bunches may enable generation of extremely short duration x-raypulses over a wide spectral range which can be used in many different applications.
The STELLA experiment is a natural merge of the two ICA and IFEL laser acceleration experimentalprograms which have been conducted at the ATF for several years. Both ICA and IFEL are driven by theATF high-power CO2 laser and use the high-brightness 50-MeV, 10-ps electron beam produced by the RFlinac. The ICA program has essentially completed its major objectives demonstrating energy modulationusing the Fontana-Pantell radially-polarized, axicon-focused laser beam geometry [3]. In this experimentthe electrons interacted over all phases of the light wave resulting in both accelerated and deceleratedparticles. To achieve high acceleration of a significant proportion of electrons requires prebunching themto the laser wavelength period and then resonance interaction with the laser EM wave in the ICA celLMeeting this demand, the ATF IFEL experiment has recently demonstrated microbunch generation, whichhas been detected using a coherent transition radiation diagnostic [4].
In this paper we discuss the design and simulations for two phases of the STELLA experimentincluding demonstration of 10 MeV and 100 MeV acceleration.
2. STELLA DESIGN
The principal diagram in Fig. 1 illustrates the layout of the STELLA experiment which is located atthe end of the ATF electron beamline #1. Quadrupoles not shown on the drawing focus the e.-beam througha 3 mm diameter hole in a metal mirror used to direct the laser beam into the IFEL waveguide. Triplet #1refocuses the e-beam inside the IFEL. ThelCAcell is separated from the exit of the IFEL by a 190-cm
• Contact author: BNL, 725C, Upton, NY 11973; fax: (516) 344-5801; [email protected]
- 2 5 -
JAERI-Conf 98-004
CO2Laser Beam 1
axicontelescope
SPECTROMETER J Q ^ |FEL
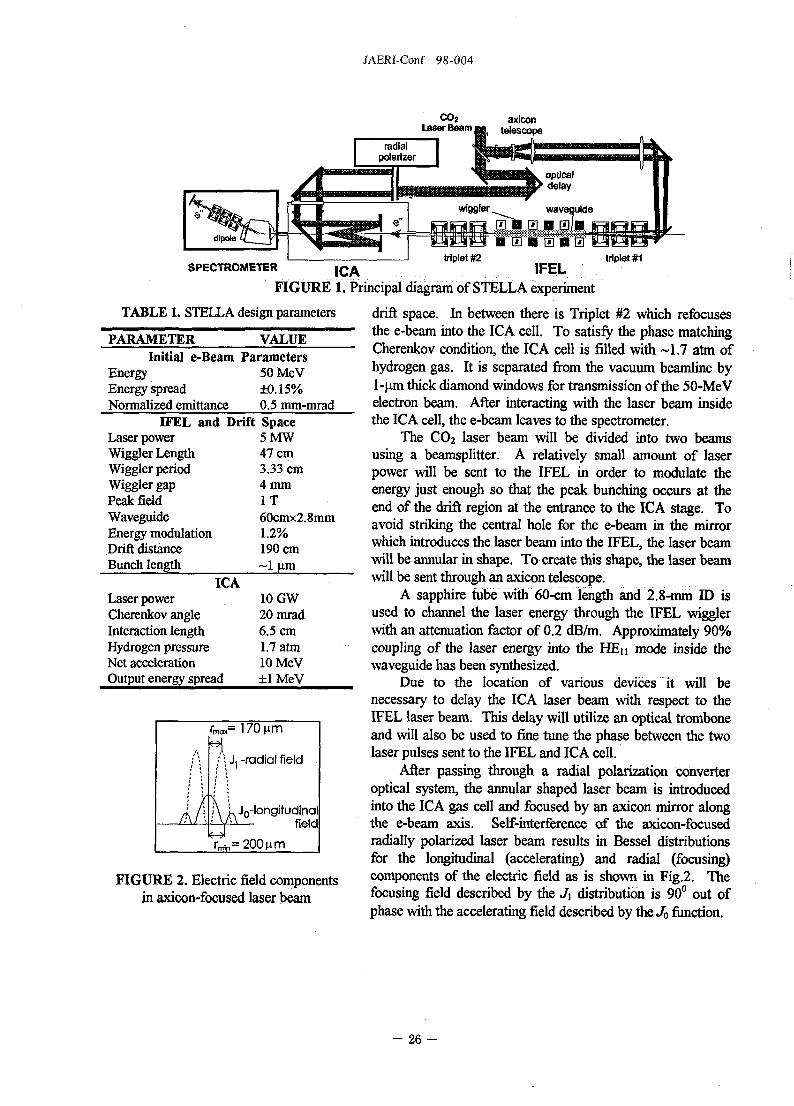
FIGURE 1. Principal diagram of STELLA experiment
triplet #1
TABLE 1. STELLA design parameters
PARAMETERInitial e-Beam
EnergyEnergy spreadNormalized emittance
VALUEParameters
50MeV±0.15%0.5 mm-mrad
IFEL and DriftLaser powerWiggler LengthWiggler periodWiggler gapPeak fieldWaveguideEnergy modulationDrift distanceBunch length
ICALaser powerCherenkov angleInteraction lengthHydrogen pressureNet accelerationOutput energy spread
Space5MW47 cm3.33 cm4mmI T60cmx2.8mm1.2%190 cm~1 fim
10 GW20mrad6.5 cm1.7 atmlOMeV±lMeV
rma«= 170 urn
N; : J, -radial field
i \ u J0-longitudinalField
U,= 200 urn
FIGURE 2. Electric field componentsin axicon-focused laser beam
drift space. In between there is Triplet #2 which refocusesthe e-beam into the ICA cell. To satisfy the phase matchingCherenkov condition, the ICA cell is filled with -1.7 atm ofhydrogen gas. It is separated from the vacuum beamline by1-fim thick diamond windows for transmission of the 50-MeVelectron beam. After interacting with the laser beam insidethe ICA cell, the e-beam leaves to the spectrometer.
The CO2 laser beam will be divided into two beamsusing a beamsplitter. A relatively small amount of laserpower will be sent to the IFEL in order to modulate theenergy just enough so that the peak bunching occurs at theend of the drift region at the entrance to the ICA stage. Toavoid striking the central hole for the e-beam in the mirrorwhich introduces the laser beam into the IFEL, the laser beamwill be annular in shape. To create this shape, the laser beamwill be sent through an axicon telescope.
A sapphire tube with 60-cm length and 2.8-mm ID isused to channel the laser energy through the IFEL wigglerwith an attenuation factor of 0.2 dB/m. Approximately 90%coupling of the laser energy into the HEn mode inside thewaveguide has been synthesized.
Due to the location of various devices it will benecessary to delay the ICA laser beam with respect to theIFEL laser beam. This delay will utilize an optical tromboneand will also be used to fine tune the phase between the twolaser pulses sent to the IFEL and ICA cell.
After passing through a radial polarization converteroptical system, the annular shaped laser beam is introducedinto the ICA gas cell and focused by an axicon mirror alongthe e-beam axis. Self-interference of the axicon-focusedradially polarized laser beam results in Bessel distributionsfor the longitudinal (accelerating) and radial (focusing)components of the electric field as is shown in Fig.2. Thefocusing field described by the J\ distribution is 90° out ofphase with the accelerating field described by the Jo function.
- 2 6 -

JAERI-Conf 98-004
To ensure efficient and monochromatic acceleration, the e-beam must be focused to a smaller radiusthan the width of the central lobe of the Jo Bessel pattern. For a 20-mrad Cherenkov angle, this lobe has aFWHM of-200 um. The first zero at the Jb Bessel distribution also occurs at a radius of 200 |im.
Design parameters for the first phase of the STELLA experiment when the 10-GW CO2 laser beamwill be used are summarized in Table 1. This table also includes results of simulations which are discussedin Section 3. During the second phase of the experiment, which will start after the ATF CO2 laser isupgraded to ~1 TW peak power [5], 100-MeV monochromatic acceleration will be attempted.
3. MODEL PREDICTIONS
An integrated model of the STELLA experiment has been developed which combines existing IFELand ICA codes, and utilizes a ray-tracing method along with the TRANSPORT code for simulating theelectron trajectory through the focusing triplet. For a given wiggler configuration (i.e., spacing andmagnetic field strength), e-beam energy, and laser wavelength, the optimum bunching distance for the IFELis controlled by the amount of energy modulation imparted by the laser beam. Our analysis shows that awiggler length of 0.47 m and uniform period of 3.3 cm enables suitable bunching performance over aninput energy range of 40-65 MeV. The laser driver requirements are quite modest. For an ~2-m bunchingdistance, the laser power scales approximately as 5 MW(£750 MeV), where E is the energy of the e-beamin MeV. The initial energy spread must be much less than the induced energy spread, which needs to beapproximately Ay/y=1.2%(E/50MeV).
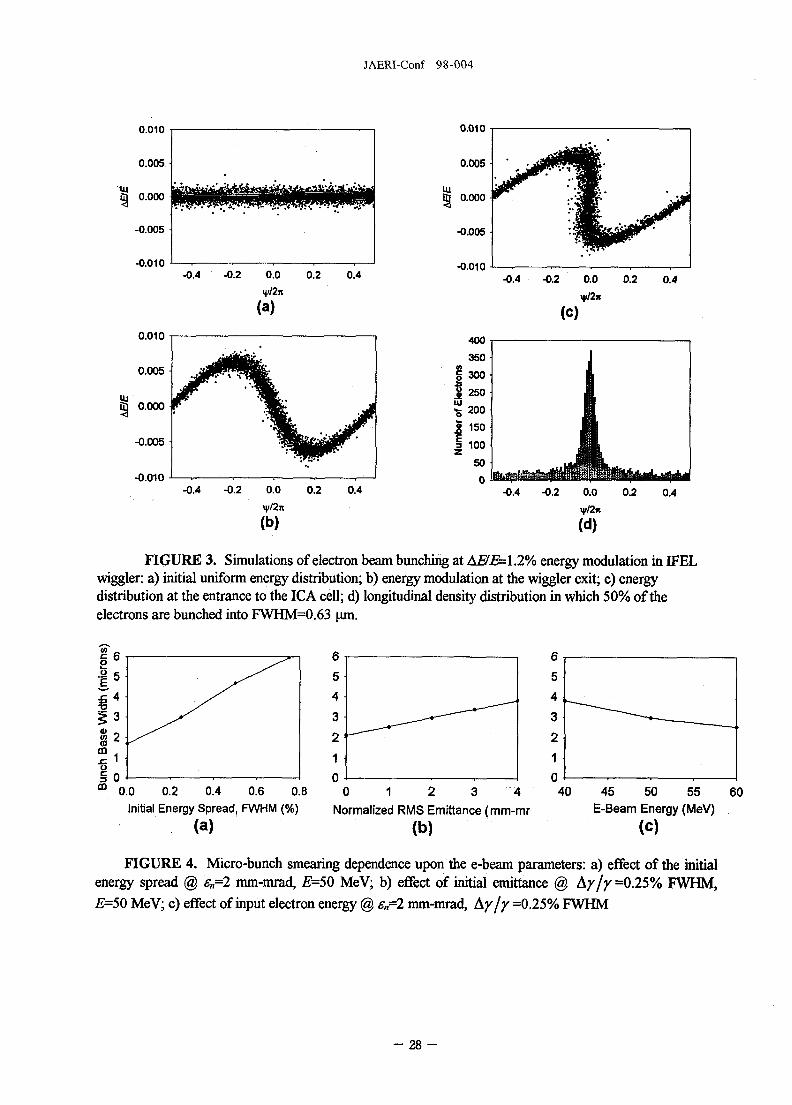
Figure 3 shows the e-beam energy-phase diagrams calculated for an incoming emittance £«=0.5 mm-mrad and intrinsic energy spread of Ay/y =0.15%. The e-beam enters the IFEL uniformly distributedover phase and longitudinal space [Fig.3(a)]. At the exit of the IFEL the e-beam has a sinusoidal energymodulation of 1.2% (±0.3 MeV) [Fig.3(b)] and very little bunching has occurred yet. At the end of thedrift region just before the entrance to the ICA cell, the more energetic electrons catch up with the slowones resulting in the formation of a. microbunch [Fig.3(c),(d)]. The FWHM of the bunch is 0.63 um.Some bunch smearing caused by the emittance, initial energy spread, and path length difference through thefocusing triplet between the IFEL and the ICA cell can be seen. Indeed, electrons leaving the IFEL wigglerwill take different paths as they are focused by the quadrupole magnets into the ICA cell. This results inbunch smearing that is illustrated by Fig. 4 assuming more conservative numbers for the normalizedemittance en and the intrinsic energy spread Ay/y than those entered in Table 1. We see that to avoid
significant bunch smearing we should choose e»<2 mm-mrad and Ay/y <0.25% FWHM. Fortunately, an
e-beam with such parameters is routinely produced by the ATF linac.The results of Monte-Carlo computer simulations for short electron bunch acceleration in the ICA cell
induced by the 10-GW laser pulse are illustrated in Fig.5. Figure 5(a),(b) show the e-beam expansion dueto e-beam focusing into the gas cell, emittance, and gas and window scattering. From Fig. 5(c) we see howthe amount of energy gain depends upon the radial position of the electrons within the e-beam profile.Electrons farther out from the center do not experience the peak laser field and, therefore, do not gain orlose the maximum possible amount of energy. However, most of the electrons are still grouped in a fairlytight bunch and gain up to 10 MeV energy. Over the 6.5-cm interaction distance this corresponds to >150MeV/m acceleration gradient for only 10-GW laser power. The FWHM width of the accelerated electronenergy peak shown in Fig. 5(d) is 2.2 MeV and contains ~50% of all the electrons.
The ATF CO2 laser is presently being upgraded to ~1 TW peak power. Before presenting simulationsfor the STELLA performance for the high-power situation, the following comments need to be made.
- 2 7 -
JAERI-Conf 98-004
0.010
0.005
& 0.000
0.010
0.4 0.4
FIGURE 3. Simulations of electron beam bunching at AE/B=l.2% energy modulation in IFELwiggler: a) initial uniform energy distribution; b) energy modulation at the wiggler exit; c) energydistribution at the entrance to the ICA cell; d) longitudinal density distribution in which 50% of theelectrons are bunched into FWHM=0.63 um.
0.0 0.2 0.4 0.6 0.8Initial Energy Spread, FWHM (%)
(a)
0 1 2 3 4
Normalized RMS Emittance (mm-mr
(b)
45 50 55
E-Beam Energy (MeV)
(C)
60
FIGURE 4. Micro-bunch smearing dependence upon the e-beam parameters: a) effect of the initialenergy spread @ en=2 mm-mrad, £=50 MeV; b) effect of initial emittance @ Ay/y =0.25% FWHM,£=50 MeV; c) effect of input electron energy @ ett=2 mm-mrad, Ay/y =0.25% FWHM
- 28 -

JAERI-Conf 98-004
-0.06-0.06-0.04-0.020.00 0.02 0.04 0.06
x Position (cm)
(a)
0.04
-0.06-0.06-O.04-0.020.00 0.02 0.04 0.06
x Position (cm)
(b)
-20 -15 -10 -5 0 5 10 15 20Energy Shift (MeV)
FIGURE 5. Simulations for electron bunch [see Fig.2(d)] acceleration in ICA cell at PL=l0 GW:a) e-beam spot size at axicon; b) e-beam spot size exiting ICA interaction cell; c) radial energy distribution;d) electron energy spectrum
For relatively low^y e-beams such as the ATF, significant phase slippage occurs within the interactionregion at high laser powers. A possible way to compensate for this effect is to introduce a curvedwavefront to the axicon-focused laser beam which causes the laser beam to intersect the e-beam along theinteraction region at different angles.
Second, at high laser power the issue of gas breakdown becomes more important. For Gaussianshaped laser pulses the upper limit to the maximum acceleration gradient is calculated to be ~650 MeV/m.
Third, to handle the high peak power the laser beam size on the axicon must be increased. For a 1-TW laser beam (i.e., 3 J in 3 ps) and a 5-J/cm2 damage fluence, this gives a minimum laser beam diameteron the axicon of 9 mm. For a 20-mrad Cherenkov angle and 1-mm diameter annulus hole, this yields aninteraction length of 19.4 cm. For these conditions ..the maximum acceleration gradient is again -650MeV/m. Hence, this 1-TW design is consistent with regard to avoiding optical damage and gasbreakdown.
An energy gain of ~125 MeV for a 50-MeV e-beam is predicted (see Fig.6). The energy spread of theaccelerated bunch is just 6 MeV FWHM. The length of the microbunch is <1 pm. For this simulation weselected the laser and electron bunch phasing not to be at the maximum energy gain, but at the point wherepartial laser focusing begins to occur. This focusing effect can be clearly seen in the beam profile plot after
- 2 9 -

JAERI-Conf 98-004
the interaction [Fig.5(b)]. Figure 5(c) also shows that most of the accelerated electrons are confined withinthe central portion of the beam. Thus, this 1-TW example shows the promise of >100-MeV net energygains with well-controlled e-beam monochromaticity and emittance. The overall performance shouldimprove by using a curved axicon. This capability will be added to the STELLA simulation program.
0.06
•0.06-0.C6-0.04-0.02 0.00 0.02 0.04 0.06
x Position (cm)
(a)
-0.06 -0.04 -0.02 0.00 0.02 0.04 0.06x(cm)
(C)
-0.06
1000
jS 800
I 600UJ
| 400
Z 200
0-0.06-0.04-0.020.00 0.02 0.04 0.06
x Position (cm)
(b)
0 50 100 150
Energy Shift (MeV)
(d)
200
FIGURE 6. Simulations for electron bunch [see Fig.2(d)] acceleration over 19.4-cm ICAinteraction length at PL=l TW: a) e-beam spot size at axicon; b) e-beam spot size exiting ICA interactioncell (shows focusing); c) radial energy distribution (shows focusing); d) electron spectrum
REFERENCES
1. W.D. Kimura, et al. Phys. Rev. Lett., 74, 546 (1995).2. A. van Steenbergen, et al., Phys. Rev. Lett, 77, 2690 (1996).3. J.R. Fontana & R.H. Pantell,./,4/?/?/. P/2>«., 54, 4285 (1983)4. Y. Liu, et al., "Experimental Observation of IFEL Micro-Bunching Using Coherent Transition Radiation",
Particle Accelerator Conference, Vancouver, Canada, May 12-16,1997, to be published.5. I.V. Pogorelsky, et al., "The First Terawatt Picosecond CO2 Laser for Advanced Accelerator Study at the
Brookhaven ATF", Proceedings of '7th Advanced Accelerator Concepts Workshop, Lake Tahoe, CA,October 12-18,1996, to be published.
- 3 0 -

JAERI-Conf 98-004
3 .Simulation of Intense Laser - Dense Matter Interactions- X ray production and Laser absorption -
Yutaka UESHIMA, Yasuaki KISHIMOTO, Akira SASAKI, Yasuhiko SENTOKU*
and Toshiki TAJIMA**
Kansai Research Establishment, Japan Atomic Energy Research Institute,
2-6 Mii-mimami, Neyagawa, Osaka 562, Japan
institute of Laser Engineering, University of Osaka, 2-6 Yamadaoka,
Suita 565, Japan
** also Fusion Studies, University of Texas at Austin, Austin, Texas 78712 U.S.A.
ABSTRACTThe development of short-pulse ultra high intensity lasers will enable us to generate short-pulse intense
soft and hard X-rays. Acceleration of an electron in laser field generates intense illuminated located radiation, Larmor
radiation, around KeV at 1018 W/cm2 with 100TW and l\itn wavelength laser. The Coulomb interaction between
rest ions and relativistic electron generates broad energy radiation, bremsstrahlung emission, over MeV at 10ls
W/cm2 with the same condition. These intense radiations come in short pulses of the same order as that of the
irradiated laser. The generated intense X-rays, Larmor and biemsstrahlung radiation, can be applied to sources of
short pulse X-ray, excitation source of inner-shell X-ray laser, positron production and nuclear excitation, etc.
Keywords: short-pulse ultra high intensity laser, Larmor radiation, bremsstrahlung emission,
short-pulse intense X-ray, inner-shell X-ray laser
1. INTRODUCTION
The development of short-pulse ultra high intensity lasers has opened new regime in the
study of laser - plasma interaction. Recently, there has been a great deal of research devoted to
generation higher harmonics and X-ray by ultra high intensity lasers. For example, D. von derLinde
et al. [1] reported that the 15th higher harmonics was generated by CO2 laser at 1017 W/cm2 with
dielectric and metallic soli<i surface; J. J. Macklin et al. [2] observed that Ne gas excited by
Ti: sapphire laser at 1015W/cm2 generated harmonics up to the 109th order; P. Gbbon [3]
investigated that the 60th harmonics reflected from solid-density plasma surface at L\2>1019W/cm2
with power efficiencies > 10"6; T. D. Donnelly et al. [4] observed that short-pulse high intensity laser
(825nm, 1015 W/cm2) interaction with Ar clusters were produced a higher harmonics and intensity as
compared with monomer gases; S. Kato et al. [5] estimated with the use of a dynamical form factor
- 3 1 -

JAERI-Conf 98-004
for a dense plasma that higher harmonics was generated by an oscillating current due to intense laser
field.; S. Huller et al. [6] indicated that higher harmonics dependent on lattice period was generated
with crystal targets; J. D. Kmetec et al. [7] reported that hard-X-ray was generated forward with
metal in the experiments; B. N. Chichkov et al. [8] evaluated relativistic momentum distribution
function for electron underthe intense laser and bremsstrahlung emission from calculated momentum
distribution function.
This proceeding reported the generation of intense-X-ray radiation by short-pulse ultra
high intensity interaction with dense matters. Mainly, the following 2 type radiation processes are
paid attention. The first is Larmor radiation from acceleration of an electron by intense laser field.
The radiation has a character that its energy spectra is located around KeVat 1020 W/cm2 with lujn
laser wave length. The second is bremsstrahlung emission from the Coulomb interaction between rest
ions and relativistic electron by intense laser field. The emission has broad energy spectra over MeV
at 1020 W/cm2 with l^m laserwave length. These intense radiations are short pulse length of the same
order as that of the irradiated laser. The generated intense X-rays, Larmor and bremsstrahlung
radiation, will be applied for source of short pulse X-ray, excitation source of inner-shell X-ray laser,
positron production and nucleus excitation, etc.
In JAERTs laser system, it was achieved that the pulse time was less than 20 femtosecond
and the peak power was more stronger than 10TW with 88Onm laser wave length. Until this year, the
peak power will reach 100TW. When the focused spot size of laser is 10 \xm, the laser intensity
achieves 1021 W/cm2. The interaction of this laser with electrons has interesting matters asfollows.
Under the action of a short pulse laser, there is not enough time to thermalize the electrons. This
means that the electrons are very cool and laser - plasma interaction is very pure, in other words, all
kind of phenomena are independent of temperature of electron. The pure interaction may also
produce collective motion of electrons and then many kinds of phenomena with the electrons are
coherent. At ultra high intensities, motion of an electron becomes relativistic. The electron quivers
and drifts in the polarization and the propagation of the laser directions with the same order as
photon speed. Since a orbit of the electron forms closed 8-figure in the drift frame, the motion of the
electron is called for the 8-figure motion. This longitudinal acceleration in the propagation of the
laser direction makes intensity of Larmor radiation higher than that for non-relativistic quivering
motion. Enhancement of intensity and blue shift of wave length for Larmor and bremsstrahlung
radiations are caused by Doppler effect from the relativistic drift velocity.
2. 8-F1GURE MOTION & CHARACTERISTIC PARAMETERS
As described before the section, laser - plasma interaction is very pure in the ultra intense
laser. From the fact, the number of characteristic parameters is reduced. The non-dimensional laser
strength parameter is as follows:
- 3 2 -
JAERI-Conf 98-004
mxco,(1)
where e, me, c, Eo and C0L represent elemental charge, rest mass of an electron, speed of light,
maximum strength of electric field and frequency of laser, respectively. This non-dimensional
parameter aQ can be regarded as the gained momentum of electron normalized by mec during a period
of laser. Accordingly, for ao>l, motion of the electron becomes relativistic. In terms of the laser
intensity / , the quantity a0 is given by
aQ = 0&i-^-\——l f , (2)U 1 1 r\l% I T H 2 ' v '
where Xh represents wave length of laser. From Eq.(2), Highly relativistic electron motion requires
laser intensities greater than 1018 W/cm2 for wavelength of AL~1 Jim. As described before the
section, such intensities are now available enough from JAERI' s laser system and #0~100 may be
reached.
Next, we consider the motion of an electron, initially at rest, in a relativistic plane
monochromatic linearly polarized electromagnetic (EM) wave propagating along the x axis[10].
Selecting the direction of the electric field E = E0cos£ ez as the z axis, where £ = (DLt — 2izxlXL,
and e, represents a unit vector in the / direction , the position r , momentum p and relativistic mass
factor 7 of the electron are then described as follows:
r fln2 fe
4 { An
^ { ^ , aQ sin^ ezmec 4
-aQ sin^ ez , y = 1 + [±\ (4)
The quivering motion is called for 8-figure motion. The characteristic values are derived from these
formula as follows:
X, In' mec
= l + ^ _ and T = l + -T 0
2 4 a°"°
where z0, pz0, vxd and T represent the position and max. momentum in the z direction, drift speed
- 3 3 -
JAERI-Conf 98-004
in the x direction and a period of acceleration in the laboratory frame. The quivering length and max.
momentum in the z direction is proportional to a0'. The drift speed in the x direction is almost the
same as light speed for a o » l , so that the angle between laser propagation and quivering direction is
tan0 = 2/a0. For example, the drift speed and y become vxd = 0.9975 c and y = 201 for ao=2O.
Accordingly, a period of acceleration becomes long in the laboratory frame, as is well-known in
conventional accelerators.
3. LARMOR RADIATION & BREMSSTRAHLUNG EMISSION
It is well-known that an accelerated electron emits electromagnetic wave. In the non-
relativistic regime, the power of radiation P can be calculated from famous Larmor's formula. In the
case of the relativistic motion, Larmor's formula is extended in cgs units as follows:
(6)
where B and B represent velocity and acceleration of the electron. Note that radiation power is a
Lorentz invariant quantity, although its angular spectra distribution is not invariant. The angular
spectra distribution of radiation power is calculated from Fourier transform of Lienard-Wiechert
potential.
= --y6 B-[BxB3 ' L V
d2P e2
dcodQ. An: c
rrnx|"(ii-P)xPlr j _ _J iO)(t—n-r)
JO (\ - R . n \ 6 C(7)
where n and B represent a unit direction vector for observation and time-averaged velocity
normalized by light speed. The denominator in Eq. (7) is continuing duration of illumination to the
n direction.
The radiation power averaged over an acceleration period of the electron can be calculated
from Eq. (6). The radiation generated by EM waves is called for Larmor radiation or Thomson
scattering. In the case of electron motion induced by circular polarized EM wave, that is synchrotron
motion , the radiation power is proportional to a04.
P [Wl en?} = 1.81 X10
- 3 4 -
JAERI-Conf 98-004
where ne represents number density of electron. However, the motion is induced only by adiabatic
pulse raise, namely long pulse, and the motion may be broken by other dynamical processes, for
example ponderamotive force. Next, consider the case of 8-figure motion for an electron induced by
plane EM wave. The radiation power averaged over an acceleration period of the electron calculated
from Eq. (6) with using Eq. (3, 4) in Sec. 2 is proportional to a02, namely intensity.
The reason why this radiation power is smaller than that of the circularity polarized EM wave that the
electron drifts in the direction of laser propagation and a period to pass through laser pulse becomes
long. Due to this drift motion, the radiation power becomes aQ2 times large nearby the laser
propagation direction. The angular spectra distribution of radiation power is calculated from Eq. (7).
To change the power in the unit volume P[W7cm3] into that in the unit surface area P 'rW/cm2] ,
Eq. (7) should be multiplied by the propagation length of the laser, cT. It is found that the angular
distribution concentrates around the quivering direction, tanG = 2/a0, in the angle range of ao~4 and
the irradiated intensity and emitted photon energy are respectively proportional to aos and a0
3 in
the case of single particle motion. At ao=2O, AL=0.88|jm and ne = 102Icm/3, ~ IKeVphotons is
irradiated about 1018 WI cm2 at peak power. This high energy-intensity irradiation source is opened
wide and new regime in the study and application. For example, the generated intense X-ray will be
applied to source of short pulse X-ray, pumping source of inner-shell X-ray laser, etc.
When an electron is accelerated by the Coulomb force from an ion, the another radiation
is generated. This radiation is called for bremsstrahlung emission. In the non-relativistic regime, the
power of radiation is estimated by calculating acceleration of an electron from ions with using Eq. (6).
Adopting ballistic orbit approximation, the power is then found to be proportional to a0. In the case
of the relativistic motion, the radiation power should be estimated with concerning quantum-photon
effect, Compton scattering. In Born's approximation, the power is proportional to ao4 .Inthe limit
of large a0, the radiation power per unit volume is approximated,
P \w/cm3] ~ 2 x1 J
where Z and ni represent charge number and number density of ion, respectively. In the same as
Larmor radiation, the radiation power becomes a02 times large nearby the laser propagation direction.
The emitted photon energy spreads widely over MeV, which is proportional to logarithm of a
reciprocal of photon energy. The angular distribution concentrates around the quivering direction in
the angle range of ao~4 .As a result, the irradiated intensity and maximum emitted photon energy are
respectively proportional to a010 and a0
2 in the case of single particle motion. At ao=2O,
- 3 5 -
JAERI-Conf 98-004
AL=0.88|!m and Z = 10, ne = 1021cm"3, ~ lOOMeV photons are generated about 1018 W/cm2 at
peak power. This high energy-intensity irradiation source is opened wide and new regime in the study
and application. For example, the generated intense hard X-ray will be applied to source of short pulse
hard X-ray, positron production and nucleus excitation, etc.
4. CONCLUSION and REMARKS
Larmor radiation around KeV at 1018 W/cm2 is generates by interaction between dense
plasma, ne = 1021cm"3, and intense laser around 1021 W/cm2 with l|im laser wave length. The
generated intense X-ray will be applied for source of short pulse X-ray, pumping source of inner-shell
X-ray laser. Bremsstrahlung emission over MeVat 1018 W/cm2 is also generated in the same condition.
The intense hard X-ray can be applied to sources of short pulse X-ray, positron production and
nucleus excitation, etc. It was also observed that short-pulse high intensity laser interaction with
clusters absorbed laser energy and produced intense higher harmonics as compared with plasma and
metal. These intense radiations may be opened new regime in the study.
5. ACKNOWLEDGMENTS
The authors would like to thank H. Ohno and T. Arisawa for their interest and
encouragement throughout this work.
REFERENCES
(1) D. von derLinde et al., Phys. Rev. A. 52, 52 (1995).
(2) J. J. Macklin et al., Phys. Rev. Lett. 70, 766 (1993).
(3) P. Gibbon, Phys. Rev. Lett. 76, 50 (1996):
(4) T. D. Donnelly et al., Phys. Rev. Lett. 76, 2472 (1996).
(5) S. Kato et al., J. Phys .Soc. Jpn . 66, 388 (1997).
(6) S.Hullerand J. Meyer-ter-Vehn, Phys. Rev. A.48, 3906 (1993).
(7) J. D. Kmetec et al., Phys. Rev. Lett. 68, 1527 (1992).
(8) B. N. Chichkov et al., Phys. Rev. A. 46, 4512 (1992).
- 3 6 -
JAERI-Conf 98-004
4. Pondermotive absorption of a short intense laser pulse in a non-uniformplasma
A.A. Andreev, K.Yu. Platonov, K.A.Tanaka*
Institute for Laser Physics, SC "Vavilov State Optical Institute"12, Birzhevaya line, St Petersburg 199034, Russia
*Fac. of Engineering & ILE, Osaka University,2-6 Yamada-oka, Suita, Osaka 565, Japan
ABSTRACT
An analytical description of the pondermotive absorption mechanism at a short highintense laser pulse interaction with a strong inhomogeneous plasma is presented. The optimalconditions for the maximum of resonance absorption of laser pulse interaction with non-uniform plasma at normal incidence are founded.
Keywords: Short laser pulse, Inhomogeneous plasma, Resonant absorption
INTRODUCTION
Significant amount of papers, both theoretical and experimental [1] are devoted in the lastyears to investigations of a process a short powerful laser pulse interaction with a denseplasma. The intensity of radiation, achieved in experiments at the moment reaches1019W/cm2. A movement of plasma in fields of such intensity gets essentially non-linearrelativistic character.
The analytical consideration of laser pulse absorption in such situation rather difficult,therefore is used numerical simulations (PIC, Vlasov-codes) [2,5]. Whereas the analyticalresults have greater presentation, open physical mechanisms of occurring processes andserve the tests for the computer programs. In the present work the analytical decisions of non-linear relativistic hydrodynamic equations for plasma are considered.
There is shown, that at weak non-linearity the resonant absorption arises even at normalincidence of an electromagnetic wave on spatially non-uniform plasma. Absorption coefficienthas the big rise in comparison with a linear case. This result coexist qualitatively with the factof a weak dependence of absorption from an angle of incidence at high laser intensity [3].
SYSTEM OF THE BASIC EQUATIONS
For the description of a plasma movement in strong laser fields we shall use onedimensional system of the hydrodynamic equations, including speed of an ordered movementsuperior thermal speed. The given approximation corresponds to a limit of normal skin-effect(SIB [4]).
The law of conservation of a perpendicular component of an initial pulse allows to reducethis system to two equations for longitudinal and perpendicular fields:
- 3 7 -

JAERI-Conf 98-004
d2A(1)
In (1) are entered following undimensional variables: A - vector potential of a perpendicularfield in terms of mc2/e, E - strength of a longitudinal field in terms of mccOp/e, %=0OpZ/c -undimensional co-ordinate, T=O)t - undimensional time, cop - plasma frequency in depth ofplasma, Tj(^) - plasma density (normalised per unit of in depth of plasma), (0 - frequency ofan incident electromagnetic wave. We shall consider weak non-linearity (A2 < A), displayingthe solution (1) in a number on degrees A. This approximation limits intensity of an incidentradiation to intensity 1018 W/cm2. Result of decomposition (1) looks like:
(2)
For linear polarisation of a incident wave a pondermotive force depends on time. Then thesolution of zero approximation of system (2) has the following form:
A(0)cos ((0% I coCOp
CO' (0)sisin / cop cos(r) ;
(3)
Where A' (0) - derivative A ( ) at £,=0. In (3) it means, that r\ (£) is nonzero in area^ > 0.The function A (£) depends on a specific structure of concentration. The further calculationswill be made for any A (£), and the example of absorption coefficient for exponential ofgrowing concentration is resulted in the following paragraph.
The averaged Pointing vector of a laser wave, appropriate to a field (3) is determined byA{0) and A' (0):
(4)
The solution of the equation of the first approximation for a longitudinal field E at a givenright part in view of a resonance looks as follows:
(5)
- 3 8 -

JAERI-Conf 98-004
In a point T) (£*) =4co2 /0)p2 the field E(1) linearly accrues in due course, that corresponds
to a resonance between pondermotive force and plasma wave. Energy of a longitudinal fieldper unit of the area of plasma
9 0
me <Df
Sne2
Calculated with the help of presentation of 5-function
(6)
lim sin or
Also linearly grows in due course:
W =m2c*COT
2 VdA2
-1-1
(7)
By dividing absorbed power on Pointing vector of laser wave we shall receive requiredabsorption coefficient £
- i
(8)
So, the received expression determines absorption coefficient at normal incidence of anelectromagnetic wave on non-uniform plasma through the decision of the equation of zeroapproximation for vector potential. A condition of applicability (8) is: electron thermal speedless then its hydrodynamic speed, or amplitude of vector potential it imposes a conditionl»A2»VTG>p/ca>. Remember, that the case of normal skin effect is realised when
V1/C«(0/C0p.
Absorption coefficient in plasmawith exponential growing density
The function A(£) manages to be constructed analytically for a limited set of structures
). One of variants is T|(£) = exp(oc^), where a=c/Loop - undimensional scale of plasma
in-homogeneity. The solution (2), aspiring to zero at large % looks like
= -2\ (2&sh(2nQ / a) I xeef2 K2iafa (2 exp(a£/ 2)/ a) (9)
In (9) for Q is the relation GO/Cflp, K(^) - function McDonald, A - amplitude of a laser wave
is designated at t, —> — o°. Doing further account according to the above-stated technique, we
shall receive the following result for absorption coefficient:
- 3 9 -

JAERI-Conf 98-004
C = — AZx3sh2(27ix)Klix(4x)K?ix(4x) \x = C0Llc (10)n
The stroke in (10) designates derivative of function McDonald. We shall carry out researchof absorption coefficient. We shall note, that as well as in case of incident at some angle the
resonant absorption does not depend on density of plasma 0)p . At small in-homogeneityscales L ( x « 1)
C = 167iA^x3ln2(l/2x) (11)
We shall remind, that at inclined incident for small x, £=27ixsin29/cos0. At large x,asymptotic (10) looks as follows:
C = 4flAfcexp(- (16- 4n)x)
The maximum £" = 0 . 3 8 ^ absorption coefficient reaches at Xmax^O.26, it means that at
in-homogeneity scales about length of a wave, as well as in case of inclined incident. Wecompare resonant absorption to other channels of absorption. In uncollisional plasma this isLandau damping on separate electrons (SIB [4]):
^ f p (12)
At large L, t, IB exponentially decreases with increase L. Thus, at sufficient intensity of a
laser wave AQ > v T COp/cO) in spatially non-uniform plasma (L> c/cop) the resonant absorptionis dominant, and absorption coefficient reaches tens of percents. We shall note, that at someangle of incidence the account of the members proportional A in the equations also results inadditional absorption, connected to generation of the second harmonic in reflected radiationand presence of the second resonant point. But at inclined incidence these effects give onlyamendment to standard linear transformation.
THE CONCLUSION
Considered effect allows qualitatively to interpret results of numerical simulations,according to which at A < 1 dependence of factor of absorption on an angle of incidencebecomes weak, as inclusion of the pondermotive mechanism of absorption.
REFERENCES
1. Luther-Davies B., et al. Laser Phys. 1991 v.1 p. 325.Mourou G., Umstadter D. Phys. of Fluids B4, (1992), p.2315.
2. Wilks S.C. Phys.Fluids B 5 (7), (1993), p. 2603.3. Ruhl H., Mulser P. Phys.Let.A 205 (1995), p. 388.4. Briang Yang T.-Y., et. al, Phys. Plasmas v.2, (1995) p.3146.5. Kruer W. Phys. of Fluids (1987), p.1278.
- 4 0 -

JAERI-Conf 98-004
5. Integrated Code Development for Studying Laser Driven Plasmas
Hideaki TAKABE, Hideo NAGATOMO, Atsusi SUNAHARA,Naofumi OHNISHI, Syuji NARUO, and Kunioki MMA
Institute of Laser Engineering, Osaka UniversitySuita, Osaka 565 Japan
E-mail: [email protected]
ABSTRACT
Present status and plan for developing an integrated implosion code arebriefly explained by focusing on motivation, numerical scheme and issues to bedeveloped more. Highly nonlinear stage of Rayleigh-Taylor instability ofablation front by laser irradiation has been simulated so as to be compared withmodel experiments. Improvement in transport and rezoning/remappingalgorithms in ILESTA code is described.Keywords: laser fusion, implosion, integrated code, 2-D ALE code,
rezoning, Rayleigh-Taylor instability
1. INTRODUCTION
Recently much attention is focused on the topics of physics in complex phenomena.The study of complex systems requires a large scale computing and is roughly classified intotwo categories: (1) Elementary process of a system with huge number of freedom. (2)Phenomena stemming from strong coupling of a variety of different physics.
In case of category (1), the basic equations are simple, but tbecause of nonlinearity inthe equations a complex phenomena are seen. As a subject belonging to this category, we canenumerates, for examlpe, fluid turbulence, galaxy formation, multi-electron atomic structure,and so on. In case of the fluid turbulence, it is essential to treat a system in which small andlarge scale vortices co-exist. With increase of the Reynolds number, the ratio of the scalebetween the largest and smallest vortices increases; consequently, a large scale computing isnecessary to directly simulate the turbulence. In the category (1), the key words arenonlinearity, non-locality, many-body, non-equilibrium, etc.
On the other hand, the category (2) includes fusion, astrophysics, aerodynamics,meteorology, and so on. In this case, we have to treat the phenomena stemming from thecoupling of many of different physics. It can be said that this is the physics of combinedsystem. It has become possible to study the combined physics with a dramatic progress ofcomputational ability after the start with ENIAC of 51 years ago[l]. It has becpme to berecognized that the computer simulation is an essential method in researching physics. This isthe third method additive to the traditional methods, theory and experiment. The computerscience is getting to be essential in modern science.
In laser fusion, a micro-pellet called target is explosively squeezed to 1/30 - 1/50 of itsinitial radius and high density and high temperature fuel plasma is produced in the centralregion. The physics controlling such phenomena is complex, where the compressible
- 4 1 -

JAERI-Conf 98-004
hydrodynamics coupled with electron heat conduction, x-ray radiation transport plays a keyrole. In laser implosion, it is difficult to analyze the experimemental data without a help ofcomputer simulations, because a micro-target is imploded to a radius of several tens micron inan extremely short time of a few 100 ps. Therefore, simulation codes have been developedfrom the beginning of the research in order to reproduce the whole physical scenario ofimplosion[2]. We call such code for laser fusion an "integrated implosion code". The entitledresearch purpose is to analyze experimental data and do research planning by developing theintegrated code systematically. In this paper, we briefly show the outlook of our integratedimplosion code and the present status of its development.
2. INTEGRATED IMPLOSION CODE
In studying the physics of a complex system, four elements are necessary to promotethe research. Two are experimental ones, namely, "synthetic experiment" and "modelexperiment". The implosion experiment is a synthetic one and a variety of model experimentsare necessary to clarify the physics controlling the implosion phenomena. The other two aretheoretical ones, "theoretical models" and "integrated code". The theoretical models checkedwith corresponding model experiments should be installed in the integrated code to analyzeexperimental data and design fusion targets. The integrated code is the essence of the computerscience and its development has become possible with the dramatic progress of high-speedcomputers.
Let me try to describe the definition of the integrated implosion code. It should satisfythe following conditions.
(l)The code should be a multi-dimensional hydrodynamic code to be able to simulate thewhole scenario of the physics in laser driven fusion from laser absorption to implosionand fusion burn.
(2)A11 the physics thought to be important should be included in the code.(3)The appropriateness of the physics models and the accuracy of the numerical scheme
should be checked by comparing with experiments.(4)The code should be highly reliable so as to be used for the purpose of "numerical high
gain experiment (NHGX)".The readers may have an impression that the item (2) is reckless. What is important is
to judge which should be modeled and which should be abandoned. To do so, a good sense ofphysics may be required. The spirit of the item (4) stands on the same base as the numericalwind tunnel (NWT)[3] and numerical Tokamak[4]. It is well known that the NWT has beenreplaced of the experiment with a wind tunnel for designing aerodynamics of aircraft. In theearly stage of an aircraft design, NWT is very efficient from an economical point of view,because we can reduce the number of candidates for prototype in a real wind tunnel experiment.Recently, it has become possible to control the turbulence with a sophisticated design of wingsurface[3]. The numerical Tokamak is a big challenge because we are required to bridge hugescale (difference) in temporal and spatial dimensions from tiny eddies to the whole machine, forexample[4]. The long time scale transport should be solved consistently with a short time scaleinstability phenomena.
The third example is numerical astrophysics. The astrophysics is very resemble tophysics of laser fusion and laboratory astrophysics is proposed to study a variety ofhydrodynamic, radiation, atomic, and relativistic plasmas by use of intense lasers[5]. The
4 2 -
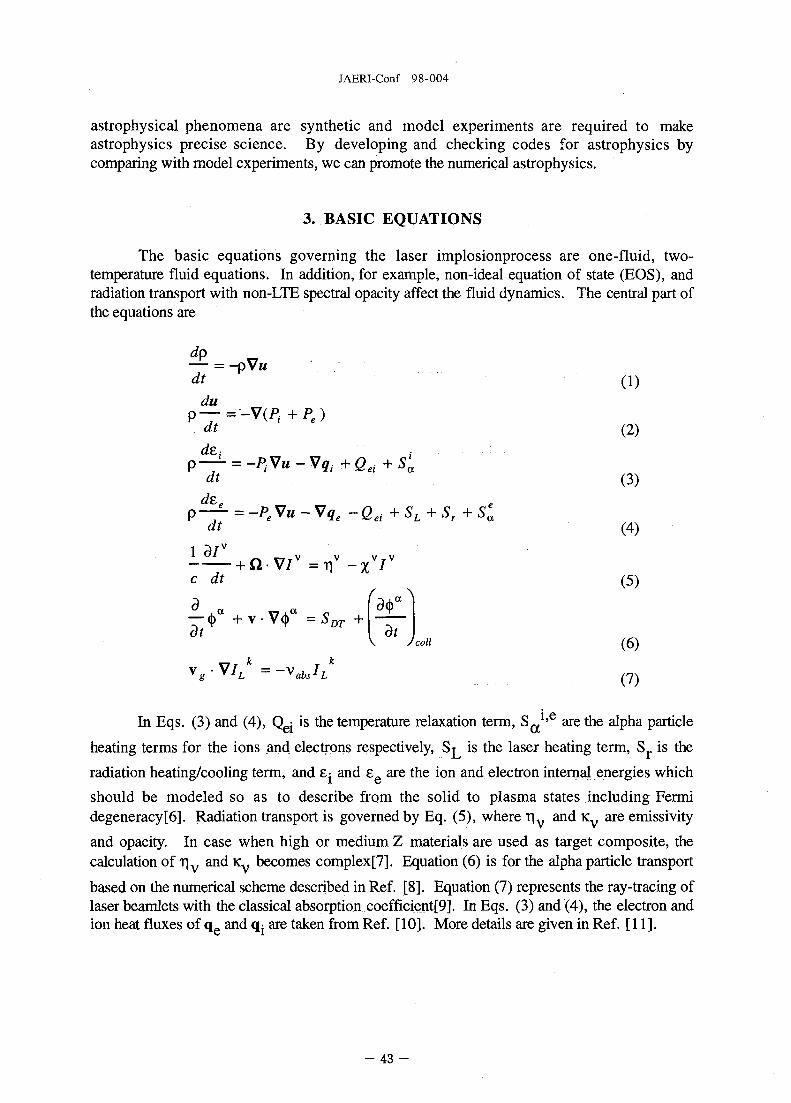
JAERI-Conf 98-004
astrophysical phenomena are synthetic and model experiments are required to makeastrophysics precise science. By developing and checking codes for astrophysics bycomparing with model experiments, we can promote the numerical astrophysics.
3. BASIC EQUATIONS
The basic equations governing the laser implosionprocess are one-fluid, two-temperature fluid equations. In addition, for example, non-ideal equation of state (EOS), andradiation transport with non-LTE spectral opacity affect the fluid dynamics. The central part ofthe equations are
dp-T = -pVudt (1)
+Pe)(2)
q Q adt (3)
^ - = -PeWu-Wqe -Qei +SL + Sr+Sea
dt (4)
QV7 =i) -c dt (5)
9 a a 19(j)— <|) + v • V<j) = 5Dy +dt dt
V /co« (6)
In Eqs. (3) and (4), Qgj is the temperature relaxation term, S a1 > e are the alpha particle
heating terms for the ions and electrons respectively, Sj^ is the laser heating term, Sf is the
radiation heating/cooling term, and £: and £„ are the ion and electron internal energies which
should be modeled so as to describe from the solid to plasma states including Fermidegeneracy[6]. Radiation transport is governed by Eq. (5), where T|v and Kv are emissivity
and opacity. In case when high or medium Z materials are used as target composite, thecalculation of T|v and iCy becomes complex[7]. Equation (6) is for the alpha particle transport
based on the numerical scheme described in Ref. [8]. Equation (7) represents the ray-tracing oflaser beamlets with the classical absorption coefficient^]. In Eqs. (3) and (4), the electron andion heat fluxes of q e and q are taken from Ref. [10]. More details are given in Ref. [11].
- 4 3 -

JAERI-Conf 98-004
4. NUMERICAL METHODS
Equations (1) - (4) are solved with finite difference method in the Lagrangian frame.The details of the method are described in Ref. [11] for one-dimensional case. Since theintegrated code should be at least two dimensional, more sophisticate numerics are requiredespecially relating to transport algorithm and rezoning/remapping algorithms.
The Lagrangian scheme in which the numerical mesh moves with fluid elements is moreconvenient compared to the Eulerian scheme because of the following reasons. In laserplasmas, the density and temperature varies over many order of magnitude, for example, acrossthe ablation front. A thin shell is imploded with high in-flight aspect ratio of more than 100. Ahigh radius convergence (CR = 30 - 40) implosion shold be simulated. In addition, a target
consisting of different material layers with different EOS, atomic state, opacity etc should besimulated. In some case, rate equation for determining ionization state distribution should besolved for each fluid element by coupling with fluid dynamics.
In employing the Lagrangian scheme, following numerical difficulties should be solved.Since the numerical mesh structure is distorted, for example, by shear flow due tohydrodynamic instabilities, a rezoning of mesh is necessary to continue the calculations. In thiscase, the rezoning should be designed so as to keep the merit of Lagrangian scheme. Inaddition, a remapping scheme sould be deveplped so that the physical quantities such asdensity, momentums, energy densities are re-defined precisely from those in the old mesh to inthe new mesh zones. Numerical diffusion and overshooting well-known in numerical methodin solving a convective term should be reduced. Since the Lagrangian mesh becomes non-orthogonal structure, the transport algorithm becomes complicate even for the case of diffusion-type transport.
4.1 Transport AlgorithmIn order to explain the numerical algorithm for transport, we briefly explain the guide
line in solving the following diffusion equation.
Pc - rdt (8)
After volume integration of Eq. (8) over a mesh zone, it is solved with the fully implicitmethod. It is required to estimate the gradient of T in the Lagrangian mesh. In twodimensional (2-D) planer geometry, 3T/dx and 8T/3y can be given with the Lagrangiancoordinate (X,Y) in the form;
dT 1 dT dy dT dy— = - ( - - - )dx J dXdY dY dX (9)
dT ]_ 3 £ ^ ^ l i i9y ~~ J dXdY ~ dY dX ( 1 0 )
dx dy dy dx
~ dXdY~ dXdY (11)
The total heat flux coming across the four boundaries as seen in Fig. 1 can be calculated by
- 44 -

JAERI-Conf 98-004
expressing Eqs. (9) - (11) in the finite difference forms. Then, not only the quantities definedat the center of the zone, but also those at four grid points are also necessary. At the presenttime, we define them as the average of the surrounding four quantities. As the result, the totalheat flux is given with nine quantities which are still unknown.
In order to reverse the matrix for such nine point transport scheme, ICCG scheme isusually used[12]. However, this method is not applicable to the present scheme and we useILUBCG (Incomplete LU Biconjugate Gradient) scheme[13]. This is time consumingcompared to ICCG, but can be extended to more general cases. We have checked the accuracyof the scheme in strongly distorted mesh cases and reasonable accuracy has been seen [13].
4.2 Rezoning/RemappingThe orthogonality of the mesh structure can be maintained by solving a Poisson-type
equation for new x and y grid coordinate H, and r\:
(12)dx2 dy2 dx2 dy2
where P and Q are called forcing terms. By controlling the definition of P and Q , we canassume many zones, for example, in the region with steep density gradient. In order to keepthe displacement of the new grid point from the old one, a relaxation parameter is set to be smallin solving Eq. (12) with the relaxation method.
We have two different rezoning/remapping schemes. One is done a few tens times overseveral thousand time steps, when the mesh distortion becomes very severe. This scheme hasbeen used to study nonuniform ignition and burn simulations[14]. The other developedrecently[15] is every-time-step rezoning/remapping scheme. The rezoning schemes are same,while the remapping schemes are completely different. In the latter case which we use in thepresent paper, the displacement of the grid from old to new at each time step is assumed to bemuch smaller than the grid distances. This corresponds to the Courant condition in solving theconvection term in Eulerian scheme. In the remapping case, the physical quantities areconvected from one to another adjustent zone because of move of the boundary by rezoning.Then, the convected quantities can be evaluated by various numerical methods developed in thepast two decades.
In 2-D, we calculate the convected quantities one by one in x and y directions. Theconvected flux is calculated with FCT (Flux Collected Transport) scheme. As for the fluxlimiter in FCT, two types of limiter proposed by Boris et al and Zalesak are used[16]. Theformer is rather dissipative than the latter, although the former is numerically more stable. Wehave checked an appropriateness and accuracy of the present scheme by artificially moving themeshes from a strongly distorted case to a smoothed code[15].
5. SIMULATION OF EXPERIMENT
As mentioned previously, two different kind of experiments are necessary and havebeen done with Gekko XII laser. One is a model experiment. The Rayleigh-Taylor (R-T)instability of ablatively accelerating planer target has been studied intensively [16]. The other isthe spherical implosion experiments. At the present time, the integrated code is not robust
- 4 5 -

JAERI-Conf 98-004
enough to simulate whole of implosion process in 2-D and, therefore, comparison has beenmainly done with 1-D code[17] or Eulerian code with 2-nd order Godunov scheme[18]. Theimplosion dynamics are well reproduced with 1-D code as seen in Fig. 2, where trajectories ofx-ray streak image are compared. This indicates that energetics of implosion process is wellmodeled in 1-D code. However, the neutron yield, fuel temperature, and compressed coreimages are not reproduced. Most of these discrepancies appear to be explained in 2-Dsimulations with nonuniformity of relatively long wavelength[19].
The integrated code has been tested to study linear and nonlinear R-T instability of theablation front. In Gekko XII experiments, a planer plastic target with corrugated surface onlaser irradiation side is used to be accelerated with green light of square pulse. We show atypical simulation result. The target initial thickness is 16 |im and a surface corrugation is 60
(Lim in wavelength and 3 ]im in amplitude. Laser intensity is 0.7 x 10 W/cm . A half of onewavelength region is simulated with 180 numerical zones in the accelerating direction and 40zones in the perpendicular direction. The pulse duration is ,2 ns. In Fig. 3, the densitycontours and the mesh structure at 3.5 ns are shown. The target initial position is at 0 |j,m inthe scale shown in Fig. 3. As clear from Fig. 3, it is possible to simulate highly nonlinear stagewith the present integrated code.
The comparison of linear growth rate and spike-bubble structure to correspondingexperimental data is on going with a developed spectroscopic code to reproduce back-light andside-light images.
6. INTEGRATED CODES IN WORLD
The concept of the integrated code is not our original, but is natural trend from the spiritof computational science. As for the integrated implosion code, code development has starteddue to a necessity to promote laser fusion program.
In LLNL, an integrated code development started at the same time as laser fusionresearch started[l,20]. The most famous code is LASNEX code[l], which is one and twodimensional. Recently, more advanced and tractable code CALE2D has been developed andbeen used to analyze radiation driven hydrodynamic instabilities [22]. This code is also used tostudy EOS effect on R-T instabilities[23], because the code is user-friendly in modeling andmodifying EOS. In addition, 3-D Lagrangian code HYDRA which came to appeare a few yearsago in papers is used for systematic study of implosion experiments as well as modelexperiments[24]. It could be possible to say that LLNL has come to the level that they canperform reliable experiments numerically without real experimenst.
In LANL, the LANL version of LASNEX has been developed and been used to studya target design of medium gain for NIF (National Ignition Facility)[25]. In the US, in addition,2-D hydrodynamic code ORCHID [26] of LLE, University of Rochester, and FAST3Dcode[27] of NRL (Naval Research Lab.) have been used to analyze experimental data and todesign targets.
7. DEVELOPMENT PLAN
We have been developing implosion codes to analyze the experimental data from Gekkolasers and design the ignition and high gain target. Such simulation will be a theoretical base to
- 4 6 -

JAERI-Conf 98-004
perform a hydrodynamically equivalent plasma (HEP) experiment to clarify the most criticalissue of hydrodynamic instability of implosion. We plan to extend the codes to the integratedcode by installing additional physics models and improving numerical schemes. The codes tobe used are Lagrangian codes, ILESTA-1D[11,28] and ILESTA-2D[14]. As the first step, wefocus on the following four subjects to be installed in ILESTA-2D code.
(l)Numerical algorithm of transports: This has been developed by Ohnishi and hasbeen briefly explained in Sec.4. This scheme will be also used to the multi-group radiationtransport with variable Eddington factor scheme and multi-group alpha particle transport. Withthe radiation transport algorithm, the code will be applied to analyze experimental data of so-called direct/indirect hybrid scheme[29]. The hybrid scheme will use radiation smoothing toavoid an initial imprint of laser non-uniformity by coating high-Z material and form zone on atarget surface. This is a good example to test 2-D radiation transport and the code will be usedto optimize the target and laser conditions.
(2)Rezoning/Remapping algorithm: This has been developed by Nagatomo andbriefly explained in Sec. 4. Most of the algorithm has been already developed, while aremapping scheme for physical quantities defined at a grid point should be improved. In nearfuture, we plan to develop a hybrid scheme in which two different rezoning schemes explainedin Sec. 4 are used in the same job to reduce numerical diffusion as less as possible and fit themesh structure to a deforming plasma structure as similar as possible.
(3)Spectroscopic diagnostic code: This has been developed by Naruo and used toanalyze R-T instability experiment and implosion experiments [30]. Only with the implosioncode, we can not compare the numerical result with the experimental data directly. We have toapproach to the experimental data. Since most of experiments are carried out withspectroscopic or back-lighting techniques, we have to develop a variety of codes to calculate thex-ray image and time history of hydrodynamics calculated with the integrated code. In case ofthe R-T experiment, the transmitted x-ray image should be Fourier transformed to see thegeneration of higher harmonics. In case of implosion experiments, fuel-doped argon line
emissions of LyP and He^ are measured[31]. This data should be analyzed by use of non-LTEatomic model and multi-dimensional code. We use RATION[32] code to get spectral opacityand emissivity to do ray-tracing in 2-D simulation. The rate equation solver FLY[33] is alsogoing to be installed in the present scheme.
(4)Kinetic-dijfusion hybrid transport scheme: This is a big issue under progress bySunahara. It has been pointed out that the kinetic effect is important to analyze the R-Texperiment done even with moderate intensity [34]. The purpose is to develop a hybrid modelof diffusive and kinetic transport for electrons and to install into the 2-D integrated code. At thepresent time, we still work for 1-D case and the hybrid model will be compared to the case withFokker-Planck code.
At the second stage, we will apply the integrated code to analyze the implosionexperiments from the very beginning of laser irradiation. The EOS package based on Thomas-Fermi model[6] should include an additional effect such as molecular dissociation[35]. Then,the code will be used to study stability and nonuniformity of implosion dynamics of high gaintargets. Even with the implosion code, it is difficult to treat the mixing governed by the modeswith spherical wavenumber of I from one to several hundreds because of limited number ofmeshes in the azimuthal direction. Some mixing model[36] should be developed to clarify theeffect of mixing in the stagnation phase. This is much hard job compare to the case of NIFindirect target design. The most unstable mode has the spherical wavenumber £ of roughlyseveral tens[37] in NIF design, while the direct high gain has
- 4 7 -
JAERI-Conf 98-004
I of a few hundreds[38].At the third stage, we have to consider to upgrade the code to include magnetic field.
In the limit of pure central ignition, the implosion scenario is spherically symmetric and no needto include magnetic field. However, the fast ignition scheme[39] is thought to be a promisingalternative to the central ignition after the technical accomplishment of ultra-intense lasers. Inthis case, an ultra-short pulse is irradiated at the edge of a compressed core and a strongmagnetic field of Giga gauss range is expected to be generated [40]. Then, we have to includetransport inhibition by generated magnetic field and the magneto hydrodynamics becomesimportant in analyzing and designing the fast ignition.
Finally, the integrated code should be upgraded to three dimension. In this case,complexity exists in transport algorithm, while this does not require a new algorithm and thesame scheme described in Sec. 4 will be extended. The development plan has beensummarized in Fig.4. The integrated code can be developed by a good combination ofresearches who work for modeling of element physics and those who develop the integratedcode by developing numerical scheme to install the models of element physics.
8. CONCLUSION
In order to study multi-dimensional hydrodynamic phenomena coupled with a variety ofenergy transports in high-energy-density plasmas produced by intense laser irradiation on asolid material, we have developed 2-D integrated code ILESTA-2D. A new transport algorithmhas been developed to solve diffusion equations in distorted Lagrangian mesh structure. Therezoning/remapping algorithm is essential to continue 2-D simulation even after strongdeformation of Lagrangian mesh. A new algorithm has been developed.
By installing these schemes into 2-D code, we have studied linear and nonlinearevolution of R-T instability in a planer plastic foil being accelerated by laser irradiation. Highlynonlinear stage with bubble and spike structure has been simulated. A spectroscopic code hasbeen developed to post-process the 2-D simulation results. Back-lighting, side-lighting, andline emission spectroscopy can be simulated with this package. We have shown an expectedplan to upgrade ELESTA to 3-D code after installing the kinetic effect of electron transport andmagnetic effect.
Finally, it is important to ask ourselves whether by developing the integrated code, wecan find a new physics. It is difficult to answer this question at the moment. We can,however, enumerate an example. When the heat transport becomes important and modifies thegrowth of R-T instability in the stagnation phase, it is nit clear whether the growth issuppressed by the fire-polishing effect or the mixing is enhanced because of melting of coldspikes into hot fuel. We have to keep in mind this question in developing the integrated codeand try to find some new phenomena which can appear only through couplings of a variety ofphysics elements.
- 48 -

JAERI-Conf 98-004
REFERENCES
[I] A. E. Brenner, Phys. Today, October issue(1996) p.24.[2] T. A. Heppenheimer, " The man-made Sun" (An Omni Press, Boston, 1983) Chap. 5.[3] P. Moin and J. Kom, Scientific American, January issue (1997).[4] J. Glanz, Science 274, 1600-1002 (1996).[5] H. Takabe, "Laboratory astrophysics with intense and ultra-intense lasers", in the Proceedings of "Intn.
Conf. Superstrong Fields in Plasmas", Varenna, Italy, Aug. 27 Sep. 2 (1997).[6] K. Takami and H. Takabe, Tech. Rep. Osaka Univ. 40, 159 (1990); R. L. More et al, Phys. Fluids 3 1,
3059(1988).[7] H. Takabe and K. Nishikawa, J. Quant. Spec. Rad. Transfer 51 , 379-395(1994).[8] E. G. Cormann et al, Nucl. Fusion 15, 377(1975).[9] W. L. Kruer, "The Physics of Laser Plasma Interactions" (Addison-Wesley Pub., 1988).[10] S. I. Braginskii, in "Rev. Plasma Physics Vol.1" (Consultant Bureau, New York, 1965) p. 205.[II] H. Takabe, "Hydrodynamic Simulation Code for Laser Driven Implosion ", to be published.[12] D. S. Kershaw, J. Comput. Phys. 26, 43 (1978).[13] N. Ohonishi et al, in preparation.[14] H. Takabe and T. Ishii, Jpn. J. Appl. Phys. 32, 5575-5580 (1993).[15] H. Nagatomo et al, to be published.[16] K. Shigemori et al, Phys. Rev. Lett. 7 8, 250-253 (1997).[18] A. Sunahara et al, Jpn. J. Appl. Phys. 3 5, 6265 (1996).[19] A. Sunahara et al, in preparation.[20] R. E. Kidder, "Laser Fusion : the first ten years 1962-1972", unpublished.[21] J. A. Harte et al, ICF Quarterly Report, LLNL, July - Sep. 1996 Vol. 6, No. 4. p. 150.[22] G. Dimonte et al, Phys. Rev. Lett. 74, 4855-4858 (1995).[23] D. H. Kalantar et al, in the 6-th Int. Wksp on "Physics of Compressible Turbulent Mixing", Marseille,
France, June 18-21 , 1997.[24] M. M. Marinak et al, Phys. Plasmas 3, 2070-2076 (1996).[25] W. J. Krauser et al, Phys. Plsamas 3, 2084 (996).[26] R. L. McCrory and C. P. Verdon, in "Inertial Confinement Fusion", ed. by A. Caruso (Editrice
Compositori, Bologna, 1989) pp.83-124.[27] R. J. Taylor et al, Phys. Rev. Lett. 76, 1643-1646 (1996).[28] H. Takabe etal, Phys. Fluids 31,2884-2893 (1988).[29] H. Nishimura, private communication.[30] S. Naruo et al, in preparation.[31] Y. Ochi et al, to be published.[32] R. W. Lee, "Users Manual for RATION", LLNL Report, January 1990.[33] R. W. Lee, J. Quant. Spect. Rad. Transfer 5 6, 535 (1996).[34] M. Honda and K. Mima, submitted to Phys. Rev. Lett. (1997).[35] L. B. Da Silva et al, Phys. Rev. Lett. (1997).[36] S. W. Haan, Phys. Rev. A 3 9, 5812-5825 (1989).[37] C. J. Keane et al, J. Quant. Spec. Rad. Transfer 54, 207-220 (1995).[38] H. Takabe et al, in the Proceeding of IAEA TCM on "Drivers and Ignition Facilities for Inertial Fusion",
March 10-14, Osaka (1997).[39] M. Tabak et al.Phys. Plasmas 1, 1626 (1994).[40] S. C. Wilks et al, Phys. Rev. Lett. 69 1383 (1992).
- 4 9 -

JAERI-Conf 98-004
FIGURE CAPTIONS
Fig. 1 The heat flown into the zone (X, Y) is the sum of fluxes 1 - 4. These fluxes aredescribed with surrounding nine quantities. The quantities Q's at the four cornergrid points are approximated by Q's.
Fig. 2 The radius-time diagram of DD gas-filled plastic shell implosion. The solid circleswith error bars are from the x-ray streak image of Gekko XII experiment, while theopen circles are from BLESTA-1D code. Energetics is well reproduced with 1-Dcode.
Fig. 3 Highly nonlinear stage of Rayleigh-Taylor instability of ablatively accelerating plasticfoil. The left shows the density contours and the right shows numerical meshstructure. The target is roughly accelerated by 100 |nm during 3.5 ns.
Fig. 4 Expected plan for developing the integrated implosion code. The code developmentconsists of two parts; one is basic research as to physics elements or models, and theother is code integration by installing the accomplishment through the formeractivity.
Q : cell centered quantity,Q : intersection quantity
Fig. 1
250
200
150
100
SO
0
I
=-
- •
-
0
0
Jo
I i
1 1
oo
o
IPO
i
#17353o Sim •• Exp.
-
-
-
4
500 1000 1500Time (ps)
Fig. 2
2000 2500
- 5 0 -

JAERI-Conf 98-004
-100 [pm] _
- 9 0
- 8 0
- 7 0
- 6 0
- 5 0
- 4 0
0.0 1.5 3.0Density [g/cm3]
Fig. 3
Plan for Integrated Code Development jr.
• Rezoning/Rem.
• Transport Arg.
• Diagnostic Code
• R-T exp.
• Imp. exp.
• Target D.(C.I.)
• Target D. (F.I.)
• E. Nonlocal
• EOS
• Opacity
• non LTE
• 3D Code
• Turb. Mix.
• MHD (B)• Interaction
Fig. 4
- 5 1 -
JAERI-Conf 98-004
6 . 3d Particle Simulations on Ultra Short Laser Interaction
Katsunobu NISHIHARA, Takashi OKAMOTO and Hidekazu YASUI
Institute of Laser Engineering, Osaka UniversitySuita, Osaka 565, Japan
ABSTRACT
Two topics related to ultra short laser interaction with matter, linear and nonlinear highfrequency conductivity of a solid density hydrogen plasma and anisotropic self-focusing of anintense laser in an overdense plasma, have been investigated with the use of 3-d particle codes.Frequency dependence of linear conductivity in a dense plasma is obtained, which shows
anomalous conductivity near plasma frequency. Since nonlinear conductivity decreases with v "•*,where vQ is a quivering velocity, an optimum amplitude exists leading to a maximum electron
heating. Anisotropic self-focusing of a linear polarized intense laser is observed in an overdenseplasma.
Keywords: electric conductivity, self focusing, dense plasma, ultra short pulse.
1. INTRODUCTION
An ultra short laser pulse may interact directly with a solid density plasma, if its pulse duration,
TL, is very short so that plasma expansion length, csTL, is shorter than the skin depth c/co , where
c, cs and cope is light speed, sound speed and electron plasma frequency, respectively. This is quite
different from a long pulse case of pulse duration longer than picosecond, in which a laser lightcan not penetrate over the critical density. Other feature of the ultra short laser interaction is thatelectrons and ions are not in a thermal equilibrium, since pulse duration is longer than the
electron-ion energy relaxation time. Thus the ion coupling constant, r=Z2e2/akBT^, may still be
greater than one, where a, Tj and Z are an ion sphere radius (47ia3/3=nj"1), ion temperature and
ion ionization state, respectively. Both ion-ion correlation and electron shielding then playimportant roles to reduce high frequency conductivity. When a quivering velocity, v0=eE0/mco0, is
greater than electron thermal speed, the conductivity depends on a laser intensity, since electron-ion scattering is determined by the quivering velocity instead of thermal speed.
In this paper we have studied these features of intense ultra-short laser interaction with the useof a 3-d strongly coupled plasma particle code "SCOPE" [1]. The code calculates particledynamics determined by Coulomb forces among individual particles. In the force calculation,quantum diffraction and quantum symmetry are effectively introduced [2].
Recently, self focusing and filamentation of an intense laser beam have been investigatedintensively related to laser acceleration and fast ignitor in ICF [3-5]. Most of previous works arelaser interaction in an underdense plasma. In this paper we deal with the self-focusing of anintense laser in an overdense plasma with the use of 3-d PIC. Anisotropic self-focusing isobserved in simulations.
2. LINEAR AND NONLINEAR HIGH FREQUENCY CONDUCTIVITY IN SOLID
\te used 500 electrons and 500 ions in a periodic cubic system. A two component plasma canbe characterized by two parameters, the ion coupling constant and the electron degeneracyparameter, kBTe/fepo, where eF0 is the Fermi energy at zero temperature. For a solid densityhydrogen with an initial temperature of leV and 13.6eV, the ion coupling constant is of the orderof 1 to 10, and the degeneracy parameter is greater than one for 13.6eV. The parameter used aresummarized in Table 1.
- 5 2 -

JAERI-Conf 98-004
Table 1 Physical parameters of solid density hydrogen plasma
density(cm"3)
5xlO22
5xlO22
ion temp,(ev)
13.6
1
ele. temp(ev)
13.6
13.6
ion couplingconst.
0.629
8.55
degeneracyparameter
2.75
2.75
Since electrons are heated very rapidly by laser electric field, but not ions, the ion-ioncorrelation and electron shielding becomes important. Observed ion-ion pair correlationfunctions without an external electric field are shown in Fig.l for the temperatures of leV and13.6eV. It is clearly seen that there is a strong ion-ion correlation, which reduces the highfrequency conductivity. When an external electric field oscillating with a frequencyco0/(o =0.423 is applied, rapid electron heating is shown in Fig. 2 at ©Qt ~ 9.5 and with an
quivering velocity of vo/vteO=2.9, where vte0 is an initial electron thermal speed.
1.5
1 -
0.5 -/* / /
/ / / f
I/1/ / II/// ^
simulation— T| = 13.6eV- - T | = 1.0 eV
theory— Ti = 13.6 eV— T,= 1.0 eV
i
Fig. 1 Ion-ion pair distribution functions obtainedby simulation (thin lines) and theory (thick lines)for ion temperature of 13eV (solid lines) and leV(dotted lines). Distance is normalized by ionsphere radius. Theory assumes uniform electronbackground.
r/a.
at t / (. 1 . . . .
r Ion;, J• • • • 1 »
Initial
JL. . . . . "
E l e c t r o n / ^ In|t|a|-
Fig. 2 Electron and ionvelocity distributionfunctions, dotted linesrepresent initial valuesand solid lines at coQt=9.5.
Isotropic electron velocitydistribution is achieved.
Linear high frequency conductivity can be calculated by taking the Fourier transform of theautocorrelation of electron current. The complex high frequency conductivity is shown in Fig.3.The real part of the observed conductivity agrees well with analytical values [6] except in thefrequency range of ©0~ G)pe ~2oope. The theory takes the ion-ion correlation into account
through the ion formfactor and the electron shielding through the linear dielectric responsefunction. However the collective response of a plasma is not considered in the theory. Thediscrepancy between the simulation results and the theory beyond the plasma frequency may bedue to the collective response of the plasma. The large peak of the conductivity around a>0~
- 5 3 -

JAERI-Conf 98-004
0.2(ope indicates that a laser with the wavelength of l^m gives high absorption rate at least for aplasma with the parameters used.
Fig. 3 Linear electric1 0 conductivity as functions of
frequency. Solid line is real partand thin dotted line imaginarypart. Dashed line is analyticalvalues [6].
o•ooo
u.o
0.4
0.3
0.2
0.1
n
• ^
i ' • • '
/•••-—"...-.„..•....-
•
••v
— - TheoryI f . i i
- 0.5
1oo/cop
0.1
I 0.01T3
OO
0.001
Te = 13.6eV
•T6 = 50eV
Te riOOe1?
•
*
simulation •• T, = 13.6eV :
A T.= 1.0 eV !theory
\ " T
t \
•A
= 13.6eV= 1.0 eV i
\
Fig. 4 Nonlinear conductivity asfunction of quivering velocity for initialtemperatures of 1 and 13eV. Linesrepresent theoretical values [6].
0.1 1 10
Quivering velocity vQ I vTe0
100
The nonlinear conductivity is estimated by observing directly oscillating current induced by anexternal electric field oscillating at the frequency of a>0/cope=0.423 which corresponds towavelength of 0.353um. The results are shown in Fig.4 with the theoretical values They agreesrairly well. The difference between them in the low intensity region is mainly due to rapidelectron heating in the simulation. However, it is still difficult to explain the difference of thefactor of 2 in the high intensity region. The nonlinear conductivity decreases with v0"3 asexpected, because electron-ion collision frequency is determined by the quivering velocity andproportional to vQ"3.
3. ANISOTROPIC SELF-FOCUSING OF INTENSE LASER IN OVERDENSE PLASMA
Ate consider a slab plasma of which dimension is 1.28X x 5.14*. x 5.1431, where X is a laserwavelength m a vacuum. Linear polarized laser light is irradiated normal to the plasma in the x-direction. The electric field is in y direction. The vacuum regions are located in both sides of theplasma with a length of 1.93X. Numbers of particles and meshes are 5,268,480 for both electrons
- 5 4 -

JAERI-Conf 98.-004
and ions and 1283. The spatial profile of the laser is a Gaussian with 3X FWHM, and the temporalprofile is given by a Gaussian with 2X/c FWHM and a flat profile follows the peak. The plasmadensity and the amplitude of the laser are chosen to be ne/nc=1.75 and a=eEo/mecoc=2,
respectively. Thus for the peak intensity yo=2.25, the plasma becomes transparent because of the
relativistic mass effect, but not transparent for the time averaged intensity, <y>=1.68.Spatial profiles of the magnetic field of the electromagnetic wave and the electron density are
shown in Fig.5 and 6 at 50 wQt. The magnetic field and electron density are normalized by that of
the incident laser light and the critical density, respectively. As shown in Fig.5, the laser lightpenetrates into the overdense plasma with self-focusing. Anisotropic self-focus is cleary seen,namely the width in the magnetic field direction(z) is much narrower than that in the electric fielddirection y. Density holes are also anisotropic. DC magnetic field of the order of lOOMGauss isgenerated in the plasma. The x component of the current and the magnitude of the DC magneticfield is plotted in Fig.7, which is measured at the point c in Figs. 5 and 6. Both the current andmagnetic field have complex structures, elliptic shape in the center surrounded by many bananashapes. Physical mechanisms which cause these structures are not well understood yet. Howeverthe stronger self-focusing of a laser light is observed in the direction of the magnetic field of thelaserlight.
Even if a uniform laser light is impinged onto a plasma, anisotropic filamentation occurs in thedirection of the magnetic field of the incident laser light as shown in Fig. 8. The size of thefilaments is the order of the wavelength of the laser light.
b c
nBo o
1 2 3 4 5X(wavelength)
' 1 i
X(wavelength)l 2 3 4 5Y(wavelength)
1 2 3 4 5Y(wavelength)
Fig. 5 Spatial profiles of magnetic field of electromagnetic wave in x-z plane (above) and x-yplane (bottom) for linear polarized wave (Ey, Bz). Magnetic field is normalized by its incidentvalue, a, b, and c represents profiles along the lines indicated in left figures.
- 5 5 -

JAERI-Conf 98-004
b c
1 2 3 4 5Z(wavelength)
1 2 3 4 5X(wavelength)
i<ne>/no
1 2 3 4 5X(wavelength)
1 2 3 4 5Y(wavelength)
1 2 3 4 5Y(wavelength)
Fig. 6 Spatial profiles of electron density normalized by the critical density in x-z plane (above)and x-y plane (bottom), a, b, and c are the same in Fig. 5.
BO
o-
1 2 3 4 5Y(wavelength)
-1
• -«. A
—i—•—r1 2
<JX>NoC
—I—'—i—'—r3 4 5
<Jx>NoC
Y(wavelength)1 2 3 4 5
Z(wavelength)
0.5"
1 2 3 4 5 1 2 3 4 5Y(wavelength) Z(wavelength)
Fig. 7 Spatial distributions of current density (top) normalized by enoc and y-component of DC
magnetic field (bottom) normalized by magnetic field of the incident electromagnetic field in y-zplane at x/^=2.8 corresponding to the point c in Fig.5 and 6. a and P represents the values alongthe lines a and P in the left figures.
- 5 6 -

JAERI-Conf 98-004
1 2 3 4 5
Fig. 8 (a) Spatial profile of magnetic field of electromagnetic wave (Bz) (top) and y componentof DC magnetic field (color) and current distribution (arrow) in x-z plane at the center.
(b) Spatial profiles of x-component of current (top) and electron density (bottom) in y-zplane at x/^=2.93 for uniform laser irradiation.
4. CONCLUSION
Linear and nonlinear high frequency conductivities are obtained for a solid density hydrogenplasma, in which both the ion-ion correlation and electron shielding play important roles. Theresults indicate that there is an optimum laser wavelength and intensity resulting in highabsorption efficiency.
Strong anisotropy of laser self-focusing is observed in an overdense plasma, although itsphysical mechanism still remains to be investigated in future.
REFERENCES
[1] K. Nishihara, Kakuyugo Kenkyu 66,253 (1991).[2] H. Furukawa and K. Nishihara, Phys. Rev. A42,3532 (1990)[3] A. Pakhov and I. Meyer-ter-vehn, Phys. Rev. Lett, 76,3975 (1996).[4] G. A. Askaryan and S. V. Bulanov, JETP Lett. 60,250 (1994).[5] M. Tabak et al, Phys. Plasma 1,1626 (1994).[6] S. Kato et al, Phys. Rev. A43,5560 (1991).
- 5 7 -

JAERI-Conf 98-004
7 .Ultra fast atomic process in X-ray emission by inner-shell ionization
Kengo Moribayashi, Akira Sasaki, and T.Taji
Advanced Photon Research Center, Kansai Research Establish, Japan Atomic Energy ResearchInstitute, 25-1, Mii-minami-cho, Neyagawa-shi, 572, Osaka, Japan
t also at Fusion Studies, University of Texas at Austin, Austin, Texas 78712
ABSTRACT
An ultra-fast atomic process together with X-ray emission by inner-shell ionization using
high intensity (1018W/cm2) short pulse (20fs) X-ray is studied, A new class of experiment is
proposed and a useful pumping source is suggested. In this method, it is found that the gain
value of X-ray laser amounts to larger than 1000(l/cm) with use of the density of 1022/cm3 of
carbon atom. Electron impact ionization effect and initial density effect as well as intensity of
pumping source effect are also discussed.
Keywords: ultra fast atomic process, inner-shell ionization, high intensity short pulse X-ray
emission, X-ray laser, carbon atom.
1. INTRODUCTION
An inner-shell ionization process of atoms is thought to be one of the useful method for
emission of X-ray laser[l-4]. Furthermore, in the process, there are some interesting physi-
cal phenomena and applications such like (l)application of ultra-short pulse X-ray pumping
source[5-9], (2)ultra-fast atomic process, and (3)interaction between high intensity short pulse
X-ray and atoms as well as (4)the application to X-ray laser. Nevertheless, there are no ex-
periment as far as we know. Further, only a small number of recent theoretical research [3, 4]
exists.
The method was suggested by Duguay and Rentzepis[l] in the first place. Recently, by
Kapteyn[3] and Moon ei.a/.[4], the gain value of X-ray laser amounts to about 10cm"1 for the
"water window" region with Ne atom and carbon atom, respectively. They used the density of
smaller than 1020(l/cm3) by about 1016W/cm2 in 50fs pumping source. We can get the gain
value of larger than 1000/cm with use of density of 1022(l/cm3) and ultra-fast atomic process
by 1018W/cm2 in 20fs pumping source. Recently, Ueshima et.al.[9] have generated short pulse
high intensity X-ray emission theoretically by Larmor radiation resulting from the interaction
between ultra short pulse laser and plasma. In this method, it is possible to make X-ray emission
with the intensity of 1018W/cm2 in 20fs pulse.
In this paper, we will demonstrate the ultra-fast atomic process in X-ray emission by inner-
shell ionization with the use of the high intensity of 1018 W/cm2 in short pulse of 20fs pumping
- 58 -

JAERI-Conf 98-004
source. We take carbon atom with density of 1022cm~3 as sample. Further, we also solve the
lasing condition, propose a new class of experiment, and suggest a useful pumping source.
2. ATOMIC PROCESSES
Fig.l shows the atomic process of the carbon atom in X-ray emission by inner-shell ionization.
The photo-ionization and the electron impact ionization cross sections [ap and ae) are derived
from the data or the empirical formula in Refs.[10] and [11], respectively. Here, the electrons
and their energies are assumed to be ejected through ionization processes and the photon energy
minus ionization energy, respectively. Then, the photo ionization rate (Rp) and the electron
impact ionization rate (Re) are given by
Iap
Rp = and Re =< veae > ne> (1)
respectively, where / , hu, ne are intensity of pumping source, photon energy, electron density,
respectively. The energy levels, radiative transition probability (Ar), and auto-ionization rate
(Aa) are calculated by Cowan's code[12, 13]. Then, the inner-shell ionization energy and ion-
ization energy to the ground state of C+ from the ground state of C atom are about 300eV and
lOeV, respectively. Further, the Ar and Aa values are about 3xlO12/s and 1014/s, respectively.
In order to get the gain value given by
gain = 2.7 x 10
following rate equations must be solved:
24>i9l<»»(—9 Qlow
• ) / «(2)
inner-shell excited state
inner-shellionization
Ts2s22p2
X-ray
1s22s22p
^ photo ionizationelectron impact ionization
source
short pulserlaser
Larmor radiation
| X-ray
Filter
r
Filter
|Ep>300eV
C atom c + ion
inner-shell ionization
ion
Fig.1 Atomic process in X-rayemission by inner-shell ionization.
X-ray laser
Fig.2 Our proposal of class ofexperiment
- 59

JAERI-Conf 98-004
No = ~(RuP + Rfow + Rtow)N0, Nup = R^pNo - (Ar + Aa)Nup, N'(ow = (R[ow + Rtow)N0 + ArNup, (3)
where 4>i, No, Nup^ow^, gupQ0W), fui are the Doppler or Voigt broadening, population of C atom,populations of upper (lower) state, statistical weight of upper (lower) state, oscillator strength,respectively. The No, Nup, Niow values can be solved analytically:
iV0 =
Nlow = < A T 02
0 < vea° > - ^ — { ^ — - ( l - e - « P + - ^ ) - ^ ( l - e - ™ & ) } , ( 4 )•"'up ~ A « ^up T A a £Jlup
where NQQ is the No value at 2=0. Here we consider only the fast processes, then the slowprocesses such like the radiative transition process can be ignored, further the ne value canequal to the Nup value approximately.
3. PROPOSAL OF NEW CLASS OF EXPERIMENT AND SUGGESTION OFUSEFUL PUMPING SOURCE
As is seen from eqs.(2) and (4), the Rp and Re values in eq.(l) must be decreased to make
Niow value smaller, that is, gain value larger.
In the photo-ionization cross sections of carbon atom[10], the low energy component with
photon energy (Ep) < 300eV gives the contribution only to the ionization to the lower state.
Therefore, we propose that the lower energy component should be cut and only the high photon
energy component should be used.
The ne value is almost in proportional to t and the electron impact ionization rate coefficient
< veae > is in inverse proportional to ve. Therefore, the interaction time and the ve value
should be shorter and faster, respectively. To reduce the interaction time, we propose the use of
high intensity short pulse pumping source because it can make all the initial C atom ionize in a
moment. On the other hand, as far as the velocity is concerned, we have no idea of increasing
the velocity now.
The pumping source should be high intensity short pulse X-ray as mentioned just now. In
the pulse duration time of 20fs, the Rp value is requested larger than 5xlO13/s for ionizing all
the atom during this duration time. Since the inner-shell photo-ionization cross section at the
photon energy Ep of lkev is 4xl0~2Ocm2, we suggest the intensity of larger than 2xlO17W/cm2
to the the most useful pumping source.
Fig.2 shows our proposal of a class of the experiment. Firstly, by Larmor radiation resulting
from short pulse laser with the intensity of ~102OW/cm2, short pulse (~ 20/s) high intensity
(/ ~ 1018W/cm2) X-ray emits[9]. Then, with use of a filter, X-ray with Ep > 300eV can be
selected. Lastly, as soon as this X-ray interacts with the C atom solid, the X-ray laser by inner-
shell ionization method will be generated. We should use another filter in order to avoid the
interaction between the short pulse laser and the solid carbon atom because it may destroy the
inner-shell excited state by optical field ionization.
- 6 0 -

JAERI-Conf 98-004
4. RESULTS AND DISCUSSIONS
For i=1015 ~1018 W/cm2 and £p=400eV~lkeV, the gain value in Eq.(2) and populations of
the carbon atom, the upper and lower state are calculated. Then, the electron impact ionization
effect and the initial atom density effect are discussed.
Figs.3(a) and (b) show the gain values at Ep=600eV and iV0o=1022/cm3 as a function of
time without and with electron impact ionization effect, respectively. In both cases, the gain
values become larger as the intensity value increases, however, a different feature for the duration
time of the large gain value is seen. Namely, the duration times are more than 20fs without
it and about lfs with it, respectively. This means that the electron impact ionization plays an
important role at high density.
At / > 1016W/cm2, the maximum of the gain value is more than 10/cm. We found that the/ > 1016W/cm2 values are the lasing condition. It should be noted that the gain value is morethan 1000/cm at / = 1018W/cm2.
In Fig.3(b), only the duration time with I=1018 W/cm2 is longer than those with / <
1017W/cm2 which are almost the same among them. The reason why the difference exists is
seen from Fig.4(a) and Fig.4(b), which show the populations of the carbon atom, the upper
state, and lower state for /=1017 and 1018W/cm2, respectively. In the case of J=1018W/cm2
(Fig.4(b)), the populations of the upper state and those of the carbon atom increases and
f
'cdTO
Without Electron impact effect
10
10C Y ® -
•.•t:-=. i—«=,.-..:!
1=1015 (W/cm2).
1=10 16(W/cm 2)
1=10 " (W/cm2)
l=101B(W/cm2) ;
10*
10s
101
CL0
10 15 20
time (fs)With electron impact effect
~r(b)
T"
l=10>5(W/cm2)
1=1016 (W/cm2)
1=10 "(W/cm2)1=1018 (W/cm2)
10 15 20
time(fs)Fig.3 gain (1/cm) vs. time(fs).(a)withoutand (b)with electron impact ionization.
g
exa
10
10
10
10
10
221=1017 (W/cm2) E p=600eV
21
20
19
18
/ /
f /
r
i
s
1 L
C atomupper levellower leveli i
i.
^ \
. _ . J
(a) -
i
Q.oQ.
10time (fs)
15 20
=1018(W/cm2) E =600eVT
(b)C atomupper levellower level
JL
10
time (fs)
15 20
Fig.4 Population (1/cm 3) vs. time (fs)
(a)l=10 17 and (b)l=10 18W/cm2.
- 6 1 -

JAERI-Conf 98-004
decreases very rapidly, respectively. As a result, there is little time for the ionization process
from the C atom to the lower state by electron impact. On the other hand, in the case of
1017W/cm2(Fig.4(a)), all the populations change slower. Therefore, enough time for electron
impact ionization exists. Further, the population of the upper state decreases because of au-
toionization and radiative transition processes, on the other hand, that of lower state converges
soon. Therefore, the duration time can not be long even in the case of 1018W/cm2 high intensity.
Fig.5 shows the same as Fig.3(b) for the ve value of the light velocity. You can see the larger
gain values continue for longer time than those in Fig.3(b) though we can have no good idea for
the increase of the velocity. This may be key to succeeding the method and our problem to be
solved.
Fig.6 shows the same as Fig.3(b) for / = 10irW/cm2 and iVoo=1019 ~1022/cm3. At lower
iVoo value, longer, duration time is seen. However, the gain value decreases as the Noo value
becomes larger. We can also choose the best density for the request of the experiment.
5. SUMMARY
With use of the high intensity (~ 1018W/cm2) short pulse (~20fs) X-ray, we can treat theultra fast atomic process. This is connected to the X-ray laser with the gain value of more than1000/cm. We also propose the new experimental class and suggest the useful pumping source.Further, we discuss the electron impact ionization effect and the effect of the atom density onthe X-ray laser.
In this paper, only the carbon atom is treated. However, we can choose the best atom forthe request of experiment after the pumping source is decided.
"to
10
10'
10
10
~l 1
J=1018(W/cm
; / ' l=101 7 (W/cm2 ) . s
i16 (W/cm2)
f 1=10 (W/cm )
1000
0 5 10 15
time (fs)
Fig.5 The same as Fig.2(b) forthe electron velocity of the lightone.
20
i rN0=1022(1/cm 3)
N0=1021(1/cm 3)
N00=1020(1/cm 3) •
NOo=10 (1/cm
5 10 15
time (fs)
20
17 2
Fig.6 gain vs. time for 1=10 W/cm
andN00=1019~1022(1/cm 3)
- 6 2 -

JAERI-Conf 98-004
ACKNOWLEDGMENT
We wish to thank Drs. T. Kato(NIFS) and Y. Ueshima for their useful discussions. Cowan'
code is employed for the calculations of the energy level, the radiative transition probability,
and autoionization rate.
References
[1] M.A.Duguay and M.Rentzepis, Appl.Phys.Lett., 10, 350(1967).
[2] T.S. Axelrod, Phys.Rev.A, 13, 376(1976).
[3] H.C.Kapteyn, Applied Optics, 31, 4391(1992).
[4] S J.Moon, D.C.Eder, and G.L. Strobel, AIP Conference Proceedings, 332, 262(1994).
[5] P.Gibbon, Phys.Rev.Lett., 76, 50(1996).
[6] J.J. Macklln, J.D. Kmetec, and C.L. Gordon, Phys.Rev.Lett., 70, 766(1993).
[7] T.D. Donnelly, T.Ditmire, K.Neuman, M.D. Perry, and R.W. Falcone, Phys.Rev.Lett., 76,2472(1996).
[8] J.D.Kmetec, C.L. Gordon III, J.J. Macklin, B.E. Lemoff, G.S.Brown, and S.E.Harris,
Phys.Rev.Lett., 68, 1527(1992).
[9] Y.Ueshima, Y.Kishimoto, A.Sasaki, Y.Sentoku, and T. Tajima, this proceeding.
[10] J.J.Yeh and I.Lindau, Atomic data and Nucl. data tables, 32, 1(1985).
[11] W.Lotz, Z.Phys., 232, 101(1970).
[12] R.D. Cowan, J.Opt.Soc.Am., 58, 808(1968).
[13] R.D. Cowan, "The theory of atomic structure and spectra", "University of California Press,
1981.
- 6 3 -

JAERI-Conf 98-004
8 . Stimulated Raman Backscattering at High Laser Intensities
Milos M. SKORIC '* , Toshiki TAJIMA, Akira SASAKI,
Aleksandra MALUCKOV ** and Moma JOVANOVIC**
Advanced Photon Research Center, Kansai Research Establishment
Japan Atomic Energy Research Institute, Osaka, 572, Japan
*Vinca Institute of Nuclear Sciences, POB 522,
II001 Belgrade, Yugoslavia
**Faculty of Philosophy, Department of Physics
University of Nis, 18000 Nis, Yugoslavia
ABSTRACT
Signatures of Stimulated Raman backscattering of a short-pulse high-intensity laser interacting with an
underdense plasma are discussed. We introduce a nonlinear three-wave interaction model that accounts
for laser pump depletion and relativistic detuning. A mechanism is revealed based on a generic route
to chaos, that predicts a progressive increase of the backscatter complexity with a growing laser
intensity. Importance of kinetic effects is outlined and demonstrated in fluid-hybrid and particle
simulations. As an application, we show that spectral anomalies of the backscatter, predicted by the
above model, are consistent with recent sub-picosecond, high-intensity laser gas-target measurements
at Livermore and elsewhere. Finally, a recently proposed scheme for generation of ultra-short, low-
prepulse laser pulses by Raman backscattering in a thin foil target, is shown.
Keywords: Laser Plasma, X-Ray Lasers, Stimulated Raman Scattering, Anomalous Absorption
1. INTRODUCTION
A large amount of research on short-pulse laser driven plasmas in gas targets / l - l 1/ has been
motivated by interest in novel recombination and collisionally excited x-ray lasers /I-5/. In
recombination schemes in order to achieve shorter XUV wavelength, high laser intensities are needed
to produce ions of higher ionization potential, while higher plasma density and very low electron
temperatures are required to achieve high gain. Generally taken, short wavelength-248 nm and short-
pulse -100 fs lasers are expected to be favorable 13-11. Moreover, Lemoff et al. demonstrated a new
class of XUV lasers in which intense circularly polarized fs-laser pulse is used to tunnel ionize a
gaseous target with simultaneous collisional excitation by hot electrons 161. More recently, anomalous
x-ray emissions in the sub-ps laser interaction with dense gas targets were reported. It was Crane et al.
of Livermore, first to point out 161 the interrelation between anomalous x- emissions from Ne plasmas
and anomalous signatures of stimulated Raman backscattering /1,21. In this paper, we intend to clarify
- 6 4 -

JAERI-Conf 98-004
signatures of stimulated Raman backscattering (SRBS) related to sub-ps high-intensity laser
underdense plasma experiments /12-14/. Based on a generic model /8-9/ of SRBS we believe to be
able to offer an interpretation of spectral anomalies reported at Livermore and Rutherford, and more
recently elsewhere /4-9/. As a further application, the novel ultrashort -laser pulse generation scheme
by SRBS in a thin foil target is proposed /15-16/. Results are demonstrated by hybrid-fluid as well as
particle simulations /13,14/.
2. COUPLED MODE MODEL
Stimulated Raman Backscattering (SRBS) in a plasma is a paradigm of a three-wave parametric
process whereby a strong incident laser light (0-pump) decays into an electron plasma wave (2) and
backscattered light (1) downshifted in frequency /I,II, This process obeys a resonant matching
condition for wave frequencies and wavenumbers, in a form :
CDQ=cDx+a)2 , k0 = ~kx + k2
The standard model of SRBS described by both linear and nonlinear parametric theory is well
established predicting threshold /instability growth rates and steady-state reflectivity saturation I\,2I.
It was only recently, that a generic route to complex saturated Raman regimes was revealed by some
of these authors, in a form of a quasi-periodic transition to chaos via intermittent route /8,9/.
Depending on control parameters (laser intensity, plasma length, etc.), Raman reflectivity signatures
span from the steady-state, to coherent temporal pulsations, temporal intermittency and chaos. A
comprehension of SRBS complexity and its parameter dependence has allowed possible explanation
of puzzling spectral anomalies recently observed in short high-intensity laser interaction with gas
targets 13 -II. Although based on a fluid approximation, the model was qualitatively confirmed in
particle simulations. Ill, 13/.
We consider a coupled three-wave interaction (3WI) model of SRBS. In one-dimensional case, which
is of major importance, the linear parametric Raman backscatter growth rate is given by
is the ratio between the electron plasma frequency and the frequency of the laser light.
In a bounded, uniform, completely ionized plasma, the spatio-temporal evolution of coupled waves is
governed by the following set of partial differential equations
a, -
Voao = -axa2
^ a , = a(]a"2
K2 r2 + i a 2 +/( j^ 2 a2 = poa
(1)
(2)
o< (3)a2
Where the dot and the prime sign designate partial temporal and spatial derivatives, respectively;
given in normalized coordinates :
- 65 -

JAERI-Conf 98-004
r-co0t, g = x/L ; where a;.(£, r)
Are normalized, slowly varying complex amplitudes of a pump (0). backscattered wave (1) and
plasma wave density (2), respectively. Matching conditions for frequency and wave numbers are
assumed; each wave satisfying its linear dispersion relation. The group velocities of the waves are:
Vo=c2ko/co%L, V^c2kJa)Go)xL, V2 =3v2k2lco0copeL,
With a plasma wave linear damping rate given by F . Damping of the light waves is neglected.
The quantity Po is a relative laser pump strength, i.e. the ratio between the electron quiver velocity in
the laser light and the speed of light in vacuum. :
vosc[m/s] = 0.256y[7/l0 where I is in WI cm2, and /l0 is in microns.
An important feature of the system is the self-modal cubic term in the plasma wave equation (3).
It appears as a nonlinear shift due to relativistic frequency detuning of a large amplitude plasma wave .
We solve the system (1-3) in space-time for standard initial and boundary conditions. In the steady-
state, for zero phase shift, the system predicts well known elliptic-function solutions, together with a
set of (Manley-Rowe) conserved quantities 111. However, with a nonzero phase shift (a>0 ) , for
finite boundary conditions, invariants are broken. A violation of the steady-state condition, thus points
to a nonstationary Raman saturation. A time-only version of (1-3) was studied in detail, and it was
shown to exhibit bifurcation to a low-dimensional chaos under restricted conditions. Indeed, in early
works on particle acceleration, transition to incoherency due to multicascading of scattered waves was
readily predicted /10,11/. The spatially extended model is of more physical significance and have
recently revealed rich complexity related to low-dimensional as well as spatio-temporal chaos. For
completeness, we briefly review, with details available, elsewhere /8,9/. For a low pump intensity,
bellow the threshold for absolute SRBS, the system (1-3) attains the steady-state (fixed point) with
reflectivity saturated at a noise level 111. Beyond the threshold Hopf bifurcation saturates to a single-
periodic (limit-cycle) state. Reflectivity displays weak periodic modulations around the maximum,
limited by a pump depletion, according to the Manley-Rowe relation. Another Hopf bifurcation brings
a second frequency leading to a 2-torus dynamics with strong quasi-periodic pulsations. Further pump
increase leads to a collapse of a torus to transit a nonlinear coherent state to a deterministic chaos.
The subsequent evolution first exhibits a low-dimensional intermittency to finally result in a fully
developed spatio-temporal chaos /8-9/, in a fluid model (1-3) of SRBS. Chaotic dynamics is related to
plasma wave breaking followed at a kinetic level, by strong nonlinear electron acceleration /1,3,13/. In
turn, hot electrons tend to Landau-damp freshly driven plasma waves to suppress instability and
limit the level of a kinetic SRBS complexity to be observed. To perform studies in this direction we
have recently introduced particle and hybrid- 3WI simulations.
- 6 6 -

JAERI-Conf 98-004
3. ANOMALOUS SPECTRAL SIGNATURES
We chose to simulate conditions relevant to recent short-pulse high-intensity laser plasma experiments,
to study anomalous Raman signatures, in particular, complex spectral properties. According to
Livermore experiments 15-61, deep modulations on backscatter spectra have been observed at variety
of densities and intensities. Major spectral features are the large frequency extent, the irreproducibility
and the broadening mainly to the blue side of standard Raman. More recent data further relate hot
electron generation and x-ray emission to Raman anomalies 16,11. To emulate some of the kinetic
effects missed by the fluid 3WI model (1-3), we introduce a hybrid scheme by including effects of
electron acceleration in breaking plasma waves and subsequent Landau damping on hot electrons .
Assuming that plasma wave energy is transferred to suprathermal electrons we numerically solve hot
electron balance equation together with 3WI set (1-3). In turn, hot electrons suppress SRBS through
Landau damping- F term in (3). We further add simple transport equation to model bulk heating via
partial thermalization of hot electrons. Typical simulation results for a Gaussian pulse are presented in
figures 1 and 2. Anomalies, such a temporal pulsations, bursting and incoherence that result in
modulated broadened blue shifted spectra are obtained. We find a consistency with recent
experimental findings. Blue shift is explained to be due to a relativistic drop of plasma frequency in a
large plasma wave, with a backscatter blue shifting to maintain in a resonance with a laser pump.
•sa
Ioa
0O=O.2O
0O=O.3O
/f?o=0.45
00=0.50
200 600 900 1200 1500 -0.1
time (&V1)
Fig. 1
3 «
p.
•IK0o=O.55
0O=O.65
0 300 600 900 1200 1500 -0.1
time far1)
Fig. 2
oP.
CO
(cj-£d,)/cj0
FIGURE 1: Backward SRS reflectivity vs. time andfrequency spectrum for a plasma layer (no = 0.01ncr, Tc —ikeV, L = lOOc/u>o) by different values of short (600 fs)laser pulse intensities /?<>•
FIGURE 2: Reflectivity and spectrum for the parametersof Fig. 1, except length: L = 500c/wo-
- 6 7 -

JAERI-Conf 98-004
4.FS LASER-PULSE GENERATION
Chirped-pulse (CPA) has become a standard technique for damage-free amplification of sub-ps laser
pulses to terawatt levels and beyond. Such laser systems offer promise as convenient tools for
investigation of high field phenomena, particle acceleration and generation of ultra-fast x-ray radiation.
At a frontier of FS-science, sub-10 fs laser oscillators readily exist, however amplification of sub-20 fs
pulses to energies greater than 0.1 mJ is difficult to achieve. Further, we discuss a method for the
generation of ultra-fast fs-range pulses recently proposed /161. The scheme is based on a SRBS in a
very thin foil target. In an underdense exploding foil plasma, beyond the threshold for absolute Raman
instability it was shown that reflectivity can saturate via strong quasi-periodic coherent pulsations 191.
By a proper choice of plasma parameters one can produce a low-prepulse, ultra-short backscatter pulse
shorter than 10 laser periods, i.e. in the 10 fs range. In that way, one can possibly master an
inexpensive and flexible method for proliferation of fs-range energetic laser pulses by using ps-scale
laser drivers, commonly available. To illustrate we show particle simulation results /13/ in figure 3.
After initial development, reflectivity pulsations are quickly suppressed due to intense plasma heating.
We plot a diagram to find a scaling of a pulse length on intensity and plasma parameters (figure 4).
0 500 1000 1500 2000 2500 3000
t i m e (To)
FIGURE 3. PIC simulation reflectivity versus time for two different pump intensities /?<)'•a) 0.02, b) 0.03. For the fundamental wavelength 1.06 /im, the pulse lengths are estimated toapproximately lps and 0.5 ps, respectively. Plasma is underdense: n0 = 0.1ncr, Te = 0.5keVand L = 16 Ao.
- 68 -

JAERI-Conf 98-004
70
50
30
10R(%>-19 43-"'t'"""*"'""
49*
•
20
55. - • "
» " *TC =1 keV
59- - - - • • - "
Tc=SI<eV.
5 _LPa
0.5 1.0 1.5
-L.X.
FIGURE 4. Pulse length T/TQ (full line) and laser intensity /?o (broken line) versus plasmafoil thickness L with corresponding peak reflectivity for plasma temperatures of 1 keV (tri-angles) and 5keV (dots). Plasma is underdense (no = 0.1ncr); Ao and To are the laserwavelength and period, respectively.
5. ACKNOWLEDGEMENTS
Discussions and encouragement by Professor H. Takuma, Dr T. Arisawa, Professsor K. Mima and Dr
Y. Kishimoto are gratefully acknowledged. One of us (M.M.S) was a JAERI Guest scientist at the
Advanced Photon Research Center. The hospitality of Kansai Research Establishment is appreciated.
6. REFERENCES
1. W.L. Kruer, The Physics of Laser Plasma Interactions (Addison-Wesley, 1988)
2. D.W. Forslund, J.M. Kindel and E. Lindman,, Phys. Fluids 18, 1002 (1975)
3. S.C. Wilks et al., Physics of Plasmas 2, 274 (1995)
4. C.I Joshi and P.B. Corkum, Phys. Today 48, 36 (1995); see Science 271, 25 (1995)
5. C. Coverdale et al. BAPS 40, 1663 (1995); Plasma Phys. Repts 22, 617 (1996)
6. J.K. Crane et al., J. Opt. Soc. Am. B13, 89 (1996); ibid., B.E. Lemoff et al
7. A. A. Offenberger et al. Laser and Particle Beams 13, 19 (1995) (and to appear)
8. MM. Skoric and M.S. Jovanovic, in Laser Interaction and Related Plasma Phenomena,
Vol. 11, ed. G. Miley (AIP, N.Y., 1994); ibid., Vol. 12, p.363, (AIR 1996)
9. M.M. Skoric et al., Phys. Rev. E53, 4056 (1996); Europhys. Lett. 34, 1 (1996)
10. T. Tajima and J.M. Dawson, Phys. Rev. Lett. 43, 267 (1979);
11. T. Tajima, Laser and Particle Beams 3, 351 (1985)
12. K-C. Tzeng, W.B. Mori and CD. Decker, Phys. Rev. Lett. 76, 3332 (1996)
13. S. Miyamoto, K. Mima, M.M. Skoric*, M.S. Jovanovic, J. Phys. Soc. Japan (to appear)
14. M.M. Skoric, A. Maluckov, A. Sasaki, T. Tajima and K. Tani, JAERI-Memo (1997)
15. M.D. Perry and G. Morou, Science 264, 917 (1994);also, in STA Today (4/97)
16. K. Mima, M.M. Skoric" et al. in Laser Interaction and Related Plasma Phenomena,
Vol. 14, eds. E.M. Campbell and G.M. Miley (AIP, N.Y., 1997, to appear)
- 6 9 -

JAERI-Conf 98-004
9 . Plasma Simulation with the Differential Algebraic Cubic InterpolatedPropagation Scheme
Takayuki UTSUMI
Advanced Photon Research Center, Kansai Research Establish,
Japan Atomic Energy Research Institute
Tokai-mura, Naka-gun, Ibaraki-ken 319-11, Japan
ABSTRACT
A computer code based on the Differential Algebraic Cubic Interpolated Propagation schemehas been developed for the numerical solution of the Boltzmann equation for a one-dimensionalplasma with immobile ions. The scheme advects the distribution function and its first derivativesin the phase space for one time step by using a numerical integration method for ordinarydifferential equations, and reconstructs the profile in phase space by using a cubic polynomialwithin a grid cell. The method gives stable and accurate results, and is efficient. It is successfullyapplied to a number of equations; the Vlasov equation, the Boltzmann equation with the Fokker-Planck or the Bhatnagar-Gross-Krook(BGK) collision term and the relativistic Vlasov equation.The method can be generalized in a straightforward way to treat cases such as problems withnonperoiodic boundary conditions and higher dimensional problems.
Keywords: Boltzmann equation, Vlasov equation, Differential Algebraic CIP scheme
1 INTRODUCTION
In the analysis of nonlinear oscillations and instabilities of plasmas, numerical calculationplays an important role. Many numerical techniques have been proposed in recent years suchas particle simulation [8], Fourier-Hermite transform [1], Fourier-Fourier transform [5], finiteelement [12],and splitting methods [4]. For the elucidation of nonlinear plasma phenomenon insuper strong electromagnetic fields generated by ultra high peak and ultra short pulse lasers,the development of the high-precision and efficient numerical techniques have been continuallydesired.
In the meantime, the cubic interpolated propagation (CIP) scheme introduced by Yabe etal. [9] is a low diffusion and stable method, and is a universal solver for hyperbolic equations.The CIP scheme has been successfully applied to various complex fluid flow problems [11, 10],covering both compressible and incompressible flow, such as shock wave generation, laser-inducedevaporation, and elastic-plastic flow. The basic idea is that a physical quantity within a gridcell is approximated by a cubic polynomial, of which coefficients are determined by the physicalquantity and it's spatial first order derivatives at each grid point. Here, the physical quantityobeys a governing equation and the equations for its spatial first order derivatives are derived bytaking spatial derivatives of the master equation for the sake of consistency. These equations are
- 7 0 -

JAERI-Conf 98-004
split into two phases; the nonadvection and advection phase. The equations for the advectionphase are the free stream equation containing the convection terms and those for the nonadvec-tion phase contain other dynamical terms and compression terms. For each time step, after thenonadvection phase is solved via a finite-difference approach, the quantities at each grid pointare determined by interpolating profiles. Viewing the CIP scheme from the Lagrangian pointof view, the nonadvection phase represents dynamics along characteristics and the advectionphase reconstructs profiles on the grid points. Based on this idea, we propose the differentialalgebraic CIP (DA-CIP) scheme [6], in which the trajectory equations are solved explicitly andthe dynamics along each stream line are solved with a numerical integration method for ordinarydifferential equations (ODEs) like the Runge-Kutta (RK) integration method. All the quanti-ties appearing during derivative evaluation are estimated by using cubic polynomials. Then theDA-CIP scheme can attain higher order accuracy and avoid finite-difference operation. Further-more, these integration methods are local in the sense that the time evolution for each grid pointdepends only on the local information around it, so they conform to parallel computation basedon the Single Instruction Multiple Data (SIMD) model.
The Boltzmann equation is the advection equation in phase space and one of hyperbolicequations, the DA-CIP scheme might be expected to be directly applicable. Though manymodern schemes has been derived from various points of view and are applicable only for specificpurposes, we show in this paper that the DA-CIP scheme is a robust and efficient numericalmethod with a wide range of applicability.
In Section 2, we briefly describe the governing equations to be treated in this paper andthe DA-CIP scheme. In Section 3, some numerical results are shown; for the Vlasov equation,the Boltzmann equation with the Fokker-Planck or the Bhatnagar-Gross-Krook(BGK) collisionterm and the relativistic Vlasov equation. The conclusions are given in Section 4.
2 GOVERNING EQUATIONS AND NUMERICAL PROCEDURE
The system we solve here is the single species one-dimensional electron (charge -e, mass m)plasma with periodic boundary conditions. The physics of the non-relativistic unmagnetizedelectron plasma is described by the Boltzmann equation,
where / = f(x,v,t) is the electron distribution function and (§£)c is the collision term. Forcollisionless plasma, (§f)c = 0, (1) is called as Vlasov equation. Supplemented byf Poissonequation for electrostatic field Ex = Ex(x,t),
3EX
dx/•oo
= 1 - / fdv. (2)J—oo
Lengths are measured in units of the Debye length Xp = (kT/innoe2)1/2, times in units ofthe inverse plasma frequency u~l = (4Trnoe2/m)~1/2, velocities in units of the thermal velocityVT — Xpujp, where no is the average number density of ions providing a uniform neutralizing
- 7 1 -

JAERI-Conf 98-004
background. Ex = Ex(x, t) and / = f(x, v, t) are the dimensionless electric field and distribution
function, respectively.
The above defined system is also extended, replacing the independent variable v with the
momentum px> to the relativistic electromagnetic electron plasma as
with the relativistic factor 7 = (1 + P2)1 /2 , the quiver velocity uy = uy(x, £), and magnetic field
Bz = Bz(x, t), assuming uz — 0, Bx = By = 0, Ez = 0. The quiver velocity uy satisfies ^uy =
—Ey. The longitudinal electrostatic field Ex obeys Poisson equation (2), and the transverse
electromagnetic fields Ey,Bz obey Maxwell equations, -^Bz = --§^Ey -^Ey = --§^BZ - Jy,
where Jy — — %/f^ fdpx is the current density in y-direction. The units used in this system
are u~l for times, cu~l for lengths, c for velocities, and me for momenta, where c is the speed
of light. The fields Ex or Ey are normalized to upmc/e and the field Bz to upm/e.
According to the general formulation of the DA-CIP scheme, the governing equations for the
relativistic system are expressed as follows: (see [7] for the non-relativistic system)
% ^ ^ 0 (4)
supplemented by Poisson equation(2) and -jjiouy = —Ey, ^ ± £ ' : t = — Jy , where E± = (Ey±Bz),
and -^ , ^ , are the differentiation along the characteristics x = const, x^t = const, respec-
tively. The equations for the first derivatives of / , uy,Ey, Bz in the phase space are obtained by
taking derivatives of these equations. Then the numerical procedure of the DA-CIP scheme is
as usually defined [7].
3 NUMERICAL RESULTS
In this section, several numerical results are described to demonstrate the accuracy and ef-
ficiency of the DA-CIP scheme for the collisionless plasma, the collisional plasma, and the
relativistic collisionless plasma.
(a) the collisionless plasma simulation
The physics of the collisionless plasma is described by the Vlasov-Poisson equation ((1) with-
out collision term and (2), and the results are shown elsewhere [7] for the well-understood
problems; the recurrence effect for a free streaming distribution, linear Landau damping, strong
nonlinear Landau damping, the two-stream instability, and the bump-on-tail instability.)
Here we only show the case for the evolution of a two-stream plasma to Bernstein-Greene-
Kruskal (BGK) equilibria with the initial condition
*, v, 0) = / 0 w o S ( l + 7~^:)e{-v2/2)(l + A1 cos{hx) + A2 cos(k2x + 0)), (5)
where fj, = 1, f = 0.9, if) = TT/5, AX = 10~3, A2 = 10~6, fci = 0.25, and kt = 0.5. Figure 1 shows
that at first the two-hole structure appears at t ~ 80, then two holes start coalescence due to
the perturbation term A2 cos(k2x + ifi), and finally one-hole BGK structure appears and persists
- 7 2 -
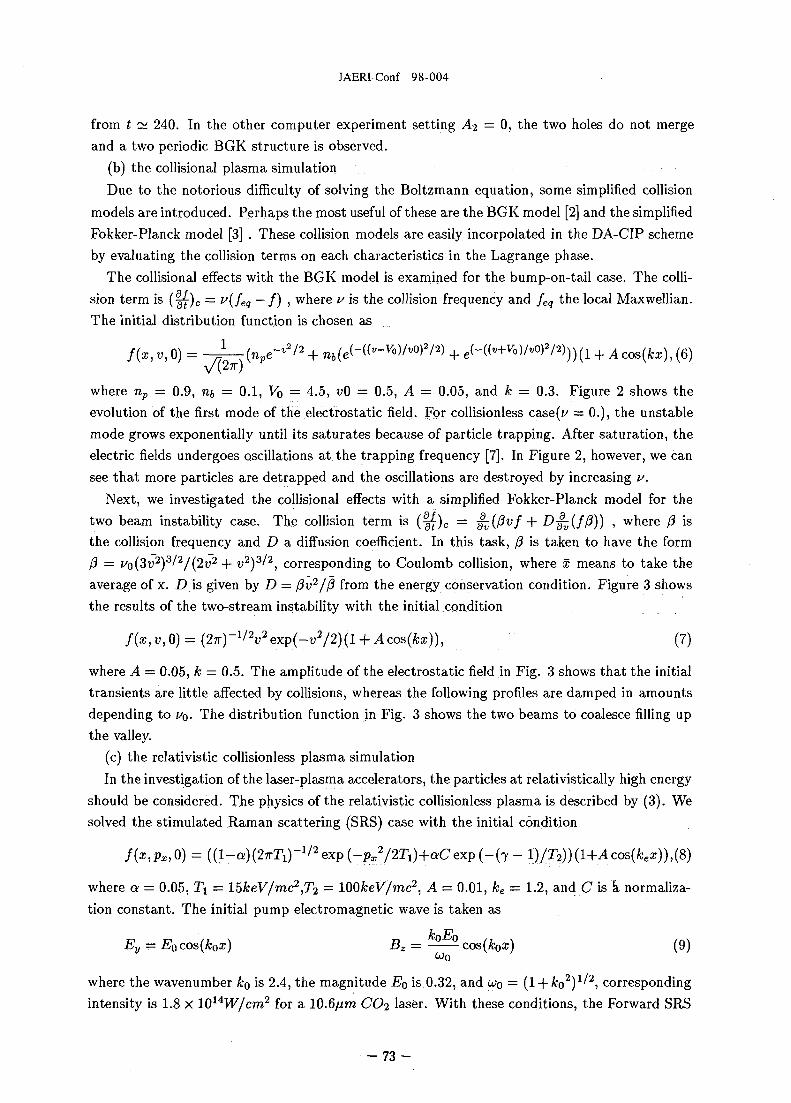
JAERI-Conf 98-004
from t ~ 240. In the other computer experiment setting A<i = 0, the two holes do not mergeand a two periodic BGK structure is observed.
(b) the collisional plasma simulationDue to the notorious difficulty of solving the Boltzmann equation, some simplified collision
models are introduced. Perhaps the most useful of these are the BGK model [2] and the simplifiedFokker-Planck model [3] . These collision models are easily incorpolated in the DA-CIP schemeby evaluating the collision terms on each characteristics in the Lagrange phase.
The collisional effects with the BGK model is examined for the bump-on-tail case. The colli-sion term is (§{)c = v(feq — f) » where v is the collision frequency and feq the local Maxwellian.The initial distribution function is chosen as
/(ar> W| 0) = - J _ ( % e - 2 / 2 + nb{e(-((v-Vo)/vo)V2) + c<-<H-Vo)/«o)V2)))(1 + Acos(^), (6)
v(2 7 r)where np = 0.9, rif, = 0.1, Vo = 4.5, vO = 0.5, A = 0.05, and k = 0.3. Figure 2 shows theevolution of the first mode of the electrostatic field. For collisionless case(z/ = 0.), the unstablemode grows exponentially until its saturates because of particle trapping. After saturation, theelectric fields undergoes oscillations at the trapping frequency [7]. In Figure 2, however, we cansee that more particles are detrapped and the oscillations are destroyed by increasing v.
Next, we investigated the collisional effects with a simplified Fokker-Planck model for thetwo beam instability case. The collision term is (g{)c = ^,{/3vf + D-^(//?)) , where j5 isthe collision frequency and D a diffusion coefficient. In this task, /3 is taken to have the form0 = VQ(3V2)3/2/(2V2 + u2)3/2, corresponding to Coulomb collision, where x means to take theaverage of x. D is given by D = /?u2//? from the energy conservation condition. Figure 3 showsthe results of the two-stream instability with the initial condition
f(x,v,0) = (2n)-1/2v2exp(-v2/2){l + Acos(kx))1 (7)
where A = 0.05, k = 0.5. The amplitude of the electrostatic field in Fig. 3 shows that the initialtransients are little affected by collisions, whereas the following profiles are damped in amountsdepending to vQ. The distribution function in Fig. 3 shows the two beams to coalesce filling upthe valley.
(c) the relativistic collisionless plasma simulationIn the investigation of the laser-plasma accelerators, the particles at relativistically high energy
should be considered. The physics of the relativistic collisionless plasma is described by (3). Wesolved the stimulated Raman scattering (SRS) case with the initial condition
/(*,!>*,0) = ( ( l -«)(27rT 1 ) - 1 / 2 exp(-^ 2 /2r 1 )+aCexp(-( 7 - l)JT2)){l+Acos{kex)),{$)
where a = 0.05, Tx = l5keV/mc2,T2 = 100keV/mc2, A = 0.01, ke = 1.2, and C is a normaliza-tion constant. The initial pump electromagnetic wave is taken as
Ey = E0cos(k0x) Bz =-^—^ cos(k0x) (9)
where the wavenumber &o is 2.4, the magnitude i?o is 0.32, and a>o = (1 + fco2)1/2, correspondingintensity is 1.8 x 10¹⁴W/cm2 for a 10.6/zra CO2 laser. With these conditions, the Forward SRS
- 7 3 -

JAERI-Conf 98-004
instability occurs involving three waves; the incident pump wave, a scattered electromagneticwave, and an electron plasma wave.
Figure 4 shows the time history of the energy exchange between these three waves. The 3Dsurface-representing distribution function in Fig.5 exhibits the acceleration of positive velocityparticles.
4 Conclusions
In this work we have shown the DA-CIP scheme can be applied to solve the the collisionlessplasma, the collisional plasma, and the relativistic collisionless plasma that describes a plasmawith a homogeneous background plasma of opposite charge. The DA-CIP code solved a numberof initial value problems stably, accurately, and efficiently. In principle, the DA-CIP schemecan be extended to solve more complicated problems such as problems with nonperiodic spa-tial boundary conditions, two- and three-dimensional problems, and problems with externalelectromagnetic field.
References
[1] T. Armstrong and D. Montgomery. Physics of Fluids, 12(10):2094-2098, 1969.[2] P. Bhantnagar, E. Gross, and M. Krook. Physical Review, 94:511, 1954.[3] S. Chandrasekher. Review of Modern Physics, 15:1, 1943.[4] C. Z. Cheng and G. Knorr. Journal of Computational Physics, 22:330-351, 1976.[5] A. J. Klimas. Journal of Computational Physics, 50:270-306, 1983.[6] T. Utsumi. CFD journal, 4(2):225-238, 1995.[7] T. Utsumi, T. Kunugi, and J. Koga. JAERI-memo, 09-115, 1997.[8] S. Wollman and E. Ozizmir. SIAM J. Numerical Analysis, 33(4):1377-1409, 1996.[9] T. Yabe and T. Aoki. Computer Physics Communications, 66(3):219-232, 1991.
[10] T. Yabe and et al. Geophy. Res. Lett., 22:2429-2432, 1995.[11] T. Yabe and F. Xiao. Nucl. Eng. and Design, 155:45-53, 1995.[12] S. I. Zaki and L. R. T. Gardner. Journal of Computational Physics, 79:184-199, 1988.
Velocity
Figure 1. The over-view of the distribution function showing the appearance of two-hole s t ructure
and its subsequent coalescence in the two-stream instability.
- 7 4 -

JAERI-Conf 98-004
l O " 3
I to-'
10'
10-'
v = 0.05
v = 0.10
v = 0.15
1...j.X.
m11
fjfi-0 20 40 60 80 100time
Figure 2. Evolution of the amplitude of the first electrostatic mode for the bump-on-tail instability
with BGK collision term.
L
1
ft!••-
- — i—1 • . i - - • '
1 i
. i . . . i i 1. i
Figure 3. Two beam instability. Evolution of the amplitude of the first and second electrostaticmode, and the distribution function compared at t=0, 80.
. . . . . . . . . I . . . . . . . . .-^ 1 1 '
\ i 1{ 1•
i
j l\l_-•H] |-/
A
\ p 7y •[/- \
7
f :...}..: i :.:.
1 f ]
0,007
0.004
a.ooi
00O3
|... k.. 1 \ l._. i.i
j Li
_..u
Iff 4 I I11-1/ jl-lj .U-/_; I . ..
i I !
..Miin mo xa *» wo «» 0 100 500 J » *M JDO «M
Energy of the Pump Waves Energy of the Scattered Waves Electrostatic Energy Kinetic Energy
Figure 4. Evolution of the energy of the pump wave, the energy of the scattered wave, the electro-static energy and the kinetic energy for the forward SRS.
t = ioo t=150
Figure 5. The 3D plot of the distribution function of the accelarated particles for the forward SRS.
- 7 5 -
JAERI-Conf 98-004
1 0. Correlations in a Partially Degenerate Electron Plasma
Junzo CHIHARA
Advanced Photon Research Center,
Japan Atomic Energy Research Institute,
Tokai, Ibaraki 319-11, Japan
ABSTRACTThe density-functional theory proves that an ion-electron mixture can be treated as a one-component liquid interacting only via a pairwise interaction in the evaluation of the ion-ion radialdistribution function (RDF), and provides a set of integral equations: one is an integral equation forthe ion-ion RDF and another for an effective ion-ion interaction, which depends on the ion-ion RDF.This formulation gives a set of integral equation to calculate plasma structures with combined useof the electron-electron correlations in a partially degenerate electron plasma. Therefore, it is im-portant for this purpose to determine the electron-electron correlations at a arbitrary temperature.Here, they are calculated by the quantal version of the hypernetted chain (HNC) equation. On thebasis of the jellium-vacancy model, the ionic and electronic structures of rubidium are calculatedfor the range from liquid metal to plasma states by increasing the temperature at the fixed densityusing the electron-correlation results.keywords: degenerate electron plasma, ionization, atomic structure, radial distribution
function, plasma, liquid metal
1 INTRODUCTION
In the standard theory, a liquid metal is treated as a one-component liquid interacting viaa binary effective potential, which is determined by the pseudopotential formalism; a pseudopo-tential is introduced either by first-principles calculations or by adjusting parameters involvedin model potentials to some experimental results. In this treatment, the ionic structure is deter-mined independently of the electronic structure in a liquid metal. Therefore, this usual methodto treat a liquid metal can not be extended to calculate the plasma structure, since we can notset up this kind of the pseudopotential for a plasma.
Previously, we have proposed a set of integral equations for radial distribution functions(RDF's) in an electron-ion mixture on the basis of the density functional (DF) theory in thequantal hypernetted (QHNC) approximation.1'2 The QHNC equations are derived from exactexpressions for the electron-ion and ion-ion RDF's in an electron-ion mixture: these exact ex-pressions are only formal results derived from the DF theory. Already, we have applied thisapproach to liquid metallic hydrogen,1 lithium,3 sodium,4 potassium5 and aluminum6 obtainingion-ion structure factors in excellent agreements with experiments. Recently, we have performeda first-principles molecular dynamics based on the QHNC theory for alkali metals, and obtainedstructure factors, where a small deviation between experiment and the QHNC result disappears.7
In a plasma such as produced by the laser compression for example, the ionic valency Z\and the electron-ion interaction veI(r) may vary over a wide range as its temperature and densitychange. As a consequence, it is significant in the treatment of plasmas that our method cancalculate these quantities in a self-consistent manner using the atomic number of the system as
- 7 6 -
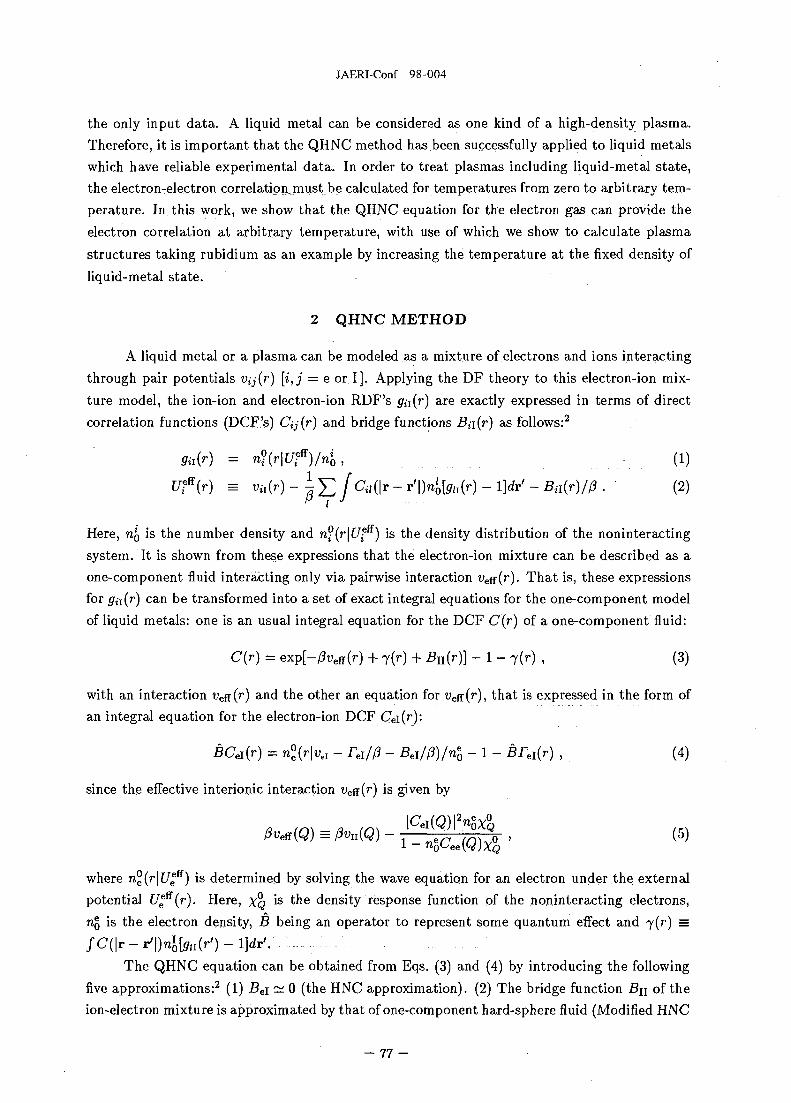
JAERI-Conf 98-004
the only input data. A liquid metal can be considered as one kind of a high-density plasma.Therefore, it is important that the QHNC method has been successfully applied to liquid metalswhich have reliable experimental data. In order to treat plasmas including liquid-metal state,the electron-electron correlation must be calculated for temperatures from zero to arbitrary tem-perature. In this work, we show that the QHNC equation for the electron gas can provide theelectron correlation at arbitrary temperature, with use of which we show to calculate plasmastructures taking rubidium as an example by increasing the temperature at the fixed density ofliquid-metal state.
2 QHNC METHOD
A liquid metal or a plasma can be modeled as a mixture of electrons and ions interactingthrough pair potentials Vij(r) [i,j = e or I]. Applying the DF theory to this electron-ion mix-ture model, the ion-ion and electron-ion RDF's gh(r) are exactly expressed in terms of directcorrelation functions (DCF's) Cij(r) and bridge functions Bn{r) as follows:2
9*(r) = nUr\Uf)/4, (1)
Uf(r) = vh(r) - I £ JCU{\T - r'\)nl0[9ll(r) - l)dr' - Ba{r)/§ . (2)
Here, UQ is the number density and nf (r|f/fff) is the density distribution of the noninteractingsystem. It is shown from these expressions that the electron-ion mixture can be described as aone-component fluid interacting only via pairwise interaction feff(r). That is, these expressionsfor <7ii(r) can be transformed into a set of exact integral equations for the one-component modelof liquid metals: one is an usual integral equation for the DCF C(r) of a one-component fluid:
C{r) = exp[-/Hff(r) + 7(r) + Bn(r)] - 1 - 7(r) , (3)
with an interaction ves(r) a-nd the other an equation for weff(r), that is expressed in the form ofan integral equation for the electron-ion DCF Cei(r):
= n°(r\vel - rd/0 - Bei//3)/n§ - 1 - Brel(r) , (4)
since the effective interionic interaction ueff (r) is given by
where «e(rl^eff) *s determined by solving the wave equation for an electron under the externalpotential U^(r). Here, x% 1S the density response function of the noninteracting electrons,HQ is the electron density, B being an operator to represent some quantum effect and 7(r) =fC(\r-r>\)nl[gn(r>)-l}dv'.
The QHNC equation can be obtained from Eqs. (3) and (4) by introducing the followingfive approximations:2 (1) J5ei c± 0 (the HNC approximation). (2) The bridge function Bu of theion-electron mixture is approximated by that of one-component hard-sphere fluid (Modified HNC
- 77 -

JAERI-Conf 98-004
Li (470 K)
QHNC
exp.
1.2
'5T<D
0.8
0.4
r =1 (i.6ixio
2000 oV (0.0251)500 eV
100 eV (0501)50 eV
1 eV (50.1)
r/aFigure 1: The ion-ion static structure factor Su(Q) for F i g u r e 2 . E l e c t r o n . e l e c t r o n correlations at the densityliquid Li at temperature 470 K: solid curve, the QHNC r< = 1 f o r t e m p e r a t u r e s f r o m x e V t o 2000 eV.result; o, experiment.10
approximation8). (3) Cee(Q) ~ -fivee(Q)[l — GPen(Q)] in terms of the the local-field correction(LFC) G*ett(Q) of the jellium model. (4) An approximate veX(r) is obtained by treating a liquidmetal as a nucleus-electron mixture9 in the form:
vel(r) = -ZAe2/r + J vee(|r - r'\)nbe{r')dr' ne
0) - (6)
where n^(r) is the bound-electron distribution and Hxc(n) the exchange-correlation potential inthe local-density approximation. (5) vu(r) is taken as pure Coulombic.
Under these approximations, a set of integral equations can be solved to determine theelectron-ion and ion-ion correlations together with the ionization and electron bound states.Figure 1 is an example calculated from this procedure: the structure factors of Li liquid. Thefull curve is the QHNC result, which exhibits an excellent agreement with experiment denotedby white circles. From this example, we can expect the QHNC method to give an accuratedescription of strongly coupled plasmas.
However, when we apply the QHNC method to plasmas, there occur the following prob-lems: for liquid metal where the electron gas is treated in the absolute zero temperature,the LFC involved in the electron-electron DCF has been calculated by many persons. Totreat a plasma, this electron-electron DCF must be evaluated at arbitrary temperature. Theelectron-density distribution under the external potential can be obtained by solving waveequation generally. However, at high temperature it is difficult to determine this densitydistribution from the wave equation, since it becomes nearly the classical Bolzmann factor:We(r| eff) = Sj/(€,-)|^>i(r)|2 => ngexp[-/3[/eff]. Here, we apply the QHNC equation to obtainthe electron-electron DCF,
with
ne(r|e) = n°e(r\UeS) =
/3UeK(r) = Pvee(r)- j Cee{\r-r'\)[ne(r'\e)-no]dr'
(7)
(8)
- 7 8 -

JAERI-Conf 98-004
T=1 eV
Z,-1.OOOO26
I"-5.05
A - 1 . 7 3
Figure 3: The electron-ion and ion-ion radial distribu-tion functions for liquid Rb: solid curve, the QHNCresult; ., the electron-ion RDF derived by the use of Fi*we 4 : T h e el«tron-ion and ion-ion RDF's together
the Ashcroft potential. with effective ion-ion interaction at temperature 1 eV.
which reduces to the well known HNC equation for classical electron gas in the high temperaturelimit. Here, the DCF for one-component system is defined by
n0Cee(Q) = 1/X°Q - - G(Q)]. (9)
The Fourier transform of the density distribution yields the following bootstrap relation for
Cee(Q) with combined use of Eqs. (7) and (8):
TQ[ne(r\e) - n0] = l/[l-ne0Cee(Q)X°Q] - (10)
The electron-electron correlation, that is, the electron density distribution around a fixed elec-tron is shown in Fig.2 calculated for a partially degenerate electron plasma at the density1.61 x 1024/cm3(rs = 1) varying the temperature from 1 eV to 2000 eV. Degeneracy is denotedby A = Ep/kTs, which is defined by Fermi energy over temperature. When the degeneracyis high such as temperature 1 eV, the Thomas-Fermi (TF) approximation denoted by full cir-cles gives the density distribution quite different from that calculated by the wave equation.When the temperature is increased to 100 eV, the TF result becomes identical to that fromthe wave equation except near the origin. When the temperature approaches 2000 eV, theelectron-electron correlation reduces to the classical one. From this calculation, we can obtainthe electron-electron DCF, which determine plasma properties in terms of the LFC G{Q).
As a first step, we don't perform a full self-consistent calculation as was done in liquidmetals. Instead, in order to obtain the ion-core structure and the electron-ion correlation, wetake the jellium-vacancy model, where the following three approximations are introduced in theelectron-ion interaction:
P»fi{r) = Mr) - J Cee5neldr' - J Cel6nudr', (11)
(1) The ion-ion RDF involved above is approximated by the step function: gn(r) = B(r — R), (2)the electron-ion DCF by pure coulomb force: Ce/(r) = — ftv^r), and (3) the last approximationis replacement of the electron-electron DCF by that of the one-component plasma: Cee (r) =C*ltt(r). Then, a problem to determine the electron-ion RDF becomes identical with the problem
- 7 9 -

JAERI-Conf 98-004
2-
1
•
• Wri t )
i
\
\
g
vHet t(r)
n(r)
T=3
Z,-1
r » 2
A - O
eV
. 27
.70
.674
-
1.00 1.03 2.05 5.281.00 1-27 3.80 6.55
- 4 •
S i "
' 4p I
4sJ1
OeVfree atom
2eVeV 3t
8 0.83
0.99
JV I5eV
10
5s4d
0.58
0.87
eV
0.11
0.29
0.47
22 eV
0.1
0.22
0.34 '
30 ©Vr/a
Figure 6: The temperature variation of outer boundFigure 5: The electron-ion and ion-ion RDF's together levels in the Rb ion in a plasma. Numbers attached towith effective ion-ion interaction at temperature 3 eV. bound levels denote the occupation numbers.
to determine the electron distribution around a fixed nucleus at the center of the spherical-
vacancy in the jellium background. By solving these integral equations, we can obtain the
electron-ion DCF, from which the ion-ion effective interaction is determined from the formula:
(12)
with the combined use of the electron-electron DCF. Here, we apply these equations to Rb atthe fixed density of normal liquid metal: temperatures are varied from 0 to 30 eV in order toinvestigate how the liquid metal state changes into the plasma state.
The electron-ion RDF of Rb liquid is plotted in Fig. 3 along with the ion-ion RDF. Theelectron-ion RDF from the QHNC method has an inner-core structure which comes from theorthogonality of the free-electron wave function to core-electron wave functions. It should benoticed that the usual liquid metal theory yields the electron-ion RDF, which has no innercore structure as plotted by full circles: this cut off of inner core structure brings about simpletreatment of liquid metals in the standard liquid metal theory. This clear distinction betweeninner- and core-structures is characteristic of a liquid metallic state and makes liquid metaltheory simple. At the temperature 0.05 eV, the electron-ion RDF has clear distinct inner-corepart and outer-core part. Even at temperature 1 eV as shown Fig. 4, this clear distinctionremains to show characteristic of a liquid metal: the ionization also remains unity and theion-ion effective interaction is almost same to that of liquid metal at the normal condition,although the ion-ion correlation becomes weak. Figure 5 shows that at the temperature 3 eVthe distinction between inner- and outer-core parts are disappeared and the ionization becomessignificant as 1.27. When temperature becomes 30 eV, the ionization becomes large like 6.55.
Figure 6 shows the temperature variation of the outer bound levels in plasma Rb at thefixed density of normal liquid metal. The 4s- and 4p-bound levels are plotted there correspond-ing to free atom, 0, 1, 2, 3, 5, 10, 22, 30 eV, respectively. As the temperature increases, thebound levels become deeper due to the decrease of bound-electron number, which makes thescreening effect weak. At the temperature 22 and 30 eV, new bound levels, 5s and 4d, appear.The occupation number at each level is shown at each level line in Figure 6. The ionization
- 8 0 -

JAERI-Conf 98-004
variation Z\ is shown in the top of Figure 6 as the temperature is increased.
3 DISCUSSION
Using the atomic number as the only input, we can determine ion-configuration and atomicstructure by the QHNC method, and obtain results in excellent agreement with experiments forthe case of liquid metals. It should be emphasized that in the QHNC formulation the innerelectronic structures around a fixed nucleus, such as the electron-ion RDF in the core region andthe bound-electron distribution nt>(r) of an ion in a liquid metal, are determined to be consistentwith the outer structure, that is, the surrounding ion and electron configurations. Therefore,the QHNC method can be applied to a high density plasma, where a usual pseudopotential cannot be constructed due to the fact the atomic structure in a highly compressed plasma stateis quite different from that in the vacuum. The QHNC method has been applied to a denseplasma Rb by increasing the temperature from 0 to 30 eV at the fixed density of normal liquidmetal. We have shown that the QHNC method produces a nonlinear pseudopotential applicableto plasma state. However, applicability of this method is limited to simple metallic system,where the bound electrons are clearly distinguished from the free electrons. Here, we used theJellium-Vacancy model as the first step. In the next work, we are planning to determine theionic structure, the electron-ion RDF using the self-consistent ion-ion RDF, as was done to treatliquid metals. The QHNC method can give the electron and ionic structures in a wide regionof temperatures and densities ranging from liquid-metal to plasma states along with the atomicstructure in a plasma.
4 REFERENCES
1. J. Chihara, Phys. Rev. A 33, 2575 (1986).2. J. Chihara, J. Phys.: Conderis. Matters, 8715 (1991);
J. Chihara and M. Ishitobi, Molecular Simulation 12, 187 (1994).
3. J. Chihara, Phys. Rev. A 40, 4507 (1989).4. M. Ishitobi and J. Chihara, J. Phys.: Condens. Matter 4, 3679 (1992).5. M. Ishitobi and J. Chihara, J. Phys.: Condens. Matter 5, 4315 (1993).6. J. Chihara and S. Kambayashi, J. Phys.: Condens. Matter, 6 10221 (1994).7. S. Kambayashi and J. Chihara, Phys. Rev. E 53, 6253 (1996).8. Y. Rosenfeld, J. Stat. Phys. 42, 437 (1986).9. J. Chihara, J. Phys. C: Solid State Phys. 18, 3103 (1985).
10. H. Olbrich, H. Ruppersberg and S. Steeb, Z. Naturforsch. 38A, 1328 (1983).
- 8 1 -

JAERI-Conf 98-004
11. Time-dependent H-like and He-like Al lines produced by ultra-short pulselaser
Takako Kato and Masatoshi KatoRonnie Shepherd*, Bruce Young*, Richard More* and Al Osterheld*,
National Institute for Fusion Science, Nagoya 464-01, Japan*V-Division, L-41, Lawrence Livermore National Laboratory, P.O. Box 808,
Livermore, CA 94550
ABSTRACTWe have performed numerical modeling of time-resolved x-ray spectra from thinfoil targets heated by the LLNL Ultra-short pulse (USP) laser. The targets werealuminum foils of thickness ranging from 250A to 1250 A, heated with 120 fsecpulses of 400 nm light from the USP laser. The laser energy was approximately0.2 Joules, focused to a 3 micron spot size for a peak intensity near 2xlO19 W/cm2.Lyoc and Hea lines were recorded using a 900 fsec x-ray streak camera.
We calculate the effective ionization, recombination and emission rate coefficientsincluding density effects for H-like and He-like aluminum ions using a collisional-radiative model. We calculate time- dependent ion abundances using theseeffective ionization and recombination rate coefficients. The time-dependentelectron temperature and density used in the calculation are based on an analyticalmodel for the hydrodynamic expansion of the target foils. During the laser pulsethe target is ionized. After the laser heating stops, the plasma begins to recombine.Using the calculated time dependent ion abundances and the effective emissionrate coefficients, we calculate the time dependent Lyoc and Hea lines. Thecalculations reproduce the main qualitative features of the experimental spectra.Keywords: Ultra-short pulse laser, H and He-like Al spectra,
time evolution of X-ray, ionization, recombination
1. IntroductionThe ultra-short pulse (USP) laser has been developed as a unique facility
able to create small plasmas at a known high density, near the initial soliddensity, during the 100 - 200 fsec laser pulse. However it is difficult to make goodmeasurements of x-ray spectra with corresponding time resolution.
The USP laser plasma can also be regarded as launching a precisely definedinitial value problem. It makes a plasma with rather few degrees of freedom whosesubsequent evolution can be measured and compared to theoretical calculations. Inthis paper we compare plasmas made from thin and thick Aluminum foils and tryto understand the observed x-ray emission.
2. Measurement of H-like and He-like Al ion spectraThe time evolution of the H-like and He-like Al ion spectra has been
measured for five different foils; 250 A, 500A, 750A, 1000A and 1250A[l]. Thetime evolution of i) Lyoc (Is - 2p) line, ii) Hea (Is2 - ls2p(1P)) together withintercombination (Is2 - Is2p (3P)) and satellite lines, and iii) Hep (Is2 - Is3p (XP))line are measured. A more detailed description of this experiment is given in
- 8 2 -

JAERI-Conf 98-004
Ref. 1. In Fig. 1 we show the time history of the intensity for Lyot, and Hea. Asseen from Fig. 1 the intensity decreases slowly for thin foil and rapidly for thickfoil respectively. Especially for Hea line, decay is very slow for 250, 500 and 750Afoils.
3. Scaling of expansion for plasma parametersIn order to analyze the time behavior of lines we need the time evolution of
the plasma parameters. We estimated the plasma parameters by the followingscaling laws.
The foil with the thickness do is heated by USP laser and absorbs a constantenergy assumed to be independent of do. For this reason,
Todo = constant (1)where To is the initial electron temperature for this foil. The foil expands withvelocity vo
vo = (ykTo/m)1/2 (2)then at time t the plasma width d and the density p are:
d ~ 2v0t (3)p = (podo/d) = (podo/2vot) a do
3/2/t (4)where po is initial density of the foil. The electron temperature at time t coolsthrough ideal-gas adiabatic expansion to
Te =T0 (p/po) 2/3= (To3/2do/2v0t) 2/3= (m/yk) V3 (T0d0/2t) 2/3 (5)
The electron temperature Te is independent of do because Todo = constant. Hoeverwhen the electron temperature is low, three body recombination raisestemperature. We assume Te =To (po/p)M as a general law of EOS for low Te. Weused y = 1.366 from QEOS which includes the heat released by three bodyrecombination. These equations apply only for d >> do. The exact formulae for neand Te which are used in our calculation are given in ref. 2.
As for the electron density, ne decreases rapidly for thin foil and for thickfoil ne decreases slowly.
4. Numerical model for time evolution of the emission linesi) Effective rate coefficients
In order to calculate the time dependent line emission we should solve timedependent rate equations with many levels. However because most of the excitedstates are considered in a quasi steady state, it is not necessary to solve thecomplete time dependent rate equations. We have derived the effective ionizationSeff, recombination aeff and emission rate coefficients 8 assuming the quasi steadycondition by solving a collisional radiative model (CRM) of H-like and He-like[3] Alions. We use these rate coefficients to solve the rate equation and calculate thetime dependent line intensities. The detailed description of these rate coefficientsis given in Ref. [2],
The effective emission rate coefficients are defined as follows,
e1 (i, j) = n2(i) A (i, j)/ne for nz (1) =1, nz+i(l) =0, (6)£' (i, j) = n, (i) A (i, j)/ne for n2 (1) =0, nz+l (1) =1, (7)
where A(i, j) is the radiative transition probability from the level i to the level j , nz(i)
- 8 3 -

JAERI-Conf 98-004
the population density of the level i of the ion with charge z. The emission ratecoefficients in purely ionizing plasma e' decrease at high density due to theexcitation and ionization processes. On the contrary the emission rate coefficientsin purely recombining plasma er increase for high densities at low temperatures.Therefore strong emission is expected in recombining phase at high densities.
ii) Time variation of line intensitiesThe line emissivity per volume at time t is derived with the ion abundances
and emission rate coefficients as follows,I(z,t) = n(z,t) ne(t) e
1 + n(z+l,t) ne (t) er (8)= ne (t) E n(z,t) e
where n(z) indicates the ion density of an ion with charge z. The detailed resultsfor time dependent ion abundances are given in Ref.[2]. Here we define 8 as theeffective emission rate coefficient including ion fraction at time t.
8 = n(z,t)/ £ n(z,t) e; + n(z+l,t)/ Z n(z,t) er (9)The observed line intensity from a uniform plasma is given by
F = e ne S dono /4K (10)where S is the surface area of the plasma. This equation means that the observedintensity is proportional to the initial foil thickness do and the quantity whichvaries with time is e and ne.
The emission rate coefficient e at time t is derived with ion abundances andeffective emission rate coefficients following the formula (9). The Hea emissionhas two peaks; one produced in the ionizing phase and the other in therecombining phase. The first peak is much larger than the second one due to thetime variation of ne. The contribution of excitation is dominant in the initial phasebefore 10 -1? s and that of recombination is dominant later. However since the firstpeak is produced in this early phase in a short period before O.lps, themeasurement can not resolve the first peak clearly. The observed intensities givenin Fig. 1 were measured by streak camera. The streak camera has a time resolutionas well a time delay. We have assumed the Gaussian type of response of thestreak camera with time delay of 5 ps and time resolution of 3 ps. The timehistory of the convoluted intensity is given in Fig. 2 for four different foils. Theeffective emission rate coefficients used in Eq.(8) are shown in Fig. 3.
5. Comparison with experiment and calculationWhen we compare our calculation to the experimental results, the time
behaviors of different thick foils agree qualitatively. The slopes in later phaseagree quite well as compared in [2]. In the case of 1250A the agreement is verygood in total. However the intensity in the early phase in our calculation isalways larger than the measurement except 1250A.
Since we do not know the initial temperature To we guessed it from the timebehaviour of the line. When we increase To H-like line intensity increasescompared to He-like line intensity. Our calculation shows higher intensity for Lyathan Hea although the experimental results show the contrary as shown in Figs. 1and 3. However if we decrease To to reduce Lya, ions disappear rapidly due to thelow temperature and then the Hea line in the recombining phase will decrease toorapidly compared to the experiment. We have an impression that Te or ne decays
- 8 4 -
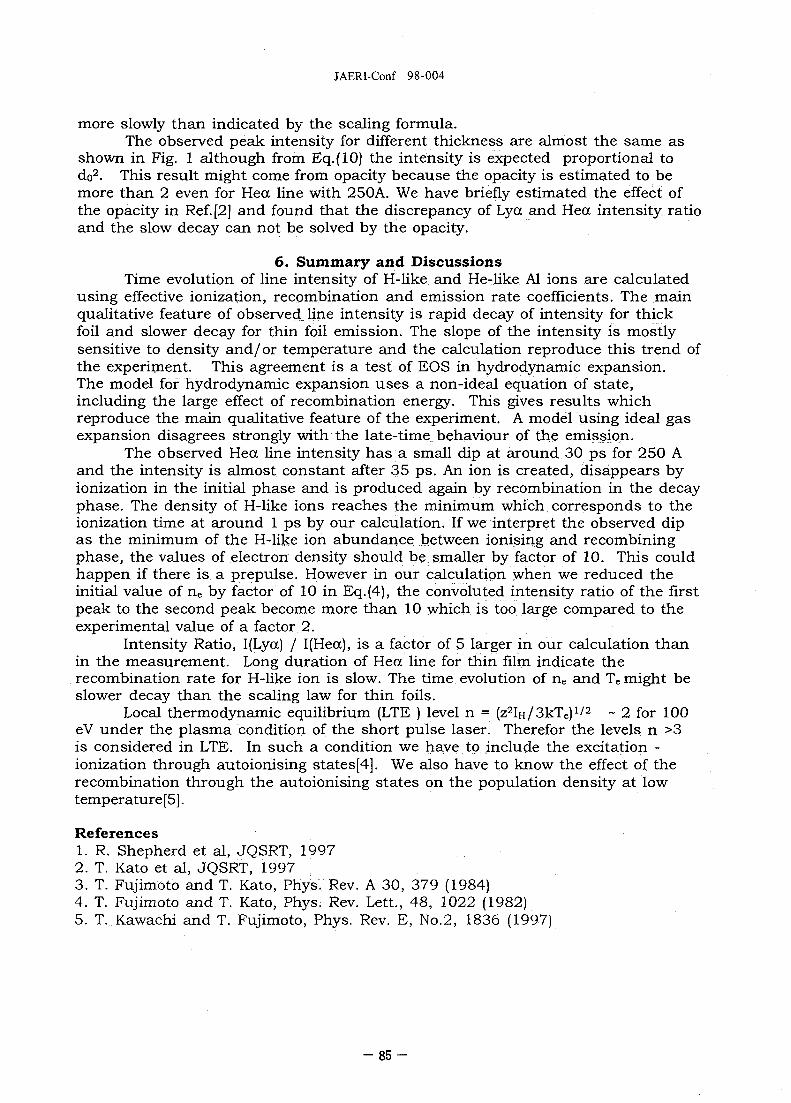
JAERI-Conf 98-004
more slowly than indicated by the scaling formula.The observed peak intensity for different thickness are almost the same as
shown in Fig. 1 although from Eq.(lO) the intensity is expected proportional todo2. This result might come from opacity because the opacity is estimated to bemore than 2 even for Heoc line with 250A. We have briefly estimated the effect ofthe opacity in Ref. [2] and found that the discrepancy of Lya and Heoc intensity ratioand the slow decay can not be solved by the opacity.
6. Summary and DiscussionsTime evolution of line intensity of H-like and He-like Al ions are calculated
using effective ionization, recombination and emission rate coefficients. The mainqualitative feature of observed line intensity is rapid decay of intensity for thickfoil and slower decay for thin foil emission. The slope of the intensity is mostlysensitive to density and/or temperature and the calculation reproduce this trend ofthe experiment. This agreement is a test of EOS in hydrodynamic expansion.The model for hydrodynamic expansion uses a non-ideal equation of state,including the large effect of recombination energy. This gives results whichreproduce the main qualitative feature of the experiment. A model using ideal gasexpansion disagrees strongly with the late-time behaviour of the emission.
The observed Hea line intensity has a small dip at around 30 ps for 250 Aand the intensity is almost constant after 35 ps. An ion is created, disappears byionization in the initial phase and is produced again by recombination in the decayphase. The density of H-like ions reaches the minimum which corresponds to theionization time at around 1 ps by our calculation. If we interpret the observed dipas the minimum of the H-like ion abundance between ionising and recombiningphase, the values of electron density should be smaller by factor of 10. This couldhappen if there is a prepulse. However in our calculation when we reduced theinitial value of ne by factor of 10 in Eq.(4), the convoluted intensity ratio of the firstpeak to the second peak become more than 10 which is too large compared to theexperimental value of a factor 2.
Intensity Ratio, I(Lyoc) / I(Hea), is a factor of 5 larger in our calculation thanin the measurement. Long duration of Hea line for thin film indicate therecombination rate for H-like ion is slow. The time evolution of ne and Te might beslower decay than the scaling law for thin foils.
Local thermodynamic equilibrium (LTE ) level n = (z^u/SkTe)1'2 ~ 2 for 100eV under the plasma condition of the short pulse laser. Therefor the levels n >3is considered in LTE. In such a condition we have to include the excitation -ionization through autoionising states[4]. We also have to know the effect of therecombination through the autoionising states on the population density at lowtemperature[5].
References1. R. Shepherd et al, JQSRT, 19972. T. Kato et al, JQSRT, 19973. T. Fujimoto and T. Kato, Phys. Rev. A 30, 379 (1984)4. T. Fujimoto and T. Kato, Phys. Rev. Lett., 48, 1022 (1982)5. T. Kawachi and T. Fujimoto, Phys. Rev. E, No.2, 1836 (1997)
- 8 5 -

Intensity (photons s*)
oX
Intensity (photons s"
COoX
3ere
w
9
I
§
s
ft
I;en
Intensity (Avb. Units)
o
o
8
S
.»•
0) 0>
f f5, w
- b
>sn§
oO
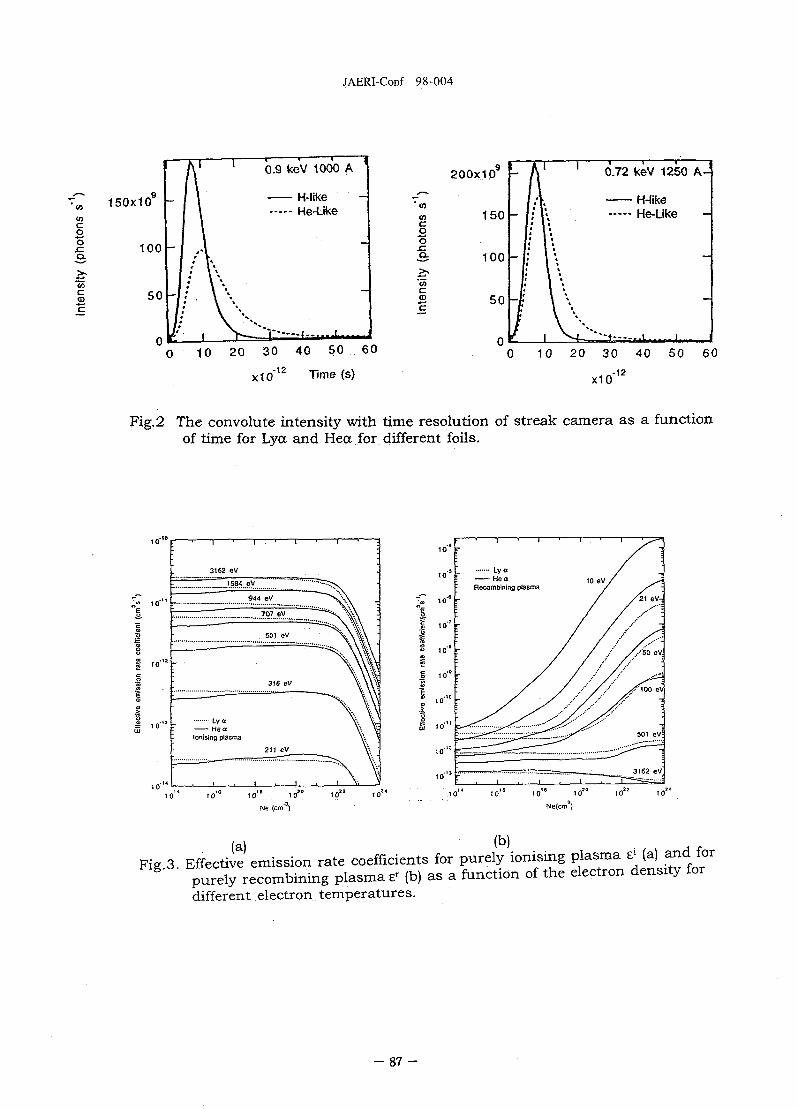
JAERI-Conf 98-004
inooQ.
c£
150x10" h
100h
50 h
A'
II
I ]n/I;
-///;//k i
1 0.9
\ \
A '**•\ \
keV 1000 A '
- H-Jike- He^Jke
——
—.« ! .
"co01ooa.
COc
c
200x109
150
100
50
n10 20 30 40 50 60
x1012 Time (s)
L A '
/A~ V V>I . 1 •
-f \\
1 0.72 keV 1250
H-likeHe-Like
A—
—
—
-
10 20 30 40 50 60
X10-12
Fig. 2 The convolute intensity with time resolution of streak camera as a functionof time for Lya and Hea for different foils.
(a) (b)\ -1
Fig.3. Effective emission rate coefficients for purely ionising plasma e1 (a) and forpurely recombining plasma er (b) as a function of the electron density fordifferent electron temperatures.
- 8 7 -

JAERI-Conf 98-004
12. Theory and Simulation of Ultra-short Pulse Laser Interactions
Richard MORE, Rosemary WALLING, Dwight PRICE, Gary GUETHLEINRick STEWART, Steven LIBBY, Frank GRAZIANI and Joann LEVATIN
Lawrence Livermore National LaboratoryLivermore, California, USA, 94550
ABSTRACT
This paper describes recent Livermore work aimed at building computationaltools to describe ultra-short pulse laser plasmas. We discuss calculations of laserabsorption, atomic data for high-charge ions, and a new idea for linear-responsetreatment of non-equilibrium phenomena near LTE.
Keywords : Ultra-short Pulse, Laser Interaction, Optical Properties, AtomicModels, Non-LTE Atomic Kinetics
INTRODUCTION
This paper will describe recent Livermore work aimed at buildingcomputational tools to describe ultra-short pulse laser plasmas. We will discusscalculation of optical phenomena, a semiclassical atomic model (SAM) for high-charge ions, and a new idea for linear-response theory of near-equilibrium non-LTEatomic dynamics.
I. OPTICAL PHENOMENA
At the LLNL USP laser we have measured target absorption as a function ofangle of incidence, laser intensity and polarization.(l) These experiments areperformed with 120 fsec pulses at intensities ranging from 1 0 ^ to 10*8 W/cm^. Wealso have begun to measure thin-foil transmission, a test of laser penetrationthrough a thin overdense plasma, and we are using Fourier Interferometry tomeasure the phase-shift of probe pulses reflected with various time-delays. Thisdata can accurately characterize the plasma expansion.
Because there is some surface expansion even during the 120 fsec heat pulse,our analysis includes a surface density profile, usually taken to be an exponential p =p 0 exp(-x/L), corresponding to an isothermal rarefaction. Because the targetmaterials are heated to temperatures ranging from 1 eV to more than 100 eV, thematerial properties, especially the optical properties, are dramatically altered fromthose known for cold matter. We cannot necessarily predict these high-temperatureoptical properties and want to determine them from the experimental data.
We analyze laser-target interaction experiments using a simple code forsolution of Maxwell equations in planar (1-D) geometry. The inputs to this code arethe scale length L for the surface expansion profile, the solid-density optical
- 8 8 -
JAERI-Conf 98-004
coefficients e i ° , £2°, the laser wavelength X, the angle of incidence 8, and the laserpolarization (s or p).
The code uses a matrix-multiplication method to solve Maxwell equations forlight interacting with the target. The optical coefficients are assumed to have theusual density-dependence,
[ ei + i£2 - 1 ] « p
so the code only requires the solid-density value ei° + i£2°.
Output from the code includes s- and p-polarized absorption, phase shifts andtransmission through thin targets. With appropriate choice of the inputparameters, the code achieves excellent agreement with experiment.
For aluminum angle-dependent absorption experiments, we find surfaceexpansions in the range 20 - 80 A during the 120 fsec laser pulse, depending ofcourse on the laser intensity. Absorption range from a few percent to about sixtypercent.
Absorption by thin layers of AI2O3 on aluminum substrates show remarkabletemperature variation of the dielectric properties of the oxide (the experimentaldata-set includes data from eight layer thicknesses ranging from a few Angstroms toabout 1 micron). At temperatures of a few eV the oxide is a very strongly absorbingmedium.
Fourier interferometry probes of aluminum surface expansion yieldexpansion velocities * 28 km/sec for a laser intensity near 1 0 ^ W/cm^. The dataanalysis uses the Maxwell code to match both s- and p-polarized phase shifts with asingle scale-length.
To interpret this FDI data, we have derived a general formula relating theexpansion scale length to the plasma equation of state,
L = [d(pcs)/dp]t (1)
where L is the scale-length, p is the density, cs is the isothermal sound speed, and t isthe time of the probe-pulse. Equation (1), which assumes adiabatic expansion of auniformly heated solid, is valid for any equation of state.
Continued development of the FDI technique offers several benefits: first, away to measure the equation of state of hot dense plasmas, and second, a way todetermine hydrodynamic expansion to remarkable precision (perhaps 5 %). For x-ray lasers based on flat targets, such hydrodynamic expansion controls the x-rayrefraction which will limit the gain length, and for this reason we believe it will bevery important to accurately understand and control the plasma hydrodynamics.
- 8 9 -

JAERI-Conf 98-004
II. SEMICLASSICAL ATOMIC MODEL
The semiclassical atomic model (SAM) is intended as a practical way togenerate atomic data for hydrodynamic applications. SAM does not have the highprecision required for spectroscopy, but it compensates for that by being rapid,flexible and more convenient than other approaches.
The basic idea is very simple. SAM imitates a quantum jj-coupled self-consistent field calculation of atomic structure but replaces the numericalcalculation of wave-functions by the use of closed-form WKB wave-functions.
This is possible because of two technical advances: first, an accurate WKBsolution of the Dirac equation^), and second, a method to compute matrix-elementsbetween WKB functions^). The WKB functions are known in closed form forCoulomb potentials, and so we approximate the electrostatic potential in the generalhigh-charge ion as a series of screened Coulomb potentials on radial shells definedby K-, L-, M-shell electrons. Then the screened charges are made consistent withthe charge density given by the WKB wave-functions.
In quantum mechanics, the 3s electrons (for example) have their largestcharge density in the M-shell region, but actually extend over a large radial range,sampling the potential in the K- and L-shell regions. The semiclassical rule is thatan electron of quantum numbers n, 1 extends from a minimum radius set by 1 to amaximum radius set by n. Study of quantum wave-functions shows the semiclassicalrule is reasonably accurate.
The SAM computer code is small, robust and reasonably accurate. The codeitself is about fifteen pages of FORTRAN. It requires a few milliseconds per ion,averaged over the entire list of 4278 ions (nuclear charge Z = 1 to 92, ion charge Q = 0to Z-l). The code is robust because it converges for all 4278 ions without failing.
To test the accuracy we compare SAM with quantum atomic structure codes.For the ionization potentials of the 4278 ions, the overall average error is 7 %.However large percentage errors occur only for neutrals or low-charge ions whichhave small ionization potentials. For ions with charges greater than about 10+ theionization potentials are always accurate to 1 or 2 %.
We have also compared one-electron eigenvalues from SAM with thosegenerated by a relativistic quantum self-consistent field code (J. Scofield supplied thecomparison data). Figure 1 shows one example of these comparisons. Thiscomparison shows that SAM is able to reproduce the important features of x-rayspectra without achieving spectroscopic accuracy.
Today SAM describes an isolated atom (ion) and provides electron energies.Our plan is to extend the code first to radiative properties (line-strengths), then toinclude plasma density effects in a finite-temperature context, and finally to addcollisional and autoionization processes to produce a non-LTE code.
The structure of the code permits use in either average-atom or detailedconfiguration modes, although the spectrum is always computed from jj-coupled one-
- 9 0

JAERI-Conf 98-004
electron eigenvalues. This approximation neglects term splitting and configurationinteraction and is most appropriate to high-Z ions. Because average-atomcalculations are simpler we plan to implement that method first.
III. TABULAR NON-LTE ATOMIC KINETICS
For all but the simplest atomic models, it requires very much computer time toperform detailed configuration NLTE calculations consistently coupled tohydrodynamic simulations. One new approach proposes using multiple effectivetemperatures and LTE opacities in order to imitate the main consequences of NLTE.(Busquet, (4)) However this is an intuitive model and we have no exact idea of itsaccuracy.
We propose to develop a systematic treatment of NLTE corrections to LTEbehavior in high-density plasmas.
General thermodynamic principles apply to near-LTE plasmas and can give usimportant consistency checks. For plasmas maintained in a near-equilibrium steadystate, the rule is that the rate of entropy production is minimized by the (NLTE)choice of ionic populations that compromise between between the temperatures ofthe different heat reservoirs (Prigogine theorem). For an ion in a hot plasma, theseheat reservoirs are free electrons and photon frequency groups. If we examine therate of entropy production near the steady state, we find symmetry relations(Onsager relations) that must be obeyed by any correct NLTE calculation. Finally,the fluctuation-dissipation theorem, gives a rigorous expression (Kubo relation) forthe non-equilibrium linear-response function as an average over equilibriumpopulations and cross-sections.
Some obvious applications of a near-LTE non-LTE theory are to the interactionof x-ray lasers with a hot plasma target; emission from ions near the surface of asemi-infinite medium, as in strong shock waves or Marshak (heating) waves; and thetypical opacity experiment performed by irradiating a foil sample confined in alaser-heated hohlraum. We also believe these methods will be useful for modelinghigh-density short-pulse laser target interactions, and even for planningexperiments to produce plasmas for x-ray laser experiments.
For a near-LTE atom(ion), the linear-response matrix Ry,v' c a n be defined by
JOcve - KV
a) Bv dv = Zv ' Rv.v' [ Av Av' 8TV' ]/4it (2)
where KVe , KV
a are emission and absorption opacities, Bv is the black-body photonintensity spectrum, Av and Av' are photon frequency group widths, and 8TV ' is theperturbation which causes the deviation from LTE, expressed as a change in radiationtemperature which applies over a photon group Av' centered at v'. The integral onthe left runs over the frequency group Av centered at v.
If the matrix Rv,v' *s tabulated, we can use the local photon frequencydistribution (in the form of photon group temperatures 8TV) to calculate ( K V
e - K va ) .
- 91 -

JAERI-Conf 98-004
Then together with the LTE opacities, which supply the sum KVe + KV
a, we have theinformation required for radiation transport.
We have formulated atomic kinetics for near-LTE steady plasmas and find thatthe rate of entropy production is given by a quadratic form proportional to
dS/dt = constant * Zv V Rv,v' Av AV 5TV 8TV> (3)
The atomic populations are those which minimze this quadratic form for fixedtemperature perturbations 8TV ' . According to the Onsager relation, the responsematrix Ry,v' must be symmetric
Rv,v' = Rv',v (4)
This relation is actually a nontrivial general consistency test for non-LTE codes andcalculations, and we plan to test whether it is obeyed by existing NLTE computercodes. Figure (2) gives a first test of Eq. (4), two scans through the matrix Ry.v'obtained from the screened hydrogenic average-atom model for an aluminum plasmaat density .001 g/cm^, temperature 50 eV. The two scans approximately agree, so thescreened hydrogenic model is approximately consistent with Eq. (4).
IV. SUMMARY AND CONCLUSIONS
We conclude with a list of useful tools (past, present and future) for ultra-shortpulse laser interaction research.
Existing tools:
- One-dimensional Maxwell equation code for optical properties- Inertial fusion code LASNEX (hydro accurate to perhaps 20%)- X-ray laser design codes- Atomic data sources (e.g., HULLAC code)
Tools in development today:
- Inline atomic/non-LTE models (SAM code, NLTE tables)- Hydrodynamics validated to 5 % by USP laser experiments- Advanced raytracing methods
Tools we will need in the future
- 2D, 3D Maxwell equation codes- X-ray raytracing, x-ray laser interaction physics- Heatflow validated by experiments- Special atomic data for special x-ray lasers
As we develop these tools, it will be important that they work together, that theoutput from one code be compatible with the input to another. As we discuss ourplans with the international community interested in short-pulse laser research, it
- 9 2 -

JAERI-Conf 98-004
may be equally important that we find ways for the scientists of differentlaboratories to work together.
Acknowledgement:
The author is very grateful to Dr. Keiji Tani of the JAERI Kansai ResearchEstablishment for assisting his participation in the Kyoto Workshop on ultrashortpulse ultrahigh power lasers.
Supported in part under the auspices of the U.S. Department of Energy by LawrenceLivermore National Laboratory under Contract No, W-7405-ENG-48.
References:
(1.) D. Price, R. More, R. Walling, G. Guethlein, R. Shepherd, R. Stewart and W. White,Phys. Rev. Lett. 75, 252 (1995).
(2.) R. More, J.Q.S.R.T. 51, 237 (1994).
(3.) R. More and K. Warren, Annals of Physics 207, 282 (1991).
(4.) M. Busquet, Phys. Fluids B5, 4191 (1993).
FIGURE CAPTIONS
Figure 1.) One-electron eigenvalues for thorium ions at various ionization statescalculated by a relativistic quantum self-consistent field theory and by thesemiclassical atomic model (SAM) code. The author is grateful to Dr. J. Scofield forproviding this comparison data.
Figure 2.) Scans of the linear-response matrix Ry,v' for an aluminum plasma atdensity .001 g/cm^, temperature 50 eV. One scan has varying v and the other hasvarying v'; the results approximately agree. The lowest figure shows the twoopacities (which are nearly equal for a very small perturbation) and indicates theperturbed photon group by a small box near 50 eV.
- 9 3 -

JAERI-Conf 98-004
100,000-3
T
cLU
SLU
ic"
LU
I<U
10,000 -
1,000 i
100
10
Relativistic Quantum Self-ConsistentField Eigenvalues (J. Scofield)2si/2> — — r r =
2p1/2, = = _ — — —2P3/2 _ = =
3 p , 3 d = = = ~ ~ s = 5 = =
4s, 4p, = = — = W4d,4f = _ = i S
5 s t 0 = = = " "
6s to =6h
Z = 90
-10 0 10 20 30 40 50 60 70 80 90Ion charge Q ->
100,000 -j-
10,000-
Semiclassical Atomic Model
1,000-
100
-10 0 10 20 30 40 50 60 70 80 90Ion charge Q -»
Figure 1.)
- 9 4 -

JAERI-Conf 98-004
30 x 1011
25x1011
20x1011
15x1011
10x1011
5x10¹¹
0
-5x101 1
-10x1011
-15x1O11
30x1011
25x1011
20.X.1011
15x1011
10x1011
5x10¹¹
0
-5x101 1
-10x1011
-15x1011
104
w 103
n£1
(0
< 102
101 L-
I I I
r
i i i i i i i
— i i i i i i i i i t
( I I I I I !
1 1 1 1 I I 1
10,-2
I 1 1 1
_J I I I I ) , I _J I I I I I
10°hv (keV) ->
Figure 2.)
- 9 5 -

JAERI-Conf 98-004
13. Modeling of collisional excited x-ray lasers using short pulse laser pumping
Akira Sasaki, Kengo Moribayashi, Takayuki Utsumi, and Toshiki Tajima
Advanced Photon Research Center, Kansai Research Establishment, Japan Atomic Energy Research
Institute, 25-1 Mii-minami-cho, Neyagawa-shi, 572, Osaka, JAPAN
Abstract
A simple atomic kinetics model of electron collisional excited x-ray lasers has
been developed. The model consists of a collisional radiative model using the
average ion model (AIM) and a detailed term accounting (DTA) model of Ni-like
Ta. An estimate of plasma condition to produce gain in Ni-like Ta (X=44A) is
given. Use of the plasma confined in a cylinder is proposed to preform a uniform
high density plasma from 1-D hydrodynamics calculations.
Keywords: x-ray laser, laser produced plasma, atomic kinetics
1. INTRODUCTION
Development of efficient, short wavelength x-ray lasers have been pursued for many years.
Especially, x-ray lasers in water window wavelength (20-40A) are interested for biological purposes.
Lasers in longer wavelength (=130A) will also be useful in lithography and material processing.
Despite successful demonstration of gain up to Ni-like Ta and W[l], present collisional x-ray lasers
require large pump energies. Reduction of the pump energy will make x-ray lasers much more useful
for industrial and scientific applications. This can be possible by the use of short pulse pumping, after
detailed understanding of the mechanism of lasing and optimization of experimental condition through
intensive theoretical and numerical investigations.
In this paper, modeling of electron collisional excited lasers using Ni-like ions is presented. We
have developed a simple atomic kinetics model of Ni-like Ta laser to determine temperature and
density of the plasma required to produce gain. Preliminary target design has also been made using
HYADES 1-D hydrodynamics code.
Soft x-ray gain is produced in 4d(3/2, 5/2) J=l and 4p(3/2, 3/2) J=0, 4p(l/2, 3/2) J=0 transitions of
Ni-like ions of high-Z elements. Two different schemes are proposed for efficient pumping. The OFI-
collisional excitation scheme is proposed by Lemoff[2]. They irradiated Xe gas target by a circularly
- 9 6 -

JAERI-Conf 98-004
polarized 1018 W/cm2, lOOfs laser pulse. Energetic electrons were created to ionize and excite Pd-like
Xe ions. Gain in 417A was demonstrated. The other method is the prepulse or multipulse technique.
The weak prepulse preforms a plasma with an appropriate density. The subsequent intense mainpulse
heats the plasma to excite the lasing level through electron collisional excitation, and to produce
population inversion. Recently lasing has been reported from Ne-like Ti[3] to Ni-like Ag[4] and Sm[5]
using this technique. Optimization of these methods using ultra short pulse laser as a pump source is
intereseted toward achievement a compact water window laser.
2. MODELING OF ATOMIC KINETICS
A simplified energy level diagram of Ni-like Ta is shown in Figure 1[6], The upper(4d) and
lower(4p) configuration consist of 18 and 12 spectral terms. These excited configurations are about
2keV above the ground state, and energy spread of spectral terms belong to 4d configuration is 120eV.
Total number of 3d94/ levels is 54. The collisional excitation rate from the ground state to 4d(3/2, 5/2)
J=l is exceptionally greater than to any other levels, therefore gain is expected for several transitions
to 4p levels. Not only 3d9n/ levels but inner shell excited levels such as 3s4/, 3p54/ are below ionization
limit and the energy levels are overlapped each other. We have to account for the population of
detailed levels for calculation of soft x-ray gain.
For the calculation of soft x-ray gain, calculation of abundance of Ni-like ion is indispensable. To
calculate ionization using the detailed term accounting(DTA) the model should include level structure
of other ionization stages. In complex ions ionization and recombination take place through several
channels. For example, 3d'4/ excited levels correspond to ionization limit of inner shell (3d'4s) or
double excited states of (3d84/n/) of Cu-like ion. Excitation Autoionization (EA) and Dielectronic
Recombination (DR) processes may change ionization balance significantly. Inclusion of these
detailed level structure make the atomic model huge. On the other hand the ionization balance is
coupled to other groval plasma characteristics through hydrodynamics motion and radiative transfer.
The model should be coupled with hydrodynamics or particle codes, development of simple
approximated methods have practical importance. Therefore we have divided the model into two parts,
a simple model to calculation of ionization balance and a detailed model of Ni-like Ta.
We have developed a collisional radiative model based on Wevependent average ion model (AIM)
[7,8] to calculate ionization of the Ta plasma. Energy levels and rate coefficients are calculated using
screened hydrogenic approximation, which gives most of ionization energies of Ta ions within 20%
accuracy without detailed knowledge of atomic structure. In the AIM, instead of calculating
populations of each level, average number of electrons in each nl shell is calculated. An advantage of
the model is, in principle, this model includes effects of multiple excited levels and inner shell excited
levels. On the other hand, ion abundance nor population of any specific level can not be inferred from
the results of AIM except when the system is close to equilibrium state(LTE). Using this model, the
- 9 7 -

JAERI-Conf 98-004
Energy [keV]
A 3p4p(3/2, 3/2):
2.1
2.0
1.9
1.8
1.7
3p4p(3/2,1/2)'
3p-4pinner shellcollisionalexcitation
3d4f(3/2, 5/2)
71 - 85Again by
photopumij3d4d(3/2, 3/2jJ=0 '
J=1
26.8A
3d4d(3/2, 5/2)3d4d(3/2, 3/2)
3d4d(5/2,5/2)3d4d(5/2, 3/2)
i3d4f(3/2, 7/2)53d4f(5/2,7/2)
3d4f(5/2, 5/2)
3d-4f resonancelinestrong photoexcitation
T3d-4d collisionalexcitation
Iradiative decay
N
ground state 3d'0
Figrue 1 Energy level diagram of the Ni-like Ta laser.
iondensity=1018[1/cm3]
103 10"Te[eV]
Figure 2 Temperature dependence ofavereage charge of Ta.
iooor
'100 r
<D
£ 10:
3-3 transitions
T =1.5keV (a)
20
15
1 0 •
I
(b)
1
........• — •
J - • ' . — •
3-3 trans
. . . .
5PS5BE-,
n
ntions
=3.3x10
. . . .
ansitions
1 8 1/cm-
e=45n |/0.15 ~
111111mm
Ni-like ion ground state density [1/cm
2 3 4 5 6Te [keV]
Figure 3 Density(a) and temperature(b) dependence of gain.#140 4d(3/2, 3/2) J=0 - 4p(3/2, 1/2) J=1, 44.0A#189 4d(3/2, 3/2) J=0 - 4p(5/2, 3/2) J=1, 49.9A#470 4p(3/2, 3/2) J=0 - 4s(3/2,1/2) J=1, 58.7A#185 4d(5/2, 5/2) J=2 - 4p(5/2, 3/2) J=1, 74.5A#515 3d4f(5/2, 7/2) J=2 - 3p4f(3/2, 7/2) J=2, 28.6A#192 3d4p(3/2, 3/2) J=0 - 3p4p(5/2, 3/2) J=1, 26.8A#474 3p4s(3/2, 1/2) J=1 - 3s4s(1/2, 1/2) J=0, 23.3A
- 9 8 -

JAERI-Conf 98-004
average charge of Ta plasma as functions of density and temperature as shown in Figure 2(a). For ion
densities of 10" to 1020 I/cm3, the temperature required to produce Ni-like ions (Ta45t) is found to be
1.0- 1.5keV.
The steady state gain calculated using the atomic model of Ni-like Ta in Figure 1 is shown in
Figure 3. In the figures, density of ground state of Ni-like ion is assumed to be 0.15 of ion density, and
the average charge is assumed to be 45. Gain of more than 10 I/cm is calculated in 4d(3/2, 5/2)J=0 -
4p(3/2, 1/2)J=1 transition for moderate densities which is consistent with experimental
observations!!].
Using this model we can calculate gain for all transitions in Ni-like Ta. Positive gain is obtained for
not only in the usual lasing transitions but between other 4/ levels and inner shell excited levels. 4f
levels are excited by strong photo pumping as well as electron collisions. The resonance transition
probability from 4f to ground state is large. However in the case of high densities the optical depth of
this line could become large. Due to the effect of line trapping the population in 4f levels could be
increased to produce population inversion between 4d-4f[9]. It is also found that some of the inner
shell excited levels such as 3p4p(3/2, 3/2) J=0 are excited by strong electron collisions leading gain in
3-3 transitions. Emission from the inner shell transitions are observed in 2-2 transitions in Ne-like
system and possibilities for lasing had been discussed[10]. Gain of 3-3 transitions in the present
calculation is one order of magnitude smaller than usual 4-4 transitions, however the gain could be
increased using transient pumping scheme with which very large gain in various 4-4 transitions had
been observed. Wavelength of 3-3 transitions are almost 1/2 of 4-4 transitions as shown in Figure 4,
and are inside the water window region with Nd (Z=60). Requirement of large pump energies to
obtain lasing in short wavelength with Ni-like ions might come from the fact that difficulty to obtain
200
150
fioo
45 50 55 60 65 70 75
Figure 4 Wavelength scaling of 4-4 and 3-3 transitions of Ni-like ion.
- 9 9 -

JAERI-Conf 98-004
high temperature to produce Ni-like ions of high-Z elements. If we made use of 3-3 transitions, water
window laser would be obtained using smaller pump energies.
3. MODELING OF TARGET
In this section, methods to preform plasma with a sufficient density to produce gain of Ni-like
collisional excited lasers are examined using a 1-D hydrodynamics code. Several schemes such as use
of high pressure gas filled targets, foam targets, and use of plasma confined in a cavity are considered
to be useful to produce a uniform, long scale length, sub-critical density plasma. We considered the
plasma produced inside a cylinder target as schematically shown in Figure 5. In this scheme, firstly, a
plasma production laser irradiates and ablates the inner surface of the cylinder. The ablated plasma
converges to the center of the cylinder. Secondly, a short-pulse intense laser pulse is focused to the
central region to heat the plasma to successively ionize the medium ions to Ni-like stage, and to excite
them to lasing levels.
Density and temperature of the preformed plasma has been estimated using HYADES code as
shown in Figure 5. Calculations were carried out for the laser intensity of 10l2W/cm\ wavelength of
1.06|im, and pulse duration of 0.5ns. After 2ns from the beginning of the laser pulse, the plasma
converged at center of the cylinder. At 5ns, the central region is filled with uniform plasma with a
density of 0.1g/cm3.
4. SUMMARY
1mm
plasma production laser
Figure 5 Schematic diagram of a plasmaconfined in a cylinder.
0.005 0.01r[cm]
0.015
Figure 6 Density profile of the plasmaconfined in a cylinder.
- 1 0 0 -

JAERI-Conf 98-004
Simple atomic kinetics and hydrodynamics calculations showed possibility to produce gain in Ni-
like Ta by pumping a preform plasma confined in a cylinder. A detailed atomic model which can
make more quantitative estimation of soft x-ray gain is under development. Application of the codes
to transient pumping x-ray lasers using ultra short pulse laser pumping is projected to deteremine the
optimum pulse duration and the minimum pump energy.
References
1. BJ.MacGowan, S. Maxon, L.B.DaSilva, C.J.Keane, D.L.Mathews, A.L.Osterheld, J.H.Scofield,
G.Shimkaveg, and G.F.Stone, Phys. Rev. Lett., 65, 420 (1990).
2. B.E.Lemoff, G.Y.Yin, C.L.Gordon III, C.PJ.Barty, and S.E.Harris, Phys. Rev. Lett., 74, 1574
(1995).
3. P.V.Nickles, V.N.shlyaptsev, M.Kalachnikov, M.Schnurer, I.Will and W.Sandner, Phys. Rev.
Lett., 78, 2748(1997).
4. J. Zhang, A.G.MacPhee, LNilsen, J.Lin, T.W.Barbee, Jr., C.Danson, M.H.Key, C.L.S.Lewis, D.
Neely, R.M.N.O'Rourke, G.J.Pert, R.Smith, GJ.Tallents, J.S.Wark, and E.Wolfrum, Phys. Rev.
Lett, 78, 3856 (1997).
5. J. Zhang, A.G.MacPhee, J.Lin, E.Wolfrum, R.Smith, C.Danson, M.H.Key, C.L.S.Lewis, D.Neely,
J.Nilsen, GJ.Pert, GJ.Tallents, and J.S.Wark, Science, 276, 1097(1997).
6. A.L.Osterheld, preivate communication.
7. T. Nishikawa, M.Nakamura, H.Takabe, and K.Mima, J. Plasma and Fusion Res. 145, 66(1992).
8. F.Perrot, Phys. Scripta, 39, 332(1989).
9. J.Nilsen, H.Fiedorowicz, A.Bartnik, Y.Li, P.Lu, and E.E.Fill, Opt. Lett., 21,408(1996).
10. G.D.Enright, D.M.Villeneuve, J.Dunn, H.A.Baldis, J.C.Kieffer, H.Pepin, M.Chaker, and P.
R.Herman, J. Opt. Soc. Am, B8,2049 (1991).
- 101 -

JAERI-Conf 98-004
14. Optical Properties of Cluster Plasma
Yasuaki KISHIMOTOt'tt, Toshiki TAJIMAt-*, Mike C. DOWNER*
] Kansai Research Establishment,Advanced Photon Research Center
ff Naka Fusion Research EstablishmentJapan Atomic Energy Research Institute,
Naka, Ibaraki, 311-01 Japan
* Department of Physics, Institute for Fusion StudiesUniversity of Texas .Austin, Texas 78712
Abstract
It is shown that unlike a gas plasma or an electron plasma in a metal, an ionized clustered
material ("cluster plasma") permits propagation below the plasma cut-off of electromagnetic
(EM) waves whose phase velocity is close to but below the speed of light. This results from
the excitation of a plasma oscillation mode (and/or polarization mode) through the cluster
surface which does not exist in usual gasous plasma. The existence of this new optical mode,
cluster mode, is confirmed via numerical simulation.
Keyward : High Power Laser, Cluster Plasma, Surface Mode, Polarization Mode, X-Ray
Generation, Stochastic Motion, Particle-In Cell Simulation,
- 1 0 2 -

JAERI-Conf 98-004
I Introduction
The properties of clustered materials have attracted interest for a long time (e.g. [1], [2]).
Recently its interest has heightened, in part, due to the technical developments of nanotechnology
and nanoparticles (e.g. [3], [4]) and, in part, due to irradiation of ultrashort femtosecond laser
pulses (e.g. [5]-[8]). In particular, it is known that a clustered plasma can absorb a significant
amount of laser energy through high power laser-cluster interaction and that highly ionized, very
high temperature micro-plasmas are produced. Such a cluster plasma is found to emit a copious
amount of intense X-ray than a comparable gas and/or uniform solid-like plasma [9] and, more
recently, to eject ions with substantial kinetic energy (up to lMeV) [10]. So far, although many
interests are addressed to the high power nonlinear regime where the laser amplitude is high
(i.e. «o = eA/mc2 > l)(e.g. [7], [11]-[12]), not only the above prominent features, but also
fundamental optical properties, i.e. propagation and absorption in the linear regime have not
been studied.
In this paper, we investigate the optical properties when a transverse electromagnetic (EM)
field is irradiated onto cluster material and/or cluster plasma. In particular, we point out that
the EM field can propagate in a cluster plasma below the plasma cutoff in the linear regime,
showing the existence of a new optical branch. We found that this results from the excitation
of plasma oscillation modes (and/or polarization modes) which are coupled with the transverse
EM field through the existence of a cluster surface. We performed a numerical simulation of the
laser-cluster interaction and confirmed that this prominent feature actually takes place.
In Sec.2, we derive the linear dispersion relation of the laser-cluster interaction and describe
its properties. In Sec.3, we present our numerical simulation to confirm pur theory. Concluding
remarks are given in Sec.4.
II Dispersion Relation of Laser-cluster Interaction
We here consider a fully ionized cluster plasma with the uniform electron density inside the
cluster. Let pc be the packing ratio, i.e. the ratio of the volume occupied by all the clusters to the
entire volume. Since our interest is focused on short pulse laser irradiation, ions in the clusters
are assumed to be immobile. A linearly p-polarized (in the /-direction) plane electromagnetic
wave with frequency u> propagating in the -direction is irradiated onto this plasma. We assume
that the wavelength of this electromagnetic wave A = 2ic/k is much greater than the (typical)
cluster radius a, i.e. A > a. The Maxwell equation is
92 E
1#2E**du\ m
where Ey is the laser electric field oscillating with frequency u>. The current density (Jy) is
averaged over the spatial wavelength of the electromagnetic wave and (Jy) = ~(ne)ey where
- 103-
JAERI-Conf 98-004
y = dydt, and (ne) is the average electron density and may be written as (ne) = pcne, where
ne is the local electron density inside the clusters (ne = Zrii, where n{ is the immobile ionic
density).
The dynamics of the electron displacement y is dictated by the electromagnetic field of
course, but also now in a cluster, by the induced polarization within the cluster. In an ordinary
plasma, polarization in the direction (y) of the electric field of the EM wave does not happen,
though polarization in the direction (a;) of the propagation of the EM wave can happen in the
intense regime (and has been exploited for acceleration [13]). However, for a cluster this situation
fundamentally changes due to the surface charge induced polarization in the y-direction. Because
of this polarization, there arises a strong restoring force due to plasma electron space charge,
which is not too different from to the longitudinal plasma charge restoring force. The equation
of motion of an electron in the ^/-direction is given by
where u>p == (47re2ne/m)1/f2 is the plasma frequency for the cluster density, / is a geometrical
factor of order unity (unity for slab clusters), and 7 denotes the damping rate of plasma oscilla-
tions, which may lead to wave absorbtion. The displacement y produces a polarization current
{Jy) and then Eq. (2) is coupled with Eq. (1), obatining the dispersion relation of EM waves in
a cluster plasma as
n\k,u) =C-^- = l- 2 ?* • , (3)u>2 u 2 — fu;2 + vyw '
where n(k,u>) is the index of refraction.
The dispersion relation of Eq. (3) is shown in Fig.l both in (fc,u;) and (ra,u>) space and
has one fundamental difference from that for a gaseous (or metallic) plasma, i.e. the term in
the denominator of the second term on the right-hand side, —fa>p. This term arose from the
transverse restoring force due to the space charge on the surface of the clusters. Because of
the presence of this term, Eq. (3) now yields two branches in the dispersion relation and a new
branch emerges that has a real frequency below the plasma cutoff as seen in Fig.l. By neglecting
the damping term in Eq. (3), we obtain two roots in the small wavenumber regime as
/ l _ a , _ a ( 5 )
and those in the large wavenumber regime as
w2 ~ c2k2 + pu* , (6)
u2^f<4 • (7)
Here both Eqs. (4) and (6) are the upper branch and correspond to the well-known EM wave
dispersion relation in the presence of a plasma, while both Eqs. (5) and (7) emerge as a new
- 104-

JAERI-Conf 98-004
lower branch. The most striking feature of this new branch is the emergence of a propagating
EM wave below the plasma cutoff (in the present case w = y/f + pu>p). This branch has a
phase velocity close to but less than the speed of light, vvh = C/A/(1 + p//), and a resonance at
u = y/Ju)p.
Although in the present derivation we considered phenomenological damping 7, no kinetic
affect is included. However, it can be shown that this wave doesn't suffer from Landau damping
in the low k regime (even though vph < c), while it damps near the resonance similar to the
mechanism of cyclotron damping [14]. This is because the restoring force due to clusters does
not allow ballistic motion to yield the Landau pole (w - kv)~l. This situation is similar to
the Alfven wave [15] in which the restoring force is magnetic tension, while the phase velocity
is typically VA <C C. There is a narrow stop band between \/Ju>p < u < y/f + pwp. When
the EM waves are injected onto the cluster plasma, the reflection coefficient R and also the
transmission coefficient 1 — R can be obtained in terms of the complex refractive index [ Eq. (3)
] by E(w) = |(n - !)/(» + 1)|2 = [(nT - I)2 + n2] / [(nr + I)2 + n2], where n = nr(w) + infa).
Ill Simulation of Laser-Cluster Interaction
Here, we perform a 2D fully relativistic electromagnetic PIC simulation of laser-cluster in-
teraction to confirm the theory we presented in Sec.2. The configuration of the simulation
(0 < x < 1524 and 0 < y < 256 ) is shown in Fig.2 (a), where the grid size is Aa; = Ay = 1 in
normalized units. A cluster is modeled by a fully ionized constant density plasma column in the
(«,?/)-plane occupying an area of radius a. Such a cluster plasma is uniformally distributed in
the region 800 < x < 1200 with a packing ratio of p ~ 0.31(a = 10) as seen in Fig.2. Note that
the ions are immobile and each electron is initially distributed in the same position as the ion.
We assume that the p-polarized laser field which is spatially localized in the x-direction modeling
an urtrashort pulse laser, but uniform in the y-direction as seen in Fig.2. The wavelength is
A = 45TT SO that the condition A >• a is satisfied. In the simulation, the cluster density is chosen
to ne/nc ~ 64 (nc = mu>2/4ire2 : the cut-off density) and then the average electron density be-
comes {ne)/nc ~ 19.4. The electron skin depth inside the cluster is Se = u>p/c ~ 2.8. Therefore,
the cluster plasma is sufficiently below the cut-off density so that the laser field usually would
not penetrate into a plasma with same average density. The normalized laser amplitude is given
by ao ~ 0.022 to simulate the linear regime and the ratio of the electron thermal velocity ve to
the osillation velocity vos is ve/vos ~ 0.2.
The field pattern of Ey at y = Ly/2, i.e. Ey{x,y = Ly/2), is illustrated in Fig.3 (a)-(e) for
different times together with the two dimensional one of .E -field at t = 40 which corresponds
to Fig.3 (a). After the laser pulse hits the lefthand side boundary of the cluster (x ~ 800),
although some part is reflected at the boundary, the laser pulse is found to penetrate into the
cluster and to come out from the righthand side, clearly showing the optical branch described in
- 105 -

JAERI-Conf 98-004
Sec.2. During the propagation in the cluster, the laser amplitude is found to decrease showing a
strong damping as we discuss later.. In order to confirm the theory that the transmission results
from the polarization in the y-direction through the cluster surface, in Fig.4, we also show the
result when a .s-polarized laser pulse is irradiated in the same manner. As is clearly seen, the
laser pulse is completely reflected at the LHS without transmission as occured in the p-polarized
case.
Figure 5 shows the time evolution of the electromagnetic energy in the system and kinetic
energy of cluster electrons for the p and .s-polarized case corresponding to Figs. (3) and (4). In
the case of the -polarized wave, a significant portion of the laser energy (about 60 %) is absorbed
by the cluster electrons during the transmission. On the other hand, no absorption is observed
in the case of the s-polarized wave. The dashed line in Fig.5 also shows the p-polarized case, but
for smaller packing ratio (pc — 0.2) keeping the average density (ne) constant. The absorption
rate is reduced when the ratio a/A, i.e. [cluster radius)/[laser wavelength] becomes small. This
is considered as follows. When a <C A, there is no variation of the electric field strength in one
cluster. Therefore, the polar ization and the corresponding plasma oscillation are well denned
because of the splitting of the time scale, u>p > c/2a ^> u. On the other hand, when a < A, i.e.
when the cluster size is not neglected compared with the laser wavelength, the plasma oscillation
is affected by the propagation of the laser pulse because of the relation OJV > c/2a > w and the
adiabaticity of the plasma oscillation relative to the laser propagation becomes worse. Then
stochasticity of the electron motion is enhanced and as a result the absorption rate increases.
IV Concluding Remarks
In this paper, we present a new optical mode, i.e. cluster mode, where a transverse EM field
can propagate below the plasma cut-off frequency and this mode is confirmed via numerical
simulation. This results from the excitation of a plasma oscillation mode (and/or polarization
mode) through the cluster surface which does not exist in usual gasous plasmas. Many applica-
tions can be derived from the properties of the new branch, because the phase velocity is smaller
than the speed of light. We discuss these applications in a different paper. It is important to
emphasize that the current theory is linear and that nonlinear physics should play an important
role in the interaction between the cluster plasma and laser ant will be a focus of future work.
Furthermore, although we initially assume a fully ionized cluster plasma, the formation of a
cluster plasma where the ionization process is taken into account is important. Also collisional
processes will significantly affect the absorption process. This will be examined in furture works.
- 106-

JAERI-Conf 98-004
V Acknowledgments
We would like to acknowledge Mr. K. Nakagawa and Mr. H. Watanabe for supporing the
simulation, and Prof. Takuma for fruitful discussion. The work was supported in part by the
U.S. DOE.
Reference
1. A. Kawabata and R. Kubo, J. Phys. Soc. Jpn. 21, 1765 (1966).
2. R.H. Doremus, J. Chem. Phys. 40, 2389 (1964).
3. H.W. Kroto, J.R. Heath, S.C. O'Brien, R.F. Curl, and R.E. Smalley, Nature 318, 162
(1985).
4. M.F. Becker, J.R. Brock, and J.W. Keto, U.S. Patent #5, 585, 07.0 (1996).
5. A. McPherson, et.al. Phys. Rev. Lett. 72, 1810 (1994)
6. T. Seidman, M. Ivanov, and P.B. Corkum, Phys. Rev. Lett. 75, 2819 (1995).
7. T. Ditmire, T. Donnelly, R.W. Falcone, and M.D. Perry, Phys. Rev. Lett. 75, 3122
(1995).
8. E. Snyder, S. Buzza, and A. Castleman, Phys. Rev. Lett. 77, 3347 (1996).
9. T. Donnelly, et. al, Phys. Rev. Lett, 76, 2472 (1996).
10. T. Ditmire, J.W.G. Tisch, et. al. Nature 386, 54 (1997).
11. M. Rosenberg and N.A. Krall, Phys. Plasmas 3, 644 (1996).
12. S. Vladimirov and 0, Ishihara, Phys. Plasmas 3, 444 (1996).
13. T. Tajima and J.M. Dawson, Phys. Rev. Lett. 43, 267 (1979).
14. S. Ichimaru, S., Statistical Plasma Physics, (Addison-Wesley, Reading, MA, 1992).
15. H. Alfven, Nature 150, 405 (1942).
- 107 -

JAERI-Conf 98-004
(a) CO (b)
fast mode
stop band
cluster mode•
1 1+P/f n
Fig. 1 Linear dispersion relation in the (A;,u;)-plane (a) and (ra,w)-plane of a transverse electro-
magnetic field and cluster plasma interaction, n is the refractive index, p is the packing
fraction, and / is the geometrical factor of order unity.
200
100
0
tfeftSeflONW •—00600000660 (a)66000000060cdeoooeoce® ne(x,y)oocoeoooeeo66000000000 -(-cluster66000000000•eeoeeoocce .
500 iooo 1500
1000 1500
Fig. 2 Configuration of the simulation : (a) contour plot of the initial Ey field (^-polarized field)
and density distribution of the clusters in the (x, j/)-plane, (b) initial field pattern of Ey(x)
at y(= Ly/2) = 128.
- 108-

JAERI-Conf 98-004
00
XxXw
n 1O.I
o.o
0.1
0.0-0.1
0.1
0.0
-0.1
0.1
0.0-0.1
0.1
0.0
-o.r
L(a)
-(b)
r
[ (c)
L(d)
- (e)
A
- A A \ A - •^ V V \
t=60 A '
_____ r\ A A /1 A A =v y / ^ j
i . . . . i . . . . i •
t=80 A A '
-~\ /A / \ / \ y——A /\ A A -~-———^- ~ N ^ \^/ yy \ ^ V W W ^ -^^ :
t=100 i
. ' . . i . . . r i , , . . i • •
t=120 J
0 500 1000 1500
Fig. 3 Field pattern of Ey(x) at y = Ly/2 for different time steps. Note that the time is
normalized by a)"1 where up is the plasma frequency averaged over the system.
- 1 0 9 -
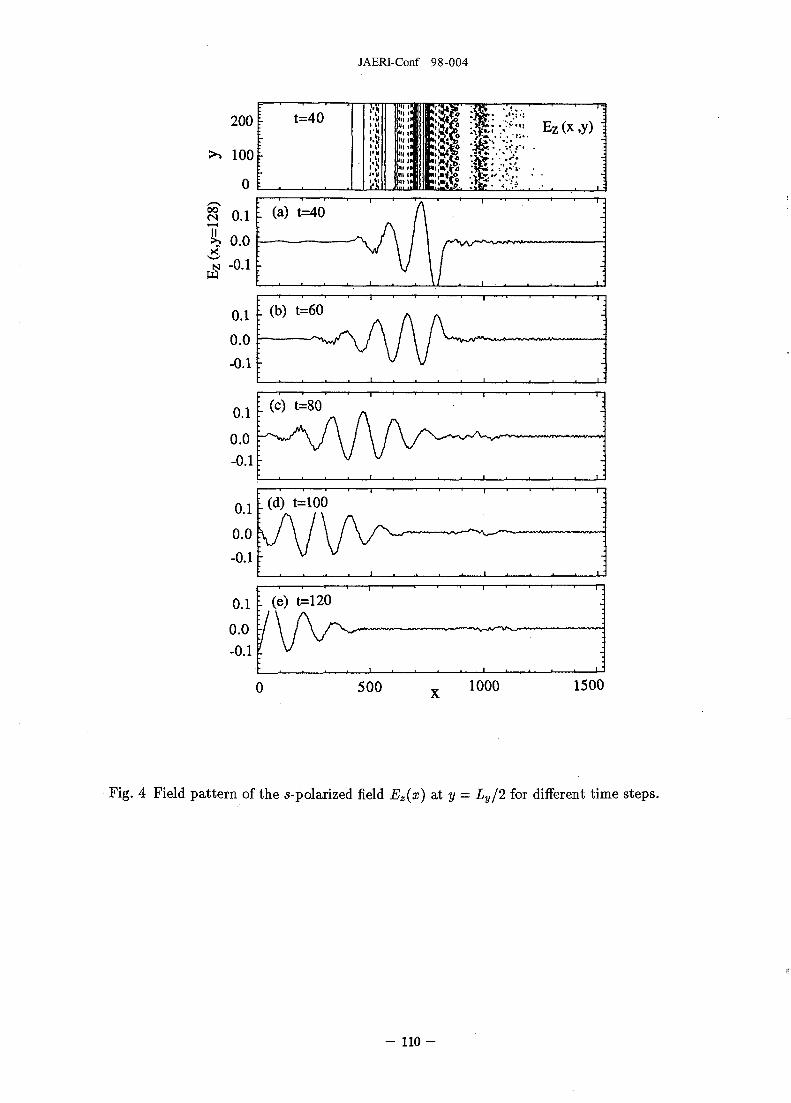
JAERI-Conf 98-004
200
100
0
00 n ,
cs 0.1L (a) t=40
-0.1
0.1
0.0
-0.1
0.1
0.0-0.1
0.1
0.0
-0.1
0.1
0.0-0.1
. (b) t=60
t=40
L (c) t=80
: (d) t=100
L (e) t=120
Ez(x,y)
500 1000 1500
Fig. 4 Field pattern of the s-polarized field Ez(x) at y = Ly/2 for different time steps.
- 1 1 0 -
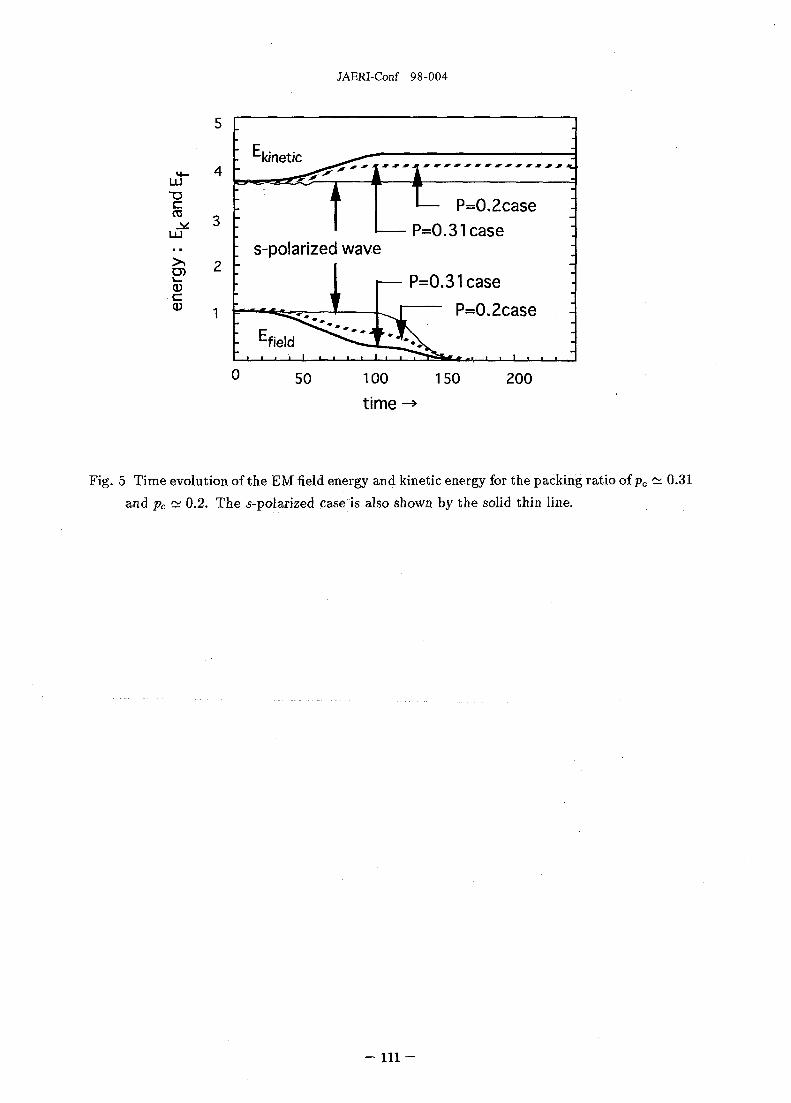
JAERI-Conf 98-004
oCO
LU
a3c
2
1
• I
{ ALI—p=o
; s-polarized wave
•
• Efield ^ * \ ^ !
I— P=0.
-
P=0.2case -
.3 lease :
31 case •
P=0.2case -
50 100
time150 200
Fig. 5 Time evolution of the EM field energy and kinetic energy for the packing ratio of pc ~ 0.31
and pc ~ 0.2. The 5-polarized case is also shown by the solid thin line.
- I l l -
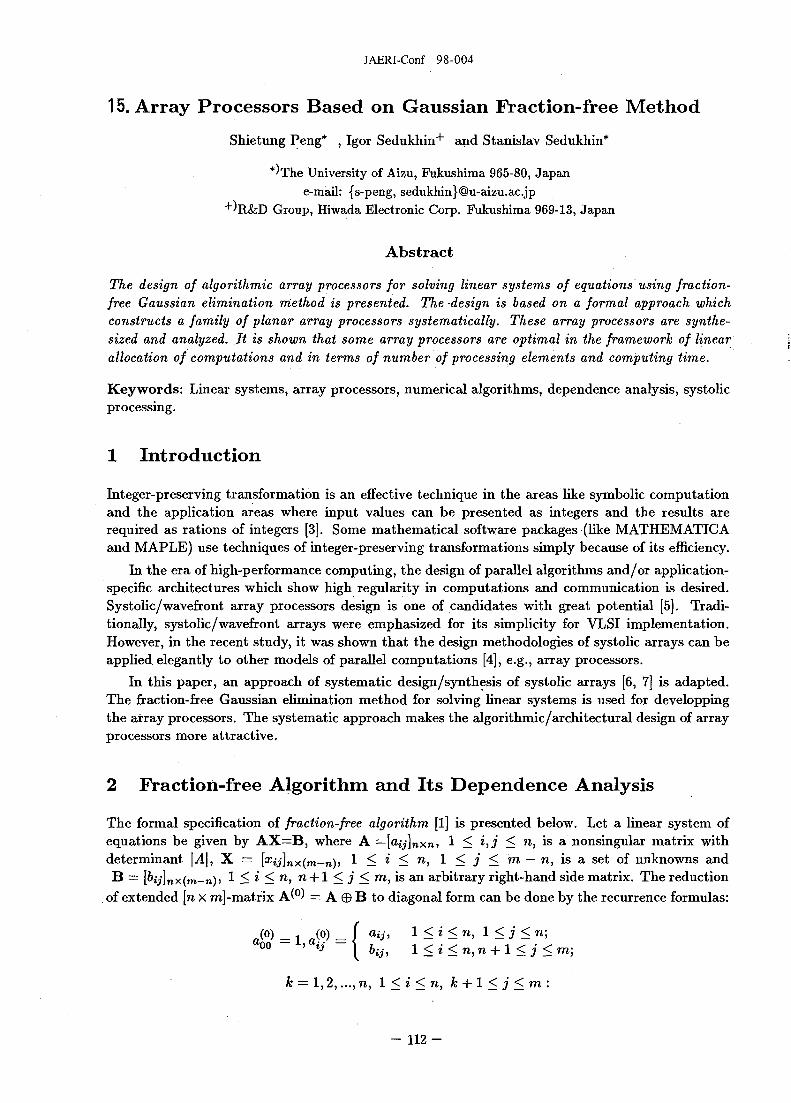
JAERI-Conf 98-004
15. Array Processors Based on Gaussian Fraction-free Method
Shietung Peng* , Igor Sedukhin"1" and Stanislav Sedukhin*
*'The University of Aizu, Fukushima 965-80, Japane-mail: {s-peng, sedukhin} @u-aizu.ac.jp
+)R&D Group, Hiwada Electronic Corp. Pukushima 969-13, Japan
Abstract
The design of algorithmic array processors for solving linear systems of equations using fraction-free Gaussian elimination method is presented. The -design is based on a formal approach whichconstructs a family of planar array processors systematically. These array processors are synthe-sized and analyzed. It is shown that some array processors are optimal in the framework of linearallocation of computations and in terms of number of processing elements and computing time.
Keywords: Linear systems, array processors, numerical algorithms, dependence analysis, systolicprocessing.
1 Introduction
Integer-preserving transformation is an effective technique in the areas like symbolic computationand the application areas where input values can be presented as integers and the results arerequired as rations of integers [3]. Some mathematical software packages (like MATHEMATICAand MAPLE) use techniques of integer-preserving transformations simply because of its efficiency.
In the era of high-performance computing, the design of parallel algorithms and/or application-specific architectures which show high regularity in computations and communication is desired.Systolic/wavefront array processors design is one of candidates with great potential [5]. Tradi-tionally, systolic/wavefront arrays were emphasized for its simplicity for VLSI implementation.However, in the recent study, it was shown that the design methodologies of systolic arrays can beapplied elegantly to other models of parallel computations [4], e.g., array processors.
In this paper, an approach of systematic design/synthesis of systolic arrays [6, 7] is adapted.The fraction-free Gaussian elimination method for solving linear systems is used for developpingthe array processors. The systematic approach makes the algorithmic/architectural design of arrayprocessors more attractive.
2 Fraction-free Algorithm and Its Dependence Analysis
The formal specification of fraction-free algorithm [1] is presented below. Let a linear system ofequations be given by A X = B , where A =[aij]jixn> 1 5; i>j 5; ni 1S a nonsingular matrix withdeterminant |A|, X = [xij]nx(m~n)> 1 < * < n> 1 < i < m — n, is a set of unknowns andB = [^tj]nx(m-n)j 1 < ? < n> n + 1 < j < m, is an arbitrary right-hand side matrix. The reduction
of extended [n X m]-matrix A^0) = A © B to diagonal form can be done by the recurrence formulas:
(o) _ i (o) _ I a-ij, !<« '<«? 1 < 3 < n;a 00 ~ •*•' aij ~ \ I... 1 < i < m n 4- 1 < 4 < m-
k = 1,2,..., 7i, l < i < n , fc + 1 < j < m :
- 112-

JAERI-Conf 98-004
if i = k;(fc-i)
, otherwise. (1)kk akj(*-l) (S-l)
a
An initial algorithm can be derived directly from (1) using indexed, single-assignment formatas follows:
\input computations (initialization)
forall 1 < i < n do(0) f aij, 1 < j < n;« \ 6y, n_+l< j < m ;
\internal computationsfor & = 1 to n do
begin<2>
forallifi = k then og"^ elseW <-ifi = k then og
<*) (*-l) (fc-i) (fc-i)w (fc-i)a a i ~ a a )/akk~ aik
(fc-i)w (fc-i) .akj )/ak-l,k-V
end\output computationsforall 1 < i < n,1 < j < m — n do
(n+l) (n) , (n)
As it directly follows from (2), the index or iteration space X =Z3 of the initial algorithm consistsof the index subsets of input, internal and output computations, i.e. V = Vin U Vint U Pouij where^m = {(i,j,0)T U (0,0,0)T| 1 < i < n, 1 < j < m} C Z2;^m< = {(?,J, A;)T| 1 < k < n, 1 < t < n, k + 1 < j < m} C Z3;T'out = {(«> + j , n + 1)T| 1 < i < n, 1 < j < m - n} C Z2.
For this algorithm, local dofa dependence graph (DG) can be constructed in 3-dim index space(i,j,k\, representing the locations of the computations in the space (as the index points) and thedata dependencies (as the arcs) between the computations of the algorithm. The local DG Fi ofthe algorithm (2) is shown in Fig. 1 for the case of n = 3 and m = 6.
It can be shown that the length C of the longest path is C(pmin,pmax) = 4(ra — 1) + (m — n) =m + 3n — 4, where pmia — (1,1,1)^ and pmax = (l,m,n)T. Timing (step) function step(p) :Pint —» Z+ which assigns a computational time step to each index point p E Vint can be defined asstep(p) = \i — k\ + \j — k\ +3fc — 3. The spatial allocation of the set of computations is accomplishedby an allocation function place(p) = A^ -p, where A,, is a (2 x 3)-matrix of the linear transformationcorresponding to a projection direction r\ 6 ker A^ and which has the rank A,j = 2.
Along all possible projection directions which the cubic DG may be projected onto the plane,only those are admissible that keep local data dependencies between computations, and do not mapany index points p,q £ Vint, such that step(p) = step(g), onto the same PE.
The major problems concerning the initial algorithm and it's DG are: (1) some data are trans-mitted along opposite edges in i direction, thus prevent projections in this direction; (2) the arc-delays along fe-axis vary, thus complicate the control of computation/communication. To designoptimal array processors, we present a new algorithm which eliminates the problems mentionedabove using an innovative reindexing technique in the next section.
- 113-
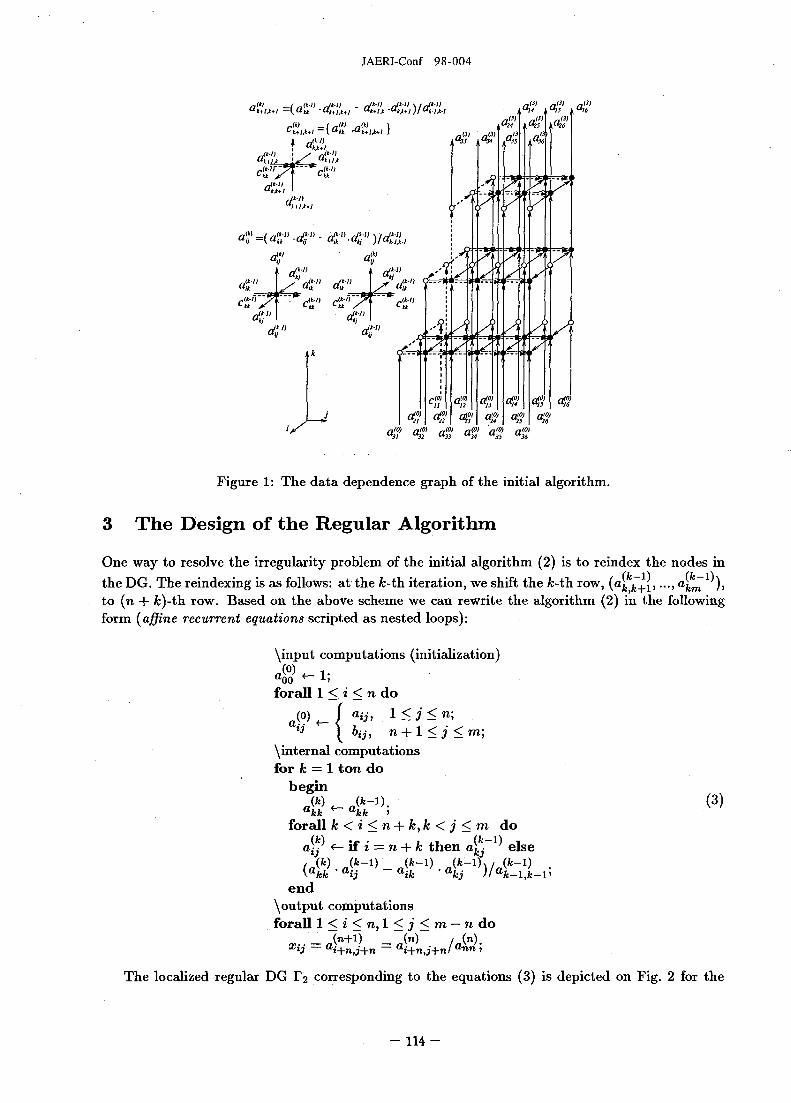
JAERI-Conf 98-004
m a"" n"" a"" a<°> a<°>U U32 "33 U34 U3S U36
Figure 1: The data dependence graph of the initial algorithm.
3 The Design of the Regular Algorithm
One way to resolve the irregularity problem of the initial algorithm (2) is to reindex the nodes inthe DG. The reindexing is as follows: at the fc-th iteration, we shift the &-th row, (aj. k+{,..., <4m ) ,to (n + fc)-th row. Based on the above scheme we can rewrite the algorithm (2) in the followingform (affine recurrent equations scripted as nested loops):
_: *
\input computations (initialization)(°) i .
forall 1 < i < n doaij) 1 < 3' < n]
n + 1 < j < m;\internal computationsfor fc = 1 ton do
begin(*) (*-i) (3)
forall k<i<n + k,k<j<m d o
a j" <=- if z = n + k then a "- else\akk ' aii aik ' aki )/ak—l k—1>
end\output computationsforall 1 < i < n,l < j < m — n do
Xij = ai+nj+n = ai+nj+n/ann ]
The localized regular DG F2 corresponding to the equations (3) is depicted on Fig. 2 for the
- 114-

JAERI-Conf 98-004
"itIJt-f
/•'•" nm n'3>
C33 UI5 UI6
W 1 A3>\ r.13)
?i
?!•
r<0)
6*
PC
f
Figure 2: The data dependence graph of the regular algorithm.
case of n = 3, m = 6.
For the regular DG the timing function step(p) can be specified in the linear form as step(p) =A-p + 7. This function defines a set of hyperplanes orthogonal to the schedule vector A on the indexspace of the algorithm. It is easy to show that the timing function of the minimal form for theregular DG is step(p) = i + j + k — 3 for any p G V{nt, taking into account that step(pmin) = 0,where pm[n = (1,1,1)T G Vint- Thus, the schedule vector A is (1,1,1) and 7 is —3. It can beproved that the length of the longest path in the regular DG is C(pmin,pma.x) = 3(n — 1) + m, wherePmax = (2", m, Tl) € Vint-
4 Optimal Array Processors
As mention before, the timing and allocation functions must guarantee that each PE executes atmost one computation, which associated with any index point of DG, at any given time step.For the regular DG with a linear timing function this requires the condition A • if 7 0 to be held.According to [7] for the 3-dim DG of the regular algorithm there are 17 possible projection directionsthat keep the local communications and define systolic solutions. However, only 13 directions areadmissible for the regular DG according to the above condition. It can be shown that the onlysolutions, generated by mapping the regular DG along the projection directions 171 = (0,1,0)T and772 = (1,0,0)T, i.e. along j'-axis and i-axis, are characterized in aggregate by the minimal numbers ofPE's and I/O ports, and the number of delays. The array processor £(0,1,0) is generated by mappingthe regular DG along j direction, i.e. along projection direction J?I = (0,1,0)T. This 2-dim rhombicarray processor £(0,1,0) (see Fig. 3 for the case of n = 3, m = 6) consists of P(o,i,o) = n ( n ~ 1)orthogonally connected PEs, 2n delay elements. Thus a size of array is independent of m. Theinitial matrix A ^ = [a\j ] M m is loaded into the array processor column by column. The totalcomputation time for one task is T(o,i,o)(l>w, m) = Tmin(r2) = 3(n — 1) + m. The data pipeliningperiod is a = |A • ?7i| = 1 and the block pipelining period is /? = m + 1, i.e. the next task can bepushed into this array processor after m + 1 time steps. The number of I/O ports is 2n. Also it is
- 115
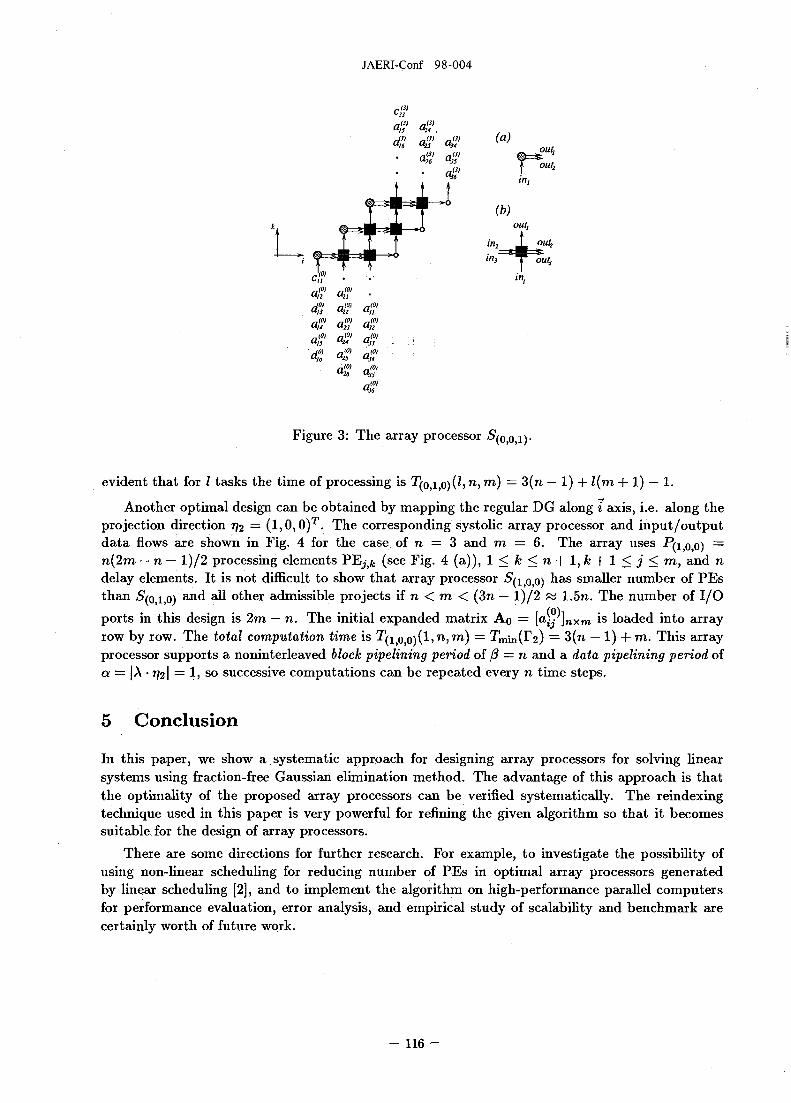
JAERI-Conf 98-004
(a)_ out,© = * 'J out2
in.
out,
in2
- T Ocunm
"12
"13
offoff<
•
<
<
ag'
••
"31
nm
"32am
nm
"34nm
"35
Figure 3: The array processor £(0,0,1) •
evident that for I tasks the time of processing is T(O)1>o)(J, n, m) = 3(n — 1) + /(m + 1) — 1.
Another optimal design can be obtained by mapping the regular DG along i axis, i.e. along theprojection direction 772 = (1,0,0) r . The corresponding systolic array processor and input/outputdata flows are shown in Fig. 4 for the case of n = 3 and m = 6. The array uses P(i)o,o) =
n(2m — n — l) /2 processing elements PE^fc (see Fig. 4 (a)), l < & < n + l,fe + l < j i ' < m , and ndelay elements. It is not difficult to show that array processor 5(1,0,0) has smaller number of PEsthan 5(0,1,0) and all other admissible projects if n < m < (3n — l) /2 ?« 1.5n. The number of I/O
ports in this design is 2m — n. The initial expanded matrix Ao = [a\- ] n x m is loaded into arrayrow by row. The total computation time is T(1)OO)(l,n,m) = Tmin(F2) = 3(n — 1) + m. This arrayprocessor supports a noninterleaved block pipelining period of /? = n and a data pipelining period ofa = j A - 7721 = 1) s o successive computations can be repeated every n time steps.
5 Conclusion
In this paper, we show a systematic approach for designing array processors for solving hnearsystems using fraction-free Gaussian elimination method. The advantage of this approach is thatthe optimality of the proposed array processors can be verified systematically. The reindexingtechnique used in this paper is very powerful for refining the given algorithm so that it becomessuitable for the design of array processors.
There are some directions for further research. For example, to investigate the possibility ofusing non-linear scheduling for reducing number of PEs in optimal array processors generatedby linear scheduling [2], and to implement the algorithm on high-performance parallel computersfor performance evaluation, error analysis, and empirical study of scalability and benchmark arecertainly worth of future work.
- 116-
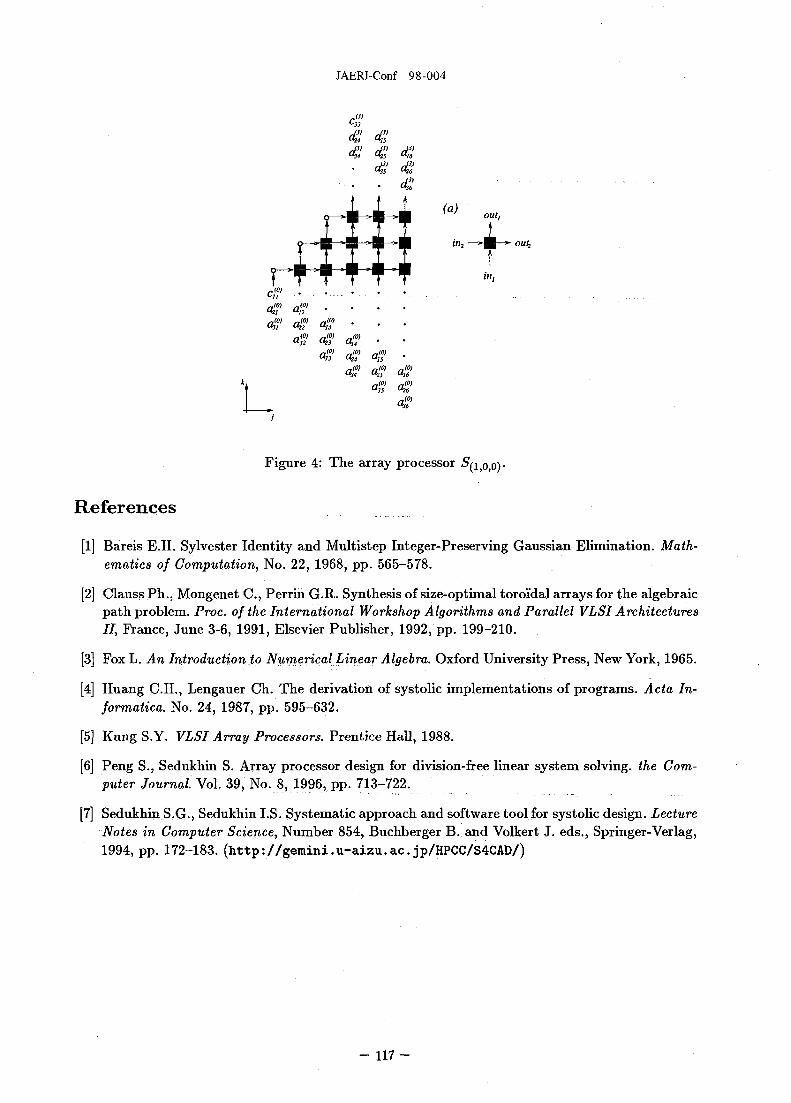
JAERI-Conf 98-004
<a> out,
in2 — * B ~ * " out2
Tin,
Figure 4: The array processor S^o.o)-
References
[1] Bareis E.H. Sylvester Identity and Multistep Integer-Preserving Gaussian Elimination. Math-ematics of Computation, No. 22, 1968, pp. 565-578.
[2] Clauss Ph., Mongenet C , Perrin G.R. Synthesis of size-optimal toroidal arrays for the algebraicpath problem. Proc. of the International Workshop Algorithms and Parallel VLSI ArchitecturesII, France, June 3-6, 1991, Elsevier Publisher, 1992, pp. 199-210.
[3] Fox L. An Introduction to Numerical Linear Algebra. Oxford University Press, New York, 1965.
[4] Huang C.H., Lengauer Ch. The derivation of systolic implementations of programs. Ada In-formatica. No. 24, 1987, pp. 595-632.
[5] Kung S.Y. VLSI Array Processors. Prentice Hall, 1988.
[6] Peng S., Sedukhin S. Array processor design for division-free linear system solving, the Com-puter Journal Vol. 39, No. 8, 1996, pp. 713-722.
[7] Sedukhin S.G., Sedukhin I.S. Systematic approach and software tool for systolic design. LectureNotes in Computer Science, Number 854, Buchberger B. and Volkert J. eds., Springer-Verlag,1994, pp. 172-183. (http://gemini.u-aizu.ac.jp/HPCC/S4CAD/)
- 117-
JAERI-Conf 98-004
16. Numerical Simulation of Extremely Chirped Pulse Formationwith an Optical Fiber
Tamitake ITOH, Akihiko NISHIMURA, Kazuyoku TEI, Tohru MATOBA, Hiroshi TAKUMAJAERI, 2-4 Shirane, Tokai-mura, Naka-gun, Ibaraki-ken 319-11, Japan
Mikio YAMASHITA, Ryuji MORTTADepartment of Applied Physics, Hokkaido Univ., Kita-13, Nishi-8, Kitaku, Sapporo 060, Japan
ABSTRACTA nonlinear propagation code which used a symmetric split-step Fourier method as an algorithm was
improved to simulate a propagation behavior of extremely chirped pulse in a long fiber. The
performances of pulse propagation in noble gases cored hollow fibers and a pulse stretcher using a
nonlinear and normal silicate fibers have been simulated by the code. The calculation results in the case
of the hollow fiber are consistent with their experimental results. We estimated that this pulse stretcher
could give a extremely chirped pulse whose spectral width was 84.2nm and temporal duration was
1.5ns.
Keywords: Chirped pulse, Nonlinear propagation, Symmetric split-step Fourier method,
Pulse stretcher, Nonlinear fiber, Hollow fiber
1. INTRODUCTIONChirped pulse amplification (CPA)') has been widely applied to the high peak power laser systems
to enable efficient energy extraction without optical damage from solid state gain media. The use of
Ti:sapphire as a gain medium has produced wide variety of CPA laser systems. The output peak power
is ranging from mj to several J. The fs-mj pulses easily undergo self phase modulation (SPM) in a
hollow quartz fiber, giving broadened spectra, which make the pulses compressable down to the range
of 10 fs2). The high energy storage capacity, low quantum defect and long lifetime of excited-state are
necessary for the gain media in order to make the systems compact and efficient. For this reason,
Yb:glass is an attractive gain medium for the future CPA laser systems. Aecently, an application of
Yb:glass for CPA has been demonstrated3'. In this experiment, a silicate fiber was used to stretch a 100-
fs pulse to 2-ns one before the amplification with a Yb:glass regenerative amplifier. This indicated that a
silicate fiber stretcher was useful to obtain a extremely chirped pulses. However, further chirped pulses
caused by SPM are required to cover the bandwidth of Yb:glass. A nonlinear fiber would meet this
purpose. A numerical simulation for SPM coupled with dispersion calculation is necessary to estimate
the characteristics of chirped pulse injection in a hollow fiber or a fiber stretcher. In this report, a
calculation code improved to save CPU time and memory size successfully simulates the propagation in
each fiber. The advantage of the use of a nonlinear fiber in pulse stretching is also demonstrated.
2. CALCULATION MODEL
Owing to a nonlinear refractive index, the refractive index of a fiber core varies with intensity of
pulse. This effect induces an intensity-dependent phase modulation. As a result, the spectrum of ttie
pulse from the fiber is broadened. The pulse duration also broadens in time domain, owing to trie fiber
- 1 1 8 -

JAERI-Conf 98-004
dispersion. In our calculation, it is assumed that a fiber input pulse has a hyperbolic-secant shape and is
chirpless(O=0)(2.1). This nonlinear Schrodinger equation is used as the propagation one(2.2).4)
«(£ = 0,r) = ,/Vsech(T)exp-iCt2
2 (2.1)In this equation, the dispersion effect from second to fifth order, the SPM effect, the self-steepening
effect and the nonlinear delayed response effect are taken into account. The numerical method used here
is called the symmetric split-step Fourier method has been described in the previous report5'. The
equation (2.2) consists of following operators where D-hat operator (2.3) indicates the linear part and
du i d2u d4u c d5u
dx\u\ u\-TRu
dx (2.2)
the linear part and iV-hat operator (2.4) shows the nonlinear part.
d5
(2.3)
(2.4)
Optical fiber
(1)
(2)
^
•
s - c in fe s outFigl. Schematic illustration of the symmetric split-step Fourier method
An algorithm we use is shown in Fig. 1. A optical fiber is divided into each segment having trie
thickness h. The following process was used for the calculation of seed pulse propagation where the D-
hat operator and the JV-hat operator were calculated respectively. Firstly, D-hat operator for dispersion
effect was calculated until a seed pulse u(S in, r ) propagates to the h/2. Secondly, the calculation of N-
hat operator for nonlinear effect was carried out thorough the h. Finally, Z>hat operator. This process
was repeated until the pulse u{ § out, t )was ejected at the end of the fiber. All the nonlinear effects
strongly depend on the pulse peak power and duration of the pulse, so h can be extended gradually to
reduce an iteration number in the calculation, as pulse peak power decreases. To save memory size, a
- 1 1 9 -

JAERI-Conf 98-004
scale of arrangement variable is adopted to a pulse duration. As a pulse propagates farther, its duration
becomes longer. Therefore, a time width should be extended in memory. By the use of super computers
VPP300 and VPP500(FUJITSU) with vector processors, these calculations has been enable to be
carried out.
3. CALCULATION RESULTS and DISCUSSION
3.1 Simulation for a hollow fiber
As a first example, a propagation behavior in a hollow fiber are simulated. We also check our
numerical method by comparing our calculation results with experimental results under the same
conditions. The experimental data reported by Svelto et. al was used for the present simulation2). The
experimental setup is shown in Fig 2. An input pulse was focused into the fiber core and its output was
collimated and compressed with the prism pairs. The fiber core was filled with noble gas at a high
pressure. The output pulse was compressed to 10 fs. The input pulse duration was 140 fs and its peak
power was several GW. Figs. 3 (a) and (b) show the experimental and calculated output spectra
obtained with a fiber filled with krypton at 2-atm and a 1-GW input peak power. The vertical axis
shows the normalized intensity. The horizontal axis shows the wavelength. The experimental and
calculated spectral broadening are indicated by the arrows, and are almost the same. However the
spectral structures showed a little difference. Though the calculated spectrum exhibited two main peaks
and one small peak, but the experimental spectrum has only two peaks and the small was not observed.
An initial chirp and a pulse asymmetry could explain the absence of the small peak in the experimental
spectrum. Figs. 4 (a) and (b) show experimental and calculated output spectra obtained with a fiber
filled with Argon at 4-atm and a 3.5-GW input peak power. The center wavelengths of the spectra are
blue shifted by 10 ran in the both the cases. The experimental and calculated spectral structures are
considerably different each other. The calculated spectrum has a large peak on the blue side, but the
experimental one has a large peak on the red side. This difference also could be attributed to an initial
chirp and a pulse asymmetry of input pulse. With these results, we think these calculation results are
consistent with experiments.
3.2 Simulation for a fiber stretcher
Spectral width of injected pulses should be wide enough in comparison with gain bandwidth of
regenerative amplifiers. Over 60 run spectrum width is necessary for Yb:glass CPA. However, it is
difficult to generate such a broad spectrum at the wavelength of 1 /xm. For this reason, the fiber
stretcher which consists of a short nonlinear fiber and a long silicate fiber is proposed (Fig. 5). Since the
nonlinear refractive index of the nonlinear fiber is larger than that of the normal silicate fiber by several
times, the nonlinear fiber can easily expand the spectrum of seed pulse from.a mode-locked oscillator6'.
The SPM effect disappears as the pulse width increases. In the silicate fiber, the broaden spectrum is
chirped in time domain by the dispersion effect. Table 1 shows the comparison of a nonlinear fiber and a
- 120 -
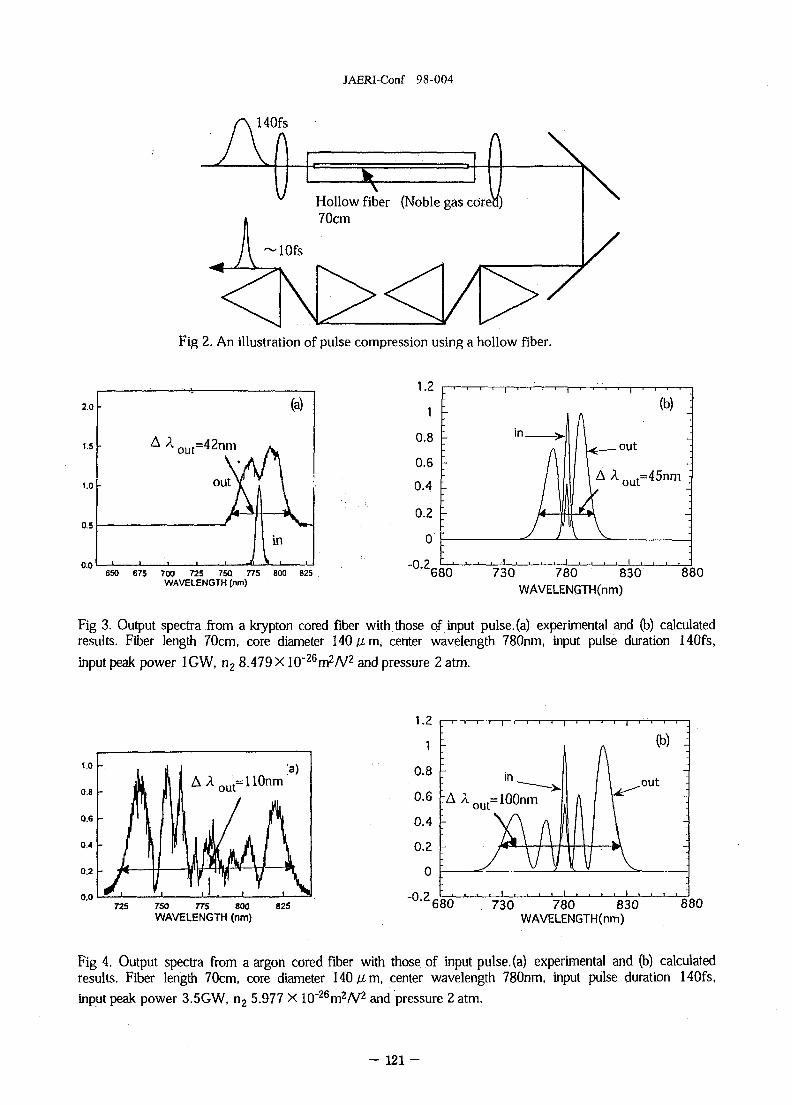
JAERI-Conf 98-004
Hollow fiber (Noble gas corec70cm
lOfs
Fig 2. An illustration of pulse compression using a hollow fiber.
\
6SO 675 700 725 750. 775 800 625WAVELENGTH (nm)
'680 730 780 830WAVELENGTH(nm)
880
Fig 3. Output spectra from a krypton cored fiber with those of input pulse, (a) experimental and (b) calculatedresults. Fiber length 70cm, core diameter 140 fim, center wavelength 780nm, input pulse duration 140fs,
input peak power 1GW, n2 8.479X 10~26m2A/2 and pressure 2 atm.
1.0
0.8
0.6
0.4
0.2
n n
k 1144
a)I AAout=110nm'f J / ui
Aft J Ai r i f V \
725 750 775 800 825WAVELENGTH (nm)
1.2
1
0.8
0.6
0.4
0.2
0
-0.2
(b) -
in
A Aout=100nmout
l i t !
680 730 780 630WAVELENGTH(nm)
880
Fig 4. Output spectra from a argon cored fiber with those of input pulse, (a) experimental and (b) calculatedresults. Fiber length 70cm, core diameter 140 Mm, center wavelength 780nm, input pulse duration 140fs,
input peak power 3.5GW, n2 5.977 X 10"26m2A/z and pressure 2 atm.
- 121 -
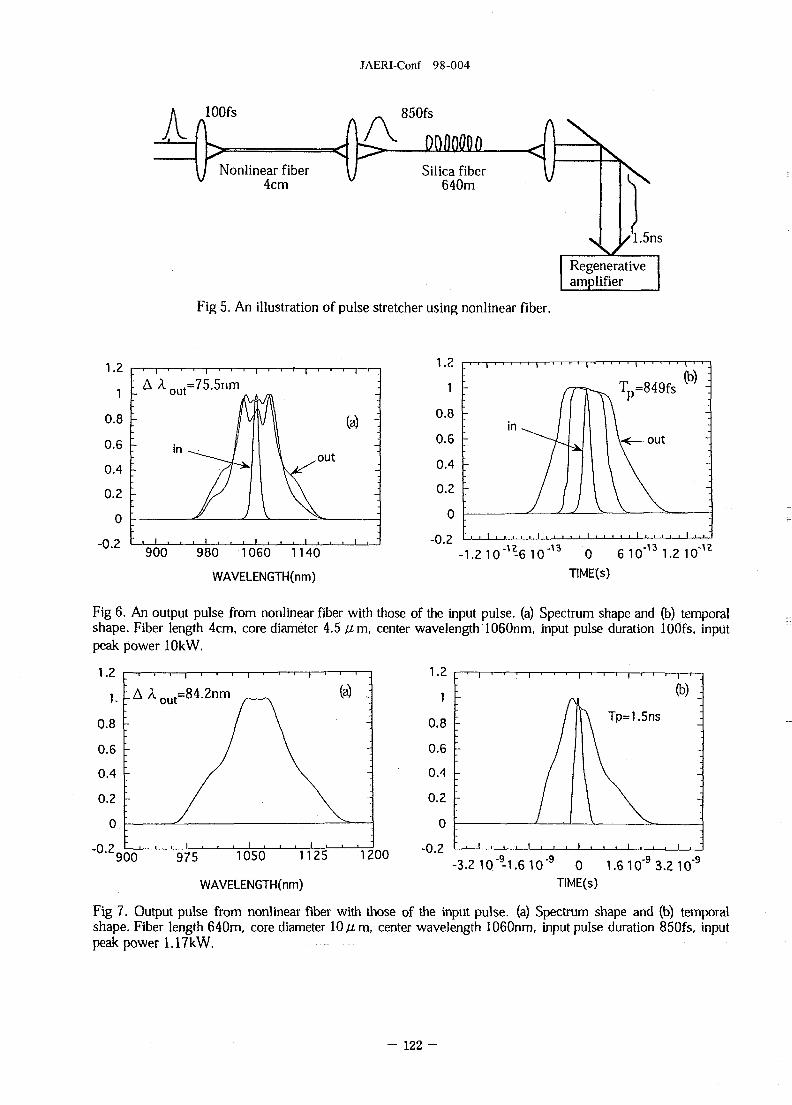
A lOOfs
Nonlinear fiber4cm
JAERI-Conf 98-004
850fs
OQQO0DOSilica fiber
640m
/1.5ns
Regenerativeamplifier
Fig 5. An illustration of pulse stretcher using nonlinear fiber.
1.2
1
0.8
0.6
0.4
0.2
0
-0.2
. AA
'-
-
900
out=75.5nm :
in ~ ^ ^ /
f 1I \ '980 1060 1140
WAVELENGTH(nm)
1.2
1
0.8
0.6
0.4
0.2
0
-0.2
i—i—i—i—i—r
in-\J
: / /A• . , i i i • i
1.2 1 0 - 6 10 0TIME(s)
—i—i—r—i—I—i—i—r
Tp=849fs
W—out
vv6 10"13 1.2
_—,—,—.(b) :
.. i
•
•.
i
-
. i i i "
10"1Z
Fig 6. An output pulse from nonlinear fiber with those of the input pulse, (a) Spectrum shape and (b) temporalshape. Fiber length 4cm, core diameter 4.5 urn, center wavelength 1060nm, input pulse duration lOOfs, inputpeak power lOkW.
1.2
1.
0.8
0.6
0.4
0.2
n
n 7
l A A
'-
'7
°-2900
—T 1 1 1 1 i—. i—i—|—i 1 1—;
f=84.2nm (a) _
/ \ -i
/ \ ' •
y ~-, i , . . i , . . i . , ,
975 1050 1125 1200
WAVELENGTH(nm)
1.2
1
0.8
0.6
0.4
0.2
A
-0.2
~'—i—i—i-
'-
'-
-
- , i , .
3.2 10"9-1
-.—i—•—•—i—r
/ I//
—i
\
\
\
/ \/. i . , , i .
.6 10"9 0TIME(s)
' - i • • - .
Tp=1.5ns -
-
V -\ -_
, • 1 . , , 1 , "
1.610'93.210"9
Fig 7. Output pulse from nonlinear fiber with those of the input pulse, (a) Spectrum shape and (b) temporalshape. Fiber length 640m, core diameter 10 Aim, center wavelength 1060nm, input pulse duration 850fs, inputpeak power 1.17kW.
- 122 -

JAERI-Conf 98-004
silicate fiber. The peak power of seed pulse can be reduced for the sake of the nonlinear fiber section,
which enable us to use a glass oscillator directly pumped with a laser diode7). Here, the 100 fs pulse
and 10 kW peak power at 1060 nm are used for the typical specification from this type of oscillator. The
nonlinear refractive index of this nonlinear fiber core is 10 times larger than that of normal silicate
fiber8'. However, no nonlinear fibers longer than several cm are commercially available. Figs. 6(a) and
(b) show the calculation results obtained for the output pulses with the nonlinear fiber. The full width at
half maximum of the output spectrum is 75.5 nm. It covers the gain band of a Yb:glass amplifier. The
pulse is stretched to in its duration of 850 fs, and is injected to normal silicate fiber. Figs. 7 (a) and (b)
show the calculation results of a silica fiber output pulse. This calculation is carried out with the
nonlinear fiber output pulse profile as show in Figs. 6. The pulse propagates 640 m though the silicate
fiber. The SPM effect in the silicate fiber is negligibly small during the propagation of 640 m. The full
width at half maximum of the output spectrum is 84.2 nm, and the pulse duration is stretched to 1.5 ns.
Table 1. Profiles of a lead-doped nonlinear fiber and a normal silicate fiber
Group velocityn 2 dispersion
Substance . ?. ?, (1060nm) Material Length
(s2/m)
Nonlinear fiber 1.196X10"21 1.279X 10"25 Silica (75^%) S h o r t
Silica fiber 1.220 X 10~22 1.677X10"26 Silica Long
4. SUMMARY
The performance of a pulse stretcher using a nonlinear and normal silicate fibers has been
simulated by the symmetric split-step Fourier method. We adopted an increasing segment length for the
decreasing nonlinear effects of the fiber during the propagation of the input pulse. At the same time, an
increasing arrangement variable size was used for the increasing pulse duration to save CPU time and
memory. We have demonstrated the spectral and temporal broadening of the input pulse after the
propagation through hollow fibers. The results are in good accordance with the experimental data. We
have simulated a pulse stretcher which consists of a nonlinear fiber and normal silicate fiber, and we
showed the spectral broadening(8.2 nm—>-84.2 nm) and the temporal broadening(100 fs-*1.5 ns).
ACKNOWLEDGMENTS
The authors would like to thank Dr. Hirokazu Kubota of Optical Soliton Communication Research
Group, Nippon Telegraph and Telephone Corporation for valuable discussions.
- 1 2 3 -
JAERI-Conf 98-004
REFERENCES
1. D. Strickland and Mourou, Opt. Commun., 56, 219 (1985).
2. M. Nisoli, S. De Silvestri, and O. Svelto, Appl. Phys. Lett., 60, 2793 (1996).
3. S. Biswal, F. Duron, J. Nees, G. Mourou and A. Nishimura, CThCl, Technical Digest CLEO
'97(Baltimore) p.319 (1997).
4. R. Morota andM. Yamashita, Opt. Lett., 19, 1459 (1994).
5. See for example, G. P. Agrawal, Nonlinear Fiber Optics (Academic Press, San Diego, 1989).
6. T. Itoh, R. Moritaand M. Yamashita, Jpn. J. Appl. Phys., 35, 1107 (1996)
7. J. Ausder Au, D. Kopf, F. Morier-Genoud, M. Moser, andU. Keller, Opt. Lett., 22, 307 (1997).
8. T. Suemura, M. Ohtani, R. Morita, and M. Yamashita, FST'97 (1997. 2.13-14).
9. R. H. Stolen and C. Lin, Phys. Rev., A 17, 1448 (1978).
- 1 2 4 -

JAERI-Conf 98-004
17. Emerging Terawatt Picosecond CO2 Laser Technology
I.V. Pogorelsky
Accelerator Test Facility, Brookhaven National Laboratory, 725C, Upton, NY 11973, USA
ABSTRACT
The first terawatt picosecond (TWps) CO2 laser is under construction at the BNL AcceleratorTest Facility (ATF). TWps-CO2 lasers, having an order of magnitude longer wavelength than thewell-known table-top terawatt solid state lasers, offer new opportunities for strong-field physicsresearch. For laser wakefield accelerators (LWFA) the advantage of the new class of lasers is dueto a gain of two orders of magnitude in the ponderomotive potential. The large average power ofCO2 lasers is important for the generation of hard radiation through Compton back-scattering ofthe laser off energetic electron beams. We discuss applications of TWps-CCk lasers for LWFAmodules of a tentative electron-positron collider, for y-y (or y-lepton) colliders, for a possible"table-top" source of high-intensity x-rays and gamma rays, and the generation of polarizedpositron beams.
1. NEW CLASS OF TERAWATT PICOSECOND LASERS
Table-top terawatt (T3) picosecond and subpicosecond solid state lasers are the sources of the mostintense electromagnetic radiation and strongest electric and magnetic fields available for laboratoryresearch. However, progress in the newly emerged strong-field physics applications, such as laseraccelerators or laser synchrotron x-ray sources, to high repetition rate devices is impeded by the lowaverage power of the T3 lasers. This is due to the inherently low efficiency of the thermal diffusion coolingof the solid active elements. Much more efficient convection heat exchange may be implemented in the fast-flow gas lasers. The demonstrated high output energy and power of molecular and eximer lasers make thema rational complement to solid state laser technology. CO2 lasers operating in the mid-IR spectral region(/t=10 pm) deserve the most attention. This is not just because the absolute maximum average power hasbeen demonstrated with these devices, but also due to favorable wavelength scaling of a number of light-matter interactions.
The relatively long nanosecond pulse duration of conventional CO2 lasers is the prime reason why thepotentials of CO2 lasers have not been utilized so far in a full manner for high-energy physics research.Kilojoules of laser energy would be required to reach a terawatt peak power. This is still possible with CO2lasers, as it has been demonstrated previously. However, such lasers are very bulky and are not capable ofhigh repetition rates. There is also a problem to deliver such a high laser energy to the interaction pointwithout optics damage. And finally, the nanosecond pulses are incompatible with many of the strong-fieldphysics processes which are typically localized in very short time and space intervals. Thus a picosecondand shorter pulse duration turns out to be a prerequisite for the successful use of lasers in advancedscientific applications.
A physical parameter that enables generation and amplification of picosecond laset pulses is the gainspectral bandwidth. In solid state lasers, radiation transitions in outer electron shells of active ions arebroadened to 5-50 THz due to the perturbation action by the host matrix. Such a broad gain spectrummakes possible the generation of picosecond, and even femtosecond, laser pulses by the mode lockingtechnique. Unlike a solid state, the spectral gain in the molecular gas discharge is periodically modulated by
- 125 -
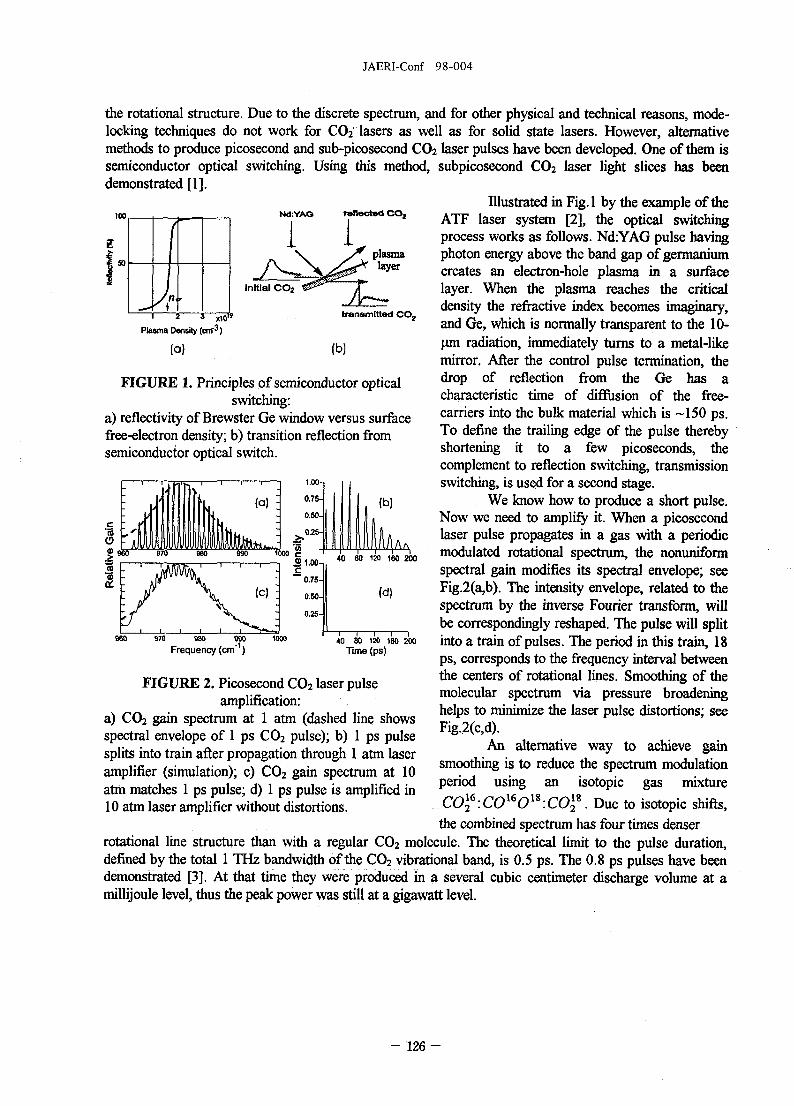
JAERI-Conf 98-004
100
Ifir
NchYAQ reflected CO,
plasma
Initial CO2 7" 2 3 x t 0 ' »
Plasma Density (cnrr3)
transmitted C O ,
(a) (b)
the rotational structure. Due to the discrete spectrum, and for other physical and technical reasons, mode-locking techniques do not work for CO2 lasers as well as for solid state lasers. However, alternativemethods to produce picosecond and sub-picosecond CO2 laser pulses have been developed. One of them issemiconductor optical switching. Using this method, subpicosecond CO2 laser light slices has beendemonstrated [1].
Illustrated in Fig.l by the example of theATF laser system [2], the optical switchingprocess works as follows. Nd:YAG pulse havingphoton energy above the band gap of germaniumcreates an electron-hole plasma in a surfacelayer. When the plasma reaches the criticaldensity the refractive index becomes imaginary,and Ge, which is normally transparent to the 10-um radiation, immediately turns to a metal-likemirror. After the control pulse termination, thedrop of reflection from the Ge has acharacteristic time of diffusion of the free-carriers into the bulk material which is -150 ps.To define the trailing edge of the pulse therebyshortening it to a few picoseconds, thecomplement to reflection switching, transmissionswitching, is used for a second stage.
We know how to produce a short pulse.Now we need to amplify it. When a picosecondlaser pulse propagates in a gas with a periodicmodulated rotational spectrum, the nonuniformspectral gain modifies its spectral envelope; seeFig.2(a,b). The intensity envelope, related to thespectrum by the inverse Fourier transform, willbe correspondingly reshaped. The pulse will splitinto a train of pulses. The period in this train, 18ps, corresponds to the frequency interval betweenthe centers of rotational lines. Smoothing of themolecular spectrum via pressure broadeninghelps to minimize the laser pulse distortions; see
FIGURE 1. Principles of semiconductor opticalswitching:
a) reflectivity of Brewster Ge window versus surfacefree-electron density; b) transition reflection fromsemiconductor optical switch.
(bj
960 970 380 990Frequency (cm"1)
40 80 120 160 200Tims (ps)
FIGURE 2. Picosecond CO2 laser pulseamplification:
a) CO2 gain spectrum at 1 atm (dashed line showsspectral envelope of 1 ps CO2 pulse); b) 1 ps pulsesplits into train after propagation through 1 atm laseramplifier (simulation); c) CO2 gain spectrum at 10atm matches 1 ps pulse; d) 1 ps pulse is amplified in
Fig.2(c,d).An alternative way to achieve gain
smoothing is to reduce the spectrum modulationperiod using an isotopic gas mixture
8 • Due to isotopic shifts,CO\6:COl6(10 atm laser amplifier without distortions.the combined spectrum has four times denser
rotational line structure than with a regular CO2 molecule. The theoretical limit to the pulse duration,defined by the total 1 THz bandwidth of the CO2 vibrational band, is 0.5 ps. The 0.8 ps pulses have beendemonstrated [3]. At that time they were produced in a several cubic centimeter discharge volume at amillijoule level, thus the peak power was still at a gigawatt level.
- 126 -

JAERI-Conf 98-004
Mulii-lsotope 5 otm litterRegenerative Preamplifier
Extt 1/4 WavePockelsCel
Entrance l/4Wtrvel/4Wave Rate
PockelsCell
lOatm lOllter lO-cmaperture Amplifier
TW
To attain a terawatt peak power, a ~10-atm, -10-/ CO2 amplifier is required. To maintain auniform discharge under such conditions, the following requirements should be satisfied: a) strongpenetrating preionization, b) ~1 MV voltage applied to the discharge, and c) the energy load of severalkilojoules deposited in a relatively short, <300 ns, time interval. The first x-ray preionized laser with suchparameters is under construction at the ATF. Fig.3 shows the principal optical diagram of the ATF TWpsCO2 laser system.
The 1 MW, 100 nspulse produced by a 1-atm CO2
laser oscillator is sliced at asemiconductor switch controlledby the picosecond Nd:YAGlaser. The high power will beattained via regenerativeamplification and four additionalpasses through the preamplifierfollowed by three passes in the10-atm, 10-/ final amplifier withthe beam expansion to its full
FIGURE 3. Optical diagram of the ATF TWps-CO2 laser; 10-cm aperture.PS - plasma filter; SA - saturable absorber; PBS - polarizing beam jfos diagram looks
splitter relatively simple to anyone whois familiar with the T3 laser designs. There is a principal physical reason for this. Because of the strongoptical nonlinearity of solids, the high laser energy can not be extracted directly in a picosecond pulse. Therelatively sophisticated chirping technique should be implemented. This technique requires diffractionstretchers and compressors of the laser pulse. As a result, the optical damage of diffraction gratingsbecomes the primary limiting factor for this technology. The gas medium of the CO2 laser is free from thislimitation; thus a picosecond laser pulse may be amplified directly.
Table 1 serves to compare the main physical parameters of solid-state and CO2 lasers. Because ofthe broader gain bandwidth in the solid state lasers, as short as 10 fs laser pulses can be produced whereasthe CO2 laser pulses are limited to -1 ps the shortest. However, such pulse duration is sufficient for thecritical applications that we consider below.
A gain cross-section per ion or molecule is comparable for both types of lasers. About ten timeshigher concentration of active ions in solid matter than the CO2 molecules in a gas results in a ten timeshigher gain for solid state lasers. In addition, ten times higher photon energy makes the specific storedenergy in solid state lasers about hundred times higher. However, the large volume of a gas laser makes thetotal stored energy per CO2 laser stage similar or higher than for a big-aperture slab solid state amplifier.
Because of the ease of the heat removal by fast gas exchange in the CO2 laser, it is potentiallycapable of high repetition rates that are difficult to attain with massive glass or crystal active elements.This will be important for future advanced particle accelerators. For example, CO2 laser pulses o f - 1 psduration, 1 J energy, and 10 kHz repetition rate may be required to drive the e*=>y converter of the future 5TeV cm. collider. Relatively compact -10 / discharge, high-pressure, fast-flow CO2 lasers operating at a-100 Hz repetition rate may approach this requirement when the energy stored in the laser medium isextracted by a train of pulses of 1 ps length each following at a ~1 ns period. Such a regime looks not justfeasible but also quite efficient, permitting extraction of a good portion of the stored CO2 laser energy.Overall electric efficiency of the laser may approach 20% as has been demonstrated for the long-pulse CO2
- 1 2 7 -

JAERI-Conf 98-004
lasers pumped with the e-beam sustained discharge. An additional straightforward way to increase theefficient pulse repetition rate is recycling of the laser power in storage cavities [4].
2. TWps-CO2 LASER APPLICATIONS IN HIGH ENERGY PHYSICS
2.1. Laser Wakefield Accelerators and e'-e+ Colliders
High-gradient laser acceleration is a fast advancing area of the high energy physics research.Among the known laser acceleration techniques, the LWFA method [5] is considered to be the most reliableapproach. It is based on the ponderomotive charge separation and a relativistic wake formation when thepropagating laser pulse duration is in resonance with the plasma oscillation. The amplitude of theaccelerating field, Ea, due to the charge separation in a plasma wave reaches
TABLE 1. Ea[V/Characteristics of Solid State and CO2 Lasers
cm cm (1)
PARAMETER
Bandwidth (THz)Cross section (xlO'20
cm2)Gain (%/cm)Saturation energy(J/cm2lStored energy (J/cm3)Active volume (cm3)Maximum efficiency(%)Average power (W)
Solid State
5-501-30
-501-20
110-100
10
10
10-atm CO2
15
3-40.5
0.0110,000
20
10,000
where ne is electron density in plasma, and a isthe dimensionless laser vector-potential
a=eEL/mc6)=03EL\TV/m]Jl[[\iml (2)From Eqs.(l) and (2) we see that a 10-um CO2
laser is capable of producing an acceleratinggradient at least 10 times higher than the l-pmlaser of the same intensity. This is due to thestronger ponderomotive potential of plasmaelectrons oscillating in a lower-frequencyelectromagnetic field.
Using 1-um laser pulses of a shorter duration andat correspondingly higher plasma densities helpto compensate for the low ponderomotivestrength and attain high acceleration gradients.However, the maximum number of particles perbunch, Ne, at the limit when the bunch self-field
does not effect the plasma wake structure, drops proportionally to the plasma
wavelength: Ne oc Xp oc n~in. This becomes especially important when we consider a prospective
design of the LWFA stages for the future TeV e-e+ collider [6] where the most critical characteristic,luminosity
A = N2eft/47va2
±, (3)
(where ^is a number of bunches per train,/is the linac repetition rate, and ax is the e-beam cross-section
at the interaction point) is proportional to N].Another potential advantage of using a longer period plasma wave is that it facilitates fitting of the
electron bunch inside the small portion of the wake period thus ensuring the good beam quality (smallenergy spread and emittance). For example, at ti=\ ps and the resonance plasma wavelength ^=600 ^mthe desirable electron bunch duration is ri<200 fs. Contemporary photocathode RF guns tend to approachthese requirements. In particular zj,=370 fs electron bunches of 2.5xlO8 electrons, Ap/p = 0A5%, and£^=0.5 mm.mrad have been demonstrated with the ATF photocathode RF gun [7].
- 1 2 8 -

JAERI-Conf 98-004
Provided methods of plasma channel formation are available, compact (~1 m) LWFA of severalGeV energy driven with the technically feasible ~50 TW lasers may become a reality. Staging of suchaccelerators permits the new generation of TeV-class e'-e+ colliders less than 1 km long.
2.2. Table-Top Laser Synchrotron Source
Synchrotrons equipped with wiggler magnets are the sources of x-ray fluxes at a level of 1018
photon/sec. According to another approach to a relatively compact high-brightness x-ray generator calledlaser synchrotron source (LSS), the laser beam acts on relativistic electrons as an electromagnetic wigglerwith a period 104-105 times shorter than the magnetic undulator. Thus, LSS produces proportionallyheavier photons than a conventional synchrotron source operating at the same e-beam energy. Similarly,LSS permits significant downsizing of the electron accelerator.
A combination of a high-gradient LWFA with LSS may open a route to table-top wakefield LSSoperating in x-ray and gamma regions. Proof-of-principle table-top LSS may be realized at the ATF usingthe 5-TW CO2 laser and a 5 MeV photocathode electron gun. The CO2 laser beam is split into two beamsthat serve to drive both LWFA and LSS as is shown in FigA PIC simulations predict 250 MeVacceleration when a 4 TW CO2 laser beam is focused into the waveguide with parameters shown in Table 2[8]. At the exit of the waveguide, electrons accelerated in the plasma wake field interact with the secondCO2 laser beam, generating an x-ray flux orders of magnitude above numbers obtained with conventionalsynchrotron light sources.
CO2 Laser Beam 1
opticaldelay
focusingquadruples
FIGURE 4. Table-top laser wakefield x-ray source
TABLE 2. Design Parameters for Table-Top LSS
RFGun
i LWFA1 Initial Electron Energy [MeV]j Bunch Charge [nC]! Bunch Duration FWHM [fs]I Laser Peak Power [TW]j Laser Pulse Duration [ps]| Plasma Density [cm'3]1 Channel Radius [urn]| Channel Length [cm] j! Energy Gain [MeV) i
5 i0.1 I300 i4 S3 I3.5xlO16 160 |4 !250 |
i LSS! Laser Peak Power [TW]1 Laser Pulse Duration [ps]! Laser Focus Radius [um]! X-ray Photon Energy [keV]! Angular Spread [mrad]! Spectral Bandwidth [%]1 X-ray Pulse Duration [fs]! X-ray Photons per PulseI X-ray Peak Flux [photons/s]
1 !3 i30 I470 !0.1 . j0.2 I300 i3xlO9 110 2 2 1
- 1 2 9 -

JAERI-Conf 98-004
2.3. Gamma and Positron sources for Linear Colliders
By Compton backscattering of the laser photons from the TeV electron beam, a high brightnessTeV photon beam can be created. It opens an opportunity to study a variety of interaction processes bycolliding e", e+ and y beams in any combination and at independently controlled polarization.
The expression for the maximum gamma photon energy for linear Compton backscattering isho)r=(x/x + i)Ee, (4)
where Ee is the electron energy, and x = 4Eeho)/m2c4 . At x » l , the Compton photon energyapproaches the electron energy, hcoy «Ee . For CO2 laser, x=l at Ee=0.5 TeV. Thus, the long wavelength
of the CO2 laser used for the e±=>y converter at Ee=2.5 TeV does not degrade <or to compare with shorterwavelength lasers. Capable of high average power and delivering ten times more photons than solid state
lasers of the similar energy, CO2 lasers permit ultra-high intensity y-sources.
The strong requirement to the laser wavelength isset by rescattering of gamma photons on the laserbeam into pairs through the reaction y+/l=>e"+e+. Thisoccurs when mco7 > m2c*jh2. Based on this
condition, the optimum laser wavelength is derived:A[^un]=4.2Ee[TeV]. Thus, for the 2.5 TeV collider thelaser with /l=10.5 urn is the optimum choice.
Lasers may be used also in polarized positronsources for e-e+ collider. Here, the backward Comptonscattering serves as an intermediate process followedby pair production on a target. Polarization of theproduced particles is controlled by the input laserbeam. Picosecond CO2 lasers have been selected as theoptimum choice for the Japan Linear Collider [9]. Bothapplications described in this paragraph are illustratedbyFig.5.
FIGURE 5.Electron-gamma converter and polarized
positron source for future electron-positroncollider
REFERENCES
1. C. Roland and P.B. Corkum, J. Opt. Soc. Am., B3,1625 (1986)2. I.V. Pogorelsky, et al., "The First Terawatt Picosecond CO2 Laser for Advanced Accelerator Study at
the Brookhaven ATF", Proceedings of 7th Advanced Accelerator Concepts Workshop, Lake Tahoe,CA, October 12-18, 1996, to be published
3. P.B. Corkum, IEEE J. Quant. Electron., QE-21,216 (1985)4. C.E. Clayton, N.A. Kurnit, D.D. Meyerhofer, Nucl. Instr, & Methods Phys. Res., A355, 121 (1995)5. T. Tajima & J.M. Dawson, Phys. Rev. Lett. 43,267 (1979)6. I.V. Pogorelsky, "Prospects for Laser Wakefield Accelerators and Colliders Using CO2 Laser Drivers",
Nucl. Instr. & Methods Phys. Res., A, to be published7. X.J. Wang, X. Qui, and I. Ben-Zvi, Phys. Rev. E, 54, R3121 (1996)8. S.V.Bulanov, et al,IEEE Trans, on Plasma Sci., 24, 393 (1996)9. T.Okagi,etal,Jpn.J.Appl.Phys. 35, 3677(1996)
- 1 3 0 -

JAERI-Conf 98-004
18. Next Generation Chirped Pulse Amplification
John NEES, Subrat BISWAL, Gerard MOUROUUniv. Michigan, Center for Ultrafast Optical Science , 2200 Bonisteel, 10061ST, Ann Arbor, MI 48108, USA
Akihiko NISHIMURA, Hiroshi TAKUMAJapan Atomic Energy Research Institute, 2-4 Shirane, Tokai-mura, Naka-gun, Ibaraki-ken 319-11, Japan
ABSTRACTThe limiting factors of Chirped Pulse Amplification (CPA) are discussed and experimental results of CPA in
Yb:glass regenerative amplifier are given. Scaling of Yb:glass to the petawatt level is briefly discussed.
KEYWORDSYtterbium Glass, Chirped Pulse Amplification , Petawatt Lasers, High Energy Storage Density Laser Materials
1. Next Generation Chirped Pulse AmplificationRecent advances in high power lasers using Chirped Pulse Amplification (CPA) have
generated a growing interest in studies of High-Field Science. This field supports research inhigh-harmonic generation, solid-density plasma physics, relativistic plasma dynamics, laserwakefield acceleration, and coherent control of chemical dynamics, as well as other subjects.One factor driving these topics is the fact that the technology for building table-top terawattlasers is available to institutes and universities for an affordable price. Future high-power laser
100
CM
l a
1I§11
10.0
1.00 r
^ , , , ,
!VNd:gl
= 100
1 " " '
# YbrglassS. # Alexandrite
1 PW/cm \
Cr:LiSAFS. I
TW/an^N^j
1 . . . . .0.100100 10 1
minimum pulsewidth (fs)Figure 1. Theoretical peak power for various materials for operation at saturation fluence and assuming a minimumpulse duration inversely related to the emission bandwidth.
1 3 1 -

JAERI-Conf 98-004
systems made for high-field studies will need to be based on new solid-state gain media withexcellent energy storage capability and laser diode pumpability. In this paper we will attempt toestablish a direction for the development of these sources in such a way that they will continue tobe available to a broad range of researchers. The potential to scale these compact designs toachieve unprecedented intensities will also be discussed.
Using the technique of chirped pulse amplification (CPA) with solid-state laser materialshigh peak power laser systems have been reduce in size from the scale of a building to fit on anoptical table. This advancement is a result of the reduction in pulse duration from thenanosecond to the subpicosecond range and a corresponding reduction of energy from the kilojoule level to well below a joule. To choose the best material for high field generation there are anumber of parameters which must be considered; the saturation fluence of the gain material,which is a measure of the energy which can be extracted from the material; the gain-bandwidth,which provides a measure of the inverse of the pulse-width which may be obtained; and thefluorescence lifetime, which provides a measure of the maximum pump-pulse duration. In orderto build a scalable system it is also necessary to choose a material with an absorption bandcompatible with high power laser diodes.
2. Theoretical LimitsThe theoretical limit of peak power for a given aperture of gain material is given by the
saturation fluence, hv/<7, divided by the minimum pulse duration, xp. As shown in figure 1 peakpowers in excess of 1 PW/cm2 could theoretically be extracted from Yb:glass.
1000
0.1000
i 11 ii mi i rxri I HI i I i m i l i 111 IIIII r I m i s
i i mini i 11 mill i M mill i i i mill i M I mil i i
0.001 0.01 0.1 1 10 100 1000
pulse duration (ns)Figure 2. General scaling law for damage in laser materials. Saturation fluences for Ti:sapphire and Yb:QX areshown as guides.
3. Damage ThresholdThis limit excludes the damage threshold of the laser material which scales as the inverse
square-root of pulse duration in the picosecond and nanosecond regimes. It was in order to avoidnonlinear effects and damage at high intensities that CPA was developed. The level of opticalfluence which induces damage may be approximated empirically by the relation Jth=10 J/cm2 x
- 1 3 2

JAERI-Conf 98-004
(^stretched)1'2, where Jth is the damage fluence threshold in J/cm2 and Tstretched is the pulse durationin ns. Stretching the ultrashort optical pulse to avoid the low damage threshold of femtosecondpulses, it is possible to efficiently extract energy at or near the saturation fluence of many solid-state materials. It is clear from figure 1 that Yb:glass is superior to other CPA candidates in itsenergy storage density and that its bandwidth is sufficient for operation the sub-100-femtosecondregime. In addition, the damage threshold scales inversely with the radius of the beam. Thisfurther increases the desirability of working with a small aperture system having high energystorage density.
4. Yb: glass CharacteristicsAnother characteristic which makes Yb:glass especially well suited for advancement of
lasers in High-Field Science is its long excited state lifetime. It is capable of integrating pumplight over an interval of 2 ms. This is 600 times longer than Tksapphire. As a result the pumppower requirements for Yb:glass are significantly lower than those of Ti:Sapphire. To date wehave operated a diode pumped modelocked oscillator producing pulses as short as 60 fs and adiode-pumped Q-switched amplifier laser with 10 uJ output.
Spectral Characteristics of Yb .phosphate glassFluorescence spectran
- - - - - Absorption spectrum
1
0.8
0.6
0.4
0.2
0
i i
i
*
1i
ii
li
il
li
ii
li
ii
li
ii
! p im
IN
,p
.. •
1
1.
. i
..
. i
..
. i
..
.
No excited stateabsorption
Snail quantumdefect
2 nslifeline
easy tomake
900 950 1000 1050 1100vavelength(nm)
Figure 3 Absorption and emission curves for Kigre Yb:QX glass doped at 15% wt.
The features of Yb:glass (Kigre Yb:QX glass 15% by wt. Yb2O3) including the emissionand absorption spectra are shown in figure 3, Note the broad absorption and emission bands.The breadth of the absorption band from 920 to 965 nm is advantageous for diode pumpingbecause it is much broader than the wavelength variation found in current laser diodemanufacturing. Also the emission band in Yb:QX is near the absorption band so there is a lowquantum defect of only 7 to 9%. The laser transition shown in the inset is quite simple allowingno excited state absorption and a long (2ms) excited-state lifetime.
The peak emission cross section of the Yb ion in this glass is 0.6 x 10'20 cm2., while otherglasses may be found which have cross sections at 1.03 of 1.3 x 10~20cm2. Saturation fluence at1.03 jxm in Yb:QX is 70 J/cm2. This poses a problem for the use of Yb at saturation fluence. Todo so would require stretching the signal pulse to 50 ns. Rather than pressing to such a highenergy density it is more useful to relax the extracted energy to an acceptable level near the
- 1 3 3 -

JAERI-Conf 98-004
damage threshold for a pulse duration which may reasonably be achieved. Presently, 2 ns pulsemay be obtained by using 22-cm gratings for stretching and compression. This sets the damagethreshold near 20 J/cm2. If the system is operated with a 50% safety margin a fluence of 10J/cm2 is incident on the gain material. Though operation below the saturation fluence lowers thetheoretical peak power per cm2 of aperture, the energy storage density and diode pumpability ofYb:glass still makes it the best material for new CPA systems.
5. Working Below Saturation FluenceEfficient extraction of energy at a fluence much below the saturation fluence can also
reduce the requirements for pump intensity. To efficiently extract energy stored in the laser gainmaterial with out approaching the saturation fluence requires that the energy per cm2 stored bebelow the saturation energy. This in turn limits the laser to low gain operation with low losses.The low gain condition may be achieved by pumping with lower intensity. Hence, the pumpintensity requirement is lowered.
Yb:glass Chirped Pulse Amplification Laser SystemCa\ity Dumped
Output15 mJ
76 MHz. 100 mW/* ModelocKedI Tl:sapphire
1030 nm
5Hz.200mJ940 nm
Figure 4 Experimental layout demonstrating CPA in Yb:QX glass. The blocks designated PC and TFP refer to thePockels cell and thin film polarizer respectively.
40
£20CD
3-ioO 5
0
r Free-runningL laser output
Repetition Rate = 5 Hzj
slope efficiency = 40%:
40 60 80 100 120 140 160Absorbed pump energy (mJ)
Figure 5 Output of the free-running Yb:QX amplifier without polarizer or Pockels cell in cavity .
- 1 3 4 -

JAERI-Conf 98-004
6. Experimental ResultsTo test the capability of Yb: glass for CPA a flashlamp-pumped Ti:Sapphire laser was
used to simulate a laser diode pump source. The experimental configuration is shown in figure4. Removing the PC and the TFP and operating the Yb:QX laser as a free-running laser a slopeefficiency of 40% was obtained with an efficiency of greater than 28% with respect to (w.r.t.)absorbed pump energy. When a TFP (8% per pass loss) and PC (1% per pass loss) were addedthe losses were increased to approximately 20% per round trip. In this configuration anefficiency of nearly 10% w.r.t. absorbed pump energy was obtained. Using the regenerativeamplifier to amplify seed pulses from a modelocked source 8 nm bandwidth at 15 mJ wasobtained without spectral filtering while 13 nm at 8 mJ was obtained with the use a thin intra-cavity etalon. These experiments operated with an absorbed pump fluence of about 50J/cm2 anda signal fluence of about 7 J/cm2. By reducing the intra-cavity losses to 5% the efficiency shouldbe increased to 20%.
7. ScalablitiyThese results can be scaled by increasing the pump energy and the size of the gain
aperture. As the gain aperture is scaled up the aperture of the remaining elements of theamplifier should also be increased. Extending amplification to the joule level it is expected that a10 TW laser with 100 fs pulses can be obtained using a flashlamp-pumped Ti: sapphire laser.Scaling to the petawatt and beyond will require more energetic pump sources and a greaterconcentration on the control of dispersion to obtain a system with >40 J in 40 fs, operating at20% efficiency w.r.t. absorbed pump energy (200 J). A petawatt laser based on this technologywill require a gain-aperture only 3-cm in diameter and temporal pulse stretching of 5 x 10⁴ from40 fs to 2 ns. A pump source of >200 J with a sub-ms pulse duration is also needed. Whilestacked laser diode pump configurations have demonstrated 35kW/cm2 intensities at wavelengthscompatible with the Yb:QX-based CPA laser a further discussion of these technologies is outsidethe scope of this paper.
8. ConclusionWe have reviewed the factors critical to producing diode-pumped table-top CPA systems
with scalability beyond the petawatt level. Experiments using a flashlamp-pumped Ti:sapphirelaser to simulate laser-diode pumping of Yb:QX glass have produced 15 mJ and 8 nm bandwidthand 8 mJ with 13 nm bandwidth. We conclude that Yb:glass is an excellent candidate for thenew generation of diode-pumped table-top lasers and that it has the potential to scale into thepetawatt range.
[1] D. Strickland and G. Mourou, Opt. Commun. 56,219,1985.
[2] S. Biswal, F. Duron, J. Nees, G. Mourou, A. Nishimura, "Ytterbium:glass CPA regerative
amplifier pumped by a free-running laser", CThCl CLEO 1997, Baltimore, May 1997.
[3] S. Biswal, J. Nees, G. Mourou, A. Nishimura, "Efficient gain-switched operation of a highly-
doped Yb:phosphate glass laser," OSA TOPS Vol. 10 Advanced Solid State Lasers, 1997, C.
Pollack and W- Bosenberg, eds., 119-121.
- 135 -

JAERI-Conf 98-004
19. Flashlamp Pumped Ti-sapphire Laser for Ytterbium GlassChirped Pulse Amplification
Akihiko NISHIMURA, Akira OHZU, Akira SUGIYAMA, Yoichiro MARUYAMATakashi ARISAWA, Hiroshi TAKUMA
Japan Atomic Energy Research Institute, 2-4 Shirane, Tokai-mura, Naka-gun, Ibaraki-ken 319-11, Japan
Edward ERICKSONEEA, 634 W:Vista Hermosa Dr., Green Valley, AZ 85614, USA
Susumu OWADA, Sousuke SATOURASEL, 478 Nibukata-cho, Hachioji-shi, Tokyo 193, Japan
John NEES, Subrat BISWAL, Gerard MOUROUUniv. Michigan, Center for Ultrafast Optical Science , 2200 Bonisteel, 10061ST, Ann Arbor, MI 48108, USA
ABSTRACTA flashlamp pumped Ti: sapphire laser is designed for ytterbium glass chirped pulse amplification. A high
quality Ti:sapphire rod and a high energy long pulse discharging power supply are key components. Theprimary step is to produce the output power of 10 J per pulse at 920 nm.
KEYWORDS Ti:sapphire, Flashlamp Pumping, Free Running, Ytterbium Glass, Chirped Pulse Amplification
Chirped Pulse Amplification (CPA) [1] is now widely used as a technique for extracting
energy from solid-state laser material to achieve ultrahigh peak power. The CPA has been
applied to demonstrate the range of Peta-watt of ps duration by Nd:glass amplifiers [2]. In the
ultrashort pulse duration region of less than 20 fs, the peak power from a Ti:sapphire CPA
laser system is now coming to 100 TW [3]. Such a high peak power laser can open the new
research fields, such as laser wakefield generation, solid-density plasma studies, hard X-ray
laser and y-ray generation, which are called High Field Science.
Solid-state material having high saturation fluence, wide bandwidth and long upper state
radiative lifetime is attractive as high peak power CPA. Ytterbium doped glass is a
challenging material, having over 30 J/cm2 high saturation fluence, 50 nm bandwidth and 2
ms upper state radiative lifeime. The long radiative lifetime makes it possible to pump
Yb:glass directly by laser diodes. The laser diode pumped Yb:glass CPA laser should be very
compact and efficient. For now, however, it is reasonable to use a flashlamp pumped free-
running laser as a high energy pumping source due to the costly laser diodes. The authors
have successfully demonstrated regenerative CPA of Yb: glass using the flashlamp pumped
free running Tksapphire laser[4]. This laser made by ELIGHT having the output energy of
300 mJ /pulse at the wavelength of 920 nm was used. The output pulse energy of 15 mJ from
the regenerative amplifier was achieved. For Yb:glass multipass amplifiers, higher output
energy pulse of the free running pumping laser is required.
- 1 3 6 -

JAERI-Conf 98-004
Flashlamp pumped Ti:sapphire lasers have attracted much attention. By Q-switching
operation and frequency conversion, those can cover the wavelength ranging from IR to UV.
Many technical innovations have been achieved, such as high quality Ti: sapphire rods, high
speed switching power supplies, high efficiency pumping chambers, long lifetime flashlamps,
and UV - visible fluorescence converters. Based on these innovations, the output energy 5.7 J
/pulse at the wavelength of 800 nm has been achieved by free running operation [5]. The total
efficiency up to 2 % has been obtained.
Our focus is directed towards the development of flashlamp pumped Tksapphire lasers
for pumping the Yb:glass. High energy and long pulse operation are suitable for this purpose.
Brown and Fisher have reported the 6.5 J output energy of 7 (is at 800 nm, pumping a
Ti:sapphire rod with cylindrically arranged six flashlamps [6]. Although the laser head and
the power supply were not optimized for free running operation, the total efficiency of 0.5 %
was obtained. The following laser system based on the previous work is capable to produce
higher output energy and higher total efficiency for Ybrglass pumping[5].
deionizer + deoxygenizer
Prism
Chiller
Cooling Water Circulation
/
Uiptical Silver Reflector
HR Mirror
Output Coupler
to Amplifier
High Voltage Capacitor
Charging Power Supply j
"^Plastic Filter
*Ce:Quartz Plate
[Simmer Supply
Ignitron
Figure 1 Schematic View of Flashlamp Pumped Ti:sapphire Laser System
(1) Laser Head
A laser head has a single-elliptic pumping chamber made of a silver block. Ultraviolet
cutting filters were placed between a flashlamp and a Ti:sapphire rod in the chamber. Ther
flashlamp made by ILC Technology was 450 Torr Xenon filled type, having a double wall
made of cerium doped quartz. The double wall of this lamp and the UV cutting filters can
protect the Tksapphire rod from UV radiation. The pumping chamber was filled with
deionized flowing water which can maintain the high reflectivity. Based on the Czochralski
crystal growth technique, the Ti: sapphire rod of 190 mm length and 8 mm diameter doped at
0.1% has been fabricated by Union Carbide. The single pass loss at 920 nm less than 8% is
- 1 3 7 -

JAERI-Conf 98-004
requested. Both faces of the rod have AR coated. A prism is placed in a laser cavity for
wavelength selection for lasing at 920 nm for Yb:glass pumping.
(2) Power Supply
A power supply consists of a master controller, a charging unit, simmer circuits, pulse
forming networks and main discharging units. The flashlamp is conditioned prior to a main
discharge by a simmer discharge. The plasma generated by the simmer discharge fills the
inner bore of the flashlamp can stabilize the main discharge. An ignitron (mercury vapor
switch) was used in the main discharging unit. The charging voltage of 5 - 10 kV can be
varied continuously. In order to change the discharging duration, the capacitance of the main
discharging unit is designed to be switchable. The energy of 810 J stored in a capacitor was
successfully discharged through the ILC double wall flashlamp at 1 Hz repetition rate. The
140 (is discharging duration at 10 % current on was obtained using a 65 |jF capacitor. The
power supply has two sets of the main discharging units. Each unit drives an oscillator laser
head and an amplifier laser head respectively.
The wide tunabiliy of Ti:sapphire lasers can cover a broad absorption spectrum of
Yb:glass ranging from 900 nm to 975 nm. The laser system which can produce the output
energy of over 10 J /pulse at 920 nm is being assembled for the purpose of high energy
Yb: glass OP A. To get much higher energy, it is expected to extend the explosion limit of
flashlamps and to improve the direct bonding technique of Tksapphire crystals to fabricate a
long uniform rod.
Acknowledgment
The authors thank Dr. Milan Kokta of Union Carbide for helpful discussions about high
quallity Ti:sapphire rods.
Reference
[1] D.Strickland and G.Mourou, Opt. Commun., "Compression of amplified chirped optical
pises", 56, 219,1985.
[2] M.Perry, B.Stuart, G.Tietbohl, J.Miller, J.Britten, R.Boyd, M.Everett, S.Herman,
H.Nguyen, H.Powell, B.Shore, "The petawatt laser and its application to inertial confinement
fusion", CWI4 CLEO 1996, Anaheim, June 1996.
[3] K.Yamakawa, M. Aoyama, T.Itoh, T.Matoba, H.Takuma, "Development of a repetitive
ultrahigh peak power, ultrashort pulse Tirsapphire laser system", TuE5 CLEO Pacific Rim,
Makuhari, July 1997.
[4] S.Biswal, F.Duron, J.Nees, G.Mourou, A.Nishimura, "Ytterbium:glass CPA regerative
amplifier pumped by a free-running laser", CThCl CLEO 1997, Baltimore, May 1997.
[5] E. Erickson, "State of the Art and Future Potential of the Flashlamp Pumped Ti: sapphire
laser", TiS conference, Big Sky MT, August 1992.
[6] A.Brown and C.Fisher, "A 6.5-J flashlamp-pumped Ti:Al2O3 laser", IEEE J. Quntaum
Electron. 29, 2513,1993.
- 1 3 8 -

JAERI-Conf 98-004
20. Efficient Chirped-Pulse Amplification of Sub-20 fs Laser Pulses
Shinichi MATSUOKA and Koichi YAMAKAWA
Advanced Photon Research Center, Kansai Research EstablishmentJapan Atomic Energy Research Institute
2-4 Shirakata-Shirane, Tokai, Naka, Ibaraki, 319-11, Japan
ABSTRACT
We have developed a model for ultrabroadband and ultrashort pulse amplification including the
effects of a pulse shaper for regenerative pulse shaping, gain narrowing and gain saturation in the
amplifiers. Thin solid etalons are used to control both gain narrowing and gain saturation during
amplification. This model has been used to design an optimized Tirsapphire amplifier system for
producing efficiently pulses of < 20-fs duration with approaching peak and average powers of
100 TW and 20 W.
Keywords: Chirped Pulse Amplification, GainNarrowing, Gain Saturation, Regenerative Pulse Shaping
1. INTRODUCTION
Recently, there has been much interest in the development of high-peak-power, ultrashort
pulse laser systems for investigations of high-field interaction and atomic physics [1]. Utilization of
solid-state materials in conjunction with the technique of chirped pulse amplification (CPA) can
produce high energy, ultrashort pulses [2-5]. The large gain bandwidth materials such as Ti:sapphire
(Ti:Al2O3) and CnLiSAF, which permits the capability of femtosecond pulse generation and
amplification. In fact, Ti .-sapphire has a largest gain bandwidth (~ 230 nm FWHM) which corresponds
to the transform limited pulse duration of ~ 3 fs [6]. However, in most terawatt Ti:sapphire CPA
systems, a net gain of > 108 is necessary to reach the desirable amplified pulse energy. Because of the
frequency dependent gain profile, this amplification leads to gain narrowing of the pulse spectrum
[7,8]. A reduction in gain bandwidth not only reduce the stretched pulse duration but also results in a
longer pulse after compression.
The most recent evolution in ultrashort pulse CPA systems has been the utilization of
regenerative pulse shaping to eliminate gain narrowing [9,10]. With this technique the pulse duration
of the amplified, compressed pulses has been reduced by a factor of 2, reaching now 16 fs at a
multiterawatt level [11]. This is conveniently accomplished in regenerative amplification schemes by
placing a frequency dependent attenuator inside the amplifier cavity.
It is also desired to optimize the amplifier to achieve the highest possible output energy for a
given pump energy. In principle, Ti:sapphire lasers can achieve extraction efficiencies that approach
~ 57%; most Ti:sapphire CPA systems, however, achieve only 10 - 30% efficiency. To achieve
theoretical maximum quantum efficiency, one must operate the amplifier above the saturation fluence
- 1 3 9 -

JAERI-Conf 98-004
of the laser materials [12]. While operating at these fluences, one also needs to maintain a low
intensity in the amplifier, since the damage threshold of amplifier materials is ~ 5 GW/cm2. Dividing
fluence by intensity, the pulse duration in the amplifier must be at least 300 ps for Titsapphire. Most
Ti:sapphire CPA lasers use stretched pulse durations that are well below 300 ps and therefore are
unable to operate at the high fluences necessary for efficient amplification.
Here we present our detailed analysis that govern the chirped-pulse amplification including
the effects of a pulse shaper for regenerative pulse shaping, gain narrowing and gain saturation in the
Ti:sapphire amplifiers in order to obtain the shortest compressed pulse, while simultaneously increasing
the amplifier efficiencies.
2. MODEL FOR ULTRASHORT PULSE AMPLIFICATION
In our model we assume that 1) a gain medium is a homogeneously broadened two-level
system, 2) an exited-state lifetime is much longer than the laser pulse duration, and 3) pump beam
distributions and population inversion densities are uniform.
For a frequency chirped pulse, the emission cross-section, c^coQ)], is consider to be a function
of instantaneous frequency co(t). The basic equations for the pulse intensity, I(z,t), and the population
inversion, Nfat), can be written in the forms [13]
^ p ( z , t ) (1)and
where ti is Planck's constant, and 2* is a dimensionless population saturation factor with values
between 1 (lower level empties out rapidly) and 2 (lower level bottlenecked). The total inverted
population per amplifier area is defined as
i
Nu(t)mjN(z,y)dz, (3)o
where L is the length of the amplifier. Equation (1) can be rearranged and integrated over the length
of the amplifier and then be expressed in the form
(4)
where IJt) and /out(0 are the input and output intensities, respectively. Therefore the time-varying
gain, G(t), including gain narrowing and gain saturation at any instant within the pulse is given by
G(t) = ^ = exp{<7[fl>(0] • AUO) • (5)
Here gain narrowing is a function of the emission cross-section and gain saturation is a function of the
population inversion. Equation (2) can also be integrated over the amplifier length and then rewritten,
- 1 4 0 -

JAERI-Conf 98-004
using Equation (1), in the form
(6)
Equation (6) can be solved numerically. Using the solved NM(t), the instantaneous gain and the
output intensity can also be obtained from Equations (5) and (6). The initial value of the population
inversion is given by
^,(0) = f ^ S (7)
where rj is the coupling efficiency, .Fabs is the pump fluence absorbed by the amplifier crystal, and cop
is the pump frequency.
In the cases of the regenerative amplifier and the multi-pass amplifier, the input intensity,
iJ^Xi), and the output intensity, /out*))(/), per pass/? in the amplifiers are related by
(8)
where Loss is the loss coefficient per pass, and T[a)(t)] is the frequency-dependent single-pass
transmission function of the spectral filter for regenerative pulse shaping in the regenerative amplifier
or unity for the multi-pass amplifier. We do not take into account wavelength-dependent reflectance
and transmission of the optics in the amplifiers, since their bandwidths are relatively large. The input
intensity and the population inversion for the next pass p+1 are, respectively, given by
and
<1) <?). (10)
3. DESIGN AND OPTIMIZATION OF TI: SAPPHIRE AMPLIFIERS TOWARDS A100 TW
We have recently developed a compact 2-stage Ti:sapphire amplifier system that has produced
16-fs 10-TW laser pulses at a 10-Hz repetition rate [11]. This system consists of a Ti:sapphire
oscillator, a pulse expander, a regenerative amplifier, a 4-pass amplifier, and a pulse compressor. In
the present system, the output of the four pass Ti:sapphire amplifier is then introduced into a final
double-pass amplifier which is designed to produce >3 J of radiation. An optical layout of an
upgraded 100 TW laser system is shown in Fig. 1. The output of the Ti:sapphire double-pass
amplifier is passing through a spatial filter and then introduced into the final vacuum compressor.
We have modeled to optimize the performance of the double-pass amplifier using Equations
(5) to (10) in order to obtain the largest bandwidth of the amplified pulses, while simultaneously
extracting as much energy as possible. Calculated spectra after each amplifier are shown in Fig. 2.
141 -

JAERI-Conf 98-004
100TW,2Ofs, 10 HzTo exp erimen tal area
Regenaratlve Amplifier
Fig. 1. JAERI100 TW, 20fs, lOHz Ti:sapphire laser system.
1.2
(0= 0.8
oz
0.4
0.2
^ 1
0.9
0>
0.8 o3
0.7 3
(A
0.6 £2.o
0.5
0.4700 750 800 850
Wavelength [nm]900
Fig. 2. Calculated spectra after a regenerative amplifier (dashed curve), a four-pass amplifier(dotted curve) and a double-pass amplifier (solid curve). Representative single-passtransmission curves for a 2.2 micron (solid curve) and a 2.3 micron (dashed curve)nitrocellulose etalon (angles of incidence 44 and 39 deg, respectively).
The spectrum after the pulse expander is used for the initial pulse to perform this calculation. Three
amplifiers are pumped by 50 mJ, 700 mJ and 7 J of 532 nm radiation, respectively. Two solid etalons
(thicknesses of 2.2 jum and 2.3 ,um) are used in transmission and is angle tuned so as to be off
resonance around the peak of the gain profile of Ti:sapphire in the regenerative amplifier. In this
- 1 4 2 -

JAERI-Conf 98-004
calculation, incidence angles of the two etalons are set to be 39° and 44°, respectively. It is clearly
seen that it is not desirable to center the wavelength of the pulses at 800 nm in the regenerative and
four-pass amplifier stages, since the effect of gain saturation causes the pulse spectrum to severely
red-shift from the peak of the gain in the double-pass amplifier. In contrast, the broad amplified
bandwidth at the high energy level can be obtained by positioning the input spectrum on the short
wavelength side of the desired output. The bandwidth and output energy of the amplified pulse that
we modeled are -80 nm and ~ 3.6 J, respectively. In this case, a conversion efficiency of 532-nm
pump light to 790-nm radiation is reached to over 90% of the theoretical maximum quantum efficiency.
The calculated output energies and intensities after each amplifiers are also given in Table 1.
The duration of the transform limit, as calculated from the amplified spectrum after the
double-pass amplifier is 17 fs as shown in Fig. 3. The energy of the compressed pulse is expected to
be > 2 J according to the measured diffraction efficiency of the pulse compression gratings, which
implies a peak power for the laser pulse of > 100 TW.
-20 0 20
Time [fs]
Fig. 3. Transform-limited pulse shape corresponding to the spectrum afterthe double-pass amplifier (FWHM 17fs).
Table 1. Calculated gains, energies and intensities after each amplifiers.
Regenerativeamplifier
4-passamplifier
Double-passamplifier
Gain - 1 0 ' -40 -10
Output energy -8 ml -320 mJ -3.6 J
Output intensity -0.9 GW/cm2 ~2.9GW/cm2 ~4.5GW/cm2
- 1 4 3 -

JAERI-Conf 98-004
4. CONCLUSION
In conclusion, we have developed a simple model for ultrabroadband and ultrashort pulse
amplification including the effects of a pulse shaper for regenerative pulse shaping, gain narrowing
and gain saturation in the Ti: sapphire amplifiers in order to obtain the shortest compressed pulse,
while simultaneously increasing the amplifier efficiencies. This model has been used to design an
optimized Ti:sapphire amplifier system for producing efficiently pulses of < 20-fs duration with
approaching peak and average powers of 100 TW and 20 W.
5. REFERENCES
1. M. D. Perry and G. Mourou, "Terawatt to Petawatt Subpicosecond Lasers," Science, vol. 264,
pp. 917-924, 1994.
2. D. Strickland and G. Mourou, "Compression of amplified chirped optical pulses," Opt. Commun.,
vol. 56, pp. 219-221, 1985.
3. K. Yamakawa, H. Shiraga, Y. Kato, and C. P. J. Barty, "Pre-pulse free 30-TW, 1-ps Nd:glass
laser," Opt. Lett., vol. 16, pp. 1593-1595,1991.
4. B. C. Stuart, M. D. Perry, J. Miller, G. Tietbohl, S. Herman, J. A. Britten, C. Brown,
D. Pennington, V. Yanovsky, and K. Wharton, "125-TW Ti:sapphire/Nd:glass laser system,"
Opt. Lett., vol. 22, pp. 242-244, 1997.
5. J. D. Kmetec, J. J. Macklin, and J. F. Young, "0.5-TW, 125-fs Ti:sapphire laser," Opt. Lett.,
vol. 16, pp. 1001-1003, 1991.
6. P. F. Moulton, "Spectroscopic and laser characteristics of Ti:Al2O3," J. Opt. Soc. Amer. B,
vol 3, pp. 125-133, 1986.
7. F. G. Patterson and M. D. Perry, "Design and performance of a multiterawatt, subpicosecond
neodymium:glass laser," J. Opt. Soc. Amer. B, vol 8, pp. 2384-2391,1991.
8. J. Zhou, C. -P. Huang, M. M. Murnane, and H. C. Kapteyn, "Amplification of 26-fs, 2-TW
pulses near the gain-narrowing limit in Ti:sapphire," Opt. Lett., vol. 20, pp. 64-66,1995
9. C. P. J. Barty, G. Korn, F. Raksi, C. Rose-Petruck, J. Squier, A. -C. Tien, K. R. Wilson,
V.V. Yakovlev, and K. Yamakawa, "Regenerative pulse shaping and amplification of
ultrabroadband optical pulses," Opt. Lett., vol. 21, pp. 219-221, 1996.
10. K. Yamakawa, T. Guo, G. Korn, C. Le Blanc, F. Raksi, C. G. Rose-Petruck, J. A. Squier,
V. V. Yakovlev, and C. P. J. Barty, "Techniques for controlling gain narrowing during ultrashort
pulse amplification," Proceedings of the SPIE - The International Society for Optical Engineering,
"Generation, Amplification, and Measurement of Ultrashort Laser Pulses H", vol. 2701,
pp. 198-208, 1996.
11. K. Yamakawa, M. Aoyama, S. Matsuoka, H. Takuma, C. P. J. Barty, and D. Fittinghoff,
"Generation of 16 fs, 10 TW pulses at a 10 Hz repetition rate with efficient Ti:sapphire
amplifiers," submitted to Opt. Lett.
12. L. M. Frantz and J. S. Nodvik, "Theory of Pulse Propagation in a Laser Amplifier," /. Appl.
Phys., vol, 34, pp. 2346-2349, 1963.
13. A. E. Siegman, Lasers. Mill Valley, CA: Univ. Sci., 1986, ch. 10.
- 1 4 4 -

JAERI-Conf 98-004
21. Development of Laser Diode-Pumped High Average Power Solid-State Laserfor the Pumping of Titsapphire CPA System
Yoichiro MARUYAMA, Kazuyoku TEI, Masaaki KATO, Yoshito NIWA,Sayaka HARAYAMA, Masaki OBA, Tohru MATOBA,
Takashi ARISAWA and Hiroshi TAKUMA
Advanced Photon Research CenterKansai Research Establishment
Japan Atomic Energy Research InstituteShirakata, Tokai-mura, Naka-gun, Ibaraki-ken 319-11, Japan
e-mail: maruyama@' hikari.tokai.jaeri.go.jp
AbstractLaser diode pumped all solid state, high repetition frequency (PRF) and high energy Nd:YAG
laser using zigzag slab crystals has been developed for the pumping source of Tksapphire CPAsystem. The pumping laser installs two main amplifiers which compose ring type amplifierconfiguration. The maximum amplification gain of the amplifier system is 140 and thecondition of saturated amplification is achieved with this high gain. The average power offundamental laser radiation is 250 W at the PRF of 200 Hz and the pulse duration is around 20ns. The average power of second harmonic is 105 Wat the PRF of 170 Hz and the pulse durationis about 16 ns. The beam profile of the second harmonic is near top hat and will be suitable forthe pumping of Tksapphire laser crystal. The wall plug efficiency of the laser is 2.0 %.
Keywords :Laser Diode, Nd:YAG, Zigzag Slab Crystal, Nonlinear Crystal, Master OscillatorPower Amplifier
1. INTRODUCTIONIn Japan Atomic Energy Research Institute (JAERI), X-ray laser and laser acceleration driven
by a high peak power laser has been studied. And as one of the high peak power lasers,development of high repetition rate Tksapphire CPA system has been carried out. Currently, ahigh average power Ti: sapphire CPA system has been pumped by A/O Q-switched solid statelaser in which Nd:YAG,or Nd:YLF crystal is pumped by arc-Iampl>2-3). Although these solid statelasers can be operated at very high pulse repetition frequency between 1 kHz and 5 kHz, theirpulse energy is limited to around 40 mJ because of the low energy of arc-lamp. Therefore, thepeak power and average power of CPA system is also limited around 0.1 TW and 5 W,respectively. Some effort has been carried out to produce higher average power with higher peakpower. However, to achieve laser performance with ultra-high peak power at the PRF of kHz forabove stated applications, the development of high energy and high PRF pumping laser isinevitable. Availability of high duty factor, high energy laser diode array leads to develop highrepetition frequency, high energy solid state laser with high efficiency. And so far, highperformance all solid state lasers have been developed4'5-6* for many applications such asprecision machining, X-ray photolithography, LIDAR, illuminator, etc. However, for thepumping laser of CPA system, high spatial and temporal stability as well as high average powerand high PRF are strongly required because the damage threshold of Tksapphire crystal is thesame order as the saturation fluence. Therefore, we have been developing laser diode pumped allsolid state laser for the Tksapphire CPA system7-85. In this paper, we report bur present status ofthe development of laser diode pumped all solid state laser which consists of an oscillator, apreamplifier, two post amplifiers which compose ring type amplifier system, and image relaytelescopes.
- 1 4 5 -
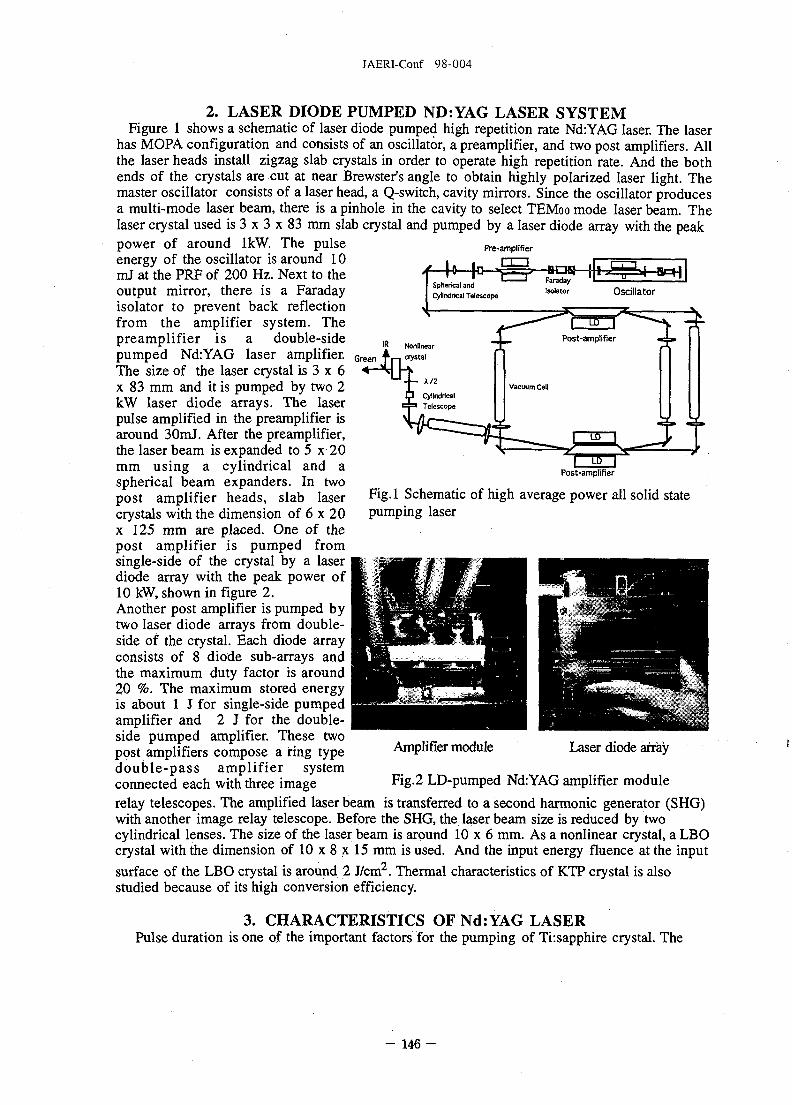
JAERI-Conf 98-004
2. LASER DIODE PUMPED ND:YAG LASER SYSTEMFigure 1 shows a schematic of laser diode pumped high repetition rate Nd:YAG laser. The laser
has MOPA configuration and consists of an oscillator, a preamplifier, and two post amplifiers. Allthe laser heads install zigzag slab crystals in order to operate high repetition rate. And the bothends of the crystals are cut at near Brewster's angle to obtain highly polarized laser light. Themaster oscillator consists of a laser head, a Q-switch, cavity mirrors. Since the oscillator producesa multi-mode laser beam, there is a pinhole in the cavity to select TEMoo mode laser beam. Thelaser crystal used is 3 x 3 x 83 mm slab crystal and pumped by a laser diode array with the peakpower of around lkW. The pulseenergy of the oscillator is around 10ml at the PRF of 200 Hz. Next to theoutput mirror, there is a Faradayisolator to prevent back reflectionfrom the amplifier system. Thepreamplifier is a double-sidepumped Nd:YAG laser amplifier.The size of the laser crystal is 3 x 6x 83 mm and it is pumped by two 2kW laser diode arrays. The laserpulse amplified in the preamplifier isaround 30mJ. After the preamplifier,the laser beam is expanded to 5 x 20mm using a cylindrical and aspherical beam expanders. In two
Post-amplifier
Fig.l Schematic of high average power all solid statepumping laser
post amplifier heads, slab lasercrystals with the dimension of 6 x 20x 125 mm are placed. One of thepost amplifier is pumped fromsingle-side of the crystal by a laserdiode array with the peak power of10 kW, shown in figure 2.Another post amplifier is pumped bytwo laser diode arrays from double-side of the crystal. Each diode arrayconsists of 8 diode sub-arrays andthe maximum duty factor is around20 %. The maximum stored energyis about 1 J for single-side pumpedamplifier and 2 J for the double-side pumped amplifier. These twopost amplifiers compose a ring typedouble-pass amplifier systemconnected each with three image F ig- 2 LD-pumped Nd:YAG amplifier module
relay telescopes. The amplified laser beam is transferred to a second harmonic generator (SHG)with another image relay telescope. Before the SHG, the laser beam size is reduced by twocylindrical lenses. The size of the laser beam is around 10 x 6 mm. As a nonlinear crystal, a LBOcrystal with the dimension of 10 x 8 x 15 mm is used. And the input energy fluence at the input
surface of the LBO crystal is around 2 J/cm2. Thermal characteristics of KTP crystal is alsostudied because of its high conversion efficiency.
3. CHARACTERISTICS OF Nd:YAG LASERPulse duration is one of the important factors for the pumping of Ti:sapphire crystal. The
Amplifier module Laser diode array
- 1 4 6 -

JAERI-Conf 98-004
pulse duration can be controlled bychanging the cavity length of theoscillator or pumping power. Byusing former method, higher pulseenergy with long pulse duration isexpected. Figure 3 shows the pulseduration as a function of the cavitylength. The squares and circles showthe pulse duration and averagepower, respectively. With the cavitylength of 30 cm, the pulse duration isaround 20 ns and the pulse durationof 50 ns is obtained at the cavitylength of 100 cm. The averageoutput power is almost constant andis about 10 W The triangles showsthe pulse duration at 532 nm. Thepulse duration at the cavity length of30 cm is around 18 ns and that at the
60
50
I 4°.1 30
£ 20
10
- ^ - P u U e duration (1064 nm)
A Pulse duration (532 nm)
# Average power
20
15
10
2
I
20 40 60 80
Cavity Length (cm)
100 120
1.5PRF:100HzOscillator energy: 10 mj
>> Two post amplifier
0.5
One post amplifier
Fig.3 Pulse duration and average power of masterosillator as a function of cavity length
cavity length of 100 cm is around 40 ns. Therefore, the pulse duration at 532 nm can becontrolled and the optimum pulse duration will be chosen for the pumping of Tksapphire CPAsystem.Figure 4 shows the pulse energy at1064 nm as a function of laser diodedrive current. The triangles representthe pulse energy with one postamplifier and the squares with twopost amplifiers. The pulse repetitionrate is 100 Hz. The output energyincreases with laser diode drivecurrent and 1.4 J at the drive currentof 45 A and 1.2 J at 40 A areobtained, respectively. Since thepreamplified pulse energy is 30 mJ,the double-pass amplification gain isabout 13 with one post amplifier. Theproduct of small signal gain (go) andgain length( 6 ) is around 2.6. Thislow gain is due to that this postamplifier is pumped from single sideof the crystal and has low storedenergy. And with two post amplifiers,the gain for the ring type double-passamplifier increases to 47. The go £ also increases and is 3.8. With this high amplification gain,the condition of saturation amplification is achieved. Figure 5 shows the average power at 532nm and energy conversion efficiency as a function of fundamental power into the LBO crystal.The pulse repetition rate is 170 Hz and the laser diode array drive current 40 A. The pulseduration of the LD drive current is 250 /us. The input fluence and the peak power are around1.9 J/cm2 and 98 MW/cm2, respectively. The average power increases linearly with fundamentalpower and is 105 W when the fundamental input power is 200W. The energy conversionefficiency is observed to decrease gradually with fundamental input power. This may be due tothe heating of LBO crystal by the absorption of laser radiation. Figure 6 shows the pulse energyat 532 nm as a function of pulse repetition rate. The pulse energy at the pulse repetition rate
25 30 35 40 45 50
LD Peak Drive Current (A)
Fig.4 Fundamental output energy as a funciton of LDdrive current at the PRF of 100 Hz
- 147

JAERI-Conf 98-004
of 100 Hz is 0.64 J and 0.62 J at170 Hz. The figure shows that thepulse energy is almost constant atthe pulse repetition rate between 100Hz and 170 Hz. This is due to thepulse energy of laser diode is alsoalmost constant between wide pulserepetition rate. From the standpointof Ti: sapphire crystal pumping, theintensity profile of green laser beamis important. Because if it has a hotspot with high peak power, theTi:sapphire crystal will be damaged.Figure 7 shows the intensity profileof second harmonic at the PRF of170 Hz. In this measurement, theimage of the second harmonic isrelayed to CCD camera by an imagerelay optics. The profile of greenlaser beam is nearly homogeneousand has near top hat. It is thoughtthat the green laser beam is suitablefor the pumping of Ti:sapphirecrystal. Although some of the smallpeaks are observed, the peak powerof these peaks are not so high.Therefore, Ti:sapphire crystal willnot be damaged. In the future, aSBS reflector will be used to achievemore homogeneous laser beam. Theefficiency of the pump laser isimportant from the stand point ofrealizing a compact pump lasersystem. Figure 8 shows the progressof wall plug efficiency and pulseenergy. In 1993, the wall plugefficiency is around 1.3 % but in1997 it becomes 2.0 %. The reasonof this is the use of large amplifierwith high amplification gain. Atpresent, the small gain of theamplifier is nearly 4. therefore, theinput laser pulse from the oscillatoris amplified to high energy with firstamplification. And in the secondamplification in the ring system, thecondition of the saturationamplification is achieved and as a
result, the energy extractionefficiency increases. In this pumplaser, one of the amplifier is pumpedfrom one side of the crystal by alaser diode array. If it is alsopumped from both sides, the stored
120
100
§| 60wroin« 60
I 40a.0 20|
1 0
•Average power
-•Conversion efficiency
PRF:170HzLO peakcun*ent:40 ALBO:10xBx15mm
70
65
60
55
S 0
45
40
so 100 180120 140 160
Pulse Repetition Rate (Hz)
Fig.5 Average power at 532nm and energy conversionefficiency as a function of fundamental power
0.8
0.6
0.4
0.2
80 100 120 140
Pulse Repetition Rate (Hz)
160 180
Fig.6 Pulse energy at 532nm as a function of pulserepetition rate
Fig.7 Intensity profile of green laser beam
- 148 -

1.5
•Measurement—Calculation—Calculation With tow
double-side pumped amplifier
JAERI-Conf 98-004
energy will increase. Therefore, anamplification characteristics withtwo double-side pumped amplifieris studied. Measured and calculatedpulse energy at 1064 nm is shownin figure 8 as a function of numberof passes in amplifier at the pulserepetition rate of 170 Hz. In themeasurement, some optical loss in3rd and 4th amplification isobserved and this is due to thereflection loss at the input surfacesof the amplifier which is nearBrewster's angle. The calculationshows that if two post amplifiers arepumped from double-side of thecrystals, the output energy willincrease to about 1.9 J. The energyconversion efficiency is expectedto be over 50 % for LBO and 60 %for KTP. Therefore, it will be expected to have around 1 J in green if the two both sides pumpedamplifier is used.
0.5
I post amp.
2 3Number of Passes
Fig.8 Measured and calculated pulse energy
4. SUMMARY"We developed all solid state pumping laser for the pumping of high repetition rate Ti: sapphire
CPA system. The pulse energy at 1064 nm is 1.25 J and the average power is 250 Wat therepetition rate of 200 Hz. The pulse energy and average power at 532 nm are 0,62 J and 105 Wat the pulse repetition rate of 170 Hz, respectively. The wall plug efficiency of the laser is 2.0%.It is shown by the calculation using Frantz-Nodvik equation that the pulse energy of around 1 Jat 532 nm will be expected, if two double-side pumped amplifier is used.
REFERENCES1) Q.Fu, F.Seier,"High average power kilohertz sub-lOOfs amplifier," in Technical digest ofConference of Lasers and Electro-Optics (Anaheim CA, 1996) paper CTull42) F.Salin, C.Le Blanc, C.Spielmann, et al," kilohertz thermal eigen mode multipass-amplifier forhigh average power chirped pulse amplification," in Technical digest of Conference of Lasersand Electro-Optics (Baltimore Maryland, 1997) paper CMC23) S.Backus, C.G.Durfee III, M.Murnane, et al,"0.125 terawatt kilohertz laser system," inTechnical digest of Conference of Lasers and Electro-Optics (Baltimore Maryland, 1997) paperCMC54) S.P.Velsko, C.A.Ebbers, B.Comaskey, G.F.Albrecht, et al," 250Watt average power Electro-Optically Q-switched diode-pumped power oscillator," OSA Proceedings on Advanced SolidState Lasers, 20,308(1994)5)J.J.Kasinski, R.L.Burnham," Near diffraction limited output from a high power diode pumpedlaser via phase correction with aspheric diamond turned optics," in Technical digest of AdvancedSolid State Lasers, (San Francisco, CA, 1996) paper FD56)R.St Pierre, G.Holleman, M.Valley, H.Injeyan, J.Berg, et al," Active tracker laser (ATLAS),"OSA TOPS, 10,288(1997)7) Y.Maruyama, M.Oba, M.Kato, T.Arisawa,"Characteristics of LD-pumped Nd:YAG green lasersystem," OSA TOPS, 1,369 (1996)8) M.Oba, Y.Maruyama, M.Kato, T.Muramatu, TArisawa," Laser Diode pumped high averagepower Nd:YAG green laser," in Technical digest of Conference of Lasers and Electro-OpticsEurope (Hamburg Germany, 1996) paper CThI55
- 1 4 9 -
JAERI-Conf 98-004
2 2 . Development of AH Solid-State, High Average PowerUltra-Short Pulse Laser for X-ray Generation
~ High Average Power CPA System
and Wavefront Control of Ultra Short Laser Pulse ~
Sayaka HARAYAMA, Katsuaki AKAOKA, Kazuyoku TEI,
Masaaki KATO, Yoshito NIWA, Yoichiro MARUYAMA,
Toru MATOBA, Takashi ARISAWA, Hiroshi TAKUMA
Advanced Photon Research Center
Kansai Establishment
Japan Atomic Energy Research Institute
Tokai, Ibaraki 319-11 Japan
E-mail: [email protected]
ABSTRACT
We developed a prototype CPA laser system which is pumped by a all solid-state Nd:YAG
laser. In a preliminary experiment, the output energy of 52mJ before compression was obtained
when the pumping energy was 250mJ. To compensate the wavefront distortion, an adaptive optics
has been developed. By using this wavefront control system, the laser beam with the distortion of
0.15 A was obtained.
Keywords : Ultra short pulse laser, High peak power laser, LD-pumped laser, Chirped Pulse
Amplification (CPA), Multi-pass amplification, Adaptive optics, Wavefront
compensation
1. IntroductionAn ultra high peak power laser with high repetition rate using Chirped Pulse Amplification
(CPA) is very attractive light source for the development of X-ray laser, laser induced high energy
particle acceleration, and for many other applications such as high field physics, laser processing,
etc. But in the conventional high peak power CPA system, the repetition rate has been restricted
up to lOHz because the pumping laser is pumped by flashlamps. Recently, a high repetition rate
CPA system has come into discussion and arc-lamp pumped, high repetition rate Nd:YAG and
Nd:YLF have been used as pumping light source*'^' ' . Although these pumping lasers are able tooperate at kHz repetition rate region, the average power and peak power of the CPA system are
limited because of the low pulse energy of the pumping laser. Therefore, to obtain high average
power and high peak power in a Ti:sapphire CPA system, it is inevitable to develop a high
repetition rate and high energy pumping laser.
In order to realize high repetition rate, high average power, and ultra high peak power
laser, dispersion compensation is essentially important. The higher the peak power is, the higher
order dispersion has to be taken into consideration. And the thermal load into the laser crystal
- 1 5 0 -

JAERI-Conf 98-004
4 pass1-OM-
uniolificr
Pul.sc-Comprcssor
LD-pumpodNd:YAGLiner
m Pocke .Cell
LD-pumpedNd:YAG
asor
becomes more important with increasing the average power. Realization of laser beam of highquality and stability by compensating the thermal load in the laser crystals is indispensable for theabove stated applications, because high thermal load causes the thermal lens effect as well asinhomogeneous diffraction index distribution resulting in the dispersion errors which makes theultra short pulse width broader leading to the reduction of the peak power considerably.
In JAERI, to construct a high repetition rate, high average power CPA system, we have
been developing LD-pumped Nd:YAG green laser ' and the wavefront control system.
2. CPA systemO u r prototype
Ti:sapphire CPA system isprepared to obtain design datafor a higher average powerCPA laser system. Theschematic is shown in Fig.l.The CPA laser system consistsof an ultra short pulseoscillator, a stretcher, aregenerative amplifier with apockels cell, a 2-pass pre-amplifier, a 4-pass post-amplifier, a compressor, and awavefront control systems. pig.i Schematic of
The pulse duration of the Titsapphire CPA Laser Systemoscillator is lOOfsec and output power is 300mW at lOOMHz when it is pumped by 5W CW greenlaser. Then the laser pulse is stretched to lOOps. The stretched pulse is amplified by theregenerative amplifier and 2-pass pre-amplifier. These regenerative and 2-pass pre-amplifier arepumped by a 2.5W LD-pumped Nd:YAG laser of which pulse duration is around 50ns. Thegreen pump laser beam is divided into two, and one of which is used to pump regenerativeamplifier and the other to pump 2-pass pre-amplifier. The output pulse energy of theregenerative amplifier is around lmJ, and that of 2-pass pre-amplifier is about 3mJ. After the 2-pass amplifier, there is a second pockels cell to get a high contrast ratio. Then the laser pulse isintroduced into 4-pass post-amplifier which is pumped by another LD-pumped Nd:YAG laser.After that, the laser pulse is compressed by a compressor. In order to compensate wavefrontdistortion, the wavefront control system is placed after the compressor.
In this CPA system, the 4-pass amplifier is pumped by a Nd:YAG laser with the maximumaverage power of 25W. Therefore, if the heat generated in the crystal can not be removedefficiently, the temperature of the crystal increases. As the result, some effects are caused such as
thermal lensing, the shortening of the decay time of excited Ti which results in a decrease ofstored and output energy, etc. To avoid these effects, the crystal temperature has to be kept atnear room temperature.
Fig.2 shows the calculated temperature distribution of the Ti:sapphire crystal and its
- 1 5 1 -

JAERI-Conf 98-004
housing for the 4-pass amplifier when the input average power is 25W and the temperature of the
cooling water is 18°C. It indicates the highest temperature in the crystal will be 30°C. Judging
from this calculation, it is expected thermal effects caused by the pumping will be avoided by
using this crystal housing when the input average power is up to 25W. The compressed pulse
duration is shown in Fig.3. This measurement is done by optical delay back-ground free
autocorrelation using second harmonic generation
of KTP. The FWHM of the laser pulse is fit with
Pumping Power 25 W
Temperature of Cooling Medium 18° C
Highest Temperature in Crystal 30° C
Fig.2 Temperature Distribution ofTi:sapphire Crystal by 25W Pump
Profile of two pass amplifier output beam
Profile of four pass amplifier output beam
1- , ,
Fig. 5 Intensity Profiles ofP re-am p. and 4-pass amp. Output Beam
in
a>
CD>
Time Delay 1OOfs
Fig.3 Compressed Laser Pulse Duration
760 780 800 , 820 840Wavelength (nm)
Fig.4 Bandwidth of Laser Pulse100
80
60
40
2 0
Multi-pass Amp. Input -. 2.3 mj
0 50 100 150 200 250 300Pump Laser Energy (mJ)
Fig.6 Tirsapphire CPA LaserMulti-pass AmplificationPumped by All Solid State Nd:YAG Laser
- 152 -

JAERI-Conf 98-004
square hyperbolic secant (Time bandwidth product is 0.315.) is 139fs. Fig.4 shows the
bandwidth of the laser pulse. The FWHM of the bandwidth is about 20nm and the center
wavelength is about 800nm. The intensity profiles of the output beam of 2-pass pre-amplifier and
4-pass post-amplifier are shown in Fig.5, both show good fits to Gaussian curves. Fig.6 shows the
output energy of 4-pass amplifier as a function of pump pulse energy. The input energy into the
amplifier is 3mJ. The output energy is 52mJ before compression with the repetition rate of lOHz
when the pumping energy is 250mJ. Our pumping laser is now operated at 200Hz, we intend to
increase the repetition rate from now on.
Now, 100W green laser has been
realized in JAERI, then much higher
pulse energy and higher peak power
can be expected by a CPA system.
However, if it is pumped by the 100W
laser beam, the temperature of the
crystal will increase. So, thermal
characteristic of the Ti: sapphire has
been studied by using a heat code.
Fig.7 illustrates the calculated
temperature distributions when a crystal
is pumped by the average power of
Pumping Power 100 WTemperature of Cooling medium -15" CHighest Temperature in Crystal 33* C
Fig.7 Temperature Distribution ofTi:sapphire Crystal by 100W Pump
100W. The cooling medium flows on upper and lower sides of the crystal. The temperature
distribution shows a good symmetry. This calculation shows that highest temperature in the
crystal will be 33 °C when the temperature of the cooling medium is -15 °C. Using this crystal as a
second 4-pass amplifier, the average power of 20W will be obtained. And the peak power will be
expected to increase to around 2TW level when the pulse duration is lOOfs.
Deformable MlrroiCBIitiorphtype)
3. Wavefront Control System
Fig.8 shows a schematic of the
wavefront control system. The system
consists of a Shack-Hartmann type
wavefront sensor, a control computer, a
diagnostic computer, and a deformable
mirror. A part of the laser beam from
the CPA system is sampled by a beam
splitter, and the wavefront is measured
by the Shack-Hartmann type wavefront
sensor^. The conjugate surface on thedeformable mirror is made by the
computer. Fig.9 illustrates the schematic of the Shack-Hartmann type sensor. The sensor
includes the array of stacked lenslets of 32 x 32, a CCD camera, and a point light source. Each
lenslet focuses the laser beam onto the CCD camera and a point light source generates a plane
wavefront as a reference. Then the local tilt of wavefront can be calculated from the difference
Fig.8 Schematic ofWavefront Control System
- 1 5 3 -
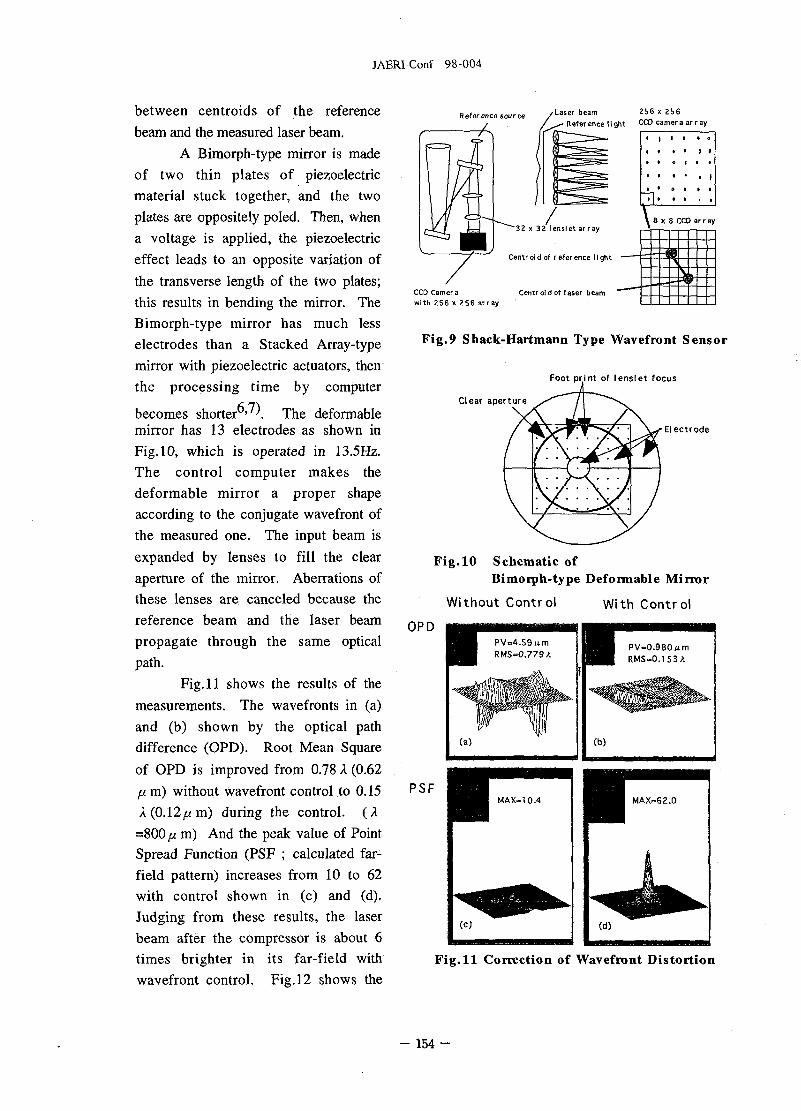
JAERI-Conf 98-004
between centroids of the reference
beam and the measured laser beam.
A Bimorph-type mirror is made
of two thin plates of piezoelectric
material stuck together, and the two
plates are oppositely poled. Then, when
a voltage is applied, the piezoelectric
effect leads to an opposite variation of
the transverse length of the two plates;
this results in bending the mirror. The
Bimorph-type mirror has much less
electrodes than a Stacked Array-type
mirror with piezoelectric actuators, then
the processing time by computer
becomes shorter ' K The deformablemirror has 13 electrodes as shown in
Fig. 10, which is operated in 13.5Hz.
The control computer makes the
deformable mirror a proper shape
according to the conjugate wavefront of
the measured one. The input beam is
expanded by lenses to fill the clear
aperture of the mirror. Aberrations of
these lenses are canceled because the
reference beam and the laser beam
propagate through the same optical
path.
Fig. 11 shows the results of the
measurements. The wavefronts in (a)
and (b) shown by the optical path
difference (OPD). Root Mean Square
of OPD is improved from 0.78 A (0.62
fx m) without wavefront control to 0.15
A (0.12/u m) during the control. (A
=800 fx m) And the peak value of Point
Spread Function (PSF ; calculated far-
field pattern) increases from 10 to 62
with control shown in (c) and (d).
Judging from these results, the laser
beam after the compressor is about 6
times brighter in its far-field with
wavefront control. Fig. 12 shows the
Reference source
/
/Laser beam 256 x 256• R ef er ence I i ght CCD earner a ar r ay
"32 x 32 lenslet array
Centr oi d of r ef er ence I! ght
CCD Camera Centroid of laser beamwith 256 x 256 array
1 | 1 0 t O
i • • * 0 0
tt • • , |
7H\ 8 x 8 CCD array
••—
L-mV4-1I
uMT
Fig.9 Shack-Hartmann Type Wavefront Sensor
Foot print of lenslet focus
Clear aperture
Electrode
Fig. 10 Schematic ofBimorph-type Deformable Mirror
Without Control With ControlOPD
PSF
Fig. 11 Correction of Wavefront Distortion
- 154

JAERI-Conf 98-004
wavefront distortion in Root Mean
Square with control and without
wavefront control as a function of time.
Without control, the wavefront
distortion of 0.6 jum is observed.
However, the distortion is reduced less
than 0.2 /x m with control.
200 250100 150T i m e ( a s )
Fig. 12 Wavefront Distortionwith and without Control
5. Summary
In Summary, the prototype all solid-state high average power Ti.sapphire CPA system was
constructed and the preliminary preliminary measurement has been studied at a low repetition
rate. The output average of 52mJ was obtained by the pumping energy of 250 mJ.
The performance at high repetition rate will be measured from now on.
And by using the adaptive optics to compensate the wavefront distortion of the CPA
system, the laser beam of high quality with the distortion of 0.15 X was obtained.
Our calculation shows if one more 4-pass post amplifier is installed, it will be able to
increase the peak power to TW level and the average power of 20W.
References
1) Sterling Backus, Charles G.Durfee M, Margaret Murnane, Henry Kapteyn, "0.125 terawatt
kilohertz laser system," in Technical Digest of CLEO'97 (Baltimore MD), CMC5
2) Q.Fu, F.Sier, "High-average-power kilohertz sub-100-fs amplifier," in Technical Digest of
CLEO'96 (Anaheim CA), CtuL14
3) F.Salin, C.Le Blanc, C.Spielmann, J.Squier, V.V.Yakovlev, C.P.J.Barty, "Kilohertz thermal
eigenmode multipass amplifier for high-average-power chirped-pulse amplification," in Technical
Digest of CLEO'97 (Baltimore MD), CMC2
4) Y.Maruyama, M.Ohba, M.Kato, T.Arisawa, "Characteristics of LD-Pumped Nd:YAG Laser
System," OS A TOPS on Advanced Solid-State Lasers, 369-372, Vol.1 (1996)
5) K.Akaoka, Y.Maruyama, T.Arisawa, "Development of wavefront control system using
deformable mirror for solid state lasers," in Proceedings of Solid State Lasers 6 (San Jose CA), 55-
61(1997)
6) J-P.Gaffard, J.P.Gex, P.Gosselin, PJagourel, "A Stacked Array Mirrors and Bimorph Mirrors
Comparison," in Proceedings of Conference on Wave Propagation in Turbulent Media and
Adaptive Optics, National Astronomical Observatory (Tokyo Japan), 235-240 (1993)
7) P.Gosselin, PJagourel, J.Peysson, "Objective Comparisons between Stacked Array Mirrors and
Bimorph Mirrors," in Proceedings of Conference on Wave Propagation in Turbulent Media and
Adaptive Optics, National Astronomical Observatory (Tokyo Japan), 241-250 (1993)
- 155 -

JAERI-Conf 98-004
23 . 80-W cw TEMoo IR beam generation by use of a laser-diode-side-pumped Nd:YAG rod laser
Susumu Konno, Shuichi Fujikawa, and Koji Yasui
Advanced Technology R&D Center
Mitsubishi Electric Corporation
8-1-1 Tsukaguchi, Amagasaki 661, Japan
E-mail: [email protected]
Phone: 81-6-497-7110
Fax: 81-6-497-7288
Abstract
We have demonstrated high-efficient and high-power operation of a diode-side-pumped Nd:YAG
rod laser. The laser has a simple and scalable configuration consisting of a diffusive pumping
reflector and an advanced cavity configuration for polarization-dependent bifocusing
compensation.
1. Introduction
Compact, electrically-efficient, scalable, and high brightness IR beam sources are desired for
various applications in material processing and frequency conversion. Diode-pumped solid-state
lasers are promising approaches satisfying these requirements. Diode-pumping could reduce the
size and weight of the system, and could increase the electrical-to-optical conversion efficiency,
reliability, and lifetime.
Several tens W of TEMQ0 IR beams have been generated by using end-pumping configuration,1
or side-pumping configuration with fiber-coupled diodes2'3 and zigzag slab laser geometry.4
However, in the end-pumping configuration, further enhancement of the output power is limited
by the thermal fracture of the laser material.5 In the side-pumping configuration, fiber-coupled
diodes or slab-shaped laser material are relatively expensive and could reduce the overall system
efficiency.
- 1 5 6 -
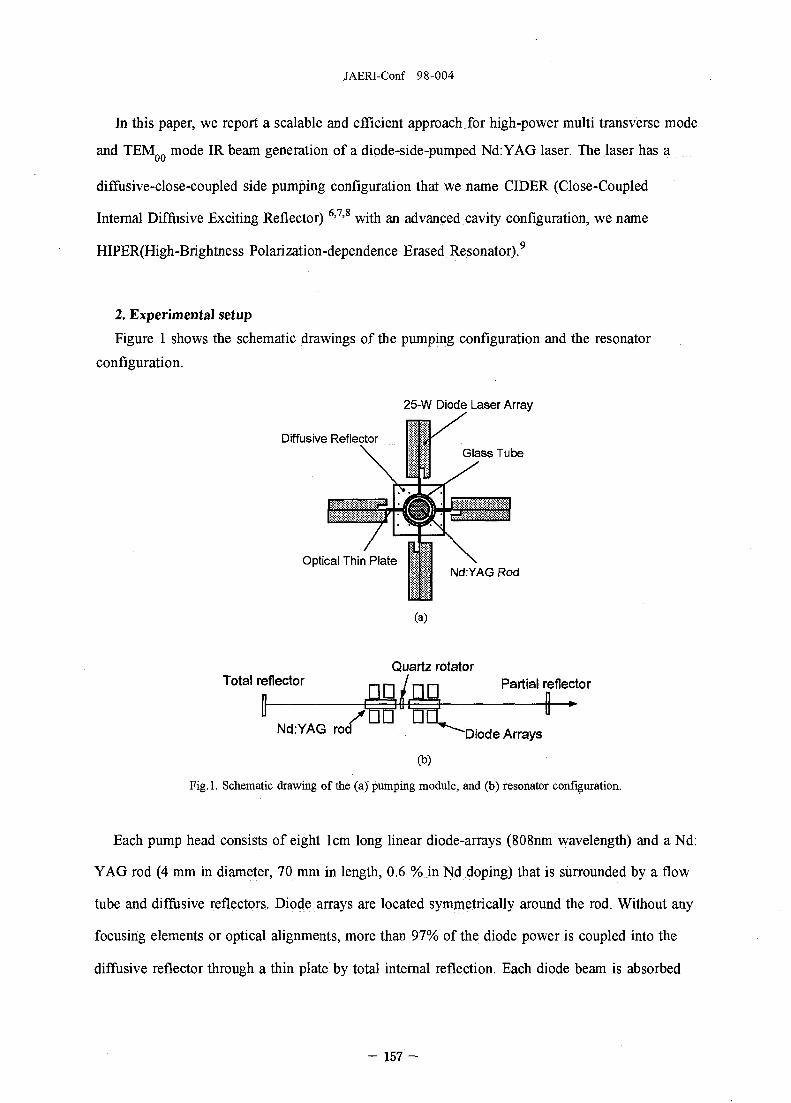
JAERI-Conf 98-004
In this paper, we report a scalable and efficient approach for high-power multi transverse mode
and TEM mode IR beam generation of a diode-side-pumped Nd:YAG laser. The laser has a
diffusive-close-coupled side pumping configuration that we name CIDER (Close-Coupled
Internal Diffusive Exciting Reflector) 6>7'8 with an advanced cavity configuration, we name
HIPER(High-Brightoess Polarization-dependence Erased Resonator).9
2. Experimental setup
Figure 1 shows the schematic drawings of the pumping configuration and the resonator
configuration.
25-W Diode Laser Array
Diffusive ReflectorGlass Tube
Optical Thin PlateNd.YAG Rod
Total reflector
(a)
Quartz rotatorPartial reflector
Diode Arrays
(b)
Fig.l. Schematic drawing of the (a) pumping module, and (b) resonator configuration.
Each pump head consists of eight lcm long linear diode-arrays (808nm wavelength) and a Nd:
YAG rod (4 mm in diameter, 70 mm in length, 0.6 % in Nd doping) that is surrounded by a flow
tube and diffusive reflectors. Diode arrays are located symmetrically around the rod. Without any
focusing elements or optical alignments, more than 97% of the diode power is coupled into the
diffusive reflector through a thin plate by total internal reflection. Each diode beam is absorbed
- 1 5 7 -

JAERI-Conf 98-004
into the laser rod both directly and also after multiple-reflection on the reflector. Detailed
description of the pumping configuration is previously reported8. The IR operation was
performed with a symmetrical 1.1m convex-convex resonator (R = 200 mm, T=ll%) for TEMQ0
mode operation and a 0.3m concave-concave (R=2m,T=8%) short cavity for low-brightness
operation. A 90°-polarization-rotation quartz rotator is placed between two uniformly pumped
Nd:YAG rods for polarization-dependent bifocusing compensation.
As described in Fig.4, the technical point of this resonator configuration is to cancel out the
bifocusing of the two polarization directions (<|>-polarization and r-polarization). The focal length
variation within the rod cross section could significantly degrade the laser performance.
Therefore, uniform pumping of the rods is required. Detailed description of the basic mechanism
of this resonator configuration is described elsewhere9. We measured the output power with a
calorimetric power meter and the beam quality by a Coherent's M2 meter.
3. Experimental results
Laser performance obtained with low-brightness operation (M2=45) was shown in Fig.2. The
laser output power of 147W was obtained at 386W and 992W of diode pumping power and
electrical input power for laser diodes, respectively.
150
1-1006
50Output
I I I I
0.5
0.4? 150 -
0 100 200 300 400
Pumping Diode Power (W)
Fig.2(a)
40.2 m
oW
0-1 o
0.0
100 -O
50 -
1 1
Output 9 -
J\0m Efficiency
W
1
0.25m
80.20 5.o
5*0.15 &
- 0.10
0.05 §
0 400 800
Electric Input Power (W)
Fig.2(b)
0.001200
<5
Fig.2 Laser output (a) as a function of the total diode output power, (b) as a function of the
electrical input power.
- 1 5 8 -

JAERI-Conf 98-004
These values are corresponding to 38.1% of optical-to-optical conversion efficiency and
14.8% of electrical-to-optical conversion efficiency. To our knowledge, these values are the
highest numbers for diode-side-pumped Nd.YAG lasers and the electrical -to-electrical conversion
efficiency is comparable with that of CO2 lasers.
Lasing performance of TEM mode operation is shown in Fig. 3 as a function of the total
diode output power. To show the effect of bifocusing compensation, we also showed laser
performance obtained without bifocusing compensation,thus without a quartz rotator between the
rods. The highest TEM output power of 80W was generated at 386 W of total diode output
power with the beam quality of M2=l.l. Although the M2 changed slightly between 1.1-1.7, the
beam profile was always Gaussian. While, without the bifocusing compensation, the beam quality
degraded to M2~3. and the highest output power decreased by 19 %. The temporal stability of the
output power was also improved by introducing the bifocusing compensation. With bifocusing
compensation, the average power remained stable with less than 1% fluctuation, while, without
bifocusing compensation, the output power instability was more than 3%.
Q.
•3oor
100
80
60
40
20
0
T T I
- without compensation• output power
_ • Beam Quality: M
with compensation• output power
O Beam Quality: M
I I
10
8 CD
3
SL
280 320 360 400Total diode output power (W)
Fig.3. IR cw output power and beam quality as a function of the total diode output power obtained with and
without bifocusing compensation.
- 1 5 9 -

JAERI-Conf 98-004
Figure 4 shows the stability zone calculation of the resonator for TEMQ0 mode operation with
and without bifocusing compensation. When a quartz rotator was placed between the Nd:YAG
rods, thus with bifocusing compensation, the beam diameter at the rod was almost identical for
both polarization directions (r-polarization and ^-polarization), as shown in Fig. 4 (a). While,
without a quartz rotator, thus without bifocusing compensation, stability zone separates for both
polarization directions, as shown in Fig. 4 (b). This separations leads to inefficient and unstable
operation.
2.0
e
^ 0 . 5
| 0.0
ICO
Fig.4,
- (((-polarization -r-polarization
i i i i i
- • ' - ; :
<t>-polarization _r-polarization
I I280 320 360 400 I
CO
280 320 360 400
total diode output power (W)
Fig.4.(b)total diode output power (W)
Fig.4.(a)
Stability zone calculation (a)with bifocusing compensation and (b) without bifocusing
compensation.
This calculation is based on non-lasing thermal loading of the Nd: YAG rod. Therefore, the
experimentally observed operation zone is slightly offset toward higher pumping region as shown
in Fig. 3.
4. Summary
We have reported efficient and high power IR operation. In TEM mode operation, 80-W IR
beam was obtained with 20.7 % of the optical-to-optical and 8.06 % of the electrical-to-optical
conversion efficiency. In addition, 147W of multi-transverse-mode IR beam was extracted with
38.1 and 14.8% of optical-to-optical and electrical-to-optical conversion efficiency, respectively.
These values were obtained with diode-side-pumped Nd: YAG lasers by using the combination of
a diffusive close-coupled pumping module and the bifocusing compensation. Since, the
- 1 6 0 -
JAERI-Conf 98-004
configuration is simple and scalable, we believe further enhancement of the output power should
be possible by increasing the pumping power.
The authors thank K. Yoshizawa , S. Yagi, and M. Tanaka for supporting and encouraging our
research.
References
! S. C. Tidwell, J. F. Seamans, and M. S. Bowers, Opt. Lett. 18, 116 (1993).
2D. Golla, M. Bode, S. Knoke, W. Schone, and A. Tunnermann,Opt. Lett. 21, 210 (1996).
3D. Golla, S. Knoke, W. Shone, M. Bode, A. Tunnermann, and H.Welling, Proc. SPIE 2700, 314
(1996).
4R. J. Shine, Jr., A. J. Alfrey, and R L. Byer, Opt. Lett. 20, 459 (1995).
Steve C. Tidwell, Jonathan. F. Seamans, Mark S, Bowers, and Anada K. Cousins,IEEE J.
Quantum Electron. 28, 997 (1992).
6T. Kojima, and K. Yasui, Post Deadline papers CLEO/Pacific Rim., PD2.2 (1995).
7T.Kojima and K.Yasui, Appl.Opt.36,4981 (1997).Q
S. Fujikawa, T. Kojima, and K. Yasui, to be published in IEEE J.Selected Topics Quantum
Electron.vol.3,No.lFebruary 1997
9K. Yasui, Appl. Opt. 35, 2566 (1996).
1 0 S.Konno, S. Fujikawa, and K.Yasui, Appl.Phys.Lett.7O, 2650, (1997)
- 1 6 1 -

JAERI-Conf 98-004
24. Reliability of Czochralski-grown P-BaB2O4(BBO) Devices
Nobuhiko Umezu, Tatsuo Fukui, Tsutomu Okamoto,
Hiroyuki Wada, Kouichi Tatsuki, Kenji Kondo
and Shigeo Kubota
Kubota Optoelectronics Laboratory, Research Center, Sony Corporation
6-7-35, Kitashinagawa, Shinagawa-ku.Tokyo 141, Japan
Abstract
We have achieved more than 1000 hours-operation in 266 nm-continuous wave (CW), 100 mW-
generation of all-solid-state-UV laser system using Czochralski (Cz)-grown P-BaB2O4(BBO) crystal
devices. Absorption of the Cz-grown crystal for e-ray at 266 nm was improved to 1%/cm, which is
one-third lower than that of the crystal grown by top seeded solution growth(TSSG) method.
Degradation rate of 266 nm generation, using 7 kHz repetition rate laser diode pumped Q switched
Nd: YAG laser as a fundamental light source, was one order of magnitude lower than that of
TSSG-crystal. Surface roughness of the crystal was better than 0.3 rms.-nm. HfO2 film with
extremely high adhesion was deposited on the surfaces using reactive low voltage ion plating method.
Our devices can be put to practical use in areas of photolithography, micro fabrication, material
processing and ultra high density optical disk mastering.
Keywords: All-solid-State CWUV laser, Czochralski, BBO, Top Seeded Solution Growth,
Laser Scanning Tomography, Photolithography,
1. Introduction
We have developed an all-solid state 266 nm CW UV laser system using an external frequency
conversion cavity with a nonlinear optical device [1,2]. As far as we know, there has been no
report on long-term reliability in such a laser system. Recently, we have achieved long-term
reliability of the system using a Cz:grown BBO device in CW operation. This results from the
improvement of surface roughness of BBO and durability of optical coating on the surfaces as
well as reduction of bulk optical loss. In this paper, we report the crystal quality, fabrication
processes and reliability of our system.
- 1 6 2 -

JAERI-Conf 98-004
2. Crystal Growth
We adopted the Czochralski method, because Czochralski grown crystals have a higher damage
threshold than TSSG-crystals [3]. Refining the Cz-growing method reported by Itoh et al [4], we
obtained BBO crystals 2" in diameter and 1" in length. Actual growth time was only about 8 hours.
Except for damage threshold data [5], few data were available. For example, data on internal
scattering and optical loss are not available. These data are important for designing and fabricating
optical devices. We compared BBO crystals grown by these two different growth techniques.
2.1 Evaluation of Crystal quality
2.1.1 Laser Scanning Tomography
The quality of these two crystals was evaluated using laser scanning tomography [6]. As shown in
Fig. 1, no extreme scatters could be observed in Cz-crystal but many scattering sources were observed
in a TSSG-crystal, mostly impurities and dislocations decorated by impurities taken into the crystal
from the flux. This difference is supported by the result of Inductively Coupled Plasma -Atomic
Emission Spectrometry (ICP-AES) measurement that the concentration of impurities in the Cz-BBO
was less than that in the TSSG-BBO.
t
Cz Crystal
tf% ; . i«
lmm
TSSG Crystal
Fig. 1 Internal scattering observed using
laser scattering tomography
- 1 6 3 -

JAERI-Conf 98-004
2.1.2 UV absorption
We also measured the UV transparency of these crystals, shown as Fig. 2. The optical loss of the
Cz-crystal was a few times lower than the TSSG-crystal. We think that this comes from scattering and
absorption of impurities. Better transparency of Cz-BBO is needed for good UV devices .
2.1.3 Evaluation of crystal quality using high-repetition-rate Q-switched Nd:YAG laser.
We evaluated the crystal quality using 266 nm UV generation system of laser diode pumped
high-repetition-rate Q-switched Nd:YAG laser [1]. The 1064 nm fundamental light was
frequency-converted using lithium triborate (LBO) and BBO stage. The average power of this system
was about 2.6 W @ 532 nm and 0.8 W @ 266 nm. High repetition-rate-pulsed laser light causes
optical damage, hence the UV generating power degrade. We select low degradation rate device
samples of the bulk crystal. Our typical Cz-BBO showed a 0.1 % /H degradation rate, which was better
by almost one order of magnitude than two pieces of TSSG-BBO supplied by outside vendors, shown
as Fig. 3. We think this suggests a correlation between degradation rate in pulsed operation andUV
absorption. The best in-house BBO shows a 0.05 %/H degradation rate, as is shown in Fig. 3.
Fig.2 Optical loss in e-ray polarization.
The optical loss of Cz-crystal was a few
times better than TSSG-crystal.
10 15Operation Time (H)
200 220 240
Wavelength (nm)
260 280
Degradation rate:
1_ dP(t)P(0)* d t
Cz : 0.1 %/hourFlux : 1.5 %/hour(Linear approximation)
Fig. 3 Degradation rate
in the pulsed operation.
- 1 6 4 -

JAERI-Conf 98-004
3. Process
Our device fabrication process is shown Table 1. The most important procedures in this sequence
are optical polishing and coating the surfaces .
3.1 Optical polishing
The fabrication of BBO has been thought to be difficult, because of a little deliquescence and a
weak cleavage parallel to the c-plane of BBO. In general, the surface scattering loss is proportional to
the square of rms. roughness and the inverse square of wavelength, so we had to make a better optical
surface for the purpose of devices operating in the UV range than in the VIS and NIR range . We have
not only employed a very precise polishing machine and high-quality polishing materials , but also
optimized the polishing conditions . We achieved a 0.3 nm rms. roughness super optical surface. We
were careful to avoid water and/or moisture from the polished BBO surface during cleaning and
drying process.
3.2 Anti-reflection (AR) coating
We successfully coated BBO crystal surfaces which have a small amount of deliquescence. HfO2
and MgF2 were deposited on the surfaces. HfO2 was deposited using Balzers BAP 800 reactive-
low-voltage ion plating system [7]. The film deposited by ion plating had little spectral shift and little
reflection change under the hot and humid atmosphere. MgF2 was deposited using the standard
electron beam process. The coating provides less than 0.2 %-total optical loss in a cavity at 532 nm
wavelength and has good durability for 900 kW/cm2at 532 nm and for 270 W/cm2at 266 nm in our
system. Optical coating on the BBO crystal surfaces have the function not only as an AR coating but
also as a protective layer from a trace of moisture in the air.
CuttingDirection Correction
Inspection PolishingEvaluating Bulk Crystal
Dicing to Devices
PolishingCleaning and Drying
Optical Coating
Inspection
X-ray Laue PatternAccuracy ± 0.1 deg
rms. Roughness 0.7 nmHomogenity, Transparency
Accuracy ± 0.1 mm
rms. Roughness 0.3 nmWater Free
AR Coating, Ion Plating
Outlook, UV Degradation
Table 1 Fabrication process
- 165 -

JAERI-Conf 98-004
4. Long-term reliability in CW generation
We evaluated 266 nm output power and cavity loss for incident green power. Figure 4 shows a
schematic of the BBO evaluation system. The cavity is put into a container, from which all grease is
removed. Nitrogen gas is flowed into the container to purge outgas. Long-term reliability data is
shown in Fig. 5. 266 nm output power was very stable for over one thousand hours. No optical
damage on the crystal surfaces could be found even using a microscope. After 1000 hours operation,
30 mWincreasing of the input green power was needed to keep 266 nm output power at 100 mW.
This means there was an the increase in the cavity loss for green power. The calculated cavity loss in
this experiment is shown in Fig. 6. Total cavity loss for green power was calculated using incident
green power into the external resonant BBO cavity and power converted to 266 nm. In this system, it
is difficult for green light to be coupled with the cavity, when the cavity loss is more than 0.7%.
Considering this value as a criterion , an additional 1000 hours might be expected. Some samples
show much small increasing rate of cavity loss. We are measuring these now.
Fig.4 Schematic of the
external cavity
surface polish
532 nm
coating
266 nm100 mW
Power density 532 nm 900kW/cm2266 nm 270 W/cm2
200 400 600 800
Time [hour]1,000 1,200 0.00
200 400 600 800
Time [hour]1,000 1,200
Fig. 5 100 mW, 1000 hours operation
of the 266 nm CW laser
Fig. 6 Total cavity loss vs. operation time
of UV generation.
- 1 6 6 -

JAERI-Conf 98-004
5. Summary
We have refined a method of growing Cz-BBO which has low scattering and optical loss. The device
fabrication technique and AR coating process suited for BBO have been improved. We operated BBO
devices which generated 100 mWUV light for more than 1000 hours.
Hence, an all-solid-state-CW-UV laser system using Cz-grown BBO crystal devices is expected to
find many applications.
7. References
[1] M. Oka, L. Y. Liu, W. Wiechmann, Y. Taguchi, H. Wada, T. Okamoto,
H. Suganuma and S. Kubota, Proc. SPIE 2700, (1996) 302
[2] M. Oka, L. Y. Liu, W. Wiechmann, N. Eguchi, and S. Kubota, IEEE J. Sel. Top. in
Quantum Electron. 1 (1995) 859
[3] C. Chen, B. Wu, A. Jiang and G. You, Sci. Sinca (Ser.B) 28 (1985) 235
[4] K. Itoh, F. Marumo, and Y. Kuwano, J. Crystal Growth 106 (1990) 728-731
[5] D.Eimerl, L. Davis, and S. Velsko, J.Appl. Phys., 62 (1987) 1968-1983
[6] Q. Tan, H. Mao, S. Lin, H. Chen, S. Lu, D. Tang, T. Ogawa, J. Crystal Growth
141 (1994)393-398
[7] A. J. Waldorf, J. A. Dobrowolski, B. T. Sullivan, and L. M. Plante, Appl. Opt.
32(1993)5583
- 167-

JAERI-Conf 98-004
APPEND IX
Joint ICFA/JAERI-KansaiInternational Workshop '97
13th Advanced ICFA Beam Dynamics Workshop
and 1st ICFA Novel and Advanced Accelerator Workshop :
the Second Generation Plasma Acceleratorsand
1st JAERI-Kansai International Workshop onUltrashort-Pulse Ultrahigh-Power Lasers
and Simulation for Laser-Plasma Interactions
Kyoto Research Park
Kyoto, Japan
July 14-18,1997
organized by
International Committee for Future Accelerators(ICFA)
hosted by
High Energy Accelerator Research Organization(KEK)
and
Japan Atomic Energy Research Institute(JAERI)
- 1 6 8 -

JAERI-Conf 98-004
Joint ICFA/JAERI-Kansai International Workshop '97(July 14-18, Kyoto Research Park, Kyoto, Japan)
14-Ju
Registration
Joint PJenarysession
(Invited talks)
Reception
8:00 - 9:45
9:45 - 10:15
10:15 - 10:4510:45 - 11:1511:15 - 11:45
11:45 - 12:1512:15 - 12:4512:45 - 13:1513:15 - 14:40
14:40 - 15:0015:00 - 15:2015:20 - 15:4015:40 - 16:0016:00 - 16:30
16:30 - 18.00
18:00 - 20:0020KM
1:45
0:30
0:300:300:30
0:300:300:301:25
0:200:200:200:200:30
1:30
Foyer
Registrationcoffee
coffee
coffee
Hotel bus
Restaurant"Bread
Basket"
lunch
Reception
Science Hall
(Chairman) K.Nakajima
Welcome AddressY. NishidaC.Clayton "
(Chairman) D.UmstadterH. DewaM. DownerF. Amiranoff
(Chairman) W.GaiN.BarovA.M.KoudrisvtsevR. AssmannP. Chen
Chairman) Y.Kitagawaforking groupntroductory talks andorganization
Room A Room B Room C
• ' • "- P- •
AV Room
15-JulICFA Working
groups andJAERI workshop
8:309:00
10:3011:0012:3014:00
15:30
16:00
18:00
-9:00- 10:30- 11:00- 12:30- 14:00- 15:30
-16:00
- 17:30
0:301:300:301:301:301:30
0:30
1:30
Hotel bus
Foyer
coffee
coffee
coffee
Restaurant"BreadBasket"
lunch
Science Hall Room A Room B RoomC
ICFA WG-I ICFA WG-II ICFA WG-III
ICFA WG-I
ICFA WG-I
ICFA WG-II
ICFA WG-II
ICFA WG-III
ICFA WG-III
ICFA WG-I ICFA WG-II ICFA WG-III
AV Room
JAERI workshop
JAERI workshop
JAERI workshop
JAERI workshop
16-Jul
ICFA Workinggroups and
JAERI workshop
Joint Plenarysession
(Invited talks)
8:30 - 9:00 0:309:00 - 10:30 1:30
10:30 - 11:00 0:3011:00 -12:30 1:3012:30 - 14:00 1:30
14:00 - 14:30 0:3014:30 - 15:00 0:3015:00 - 15:30 0:3015:30 - 16:00 0:3016:00 - 16:30 0:3016:30 - 17:00 0:3017:00 - 17:30 0:30
17:30 -
Foyer
coffee
coffee
coffee
Restaurant"Bread
Basket"
lunch
Science Hall
(Chairman) H.Takuma
C. BaityK. YamakawaJ.P. Chambaret
"' G. MourouT. Taiima
Room A Room & Room C
ICFA WG-I ICFA WG-II ICFA WG-III
ICFA WG-I ICFA WG-II ICFA WG-III
AV Room
JAERI workshop
JAERI workshop
PhotoKrachinK
"Gion Festival Eve" Banquet
17-Jul ICFA Workinggroups and
JAERI workshop
9:00 - 14:00
14:00 - 153015:30 - 16:00
16:00 - 18:05
18:30
5:00
1:300:30
2:05
Foyer
coffee
Hotel bus
Restaurant"BreadBasket"
Science Hall Room A
"Gion Festival"
ICFA WG-I
Room B
ICFA WG-II
RoomC
ICFA WG-III
ICFA WG-I ICFA WG-II ICFA WG-III
AV Room
JAERI workshop
JAERI workshop
18-Jul Joint Plenarysession
8:30 - 9:00 0:30
9:00 - 10:30 1:30
10:30 -11:00 0:30
Foyer
coffee
Restaurant"Bread
Basket"Science Hall Room A Room B Room C AV Room
(Chairman) K.Hirsta
Report from ICFAworking croupsJAERI workshopSummary
- 1 6 9 -

JAERI-Conf 98-004
SPECIAL EVENTS
1. Welcoming Reception
Monday, July 14 from 6:00 p.m. to 8:00 p.m] at the restaurant "Bread Basket"
in the Kyoto Research Park, Conference site.
It is a great of pleasure for JAERI-Kansai to invite all the workshop attendees
and their guests to this event.
2.Commemorative Photography
[Wednesday, July 16 at 5:00 p.Tnl at the gate of the Kyoto Research Park,
Conference site.
3.Banquet
^Wednesday, July 16 from 6:00 p.m. to 7:00 p.m. [at a Japanese style
restaurant "ROKUSEI", near Gion, Kyoto.
The bus will leave for Banquet from Conference site at 5:30 p.m..
Attendance at this event is covered in the registration fees. Bringing guest
tickets may be purchased for¥3,000(Yen) per person at the registration desk.
After the banquet, everyone can enjoy the Gion Festival Eve and/or the Gion
Corner (one of optional tours).
4. "Gion Corner" after the Banquet (Optional Tours-1)[Wednesday, July 16 from 7:40 p.m.| at Gion Corner.
After the banquet, the bus will leave for the Gion Corner, 1st Floor of Yasaka
Hall, Gion, Kyoto.
This place offers visitors a chance to enjoy traditional Japanese arts such as
the tea ceremony, flower arrangement as well as Japanese performance of
Bunraku (puppets), Kyo-mai (Kyoto-style dance) of Geisha girls etc.. The
entry fee for this tour is ¥2,500 Yen.
5. Gion Festival "Yamahoko Junko" (Optional Tours-2)[Thursday, July 17 in the morning|.
The bus will pick up the participator at each hotels (HOTEL KEIHAN (ELINN) 9:00, NEW MIYAKO HOTEL 9:05, RIHGA ROYAL HOTEL 9:10,GINKAKU 9:15).
This is the climax of the Gion Festival. A sightseeing of the parade of
Yamahoko (decorated traditional floats) at a special gallery is also scheduled
on the morning of July 17.
- 1 7 0 -

JAERI-Conf 98-004
Joint plenary session
M o n d a y , J u l y 14
[Science Hall]
8:00 - 9:45 [Registration]
[ Coffee ]
9:45 — 11:15 (Chairman) KNakajima9:45 - 10:15 [Welcome Address]
10:15 - 10:45 Y.Nishida "Plasma Based Cross-Field Particle(utsunomiya u.) Acceleration with High Power Microwave"
10:45 — 11:15 C.Clayton "Second Generation Beatwave Experiments(UCLA) at UCLA"
11:15 - 11:45 [Coffee]
11:45 - 13:15 (Chairman) D.Umstadter11:45 - 12:15 H.Dewa "KEK-JAERI-U.Tokyo Experiments of
(JAERl) High Energy Gain Laser Wakefield Acceleration"
12:15 — 12:45 M.Downer "Laser Wakefield Acceleration Experiments"(University of Texas)
12:45 - 13:15 RAmiranoff "The Laser Wakefield Program at(LULI) Ecole Polytechnique"
13:15 - 14:40 [Lunch]
14:40 - 15:00 (Chairman) W.Gai14:40 - 15:00 N.Barov "The UCLA/ANL Plasma Wakefield Experiment"
(UCLA)
15:00 — 15:20 A.M.Koudriavtsev "Plasma Wake-Field Acceleration for(Budker institute of High Energies: Physics and Perspectives"
Nuclear Physics)
15:20 - 15:40 R.Assmann "Proposal for a lGeV Plasma-Wakefield(SLAC) Acceleration Experiment at SLAC"
15:40 - 16:00 P.Chen "Proposal for a FFTB Plasma Lens Experiment(SLAC) a t SLAC"
16:00 - 16:30 [Coffee]
16:30 - 18:00 (Chairman) Y.Kitagawa16:30 — 18:00 Working Group Introductory Talks and Organization
18:00 — 20:00 [Reception]
- 1 7 1 -

JAERI-Conf 98-004
Joint plenary session
W e d n e s d a y , J u l y 1 6
[Science Hall]
14:00 - 17:00 (Chairman) H.Takuma14:00 - 14:30 C.Barty " From T-cubed to U-cubed:
The Evolution of Ultrafast, Ultrabright,Ultrapowerful Amplification Systems"
14:30 - 15:00 K.Yamakawa
15:00 - 15:30 J.P.Chambaret
15:30 - 16:00 [Coffee]
16:00 - 16:30 G.Mourou
16:30 - 17:00 T.Tajima
" Development of an UltrahighBrightness Laser Source at JAERI"
" Towards Ultra-high Peak Powerwith Femtosecond Laser atHigh Repetition Rate"
"Ultrahigh Peak Power Laser for ParticleAcceleration : Present and Future"
"High Field Science"
- 172-

JAERI-Conf 98-004
Joint plenary session
F r i d a y , J u l y 1 8
[AV ROOM]
8:30 - 9:00 [Coffee]
9:00 - 11:00 (Chairman) KHirata9:00 - 10:30 "Report from ICFA working groups"
10:30 - 11:00 TArisawa "JAERI workshop Summary"(JAERI)
- 173 -

JAERI-Conf 98-004
First JAERI-Kansai International Workshopon
Ultrashort-Pulse Ultrahigh-Power Lasersand Simulations for Laser-Plasma Interactions
14 to 18 July 1997
Kyoto Research Park
Kyoto, JAPAN
organized by International Committee for Future Accelerators (ICFA)Eosted by High Energy Accelerator Research Organization (KEK)
and Japan Atomic Energy Research Institute (JAERI)
joined by13th Advanced ICFA Beam Dynamics Workshop
and 1st ICFA Novel and Advanced Accelerator Workshop:the Second Generation Plasma Accelerators
as
Joint ICFA/JAERI-Kansai International Workshop '97
- 1 7 4 -

JAERI-Conf 98-004
JAERI workshop
T u e s d a y , J u l y 1 5
[AVROOM]8:3.0 - 9:00 [Coffee]
9:00 - 10:30 (Chairman) K M i m a9:00 — 9:30 Y.Kurihara "Polarized Positron Generat ion for JLC using a
(KEK) High Power Pico-second CO2 Laser System"
9:30 - 10:00 J .MENDONCA "Recent Resul t on Photon Acceleration"(INSTITUTE SUPERIOR
TECNICO)
10:00 - 10:30 I.Pogorelsky "Staged Electron Laser Accelerator STELLA(BNL) Experiment at Brookhaven ATF"
10:30 - 11:00 [Coffee]
11:00 - 12:30 (Chairman) R.More11:00 — 11:30 Y.Ueshima "Simulation of Intense Laser and Dense
(JAERI) Matter Interactions - X ray Generationand Laser absorption -"
11:30 - 12:00 A.ANDREEV "Scattering and Absorption of MultyTW(Visiting Prof. Picosecond Laser Pulse by Solid Targets"
in ILE Osaka U.)
12:00 - 12:30 K.Mima "Intense Short Pulse Propagation and(ILE, Osaka U.) Interactions in Overdense Plasmas"
12:30 - 14:00 [Lunch]
14:00 - 15:30 (Chairman) M.Skoric14:00 - 14:30 H.Takabe "Integrated Code Development for Studying
(ILE, Osaka U.) Laser Driven Plasma Physics"
14:30 - 15:00 K.Nishihara "3d Particle Simulations on Ultra Short(Osaka U.) Laser Interaction"
15:00 - 15:30 T.Zolotoukhina "Energy Transfer in the Process of(AIST) Diatomic-Surface Collision"
15:30 - 16:00 [ Coffee ]
16:00 - 17:30 (Chairman) KNishihara16:00 - 16:30 K.Moribayashi "Ultrafast Atomic Process in X-ray
(JAERI) Emission by Inner-shell Ionization".Kengo Moribayashi, Akira Sasaki*and Toshiki Tajima
16:30 - 17:00 M.Skoric "Stimulated Raman Back-scattering(Vinca Institute at High Laser Intensities"
/JAERI)
17:00 - 17:30 T.Utsumi "Plasma Simulation with the Differential(JAERI) Algebraic-CIP Scheme"
- 175 -

JAERI-Conf 98-0.04
JAERI workshop
W e d n e s d a y , J u l y 1 6
[AV ROOM]
8:30 - 9:00 [Coffee]
9:00 - 10:30 (Chairman) J.Koga9:00 — • 9:30 J.Chihara "Correlations in a Partially Degenerate
(JAERl) Electron Plasma"
9:30 - 10:00 T.Kato "Time Dependent H-like and He-like(NIFS) Al Lines Produced by Ultra-Short Pulse Laser"
10:00 - 10:30 R.More "Theory and Simulation of Short-Pulse Laser(Lawrence Livermore Interactions". R.More, R.Walling, D.Price,National Laboratory) G.Guethlein, A.Osterheld, J.Dunn and
R.Stewart
10:30 - 11:00 [Coffee]
11:00 - 12:30 (Chairman) H.Takabe11:00 — 11:30 A.Sasaki "Modeling of collisional excited X-ray lasers
(JAERl) using short pulse laser pumping"
11:30 — 12:00 Y.Kishimoto "Cluster Plasma and its Linear and Nonlinear(JAERI) Properties"
12:00 — 12:30 S.Peng "Design of Optimal Array Processors for(Aizu U.) Division-Free Linear System Solving"
12:30 - 14:00 [Lunch]
1 7 6 -

JAERI-Conf 98-004
JAERI workshop
T h u r s d a y , J u l y 1 7
[AVROOM]
9:00 - 14:00 [ Gion Fest ival ]
14:00 - 15:40 (Chairman) T.Matoba14:00 - 14:25 T.Itoh "Numerical Simulat ion For Extremely
(JAERl) Chirped Pulse Using An Optical Fiber"
14:25 — 14:50 I.Pogorelsky "Emerging Terawat t Picosecond CO2(BNL) Laser Technology"
14:50 — 15:15 S.Biswal "Chirped Pulse Amplification in a Ytterbium(University of Glass Regenerat ive Amplifier"
Michigan)
15:15 — 15:40 A.Nishimura "Flashlamp Pumped TiS Free-Running Laser(JAERl) for Yt terbium Glass CPA"
15:40 - 16:00 [Coffee]
16:00 — 18:05 (Chairman) G.Mourou16:00 ~ 16:25 S.Matsuoka "Efficient and High Energy Ti:Sapphire
(JAERI) Amplifiers for Ul t ra-Short Pulse Amplification".Shinichi Matsuoka,Makoto Aoyama,KoichiYamakawa
16:25 - 16:50 Y.Maruyama "R&D of LD-Pumped High Average Power(JAERI) Solid-State Laser for the Pumping of
High Average Power Ti: sapphire CPA system"
16:50 - 17:15 S .Harayama "Development of All Sblid-State,High Average(JAERI) Power Ui t ra-Short Pulse Laser for X-ray
Generation"
17:15 - 17:40 S.Konno "80W-cw-TEMOO IR Beam Generat ion by Use(Mitsubishi Electric Corporation of a Laser-Diode-Side-Pumped NdfYAG RodAdvanced Research R&D Center) Laser". Susumu Konno, Shuichi Fujikawa,
and Koji Yasui
17:40 - 18:05 N.Umezu "Reliability of a Czochralski-Grown(SONY Corp. 13 -BaB2O4 Crystal"
Research Center)
- 1 7 7 -

JAERI-Conf 98-004
13th Advanced ICFA Beam Dynamics Workshopand 1st ICFA Novel and Advanced Accelerator Workshop:
the Second Generation Plasma Accelerators
14 to 18 July 1997
Kyoto Research Park
Kyoto, JAPAN
organized by International Committee for Future Accelerators (ICFA)hosted by High Energy Accelerator Research Organization (KEK)
and Japan Atomic Energy Research Institute (JAERI)
joined by1st JAERI Workshop on Ultrashort-Pulse Ultrahigh-Power Lasers
and Simulations for Laser-Plasma Interactions
as
Joint ICFA/JAERI-Kansai International Workshop '97
- 178 -

800-945 registration
JAERI-Conf 98-004
Program
July 14 (Mon)
945-1115 K.Nakajima, chairman945-1015 welcome
Hirata(ICFA), Amiranoff(ICFA), Ohno(JAERI)1015-1045 Y. Nishida(Utsunomiya U.) Plasma Based Cross-Field Particle Acceleration
with High Power Microwave1045-1115 C. Clayton(UCLA) Second Generation Beatwave Experiments at UCLA
1115-1145 coffee
1145-1315 D.Umstadter, chairman1145-1215 H. Dewa(JAERI) KEK-JAERI-U.Tokyo Experiments of High Energy Gain
Laser Wakefield Acceleration1215-1245 M. Downer(U.Texas, Austin) Laser Wakefield Acceleration Experiments1245-1315 F. Amiranoff(LULI) The Laser Wakefield Program at Ecole Polytechnique
1315-1440 lunch
1440-1600 W.Gai, chairman1440-1500 N.Barov(UCLA) The UCLA/ANL Plasma Wakefield Experiment1500-1520 A.M.Kudryavtsev(BINP) Plasma Wake-Field Acceleration for High
Energies: Physics and Perspectives1520-1540 R. Assmann(SLAC) Proposal for a lGeV Plasma-Wakefield Acceleration
Experiment at SLAC1540-1600 P. Chen(SLAC) Proposal for a FFTB Plasma Lens Experiment at SLAC
1600-1630 coffee
1630-1800 Y. Kitagawa, chairmanintroductory talks by working group chairmen (J.Rosenzweig, T.Katsouleas, T.Tajima)
July 15 (Tue)-17 (Thu)
Working Group Sessions
Group I injection and dynamics of accelerated beams,chaired by K. Yokoya, and J.Rosenzweig
Group II dynamics of plasma-wave drivers (lasers in LWFA and beams in PWFA) and plasmaschaired by T. Katsouleas and K.Nakajima
Group III near-term and far-term applications of plasma acceleratorschaired by T.Tajima and P.Chen
Julyl8(Fri)
900-1030 H.Hirata, chairmanWorking Group Summary Reports and Closing
to be followed by JAERI Workshop Summary
- 1 7 9 -

JAERI-Conf 98-004
Proposed Talks at the Working Group Sessions
If you want to make talks in addition to those listed below,(or if you find anything wrong in the list),
please contact the working group chairmen,preferably within July 14, Monday.
Group I
D.Bernard: Electron Capture in the Laser Wake-Field Acceleration Experiment
R.Hemker: Cathodeless, High Brightness Electron Beam Production by Multiple Laser Pulses inPlasmas
N.Kirihara:Vp x B Electron Linear Accelerator with TE-wave Assisted by Plasma for Beamstabilization
F.Pegoraro:Nonlinear Electrodynamics of the Interaction of Ultraintense Laser Pulses with a ThinFoil
M.Uesaka: Femtosecond Electron Injection for Laser Wakefield Acceleration
D.Umstadter: Laser Injection and Wakefield Acceleration in a Guided Channel
X.Wang: Femto-Second Micro-bunched Electron Beam Generation using IFEL
Group II
N. Andreev:The Problems of Laser Wake Field Acceleration in Plasma Channels
S.Bulanov: Variety of Nonlinear Wave-Breaking
P.Chen: Laser Pulse Shaping and the Laser-Plasma Coupling Efficiency
M.Downer: Lasers for Accelerators
W.Gai: High Current Electron Drive Beam for Plasma Wakefield Acceleration
H.Hojo: Particle Acceleration by Subcycle Laser Pulses
J.Koga/Y.Kishimoto: Simulation of Short Pulse Laser Propagation and Wake Field GenerationIncluding Ionization and Polarization Effects
K.Lotov: Simulation of Ultrarelativistic Beam Dynamics in Plasma Wake-Field Accelerator
M.Mori: Ultra Intense Glass Laser System and Laser-Plasma Interactions
K.Nakajima: Developments of Laser Wakefield Accelerators at JAERI-Kansai
R.Sugihara: Electron Acceleration by Two Colinear, Overlapping Laser Beams
L.Tsintsadze-.Nonlinear Wakefields in an Electron-Positron-Ion Plasma
- 180 -

JAERI-Conf 98-004
Group III
D.Bernard: One GeV Acceleration with Laser Wake-Field in the Linear Regime
P.Chen: Testing Unruh Radiation in Plasma Wavefronts
I.Pogorelsky : Prospects for LWFA and electron-positron colliders using CO2 laser drivers
A.Ogata : Laser/Plasma Accelerator in Terminology of RF Linac
T.Tajima : Laser Collider at a Quantum Operating Regime
- 181 -

JAERI-Conf 98-004
N u eA
o • Akahane, Yutakao • Amiranoff, Francoiso»ANDREEV, Alexandre A.o • Andreev, Nikolai E.o • Arisawa, Takashio • Assmann, Ralph W.
Bo • Barov, Nikolaio • Barty, Christopher P. J.o • Bernard, Deniso • Biswal, Subrato • Bulanov, Sergei V.
Co»CHAMBARET, Jean - Paulo • Chen, Pisino • Chihara, Jyunzoo • Clayton, Chris
Do • Dewa, Hidekio • Downer, Mike
Eo • Endo, Akira
Fo • Ferrario, Massimo
Go • Gai, Wei
Ho • Harayama, Sayakao • Hatsuda, Yoshioo • Henker, Roy Go • Hirata, Kohj io • Hizanidis, Kyriakoso • Ho jo, Hi tosh i
Io • lhara, Hi toshio • | izumi, Masashio • Ikegami, Masanorio • Inoue, Makotoo • | toh, Tami take
Ko • Kando, Masakio • Kato, Takakoo • Katsouleas, Thomas C.o • Kawachi, Tetsuyao • Kawanishi, Shun-ichio • Kirihara, Naotoshio • Ki sh i mo to, Yasuakio • Kobayashi, Katsuyukio • Koga, Jameso • Konno, Susumuo • Kotaki, Hideyukio • Koudriavtsev, Andrey M.• Koyama, Kazuyoshi
o • Kumada, Masayukio • Kurihara, Yoshimasao • Kuroda, Hiroto
Lo • Lotov, Konstantin V.
Vo • Waruyama, Toraoyuki
Joint ICFA/JAERI-Kansai International Workshop '97July 14 - 18 , .1997
List of the Registrants(106) and Paticipants(106)O : Registrants# : Paticipants
Affliction
JAERI, JAPANLULI, FRANCEVisiting Prof, in ILE Osaka U., JAPANHEDRC of RAS, RUSSIAJAERI, JAPANSLAC, U. S. A.
ANL, U. S. A.Univ. California, San Diego, U. S. A.LPNHE, Ecole Polytechnique, FRANCEUniversity of Michigan,General Phys. Inst. , Moscow, RUSSIA
LOA - ENSTA, FRANCESLAC, U. S. A.JAERI, JAPANUCLA, U. S. A.
JAERI, JAPAN
University of Texas .U.S.A.
SHI, JAPAN
INFN-LNF, ITALY
ANL, U. S. A.
JAERI, JAPANNEC G&E Div,UCLA, U. S. A.KEK, JAPANNATIONAL TECHNICAL UNIVERSITY OF ATHENS, GREECETsukuba U., JAPANJAERI, JAPANJAERI, JAPANNSRF, ICR, Kyoto U., JAPANKyoto U., JAPANJAERI, JAPAN
Kyoto U./JAERI, JAPANNIFS, JAPANUniv. Southern Cal ifornia , Dept. EE-Electrophysics, U. S. A.RI KEN, JAPANJAERI, JAPANUtsunomiya U., JAPANJAERI, JAPANFemtos-econd Technology Research Association, JAPANJAERI, JAPANMitsubishi Electric Corporation Advanced Research R&D Center, JAPANJAERI, JAPANBudker Institute of Nuclear Physics .RUSSIAJAPANNIRS, JAPANKEK, JAPAN
Institute for Solid State Physics, Univ. of Tokyo, JAPAN
Budker Institute of Nuclear Physics .RUSSIA
JAERI, JAPAN
- 182

JAERI-Conf 98-004
o • Maruyama, Yoichi roo • Matoba, Tooruo • Matsuoka, Shinichio • Matsushima, Isaoo • MENDONCA, J. T.o«MIGUS, Arnoldo • Mima, Kuniokio • More, Richardo • Mori, MichiakiQ • Mori, Warren B.o • Moribayashi, Kengoo • Mourou, Gerald
• Naito, Kentao • Nakaj ima, Kazuhisao • Nakanishi, Hiroshio • Nakano, Masafumio • Nees, Johno • Nishida, Yasushio • Nishihara, Katsunobuo • Nishimura, Akihikoo • Noda, Aki ra
Au
o • Ogata, Atsushio • Ohno, Hideoo • Okamoto, Hi romi
B
ro • Pegoraro, Francescoo • Peng, Shietungo • Petracca, Stefaniao • Pogorelsky, Igor
on
o • Rosenzweig, James B.o • Rousse, Antoineo • Ruhl, Hartmut
c
o • Sakai, Jun-ichio • Sasaki, Akirao • Sasuga, Tsuneoo • Sentoku, Yasuhikoo • Shadwick, Brado • Skoric, Mi los M.o • Sugihara, Ryo• Sugiyama, Akira
1
o • Taj ima, Toshikio • Takabe, Hideakio • Takuma, Hiroshio • Tani, Keijio • Tsintsadze, Levano • Tsuchida, Noboruo • Tsunemi, Akira
iiu
o • Uesaka, Mi tsuruo • Ueshima, Yutakao • Umezu, Nobuhikoo • Umstadter, Donaldo • Utsumi, Takayuki
•
o • Wang, Xijieo • Washio, Masakazu
vT
o • Yamakawa, Koichio Yamanaka, Chiyoeo • Yokoya, Kaoruo Yoshida, Norimasao Yoshikawa, Hiroshio • Yugami, Noboru
7L
o • Zolotoukhina, Tatiana N.
JAERI, JAPANJAERI, JAPANJAERI, JAPANETL, JAPANINSTITUTE SUPERIOR TECNICO, PORTUGALLULI, FRANCEILE, Osaka U., JAPANLawrence Livermore National Laboratory, U. S. AILE, Osaka U., JAPANUCLA, U. S. A.JAERI, JAPANU. Michigan, U.S. A.
NISSIN ELECTRIC CO. LTD, JAPANKEK, JAPANKEK, JAPANJAERI, JAPANUniversity of Michigan, U. S. AUtsunomiya U., JAPANOsaka U., JAPANJAERI, JAPANKyoto U., JAPAN
KEK, JAPANJAERI, JAPANKyoto U., JAPAN
University of Pisa, ITALYAizu U., JAPANUniversity of Salerno/Canon Fellow, ITALYBNL, U. S. A.
UCLA, U. S. A.LOA - ENSTA, FRANCEPost Doc./ILE, Osaka U., JAPAN
Toyama U., JAPANJAERI, JAPANJAERI, JAPANStudent/Osaka U., JAPANPhysics Department, University of CaliforniaVinca Institute /JAERI, YugoslaviaNagoya U., JAPANJAERI, JAPAN
UT Austin/JAERI, U. S. A.ILE, Osaka U., JAPANJAERI, JAPANNASDA, JAPANILE, Osaka U., JAPANJAERI, JAPANBNL, U. S. A.
NERL, U. Tokyo, JAPANJAERI, JAPANSONY Corp. Research Center, JAPANU. Michigan, U. S. AJAERI, JAPAN
ATF/BNL, U. S. A.SHI, JAPAN
JAERI, JAPANInstitute for Laser Technology, JAPANKEK, JAPANToshiba Co., JAPANJAERI, JAPANUtsunomiya U., JAPAN
A 1ST, JAPAN
- 1 8 3 -

JAERI-Conf 98-004'
AAkaoka, KatsuakiAndreev, A.A.Arisawa, TakashiBBabzien, M.Ben-Zvi, I.Biswal, Subrat
CCamino, F.Chihara, JunzoCline, D.B.
DDias, J.M.Downer, Mike.C.
EErickson, EdwardFFiorito, R.B.Fujikawa, ShuichiFukui, TatsuoGGallardo, J.C.Gottschalk, S.C.Graziani, FrankGuethlein, GaryHHarayama, SayakaHe, P.
1Itoh, Tamitake•w
JJovanovic, MomaKKato, MasaakiKato, MasatoshiKato, TakakoKimura, W.D.Kishimoto, YasuakiKondo, KenjiKonno, SusumuKubota, ShigeoKusche, K.P.LLevatin, JoannLibby, StevenLiu, Y.MMaluckov, Aleksandra
Author Index
JAERI
Vavilov State Optical Institute
JAERI
BNL
SUNY at Stony Brook
Univ. Michigan
SUNY at Stony Brook
JAERI
UCLA
Institute Superior Tecnico
Univ. of Texas
EEA
NSWC
Advanced Technology R&D Center, Mitsubishi Electric Corporation
Research Center, Sony Corporation
BNL
STI Optronics Inc.
LLNL
LLNL
JAERI
UCLA
JAERI
Univ. ofNis
JAERI
NIFS
NIFS
STI Optronics Inc.
JAERI
Research Center, Sony Corporation
Advanced Technology R&D Center, Mitsubishi Electric Corporation
Research Center, Sony Corporation
BNL/STI Optronics Inc.
LLNL
LLNL
UCLA
Univ. ofNis
19 21
18
21
21
3
22422
2219
2102
114
19
22324
' 221212
222
16
8
2211112142423242
12122
8
- 1 8 4 -
JAERI-Conf 98-004
Maruyama, YoichiroMatoba, TohruMatsuoka, ShinichiMendonca, J.T.Mima, KuniokiMore, RichardMoribayashi, KengoMorita, RyujiMourou, Gerard
NNagatomo, HideoNaruo, SyujiNees, JohnNishihara, KatsunobuNishimura, AkihikoNiwa, Yoshito
OOba, MasakiOhnishi, NaofumiOhzu, AkiraOkamoto, TakashiOkamoto, TsutomuOsterheld, AlOwada, SusumuP
Pantell, R.H.Pastwick, L.J.Peng, ShietungPlatonov, K.Yu.Pogorelsky, I.V.Price, Dwight
QQuimby, D.C.
RRobinson, K.E.Rule, D.W.
SSandweiss, J.Sasaki, AkiraSatou, SousukeSedukhin, IgorSedukhin, StanislavSentoku, YasuhikoShepherd, RonnieSilva, L.O.Skaritka, J.Skoric, Milos.M.Steinhauser, L.C.Stewart, RickSugiyama, AkiraSunahara, Atsusi
JAERI
JAERI
JAERI
Institute Superior Tecnico
ILE, Osaka Univ.
LLNL
JAERI
Hokkaido Univ.
Univ. Michigan
ILE, Osaka Univ.
ILE, Osaka Univ.
Univ. Michigan
ILE, Osaka Univ.
JAERI
JAERI
JAERI .
ILE, Osaka Univ.
JAERI
ILE, Osaka Univ.
Research Center, Sony Corporation
LLNL
RASEL
Stanford Univ.
STI Optronics Inc.
Univ. of Aizu
Vavilov State Optical Institute
BNL
LLNL
STI Optronics Inc.
STI Optronics Inc.
NSWC
Yale Univ.
JAERI
RASEL
Hiwada Electronic Corp.
Univ. of Aizu
ILE, Osaka Univ.
LLNL
Institute Superior Tecnico / UCLA
BNL
Vinca Institute
STI Optronics Inc.
LLNL
JAERI
ILE, Osaka Univ.
19 2116 21
117
18
18
16 1821
2
2222201512131619
551961922
215196241119
221541712
22
3 7 8 13191515311128212195
- 185-

JAERI-Conf 98-004
Tajima, ToshikiTakabe, HideakiTakuma, HiroshiTanaka, K.A.Tatsuki, KouichiTei, KazuyokuU
Ueshima, YutakaUmezu, NobuhikoUtsumi, Takayuki
VvanSteenbergen, A.
WWada, HiroyukiWalling, Rosemary
YYakimenko, V.Yamakawa, KoichiYamashita, MikioYasui, HidekazuYasui, KojiYoung, Bruce
JAERI/Univ. of Texas
ILE, Osaka Univ.
JAERI
ILE, Osaka Univ.
Research Center, Sony Corporation
JAERI
JAERI
Research Center, Sony Corporation
JAERI
BNL
Research Center, Sony Corporation
LLNL
BNL
JAERI
Hokkaido Univ.
ILE, Osaka Univ.
Advanced Technology R&D Center, Mitsubishi Electric Corporation
LLNL
3 7 8
16 18 19
16
13
21
21
9
1452242422
32413
2412
220166
2311
- 1 8 6 -
JAERI-Conf 98-004
Keyword IndexAAdaptive optics 22All-solid-state CW UV laser 24Anomalous absorption 8Array processors 15Atomic kinetics 13Atomic models 12Atomic structure 10BBBO 24Boltzmann equation 9Bremsstrahlung emission 3CCarbon atom 7Chirped pulse 16Chirped pulse amplification (CPA) 18 19 20 22Cluster plasma 14Czochralski 24DDegenerate electron plasma 10Dense plasma 6Dependence analysis 15Differential Algebraic CIP scheme 9EElectric conductivity 6FFlashlamp pumping 19Free running 19GGrain narrowing 20Grain saturation 20HH and He-like AI spectra 11High energy storage density laser materials 18High intensity short pulse X-ray emission 7High peak power laser 22High power laser 14Hollow fiber 16IImplosion 5Inhomogenenous plasma 4Inner-shell ionization 7Inner-shell X-ray laser 3Integrated code 5Ionization 10 11LLarmor radiation 3Laser diode 21Laser fusion 5Laser interaction 12
- 1 8 7 -

JAERI-Conf 98-004
Laser plasma 8Laser produced plasma 13Laser scanning tomography 24LD-pumped laser 22Linear systems 15Liquid metal 10MMaster oscillator power amplifier 21Multi-pass amplification 22NNd:YAG 21Nonlinear crystal 21Nonlinear fiber 16Nonlinear propagation 16Non-LTE atomic kinetics 12Numerical algorithms 15OOptical properties 12PParticle-in cell simulation 14Petawatt laser 18Photolithography 24Plasma 10Polarization mode 14Pulse stretcher 16RRadial distribution function 10Rayleigh-Taylor instability 5Recombination 11Regenerative pulse shaping 20Resonant absorption 4Rezoning 5S2-D ALE code 5Self focusing 6Short laser pulse 4Short-pulse intense X-ray 3Short-pulse ultra high intensity laser 3Stimulated Raman scattering 8Stochastic motion 14Surface mode 14Symmetric split-step Fourier method 16Systolic processing 15
Tirsapphire 19Time evolution of X-ray 11Top seeded solution growth 24UUltra fast atomic process 7Ultra short pulse 6Ultra short pulse laser 22
- 1 8 8 -

JAERI-Conf 98-004
Ultra-short pulse 12Ultra-short pulse laser 11VVlasov equation 9WWavefront compensation 22XX-ray generation 14X-ray laser 7 13X-ray lasers 8YYtterbium glass 18 19ZZigzag slab crystal 21
- 1 8 9 -

M SI2
ft §K ftm is« m1{?l %. ft
ft X¥ 11 ^# ft- n
7T^A
7
X
—
n
y
y
if
T 7
f 7
'x
b"
fr
A
ry
;v7
y
12 -it
mkgsAK
molcd
rad
sr
m
EEX -
X«
m
•3
)i
m
m
m
tl , f
*, m«t ft ,
^ gy ¥ 9 9
;i/ i- -> x
ft m
is Af.ssam M
fiSi
y x
my xM E
5Kft
a
X
/?
i '
77
#
7~
?r
-b
* m>v
j . — ^
X ;#i —
— p
>vr 7
-— / yx —
Xy y
— ?
7
7 V
V
- ^ )V
Vy
ft/)V
y
hKA
X<5
7
—
Ky
X;l-
A
ia^
HzNPaJ
W
cVFDS
WbTH°Clmlx
Bq
GySv
K*«JSs"'m-kg/s2
N/m2
N-mJ/s
.A-sW/AC/VV/AA/VV-sWb/m2
Wb/A
cd-srlm/m2
s-'
JAgJ/kg
y y hh
M1- '1? A
0
y
b
IB
min,
I, Lt
eVu
h, d
« 5 SHSSRll
leV=1.60218xlO-'9J
1 u =1.66054x10-^kg
^^
iS
w y7
_
_
y
Ay
—
y
KA
Ab
barGalCiR
radrem
1 A=0.1nm=10-10m
1 b=100fm2=10-28m2
1 bar=0.1MPa=105Pa
1 Gal=lcm/s2=10-2m/s2
lCi=3.7xl010Bq
1 R=2.58 x 10"4C/kg
1 rad=lcGy=10"2Gy
1 rem=lcSv=10-2Sv
fgic1O'8
1O15
1O'2
109
10"103
102
10'
io-'10~2
io-3
10"6
10"°io-'2J0-,510"18
&
X
T
T-b^
•?'
•f
b*77
7
A*•ffD
y f-y
< 7U
ta •EpTGMkhda
dcmIXn
Pfa
1 - 5
(SO1.
2.
3. bar i±,
4 .
, tztzh, 1 eV
r, barn«J;
N(=105dyn)
1
9.80665
4.44822
kgf
0.101972
1
0.453592
lbf
0.224809
2.20462
1
lPa - s (N-s /m 2 )=10P(^ rX) (g / ( cm-s ) )
Im2 /s=104St(X h -
£E MPa(=10bar)
I
0.0980665
0.101325
1.33322x10-"
6.89476X10"3
kgf/cm 2
10.1972
1
1.03323
1.35951X10"3
7.03070X10"2
atm
9.86923
0.967841
I
1.31579 xlO'3
6.80460 xlO~2
mmHg(Torr )
7.50062 xlO3
735.559
760
1
51.7149
Ibf/in2(psi)
145.038
14.2233
14.6959
1.93368 xlO-2
1
X
;v•V1ft4*sift
m
J(=107 erg)
1
9.80665
3.6x10°
4.18605
1055.06
1.35582
1.60218 x 10-'9
kgf-m
0.101972 .
1
3.67098XI05
0.426858
107.586
0.138255
1.63377 x 10⁻²⁰
kW-h
2.77778 xlO"7
2.72407 xlO"6
1
1.16279 xlO-6
2.93072 xlO"4
3.76616 xlO"7
4.45050 xlO"26
cal(tr»ft)0.238889
2.34270
8.59999 xlO5
1
252.042
0.323890
3.82743 xlO"20
Btu
9.47813x10-"
9.29487 xlO"3
3412.13
3.96759 xlb"3
I
1.28506 xlO'3
1.51857 xlO"22
ft-lbf
0.737562
7.23301
2.65522 XlO6
3.08747
778.172
1
1.18171 xlO"19
eV
6.24150 xlO'8
6.12082 xlO'9
2.24694 xlO25
2.61272 xlO19
6.58515 xlO21
8.46233 xlO18
1
1 cal= 4.18605J (tfftr£)
= 4.184J (mit¥)
= 4.1855J (15°C)
= 4.1868J
1
= 75 kgf-m/s
= 735.499W
Bq
1
3.7xlO'c
Ci
2.70270x10""
1
Gy
1
0.01
rad
100
1
C/kg
2.58x10"
R
3876
1
Sv
1
0.01
rem100
1