
JAERI-Conf - 2003-019(Part )
486
JAERI-Conf JP0450085 2003-019(Part ) A Part I Organized and Sponsored by JA PA N A TOMIC ENERG Y RESEA RCH INS TITUTE ATOMIC ENERGY SOCIETY OF JAPAN Co-sponsored by JAPAN NUCLEAR CYCLE DEVELOPMENT INSTITUTE El 7r\ R, -7- h ff R Ph Japan Atomic Energy Research Institute
-
Upload
khangminh22 -
Category
Documents
-
view
1 -
download
0
Transcript of JAERI-Conf - 2003-019(Part )

JAERI-Conf JP0450085
2003-019(Part )
A
Part IOrganized and Sponsored by
JA PA N A TOMIC ENERG Y RESEA RCH INS TITUTEATOMIC ENERGY SOCIETY OF JAPAN
Co-sponsored by
JAPAN NUCLEAR CYCLE DEVELOPMENT INSTITUTE
El 7r\ R, -7- h �ff R Ph
Japan Atomic Energy Research Institute

(T319-11955�JwoaMblaCktf) b, VPLIMUT;�-L).
(T319-1195
--�' -C 16 9 1 T.
This report is issued irregularly.Inquiries about availability of the reports should be addressed to Research
Information Division, Department of Intellectual Resources, Japan Atomic EnergyResearch Institute, Tokai-mura, Naka-gun, Ibaraki-ken T 319-1195, Japan.
(O Japan Atomic Energy Research Institute, 2003
W**)Ui H 4� T j Iff A Ofi

JAERI-Conf 2003-019
CONTENTS
PART I II
PARTI
Plenary Session Monday, October 20
O p en ing A d d ress ..................................................................................................................................... 3S Saito (President of Japan Atomic Energy Research Institute and President of Atomic EnergySociety of Japan, Japan)
Four Years after the JCO Criticality Accident ..................................................................................... 5K. Sumita (Emeritus Professor of Osaka University and Consultant of Osaka Science Technology, Japan)
Overview of Activities of the OECD/NEA/NSC Working Party on Nuclear Criticality Safety ........ 11A. Nouri (OECD Nuclear Energy Agency), R. Blomquist (ANL, USA), M B. Raap (PNNL, USA),B. Briggs (INEEL, USA), P. Cousinou (IRSN, France), Y Nomura (JAER1, Japan), C. deOliveira (Imperial College ofScience, UK) and W. Weber (GRS, Germany)
Current Status of 1AEA Activities in Spent Fuel Management ........................................................... 17W. J. Danker (1AEA)
1. Topic Standards and Methodology for Criticality Safety
Oral Session -1 Tuesday, October 21
1.1 Selection of Exception Limits for All Actinide Nuclides Based on Revised Criteria for SafeIniernational T ransport .......................................................................................................................... 25
C. Lavarenne (IRSN, France), D. Mennerdahl (EMS, Sweden), C. Dean (SERCO, UK), N.Barton (Departmentfor Transport, UK), V. Rouyer, G.Sert (IRSN, France), F. Jean (APTUS,France)
1.2 Results of an OECD/NEA Comparison of Minimum Critical Values ................................................. 31W Weber (Geselischaft fr Aniagen- und Reakforsicherheit (GRS) mH, Germany) and D.Mennerdahl (EMS, Sweden)
1.3 Isopiestic Density Law of Actinide Nitrates Applied to Criticality Calculations ............................... 37N. Leclaire J Anno, G. Courtois, G. Pouliot and V. Rouyer (IRSN, France)
1.4 Criticality of Mixtures of Plutonium and High Enriched Uranium .................................................... 44E. Grolleau, M. Lein, G. Leka, B. Maidou and P. Klenov (SGN, France)
Oral SeWon T1-2 Wednesday, October 22
1.5 How Can a Potential Moderation and/or Reflexion of the Neutrons between the FuelUnits Be Modelled to Give the Maximum of the k-eff - No Equivalence between a WaterL ayer and a M ist ...................................................................................................................................... 4 9
C. Lavarenne (IRSN, France), A. Cossenet (Consort Technologies, France) and N. Leclaire(IRSN, France)
1.6 The Moisture Content Monitoring Device for P02 Using Self Neutron Radiation .......................... 55V. Bulanenko, V. Sviridov, V. V. Frolov, B. G. Ryazanov and V. V. Talanov (1PPE' Russia)
1.7 Applications of the TSUNAMI Sensitivity and Uncertainty Analysis Methodology .......................... 61B. T Rearden, C. M Hopper, K R. Elam, S. Goluoglu and C. V. Parks (ORNL, USA)
1.8 Application of Reactivity Equivalence Relations to MOX Fuel Systems ............................................ 67J C. Neuber (ramatome-ANP GmbH, Germany)
Oral Session T1-3 Wednesday, October 22

JAERI-Conf 2003-019
1.9 Review of Criticality Safety Assessments for Transport Packages by the German CompetentA u th o rity .................................................................................................................................................. 7 3
I. Reiche (Bundesamtftir Strahlenschutz, Germany)
1.10 Activity of the Atomic Energy Society of Japan for Compiling the Consensus Standard onN uclear C riticality Safety C ontrol ......................................................................................................... 75
Y. Yamane (Graduate School of Engineering, Nagoya University, Japan) and Matsumoto(JNC, Japan)
1.11 RegulatoryAspectsofCriticalityControlinAustralia ........................................................................ 79S.Zimin(AustralianRadiationProtectionandNuclearSafetyAgency,Australia)
1.12 ALARP Considerations in Criticality Safety Assessments ................................................................... 83R. L. Bowden, A. Barnes, P. P, Thorne and J. Venner (Nuclear Technologies p1c, UK)
Poster Session
1.13 Minimum Critical Values of Uranyl and Plutonium Nitrate Solutions Calculated by VariousRoutes of the French Criticality Codes System CRISTAL using the New Isopiestic NitrateD en sity L aw .............................................................................................................................................. 8 9
J. Anno, V. Rouyer and N. Leclaire (IRSN, France)
1.14 Actinides Critical M asses and the Paxton W oodcock Rule .................................................................. 94J Anno, 1. Duhamel, C. Lavarenne (IRSN, France) and M Duluc (Nuclear Engineer Student atINSTN, France)
1.15 The Effect of Reflection on an 18kg Sphere of HEU and a 4.5kg Sphere of Plutonium (239pU)
U sing V arious M aterials ......................................................................................................................... 99D. Bower, L. Sutton (AWE, UK) and S. Plummer Nuclear Technologies, UK)
1.16 NDA Neutron M ethod for U02 Powder Humidity ................................................................................ 105V. L Bulanenko and V. V Frolov (IPPE, Russia)
1.17 Monte Carlo Simulation of NDA for Fissile Materials Humidity ........................................................ 110V. L Bulanenko and V. B. Polevoy (IPPE, Russia)
1.18 Revised Data for 2nd Version of Nuclear Criticality Safety Handbook/Data Collection .................. 116H. Okuno (JAER, Japan), S Ryufuku (Visible Information Center, Inc., Japan), K. SuYama YNomura, K. Tonoike and Y Miyoshi (JAERI, Japan)
1.19 Critical and Subcritical Parameters of the System Simulating Plutonium Metal Dissolution .......... 122Y. Y. Vasilev, B. G. Ryazanov, V. L Sviridov and L. . Mozhayeva (IPPE, Russia)
1.20 K-effective as a M easure of Criticality Safety ....................................................................................... 128J Venner, R. M Haley and R. L. Bowden (Nuclear Technologies p1c, UK)
2. Topic 2 Criticality and Subcriticalty Experiments
Oral Session 2-1 Monday, October 20
2.1 IRSN Projects for Critical Experiments "Low Moderated MOX Fuel Projects" and Others .......... 135V. Rouyer, L Duhamel (IRSN, France), G. Poullot (Retiredfrom IRSN. France), P. Cousinou(IRSN, France), F. Barbry, P. Fouillaud and E. Girault (CEA Valduc, France)
2.2 Results and Preliminary Analysis of Critical Experiments on Assemblies with Uranium and
M O X F uel R od C lusters .......................................................................................................................... 140V. S. Vnukov, B. G. Ryazanov, V. 1. Sviridov, V. F. Shapsha Y D. Makarenkov and 0 VSichkaruk (IPPE, Russia)
2.3 Sub-critical Pulsed Neutron Experiments with Uranyl Nitrate Solutions in Spherical
G eo m etry .................................................................................................................................................. 14 4V N. Gurin, B. G. Ryazanov, V. L Sviridov and V V. Volnistov (IPPE, Russia)
2.4 Criticality Analysis of Highly Enriched Uranium Fueled, Polyethylene-Moderated[ReflectedThermal Spectrum Cores of Kyoto University Critical Assembly ...................................................... 149
H. Unesaki T Misawa C Ichihara, K. Kobayashi, H. Nakamura, C -H. Pyeon and S. Shiroya
H

JAERI-Conf 2003-019
(Research Reactor Institute, Kyoto University, Japan)
Oral Session 2-2 Monday, October 20
2.5 Critical Experiments of STACY Homogeneous Cores Containing 0% Enriched Uranyl
N itrate S o lu tion ........................................................................................................................................ 15 4Y. Miyoshi T Yamamoto, K. Tonoike, Y. Yamane and S. Watanabe (JAERI, Japan)
2.6 Examination of the 2x2 SiO2, Al and Fe Experiments Mixed with Highly Enriched Uranium
on the T herm al E nergy R egion .............................................................................................................. 160D. Loaiza and R. Sanchez (LANL, USA)
2.7 Results and Preliminary Analysis of Critical Experiments with Interacting Slab
S o lu tio n T a n k s ......................................................................................................................................... 16 6V. N. Gurin, B. G. Ryazanov and V. L Sviridov (IPPE, Russia)
2.8 Critical Experiments of Basic Heterogeneous Core Composed of LWR Fuel Rod Array
and Low Enriched U ranyl N itrate Solution .......................................................................................... 171S. Watanabe, T Yamamoto, T Nakamura, H. Hirose K Izawa and Y. Miyoshi (JAER, Japan)
Oral Session T2-3 Monda4 October 20
2.9 Measurement of Subcriticality by Higher Mode Source Multiplication Method ............................... 178T Misawa and H. Unesaki (Kyoto University Research Reactor Institute, Japan)
2.10 Source-driven Noise Analysis Measurements with Neptunium Metal Reflected by High
E nriched U raniu m ................................................................................................................................... 18 3T E. Valentine and J. K. Mattingly (ORNL, USA)
2.11 Exponential Experiments on PWR Spent Fuel Assemblies .................................................................. 187H. Shin, S. -G. Ro, G. -S. Kim, Y -H, Hwang and H. -D. Kim KAERI, Korea)
2.12 Suberiticality M easurements in PW R Spent Fuel Pit ........................................................................... 192T Natsume, T Ida (Mitsubishi Heavy Industries, Lid, Japan), H. Doi (Nuclear DevelopmentCorporation, Japan), H. Okamoto (The Japan Atomic Power Company, Japan), H. Futamata(The Hokkaido Electric Power Co., Inc., Japan), Y. Tsuzuki (The Kansai Electric Power Co.,Inc., Japan), Y. Kato (Shikoku Electric Power Co., Inc., Japan) and A. Ao (Kyushu ElectricPower Co., Inc., Japan)
Oral Session 24 Tuesday, October 21
2.13 Criticality Safety Using Monte Carlo and Nodal Methods for a Small Beryllium
R eflected C ore .......................................................................................................................................... 19 7P. E A. de Leege (Delft University of Technology, The Netherlands), J Valko 1kesolConsulting, The Netherlands) and F Reitsma (NECSA, South Africa)
2.14 C riticality of a 237 N p Sphere .................................................................................................................... 20 1R. G. Sanchez, D. Loaiza, R. H. Kimpland D. K Hayes, C. C. Cappiello, W L. Myers, P. Jaegers, S. D. Clement and K. B. Butterfield (LANL, USA)
2.15 Numerical Simulation of CALIBAN Reactivity Perturbation Experiment Using
N eptunium -237 Sam ples ......................................................................................................................... 204P. Humbert and B. M6chiloua (CEA, France)
2.16 Experiments on Spherical Critical Assemblies Possessing a Large Central Cavity in the Core ....... 210M . Kavshinov, V. N. Bogdanov, S. V. Vorontsov V N. kyachin, V. P. Gorelov, V. P. Egorov,A. E. Zapol'ski, V. . Iin, A. V Korotchenkov, A. V Lke, G. N. Maslov, A. V Panin, D. P.Peshekhonov and E. F. Fomushkin (Russian Federal Nuclear Center - All-Russian ScientificResearch Institute ofExperimental Physics, Russia)
Poster Session
2.17 Absolute Measurement of the Subcriticality Based on the Third Order Neutron Correlation
in Consideration of the Finite Nature of Neutron Counts Data ........................................................... 215T Endo, Y. Kitamura, Y. Yamane (Graduate School of Engineering, Nagoya University, Japan)
iii
JAERI-Conf 2003-019
2.18 Experiments for Substantiation of RBMK Fast-scram System Based on Gaseous Absorber ........... 221V. Kachanov, E. Burlakov, A. Kuzmin and V. Jilarev (Russian Research Center �(KurchatovInstitutev, Russia)
2.19 Critical Experiments Recent and Future International Programmes in VENUS ........................... 225B. Lance, D. Marloye, J. Moerenhout, P. V. D. Hende, J. Basselier (Belgonucleaire, Belgium),P. Baeten, K. V. der Meer and P. Dhondt (SCK- CEN, Belgium)
2.20 Critical Experiment Program of Heterogeneous Core Composed of LWR Fuel Rods and LowE nriched U ranyl N itrate Solution .......................................................................................................... 231
Y Miyoshi, T Yamamoto, S. Watanabe and T Nakamura (JAERI, Japan)
2.21 Measurement of Neutron Flux Distribution of STACY Heterogeneous Core by Position
Sensitive P roportional C ounter .............................................................................................................. 236M. Murazaki, Y. Uno and Y. Miyoshi (JAERI, Japan)
2.22 The International Science and Technology Center (ISTC) and ISTC Projects Related toN uclear Safety (inform ation R eview ) .................................................................................................... 241
L. V. Tocheny (ISTC, Russia)
2.23 Real Time Alpha Value Measurement with Feynman-a Method Utilizing Time Series Data
Acquisition on Low Enriched Uranium System .................................................................................... 246K Tonoike, T Yamamoto, S. Watanabe and Y Miyoshi (JAER1, Japan)
2.24 Reactivity Effects of Neutron Isolator in Two-slab Tank Array Containing Low EnrichedU ranyl N itrate Solution ........................................................................................................................... 25 1
K Tonoike K Okubo K Iza-wa, S. Onodera and Y. Miyoshi (JAERI, Japan)
2.25 Interpretation of Subcritical Measurements with Polyethylene Reflected Plutonium Sphere .......... 257T E. Valentine (ORNL, USA)
2.26 Study on Variance-to-mean Method as Subcriticality Monitor for Accelerator Driven System
O perated w ith Pulse-M ode ..................................................................................................................... 263H. Yamauchi, Y. Kitamura, Y. Yamane (Graduate School of Engineering, Nagoya University,Japan), T Misawa and H. Unesaki (Research Reactor Institute, Kyoto University, Japan)
3. Topic 3 Criticality and Suberiticalty Benchmark Evaluation
Oral Session T3-1 Tuesday, October 21
3.1 Status of the International Criticality Safety Benchmark Evaluation Project (ICSBEP) ................. 271J. B. Briggs (NEEL, USA), A. Nouri (OECD Nuclear Energy Agency) and L. Scott (UnderSubcontract to the INEEL, USA)
3.2 OECD[NEA Source Convergence Benchmark Program: Overview and Summary of Results ........ 278R. Blomquist (ANL, USA), A. Nouri (OECD Nuclear Energy Agency), M. Armishaw (SercoAssurance, UK), 0. Jacquet (IRSN, France), Y Naito NAIS, Japan), Y Miyoshi and TYamamoto (JAERI, Japan)
3.3 Estimation of Accuracy of Criticality Prediction or Highly Enriched Uranium HomogeneousSystems on the Basis of Analysis of Data from ICSBEP Handbook ................................................... 283
T Ivanova, G. Manturov, M. Nikolaev, K. Raskach, E. Rozhikhin and A. Tsiboulia (IPPE,Russia)
3.4 Analysis of the LEU-COMP-THERM-049 MARACAS Critical Configurations UsingTRIPOLI-4.3 3D Lattices Geometry and JEFF3.0 Library ................................................................ 289
Y. -K. Lee (CEA Saclay, France)
Oral Session T3-2 Tuesday, October 21
3.5 Analysis on the 137 Np Sphere Surrounded by 235U Shells Experiment ................................................D. Loaiza and R. Sanchez (LANL, USA) 296
3.6 HERBE - Coupled Fast-thermal Core as Possible Criticality Benchmark ......................................... 299M P. Pegi6 (The VINOA Institute offuclear Sciences, Serbia and Montenegro)
iv

JAERI-Conf 2003-019
3.7 Comparisons for MCNP Criticality Benchmark Suite with ENDF/B-V1.8, JENDL-3.3, and
JE F F -3 .0 ................................................................................................................................................... 3 0 4D. H. Kim, C. -S. Gil, J. -D. Kim and J. Chang Y4ERI, Republic of Korea)
3.8 Analyses of Criticality and Reactivity for TRACY Experiments Based on JEND1,3.3
D ata L ib rary ............................................................................................................................................ 3 0 8H. Sono (JAER1, Japan), H. Yanagisawa Secretariat ofNuclear Safety Commission of Japan),K. Nakajima (Kyoto University Research Reactor Institute, Japan) and Y Miyoshi (JAERI,
Japan)
Poster Session
3.9 The Benchmark Results between MCNP and MONK Criticality Codes for a Full-scale
M odel of a Sub-critical G raphite Assem bly .......................................................................................... 314L. C-A Bourva (Canberra Industries, USA), P. Cowan (Serco Assurance, UK), S. Croft(Canberra Industries, USA) and,M Ferris (UK Atomic Eneqy Authority, UK)
3.10 Validation of the 3D Transport Monte Carlo Code TRIPOLI-4.3 for Moderated andUnmoderated Metallic Fissile Media Configurations with JEF2.2 and ENDF/B-VI.4
C ross Section E valuations ....................................................................................................................... 320E. Gagnier Y K Lee, L. Aguiar (CEA Saclay, France) and N. Vedrenne (CEA Valduc, France)
3.11 Sub-critical Measurement Simulation Comparisons between MCNP-DSP and
P A N D A C od es .......................................................................................................................................... 3 2 6P. Humbert and B. Mgchiloua (CEA, France)
3.12 Attempt of the Joint Analysis of the Entire Set of the HEU-SOL Type Experiments fromthe "International Handbook of Evaluated Criticality Safety Benchmark Experiments' . ............... 327
T Ivanova M Nikolaev K Raskach Y Rozhikhin and A. Tsiboulia (IPPE, Russia)
3.13 On Numerical Solution to the Problem of Criticality ........................................................................... 334J. Kyncl (Nuclear Research Institute Ae;!, p1c, Czech Republic)
3.14 Comparison of Criticality Benchmark Evaluations for UPu System - JACS System and the
O ther M onte C airo C odes . .................................................................................................................... 34 1T Takada, H. Yoshiyama, Y. Miyoshi andJ Katakura (JAER1, Japan)
3.15 Review of Criticality Safety Benchmark Data of Plutonium Solution in ICSBEP Handbook .......... 346T Yamamoto, Y. Miyoshi, and K. Okubo (JAER1, Japan)
3.16 The Sandwich Method for Determining Source Convergence in Monte Carlo Calculation ............. 352J. Yang and Y. Naito (NAIS Co. Inc., Japan)
4. Topic 4 Practice of Criticality Safety Design and Control
Oral Session T4-1 Monda4 October 20
4.1 Calculation of Allowable Fuel Masses for Handling and Post-irradiation Examinations ................. 361P. Grimm, J. -M. Paratte and J -M Hollard (Paul Scherrer Institute, Switzerland)
4.2 Possibilities of Television Technologies Application to Provide Safe Performance of Works
at C ritical F acilities ................................................................................................................................. 3 6 6J V. Zhukov, V. T Punin, G. M. Skripka M L Kuvshinov L A. Nikitin, S. V. Sorokin, V. N.Murin M R. Mochalov (Russian Federal Nuclear Center All-Russia Scientific-ResearchInstitute of Experimental Physics, Russia)
4.3 Criticality Safety Philosophy for the Sellafield M OX Plant ................................................................. 372J Edge and J Gulliford (British Nuclear Fuels p1c, UK)
4.4 CAAS - An Experts Working Group Revisits the Safety Files for the French Nuclear Safety
A u th o rity .................................................................................................................................................. 3 7 5L. Reverdy (CEA Saclay, France), F. Barbry (CEA Valduc, France), J T Battiston J M Bordy(IRSN, France), A. Devita (MELOX, France), M Doucet (FRAMATOME ANP, France), CGinisty (IRSN, France), A. Marc (SGN, France), V. Masse (CEA Saclay, France), R. Medioni(IRSN France), D. M�uin (CEA Saclay, France) and V Rouyer (IRSN, France)
V

JAERI-Conf 2003-019
Oral Se�gion T-2 Monday, October 20
4.5 Lessons Learned from a Criticality Safety Case for Historic PCM Waste Retrieval ........................ 379D. Kirkwood (British Nuclear Fuels p1c, UK)
4.6 A New Approach to the Criticality Safety Assessment of PCM at BNFL Sellafield .......................... 384S. Darby and D. Kirkwood (BNFL, UK)
4.7 Current Activities in Criticality Analyses for Final Disposal of Spent Nuclear Fuel and Fissile
M aterial Containing W aste in G erm any ............................................................................................... 389B. Gmal, K. Hummelsheim, R. Kilger, E. F. Moser (GeselIschaft fr Anlagen undReaktorsicherheit (GRS), Germany), and J Thiel (Bundesamtftir Strahlenschutz, Germany)
4.8 Decommissioning of a MOX Fuel Fabrication Facility Criticality Safety Aspects .......................... 395G. Kindleben and R. Baumann (Siemens AG, Germany)
Poster Session
4.9 Particle Packing Considerations for Pebble Bed Fuel Systems .............................................. ............ 401M. Armishaw, N. Smith and E. Shuttleworth (Serco Assurance, UK)
4.10 FRAMATOME-ANP France Criticality Calculation Route - Qualification and Safety
M argin D eterm ination ............................................................................................................................ 406M Doucet, N. Comte, M Landrieu and S. Zheng (ramatome-ANP Fuel Technology Service,France)
4.11 The Use of the Average Plutonium-content for Criticality Evaluation of Boiling Water
Reactor Mixed Oxide-fuel Transport and Storage Packages .............................................................. 408C. Mattera (Cogema Logistics, France)
4.12 NMC&A and Nuclear Criticality Safety Systems Integration: A Prospective Way for
Enhancement of the Nuclear Industry Facilities Safety ....................................................................... 412B. G. Ryazanov, V. . Sviridov, V. V. Frolov (IPPE, Russia), M 0. Shvedov (Ministry of theRussian Federationfor Atomic Energy), T P. McLaughlin and N. L. Pruvost (LANL, USA)
4.13 Criticality Safety Assessment on the RSG-GAS Spent Fuel Storage for Anticipating the Next
C ore C onversion P rogram ...................................................................................................................... 4 16T M. Sembiring (BATAN, Indonesia), P. H. Liem (NAIS Co., Inc., Japan), L Kuntoro andZuhair (BA TAN, Indonesia)
4.14 Neutronic Dimensioning of a Fast Breeder Reactor (FBR) Fuel Shipping Cask ............................... 422B. Thievenaz (ramatome-ANP Novatome Division, France), M Doucet (ramatome-ANP FuelTechnology Service, France) and A. Joudon (CEA Cadarache, France)
4.15 Problems and Experience of Ensuring Nuclear Safety in NPP Spent Fuel Storage Facilities
in R u ssia ................................................................................................................................................... 4 2 7V. S. Vnukov and B. G. Ryazanov (Federal State Unitary Enterprise, Russia)
Vi

JAERI-Conf 2003-019
PARTII
5. Topic Development of Computer Codes
Oral Session T5-1 Wednesday, October 22
5.1 Continuous-energy Version of KENO V.a for Criticality Safety Applications .................................. 439M E. Dunn, N. M Greene and L. M Petrie (ORNL, USA)
5.2 SCALE 5: Powerful New Criticality Safety Analysis Tools .............................................................. 447S M Bowman, D Hollenbach M D Dehart, B T Rearden, C. Gauld and S. Goluoglu(ORNL, USA)
5.3 Current Status and Future Direction of the MONK Software Package ............................................. 454N. Smith, M Armishaw (Serco Assurance, UK) and A. Cooper (British Nuclear Fuels p1c, UK)
5.4 Application of Distinct Element Method to Criticality Evaluation for MOX Fuel Fabrication
F a cility ...................................................................................................................................................... 4 6 0M. Sakai, T Yamamoto, M Murazaki and Y. Miyoshi (AERI, Japan)
Oral Session T-2 Thursday October 23
5.5 MORET: Version 4.1 A Multigroup Monte Carlo Criticality Code ................................................... 4660. Jacquet, Miss and G. Courtois (IRSN, France)
5.6 Validation of MORET 4 Perturbation against 'Physical' Type Fission Products Experiments ....... 472J. Anno, 0. Jacquet and J. Miss (IRSN, France)
5.7 CRISTAL VI: Criticality Package for Burn up Credit Calculations ................................................. 477J-M Gomit, P. Cousinou (IRSN, France), C Diop, G. F. de Grado (CEA, France), F.Gantenbein (IRSN, France), J-P. Grouiller (CEA, France), A. Marc (SGN, France), D. Mijuin(CEA, France) and H. Toubon (COGEM4, France)
5.8 Synthesis on the Validation of the CRISTAL VO Package ................................................................... 482I. Duhamel, J-M. Gomit (IRSN, France), Y.-K. Lee andC. Venard (CEA, France)
Oral Session T-3 Thursday, October 23
5.9 SWAT2: The Improved SWAT Code System by Incorporating the Continuous Energy Monte
C arlo C ode M V P ..................................................................................................................................... 48 8H. Mochizuki (The Japan Research Institute, Ltd, Japan), K. Suyama (OECD Nuclear EnergyAgency) and H. Okuno (JAERI, Japan)
5.10 Development and Verification of Monte Carlo Burnup Calculation System ..................................... 494Y A ndo, K. Yoshioka, L Mitsuhashi, K. Sakurada and S. Sakurai (Toshiba Corporation, Japan)
5.11 Monte Carlo Criticality Source Convergence in a Loosely Coupled Fuel Storage System ............... 500R. N. Blomquist and E. M Gelbard (ANL, USA)
5.12 Implementation of Convergence Judgment Method to OECD/NEA Benchmark Problems ............ 508T Kuroishi (Nuclear Fuel Industries Ltd, Japan) and Y Nomura AERI, Japan)
Poster Session
5.13 On a Fast Numerical Tool for Nuclear Accidental Dynamic Phenomenology and Application
to the Real Tim e Sim ulation of Lady G odiva ........................................................................................ 513Laurent Bindel, Andri Gamess, rgdjric Jasserand and Sibastien Laporte (GALINE0(MILLENNIUM Group), France)
5.14 New SCALE Graphical Interface for Criticality Safety ....................................................................... 516S. M. Bowman andJ E. Horwedel (ORNL, USA)
5.15 The Development and Validation of a New Collision Processor for MONK ...................................... 523S. Connolly (British Nuclear Fuels p1c, UK) and Al. Grimstone (Serco Assurance, UK)
5.16 Experimental Validation of the APOLLO2-MORET4 Standard Route of the French
VI!

JAERI-Conf 2003-019
C R IST A L V I P ackage ............................................................................................................................ 529I. Duhamel, E. Letang, A. Cossenet (IRSN, France) and G. Poullot (reliredfrom IRSN, France)
5.17 A M ORET Too] to Assist Code Bias Estimation ................................................................................... 535F. Fernex, Y Richet and E. Letang (IRSN, France)
5.18 CALICE An Essential Software Too] for Criticality Engineers ....................................................... 541E. Guillou (COGEA,1A LA HAGUE, France), H. Toubon (COGEMA VELIZY, France), L.Aguiar, D. MUuin (CEA SACLAY, France), G. Chazelle, E. Chtourbine, L. Clouet and E.
Lejeune (MILLENNIUM, France)
5.19 The Graphical User Interface for CRISTAL VI .................................................................................. 545L. Heulers, G. Courtois, F. Fernex, J. M Gomit and E. Letang (IRSN, France)
5.20 The SMORES Capability for Minimum Critical Mass Determination .............................................. 551Y. Karni, D. Regev, E. Greenspan (University of California, Berkeley, USA), S. Goluoglu, L. M.Petrie and C. M. Hopper (ORAIL, USA)
5.21 MCNP Based Calculation of Reactivity Loss due to Fuel Circulation in Molten Salt Reactors ....... 557J Kophazi, M. Szieberth, S. Feher, S. Czifrus Institute offuclear Techniques, Hungary) and P.F. A. de Legge (Deo University of Technology, The Netherlands)
5.22 Development of Direct Transmission Probability Method for Criticality Safety Analysis ............... 563T Matsumura and T Kameyama (Central Research Institute ofElectric Power Industry, Japan)
5.23 Numerical Analysis of the Reactivity for the Dry Lattices above the Water Level of
the C ritical F uel C ores ............................................................................................................................ 568Y. Nauchi and T Kameyama (Central Research Institute ofElectric Power ndustry, Japan)
5.24 Consideration of Convergence Judgment Method with Source Acceleration in Monte CarloC riticality C alculation ............................................................................................................................. 574
Y. Nomura (JAERI, Japan) and T Kuroishi (Nuclear Fuel Industries Lid, Japan)
5.25 Automated Suppression of the Initial Transient in Monte Carlo Calculations Based onStationarity Detection Using the Brownian Bridge Theory ................................................................. 578
Y. Richet, 0. Jacquet (IRSN, France) and X Bay (Ecole Nationale Supgrieure des Minesde Saint Etienne, France)
5.26 Contribution of the Experimental Validation of the French Criticality-Safety Package'CR ISTAL V I' APO LL0 2 SN R oute ................................................................................................... 584
C Venard, B. Camous (CEA Cadarache, France), S. Mengelle (CEA Saclay, France) and H.Toubon (AREVAICOGEMA, France)
5.27 An Algorithm of a - and y -mode Eigenvalue Calculations by Monte Carlo Method .................... 590T. Yamamoto and Y. Miyoshi (JAERI, Japan)
6. Topic 6 Evaluation of Nuclear Data
Oral Session T6 Wednesday, October 22
6.1 New Evaluation of 238U Neutron Resonance Parameters ..................................................................... 597H. Derrien, L. C Leal and N. M Larson (ORNL, USA)
6.2 Unified Description of Neutron-, Proton- and Photon-induced Fission Cross Sections in
Interm ediate E nergy R egion ................................................................................................................... 603T Fukahori, 0. Iwamoto and S. Chiba (JAER1, Japan)
6.3 Analysis of Evaluations of Neutron Cross-sections for Structural and Technological MaterialsN u clei ........................................................................................................................................................ 6 0 9
V. P. Gorelov, A. N. Grebennikov, V. I. l�in, N. A. Krut'ko and G. G. Farafontov (RussianFederal Nuclear Center - All-Russian Scientific Research Institute of Experimental Physics,Russia)
6.4 A New Set of Parameters for Gaussian Fission Yields Systematics .................................................. 613J Katakura (JAERI, Japan)
Poster Session
WI

JAERI-Conf 2003-019
6.5 Critical Mass Calculations for Am-241, Am-242m and Am-243 ......................................................... 618H. Dias, N. Tancock and A. Clayton (Atomic Weapons Establishment p1c, UK)
7. Topic 7 Burnup Credit
Oral Session T7-1 Wednesday, October
7.1 Current Studies Related to the Use of Burnup Credit in France ........................................................ 627J. Raby, C. Lavarenne (IRSN, France), A. Barreau (CEA Cadarache, France), P. Biour(Electricitg De France, France), M. Doucet (FRAAMTOME ANP, France), E. Guillou(COGEAM, France), G. Leka (SGN, France), C. Riffard, B. Roque (CEA Cadarache, France)and H. Toubon (COGEAL4, France)
7.2 UK Regulatory Perspective on the Application of Burn-up Credit to the BNFL Thorp HeadE n d P la n t .................................................................................................................................................. 6 3 3
D. N. Simister (Health and Safety Executive, UK) and P. D. Clemson (Risk ManagementConsultants Ltd, UK)
7.3 Specific Application of Burnup Credit for MOX PWR Fuels in the Rotary Dissolver ..................... 639G. Caplin, A. Coulaud, P. Klenov (SGN, France) and H. Toubon (COGEM4, France)
7.4 The REBUS Experimental Programme for Burn-up Credit ............................................................... 645P. Baeten, P. Dhondt, L. Sannen (SCK- CEN, Belgium), D. Marloye, B. Lance, A. Renard and JBasselier (Belgonuclgaire, Belgium)
Oral Session T2 Thursday, October 23
7.5 Sensitivity Study Applied to the CB4 VVER-440 Benchmark on Burnup Credit ............................. 650L. Markova (Nuclear Research Institute at Rez, ple., Czech Re,public)
7.6 Source Convergence Problems in the Application of Burnup Credit for WWER-440 Fuel ............. 656G. Hord6sy (KFK! Atomic Energy Research Institute, Hungary)
7.7 Comparative Analysis of Isotope Composition of VVER-1000 Spent Fuel Depending on TheirM anufactory and O peration Conditions ............................................................................................... 661
Y. Kovbasenko Y Bilodid and M. Yeremenko State Scientific and Technical Centre on Nuclearand Radiation Safety (SSTC NRS), Ukraine)
7.8 French Fission Products Experiments Performed in Cadarache and Valduc. Results
C o m p a riso n .............................................................................................................................................. . 6 6 6J. Anno (IRSN, France), A. Barreau, J. P. Hudelot (CEA, France), E. Girault, P. Fouillaud(Direction des Applications Militaire, France) and H. Toubon (ARE VAICogema, France)
Oral Session T3 Thursday, October 23
7.9 Generation of Bounding Axial Burnup Profiles as a Continuous Function of Average Burnup ...... 672J C. Neuber (ramatome-ANP GmbH, Germany)
7.10 Conceptual Cask Design w ith Burnup C redit ....................................................................................... 678S. H. Lee, J G. Ahn and H. R. Hwang (Korea Power Engineering Company, Inc., Republic ofKorea)
7.11 Evaluation of Burnup Credit for Accommodating PWR Spent Nuclear Fuel in High-capacity
C ask D esigns ............................................................................................................................................ 6 8 4J. C. Wagner (ORNL, USA)
7.12 Investigation of Several Methods to Set Burnup for Criticality Safety Assessment of Spent
F uel T ransport C asks .............................................................................................................................. 6 90Y Nomura (JAERI, Japan)
Poster Session
7.13 Parametric Studies of the Effect of MOx Environment and Control Rods for PWR-UOx
B urnup C redit Im plem entation .............................................................................................................. 694
N

JAERI-Conf 2003-019
A. Barreau, B. Roque, P. Marimbeau, C. Venard (CEA Cadarache, France), P. Bioux(Electricitj De France, France) and H. Toubon (AREVAICOGEM4, France)
7.14 Testing the SAS2H SCALE Control Module on VVER Type Fuel ..................................................... 700Y. Bilodid M Yeremenko and Y Kovbasenko (State Scientific and Technical Centre on Nuclear
and Radiation Safety (SSTC NRS), Ukraine)
7.15 The Implementation of a Burnup Credit Based Criticality Safety Assessment in the THORP
H ead E nd P lant ........................................................................................................................................ 70 6J. Gulliford J. A. Edge, J. Gracey and N Harris (BNFL, UK)
7.16 Application of Gadolinia Credit to Cask Transportation of BWR-STEP3 SFAs .............................. 711T Kikuchi (Nuclear Power Engineering Corporation, Japan), I. Mitsuhashi (ToshibaCorporation, Japan), D. Ito (Mitsui Engineering Shipbuilding Co., Lid, Japan) and Nakamura (Nuclear Fuel Transport Co., Ltd, Japan)
7.17 Burn-upCreditApplicationsforUO2andMOXFuelAssembliesinAREVA/COGEMA ............... 717H. Toubon (COGEAM Velizy, France), C. Riffard(CEA Cadarache, France), M. Batifol(COGEM4 La Hague, France) and S. Pelletier (Canberra-Eurisys, France)
7.18 Preparation and Testing ORIGEN-ARP Library for WER Fuel Design ......................................... 721M, Yeremenko, Y. Kovbasenko and Y. Bilodid (State Scientific and Technical Centre on Nuclearand Radiation Safety (SSTC NRS), Ukraine)
8. Topic Assessment of Criticality Accident
Oral Session S-1 Tuesday, October 218.1 Development of INCTAC Code for Analyzing Criticality Accident Phenomena ............................... 729
S. Mitake, Y Hayashi and S. Sakurai (Institute ofNuclear Safety, NUPEC, Japan)
8.2 Modelling Transient 3D Multi-phase Criticality in Fluidised Granular Materials -
T he F E T C H C ode .................................................................................................................................... 734CC Pain, J. L. M. A. Gomes, M. D. Eaton, A. K Ziver, A. P. Umpleby, C. R E. de Oliveira andA. J H. Goddard (Imperial College ofScience, UK)
8.3 Development of Criticality Accident Analysis Code AGNES .............................................................. 740Y Yamane (JAERI, Japan), K. Nakajima (Research Reactor Institute, Kyoto University, Japan),T Yamamoto and Y Miyoshi (JAERI, Japan)
8.4 Applicability of Simplified Methods to Evaluate Consequences of Criticality Accident UsingP ast A ccident D ata ................................................................................................................................... 746
K Nakajima (Research Reactor Institute, Kyoto University, Japan)
Oral Session S-2 Tuesday, October 21
8.5 Criticality Accident Studies and Methodology Implemented at the CEA .......................................... 752F Barbry, P. Fouillaud (CEA Valduc, France), L. Reverdy and D. Myuin (CEA Saclay, France)
8.6 FRAMATOME-ANP France U02 Fuel Fabrication - Criticality Safety Analysis in the Light
of the JC O A ccident ................................................................................................................................ 75 5M Doucet, S. Zheng (ramatome-ANP Fuel Technology Service, France), J Mouton and KPorte ramatome-ANP Fuel Fabrication Plant, France)
8.7 "Oh, No it isn't!" "Oh, Yes it is!" The Omission of Criticality Incident Detection Systemsin th e U K .................................................................................................................................................. 7 5 8
P. R. Thorne, R. L. Bowden and J Venner Aluclear Technologies p1c., UK)
8.8 Updated Rules for M ass Limitation in Nuclear Plants ......................................................................... 764V. Rouyer, X. Knemp I L. Bars, J Rannou (IRSN, France) and C. Weber (Nuclear EngineerStudent at ENSPG, France)
Poster Session
8.9 Irradiating Complex on BIGR Reactor for Simulation Accidents of RIA Type ................................ 770V. N. Bogdanov, V. L Iin, V. Kolesov M L Kuvshinov, V. T. Punin, V. V. Sazhnov L G.
X

JAERI-Conf 2003-019
Smirnov, Y. A. Trulnev and V. A. Ustinenko (Russian Federal Nuclear Center - All-RussianScientific Research Institute ofExperimental Physics, Russia)
8.10 Analysis of Reactivity Effects in Reactors with Cavities ...................................................................... 773V. F.Kolesov and VK.Khoruzhi (Federal Nuclear Center of Russia - All-Russia Research
Institute of Erperimental Physics, Russia)
8.11 O n the Fictitious Aspect of the Critical State ........................................................................................ 779B. Mjchitoua (CEA, France)
8.12 Measurement and Evaluation of Leakage Neutron Spectrum at TRACY ......................................... 784T Nakamura, K. Sakurai and Y Miyoshi (JAER1, Japan)
8.13 Transient Characteristics Observed in TRACY Supercritical Experiments ..................................... 791Y. Yamane (JAER1, Japan), K Nakajima (Research Reactor Institute, Kyoto University, Japan),K 0gawa (Secretariat of Nuclear Safety Commission of Japan, Japan), E. Aizawa (JAERI,Japan), H. Yanagisawa (Secretariat of Nuclear Safety Commission of Japan, Japan) and Y.Miyoshi (JAER1, Japan)
8.14 Re-evaluation of Gamma-ray Exposure Rates During TRACY Power Burst Experiments
B ased on the Latest JE N D L Files ........................................................................................................... 797H. Yanagisawa, H. Sono and J. Katakura (JAERI, Japan)
8.15 Thermal-hydraulics Analysis of Thermal Mock-up Test for JCO Precipitation VesselU sing a-FLO W C ode System .................................................................................................................. 803
S. Watanabe, K. Okubo, and Y Miyoshi JAER1, Japan)
8.16 Comparative Neutron and Gamma-ray Dosimetry of JCO and SAROV Accidents Using
F E T C H ..................................................................................................................................................... 8 0 8A.K. Ziver, C. C. Pain, M D. Eaton, A. P. Umpleby, C. R- E. de Oliveira, A. J H. Goddard(Imperial College of Science, UK) and D. N. Simister (Health and Safety Executive, UK)
9. Topic 9 Emergency Response and Training
Orai Session T9 Monday, October 2
9.1 Remote Disassembly of an Abnormal Multiplication System .............................................................. 817V. E Basmanov, S. V. Vorontsov L V. Zhukov, V. I fl�h M . Kuvshinov, V. Punin G.Sinirnov, E. Y. Tarasova, V. Yuferev and V. N. Yanovsky (Russian Federal Nuclear Center -All-Russian Scientific Research Institute ofExperimental Physics, Russia)
9.2 The Organisation of Criticality Hazard Prevention at the CEA ......................................................... 823D. Myuin, H. Carros and B. Sevestre (CEA Saclay, France)
9.3 The Protection of On-site Personnel in the Event of a Radiological Accident .................................... 826M, Morrey (National Radiological Protection Board, UK) and D. N. Simister (Health and
Safety Executive, UK)
9.4 Process Criticality Accident Likelihoods, Magnitudes and Emergency Planning - A Focus on
Solution A ccidents ................................................................................................................................... 8 3 1T P. McLaughlin (LANL, USA)
Poster Session
9.5 Development of a Multimedia Training Platform for Nuclear Criticality Safety .............................. 837E. Guillou J Demeestere, C. Loy (COGEAM LA HAGUE, France), L. Clouet and EChtourbine (MILLENNIUM, France)
9.6 Criticality Incident Detection Assessment M ethodology ...................................................................... 841R. M. Haley, S. J Warburton and R. L. Bowden (Nuclear Technologies p1c, UK)
9.7 Use of a W eb Site to Enhance Criticality Safety Training ................................................................... 846S. T Huang LNL, USA) andJ. A. Morman (ANL, USA)
9.8 To Stay or to Go? Balancing the Risk of Reprocessing Plant Control Room Evacuation
Follow ing a C riticality A larm ................................................................................................................. 850
xi

JAERI-Conf 2003-019
S. Love, D. Mccrindle, N. Harris and J. Haworth (British Nuclear Fuels p1c, UK)
9.9 Present Status of Monte Carlo Seminar for Sub-criticality Safety Analysis in Japan ....................... 855K Sakurai (JA ERI, Japan) and I. Nojiri (JNC, Japan)
9.10 Study on the Detection of the Criticality Accident Alarm Systems and Area Monitors .................... 858Y. Shimizu and T Oka (JNC, Japan)
10. Special Session: Post Irradiation Examination Wednesday, October 22
10.1 The French Post Irradiation Examination Database for the Validation of Depletion
C alculation T ools ..................................................................................................................................... 8 65B. Rouque, P. Marimbeau (CEA, France), P. Bioux (EDF, France) H. Toubon(ARE VAICOGEAL4, France) and L. Daudin (ramatome-ANP, France)
10.2 Recent Activities on the Post-irradiation Analyses of Nuclear Fuels and Actinide Samples
at J A E R I ................................................................................................................................................... 8 7 1N. Shinohara, Y. Nakahara, N. Kohno and K. Tsujimoto (JAERI, Japan)
10.3 Current Status of PIE Activities in O-arai Engineering Center of JNC on FBR MOX Fuel ............ 877S. Ko ama, M Osaka, T. Namekawa and M. Itoh (JNC, Japan)
10.4 Characterization of Spent Nuclear Fuels by an Online Combination of Chromatographic and
M ass Spectrom etric T echniques ............................................................................................................. 884I. Giinther-Leopold, B. Wernli and Z Kopajtic (Paul Scherrer Institute, Switzerland)
10.5 Improvements to SFCOMPO - A Database on Isotopic Composition of Spent Nuclear Fuel ........ 890K. Suyama, A. Nouri (OWDINEA), H. Mochizuki (JR1, Japan) and Y. Nomura (JAERI, Japan)
A U T H O R IN D E X ............................................................................................................................................... 893
A

JAERI-Conf 2003-019
R &
PART I II
PART I
-t Y I A 20 (A
............................................................................................................................................... 3
JC O M -A * a 7316 4 * .......................................................................................................................... 5A��Y tv_�: 6txlty�&Y#&
OECD/NEA/NSC .................................. 11A. Nouri (OECD Nuclear Eneqy Agency), R. Blomquist (ANL, USA), M B. Raap (PNNL, USA),B. Briggs (INEEL, USA), P. Cousinou (IRSN. France), ff,&jW (N 9), C. de Oliveira(Imperial College of Science, UK) and W. Weber (GRS, Germany)
1A EA 0 M M OD.N .................................................................................. 17W. J Danker (1AEA)
-7!7&r D' IT
T1-1 10 �q 21 (A)
............ 25C. Lavarenne (IRSN, France), D. Mennerdahl (EMS, Sweden), C. Dean (SERCO, UK), N.Barton (Departmentfor Transport, UK), V. Rouyer, G.Sert (IRSN France), F. Jean (APTUS,France)
1.2 * ,J,,% A * O OECD/NEA 0DIM M . ................................................................................................ 31W. Weber (Geselischaft fir Anlagen- und Reaktorsicherheit (GRS) mbH, Germany) and D.Mennerdahl E Mennerdahl Systems, Sweden)
1.3 F 0 4 FI AM I ........................................................................... 37N. Leclaire, J Anno, G. Courtois, G. Pouliot and V Rouyer (IRSM, France)
1.4 ................................................................................... 4 4E. Grolleau, M. Lein, G. Leka, B. MaNou and P. Klenov (SGN, France)
10,,q22H
1.5
.............................................. .............. 49C. Lavarenne (IRSN, France), A. Cossenet (Consort Technologies, France) and N. Leclaire(IRSN, France)
1.6 ............................................................. 5 5V. . Bulanenko, V. Sviridov, V. V. Frolov, B. G. Ryazanov and V. V. Talanov (IPPE, Russia)
1.7 .................................................................... 6 1B. T Rearden, C. M. Hopper, K R. Elam, S. Goluoglu and C V. Parks (ORAIL, USA)
1.8 ............................................................................................ 6 7J-C. Neuber (ramatome-ANP GmbH, Germany)
10,q2217 *)
1.9 F4 VIM M IL1 . ................................................ 73L Reiche (Bundesamiftir Strahlenschutz, Germany)
Afi

JAERI-Conf 2003-019
Y ........................................1.10 MAP-itIM LMI-6 75
1.1 1 ........................................................................................... 7 9S. Zmin (Australian Radiation Protection and Nuclear Safety Agency, Australia)
1.12 A L A R P CD 9 11 ................................................................................................ 83R. L. Bowden, A. Barnes, P. R. Thorne and J Venner (Nuclear Technologies p1c, UK)
1.13
....................................................... 89J Anno, V. Rouyer and N. Leclaire (IRSN, France)
1.14 7-31 1-:= M AWR Paxton Woodcock WRU ................................................................................... 94J. Anno L Duhamel, C Lavarenne (IRSN, France) and M. Duluc Nuclear Engineer Student atINSTN, France)
1.15 18kg oDAAM t> 5� �/19* L 4.5kg 1�1 ,('39Pu)4ZPKODQ& ............ 99D. Bower, L. Sutton (AWE, UK) and S. Plummer (Nuclear Technologies, UK)
1.16 U 0 2 N D A LM -T ............................................................................................ 105V. L Bulanenko and V. V. Frolov IPPE, Russia)
1.17 ......................................... 110
V. L Bulanenko and V B. Polevoy (IPPE, Russia)
1. 1 8 A P . - � V !�, -� /7- -3f V 0) M 2 AK 0) t b5 OD & Ir 7-- - 31 ....................................................... 116
9 At 4��AITI EW #A(X69
1.19 ................................ 122Y Y Vasilev, B. G. Ryazanov, V. 1. Sviridov and L. L Mozhaye-va (IPPE, Russia)
1.20 L U -C OD K -E ffective ................................................................................................... 128J Venner, R. M. Haley and R. L. Bowden (Nuclear Technologies p1c, UK)
2. 2 JKMMI�*
10,q20f (,q)
2.1 ............................................ 135V Rouyer L Duhamel (IRSN, France), G. Poullot (Refiredfrom IRSN, France), P. Cousinou(IRSN, France), F. Barbry, P. Fouillaud and E. Girault (CEA Valduc, France)
2.2 T9 ��i Z131t� MOX MM ............................ 140V. S. Vnukov, B. G. Ryazanov, V. .Sviridov, V. F.Shapsha, Y D. Makarenkov and 0 V.Sichkaruk (IPPE, Russia)
2.3 T*JrM 6DM* Y 43it-TIKIR .................................................................... 144V. N. Gurin, B. G. Ryazanov, V. . Sviridov and V. V. Volnislov (IPPE, Russia)
2.4 AM)Q*MA* ft f*OD;f 9 IL �5i
� 1v 'b DOM ................................................................................................... 149J:W* 01W. -�M -0 " 7�A /,# 4p-P. A P 9�M ft-i� A"
JW- )
10�R2 a (W)
2 .5 .................................................... 15 4&�Z� At 11/0 00 J17- qp�gq
2.6 5i � L A-163" Z� ftft 2x2 SiO2, Al 131 U Fe ...................... 160D. Loaiza and R. Sanchez (LANL, USA)
2.7 ........................................ 16 6
x1v

JAERI-Conf 2003-019
V N. Gurin, B. G. Ryazanov and V L Sviridov (IPPE, Russia)
2.8 ..................... 171qlAt NYX )�& X4�' #M &-A MA9
aff#R* -L-,�Y :�� H ��' 2-3 10 �q 20 )
2 .9 ........................................................................... 1 7 8Em 'R. J�-&A-f 0/9 r5va"t4 'WI T�ffxpp'�)
2.10 ............................ 183T E. Valentine and J. K. Mattingly (ORNL, USA)
2.11 P W R ..................................................................................................... 18 7H. Shin, S. -G. Ro, G. -S. Kim, Y. -H. Hwang and H. -D. Kim (KAER1, Korea)
2.12 PW R W 439 0 * e ��, �1?OD* W A A N ......................................................................................... 192
xm NNMWS'7�)� -ax -0 OWAW2j')� AM#
10,#21 �7 (A)
2.13 ........................................ 19 7P. F. A. de Leege (Deo University of Technology, The Netherlands), J. Valko (IkesolConsulting, The Netherlands) and F Reitsma (NECSA, South Africa)
2.14 237 N p J* I* D W ..................................................................................................................................... 20 1R. G. Sanchez, D. J Loaiza, R. H. Kimpland, D. K Hayes, C. C. Cappiello, W L. Myers, P. JJaegers, S. D. Clement and K B. Butterfield (LANL, USA)
2.15 -t;f �Y:-- r �- -� I 204.� JA-237 CALIBAN NZAYW56001(9-�' a . .......
P. Humbert and B. Michitoua (CEA, France)
2.16 .............................................................. . ... 2 10M L Kuvshinov V N. Bogdanov S V Vorontsov V N. Vyachin, V. P. Gorelov, V. P. Egorov,A. E. Zapol'ski, V. I. Iin, A. V. Koroichenkov, A. V. Livke, G. N. Maslov, A. V. Panin, D. P.Peshekhonov and E. F Fomushkin (Russian Federal Nuclear Center - All-Russian ScientificResearch Institute ofExperimental Physics, Russia)
2.17 ............................ 2154
2.18 ..................................................... 2 2 1V. Kachanov E Burlakov, A. Kuzmin and V. Jilarev (Russian Research Center ((KurchatovInstituleo, Russia)
2.19 ON MA VENUS ) WI-f-3 I tM AEOD M F;Ip 12 ................................................................. 225B. Lance, D. Marloye J Moerenhout, P. V. D. Hende, J. Basselier (Belgonucleaire, Belgium),P. Baelen K V der Meer and P. Dhondt (SCK- CEN, Belgium)
2.20 ............................. 23 1ZAf &A, /Z/* &5z' 00 fp-, rph, (F69
2.21 ................................ 236AW W jW # ZA1 AYA (Wk9
2.22 ..... 241L. V Tocheny (ISTC, Russia)
2.23 WRWY 4�i 6 Feynman-a&-CO 9 74'3r4 AOD7111- 7 7 f10 1 It ....................................................................................................................................... 246
14A W* &Y'/� &,] -EAF &A Offa9
2.24 2 XOD*&31 A ........................ 251
xv

JAERI-Conf 2003-019
,4A VtRIT, AN AM -)§�', INf + 1#-Z� -EW &A (XM
2.25 .................................................... 2 5 7T E. Valentine (ORNL, USA)
2.263�W 4 * 1* 0 5E ................................................................................................................................... 263
t&PY A, &# 09Y� 14fV -779 .9,�W -7-,�6XNPK)
3. �e�'3
10,q21H (A)
3.1 �(ICSBEP)0)-% ....................................................... 271J B. Briggs (INEEL, USA), A. Nouri (OECD Nuclear Energy Agency) and L. Scott (UnderSubcontract to the INEEL, USA)
3.2 . .......................................... 278R. Blomquist (ANL, USA), A. Nouri (OECD Nuclear Energy Agency), M Armishaw (Serco,Assurance, UK), 0. Jacquet (IRSN, France), AW 04�- ZA1 &A,Y/ M W 9
3.3 ICSBEP /N�/ ly �i .... 283T Ivanova, G. Manturov, M Nikolaev K Raskach, E. Rozhikhin and A. Tsiboulia (IPPE,
Russia)
3.4 TRIPOLI-4.3 ) ---I- &j7u*-T-Jff1V:13X t� JEFF3.0 �5i - --/ � 9 - �-Yfl v t
LEU-COMP-THERM-049 MARACAS A**0DX* .................................................................... 289Y-K. Lee (CEA Saclay, France)
/7.jv -�-T3-2 10A'21 B (A)13-IU ftpZ 37 M 296
3.5 _ N p 3* 0)- jk0)X .............................................................................................D. Loaiza and R. Sanchez (LANL, USA)
3.6 HERBE -VAA ---Z:�/-5F-r- -�'L ............................................................. 299M P. Pegi6 (The VINOA Institute offuclear Sciences, Serbia and Montenegro)
3.7 ENDF/B-V1.8,JENDL-3.3,JEFF-3.0 L ...................... 304D. H. Kim, C.-S. Gil, J-D. Kim andJ Chang (Y-4ERI, Republic ofKoreq)
3.8 JENDt,3.3 �5i - 9 - IZA- < TRACY AIRODW-Aft L a;tL,9tv)X* ................................... 308
Wfflf AZN (RIA9 AM 11-4�-- 47 tpo I* Aret1w 7ffix9),) � Z0 &A OW
3.9 MCNP MONK WA --3- MOD................................................................................................................................... 314
L. C-A Bourva (Canberra Industries, USA), P. Cowan (Serco Assurance, UK), S. Croft(Canberra Industries, USA) and M Ferris (UK Atomic Energy A uthority, UK)
3.10
W E ........................................................................... 320E. Gagnier, Y. K Lee, L. Aguiar (CEA Saclay, France) and N. Vedrenne (CEA Valduc, France)
3.11 *VAA1111 Z0 -� Z x V-'�l � : MCNP-DSP L PANDA KODAip ...................................... 326P. Humbert and B. Michitoua (CEA, France)
3.12 -31 Alk[g P,- �/ -� "0) AlkO)� 9 3 0# MP fw * 0 9 1L ................................................................................................................... 327
T Ivanova, M Nikolaev, K. Raskach Y Rozhikhin andA. Tsiboulia (IPPE, Russia)
3 .13 -- C ............................................................................................................... 3 3 4J Kyncl (Nuclear Research Institute Ad, p1c, Czech Republic)
xv!

JAERI-Conf 2003-019
3.14 U+Pu -JACS
. ..................................................................................................................... ..... 341OR '?�Ap. S� �'/� ZAF VA 9- OPA9
3.15 ICSBEP/-,�- V.9'!y - �=. ................................................................................................................................................... 346
/Z/* EAF IWA 'ItAfW AILL!,-
3.16 .................................... 352J Yang, W
4. If �Y � 4
�7-07RO T4-1 10 q 20 7 (,q)
4.1 6 JAV4W -A 6D14X .................................................... 361P. Grimm, J -M Parafte and J -M Hollard (Paul Scherrer nstitute, Switzerland)
4.2 ............................................................ 3 6 6J V. Zhukov, V. T. Punin, G. M Skripka, M. I. Kuvshinov, A. Nikitin, S. V. Sorokin, V. N.Murin M R. Mochalov (Russian Federal Nuclear Center All-Russia Scientific-ResearchInstitute of Experimental Physics, Russia)
4.3 Sellarield M O X :f 5� �/ � . ........................................................................................ 372J Edge and J Gulliford (British Nuclear Fuels p1c, UK)
4.4 CAAS ....... 375L. Reverdy (CEA Saclay, France), F. Barbry (CEA VaIduc, France), J T Battiston, J M Bordy(IRSN, France), A. Devita (MELOX, France), M Doucet (FRAMATOME ANP, France), C.Ginisty (IRSN, France), A. Marc (SGN, France), V. Masse (CEA Saclay, France), R. Medioni(IRSN, France), D. Mijuin (CEA Saclay, France) and V. Rouyer (IRSN, France)
10,,q2 ()
4.5 R 5�0�jt� PCM i�* AAM XII ............................................................. 379D. Kirkwood (British Nuclear Fuels p1c, UK)
4.6 BNFL Sellafield -e OD PCM 0) VAA%��!f * OW L, V %7 rl -z5 .................................................... 384S. Darby and D. Kirkwood (BNFL, UK)
4.7 1:4 V - 0)*ffl 9jAV+.f3 I
M I 6 3x a o ffi ................................................................................................................................... 389B. Gmal, K. Hummelsheim, R. Kilger, E. F. Moser (Geselischaft ftr Anlagen undReaktorsicherheit (GRS), Germany), and J Thiel (Bundesamtfiir Strahlenschutz, Germany)
4.8 M 0 X A VV] 0 T S B 05�' 1 :-' !�, -:/ 5 := �/ Y M A P 1t 0) I R A )" 6 ................................................. 395G. Kindleben and R. Baumann (Siemens AG, Germany)
vl,',�K -4- -L-;v
4.9 - Z-f 4 - < �Y ........................................................................................... 40 1M. Armishaw, N. Smith and E. Shuttleworth (Serco Assurance, UK)
4.10 FRAMATOME-ANP-i:?OD7��i�/AO)MYW,4f*G)��)R ................ 406M Doucet, N. Comte, M Landrieu and S. Zheng (ramatome-ANP Fuel Technology Service,France)
4.11 MANW) ft & CD
* t � ........................................................................................................... 4 0 8C. Mattera (Cogema Logistics, France)
4.12 NMC&AM 44 i� 6 t ..................................... I ................................................................................................. 4 12
B. G. Ryazanov V Sviridov V V Frolov (IPPE, Russia), M 0. Shvedov (Ministry of theRussian Federationfor Atomic Energy), T P. McLaughlin and N. L. Pruvost (LANL, USA)
Xvii

JAERI-Conf 2003-019
4.13 .................................... 4 16T M. Sembiring (BATAN, Indonesia), P. H. Liem (NAIS Co., Inc., Japan), L Kuntoro andZuhair (BA TAN, Indonesia)
4 .14 ................................................................................. 4 2 2B. Thievenaz (ramatome-ANP Novatome Division, France), M. Doucet (ramatome-ANP FuelTechnology Service, France) and A. Joudon (CEA Cadarache, France)
4.15 ........................ 427V. S. Vnukov and B. G. Ryazanov (Federal State Unitary Enterprise, Russia)
Wil

JAERI-Conf 2003-019
PARTII
5. �e!Y-�'5 4,FFX=-FOAMM
10,q22 R W
5.1 ........................................... 4 3 9M. E. Dunn, N. M Greene and L. M Petrie (ORNL, USA)
5.2 SC A L E 5: . .................................................................................... 447S. M Bowman, D. F. Hollenbach M D. Dehart, B. T Rearden L C. Gauld and S. Goluoglu(ORNL, USA)
5.3 M ONK Y 7 F rY L-4 3M 601 ...................................................................... 454N Smith M Armishaw (Serco Assurance, UK) and A. Cooper (British Nuclear Fuels pc, UK)
5.4 Oft W * &0) M OX .................................................................... 460,W,# 9-k-, t&* &A� ft* , EAf -4 Pfi�q
T5-2 10,,q 23 Ot)
5.5 M ORET: /�- -:, a :/ 4.B A�# -& .............................................................. 4660. Jacquet, J. Miss and G. Courtois (IRSN, France)
5.6 MORET40D*M#kMO)YE3�g,-t-**%�kO)"physical"-3f-f--/i,:,tt�-50!E ............................... 472J A no, 0. Jacquet and J. Miss (IRSN, France)
5.7 CRISTAL VI: A*Pt �' I., �� �v � H 1 OD IL 05 OD -�r - :� ..................................................... 477J-M. Gomit, P. Cousinou (IRSN. France), C Diop, G. F de Grado (CEA, France), F.Gantenbein (IRSN, France), J -P. Grouiller (CEA, France), A. Marc (SGN, France), D. M�uin(CEA, France) and H. Toubon (COGEAM, France)
5.8 ........................................................................................... 4 8 21. Duhamel, J-M. Gomit (IRSN France), Y.-K. Lee and C Venard (CEA, France)
10,,q23 H
5.9 SWAT2:= ....................................................................................................................................... 4 8 8
_Vq !90 H*k09, N[& OLIJ (OECD Nuclear Energy Agency), Offlf 0 RW9
5.10 .................................................................................... 4 9 4TR 9-� _EUX *R� IM t-, ff,# (,C�
5.11 ................................................... .... 500R. N. Blomquist and E. M Gelbard (ANL, USA)
5.12 OECD/NEA--�',�/l�-----�IP.901-1�6DgR3�,rvjzm6Du ...................................................................... 508ji� O "ON-TA (1949
5.13 LadyGodivaO)9M R�/-��'_ L- �I-OX%**Y4 I- --- -�'A ON**$- TY
. ............................................................................................................... 513Laurent Bindel, Andrg Gamess, Fridiric Jasserand and Sgbastien Laporte (GALINEO(MILLENNIUM Group), France)
5.14 0 AP-it ) ft Y) ) SCALE ) * L, 7 _f 7 �-C'f �A ............................................ 516S. Al. Bowman andJ E. Horwedel (ORN1, USA)
5 .15 .............................................................................. 5 2 3S. Connolly (British Nuclear Fuels p1c, UK) and M Grimstone (Serco Assurance, UK)
5.16 7�i:/7O)CRISTALV1,"�,:�,,�'--,;G)APOLL02-MORET40)-w,*'Y-,,IO)Alklyj*u ....... 529I. Duhamel, E. Letang, A. Cossenet (IRSN, France) and G. Pouliot (retiredftom IRSN, France)
5.17 ........................................................... 5 3 5F. Fernex, Y. Richet and E. Letang (IRSN, France)
AX

JAERI-Conf 2003-019
5.18 CALICE VA AVE*-W 0) ft bb OD 7 � 1� -- 7Y -A . ........................................................................ 541E. Guillou (COGEAM LA HAGUE, France), H. Toubon (COGEM4 VELIZY, France), L.Aguiar, D. Muin (CEA SACLAY, France), G. Chazelle, E. Chtourbine, L. Couet and E.Lejeune (MILLENNIUM, France)
5.19 CRISTAL VIOD;Y �5i7 -f ........................................................... 545L. Heulers, G. Courtois, F. Ferrier J M. Gomit and E. Letang (IRSN, France)
5.20 SM O R ES M O N ............................................................................................. 551Y Karni, D. Regev, E. Greenspan (University of California, Berkeley, USA), S. Goluoglu, L. MPetrie and C. M Hopper (ORNL, USA)
5.2 1 .................................................. 5 5 7J Kophazi M Szieberth, S. Feher, S. Czifrus (Institute offuclear Techniques, Hungary) and P.F. A. de Legge (De�ft University of Technology, The Netherlands)
5 .2 2 .................................................................................... 5 6 3
5.23 ........................................................ 5 6 8-Billy
5.24 ............................................ 574jw) Af
5.25 BrownianBridge]93koD)t'90811C)&-'3< ..... 578Y Richet, 0. Jacquet IRSN, France) and X Bay (Ecole Nationale Supgrieure des Minesde Saint Etienne, France)
5.26 ..... 584C. Venard, B. Camous (CEA Cadarache, France), S. Mengelle (CEA Saclay, France) and H.Toubon (AREVAICOGEAM, France)
5.27 A/ X ................................................ 590
/&* &Y/1 EW 0-4 Mk9
6. �Y � 6 A 7' - -3r 6D if*
r-7 T6 1 0 q 22 H138 OD6.1 , �k ', Z;5� 2t _ 3 0,* .................................................................................................... 597
H. Derrien, L. C. Leal and N. M Larson (ORNL, USA)
6.2 A T , ............................ 603
6.3 O il , .................................................................... 609V. P. Gorelov, A. N. Grebennikov, V. L Il�in, N. A. Krutko and G. G. Farafontov (RussianFederal Nuclear Center - All-Russian Scientific Research Institute of Experimental Physics,Russia)
6.4 ................................................................ 6 13
6.5 Am-241, Am-242m 43 �t U Am-243 OD WAKAO)ff N ....................................................................... 618H. Dias, N. Tancock and A. Clayton (Atomic Weapons Establishment p1c, UK)
7. e!�? -� 7 IS, *1 -�' L- �
17iffRO -q ; T7-1 10 q 22 H
7.1 7 �i :;7, IL �6 It 6 Mftg[ �y OD*,ffl IL Nil L, t 9;1�- 04 � ................................................ 627J Raby, C. Lavarenne (IRSN, France), A. Barreau (CEA Cadarache, France), P. Bioux(Electricit6 De France, France), M Doucet (FRAMATOME ANP, France), E. Guillou
XX
JAERI-Conf 2003-019
(COGEM4, France), G. Leka (SGN, France), C. Riffard, B. Roque (CEA Cadarache, France)and H. Toubon (COGEM4, France)
7.2 �A)fl1LNJ_6*1M0D*VJ0DVcV S ............ 633D. N. Simister (Health and Safety Executive, UK) and P. D. Clemson (Risk ManagementConsultants Ltd, UK)
7.3 PWR 6D MOX AW)ONA-7 OD AM ................................................. 639G. Caplin, A. Coulaud, P. Klenov (SGN, France) and H. Toubon (COGEIVM, France)
7.4 JM * 1 �' I- � CD k bb OD RE BUS !XV �f N .................................................................................... 645P. Baeten, P. Dhondt, L. Sannen (SCK- CEN, Belgium), D. Marloye, B. Lance, A. Renard and JBasselier (Belgonucliaire, Belgium)
RWR-P-& >' T7-2 10 q 23 1 (40
7.5 JAP9U, F ir Rig Uft CB4 VER-440 ................... 650L. Markova (Nuclear Research Institute at Rez, pc., Czech Republic)
7.6 WWER-440 AV4-0A1A& �� L �� �y � ODAM IL43 'J-'B PitTXVA1h1Jffl .................................. 656G. Hord6sy (KFKI Atomic Energy Research Institute, Hungary)
7.7 V A , ................................. 661Y Kovbasenko, Y Bilodid and M. Yeremenko (State Scientific and Technical Centre on Nuclearand Radiation Safety (SSTC NRS), Ukraine)
7.8 Cadaracbe L VaIdue IM *D*Ift 7 �� �/ 7 .............................. 666J Anno (IRSN, France), A. Barreau J P. Hudelot (CEA, France), E. Girault, P. Fouillaud(Direction des Applications Militaire, France) and H. Toubon ARE VA/Cogema, France)
n j*R-0 -L- T7-3 1 0 # 2 3 H (W
7.9 ........................................................ 6 7 2J. C. Neuber (ramatome-ANP GmbH, Germany)
7.10 §A* g[ -�' I,- F Ir I B :k- -r A -�' O ft t & ff .................................................................................... 678S. H. Lee, J G. Ahn and H. R. Hwang (Korea Power Engineering Company, Inc., Republic ofKorea)
7.11 O)N ................................. 684J C Wagner (ORAIL, USA)
7.12 .................... 690
7.13 PWR-UOx-ODM*1�1
............................................................................................................................... 694A. Barreau, B. Roque, P. Marimbeau, C. Venard (CEA Cadarache, France), P. Bioux(Electricil� De France, France) and H. Toubon (AREVAICOGEM4, France)
7.14 SAS2H SCALE $0P-:& -:,� --x -,11,0 VVER VZVM�,f t,5 '�F' 7 ................................................... 700Y Bilodid, M. Yeremenko and Kovbasenko (State Scientific and Technical Centre on Nuclearand Radiation Safety (SSTC NRS), Ukraine)
7.15 THORP k9';f 9 �, F ......................... 706J Gulliford J A. Edge, J Gracey and N Harris (BNFL, UK)
7.16 BWR-STEP3 *M 0) IMA:k- t 7 �' - 00 1: 9 = 7-3, V -;,�!7 F 04M .................. 711,*/L# �Y �Af )VF7 );N'* -2t-41; CE'" A/9� q1Y±11� (MMS
7.17 AREVA/COGEMAi,�:t3lt.5UO,�SIUMOXlMf4*--c-3-4-ODM*Pt�'L--:'�!�'�ODJI)iJ ...... 717H. Toubon (COGEAL4 Velizy, France), C. Riffard(CEA Cadarache, France), MBatifol(COGEM4 La Hague, France) and S. Pelletier (Canberra-Eurisys, France)
7.18 WER A)P+Vff30D'rt &� OD ORIGEN-ARP �i -5 9 -D .49 �' OK .......................................... 721
XA

JAERI-Conf 2003-019
M Yeremenko, Y. Kovbasenko and Y Bilodid (State Scientific and Technical Centre on Nuclearand Radiation Safety (SSTC NRS), Ukraine)
8. �Y � 8 SAIMFM
17ff#RO f.�/ TS-1 10 q 21 7 (A)
8.1 %A4&****0Dfz6b0D INCTAC =- KDDflM .......................................................................... 729Efl- ff _t& NA &AW ff
8.2 -FETCH - - : ........................................ 734CC Pain, J L. M. A. Gomes, M D. Eaton, A. K. Ziver, A. P. Umpleby, C. R. E. de Oliveira andA. J H. Goddard (Imperial College ofScience, UK)
8.3 0iA * & * * - V AGNES OD rA -M .................... I ............................................................................... 740
/&& #_ AW9 'A I* t&* &jz� ZA( &A AyP90
8.4 WAOAP&� 3&7)jj � "k VjA*&0DWVff*0) t bb DM-A*&0Dix)1j .................................... 746q7, Ag
TS-2 1 0 21 a
8.5 CEA WC � %5 MJA*&0DVM L..ft .................................................................................. 752F. Barbry, P. Fouillaud (CEA Valduc, France), L. Reverdy and D. Myuin (CEA Saclay, France)
8.6 FRAMATOME-ANP 7 �i �/A OD UO, MV+MT_ -JCO $&ODWA 7 i�, 0)&JAV4�** ............ 755M Doucel, S. Zheng (Framatome-ANP Fuel Technology Service, France), J Mouton and -Porte ramatome-ANP Fuel Fabrication Plant, France)
8.7 ............................................... 758P. R. Thorne, R L. Bowden and J Venner (Nuclear Technologies p1c., UK)
8.8 J#-T)j-2`5i �/ � ........................................................................................... 764V Rouyer, X Knemp I L. Bars, J Rannou (IRSN, France) and C. Weber uclear EngineerStudent at ENSPG, France)
8.9 0 BIGR W -C-0) M ft bkR ............................................................... 770V. N Bogdanov, V. L llin, V. F. Kolesov, M. L Kuvshinov, V. T Punin, V. V. Sazhnov L G.Smirnov Y A. Trutnev and V. A. Ustinenko (Russian Federal Nuclear Center - All-RussianScientific Research Institute of Experimental Physics, Russia)
8 .10 ....................................................................................................... 7 7 3V. F.Kolesov and VKKhoruzhi (Federal Nuclear Center of Russia - All-Russia ResearchInstitute ofExperimental Physics, Russia)
8 .1 1 ....................................................................................................................... 7 7 9B. M6chitoua (CEA, France)
8.12 T R A C Y ................................................................................ 784
8 .13 .................................................................................... 7 9 1
&M V,V WM AM �Z- TV 0
8.14................................................................................................................................................... 797
Off .6-10 A* Ag-(X�
8.15
................................................................................................................................... 80300 Zt-, AN AZT, -EW &A(AW
xxii

JAERI-Conf 2003-019
8.16 FETCH;k)flV1k JCO L SAROV ]$*0)rPjt-T, ........................... 808AX Ziver, C. C. Pain, M D. Eaton, A. P. Umpleby, C. R. E. de Oliveira, A. J H. Goddard(Imperial College of Science, UK) and D. N. Simister (Health and Safety Executive, UK)
9.
n NRP -t- -q ;-' TS 1 0 2 H (,q)
9.1 A 19 M I Ift 1*1 D A FA X f * ........................................................................................................................... 817V. F. Basmanov, S. V. Vorontsov I V. Zhukov, V. 1. l�in M I. Kuvshinov, V. Punin, I. G.Smirnov, E. Tarasova, V. I. Yuferev and V. N. Yanovsky (Russian Federal Nuclear Center -All-Russian Scientific Research Institute ofErperimental Physics, Russia)
9.2 CEA T D OM a-M M A M .............................................................................................................. 823D. Myuin, H. Carros and B. Sevestre (CEA Saclay, France)
9.3 � ;UM M ............................................................................................... 826M. Morrey (National Radiological Protection Board, UK) and D. N. Simister (Health andSafety Executive, UK)
9.4 9 OD * & i L4 L t --f 12 -t 7 M OD -PT 19 it, 19 4 L -F N ........................................ 831T P. McLaughlin (LANL, USA)
/1'�X '-�' - -L- �y �� -3 -�-'
9.5 NjA-Vcjt0) ft �b 7-,f 7 11*7P -�i 7 A OD .................................................... 837E. Guillou, J Demeestere, C. Loy (COGEM4 LA HAGUE, France), L. Clouet and E.Chtourbine (MILLENNIUM, France)
9 .6 ........................................................................................................................... 8 4 1R M. Haley, S. J Warburton and R. L. Bowden (Nuclear Technologies p1c, UK)
9.7 � 0 *# j ............................................................................... 846S. T Huang LNL, USA) and J A. Morman (ANL, USA)
9.8 ........ 8509 Love, D. Mccrindle, N. Harris and J Haworth (British Nuclear Fuels p1c, UK)
- L I r L 9.9 El * ts lt;5 * Ni OD tn &� 0) & �1'j "I' -1 J- - 0) #Lv� ............................................ 855
&# ;f AYM, YfIN
9.10 9gJA*i*V*-�/A'5F- L 9 ........................................................ 858eft &R N
10. 1 A 22 H
10.1 ............................................ 865B. Rouque, P. Marimbeau (CEA, France), P. Bioux (EDF, France), H. Toubon(ARE VAICOGEAL4, France) and L. Daudin (ramatome-ANP, France)
10.2 ................................................ 8 7 14,W q7,W
10.3 ....... 877IJ,141 0, I�W iE, j(## T�-- OWWN-PL --( �'IPIVRIWO
10.4W t gf % ................................................................................................................................................... 8 8 4
L Gfinther-Leopold, B. Wernli and Z Kopajtic (Paul Scherrer Institute, Switzerland)
10.5 SFCOM P OD& A ......................................................... 890X14t JWLY�, A. Nouri (OECD/NEA), V �ZX (H*&&ffZP7), fflf-ft (9�99
.............................................................................................................................................................. 893
Xxiii

This is a blank page.

JAERI-Conf 2003-019
TOPIC
DEVELOPMENT OF COMPUTER CODES

This is a blank page.
JAERI-Conf 2003-019 JP0450086
Continuous-energy Version of KENO V.a forCriticality Safety Applications
Michael E. DUNN,' N. Maurice GREENE and Lester M. PETRIEOak Ridge National Laboratory� P. 0. Box 2008, Oak Ridge, Tennessee 3 7831-63 70, USA
KENO V.a is a multigroup Monte Carlo code that solves the Boltzmann transport equationand is used extensively in the criticality safety community to calculate the effectivemultiplication factor of systems with fissionable material. In this work, a continuous-energy orpointwise version of KENO V.a has been developed by first designing a new continuous-energy cross-section format and then by developing the appropriate Monte Carlo transportprocedures to sample the new cross-section format. In order to generate pointwise crosssections for a test library, a series of cross-section processing modules were developed andused to process 50 ENDF/13-6 Release 7 nuclides for the test library. Once the cross-sectionprocessing procedures were in place, a continuous-energy version of KENO V.a wasdeveloped and tested by calculating 21 critical benchmark experiments. The point KENO-calculated results for the 21 benchmarks are in agreement with calculated results obtained withthe multigroup version of KENO V.a using the 238-group ENDF/B-5 and 199-group ENDF/B-6 Release 3 libraries. Based on the calculated results with the prototypic cross-section library,a continuous-energy version of the KENO V.a code has been successfully developed anddemonstrated for modeling systems with fissionable material.
KEYWORDS. Monte Carlo, continuous energy, KENO Va
1. Introduction structure of the MCNP cross-section data inherentlydictate the transport procedures used in the random
Monte Carlo (MC) methods are used extensively walk, the previously developed continuous-energyto model complex nuclear systems because such KENO V.a is not completely independent from themethods have the capability to solve the integral form MCNP transport procedures. For criticality safetyof the Boltzmann transport equation with little or no applications that do not have applicable benchmarkapproximations. Typically, MC methods are experiments, completely independent calculationalclassified according to whether a continuous-energy or methods are essential for establishing and verifyingmultigroup representation of the cross-section data is subcritical limits. By using MCNP cross-section data,used to solve the transport equation. In general, the previously developed pointwise version ofcontinuous-energy or pointwise methods are preferred KENO V.a could not provide an independentbecause the continuous-energy treatment avoids many verification of systems having fissionable material.of the assumptions and approximations inherent in As a result, this work has focused on the developmentmultigroup methods. KENO V.a') is a multigroup MC of a production-level continuous-energy version ofcode that is used throughout the world to analyze KENO V.a that is completely independent of otherfissionable systems for criticality safety applications. pointwise MC codes (e.g., COG, MCNP, MONK,The KENO series of codes is developed and RACER, TART, VIM, etc.). The research initiallymaintained at the Oak Ridge National Laboratory focused on the design and development of a(ORNL) as part of the SCALE') (Standardized continuous-energy cross-section format for KENOComputer Analyses for Licensing Evaluation) system. that necessitated the development of new continuous-The objective of this work is to develop and test a new energy cross-section processing modules. The secondversion of KENO V.a that utilizes pointwise cross phase of the research focused on the development of asections to model the radiation transport. pointwise version of KENO V.a that uses the
Previous work') has focused on the development continuous-energy data to perform the radiationof a prototypic version of KENO V.a that performs the transport.random walk using continuous-energy MCNp3) crosssections. Although the previous work successftilly 2. Cross-Section Processing Developmentdemonstrated the use of MCNP cross sections with theKENO V.a transport package, the prototypic The nuclear data within the ENDF. system areKENO V.a is not available for widespread distribution voluminous in nature and cannot be used directly inand is limited to ENDF (Evaluated Nuclear Data File) radiation transport codes. As a result, a cross-sectiondata prior to Version 64) Because the format and processing system must be used to process the ENDF
*Corresponding author, Tel.+1-865-574-5260, Fax 1-865-574-3527, E-mail: dunnme�omi.govt Managed by UT-Battelle, LLC, for the U.S. Department of Energy under contract No. DE-AC05-00OR22725.
- 439 -

JAERI-Conf 2003-019
data and generate nuclear data libraries that can be sequence can be developed to post-process theaccessed by radiation transport codes. At ORNL, the existing data for another application. As a result, theAMPX-) code system has been used since the early ENDF/B files do not have to be accessed multiple1970s to process the full range of ENDF/B formats times to generate cross-section libraries for differentused to describe the physics associated with neutron, radiation transport codes. As an example, one of thegamma, and coupled neutron-gamma interactions up newest additions to SCALE is a continuous-energyto 20 MeV. In order to facilitate the development of I-D discrete ordinates capability (CENTRM) that isindependent transport procedures, a new continuous- used to calculate pointwise neutron spectra forenergy cross-section library structure has been generating problem-dependent resonance self-shieldeddesigned for KENO, and multiple AMPX processing multigroup cross sections.6,7) Prior to the Point KENOmodules have been developed to generate cross- development, AMPX-2000 was used to generatesection data in the new pointwise format. All of the prototypic -D temperature-dependent continuous-new AMPX modules and point KENO V.a have been energy cross-section data [i.e., YE, T)] for CENTRMwritten in accordance with the free-forin FORTRAN using ENDF/13-5 and ENDF/B-6 Release 790/95 standard. The details of the continuous-energy evaluations. After the point KENO library format waslibrary format are beyond the scope of this paper; defined, additional AMPX processing modules werehowever, the essential components of a point KENO developed and tested for post-processing the Dcross-section library include the following: temperature-dependent data that served as the(1) average number of neutrons (delayed and prompt) foundation for the prototypic CENTRM cross-sectionproduced by fission, -0 (E) 2 -dimensional (I D) libraries. Note that point KENO data are notcontinuous-energy cross sections as a function of generated directly from CENTRM data; rather, thetemperature, cr(E, T); 3 2-D pointwise joint temperature-dependent data used to generateprobability distributions that describe the energy and CENTRM cross sections can be stored in a generalangle of particles emerging from a collision, fE-+E', format and post-processed for a specific transport code.g) 4 probability tables for sampling the cross In addition to the I-D cross-section processingsections in the unresolved-resonance region. The capabilities, one of the novel and robust features of thefollowing discussion provides an overview of the latest AMPX system is the treatment of the collisioncross-section processing development effort that was kinematics that provide secondary energy and ngleperformed to support the development of a distributions for particles emerging from a reaction ofcontinuous-energy version of KENO V.a. interest. In AMPX a uniform kinematics structure
Although the current point KENO development (i.e., data have the same structure independent ofrepresents a complete redesign from the "ground up" reaction type) has been developed to describe all(i.e., redesigning the base cross-section format and possible secondary energy-angle distributionsassociated transport procedures), a significant amount including thermal scattering collisions. Because of theof cross-section processing work had already been uniformity in the collision kinematics data, pointwisecompleted prior to the development of point KENO. cross-section libraries can be produced that areBeginning in the mid 1990s, the AMPX code system independent of ENDF laws and procedures. Somewas completely redesigned to process the latest continuous-energy radiation transport codes have theENDF/B formats through Version 6 The latest ENDF laws and procedures programmed in the code.version of the cross-section processing system Unfortunately, as changes are made to the ENDF(AMPX-2000) can be used to generate a variety of formats, the radiation transport code and associatedmultigroup and/or continuous-energy cross-section cross-section processing code system must be updatedlibraries. The preceding and concurrent AMPX-2000 to process the new ENDF laws and procedures.development effort has provided the foundation for a Because of the novel AMPX processing procedures,significant portion of the continuous-energy KENO the burden of treating the ENDF formats in thedevelopment. As a result, the point KENO cross- transport code has been transferred solely to the cross-section development did not have to begin with the section generation code.base ENDF/B data formats. A majority of the cross- For the point KENO development, existing AMPXsection processing work for point KENO involved the modules were used to process the ENDF/B collisiondevelopment of new modules to post-process data kinematics data and generate energy and anglefrom existing AMPX modules to generate MC data distributions for secondary particles in a generallibraries. pointwise format. AMPX is used to process S(cc, P)
Because AMPX-2000 is extremely modular in data for thermal moderators in addition to secondaryconstruction (i.e., more than 80 distinct processing energy and angle distributions for particles emergingmodules), cross-section processing sequences can be from collisions [e.g., elastic scattering, (n,2n), (n,3n),tailored for a specific application. Moreover, if cross- etc.]. In addition, AMPX can be used to generate ree-section data have already been processed from gas S((x, data for materials not having thermalENDF/B files for a specific application, an AMPX scattering law data. The free-gas S((x, P) data are also
- 440 -

JAERI-Conf 2003-019
post-processed to generate pointwise kinematics approach.') As op osed to using the conventionaldistributions that can be used in a variety of transport "ladder" approach, AMPX uses MC procedures toapplications. As for the I D continuous-energy cross- sample pairs of resonances for each spin sequencesections, the AMPX-generated pointwise kinematics around the reference energy provided in the ENDF/Bdata can be post-processed for a specific transport evaluation. The resonance spacings are sampled fromapplication. In particular, the kinematics data have a Wigner spacing distribution, and the parameters forbeen successfully post-processed with additional each resonance are sampled from a Chi-squareAMPX modules to generate multigroup transfer distribution. In addition, the Dyson and Mehta A3-matrices for group-dependent cross-section libraries statistics testlo, 1) is used to determine the number ofthat can be used by various multigroup transport codes resonances to sample in the probability table(e.g., XSDRNPM, KENO V.a, KENONI, etc.). calculation. Using the sampled resonance parameters,
For the current work, additional AMPX modules the total, capture, fission, and elastic scattering crosswere developed to post-process the pointwise collision sections are calculated at the reference energy usingkinematics data and generate continuous-energy joint the single-level Breit-Wigner formaliSM4) with(i.e., coupled in energy and angle) probability density appropriate treatment for temperature effects. Cross-functions (PDFs) and cumulative distribution section probability tables are generated based on thefunctions (CDFs). In AMPX, all of the pointwise different MC estimates of the total and correspondingkinematics data are exported in the lab system frame partial reactions.of reference, and the joint PDFs and CDFs that are As indicated above, different AMPX modules aregenerated for point KENO are also in the lab system. used to generate each component of a point KENOBy adhering to the lab coordinate system, point library for a specific nuclide, and a subsequent moduleKENO does not have to transforin between different was developed to combine the different components tocoordinate systems during the random walk; however, create a point KENO cross-section file for eachthe energy and angle distributions for elastic and nuclide.discrete-level inelastic scattering become morecomplex in the lab system. For example, an angular 3. Radiation Transport Developmentdistribution that is isotropic in the center-of-masssystem is anisotropic in the lab system. In addition, KENO V.a has been used extensively in the nuclearthe secondary energy distribution as a function of exit community to model fissionable systems for variousangle cosine in the lab system can be double-valued criticality safety applications. In an effort to allow(i.e., two possible exit energies with respect to a single experienced KENO users to easily convert existingangle cosine) for certain incident energies above KENO input files to the new point KENO inputthreshold for discrete inelastic-level reactions. format, one of the design objectives for the new codeLikewise, a similar double-valued -distribution is is to minimize the number of changes to the userobserved for elastic scattering with hydrogen in the interface. From a user interface perspective, thelab system if the actual mass ratio is used (i.e., A = changes are essentially transparent, except for the0.99917 as opposed to A = .0). In the generation of material format specifications used in a problem. Thisjoint PDFs and CDFs for point KENO, special phase of the research focused on the development of aattention is exercised in the construction of the stand-alone pointwise version of KENO V.a. Futuresecondary angle and energy distributions in the lab work will focus on the development of a new CSASsystem. The point KENO cross-section fon-nat (Criticality Safety Analysis Sequence) module forprovides the flexibility to represent secondary angle SCALE that integrates the material informationand energy distributions with either equal probable or processing capabilities that are available in SCALEnonequal probable bins. with the material specification requirements of the
For resonance isotopes in a neutron cross-section pointwise version of KENO V.a.evaluation, the unresolved-resonance region is an To utilize continuous-energy cross sections,energy region in which the experimental resolution is modifications were made to the input processinginadequate for determining the resonance parameters routines in KENO V.a. Several new subroutines wereof individual resonances. As a result, energy- developed to read and process the new pointwiseaveraged unresolved-resonance parameters are cross-section library structure that is discussed in thetypically provided for the unresolved region. Because previous section. In the stand-alone version ofof the statistical nature of the unresolved parameters, KENO V.a, the user must specify a mixing table thatprobability tables can be used to provide cross-section defines the mixtures for a problem. Moreover, eachprobability distribution functions for energy ranges at mixture has a nuclide specification along with thespecific temperatures within the unresolved region. appropriate atomic number density. In point ENO,Prior to the point KENO development, a new AMPX- the user has the capability to specify different nuclides2000 module was developed to generate probability from different evaluation sources. As a result, thetables for the unresolved region using an MC user has more control and flexibility with the new
- 441 -

JAERI-Conf 2003-019
material specification options relative to the where x is the spatial variable and x(E) is themultigroup versions of KENO. Regarding otherchanges to the user interface, additional parameters macroscopic total cross section for a mixture at energyhave been defined that are specific to the continuous- E. If any of the isotopes in the mixture haveenergy transport. For example, the user has the option probability-table data and the incident energy is in theto disable the probability table treatment if the impact unresolved region of the isotope, the macroscopicof the unresolved-resonance region treatment is to be total cross section for the mixture is adjusted based oninvestigated for the problem. Also, the user must the sampled probability table. Because the pointwisespecify an energy group structure that is used to collision treatment is modeled on a per-nuclide basis,tabulate calculated quantities (e.g., flux, leakage, etc.) the total cross section and corresponding partialduring the random walk. In addition, the current reactions (i.e., elastic scattering, fission, and capture)group-dependent biasing schemes (e.g., roulette and from the probability table are stored for each isotopesplitting) in KENO V.a are maintained in the that is sampled during the collision site selection.continuous-energy version of the code. Because the At each collision site, the collision is modeled bypointwise version of KENO uses the existing selecting the th isotope/nuclide in the mixture fromKENO V.a geometry package, existing KENO V.a the following equation (energy variable suppressed):
geometrical models can be used in the new 1_1 N I
continuous-energy version of KENO V.a. Future V < R E < LEJ (3)work will also focus on the development of a t 2: t Ipointwise version of KENO-VI. j=1 j=1 j=1
Because the cross-section library format dictatesthe random walk procedures, the cross-section where E' is the macroscopic total cross section for
processing development, which is described in the the 1h isotope/nuclide in the mixture. Once theprevious section, provided the foundation for the collision nuclide is selected, the nonabsorption,subsequent point KENO radiation transport absorption, and fission probabilities are calculated.development. For the first generation in a calculation, Absorption is modeled implicitly by reducing thean estimate of the initial source distribution is made particle's weight by the nonabsorption probability.based on the nature of the problem. The six start-type Depending on the particle's weight, splitting, rouletteoptions that are available in the multigroup version of or both are performed as necessary. In the pointwiseKENO are maintained in the continuous-energy random walk, an explicit collision treatment isversion of the code; however, the starting energy modeled, and the reaction is selected from NRdistribution is sampled from a continuous-energy possible nonabsorption reactions based on thefission spectrum, X(E), of the fissionable isotope microscopic cross-section data for the target nuclide:present in the mixture. If N fissionable isotopes arepresent in the mixture, the th fissionable isotope to k-1 MR k
sample is selected from a relation of the form E cri < R Y CTJ Irj (4)j=1 j=1 j=1
< where cj is the cross-section value for theE' < RJ, f f nonabsorption reaction at incident energy E.
j=1 j=1 j=1 As noted in the previous section, the point KENO
cross-section libraries are prepared by generatingwhere R is a random number between and I and EJ tabular joint kinematics distributions in the lab system.fis the macroscopic fission cross section. Linear-linear Moreover, the coupled distributions are constructedinterpolation is used to determine intermediate cross- such that the angular cosine, �t, is selected first. Oncesection values between energy gtid points. In general, the angular cosine is sampled, the exit energy isthe starting direction cosines are sampled uniformly sampled from the conditional probability distributionfrom an isotropic distribution. In the first generation corresponding to the sampled E and [t. Note that forof the MC simulation, fission points are generated that isotropic angular distributions, the exit cosine iswill serve as the source distribution for the next sampled uniformly from -1 to 1, and a single exitgeneration. The source distribution for each energy distribution is sampled for the exiting neutron
successive generation is generated from the fission energy.points from the preceding generation. For neutron-producing reactions other than fission
Once the starting distribution is sampled, the next [e.g., (n,2n), (n,3n), etc.], the weight of the exitingcollision site in a mixture is sampled from the neutron is adjusted by the reaction multiplicity tofollowing CDF: account for the additional neutrons. In other words,
Y,-'(E)x nonfission neutron-producing reactions provide aF(x) = I - e (2) source for the current generation. The fission
treatment in point KENO is implicit in nature. At
- 442 -
JAERT-Conf 2003-019
each collision site, the code determines whether NJOY 91,14) and fW]-energy-range Bondarenko,fission occurs and how many fission points are factors are provided in the library to performgenerated based on the fission probability. For each resonance self-shielding. As a result, the narrowfission point generated, the angle cosine and energy of resonance approximation is used throughout thethe fission neutron are sampled from the kinematics resonance region with the 199-group library. Thedistribution, which is generally isotropic in nature. failure of the narrow resonance approximation in theThe fission points are stored in a "fission bank" which resolved region is observed for the 199-group libraryserves as the source for the next generation. with the green block cases in Table 2 (i.e., cas82
In each generation, all of the histories are tracked through cas85), and these results are consistent withuntil death or the particle leaks from the system. the results provided in Ref. 12. As noted in Ref. 12,When the specified number of histories is complete the narrow resonance approximation in the 199-groupfor the current generation, an estimate of the library provides too much self-shielding of the 238U
eigenvalue of the system is made in addition to other capture cross section and the capture cross section isrequested quantities (e.g., flux, leakage, etc.). too low, thereby causing an overprediction in kff InSubsequently, the next generation is processed based contrast, the 238-group results and point KENOon the source estimate from the previous generation. results are closer to critical compared with the 199-The calculation is complete when all of the specified group values because of improved modeling of thenumber of generations have been processed. resonance self-shielding of the 211U capture cross
section. The point KENO results for the remaining4. Testing cases in Table 2 are consistent with the multigroup
KENO V.a results and demonstrate the computationalUsing the AMTX modules developed specifically capability of the new continuous-energy version of
for this work, prototypic point KENO cross sections KENO V.a.were generated for 50 ENDF/B-6 Release 7 nuclides At this point in the development, extensive CPU(i.e., includes all the uranium and plutonium isotopes, timing studies have not been performed with thein addition to thermal data for H in H20 and H in continuous-energy version of KENO V.a; however,CH2). In an effort to demonstrate and test the timing comparisons relative to the multigroup versioncomputational capability of point KENO, 21 critical of KENO V.a have been performed for the 21benchmarks were selected from the work by Bowman benchmark problems in Table 1. The differences inet a]. 12) and modeled with the continuous-energy CPU times between the pointwise and multigroupversion of KENO V.a. A brief description of each versions of KENO V.a are directly correlated to thebenchmark is provided in Table 1, using the case complexity of the problem. Based on testing duringdesignation specified in Ref. 12. The first 13 the point KENO development and testing with the 21benchmarks in Table I involve light-water-reactor benchmarks, the multigroup version is 6 to 133 times(LWR)-type U02 fuel pin lattices with various faster than point KENO. One of the recognizedabsorber and reflector configurations. The next four strengths of the multigroup version of KENO is thebenchmarks in Table I (i.e., cas82 through cas85) are speed of the MC simulation. Fast execution times forthe "green block" experiments that involve 23 wt % multigroup KENO V.a are attributed to the building-enriched homogenized uranium in paraffin blocks. block" type of geometry package coupled with theCases cas86 through cas88 involve uranyl fluoride and multigroup collision treatment. In the multigroupuranyl nitrate solutions at 93.2 wt % enrichment, and approach, a collision is modeled with the entirecas9I consists of uranyl fluoride solution at 489 wt % mixture, and the collision treatment does not requireenrichment. the selection of the interacting nuclide or reaction type
The new version of point KENO was used to (i.e., elastic versus nonelastic) as in the continuous-model each of the benchmarks presented in Table 1, energy approach. As a result, particle collisions inand the calculated results for each benchmark are multigroup KENO are treated much faster than in theprovided in Table 2 All of the calculations were continuous-energy treatment. The large range ofperformed on a DEC Alpha XP1000 workstation. For differences in CPU time for the 21 benchmark casescomparison purposes, the 21 benchmarks were are attributed to the aount of H in H20 material [i.e.,modeled with the multigroup version of KENO V.a kinematics distributions based on S(ctp) data] asusing the 238-group 13) ENDF/B-5') and 199-group either a moderator or reflector. The point KENOENDF/13-6 Release 3 cross-section libraries. The particle collision treatment requires that the exiting199-group and 238-group libraries are general- energy and angle be sampled from tabular kinematicspurpose data libraries with adequate group structures distributions. Consequently, the continuous-energyfor most fast and thermal criticality safety applications. approach requires extensive table searches for theOne limitation of the 199-group library is the method collision treatment. Problems that have extensiveused for self-shielding the resonances in the resolved thermal collisions require multiple sampling of theregion. The 199-group library was generated using H20 tabular kinematics distributions. For example,
- 443 -

JAERI - Conf 2003 - 019
Table Descriptions of selected critical benchmark cases
Enrichment LatticeCase (wt %) Description water/fuel
volume ratio*
cas 1 2.35 No absorber plates 2.92
casO7 2.35 Uranium reflector 2.92
casO9 2.35 No reflector 2.92
cas19 2.35 Uranium reflector 1.6
cas2 1 2.35 No reflector 1.6
cas34 2.46 Core YX: 1675 ppm soluble boron 0.999
cas36 2.46 Core IX: No 134C pins, four pitches between assemblies 1.84
cas37 2.46 Core XIII: 16 wt % Boral, one pitch between assemblies 1.84
cas38 2.46 Core XXI: 0 I wt % Boral, three pitches between assemblies 1.84
cas46 2.35 1.562 cm pitch, 464 ppm soluble boron 1.196
cas47 2.35 1.905 cm pitch, no boron 2.408
cas48 2.35 1.905 cm pitch, 568 pprn soluble boron 2.408
cas5O 2.35 2.2 1 0 cm pitch, 286 pprn soluble boron 3.687cas82 2.0 Homogenized uranium in paraffin, unreflected H/135U = 293.9
cas83 2.0 Homogenized uranium in paraffin, plexiglass, and paraffin H/231U = 406.3reflector
cas84 3.0 Homogenized uranium in paraffm, plexiglass and paraffin W35U = 133.4reflector
cas85 3.0 Homogenized uranium in paraffin, unreflected H/215U = 133.4
cas86 93.2 U02172 solution sphere, no reflector W31U = 1112
cas87 93.2 U021`2 solution sphere, 1420 reflector W31U = 1270
cas88 93.2 U02(NO3)2 solution, 142.9 g U/1, cylinder, no reflector Hj23_1U = 186
cas9l 4.89 U02172 solution sphere, 42.54 g 235U/1 , Al box, H20 reflector H/235U = 524
* Unless designated as H/ 231U ratio.
problems cas36 and cas37 involve U(Z.46)02 fel pin 5. Summarylattices that have separation differences of I and 4pitches, respectively. The increased water moderation The objective of the research is to develop andbetween assemblies in cas37 leads to 2.5 times demonstrate a continuous-energy version of the MClonger point KENO CPU time compared with cas36. code KENO V.a. The initial phase of the researchAs a result, more CPU time is spent sampling the focused on the design and development of atabulated CDFs in cas37 than in cas36 as a neutron continuous-energy cross-section format and thethermalizes in H20- Improved CPU times in the point associated cross-section processing modules for theKENO simulation can be obtained by improving the AMPX-2000 code system. After defming the cross-sampling efficiency of the tabular kinematics section format, the transport procedures weredistributions. developed and implemented in a pointwise version of
KENO V.a. Using the processing modules that weredeveloped in the initial phase of the research, ENDF/13-6 Release 7 nuclides were processed withAMPX to create a test pointwise cross-section library.In an effort to demonstrate and test the new transportcapability, 21 critical benchmarks have beencalculated with the continuous-energy KENO V.a.The point KENO-calculated eigenvalues for thedifferent benchmarks are in agreement with the resultsobtained with KENO V.a using the 238-groupENDF/13-5 and 199-group ENDF/13-6 Release 3
- 444 -

JAERI-Conf 2003-019
Table 2 Calculated kff for selected critical benchmark cases
Case Point KENO KENO V.a KENO V.aENDF/B-6 Re]. 7 199-group ENDF/B-6 Rel 3 238-group ENDF/B-5
cas 1 0.9925 ± 00016 0.9947 ± .0015 0.9937 ± 0.0015
casO7 1.0048 00016 0.9934 ± 00016 0.9956 ± 0.0015
casO9 0.9936 00014 0.9908 ± 0.0015 0.9956 ± 00014
casl9 0.9999 ± 0.0015 0.9937 ± 00022 0.9903 ± 00014
cas2l 0.9955 00017 0.9890 ± 00017 0.9941 ± 00016
cas34 0.9990 0.0018 0.9973 ± 0.0011 0.9925 ± 0.0015
cas36 0.9908 ± 00016 0.9896 ± 00014 0.9934 ± 00014
cas37 0.9975 ± 00020 0.9979 ± 00020 0.9931 ± 0.0015
cas38 0.9924 ± 0.0015 0.9859 ± 0.0015 0.9901 ± 00016
cas46 0.9967 ± 0.0018 0.9948 ± 00017 0.9942 ± 00014
cas,47 0.9959 00012 0.9924 ± 0.0010 0.9952 ± 00012
cas48 0.9984 ± 00012 0.9972 ± 0.0011 0.9981 0.0010
cas5O 0.9999 ± 00021 0.9973 0.0011 1.0033 00014
cas82 1.0027 ± 00016 1.0241 0.0015 1.0021 ± 00016
cas83 1.001 + 00019 1.0194 ± 00017 0.9992 ± 00017
cas84 1.0129 00021 1.0357 ± 00017 1.0118 ± 00017
cas85 1.0137 ± 00017 1.0407 ± 00020 1.0123 ± 00020
cas86 1.0043 ± 00016 1.0026 ± 00022 1.008 ± 00016
cas87 1.0014 ± 0.0018 1.001 ± 00014 1.0039 ± 00013
cas88 0.9981 ± 00020 1.0029 00025 1.0090 0.0021
cas9I 1.0025 ± 00014 1.0120 00012 1.0064 0.0013
libraries. In addition, the point KENO results 3) "MCNP A General Monte Carlo - Particleobtained with ENDF/B-6 Release 7 data are in much Transport Code," Version 4C, LA-13709-M, J. F.better aeement with critical than were previously Briesmeister, Ed., Los Alamos Nationalcalculated results obtained with the 199-group Laboratory 2001).ENDF/B-6 Release 3 library for the green block 4) "ENDF- 1 02 Data Formats and Procedures for theexperiments. With regard to future development, Evaluated Nuclear Data File ENDF-6," BNL-additional testing for a wide variety of benchmarks NCS-44945, Rev. 10/91 (ENDF/B-6) 1991).should be performed. Moreover, additional work 5) M. E. Dunn and N. M. Greene, "AMPX-2000 Aneeds to be performed to improve the calculational cross-section processing system for generatingefficiency of the code. Although additional research nuclear data for criticality safety applications,"is planned, a continuous-energy version of the KENO Trans. Am. Nucl. Soc. 86, 118-119 2002).V.a code has been successfully developed and 6) M. Williams and M. Asgari, "Computation ofdemonstrated for modeling systems with fissionable continuous-energy neutron spectra with discretematerial. ordinates transport theory," Nucl. Sci. Eng. 121,
173-201 1995).Acknowledgments 7) S. M. Bowman, D. F. Hollenbach, M. D. DeHart,
The work presented in this paper was sponsored B. T. Rearden, I. C. Gauld and S. Goluoglu, "Anby the United States Nuclear Regulatory Commission. Overview of What's New in SCALE 5," Trans.
Am. Nucl. Soc. 87, 265-268 2002).References 8) M. E. Dunn and L. C. Leal, "Calculating1) "SCALE: A Modular Code System for probability tables for the unresolved-resonance
Performing Standardized Computer Analysis for region using Monte Carlo methods," Proc. Int.Licensing Evaluation," NUREG/CR-0200, Rev. 6 Conf. on the New Frontiers of NuclearORNL/NUREG/CR/CSD-2/R6, Vols. 1, 11, and III Technology: Reactor Physics, Safety and High-(2000). Performance Computing, PHYSOR 2002, Seoul,
2) M. E. Dunn, C. L. Bentley, S. Goluoglu, L. S. Korea, Oct. 710, 2002, 1 1 C.03.pdf 2002).Paschal, L. M. Petrie and H. L. Dodds, 9) L. B. Levitt, "The probability table method for"Development of a continuous energy version of treating unresolved neutron resonances in MonteKENO V.a," Nucl. Technol. 119, 306-313 1997). Carlo calculations," Nucl. Sci. Eng. 49, 450-457
- 445 -

JAERI-Conf 2003-019
(1972).10) F. J. Dyson and M. L. Mehta, "Statistical theory
of the energy levels of complex systems," J. Math.Phys 4 701 1963).
11) L. C. Leal and N. M. Larson, "SAMDIST AComputer Code for Calculating StatisticalDistributions for R-Matrix ResonanceParameters," ORNUTM- 3092 1995).
12) S. M. Bowman, R. Q. Wright, M. D. DeHart,C. V. Parks and L. M. Petrie, "Recent validationexperience with multigroup cross-section librariesand SCALE," Proc. Int. Conf, on NuclearCriticality Safety, ICNC'95, Albuquerque, NM,Sept. 17-21, 1995 2X44 - 2X55 1995).
13) D. T. Ingersoll, J. E. White, R. Q. Wright,H. T. Hunter, C. 0. Slater, N. M. Greene,R. E. MacFarlane and R. W. Roussin,"Production and Testing of the VITAMIN-136Fine-Group and the BUGLE-93 Broad-GroupNeutron/Photon Cross-Section Libraries Derivedfrom ENDF/B-VI Nuclear Data," ORNL-6795,NUREG/CR-6214 1995).
14) R. E. MacFarlane and D. W. Muir, "The NJOYNuclear Data Processing System-Version 91,"LA-12740-M 1994).
- 446 -

JAERI-Conf 2003-019 JP0450087
SCALE 5: Powerful New Criticality Safety Analysis Tools
Stephen M. BOWMAN% Daniel F. HOLLENBACH, Mark D. DEHART,Bradley T. REARDEN, Ian C. GAULD and Sedat GOLUOGLU
Oak Ridge National Laboratory� P.O. Box 2008, Oak Ridge, Tennessee 37831-6370, USA
Version of the SCALE computer software system developed at Oak Ridge NationalLaboratory, scheduled for release in December 2003, contains several significant new modulesand sequences for criticality safety analysis and marks the most important update to SCALE inmore than a decade. This paper highlights the capabilities of these new modules andsequences, including continuous energy flux spectra for processing multigroupproblem-dependent cross sections; one- and three-dimensional sensitivity and uncertaintyanalyses for criticality safety evaluations; two-dimensional flexible mesh discrete ordinatescode; automated burnup-credit analysis sequence; and one-dimensional material distributionoptimization for criticality safety.
KEYWORDS. SCALE, TSUN"I, SMORES, Javapeno, STARBUCS, NEWT, TRITON,CENTRM, AENO, sensitivity, uncertainty, optimization, burnup credit
1. Introduction in only one unit cell. All materials not specified in aunit cell are processed as infinite homogeneous media.
The SCALE (Standardized Computer Analyses for NITAWL-111, an upgrade of NITAWL-II, has theLicensing Evaluation)'� computer software system capability to process multipole data, thus enabling it todeveloped at Oak Ridge National Laboratory (ORNL) process an ENDF/B-VI cross-section library with theis widely used and accepted around the world for Reich-Moore resonance parameters converted tocriticality safety analyses. Version of SCALE, multipole parameters. NITAWL uses the Nordheimscheduled for release in December 2003, contains Integral Treatment to process cross-section data in theseveral significant new modules and sequences for resolved resonance range. Each resonance iscriticality safety analysis and marks the most processed individually, not accounting for the changeimportant update to SCALE in more than a decade. in the background cross section due to otherThis paper highlights the improvements to existing overlapping resonances. Also, a flux spectrum in theSCALE modules and the capabilities of new modules fuel lump is calculated based on the moderators andand sequences. absorbers in the fuel lump and assuming a /E flux
spectrum outside the lump as well as the
2. Improvements to Existing SCALE Modules slowing-down source above each resonance.
The following sections describe enhancements in 2.2 KENO V.a / KENO-VISCALE to currently existing SCALE modules. The KENO V.a and KENO-VI Monte Carlo
criticality safety codes have been extensively modifled2.1 Cross-Section Processing Enhancements for SCALE 5. Most of these modifications are
The cross-section processing capabilities in transparent to the user. First, the codes have beenSCALE have been expanded over the capabilities completely rewritten in Fortran9O. The large arraycurrently in SCALE 4.4a. Currently in SCALE 4.4a, that previously contained the cross-section andonly one unit cell can be specified and all other geometry data has been eliminated. In SCALE thematerials are treated as an infinite homogeneous memory needed to store data in arrays is allocatedmedium. Resonance data must be manually added to dynamically as needed and deallocated when nothe MORE DATA block to account for the geometry longer needed. This greatly simplifies the overalland lattice effects of materials not specified in the unit program logic and removes the need forcell. In SCALE 5, the user may specify multiple unit supergrouping. As a result, the supergrouping optioncells. Each unit cell specification contains the cell has been eliminated.type (infinite homogeneous medium, multiregion, or A new algorithm is now used to determine thelattice cell), cell geometry type, and appropriate standard deviation associated with the system kffmaterial and geometry data. Any number of unit based on work by Ueki et al.') This algorithmcells may be specified, but each material may appear accounts for the serial correlation between successive
Corresponding author, Tel. 865-574-5263, Fax. 865-576-3513, E-mail: bowmansm�oml.govManaged by UT-Battelle, LLC, for the U.S. Department of Energy under contract No. DE-AC05-00OR22725.
- 447 -

JAERI-Conf 2003--019
generations, thus producing a more realistic standarddeviation.
The codes now calculate a system mean-free path.This is done by first calculating a mean-free path foreach generation. An average mean-free path over allgenerations and its standard deviation are thencalculated. Region mean-free paths can also becalculated using the region macroscopic total crosssection and the region fluxes.
The criticality search capabilities in SCALE havebeen expanded to allow each unit cell to be explicitly
identified with either a unit or a material that is being Fig. I Hexagonal array (SCALE 4.4a and SCALE 5).modified in KENO V.a. A search case may alter thematerial densities, the pitch of the cells in a lattice, orsimple geometry boundaries. Since multiple unitcells are now allowed, a critical search may now beperfon-ned on lattices containing more than one fuelpin type. As the geometry or material in KENO V.ais modified, the unit cell is similarly modified, thusensuring that the cross sections for the material areappropriately processed. Cell-weighted materialsmay now be included in the searches, updating thegeometry, material, and cross sections as the searchprogresses.
Several new geometry and array types have beenadded to KENO-VI. New geometry types includeX-cylinder, Y-cylinder, Z-cylinder, pentagon, Xplane,Y-plane, and Z-plane. Three additional array typesare available: dodecahedral, which is a Fig. 2 Standard hexagonal array (SCALE 5).three-dimensional (3-D) stack of dodecahedrons;standard hexagonal, which differs from the currenthexagonal array type as shown in Figures I and 2 androtated hexagonal, which is a standard hexagonalarray rotated 90 degrees (Figure 3.
3. New Modules in SCALE
The following sections describe the modules thatare being released in SCALE .
3.1 CENTIRM: Continuous Energy Flux Spectrafor Multigroup Cross Sections
The resolved resonance processor modulesCENTRM') (Continuous Energy ransport Module)and PMC (Pointwise Multigroup Converter) provide asignificant new capability in SCALE 5. CENTRM isa one-dimensional (I D) discrete ordinates code thatuses a pointwise continuous energy cross-sectionlibrary to produce a set of pointwise continuous
energy fluxes at discrete spatial intervals for each unit Fig. 3 Rotated hexagonal array (SCALE 5).cell. Using these fluxes, PMC collapses the
pointwise continuous energy cross sections into Discrete-level inelastic cross-section data can alsomultigroup cross sections for each nuclide in each be processed by CENTRM/PMC. Down-scatteringmaterial in the unit cell. CENTRM can be used to from inelastic continuum data and thermalexplicitly model fuel or absorber materials in up-scattering into the pointwise range are optionallysubdivided regions, such as concentric rings in a fuel available by a multigroup treatment. CENTRM/PMCpin, to more precisely model the spatial effect on the avoids many of the inherent assumptions in NITAWLflux and cross sections. Other modules in SCALE by calculating a problem-dependent flux profile, thussuch as KENO, can then use these multigroup cross making it a far more rigorous cross-section treatment.sections. Effects from overlapping resonances, fissile material
- 448 -

JAERI - Conf 2003 - 019
in the fuel and surrounding moderator, anisotropic 3.3 SMORES: Material Optimization forscattering, and inelastic level scattering are explicitly Criticality Safety Analysishandled in CENTRM/PMC. A new SCALE control module named SMORES8)
A separate set of CENTRM and PMC input files is (SCALE Material Optimization and REplacementrequired for each unit cell. For a SCALE sequence Sequence) has been developed as part of theutilizing CENTRM/PMC, the control module Applicable Ranges of Bounding Curves and Dataproduces the input files for CENTRM and PMC based (AROBCAD) Task undertaken by the U.S.on the unit cell data specified in the problem. If a Department of Energy Nuclear Criticality Safetylattice unit cell is specified, the code converts the cell Program. The purpose of SMORES is to performdescription to an equivalent Wigner-Seitz cell for automated I-D optimization for criticality safetyprocessing. When the CENTRM/PMC option is analysis.specified, the WORKER utility module is initially run The SMORES sequence consists of three majorto produce a working format cross-section library. steps that are repeated as needed: (1) preparation ofThen CENTRM and PMC are executed for each unit the cross sections and mixing table used for thecell specified plus an additional time to process all the transport and optimization calculations; 2 I-Dnuclides contained in materials not specified in a unit neutron transport calculation of the angular forwardcell. When all nuclides have been processed, and adjoint fluxes; and 3) calculation of effectivenessWORKER is called again to convert the final master functions and optimization of the system with respectformat library to a working format library. to a parameter, either the calculated kff value of a
system or the minimum amount of fissile material in a3.2 TSUNAMI: Sensitivity and Uncertainty for system that will yield a desired kff value.
Criticality Safety Analyses The cross-section processing is performed usingORNL has invested a significant effort in the either BONAMIINITAWL-III modules or
development of sensitivity and uncertainty (SIU) BONAMI/CENTRMIPMC. The processed crossanalysis capabilities for criticality safety. Both -D sections are then used to create a problem-dependentand 3-D sequences plus several auxiliary codes have self-shielded macroscopic cross-section library thatbeen developed into a new suite of S/U analysis codes corresponds to the most recent configuration in thecalled TSUNAMI (Tools for Sensitivity and optimization process.UNcertainty Analysis Methodology Implementa- The forward and adjoint neutron transport
4,I)tion). calculations of the system are performed using theTSUNAMI contains a number of codes that were XSDRNPM module. This module performs the I D
developed primarily to assess the area of applicability criticality calculation that provides the neutron fluxesof benchmark experiments for use in criticality code that are used to determine the effectiveness functions,validations. However, the S/U data produced by as well as the kff of the current system.these codes can be used in a wide range of studies. Finally, SMORES calls the SWIF functionalSensitivity coefficients produced by the TSUNAMI module, which has been developed at the Universitysensitivity analysis sequences predict the relative of California, Berkeley. SWIF optimizes a specifiedchanges in a system's calculated kff value due to parameter (kf or minimum fissile mass) by calculatingchanges in the neutron cross-section data. the effectiveness functions (equal volume replacementTSUNAMI produces sensitivity data on a groupwise reactive worth) using the forward and adjoint fluxesbasis for each region defined in the system model. calculated by XSDRNPM and problem-dependentThe TSUNAMI-ID control module generates cross sections. Since the optimization process issensitivity coefficients using XSDRNPM. The iterative, the above steps are repeated untilTSUNAMI-3D control module is based on KENO Va. convergence is achieved or the maximum number of
Both TSUNAMI-ID and TSUNAMI-3D fold the iterations is reached. If the maximum number ofsensitivity data with cross-section covariance data to iterations is reached before convergence, a restartcalculate the uncertainty in the calculated kff value option can be used to optionally change thedue to tabulated uncertainties in the cross-section data. convergence criteria for continued optimization with aMultigroup cross-section covariance data libraries for new maximum number of iterations. Along with aavailable nuclides and reactions will be included in standard output file, several plot-oriented output filesSCALE 5. are created to allow rapid processing for visualization
The applicability of benchmark experiments to the using Jav4peno (Lava Plots Especially Nice Output),criticality code validation of a given application can which is included with SCALE and described in thebe assessed using S/U-based integral parameters. 4,6) next section, or other standard plotting packages.The TSUNAMI-IP (Integral Parameters) code utilizes Hence, the system ff, material concentrations, andsensitivity data and cross-section covariance data to fissile mass as a function of iteration number canproduce a number of relational integral parameters easily be plotted. Figure 4 shows a plot of fissilethat can be used to assess system similarity. Some mass vs iteration for minimum critical mass search.example of uses of the TSUNAMI techniques are
7)given in a companion paper.
- 449 -

JAERI-Conf 2003-019
' b V . . .... ... . .. ... .. ... ... .. .... .... ... ............................ ....... .... ...... .. . ... .. ....... .... ..... 103-10cm; Mass by Iteration
0.192 6
... .. ....... .. .. ..... .. .......
0.190 . .... .....
0.188
0.186
0) 0.184
.... .. ....
M 0.182 ......
0.180............ .........
0.178
........ ......
... ... ..... .0.176
. . . ........
0 .1 7 4 .. ................ .. ............ . .... .... .......... . ..... ........ .. ......... ......... . .
..... ....... ..... ..... .. .. ........... . .. ... ..... ... ... .... ......... ....... ... .... . .. ..... ............ ...... . .... ... .......-
0.172
20.0 40.0 60.0 80.0 100.0 120.0 140.0 160.0
Iteration
Fig. 4 SMORES minimum critical mass search.
3.4 Javapeno: Interactive Plotting of Calculated while the second experiment is much more sensitive inResults the resonance and fast ranges.
Javapeno is a Java program originally designed to
plot data from the TSUNAMI sensitivity sequences. Table 1. MOX polystyrene compact criticalIt has been expanded to plot the SMORES mater .ial experimentsoptimization sequence results and the groupwisereaction-rate and flux data calculated by Experiment nse55t4-01 nse55t5-01
KENO Va/KMART and KENO-VIXMART6. H/(U+Pu) 30.6 2.8
Javapeno plots sensitivity, reaction-rate, or flux Pu/(U+Pu) 0.146 0.303
data as a function of energy group normalized by the wt % Pu-240 7.97 11.5unit lethargy for each group, thus eliminating therelative group width from the analysis. EALF* 0.143 39.7
Figure contains a Javapeno plot of the Pu-239 *Energy of average lethargy causing fission.fission sensitivity profiles for two mixed oxide(MOX) polystyrene compact critical experiments.9) Javapeno plots can be printed directly from theThe red curve called nse55t4-01 is the first experiment software package or can be exported to a variety ofin Table 4 of that reference, while the blue curve graphics forinats to use in reports or presentations.called nse55t5-01 is the first experiment in Table of Because of the cross-platform capabilities of Java,that reference. The characteristics of these Javapeno can execute on any computer for which theexperiments are given in Table 1. The plot shows Java Runtime Environment is available.that the first experiment is much more sensitive to thePu-239 fission cross section in the thermal range,
- 450 -

JAERI-Conf 2003-019
.... .......... ... Me I-239 118sion0.17'
0.16 nsev'45 Pu-239 fr.Man
0.15. .......... ..... ... ... ... ... .... .. .............. ... .... ... ... .... ...... .. ........ .. .... ..... ... . . .... .. ..... ... .. . . ........0.14
.. . ...... .... ......... ...... ... .. . . ..... ..... ......... ... ... ... ... ... ...... ..... ... ... ....... .. . ................. ... .. ..............0,13
0.12..... .. ............. ............. .............. .. ... .. .. ......... ....... .. ............. ..... ........... ..... .. . .. .......... . ........ .................. .... ........ ..... .... ...... ..... ... .0.11 f
0 , 1 ( ............. .... ...... ...... .... .. ............ . .............. ... . . ... ..... ... .............. .... .... . .. ...... . . ............................ .... .................. .
.. .... ...................... ............ ... .. ......... ....... ... .......... .. .... ....... ... ........ ........... ..... .... ....... ...0.09
0A ... ... - --- ---- - ....... .......... .............. ... .. . ... .........-........ ---
0 . 7 . . ....... ......... ... .............. ... ... .. .... ..... .................... ................................. .. . ..... ... .. ...................... .............. .............. .... ......................... ............ ...... .. .............. . .... ... . .......... ... ....... ....... ......... .... ............... ...... . . ....... ...................... .
0M
0.05 ....... ................ ..... ... ..... ............. ...... .. ..... .. .......... ....... . ...... . . .............. ......................... ...... .... ... ... ... ................
0.04.... ...... . ....... .... ..... . .. .. ... ................. ........................ .. . ......... . ...................
. ...................... ................ .. .... ........ ... ........................ ..... .... ........0.02
....... .... ... ...... .0.0(-0.01,
LOE-04 LOE-02 LOF00 LOE02 LOE04 LO&WEnergy(eV)
Fig. 5 Javapeno plot of Pu-239 fission sensitivity profiles from MOX polystyrene compact critical experiments.
3.5 STARBUCS: Burnup-Credit Analysis cross sections to determine the neutron multiplicationSequence factor for the system.
STARBUCS10) standardized Analysis of 'The STARBUCS control module is designed toReactivity for Eurnup gedit using �CALE) is a new facilitate burnup-credit criticality analysis bysequence to perform criticality calculations for spent automating and linking the depletion analysis andfuel systems employing burnup credit. STARBUCS criticality calculations. The input format has beenautomates the criticality analysis of spent fuel designed around the existing depletion analysis andconfigurations by coupling the depletion and criticality safety sequences of SCALE. Only acriticality aspects of the analysis, thereby eliminating minimal amount of input beyond that typicallythe need to manually process the spent ftiel nuclide required for a fresh-ftiel calculation is needed tocompositions into a format compatible with criticality perform a burnup-credit calculation.safety codes. STARBUCS automatically prepares STARBUCS has been designed specifically tothe input for all codes in the analysis sequence, allow analysts and reviewers to assess the majorexecutes the codes through the SCALE driver, and burnup-credit phenomena identi d the U. S.performs all module interface and data management Nuclear Regulatory Commission Interim Staffftinctions for the user. Guidance 8 (ISG8).") Specifically, STARBUCS
STARBUCS performs a depletion analysis allows the user the following capabilities:calculation for each spatially varying burnup region I An arbitrary axial and/or horizontal assembly(if an axial burnup profile is specified) of a spent fuel burnup gradient can be input. The spatial burnupassembly using the ORIGEN-ARP methodology of distribution may be controlled entirely by the user.SCALE. The ORIGEN-ARP methodology serves as Optionally, built-in "bounding" axial profiles maya faster alternative to the SAS2H depletion analysis be selected by the user. A maximum of 100sequence in SCALE, while maintaining calculational axial and IO horizontal zones may be defined.accuracy. The spent ftiel compositions are then used 2. Any or all of the spent ftiel actinide or fissionto generate resonance self-shielded cross sections for product isotopes may be included in the criticalityeach burnup-dependent fuel region using the SCALE calculation. The user may select from any of the!Criticality Safety Apalysis Sequence (CSAS). more than 1000 nuclides in the ORIGEN-SFinally, a KENO V.a or KENO-VI criticality libraries, Provided cross sections are available forcalculation is performed using the spatially varying the KENO calculation. This allows the fission
product margin to be readily evaluated.
451 -

JAERI-Conf 2003-019
Optionally, the user may request all nuclides to be NEWT's automated grid-generation scheme, basedincluded to obtain "best-estimate" results. on the placement of simple bodies within a problem
3. The burnup calculations can specify any desired domain, allows rapid development of a model withoutoperating history. The user may specify the the need to manually input a complex and irregularassembly-average specific fission power, cycle grid structure. Figures 6 and 7 show twolengths, cycle downtime, and post-irradiation computational grids generated by NEWT for acooling time. This allows the user to readily hypothetical fuel assembly. The geometry inputevaluate power history and cooling time effects. specifications are identical, but a more refined grid is
4. Isotopic correction factors may be input to adjust specified for the second model. Note that thesethe calculated isotopic inventories to account for models contain no curved surfaces but instead consistknown bias and/or uncertainties associated with of arbitrary polygons computed by NEWT in whichthe depletion calculations. volumes are conserved.
5. Virtually any arrangement of spent ftiel may besimulated. STARBUCS is not restricted to spentftiel transport and storage cask analysis. AnyKENO geometry model is permissible. Forexample, spent fuel arrays in a storage pool could J-t I Ibe easily simulated. W I I
%J14 W3.6 TRITON/NEWT: Flexible Mesh 2-D Discrete AN it,%
Ordinates w w wSCALE 5 introduces two-dimensional (2-13)
analytical capability via the NEWT (NEW Transportalgorithm) flexible mesh discrete ordinates code.Unlike traditional S. codes, NEWT is not limited toCartesian or cylindrical coordinate systems. INEWT's arbitary geometry, or flexible mesh, allows P_[��users to combine orthogonal, radial, and other more I I I Zt%unusual geometry shapes in the same model. ff L% 4 0_1 1. W_ Ise N�
NEWT is unique in the domain of discrete L7P=F= ---+-+-ordinates methods because it is based on a Fig. 6 NEWT coarse grid for fuel assembly.nonorthogonal, flexible mesh scheme that allowsaccurate representation of complex geometricconfigurations that are normally impossible to modelwith discrete ordinates methods without significant
12)approximations. Using a discrete ordinatesapproximation to the transport equation on anarbitrary grid, NEWT provides a robust and rigorousdeterministic solution for nonorthogonalconfigurations. Lower-order detenninistic methodstypically applied in lattice analyses (e.g., integraltransport and collision probability methods) do notprovide the angular resolution necessary to treatstrongly anisotropic fluxes, such as those in thevicinity of strong absorbers or in high-leakage cores.This limitation may be exacerbated in MOX fuels due 9 I ILI
to the increased sensitivity of such ftiels to the thermalspectrum. NEWT has already been used todemonstrate the effect of minor assumptions on thethermal spectra of MOX fuels. 13) Fig. 7 NEWT refined grid for fuel assembly.
NEWT offers several calculational options. Itmay be used to calculate the eigenvalue of a system, The TRITON control module (originally developedto perform a fixed source calculation, or to calculate as a prototype named SAS213) performs the task ofthe critical (X-Y) buckling of a lattice. It allows the coordination of data transfer between various physicsspecification of an axial buckling or calculates an codes, and in invoking those codes in the properaxial buckling from a specified height to account for sequence for a desired calculational type. 14) TRITONaxial leakage effects. NEWT can collapse cross brings to NEWT the automated and simplifiedsections to an appropriately weighted group structure approach for setting up and performing complex setssubset, in the form of an AMPX working-format of calculations, a hallmark of the SCALE system.library. TRITON provides multiple sequence options,
depending on the nature of the problem to be analyzed,
- 452 -
JAERI-Conf 2003-019
including a single NEWT transport calculation (with Criticality Safety, ICNC 2003, Tokai-mura, Japanproblem-specific multigroup cross-section generation) (2003).and a 2-D depletion calculation that iterates between 8) S. Goluoglu, L. M. Petrie, C. M. Hopper, Y. Karni,NEWT-based transport calculations and ORIGEN-S D. Regev and E. Greenspan, "SMORES - A newdepletion calculations. The rigor of the NEWT SCALE sequence for the determination ofsolution in estimating angular flux distributions bounding curves and date," Proc. of ANS 2002combined with the world-recognized accuracy of Annual Meeting: The Revival of the NuclearORIGEN-S depletion gives TRITON the capability to Energy Option, Hollywood, Florida, June 913,perform rigorous burnup-dependent physics data with 2002. Trans. Am. Nucl. Soc. 86, 114-116few implicit approximations. Such rigor may be (2002).necessary to capture the unique attributes of MOX 9) S. R. Bierman and E. D. Clayton, "Criticalfuel behavior as well as that of advanced, highly experiments to measure the neutron poisoningheterogeneous fuel assembly designs being deployed effect of copper and copper-cadmium plates,"in current-generation reactors. Nucl. Sci. Eng. 55, 58-66 1974).
10) I. C. Gauld and C. E. Sanders, "Development and4. Conclusions applications of a prototypic SCALE control
module for automated burnup credit analysis,"SCALE5 contains many new capabilities for Proc. 2001 ANS Embedded Topical Meeting on
criticality safety analysis, including continuous energy Practical Implementation of Nuclear Criticalityflux spectra for processing multigroup Safety, Reno, Nevada, Nov. 11-15, 2001,problem-dependent cross sections, ENDF/B-V1 35238.pdf 2001).resonance processing for multigroup cross sections, I 1) Spent Fuel Project Office Interim StaffI-D and 3-D SIU analyses for criticality safety Guidance-8, Rev. 2-Burnup Credit in theevaluations, 2-D flexible mesh discrete ordinates Criticality Safety Analyses of PWR Spent Fuel incode; automated burnup-credit analysis sequence, and Transport and Storage Casks, U.S. NuclearI-D material distribution optimization for criticality Regulatory Commission (Sept. 27,2002).safety. These features will finther enhance SCALE's 12) M. D. DeHart, "An advanced deterministicability to provide a powerfal but easy-to-use set of method for spent-ftiel criticality safety analysis,"criticality safety analysis tools. Proc. ANS 1998 Annual Meeting and Embedded
Topical Meeting, Nashville, Tennessee, June 71 ,References 1998. Trans. Am. Nucl. Soc. 78, 170-1721) "SCALE: A Modular Code System for Performing (1998).
Standardized Computer Analyses for Licensing 13) M. D. DeHart, "A deterministic study of theEvaluation," NREG/CR-0200, Rev. 6 ORNL/ deficiency of the Wigner-Seitz approximation forNUREG/CSD-2/R6, Vols. 1, 11, and III (May Pu/MOX fuel pins," Proc. of M&C'99-Madrid,2000). Mathematics and Computations Meeting, Madrid,
2) T. Ueki, T. Mori and M. Nakagawa, "Error Spain, Sept. 27-30, 1999, 689-699 1999).estimations and their biases in Monte Carlo 14) M. D. DeHart, "SAS213-A two-dimensionaleigenvalue calculations," Nucl. Sci. Eng. 125, depletion sequence for characterization of spent1-11 1997). nuclear fuel," Proc. of 2001 ANS Embedded
3) M. Williams and M. Asgari, "Computation of Topical Meeting on Practical Implementation ofcontinuous-energy neutron spectra with discrete Nuclear Criticality Safety, Reno, Nevada,ordinates transport theory," Nucl. Sci. Eng. 121, Nov. 11-15, 2001, 35583.pdf 2001).173-201(1995).
4) B. T. Rearden, "Perturbation theory eigenvaluesensitivity analysis with Monte Carlo techniques,"Nucl. Sci. Eng. in press 2003).
5) B. L. Broadhead, B. T. Rearden, C. M. Hopper,J. J. Wagschal, and C. V. Parks, Sensitivity- anduncertainty-based criticality safety validationtechniques," Nucl. Sci. En& in press 2003).
6) S. Goluoglu, C. M. Hopper, and B. T. Rearden,"Extended interpretation of sensitivity data forbenchmark areas of applicability," Trans. Am.Nucl. Soc. 88, 77 2003).
7) B. T. Rearden, C. M. Hopper, K. R. Elam,S. Goluoglu, and C. V. Parks, "Applications of theTSUNAMI sensitivity and uncertainty analysismethodology," Proc. 7th Int. Conf. on Nuclear
- 453 -

JAERI - Conf 2003 - 019 JP0450088
Current Status and Future Direction of the MONK Software Package
Nigel SMITH'*, Malcolm ARMISHAW1 and Andrew COOPER�'Serco Assurance, Winfrith Technology Centre, Dorchester, Dorset, DT2 8DH UK
2British Nuclear Fuelsp1c, Rutherford House, Risley, Warrington, Cheshire, WA3 6AS UK
This paper provides a view of the MONK criticality software package in terms of recentand current developments and future plans aimed at meeting the short and long-term needsof the code user community.
KEYWORDS: MONK, Codes, Software Development, Validation
1. Introduction Since the completion of MONK813, development ofthe package has continued aimed at the next major
This paper describes the main recent and on-going version, in line with the forward programmedevelopments to the MONK package and outlines the assembled as outlined above.proposed development programme for the next fouryears. This programme comprises a mixture of the 2. Recent and On-going Developmentscontinuation and further evolution of some currentactivities, a selection of well-understood new The recent and current developments cover a rangeactivities and more general broad directions to be of areas of activity and are presented below under thefilled out by specific activities as we move forward. following seven headings: Physics Modelling,
The Monte Carlo code MONK is a well-established Geometry Modelling, Source Convergence, Nuclearcriticality tool with a proven track record of Data, Validation, Supporting Tools and Customerapplication covering the whole of the nuclear fuel Services.cycle. The development of MONK is performed andmanaged within NCD (Nuclear Codes Development), 2.1 Physics Modellinga collaborative arrangement between Serco Assurance For many years, MONK has used a module called(as part of its ANSWERS Software Service) and DICE for its nuclear collision processing, togetherBNFL. with DICE format nuclear data libraries. These
The MONK package comprises not only the Monte libraries exist from various sources TKNDL, JEF2.2,Carlo code itself but also nuclear data libraries, ENDF/B-Vl, JENDL3.2) and store the nuclide cross-validation data, documentation, geometry model sections on a fixed hyperfine energy grid of 13,193visualisation tools, productivity tools of various kinds groups. The neutron collision processing comprises aand user support services. In identifying the continuous energy and angle treatment of thedevelopment direction for the package, input is neutron/nucleus interactions.obtained not only from the two collaborating partners The DICE module has served the MONK code wellbut also from others customers of the ANSWERS for many years (and is also used in the ANSWERSSoftware Service. Indeed such input is welcomed and general transport code MCBEND1)) and has provenactively sought such that a balanced programme is itself to be reliable and robust in practical industrydefined, and one that meets industry application application. However, as part of a wide programme ofneeds. The development programme also seeks to regeneration and renewal, a replacement modulemaintain a balance between short-term and longer- (internal name BINGO) has been under development.term requirements and small and larger developments. The aims of BINGO have been threefold:An example of how this is managed is the system of 0 to further improve the underlying physicalLong-Term Technical Requirements that has been realism available in MONK for both criticalityestablished by NCD to ensure more substantial and and reactor physics applications;longer-term developments are sufficiently well a to develop and document a modem package inrepresented in the programme. keeping with modem software language
The current production version of MONK is capabilities;MONK8B, issued in December 2001. MONK813 was 0 to provide a major development programmea relatively minor upgrade to the major new version that would facilitate the development of keyMONK8A, the latter release bringing the major skills in the younger generation.enhancement of combining the previously separate The major physical realism benefits realised to datecriticality and reactor physics variants of the code. include: finer cross-section representation for key
Corresponding author, Tel. 44 1305 203260, Fax 44 1305 202194,E-mail: nigel.smith�sercoassurance.com
- 454 -

JAERI-Conf 2003-019
nuclides; improved variable temperature treatment; provide a particular generic geometry type, the Userenhanced thermal scattering modelling; better Hole provides a means by which a MONK user canrepresentation of ENDF correlated energy/angle laws; effectively provide a geometrical definition of a newand more detailed representation of the off-peak parts hole type. The input is in terms of simpleof the fission spectrum. mathematical functions - the output is a custom-build
The BINGO module in MONK is now undergoing geometrical option for your particular need. Examplefield testing in readiness for its formal release. applications to date include multiple interlockingFurther details can be found in a companion paper spiral ducts (See Figure 1), innovative fuel elementpresented at this conference. 2) grid designs and irregular waste packing
configurations.2.2 Geometry Modelling2.2.1 Fractal Geometry
The MONK geometry modelling packagecomprises two complementary components: FractalGeometry, employing conventional 'ray tracing'algorithms through defined geometrical bodies, andHole Geometry, using the powerful and versatileWoodcock Tracking.
MONK has a particularly rich set of ray tracingoptions, with a large selection of body shapes and anumber of combination options linked to applicationrequirements. A further development has now beeimplemented however, that of the Window Part.
A MONK geometry model is constructed asgeometry hierarchy, with small components beingcombined to form larger items, and these larger itemsbeing themselves combined, and so on. At present,the hierarchical relationship demands that the outershape of a combined set of items itself matches one ofthe MONK body shapes. For the Window Part thisrestriction is removed, providing yet more flexibilityof construction for the MONK modeller.
As an example of the additional capabilityprovided, the new Window Part has proven itself to behelpful in simplifying models of transport flasks and Fig.1 Example of the new hole option to producestorage containers subject to internal local variations concentric coiled ventilation ductsdue to potential damage caused by impact.
2.2.2 Hole Geometry 2.3 Source ConvergenceThe Woodcock tracking algorithm in MONK is a MONK uses its indigenous Superhistory Powering
powerful adjunct to the conventional body modelling method for managing the convergence of the fissionprovided by Fractal Geometry. Implemented via the source. This has stood the test of time well and hasHole Geometry package, Woodcock tracking brings proven its reliability and robustness in a number ofsignificant additional modelling power to the user, as difficult applications.well as providing convenient short-cuts to common There is current renewed interest in sourcemodelling situations. convergence issues with an OECD Expert Group 3)
Over the years, additional hole types have been being established to investigate and compare methods,added to MONK in response to particular industrial their strengths and limitations.needs and tis will continue as new requirements MONK has been used as part of this exercise and inemerge. A recent development has been a new bole parallel further developments are in progress for thetype to model Pebble Bed Modular Reactor (PBMR) code. The main new MONK developments so fartype fuel. This is a complex problem, given the quasi- have been initiated with two objectives in mind:random nature of the fuel distribution but is one well to introduce automation into the selection ofmatched to the Woodcock algorithm. This method the number of discounted neutron generationshas enabled MONK to be used to validate at the start of calculation (i.e. where the sourcedeterministic methods of PBMR fuel design and is transformed from the initial estimate to a fit-burnup. for-purpose approximation of the real
Another development has been to add a so-called distribution);User Hole to the set of available options. Rather than to introduce additional monitoring and
- 455 -

JAERI-Conf 2003-019
reporting so that should source convergence reported via extensions to the MONK User Manual.issues be suspected, the user is alerted in an Requests for additions the MONK validationeasy to understand manner. database are received from the user community and
The results to date have been encouraging, with the this drives the prioritisation of the database expansion.outcomes scheduled for the next release of MONK. In addition, an annually-updated summary document
is produced bringing together the extant validation2.4 Nuclear Data results and drawing broad conclusions with regard to
Part of the philosophy of the MONK package has accuracy for particular application types.been to provide the user community with choices.The underlying nuclear data used by the code is 2.6 Supporting Toolsultimately the determinant of the accuracy that is Whilst the Monte Carlo code itself is clearly theachieved. The representation of the data for use front line calculation component of the MONKwithin the code and the associated nuclear collision package, additional tools are also routinely used.models clearly also impact the accuracy to a These tools cover geometry model visualisation andsignificant extent (and this is being enhanced via the verification (VISAGE and VISTA) and calculationBINGO development described above), but the basic parameter control and job submission (LaunchPad).sources of nuclear data ultimately drive the accuracy. VISAGE and VISTA are mature codes in their own
In recognition of this, it has been the policy for right and development has continued to meetsome time to provide alternative nuclear data libraries additional customer requirements. The most recentfrom established sources, so that inter-comparisons developments have been focussed on improved three-can be readily performed. These inter-comparisons dimensional images via enhanced shading algorithms,can be used to provide additional confidence in certain new transparent filter options and the ability toapplication areas or can be used to investigate overlay a display of source regions. An example of auncertainties due to nuclear data. By keeping the VISTA image is shown below.underlying energy structure and collision processingsystem identical (the DICE module and library asdescribed above), the inter-comparison available withMONK is a true test of underlying data librarydifferences.
The MONK code is currently issued with fourcontinuous energy/angle libraries, bast, on thefollowing original sources: UKNDL, JEF2.2,ENDF/B-VI and JENDL3.2. The libraries havematching contents, currently containing over 160isotopes.
To facilitate inter-comparisons, the MONK inputfor material compositions has been made independentof the library used. Hence, a simple menu selectionfrom the MONK LaunchPad user environment (seeSection 26) will enable the same calculation to be runwith a different nuclear data library.
2.5 ValidationValidation remains an issue at the eart of
criticality code usage. Whilst improvements to theefficiency of the methods coupled with the seeminglynever-ending computer hardware enhancementsenable us to calculate ever more precisely, the realconcern remains accuracy, and to test accuracyrequires validation.
MONK has a well-developed and evolvingvalidation database that supports its use in practicalapplications. Many hundreds of experimentalconfiguration descriptions ave been taken from thehandbook of the International Criticality SafetyBenchmark Evaluation Project (ICSBEp4)) andquality-assured MONK models produced. Thesemodels are then computed using the range of nuclear Fig.2 Example of a VISTA image of a transportdata libraries currently available and the results flask
- 456 -

JAERI-Conf 2003-019
LaunchPad is a relatively new addition to the meeting the present and future needs of its myriadMONK package and provides a convenient tool to industrial activities, both in the UK and elsewhere.check, visualise and edit an input file, select major From these inputs, a programme is discussed,options (e.g. nuclear data library) and launch and reviewed, agreed and then implemented. In addition,monitor the progress of sets of MONK calculations. some flexibility is retained in the programme to copeFurther development of the LaunchPad concept is now with urgent issues that need to be accommodated.planned. A recent change to the formulation of the
Another new development, CODEMORE, has been programme has been the setting up of a system ofproduced to optimise the use of MONK on a network Long-Term Technical Requirements (LTTRs). Aof computers. This development has been particularly review of recent activities led to the conclusion that byhelpful for scoping calculations, where tens of the very nature of current application needs, thethousands of calculations have been performed by MONK development programme would tend to have amaking best use of a large network, taking due note of relatively short-term focus. The system of L'I7Rsthe power of the individual nodes of the network and was set up to encourage members of the partnertheir loading, and bringing together the results in a organisations to propose and champion longer-termconvenient form. ideas concerning the direction of development. Each
LTTR may be an individual development (but by2.7 Customer Services definition, one that would take significant resources to
The ANSWERS Software Service has now been in achieve) or just a particular desired outcome, that mayexistence for almost twenty years, with the service take one or more complementary developments tostarting in 1984 and MONK being incorporated in reach. The champion of each LTTR is then1987. During that time, the service has continued to responsible for overseeing the item as it progresses,evolve and develop to meet the expectations of its inputting requirements as appropriate and ensuringcustomers as their needs have changed and new that the desired outcome is obtained. Although arequirements emerge. relatively new process, the LTTR system has already
Recent changes to the service have included: produced a broader focus to the overall development• Increased use of the internet for distribution of programme and led to more widely supported generic
software and documentation, including the development themes.development of a password-protected customerarea; 3.2 Development Plans
• Adoption of a commercial standard software Section 2 of this paper described both recent andlicensing system, for increased flexibility and on-going developments for MONK and theease of use; development of the code package over the next four
• Adoption of a commercial help-desk system, to years is envisaged to include further work on some ofenhance the tracking and reporting of customer those items already discussed:enquiries, and to make available to help-desk 0 Completion of the BINGO module and itsstaff customer and code-specific historical data validation, followed by its release to customersto improve the delivery of the service at the as part of a new version of the MONK packagepoint of delivery; (MONK9);
• Extension of the standard system platforms 0 Further evolution of the geometry modellingsupported to cover PC Windows and Linux, in capabilities, to reflect the changing industryaddition to various Unix workstations. needs (e.g. new fuel designs, waste
optimisation);The business world continues to change at a rapid 0 Finalisation of the source convergence
rate and by maintaining close relationships with its developments into a fit-for-purpose algorithm,customers, the ANSWERS Software Service will backed up by clear supporting guidance;continue to strive to provide codes and services that 0 Additional nuclear data libraries, in response tomatch the needs and expectations of industry. developments in that area. For example, a
MONK library incorporating some JEFF33. Future Plans evaluations has already been produced for
testing purposes;3.1 Formulation of the Development Programme 0 Extensions to the validation database;
The development programme for MONK is formed 0 Improvements to the established supportingfrom a number of inputs. As collaborators in the tools and the development of new tools;development, Serco Assurance and BNFL both 0 Further extension and refinement to thecontribute requirements. Serco Assurance's ANSWERS Software Service itself.requirements are derived from discussions with itscustomers, coupled with foresight regarding emerging In addition, new items have been outlined and workgeneric needs or issues. BNFL's input is focussed on has commenced in certain areas.
- 457 -

JAERI-Conf 2003--019
A new supporting utility ModelBuilder is in envisaged, by inclusion of a geometrical sensitivityproduction. ModelBuilder is a fully interactive option (similar to that used in MCBEND) and by theMONK model construction tool, with real time development of an uncertainty module, which wouldvisualisation and checking. The new tool will not automatically combine sensitivities and cross-sectiononly be used to construct new models, but advantage uncertainties to yield total k-effective uncertainties.will be taken of the MONK input structure to facilitate Nuclear data will also remain at the forefront of thethe use and re-use of the large investment in existing development programme. Within the UK, JEF2.2 hasmodels. An example of the ModelBuilder prototype been adopted by a number of organisations as auser image is shown below: 'standard' source of data for many applications
(including criticality). For MONK, we have alsomade available other libraries, both to represent theinterests of other customers and to provide the usefulcross-check capability described above.
As developments in nuclear data are progressed, itis the intention that MONK will provide newcapabilities as and when appropriate. The JEFFproject continues to move forward and a provisionsversion of the JEFF3 library is being assessed withinthe collaborating countries. MONK is being use aspart of this activity. Libraries for MONK to evaluatefor criticality purposes the major changes to this (andother) libraries will continue to be produced as part ofour development activities. However, it is recognised
RUM that, due to the potential safety case updateimplications, major changes to something as
Fig.3 Example of a prototype ModelBuilder screen fundamental as the standard MONK nuclear datalibrary should appear only at relatively infrequent
Another development that has recently commenced intervals, unless major errors or limitations areis the Integrated Scoping Tool. As mentioned earlier, uncovered. Hence decisions on the adoption ofthe use of MONK for system scoping purposes on a additional standard libraries will be taken innetwork of computers has recently been facilitated by consultation with those stakeholders most affected.the use of the package CODEMORE. For use of thecode on a single machine, large-scale soping studies 4. Conclusioncan be overly time-consuming. Prototype This paper hassurnmarised the current status of thedevelopments have already commenced aimed at MONK code, outlining recent and on-goingintegrating a deterministic flux solution algorithm developments and envisaged directions for the future.from the WIMS5) code with the MONK geometry MONK continues to be focussed on meeting thepackage, thereby providing a 'single model-multiPle current and future needs of its customers and thesolution method'capability. This will provide the user programme is assembled from such stakeholder input.of MONK with the option of a rapid deterministic tool In addition, we look forward to new requirementsfor soping and survey purposes, but one that retains emerging over the coming years that do not yet featurethe same geometry description used by the definitive in the envisaged programme, and it is intended thatMonte Carlo calculation. sufficient flexibility will be retained in the planning
Uncertainty analysis remains an important and implementation processes such that these itemsconsideration for criticality assessment and sensitivity can be agreed and accommodated as appropriate,methods have a potentially important role to play.MONK813 contains an option that enables the code tocalculate the sensitivity of k-effective to uncertaintiesin cross-section values. These uncertainties can be forparticular energy ranges, specific reactions, r Acknowledgernentsspecific nuclides in one or more materials. Material The authors wish to acknowledge the otherdensity sensitivities can be obtained by considering members of the MONK package development team:the whole energy range for each reaction and nuclide Adam Bird, Christopher Dean, Geoff Dobson,in a material. This option has already been used to Malcolm Grinistone, David Hanlon, Chris Maidment,good effect to investigate the sensitivity of calculated Ray Perry, Ted Shuttleworth, Toby Simpson, GeorgeMONK result to uncertainties in the cross-sections o Wright (all Serco Assurance), David Bendall, Regrelatively unusual nuclides (i.e. ones not commonly Brissenden, Simon Connolly, David Dewar, Paulfeatured in significant quantities in validation Hulse, Richard Neal and Keith Searson (all BNFL).experiments). Further extension of this option is
458 -

JAERI - Conf 2003 - 019
References Convergence Benchmark Program: Overview and1) G. A. Wright, E. Shuttleworth, M. J. Grimstone Summary of Results", Proceedings of an
and A. J. Bird, "The Status of the General international Conference on Nuclear CriticalityRadiation Transport Code MCBEND," Safety, ICNC'03, Tokai-mura, Japan, Oct. 20-24Proceedings of an International Topical Meeting (2003).on Industrial Radiation and Radioisotope 4) OECD Nuclear Energy Agency, InternationalMeasurement Applications, Bologna, Italy, June 9- Handbook of Evaluated Criticality Safety14 2002). Benchmark Experiments", NEAINSC DOC(95)03,
2) S. M. Connolly and M. J. Grimstone, "The (2002).Development and Validation of a New Collision 5) T. D. Newton and J. L. Hutton, "'Me NextProcessor for MONK," Proceedings of an Generation WIMS Lattice Code: WIMS9,"International Conference on Nuclear Criticality Proceedings of New Frontiers of NuclearSafety, ICNC'03, Tokai-mura, Japan, Oct. 20-24 Technology, PHYSOR 2002, Seoul, Korea, Oct. 7-(2003). 10 2002).
3) R. Blomquist et al, "OECD/NEA Source
- 459 -

JP0450089JAERI-Conf 2003-019
Application of Distinct Element Method to Criticality Evaluationof MOX Fuel Fabrication Facility
Mikio SAKAI*, Toshihiro YAMAMOTO, Minoru MURAZAKI and Yoshinori MIYOSHIJapan Atomic Energy Research Institute
Shirakata-Shirane 24, Tokai-mura, Nakagun, baraki-ken319-1195, Japan
A criticality evaluation method considering granular flow is developed by coupling a DistinctElement Method simulation code with a continuous-energy Monte Carlo transport code to studythe affect of MOX fuel powder mixture to a criticality evaluation. Criticality evaluations areperformed under mixing the MOX fuel powder in a stirred vessel. The effective multiplicationfactors of the heterogeneous distribution of the MOX powder were compared with that of theuniformity distribution. The evaluation results revealed that the effective multiplication factorwith the uniformity condition was not exactly conservative.
KE YWORDS. MOX Fuel, Particulate System, Granular Flow and Distinct Element Method
1. Introduction power industry, the criticality evaluation of MOX(Mixed plutonium-uranium oxide fuel) fuel
Criticality evaluations in particulate systems fabrication facility needs to be reflected the MOXhave been carried out with regarding particulate fuel particle behavior A homogenization bendersystem as a homogeneous substance'. This evaluation operation is focused on the criticality evaluation. Incould satisfy when the evaluation objective was the homogenization operation, the MOX fuel powdersomething regarded as homogeneous or certain is agitated with another powders, and how lopsideddegree of uniformity. But this conventional method particle distribution affects the criticality evaluationcould be difficult to estimate how heterogeneous is one of important issues. To resolve this issue, weparticle distribution affect the criticality evaluation. have developed a novel criticality code by couplingAn appropriate granular flow model should be the DEM simulation code with a criticality evaluationincorporated in the criticality evaluation to overcome code. The DEM was applied as the granular flowthis difficulty. The criticality evaluations of model in mixing the MOX powder.particulate systems could not be done until The criticality evaluations have been carried outappearance of appropriate discrete particle models. under the solids mixing. We compared the effective
Recently multiphase flow models that can multiplication factor (kff) of the heterogeneousestimate granular flow have been suggested by some particle distribution with that of the uniformityinvestigators'-5 . The multiphase flow models for the distribution by using the novel coupling code.granular flow have been applied to various industrialparticulate systems, commencing with fluidized beds. 2. Criticality Evaluation of MOX Fuel PowderThe continuum model based on kinetic theory Mixture Processapproach and the Distinct Element Method (DEM)have been well used as the granular flow model. The homogenization blender operation that is
Such an appearance of the granular flow models the final operation of powder conditioning process ishas contributed to the development of criticality focused on the criticality evaluation of the MOX fuel
6evaluation. Pain et a]. has developed the FETCH fabrication facility. It is due to that this operation hascode, the coupled neutronics/multi-phase maximum total amount of MOX fuel powder in allcomputational dynamics code, and carried out the the operations. The powder conditioning processtransient criticality evaluation for a conceptual adjusts plutonium enrichment by loading/agitatinghelium-cooled fluidized bed thermal reactor. The not only MOX fuel powder but also Uranium dioxidekinetic theory approach was used as the granular flow (UO2) powder and Zinc Stearate (Zn-St, molecularmodel in this code. formula: [CH,(CH2)16CO012Zn) powder in a stirred
Extremely few criticality evaluation codes that tank. Agitating these powders causes granular flow incan treat particle movement were developed although the tank. The flow under regular operation isthere are various complicated subjects requiring classified into gas-solid flow including denseparticle dynamics for criticality evaluation. Taking granular media because the facility adopts drysingle example of particulate systems in nuclear operation method throughout overall processes.
*Corresponding author, Tel. 81-29-282-5398, E-mail: mikio-sakai�melodytokai.jaeri.go.jp
- 460 -

JAERI-Conf 2003-019
dx (1)
3. Granular Flow Model di
Pp d = VP + Pp (FC + FD)+ Pp9 (2)The DEM, that is one of Lagrangian approach, is di M
regarded as an epoch-making approach for dense F = , Fj (3)
granular flow, especially the particle where v is the particle velocity, pp is the density ofcontact-dominated flow. The particle motion is the particle, M is the particle mass and g is theinduced by the drag force and the trajectories of acceleration due to gravity, respectively. The contactindividual particles affected by the presence of other force is the sum of the force of normal direction (F.)particles and gravity. The discrete modeling has and tangential direction (F,) where n and t designates
4 nal and tangential direction.fashioned after Cundall and Strack's pioneering job . nonRelatively recently, Tsuji et al. have expanded this The normal contact force is written as Eq. 4),
model to include fluid drag effects. Fn = kbn - M, (4)When two particles collide, they actually deform. where k is the spring constant, is the damping
The overlap displacement is assumed in the DEM coefficient and Sis the particle displacement.as shown in Fig. I (a). The DEM is composed of a When the absolute value of tangential force isspring, a dash-pot and a friction slider as shown in less than the product of the normal force and particleFig. I (b). The DEM simulation demands large friction coefficient, the tangential component of thecalculation load for industrial processes due to contact force is given by Eq. (5). When the tangentialLagrangian approach that can trace all particles in a force surpasses the product, it is given as Eq. 6).system. Besides, over billions of particles are needed F, = -W - v, IF, I <#IF. 1 (5)to simulate the industrial processes, although at mostone million particles can be calculated by using latest F, = -#IF,, I V, lIv, I IF, I > plF. 1 (6)PC. Therefore similarity models have been suggested
M7,8to resolve the fatal proble 3.2 Fluid Motion
The DEM formula and the incorporated models Following the analyses of Anderson and9in the simulation are addressed below. Jackson the continuity and momentum equations for
the fluid phase can be written in terms of locallySt averaged variables as
a--Pf + V (Cpf U)= 0 (7)at
acpf U + Vkpf Ual (8)= - eVP - FD + epf g + V -(WVU)
FD = 6(m - V) (9)
1 where is the void fraction, pf, u and P are fluiddensity, fluid velocity and pressure, respectively. isthe fluid-particle interaction coefficient, which isgiven by Ergun's equation's for the dense region and
(a) Displacement of two particles in contact the equation derived by Wen and Yu" for the diluteregion.
df)[15�1-E)+I.75Rep1 c<0.8)d2e
Dash-pot (TI) j6 3 P AL!�E_2.7 Re (10)-CD 2 p (e > 0.8)4 dp
c on The drag coefficient for an isolated particle
Spfing (k) depends on the particle Reynolds number (Rep) as Eq.(I 1).
(b) Spring-damper system to contact force 0.68724(1+0.15Rep )/Rep (Re, <I 000)Fig. Contact Force Model CD 0.43 (Rep > I 00) O )
3.1 Particle Motion the instantaneous Rep Iv - ulpf e dpIn the DEM simulation, (12)
velocities and positions of the particles are to becalculated by taking account of the sum of the fluiddrag force (FD), the contact force (Fc) and the gravity 3.3 Similarity Modelacceleration as The representative particle model (RPM)
- 461 -

JAERI - Corif 2003- 019
7suggested by Kuwagi et a] . was known as one of the the particle distribution into the criticality evaluationsimilarity models and used widely 7, ". The motion of exactly. The kff was evaluated by giving crossthe group of small original-particles is assumed to be sections as well as the data of the atomic numbercalculated by using large model-particles in the RPM. density.
As a tentative condition, 115 kg of MOX3.4 Model of the Particle Shape powder, 6.4 kg of Zn-St powder and 206 kg Of U02In performing the criticality evaluation, the volume powder were loaded into the stirred tank. Thesefraction of solid is one of most dominant parameters. powders were stacked in layers at the initial conditionWhen particle shape is assumed as an ideal as illustrated in Fig. 4 To investigate the affects ofmono-sphere, the volume fraction becomes the range the heterogeneity of the solids mixing to theof approximately 55% at random loose packing' 3 to criticality evaluation, three mixture conditions, that isapproximately 64% at random close packing". initial condition, the mixture condition with agitatingMiyoshi et a]. 1 5have carried out the criticality for 20 sec and the uniformity condition, were chosenevaluation by assuming the bulk density of MOX fuel and compared with these effective multiplicationpowder as 2800 (kg/m 3), i.e. the volume fraction was factors.approximately 25%. The shape of MOX particle isextrapolated as one of reasons that the volume DEM Simulation
fraction of MOX particles is smaller than that of the Boundary Grid on guratmono-spherical particle. Fig. 2 designates the SEM Condition Generation of a Stirred
micrograph of the MOX particle. The shape of theMOX particle is rough and far from sphere. To reflectthe shape effect of the MOX fuel particle into the C F
DEM simulation, the particle diameter and thecontact diameter should be set separately. The contact Analysis Result
diameter should be adjusted that the maximum Particle distribution, etc
packing limit equals to that of the experimental value. I
Converter
Criticality Evaluation
Atomic Numb Ssr en
Density in each �0] e.Crtin on
Monte Carlo Transport Code
Multiplication Factor
Fig. 3 Procedure of the criticality evaluation
Gas hase Air)Fig. 2 SEM micrograph of the MOX particle
4. Strategy of the Criticality Evaluation
The criticality evaluation under mixing the creW
MOX fuel powder in a conceptual tank has been
carried out by coupling the DEM simulation code and
the Monte Carlo transport code MCNP. The criticality
procedure is shown as Fig. 3.
In this criticality evaluation, the conceptual
agitated tank is used as illustrated in Fig. 4 The DEM
simulation was performed to calculate the spatial solid c S
distribution of each particle, i.e. the volume fraction
of each phase. The volume fraction was converted to
the atomic number density via the converter. The
atomic number density was transferred strictly to the
divided domains of the criticality evaluation to reflect Fig. 4 Schematic ofthe DEM simulation
- 462 -

JAERI-Conf 2003-019
4.1 The DEM Simulation ConditionsThe conceptual tank dimension was illustrated in 01207
Fig. 5. The vessel whose shape was inverted corn had k� N
a screw rotated at 30 rpm. The conditions of theDEM simulation are shown in Table .
All the particles were assumed to be thespherical body whose size was 400 m. As far as theMOX fuel particle and the U02 particle areconcerned, the original particle diameter and thecontact diameter were set separately to consider theparticle shape. The contact radius of MOX particleand U02 particle was set 500 gm by assuming thatthe volume fraction of those powders were 32 atthe maximum packing limit. The particle sizedistribution was not assumed but mono size sphericalparticles were applied in the simulation. The densityof the MOX fuel particle were calculated based onthe assumption that the P02 enrichment was 50 w%, Side View Ton View
and the Pu isotopic vector were239PU/240PU/241 Pu=71/17/12 (wt%). The density of Fig.5 Dimension of the conceptual stirred tank
U02 particle were calculated assuming that theuranium isotropic vector was 25 U/ ... U=0.71/99.29 4.2 The MCNP Conditions(wt%). The density of Zn-St was measured by the . The criticality evaluations reflecting the particleliquid displacement method at room temperature. distribution in the initial condition, agitating for 20Serni-eMpiTical values were applied to the other sec and uniformity condition have been carried out toparameters (The coefficient of restitution is used for compare these effective multiplication factors. kffdetermining the coefficient of viscous dissipation). was evaluated based on the atomic number densityThe particle-particle adsorption was not assumed in analyzed by the DEM simulation. The conditions ofthe simulation. The RPM9 was applied to the the criticality evaluation by the MCNP code aresimulation with the similarity rate 25 times since too shown in Table 2.numerous particles were needed in using the actual The criticality evaluation model was illustratedsize particle. in Fig. 6 The criticality evaluation domain was
The fluid in the vessel was air and the physical divided into 720 A water reflector (25mm-thickness)property at 300 K was used in the simulation. The was attached to the stirred tank sidewall to take intofluid was assumed to be inviscid and its flow was account of the neutron reflections by surroundings.solved taking into account the interaction between The volume fraction calculated by the DEMparticles and fluid. simulation was converted to the atomic number
density via the converter, and Mreover the atomic
Table Conditions of the DEM simulation number density was transferred strictly to the dividedParricle domains of the MCNP cells. P02 enrichment of the
Spring Constant 30,000 (N/m') MOX fuel (PU02/(PU02 +UO2)) was assumed to beRestitution Coefficient 0.80 50 wt% and the plutonium isotopic vector assumed to
be 231pU/240pU/241 Pu=71/17/12 (wt%). The UraniumFriction Coefficient 0.15 isotropic vector assumed to be the same as the natural
Particle Contact abundance , 23SU/IIIU=o .71/99.29 (wt%).
Diameter MOX 400 gm 500 gm The criticality evaluation was carried out by(Mono-sphere) Zn-St 400 m 400 m using a continuous energy Monte Carlo code
U02 400 gm 500 m MCNP4C 16 and a point wise cross section libraryMOX Particle Density 11,213 (k g/M3) JENDL-3.2" and ENDL-92.
Zn-St Particle Density ],I 00 (kglm')
Table 2 Conditions of the criti lity evaluationU02 Particle Density 10,960 (kg/m')
MOX 115 (kg)Similarity Ratio x 25
Total 66,640 Mass Zn-St 6.4 (kg)
Particle number Mox 19,600 (115 kg) U02 206 (kg)
(Applying the RPM) Zn-st 11,200 6.4 kg) Neutrons per generation 10,000
U02 35,840 206 kg) Total generation nurnber 300
Fluid Skipped generation number 100
Density 77 1.176 (kg/m') Cross section library Atoms except Zn I JENDL-3.2
Viscosity 18.62 x I " (Pa s) Zn T�rNDL-92�
463 -

JAERI - Conf 2003-019
Water Reflection eventually.The results of MCNP calculations are shown in
Table 2 The kff in the mixture condition of agitatingthe powder for 20 see was higher than the otherconditions. On the contrary, the kff with theuniformity mixture condition was lower than all theconditions. It was extrapolated that spread of theZn-St powder and expansion of the MOX layer madethe kff increase. The Zinc Stearate includeslightweight atoms as H, C and so that it played asmoderator when it spread to the MOX layer due to
TER the solids mixing.These results revealed that the multiplication
Vertical Section Cross Section factor could not become maximum when the powderdistribution was unifon-nity.
Fig. 6 Criticality Evaluation Domain The keff depends on the amount of powders, thepowder layout order, etc, that are correlated to the
5. Results and Discussion flowability of powder. We continue to investigate the
correlation between the solids mixing and theThe result of the DEM simulation is illustrated criticality evaluation.
in Fig. 7 The interface of the powders was nothorizontal during mixing as shown in Fig. 7 (a). Table 3 kff of each analytical co itionWhen the powders were agitated for 20sec, small Initial Agitation Uniformityamounts of Zn-St powder were spread to the MOX Condition condition time 20 see Conditionpowder layer as designated in Fig. 7 (b). Fig. 7 (c) keshows the volume fraction of all the powders in each 0.64 0.65 0.48
condition. This results implied that the volumefraction become approximately 30% 35%
(a) verview
�M ll�'
...... .....
(b) Vertical Section
U"I000
!Phillips
0 mo
000.)(c) Volume Fraction
Inithil Condition Agitation time 20 see Uniformity condition
Fig. 7 DEM simulation results
- 464 -

JAERI-Conf 2003-019
6. Conclusion Mechanical Description of Fluidized Beds,"Industrial and Engineering Chemistry
We've been successful in performing the Fundamental 6 4) 527 1967)criticality evaluation considering the particle 10) S. Ergun, Fuid Flow Through Packeddistribution by coupling the DEM simulation code Columns," Chemical Engineering Progress, 48 89with the Monte Carlo code. This novel method has (1952)made possible to investigate how the particle I 1) C.Y. Wen and Y.H. Yu, "Mechanics ofdistribution affects the criticality evaluation of the Fludization," American Institute of ChemicalMOX fuel powder mixture. The analytical esult Engineers, Chemical Engineering Progressclarified that the effective multiplication factor never Symposium Series, 62, 610 1966)become maximal in the uniformity condition. 12) Y. Kaneko, K. SakakUTa and T. Shiojima,
"Numerical Analysis of Particle and Gas BehaviorsAcknowledgement in a Helical Ribbon Agitator Using
Three-dimensional DEM Simulation," ProceedingsThis work includes the results of entrustment by of the 81h SCEJ Symposium on Fluidization, 398
the Ministry of Economy, Trade and Industry of (2002)Japan. The authors would like to acknowledge Dr 13) GY. Onoda and E.G. Liniger, "Random LooseHiroshi Takeda of RFLOW Co., Ltd. for his valuable Packings of Uniform Spheres and the Dilatancycomments during the preparation of this manuscript. Onset," Physical Review Letters, 64 22) 2727We also would like to thank Mr Fumio Sakata of (1990)Japan Nuclear Cycle Development Institute for 14. G.D. Scott and D.M. Kilgour, "The Density ofgiving us the SEM micrograph of the MOX particle. Random Close Packing of Spheres," British
Journal of Applied Physics, 2 2) 863 1969)References 15) Y. Miyoshi, T. Yamamoto and K. Nakajima,
"Simplified Estimation of Criticality Accident of1) nternational Handbook of Evaluated Criticality MOX Powder Fuel," AERI Research 2002-002,
Safety Benchmark Experiments, NEA/NSC/DOC Japan Atomic Energy Research Institute, 2003)(95)03, September 2002 16) J.F. Briesmeister, Ed., "A General Monte Carlo
2) D. Gidaspow, "Multiphase Flow and Fluidization: N-Particle Transport Code Version 4C,"Continuum and Kinetic Theory Descriptions, LAI 3079-M 2000)Academic Press (I 994) 17) K. Kosako, F. Maekawa, Y. Oyama, Y. Uno and
3) Lun, C.K.K., S.B. Savage, D.J. Jeffrey, N. H. Maekawa, "FSXLIB-13R2 A ContinuousCheparney, "Kinetic Theories fir Granular Flow: Energy Cross Section Library for MCNP Based onInelastic Particle in Coette Flow and Slightly JENDL-3.2," AERI-DatalCode 94-020 1994)Inelastic Particles in a General Flow Field,"Journal of Fluid Mechanics, 140, 223 1984)
4) Cundall. P.A. and O.D.L. StTack, "A DiscreteNumerical Model for Granular Assembles,"Geotechnique, 29, 47 1979)
5) Y. Tsuji, T. Tanaka and T. shida, "LagrangianNumerical Simulation of Plug Flow ofCohesionless Particle in a Horizontal Pipe,"Powder Technology, 71, 239 1992)
6) C.C. Pain, J. L.M.A. Gomes, M.D. Eaton, C.R.E.de Oliveira, A.P. Umpleby, A.J.H. Goddard, H. vanDam, T.H.J.J. van der Hagen and D. Lathouwers,"Space-Dependent Kinetics Simulation of aGas-Cooled Fluidized Bed Nuclear Reactor,"Nuclear Engineering and Design, 219, 225 2002)
7) K. Kuwagi, H. Takeda. and Horio, "RepresentativeParticle Model: A Novel Method for Large-ScaleDEM Simulation," Proceedings of the 81h SCEJSymposium on Fluidization, 398-405 2002)
8) M. Kazari, K. Roko, T. Kawaguchi, T. Tanaka, Y.Tsuji, "A Study on Conditions for Similarity ofParticle Motion in Numerical Simulation of DenseGas-Solid Two Phase Flow," Proceedings of the2nd. International Conference on MulliphaseFlow '95-Kyoto, FB2-9 1995)
9) T.B. Anderson and R. Jackson, "A Fluid
- 465 -

JAERI-Conf 2003-019 JP0450090
MORIET: Version 4.BA Multigroup Monte Carlo Criticality Code
Olivier JACQUET*, Joachim MISS, G6rard COURTOIS"Institut de Radioprotection et de Sfiretj Nucliaire (IRSN), BP 17, 92262 Fontenay-aux-Roses, France
MORET 4 is a three dimensional multigroup Monte Carlo code which calculates theeffective multiplication factor (keff) of any configurations more or less complex as well asreaction rates in the different volumes of the geometry and the leakage out of the system.MORET 4 is the Monte Carlo code of the APOLL02-MORET 4 standard route ofCRISTAL, the French criticality package. It is the most commonly used Monte Carlo codefor French criticality calculations. During the last four years, the MORET 4 team hasdeveloped or improved the following major points: modernization of the geometry,implementation of perturbation algorithms, source distribution convergence, statisticaldetection of stationarity, unbiased variance estimation and creation of pre-processing andpost-processing tools.
The purpose of this paper is not only to present the new features of MORET but also todetail clearly the physical models and the mathematical methods used in the code.
KEYWORDS. Monte Carlo code, simulation, perturbation, stationarity
Transoort caskniodelin
1. Introduction a To treat the overall heterogeneity and geometricalcomplexity with 3D Monte Carlo tracking without
MORET is a multigroup Monte Carlo neutronics wasting computation time in treating local detailscode developed by IRSN to perform criticality since they have been taken into account in thecalculations. previous step.
It has been used for the last thirty years for most of In the framework of the standard route ofcriticality-safety studies in France and is now widely CRISTAL'), the MORET 4 code is used inused by the French criticality safety community conjunction with the deten-ninistic assembly code(IRSN, CEA and French nuclear companies). APOLL02 and with the CEA93 library 172 groups
The MORET code has been designed in order to structure from JEF2.2 nuclear data library).obtain accurate calculations of effective multiplication The new 4.13 version of MORET takes benefit fromfactors for complex geometries in a reasonable this successful experience and brings furthercalculation time. It is thus especially well suited for enhancements to the physics and to the engineering ofrequirements of criticality surveys performed for fuel the code. Many developments were performed in thecycle facilities and plants and for fissile material last few years in order to still better help users to carrytransport packaging, which usually requires many out criticality safety analyses: modernization of thecalculations. geometry, implementation of perturbation algorithms,
The efficiency of the MORET code is based mainly source distribution convergence, statistical detectionon the powerful association of deterministic and of stationarity, unbiased variance estimation andMonte Carlo approaches, namely: creation of pre-processing and post-processing tools.o To treat the local heterogeneity that could be This paper presents not only the innovations but
represented in simple ID or 2D cells by also the whole characteristics of the physical anddeterministic methods Pj or S and to apply mathematical models implemented in the code.related models for self-shielding and possiblyhomogenisation.
Corresponding author, Tel. 33-1-58-35-89-15, Fax. 33-1-46-57-29-98, E-mail: olivier.jacquet�irsn.frG. COURTOIS died on January 2003.
- 466 -

JAERI-Conf 2003-019
2. Physical Models and Mathematical Methods e uniform distribution of a specified number ofsource neutrons in specified fissile volumes,
2.1 Simulation strategies e automatic sampling of starting points in all fissileFive strategies are available in the MORET 4 code: volumes, by generating the same number of
the conventional method, the stratified sampling�', the neutrons in each volume and by uniformlysuper-history powerin g3), the use of fission matriX4) distributing them in each volume.
6)and the use of importance function",The common principles of all the strategies except 2.3 Neutron tracking
for the superhistory powering are: The life of a neutron is a succession of separated• each cycle comprises only one generation: the events in space: birth, elementary motion, collision,
starters of one generation are simulated one at crossing of surfaces, leakage or absorption.the time from their 'birth' to their 'death' The energy group of the starting neutrons is drawn(absorption or leakage) and their progeny is randomly from the fission spectrum of the mediumsimulated during the next cycle, supplied by the APOLL02 code. The motion direction
• each collision site in a fissile volume is of the starting neutrons is drawn randomly from aconsidered as a potential fission site; the uniform angular distribution.probable nmber of produced neutrons and the If the distance to the closest surface in the directioncoordinates of the collision point are stored, of the neutron is smaller than the probable distance to
• the positions of the starters of the new cycle are the next collision drawn randomly, the neutron leavessampled among the collision sites of the the volume otherwise a collision takes place.previous cycle, If the neutron leaves the volume and enters a new
• since the progeny is not considered, the number one, a new probable distance is drawn randomly,of simulated neutrons is equal to the number of accounting for the different material environment. Thestarters, which is kept constant at each cycle. direction of motion is kept the same.
In the case of the superhistory powering: If the neutron reaches one of the outer boundaries• each cycle comprises L generations: the starters of the system, depending on the type of boundary
of the fst generation of the cycle and their conditions, it can be reflected or leak out. If theprogeny are followed one at the time from their neutron leaks out of the system, the neutron 'dies' and'birth' to their 'death' (absorption or leakage), the tracking is stopped.
• each absorption site in a fissile volume during If a collision takes place, the choice betweenthe last generation of the cycle is considered as absorption and scattering is randomly determined.a potential fission site; the probable number of In the case of scattering, the (nxn) reactions areproduced neutrons and the coordinates of the accounted for by introducing a weight to the neutronabsorption point are stored, - which is increased at each collision by the factor:
• the positions of the starters of the new cycle are + 2Z.,(.,2. 3.,(.,3.) +
sampled among the absorption sites of the last + 2.'(.,2.) + F(n,3.) +
generation of the previous cycle, with nm) being the cross section for the (nxn)• the number of starters is kept constant but the reactions.
number of simulated neutrons is variable at A new energy group is selected from theeach cycle since the progeny is considered. cumulative transfer probability distribution. This
These strategies differ from the point of view of the group-to-group transfer determines an angularestimation of the source distribution between the scattering distribution, usually expressed as acycles (see section 24). Legendre expansion of the cross section transfer array
Some of these strategies have been compared on a supplied by the APOLL02 code. According to themodified version of the configuration studied by order of expansion available, the MORET 4 code usesKadotani et al. (a x 5 x I array of metal spheres in one of the three following methods preserving thevacuum) in which the initial source is chosen to be far
7) moments of the Legendre expansion of the angularfrom the converged source distribution. scattering distributions):
They are currently tested in the framework of the * theCoveyousemi-linearmethod(PI),Expert Group in Source Convergence Analysis, which . the Lux semi-continuous method (M),
was set up by the NEA.8) 9 or the discrete angle method (P5 and higher).
2.2 Sources description In the case of absorption, the neutron 'dies' and theThe MORET 4 code provides three automatic tracking is stopped.
options to describe the first generation source2.4 Source distribution estimationneutrons:
punctual distribution (which requires specifying At each cycle, the number of neutrons is notthe coordinates of source neutrons, an operation rigorously renormalized to the initial number of
that may be tedious),
- 467 -

JAERI-Conf 2003-019
starting neutrons, Mo, but the total weight of the the reaction rates (collision, track-length andstarters is renormalized to Mo. absorption) and two cycle keff definitions:
At the end of a cycle, the proportions of neutrons * "source" keff = fission productions sources,Pv to be emitted in each fissile volume V are * "balance" keff = fission productions neutrondetermined in the following way: balance (absorption leakage - excess),
P = fission productions in V M, MORET 4 has 6 individual keff estimators, computedtotal fission productions as the average of cycle keff estimates at each cycle.
The fission productions are estimated either with In the case of superhistory powering, athe collision estimator (conventional strategy), or with supplementary keff estimator based on the absorptionthe track-length estimator (stratified sampling, use of estimator is used (average of fission productions atfission matrix and importance function), or with the each cycle average of sources).absorption estimator (superhistory powering). The All the keff estimators have the same expectedtrack-length estimator guarantees a non-null estimate value but not the same standard deviation. Thisof the fission productions in each fissile volume if at implies that, depending on configurations, a keffleast one neutron is emitted in each fissile volume. estimator can require more or less cycles than the
In the case of the use of fission matrix, the others to reach a fixed uncertainty. In other words, nocalculation of Pv differs from the usual way every N estimator is universally better than others.cycles (N is fixed by the user). In this case, the The linear combination of estimators allowsproportions of neutrons Pv to be emitted in each fissile creating a higher performance estimator whosevolume V are given by the components of the variance is equal to the minimum of individualeigenvector associated to the highest eigenvalue of the variances, in the worst conditions.fission matrix which is calculated all N cycles. Thus, the MORET 4 code evaluates:
The fission matrix is a square matrix of size the on each step, two combinations of three keffnumber of fissile volumes defined as follows: estimators (the combined "source" estimators andki = PjSj, Pj being the cumulative (over all the the combined "balance" estimators); the simulationcycles) fission production in fissile volume i due to stops when the minimum number of cycles isneutrons emitted in volume , Sj being the cumulative achieved and as soon as the standard deviation of(over all the cycles) weight of sources emitted in one of the available keff estimators is lower thanvolume j. Pj is estimated with the three combined the precision level wished by the user,estimators (collision, track-length, absorption). on the ultimate step, a more general combination
In the case of the use of the importance fction, of keff estimators (the 3 "source" estimators andthe fission productions are estimated with the track- 2 "balance" estimators: collision and track-length)length estimator but not in the usual way. The and of 2 control variables (neutron balancecontribution of a neutron bom in the; volume j and estimated with the collision estimator and themoving in volume i is multiplied by the ratio of the track-length estimator).importance of volume i over the importance of volumej. The estimation of the importance function is 3. New Features of MORETrenewed all N cycles (N is fixed by the user). It is theeigenvector of the highest eigenvalue of the adjoint of 3.1 Modernization of the geometrythe fission matrix. Since the first releases of MORET, the geometry
The number of starting neutrons for the next cycle has been described in a combinatory manner, viain a fissile volume V is: Mv = NINT(Pv). simple-shape convex elementary volumes (sphere,
In the case of stratified sampling, if Mv is null (i.e. cylinder with any direction axis, parallelepiped box,Pv < 0.5), Mv is set to 1, in order to have at least one cone with axis parallel to a reference axis, semi-solidneutron in each fissile volume. limited by a plane, prism with hexagonal section) and
If Mv differs from 0, all starters in volume V have geometric operators derived from the theory of setsthe weight Pv / Mv. (inclusion, intersection, union, penetration, truncation).
The Mv starters in fissile volume V are sampled The whole system is placed in an external volumefrom the potential fission sites (either collision sites or whose surfaces may totally or partly reflect theabsorption sites in the case of superhistory powering) neutrons.in volume V stored during the previous cycle. The Up to the previous version, only one rectangularprobability to pick a potential fission sites is array could be described in the geometry. Theproportional to its weight. description of hexagonal arrays is now available. As
The weights of all starters are possibly multiplied explained below, several arrays and arrays in arraysby the same correction factor in order to keep the total are now allowed thanks to the new modular geometry.weight of all starters equal to Mo. The modular geometry, implemented in2.5 Keff estimators MORET 4.13, allows to model more complex
An aspect that deserves a lot of attention is the geometries. It is based on the use of basic buildingestimator of keff.'O) Using the three usual estimators of blocks (parts of the whole geometry), called
- 468 -

JAERI-Conf 2003-019
,'modules", that can be embedded one in another (via 3.2 Implementation of perturbation algorithmsholes) to form sub-systems usable from one study to The correlated sampling method was implementedanother without modifications. The geometry of each in the MORET 4 code. This new feature allowssub-system is always described in a combinatory estimating during the same simulation the keff and themanner via simple-shape volumes. variation of the keff due to "low" perturbations of
Here are summarized the features of modules: chemical compositions, while not noticeably• There is one main module (numbered 0) for -the increasing the calculation time. The validity extent of
whole geometry (see examples Figure 1). this method is currently being studied.• The way of modelling the geometry within each A numerical and physical validation of MORET 4
module is unchanged compared to the previous perturbation calculations against 'Physical' typeversions. fission products experiments is exposed in a paper of
• Modules have their own local coordinates and can Anno et al. in this conference.")be used from one calculation to another withoutany modification. This is particularly interesting 3.3 Statistical detection of convergencefor users who can choose modules or add their The settling of the source distribution convergenceown modules in a common database. can require a very variable number of cycles during
• Modules can be embedded one in another without which the estimation of keff can be erroneous.any restriction via holes (keyword TROU: hole in The suppression of non-converged cycles isFrench). necessary to obtain an accurate determination of the
• Modules allow modelling several arrays, and keff confidence interval but the checking of the sourcearrays in arrays (one array per module) whereas convergence is a longstanding difficulty of Monteonly one array could be described with the Carlo calculations.previous versions of the code. Up to the last release of MORET, the user could
As illustrated in Figure 1, suppose sub-modules 1, check the convergence of the calculation only by the2 and 3 have been already modelled for the study I following different indicators:and stored in a database, the writing of the geometry a chi-square tests performed by the code to checkpart of the input file for the study 2 would consist in the normality of the distribution of the cycle keffpasting the description of sub-modules 1 2 3 and in (for each keff estimator),writing the following description of the main module: e the recalculation of the fal keff and its standardMODUle 0 deviation after the suppressing of a variable
TYPE I BITe 15. 10. 10. number of initial cycles,TYPE 2 BITe 2 2 2 * the plot of the distribution of the cycle keff inTYPE 3 SPHEre 3 order to be visually compared to the theoretical
VOLUme I 0 1 1 0. 0. 0. normal distribution (Figure 2,* Hole 1: in vol. 1, of type 2 filled with module 2 * the plot of the cumulative keff versus the number* at coordinates (-8.,5.,O.) of active cycles in order to visualize the presenceTROU I 2 2 -8. 5. 0. of an initial transient (Figure 3.* Hole 2 in vol. 1, of type 2 filled with module 2 N-h..fq� kW
* at coordinates (7.,O.,O.) Ito by
TROU 2 2 2 7 0. 0.* Hole 3 in vol. 1, of type 3 filled with module 3 In-It at coordinates (-5.,-5.,O.)TROU 3 3 3 -5. -5. 0.
17114N[odule 76
OR
Fe W EC W191161 10101 Folf 40
0 0 10101 30
0 0 In le0 0 Modul 0 10
IJW A45 1�0 I
mG A Iw 1.723 I9 1 " A" Im
Module I Module 2 Module 3 (made by wing Module 1) Fig. 2 Part of the postscript output file:
0 0 Comparison of the distribution of the cycle keff with
MO the theoretical normal distribution
Fig. I Example of modular geometries Statistical tests based on the Brownian bridgetheory have been implemented in MORET 4.B and itspost-processing tool (OPOSSUM) to automaticallysuppress the initial transient of the cycle keffseries. 12,13)
- 469 -

JAERI-Conf 2003-019
1.9"3 C.-Nd" ff ith a.2,(,=0, a:- 2p NP+1 N N -I)] and. ..... 003" a c�. 596
923 1 1INK186 I ( 2 N
2 P - i)a(i)N_I)Y(N
When the number of cycle N is about a fewCy.k. hundreds, a is very small and the number of iterations
0 66 igll� 160 210 260 31� 360 0 410 U 4 510 needed is very low: I or 2.F . art of the p stscript utp t file: An improvement of the method of Ueki et al.
Cumulative keff versus the number of active cycles consists in estimating directly the limit I of the
3.4 Unbiased standard deviation estimation sequence I = a -I + bVarious methods have been proposed to better take +�
into account the correlations between generations in uthe calculation of the standard deviation of any Monte N(N-1) N(N-1)
Carlo results (batching method, method of Ueki et al.,use of time series methodology... .14) One of the major difficulties of the method of I 'eki
At present, none of them gives really satisfactory et al. is the fact that al. can be negative! Indeed, due
results. Developments are still in progress in this area. to the uncertainties on the estimates 6(i) of the first p
Nevertheless, the method proposed by Ueki et al. autocovariance coefficients, the corrective termhas been chosen because, without a great effort ofadaptation, it gives a more realistic estimation of the 2 (N-i)E(i) can be negative and greater instandard deviation than the conventional method N(N - ) =1assuming no correlation. absolute value than &2
The principle of the method of Ueki et al. and the An adaptation has been made to the method of Uekiadaptations of the method are explained hereafter. et al. consisting in initialising the number p of
Let consider a cycle keff series of length N. autocovariance coefficients taken into account to Ueki et al. established the theoretical expression of and in decreasing p while y. is negative.
the bias of the conventional estimation of the variance
of the mean of the cycle keff series, denoted as 2 N-1 3.5 Creation of pre-processing and post-processing
B(,& = -�7(- - i)c(i) , toolsi=1 The new tools for the MORET code are written in
c(i) being the true autocovariance coefficients of the JAVA and are available on all environmentscycle keff series. (Windows, Linux, Unix).
Ueki et al. also established the theoreticalexpression of the bias of the conventional estimation 3.5.1 Pre- rcessing Tool EMof the autocovariance coefficients of the cycle keff EJM 13fis a text editor offering users the possibility
series, denoted as a i) , for the small values of i: to display the construction of their geometry at the
-al same time as they write it. Its principal panel isdivided into two parts: the left part is used to write the
CT' being the true variance of the mean of the cycle modelling of the geometry and the right one tokeff series. visualize it with various cuts (in the three directions)
Ueki et al. consider only the first p (p = lo) at various levels in real time.autocovariance coefficients, assuming that theautocovariance fimction c(i) quickly decreases to 3.5.2 Post-processing Tool OPOSSUMwhen the lag i increases. OpOSSUM13) is a post-processing tool allowing
The method of Ueki et al. consists in iterating the users to visualize the results of their MORET 4
estimation of the variance of the mean : calculations through graphs and curves and to2 P compare several calculations results. This new tool
-j�-( - i)c(i) will include three main features to help users toi=1 analyze the calculations results:
with c(i = a(i) for the first iteration and , a tool displaying the curves from the output data
C (i = i) + C2 for the next iterations. (cross sections, reaction rates, fluxes ... ,U 0 a graphical tool giving 2D representations of
So the successive estimates of the variance of the various tallied parameters (source distribution,mean with te method of Ueki et al. define a linear reaction rates) in the MORET geometry model,recurring sequence of order 1 cu,. = a u,, b 0 a statistic tool used to determine the well-done
stationarity of the Monte Carlo calculation.
- 470 -

JAERI - Corif 2003 - 019
3.5.3 Post-processing tool to assist code bias 5. Conclusionestimation
The three main ftinctionalities of this tool") are: This paper has introduced the main improvements• definition of the characterization's working implemented in the Monte Carlo code MORET 4.B.
database (user selected experiments), The "kits" approach for the geometry making is an• graphical visualization of a practical case among original way to improve the efficiency of users to
the experiments of the working database, build and verify their criticality safety models.• bias estimation with statistical uncertainty Future developments of MORET will particularly
evaluation. concern:a the diversification of the origin of cross sections,
4. MORET project * the development of source convergence criteria,At present, the MORET team regroups at least * the improvement of simulation algorithms to
persons for the development of the code and guarantee the source convergence,associated tools, verification, experimental validation, * the development of pre-processing and post-installation and user support. processing tools.
4.1 Software characteristics ReferencesMORET 4 is a modular code written in Fortran 90. 1) J.-M. Gomit et al., CRISTAL VI: "Criticality Package for
The routines are grouped in specific modules (physics, Bumup Credit Calculations", ICNC 2003.2) A. Mohamed, E.M. Gelbard, "Stratified Source-Sampling
mathematics or purely IT domains). The memory is Techniques for Monte Carlo Eigenvalue Analysis", Proc. Int.dynamically managed. Conf On the Physics of Nucl. Sci. and Tech., pp 152-159,
A software engineering tool, called PAPYRUS, Long Island NY, Oct. 1998.allows configuration management. 3) R.J. Brissenden, A.R. Garlick, 'Biases in the estimation of kff
and its effors by Monte Carlo methods", Ann. Nucl. Energy:Vol. 13 2, p. 63, 1986.
4.2 Verification and Installation 4) H. Kadotani, Y. Hariyama, M. Shiota, T. Takada, AccelerationAn extensive verification is done at each new of fission distribution convergence using eigenvectors from
development's step to validate the new fmctionalities matrix K calculations in the KENO code", Proc. CNC'91,paper 11-1, Oxford, Sept. 1991,
as well as the old ones. A verification database of 5) M.H. Kalos, 'Zero variance estimator for reactor criticality',more than 200 test cases is automatically launched on Top. meeting on new dev. in reactor phys. and shielding, Vol. ,each platform referred above (see section 41) and CONF-720901, 1972.then analysed. New test cases are added to this 6) A. Nouri, "ContributionsA la qualification du code Monte Carlo
Tripoli sur des experiences critiques et A 'dtude de 'interactiondatabase at each new development. neutronique entre unitds fissiles", PhD-thesis of the univ. Paris-
The same database of tests is used to demonstrate XI, Jan. 1994.that the software is properly installed and functioning 7) J. Miss, 0. Jacquet, A. Nouri, "Development and Comparisoncorrectly. of Monte Carlo Techniques Implemented in the MORET 4
Code for the Calculation of Loosely Coupled Systems', Proc.MORET 4 runs on various platforms: IBM (AIX), MC 2000 Conf, Lisbon, 71 .
SUN (Solaris), DEC (OSFI), HP (HP-UX), SGI 8) R. Blomquist et al., 'OECD/NEA Source Convergence(IRIX), PC (Windows and Linux). Benchmark Program: Overview and Summary of Results',
ICNC 2003.9) A. Nouri, A. Le Cocq, P. Reuss, "Anisotropy Treatment In
4.3 Experimental Validation Criticality Multigroup Monte Carlo Codes", Proc. PHYSOR 96,Within the scope of the French CRISTAL package, Mito, 1996.
the MORET 4 code undergoes an important 10) A. Nouri, J. Dupas, P. Reuss, L. Carraro, "Furtherexperimental validation program 16) with systematic Investigations on the Comparison and the Combination of
Monte Carlo k Estimators", Proc. Int. Conf On the Phys ofanalysis of critical experiment results from various Nucl. Sci. and Tech., Long Island NY, Oct. 98origins (experimental programs performed in Valduc II) J. Anno, 0. Jacquet, J. Miss, 'Validation of MORET 4facility, in the USA, in Japan ... ). The greater part of Perturbation against 'Physical' Type Fission Productsthese experiments is assessed by the ICSBEP working Experiments", ICNC 2003.
12) Y. Richet, 0. Jacquet, X. Bay, "Automatic Suppression of thegroup (International Criticality Safety Benchmark Initial Transient based on the Stationarity Detection usingEvaluation Project). Brownian Bridge Theory', CNC 2003.
13) L. Heulers et al., "The Graphical User Interface for CRISTAL4.4 Users Support VI", ICNC 2003.
14) 0. Jacquet et al., "Evaluation of the Uncertainty in EigenvalueA huge effort has been achieved to assist Monte Carlo Calculations, Using Time Series Methodologies',
MORET 4 users: Proc. MC 2000 Conf, Lisbon, 23-26 Oct. 2000, 703.• combined classroom and hands-one training, 15) F. Fernex, Y. Richet, E. Utang, "A MORET tool to assist Code• public and private access website with online Bias Estimation", ICNC 2003.
documentation (www.irsn.fi7/cristal 16) 1. Duharriel et al., Experimental Validation Of The APOLL02-MORET4 Standard Route of the French CRISTAL VI
• users hot line, forum and users club, Package", ICNC 2003.• bugs report, maintenance.
471 -
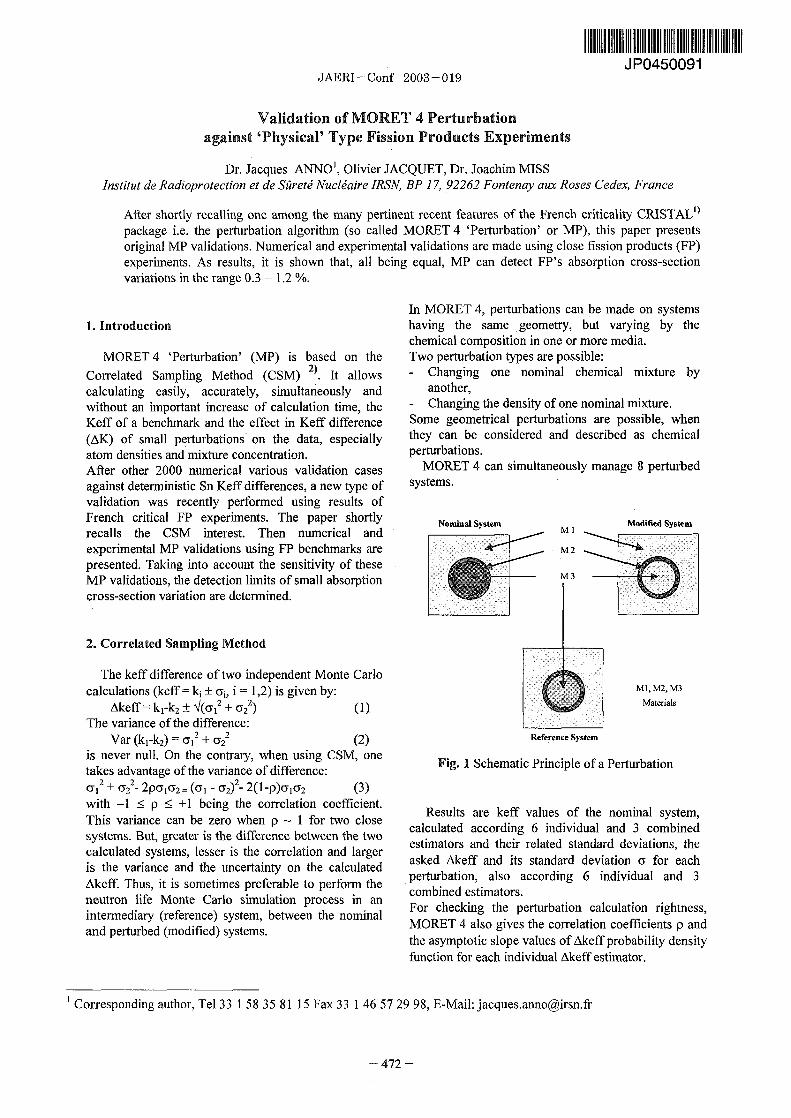
JP0450091JAERI-Conf 2003-019
Validation of MORET 4 Perturbationagainst 'Physical' Type Fission Products Experiments
Dr. Jacques ANNO1, Olivier JACQUET, Dr. Joachim MISSInstitut de Radioprotection et de Sfiretj Nucliaire IRSN, BP 17, 92262 Fontenay aux Roses Cedex, France
After shortly recalling one among the many pertinent recent features of the French criticality CRISTAOpackage i.e. the perturbation algorithm (so called MORET 4 'Perturbation' or MP), this paper presentsoriginal MP validations. Numerical and experimental validations are made using close fission products (FP)experiments. As results, it is shown that, all being equal, MP can detect FP's absorption cross-sectionvariations in the range 03 - 12
In MORET 4 perturbations can be made on systems1. Introduction having the same geometry, but varying by the
chemical composition in one or more media.MORET 4 'Perturbation' (MP) is based on the Two perturbation types are possible:
2) - Changing one nominal chemical mixture byCorrelated Sampling Method (CSM) . It allowscalculating easily, accurately, simultaneously and another,without an important increase of calculation time, the - Changing the density of one nominal mixture.Keff of a benchmark and the effect in Keff difference Some geometrical perturbations are possible, when(AK) of small perturbations on the data, especially they can be considered and described as chemicalatom densities and mixture concentration. perturbations.After other 2000 numerical various validation cases MORET 4 can simultaneously manage perturbed
against deterministic Sn Keff differences, a new type of systems.validation was recently performed using results of
French critical FP experiments. The paper hortly Nominal System Modified Systemrecalls the CSM interest. Then numerical and mlexperimental MP validations using FP benchmarks are M 2presented. Taking into account the sensitivity of theseMP validations, the detection limits of small absorption M 3cross-section variation are determined.
2. Correlated Sampling Method
The keff difference of two independent Monte Carlocalculations (keff ki ± ai, i = 12) is given by: Ml, M2, M3
Akeff = k,-k2 4(G12 + Y2 2) (1) MaterialsThe variance of the difference:
Var kl-k2) = CT] 2 + G2 2 (2) Reference System
is never null. On te contrary, when using CSM, onetak .es advantage of the variance of difference: Fig. I Schematic Principle of a Perturbation
CFI 2 CV22 - 2P(yl(72= ((Tl - CT2)2 - 2l-P)CF1U2 (3)
with -1 p +1 being the correlation coefficient. Results are keff values of the nominal system,This variance can be zero when p - I for two close calculated according 6 individual and 3 combinedsystems. But, greater is the difference between the two estimators and their related standard deviations, thecalculated systems, lesser is the correlation and larger asked Akeff and its standard deviation cy for eachis the variance and the uncertainty on the calculated perturbation, also according 6 individual and 3Akeff. Thus, it is sometimes preferable to perform the combined estimators.
neutron life Monte Carlo sulation process in an For checking the perturbation calculation rightness,intermediary (reference) system, between the nominal MORET 4 also gives the correlation coefficients p andand perturbed (modified) systems. the asymptotic slope values of Akeff probability density
function for each individual Akeff estimator.
Corresponding author, Tel 33 1 58 35 81 15 Fax 33 46 57 29 98, E-Mail: jacques.anno�irsn.fr
- 472 -

JAERI-Conf 2003-019
During the implementation of the perturbation only differ on FP concentration and on solution acidity.calculation in MORET 4 many numerical validation Others differ on FP nature in slightly acidic aqueouscalculations were performed: solution.- 500 during the preparation phase on various fissile
media, as U02 or P02, in crystal or powder tate, 3.2 Method
with 5 types of changing: density, isotopic, Thus the difference in water height AH, which is themoderation ratio, small thickness variation of a sub-critical approach parameter, is correlated to Kefffissile material, replacing small fissile thickness difference. With the relationships KF(H) and itsmaterial by water. derivative, it is easy to obtain mathematically the AK
- 1500 during the validity limits determination, by value resulting from AH, when changing a mixture withvariation calculations on the most encounteredcases in criticality calculations. Among them, IN another one for the same FP and the same geometry.
calculations cases were performed on critical Iexperiments, such as for determining uncertainties Keff
K Watetweights of the published LEU-COMP-THERM-05 Ole FP0 ......... ..................
benchmark compared against deterministic Watecalculation differences. Especially, it was shownthat MORET 4 Perturbation is a very convenient,accurate, efficient and fast toot to determine FPluncertainties weights and parameters sensitivities ofcritical experiments. F112
3. Experimental Validation
A He3.1 Data Base KT FPI ............ Z
(He Wm z JExperiment)IRSN has a large database of French experiments
3)made in Saclay and VaIduc . Recent Fission Products X FPI
4) W.I.,; Tangenteexperiments are very accurate Refer to this Slope - Keff A H
publication for the description and some results, whichprinciple is shortly described in the following Figure 2 H Water
(Driver Array)
H o- Level Measurentent Device He Water Ile FP2Hi R2 - 1- I A W
keff-F(H)
-Rod Driver Array Fig. 3 Keff Variation against H Water (DriverRod
0 When, H .-Upper Level Array) for the same Driver Array Geometry0] ofthe Fissile Zone0 -
C(/(1-keff) -FP Solutionin Zr Tank The Figure 3 displays the principle of the
tNeutron Count Rate C perturbation validation based on experimental
Lower Level exploitation of so-called 'physical type' experiments.Neutron Counter .... of the Fissile Zone Indeed, in the series of these 47 performed
Pedestalexperiments, many are related to the same geometrieswith the same FP. They exactly have the same number
Input and Output of rods in the driver array.Thus, for two different solutions FPJ and FP2 of the
Fig. 2 Sub-critical Approach Principle: At each water same FP, by using the critical heights differencelevel height H, neutron count rates C depend on Keff. H,2 - 1, = AHe, one can obtain AKeff knowing the
When Keff increases towards 1, I/C decreases to zero. value 5/5H at H,:Thus, the intersection with the abscissa of the AK 6K/6H) Hcl x AHc (4)extrapolated tangent of the curve I/C = F(H) from the 8K/6H is obtained by deriving the representativelast measured points determines the critical level H. function Keff, K = FH). This latter one is determined
by mathematical fit on independent MORET 4 keffcalculations (with standard deviation = 33.10-5) of the
In particular, experiments in the same driver array benchmark for various array water heights. For H, oneconfigurations (23x23-25 to 25x25-25, the latter 25 obtains: 8K/8H H = [5F(H)/8H1 H (5)rods being removed for making place to the centraltank) and the same fission product solution only differ Thus, the derivation method gives:by this fission product mixture in the central tank. They AK = [8F(H)/5H] Hcl x AH, (6)
- 473 -

JAERI-Conf 2003-019
Table I Results of Experimental ValidationIf AH is not too large, i.e. the tangent slope at the of MORET 4 Perturbation against FP critical
curve K = F(H) does not vary or slightly between H Experimentsand H,2, this AK calculation method is correct (seeFigure 3 If not, it is preferable to use the integral - Fl? case ��p (mm) AK Calculation I 0'3 P
between Hcj and Hc2, classically giving: - 1 2 3 4 5 6 7
CS05 CS10 49.95 612 652 691 0.99233
AK = I 8F(H)/8H] dH = F(H)H,,2 - F(H)Hcl (7). csO7 csO77 103.85 509 723 745 0.99210
csO77 csO7 -103.85 -670 -762 -747 0.99511
For example, the Figure 4 displays Keff variations CS09 cSl I - 29.8 -673 -660 -656 0.99548
of some FP experiments, against water height, csO9 csl2 -5.69 -135 -134 -90 .98557
performed in the same driver array 25 x 25 - 25. csO9 csl7 -3.85 -79 -78 -87 .98756
cs10 csO5 -49.95 -633 -600 -701 .99509
Phy3M7ypeFWzimdswW. 25x2S-2SD#mAirW CS1 1 CS09 29.8 605 645 689 .99282K�ftVadAon&j*9VMwHh*M cs I csl7 25.98 527 558 575 .99246
CS I cs 12 24.14 490 516 570 0.99159------------
csl2 cs 1 -24.14 -484 -460 -568 0.99967DS
Ms (.0.) cs 12 csO9 5.69 130 132 8 7 0.98332IN -tffl!
No M csl2 cs 17 1.84 3 7 3 7 5 0.99988I
!01 %1 csl7 csll -25.98 -521 -493 -575 .99405
csi7 csO9 3. 7 7 7 0. 8531
csl7 csl2 -1 4 7 -37 -5 0.99990
rh34 rh35 67.1 1002 1171 1075 0.97842
rh3 5 rh34 -67.1 -1079 -895 -1085 0.98885gp�
Note also the correlation coefficient values: for the
very small H value of 184 mm, p = 099990 while the5
4W M Soo %D 6� 6M 7GO RD corresponding AK values (37.10- ) based on derivation
N $"of D*MAffWi1WM or integration are larger than the MORET 4 Perturbation
Fig. 4 Determining curves K = F(H) for the AK value (5. 10-5). In this case, the accuracy of the
same array 25x 25 - 25 with various FP and calculation made by the above relationship 6) or 7)
water in the central tank. depends on measurement uncertainty on the heights (by
their differences and the height value of the calculation
point), and on the uncertainty of the determination of the
two expressions used K = F(H) and F(H)/5H which
3.3 Results and Comments derive from independent MORET 4 keff obtained with
standard deviation = 33.10-5. Thus, we assume that theThe following Table I presents some calculation MORET 4 Perturbation value is correct, while the other
results, based on derivation (column 4 integration AK values are larger due to experimental uncertainties.
(column 5) and MORET 4 Perturbation' (column 6 When H > 2 mm (see for example the 385 mm
against the experimental difference of critical heights case), all AK values agree very well and the
AH (column 3 The initial (nominal) FP in column I experimental and statistical uncertainties do no longer
is perturbed (changed) by the FP of column 2 The have any effect.
lowest value of correlation coefficients p (among the By quadratic combination of measurement
6) obtained for each MP calculation is also given. uncertainties on the heights difference and their
As can be seen, symmetric cases (for instance, csO5 reproducibility, one obtains 06 mm at 2a levels.
changed by csIO and csIO changed by csO5) give Taking into account the slopes values 8H,
results of fairly equal but with opposite values. determined to be from 9 to 24.10-5/mm, one translates
The Figure displays these AK variations against the measurement uncertainty into reactivity weightsbetween 54 to 14.4. 1 05.
AH when AH < 70 mm. One experiment (with water, instead of FP solution)
As it can be seen on Figure 5, for small variations was also exactly repeated. This reproduced experiment
of AH, the variations of AK against AH are quite linear showed against the reference one a difference height AH
and can be approximated by line 1, slope of which is = 187 mm. When quadratically combining this latter
24.10-'/mm. When AH increase, AK can be value with the former one of 06 mm, the uncertainty
approximated by line 2 slope of which is 9 1 0"/mrn or rises to 2 mm, giving AK between 18 to 48.10-5.
more precisely by a fitted curve of degree 3 Thus, we assume an average value of ± 20.10-5 of
experimental methodology uncertainty for the
- 474 -

JAERI-Conf 2003-019
experimental validation of MORET4 Perturbation. They are under 2 for 20.10-5 and their average areAs seen by the 184 mm case, MORET 4 Perturbation respectively 12% and 03% for 20.10-5 and 5.10-'itself is more accurate. limits.
4. Numerical Validation6. Conclusion
4.1 Method
Calculation results from MORET 4 Perturbation In MORET 4 is implemented the calculationare compared with deterministic APOLLO S 2D possibility of perturbation based on Correlatedcode results, when applying the same variation Sampling Method. 2000 calculations were already(+ 10% of FP concentration). TRIPOL14.2 performed to validate numerically its use againstPerturbation is also used. For Monte Carlo 3D codes, deterministic APOLL02 calculations, Here, results ofMORET4 and TRIPOL14.2 the same geometrical an experimental validation are given. The principle ismodel is used. For APOLL02 Sn, the 3D geometry is the exploitation of critical heights differences of closedescribed in an equivalent 2D geometry, which gives Physical Type experiments, in the same geometry anda Keff near that obtained by Monte Carlo codes. with the same nature of FP, differing in concentration
and acidity.Results prove the adequacy of MORET 4
4.2 Results and Comments perturbation well suited for the reactivity weights ofuncertainties evaluations in FP experiments.
Table 2 gives a sample results over 32 analysed Moreover, the study shows that small absorptionPhysical Type FP experiments. cross section variation of FP 12 - 03 %) can be
Differences calculated by deterministic code detected by MORET 4 Perturbation, all being equal.APOLL02 S 2D for 10% variation of FP TRIPOL14.2 Perturbation results, less accurate, shouldconcentration C) agree quite well with results for the be deeper analysed.same variation obtained by MORET 4 Perturbation,with standard deviation (a) very small. AK arebetween 100 and 200. 10-5 and close to each other References(differences 20.10--). Thus, with the formerexperiment validation, and those performed with 2000 1) J.M. Gomit, P. Cousinou, A. Duprey, C. Diop, J. P.calculation cases carried out during the CSM Grouiller, L. Leyval, H. Toubon & E. Lejeune,implementation, we have a very good confidence in "The new CRISTAL Criticality-Safety Package",the use of MORET 4 Perturbation, especially for FP Proc. Int. Conf. on Nuclear Criticality Safety,experiments evaluations. On the contrary, ICNC'99, Versailles, France, Sept. 20-24, 1999 I,TRIPOL14.2 Perturbation results are larger (- x 1.5) 308 1999).than APOLLO S 2D reference calculations and with 2) A. Le Cocq, A. Nouri and P. Reuss, "Review andlarger a (- 45). These TRIPOL14.2 results must be Variance Analyses of Monte-Carlo Perturbationdeeper analysed. Algorithms", Proc. Int. Conf. on Nuclear
To complete the comparison, some calculations are Criticality Safety, ICNC'99, Versailles, France,also intended with MCNP Perturbation. Sept. 20-24, 1999, I, 288 1999).
3) F. Barbry, P. Grivot, E. Girault, P. Fouillaud P.Cousinou, G. Pouliot, J. Anno, J. M. Bordy D.
5. Detection of FP Concentration Variation Doutriaux, Criticality Experiments Performed inSaclay and VaIduc Centers - France 1966-2002),
With all these results, it is possible to predict the to be published in a ICSBEP special Nucleardetection limits of MORET 4 Perturbation, all being Science and Engineering 145, Sept. 2003).equal in the FP Physical Type benchmarks, related to 4) J. Anno, G. Pouliot, E. Girault, P. fouillaud D.Concentration variation of FP, or, which is practically Hynek & H. Toubon, "Status of the joint Frenchthe sme, absorption cross section variation of FP. In IPSN/COGEMA Qualification Programme ofTable 2 results of 10 variation are simply applied Fission Products", ANS Winter Meeting, Reno,by proportionality for reactivity limits of 20.10-' and USA, Nov. 2001).5. 10-5, in each last column of the two half-tables.Indeed the values depend on the case and FP (natureand concentration).
475 -

JAERI - Conf 2003 - 019
CalculationMethod
Delta K 10 Line 20 Integral
ret P.
Line I
-60 -60 -40 -20 1 1 20 40 60 0.6
Defta H Experiment (mm)
Fig. Variation of various calculated AK against the experimental AH
Table 2 Numerical Validation of MORET 4 Perturbation. Detectability of Variation of FP Concentration.
AK 10-5) Calculations C FP variation AK (I 0-5) Calculations C FP variationfor C FP + 10% 4 % for limit for C FP + 10% � % for limit
case MORET 4 Sn TRIPOL14 20.10-' 5. 1 0-' case MORET 4 Sn TRIPOL14 20.10" 5. 1 0-'
((T) I (CF)
rh33 187 189 1.07 0.214 1nd22 128 131 451 43) 1.56 0.390
rh34 178 1.12 0.280 sm23 188 1.06 0.265
rh35 129 190 45) 1.55 0.388 sm24 186 170 1.06 1 0.265
rh37 1 147 1 1.36 0.340 sm25 198 1.01 0.253
csO5 148 254 46) 1.35 0.340 sm26 183 417 45) 1.09 0.273
csO7 158 138 221 47) 1.27 0.318 sm27 185 1981 1.09 0.273
CS11 139 238 45) 1.44 0.36 gd28 152 387 44) 1.32 0.330
csO77 118 1.69 0.423 gd29 159 160 1.26 0.315
csO8 122 1.64 0.410 gd3O 160 1.25 0.315
CS09 105 1.90 0.475 gd3l 127 1.54 0.385
CSIO III 217 46) 1.80 0.450 gd32 125 1.60 0.400
cs 12 101 1.98 0.495 mix44 173 1.16 0.290
csI7 100 2.00 0.500 mix45 191 1.05 0.263
cs18 122 1.64 0.410 mix46 190 197 1.05 0.263
nd2l 112 1.79 0.448 sm47 179 184 1.1
sm48 143 394 45) 1.40 0.350
Average i.2 0.3
- 476 -

JAERI-Conf 2003-019 JP0450092
CRISTAL V1: Criticality Package for Burn up Credit calculations
Jean-Michel GOMIT'*, Patrick COUSINOU', Cheikh DOp2,
Guy FERNANDEZ de GRAD02 , Frangoise GANTENBEIN1, Jean-Paul GROUILLER 3Andrd MARC4 , Dominique MIJUIN 2and Hervd TOUBON5
'Institut de Radioprotection et de Sfiretj Nucliaire, BP 17, 92262 Fontenay aux Roses Cedex, France2COMMissariati VEnergie Atomique, BP 28, 91191 Gifsur Yvette Cedex, France
3Commissariat i) VEnergie Atomique, 13108 Saint Paul lez Durance Cedex, France4SGN I rue des Hirons, 78182 Saint Quentin en Yvelines Cedex, France
sCogema 2 rue Paul Dautier, 78140 Vilizy Villacoublay, France
The first version of the CRISTAL package'), created and validated as part of a jointproject between IRSN, COGEMA and CEA, was delivered to users in November 999. Thisfruitful cooperation between IRSN, COGEMA and CEA has been pursued until 2003 withthe development and the validation of the package CRISTAL VI, whose main objectives areto improve the criticality safety studies including the Burn up Credit effect.
1. Introduction - Probabilistic calculations with "APOLL02As part of their respective activities in designing MORET 4;
and operating nuclear facilities, CEA, EDF, - Deterministic calculations with the Sn modules ofFRAMATOME and COGEMA are interested to take APOLL02 (I D or 2D geometries) or for theinto account Bum up Credit, which is the reactivity standard worths at one dimension.margin due to the formation of actinides and fission The "standard" route, managed by the Graphicalproducts during the irradiation of nuclear fuels. On its User Interface (GUI), integrates the know-how ofpart, IRSN needs tools for assessing the operator criticality engineers. The linking of different codes issafety analysis. It was decided to develop and validate done according to procedures adapted to eacha computer code of the "evolution of material and configuration, the procedures integratingcriticality balances" based on a coupling between the recommendations related to calculation schemes.packages dedicated to nuclide material depletion 2.2.2 "Reference" routecalculations DARWIN package and CESAR code) With the "reference" route, calculations are doneand to effective multiplication factor calculations with the continuous-energy Monte Carlo computer(CRISTAL). code TRIPOLI-4. The main principle of the
"reference" route is to use a minimum of physical2. CRISTAL V1 Package Description approximations and of modeling for the kff
determination.2.1 Presentation
The CRISTAL VI package is composed o 2.3 CEA93 Neutron Library- Libraries (JEF 22 and CEA93) containing basic The CEA93.V6 library, based on the EF2
2)nuclear data common to all the routes, evaluation ,is available to the user in two standard- Procedures based on recommended calculation multigroup formats: the 99-group energy mesh and the
schemes (APROC and APROC-CRISTAL Xmas 172-group structure. The library was obtainedlibraries), by processing JEF2 data with the NJOY systeM3) and
- Specific neutron transport computer codes has no cross-section adjustment. The CEA93.V6(APOLLO2, MORET 4 and TRIPOLI-4), library contains data for 279 isotopes and
- And interface softwares (CIGALES, EGM, self-shielding data for 56 resonant isotopes.SYCOMORE and a characterization system). The CEA93.V6 library was extended to integrate
essential nuclides for the criticality calculations (e.g.2.2 Functional architecture chlorine, calcium, zinc, tin) knowing that these
The functional architecture of the CRISTAL nuclides are not very used in the nuclear reactor field.package, Figure 1, is organized according to two More, for the needs of CRISTAL V I package, aroutes for the kff determination: the standard" route specific library is available with multigroup transferand the "reference" route. cross-sections at Legendre order 9 for Uranium,2.2.1 "Standard" route Plutonium and Americium isotopes.
The "standard" route with the multigroupcross-sections formulation allows realizing:
Corresponding author, Tel. 33 1 58 35 74 30, Fax. 33 46 57 29 98, E-mail: jean-miche1.gomit�hnfr
- 477 -

JAERI-Conf 2003-019
and to provide automatically data files for the2.4 Procedures libraries APROC and APOLLO2.5 code:APROC-CRISTAL - For cell and multi-cell calculations for arrays with
With regard to criticality, the wide scope of Pij method of APOLLO2.5 code,applications, the variety of geometric configurations - For the calculation of the effective multiplicationand chemical media processed, and the abundance of factor keff (ID or 2D calculations) with Snneutronic spectra require general and robust method,formalisms. Recommended calculation schemes, - For calculation of standard worth with S method.consisting, for each situation, on the selection of theoptimum sequence of calculation options. The Moreover, the CIGALES computation code allowsGIBIANE control language and the modular design of to use in APOLLO2.5, the isotopic data issued fromthe APOLL02 code make possible to draw up depletion codes (DARWIN package and CESARprocedures. These procedures, called APROC, code).simplify the user approach by creating operationsequences. A specific APROC - CRISTAL library was The CIGALES computation code, developed withdeveloped for the CRISTAL-VI package for the Visual Basic 5.0, is available on Windows NTdescription of geometry, self-shielding and Sn environment. Input data are provided in an interactivecalculations. way, using the arborescent structure of panels with
predefined fields.2.5 APOLL02 Code
The APOLL02 code 4), modular tnsport code 2.6.2 EGM graphic editordeveloped since 1983 by CEA in a joint development The EGM 3D graphic editor 7) allows to modeleffort with Electricitd de France and Framatome-Anp, graphically and interactively 3D complicatedallows assembly transport computations using the configurations. The user draws the configuration withcollision probability method. In the CRISTAL VI different menu bars, popup menus and icons. EGM ispackage, the main functionalities of the APOLLO2.5 an application based on CAS.CADE Object Librariescode used are: using geometric primitives and topological operations
- The self-shielding module, (intersection, union, ... ) to apply to the 3D geometry.- The collision probability method (PiJ method) for
flux calculations, 2.6.3 SYCOMORE System- The collapsing and homogeneisation of the The SYCOMORE system 5) comprises two main
cross-sections, modules: EJM and OPOSSUM modules.- The discrete ordinates method for Sn calculations.
The EM module is a useful and powerful editor toThe APOLLO2.5 computer code allows preparing display automatically the MORET geometry model.
homogenized and self-shielded macroscopic This too] is developed with JAVA 2 to ensure thecross-sections for MORET 4 and Sn calculations. portability in different environments (Windows, Unix
and Linux).2.6 Graphical User Interface (GUI)
The main aim of the GUI is to offer users a high The OPOSSUM module is a post-processinglevel of user-friendliness and flexibility in the data toolbox that:description of codes of the CRISTAL VI package. - Display curves from output data (cross-sections,
reaction rates, fluxes);The main components of the Graphical User - Give a 2D representation of parameters in the
Interface (GUI), developed by RSN, are: MORET geometry model to know for example- The CIGALES code, a data generator, the most populated neutrons area, materials- The EGM 3D graphic editor, where absorption is the most prevalent;- The SYCOMORE system with a graphical editor - Use different statistic tests to determine the
to display automatically the MORET geometry convergence rate of the MORET simulations.model (EJM) and a post-processing toolbox. forthe MORET computer code (OPOSSUM), 2.6.4 Characterization system")
- A characterization tool to assist code bias Accurate predictive estimation of the effectiveestimation. multiplication factor kff and associated errors
determination are essential for users of neutronic code2.6.1 CIGALES code systems, like CRISTAL VI package.
The CIGALES Version 30 computer code isused to calculate isotopic compositions by means of The characterization system allows reaching thesedilution laws for the fissile material 6 and predefined two objectives and is assigned:materials (such as steel and concrete) for the others, - To locate a criticality calculation among a group
- 478 -

JAERI-Conf 2003-019
of similar experiments whose bias are known. abundance of each nuclide, taking into account theThe critical experiments have been calculated detailed history of the fuel assembly (in the reactorwith the CRISTAL VI package to obtain and during cooling) for the fuel cycle of any reactor"code-experiment" bias; type (PWR, BWR,).
- To determine an estimation of the overall bias of The CRISTAL VI package, devoted to performthe CRISTAL VI package for the particular automatized criticality calculations using bum up
14)situation studied. credit , contains an interface coupled with thedepletion code and designed to issue automatically
2.7 MORET 4 Code data files for the criticality calculations. This interfaceThe MORET 4 code 1) is a three dimensional takes into account:
multigroup Monte Carlo code which calculates the - Correction factors (of actinides and fissioneffective multiplication factor kff) of any more or products concentrations) determined by theless complex configurations as well as reaction rates validation of the evolution calculations and byin the different volumes of the geometry, and the the validation of cross-sections,neutron leakages. - The axial profile of burn up,
- The number of axial zones chosen.The MORET 4 code is a modular code, well suited
for requirements of criticality surveys performed for 4. Validation of the CRISTAL V1 packagefiiel cycle facilities and plants and for fissile materialtransport packaging. The validation database of CRISTAL VI package
contains approximately 2000 experimentalRecent developments and improvements of the configurations with:
previous version of MORET have led to include the - The CRISTAL VO update database 516new version MORET 4.B in the CRISTAL VI experiments),package. The new features concern: - Experiments involving slabs, arrays Of U02 and
- he modernization of the geometry with regard to MOX ftiel rods, fuel-pin lattices in nitratethe previous version. A modular geometry solutions, uranyl nitrate solutions, mixedstructure allows constructing complex plutonium and uranium nitrate solutions,geometries using particular zones, called units. uranium nitrate solutions, uranium metal andThe new geometry structure enables the plutonium metal, uranium powders,description of arrays in arrays and hexagonal - Experimental programs dedicated to Bum uparrays; Credit
- The implementation of perturbation algorithms e Programs carried out in criticality laboratory atbased on the correlated sampling method; Valduc,
- The source distribution convergence; 0 Experimental programs carried out at- The statistical detection of stationarity; Cadarache by the CEA on Bum up Credit.- The unbiased variance estimation.
The experiments of the CRISTAL VI validationMoreover, the MORET 43 version is connected base have been selected to have an extensive
with post-processing tools to help users to analyze the representation of media and geometries encountered insimulation results. the nuclear fuel cycle. The validation database,
composed of about 2000 experiments, is presented by2.8 TREPOL14 Code medium type: solutions, interaction , 23U (solutions),
The TRIPOL14 code 11), developed by CEA/DEN, powders, arrays, dissolvers. metallic system, as shownis a three-dimensional, continuous energy, particle in Table .transport calculation code (neutrons and gamma),based on the Monte Carlo method. The TRIPOLI-4.3 Table CRISTAL VI Validation Base Selectedcode is the "reference" route of CRISTAL VI. This experimentscode avoids describing complex geometry like arraysin arrays, and is used to determine the keff as well as Classes No of No ofthe neutron flux, reaction rates and fission rates, for Series Casesexample. Solutions 6 470
Interactions 24 2623. DARWIN-CRISTAL and CESAR-CRISTAL I.JJ U 6 43
Couplings Powders 8 170
Arrays 77 937The DARWIN"' and CESAR") packages upstream Dissolvers 7 81
of the application of the CRISTAL package are used -Kietals 72 129to calculate changes in the physical parameters such as Total 295 2092
- 479 -
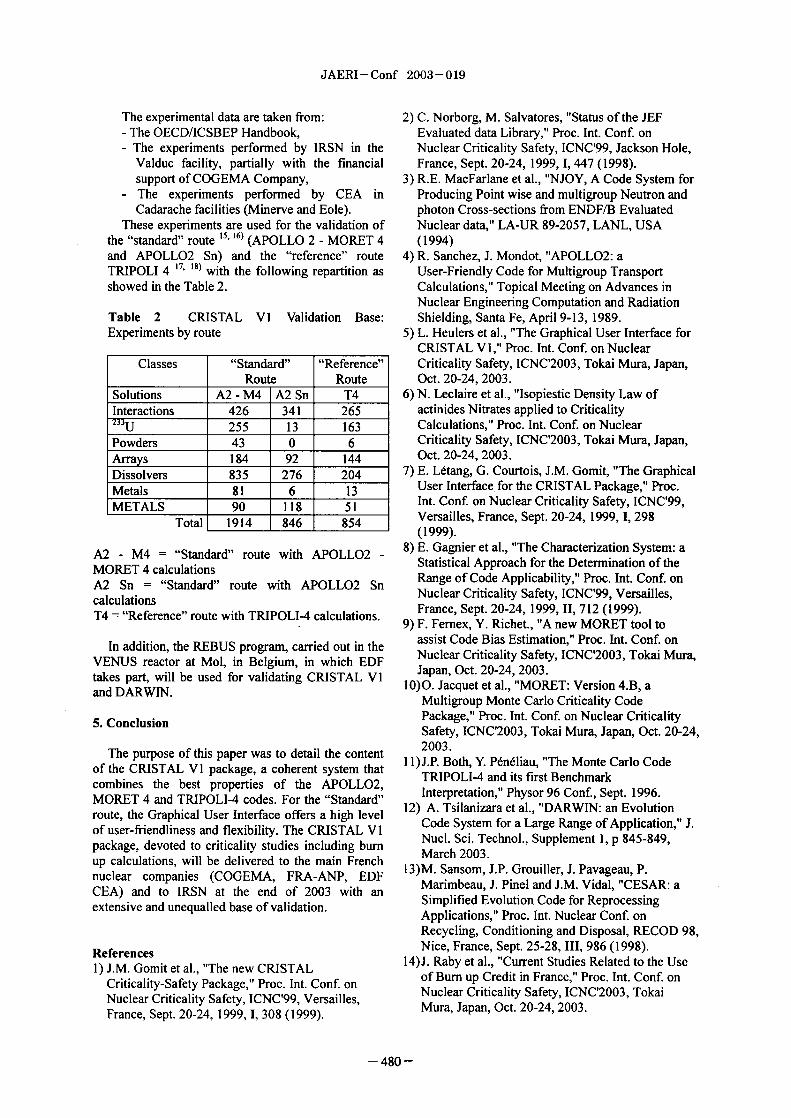
JAERI-Conf 2003-019
The experimental data are taken from: 2) C. Norborg, M. Salvatores, "Status of the JEF- The OECD/ICSBEP Handbook, Evaluated data Library," Proc. Int. Conf on- The experiments performed by IRSN in the Nuclear Criticality Safety, ICNC'99, Jackson Hole,
Valduc facility, partially with the financial France, Sept. 20-24, 1999,1, 447 1998).support of COGEMA Company, 3) R.E. MacFarlane et al., "NJOY A Code System for
- The experiments performed by CEA in Producing Point wise and multigroup Neutron andCadarache facilities Minerve and Eole). photon Cross-sections from ENDF/B Evaluated
These experiments are used for the validation of Nuclear data," LA-UR 89-2057, LANL, USAthe "standard" route 15,16'(APOLLO 2 - MORET 4 (1994)and APOLL02 Sn) and the "reference" route 4) R. Sanchez, J. Mondot, "APOLL02 aTRIPOLI 4 17, ") with the following repartition as User-Friendly Code for Multigroup Transportshowed in the Table 2 Calculations," Topical Meeting on Advances in
Nuclear Engineering Computation and RadiationTable 2 CRISTAL VI Validation Base: Shielding, Santa Fe, April 913, 1989.Experiments by route 5) L. Heulers, et al., "The Graphical User Interface for
CRISTAL V I," Proc. Int. Conf on NuclearClasses "Standard" "Reference" Criticality Safety, ICNC'2003, Tokai Mura, Japan,
Route Route Oct. 20-24, 2003.Solutions A - M4 A2 Sn T4 6) N. Leclaire et al., "Isopiestic Density Law ofInteractions 426 341 265 actinides Nitrates applied to Criticality
7TU___ 255 3 163 Calculations," Proc. Int. Conf, on NuclearPowders 43 0 6 Criticality Safety, ICNC'2003, Tokai Mura, Japan,Amys 184 92 144 Oct. 20-24, 2003.Dissolvers 835 276 204 7) E. Ldtang, G. Courtois, J.M. Gomit, "The GraphicalMetals 8 1 6 13 User Interface for the CRISTAL Package," Proc.METALS 90 118 5 1 Int. Conf. on Nuclear Criticality Safety, ICNC'99,
Total 1 1914 846 854 Versailles, France, Sept. 20-24, 1999, 1, 298(1999).
A - M4 = "Standard" route with APOLL02 - 8) E. Gagnier et al., "The Characterization System: aMORET 4 calculations Statistical Approach for the Determination of theA S = "Standard" route with APOLL02 S Range of Code Applicability," Proc. Int. Conf oncalculations Nuclear Criticality Safety, ICNC'99, Versailles,T4 = "Reference" route with TRIPOL14 calculations. France, Sept. 20-24, 1999, II, 712 1999).
9) F. Femex, Y. Richet., "A new MORET tool to
In addition, the REBUS program, carried out in the assist Code Bias Estimation," Proc. Int. Conf. onVEN'US reactor at Mol, in Belgium, in which EDF Nuclear Criticality Safety, ICNC12003, Tokai Mura,takes part, will be used for validating CRISTAL VI Japan, Oct. 20-24, 2003.and DARWIN. 10)O. Jacquet et al., MORET: Version 4.B a
Multigroup Monte Carlo Criticality CodePackage," Proc. Int. Conf on Nuclear Criticality
5. Conclusion Safety, ICNC'2003, Tokai Mura, Japan, Oct. 20-24,
The purpose of this paper was to detail the content 2003.of the CRISTAL VI package, a coherent system that I )J.P. Both, Y. Pdndliau, "The Monte Carlo Codecombines the best properties of the APOLLO2, TRIPOL14 and its first BenchmarkMORET 4 and TRIPOLI4 codes. For the "Standard" Interpretation," Physor 96 Conf, Sept. 1996.route, the Graphical User Interface offers a high level 12) A. Tsilanizara et al., "DARWIN: an Evolutionof user-fi7iendliness and flexibility. The CRISTAL VI Code System for a Large Range of Application," J.package, devoted to criticality studies including bum Nucl. Sci. Technol., Supplement 1, p 845-849,
up calculations, will be delivered to the main French March 2003.nuclear companies (COGEMA, FRA-ANP, EDF 13)M. Sansom, J.P. Grouiller, J. Pavageau P.CEA) and to IRSN at the end of 2003 with an Marimbeau, J. Pinel and J.M. Vidal, "CESAR: aextensive and unequalled base of validation. Simplified Evolution Code for Reprocessing
Applications," Proc. Int. Nuclear Conf onRecycling, Conditioning and Disposal, RECOD 98,
References Nice, France, Sept. 25-28, III, 986 1998).1) J.M. Gornit et al., "The new CRISTAL 14)J. Raby et al., "Current Studies Related to the Use
Criticality-Safety Package," Proc. Int. Conf, on of Bum up Credit in France," Proc. Int. Conf onNuclear Criticality Safety, ICNC'99, Versailles, Nuclear Criticality Safety, ICNC'2003, TokaiFrance, Sept. 20-24, 1999,1, 308 1999). Mura, Japan, Oct. 20-24, 2003.
- 480 -

JAERI - Conf 2003 - 019
15)1. Duhamel, E. Ldtang, A. Cossenet, G. Poullot, JEF-2.2 and ENDF/B6 Cross-sections"Experimental validation of the Evaluations," Proc. Int. Conf. on NuclearAPOLL02-MORET 4 Standard Route of the Criticality Safety, ICNC'2003, Tokai Mura, Japan,French CRISTAL VI Package," Proc. Int. Conf. Oct. 20-24, 2003.on Nuclear Criticality Safety, ICNC'2003, Tokai 18) YX Lee et al., "CRISTAL, Criticality SafetyMura, Japan, Oct. 20-24, 2003. Package Validation: TRIPOLI-4 Monte Carlo code,
16)C. Venard et al., "Contribution of the Experimental JEF2.2 Library and ICSBEP Experiments," Proc.validation of the French Criticality-safety Package Int. Conf. on Nuclear Criticality Safety, ICNC'99,CRISTAL VI: APOLL02 Sn Route," Proc. Int. Versailles, France, Sept. 20-24, 1999, 111, 1157Conf. on Nuclear Criticality Safety, ICNC12003, (I 999).Tokai Mura, Japan, Oct. 20-24, 2003.
17) Y.K. Lee, E. Gagnier, L. Aguiar, "Validation ofthe 3D Transport Monte Carlo Code TRIPOLI-4.3for Metallic Fissile Media Configurations with
Figure 1: Functional architecture of the CRISTAL Package
gm-�, in '0W``!-,`1;1
jc,�l 'n
DILUTION AWS,TP
III � PREAPoL Alan4
Vl� APROC POCrDU!!Fairchild -ml THEMISiNJOY THEMISINJ
N
Y
�vzsmvmpia- gkW,,M.'15�� I 44-Po n Xpq%,�, 0got gag
481

JP0450093JAERI-Conf 2003-019
Synthesis on the Validation of the CdSTAL VO Package
Isabelle DUHAMEL", Jean-Michel GOMIT1, Yi-Kang LEE 2and Christophe VENARD 3
1 Institut de Radioprotection et de Sfiretg Nucl&ire, BP 17 - 92262 Fontenay aux Roses Cedex, France2 Commissariat a PEnergie Atomique, BP 28 - 91191 Gifsur Yvette Cedex, France3 Commissariat ti VEnergie Atomique, 13108 St Paul ez Durance Cedex, France,
CRISTAL V.1 a French calculation package for criticality-safety studies, has beendeveloped and validated as part of a joint project between IRSN, CEA and COGEMA. Thispackage includes two calculation routes: on the one hand, the "standard route" dealing withthe nuclear data library CEA93 (derived from JEF2.2 evaluation), the APOLL02 cell codeand the Monte Carlo MORET4 code, and, on the other hand, the "reference route" using theMonte Carlo TRIPOLI4 code with a JEF2.2 continuous-energy cross-section library.Last years, an extensive validation work has been performed by CEA and RSN using alarge experimental database (more than 500 critical experiments) taking into account mostof the different operations encountered in the nuclear fuel cycle.In this framework, a significant effort has been devoted to provide CRISTAUs users acomprehensive and useful synthesis of the different validation studies.
1. Introduction Finally, the recommended calculation schemeswere introduced in procedures libraries to keep easier
The CRISTAL VO.1 package" includes two the use of the "standard route".calculation routes using JEF2.2 nuclear data:
• A pointwise route ("reference route") using the 2. Validation of CRISTAL VO.1 package3D Monte Carlo code RIPOL14 with itscontinuous-energy library. Meanwhile, an extensive validation work has been
• A multigroup route ("standard route") using the performed by CEA and IRSN with a commoncombination of the nuclear data library experimental database for the different calculationCEA93-V4, the cell code APOLL02 and the routes.Monte Carlo code MORET4. The applicationlibrary CEA93 using the 172-group Xmas 2.1 Validation Databaseenergy structure was derived from JEF2.2. Theassembly code APOLL02 is used for Validation is based on calculation-experimentsself-shielding treatment (generalized comparisons. The observed discrepancies are thenLivolant-Jeanpierre formalism) and for flux interpreted and eventually transposed to actualcalculations (Pij method). Then, self-shielded, configurations.homogenized and eventually collapsed Therefore critical experiments were selected tocross-sections, are used in the Monte Carlo code investigate all the operations encountered in theMORET4 for 3D calculations with a general nuclear ftiel cycle (including fabrication, transport,Pri-like anisotropy representation or in S storage, and reprocessing).calculations with APOLL02 code. Moreover, for each class of media, the important
parameters (lattice pitch, fuel concentration, uraniumRegarding the different calculation options of the and plutonium enrichment ... were represented and
"standard route", an important validation work was their variation ranges were covered.performed in order to optimize CRISTAL package Furthermore, for a given kind of configuration,accuracy and calculation time. For example, a P3 experiments taken from different laboratories wereanisotropy representation and a 20-groups energy investigated, in order to avoid systematic errors thatstructure were used for APOLL02 S calculations, might affect a whole experimental program.whereas a P5 anisotropy and a 172-groups energy Quality of the data provided in benchmarks wasstructure were involved in MORET4 calculations. In also a criterion for the database selection.fact, these approximations do not significantly Since few years, a huge effort has been devoted inincrease the Monte Carlo calculation time and give the framework of the OECD/ICSBEP project to selectmore accurate results. and to evaluate critical experiments from different
Corresponding author, Tel. 33.1.58.35.74.17, Fax. +33.1.46.5729.98, E-mai1:isabe1Ie.duharne1�irsnfr
- 482 -

JAERI-Conf 2003-019
laboratories. Therefore, this reference 2) is the main 3. Validation Studiessource of the benchmarks selection.
Among the 540 benchmarks retained in the initialFinally, more than 500 benchmarks (see table 1) validation database (Table 1):
were selected for the CRISTAL V.1 validation - 431 benchmarks were investigated with thedatabase (called DO), including: 14 standard route" APOLLO2-MORET4 (A2-M4) ),
• Low enriched uranium solutions 39 cases) - 80 with the "standard route" APOLL02 Sn• High enriched uranium solutions 64 cases) (A2_Sn)4),
• Plutonium solutions 124 cases) - 186 experiments, with the "reference route"
• Mixed uranium and plutonium solutions 31 TRIPOLI 4 (T4)
cases)
• Array of low enriched U02 pins (I I I cases)
• Array of mixed uranium and plutonium oxides Table Nuniber of experiments investigued wh the
pins 73 cases) different CRISTAL VO I's calculation routes.
• Uranium, plutonium and mixed uranium and
plutonium powders (respectively 18, 13 and 6 Numberof"periments
cases) Physical Fissile A2- A2-
• Array of uranium or mixed uranium and Form material DO M4 Sn T4plutonium rods in a fissile solution (respectively
8 and 18 cases) LEU 39 25 0 13
• High enriched uranium metallic systems 17 MixedU-Pu 31 19 9 19
cases) Solutions HEU 64 61 8 10
• Plutonium metallic systems (I cases) P11 79 72 18 18
2.2 Validation Method UO� rods III 91 21 34Arrays
First of all, the validation work involved U02-PU02 rods 60 44 4 1 1
calculation-experiment comparisons. Thus, critical Arrays in U(�_pUO2 rods 1 8 0 0 3
experiments were investigated with the different fissile U02 rods 8 0 6 2
routes of CRISTAL VO. 1. Calculations were soh6m
considered in good agreement with the benchmark UO� 1 8 1 8 0 18
when the discrepancies between them are in the Powders N02 13 13 0 13
4,72. U0ZPuO2 6 6 0 0uncertainties margins (a 1.dlia + 0'bnh.., )-
U 17 9 5 13Systematic inter-code comparisons were also NtWlic
performed to uncouple the different sources of code Pu 18 15 9 10
biases and to evaluate the effect of models inaccuracy Fissile Pu solutim 45 45 0 22
(multi-group treatment, anisotropy representation, media inself-shielding, collapsing, homogenization ... ). This IInteraction U02-PU02 r0dS 13 0 0
study helped to identify and to remove different TOTAL 540 431 80 186sources of discrepancies between the multigroup and I I I I I I
the pointwise schemes. Once calculation-experiment 3.1 Main Results
discrepancies are proved to be code independent, it
allows to question one of the other sources of
discrepancies: experimental biases or uncertainties For the different configurations investigated, the
and nuclear data inaccuracy. validation work has pointed out:
Thus, for a similar configuration, different A relative good k-effective prediction for
experimental programs are investigated in order to plutonium and low enriched solution 3 (except
check the consistency of the information provided. for SHEBA experiments -UO2F2 with an
Our investigations have already shown that this uranium concentration (Cu) of about 980gtl-,
desired consistency is not always fulfilled and that which lead to a high overestimation);
possible biases in the experimental data could be An overestimation of the k-effective forhigh-enriched uranium solutions, due to tile
expected. JEF2.2 235U 9)Finally, possible trends of calculation-experiment cross sections
discrepancies with iportant parameters (composition, - Inconsistencies between some investigated
spectra indices ... are investigated. It allows us to experimental programs involving mixed uranium
have more information about nuclear data accuracy. and plutonium solutions;- A good calculation-experiment agreement for the
U02 and MOX ftiel rod arrays in pure water;
- 483 -

JAERI-Conf 2003-019
- High discrepancies between "standard route" and - Number of cases investigated,4i reference route" for rods arrays ) with high flux - Mean values of calculation-experimentsheterogeneity. These discrepancies are mainly discrepancies (C-E),due to the homogenization step in the "standard - The dispersion in relation with the mean valueroute" and might be decreased with the new (am) or the minimal and maximal values ofversion of CRISTAL, thanks to multi-cell (C-E).calculations; - Main conclusions, which are reminded in the last
- An under-estimation of the k-effective for bare, column "comments".water-reflected or CH2-reflected uranium andplutonium metallic system 60) ; 4. Conclusion
- A k-effective over-prediction with the "standardroute" for stainless steel reflected configurations. In the framework of CRISTAL VO.1 development,This overestimation increases with the reflector an extensive validation work was performed.thickness or proximity. Further analyses have New calculation procedures and models werehighlighted that this over-prediction is linked to validated thanks to critical experiments and referencethe multi-group treatment of the iron isotopes calculations.(predominantly 16 Fe). The calculations allow evaluating the effect of the
approximations used in the standard route, the nuclear3.2 Synthesis data accuracy, and the reliability of experimental data
benchmarks by verif�tirig the consistency of differentCRISTAL is a customers oriented calculation experimental programs.
package. Therefore, in order to help users to better Thus, the analyses of experiments involvingidentify codes validation ranges, a report summarizing high-enriched uranium solutions have highlighted thethe different validations studies was published. necessity of improving the '35U capture cross section
This document describes briefly the different in JEF2.2 library.CRISTAL's calculation routes. Then, the several Moreover, inter-codes comparisons for steeloptions adopted for calculations are reminded. Finally, reflected experiments have shown the need ofthe validation studies results are presented in synthesis improving the multi-group treatment of iron isotopes.tables, dealing with: Besides, configurations involving U02 or
- High-enriched uranium solutions W02172, U02-PU02 rods arrays with high flux heterogeneityUF6-HF and U02(NO3)2), have pointed out the need of performing APOLL02
- Low-enriched uranium solutions 2F2, and multi-cell calculations.U02 (NO02), Furthermore, experiments dealing with bare,
- Plutonium solutions (PU02 (NO02), water-reflected and CH2-reflected metallic media U- Mixed uranium and plutonium solutions or Pu) have highlighted a slightly under-prediction of
(UO2(NO3)2 - PU02(NO3)2), k-effective for all CRISTAL VO. I calculation routes.- U02 rods arrays, in pure or poisoned water, with
or without neutrons absorbers and with different Finally, it must be emphasized that the validationreflectors, work is still in progress. In fact, the experimental
- U02-PU02 rod arrays dealing with several database is being extended for the new CRISTALconfigurations, VLO version 10-11); This aims covering other kinds of
- Low-enriched uranium powders, configurations (slabs aays , 233U systems ... ) and to- Plutonium powders, validate new options for Bum up credit (fission- U02-PU02 powders, product nuclear data) and multi-cell calculations (rods- U02 fuel rod arrays in uranyl nitrate solution and arrays with strong flux gradients...
MOX fuel rod arrays in fissile solution (mixedand plutonium nitrate),
- High-enriched uranium metallic systems, References- Plutonium metallic systems.
1) J. M. Gomit, P. Cousinou, A. Duprey, C. Diop,For each calculation routes, the synthesis tables J.P. Grouiller, L. Leyval, H. Toubon, E. Lejeune,
include (see examples in tables 2 and 3): "The new CRISTAL Criticality-Safety Package",- Main configurations characteristics (isotopic Proc. Int. Conf, on Nuclear Criticality Safety,
vector, moderation, reflection conditions, ICNC'99, Versailles, France, Sept. 20-24, 1999, 1,poisoning), 308 (1999).
- Neutron spectrum indicator (qw-4rv). The 2) NEA/NSC/DOC(95)03, International Handbookslowing down current in the infinite fissile media, of Evaluated Criticality Safety Benchmarkwhich is the number of neutrons that slow down experiments", (September 2002)past 4 eV, per fission, was chosen, 3) 1. Guimier, G. Poullot, A. Nouri, E. Gagnier,
- 484 -

JAERI-Conf 2003-019
"Numerical and Experimental Validation of Configurations using TRIPOLI-4.3 3D LatticesCRISTAL's Standard Route APOLL02-MORET4", Geometry", Proc. Int. Conf. on Nuclear CriticalityProc. Int. Conf. on Nuclear Criticality Safety, Safety, ICNC2003, Tokai-mura, Japan, Oct. 20-24,ICNC'99, Versailles, Fance, Sept. 20-24, 1999, 11, 2003.702 1999). 8) YK Lee, "'Evaluation of CRISTO 11 Storage
4) B. Roque, A. Santamarina, C. Mattera, E.Lejeune, arrays Benchmark with TRIPOLI-4.2 Criticality"Contribution to the Experimental Validation of the Calculations", Proc. Int. Conf. Monte Carlo 2000,New French Criticality-Safety Package CRISTAL", Lisbon, Portugal, Oct. 23-26, 2000, 809 2000).Proc. Int. Conf. on Nuclear Criticality Safety, 9) . Guimier, A. Nouri, "Contribution to theICNC'99, Versailles, France, Sept. 20-24, 1999, 11, validation of the new 235U evaluation adopted in502 1999). JEFF3.0 starter file", Proc. Int. Conf. on Nuclear
5) Y.K. Lee, S.H. Zheng, G. Ndron, J.P. Both, Y. Criticality Safety, ICNC'99, Versailles, France,Pdndliau, C. Diop, "CRISTAL Criticality Safety Sept. 20-24, 1999, III, 964 1999).Package Validation: TRIPOLI 4 Monte Carlo code, 10) 1. Duhamel, E. Letang, A. Cossenet, G. Pouliot,JEF 22 Library and ICSBEP Experiments", Proc. "Experimental validation of theInt. Conf. on Nuclear Criticality Safety, CNC'99, APOLL02-MORET4 standard route of the FrenchVersailles, France, Sept. 20-24, 1999, 11, 1157 CRISTAL VI package", Proc. Int. Conf on(1999). Nuclear Criticality Safety, ICNC2003, Tokai-mura,
6) E. Gagnier, Y.K. Lee, L. Aguiar, N. Vedrenne, Japan, Oct. 20-24, 2003."Validation of the 3D TRIPOLI4.3 Monte Carlo II) J.M Gomit, P. Cousinou, C. Diop, Fernandez deCode for metallic fissile media configurations with Grado, F. Gantenbein, J.P. Grouiller, A. Marc,JEF2.2 and ENDF/136 evaluations", Proc. Int. Conf. D. Mijuin, H. Toubon, "CRISTAL VI: Criticalityon Nuclear Criticality Safety, ICNC2003, package for bum up credit calculations", Proc. Int.Tokai-mura, Japan, Oct. 20-24, 2003. Conf. on Nuclear Criticality Safety, ICNC2003,
7) Y.K. Lee, "Analysis of the Tokai-mura, Japan, Oct. 20-24, 2003.LEU-COW-THERM-049 MARACAS Critical
- 485 -

JAERI-Conf 2003-019
Table 2 Synthesis table for high-enriched uranium solutions
Main characteristics of APOLL02-MORET4 APOLL02-Sn TREPIOL14experiments Comments
Fissile qif4.v Studied Cases Trend Studied Trend Studied Cases TrendMedia (C-E); Cf. 10' Cases (C-E); G�. 10-5 (C-E); cy. 10'
U02F2 II exp. 2 exp. 3 exp.
Cu: 20 to 0,067 to Cu: 20 to 69( Cu: 443 et 1,,35 H/U 500 (C-E) � 423
700 g 0,806 700 g/1 :::.310 679 g/1 400 H/LJ < 1200 25W�(.C-E)-:680
(13 exp.) Reflector Reflector Reflector
water DO water
UF,-HF 6 exp.
CU: 115 to CU: 115 to HiA Ovcr-73OgA 0,201 to 730 g/I
estimation(H/U 99 to 0,472
82) Reflector (3500 to 5)(X))
water(6 exp.)
44 exp. 6 exp. 7 exp.
UOI(NO3)2 Cu: 20 to
450 g (C-E) 71 Cu: 300 to
Cu: 20 to Reflector 3oo 359 g/I
none' water, HAJ 1300 (C-E)-:- 305 some experiments
450 g/I 0,419 to concrete (C-E) 230 have high
0,832 Poisons: HAJ: 64 to 580 H/U 400 (C-E)� 1645 experimental
77 uncertainties
B : to (C-E) 145
(45 exp.) 0,23 g/1 0 = 85 Reflector
Ov;�i predMIOD none water -640.<(C-E)< t,
Gd:Oto2gA
I
qj�f_4,v: slowing down current in the infinitefissile media(humber ofneutrons that slow downpast 4 e, perfission)(C-E) : Mean value ofcalculation-experiment discrepancies(calculated kff minus benchmark ko
a. : dispersion ofcalculation-experiment discrepancies in relation with the mean value
CU.- Uranium concentration /1)
HIU: moderation ration(Hydrogen atom density over uranium atom density)
- 486 -

JAERI-Conf 2003-019
Table 3 Synthesis table for Metallic media
Main characteristics APOLLA)2-MORET4 APOLL02-Sn TRIPOL14ofexperiments Comments
Fissile Media qit4.v Studied Trend Studied Trend Studied TrendCam (C-E) ; 0�. OO-) Cases (C-E) C. 104) Casa (C-E) ; cf. (IO-)
9 exp. 5 exp. 12 exp.
Slightly Under-estimation
U Metallic Reflecto Reflectors for bare and water-rellectedcases
None (C-Q�510 None (C-E�-770 -520��C-E�< 350
U: 89 to Water cy� = 80 Water a. 160
97,7 % 0 CH, CH, Problems vAth multigroupe
treatment ofFeSteel 1300 C-E vz:3600
(16 exp.) depending nreflector thickness
Be Nuclear Data inaccuracyGraphite IOW (C-E)� 070 (Be) in EF2.2
15 esp. 9 exp. I ep.
Re Reflecto Refl Slightly Under-estimation
Pul Metallic None (C-E)�-700 None (C-E) I 0 None for bare or water-reflected
Water a�, = 20 Water (Y. = 250 Water -56L-4C-E)<130 cases
"Pu 18 to CH2 CH, CH2
20,1%
0 steel -340<(C-E)<4(0) Problems with multigmupe
(18 exp.) (1.5 cm to 20 depending on treatment of 56Fe
cm thick) reflector thickness
Graphite 6004C-F) < 700 Th (C-EY-1900 Th Nuclear Data inaccuracy
(2 cm to 45 dqxndingon in JEF2.2
cm thick) refleiorlhickne"S.
q,,,,:.4v: slowing down current in the infinitefusile media (number ofneutrons that slow downpast 4 e V, perfission)
(C-E) : Mean value ofcalculation-experiment discrepancies(calculated kff minus benchmark
q.: dispersion ofcalculation-experiment discrepancies in relation with the mean value
- 487 -

JAERI-Conf 2003-019 JP0450094
SWAT2: The Improved SWAT Code Systemby Incorporating the Continuous Energy Monte Carlo Code MVP
Hiroki MOCHIZUKI'*,Kenya SUYAMA2 and Hiroshi OKUN03
'The Japan Research Institute, Limited, 14-17, Misaki-cho, Chiyoda-ku, Tokyo 101-0061, Japan2Organisationfor Economic Co-operation and Development, Nuclear Energy Agency,
Le Seine St-Germain, 12, Boulevard des Iles 92130, Issy-les-Moulineaux, France3Japan Atomic Energy Research Institute,
Shirakata-Shirane 24, Tokai-mura, Naka-gun, Ibaraki-ken 39-1195, Japan
SWAT is a code system, wich performs the burnup calculation by the combination of theneutronics calculation code, SRAC95 and the one group burnup calculation code, ORIGEN2 I.The SWAT code system can deal with the cell geometry in SRAC95. However, a precise treatmentof resonance absorptions by the SRAC95 code using the ultra-fine group cross section library isnot directly applicable to two- or three-dimensional geometry models, because of restrictions inSRAC95. To overcome this problem, SWAT2 which newly introduced the continuous energyMonte Carlo code, MVP into SWAT was developed. Thereby, the burnup calculation by thecontinuous energy in any geometry became possible. Moreover, using the 147 group cross sectionlibrary called SWAT library, the reactions which are not dealt with by SRAC95 and MVP can betreated. OECD/NEA burnup credit criticality safety benchmark problems Phase-113 (PWR, a singlepin cell model) and Phase-11113 (BWR, fuel assembly model) were calculated as a verification ofSWAT2, and the results were compared with the average values of calculation results of bumupcalculation code of each organization. Through two benchmark problems, it was confirmed thatSWAT2 was applicable to the burnup calculation of the complicated geometry.
KEYWORDS. SWAT2, MVP, Burnup Calculation, Burnap Credit, OECDINEA Burnap CreditCriticality Safety Benchmark Problems
1. Introduction calculation model for large geometry, such as a fuelassembly array. It may be overcome by introducing a
With the progress of computer performance in procedure that makes few group cross section setsrecent years, burnup calculation using Monte Carlo based on the single-pin cell model, using the precisemethod becomes possible Japan Atomic Energy treatment resonance absorption option. However, thisResearch Institute (JAERI) developed MVP-BURN introduces approximation due to cell model boundarycode based on the continuous energy Monte Carlo condition, and it would be difficult to develop suitablecode, MVP.'-') Another example of implementation is models for arbitrary geometry.MCODE (MCNP-ORIGEN depletion program) which Continuous energy Monte Carlo code, MVP,has been developed at Massachusetts Institute of developed at JAERI, can treat any geometry andTechnology. 3 calculate cross section and neutron flux for arbitrary
SWAT is a burnup calculation code system by region. These features of MVP code will givecombination of neutronics calculation code, SRAC95 advantages to SWAT from the view point not only ofand one-group depletion code, ORIGEN2. 1.4-7) SWAT resonance absorption treatment in arbitrary geometryperforms the burnup calculation by ORIGEN2.1 using and but also of utilization of complicated geometry.the effective one-group cross section based on the Therefore, we introduced capability to drive MVPSRAC95 calculation SWAT library is a 147 oups code into SWAT. This new version, SWAT2, cancross section library based on JENDL-3.2.1fThis perforrn neutronics calculations for a given geometrylibrary contains (ny), (n,2n), (n,3n), (nfission), (na) to obtain the neutron flux and the effective crossand (np) reactions. sections by the MVP code instead of the SRAC95.
SRAC95 is used for neutron calculation in 107 And, by the utilization of the SWAT library, it isgroups, using the collision probability calculation possible to treat (nct), (np) and (n,3n) reactions canmodule (PIJ). For major resonant nuclides, ultra-fine not be treated on MVP.group collision probability calculation by the PEACOmodule is available. At present, PEACO module is not 2. Calculation Methoddirectly applicable to two- or three-dimensionalgeometry models, because of restrictions in SRAC95. SWAT2 handles ORIGEN2.1, SRAC95 and MVPThis restriction makes it difficult to prepare a as an outside module. By handling each code as an
Corresponding author, Tel. 81-3-5217-3861, Fax. 81-3-5217-3862, E-mail: mochi�tyo.scijri.cojp
- 488 -

JAERI-Conf 2003-019
outside module, SWAT2 became independent from energy structures same as the SWAT library.updating of each code. MVP is executed at the eigenvalue calculation
Figure I shows the flow of analysis of SWAT2. It is mode for every bumup step, and 147 groups neutronpossible to choose MVP or SRAC95 for the neutron flux, microscopic cross section data are obtained. 147spectrum calculation According to Figure 1, bumup groups cross section is contracted using this neutroncalculation method by SWAT2 is explained in the flux, and one group cross section data are obtained.following. (n,(x), (np) and (n,3n) reactions which are not
For each bumup step, the neutron spectrum and treated by MVP, and all reaction data of miclideseffective multi group cross section are evaluated by which are not treated by MVP are included in theeither MVP or SRAC95. SWAT library in the form of a 147 groups inflnite
After the MVP or SRAC95 calculation, the dilution cross section. By condensing these crossLIBMAK routine is called. It makes the one-group sections with the neutron flux from MVP, effectivecross section data file for the ORIGEN2.1 using one group cross sections of all reactions which arecalculated neutron spectrum and cross section by needed for the ORIGEN2.1 library are obtained.MVP or SRAC95. For miclides and reactions can not ORIGEN2.1 performs the bumup calculation usingbe treated in MVP or SRAC95, infinite dilution cross these one group cross section.sections stored in the SWAT library are condensed bythe neutron flux. Fission yield data of233U, 235u, 239PU, 3. Validation of SWAT2and 241pii for thermal neutronsdecay constants andbranching ratios for FPS are taken from NDC FP For the verification of SWAT2(MVP)library second version. 9 Using the library prepared OECD/NEA burnup credit criticality safetyby LIBMAK a one-step bumup calculation by benchmarks Phase-113 and Phase-IIIB are analyzed.ORIGEN2.1 is carried out. Then, the TABMAKroutine makes input files for VP or SRAC95 and 3.1 OECD/NEA Phase-1B Benchmark ProblemORIGEN2.1 using the geometry data and burnup OECD/NEA bumup credit benchmark Phase-IB iscalculation results. Up to the fal bumup, that a series of single pin-cell burnup calculation problemsprocedure is repeated in every bumup step. based on PIE data of the PWR 14 x 14 assembly
burned in Calvert Cliffs Unit 110) The lattice geometryis shown in Figure 2 Bumup periods are 4 cycles and
SWAT Library power densities and boron concentration of each cycle147 Group Cross Section File JENDL-31) are given. For verification of SWAT2, one PIE sample
Decay and Fission Yield (JNDC IR Library 2nd) of 27.35 GWd/t was selected ad aalyzed. ForJENDLA2 comparison with SWAT2(NIVP), SWAT2(SRAC95)
and MVP-BURN were used for the analysis. Theneutron histories at each bumup step in SWAT2(WP)and MVP-BURN was set to 1,000,000.
0
ORIGEN2 FormatCross Section H20
Library
or P0 0�O 00 0000 in
Input
SP -- ------Daft of
Bur"Y Figure 2 Lattice geometry of Phase-113 benchmarkC.1c a,.on
problem
Figure I Flow diagram of SWAT2. The results are shown in Table 1. In the table, the
ratio of SWAT2(MVP) or SWAT2(SRAC95) results to
2.1 MVP Calculation Method averaged value shown in Ref.10 are shown. ThisMVP can deal with the energy range from 20 MeV comparison shows that the difference of results
to .OE-5 e, and it is possible to make neutron flux, obtained by using the MVP code or the SRAC95 codecross section and reaction rate with arbitrary energy in the SWAT2 code system is small. Similar results to
group structure. In order to utilize the SWAT libraryfor bumup calculation, the output of the neutron fluxand cross section by MVP has be made with 147 group This means that SWAT 2 drives MVP code for
neutron spectrum calculatin
- 489 -
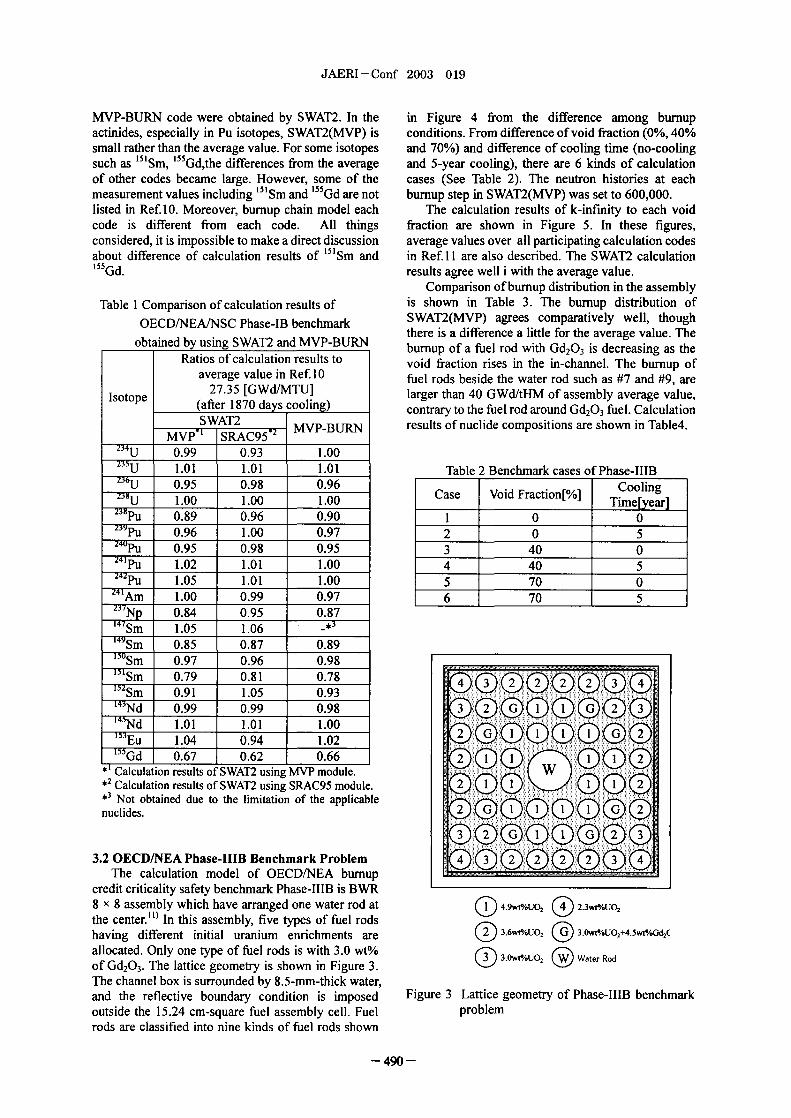
JAERI - Conf 2003- 019
MVP-BURN code were obtained by SWAT2. In the in Figure 4 from the difference among burnupactinides, especially in Pu isotopes, SWAT2(MVP) is conditions. From difference of void fraction 0%, 40%small rather than the average value. For some isotopes and 70%) and difference of cooling time (no-coolingsuch as "'Sm, "'Gdthe differences from the average and 5-year cooling), there are 6 kinds of calculationof other codes became large. However, some of the cases (See Table 2 The neutron histories at eachmeasurement values including 151 Sm and "'Gd are not burnup step in SWAT2(MVP) was set to 600,000.listed in Ref 10. Moreover, burnup chain model each The calculation results of k-infinity to each voidcode is different from each code. All things fraction are shown in Figure 5. In these figures,considered, it is impossible to make a direct discussion average values over all participating calculation codesabout difference of calculation results of 15'Sm and in Ref. II are also described. The SWAY2 calculation155Gd. results agree well i with the average value.
Comparison of burnup distribution in the assembly
Table I Comparison of calculation results of is shown in Table 3 The burnup distribution of
OECD/NEA/NSC Phase-113 benchmark SWAT2(MVP) agrees comparatively well, thoughobtained by using SWAT2 and MVP-BURN there is a difference a little for the average value. The
Ratios of calculation results to burnup of a fuel rod with Gd2O3 is decreasing as thevoid fraction rises in the in-channel. The burnup of
average value in Ref IO fuel rods beside the water rod such as 7 and 9, areIsotope 27.35 [GWd/MTU] larger than 40 GWd/tHM of assembly average value,
(after 1870 days ooling) contrary to the fuel rod around Gd2O3 fuel. Calculation
SWAT2 MVP-BURN results of nuclide compositions are shown in Table4.MVP" SRAC95"
234u 0.99 0.93 1.00
1.01 1.01 1.01 Table 2 Benchmark cases of Phase-IIII3
238u 0.95 0.98 0.96 Case Void Fraction[%] Cooling- 1.00 1.00 1.00 Time[year]
_"Pu 0.89 0.96 0.90 1 0 0239pu
0.96 1.00 0.97 2 0 50.95 0.98 0.95 3 40 0
"Tu 1.02 1.01 1.00 4 40 5_"Pu 1.05 1.01 1.00 5 70 0
PTAm 1.00 0.99 0.97 6 70 5237 Np 0.84 0.95 0.8714 'Sm 1.05 1.06
_T'Sm 0.85 0.87 0.897WSm 0.97 0.96 0.98
-T-'rSm 0.79 0.81 0.78 2Q2 3152sM 0 � .(D:!:0.91 1.05 0.93 . .... .-"TNd 0.99 0.99 0.98 3 Q2.GG 111 DG Q__r'�d 1.01 1.01 1.00 GQU I G 2-3-TEu 1.04 1.02
-7'5'Gd 0.67 0.62 0.66 2 (ID 01 01�! Q2Calculation results of WAT2 using MVP module.
*2 Calculation results of WAT2 using SRAC95 module. I 01 I GI )Q2*3 Q 0 ..Not obtained due to the limitation of the applicablenuclides. G I I GI Q2. .. ...... .
2 G 01 01 G). Q(Do3.2 OECD/NEA Phase-111B Benchmark Problem
The calculation model of OECD/NEA burnupcredit criticality safety benchmark Phase-11113 is I3VrR8 x assembly which have aranged one water rod at 4.9wt-/.UO, 2.3wt-/.UO,
the center.") In this assembly, five types of fuel rodshaving different initial uranium enrichments are 3.6wr/.UO, �) 3.0wt1/U02+4.5we/Gd2C
allocated. Only one type of ftiel rods is with 30 wt% 3-0Wt'/U02 (�) Water Rcd
of Gd2O3. The lattice geometry is shown in Figure 3.The channel box is surrounded by 8.5-mm-thick water,and the reflective boundary condition is imposed Figure 3 Lattice geometry of Phase-IIII3 benchmarkoutside the 15.24 cm-square ftiel assembly cell. Fuel problemrods are classified into nine kinds of fuel rods shown
-490 -

JAERI-Conf 2003-019
1.25
-SWAT(MVP)#2 (3 �i. 3 2 1.207 0 SWAT(SRAC95)......... ...''. & ]R :-�5 .. ... . EB Average
.(B 1.15D2� #5 #6 7 #5:1��Z' 1.10 ..... .....
#6 g#8 #9 #6 3....... ...
#7 #89 #9 #41.00
#7 9 #40..... 0.95
#6: R#i #9 #9 R#8 30.90
0 5 1 0 1 5 20 25 30 35 40
8 �1 7 #6 #5 13umup[GWd/fl-1h4]
(a) 0% void condition
1.25
-SWAT(MVPFigure 4 Position number of fuel rods for lattice 1.20 ....... .. . 0 SWAT(SRAC95)
EB Averagegeometry of Phase-IIIB benchmark problem1 .1 .............. ......................
I. Io
4. Conclusion 1.05i ......
1.00We revised SWAT code system to develop SWAT2,
the new version of SWAT, by incorporating the 0.95
continuous energy Monte Carlo code, MVP. It enables0.90
us to conduct detailed burnup calculation using 0 5 10 I L5 2L 2L5 3'0 3'5 40
ORIGEN2.1 code with latest nuclear data and precise Bumup[GWd/tHM]
treatment of neutron absorption in arbitrary geometry. (b) 40% void conditionFor the verification of SWAT2, the burnup calculationwas carried out on OECD/NEA burnup creditcriticality safety benchmark problem$ Phase-113 and 1.25
Phase-11113, and the calculation results were compared SWAT(MVP)1.20 SWAT(SRAC95)
with the average value of calculation results of burnup Averagecalculation code of each organization. In Phase-113 1.15 . ...........
calculation, Pu238 calculation result by.4a, ].Io
SWAT'2(MVP) became about IO% low compared withthe average value of Re I . This trend was similar to 1.05 ............
the tendency to MVP-BURN. Moreover, it became237 1.0010%ormorelowerthantheaveragevaluefor Npin
SWAT2(MVP) and MVP-BURN calculation results. 0.95
In the Phase-11113 calculation, k-infinity and the0.90burnup distribution showed the almost same tendency 0 10 IL5 2L 2�5 k A 40
as the average values of Ref H. The nuclide Bumup[GWd/tHMj
composition calculation results have lowered more (c) 70% void conditionthan the average value for 238PU, 237NP, and 243 Am as
well as Phase-113. It is necessary to perform theverification by comparison with the post irradiation Figure Comparison of k-infmity in Phase-11113examination data, and to understand the characteristics benchmark result of WAT2of a nuclear data file.
The following two improvements are in scope:(1) building the SWAT library based on the
JENDL-3.3. ")(2) introduction of the predictor-corrector method in
preparation of cross section data required forbumup calculation.
- 491 -

JAERI-Conf 2003-019
Table 3 Pinwise burnu p results for Phase-IIIB bench ark problem
Position 0% void 40% void 70% void
No. SWAT2 Average 13 S 2 Average SWAT2 AverageMVP` SRAC95 MVP SRAC95 MVP,1 SRAU957
#1 37.8 35.4 36.9 39.6 37.3 38.5 41.4 39.3 40.1#2 38.7 38.3 39.0 39.5 39.4 39.9 40.1 40.5 40.6#3 42.2 41.2 41.2 42.8 41.9 41.6 43.4 42.5 41.8#4 40.3 40.9 40.4 40.6 41.4 40.6 40.7 41.9 40.7#5 38.9 39.1 39.0 39.0 39.0 39.0 39.0 38.8 38.9#6 31.0 31.0 31.7 30.7 30.6 31.6 30.5 30.1 31.4#7 43.6 44.7 43.6 42.9 43.6 42.7 42.1 42.4 41.9#8 42.3 44.0 43.1 41.3 42.7 42.1 40.7 41.4 41.4#9 44.2 45.4 44.5 43.0 44.2 43.6 42.2 43.0 43.0
Average 39.9 40.1 40.0 39.9 40.1 40.0 39.9 1 40.0 1 40.0I --- w2
*3 Result from SWAT2 using MVP module. Result from SWAT2 using SRAC95 module.The average value of the calculation result shown in Ref I .
Table 4 Results of calculation for Phase-IIIB benchmark pro lem (5 year cooling)0% void 40% void 70% void
Nuclide MVP/ SRAC95/ MVP/ MVP/ 51 MVP/ MVP/ SRAC95/ MVP/Average" Average"' SRAC95*' Average SARvAerCa9ge SRAC95 Average Average SRAC95
234U 0.99 1.04 0.95 0.99 1.05 0.94 0.99 1.06 0.94235u 1.00 1.04 0.97 1.00 1.03 0.97 0.98 1.02 0.96236u 0.98 0.98 1.00 0.98 0.98 1.00 0.98 0.98 0.99238u 1.00 1.00 1.00 1.00 1.00 1.00 1.00 1.00 1.00
238PU 0.89 0.95 0.94 0.88 0.94 0.94 0.86 0.91 0.95239PU 1.04 1.00 1.04 1.03 1.00 1.03 0.99 0.98 1.01240PU 1.11 1.05 1.06 1.11 1.05 1.06 1.11 1.04 1.06241PU 0.95 1.05 0.90 0.93 1.04 0.90 0.90 1.01 0.89242PU 0.95 1.04 0.91 0.95 1.04 0.92 0.96 1.04 0.93
24 'Am 0.96 1.06 0.90 0.94 1.05 0.90 0.91 1.02 0.89243 Am 0.80 1.03 0.78 0.79 1.02 0.77 0.79 1.02 0.77237 Np 0.98 0.97 1.01 0.97 0.96 1.01 0.95 0.94 1.0195MO 1.00 1.00 1.00 1.00 1.00 1.00 1.00 1.00 1.00
99TC 1.03 1.01 1.02 1.04 1.02 1.02 1.04 1.02 1.0210'Ru 0.99 0.99 1.00 0.99 0.99 1.00 0.99 0.99 1.00103Rh 1.02 1.03 1.00 1.03 1.03 1.00 1.03 1.03 1.00I09Ag i.09 1.14 0.96 1.09 1.14 0.96 1.10 1.14 0.97133cS 1.01 1.02 0.98 1.01 1.03 0.98 1.01 1.03 0.98147sM 1.02 1.03 0.99 1.03 1.03 0.99 1.04 1.04 1.00149sM 0.96 0.92 1.04 0.94 0.92 1.02 0.89 0.89 1.00150sm 1.01 0.94 1.07 1.01 0.94 1.08 1.01 0.93 1.08151sm 0.90 1.04 0.87 0.88 1.03 0.85 0.82 0.99 0.83152sM 0.92 1.10 0.83 0.90 1.12 0.80 0.88 1.15 0.76143 Nd 0.98 1.01 0.97 0.98 1.01 0.97 0.98 1.01 0.98145Nd 1.00 1.01 0.99 1.01 1.01 1.00 1.01 1.01 1.00153 Eu 1.01 0.94 1.07 1.01 0.94 1.08 1.01 0.93 1.09155 Eu 1.00 0.93 1.07 0.94 0.86 1.09 0.87 0.79 1.10155 Gd 1.40 1.23 1.14 1.31 1.15 1.14 1.21 1.06 1.15156 Gd 1.40 1.40 1.01 1.39 1.39 1.00 1.39 1.39 1.00157 Gd 1.37 1.55 0.88 1.42 1.58 0.90 1.42 1.58 0.90158Gd 1.41 1.41 1.00 1.41 1.41 1.00 1.41 1.41 1.0013 1Xe 0.99 1.03 0.96 0.99 1.03 0.96 1.00 1.05 0.96
-2 Ratios of WAT2 calculations result using MVP module to average value in Ref IL-3 Ratios of WAT2 calculations results using SRAC95 module to average value in Ref. H.
Ratios of SWAT2(MVP) calculations results to SWAT2(SRAC95) calculations results.
- 492 -

JAERI-Conf 2003-019
References 8) T. Nakagawa, K. Shibata, S. Chiba, T. Fukahori, Y.1) T. Mori, M. Nakagawa and M. Sasaki, Nakajima, Y. Kikuchi, T. Kawano, Y. Kanda T.
"Vectorization of Continuous Energy Monte Carlo Ohsawa, H. Matsunobu, M. Kawai, A. Zukeran T.Method for Neutron Transport Calculation," Watanabe, S. Igarashi, K. Kosako, and T. Asami,J Nucl. Sci. Technol., Vol. 29, No.4, p.325 1992). "Japanese Evaluated Nuclear Data Library Version
2) K. Okumura, T. Mori, M. Nakagawa and K. Kaneko, 3 Revison-2: JENDL-3.2," Nucl. Sci. Technol.,"Validation of a Continuous-Energy Monte Carlo 32, 1259 1995).Burn-up Code MVP-BURN and Its Application to 9) K. Tasaka, J. Katakura, H. hara, T. Yoshida, S.Analysis of Post Irradiation Experiment," J Nucl. Iijima, R. Nakashima, T. Nakagawa, and H.Sci. Technol., Vol. 37, No. 2 pp. 128-138 2000). Takano, "NDC Nuclear Data Library of Fission
3) Zhiwen Xu, Pavel Hejzlar, Michael J. Driscoll, and Products - Second Version," JAERI-1320, JapanS. Kazimi "An Improved MCNP-ORIGEN Atomic Energy Research Institute 1990).Depletion Program (MCODE) and Its Verification 10) M.D.DeHart, M.C.Brady, and C.V.Parks,for High-Burnup Applications," Proc. PHYSOR "OECD/NEA Bumup Credit Calculational2002 Int. Conf. on New Frontiers ofNuclear Criticality Benchmark Phase-1-13 Results,"Technology: Reactor Physics, Safety and ORNL-6901, Oak Ridge National LaboratoryHigh-Performance Computing, Seoul, Korea, Oct. (1996).7-10, 2002 2A-04 2002). 1 1) H. Okuno, Y. Naito and K. Suyama, "OECDNEA
4) K. Suyama, H. Mochizuki and T. Kiyosumi, Burnup Credit Criticality Benchmarks Phase IIIB:"Revised Bumup Code System SWAT: Description Burnup Calculations of BWR Fuel Assemblies forand Validation Using Postirradiation Examination Storage and Transport," JAERI-Research 2001-01,Data," Nuclear TechnoloU, Vol 138, No.2, pp NEA/NSC/DOC(2002)2 2002).97-1 0 (May 2002). 12) K. Shibata, T. Kawano, T. Nakagawa, 0. Iwamoto,
5) K. Okumura, K. Kaneko and K. Tsuchihashi, J. Katakura, T. Fukahori, S. Chiba, A. Hasegawa, T."SRAC95 ; General Purpose Neutronics Code Murata, H. Matsunobu, T. Ohsawa, Y. Nakajima T.System," JAERI-Data/Code 96-015, Japan Atomic Yoshida, A. Zukeran, M. Kawai, M. Baba, M.Energy Research Institute 1996) [in Japanese]. Ishikawa, T. Asami, T. Watanabe, Y. Watanabe, M.
6) Allen G. Croff, "A User's Manual for the ORIGEN2 Igashira, N. Yamamuro, H. Kitazawa, N. YamanoComputer Code," ORNL/TM-7175, Oak Ridge and H. Takano: "Japanese Evaluated Nuclear DataNational Laboratory (July 1980). Library Version 3 Revision-3: JENDL-3.3, J Nucl.
7) K.J.Notz, "ORIGEN2, Version 21 Release Notes," Sci. Technol., 39,1125 2002).CCC-37 1, pp 200-208 (August 199 1).
- 493 -

JAERI-Conf 2003-019 JP0450095
Development and Verification of Monte Carlo Burnup Calculation System
YoshihiraANDO", Kenichi YOSHIOKA', Ishi MITSUHASHI1, Koichi SAKURADA1 and Shungo SAKURAJ2'Toshiba Corporation, 41 Ukishima-cho, Kawasaki-ku, Kawasaki 210-0862, Japan2T
oshibaCorporation, 8Shbmgita-choIsogo-kuYokohmna235-8523,Japan
Monte Carlo burnup calculation code system has been developed to evaluate accuratevarious quantities required in the backend field From the Actinide Research in a NuclearElement (ARIANE) program, by using, the measured nuclide compositions of fuel rods inthe file] assemblies irradiated in the commercial Netherlands BVrR, the analyses have beenperformed for the code system verification.
KEYWORDS. burnup calculation, spectrum calculation, ARL4NEprogram, JENDL-3.ZJNDC- V2, MCNP code, ORIGEN2 code
1. Introduction PC-method enable us to retain good accuracy incoarse burnup step even in geometry with large ab-
Accurate evaluations of fuel composition, neu- sorber such as Gd rod.tron/gamma production, radioactivity and decay heat The system flow diagram is shown in Fig.l.for a spent fuel are requested in the backend field.Fuel compositions of spent fuels are basic quantities Mcfor the criticality safety analysis. Neutron/gamma pec ross
production and decay heat evaluations are important Cale ra
for the spent fuel transportation cask shielding designand the spent fuel management in a storage pool Ra-dioactivity evaluation of irradiated structure material eutron pectrumis needed in the economical radioactive disposal. 0-20McV n te 0
Accurate radiochemical measurement for actinide, 147 groups Cross Section0 - 2OMeV, 147 grofission and activation products for MOX and U02 404 nuclides
ftiels irradiated at various burnups in PWR ad BWR Data Base
conditions were carried out in te ARIANE program') JENDL-3.2, JEF-2.2
To meet various demands in numerous nuclear BROND-2
fields, we have developed a Monte Carlo burnup cal-culation code system in which Monte Carlo neutron MCNPAS IRESAS
p2and photon transport code MCN ) and a versatile Effective one group Infinite ution onetion for group Cross ctio
code for calculating the buildu ad decay of nuclides nuchoess scoccisidered in fiir nuclide not
in nuclear materials ORIGEN2 ) are used. This system MCNP considered in4CNP
has been verified through the analyses for measurednuclide compositions of BATR ftiel rods examined inthe ARIANE program. We participated in the raryARIANE program as a member of the collaborationstudy with Japanese BVrR utilities.
ns an
2. Features of the System decay Decay DataLibrary
(JNDC.V2
To prepare the system applicable to wide fieldsfrom the present WR reactor analysis to various ORIGEN2
analysis related to backend fields and future reactor Buildup and decay
studies is the major purpose of our study. Calculation
To have no restriction in the treatment of geometry, Fig. System Flow Diagramburnup chain and nuclides, the MCNP code and the
ORIGEN2 code are selected in the system. Further- The procedure of the calculation will be explainedmore, parallel process management is applied to im- along the flow diagram shown in Fig.l. Firstly, MCNPprove the calculation efficiency and Predic- calculates neutron spectrum with the groups structuretor-Corrector method (PC-method) is adopted as inte- (147 groups) corresponding to infinite dilution crossgration method in the burnup calculation. The section library and effective one group cross section.
Corresponding author, Tel. 81-44-288-8132, Fax. 81-44-270-1806, E-mail: yoshihira.ando�toshiba.coJp
- 494 -

JAERI-Conf 2003-019
Secondly, the IRESXS code prepares one group cross Table 2 Fission Products considered in Neutronsections in the infinite dilution condition for all reac- Spectrum Calculation for standard LVVR fuels
tions of nuclides considered in ORIGEN2 and install Category Nuclidesthem in the public ORIGEN2 cross section library. In HI, 16, Se79, Kr83,Rb85,Y89this step, fission product yield (FP yield) data in the Zr9 Zr92,Zr93,Zr95,Zr96,Nb95public ORIGEN2 cross section library are optionally
4) Mo95, Mo96, Mo97, Mo98, Mo99,replaced by them evaluated in JNDC-V2 . Thirdly, M0100,
the MCNPXS code install effective one group cross Tc99, RuI00, Rul0l, R002, RuIO3,sections in the modified ORIGEN2 cross section li-brary prepared in the second step. Cross sections and R004,FP yields in the public ORIGEN2 cross section ibrary RuIO5, RuIO6, RhIO3, RhIO5, PdIO4,are almost updated by the processing of lRESXS and PdIO5,MCNPXS. Finally, ORIGEN2 calculation is per- MM, PdIO7, Pd108, AgIO9, U10,formed using the ORIGEN2 cross section library pre- FPs Cdlll,pared in the third step. These steps are repeated till the (93) Cdl 13, Inl 15, TeI29m, I 127,1129,113 ,target burnup with PC method. 1135, Xel3l, XeI32, XeI33, XeI34,
The cross section library for MCNP is prepared by Xel35,NJOY'). XeI36, CsI33, CsI34, CsI35, Cs]37,
Special features of this system are summarized as BaI34follows BaI37, BaI38, Ba140, aI39, CeI40,
(i) Free geometrical restriction Ce]41,(ii) Latest neutron cross sections and FP yield data CeI42, CeI44, rl4l, rI43, NdI42,
are available NdI43,(iii) All decay chains and FPs can be explicitly Nd 144, Nd 1 45, Nd 146, Nd 147, Nd 1 48,
considered in the burnup calculation, NdI50, PmI47, Pml48g, Pml48m,(iv) PC-method is adopted as the integration PmI49,
method in the burmip calculation Pm, 1 5 1, Sm 147, Sm 48, Sm 149, Sm 1 50,(v) Parallel process managements are applied. Sm]51, Sm152, SmI54, EuI53, EuI54,
3. Design of the System Eul55, EuI56, GdI54, Gdl55,Gdl56,GdI57, GdI58, Gdl6O, Tbl59
3.1 Neutron Spectrum Calculation In the MCNP calculation, neutron spectrum betweenA large number of miclides except nuclides in- 0 and 20 MeV and effective one group cross sections
cluded in the initial composition arebuild up in thefuel irradiation. However the most part of nuclides for production, absorption, (nfiss), (n,2n) and (n,,yhave small influence on the reactivity and neutron are calculated. (nfiss), (n,2n), (n, y 9 and (n, -y inspectrum because buildup concentration is small. the ORIGEN2 cross section library are updated to theCross section for these nuclides can be calculated in values based on MCNP calculation, in which branch-the infinite dilution condition.. These nuclides are ing ratio data for meta stable state in (n,,y ) reactiondetermined so that the absorption rates of them is less are same as those used in SWAT code 6). One groupthan 0.1% of total absorption rates in all bumup steps. cross sections except (nfiss), (n,2n), (n, -y 9 and (n,In the neutron spectrum calculation for standard LVVR y )" for nuclides considered in the MCNP calculationfuels, 28 actinides shown in Table and 93 Fps are prepared by the IRESXS code, in which one groupshown in Table 2 are considered. cross sections are calculated by the combination of
neutron spectrum obtained in the MCNP calculationTable Actinides considered in Neutron and cross sections included in the infinite dilution
Spectrum Calculation for standard LVrR fuels cross section library. The infinite dilution cross section
Category I Nuclides library includes 404 nuclides taken from JENDL-3.2,Th228,Th230,Th232 ENDF/B-VI, JEF-2.2 and BROND-2. This is preparedPa231,Pa233 by the CRECTJ5 7) code in 147 group structure be-U232, U233, U234, U235, U236, U237, tween and 20 MeV based on point wise cross sec-
Actinides U238 tions for 300K and 900K prepared in JAERI nuclear(28) Np237, Np238, Np239 data center. Neutron spectrums required as CRECTJ5
Pu236, Pu238, Pu239, Pu240, Pu2411 input data were evaluated by the SRAC8) code forPu242 various ftiel types such as BWR, PWR, FBR and
Am241, Am242, Am242m, Am243 ADS.Cm242, Cm244, Cm245 MCNP cross section libraries for the most part of
nuclides are prepared at 300K and 900K and those forspecial important nuclides such as U235, U238, Pu239,
495 -

JAERI-Conf 2003-019
Pu240, Pu241 and Pu.242 are prepared at 300K and condition is assumed as 40 bum up steps 32 cpus in5OK-wise temperature points between 800K and parallel process and 0.5 million neutron sources at1250K so as to consider accurately Doppler effect. each burnup step
3.2 Burnup Calculation 4. Verification of the SystemIn a burnup calculation, the PC-method is applied
as the integration method. The PC-method enable us This system was verified by the analysis of meas-to use coarse burnup step even in the calculation for a ured fuel compositions of sample rods from fuel as-BVv'R fuel assembly with Gd bearing fuel rods. The semblies irradiated in the commercial Netherlandscomparison of K-Infinity between PC-method and BVrR examined in the Actinide Research in a NuclearStep-wise method (SW-method) in typical BWR fuel Element (ARIANE) program.assembly is shown in Fig.2.
4.1 Measured BWR Fuel Samples
1.2 Measured BWR ftiels comes from the Dodewaard0 PC-Method plant. Segmented U02 and MOX ftiel rods are fabri-
1.15 0 SW-Methodo- Reference cated by Japan Nuclear Fuel and0 BELGONUCLEAIRE respectively.
Control blade location1.05 0
1 1.8 2.6 3.2 1 3.2 3.2 2.6
0.95 8 2.6 U021 Gd 3.2 3.2 3.2
0.9 . . . . . I 3.2 Gd 3.2 3.2 Gd 3.20 5 10 15 20 25 30 35
Burnup (Gwd/t) 3.2 13.2 1 3.2 W 3.2
Fig.2 Comparison of K-Infinity in BATR Fuel 3.2 3.2 Gd IMOV
Assembly Calculation2.6
Figure.2 shows PC-method agree well with refer- Segmented Ro&
ence calculation, but SW-method bring about large W- Water Hole
error in burnup with active Gd effect, in which refer- Fig.4 Enrichment Distributionence means the calculation by the fuel design code in Dodewaard AssemblyTGBLA9) well verified.
3.3 Parallel Process Management The samples proposed for analysis have respectiveCalculational scheme with parallel process man- burnups from 35 to 55 GWd/Mt. Enrichment distribu-
agement is shown in Fig.3. tion in Dodewaard assembly is shown in Fig.4. Maincharacteristics of measured rods is shown in Table 3and the cutting positions are located from the bottom
0 C-w-him C--.", with low void histories to the top with high void his-
tories in sample rods as shown in Fig.5.
MCMC.kdMi-
Table 3 Main characteristics of measured rods
Group DM DU
Sample DMI DW OM3 DMA Out
0. Z.W i- S.6- 11. AU B-.p Rgk. Iffaidialicin DODEWAARD BWR
Fuel ype Mox U02
FW manufacturer BELGONUCLEAIRE JNFP-Wm P M-%-Mf
CW.WA.. f- All .0- Fuel cluvaclarislics:
2% / U (W%) 0.2 4.9Pu / U N (W%) 6.4
Pu rL& Li u (w %) 71
Assembly of origin Y014 Y012 Y013 Y013
Fig.3 Calculational Scheme End of irradiation 01193 01192 OV93 01193
Fuel rod identification MD9 MD5 W7 U004
Parallel process managements are applied to MCNP Calculated sample burnup 55.6 33.546.5 81 54.4
and ORIGEN2 calculations. Standard calculation time GWdAM)
needed in the bumup calculation for typical BWR fuel Source Laboratory CEN CEN
assembly is about hours, in which the calculational
- 496 -

JAERI - Conf 2003-019
Q=V"RDYOU Y012 Y013 M We perform the analyses with some 50 burmipmap MD5 U07 UW4 steps and cooling period between operating cycles, in
which 0.5 million neutron sources are generated inMCNP code at each burmip step. Statistic errors in
W4
absorption rates for each nuclide are almost within 1.The number of regions tallied in fuel pellets is I for
DMI -R regular rods and 24 6 regions along radial with 4x9Odeg. sections) for Gd rods.
13-up C"Wti- ith 1-.di.6- Nt.
U U
Fig.5 Cutting Positions in Sample Rods1&-d Qm i AR[AMF &am
f. P- D-ty
Selected isotopes for ARIANE program are 18 ac-tinides and 31 FPs as shown in Table 4.
CIE I <
Table 4 Selected Isotopes in ARIANE program
Major Actinides
U U232,U234,U235,U236,U238
Pu I Pu238,Pu239,Pu240,Pu24lPu242 Fig.6 Analytical Flow Diagram
Minor Actinides In the comparison with calculated and measured
NP Np237 values are performed at end of life (EOL date
Am Am241,Am242mAm243 discharged date from the core) Measurements wereperformed at the different dates different from the
Cm Cm242,Cm243,Cm244,Cm245 EOL date. Experimental data corresponding to EOL
Fission Products date were estimated at BELGONUCLEAIRE in
Volatiles 1129, Csl33,Csl34,Csl35,Csl37 ARIANE program. We discussed the decay correction- for the isotopes with precursors). In the evaluation of
Metallic Sr9OMo95,Tc99,Ru I 1,Ru I 06,Rh 1 03, EOL data, the concerned nuclides and their precursors
AgIO9,Sbl25 were considered in the decay period. For some nu-
Cel44,Prl47,Ndl42,Ndl43,Ndl44, clides, it was cleared the effect of precursor withoutmeasured data was important in our study. So, we re-
Lanthanides Ndl45,Ndl46,Ndl48,Ndl5O, evaluated EOL data independently from measured
Sml47,Sml49,Sml 50,SmI5 1,Sml52,- data by ORIGEN2 calculation considering the con-
Eul53,Eul54,Eul55,Gdl55 centration for the precursor without measured data, inJ which the concentration was calculated by the neu-
FP) tronics code. These calculations were performed forThe transuranium. (TRU) and fission products several nuclides such as Sm 149 and Gd 1 55. For theses
are accumulated in the spent fuels and these reactivity nuclides, reevaluated EOL data are used in the com-effects are significant in high burnup fuels. Accurate parison.measurements by using various methods of analysis
and by exchanging aliquots between laboratories for 4.3 Analytical Resultscross checking have been performed in ARIANE pro- We discuss on the results for a U02 samplegram and these measured data are useful for the veri- (DU- 1) and four MOX samples DM 12,3,4) exposedfication of bumup calculation system. in the Dodewaard BWR (located in Netherlands). In
4.2 Analytical Method our analysis, measured values at SCK-CEN laboratoryIn the analysis, we adopt the assembly model with are compared with the calculated values.
the actual enrichment distribution shown in Fig.4, in (I)Actinideswhich irradiation histories such as power density, void Figures.7,8 and 9 show the result for U-isotopes,fraction are given in the ARIANE program. And the Pu-isotopes and TRUs. The error bars on these andreflective boundary condition is assumed. The assem- subsequent plots refer to 95% confidence level.bly average power density used in the analysis are Accuracy for U and Pu isotopes is well satisfactoryadjusted so that the calculated Nd-148 concentration except U234 in DU-1. It may come from the assump-agree with the measured one. Analytical flow diagram tion of initial U234 composition not shown inis shown in Fig.6. ARIANE program report. Accuracy for Pu-isotopes is
well satisfactory
- 497 -
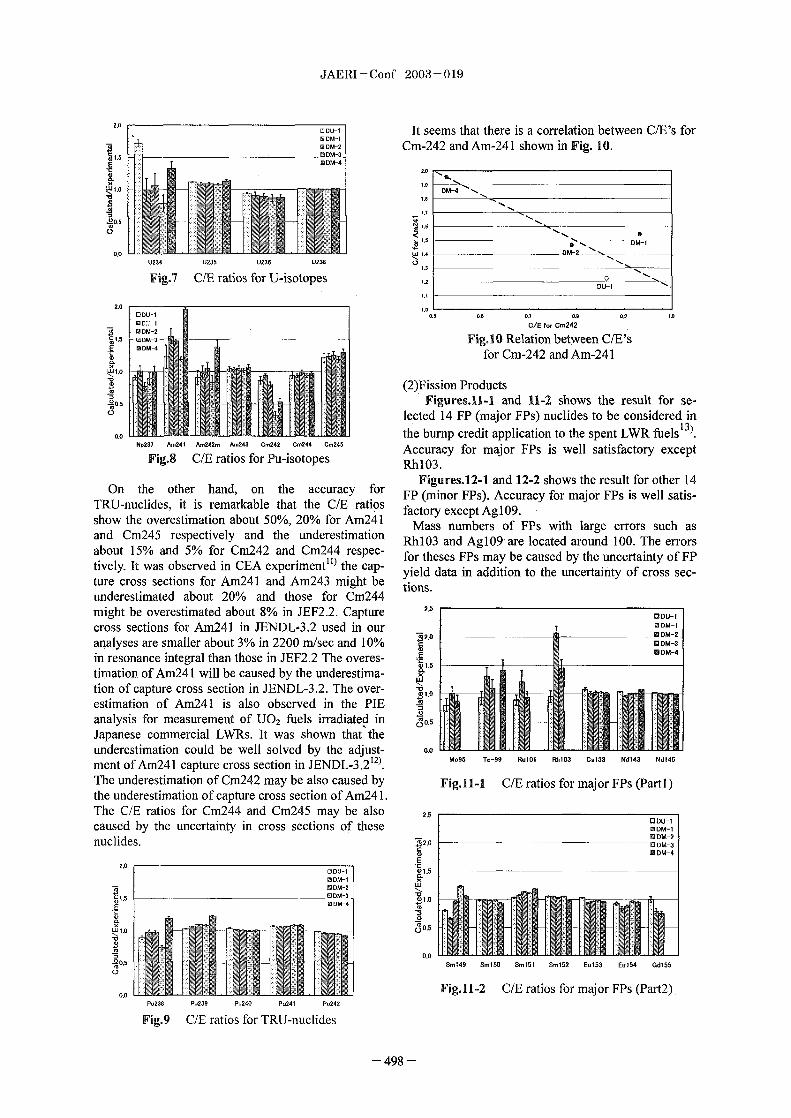
JAERI-Conf 2003-019
2.0U O-1 It seems that there is a correlation between C/E's for
+ MOM-10 DM-2 Cm-242 and Am-241 shown in Fig. 10.13DM-3
E D-42.0
.0 D4'
1.7-60.5
0.0 W1.4 13 M-2U234 U235 U236 U23B C)
Fig.7 CIE atios for U-isotopes �2 0DU-1
2.0 1.013DU-1 0.5 DA 0.1 0.9 0.9 1.0Dc:.i 1 WE f C.24213 DM-2
1.5 El DM-3 Fig.10 Relation between C/E'sMDM-4
for Cm-242 and Am-241
(2)Fission ProductsFigures.11-1 and 11-2 shows the result for se-
lee ed 14 FP (major FPs) nuclides to be considered in0.0 13)
the bump credit application to the spent WR fuelsNp237 M241 A.242. A.243 C�242 C.244 .245 Accuracy for major FPs is well satisfactory except
Fig.8 C/E ratios for Pu-isotopes RhIO3.
On the other hand, on the accuracy for Figures.12-1 and 12-2 shows the result for other 14TRU-nuclides, it is remarkable that the C/E ratios FP (minor FPs). Accuracy for major FPs is well satis-
show the overestimation about 50%, 20% for Am24I factory except Ag 09.and Cm245 respectively and the underestimation Mass numbers of FPs with large errors suc asabout 15% and 5% for Cm.242 and Cm244 respec- RhIO3 and AgIO9-are located around 100. The errorstively. It was observed in CEA experiment") the cap- for theses FPs may be caused by the uncertainty of FPture cross sections for 24I and Am243 might be yield data in addition to the uncertainty of cross sec-
underestimated about 20% and those for Cm244 tions.might be overestimated about 8% in JEF2.2. Capture 2,5 C3DU-1
cross sections for Am24I in JENDL�3.2 used in our M DM-10 DM-2
analyses are smaller about 3% in 2200 m/sec and 10% 2.0 13 DM-343 0 DM-4
in resonance integral than those in JEF2.2 The overes- ECLtimation of Am24I will be caused by the underestima- X
tion of capture cross section in JENDL-3.2. The over-estimation of Am24I is also observed in the PIEanalysis for measurement Of U02 fuels irradiated inJapanese commercial ATRs. It was shown that theunderestimation could be well solved by the adjust- 0.0
12) M.95 T-99 RuI01 RhIO3 C.133 Nd143 NdI45ment of Am241 capture cross section in JENDL-3.2 .The underestimation of Cm.242 may be also caused by Fig.11-1 C/E ratios for major FPs (Part I)the underestimation of capture cross section of Atn24 1.The C/E ratios for Cm.244 and Cm245 may be also 2.5
0DU_1caused by the uncertainty in cross sections of these D_1
M DM-2nuclides. � 20 DDM-3
NDM-4E
2.0 CODU-1 Q 1.5ODM-10 DM-2 WE3 DM-3M DM-4E
75
W10
O..10.5 S.149 S.150 S.151 S.152 Eu 1 53 E.154 Gd155
(,.OFig.11-2 C/E ratios for major FPs (Part2).
N238 Pu239 P.240 P.241 P.242
Fig.9 C/E ratios for TRU-nuclides
498 -

JAERI-Conf 2003-019
3.0 13 DU I AcknowledgementsMDM-1
2.5 MDM-2 - We would like to express our thanks to Drs.13DM-3ODM-4 M.Lippens and D.Boulanger in BELGONUCLEAIRE
E2.or for helpftil replies to our questions on measured data.0CL
LU 1.5
References-1.0 I ) M.Lippens, D.Boulanger, J.Basselier, S. Winckel,
B.Wemli and M.Betti, "Source Term Assessment:ARIANE Programme", ICEM'O I the 8-th Interna-
RON AgIO9 1129 C.134 CS135 C037 C.144 tional Conference on Radioactive Waste Manage-
Fig.12-1 C/E ratios for minor FPs (Partl) ment and Enviromnent Remediation, Sep 30 Oct4 2001).
3.0 E3DU-1 2) Judith F. Briesmeister, Ed.: MCNP - A GeneralMDM-1 Monte Carlo N-Particle Transport Code, VersionM DM-2 -0 DM-3 4A", LA-12625 1993)0 DMA
E2.0 3) A. G. Croff: "ORIGEN2: "A Versatile ComputerCode for Calculating the Nuclide Compositions
Ujug and Characteristics of Nuclear Materials", ReprintS from Nuclear Technology 62, p.335-p.351 Sep-
tember, 1983).4) K.Tasaka, J.Katakura, H.Ihara, T.Yoshida, S.Iijima,
R.Nakasima, T.Nakagawa and H.Takano eds,Ndl 42 NdI44 NdI46 WM NdI50 S.154 E.155 "JNDC Nuclear Data Library of Fission Products -
Fig.12-2 C/E ratios for minor FPs (Part2) Second Version -", JAERI 1320 1990)
5. Conclusion 5) MacFarlane R.E and Muir D.W "The NJOY Nu-clear Data Processing System Version 9 1LA- 12740-M (1 994)
We have developed Monte Carlo burmip calcula-tion code system and verified by the analyses for 6) K.Suyama, T.Iwasaki and N.Hirakawa, "Integrated
Burnup Calculation Code System SWAT",measured nuclide compositions of MOX and U02 fuel JAERI-Data/Code 97-047 1997)rods in the fuel assemblies iadiated in the commer- 7) T.Nakagawa, "A Computer Program for Compila-cial Netherlands BVTR examined in the ARIANE pro- tion of Evaluated Nuclear Data in the ENDF/Bgram. Experimental data obtained in this program are Format", Private Communication 1999).used as reliable and useful data. 8) K. Tsuchihashi, Y. Ishiguro, K. Kaneko, M. Ido,
Accuracy of analyses for U and Pu isotopes and "Revised SRAC Code System," JAERI-1302important FPs are quite good (IC/E-I I< 5%). But, large (1986)
calculational errors are found in Am-241 with +20% 9) M. Yamamoto, et al., "Development and Valida-for U02 rod and +50% for MOX rod and in several tion of TGBLA Lattice Physics Methods", Proc.FPs such as Rhl 03 and AgIO9. ANS Topical Mtg. on Reactor and Shielding, Chi-
Major part of calculational errors must be caused by cago, Illinois, Sep. 17-19, 1984 V61.1, p.364the uncertainty included in the used cross sections. (1984).
Our concluding remarks are as follows. 10) M.Lippens, D.Boulanger, Private CommunicationMonte Carlo burnup calculation code system (2001).developed in this paper has been verified I 1) S. Cathalau and A.Benslimane: "Qualification ofthrough the analysis for MOX and U02 fl JEF-2.2 Capture Cross-Sections for Heavy Nu-rods. fuels irradiated at various bumups in clides and Fission Products", Proc. of Global'95,BVvrR in addition to the former analysis for U02 p. 1537-p. 1544 (1995)fuels irradiated in Japanese commercial 12) Y.Ando and Y.Ohkawauchi, "Requests on NuclearB)7;RI2).. Data in the Backend Field through PIE Analysis",
This system enables to reduce large margin as- JAERI-Conf 2003-006 (2003)sumed in the present criticality analysis for 13) Working Group on Nuclear Criticality SafetyLVVR spent fuels 14). Data: "Nuclear Criticality Safety Handbook Ver-
It is desired that the nuclear data files for sion2", JAERI 1340 (1999)Am-241, Cm-242 and Cm-244 will be revised 14) US Department of Energy Office of Civilian Ra-to improve the accuracy. dioactive Waste Management: "Topical Report on
Our Monte Carlo bumup calculation code system Actinide-Only Burmip Credit for PWR Spent Nu-will be used in wide fields from the present LWR re- clear Fuel Packages", DOE/RW-0472 Rev.2
actor analysis to various analysis related to backend (1998)fields and also in future reactor studies.
- 499 -

JP0450096JAERI-Conf 2003-019
Monte Carlo Criticality Source Convergence in a Loosely Coupled FuelStorage System
Roger N. Blomquist* and Ely M. GelbardArgonne National Laboratory, Argonne, IL, 60439 USA
The fission source convergence of a very loosely coupled array of 36 fuel subassemblies withslightly non-symmetric reflection is studied. The fission source converges very slowly from auniform guess to the fundamental mode in which about 40% of the fissions occur in one comer sub-assembly. Eigenvalue and fission source estimates are analyzed using a set of statistical tests simi-lar to those used in MCNP, including the "drift-in-mean" test and a new drift-in-mean test using alinear fit to the cumulative estimate drift, the Shapiro-Wilk test for normality, the relative error test,and the "IIN" test. The normality test does not detect a drifting eigenvalue or fission source.Applied to eigenvalue estimates, the other tests generally fail to detect an unconverged solution, butthey are sometimes effective when evaluating fission source distributions. None of the tests pro-vides completely reliable indication of convergence, although they can detect nonconvergence.
KEYWORDS. Monte Carlo, source convergence, criticality calculations
1. Introduction and/or more neutron generations used to converge thefission source, 2) perform similar calculations with a
Loosely coupled systems provide special chal- different initial source and compare the solutions, andlenges for Monte Carlo analysts because of difficulties (3) apply statistical tests that provide the analystin convergence of the unaccelerated power method warnings when the fission source is insufficientlynormally applied to the fission source iteration and converged. In this report, we apply several tests thatbecause of inaccuracy of the usual variance computa- may be used in criticality calculations to assess theirtionS. .2.3 Source convergence difficulties can be due sensitivity and reliability, using as a test problem theto the inherent unsuitability of the unaccelerated checkerboard problem from the OECD/NEA bench-power iteration method, because of undersampling, or mark set.because of other statistical problems. The fissionsource iteration acceleration methods available in de- 2. Checkerboard Benchmark Configurationsterministic codes do not always work well because ofthe noise inherent in the Monte Carlo method, al- The checkerboard benchmark problem is an arraythough some mitigating algorithmS4,5,6 are in use. of spent ftiel subassemblies stored in a rectangularThe OECD Nuclear Energy Agency Expert Group on 3x24 array. Half of the array cells are empty (wa-Fission Source Convergence in Criticality Safety ter-filled), and the 36 subassemblies are arranged inAnalyses has specified four source convergence the array in a checkerboard pattern, alternating withbenchmark problemS,7 each of which has some com-bination of adverse stochastic and deterministic fissionsource convergence characteristics. The first of theseproblems, a loosely coupled spent fuel storage array, is LM LM LM I kq Ustudied in this work; it exhibits deterministic slow --M VI Pq 6q M
convergence and rather complex stochastic behavior 30andi&wahm;420=tA
in a particularly difficult combination.Slow convergence, by itself, is not a problem in Ridposbm(1�136DerntA27ansWm (23�)
Monte Carlo or deterministic calculations unless it isundetected and mistaken for convergence by the ana- 0.5anstedvAn
lyst. When this happens, the estimated fission dis- 2,5anYduW
tribution will be in error, and in some problems, theestimated eigenvalue can be substantially un- Sq_ * wfi- (15xjW 4an pfthl W
der-predicted, with adverse implications for criticalitysafety analysis. There are several obvious remedies:(1) perform additional calculations with more histories Fig. Checkerboard spent ftiel layout
Corresponding author, Tel. 630) 252-8423, Fax. 630) 252-4500, E-mail: RNBlomquist�anl.gov
- 500 -

JAERI-Conf 2003-019
water channels (Figure 1). The top and bottom of the to the Monte Carlo algorithm, exacerbated, as we shallsystem are 30cm water reflectors, three of the sides see, by the very low coupling between nearest ftielare 40cm concrete reflectors, and the fourth (long) bundles. Because the eigenvalues of these systemsside is a 30cm water reflector. depend only on the flux sape inside a subassembly
In accordance with the benchmark Monte Carlo and not on its distribution among subassemblies, theparameter specifications," the problem was run using eigenvalue should converge fairly quickly, even if thethe VIM Monte Carlo code9 with 1000, 2000 and 5000 global fission source distribution does not.histories per generation, and, for every given number The simplest test problem is one in which onlyof histories per generation, results were computed for two columns of the checkerboard are explicitly in-500 active generations with 20, 40 and 100 genera- cluded. Thus in this problem the whole configurationtions skipped. In all the above problems, the starting contains only two fuel cells alternating with two watersource was selected randomly with uniform probabil- cells. The most complicated in this series involves 12ity distribution throughout each fuel cell, and uni- fuel cells alternating with 12 water cells in 12 columnsformly among the 36 fuel cells. The checkerboard and 2 rows. All calculations were done with 500 activebenchmarks were also run with starting sources only generations, skipping 20 and 100 generations. The netin certain individual cells. In our calculations, genera- number of starters per generation, in each test, is thetions were collected into batches of 20, and, unless closest integer to N,otherwise specified, all means and variances werecomputed on the basis of this batching. These cal- N = 5000 M3 6, (1)
culations and those made at other institutions, reported so that the mean number of starters per fuel cell iselsewhere, 0 are not analyzed here because a) probably nearly the same in all test problems, and nearly theno analyst would run the problems this way, and b ifany did it would quickly be seen from the evolving same as in the original checkerboard benchmark withfission distributions that such runs were very far from 5000 histories per generation. In order to introduceconverged in all cases. Instead, we will examine the flux-shape drifts, which turned out to be important insource convergence behavior of a few of the specified the checkerboard benchmark series, the guessedcases and some simplified systems. source was raised in the left half of each problem con-
The NEA source convergence benchmarks are figuration and lowered in the right half, so that theunusual in that it is not the exact solution of the phys- ratio between the two halves was I.S.ics problem that is of interest. Instead, the focus is on One of the important characteristics of the check-the rate and extent of convergence, the accuracy of erboard benchmark problem is the influence of theuncertainty estimates, and the efficacy of statistical concrete reflector on the fundamental mode. Thetests. Therefore, in our work, we used a simplified geometrical arrangement of the fuel subassembly lo-version of this problem both for the benchmark com- cations in the array is uniform, so one would expect aparisons and for the additional analysis of its conver- fairly uniform flux shape from one end of the array togence properties and the statistical tests reported here. the other. Initial observations of the flux distribution,The subassembly pin lattice was homogenized by however, indicated a flux peak in the only cell withvolume weighting, but the surrounding water and two faces adjacent to concrete 1,3). To bound thestructure in each cell in the pool array were retained to effect of the surrounding materials, two calculationspreserve the inter-cell coupling. The reflectors sur- were completed for a single subassembly cell sur-rounding the storage array were also retained as speci- rounded on four sides by 40cm of either concrete orfied. The homogenization no doubt changes the ei- water. Those eigenvalues, 08778 /- 00012 andgenvalue and perhaps the converged fission source 0.8285 +/- 00012, respectively, confirm that cell 1,3)distribution somewhat, but should not have a large ought to contain a large peak reminiscent of that in theeffect on the rate of convergence or the utility of sta- Whitesides probleml and that the fission fraction intistical tests. that cell is the parameter that most directly indicates
For our own purposes we performed several other fission source convergence.
analyses. We reran the uniform source problem with 3. Statistical Tests and Results25,000 histories per generation, again with the same
three alternative numbers of skipped generations, all Monte Carlo codes normally attempt to providewith 500 active generations (identified as cases 37-39). information sufficient for conclusions about the statis-Additional analysis was performed on an even more tical validity of the Monte Carlo estimates, and somesimplified problem set with a xM (M even) array provide warnings when tests indicate computationalwith periodic boundary conditions in the x-y plane and results may be untrustworthy. In MCNP, 1 1 for example,reflection in z. These systems represent an infinite one set of these tests is intended for general use, whilelattice, so the true fission fraction for each of the M a second group is aimed at eigenvalue problems; butsubassembly locations is precisely I/M, and even if a in principal, all the tests could be used for both eigen-non-uniform source guess is used, the salient feature value and fixed source calculations. We discuss, here,of the Monte Carlo solution is statistical variation due five tests, all of them variants of tests in MCNP, and
50 -

JAERI-Conf 2003-019
describe their weaknesses when applied to eigenvalue vided into halves, but now means are computed, sepa-problems. It would seem on theoretical grounds that rately, over each half If, for example, k- is the meanthey can all be misleading when estimates from suc- of k over the first (top) half of the run, and kB thecessive generations are very strongly correlated. This mean over the last (bottom) half, define the eigenvalueweakness is particularly troublesome in difficult difference in standard deviations, AkT = k7 - kB)1ajk,
problems (like the checkerboard benchmark problem) where ak is the standard deviation in this difference.because so many eigenvalue problems are difficult AkTB is used, in this test, as the parameter whose valueprecisely due to strong intergenerational correlations. determines the acceptability of the eigenvalue estimate.Thus in using these tests it is necessary to proceed In MNP a computed mean is acceptable if the mag-with caution, relying on a background of empirical nitude of kT - kB is within the 99% probability limit,studies. assuming that kT - kB is normally distributed. This
All tests will be applied, here, to the checkerboard means here that kT - kB < 2.6cdk, where 2.6alk is theproblems specified in the criticality safety benchmark approximate width of the 99% confidence interval. Inseries. In addition we examine their performance in the case of fission fraction in fuel cell i we use thesimplified problem configurations described above. corresponding parameter AFTBj.
The quantities of interest in all of our studies are ei- The results of the drift tests described above aregenvalues and fission fractions, i.e., the ratios of the both listed in Table I for the simplest of this series offission rates in each fuel cell to the total fission rates. tests, computation of the system with only two fuelIn all tests the active generations were grouped into cells, skipping 20 generations (one batch). Here j
batches, each consisting of 20 consecutive generations. is the Monte Carlo estimate of the standard deviationThe basic data in all tests were averages of estimates of the mean fission fraction, using all active batches.over each of the 25 active batches. Variances in all Interpreting ffttj), as the amount of drift along thetests will be estimated without regard for inter-batch fitted line we see that, over and above statistical fluc-correlation. tuations, the Monte Carlo estimates in the later
batches of the iterative process have drifted by about3.1 Two Drift-in-Mean Tests 4.4% and 4.4%, respectively, in the two fuel cells.
Two drift-in-mean tests will be considered. Both These drifts, by our standards here, are only slightlyinvolve separate consideration of Monte Carlo esti- larger than the quoted standard deviations. Further wemates over the first and second halves of a Monte note that both values of AFTBj lie in the acceptableCarlo run. Both are designed to determine whether range. We don't know what would happen if the num-Monte Carlo estimates are fluctuating randomly about ber of generations were increased, so it isn't possiblea stable mean, or about a mean which has drifted sig- to make a rigorous connection between the computednificantly during the active generations of the Monte drift-parameters and the errors due to nonconvergenceCarlo computation. of the power iterations. The most we can hope for is
The first drift test is a variant of the test in which that there will be a useftil correlation between thesethe averages from each half of a calculation are com- parameters and the magnitude of such eors. In col-pared to detect drift. In our variant, we compute a cu- umn six of Table I the .4F6(ttj),'s give remarkablymulative mean for each tested variable (i.e., eigen- good estimates of the true errors in the Monte Carlovalue or fission fractions) after each generation. Then means, but one can't expect that this will be true inwe construct a linear least-squares-fit (with slope a) to general. We note also that both values of A.FTBj lie inthe cumulative means in the last half of the Monte the acceptable range.
Carlo calculation. Strictly speaking (again because of Table 1. Cell fission fractions for a 2-fuel cell s temintergenerational correlations) no statistical interpreta-tion can be assigned to the fitting coefficients. Still the Q�fitting parameters do give us some indication as to the
SZE W. -.,- 0 extent to which cumulative means are drifting. The Li. 1. W -4 - U Q
expression 1 0.478 0.013 2.8 -4.4 4.2 0.74 2.0
JF(fitj) = 13 a)IF(i,25) (2 2, 0.522 0.013 2.7 4.4 -3.8 0.74 -2.0
is the relative drift in fission fraction; F(ij) being the In the fitting process one computes the covariance
average of the fission fraction estimates in fuel cell i, between cumulative means and generation-numbers,
taken over all active batches up through active batchj. and the corresponding correlation coefficient is a good
Here, because there are 25 active batches, the halves measure of the goodness-of-fit. In fact suppose we
into which the active batches are divided are the first denote the cumulative mean afterj generations as Xp
12 and the last 13. The same test is also applied to and the variance of this running mean as 02(X) . Let
cumulative eigenvalue estimates. yo) = a*j + be the equation of the linear fit to X,
In the second drift test we have copied one of the and (F2 (y) be the variance of this line. In other words
MCNP tests which examines drifts over all active g2(y) would be the variance ofX if all the cumulative
generations. Here again the Monte Carlo run is di- means lay exactly on the linear fit. The magnitude of
502 -

JAERI-Conf 2003-019
the correlation coefficient is, then, the ratio of the happen if the run were continued. Both tests can bestandard deviation of y to the standard deviation of X, misleading as indicators of the reliability of means ini.e. the correlation coefficient tells us how much of the individual cells. Thus in cell 4 the large values ofstandard deviation of cumulative means is attributable AF(fiti) and A.FTBi indicate, incorrectly, that theto linear drift. Monte Carlo standard deviation is much too small,
It wil I be seen that the signs of Affit, i) and AFTB, i while in fact it's reasonably accurate. Clearly bothare the same, suggesting that each ofthe (iffs have, tests are misleading in this one cell, but taken as ain effect, drifted in a single direction throughout the whole they both agree, and do tell us that the Monterun. Generally Affitj),, and A.FTBi give complemen- Carlo power iterations are still far from convergencetary information The latter parameter gives us infor- after 600 generations.mation as to a general drift in Fij) throughout the run, We note also that the correlation coefficients arewhile (fitj) characterizes the behavior of the n- very large, except in cell 6 This means that in mostning averages, (ij), nearer the end of the run. Thus cells the generation-to-generation changes in fissionone may find that ATBj is relatively large while fractions are not random but very systematic, and al-AF(fiti) is small. In such a case it may be that the most linear ftinctions of the iteration number. Suchpower-iteration process is close to convergence by the behavior is not at all what one would expect of a set ofend of the run. On the other hand if AF(filj) is large, means nearing convergence, and is an important indi-particularly if the magnitude of the correlation coeffi- cation that, in fact, that the Monte Carlo power itera-cient is close to one, then this process is probably still tions are far from convergence.far from convergence.
Table 3 Eigenvalues in idealized systems with 2 4 ,Table 2 Cell fission fractions for a 12-fuel cell and 12 fuel cellssystem F
PU y UU U
I 0.111 7) 6.4 33 21 0.90 2.1 2 500 0.8608 3) -0.02 -0.56 0.00 -0.08
2 10.116 (5) 4.4 139 16 10.98 4.6 (ref.)3 0.110 4) 3.9 32 5.2 0.85 1.0 2 20 0.8582 25) -0.50 -0.94 -0.30 -1.9
2 100 0.8568 24) -0.31 -0.88 -0.46 -2.04 0.0860 44) 5.1 3.2 16 0.94 5.1 20 0 -0.42 1.25 0.0853 49) 5.8 2.4 4.2 0.76 1.4 4 .8572 (15) 0.10 0.83
6 0.0654 59) 9.1 -21 -0.7 -0.08 -7.7 4 100 0.8585 16) -0.05 0.86 -0.11 -0.577 0.0667 64) 9.5 -20 -32 -1.0 -4.9 8 20 0.8607 13) -0.07 -0.43 0.00 0.17
8 100 0.8606 13) -0.16 -0.83 0.00 -W8 10.0699 (58) 8.3 1-16 -20 1-0.97 -2.4 1 12 20 0.8613 (10) -0.13 -0.53 0.05 -1.8
9 0.0650 44) 6.7 -22 .- 15 -0.95 -1.7 12 100 0.8614 (10) -0.08 -0.78 0.11 -1.810 0.0619 52) 8.5 -26 -28 -0.91 -4.8I 0.0724 68) 9.4 -13 -4.0 0.54 -0.6812 0.0903 (58) 6.5 8.4 14 0.84 in Table 3 we list similar results for eigenvalues
in a range of simplified test problems, including a
Table 2 lists the same data for the corresponding reference two-cell computation with 1000 active gen-problem with twelve fuel cells, again skipping one erations, 500 skipped and 5000 histories per genera-batch. On comparing Tables I and 2 what stands out tion. Generally, on examining both sets of test-resultsmost clearly is that (1) the quoted relative standard in Table 3 we would be led to conclude that the ei-deviations in the computed fission fractions are much genvalue computations are pretty well converged.larger in Table 2 than in Table 1, and 2) that in Table Thus, for example, the magnitude of the net drift in k2 the true errors are much larger than the standard in the last half of the iterative process is everywheredeviations estimated by the Monte Carlo code. Both of less than twice the computed standard deviation. Itthese observations are consistent with our a priori seems surprising, therefore, to fd such large correla-assessment that the Monte Carlo process in the second tion coefficients in cases I and 2 of Table 3 since Ta-problem should be much noisier and more slowly ble I suggests that the flux shape in case I is wellconvergent than in the first. But we see also that 3) converged. One might speculate that such strong driftsAFOWi)j, when it is much larger than oFilF(i,25), could be caused, somehow, by the tilt in themight provide a useful warning that the computed source-guess. We find, however, that the computedmean may be grossly incorrect. Again we see that the correlation coefficients remain just as high in magni-signs carried by ffiti) and ATR,, tend to be the tude when the tilted source-guess is replaced by a flatsame, though they do differ in cell 6 Thus here a drift source-guess. At this point the high correlation coeffi-in the bottom half of the run again indicates an overall cient is not understood. It will be seen, however, thatdrift in the same direction. As before, we note that the approximate error generally decreases as the netresults of both tests depend on drifts over generations number of histories increases, again suggesting thatalready run, and don't necessarily tell us what would the errors are primarily due to statistical effects, per-
- 503 -
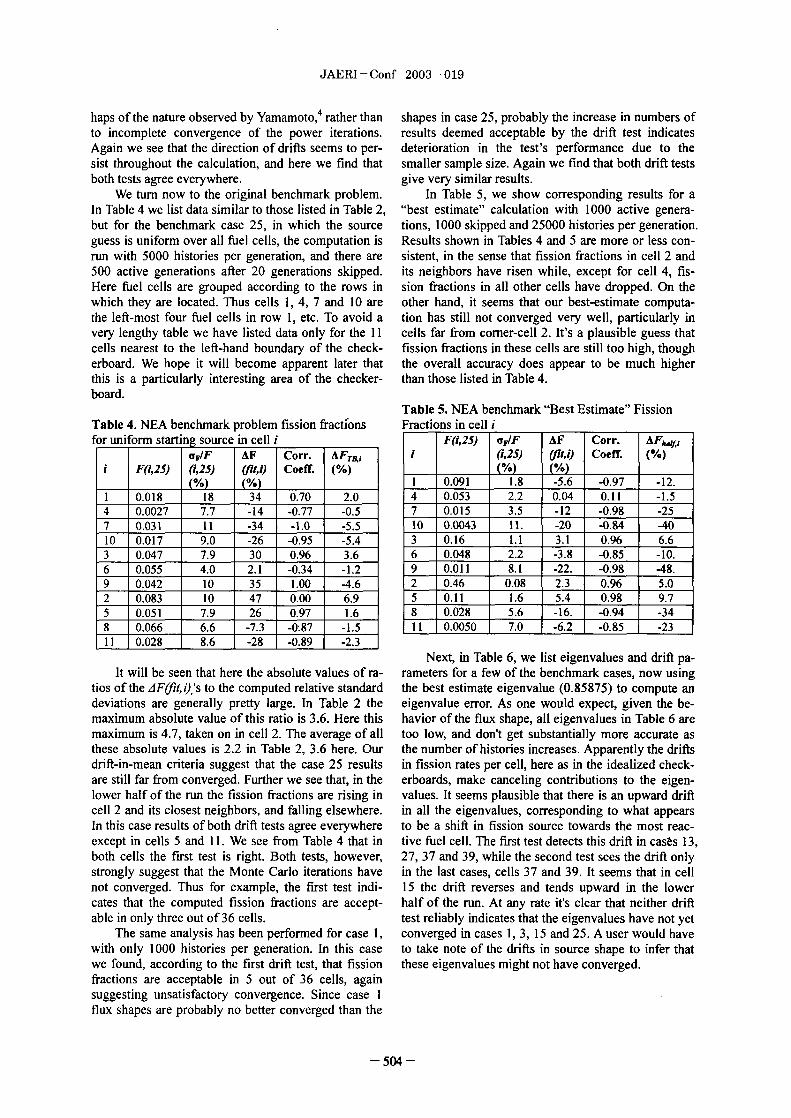
JAERI-Conf 2003-019
4haps of the nature observed by Yamamoto ,rather than shapes in case 25, probably the increase in numbers ofto incomplete convergence of the power iterations. results deemed acceptable by the drift test indicatesAgain we see that the direction of drifts seems to per- deterioration in the test's performance due to thesist throughout the calculation, and here we find that smaller sample size. Again we fimd that both drift testsboth tests agree everywhere. give very similar results.
We turn now to the original benchmark problem. In Table 5, we show corresponding results for aIn Table 4 we list data similar to those listed in Table 2 "best estimate" calculation with 1000 active genera-but for the benchmark case 25, in which the source tions, I 00 skipped and 25000 histories per generation.guess is uniform over all fuel cells, the computation is Results shown in Tables 4 and are more or less con-run with 5000 histories per generation, and there are sistent, in the sense that fission fractions in cell 2 and500 active generations after 20 generations skipped. its neighbors have risen while, except for cell 4 fis-Here fuel cells are grouped according to the rows in sion fractions in all other cells have dropped. On thewhich they are located. Thus cells 1 4 7 and 10 are other hand, it seems that our best-estimate computa-the left-most four ftiel cells in row 1, etc. To avoid a tion has still not converged very well, particularly invery lengthy table we have listed data only for the I I cells far from comer-cell 2 It's a plausible guess thatcells nearest to the left-hand boundary of the check- fission fractions in these cells are still too high, thougherboard. We hope it will become apparent later that the overall accuracy does appear to be much higherthis is a particularly interesting area of the checker- than those listed in Table 4.board.
Table 5. NEA benchmark "Best Estimate" FissionTable 4 NEA benchmark problem fission fractions Fractions in cell ifor uniform start ng source in cell i F(i,25) OFIF AF Corr. AFkifi
aFIF AF Corr. AFTBi i (i,25) (flli) Coeff.i F(i,25) (425) (ri 1, i) Coeff. (%) (%) (%)
(%) (%) 1 0.091 1.8 -5.6 -0.97 -12.1 0.018 I 3 4 0.70 2.0 4 0.053 2.2 0.04 0.11 -1.54 0.0027 7.7 -14 -0.77 -0.5 7 0.015 3.5 -12 -0.98 -257 1 0.031 1 -34 - .0 1 -5.5 1 0 0.0043 II. -20 -0.84 -401 0 0.017 9.0 -26 -0.95 -5.4 3 0.16 1.1 3.1 0.96 6.63 0.047 7.9 3 0 0.96 3.6 6 0.048 2.2 -3.8 -0.85 -10.6 0.055 4.0 2.1 -0.34 -1.2 9 0.011 8.1 -22. -0.98 -48.9 0.042 1 0 3 5 1.00 -4.6 2 0.46 0.08 2.3 0.96 5.02 0.083 1 0 47 0.00 6.9 5 0.11 1.6 5.4 0.98 9.75 1 0.051 7.9 26 1 0.97 1 1.6 8 0.028 5.6 -16 -0.94::t -348 0.066 6'6 -7.3 4.87 -1.5 11 0.0050 7.0 -6.� -0.85 1 -231 1 0.028 8.6 -28 -0.89 -2.3
Next, in Table 6 we list eigenvalues and drift pa-It will be seen that here the absolute values of ra- rameters for a few of the benchmark cases, now using
tios of theJF(fi1j),'s to the computed relative standard the best estimate eigenvalue 0.85875) to compute andeviations are generally pretty large. In Table 2 the eigenvalue error. As one would expect, given the be-maximum absolute value of this ratio is 36. Here this havior of the flux shape, all eigenvalues in Table 6 aremaximum is 47, taken on in cell 2 The average of all too low, and don't get substantially more accurate asthese absolute values is 22 in Table 2 36 here. Our the number of histories increases. Apparently the driftsdrift-in-mean criteria suggest that the case 25 results in fission rates per cell, here as in the idealized check-are still far from converged. Further we see that, in the erboards, make canceling contributions to the eigen-lower half of the ran the fission fractions are rising in values. It seems plausible that there is an upward driftcell 2 and its closest neighbors, and failing elsewhere. in all the eigenvalues, corresponding to what appearsIn this case results of both drift tests agree everywhere to be a shift in fission source towards the most reac-except in cells and I . We see from Table 4 that in tive fuel cell. The first test detects this drift in cas6s 13,both cells the first test is right. Both tests, however, 27, 37 and 39, while the second test sees the drift onlystrongly suggest that the Monte Carlo iterations have in the last cases, cells 37 and 39. It seems that in cellnot converged. Thus for example, the first test indi- 15 the drift reverses and tends upward in the lowercates that the computed fission fractions are accept- half of the run. At any rate it's clear that neither driftable in only three out of 36 cells. test reliably indicates that the eigenvalues have not yet
The same analysis has been performed for case 1, converged in cases 1 3 15 and 25 A user would havewith only 1000 histories per generation. n this case to take note of the drifts in source shape to infer thatwe found, according to the first drift test, that fission these eigenvalues might not have converged.fractions are acceptable in out of 36 cells, againsuggesting unsatisfactory convergence. Since case Iflux shapes are probably no better converged than the
- 504 -

JAERI - Corif 2003-019
Table 6 Selected Benchmark Series Eigenvalues for cepts a sample-set of any size, but in its original formseveral benchmark cases the test is intended for use with sample-sets of no
more than 50 elements. This is no difficulty in ourpresent application since the sets we treat will be, here,samples from 25 active batches.
For 25 gaussian samples the 95% limits for W areU -.t WI 1000 20 0.8524 0.19 0.34 1.8 -0.74 0.918 and 0985, and the expected value is about 095.
(16) Considering the eleven cells listed in Table 4 we fd3 1000 100 0.8529 0.28 0.17 0.81 -0.69 6 cells for which W is in this range. These are cell 2,
.(18) with W = 095; cell 5, in which W = 092; cell 6 W =13 2000 20 0.8516 0.32 0.06 0.90 -0.83 0.98; cell 9 with W = 093; cell 10, W = 096; and cell
(10) I I with W = 094. Yet we have seen that for these cells1 52000 100 0.8518 9) 0.22 0.09 -0.57 -0.82 the VIM standard deviations grossly overestimate the25 5000 20 0.8529 7) 0.14 0.22 0.94 -0.68 accuracies of the computed fission fractions. The27 5000 100 0.8538 6) 0.18 0.59 1.8 -0.58 Shapiro-Wilk test is, however, not without value in37 25000 1 20 10.8527 3) 0.11 0.51 3.8 -0.71 this case in that it rules out as unacceptable cells 1 4
25000 1 100 10.8532 3) 0.10 0.34 3.4 -0.65 and 8, three of the four cells acceptable according to
Concluding this section we note that here, in most the drift tests.cases, both drift tests give the same results, with the In Table 2 one finds that, by the Shapiro-Wilk test,first test slightly better than the second. It will-be re- the fission fraction estimates are unacceptable only incalled that, according to our first test, an estimate is cells and I though we know that the computedunreliable if the "relative drift" is greater than twice fission fractions are substantially incorrect in mostthe estimated standard deviation while, according to cells. In Table 4 all but the case 15 eigenvalue are ac-the second test, it is suspect if the drift-to-uncertainty ceptable, according to this test, though in fact they are
ratio is greater than 26. It can be shown that the test all substantially too low.ratios in both tests are closely related, and one might One difficulty here, seems to be that theargue that the tests should be inter-compared with the Shapiro-Wilk test (if one can judge from the discus-same critical values of test-ratios in both. Where one sion of Ref. 12) is intended for use with uncorrelatedof the tests fails it is usually not strict enough, so one samples. A priori it can't be assumed to give us anymight be inclined to reduce the critical information about correlations, or their effects on con-drift-to-uncertainty ratio from 26 to 2 The test results fidence intervals, but we see in Table 3 that the corre-for both tests would then become still closer. Gener- lation coefficients are high in of the 6 cells whereally the drift parameters do seem to give useful infor- the Shapiro-Wilk test is satisfied. In cells 9 and I I the
cumulative fission fractions in the lower 13 batchesmation as to the state of convergence of the flux are very nearly linear functions of the batch number.shapes. We see however, from Table 6 that test results It's easy to see what would be the value of W for sam-for eigenvalues are much less satisfactory. ples exactly linear in batch number, and to show that
3.2 Shapiro-Wilk Test this value would not depend on the slope or interceptHere, the successive estimates of fission fractions of the line on which the samples lie. For 10 and 25
and eigenvalues are subjected to the Shapiro-Wilk test such samples we find that W = 097, and for 20 sam-for normality. ples W = 096. Furthermore one can show that, if x(i)
This test is intended to tell us whether or not a = a*i + c, and if c is a normal random variable, then WMonte Carlo estimate is non-nally distributed. There may well be in the acceptable range. We conclude thatare two reasons for checking normality, both con- the Shapiro-Wilk test is of questionable value if suc-nected with confidence intervals. First, if an estimate cessive iterates are strongly correlated. Here it shouldisn't normally distributed the distribution may be be noted that we have applied this test only to 25pathological. It might, for example, have a very long, batches of generations, not to the generations them-low tail, in which case one could run into scattered selves, and the test may be used differently in MCNP.
outliers (i.e., estimates very far from the mean), so 3.3 Relative Error Testthat the true variance may be very difficult to estimate. The MCNP manual" suggests that, in aBut even if outliers aren't a problem, and even if indi- fixed-source problem, a Monte Carlo mean should bevidual samples are drawn from Gaussian distributions, regarded as untrustworthy if R, the relative standardthe probability that the true answer is outside of the deviation, is greater than 10%. In difficult problemsstated confidence interval may be underestimated estimated standard deviations are often too small, andwhen successive estimates are strongly positively cor- this is true both for fixed source and eigenvalue prob-
related. 12 lems; but, in fixed source problems, as the number ofThe Shapiro-Wilk test takes a set of values of a sample particles increases the relative eor in esti-
random variable and computes a corresponding variate mated standard deviation goes to zero. This will not beW. There is at least one variant of this test which ac-
- 505 -

JAERI-Conf 2003-019
true in eigenvalue calculations if intergeneration cor- from correct. In contrast, a converged mean can berelations are strong enough. If intergenerational corre- notably incorrect only when Monte Carlo biases arelations are very strong and positive, relative standard significant. Although it's not completely clear whendeviations will continue to be strongly underestimated this will be true, there seems to be no indication that,even as the number of starters per generation goes to in practice, such biases have affected neutronics ei-infinity. For this reason the R test will tend to be much genvalue calculations.less useful for eigenvalue problems than for fixed Here perhaps the worst failure of the precedingsource problems. Still there seems to be no reason tests is their failure to detect nonconvergence in fourwhy an estimate that fails the R test should not be of the eight eigenvalues listed in Table 6 For this rea-flagged as unreliable. In our computations, however, son we list values of ACTB for these cases in Table 7.the R test would have only one effect, i.e., it would We see that the observed relative drifts in C can belead us to label as questionable the cell-I fission frac- very small, certainly too small to warn. the user thattion in Table 4 ruled acceptable by both drift tests. the stated confidence intervals for eigenvalues are
grossly underestimated. Thus in case I the computed3.4 IN Test R, R=ulk, is incorrect by 074%: but the relative drift
Finally, we consider a test we'll call "the I IN test" in R is only 002% of R. Such a small shift in thein which one looks for a IIN behavior of the relative estimated relative error is much too small to warri thestandard deviation during N batches. The IIN test is user that the computed eigenvalue may be in error byused to see whether the estimated uncertainty is de- as much as 074%.creasing at a rate consistent with increasing samplesize. In our implementation, it is applied only to the Table 7 Relative drifts ACTB, in C = R*sqrt(N), forbottom half (the last 13 batches) of the calculation to computed eigenvalues for several benchmark casesdetermine the behavior of the cumulative mean. Let Approx. AC,, RNT 14 if we skip one batch) be the batch-number of Error Mthe first of the final 13 active batches of a Monte MCarlo run that skips Nkp batches, and NB = Nkp + N 1 -0.74 -0.02 0.16be the number of the last of the active batches, where 3 -0.69 -1.1 0.18N 25, here) is the net number of active batches. It's 13 -0.83 -2.1 1 0.12the purpose of this test to determine whether, in the 15 -0.82 3.8 0.11final batches, the relative standard deviations, R6), of 25 -0.68 -4.4 0.11the estimates x6), decrease like lsqrt(N6)), where 27 -0.58 0.35 0.08NO) = j + I - NT is the number of batches in the 37 -0.71 28 0.04range from NT down to and includingj. 39 -0.65 2 0.04
For this purpose we first compute the cumulative 4. Conclusionmean of x, XY), where j ranges from NT through NB.
Let RB6) be the standard deviation of the mean of all We've seen above that, in dealing with eigenvaluex's with batch-numbers in the range from NT throughj, problems, none of the tests we've discussed can tell usand define the relative error R6 = RB6)IX6). Define reliably that specific Monte Carlo computational re-Qj = RU)*sqrt(j-NT+1), which ought to be constant sults are trustworthy, though some tests can give usfor normally distributed x's produced from a con- useful warnings when they're not. We are not inter-verged fission source distribution. Now, given QA ested here in difficulties due to weaknesses in model-we fit the line ing, or in Monte Carlo biases. Generally we mean by
"untrustworthy results" results which, from the user's)V = ac*(i-NT+1 + bc (3) point of view, are unacceptably inaccurate, stated with
to the values of the C's. Finally, we compute the misleadingly small confidence intervals.relative change in C6), ACTB = a*131Q, over the Thus anomalies in source shapes are, here, oftenrange of the fitted line (the bottom half of the Monte associated with detectable drifts in local source densi-Carlo calculation). The magnitude of ACTB is then to ties. We see, however, fi-om Table 6 that anomalies inbe taken as a measure of the fractional change in C eigenvalues do not necessarily reveal themselvesand correspondingly, a measure of the magnitude of through corresponding drifts in the computed eigen-the uncertainty of R, due to the drift in C. Here, h,,, values. In Table 6 all the computed eigenvalues areis the mean of C over the active batches. too low, and are presumably drifting upwards as the
It should be noted that, even if the computed computation progresses; but apparently the eigenvaluevalue of R has converged, we still have no assurance drift is often too slow to detect, being hidden by noise.that the converged value gives us a valid confidence The computation of confidence intervals is gener-interval. If successive values of x have a high correla- ally based on the assumption that specified samplestion coefficient then, even if the MacMillan correc- are drawn from a normal distribution. Since we aretion 13 is applicable (i.e., even if the x's are eigenvalue mainly concerned here with the validity of confidenceestimates), computed confidence intervals may be far intervals, it might be expected that the Shapiro-Wilk
- 506 -

JAERI - Conf 2003 - 019
test for normality would be particularly valuable. This analysis of other sorts of difficult eigenvalue prob-is very likely true in fixed-source problems where the lems.samples are independent; but the Shapiro-Wilk test isapplicable only to independent samples. It does not Acknowledgementsseem to be designed to detect correlations among the Work supported by the U.S. Department of Energy,samples, even though it's usually just such correlations Nuclear Energy Program under Contractthat cause trouble in the estimation of statistical un- W-31-109-ENG-38.certainties in eigenvalue problems. For this reason, thetest's utility is limited if applied to drifting eigenvalues. ReferencesSpecifically, we find that it tends to accept errone- I E. G Whitesides "A Difficulty in Computing theously small confidence intervals when, as is often the k-effective of the World," Trans Am Nucl Soc 14case, the submitted samples are highly positively cor- No. 2 197 1).related. It is, in other words, a test which is particu- 2) R. J. Brissenden and A. R. Garlick, "Biases in thelarly prone to give false negatives. On the other hand Estimation of kff and its Error by Monte Carlothere seems to be no reason to question the test results Methods," Ann. Nucl. Energy, 113, No. 2 pp.when the normality hypothesis is rejected. 63-83 1986).
As already pointed out, one weakness of the 3) E. Gelbard and Albert Gu, "Biases in Monte CarloR-test in difficult eigenvalue problems is that, even as Eigenvalue Calculations," Nucl. Sci. and Eng., 11 7,the number of histories per generation goes to infinity, pp. 19 1994).the relative error in the computed R will often remain 4) T. Yamamoto, et al., "Fission Source of Montelarge and negative. Correspondingly the test often may Carlo Criticality Calculations in Weakly Coupledfail to flag unreliable results. On the other hand, if a Fissile Arrays," J ofNucL Sci. and Tech., 37, No.computational result doesn't pass this test it should be 1, pp. 41-45 2000).viewed with suspicion. 5) A. Mohamed and E. Gelbard, "Stratified
Finally, the IIN test may be misleading for two Source-Sampling Techniques for Monte Carlo Ei-reasons. First, particularly in eigenvalue calculations genvalue Analysis," Proc. Int. Conf On Physics ofthe drift in C, C=R*sqrt(n), may be too slow to see Nuclear Science and Technology, Hauppage, N.Y.,through the noise and, secondly, even if C has con- October 58,1998.verged it may have converged to an erroneous value. 6) N. Smith, "The Unification of MONK - ExtendingAgain, however, if the test detects an unacceptable the Monte Carlo Horizon," Sixth Internationalresult, i.e., an unacceptably large drift, the resulting Conference on Nuclear Criticality Safety, Vol I,warning ought to be taken seriously. Versailles, France, September 20-24, 1999.
In the work above one type of test has not been 7) R. N. Blomquist and A. Nouri, "The OECD/NEAexamined. This is a test based on a comparison of Source Convergence Benchmark Program," Transvarious types of estimators (e.g., track-length estima- Am Nucl Soc, 87 2002).tors, collision estimators, etc.) of eigenvalues or reac- 8) "The OECD/NEA Expert Group on Source Con-tion rates. These different estimators should not dis- vergence in Criticality-Safety Analysis" web site atagree significantly, i.e., their differences should be hitp:Hwww.nea.fr/htmUscience/mMncs/converpenceconsistent with the standard deviation in the differ- /index.html.ences, computed with regard for correlations between 9) R. N. Blomquist, et.al., "VIM--A Continuous En-estimators. Still one can expect that no foolproof test ergy Monte Carlo Code at ANL, A Review of theof this type will be discovered. Theory and Application of Monte Carlo Method,"
The cumulative results of batteries of tests should Proceedings of a Seminar- Workshop,help the Monte Carlo user avoid many serious mis- ORNL/RSIC44, Oak Ridge, TN, April 1980.takes. Further exploration of such batteries of tests, IO) M. J. Armishaw, "A Review of Benchmark I,"using different series of test problems and develop- Trans Am Nucl Soc, 87 2002).ment of new tests would be highly desirable. What is I I)J. F. Briesmeister, Ed., MCNP - A General Montemost disturbing in our results is that tests applied di- Carlo N-Particle Transport Code, Version 4A," Losrectly to eigenvalues have had so little success in de- Alamos National Laboratory 1993).tecting anomalies. After all, in criticality safety appli- 12) S. S. Shaprio wid M. B. Wilk, "An Analysis ofcations it's the eigenvalue that really counts. Our only Variance Test for Normality," Biometrika, 52, 591recommendation has been to infer the degree of con- (1965).vergence of eigenvalues from the degree of conver- 13)D. B. MacMillan, "Monte Carlo Confidence Lim-gence of fission shapes -- not the most satisfactory its for Iterated-Source Calculations," Nucl. Sci.approach because of its complexity. Of course even Eng., 52, 591 1965).such modest conclusions ought to be assessed through
- 507 -

JAERI-Conf 2003-019 JP0450097
Implementation of Convergence Judgment Method toOECD/NEA Benchmark Problems
Takeshi KUROISH11 and Yasushi NOMURA 2'Nuclear Fuel Industries Ltd., Kumatori-cho, Sennan-gun, Osaka, 590-0481, Japan
2Japan Atomic Energy Research Institute, Tokai-mura, Naka-gun, lbaraki 39-1195, Japan
To improve the slow convergence of fission source distribution, fission sourceacceleration methods have been so far developed and incorporated in the ordinary MonteCarlo calculations by using the fission matrix eigenvector. In ICNC2003 a convergencejudgment method involving an effective initial acceleration procedure is proposed by theauthors in the poster presentation, and here, the proposed convergence judgment method ispractically applied to the OECDINEA source convergence benchmark problems. In thisapplication process, some difficulties arise and are investigated to derive a solution to them.
KEYWORDS. con vergencejudgment method, benchmark problem, Monte Carlofissionsource, slow convergence, acceleration methodfission matrix
1. Introduction To estimate the convergence of the obtained kffquantitatively, the convergence judgment method is
In the criticality analyses for a loosely coupled proposed at our poster presentation in ICNC2003').system by using Monte Carlo calculations, the slow This convergence judgment method involves 2 stepsconvergence and the "lost unif' problem should be of criticality calculation for kff estimation calledtaken into account because they sometimes spoil the Batch I and Batch 2 with three suppositions. First,adequacy of the calculated results of criticality. the initial fission source distribution in Batch I isBecause of loose-coupling in the system, the slow preset by the result of the acceleration stage and theconvergence appears with week restoring force of an one in Batch 2 is produced to reverse kff trend.effective multiplication factor kff) and fission source Second, the number of cycles in Batch I and 2 isdistribution toward the convergence in the source estimated by the result of the acceleration stage.iteration'). The "lost unit" is a phenomenon that Third, the kffs in Batch I and 2 is judged to beinsufficient histories per cycle in the random sampling converged in a certain range. To verify theprocess produce a unit in which there are no fission suppositions, in this paper, the convergence judgmentsource points, therefore, the calculation might render method is applied to the OECD/NEA sourceerroneous behavior as if the unit is absent from the convergence benchmark probleMS6).
whole system. If the "lost unit" happens at a certainreactive part in a large system, the calculated kff will 2. Brief Description of Benchmark Problemsbe underestimated, that is referred to the "kff of the'world" problem'). Tree different systems are selected from the
The slow convergence could be iproved by the OECD/NEA source convergence benchmark problemsfission source acceleration method using the fission as shown in Fig. I to 3.matrix eigenvector if the matrix elements areapproximately obtained at a certain cycle in which the 2.1 5x5xi Array of Highly Enriched U Spheresfission source distribution has not converged yet. Figure I shows the geometry of benchmarkThe "lost unit" could be avoided usually by employing problem No. 4 The system consists of 5x5xl arraysufficient histories per cycle with flat initial guess of of 95wtO/o enriched uranium metal spheres and the gapfission source distribution, but an unacceptably large between the spheres is filled with air. All spherescomputing time might be required for the skipped have the same composition. The radius of the spherecycles to converge the fission source distribution in only at the center is 10cm and the others are 871 cm.the ordinary Monte Carlo calculation. Therefore, the The pitch is 80cm. The interactions in neutronpreviously described acceleration method is also reactions between the spheres are weak because ofsupposed to be effective to avoid the "lost unit" or the small solid angle."kff of the world" problem, if the approximatelyconverged fission source distribution is obtained at an 2.2 Infinite Pin Cell Array with Irradiated Fuelinitial stage of Monte Carlo calculation. Effective Figure 2 shows the geometry of benchmarkfission source acceleration methods such as the source problem No. 2 The system consists of infinite arraygeneration method and the acceleration repetition of spent fuel pin with axial bumup profile, which ismethod are proposed and the calculated results are realistically modeled by the non-equidistantly dividedshown in Reference 3 and 4 9 nodes. The burnup at the top part is set to be lower
- 50 -

JAERI-Conf 2003-019
than that at the corresponding bottom part. These Therefore, kW' at the left-top comer of location 1,3)reactive parts are divided by the middle of less is largest of all 36 assemblies, because only thereactive part and coupled each other very loosely. assembly location at this comer is adjacent to concrete
on its 2 side surfaces as shown in Fig. 3.95wt% enriched
5 0 O Q O iurn spherei Air 80cm Horizontal Cross Section
O' Location 1,3): Most reactive assembly with concrete wall on 2 sidesZ. ius of central 728 (cm)
sphere = Ocrn3 rt--O ...... .... ........ . . .........no re te �i: ........ ........r. Radius of the other ....... .. 40
spheres = 871 cm81
2 0 0 (1/8 symmetry could be TIR M MA ......31 12 13 14 15 17 19 ZD 21 22 23modeled in calculation) 30
A
Y 44d' *4CrElFuelaasemblylocation lwaterchannelwaterreflecW
1 2 3 4 5Water gap: 2 1 Sxl 5 lattice Pitch: 27cm
Fig. 1 OECD/NEANSC benchmark problem No.4 4- -WaW rnod"ed I-(5x5xl array of highly enriched uranium metal spheres)
:0.44cmradus 049an Water Channel 27cm
Horizontal boundary: reftective Virtical boundary: vacuumLight Water Wl�h BUMUP
(GWdR)
........................ L4 Virtical Cross SectionZirce 10 30 (cm)..... 20 40r--0.475cm Water reflector 30
Aim ::allies::! 285.7fuel 65 360
r--0.412cm ....20 55
5 3U24 30
LLJ
Cell pitch = 1.33cm (vacuum) Fig. 3 OECD/NEA/NSC benchmark problem No. I
Fig. 2 OECD/NEA/NSC benchmark problem No.2 (Checkerboard storage of fuel assemblies)
(Infinite array of spent fuel pin with axial bumup profile)
3. Calculated Results
2.3 Checkerboard Storage of Fuel Assemblies All calculations in this paper are performed withFigure 3 shows the geometry of benchmark using the continuous energy Monte Carlo code
problem No. 1. The system consists of 36 fresh fuel MCNP4B27) and the cross section library ENDL3.2").assemblies loaded in 240 array of ftiel rack Table I shows the calculation conditions for the initialalternately, which is referred to checkerboard storage. acceleration stage and the both Batches, and totalThe fuel assemblies are filled with water, divided by calculation time of each problem. The accelerationsteel wall of 0.5 cm thickness, water gap of 5cm and procedure is repeated once and tree times in the initialwater channel of 27cm width, and very loosely acceleration stage of the problems No. 4 and No. 2,coupled each other. The system has water boundary respectively. And the source generation method isof 30cm thickness on the top, bottom and I side adopted for the problem No. 1. Calculated results ofsurface of the fuel rack, and concrete boundary of 40 kecm thickness on 3 side surfaces. Although all ff and the fission source distributions are shown in
assemblies are fresh and have the same specification, the following sections.
kff of a isolated single assembly (k.,y") withdifferent boundary condition is different each other.
Table Calculation conditions for initial acceleration stage, Batch I and 2 and total calculation timeProblem No. Initial acceleration stage' Batch I and Batch 2 Total calculation time'4 (Chap. 2 1) 125,000 x 3 + 1) x I acceleration 125,000 x (N+ =20) + 80) 1 1.0 hour2 (Chap. 22) 10,000 x 3 4 x 3 accelerations I 00,000 x (N (=20) + 50) 19.4 hourI (Chap. 23) 50,000 x (5 + 5) x 36 units source generation 200,000 x (N (=I 10) + 50) 4.7 day
Calculation conditions are shown by the number of "histories per cycle x (skipped cycles scored cycles)"5)+: N is the number of skipped cycles in Batch I and 2 estimated by the formula of "N = l log (c) log (p)"
Actual calculated results on a Sun OS/SolarisTm8 machine (Blade I 00)
- 509 -

JAERI-Conf 2003-019
3.1 5x5xl Array of Highly Enriched U SpheresThe initial acceleration stage for the problem No. 4 In Fig. 5, it is found that the reversed kff trends in
gives the dominance ration p=0.9061 1, and the Batch I and 2 are recognized by the mean valuenumber of cycles required for convergence is change, and the convergence is confinned in the rangeestimated to be 40 (here, assuming =0.5 and C= 0-3). of about 2; as shown by the fal results ofAs shown in Fig. 4 the cumulative keff trend (the best cumulative kff. Besides, Figure also shows theestimation by MCNP) without skipped cycles in Batch difficulty to judge convergence by using individualI and 2 shows the asymptotic curve of reversed kff kff with large statistic fluctuation in each cycle.trend as theoretically considered in Reference 5. The unit-wise fission source distribution at eachNevertheless, the kff deference between Batch I and 2 stage is sown in Fig. 6 As shown in Fig. 6 theresults in about 4a at 40th cycle. This relatively initial acceleration gives almost the same result oflarge deference is caused by statistic kff estimation fission source distribution as that in Batch 1. Theinvolving klls in initial cycles, and it is necessary to revision of the fission source distribution for reversedset an adequate number of skipped cycles in both kff trend is adequately performed with multiplying theBatch I and 2 Accordingly, we propose that the lower fission source levels by a factor P =0.5) andformula of N=T1Iog(e)/1og(p) should be adopted for counterbalanced by increasing the higher source level.the estimation of the number of skipped cycles. It is found that the fission source distribution in Batch
2 redistributes toward the convergence and results in1.128 good agreement with that in Batch .
1.126
1.124 10
1.122
1.120 ------
0.1i 1161 114
0.0111`12 iz
(Error rmt�nslo) -W Before Initial Acceleration
0 0: 0.001 -E3- After Initial Acceleration1 0 20 30 40 50 60 70 80 -6- R s of Batch IL N (�O) yd. swd N (-40) yd.. - -0- C=ian for Reversed kelf Trend
4K- Result of Batch 2Said, I Bateb 2 0.0001
Fig. 4 Cumulative kff trend without skipped cycles (3,3) (3,2) (2,2) (2.1) (3,1) (1, 1)
(5x5x I array of highly enriched uranium metal spheres) Locabon of Spheres in Consideration or 1/8 Symme"
Fig. 6 Fission source distribution at each stageThe cumulative kff after N =20) skipped cycles (5x5x I array of highly enriched uranium metal spheres)
(here, assuming T=0.2 and C= 1 0-3) is shown in Fig. .Figure also shows kff's of collision, absorption andtrack length estimators in each cycle during skipped 3.2 Infinite Pin Cell Array with Irradiated Fueland scored cycles. To show the k trend in each When the effective acceleration method 4) is appliedcycle, the mean value is obtained by the average of in the previous stage to Batch I for the problem No. 2,three estimators during ten cycles before and after the the units are defined as axially non-equidistant nodes.concerned cycle as shown by solid line in Fig. 5. The upper region of more reactive part with a peak of
fission source distribution is divided into fine zones,1.130 C- A AW-� X m� �� and the lower region of less reactive part with a very
k_-1-1_il67a*D.DDo1 Lm�=M 1722±0-DD021 low source level is divided into coarse zones. Thei125 acceleration procedure in the initial stage is repeated 3
0 times, and the dominance ratio changes to be 093,1.120 a 0.91, and 090 after each acceleration procedure.
This suggests that the fission matrix elements and the1.115 fission matrix eigenvalue for the ftmdamental ode
6 and the higher order mode are iproved by theA
1.110 repetition of acceleration procedure. The number of
skipped cycles is estimated to be 20 (here, assuming1.105 -q=0.5 and =10'3
0 20 40 so 80 100 120 140 160 180 200NP201 W=2D11 The revision of fission source distribution for
S.p�d y�. so � rcI.. -Ikwpd y.W. W -. d
Beth I - 7� 1 reversed kff trend in the previous stage to Batch 2 isFig. kff of various estimators in each cycle and performed with multiplying the lower fission source
cumulative kff trend with skipped cycles estimated per unit length (because the definition of unit is(5x5xl array of highly enriched uranium metal spheres) axially non-equidistant) by a factor P =0.5) and
- 51 -

JAERI-Conf 2003-019
counterbalanced by increasing the higher source formula of N=T1Iog(e)/1og(p) to be 2090 (here,levels. assuming r=1 and &=10-'), and it suggests the very
The relative fission source distribution at each stage slow convergence in the ordinary Monte Carlois shown in Fig. 7 The vertical axis in Fig. 7 shows calculation for the problem. For convenience' sake,the relative fission source per unit length in log scale. the number of skipped cycles in the convergenceAs shown in Fig. 7 the very low source levels are judgment method is set to be I 0 (here, assumingestimated to be zero in the lower part of fuel. Hence, n=0.02 and 6= 03 ). The T1 value is determined bythe statistic precision for these low source levels is engineering judgment in consideration ofunreliable, however, it is supposed that it might nt effectiveness of the initial acceleration method.affect te keff estimation because of low source levels. The cumulative kff and the kff's by the three
estimators at each cycle are shown in Fig. 9.110 Although the final results of keffs in Batch I and 2 are
coincident with each other as shown in Fig. 9 careshould be taken that the fluctuation of kff at eachcycle is so large that the change of mean value ofthem is also fluctuated. To show the kff trendclearly, the number of histories per cycle should be
0.01 increased to be very large (for example 1,000,000),accordingly, calculation time increases proportionally.
LL Z A Initial Acceleration0.001 -&AftorlnkkgAcoolaration(3,times)
-6- Result of Batch 0.900 -- L -�-n. �.n . T-�[.-�-..n-Cu-�m.-G- CnMCUDn for Reversed keff Trend k-."'=0.89043±0.00023 k_.�"=0.B903B±0Q0024
0.0001 _W Result of Batch 2 - 1 0.898
-150 -100 -.50 1&.) So 100 150 (T�1?0 0.896 0Axial Position rn) .8 "'t ox.
0 894 0Fig. 7 Fission source distribution at each stage
10.892(Infinite array of spent fuel pin with axial bumup profile)0.890
The cumulative keff and the kff's by the three 0.888 O A 0 e�b.0 0estimators at each cycle are shown in Fig. 8. The '0
0.886change of mean value of kcff's at each cycle is not asdrastic as that shown in Fig. (problem No. 4, but it 0.884
0 so 100 150 200 250 3Wshows the reversed kff trends similar to the theoretical I N(=110)~dqd- 50-.dyd4 N=110).WPPd.0- 50 -.. d ,d.�consideration in Ref 5, and the convergence is �Bt�h I Bth 2
confirmed in the range of about I c. Fig. 9 keff of various estimators in each cycle and
1.075 cumulative kff trend with skipped cycles estimatedK-."'=l 05783±0.00027 k_.�"=1.05818±0,WW (Checkerboard storage of fuel assemblies)
1.070The relative fission source distribution at each stage
1.065 i> 0 is shown in Fig. 10. In Fig. 10 a reference case is0 ax 0
0 x 0 also shown based on the ordinary Monte Carloon NX6_,1 .0so X`� -1 A&AL. 4 calculation in which the calculation condition is 1,000
.55 77)! AN-7-1 �r�M d skipped cycles, 200 scored cycles and 50,000 histories0 per cycle. As shown in Fig. 10, the maximum point
1.050 of fission source level occurs at the location 1,3 ofMOthe upper-left comer where kaY is the maximum.
1.04520 40 7W 100 120 140 The assembly-wise fission source levels decrease
0 exponentially as far from the comer because of the?WWd Yd. very loose coupling between assemblies.
-F Batch 2
Fig. kff of various estimators in each cycle and The revision of the fission source distribution forcumulative kff trend with skipped cycles estimated reversed kff trend is performed in the same way of the(Infinite array of spent fuel pin with axial bumup profile) problems No. 4 and No. 2 with multiplying the lower
fission source levels by a factor P =0.5) and
3.3 Checkerboard Storage of Fuel Assemblies counterbalanced by increasing the higher source level.The source generation method 3) is adopted for the Because of a lot of very low source levels in the
effective acceleration method in the previous stage to opposite area to the upper-left comer, the fissionBatch I for the problem No. 1. The dominance source change by the revision for reversed kff trendration is obtained to be 09967. The number of becomes a little at the comer and its neighborhoodcycles to attain convergence is estimated by the which is principal part for the kff estimation.. This
small fission source change may cause small keff
511

JAERI-Conf 2003-019
deference between Batch I and 2.References
100 I Y Yamamoto, T. Nakamura ad Y Miyoshi�'Tission
10 source convergence ofMonte Carlo criticality calculationsin weakly coupled fissile arrays," J. Nucl. ScL Technol., 37,
1 -00 41 2000).
2) G E. Whitesides "A difficulty in computing the0.1 7!ii�
k-effective of the world:'Trans. Am. Nucl. Soc., 14,680
0.01 (1971).LL 3) 1 Kuroislii� Y Nomura, "New acceleration method of
O.DO1 -W Befom nitial Accelel rwtn source convergence-&A or Initial Accalaral for loosely coupled muld unit system-&- Rnesuft of Batch I
Ex O.ODO1 -& Crrectlon for Revemed keff by using matrix k calculation;'Proc. Int Coff. on New-W R s of Batch 2
0- 1 R=nca by ordinary MC frontiers of Nuclear Technology: Fxa= Physics, SafetyHigh-Peffmnance Compiurting, PHYSOR 2002,
Seoul, Korea, OcL 7 - 10,2002,9D-0 I QW2).Assembly Location (X, Y) 4) T. KuroLshi� Y Nomura, Development of fission source
Fig. 10 Fission source distribution at each stage acceleration method for slow convergence in criticality(Checkerboard storage of fuel assemblies) analyses by using matrix eigenvector applicable to spent
ftiel transport cask with axial burnup profile," J. Nucl ScL
4. Conclusion Technol., 40,433 2003).5) Y Nomura, T. Kuroishi "Consideration of
It is difficult to judge convergence of Monte Carlo convergence judgment method with sourcecriticality calculations because of the individual kff acceleration in Monte Carlo criticalityfluctuation. In contrast, it is well known that the calculation," Proc. Int. Conf On Nuclear Criticalityslow convergence for a loosely coupled system Safety, ICNC2003, Tokai-mura, Japan, Oct. 20-24,2003,sometimes causes non-conservative result of criticality. tinknown, (to be published).Hence, it is necessary to judge convergence. 6) Nuclear Energy Agency NSC Working Party on
In the proposed convergence judgment method, an Nuclear Criticality Safety WPNCS) homepage,effective initial acceleration method is adopted using http://www.nea.fr/html/science/wpncs/.fission matrix eigenvector, and the number of cycles 7) J. E Briesmeister, EL,'MCNP-A General Monte Carloto attain convergence in Batch I and 2 is estimated by N-Particle Transport Code Version 4B ", LA-I 2625-Kusing the matrix dominance ratio. As a result of Los Alamos National Laboratory 1997).application of this convergence judgment method to 8) T Nakagawa, K. Shbata, S. Clmlxi, et al., "Japanesethe OECD/NEA source convergence benchmark Evaluated Nuclear Data Library Version 3 Revision-2:problems, quantitative estimation for convergence is JENDL,3X'J. Nucl. ScL Technol., 32,1259 1995).
realized. It is made by checking the reversed k.trend toward the convergence during the skipped andscored cycles in Batch I and 2 and by comparing thekeff results of Batch I and 2 with statistic error inMonte Carlo calculation.
- 512 -

JAERI-Conf 2003-019 JP0450098
On a Fast Numerical Tool for Nuclear Accidental DynamicPhenomenology
and Application to the Real Time Simulation of Lady Godiva
Laurent BINDEL*, Andr6 GAMESS, Fr6d6nc JASSERAND and S6bastien LAPORTE
GALTNEO (MILLENNIUM Group), Versailles, France
(Sent August 15, 2003)
This paper present a modem numerical method, implemented in a TUI-code named MacDSP, forsolving any set of differential equations and in particular phenomenological accidental dynamiccalculations The speed efficiency of such an appmach, thanks to the use of the hybrid-levelpower offered by C+ and an ad-hoc design, make it possible to construct the first kid of a familyof real time simulator employing the video games technology DirectXTm : Lady Godiva Real TimeSimulator.
KEYWORDS: nuclear accidental dynamic, criticality accident, MacDSP, phenomenologicalcode, Lady Godiva, real time simulation.
1. Introduction 2. Method
In order to solve non-standard flux problems posed by its For the time being, MacDSP can handle general non-linearcustomers, GALINEO, the newly created scientific first order differential stiff set of equations likeengineering within the MILLENNIUM group, has developed dsiamong other applications, a flexible multi-purpose system. 77- (Di(tsi) ij- [,..,N] (1)
The aim of this paper is to demonstrate its applicability tothe domain of accidental dynamic calculations in nuclear with lsi)the N dependent variables and J(Di), N non-lineararea, and to give substance to the idea of Research/Industry (but non-singular) functions. The algorithm used to solve (1)transfer made by engineers trained in the high technology is an adaptative RK-like one. It's capability to solve veryatmosphere of French Nuclear Industry. quickly any stiff set of ODE of medium order 20) make it
Our approach, in the name of MacDSP for Masked possible to construct a family of realistic real time simulatorscompilation of Differential Stiff Problems, can be as exemplified in the following.synthesized as being a direct (and fast) numerical solution of MacDSP runs on PC platform, is written in C+ idiom,evolutionary equations of neutrons population thanks to the makes use of the best practice in scientific object-orientedconjunction of very efficient numerical algorithms and high design, and turns TNT framework to good account (use ofspeed computing on low cost desk platform. linear algebra objects, LU-decomposition and solving, ... ).
This system can serve the exploration of a large variety of MacDSP is a GUI application that consist in severalphenomenological models ad have practically no limit in Textual User Interface JUI) containing the input datathe field of point kinetic reactor because the coupling (initial value of state variables, time integration domain andbetween neutron field and others fields like thermal one or step parameters, ...), set of ODE, associated Jacobian vectorstress one can be handled by reduction of Partial Differential and Hessian matrix.Equation (PDE) to a set of multi-points or linear oscillatorsOrdinary Differential Equations (ODE) as Kolesov et al.1) in CoTimik Modeltheir 1997 FKBN-VNIEFF (Sarov) metal assembly accident (DLL)rebuilding have exemplified.
As a sequel of this work upon fast numerical differentia I J i d In" '.solver, it was tempting to create a Real Time Simulator Hessian(RTS). After performances and data availability ------verifications, our scientific code development team decided ----- Solver
(EXE)to numerically revive the so-called highly enriched uranium SC Il IC ----metal equipment nicknamed Lady Godiva. I S
Fig. I MacDSP's flow overview.
The Input data are written in an ASCII file, the ODE setCorresponding author, Tel. 33 - 3950-9779, Fax. +33-13- and derivatives are compiled, in the fly, as a Dynamic Link
950-8195, E-mail: laurent.bindel�millennium.fr
- 513 -

JAERI-Conf 2003-019
Library (DLL). These files are addressed by the numerical The model showed by Figure 2 is among the simplest ones,solver (standard EXE) which execute the algorithm and ie a Fuchs-Hansen like with heat coupling via surrounding,spool at the end an output ASCII file in a standard column that of a divergent equipment symbolized by the ODE setformat for use in various visualization tool (in particular below:Graphlt!, developed by our team based upon a free LIB 3) on dP m.t-P-f.(E(t)-Eo)the WWW). P(t)+± xipi(t)'
One of the particularities of our system consists, beyond its d t Asimplicity, in its versatility: one digital framework and many m#O if O<t<Tdomains of applications thanks to the possibility of masked dpi _XP,(t)+ P, p(t)compilation. In fact, a specialist can exert it's expertise by (2)modifying parts in the entire physical model while it is also _TF Apossible in a less expert use to simply modify the data or dEparameters of a particular model. The management of data dt =P(t)-g.(E(t)-Eo)
files and model files is natively coded so that it is easy to where P is the power generated, E the energy, the sixrecover an old case study. power-equivalent delayed groups, in is the reactivity
At first sight, it seems that the major domain limitation of insertion rate, f an over-all counter-reaction coefficient, g ansuch a method in physics applications is the necessity to put er-all thermal coupling with surroundings, and otherthe problem at hand as a set of ODE. In fact, Kolesov et al.') ovhave demonstrated the possibility with this approach to solve symbols the standard ones.a coupled neutron dynamic/then-nal propagation problem by Note that it is possible with MacDSP to code directly an ifthe use of a tricky mult�points approximation to the heat then-else statement or over C-language like statements sincetransport PDE part. In their approach, the neutron kinetics the model is handled by a parser before d -compilation.equations are, more classically, extended with additional The results of a run can be visualized by a general purpose'groups' in order to take account of environment reflections, graphic application named GraphIt! screenshoted in Figure 3
the parameters of which are obtained by the use of a general below.purpose Monte Carlo code.
Um IFtf�
3. Application
The phenomenological codes developed around the worldfor the treatment of industrial or research criticality accidentsare often dedicated to a specific fissile object phase, likesolutions (liquids), metals, wetted powders or heterogeneousmedium in the point reactor theoretic frame. MacDSP can inprinciple treat in a unified way all these phases by theupstream mathematical formulation of at hand problem in aODE form. In a sense, MacDSP is a platform for testing toy-models, for building preliminary code versions and even, ifencapsulated, for generating numbers in safety studies.
MacDSP, as a general solver, can also usefully serve thephenomenologist in his model's identification work bymaking easier the parametric studies once the cori -- I
phenomenological model has been found. Fig. 3 Graphlt!'s GUI graphical results of model 2)).A screenshot of MacDSP's TUI interface is showed below:
As another example, let's see how the without delayedneutrons problem of one group neutronic mechanicallycoupled with a ID oscillator can be handled.The evolutionary equations are:
dP Po-P-f.(uQ)-uo)PW7t A
d'u2 dE=p(ttT+(O U(t)= g.E(t) , (3)
d t Y
P'" ir, The formal analytical solution of second order displacementequation is the convolution integral below:s�
Fig. 2 MaeDSP's GUL U(t)= 9 ,fsin[ 0#-'r)1_E(r)dr( 0
- 514 -

JAERI-Conf 2003-019
In the case of very large mechanical inertia, Shabalin 4) components and oscilloscope-like traces of principal stateshowed that the oscillator displacement variable u(t) can be variables (power, energy, temperature, reactivity).written as the triple integral below:
U(0=9.fd4d'r-fdr-P(r`)0 0 0
so that the h-order system 3) can be synthesized in theformula:
PO-0-f UWR = R.R with R(t)= (4)A
where one dot means one time-differentiation.Thanks to a first integral of 4) in the form of
... R2 fR = R.�- _ gR
2 Athe system 3 can be rewritten for MacDSP in thecomputationaly very efficient P _order set of ODE:
�=R(t)p(t), p (t) Fig. Simulator interface.A
12f.9 R(t We hope that there will be as many numerical burst as theP(t)-A- ) EW) number of participants of this conference...
A AThis model can treat explosive expansion regime in fast 5. Perspectivesmetal equipment.
Scientific simulation has proven its relevance for a long4. Lady Godiva simulator time in giving good numbers for use in engineering purpose
at a broad level, and we think that there is also now a newDue to the speed efficiency of calculation algorithm coded possible use in high-level technical training via te
in MacDSP, maximum of 13 nis CPU to calculate a 'real' conjunction of computer science technology diffusion and40 ins time interval, it was conceivable to build a real time industrial context knowledge.simulator. Our choice fall onto the simplest phase and the It is planed to make MacDSP resolve stiff systems ofwidely known experimental equipment to begin, namely the Delay Differential Equations (DDE) in order to treatGodiva I pulsed reactor. dynamical problem with partial memory forgetting.
We employed the C+Builder IDE from Borland to make A forthcoming boiling equipment simulator is also planedthe job because of: once the phenomenological model able to reproduce some
- high velocity of Borland's C+ compiler, known equipment will be ready to be coded.- possibility to create our own object-components,- natural embedding of DirectX video game technology. References
The application use two synchronized threads that
communicates via a RAM segment: 1) V.F. Kolesov, M.I. Kuvshinov, I.G. Smirnov, V.Kh
GINE THRE Khor-uzhi "Experimental and Calculational Investigations ofthe Long-Term Dynamics of Fast Reactors Subjected to
New values a nother cycle Super-Prompt-Critical Step Reactivity Insertions and
max 77 Hz RAM of 40 ms can Applications for the 17 June 1997 Accident," Proc. Int.
structure start Conf. On Nuclear Criticality Safety, ICNC'99, Versailles,
Extraction of ew values France, Sept. 20-24, 1999, 1, 890 1999).
new state to be (user action) at
displayed max 25 Hz 2) R. Pozo, "Template Numerical Toolkit (TNT v.9.4):
Linear Algebra Module", National Institute of Standards and
Fig. 4 Simulator dialog between theads. Technology (NIST), Gaithersburg MD USA.TNT homepage, http://rnath.nist.gov/tnt
A screenshot of the simulator is given hereafter showing 3) R. Hong, "TgraphWin Component for C+ BUILDER
on the bottom the control panel with handles (upper and ver 20
lower spheres sections, control rod), the reactivity insertion Contact: hong�hpl.crestech.ca
rate control, and the burst rod red button with its transparent
hood. The blue area serves to accelerate the simulation in 4) E.P. Shabalin "Fast Pulsed and Burst Reactor", Pergamon
order to restart promptly. At the right of the interface is Press - I st edition, 1979.
positioned the restitution panel composed of LED-like
- 51 -
JAERI-Conf 2003-019 JP0450099
New SCALE Graphical Interface for Criticality Safety
Stephen M. BOWMAN' and James E. HORWEDEL
Oak Ridge National Laboratory! P. 0. Box 2008, Oak Ridge, Tennessee 37831-6370, USA
The SCALE (Standardized Computer Analyses for Licensing Evaluation) computersoftware system developed at Oak Ridge National Laboratory is widely used and acceptedaround the world for criticality safety analyses. SCALE includes the well-known KENO V.aand KENO-V I three-dimensional (3-D) Monte Carlo criticality computer codes.
One of the current development efforts aimed at making SCALE easier to use is theSCALE Graphically Enhanced Editing Wizard (GeeWiz). GeeWiz is compatible withSCALE and runs on Windows personal computers. GeeWiz provides input menus andcontext-sensitive help to guide users through the setup of their input. It includes a direct linkto KEN03D to allow the user to view the components of their geometry model as it isconstructed. Once the input is complete, the user can click a button to run SCALE andanother button to view the output.
KEN03D has also been upgraded for compatibility with SCALE and interfaces directlywith GeeWiz. GeeWiz and KEN03D for SCALE are planned for release in late 2003.The presentation of this paper is designed as a live demonstration of GeeWiz and KEN03D forSCALE5.
KEYWORDS. SCALE, KENO, GUI, visualizadot4 GeeWlz
1. Introduction visualization tool.2) In addition, SCALE hasseveral important new features that are not available in
The SCALE (Standardized Computer Analyses these GUls:for Licensing Evaluation)') computer software system e multiple unit cells for cross-section processing,developed at Oak Ridge National Laboratory (ORNL) * new criticality sequences using the CENTRMis widely used and accepted around the world for continuous-energy module, andcriticality safety analyses. SCALE includes the * new geometry and array options in KENO-VLwell-known KENO V.a and KENO-VI To address these needs, ORNL has developed athree4mensional (3-D) Monte Carlo criticality new integrated GUI called GeeWiz. The GeeWiz GUIcomputer codes. is compatible with KENO V.a and KENO-V in
The primary objective in the initial development SCALE and runs on Windows personal computersand ongoing enhancements to SCALE is to provide (PCs). GeeWiz provides input menus and context-easy-to-use calculational tools for performing accurate sensitive help to guide users through the setup of theirsafety analyses of nuclear facilities and packages input. It includes a direct link to KEN03D to allowusing current computing techniques. One of the the user to view the components of their geometrycurrent development efforts aimed at making SCALE model as it is constructed. Once the input iseasier to use is the SCALE Graphically Enhanced complete, the user can click a button to run SCALEEditing Wizard (GeeWiz). and another button to view the output.
Criticality safety analyses often require detailed KEN03D has also been upgraded formodeling of complex geometries. To improve the compatibility with SCALE and interfaces directlyease of use, especially for new and occasional users, with GeeWiz. GeeWiz and KENO31) for SCALE the CSpAN21 (Criticality Safety Input Processor fr are planned for release in late 2003.Analyses) and CSPAN-VI graphical user interfaces(GUIs) were previously developed to assist users in 2. Descriptionthe input setup and execution of KENO V.a andKENO-VL respectively. The CSPAN GUI for GeeWiz provides a simple user interface withCSAS/KENOV.a, written in Visual Basic, did not toolbar buttons to access the primary functions of thehave the usability features or the robustness of the program (Figure 1). Two toolbars are always active.newer CSPAN-VI for CSAS6/KENO-VI, written in The Main Toolbar at the top of the screen has buttonsVisual C+. In particular, CSPAN did not have the that invoke a variety of commands and options,CSAS search capability for criticality searches and including creating a new problem, opening a file,could not interface with the KEN03D 3-D
Corresponding author, Tel. 865-574-5263, Fax. 865-576-3513, E-mail: bowmansm�oml.govManaged by UT-Battelle, LLC, for the U.S. Department of Energy under contract No. DE-AC05-00OR22725.
- 516 -

JAERI-Conf 2003-019
saving the problem, executing SCALE, viewing 0 Unit Celloutput, viewing plots, accessing on-line help, and 0 More Dataactivating KEN03D. In addition, many of the forms 0 Parametershave toolbars that become visible when the associated 0 Geometryform is activated. 0 Arrays
The Forms Toolbar has buttons that may be used 0 Startto view or create the CSAS/KENO Va or . BiasCSAS6/KENO-VI data blocks. This toolbar, which is 0 Plotpermanently "docked" on the left side of the main 0 Searchwindow, contains the following buttons: The forms activated by these buttons are discussed
• General• Compositions in detail in the following sections.
Fig. GeeWiz toolbars.
2.1 General user may use arbitrary materials to construct othercompositions by specifying the content in weight
The Gneral button starts a dialog for general percent (Wt %) or as a chemical formula of elementsproblem information such as title, calculational and/or isotopes. SCALE automatically alculates thesequence, execution options, and cross-section library. number densities for each isotope and provides
problem-dependent resonance self-shielded cross2.2 Compositions sections.
The Standard Compositions window (Figure 2)The Compositions button opens the Standard displays a list (in spreadsheet format) of the
Compositions window, which contains the input compositions and their properties created by the user.menus for the three types of composition data that are Pressing the Create button and scting "Basiccommon to the SCALE control sequences: basic Compositions" allows the user to dfine mixtures bystandard compositions, arbitrary materials, and fissile selecting valid basic standard compositions from asolutions. The SCALE Standard Composition multiple-choice menu. If the composition contains aLibrary contains over 600 basic standard compositions multiple-isotope nuclidc, GeeWiz displays the isotopicwith alphanumeric names (e.g., "UO2" or "H20"). distribution and allows the user to modify itDefault densities and isotopic compositions are (Figure 3.provided but may be overridden by the user. The
- 517 -

JAERI-Conf 2003-019
(1 I 315 'I'll, I I 52-_',LJo2 29
K238 87uo2 6 293 92235 4
SEh2o 2Es3O4 3 Ife 4He 5ssM 7
Fig. 2 Standard Compositions window.
Mixture Number ........ . Isotopic Distribution
Cornposition Narne
Density Multiplier
Temperature (K)
Density
-A4(7t, Default (gcc)
User Supplied (gcc) (DEN
Number Density fatorns/b-cm) (ADEN)2M
7
VW,
Record of records
Fig. 3 Basic Standard Composition input form.
518

JAERI-Conf 2003-019
The Arbitrary Materials form allows the user to 2.5 Parametersdefine arbitrary material mixtures by selecting validnuclides from a multiple-choice menu. 'Me nuclide The Parameters form is a tabbed input screen fordistribution can be specified by atoms per molecule or the KENO parameter data. The parameters areby weight percent (wt %). divided into four groups: (1) Key Parameters that
The Solutions form contains three fissile solutions users most often specify, 2 Numeric Parameters,available in SCALE. The window is very similar to (3) Logical Parameters that have "Yes" or "No" values,the Standard Compositions window. and 4) 1/0 Unit Numbers.
2.3 Unit Cell 2.6 Geometry
The Unit Cell forms are available for infinite The Geometry form (Figure 4 allows the user tohomogeneous medium, lattice cell, and multiregion easily navigate through the units that define theunit cell types. The data are used for resonance geometry model. This form includes all the optionsprocessing of the problem-dependent multigroup cross for specifying KENO Va or KENO-VI geometrysections. models. The user may view, create, and edit unit
.The data on the lattice cell form define the data in the geometry data block. The user may select adimensions and compositions of the fuel, clad, and unit to edit by using the drop-down list displaying themoderator in the fuel assembly lattice. The data on unit number. Alternatively, the user may navigatethe multiregion form describe a one-dimensional through the units using the next, previous, first, and(I-D) model for resonance processing of cross last buttons.sections for geometries other than lattice cell. The Geometry Builder toolbar includes buttons for
creating geometric objects and defining regions within2.4 More Data the model. The geometry portion includes a button for
each KENO Va or KENO-VI geometry type. EachThe More Data button activates a tabbed dialog geometry button invokes a dialog that allows the user
form that includes optional input for NITAWL and to specify the geometric parameters and theXSDRNPM, primarily related to cross-section modification data such as rotate, translate, andprocessing. truncate (Figure 5).
F777770 C. bJuk
cylw&r 1 03%: 24C C� L61��dei 20,U,4582 24 A
7 24
CWWS
r"22 )O 10faW6 1 26
Fig. 4 Geometry form.
519

JAERI-Conf 2003-019
HEXPRISH LBL R Zt Zb Zt
(R i the inscribed radius) Z
Y
Zb
R Zt Zb
Label 10 F7=
Fig. 5 Geometry dialog for KENONI hexprism.
2.7 Arrays 2.9 Bias
The Array button presents a form for creating and The Bias Data button is used for entering optionalmodifying arrays to be used in the KENO geometry data that relate bias identifiers to built-in weighting(Figure 6. functions in KENO for automated reflector biasing.
When an array is displayed and a "Fill Unit" isselected, the contents of selected clls in the array may 2.10 Plotbe changed to the fill unit by using the Fill Toolstoolbar on the right side of the screen. The Hand too] Plot button assists the user in generating 2-Denables the user to click on individual cells to fill them color plots in KENO. The user can customize thewith the fill unit. The Line tool allows the user to plot by selecting colors for one or more of thedrag the mouse across the cells to be filled. The materials plotted. A sample plot generated withRectangle and Circle tools permit the user to drag the KENO is shown in Figure 7.mouse to fill the array cells within a rectangle or circle.The Fill All button fills all cells in the displayed plane. 2.11 SearchThe Move button shifts the array fill data horizontallyand/or vertically The Undo button cancels any The Search form is available only for KENO Vachanges made since the last fill tool was selected. cases in which the CSAS4 or CSAS4X search
sequence is selected. It is a tabbed dialog form that2.8 Start allows the user to select from optimum, critical, or
minimum kff searches by varying either nuclideThe Start Data button allows input and display of concentrations or geometry dimensions.
the optional data block for specifying the startingneutron distribution.
- 520 -

JAERI-Conf 2003-019
f7 Sh-All A-y Typ.� STUMARD HEXI\CONAL
umt�
4i
E Fot
MMURN
PMw'! Perot ffimzq�
Fig. 6 Array form for standard hexagonal aray
NU
AL 2AL
MATERIAL 4MATERIAL
MATrRIALMATERIAL
MATERIALMATERIAL
MATERIAL0�4 MATERIAL
TERI'L 13MALERIM 14HAYERIA, I,
Fig. 7 Sample YENO-Vl 2-D plot.
521 -
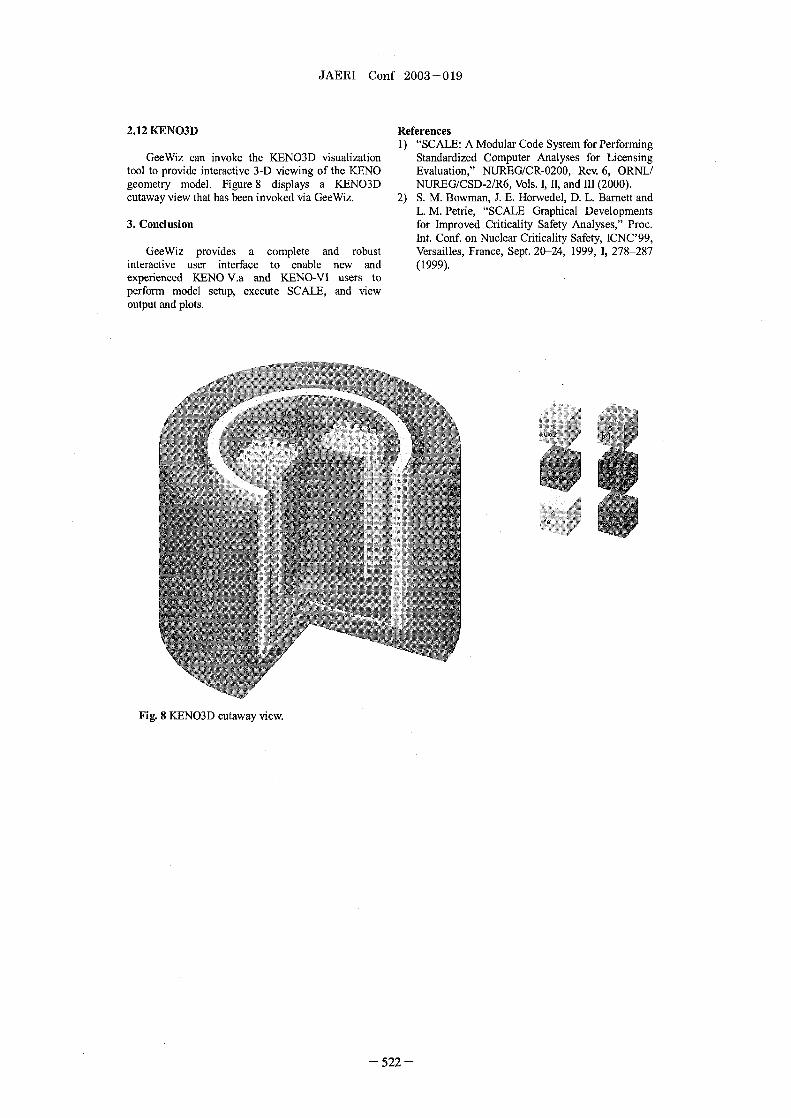
JAERI-Conf 2003-019
2.12 KEN03D References1) "SCALE: A Modular Code System for Performing
GeeWiz can invoke the KEN03D visualization Standardized Computer Analyses for Licensingtool to provide interactive 3-D viewing of the KFNO Evaluation," NUREG/CR-0200, Rev. 6 ORNL/geometry model. Figure displays a KEN03D NUREG/CSD-2/R6, Vols. 1, 11, and III 2000).cutaway view that has been invoked via GeeWiz. 2) S. M. Bowman, J. E. Hor-wedel, D. L. Barnett and
L. M. Petrie, "SCALE Graphical Developments3. Conclusion for Improved Criticality Safety Analyses," Proc.
Int. Conf. on Nuclear Criticality Safety, ICNC'99,GeeWiz provides a complete and robust Versailles, France, Sept. 20-24, 1999, 1, 278-287
interactive user interface to enable new and (1999).experienced KENO V.a and KENO-VI users toperform model setup, execute SCALE, and viewoutput and plots.
Fig. KEN03D cutaway view.
522 -

JAERI-Conf 2003-019 JP0450100
The Development and Validation of a New Collision Processor for MONK
Simon CONNOLLY" and Malcolm GRIMSTONE 2British Nuclear Fuels c, Research and Technology, Springfields, Salwick Preston, Lancashire, PR4 OXJ,P
United Kingdom2Serco Assurance, Winftith Technology Centre, Dorchester, Dorset, DT2 8DH, United Kingdom
This paper summarises the progress with a major development project for the MONKMonte Carlo criticality code, namely the development of a new collision processingmodelling package and nuclear data library.
KEYWORDS. MONK, Codes, Software Development, Nuclear Data, Validation
1. Introduction version of which was developed at AWE Aldermastonin the 1960s, was incorporated into MONK more than
MONK') is a well-established Monte Carlo code twenty years ago following a development programmefor the assessment of nuclear criticality safety that enabled it to be used for general criticalityproblems, with over thirty-five years of successful applications. One improvement was to represent theapplication across the whole of the nuclear fuel cycle. cross-sections on a fixed hyperfine energy grid ofOver the last decade, the development of MONK has 8220 groups. This provided a good representation ofbeen performed by a collaboration comprising British the resonance structure up to about 70 eV, and aNuclear Fuels pic (BNFL) and Serco Assurance, with subgroup method was incorporated to treat resonancethe MONK code being distributed and maintained in shielding at higher energies.use by Serco Assurance's ANSWERS Software Another development was to include modelling forService. the scattering of thermal neutrons by bound hydrogen
Over the last few years, a substantial programme of atoms in water.regeneration and renewal has been in progress, to A pre-processing program called MOULD wasupdate and enhance various aspects of the MONK used to generate the MONK nuclear data library frommethods, data and software. The current production the basic data in the UK Nuclear Data Libraryversion of the code MONK8 2) was the culmination of (UKNDL), which was the only data source used byone major strand of this programme, leading to the the code at that time. Data adjustments were made tounification of two previously separate versions of the improve agreement with critical experiments.code (one for criticality, another for reactor physics). During the 1980's, when the UKNDL had beenAnother major srand, scheduled to appear in MONK9 ftozen and the Joint Evaluated File (JEF) was beingnext year, has been the development of a completely developed, measures were adopted to accommodatenew neutron collision processing system and data from EF and other ENDF-format files within theassociated nuclear data library. DICE system. These included a new pre-processing
This paper outlines the historical development of route using the NJOY code. For these more modemthe nuclear collision processing methods within nuclear data libraries, data adjustments were no longerMONK and the reasons for undertaking the present required.upgrading. It describes the structure of te new Further improvements have been made since then.system and some of the important features of the The hyperfine energy grid has been revised to producemethods used. Finally it summarises the results to a scheme with 13193 groups, which providesdate of on-going validation studies in which results improved modelling of resonance self shieldingobtained using the new collision processor have been effects in the unresolved resonance range and a morecompared with results from experiments or from other accurate representation of cross-sections at thermalmethods of calculation. energies. Further enhancements have also been made
to the modelling of thermal neutron scattering by2. The Evolution of Collision Processing Methods bound atoms. DICE format nuclear data librariesand Data in MONK derived from various sources (UKNDL, JEF2.2,
ENDF/B-VI and ENDL3.2) are now available.2.1 The Development of DICE Validation evidence achieved by comparing
For many years the nuclear collision processing has MONK against experimental benchmarks supports thebeen handled within MONK by the DICE module, in conclusion that with modem nuclear data libraries, theconjunction with associated DICE nuclear data MONK code provides good agreement withlibraries. The DICE collision processor, the original measurement, generally within two standard
'Corresponding author, Tel. 44 0)1772 764025, Fax 44 0)1772 762470,E-mail: simon.m.connolly�bnfl.com
- 523 -

JAERI-Conf 2003-019
deviations (combined calculation and experimental processor is a program which is used to create auncertainty), and often within one standard deviation. MONK nuclear data library by taking evaluatedGiven this current strong position, what were the nuclear data files in ENDF-6 format and convertingdriving forces for embarking on the major project of these data into a form suitable for Monte Carloproducing a new collision processing system for sampling. The collision processor is the moduleMONK? which forms part of the MONK code and which
performs all the operations concerned with the2.2 The Need for a New Collision Processing modelling of neutron-nucleus collisions during theSystem. Monte Carlo process.
Although various factors contributed at the time, The components of the BNGO package are shownthere were three main reasons that led to the initiation in Figure .of this major programme of activity: The pre-processor is a program which takes
• An on-going objective of the BNFL/Serco evaluated nuclear data files in ENDF-6 format andAssurance collaboration is to strive for cost- converts these data into the BINGO library format.effective iprovements to the underlying Cross-section reconstruction and broadening arephysical realism available in MONK for both currently handled by NJOY, which is run as ancriticality and reactor physics applications. external program. However, the GENEX code,This objective can lead (and has led) to the originally written in the 1960's for use with UKNDL,provision of short-term user benefits in terms is being re-written and will eventually be available toof new facilities to solve immediate issues, or the pre-processor as an alternative to NJOY.to more strategic developments aimed at A BINGO nuclear data library consists of aproviding longer-term capability, confidence collection of files, each one containing the data for aand security. With the passage of time, such particular nuclide at a particular temperature. Thedevelopments in the collision processing area data within each file are organised using a speciallyare made more difficult within the DICE written database system.system by the fact that it was designed The collision processor is a module within theoriginally for an evaluated data format that MONK code. Its main functions are as follows:differed substantially from the modem ENDF once the compositions of the materials presentformat. Hence for the long-term, replacement in the current case have been determined fromrather than further enhancement was a clear the input, it reads the required data from therequirement. library and sets up pointers to enable items of
• Given its role, it is important that the MONK data to be accessed quickly;software can take advantage of modem during the tracking of neutrons, it is called todevelopments in computer languages and determine the mean free path of a neutron at itssystems and does not become frozen in time. current energy in the current material, so thatAgain with the passage of time this becomes the code can sample for the position of the nextincreasingly difficult for the existing DICE collision;system because its basic structure was designed once a collision has occurred, it is called tofor very early Fortran language versions and determine the outcome of the event, such as thefor computers with tape-based data storage and energy and direction of emergent neutrons.limited memory capacity. Again for the long-term, replacement rather than furtherenhancement was a clear requirement.
• Finally, and again looking to the long-term,both BNFL and Serco Assurance are 19�committed to maintaining expertise in the PRE-PROCESSORMonte Carlo and nuclear data modelling areas.With personnel succession planning andsharing of expertise in mind, a majorprogramme of activity provides a valuableframework to ensure expertise is passed on tothe younger generation. MONK
COLLISION3. The BINGO Package PROCESSING
MODULE
3.1 StructureThe new collision processing system for MONK Fig.1 Components of the BNGO package
has been named BINGO and consists of two parts: thepre-processor and the collision processor. The pre-
- 524 -

JAERI-Conf 2003-019
3.2 Methods required, but no such application is pnned in theshort term. Of more relevance for MONK is the fact
3.2.1 Cross-section Representation that, even for statics calculations, the presence of theCross-sections are stored in the BINGO library as delayed neutron data allows the use of the correct
point values on an energy grid chosen so that spectra for delayed neutrons. For back compatibility,intermediate values are adequately represented by at present MONK is still using the prompt neutronlinear interpolation. A different energy grid is used spectrum for all fission neutrons, but it is planned tofor each nuclide. This allows cross-section variations introduce the option to make use of the delayedto be represented accurately in the resolved resonance neutron data in the BNGO library.regions for individual nuclides, while minimising theamount of data needed to represent smooth cross- 3.2.5 Thermal Neutron Scatteringsections. Numbers of energy points range from about For then-nal neutron scattering by bound atoms, the600 for hydrogen to 212000 for 238 U. data pre-processing is carried out by the BINGO pre-
processor itself rather than by NJOY. This includes
3.2.2 Unresolved Resonance Region the processing of the S(ap) data to calculate cross-A subgroup method is used to treat resonance self section values and to generate the probability
shielding effects in the unresolved resonance region. distributions to be used for sampling the a and It is a 2-subgroup technique, in which the cross- values from which the secondary energies and anglessection in a narrow energy interval is represented as are calculated. The methods used in BINGO are, forhaving two possible values. These values are the most part, similar to those used in the currentcalculated so that they produce the correct average version of DICE, but a number of improvements havecross-section in the interval when the nuclide is been introduced. The main enhancement has been topresent at "infinite dilution" and at one other chosen introduce the modelling of coherent elastic scattering,dilution. The aim is to ensure that these cross-sections which occurs in crystalline materials and which waswill also give an adequate representation of the not treated in DICE. It is iportant, in particular, forresonance self shielding effect at intermediate thermal neutron scattering in graphite.dilutions. The two subgroup cross-sections are stored As in DICE, thermal neutron scattering in mostjust like normal cross-sections over appropriate nuclides will be treated by a free gas model, but thesubdivisions of the interval, so that no special aim is that BNGO libraries will include bound atomsampling procedure is required. This technique is scattering data for a wider range of nuclides, to thesimilar to the one used in DICE, but is adapted for use extent that these are available in the evaluated nuclearwith point-energy cross-sections and its accuracy has data files.been improved by allowing the subgroups to be ofunequal width. 3.3 Status
The BINGO module has been incorporated into a3.2.3 Temperature Treatment development version of the MONK code and this code
For any given nuclide, a BINGO library may version is now undergoing field testing in preparationcontain cross-sections for a number of discrete for its formal release as MONK9.temperatures. It is envisaged that, in practice, BINGO The pre-processor has been used to generate alibraries will provide multi-temperature data for a set BINGO library from JEF2.2 data. This libraryof the most important nuclides, while the data for the contains data for 155 miclides. Multiple-temperatureremaining nuclides will be for "room temperature" data are provided for 35 of these nuclides. In general,only. It is assumed that secondary energy and angle a standard set of 23 temperatures from 293.6 K todistributions are not dependent on the temperature, 5000 K is used, but for nuclides with bound atomexcept at thermal energies. Thus the BINGO library scattering data the set of temperatures for whichfiles for elevated temperatures contain only the cross- S(ap) data are given in the evaluated data file is used.section data (together with thermal scattering data in Further developments to BNGO will allow it tothe case of bound atoms), and the code automatically model photon production and photon and electronrefers to the room temperature file for the secondary collisions, enabling it to be included in the generaldistributions. At present, BNGO does not have the transport code, MCBEND.capability to interpolate between the temperaturesgiven in the library. If the MONK user specifies an 4. Validationintermediate temperature, the code selects the data forthe nearest available temperature. 4.1 General Plan
MONK has a large validation database comprising3.2.4 Delayed Neutron Spectra MONK models for experimental configurations, based
The BNGO library includes data for delayed mainly on specifications from the handbook of theneutrons from fission. These would enable the International Criticality Safety Benchmark EvaluationBINGO module to be used for kinetics calculations if Project (ICSBEP).4) At present the database contains
- 525 -

JAERI-Conf 2003-019
over 80 experiments, and with most experiments In general, the differences between the calculationsincluding a number of separate variants of the using BINGO and DICE are small and do notgeometry or materials, there are several hundred significantly alter the overall trends in the comparisonexperimental configurations in total. with experiment, which are associated more with the
In order to obtain a full assessment of the accuracy basic evaluated nuclear data than with theof MONK using the JEF2.2-based BINGO library, representation of the data in the code. For example, itcalculations for the complete validation set are now in has been found that MONK with JEF2.2 data over-progress. However, in order to obtain an initial broad predicts the value of k-effective for plutoniumoverview of the capabilities of the new system, a sub- solution systems by about 0.5%, and this can be seenset of calculations has been performed, with just one in the results from the cases included in the presentcase chosen from each of the experiments. The study, for which the mean k-effective value forcalculated k-effective values could then be compared plutonium solution systems is 10063 using DICE andwith the experimental values and with the results from 1.0056 using BINGO. Larger differences areMONK calculations already carried out using the observed for metal systems and a particular example isJEF2.2-based DICE library. discussed in more detail below.
In addition to the broad survey provided by
calculations for cases from the validation database, a Compound Systemsnumber of other comparisons are being carried out in 1.05
more detail and to a higher precision. In particular,these include several benchmark problems that have BkW= Dice
1.03 Ubeen defined for international intercomparisons of N+ Uftcriticality codes. Results for two of these are
presented below; others are in progress. 1.01-Finally, a number of special studies are being
undertaken to examine particular aspects of thenuclear data modelling in BINGO. One such study, ondescribed below, involves the calculation of thediffusion length for thermal neutrons in water.
0.97The results of the calculations performed to date are
included here for completeness but until thecompletion of the BINGO development programme 0.95
and the release of MONK9, they should be regarded 0.95 0.97 0.99 Dice W1.01 1.03 1.05
as provisional values only. Fig.2 Results for Compound Systems
4.2 Cases from the Validation DatabaseMONK calculations using the new collision 1.05 Solution Systems
processor have been run for one case from each of the85 experiments in the current MONK validation
Birw=Dowdatabase using the data library generated from EF2.2 1.M 0 U
0 PUdata. The results have been compared with those + YU
obtained with the DICE collision processor using theJEF2.2-based DICE library. The cases in the database 1.01are divided into classes according to the physical form
of the fissile material 3 09 * Jk
• compound (e.g. oxide)• solution
• metal 0.97
and according to the fissile element• uranium
• plutonium 0.95 0.97 0.99 1.01 1.03 1.05
• mixed (U + Pu). Dice Koff
The results for these different classes are shown in Fig.3 Results for Solution SystemsFigures 2 3 and 4 The deviation of the points fromthe diagonal line indicates the difference between thek-effective values obtained using BINGO and DICE,while the deviation from a k-effective value of 1.0shows the difference between calculation andexperiment.
- 526 -
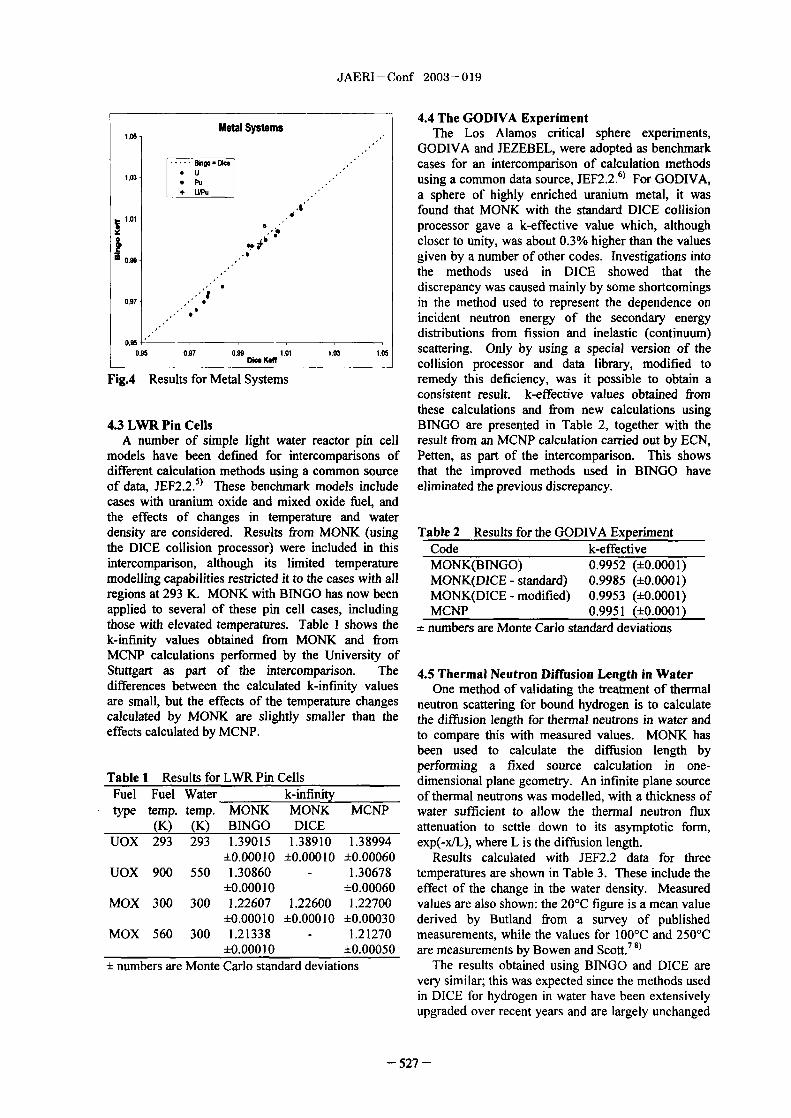
JAERI-Conf 2003-019
4.4 The GODIVA Experiment1.05 Metal Systems The Los Alamos critical sphere experiments,
GODIVA and JEZEBEL, were adopted as benchmarkWOO= Dke cases for an intercomparison of calculation methodsU
0 PU using a common data source, JEF2.2 6) For GODIVA,
L-t a sphere of highly enriched uranium metal, it was
4 found that MONK with the standard DICE collision1.01 processor gave a k-effective value which, although
closer to unity, was about 03% higher than the valuesa 099 given by a number of other codes. Investigations into
the methods used in DICE showed that thediscrepancy was caused mainly by some shortcomings
0.97 in the method used to represent the dependence on
incident neutron energy of the secondary energydistributions from fission and inelastic (continuum)
0.95025 0.97 0.99 1.01 1.03 1.05 scattering. Only by using a special version of the
Mm Koff collision processor and data library, modified to
Fig.4 Results for Metal Systems remedy this deficiency, was it possible to obtain aconsistent result. k-effective values obtained fromthese calculations and from new calculations using
4.3 LWR Pin Cells BINGO are presented in Table 2 together with theA number of simple light water reactor pin cell result from an MCNP calculation carried out by ECN,
models have been defined for intercomparisons of Petten, as part of the intercomparison. This showsdifferent calculation methods using a common source that the improved methods used in BINGO haveof data, JEF2.2 . These benchmark models include eliminated the previous discrepancy.cases with uranium oxide and mixed oxide fuel, andthe effects of changes in temperature and waterdensity are considered. Results from MONK (using Table 2 Results for the GODIVA Experimentthe DICE collision processor) were included in this Code k-effectiveintercomparison, although its limited temperature MONK(BINGO) 0.9952 0.0001)modelling capabilities restricted it to the cases with all MONK(DICE - standard) 0.9985 0.0001)regions at 293 K. MONK with BINGO has now been MONK(DICE - modified) 0.9953 0.0001)applied to several of these pin cell cases, including MCNP 0.9951 (±0.0001)those with elevated temperatures. Table I shows the + numbers are Monte Carlo standard deviationsk-infinity values obtained from MONK and fromMCNP calculations performed by the University of
Stuttgart as part of the intercomparison. The 4.5 Thermal Neutron Diffusion Length in Waterdifferences between the calculated k-infinity values One method of validating the treatment of thermalare small, but the effects of the temperature changes neutron scattering for bound hydrogen is to calculatecalculated by MONK are slightly smaller than the the diffusion length for thermal neutrons in water andeffects calculated by MCNP. to compare this with measured values. MONK has
been used to calculate the diffusion length byperforming a fixed source calculation in one-
Table Results for LWR Pin Cells dimensional plane geometry. An infinite plane sourceFuel Fuel Water k-infinity of thermal neutrons was modelled, with a thickness oftype temp. temp. MONK MONK MCNP water sufficient to allow the thermal neutron flux
(K) (K) BINGO DICE attenuation to settle down to its asymptotic form,UOX 293 293 1.39015 1.38910 1.38994 exp(-x/L), where L is the diffusion length.
±0.00010 ±0.00010 ±0.00060 Results calculated with JEF2.2 data for threeUOX 900 550 1.30860 - 1.30678 temperatures are shown in Table 3 These include the
+0.00010 ±0.00060 effect of the change in the water density. MeasuredMOX 300 300 1.22607 1.22600 1.22700 values are also shown: the 20'C figure is a mean value
±0.00010 ±0.00010 ±0.00030 derived by Butland from a survey of publishedMOX 560 300 1.21338 - 1.21270 measurements, while the values for 100'C and 250'C
±0.00010 ±0.00050 are measurements by Bowen and SCott.7.8)
numbers are Monte Carlo standard deviations The results obtained using BINGO and DICE arevery similar; this was expected since the methods usedin DICE for hydrogen in water have been extensivelyupgraded over recent years and are largely unchanged
- 527 -

JAERI-Conf 2003-019
in BINGO. The calculated diffusion lengths are about3% lower than the measured values, but further Acknowledgementsstudies will be needed to determine whether this is dueto the methods used in the code or to the basic The authors wish to acknowledge the other membersevaluated data. of the BINGO development team: David Bendall, Reg
Brissenden, Richard Neal and Keith Searson (allTable 3 Thermal Diffusion Length in Water BNFL), Adam Bird, Christopher Dean, Ray Perry,Temperature MONK MONK Experiment Nigel Smith, George Wright (all Serco Assurance).
(0c) BINGO DICEDiffusion length (cm) References
20 2.670 2.673 2.75 1) N. R. Smith, M. J. Armishaw and A. J. Cooper,± 0013 0.004 ± 0.05 "Current Status and Future Direction of the MONK
100 3.113 3.186 Software Package", Proc. Int. Conf on Nuclear± 0.010 ± 0031 Criticality Safety, ICNC2003, Tokai-mura, Japan,
250 4.307 4.295 4.438 Oct. 20-24 2003).± 0.015 ± 0006 0.044 2) N. R. Smith, M. J. Arinishaw, J. L. Hutton and J.Calculation/Experiment Sidell, "The Unification of MONK - Extending the
20 0.971 0.972 Monte Carlo Horizon", Proc. Int. Conf. on Nuclear± 0019 0.018 Criticality Safety, ICNC1999, Versailles, France,
100 0.977 Sep. 20-24 1999).± 0.010 3) G. A. Wright, E. Shuttleworth, M. J. Grimstone and
250 0.970 0.968 A. J. Bird, "The Status of the General Radiation± 0.011 ± 0.010 Transport Code MCBEND," Proceedings of an
numbers include Monte Carlo standard deviations International Topical Meeting on Industrialand experimental uncertainties Radiation and Radioisotope Measurement
Applications, Bologna, Italy, June 914 2002).
5. Conclusions 4) OECD Nuclear Energy Agency, "InternationalHandbook of Evaluated Criticality Safety
This paper has described the background, capability Benchmark Experiments", NEA/NSC DOC(95)03
and results to-date for a major new development for (2002).the MONK code, namely the production of a 5) J. L. Rowlands (editor), "LWR Pin Cell Benchmarkreplacement collision processor and nuclear data Intercomparisons", OECD Nuclear Energy Agency,library. Te development has now reached the final JEFF Report 15 1999).validation stage and ffirther results will become 6) J. L. Rowlands (editor), "Intercomparison ofavailable over the coming months in the period Calculations for GODIVA and JEZEBEL", OECDleading up to the release of MONK9. However, the Nuclear Energy Agency, JEFF Report 16 1999).results to date are very encouraging, and coupled with 7) A. T. D. Butland and C. T. Chudley, "Thermalthe additional benefits that have been and will be Neutron Diffusion Data and the WIMS Scatteringachieved by the code stakeholders, the MONK Models for Light Water", AEEW - R 701 1970).BINGO project looks set for a successftil conclusion 8) R. A. Bowen and M. C. Scott, Brit. Joum. Appl.that will serve its user community well over the Physics, Ser 2 Vol. 2 401 1969).
coming years.
- 528 -

JAERI - Conf 2003 - 019 JP0450101
Experimental Validation of the APOLL02-MORET4 Standard Route of theFrench CRISTAL V1 Package
Isabelle DUHAMEL'*, Eric LETANG1, Agn�s COSSENET', Gilles POULLOT 2
1 Institut de Radioprotection et de Aireig Nuclgaire, BP 7 - 92262 Fonlenay aux Roses Cedex, France
2 retiredftom Institut de Radioprotection et de SiirW Nuclgaire
CRISTAL VI, the new version of CRISTAL package, is being developed and validated bythe Institut de Radioprotection et de S&etd Nucldaire and the Commissariat A FEnergieAtomique, in collaboration with the COGEMA Company. Meanwhile, an extensivevalidation work is being perfonned to appreciably improve the validation database, whichwas currently composed by about 500 benchmarks,
Thus, more than 1900 experiments were selected to cover the different configurationsencountered in the nuclear fuel cycle. Regarding the APOLL02-MORET4 standard route,about 1200 experiments have already been investigated by IRSN. The first trends of thisvalidation point out that the calculation results are in relative good agreement with thebenchmark kff and that the new calculation schemes improve the validation results.
The results of the 1200 critical experiments of the validation database will then be used inthe new MORET tool to assist end-users in the estimation of the code bias.
1. Introduction storage, and reprocessing).The different criteria of the database selection were
The CRISTAL package') includes two calculation the fissile media, the diversity of configurations (toroutes which use JEF2.2 nuclear data: on the one hand, cover a wide moderation ratio range and to validatethe "standard route" dealing with the multi-group different structure materials), the variety ofnuclear data library CEA93 (derived from JEF2.2 laboratories (to detect experimental biases) and theevaluation), the APOLL02 cell code (used for quality of benchmark's data.self-shielding, flux calculations, collapsing and The main sources of the benchmarks selection arehomogenization) and the MORET4 Monte Carlo code, the OECD/ICSBEP Handbook 4) and others availableand, on the other hand, the "reference route" using the experiments performed by IRSN in the Valduc facility,TRIPOL14 Monte Carlo code with a continuous JEF2.2 some of them with the financial support of COGEMAenergy library. CoMpanY5).
In the framework of CRISTAL V 12), new versions of The validation database, which was made up ofcross sections library, computer codes and calculation more than 500 critical experiments for CRISTAL VOschemes have been developed. package, is being extended for the new V 1.0 version.
Meanwhile, an extensive validation work has been This aims:performed. Thus, the initial validation database of * to take into account the needs highlighted by theCRISTAL VO'), which was made up of more than 500 users during last years (mainly configurationscritical experiments, is being extended to about 1900 involving slabs arrays or interacting metallicbenchmarks. systems),
* to validate the new "multi-cell Pij flux2. Validation Database calculation" option,
- to validate bum up credit calculations (nuclearValidation is based on calculation-experiments data of 6 major Fission Products),
comparisons. The observed discrepancies are then - to investigate inconsistencies detected in theinterpreted and eventually transposed to configurations CRISTAL VO validation studies (for example, twoused in the criticality studies. experimental programs were added in the
Therefore critical experiments were selected to CRISTAL VI database to explain theinvestigate all the operations encountered in the inconsistencies observed for mixed uranium andnuclear fuel cycle (including fabrication, transport, plutonium solutionS3)).
'Corresponding author, Tel.+33.1.58.35.74.17, Fax.+33.1.46.57.29.98,E-mail:isabelle.duhamel�irsn.fr
- 529 -

JAERI-Conf 2003-019
Finally, CRISTAL VI validation database will be Table I Number of experiments investigated with thecomposed of about 1900 critical experiments (see table APOLLO2-MORET4 "standard route".1). CRISIAL tNAft VI3. Validation Method matpriaI Widation already
First of all, the validation work consists in Low-enriched 82 73calculating the C-E value, which is given by UraniumAPOLL02-MORET4's kff minus benchmark's kff, High-en .riched 172 95and its combined standard deviation SOLUTION Uranium
Plutonium 263 1462 2
kalculanar + orbenchmak Mixte U-Pu 52 46233u 42 21
Calculations were considered in good agreement Uranium 117 77with the benchmark when the discrepancies between POWDER Plutonium 34 34them are in the uncertainties margins. Mixte U-Pu 33 33
U02 rods 463 171This initial work is completed from case to case by ARRAYS U02-PU02 rods 254 230
inter-code comparisons to uncouple the different Slabs 135 82sources of code biases with: Uranium metal 32 6
a comparison with the CRISTAL's "reference U02 rods' 8 8route" which allows evaluating the effect models DISSOLVER* U02-PU02 rods 73 67inaccuracy (multi-group treatment, anisotropy Uranium 71 25representation, self-shielding, collapsing, Plutonium 53 21homogenization ... ), METAL Mixte U-Pu 28 0a comparison with others codes (KENO, MCNP, 233u I I
MONK ... which can point out nuclear data 237 Np I 0inaccuracies.
TOTAL 1914 1136Finally a comparison with others experimental *Fuel rods arrays infissile solution
programs in the same field (similar media and
configurations) allows highlighting experimental overestimation. Similar results were obtained withbiases. other codes (TRIPOL14, MONK and MCNP). Thus,
this ensured that the discrepancy observed is code
4. Main Results independent.
4.1.2 High-enriched Uranium solutions (95Among the 1900 benchmarks retained in the experimentsftom 16 ICSBEP series)
validation database, about 1200 have already been The experiments involved U02F2. U02(NO3)2 andinvestigated with the "standard route"APOLLO2-MORET4 (see table 1). UF6-HF solutions with uranium concentrations ranging
respectively from 20 g/I to 700 g1l, from 20 g/ to
The main results of the validation are presented by 400 g/I and from I 10 to 970 g/l. Some cases involvedmedium type. gadolinium (O to 10 g/1) and boron (O to 2 g/1) in the
uranium solutions.Calculations showed a general tendency to kff's
4.1 Solutions over-prediction, especially for high Uranium
4. 1.1 Low-enriched Uranium solutions 73 experiments concentrations. This slightly overestimation is mainlyjrom 15 1CSBEP series) due to the JEF2.2 235U cross sections 6.
The investigated experimental programs involved 4.1.3 Plutonium solutions 146 experiments from 1710 enriched U02(NO3)2 solutions with an uranium series)
concentration ranging from 170 g/I to about 460 g/I and These experiments covered a broad range of5 enriched U02172 solutions with a concentration of plutonium concentration (from 9 to 410 g/1) andabout 450, 500 and 980 g/l. Different tanks and included variou 20pu content.reflectors were studied. Compared with the experimental values, the
The different studies showed a relative good keff calculated results are consistently on average 0.005prediction for low enriched solutions, except for high. There is no discernible trend neither withSHEBA experiment (UO2F2 with an uranium plutonium concentration nor with the ... Pu content.concentration of about 980 g/1), which leads to a high
- 530 -

JAERI-Conf 2003-019
Given the diversity of the systems studied and their APOLL02-MORET4 calculations showed goodorigin and the different code systems used in our agreements with benchmark kff for theanalysis, it is concluded that this slightly well-thermalised U02 and U02-PU02 lattices; in fact,over-prediction is a code-independent commentary on the discrepancies were within the uncertainty margins,the accuracy of the JEF2.2 files for plutonium data. with no discernible trend with moderation ratio. The
4.1.4 Mixed Uranium and Plutonium solutions 46 good agreement between calculations and experimentsexperimentsfrom 6 series) was confirmed by TRIPOL14 calculations.
However, differences between the two codes wereThe experiments were carried out in different tanks found for rod arrays with high flux heterogeneity (for
with homogeneous mixed U-Pu nitrate solutions. The cases involving canisters). These discrepancies wereplutonium concentration ranged from IO to 190 g/I with tracked down to the approximations used ina ratio of plutonium Pu/(U+Pu) varying from 20 t APOLL02-MORET4 for array calculations, which led97 Two 24OpU content was studied (about and to over-predicted kff. New schemes involving19 APOLL02 multi-cell calculations (based on the
There was no discernible trend with plutonium interface current method) are currently being studied;concentration but some possible indication of an first results seemed to show an improvement in the keffincrease in calculated results for cases with the higher prediction for such configurations."'Pu content - however, as this marks the difference Finally, a large overestimation could be noticed (upbetween laboratories, this apparent discrepancy may to 1.5 %) for steel reflected experiments, whichhave other causes. Besides, the experimental programinvolving the 24OpU content of 19 has not been increases when the reflectin i walls are close to thereevaluated yet; in fact, some uncertainties exist on assemblies. Further analyses have highlighted thatexperimental data concerning more particularly zero this over-prediction is linked to the multi-grouplevel measurement for critical height and water density. treatment of the iron isotopes (predominantly 56Fe) In
fact, the pointwise Monte Carlo code TRIPOL14 gives4.1.5 233U solutions 21 experiments from 4 ICSBEp better results without any trend with core-reflectorseries) distance.
The investigated experimental programs involved98 % 233 U enriched U02(NO3)2 or U02172 solutions. 4.3 Slabs arrays 2 experiments from 3 ICSBEPThe 213U concentration ranged respectively from 17 to series)
The investigated experimental pro arns involved62 g/I and from 570 to 870 g/l. water-moderated high enriched 93 % Y3.5U) UAI plate
A good calculation-experiment agreement wasobserved for uranyl nitrate solutions. Thus, the 233U or Uranium metal slabs moderated with polyethylene,nuclear data seemed to be relevant in the thermal Plexiglas or Teflon.energy range. If the spacing between the fuel elements is small,
However, the experiments involving U021`2 led to APOLL02-MORET4 calculations led to satisfyingan important under-prediction of k. results, except for Teflon moderated cases, which gave
,ff. Several high over-predictions. However, for larger spacingcomparisons with VIM and MCNP codes showed thatcalculation-experiment discrepancies are code between the fel elements, an under-prediction couldindependent; thus it allows questioning one of the other be observed; these discrepancies might be reducedsources of discrepancies (experimental biases or when using the new calculation scheme for plateuncertainties and nuclear data inaccuracy in this energy lattices, which is currently being developed inrange). collaboration with CEA in the framework of CRISTAL
project.
4.2 Fuel rods arrays 401 experiments from 35 4.4 Metallic systems 47 experiments from 29series) ICSBEP series)
The investigated experiments involved arrays of High-enriched uranium and plutonium metalliclow-enriched U02 (with an uranium enrichment systems were studied. Different reflectors with varyingranging from 235 to 47 %) or U02-PU02 (with a Pu thickness were investigated (none, water, CH2, steel,content varying from 1.5 to 20 % and with to 25 of24OpU) pins. Different square and triangular lattices of graphite, aluminum).water moderated (lattices with pitches ranging from Main results have pointed out:1.075 cm to 25 cm for U02 rods and from 09 to -A slightly under-estimation of the kff for bare,2.6 cm for U02-PU02) were considered in order to water-reflected or C112-reflected uranium andcover a wide range of moderation ratio. plutonium metallic systems;
Some of these configurations involved soluble -An important over prediction for steel andpoison (boron or gadolinium), canisters (borated steel, graphite reflected cases, which increases withboral, haffiium, cadmium) and different kinds of the reflector thickness. As said previously, thereflection were also investigated (water, CH2, concrete, over-estimation with steel reflector is linked tosteel and lead). the multi-group treatment of the iron isotopes.
- 531 -

JAERI-Conf 2003-019
Regarding the discrepancies observed withgraphite reflectors, which were not shown with Table 2 Actinides anisotropy representation effectTRIPOLI4 code, studies are still in progress. for metallic sys s.First conclusions engaged the graphiteanisotropy treatment (in PI order) in Zases PI 6mer P$ Wor' MaAPOLL02-MORET4 calculations. n M- I)
PMF-00I.cOI 0.99361 0.99530 0.00169New calculations were performed for the metallic 0.00100 0.00100
mediums with the use of the new CEA93 cross section PMF-002.c 1 0.99527 ± 0.99634 ± 0.00107library, which contains the P9 anisotropy order 0.00050 0.00050actinides cross sections. Preliminary results (all PMF-Oll.cOl 0.99122 ± 0.99334 ± 0.00212calculations were performed with self-shielded cross 0.00100 0.00100sections) revealed a small ipact on the kff (less than PMF-022.cOI 0.99175 ± 0.99072 ± _0.00 1030.3 %, see table 2, but we can notice a slightly trend to 0.00100 0.00100reduce the calculation-experiments discrepancies. PMF-023.cOl 1.00536 ± 1.00464 ± _0.00071
0.00100 0.00100
Moreover, configurations involving several metallic PMF-024.c 1 0.99575 ± 0.99663 ± 0.00089systems in interaction have been studied. They 0.00100 0.00100involved arrays of uranium or plutonium metal PMF-027.cOI 0.99822 ± 0.99781 ± -0.00041cylinders reflected or not by water or paraffin. 0.00050 0.00050
These configurations showed good PMF-029.cOI 0.98945 ± 0.99175 ± 0.002300.00100 0.00100
calculation-experiment agreement. PMF-03 Lc 1 0.99799 ± 0.99917 ± 0.00118
233 0.00100 0.00100Finally, the only experiment investigated with U 1.00496 1.00606 ±
(bare sphere enriched with 98 % of 233U) pointed out PMF-032.cOI 0.00100 0.00100 0.00110
the same trend as other metallic systems; in fact, an HMF-00l.cOI 0.99394 ± 0.99732 ± 0.00338slightly under-prediction (of about 0006) was noticed. 0.00100 0.00100
HMF-008.cOI 0.98961 ± 0.98880 ± _0.000814.5 Powders (144 experimentsfrom 6 ICSBEP series) 0.00100 I 100
The investigated experiments concerned: FIMF- I Lc 1 0.99581 ± 0.99443 ± _0.00138- low-enriched (5 %) uranium oxide powder with 0.00100 0.00100
an atomic ratio of 2 25 or 3 reflected by HUT-013.01 1.01030 ± 1.01210 0.00180polyethylene, 0.00100 0.00100
- high-enriched 93 %) uranium oxide powder HMF-019.cO] 1.0100 ± 1.0110 ± 0.00108reflected by polyethylene, 0.00100 I 0.00100
- low-enriched 2 and 3 %) UF4 powder HMF-020.cOI 0.99504 ± 0.99530 ± 0.00026moderated by paraffin with an atomic ratio 0.00100 0.00100ranging from 4 to 20 and reflected by HMF-02I.cOI 1.03546 ± 1.03607 ± 0.00061hydrogenous materials paraffin, polyethylene, 0.00100 0.00100
plexiglas),
- plutonium oxide powder moderated by 4.6 Fuel rods arrays in issile solution (75polystyrene (with an atomic ratio ranging from experhnentsfrom 6 series)0 to 50), bare or plexiglas reflected, These experiments concerned U02 or U02-PU02
- U02-PU02 powder moderated by polystyrene fuel rods in uranium, plutonium or mixed U-Pu nitrate(with an atomic ratio ranging from 30 to 50), solutions. Different lattices pitches and variousbare or reflected by plexiglas. solutions' concentrations were tested.
powders, These configurations allowed validating mainly theRegarding plutonium and U02-PU02 APOLL02 calculation options for self-shielding,
APOLL02-MORET4 results showed an important taking into account the resonant isotopes in both theover-estimation as other codes MCNP, TREPOL14 ... ). fissile solution and the fuel rods.Nevertheless, as some experimental data are weak or For the 8 cases involving U02 rods,missing, these discrepancies are presently difficult to under-estimation, depending on the configuration, wasexplain. observed. Notice that these experiments, which were
Considering the experiments involving uranium the only experiments available, had not beenpowders, APOLL02-MORET4 calculations are in reevaluated yet (experimental data are weak). Besides,good agreement with benchmark keff, in fact, most of calculations performed with TRIPOL14 code for two ofthe calculation-experiment discrepancies are in the these cases were in good agreement withuncertainty margins. APOLL02-MORET4. So it was difficult to conclude
about models or nuclear data accuracy.
- 532 -

JAERI-Conf 2003-019
The 67 experiments performed with U02-PU02 rods calculation" option developed in the VI version.in plutonium or mixed U-Pu solutions showed an Firsts results show a better kff prediction.over-estimation of the kff. Notice that two the "global dissolution type" fission productsexperimental programs have not been reevaluated yet classified experiments performed in VaIducand that some uncertainties subsist on experimental facility.data concerning more particularly zero levelmeasurement for critical height and water density.
Moreover, "reference" calculations have to be done, 5. Conclusion
in order to conclude if this over-prediction is mainly In the framework of CRISTAL VI development, andue to self-shielding options or if it is code important validation work is being performed.independent; thus, it will allow questioning one of the The extension of the validation database allowsother sources of discrepancies (experimental biases or covering nearby all the different kinds ofuncertainties and nuclear data inaccuracy). configurations encountered in the nuclear ftiel cycle.
4.7 Fission products Validation studies highlighted the effect of theThese classified experiments were performed in approximations used in the standard route and the
VaIduc with the fancial support of COGEMA nuclear data accuracy. New calculation procedures andcompany 5). models are being validated thanks to critical
A solution containing fission products, alone or experiments and reference calculations.mixed, with or without interactions actinides was
placed in a Zr tank in the center of a rods array driver. The first trends of the validation work, whichThe first series of experiments, called "Physical" currently involve 1200 experiments, point out that the
type experiments, which involved only fission products,is representative of storage and transportation calculation results are generally in good agreementconditions. with the benchmark kff and that the improvements in
To iprove the 'dissolution' qualification, a second the calculation schemes allow obtaining best validation
series of experiments, named "Elementary results.
Dissolution" type, has been performed. Fission Finally, it must be emphasized that the validationproducts were then in close interaction with the U, Pu work is still in progress and will concern more thanand Am isotopes of inner array. This second series is 1900 experiments for the CRISTAL VI package.itself divided in two cases: fission products in acid
solutions or in depleted uranyl nitrate solution. Finally, the results of the 1900 critical experimentsOther experiments were performed on natural Gd
5MO of the validation database could be used in the newsolution, on 9 in thin slices of CH2/natural metallic MORET toof) to assist end-users in the estimation ofMo, and on F as polytetrafluorethylene solid block. the code bias.
Currently, 156 experiments have already beenperformed in VaIduc facility; some of them (with149 Sm) are available in the ICSBEP handbook References
(LEU-COMP-THERM-050). 1) J. M. Gomit, P. Cousinou, A. Duprey, C. Diop,A third series of experiments, named "Global or J.P. Grouiller, L. Leyval, H. Toubon, E. Lejeune,
Advanced Dissolution" type, is planned. It consists of a "The new CRISTAL Criticality-Safety Package",UO2-P`UO2 rod array steeping in a depleted uranyl Proc. Int. Conf. on Nuclear Criticality Safety,nitrate solution poisoned with 6 fission products. ICNC'99, Versailles, France, Sept. 20-24, 1999, 1,
Currently, the "Physical" type experiments have 308 (1999).been investigated; - they showed good 2) J.M Gomit, P. Cousinou, C. Diop, Fernandez decalculation-experiments agreement. Grado, F. Gantenbein, J.P. Grouiller, A. Marc,
D. Mijuin, H. Toubon, "CRISTAL VI: Criticalitypackage for bum up credit calculations", Proc. Int.
4.8 Perspectives Conf. on Nuclear Criticality Safety, ICNC2003,Tokai-mura, Japan, Oct. 20-24, 2003.
The validation work is still in progress, thus the 3) 1. Duhamel, J.M Gomit, Y.K. Lee, C. Venard,results of further investigations concern more "Synthesis on the validation of the CRISTAL VOparticularly: package", Proc. Int. Conf. on Nuclear Criticality
• the slabs arrays to define a more precise Safety, ICNC2003, Tokai-mura, Japan, Oct. 20-24,
calculation scheme, 2003.• the critical experiments whose configurations 4) NEAfNSC/DOC(95)03, "International Handbook of
involve high heterogeneity of flux: it allows Evalu .ated Criticality Safety Benchmark
validating the new "multi-cell Pij flux experiments", (September 2002)
- 533 -

JAERI-Conf 2003-019
5)J. Anno, A. Barreau, J.P. Hudelot E. Girault, P. starter file", Proc. Int. Conf. on Nuclear CriticalityFouillaud, H. Toubon, "French Fission Products Safety, ICNC'99, Versailles, France, Sept. 20-24,Experiments performed in Cadarache and Valduc: 1999, III, 964 1999).Results Comparison", Proc. Int. Conf. on Nuclear 7) F. Fernex, Y. Richet, E. Letang, "A New MORETCriticality Safety, ICNC2003, Tokai-mura, Japan, Tool to Assist Code Bias Estimation", Proc. Int.Oct. 20-24, 2003. Conf. on Nuclear Criticality Safety, ICNC2003,
6) 1. Guirnier, A. Nouri "Contribution to the validation Tokai-mura, Japan, Oct. 20-24, 2003.of the new ... U evaluation adopted in JEFF3.0
- 534 -

JAERI-Conf 2003-019 JP0450102
A MORET Tool to Assist Code Bias Estimation
F. FERNEX*, Y. RICHET and E. LETANGInstitut de Radioprotection et de Sfiret� Nucliaire, BP] 7 92262 Fontenay-aux-Roses Cedex, France
This new Graphical User Interface (GUI) developed in JAVA is one of the post-processingtools for MORET4 code. It aims to help users to estimate the importance of the kff bias dueto the code in order to better define the upper safety limit. Moreover, it allows visualizing thedistance between an actual configuration case and evaluated critical experiments. This tooldepends on a validated experiments database, on sets of physical parameters and on variousstatistical tools allowing interpolating the calculation bias of the database or displaying theprojections of experiments on a reduced base of parameters. The development of this tool isstill in progress.
1. Introduction base. However the number of accessible parametersobtained at the end of a calculation is huge: reaction
Criticality safety is notably assessed on physical rates by media and isotopes, leakage, all these valuesparameters issued from calculation codes, the most given for each group of the energy mesh. This numberimportant being the neutron effective multiplication is too important, compared to the number offactor (kff). Codes are able to predict the value of this experiments in validation database, to perform aparameter with an error margin 6 k,,,, due to statistical statistical analysis. Therefore a parametersmeans used (Monte Carlo method) and also a optimization method must be applied to determine thecalculation bias due to the approximations needed to most important parameters, in order to calculatemodelize the neutron flux behavior. Usually, the distances between calculation case and experiments.following condition must be demonstrated for normaland credible off-normal operating conditions: 2. Characterization Database definition
where kff + 6 k,, < I - 6 kn,.,g - kbias - Gbias, The validation database contents average kff results
-kff is the value of the best estimator of the and associated standard deviation for all experimentsMORET4 calculation, coded into the MORET4 format in order to have an
- 6 k,, is the statistical uncertainty: user has to extensive representation of media and geometriescheck the normality of the kff distribution obtained encountered in the nuclear fuel cycle. Theby the Monte Carlo calculation. Once checked, the characterization database (BdC: "Base deuser usually retains a value equals to 3 ;, where Caractdrisation") is an extension of the validationrepresents the standard deviation of the database, which contains an increased number of
distribution 3 a is related to a level of confidence parameters.equals to 99.73%), The already existing outputs in MORET4 code are the
- 6 k.ugin is the safety margin, following: flux, leakages, reaction rate for total,production and absorption cross sections. These data
- kbia, represents the calculation accuracy of the are given per energy group and for a given calculationcalculation package (it includes the bias of zone. The addition of macroscopic cross-sections perdifferent calculation approximations as well as isotope and per zone allows obtaining to isotopicuncertainties of data) and Gbi. is the statistical reaction rate:uncertainty linked to the evaluation of bias. The la.
value of 6 kU,, has also to take into account an T a P"'g -TcEOx Y a. Pgextension of the area of applicability.
Because of the wide range of media encountered in P1119criticality studies, estimation of the calculation bias is wherenot easy. The only cases, for which this bias is known, -T is the reaction rate,are the experiment evaluated for the MORET4 - YS is the macroscopic cross-section,validation database'). Almost all of these experiments -cc is the calculation zone,are issued from the ICSBEP program') and all follow -p is the type of reaction,the ICSBEP classification. -i is the specified isotopeIn order to evaluate the calculation bias of any -g the energy group.criticality calculation, a distance between validation The number of accessible data is too important (seedatabase experiments and the studied case must be Table 1) and must be reduced. A first reductionevaluated. The distance notion implied a parameters
corresponding author, Tel. 33-1-58-35-99-40, Fax. 33-1-46-57-29-98, E-mail: frederic.femex�irsn.fr
- 535 -

JAERI - Corif 2003 - 019
consists in regrouping on the one hand the fissile To avoid these constraints, a new method, based on azones and on the other hand the structures. Then all database reduction is being defined.these information are stored in a MORET 4 output In order to detennine a characterization workingXML CARA-file (.cara.et). database as a part of the total database, the choice has
been made to sort the experiments in three groupsTable number of accessible param ters following on the one hand the ICSBEP criteria and on
I.sotopic action the other hand aspects linked with the MORET4concentration Flux Leakage rate validation work. The ICSBEP criteria are the
Groups 172 172 172 following:Fissile 0 the isotopic content of fissile materials (IJ, Pu,zones I<nb<20 I<nb<20 I<nb<20 mixed U-Pu, U233 others),
Reactions 5-1 0 the physical form of the fissile media
Isotopes (metal, solution, compounds ... ,I<nb<20 I<nb<20 0 the slowing down factor, which is a neutron
= Mia spectrum indicator.
Moderator I<nb<20 I<nb<20 I<nb<20 Moreover, MORET4 validation work has highlightedzo some biases either due to material properties
Reactions 22 (absorption or scattering) for several isotopes (for
Total 40 6880 1 172 13508801 instance Iron in the 172 groups mesh) or to theITotal, production, absorption, excess, fission in approximations used (homogenisation step for
fissile zones. configuration with high flux heterogeneity). This workZTotal, absorption in moderator zones will be completed with the new experiments of the
validation database and some other biases may appear.In order to keep the maximum number of parameters, The first group contains all the experiments satisfyingthe new base consists of two XML files. both ICSBEP and validation criteria. The secondThe first file contains ICSBEP information: group gathers experiments satisfying the ICSBEP
• type of fissile media, criteria only and the third contains all the other• form of fissile media, experiments. Then, the user will determine his• slowing down factor working base by selecting the experiments according
and some specific information related to specific to his own knowledge and need.behaviour of the code. This concerns more particularly This step allows reducing the nurnber of experimentsabsorbers with cross-section uncertainties. in the database but it also enables to adapt the set ofThe second file contains all the other parameters: parameters to the actual case. For instance, a specific
• reaction rates (total, fission, absorption, energetic collapsing mesh may be defined in relationproduction and excess) on the whole fissile to the different isotopes involved in the media andmedia (the isotopic reaction rate are given), considering the neutron spectrum (the 172 groupsand on the structures, mesh does not suit to macroscopic comparison).
• flux by media,• leakages.
The parameters contained in the second file areS3) _ lbavailable on the 172 groups XMA mesh. This file is
a huge one and is never used in its entirety.Presently, the characterization database contains
,Ealmost all the experiments results of the VO validation.2base 379 over 399) and will be extended in parallel le
with the new validation base containing over 1200experiments').
lo' le lo' lo' 10 1� I lo' lo' le le le3. The parameters reduction process Energie (W)
As shown in Table 1, the number of available Fig. Uranium 238 capture cross section
parameters is too large compared to the number ofexperiments in the validation database. Therefore a The neutron flux can be divided in three distinctselection of parameters is required. A frst proposal domains (Fig. ):has been made by E. GAGNIER 5) that lead to a set of 1. In the thermal domain, the cross-sections vary35 physical parameters (essentially obtained by slowly with the energy.combining reaction rates collapsed on a energy- 2. In the epithermal domain, the cross-sectiongroups mesh). Unfortunately, these parameters are variations are very important with the energy ofcorrelated and are the same for every kind of media. incident neutron. A broad mesh is not sufficient to
- 536 -

JAERI-Conf 2003-019
describe precisely all the resonances and a self- P defines a new base and the visualisation only keepsshielding treatment is needed. the thfee first axes of this new base and projects each
3. At high energy the resonances are so numerous experiment in this new three-dimensional space.that they cannot be separated. The cross section iscontinuous. 5. Bias evaluation
A specific energetic collapsing may define the relative Even if the number of parameters has consequentlyimportance of the flux in each energetic domain. The decreased, this number remains too important tocollapsing may be adapted in relation with the interpolate with classical tools like linear regression.isotopes present in the fissile media. A second The Sliced Inverse Regression (SIR)7.8) is designed toparameter reduction can be proposed in relation with reduce large number of parameters while keepingthe composition of the fissile media. All the isotopes maximum amount of information.have not the same neutronic weight, therefore, only Let us define aj the parameters values of the id'
the most iportant isotopes are retained. experiment and Akffi the corresponding calculationbias
4. Visualisation a,, ... aln Akeff.1
X_ :One required capability of the tool is to display the and Yposition of a practical case among the experiments of aml ... a. Ak,.ff,.the BdC. In this case, the parameters set is given inrelation to the ICSBEP classification of the practical n number of parameters, m number of experiments.case and the user has to define the set of experiments The SIR method allows to define a new database Won which the statistical method will be applied. Either resuming the major part of information of X with athe whole base can be selected, or only a part of it in minimum parameters number W.relation to user parameter choice (for instance b1i ... bin'
ICSBEP). The database representation is projected in W= with n<< na Principal Components Analysis (PCA) base, whichstores most of information. This technique of b.1 ... b..
multivariate analysis provides a set of parameters that The bj parameters are obtained by the followingare linear combinations of the given parameters. All method. The initial database is divided intothe new parameters are uncorrelated and are sorted in homogeneous groups regarding Y values ig.3).relation to the ratio of information kept.The PCA method6) is equivalent to building a new Xi AL
base where axes are sorted in terms of carriedinformation.
&X3 +4-
+
Y
X ALX7+ ++ / +..!��++
++
Fig.2 PCA method representation
x1i ... Xin Y
X= C=eovX=PDP-' Fig.3 Groups definition
XMI ... Xmn Then the Principal Components Analysis is performedwhere P is C eigenvectors and D is C eigenvalues on the centres of the above-defined groups.matrix.
- 537 -

JAERI - Conf 2003 - 019
Y eD atabasc groups C M Csin (X,,Y) f an
[411- 4,Yo ef(XlX2)= : ( =X� XO...... ---- w ith
Y.ej
X,F [41 )'J,'�)]C6. The graphical user interface (GUI)
Fig.4 PCA on groups centres The GUI of the tool is developed in JAVA in orderto rim on most operating systems (Windows, UNIX,
The SIR matrix is defined as follows: Linux). The different panels of the GUI resume all thesteps of the method presented above and allow user to
sij S1'P access to the three main functionalities:XI
W = X SIRXY definition of the characterization's working
s"I S"P database user selected experiments with 2 first
where the Sp are the p first principal components. panels Fig.6 and 7,p is chosen to keep a defined amount of information e graphical visualization of a practical case(for instance 80%). among the experiments of the workingOnce the dimension reduction has been performed, database (PCA panel Fig.8),classic interpolation method may be used. In present a bias estimation with statistical uncertaintycase, Kernel Smoothing method has been retained to evaluation (SIR-KS panel Fig.9).
evaluate calculation bias.
6.1 The ICSBEP parameters selection panel
The first panel (Fig.6) allows reading the CARA-Y file. The user must specify the ICSBEP parameters ofYi its practical case and indicates the presence, or not, of
specific isotopes. Once done, the validation buttonYM gives accessto the database panel.
Yo
XO Xi x x�
Range a
Fig.5 Kernel smoothing principle
Our goal is to evaluate y the ordinate of point x. The yvalue is a weighted average value of y where theweights are the inverse exponent of the distancesbetween x and the xi considered.
E (Oiyi 2
Y f W = I I where = e(X ai Fig.6 ICSBEP parameters panel
k is a user-defined smoothing parameter. For instance,the interpolation function fx) for a two p-parameters 6.2 The database panel (Fig.7)case is defined as follows: The second panel allows the user to define the
characterization's working database. The BdC isdivided into three parts:
- 538 -

JAERI-Conf 2003-019
The first contains the nearest experiment in the On each axe, the quantity of information stored by theICSBEP classification. parameter is indicated in per cent.The second contains the experiments The total amount of information restored on the threesatisfying the ICSBEP parameters but differs axes is given in a box below the graph.
on the extra isotopic parameters.The third part contains all the other It is also possible to select an experiment in the listexperiments. that appears in green on the graph.
To build the working database the user can chooseexperiments in the three parts of the database. A A further evolution will allow calculating the distancegraphical tool is also available to help the user to between the practical case and the center of all the
select the experiments. experiments.
Fig.7 Data selection panel Fig.8 PCA display panel
This tool allows comparing the different 172 groupsparameters, such as flux, leakages and reaction rate, of 6.3.2 Bias evaluation panel (Fig.9)
the practical case and of te experimental cases This SIR-KS panel allows evaluating calculationcontained in the whole database. Advanced bias by means of statistical tools. Depending on thecapabilities are integrated such as zooming, scale number of experiment retained, the calculation methodchanging (linear and logarithmic), printing data in a varies. If the number of experiments is too smallfile or in a dynamic table. The three parts of the BdC (smaller than 1.5 times the number of parameters), aare accessible through the tabbed panel surrounded simple average on the Akff is performed; else a SIR-with red. The experiments selected in the working KS interpolation method is used.database are surrounded with green.
These first two panels aims to define a workingdatabase (reduced or not) on which elaboratedstatistical method are going to be applied in order tovisualize or evaluate a bias and its uncertainty.
6.3 The statistical tools panels
Once the working database has been selected, twooptions are available. The first option is to display thepractical case among the experiments of the reduceddatabase. The second option is to evaluate acalculation bias from the reduced base of experiments.
63.1 Visualization panel (Fig.8) ANOMMON"Fig.9 Bias evaluation panelIn the PCA panel, the parameters are projected on
the base defined by the PCA method. The practical These both methods give results but need farthercase appears in red and the experiments of the reduced developments. Presently, these methods only give adatabase appear in blue. On the left side of the panel, value of calculation bias, but another parameter has toall the selected experiments are displayed and the set be evaluated. This parameter is the uncertainty on theof parameters used in the PCA are detailed with the result of the method. The SIR-KS method is a quitetype of energetic condensation. precise way to proceed and the uncertainty on the
- 539 -

JAERI-Conf 2003-019
result is small, but for the average calculation, the Referencesuncertainty may be very important depending on theconcerned number of experiment. A method to 1) 1. Duharnel, J.M. Gornit, Y. K. Lee,determine this bias is in progress. C. Venard.
Surrounded with blue (see Fig.9), the experiments of "Synthesis on the Validation of the CRISTAL VOthe working database are displayed with the associated Package," Proc. Int. Conf, on Nuclear CriticalityAkfr (results of the MORET4 validation work 1) ). The Safety, ICNC'2003, Tokai Mura, Japan, Oct. 20-24,detailed set of parameters is surrounded with green 2003
and the interpolation panel is surrounded with blue. 2) J. Blair Briggs, Virginia F. Dean, Lori Scott,
7. Evolutions foreseen "Status of the International Criticality SafetyBenchmark Evaluation Project
The future evolutions are the following: (ICSBEP)," ICNC'99 Versailles, Sept. 1999
- Three database are foreseen to be used by thistools: 3) C. J. Dean, R. J. Perry,• the BdC (already created), "Weighting spectrum for the XMAS group scheme",• the 35 parameters database deten-nined by E. Winfrith Technology Center, 1990)
Gagnier,• the ISCBEP parameters9) database. 4) I. Duhamel, E. Ldtang, A. Cossenet, G. Poullot,The two latter bases have to be created and will "Experimental validation of the APOLL02-MORET 4automatically benefit from the increase of the Standard Route of the French CRISTAL VInumber of experiments present in the validation Package," Proc. Int. Conf. on Nuclear Criticalitybase. Safety, ICNC'2003, Tokai Mura, Japan, Oct. 20-24,
- In the three bases the number of experiments will 2003.
reach approximately 1200. 5) E. Gagnier, L. Carraro, A. Antoniadis,- An industrial database will be defined to assist
developers in validating this tool. This database A. Nouri, P. Reuss,will contain industrial application cases provided "The Characterization System: a Statistical Approachby the CRISTAL users in order to cover the largest for the determination of the range of coderange of cases that could be encountered in all the applicability," ICNC'99 Versailles, Sept. 1999
nuclear fuel cycle and during the fissile material 6) I.T. Jolliffe,
transport. "Principal Component Analysis," Springer Series in- This extensive validation will lead to improve the Statistics, 1986
capacities of the codes concerning:
• the choice of the parameter sets, 7) J. Saracco,
• the applicability range of the statistical ,Contributions A la r6gression inverse par tranchages",methods, Thesis, Universitd Paul
• the statistical methods themselves Sabatier, Toulouse 111, 1996(uncertainty on the bias estimation).
8. Conclusion 8) K.C. Li,"Sliced Inverse Regression for DimensionReduction," Journal of the American Statistic
This Graphical User Interfaced tool for MORET4 Association, Vol. 86, N' 44, Theory and Methods,allows evaluating bias and displaying comparison 1991between actual cases and experiments of a validated
database. Statistical tools are available and set of 9) Y. Rozhikhin, Dr. A. M. Tsiboulia,parameters is defined. A validation database is T. Ivanova, J. B. Briggs, Dr. V. F. Deanforeseen containing user practical cases in order to "Detailed Spectra Data for the Internationalimprove the choice of parameters sets and the Handbook of Evaluated Criticallity Safety Benchmarkstatistical methods. Experiments," ICNC'99 Versailles, Sept. 1999
Acknowledgements
The authors wish to thank I.Duhamel for her helpfulcomments while preparating this paper.
- 540-

JAERI-Conf 2003-019 JP0450103
CALICEAn Essential Software Tool for Criticality Engineers
E. GUILLOU H. TOUBONCOGEAM LA HAGUE COGEM4 VELIZY
50444 Beaumont Hague Cedex 78141 Vilizy CedexFrance France
eauillouAcopenia. htoubon(iDcogema.
L. AGUIAR D. MIJUINCEA SA CLAY CEA SA CLAYDEXIDM2S DSNQ
91191 Gifsur Yvette Cedex 91191 Gifsur Yvette CedexFrance France
aPuiar(a)solei1.serma.cea.fr miJuin(a-)aguilon.cea.fr
G. CHAZELLE, E. CHTOURBINE, L. CLOUET, E. LEJEUNEMILLENNIUM
2, rue du pont Colbert78000 Versailles
Franceguy.chazelle(a)millennium1r, eric.chtourbine(i-bmillenniumfr,
laurent.clouetAmillennium.fr, eric.lemetmeAmillennium.fr
1. Introduction0 homogeneous or heterogeneous media,
To carry out their everyday tasks, it is very useful 0 media with homogeneous moderation orfor nuclear criticality engineers to be able to quickly heterogeneous moderation,and reliably retrieve data usually used to value 0 poisoned media,criticality risks. These data are 0 media taking into account Bum-Up Credit or
not.• Fissile materials properties, such as the infinite
multiplication factor k, the material buckling Besides accessing data, CALICE v2.0 can also2factor M, tabulated as a function of the perform the following tasks:
moderation ratio or the concentration,• Criticality parameters (safe, permissible or 0 graphically display parameters as a ftinction of
critical values) which correspond to one moderation ratio or concentration,dimension geometries infinite height cylinder, 0 interpolate between two values stored in aspherical volume ... database,
0 compute simple one energy group theoryThis information is widely used in criticality safety calculations,
analysis, in technical meetings with French Nuclear 0 export data to ASCII files,Safety Authorities and also, during crisis management. 0 generate pre-formatted documents,
These data are calculated by means of one- 0 import data from formatted ASCII files,dimensional deterministic transport codes which lead 0 edit and modify data stored in the database.to the production of documents called "Criticalitystandards".
The aim of the CALICE project is to store all these 2. Technical specificationsdata (more than one million) into a database wh To develop a tool working under WINDOWS andbe accessed through a useftil tool with a of intuitive use while privileging robustness andgraphical interface. perpetuity, the reserved solution was to develop this
As a result, version 20 of the CALICE software application with the environment of developmentallows access to the criticality parameters and the DELPHI from BORLAND.fissile properties calculated with various codes such as The choice of DELPHI 7 allows exploiting theCRISTAL'), SCALE or MCNP or collected in specificities and advantages of an object- orientedinternational standards for: language to develop a tool which will be:
- 541 -
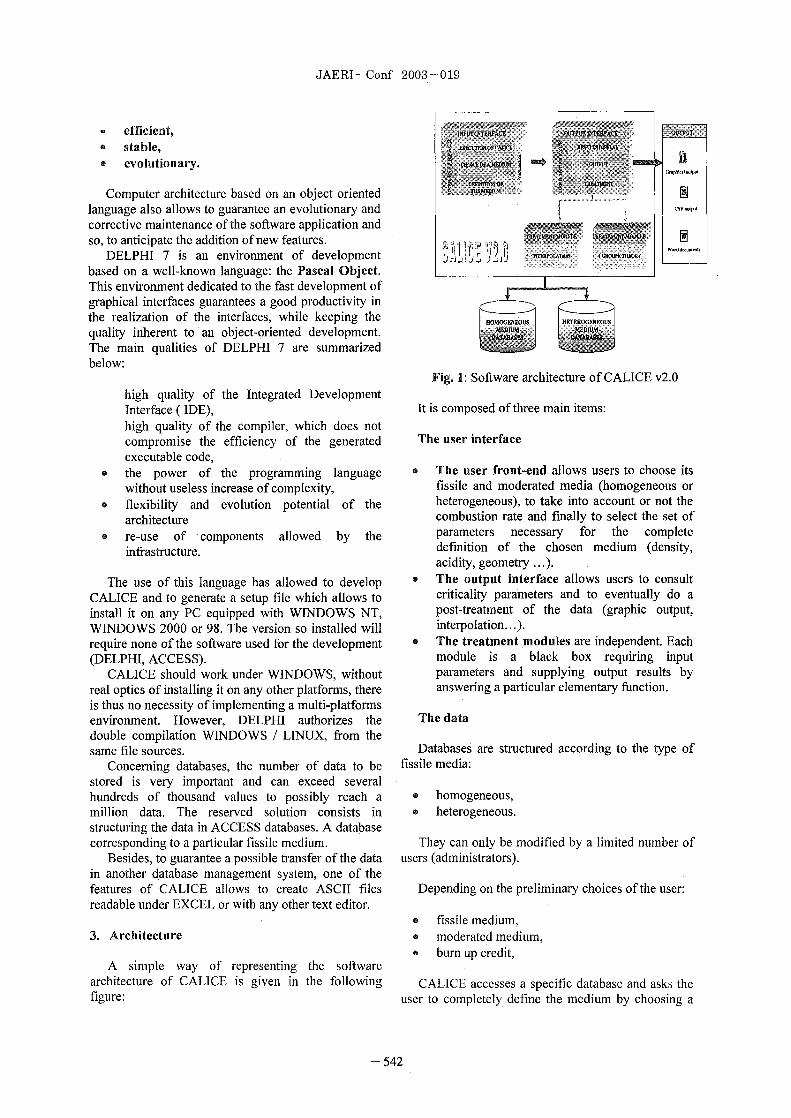
JAERI-Conf 2003-019
efficient,stable,evolutionary.
r-,hW
Computer architecture based on an object orientedlanguage also allows to guarantee an evolutionary and P.
corrective maintenance of the software application andso, to anticipate the addition of new features.
DELPHI 7 is an environment of developmentbased on a well-known language: the Pascal Object.This environment dedicated to the fast development ofgraphical interfaces guarantees a good productivity inthe realization of the interfaces, while keeping thequality inherent to an object-oriented development.The main qualities of DELPHI 7 are summarizedbelow:
Fig. 1: Software architecture of CALICE v2.0
high quality of the Integrated DevelopmentInterface ( IDE), It is composed of three main items:high quality of the compiler, which does notcompromise the efficiency of the generated The user interfaceexecutable code,
• the power of the programming language 0 The user front-end allows users to choose itswithout useless increase of complexity, fissile and moderated media (homogeneous or
• flexibility and evolution potential of the heterogeneous), to take into account or not thearchitecture combustion rate and finally to select the set of
• re-use of components allowed by the parameters necessary for the completeinfrastructure. definition of the chosen medium (density,
acidity, geometry ... ).
The use of this language has allowed to develop 0 The output interface allows users to consultCALICE and to generate a setup file which allows to criticality parameters and to eventually do ainstall it on any PC equipped with WNDOWS NT, post-treatment of the data (graphic output,WINDOWS 2000 or 98. The version so installed will interpolation ... ).require none of the software used for the development 0 The treatment modules are independent. Each(DELPHI, ACCESS). module is a black box requiring input
CALICE should work under WINDOWS, without parameters and supplying output results byreal optics of installing it on any other platforms, there answering a particular elementary function.is thus no necessity of implementing a multi-platformsenvironment. However, DELPHI authorizes the The datadouble compilation WINDOWS LINUX, from thesame file sources. Databases are structured according to the type of
Concerning databases, the number of data to be fissile media:stored is very important and can exceed severalhundreds of thousand values to possibly reach a a homogeneous,million data. The reserved solution consists in 0 heterogeneous.structuring the data in ACCESS databases. A databasecorresponding to a particular f issi le medium. They can only be modified by a limited number of
Besides, to guarantee a possible transfer of the data users (administrators).in another database management system, one of thefeatures of CALICE allows to create ASCII files Depending on the preliminary choices of the user:readable under EXCEL or with any other text editor.
0 fissile medium,3. Architecture 0 moderated medium,
A simple way of representing the software a bum up credit,
architecture of CALICE is given in the following CALICE accesses a specific database and asks thefigure: user to completely define the medium by choosing a
- 542 -

JAERI-Conf 2003-019
specific set of parameters among those stored in theTz. d. ,d- F-k ........... .. ........ N� . f4a.
database: density, acidity, poison ... r *.O. U I C U.N041Am
rPU r U.P..241A-W-.,��
Once the medium is defined, the user can execute�Jyp- .Mdad-
his request. The output interface extracts the results of r Atk� a,
the relevant database and displays them on the screen. r P..241Mr 06I.W.
U M4The output r S- pd. TC
IH20
A- d. TC C JAPOLL I DTF4V CEA86)The outputs that can be produced by CALICE are
of three types:
a tables of results, Fig. 2 Window allowing to chose a fissile medium4) Graphical results,0 CSV documental The parameters of this window characterize
WORD documents. completely a database. The validation, leads to theopening of a second window from which the user can
4. Three types of users choose the characteristic parameters of the fissilemedium (density, acidity, geometry ... ). The
Three types of users have been defined, according ergonomics of this second window depends on theto their level of expertise and the nature of their needs: type and on the nature of the selected medium. The
following figures show two examples of windows:Standard user ------------- -- 1- -- ------ - ---------This profile corresponds to a user who, for the ... ..............
needs of a study, should make one or a set of k6m gj4 2
consultations from data stored in database. Te basicfeatures of CALICE are foreseen for this type of user
.... ...... ......who can use directly the results of consultations.
Expert userThis profile is dedicated to users who, for the
needs of an expertise or a study of criticality, can beNI",
brought to import one or several databases without /24W./24IN/24Z.
modifying their contents. Contrary to a standard user, T-.240P.M - 11 0 R2.$1 �FQthe "expert" can also realize interpolation. To do it, ...... .. ....
C-� -MM6.
this type of user has access, via a login and a password,A.A..1-241A.]Ii
to these functions. ... 7�-
- --------------------The administrator ...... ......The administrator guarantees the distribution of
CALICE to potential users. The administrator can also Fig. 3: Characteristics of a homogeneous fissilecreate new databases, modify their contents as well as mediumthe title of each field. To do it, the administrator hasaccess to a specific database management tool. Thisprofile is distributed to a very limited number of users.
5. CALICE functionalities
The choice, in the "File" menu, to consultcriticality parameters leads to the opening of awindow which allows to define completely thedatabase which will be opened and from which thedata will be extracted. The figure below represents thiswindow:
- 543 -

JAERI-Conf 2003-019
Once the criticality parameters have been selected,N.& iMd&
P.1 R'P� HX. users can easily find the minimum critical value andTM liable
im H&S,.y- realise any post-treatment, such as requiring a�-Omr-& A,
LUD 2:�M graphical display. The figure below, represent an....... ........ ......... ...... ........ .... ............................. .... ...... .... ..... .....example of plot produced with CALICE:
....... ...... .. .. ..................................
j2�/Z3!RJ1M/230U,7
��]IIIUIMIUlCh.4- �j
E..4- V`- Wqin
jCh=
JnW,123W.1240p. 41 Pu 242P.
T_.2.0PU(,4 Ai tH2
JR1 R2C 5hb. I rpt�-
D_ ............. ..........
.. ..... .. ...... .
Fig. 4 Characteristics of a heterogeneous fissilemedium
The validation via the button "Next" leads to thescreen of presentation of the criticality parameters.This window consists of three zones: Fig. 6 Graphical output of CALICE v2.0
• a zone reminding the properties of the selected 6. Conclusionfissile medium,
• a zone allowing to select te parameters to see CALICE v2.0 is thus an intuitive, user friendly,(criticality parameters, neutronic constants and fast and effective analytic application which isany other physical parameters), accessible at any time on the criticality engineer's
• a zone displaying the parameters selected as a personal computer.function of the concentration and the Its helps nuclear criticality engineers, in theirmoderation ratio. everyday tasks, to quickly access data usually used to
value the criticality risks on an installation.The figure below represents the window of
consultation: RW rences1) J.M. et al, "The Cristal. Criticality Safety
Package", ICNC'99P.
........... ... .
V 44
.. ................. ................... ...............
Q.jj.ATj �� H�(.Z! d1l
12 9MW 000 zm'. this3 316�� 9:M I.. 2.,089 �Umi
2 36917 MW �1:998 OU35124t� 20M 1.904 0,036GMai MM ton 0 M47515.953 %DUO I.M 0 M AM fNU3W973 7aDOO� 1A% 20092G1 V2 100,000 I M B.031 N-in M015 IMMO I am a 030 D
M.W M.000 IM 0912 87 895 3M009 IM2 =8_L3 65 94 400.000 1.,75 OU27 1W14 M LWOW 1712 M4 chains d. -aw_15 M. MMD 02- ME 9M.Ow tw 'awl 1,0017 M451 1 X000 1.5� 0019La 2' Ns I ftiim i�50 6018
12DD.000 1�517' 0�64........ ... OM I -1 W 1-M I Fi�j
..... ..... .. .... .. ... ......
Fig. 5: Neutronic constants display of CALICE
- 544 -

JAERI-Conf 2003-019 JP0450104
The Graphical User Interface for CRISTAL V1
L. HEULERS*, G. COURTOIS", F. FERNEX, J.M. GOMIT and E. LETANGInstitut de Radioprotection et de Sfiretj Nucliaire, BP] 7 92262 Fontenay-aux-Roses Cedex, France
t: G. COURTOIS died on January 2003.
This paper deals with the new Graphical User Interface (GUI) of the CRISTAL VIpackage devoted to criticality studies including bum up calculations. The aim of this GU isto offer users a high level of user-friendliness and flexibility in the data description and theresults analysis of codes of the package. The three main components of the GUI (CIGALES,EJM and OPOSSUM) are presented. The different functionalities of the tools are explainedthrough some applications.
1. Introduction
The new Graphical User Interface (GUI) of theCRISTAL VI package') has been developed byIRSN to offer users a high level of user-friendlinessand flexibility, to propose an easier data descriptionof codes and an automatic selection of nuclear dataand computation options.
The three main components of the GUI areCIGALES, EJM and OPPOSSUM. The CIGALEScomputation code is a data generator used toprovide data files for te APOLLO2 assembly code(Pij or Sn calculations). The CIGALES V3 versionbenefits of a lot of improvements like a new recordmethod (based on the use of a database) to save andcall-back data (for a media panel or a whole Fig Main panel of CIGALES (V3)calculation), new dilution laws to calculate isotopesconcentrations of fissile media, options for multi- 1) Creation of data file for the APOLL02cell data file preparation and the possibility to link computation code, which produces, with thethe CRISTAL VI package with depletion codes for probability collision method (Pij method),bum up calculations. The EJM and OPPOSSUM homogenised and self-shielded macroscopic crosstools are graphical tools belonging to the pre- and sections for the MORET4 computation code andpost-processing Toolbox of the MORET4 neutronic parameters of the fissile materials;computation code, respectively a text editor to 2) Creation of data file for the APOLL02display the geometry construction and a tool to computation code for calculation of the effectivedisplay and to analyse the results of the Monte multiplication factor Keff (ID or 2D calculations)Carlo simulation. with S method;
2. The CIGALES computation code 3) Creation of data file for the APOLL02computation code for calculation of standard worth
2.1 Overview (ID calculation with users defined reflectors) withThe CIGALES2) computation code, available on Sn method.
Windows NT or 2000 environment, is devoted to 2.2 Improvements in the new version:the automatic generation of data files for theAPOLL02 3) computation code. Input data are CIGALES V3provided in an interactive way, using the tree 2.2.1 Recordsstructure of panels with predefined fields. In the previous version, users were able to
display recorded simple information aboutThrough the main window FiR 1, users have materials on panels. This information was stored on
access to the three functions provided by CIGALES text-files. In this new version, the use of a database(the same in all versions): replaced the simple previous system.
Thus, in each panel, a list appears at side of thematerial description, Fig 2.
LoYc HEULERS, Tel. 33-1-58-35-87-91, Fax. 33-1-46-57-29-98, E-mail: loic.heulers�irsn.fr
- 545 -

JAERI-Conf 2003 019
Lois de, Dilution..... .... . .....................................
MW
U M641 PU m6talU02 uistal PU02 nstal U02+PuO 6stalU02 po.de PuO2 poud,� U02+PuO2 poudreU308 vistal Nome Pu III Mr. nXte Th, ILOOB poudre 'Th ��
N�,Ir NOrmixte UPu r/+Th+94LU4N) sandard
& goal PuF4 poudre UP.02-(UPu4)�it
UF4 ustal Crbure UC+PuC d.1.1UF4 p.udr. Carbum UC-Pu pudreUFS-HF WU04-4H20 .udr� NjV.reU, ='i.p�.2hU03 cristal S
.... .............. ... ... ...... U03 poudre 9 DIE
JU(NO3)4
g� 'Rlm% ,,
Fig 2 Material panel with data list Fig 3 Dilution law panel
This list allows calling back of information of a 2.2.3 Multi-cell calculationselected material even if composed of several The main innovation of this new version ofmedia. Therefore, users can call back a cell CIGALES code is the implementation of thecalculation and change or add a moderating ratio multi-cell option. This option allows users to createvalue for one fissile without rewriting anything else an APOLL02 data file for a multi-cell Pij(density, list of elements for the media ... . This new calculation (based on the interface current method).record method affords to users to do calculationfaster. The creation of a multi-cell data file consists of
Moreover, users can remove a selection from the three main steps:list by pressing the delete key. a Description of the assembly geometry,
In addition, CIGALES allows recording the (Fig 4.
whole geometry of a simple or multi-cell a Cells regrouping for self-shieldingcalculation. calculation, Pij calculation and
2.2.2 Density laws homogenised media definition, (Eig-5).Criticality calculations need, as input data, the 0 Definition of reference cells used in the
atomic densities of fissile mixtures. Density lawS4) array, ig-6).are used to calculate them in solution mixtures andderive the water content, which rules the reactivity.There are relationships between mixture densityand actinide concentration, acidity and temperature: TITREdt,*dRULTICELLUUE�
,o = f(C(X), H, T). CIGALES V3.0 provides these .... ............ ......................
atom densities. r -t-1. Q'.5r&
The main improvements added in the newCIGALES version are the followings: ION
New nitrate density laws, �i .... ... ... .S Y M E T R E , ...............................................I.............................. ...................... .... .............
• New oxide-nitrate density laws, t7 r y
Possibility to solve every mixture with the r r" C
volume addition law using the "solutdsg6ndralisds" (generalized aqueous ODEU&ATMN ... .. ........ ...........................
solution) density law, RESEW
Some changes in the water density and inthe HN03 density law which affectslightly all the density laws, Fig 4 Multi-cell option front panel
0 Possibility to take into account other
moderators (CH2, plexiglas, etc..) in the The front-end panel (Fig 4) offers twogeneralized aqueous solution density law. possibilities:
These innovations are underlined in Figure 3 0 Creation of a new assembly (symmetrychoice, dimension of the rods array ... ,Access to the database through twodifferent options: either through thequalified part of the base, which can not
- 546 -
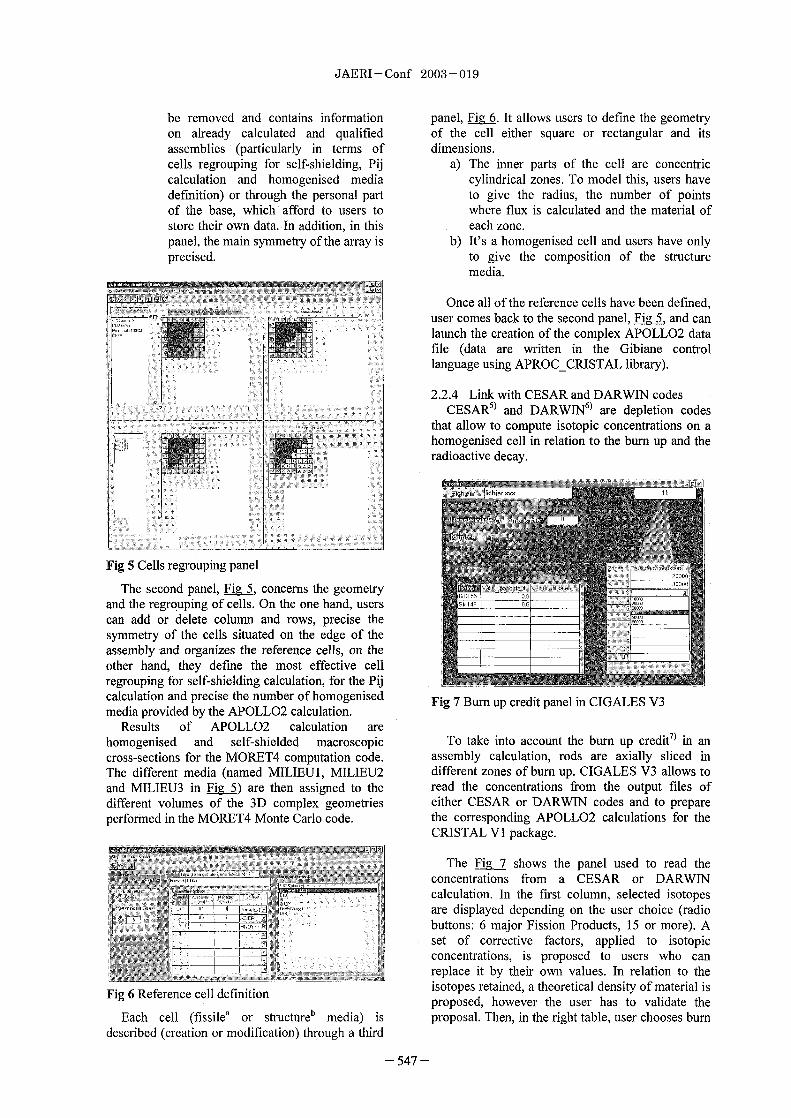
JAERI-Conf 2003-019
be removed and contains information panel, g_6. It allows users to define the geometryon already calculated and qualified of the cell either square or rectangular and itsassemblies (particularly in terms of dimensions.cells regrouping for self-shielding, PiJ a) The inner parts of the cell are concentriccalculation and homogenised media cylindrical zones. To model this, users havedefinition) or through the personal part to give the radius, the number of pointsof the base, which afford to users to where flux is calculated and the material ofstore their own data. In addition, in this each zone.panel, the main symmetry of the array is b) It's a homogenised cell and users have onlyprecised. to give the composition of the structure
media.
Once all of the reference cells have been defiried,user comes back to the second panel, Fig 5, and canlaunch the creation of the complex APOLL02 datafile (data are written in the Gibiane controllanguage using APROC CRISTAL library).
2.2.4 Link with CESAR and DARWIN codesCESAR') and DARwrN') are depletion codes
that allow to compute isotopic concentrations on ahomogenised cell in relation to the bum up and theradioactive decay.
ELLFig Cells regrouping panel
The second panel, Fig 5, concerns the geometry 8
and the regrouping of cells. On the one hand, users 4 q 0 6
can add or delete column and rows, precise thesymmetry of the cells situated on the edge of theassembly and organizes the reference cells, on theother hand, they define the most effective ellregrouping for self-shielding calculation, for the PiJ
calculation and precise the number of homogenised Fig 7 Bum up credit panel in CIGALES V3media provided by the APOLL02 calculation.
Results of APOLL02 calculation arehomogenised and self-shielded macroscopic To take into account the burn up credit') in ancross-sections for the MORET4 computation code. assembly calculation, rods are axially sliced inThe different media (named MILIEU1, MILIEU2 different zones of bum up. CIGALES V3 allows toand MILIEU3 in Fig 5) are then assigned to the read the concentrations from the output files ofdifferent volumes of the 3D complex geometries either CESAR or DARWIN codes and to prepareperformed in the MORET4 Monte Carlo code. the corresponding APOLL02 calculations for the
CRISTAL VI package.
T e FIR 7 s ws the pane use to rea theconcentrations from a CESAR or DARWINcalculation. In the first column, selected isotopesare displayed depending on the user choice (radio
E.
rH71 buttons: 6 major Fission Products, 15 or more). Aset of corrective factors, applied to isotopic
-7- concentrations, is proposed to users who canreplace it by their own values. In relation to theiio;w�
Fig 6 Reference cell definition isotopes retained, a theoretical density of material isproposed, however the user has to validate the
Each cell (fissile" or structure b media) is proposal. Then, in the right table, user chooses bumdescribed (creation or modification) through a third
_ 547 -

JAERI-Conf 2003-019
up value for each axial zone (number of zones is In the volume creation panel presented hereafter,precised in the text field above). Fig 9 users give the position of the volume, the
number of the volume, which contains it, the3. The EM text editor number of the chemistry and the kind of
interactions (topological operators) with other3.1 Overview volumes (optional).
EJM is a new tool for the MORET4 Monte Carlocode. EJM is available on all of environment(Windows, Linux, Unix). The tool is written in
Wd6vililume.JAVA. It is a text editor which offers users thepossibility to display the construction of theirgeometry at the same time as they write it. Its �Wum:e extkleur A Chim� 3
principal panel is cut into two parts: the left part isused to write the modeling of the geometry and the Type� �80W n- I aJ Liright one to visualize it by various cuts (in the threedirections) at various levels in real time, Fig 10.
3.2 UseThe text editor includes the usual functionalities:
• Undo/redo,• Search/replace,• Saving file,• Keeping in memory the path of the last
saved files.Specific functions dedicated to the geometry areavailable:
• Keyword colorization (keywords can bedefined by users),
• Adding cuts in the visualisation panel. Fig 9 Volume creation panel in EM
Besides, from the toolbar, users can create newtypes of volume, Fig 8, and new volumes, Fig 9 As it is shown on Fig 10, with a simple right-The sentences corresponding to the new type and click of the mouse on a volume, a window appearsvolume created are automatically written on the text with some information (number of the volume, type,area. In the same way, each new volume is drawn in chemistry, position). In the same way, if youeach cut of the graphic area. double-left-click a colour-chooser panel appears,
.. .. ....... giving the possibility of changing the chemistrycolour, Ei I .
.............
M
iJ2hatdeur4c' 4"
Ajouter Annuler V
0Fig 8 Type creation panel in EJM
In the type creation panel, Fig 8, users enter, Fig 10 EJM main paneldepending on the volume type desired, the values of
the main parameters (height, length, width for a box, Moreover, any change made in the text panel
radius for a sphere ... (modification of the chemistry number for a volume,
548 -

JAERI-Conf 2003-019
suppression of a volume ... is reflected on thegraphic area.
E
T1011a
EllM
Australian," ii�fi ... ..... ......
Fig 12 OPOSSUM main panel
In a second step, users have access to three tabo i I i panels: the first one to visualize keff, Fig 13, the
4second for the reaction rate, Fig 14, and the crosssection and the last one, which allow users to
Fig 11 Chemistry colorchooser display the position of the source in the geometry.
4. The OPOSSUM post-processing tool
4.1 Overview W., ''MOPOSSUM (Eig 12) is a post-processing tool for
the MORET4 Monte Carlo code. OPOSSUM isavailable on all of environment (Windows, Linux,Unix) thanks to the use of JAVA. It allows users tosee the results of their MORET4 calculation Strip �V,
through graphs and curves and to compare severalcalculations results.
Developments performed in MORET4 codeallow archiving Flux during the calculation (at eachbatch, 3 different estimated flux value are stored foreach volume and energy group) in a compressed Fig 13 Keff panelfile. At the end of calculation, all compressed fileare placed with a XML file (which contains data From the keff panel, thanks to a table legend,about the geometry' batches keff, source ratio per curves can be added or removed by checking or notvolume at each energy group, macroscopic cross- the right box. We visualize here 6 differentsection for each media) in a tar file. estimators: only one point per estimator if data are
Thanks to the collection of this huge quantity of coming from an average calculation or a curve (asdata, OPOSSUM will be also a statistic tool for plotted in Fig_ 13) if all the data are considered (allMORET4. the calculation batches are taken into account).
4.2 UseTwo modes of use are available in OPOSSUM:
starting from the whole data resulting fromcalculation or performing the average of these datatowards an opost file. This choice is done in the"File menu" opening a file or creating an opostfile. Moreover, an iterative stationarity test is doneto remove the transient of the calculation In factMonte Carlo criticality calculations are widelybiased by sources initialization and thus need atransient suppression process. This automatedsuppression of the initial transient has been
... ...... ..validated firstly on a plan of experiments oftheoretical k-effective series, and secondly on a setof practical cases. Fig 14 Reaction rate panel
- 549 -

JAERI-Conf 2003-019
In the reaction rate panel, various macroscopic Criticality Safety, ICNC' 2003, Tok;aff Mura,reaction rates can be displayed: production, Japan, Oct. 20-24, 2003.
absorption, excess, total, for each media of the 5) M. Sansom, J.P. Grouiller, J. Pavageau P.geometry. In the same way, macroscopic cross Marimbeau, J. Pinel and J.M. Vidal, "CESAR: asection can be displayed. More, the same parameter Simplified Evolution Code for Reprocessingcan be visualized for different media. Applications," Proc. Int. Nuclear Conf On
In the last panel, the geometry is displayed as in Recycling, Conditioning and Disposal, RECODthe panel graphic of EJM, Fig 10, and users can 98, Nice, France, Sept. 25-28,111, 986 1998).
visualize, by choosing the parameter on a table 6) "DARWIN: an Evolution Code System for a(source or reaction rate), the proportion of this Large Range of Application" - J. Nucl. Sci.parameter in each volume of the geometry at the Technol., Supplement 1, p845-849, March 2003.
beginning or the end of the calculation. 7) J. Raby and al., "Current studies related to the
The last functionality is the possibility given to use of Bum up Credit in France", Proc. Int.users to compare different cases of MORET4 Conf. On Nuclear Criticality Safety, ICNC'calculations. In that case, the last panel (geometry 2003, TokaY Mura, Japan, Oct. 20-24, 2003
display) is not enabled. Besides, these comparisons 8) Y. Richet, 0. Jacquet and X. Bay, "Automatedare done only with the opost file, so with average Suppression of the Initial Transient in Montedata. Carlo Calculations based on Stationarity
Detection using the Brownian Bridge Theory",At least, a possibility is offered to create for a Proc. Int. Conf. On Nuclear Criticality Safety,
calculation its own output data file by selecting the ICNC' 2003, TokaY Mura, Japan, Oct. 20-24,desired exits. 2003.
5. Conclusion
The new Graphical User Interface (GUI) of theCRISTAL VI package offers a high level offunctionalities and flexibility to achieve data filescreation (through the CIGALES and EJM interface)and to analyse and display the results (OPOSSUM).
This new generation of interface will preventusers of making effors, such as syntax eor in theinput data files (CIGALES, EJM), will improve thechecking of the MORET4 calculation validationand the analyse of the result (OPOSSUM). More, itwill allow users to exploit as well as possible thehigh quantity of data contained in the listing and toeasily compare various calculations.
References:
1) J.M.Gornit al., "CRISTAL VI: CriticalityPackage for Burnup Credit Calculation", Proc.Int. Conf. On Nuclear Criticality Safety, ICNC'2003, TokaY Mura, Japan, Oct. 20-24, 2003
2) E. Ldtang, G. Courtois, J.M. Gomit, "TheGraphical User Interface for the CRISTALPackage," Proc. Int. Conf. on Nuclear CriticalitySafety, ICNC'99, Versailles, France, Sept. 20-24,1999,1, 298 1999).
3) R. Sanchez, "APOLL02 A modular code formultigroup transport calculation". Nucl. Sci.Eng., 100, 352 1988).
4) N. Leclaire and J. Anno, "Isopiestic density lawof actinide nitrates applied to criticalitycalculations", Proc. Int. Conf. On Nuclear
_ 550 -

JAERI-Conf 2003-019 JP0450105
The SMORES Capability for Minimum Critical Mass DeterminationIY. KARNf, D. REGEV, E. GREENSPAN' ,S. GOLUOGLL�, L.M. PETRIE'and C.M HOPPER'
Uni"rsity of California, Berkeley, California 94720-1730, USA2Oak Ridge National Laboratory, P. 0. Box 2008, Oak Ridge, Tennessee 3 7831-6370, USA
The purpose of the present work is to illustrate the capability of SMORES - a nwsequence incorporated in SCALE-5, for automated minimurn critical mass (MCM)determination. The illustration Ls de by identilytrig the MCM of spherical systems of"U, U or "Pu moderated and reflected with either D20 or a combination ofpolyethylene and Be. he latta povide the lowest critical mm of, respectively, 151.7g, 202.2 g and 119.0 g. These masses are close to a factor of 2 lower than the MCM ofthe corresponding fissile material with D20 and close to a factor of 4 for the MCM H20. The fissile material concentration exhibit a spike rim the core outer boundary atthe interface between the poyethylene a Be. The SMORES sequence of SCALE could be useful fbr determining margins of subcriticality and for oer applicationsencountered by tic criticality safety cmmunity.
KEYWORDS: SMORES; SCALE, Minimum Critical Mass; Maximum ke 233 U; 235 U; 239p"
1. Introduction search for the minimum crfical mass or for theminimum mass that can provide a pecified k < .0.
A new prototypic analysis sequence, SMORES The ppose of the pesent work is to illustrate the(Scale Material Optimizanori and REplacement capability of the new SCALE sequence fb mmumSequence), was - recently developed for critical mass MCM) determination.incorpoation into the SCALE-5 code package'). The illustration is done by appyirig the SMORESSMORES, provides for a semi-automatic search for sequence to determine the MCM of two types ofeither the maximinn kff of a given amount of systems: (A) A system consisting of a single fissilespecified fissfle material, or the mmum critical material moderated and reflected by heavy-water andmass. It is described in detail in reference 2 and also M A system consisting of a singje fissile material in references 3 4 and 5. combination with two moderating materials -
Very briefly, the search procedure proceeds as poyethylene (Poly) and berylliurn (Be).fbllows: Befbre starting the optimization process, a Type A systems were found by previous researchersrekrence system is defined This oxides the core to offer the lowest MW of a given fissile materialradio or thickness and cposition and reflector when in combination with a sgle rnoderating/reflectingthickness and composition. Using firA order material. 7-9) T B systems were considered in aperturbation theory Equal Volurne Replacement previous tu; r)bt considered only 29pU fissk isotope
Reactivity Worth (EVRRW) traverses are calculated and used infinit dution au& sections.for a system consdacm the com on of wch The following illustrations pertain to problemsis a design variable. An EVRRW of material i with characterized by a sle fel aterial. Recently, therespect to refmnce material I is the reactivity effect SMORES capability has been expanded4) to enable searchof rlacing a cubic centimetm of matenal I by the fbr maximum kr for Pstems with any number of fuelsame volume of material For minimurn critical and non-fuel constituents. he ew capability Ls riotmm problems the EVRRW guide an automated incorporated, yet, within SCALE.redistribution of the systern conskmts so as tomany= the fjel inventory while keeping k at or 2. Mustrationsvery close to .0. The optimization process isiterative, it proceeds until the EVRRW distribution 2.1 MCM in D20of the fuel becomes flat Mass the core and is lower The systems considered are 240 cm i rius sphermoutside of the core. of D20 with several hundred gms of a fissile material.
SMORES can be used to determine margins of The fissile material is initially unilbrmly distributedsubmticality by identilying the maximum value of over a central sphere that is 60 cm in drus. The spherethe effective multiplication factor, km that can is divk1ed into 120 half-centimeter-thick zones heresult from a given mass of a given fissile aterial composition aoss a zone is constant The optimizationwhen combination with specified moderating ad variable is the concentration of the fissile material reflecting materials. The identification of kmdr is each of the zones.accomplished sernimautornatically, using the Figure I illustrates the opfirrial ontration of Joptimization strategy of the SWAN Code4fi). in practically finft D medium. The MCM is foundAlternatively, SMORES can perform an automated to be 344.84 g 2� U. Te uranium occupies the
CorrespondingauthorTel. 001-510-643-9983,Fax. +001-510-643-9685,E-niail: gehud�nuc.berkeley.edu
55 -

JAE RI - Conf 2003-019
innermost 32 cm spherical region, and its 4.OE-0-4 -concentration monotonously increases towards thecenter. Figure 2 shows the EVRRW distribution two successive iterations contending to the 23.OE-04 -optimal systern composition It is seen that doeffectiveness fiinctiori Ls practimfly flat across the U.zones that contain 131 U and is lower in a o OE 2.OE-04
zones This distribution unplies that the arrived at .20compositiori Ls the optimal; no shuffling ofconstituents can finther increase kr 1.OE-04
C%1
4.OE-04O.OE+00
0 10 20 30 40 50 60c2 3.OE-04 Radius (cm)
U. Optimal 3 diStnbUfion in D yielding11 Fig. 3minimurn critical mass of 295.60 g.
R 4.DE-04I.OE-04
....... 0 3.OE-04O.OE+00
0 10 20 30 40 50 60 U.Radius (cm) 0
E2.OE-04
1211Mg I Optima U dis:iribution in O yieldingminimum critical ass of 344.84 g. 1.OE-04
Of
0.022 -O.OE+00 f......... ...... ........
0.018, 0 10 20 30 40 50 60
Radius (cm)0.014 -
0.010 Fig. 4 Optimal 139pU distribution in D yieldingminimum critical mass of2O4.24 g.
0.006 .... .... 10 10 20 30 40 50 60 4.OE-04 -
Radius (cm) c.2'U 3.OE-04 -
Fig. 2 Equal Volume RepLacement Reactivity LL
Worth traverses in successive iterations 'El 2.OE-04 -cotirsponding t the optimal composition of Fig. 1. .2
0
A similar analysis done for otha fissile materials IL 1.OE-04for 2 g for 239pUresulted in 295.60 �J, 204.24
and 135.96 g for 41pLL Te geral shape of the
fissile rnaterial distribution Ls similar t that of O.OE+00Figure I but the core radius and the peak 0 10 20 30 40 50 60concentration are fissile nuiterial dependent Fgure Radius (cm)3 shows the optimal composition of 233U in DDwhile Figure 4 shows the optimal 239 Pu-1320 system Optimal 241pU distributionand Figure shows the optimal 241 Pu-D20 system. Fi .g.5 in D20 yielding
minimum critical mass of 135.96 g.
- 552 -

JAERI-Conf 2003-019
The esults for the 239pU - DP system can be Figur 9 shows the effect of zone thickness on thecompared with results orted by Yatdl. The optimal 2 &tnbUfiorL The mum Critical massminimum critical mass at roorn temperature was value s practically the same for both zone ducknessesfaind8 t be 390 g; it corrosponds to a thin shell of considered. Figures IO and I I show the corresponding2N Pu flat Ls 50 cm in outer diameter and is polyethelene and berythurn optimal ffistribution.immersed in a 240 cm cube of D20. Heavy water Whereas the optimization using 0. c thick zonesfiflS the 9pir Sphere interior a WeU. results in a complete separation between the two
From the close to a factor of two difference in moderators, the optimization using the 025 cm zonesthe critical mass it appears that the optimal spatial results in a sght mixing of the two.diStribirtion of 29pU identified by SMORES is
significantly more reactive than that of the spherical 6.OE-03 Alshell of eference S. In or to verify this
hypothesis the SCALE sequence used for the 5.OE-03 -SMORES analysis was applied for calculating ker .2of 240 cm in dius helical systems comprising of 4.01E-03a sgle 204.24 g of shell with inside and U.outside the shelL Te maximum kr was found to r- 3.OE-03 -be 0883 - lower thari for the SMORES defined .0core kf = 1.0). It corresponds to a shell that is 50 > 2.OE-03 -cm in outer diameter. Poly Be
In order to verify the SMORES minimurn critical C4 1.0E-03mass calculations reported above MCNP wasapplied to calculate k for the system compositions O. OE+00reported in Figures I through 5. The MCNP 0.0 5.0 10.0 15.0 20.0calcuhded kff is very close to unity for a fbur Radius (cm)systems, as can be seen from Table .
Table I Comparison of MCNP Versus SMORES Fig. 6 Optimal 2sU distribution with polyethylene andCalculated kE Values for MCM in D20 berylhum. moderaturs/reflectors yielding minimum
critical mass of 201.22 g.
Fissile SMORES MCNPkrmaterial ka 6.OE-03 A
- - -BT- 0.999999 0.99722±0.00092= U 1.000000 0.99871±0.00085
1.000013 0.99765±0.00089 5.OE-03.2PU 1.000048 1.00014±0.00096 4.OE-03 -
U.2.2 MCM In Polyethylene and Beryllium r 3.01E-03 -
Figure 6 shows the optimal position of a 2 , - Poly Be0Type spherical system composed of 23�J, Poly >m 2.OE-03and Be. The system outer radius is 140 cm. The Minitial cposition was a uniform mixaurc of the 1.OE-03three constituents over a central Sphere that is 20cm in radius. This "core" was divided into 0. c O.OE+00 -thick zones. The optimization process segregated 0.0 5.0 10.0 15. 0 20.0the Poly and the Be; the Poly occupying theinnermost 8.5 cm and the Be the rest of the system. Radius (cm)The critical mass is 201.22 g; significantly lowerthari with D20. The 2U concentration spikes at the Fig. 7 Optunal "-U drAnbution wth polyethylene andinterface between the Poly and the Be. A similar beryllium moderators/reflectors yielding minimumphenomenon was observed w using infinite-dillution cross sections. 6) critical mass of 151.66 g
Similar optimization calculations with SMORESresulted in 151.66 g for ... U and 118.98 g for "'Pu(see Figures 7 and 8). The latter value is orilyslightly larger m the 12 g obtained using theinfinitely duted cross Sections of the DABL69librar)P.
- 553 -
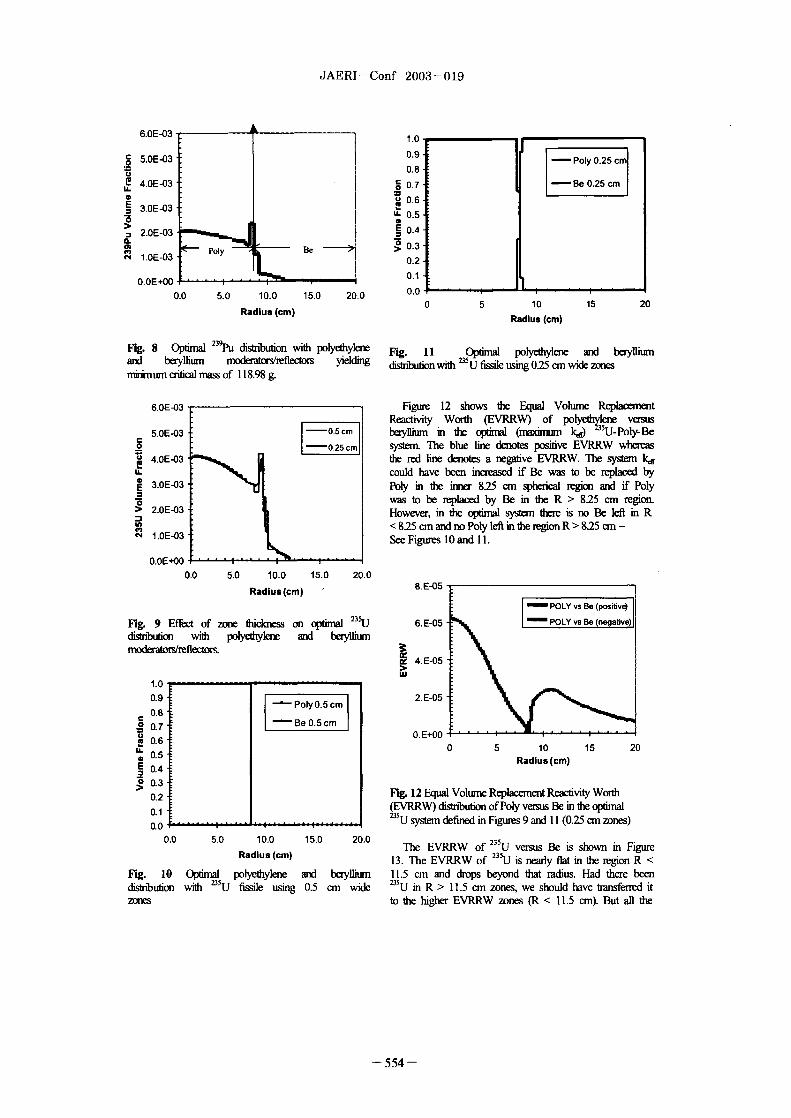
JAERI - Conf 2003- 019
6.OE-03 1.0
0.9 Poly .c 5.OE-03 25 cm.2 0.8Z - Be 025 cmLE 4.OE-03 cr 0.7L
'U 0.6E In3.OE-03 LL 0.5
OE 0.42.OE-03 Z
CD Be >0.3y
1.OE-03 0.2
0.1O.OE+00
0.0 5.0 10.0 15.0 20.0 0.00 5 10 15 20
Radius (cm) Radius (cm)
Fig. (Pfirnal 131pU diStnbUfiorl With pyethylene Fg. I Optirnal polyethylene and berylhunand bery]hurn moderatorslieflectors yielding d=butn with 3 fissile using 025 wde zones
minimurn critical mass of II 898 g.
6.OE-03 Figure 12 shows the Equal olurne ReplaCenlentReactivity Worth (EVRRW) of polyeth versus
berylliurn in the optirrial .inun kd Poly-Be5.OE-03 system The blue line dnotes positive EVRRW whereas
0
4.OE-03 the red line denotes a negative EVRRW- The systC1M ffU. could have been mcreased if Be was to be replaced byE 3.OE-03 Poly in the hineir 825 cm serical regain and if Ply
2 was t be replaced by Be in the R > 825 cm region.0> 2.OE-03 However, in the optimal system there is no Be left i R
< 825 cm and no Poly left in the region R > 825 cm -Cl)c4 1.OE-03 See Figures IO and I
O.OE+00
0.0 5.0 10.0 15.0 20.0
Radius (cm) &E-05 -
POLY Be Positivel
Fig. 9 Effect of zone thickness on qyfimal 215Ij 6.E-05 - POL 'vs Be (negative)
distribution with poly&Wlene and beryllium
moderators/reflectom
19 4.E-05
.u
1.0
0.9 Poly 0.5 cm 2.E-05
0.8
Be 0. cm0 0.7 00'U 0. E+2 0.6 0 5 1 0 1 5 20
U. 0.5 Radius (cm)
E 0.4
0.3 Fig. 12 Equal Volume Replacernent Reactivity Wrth
0.2 (EVRRW) distribution ofPoly versus Be in the pal
0.1 .. . . . . 235 U system defined in Figures 9 and II 025 cn zones)
0.0
0.0 5.0 10.0 15.0 20.0 The EVRRW of 231U versus Be is shown in Figure
Radius (cm) 13. The EVRRW of 231U is nearly flat in the region R -
Fig. 10 opfrial polyethylene and beryllium 11.5 cm and drops beyond that radius. Had there been
distribution with 235U fissile using 0.5 cm wide 235 Uin R > 1. c zones, we should have transferred it
zones to the higher EVRRW zones (R < 1. c). But a the
- 554 -

JAERl-Conf 2003-019
Z5 U is already in the R < 1.5 region, and shuffling 3 of ... U, "U and 'FkL Also given in Table 2 are235U fiorn one mm tc oer zones in this region will approximate values of the minimum critical massnot increase k as the EVRRW i a these zones is reported in Reference 10. The latter correspond tovery nearly the same. Hence we are certain that the uniform spherical solutions in water that are surroundedsystem is optimal. by an effectiv6y infinite water reflector These values
are approximate as they were irdened from the figures
0.030 - of reference 10. Table 3 gives the corresponding coremdii
Table 2 Summary of Minimum Critical Masses0.025 -
Fissile Minimum critical mass (g)
material H201U) D20 Poly Be0.020 - LJJU
595 295.6 151.7810 344.8 201.2
0.01 - 177p-u 525 204.2 119.0
Table 3 Core Radius Conresponding to Minimum0.010 Critical Mass Sstems
0 5 10 Is 20
Radius (cm) Fissile Core radius m)material H20` DP Poly BeLj�u 13.2 28.5 9.5
13 EVRRW distribution of 235U vsus Be in =U 15.6 32 11.5the system of Figures 9 and II 0.25 an znes) -11F - 15.9 31 12
As whiff check on the validity of the minimum
critical mass calculations of SMORES we The above illustrations indicate that SMORES a new
reconfigured te optimal '"Pu-Poly-Be system of sequence of SCALE, is useftil for idendyn nunirnum
Figire to have a sgle spherical shell of '"Pu critical mass. As such it could elp the cnwz* sa&-ty
with Poly filling all its iriner space and Be community fr bounding the MCM or of k& and for
surrowding it from the outside. The Pu shell determining criticality safety margins.
radius ad thickness were varied bid the 239Pu mass The above reported studies also indicate that
was conserved at II 8.98 g. The most tive continuous distribution of fissile material m a cral
configuration was fWnd t be a shell i bween sphere in D20 modffatorheflector gives a hgher kr
6 5 and 7 c with Poly filling the extra volume dw the &Xete geor� suggested in the lite"hn
fiaction in the plutonium zone; its k is 07227 spherical shell made of te sum mm.
way below that corresponding to the optirrial Another usefil finding from the limited nuniber of
configuration identified by SMORES. SMORES optimization studies carried out so far is that
The spike in the concentration of fissile, fuel at a oombiriation of polyethylene and beryllium offers a
the boundary between the Poly and Be observed for smaller MCM dm attainable with D20. To the best of
all three fissile fiiels oritributes 6) to critical mass our knowledge, this is the minimum critical mass
minrinizatim in a couple of ways : " increases the identified so far for a given fissile malenal when at
probability that neutrons that leaked into the room temperature and at sandard pessure.
reflector w (a) get back to the core, and (b) be The space dependent distribution of the fissile
absorbed in the Pu rather thari in H. Notice that the material, polyethylene and beryUmm corresponding to
spike occurs at a radius that is approximately two- the mhmurn critical ass as identified by SMORES is
thirds of the core radius. Poly is the preferred very complex, it would be very difficult to arrive at such
moderator at the inner two fluids of the core radius, a composition using the pametric study approach at
whereas Be Ls the preferred moderator at the outer can be referred to also as a 'VW and erroe' approach in
thiid of the core (as measured by radius); that is at common use by the criticality safety community-, that is,
more than one half of the core volume. Beryllium is without a too] like SMORES.
also the preferred reflector.
4. Concluding Remarks AcknowledgmentThis work was peffortned under ORNL subcontract
19X-SU083V from the Nuclear Analysis Methods andTable 2 summarizes the minimum critical ass Applications of the Nuclear Science and Technology
identified with SMORES reported in Sections 2 and Division of ORNL
- 55 -

JAERI - Conf 2003-019
References the New Frontiers of Nuclear Technology: Reactor1) S. M. Bowman, D. F. Hollenbach, M. D. Physics, Safety and High-Performance Computing,
DeHart, B. T. Rearden, I. C. Gauld and S. PHYSOR-2002, Seoul, Korea, October 710, 2002.Goluoglu, "An Overview of Whats New in 5) Y. Karni� D. Regev, E. Greenspan, S. Goluoglu, L.SCALE 5," in Proc. of American Nuclear Petrie and C.M. Hopper, "On the "SMORES"Society 2002 Winter Meeting "Building the Capabihty for Minimum Critical MassWorld Nuclear Community - Sategies for the DeterminatiW' Tns. American Nuclear Society,Deployment of New Nuclear Technologies, 88, 82 -83, June 2003November 17-21, 2002, Washington, DC. 6) Y. Kami, E. Greenspan, "The SWAN Code forTram. Am. Nucl. Soc. 87, 265 268 2002). Minimum Critical Mass and Maximum kf
2) E. Greenspan, Y. Karni, L.M. Petrie, D. Regev, Determination," Proc. ANS Topical Mtg On"SWANS - A Prototypic Scale Criticahty Criticality Safety Chaflenges In he Next Decade,Sequence For Automated Optimization Using Chelan, Wa, pp. 181-188, Sept. 712, 1997.The SWAN Methodology", 7) R.S. Olson, M.A- Robkin, "A New Smafl MassORNL/TM-1999/274 (UCBNE-4226), LT- Critical Configtinition: Tnsactions ANS, 13, 669Battelle, LLC., Oak Ridge National (1970).Laboratory, 2000. 8) K.R. Yates, Critic!12% of Tin Flat Foils ersus
3) S. Goluoglu, L.M. Petrie, C.M. Hopper, Y. Spherical Shells of Pu," Tansactions ANS, 27,Kami, D. Regev, E. Genspan, "SMORES - 415 1977). -A New Scale Sequence For The Deterraination 9) R. Sanchez, "Fission with Cold Neutrons:'of Bounding Curves And Data:' Trans. ANS, Transactions ANS, 86, 116 2002).86, 114 116, June 2002. 10) H.C. Paxton and N.L. Pruvost, "Critical
4) Y. Karni� D. Regev, E. Greenspan, S. Dimensions of Systems Containing B5 U, "9Pu andGoluogh4 L. Petrie and C. Hopper, "�J; 1986 Revision;' Los Alamos National"Automated Search for Minimum Critical laboratory Report LA 10860-MS (I 987).Mass and Maxirrium kff Of MUlti-ConstituentSystems:' Proc. Interriational Conference on
556 -

JAERI-Conf 2003-019 JP0450106
MCNP Based Calculation of Reactivity Loss due to Fuel Circulation inMolten Salt Reactors
Jozsef KOP14AZl', Mate SZIEBERTH",, Sandor FEHER1, Szabolcs CZIFRUS' and Piet F. A. de LEEGE 2'Institute offuclear Techniques, Budapest University of Technology and Economics,
III I Budapest, Muegyetem rkp 9 Hungary2 Interfaculty Reactor Institute, De�t University of Technology,
2629 JB Delfi, Mekelweg 15, The Netherlands
In molten salt reactors, the delayed neutron precursors continuously change their positionin the reactor and primary loop due to the circulation of the fuel. Therefore, the influence ofthe delayed neutrons on the reactivity differs from that of solid fuel reactors. The paperdescribes a method, which is developed in order to modify the program MCNP so that it cantake into account the transport of the delayed neutron precursors, and therefore it is capable tocalculate the reactivity loss of reactors with circulating fuel. With the aid of the modifiedversion of MCNP, calculations were performed on a simple homogeneous reactor withcylindrical core. The method was also applied to perform calculations on the reactivity loss ofthe MSRE (Molten-Salt Reactor Experiment, Oak Ridge National Laboratories, 1960s). Theresults obtained are in good agreement with the theoretical predictions and the measuredreactivity loss values.
KEYWORDS: molten salt, fluidfuel, fuel circulation, delayed neutrons, Monte Carlomethod, criticality calculation, reacdvhy loss
presented in 3-5) . Though the deterministic theories are1. Introduction capable of describing the phenomena in full detail, they
The molten salt reactor (MSR) concept seems to be usually contain simplifications.
one of the most promising systems for the realization of The problem can be efficiently studied with the aidtransmutation and one of the proposed Generation IV of the Monte Carlo method since the motion of delayedreactor types'). In molten salt reactors (or subcritical neutron precursor nuclei can easily be accounted for bysystems), the fuel circulates dissolved in some molten shifting the place of birth of the delayed neutrons. Asalt. The main advantage of this reactor type is the ftirther advantage of the Monte Carlo method is thatpotential for continuous feed and on-line reprocessing. tasks involving complex geometries and a large
Due to the motion of the fuel, the precursor nuclei number of different materials can also be computed inchange their position between the fission and neutron an uncompromising manner. This is why it isemission events and decay may even occur outside the reasonable to develop a method which enables certaincore. Therefore, the reactivity and effective delayed general Monte Carlo neutron transport codes toneutron fraction of these reactors are lower than those perform criticality calculations on circulating fuelof solid fuel systems. The extent of the reactivity loss is systems without any approximation.primarily influenced by the velocity field of the fuel This paper present such a method and itsand the length of fuel recirculation cycle. implementation to the MCNP4C6) code. First, the
Since all of the presently operating power reactors applicability of the method is illustrated on a simpleutilize solid fuel, until recently little attention had been homogeneous reactor with cylindrical core. As apaid to the calculation of the reactivity loss caused by second step, some capabilities of the method inthe circulation of the fuel. In the 1960s, measurements computing three-dimensional effects are presented inwere performed on the Molten-Salt Reactor connection with the modeling of the already mentionedExperiment (MSRE) at the Oak Ridge National MSRE. Finally, the results of an MSRE calculationalLaboratory and a theory was developed to determine benchmark are presented, pointing out the effects andthe above mentioned reactivity IOSS2). When the interest differences caused by the use of different data libraries.
toward such type of reactors started to grow a few years 2. Method of calculationago, research in this field gained a great impetus again.
Efforts have been made to determine the reactivity loss The method developed is based on the determinationby deterministic methods, such as the point kinetics of the shift of the precursors from the velocity of thetheory and the one dimensional difftision model
Corresponding author, Tel. 36-1463-1633, Fax. 36-1-463-1954, E-mail: szieberth�reak.bme.hu
- 557 -
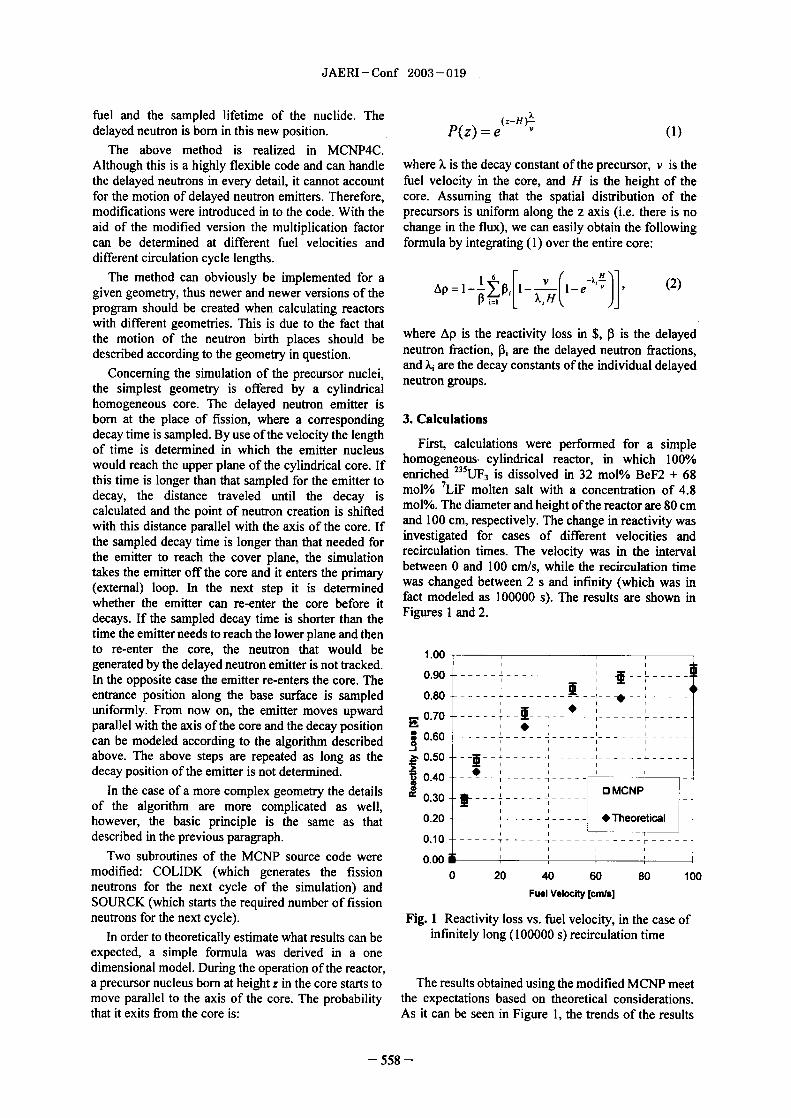
JAERI-Conf 2003-019
fuel and the sampled lifetime of the nuclide. The (z-H)X
delayed neutron is bom in this new position. P(z = e v
The above method is realized in MCNP4C.Although this is a highly flexible code and can handle where is the decay constant of the precursor, v is thethe delayed neutrons in every detail, it cannot account fuel velocity in the core, and H is the height of thefor the motion of delayed neutron emitters. Therefore, core. Assuming that the spatial distribution of themodifications were introduced in to the code. With the precursors is uniform along the z axis (i.e. there is noaid of the modified version the multiplication factor change in the flux), we can easily obtain the followingcan be determined at different fuel velocities and formula by integrating (1) over the entire core:different circulation cycle lengths.
The method can obviously be implemented for a 6
given geometry, thus newer and newer versions of the AP=l-_1P I_ (2)program should be created when calculating reactors P = I XIH
with different geometries. This is due to the fact that where Ap is the reactivity loss in is the delayedthe motion of the neutron birth places should bedescribed according to the geometry in question. neutron fraction, Pi are the delayed neutron fractions,
Concerning the simulation of the precursor nuclei, and �, are the decay constants of the individual delayed
the simplest geometry is offered by a cylindrical neutron groups.
homogeneous core. The delayed neutron emitter isborn at the place of fission, where a corresponding 3. Calculations
decay time is sampled. By use of the velocity the length First, calculations were performed for a spleof time is deten-nined in which the emitter nucleus homogeneous. cylindrical reactor, in which 100%would reach the upper plane of the cylindrical core. If enfiched 235UF3 is dissolved in 32 mol% BeF 68this time is longer tan that sampled for te emitter to MO,% 7 LiF molten salt with a concentration of 48decay, the distance traveled until the decay is Mol%. The diameter and height of the reactor are 8 cmcalculated and the point of neutron creation is shifted and 100 cm, respectively. The change in reactivity waswith this distance parallel with the axis of the core. If investigated for cases of different velocities andthe sampled decay time is longer than that needed for recirculation times. The velocity was in the intervalthe emitter to reach the cover plane, the simulation between and 100 cm/s, while the recirculation timetakes the emitter off the core and it enters the primary was changed between 2 s and infinity (which was in(external) loop. In the next step it is determined fact modeled as 100000 s). The results are shown inwhether the emitter can re-enter the core before it Figures I and 2.decays. If the sampled decay time is shorter than thetime the emitter needs to reach the lower plane and thento re-enter the core, the neutron that would be 1.00 -generated by the delayed neutron emitter is not tracked.
0.90 ------In the opposite case the emitter re-enters the core. Theentrance position along the base surface is sampled 0.80 ------------- I------uniformly. From now on, the emitter moves upward 0.70 ------- T - - - - - -- - - - - -
parallel with the axis of the core and the decay position E !can be modeled according to the algorithm described 0.60 ....... T------------- ----- -
above. The above steps are repeated as long as the 0.50 --------------- ------decay position of the emitter is not determined. 0.40
In the case of a more complex geometry the details 0.30 --------- 13of the algorithm are more complicated as well,however, the basic principle is the same as that 0.20 ------- ----------- * TheoI Idescribed in the previous paragraph. 0 lo -------------- -------------
Two subroutines of the MCNP source code were 0.00
modified: COLIDK (which generates the fission 0 20 40 60 80 100neutrons for the next cycle of the simulation) and Fuel Velocity [cm/9]
SOURCK (which starts the required number of fissionneutrons for the next cycle). Fig. Reactivity loss vs. fuel velocity, in the case of
In order to theoretically estimate what results can be infinitely long (100000 s) recirculation timeexpected, a simple formula was derived in a onedimensional model. During the operation of the reactor,a precursor nucleus born at height z in the core starts to The results obtained using the modified MCNP meetmove parallel to the axis of the core. The probability the expectations based on theoretical considerations.that it exits from the core is: As it can be seen in Figure 1, the trends of the results
- 55 -

JAERI-Conf 2003-019
are similar but the calculated reactivity loss is higher, within the space occupied by fuel. Accordingly, theespecially at higher velocities. This fact agrees to the most substantial difference compared to the algorithmexpectations as the simple theory considers only the for the cylindrical homogeneous reactor is that forneutron loss due to ex-core emissions assuming a flat nuclei entering the central graphite lattice from theaxial flux distribution while the reduction in the lower plenum one fuel channel should be selected. Thisdelayed neutron worth due to the change of the position is realized by taking the emitter nucleus to the closestis neglected. However, the results show that the latter fuel channel, sampling an x-y position fi-om entireeffect is not negligible. cross section of the given channel uniformly. The x-y
position of a nucleus exiting a channel is sampleduniformly over the whole area of the corresponding
1.00 unit cell. The emitter moves vertically in the twoplenums and inside the fuel channel.
0.90 -------------- ------
0.80 ------------
cw�0.70 ------- ! - -T I - - - - - -- - - - - ---
Ar
WTLCTE 0.60 -------- L - - - - - -- - - - - --- - - - - - - -
ME0.50
> ------ ------
NTC--1000008Jr V.'*V 7 _7 I
13Tc=5s
I *Tc=2s0.30 ------ I *Tc=l 0.
0.20 ------ ------ ------
0.10 --------------------------CT
0.00 C-E
0 20 40 60 80 100 K�wFuel Velocity rft] ICSSIL
Fig. 2 Reactivity loss calculated by modified MCNP STOWE"for the homogeneous cylindrical reactor with different
recirculation timesIMEL �. W
In order to demonstrate the capabilities of the REACTOR VESSEL REACTOR MSRE
method in more complex geometry and to comparecalculational results to measured ones it was plausible Fig. 3 Scheme of the MSRE reactorto set up a model and perform calculations for theMSRE. Based on the incomplete and rather poor data
The MSRE was a graphite moderated reactor, at the available on the experiments performed in the 60s abeginning fuelled with medium enriched 131U, Which model was worked out and implemented to the MCNP,was replaced with 233U in the later experiments. The describing the MSRE more or less adequately in termsscheme of the reactor is shown in Figure 3 7). The fuel of reactor physics. This model was not expected towas circulating in channels formed between graphite reflect the measurement data at high accuracy.blocks in the central part of the core, while the volumes However, it was suitable to investigate certainclosing the reactor on the bottom and top sides are three-dimensional effects.
homogeneous ftiel spaces, called plenums. Accordingly, with the aid of this model the influence
At te application of the above mentioned method of replacing the cylindrical plenums below and abovefor the MSRE there was a point of great importance: the reactor core with a more realistic elliptical andthe simulation had to ensure that during the motion of spherical structure, respectively, has been examined.the delayed neutron emitter nuclei they always stay The vertical section of the corresponding MCNP model
- 559 -

JAERI-Conf 2003 019
is shown on Figure 4 plenum of 17.15 cm height filled only with fuel.
The reactivity losses obtained with the cylindrical
and rounded models were 141 ± 13 and 191 ± 22 pern, Double velocity arearespectively. By comparing the difference to themeasured reactivity loss, which was 212 pcm, it can beconcluded, that the shape of the regions surroundingthe core at the bottom and top sides does have asignificant impact on the calculated reactivity loss.
The other calculational experiment is related to thefuel flow velocity profile. In this case, the flow rate wasdoubled in some portion of the fuel channels situated a inside the graphite block (see Figure 5) such that thetotal flow rate remained constant. The result obtained
- - - - - - - - - - - - - - - - - - -was that in this case the reactivity loss increased from - - - - -the earlier 141 ± 13 to 173 ± 13 pcm. From tis it I I Ifollows that the low profile also has substantialinfluence on the phenomenon to be calculated. - - - - - - - - - -
- - - - - - - - - -
- - - - - - - - -- - - - - - - - - -
Fig. Horizontal section of the MSRE model used tostudy the effect of the velocity profile
The flow velocity of the fuel in the lattice structureis 19.67 cm./s, while that in the closing plenums is5.07 cm/s.
Fig. 4 Vertical section of the MSRE model used tostudy the effect of rounded plenums (spherical top,
elliptical bottom)
In view of the incompleteness of the data availableon the MSRE project, the participants of the MOSTproject') defined a model for the MSRE in the frame ofa calculational benchmark. The third application of our Fig. 6 A horizontal section of the MSRE calculationalmethod was the calculation of this benchmark. benchmark model
Based on the data gathered within the MOST project, The composition of the fuel has also been set upthe model has been elaborated as follows. The reactor according to the MOST project (see Table 1). Theis approximated as a cylinder of 142.4 cm diameter and power of the reactor was assumed to be zero, so the166.3 cm height, which is filled with te graphite temperature of both the fuel and graphite moderator islattice structure shown in Figure 6 The lattice pitch is taken to be 918 K, which was used in the experiment.4.213 cm. The side lengths of the rectangular cross
section of the fuel channels formed inside the graphite It was decided to use two different delayed neutronare 303 cm x 1. 1 5 cm. The cylindrical system fi I led data sets. Besides the recent values of JEF-2.29) thewith the lattice is covered on top and bottom sides by a original ORNL data (see Table 3 were used, as well, in
- 560 -

JAERI-Conf 2003-019
the attempt to narrow down the discrepancy to the acceptable in view of the standard deviation of theexperiment. As delayed neutron spectra were not calculations and measurements and the uncertainty ofavailable from the ORNL, therefore we used the the fuel composition. The results obtained with ORNLprovided flff valueS2) and assumed prompt fission delayed neutron data show that method applied in thespectrum for the delayed neutrons. This approximation lack of delayed neutron spectra is feasible, however,actually corresponds to the definition of the fiff, and the modem data sets can be considered as superior.should have the same effect as if we used the real values together with the proper delayed neutron Table 2 The calculated and measured reactivity loss ofspectra. the MSRE with two types of fuel
Table I Fuel composition of MSRE Ploss 1pcm1Fuel keff Measure- Calc ation Standard
Isotope Atomic 1%] ment ORNL JEF- deviation235U 233U 22
Li 2.64E-01 2.64E-0 I "'U 105980 212 224 244 13
9Be 1 I 8E-0 I 1 19E-0 I 213U 1,12714 10 ± 5% 131 85 3Zr 2.03E-02 2.03E-02
F 5.94E-01 5.96E-01 4. ConclusionU 0 4.44E-04
0 4.37E-05 In the work presented in this paper a Monte Carlo�U 1.04E-03 9.27E-06 method based calculational procedure has been
2.21 E-03 1.86E-05 developed for the determination of the reactivity loss of9pu 0 8.89E-06 reactors with circulating fuel. The calculational
technique has been implemented by introducingThe MCNP model of the reactor was worked out modifications to the MCNP4C code. The applicability
according to the above considerations. A horizontal of the technique was first demonstrated on a simpleand vertical section of the model is seen in Figures 6 geometry homogeneous reactor, for which the resultsand 7 respectively. obtained agreed well with the expectations form
theoretical considerations.
----------------------------Calculations were performed for the MSRE, as well,
in order to investigate more complicated,three-dimensional effects and to be able to comparewith measured values. The results confirm that theapplication of the Monte Carlo method can be veryimportant if the aim is the simulation of a real geometrywith the best approximation possible. The need for abetter approximation was demonstrated by showingthat the reactivity loss was significantly affected bychange of the ftiel velocity profile and the shape of thecore containment. The values obtained for the MSREbenchmark in the framework of the MOST projectshow that a reasonable estimation of the measuredvalues is achievable.
References
Fig. 7 A vertical section of the MSRE calculational I D. J. Diamond, "Research Need for Generationbenchmark model IV Nuclear Energy Systems", Proc. PHYSOR
2002, Seoul, South Korea, 710-2002 2002).
We have applied the modified MCNP to calculate 2) "Zero-Power Physics Experiments on thethe reactivity loss for both fuel compositions of the Molten-salt Reactor Experiment" ORNL4233,reactor. The results are summarized in Table 2 Oak Ridge National Lab., USA, (I 968)
3) G. Lapenta, P. Ravetto, and G. Ritter, "Effective
It is seen that for the 235U fuelled reactor the Delayed Neutron Fraction for Fluid-Fuelagreement between the calculated (JEF-2.2) and Systems", Ann. Nucl. Energy, 27, 1523.measured reactivity loss values is very good. In the 4) G. Lapenta and P. Ravetto, "Basis Reactorcase Of233U, the calculational results can be considered Physics Problems in Fluid-Fuel Recirculated
Reactors", Kemtechnik.
- 561 -

JAERI-Conf 2003-019
5) G. Lapenta, F. Mattioda, and P. Ravetto, "Point 8) M. Delpech, S. Dulla, C. Garzenne, J. Kphdzi,Kinetic Model for Fluid Fuel Systems", Ann. J. Krepel, C. Lebrun, D. Lecarpentier F.Nucl. Energy, 28, 1759. Mattioda, P. Ravetto, A. Rinelski, M. Schikorr,
6) J. F. e. al. Briesmeister, "MCNP - A General and M. Szieberth, "Benchmark of DynamicMonte Carlo N-Particle Transport Code, Simulation Tools for Molten Salt Reactors",Version 4C", Los Alamos National Laboratory, Proc. GLOBAL 2003, New Orleans, USA,Los Alamos, USA 2000). 16-11-2003 2003).
7) "Research, Test and Experimental Reactors", 9) "The JEF-2.2 Nuclear Data Library", JEFFDirectory of Nuclear Reactors, Vol. V, IAEA, Report 17, NEA, Paris, France, 2000)Vienna, 1964).
Table 3 ORNL delayed neutron data
Fuel Tool Gn I GmW2 Cmxp3 QuW4 QuW5 Cmp6
211U p Stati [CMj 640.5 21.1 140.2 125.4 252.8 74.0 27fl, .145.7 130.7 262.8 76.6
.F static [pcm] 666.1 22.3 28
decay data [s-'] 0.0124 0.0305 0.111 0.301 1.14 3.01
233U j8 static cm] 271.2 22.55 80.28 67.48 76.86 14.94 9.10
8,ff static [pcm] 289.38 23.76 85.76 71.9 82.14 15.79 10.03
decay data [s-'] 0.0126 0.0337 0.139 0.325 1.13 2.5
562 -

JAERI-Conf 2003-019 JP0450107
Development of Direct Transmission Probability Methodfor Criticality Safety Analysis
Tetsuo MATSUMURA'* and Takanori KAMEYAMA1Central Research Institute fElectric Power ndustry (CRIEPI),11-1, Iwado Kita 2-Chome, Komae-Shi, Tokyo 201-8511, Japan
We have developed new deterministic Sn-type two dimensional transport calculationmethod using direct transmission probabilities. The present method has advantage oncalculation accuracy for geometries with much void or neutron absorption regions, becausepaths of neutron are calculated from generation to reaction without approximation.Checking calculations are carried out for a criticality safety problem of fuel assemblies in aspent fuel storage pool with neutron absorption materials, which show difference betweenthe present method and the conventional Sn methods of DOT3.5 on eigenvalues and fluxdistributions. The other checking calculations for a neutron shielding problem showadvantage of the present method comparing with the conventional Sn methods from theviewpoint of ray effects.
KEYWORDS. transport calculation, direct transmission probability, two dimension,criticality safety, radiation shielding
1. Introduction 2. Direct Transmission Probability Method
Deterministic transport calculations are effective 2.1 Transport Equationfor criticality safety and radiation shielding problems. A transport calculation considers angular neutronHowever conventional two and three dimension Sn flux (y). Boundary outgoing angular flux of a meshcodes still have ray effect problems and less reliability (yim) is calculated with boundary income angularin accuracy for geometries with much void or neutron neutron flux y,.), transmission probability jm),absorption regions. We have developed new neutron source (S ) and escape probability (TSm ofdeterministic Sn-type of two dimensional transport the mesh (ij) for angle (m) as:calculation method using direct transmissionprobabilities. The present method has advantage on yi. = yo�m T.+ S. TSMcalculation accuracy for geometries with much void orneutron absorption regions, and it has similarity to T. = exp ( -Y-t Exponential Characteristics (EC) method ), Methodof Characteristics (MOC) 23) or Method of TransmissionProbabilities 4 These methods solve transport equationalong straight lines for discrete ordinates in basic. Where, Zt: Total cross section, 1: Length ofWhile the MOC and other methods mainly deal with neutron path within mesh (ij).characteristics within each calculation cell or mesh, Veinthe present method of "Direct Transmission yProbability Method (DTPM)" solves transportequation along paths of neutron from generation toreaction for the whole geometry of calculation withoutapproximation. Therefore the DTPM has advantage oncalculation accuracy for geometries with much void orneutron absorption regions. Additionally the DTPMuses FDM-like 5-points type differential equation toaccelerate transport calculation 5). In this paper, wedescribe DTPM, and show the checking calculationresults comparing with the conventional Sn method ofthe DT3.5 code 7), for a criticality safety and a Ysm
radiation shielding problems. Fig.1 Basic Concept of the Present Transport Method.
Corresponding author, Tel. 81-3-3480-21 1 1, Fax. 81-3-3480-2493, E-mail: matsu-tgcriepi.denken.orjp
- 563 -

JAERI-Conf 2003-019
In the DTPM, transport calculation starts from 3. Checking Calculation for a Criticality Safetyboundary angular neutron flux (y,,m) and terminates at Problemboundary angular neutron flux of other side y,,,,,)with consideration of transmission probability of each 3.1 Calculation Geometry and Cross Sectionsmesh (Fig. 1). This transport calculation process is A checking calculation is performed with therepeated for all of proper starting points at geometry DTMP in order to examine the applicability to theboundaries and all of proper angles. Because the critical safety problem. Calculation geometry is arrayDTPM uses no approximation in calculation, correct of fuel assemblies in spent ftiel storage pool withvalues of neutron transport equation can be expected neutron absorption materials (Fig. 2 The ftielwithout approximation, under condition of enough assemblies and the moderator are included in the fuelstarting points and enough neutron angles. region. Position of (c) is cpped comer of neutron absorbers
and is in the region ofmoderator.
2.2 Acceleration Method(a)To accelerate calculation, the DTPM uses fite
differential method (FDM)-like 5-points type ;orberdifferential equation.
Income neutron current 'ij) of mesh (ij) can becalculated with angular neutron flux (yo,, by
loomm,summating for all of the angles and the starting points Water (I 0 mm)at geometry boundaries as:
----------
j+ij Sum yo,. - P. (2) 113 mm
(in, starting points) Fig.2 Calculation Geometry of a Criticality Safety
Problem.Where, V. is cosine of neutron angle ) to X (or
Y) direction. The cross sections of each region are listed in5-points type differential coefficients for the mesh Table 1. The cross sections were calculated with
(ij) can be expressed with neutron current 'ij) and 1-dimensional transport calculation code ANISNtotal neutron flux i-ij) of mesh (i-1j) as: with the neutron library based on ENDL3.2 9.
C1 (ij = Jij i-Ij (3) Table I Cross Sections used for a Criticality Safety
and Problem in Two Energy Groups (Unit: cm-Region Et, Et, v I 2 Ys Y 2 FX
CO 0) = C (i+lj)+C2 (i-1,J)+C3 ij+l)+C4 (ij-1) Fuel 0278 0.893 0.011 0255 0253 0.757 0.013
+(Y-tj-y-sid A A (4) Water 0.730 2.199 0.0 0.0 0.721 2.186 0.007
Neutron 0.693 12.75 0.0 0.0 0397 0.886 0.0001
Where, Esij is scattering cross sections of mesh (ij), Absorber -AXij and AY j are widths of mesh (ij) for X and Ydirection respectively. Total neutron flux (�) are 3.2 Calculated Results
calculated with the 5-points differential equation as: Calculation was carried out by the DTPM and the
Q�ij= Ci�ilj+Q�ilj+C-3�i,�,+C4�ij.,+Sij (5) conventional S method of DT3.5 code. Although
The schemes of the DTPM are: reactivity changes in mesh size, the present method1. Calculation of angular neutron flux with and DOT3.5 show some difference (about 1% 8k/k in
transmission probabilities for all of the angles and the reactivity (Fig.3).starting points at geometry boundaries. 0.83
2. Calculation of currents at each mesh boundaries 0.82
with above calculated angular fluxes. 0.81 DOT3.53. Calculation of differential coefficients such as C1, 0.80 UIPM
C2, etc. of each meshes with the currents values. 0.79
4. Calculation of total fluxes with diffusion like 0.78
differential calculation using the differential 0.77
coefficients to accelerate flux distribution calculation(inner iterations). 0.76
5. Calculation of eigenvalues (kff) by repeating the 0 2 4 6 8 10 12
above 14 procedure (outer iterations). Number ofMesh Region
Fig.3 Reactivity's of the DTPM and the DT3.5.
- 564 -

JAERI-Conf 2003-019
Comparison of fast neutron flux distributions from Table 2 Cross Sections used for a Neutron Ductthe point (a) to the point (b) of Fig. 2 is shown in Fig, Streaming Problem in Two Energy Groups4. The reason of the difference at point (c) is that the (Unit: cm-fast neutron passed through neutron absorbers is Region D, Et, Es, Es, ?X-calculated from neutron source directly in the DTPM. Concrete 02706 03854 0.2678 03808 0:66�
When segment node was changed from S t S16,
reactivity and flux distributions differed little in the 4.2 Calculated ResultsDTPM. Figures 6 to show fast and thennal neutron flux
0.40 distributions calculated with the DTPM and the(a) - the DTPM DOT3.5 code. Fig. 6 and 7 show the distributions in
0.35 DOT3.5 the whole geometry. The places of the peak in the Fig.
'a 0.30 6 are the position of the neutron source in Fig. 5. Fig.8 shows neutron flux distributions along the line of (d)�6 0.25
(c) to (e) in Fig. .0.20 In the result of the DT3.5 code shown in Fig. 6
0.15 (b) and Fig. (a), wave phenomenon is clearer than(b) that in the results of the DTPM shown in Fig.6 (a) and
2 0.104. Fuel Fig. (a). This is due to the ray effect of conventional
0.05 Sn methods. Therefore the DTMP has advantage on
0.00 ray effect in such duct streaming problems.
0 50 100 150 200 Differences of thermal neutron flux distribution are smallbetween the DTPM and the D013.5 code, since thermal
Distance from Center of Fuel Assembly (mm) neutrons come from the whole concrete wall (see Fig.
Fig.4 Fast Flux Distributions of the DTPM and the 7 and Fig. (b)).DOT3.5 Code on the Criticality SafetyProblem.
4. Checking Calculation for a Radiation Shielding 5.0
Problem 4.0
4.1 Calculation Geometry and Cross Sections Fast Flux 3.0
In order to examine the applicability of the DTPM (Arb. unit) 2
to a radiation shielding problem, a neutron ductstreaming problem was set up (Fig. 5), where a 1.0 S22
neutron source is located in void (no substance) region 0.0 S15
which is surrounded with the concrete walls. The S8
external boundaries of the problem were on vacuum(no reflection) conditions. (a) the DTMP.
Vacuum
(e)5.0
4.0
3.0Vacuum Vacuum Fsat Flux
(Arb. unit) 2.0
1.0S22
5
(d) 0.0
VacuumFig.5 Calculation Geometry of a Neutron Duct (b) DT3.5.
Streaming for Radiation Shielding Problem.
Fig.6 Fast Flux Distributions of the DTPM and theCross section of the concrete regions is listed in DOT3.5 code in the Duct Streaming
Table 2 which was also calculated with the ANISN Problem.code and the neutron library based on JENDL3.2. S12
was used for both the DTMP and the DT3.5 code inthe neutron duct streaming problem.
- 565 -

JAERI-Conf 2003-019
5. Conclusion0.016
0.014 We have developed new deterministic Sn-type two0.012 dimensional transport calculation method using direct
Thermal Flux 0.010 transmission probabilities. The present direct
(Arb. unit) '-00' transmission probability method (DTPM) has,O..116 advantage on accuracy for geometries with much void0.004 or neutron absorption regions, because paths of0,002 22 neutron are calculated from generation to reaction0.000 without approximation. The DTPM has possibility to
solve correctly neutron transport equation, on
(a) the DTPM. condition that starting points and neutron angles areenough.
0.016 Checking calculations are carr ied out for array of0.014 fuel assemblies in spent fuel storage pool with neutron0.012 absorption materials, which show difference between
the DTPM and the conventional Sn method ofThermal Flux 0.010 DOT3.5. Difference in eigenvalues is about 1 6k/k,
(Arb. unit) and flux distribution in the crevice portion of neutron
absorbers show remarkable difference between the0.004S22 DTPM and the DT3.5 code.0.002
0.000 S15 The other checking calculations for neutronS8 shielding problems show that the DTPM has caused
smaller ray effect in duct streaming problems. In this(b) DT3.5. point, the DTPM has advantage in radiation shielding
Fig.7 Thermal Flux Distributions of the DTPM problems.and the DT3.5 code in the Duct StreamingProblem. Acknowtedgements
Mr. M. Sasaki (the Japan Research Institute,1.0 Limited) cooperated the present study with the0.9 authors.
�R 0.80.70.6 References0.5 1) K. A. Mathews and C. R. Brennan, "Exponential0.4 Characteristics Nonlinear Radiation Transport0 t Method for Unstructured Grids of Triangular0�2 DOT3 Cells." N.S.E. 126, 264-281 1997),0.10.0 2) T. Jevermovic, J. Vujic, T. Tsuda "ANEMONA-a
0 50 100 150 200 250 300 Neutron Transport Code for General GeometryDistance (mm) Reactor Assemblies Based on the Method of
(a) Fast Neutron Flux Distributions. Characteristics and R-Function Solid Modeler,"Ann. of Nuclear Energy 28 125-152 2001).
0.014 - 3) S. Kosaka and E. Saji, " Transport Theory0.012 t h -cD TP M] Calculation for a Heterogeneous Multi-Assembly
DOT3.5 Problem by Characteristics Method with Direct0.010
Neutron Path Linking", J. of Nuclear Science and0.008 Technology, 37, 12, 1015-1023 2000).
0.006 4) 1 Kameyama T Matsumura, and M. Sasaki, "TheFLEXBURN Neutron Transport Code Developed by the
0.004 Sri Method with Tnsmission Probabilities in Abitrary
0.002 Square Meshes for Light Water Reactor Fuel Assemblies,"0.000
0 50 100 150 200 250 300 NSE, 123,86-95 1996).5) T, Matsumura and T. Kameyama, "Solution of
Distance (mm) Sn-type Transport Equation by Total Flux Finite
(b) Thermal Neutron Flux Distributions. Difference Method", Proceeding of Physor 96,A-15, Mito, Japan 1996)
Fig.8 Fast and Thermal Flux Distributions along 6) T. Matsumura, T. Kameyama and Y. Nauchi. Athe line of (d) to (c) in Fig. with the DTPM Simple and Flexible Coarse Mesh Method forand DT3.5 Code. Reactor Core Simulator." Physor2OO2, 7E-10,
- 566 -

JAERI-Conf 2003-019
Seoul, Korea 2002).7) RSIC Computer Code Collection DOT 35 Two
Dimensional Discrete Ordinate RadiationTransport Code, CCC-276.
8) W.W.Engle, Jr., "The Users Manual for ANISN AOne-Dimensional Discrete Ordinated TransportCode with Anisotropic Scattering," K1694, OakRidge Gaseous Diffusion Plant 1967).
9) T. Nakagawa, et al., "Japanese Evaluated NuclearData Library Version 3 Revision-2: JENDL-3.2" J.of Nuclear Science and Technology, 32 1259-1271(1995)
- 567 -

JAERI-Conf 2003-019 JP0450108
Numerical Analysis of the Reactivity for the Dry Lattices
above the Water Level of the Critical Fuel Cores
Yasushi NAUCHI* and Takanori KAMEYAMA
Central Research Institute ofElectric Power Industry, 211-1, Iwado-Kita, Komae-shi, Tokyo 201-8511, JAPAN
* nauchi�criepi. denken. orjp
Criticality analysis has been per-formed for dozens of tank type cores in which fuellattices are loaded vertically and partially immersed in light water. The reactivity effect of drypart of lattices stuck above the critical water level has been calculated using the continuousenergy Monte Carlo method. The reactivity effect exceeds 0.8% both for MOX and UOX fuellattices of large buckling (B �2>0 .0025CM,2). It is evaluated that at least 20cm length of fuel rodsabove the critical water level has significant reactivity effect.
KEYWORDS: dry part of lattice, reactivity effect, critical water level, buckling
1. Introduction reactivity effect of the dry part of fuel lattices areidentified in relation to the vertical length of
Criticality data have been measured and moderated part and volurnetric ratio of fuel toreported for light water moderated lattices in tank moderator.type core facilities in which fuel rods are loadedvertically and reactivity is controlled by level of 2. Reactivity Effect of Dry Latticemoderator'). Since those cores normally include nocontrol rods or soluble boron, different size of critical 2.1 Critical Fuel Latticelattices can be mocked up easily. The data measured Criticality calculations were performed forfor such series of lattices are useful for the UOX and MOX fuel lattices in light water where yverification of neutronics calculation methods and fuel rods stand above the critical water surface.nuclear data libraries. The criticality data of UOX fuel lattices
Criticality of the cores is achieved when had been reported from Tank-type Critical assemblyparts of fuel rods are immersed in the moderator and (TCA) of Japan Atomic Energy Research Institutethe rest parts are left in dry air. The reactivity effect (JAERI)". 26% 25 U enriched U02 fuel rods ofof the dry part is usually considered much smaller 144.15cm length were used. The fuel pellets werethan that of the moderated part. In the calculations enclosed in aluminum tube of 0.76mm thickness withwith deterministic methods, the geometry of the dry aluminum end plug of 16.8cm length on bottom side.part of lattices is not modeled rigorously, but They were loaded in square shaped lattices ofmodeled by the assumed boundary conditions such as 18.49nun, 19.56mm, 21.50mm or 22.93mm pitches,extrapolated'Iength, buckling, albedo or somethings). which determine the volurnetric ratio of moderator toOn the other hand, in the calculations with the fuel (V�Nf) to be 1.50, 183, 248 or 300,continuous energy Monte Carlo method, the total respectively Neutron was reflected in the waterlength of fuel rods including the dry part is often region outside the lattices, since the width of themodeled to predict the eigenvalue with high water region is 70cm horizontally and 16.8cm bellowaccuracy 3), because the three-dimensional transport the bottom. The lattice data used are summarized incalculation is available with the method. Accordingly, Table .it is indispensable to clarify the reactivity effect of The data of MOX fuel lattices of Criticalthe dry part for the criticality calculations. Reactor Experiment facility (CRX) had been reported
In the present paper, criticality calculations by the Westinghouse Reactor Evaluation Center4).were performed for UOX and MOX fuel lattices with The lattices were mocked up with MOX fuel rods ofthe continuous energy Monte Carlo method. The 92.96cm length containing 6.6%PU02 in naturalUO2
- 568 -

JAERI - Conf 2003-019
and 574% 235U enriched U02 fuel rods. Those rods the boundary up to 0.8% and were leveled off around
were loaded in square shaped lattices of several kinds the height of 20cm. The length is longer than the
of pitches. The (V .. [Vf) ratios of the lattices were extrapolated length X, of 11.5cm for 183u2l and
varied from 1.5 to 1 1. The region outside the lattice is 10.8cm for the CRX8, when X, were deduced by
in water of more than 30cm horizontally, and is filled fitting fission distribution F(z as
with water and aluminum below the bottom. The size, (Z ZO ) Ipitch and critical water level of the lattices are listed F(z) = F os�7r F cos(B. ( - Z('
in Table 2.Here, B. is the square root of axial buckling and zo is
2.2 Criticality Calculation the loop of the cosine shaped distribution.
Criticality calculations were performed Recently, It has been pointed out the
with the continuous energy Monte Carlo code, influence of initial source distribution on calculated
MCNP4C5). The pointwise nuclear data set kff with the continuous energy Monte Carlo method8).
FSXJ3-R2 library based on JENDL-3.2 6) was applied The two lattices were checked using three kinds of
for the calculations. TMCCS library included in source distribution,
DLC-200 library set was also used for inelastic 1) the calculated vertical fission rate distribution,
scattering on H20 molecular7). 2) identical to 1) without the dry part,
Eigenvalue and vertical (axial) fission rate 3) point source on the center of moderated part of the
distributions were calculated for the 183U21 lattice lattice. The calculated eigenvalues are described in
and the CRX8 lattice, in which the long parts of fuels Table 3 The dependence of eigenvalue upon the
were dry out of water region. In the calculations, the initial source is limited to 0.05%. The reactivity
total length of fuel rods is modeled, while the region effect of the dry part of lattices was not so much
above the top of fuel rods was assumed to be vacuum. influenced by the initial source distribution.
The initial source point was selected at the middle of
moderated part of the central fuel rod. In the 3. Reactivity of the Dry Lattice in Relation to
calculation for the 183U21 lattice, 160000 histories Lattice Property
were sampled for each generation and the eigenvalue
estimators were accumulated for 150 generations For critical lattices of TCA and CRX
after skipping 100 generations. facility listed in Table I and 2 the reactivity effect of
The eigenvalue was calculated to be the dry part were identified by two kinds of modeling
1.00162 statistical error 0.00015) for the 183U21 of the whole fuel rods and the partial fuel rods below
and to be 100594 000022) for the CRX8. The the critical water level H,. The effect was deduced by
fission rate distribution F. along the vertical axis taking the difference of the two eigenvalues. In Fig. 3,
(z-axis) of the CRX8 lattice is shown in Fig. 1. In the reactivity effects are plotted to the axial buckling2addition to general cosine shaped distribution and B, which were involved in the equation (1). The
reflector saving effect near the bottom part, the effect shows roughly linear relation to the B. 2 for
considerable aount of fission rate is observed in dry UOX lattices as well as MOX fuel lattices.
part. The ratios of the dry part for the total number of In this section, the reactivity effect is
neutron generation were 20% for the 183U21 and investigated in detail to clarify which parameters
2.2% for the CRX8. Those ratios were not negligible mainly influence the reactivity effect.
for the criticality calculations.
3.1 Neutron Gain in Dry Lattices
2.3 Reactivity of Dry Lattice Neutron gain in the dry part of lattices is
The reactivity effect of the dry part was defined by the sum of inward current and fission
investigated in series of eigenvalue calculations for neutron yield in each lattice. In square shaped lattices,
the lattices with varying the boundary position from the inward current consists of neutrons from
the criticality water level H, to the top of fuel. The moderated part of lattice and those from outer
calculated eigenvalue for the 183U21 and CRX8 are moderator (see Fig. 4 Each component of the
shown in Fig. 2 For both UOX and MOX fuel neutron gain for TCA 183Uxx lattices is listed in
lattices, the cigenvalue increased with the height of Table 4 The inward currents from the moderated part
- 569 -

JAERI - Conf 2003-019
shared over 90% of the total one and they exceed the reactivity effect of the dry part associated with the
fission yield. In Fig. 5, the inward current of thermal (V,,,/Vf) in the moderated lattice.2neutron of E < 0.14eV is plotted to the axial Since the same axial buckling B, and the same
2buckling B, and fission yield is also done. The both kind of fuel rods were needed to clarify the influence
thermal neutron currents from moderated lattices and of the (V Nf), the reactivity effects of CRX MOX
from outer moderator is significantly proportional to fuel lattices of (VnNf)=1.68 and 216 were evaluatedthe B :2 , and as the results, the fission gain also shows for B �2=0.00 14cM,2 by the linear relation of the
2 2proportional relation to the reactivity effect to the
For lattices of (VNf)=4.71, 567 and 10.75,
3.2 Multiplicity of Neutrons emitted from Dry simulated lattices were constructed by supplement of
Lattice a row of fuel rods and decrement of critical water
The reactivity effect of dry part is limited height to the experimental critical lattices with
to 0.8% for the TCA 183U21 lattice, although roughly conserving the sum of axial and horizontal
neutron yield in the lattice is almost 2. Thus the buckling. The reactivity effect of dry part of those
multiplicity of neutron yielded in the dry part was lattices were evaluated for the 2=0.00 14CM-2 using
surveyed. the data for experimental and simulated lattices.
In the MCNP-4C code, the eigenvalue kfr In Table 6 sum of inward thermal neutron
is defined by the ratio of fission neutron yield currents into the dry lattices are listed with neutron
between successive generations. Defining M(rE) as yield in them. In the lattices of small (VmNf), the
the expectation number of neutrons yielded by a ratio of neutron yield to the sum of inward current is
fission neutron of energy E radiated at position r, large owing to the small leakage probability. As the
here, the kff is expressed as follows. results, the evaluated reactivity of the dry lattices
Ital-fiel d V f dE [M f x vY f O'dE'j decreases as the (V,,,Nf) increase as shown in Fig. 6.
keff = I f VE f OVE'd V (2) 4. Reactivity Effect and Boundary Conditions
By taking the integration of the numerator of The dry part of lattice is commonly treated
equation 2) over any regions, we can evaluate the with some kinds of boundary conditions in
contribution of the regions to the eigenvalue. deterministic methods. Among them, a half of
The authors developed the new ftiriction extrapolated length, X2 is generally used to
calculating the contribution and attached it to the determine the calculation boundary outside a reactor.
MCNP4C code. Using them, the contributions of the Here we discussed the relation of calculated
dry part were calculated for 183Uxx lattices and are eigenvalues with the use of the extrapolating length
summarized in Table 5. On the right edge column of modeling the dry part of fiiel.the Table, ratios of the contributions to the neutron For square shaped critical lattices, the
yield in the dry part of lattices are shown, which neutron flux distribution in them can be expressed by
means the multiplicity of neutrons emitted from the a cosine function as the equation (1) except for the
part. The multiplicity is limited to 038. Thus, the edge region. Hypothetical boundary between dry part
reactivity effect of 183U21 lattice did not exceed 1% and moderated part can be established by deduction
in spite of fission yield of 2% to the total. of Z where F(Z)=O. The Z values were calculated for
The multiplicity in dry lattice listed in TCA and CRX. Then we performed criticality2Table is slightly increased with B. but rather calculations by raising the moderator surface level to
flatten for the lattices. Attribute to this tendency the Z and setting vacuum condition there. In Fig. 7,
together with the linear relation of the inward neutron the eigenvalues on the improved conditions are
current to the reactivity effect of the dry part, the compared with those by modeling the total length of2reactivity effect roughly show linear relation to B. as fuel rods. The former were larger than the latter for
shown in Fig. 3 every lattice, though the difference of eigenvalues
depended on the axial buckling B 2
3.3 Reactivity Effect of Dry Lattice by (V.Nr)
Further investigation had been conducted on the
- 570 -

JAERI - Conf 2003-019
5. Summary and conclusion Table Critical lattices of TCALattice Lattice pitch Vm/Vf Critical Water
Criticality calculations had been perfon-ned Name Size (mm) Level(cm)15OU21 21x2l 18.49 1.50 60.49
for dozens of tank type cores in which criticality is 183LJ17 17xl7 19.56 1.83 113.03achieved by the moderated part of fuel rods and the 183U18 l8xl8 19.56 1.83 75.42dry part of fuel rods above the critical water surface. 183LJ19 19xl9 19.56 1.83 60.21This paper revealed that the reactivity effect of dry 183U20 2Ox2O 19.56 1.83 51.1
183U21 21 x2l 19.56 1.83 45.71part was more than 0.8% both for MOX and UOX 248U17 17xl7 21.5 2.48 59.9fuel lattices of larger buckling B,2>0.0025CM,2). It 30OU17 17x]7 22.93 3.00 53.11
was also evaluated that 20cm length of fuel rods
above the critical water level has significant Table 2 Critical lattices of CRX facility
reactivity effect. The reactivity effect was found Lattice Lattice size pitch VmfVf Critical Waterlinearly increased with the axial buckling and Name & configuration (-) Lcvel(cm)monotonously decreased with volumetric ratio of CRXI 22x23MOX 13.21 1.68 82.90moderator to fuel of the lattices. CRX2 l9xl9M0X 14.22 2.16 80.75
CRX8 2lx2lMOX 14.22 2.16 50.38As described, the reactivity effect of the CRX12 l3xl3MOX 18.68 4.71 68.41
dry part of fuel rods is indispensable in analysis of CRX13 l2xl2MOX 20.12 5.67 76.76critical experiments. Caution should be taken to the CRX14 I lxl IMOX 26.42 10.75 79.50effect when we compare the accuracy of criticality CRX15 19xl9UOX 14.22 2.16 81.94
CRX18 2x2lUOX 14.22 2.16 51.00calculation methods. CRX21 ]9xl9UOX 14.22 2.16 89.43
central I I x I I MOX
References CRX29 l9xl9MOX 14.22 2.16 74.43central I I x I I LJOX
1) H. Tsuruta, 1. Kobayashi, T. Suzaki, A. Ohno, K. CRX30 19xl9UOX 14.22 2.16 82.17Murakami and S. Matsuura, JAERI 1254,(1978). central 3x3MOX2) B. Na and E. Sartori, Nucl. Sci. Eng., 142 37 CRX32 23X23MOX 13.21 1.68 74.33(2002). CRX40 25x24MOX 13.21 1.68 57.22
3) T. Suzaki, K. Sakurai, K. Nakajima. and 0. Horiki,
Proc. Int. Conf. on Nuclear Criticality Safety, Table 3 The initial source distribution and calculated
ICNC'99, Versailles, France, Sept. 20-24, 1999, 386 eigenvalues with the continuous energy Monte Carlo
(1999). Method. For both lattices, 100000 x 150 histories
4) N. M. Abdurrahman, G. Radulescu and 1. Carron, were sampled.
Nucl. Technol., 127 315 1999). initial source 183U21 CRX85) J. F. Briesmeister, "MCNPTM-A General Monte distribution eigenvalue eigenvalueCarlo N-particle transport code," LA-13709-M, error error(2000). (1) Calculated axial fission 1.00185 1.00549
rate distribution 0.00019 0.000226) K. Kosako, F. Maekawa, Y. Oyama, Y. Uno and H. (2) Same as (1) but no 1.00162 1.00592Maekawa, "A CONTINUOUS ENERGY CROSS source in air 0.00019 0.00022SECTION LIBRARY FOR MCNP BASED ON (3) Point source 1.00136 1.00594
JENDL-3.2", JAERI-Data/Code 94-020, 1994). 0.00018 0.00022
7) J. S. Headricks, S. C. Frankle, J. D. Court,
"ENDF-B VI Data for MCNP" LA-12891 1994). Table 4 Neutron gain in dry lattices
8) T. Kiyosumi and Y Miyoshi, Proc. Int. Sympo. Lattice Current from Current from Fission neutronNUCEF 200 1, Tokai, JAPAN, Oct. 3 -Nov. 2 200 1, Moderated Outer yield
Lattice Moderator415 2002). (/total neutron yielded in the system)
183LJ17 1.21E-02 1.08E-03 3.49E-03183U18 2.56E-02 2.3513-03 7.85E-03183LJ19 3.83E-02 3.37E-03 1 I 9E-02183U20 5.1 1 E-02 4.2 E-03 1.61 E-02183U21 6.24E-02 4.86E-03 1.99E-02
- 571 -

JAERI-Conf 2003-019
Table Contribution of dry lattice to the kff2 0 1831.1271Lattice % fission neutron Contribution Contribution 1.008 CRX8-2
cm yield to kff yield 1. 006 ------------------- 7
183U17 0.00063 3.47"3 1.21E-03 0.34823 V1. 004 ---183LI18 0.00129 7.83E-03 2.76E-03 0.35255183U19 0.00189 1 I 9E-02 4.34E-03 0.36587 1. 002 --- --- 14
183U20 0.00258 1.61E-02 6.16E-03 0.38328183U21 0.00301 1.98E-02 7.89E-03 0.39809
0.998 ...... ..... ....
B 0. 996Table 6 Sum of inward current to the dry part of 0.994
lattices and fission neutron yield in the part0. 992 U lu z JV 4U Du buLattice (V,/Vf) B.' (a) (b) (b) Length of dryupart of fuel rods above
cm-2 Sum of fission (a) critical water level (cm]thermal neutron Fig 2 Evaluated eigenvalue of 183U21 and CRX8
CRX32 1.68 0.001218current yield lattices in relation to the length of the dry part above.29E-04 2.35E-02 28.37CRX40 1.68 0.00188 1.32E-03 5.24E-02 39.71 the water level in the calculation models.CRX12 4.71 0.00158 1.86E-03 7.34E-03 3.95Simulation 4.71 0.00230 2.63E-03 1.26E-02 4.79CRX13 5.67 0.00129 1.74E-03 4.57E-03 2.62 11 Vm/Vf=1. 68. MOXSimulation 5.67 0.00217 2.80E-03 1.02E-02 3.64 0 Vm/Vf=2.16.MOXCRX14 10.75 0.00124 2.55E-03 3.57E-03 1.40 Vm/Vf=2.16. MOX-WXSimulation 10.75 0.00186 4.02E-03 7.52E-03 1.87 0 Vm/Vf=2-16,5.7%EU-U
S Vm/Vf=1.83 2.6%EU-U0
4--
2 0retlectdr 4 < -0.2 ------�; 2! In.effect
1. 5 Critical --- -0.4 ------------- ------------41 Cd Water
Surface -0.6 - --------------------- ---------0 .0 ------------- .... : ...... -
Fue) in 4--CD -0. 8 - --- ............... [i ...................... -Moderator a
0. 5 - --------------- ------ Fuel in ai r--
bottom �f0 fuel I nC>
D 20 40 60 100 C; C> C; C;Vertical Position f rom the bottom of lattice (an] Axial Buckling B�2 [cm�,2]
2Fig. I Calculated fission rate distribution of the Fig. 3 Relation of axial buckling B. to reactivity
CRX8 lattice. effect of dry part of lattices.
Top of fuel/6ry part of vacuum boundary
Current from-fission �7qar moderatorroneut nyield ritical water surface
CurrentOuter- - - - - - - Moderator
Moderatedpart ofLattice
Fig. 4 Schematic view of neutron gain in dry lattice.
572 -

JAERI-Conf 2003-019
0 Fission yield 13 Vm/Vf=1.68,MOXin dry lattice 0 Vm/Vf=2.16.MOX
Vm/Vf=2.16,MOX-UOX0 Vm/Vf=2. 16, 5. 7EU-L)OXM Thermal current from 0 Vm/Vf>3, MOX
moderatedupart of lattice 0 Vm/Vf=l. 83, 2 6EU-LIOXThermal c rrent fromouter moderator W41 0 6
W) 41_
Z T 0. 025 0.005 Co i 0. 5 ................ ---------------41 r+ /) 1 -C
0.02 ',: ....... 7...... -- O. 00.4 0 4 . .... ------------41.- OZ
..........b0.015 - 0. 003 Zw80.3
0.01 - 0.002 0 2 4 -----------: -404:,
0 005 0 I ...... ...........0.001 5'V
co 41bo to 0
0 UM 0 LLJ t2 04
Ln L-2 CD C,6 Ci
B 2 w2) Axial buckling B.' cm'lz
Fig. 5 Axial buckling and neutron current. Fig. 7 Eigenvalue of lattices raising critical water
height to Z on FZ)=O comparing with that in normal
modeling.
41G3 0
4-0
0.1 - ---- ------ ................41
-0.2 - ------------- I I------- ------------
-0.3 ------ ................. -
-0.4 ................... ............CD
4- -0.5 ...... ...... ------ ------- L
.4�
2 -0.64� U IU 1z
Volumetric ratio of moderator to fuel (V
Fig. 6 Reactivity effect of dry part of lattices and
2volumetric ratio ofmoderator to fuel (B are adjusted
to be 0.0014CM,2 for all lattices).
- 573 -

JAERI-Conf 2003-019 JP0450109
Consideration of Convergence Judgment Method
with Source Acceleration in Monte Carlo Criticality Calculation
Yasushi NOMURA'and Takeshi KUROISHI''Japan Atomic Energy Research Institute, Tokai-mura, Naka-gun, Ibaraki 319-1195, Japan
2Nuclear Fuel Industry.Ltd., Kumatori-cho, Sennan-gun, Osaka 590-0481, Japan
Theoretical consideration is made for possibility to accelerate and judge convergence of aconventional Monte Carlo iterative calculation when it is used for a weak neutroninteraction problem. And the clue for this consideration is rendered with some applicationanalyses using the OECD/NEA source convergence benchmark problems. Some practicalprocedures are proposed to realize these acceleration and judgment methods in practicalapplication using a Monte Carlo code
KEYWORDS. source convergence, Monte Carlo, criticality analysis, source acceleration,convergencejudgment, Dominance ratiofission matrix, eigen vector, eigen value
1. Introduction neutron histories accumulated over many cyclespursued with Monte Carlo technique.
It seems that Monte Carlo (MC) method applied to On the other hand, each component of the fissiona criticality analysis is believed as already established. matrix Pij defined as, (Number of neutrons in cell jHowever, neutron multiplication factor, k, namely, generated by fission reaction of neutrons transportedsolution of a MC calculation, sometimes results in from cell i) divided by (Total number of sourceunreliable in comparison with that of a deterministic neutrons generated in cell i), can be related directlymethod. One might underestimate or sometimes with fssion neutrons in cell i and cell j, irrespective ofoverestimate the k, value for a physical system those in other cells. Consequently, the components ofconsisting of several fissile units, for example, as a fission matrix can be obtained relatively preciselyresult of premature convergence attained to stop the even in early stages of MC calculation even if theMC calculation cycles with seemingly converged state fission source neutron distribution is not converged tobecause of a weak neutron interaction between these the final stable one. Hence, according to this fact, onefissile units. can accelerate the convergence of MC calculation by
In this paper, theoretical consideration is made for a utilizing the eigen-vector calculated by solving themethodology to accelerate convergence in MC fission matrix to correct the fission source neutroncalculation by using fission matrix eigen-vector, distribution obtained in the early stages of MCwhich gives approximate fission source distribution. calculation cycles.Consideration is also made for another methodology Here, some OECD[NEA/NSC source conversionto judge convergence. And verification analyses are international benchmark problems') are analyzed tomade for these methodologies by applying illustrate the effectiveness of fission matrix eigen-OECD/NEA Source Conversion benchmark problems. vector utilization to fission source distributionThen the procedure is proposed to materialize these correction. The first benchmark problem is of one-methodologies. dimensional infinite slab geometry, namely, a slab of
water separating two fissile units as shown in Fig. L2. Consideration of clues for Acceleration and The thickness of slab is 35 cm for unit 1, 30cm for
Judgment of Convergence of MC Calculation unit 2 and 20 cm for water layer. Since the water isthick enough to almost isolate fuel slabs from the
2.1 Application of Fission Matrix Eigen-vector viewpoint of neutron interaction, one might encounterto Acceleration of Convergence convergence problem when criticality analysis is to eIt is possible to obtain Kff eigen-value and fission made by MC method. As shown in Fig.2, the trend of
source eigen-vector by solving fission matrix calculated k,'s without correction indicates rathercalculated for each MC iteration cycle. These values slow convergence in comparison with that of fissionobtained as such, however, are accompanied with matrix correction made, in which initial neutronrelatively large statistic error due to small number of source for MC iteration is artificially located in theneutron histories assigned to each cycle, resulting in center of the unit 2 less reactive than unit 1. The aimrather poor calculation precision for the K, Of this unrealistic location is to illustrate theAccordingly, in general, fission source distribution effectiveness of adopting the correction to speed upand neutron multiplication factor k, are to be the asymptotic change due to movement of neutron toobtained by taking mean values of results with lots of conform convergence. The trend of another k's
calculated without correction is also shown in Fig.2
- 574 -

JAERI-Conf 2003-019
2)for the reference case in which the initial neutron iterative cycles proceedsource is equally distributed between unit and unit 2 This difference is caused by different amount ofIn this reference case, the convergence is attained fissile material, for example ... U, in the end regions ofrather fast because te initial neutron sourcedistribution is almost near to the converged one. (Vacuum)
Water1.75 cm End plug
Reflective Cladding cmcm
1.33cm4)10cm
20 cm 0.4750
285.7 cm
E E0 0 Fuel region0 co (9 cells)M >>
1.15 cm End plug
Fig. 3 CIDNEANSC BenchmarkReflective (Vacuum) Problem No.2 Model Geometry
35 cm __ Xcm ycm the two calculation cases. The enrichment in theFIg.1 OECDINEA/NSC Source Convergence
Benchmark Problem No.3 Model Geometry end regions is 45 weight for the case of Fig.4 and2.0 weight % for Fig.5. For these MC calculations, theinitial source neutrons were equally assigned for each
1.13 Reference case 9 axial regions. Because the length of region is shorter1.12 the both ends of fuel pin, the profile of initial1.11 towards1.10 source neutrons is something like a horseshoe shape1.09 f1.08 t Without correction with higher neutron densities appeared towards the1.07 ends of fuel pin. Since the fuel region at the end of pin
CO 106D contains more fissile material in the case of Fig.4 than1.051.04 that of Fig.5, the converged axial profiles of source1.031.021.01 1.3601.00 Without correction
0 50 100 150 200 250 300 350 400 450 1.350
Iterative cycles 1.340 th correctionT3d)
Fig.2 k-effective calculated for three thick one-dimensional r 1.330
slab geometry, 35cm fuel - 30cm water - 20cm fuel. MC Jlk
conditions; 10000 histories/cycle, 10 corrections/100 cycles. 1.320
1.310The second benchmark problem is of infinite array
0 50 100 150 200 250 300of spent fuel pin cell model as shown in Fig.3. The
fuel pin is divided into axially symmetrical 9 regions Iterative cyc ,les
with .2"U enrichment distributed so as to be higher Fig.4 Trend of k-effective calculated for infinite array of
towards the ends of fuel. For MC criticality spent fuel pin cell model geometry, with 45 Wt% 235U
calculations, the effect of applying fission matrix enriched end region. Monte Carto conditions; I 0000
eigen-vector correction is apparent for these two histories/cycle 3 corrections/90 cycles from 10 cycles
benchmark MC calculations as seen from Fig.'s 4 and
5. However, because the timing of correction is rather 1.090
late (from I 10 cycles into iteration), an erroneous
behavior can be observed in the trend of calculated k ff > "080
results as to suppress convergence when the correction a) 1.070is made, This indicates that the timing of correction is
important for application of fission matrix eigen- 1.060 With corrections
vector to make an effective acceleration of Without correction
convergence. 1.050 . . . I I -
0 50 100 150 200 250 300
2.2 Differentiation of Asymptotic Nature of Iterative cycles
MC Power Iteration Fig.5 Trend of k-effective calculated for infinite array of
As the trends of calculated results are shown in spent fuel pin cell model geometry, with 25 equivalent wt%
Fig.'s 4 and 5, different asymptotic behaviors are 235U enriched end region. Monte Carlo conditions; 10000
discerned such as increasing or decreasing of kfr as histories/cycle, 3 corrections/90 cycles from 10 cycles
into iteration.
575 -

JAERl-Conf 2003-019
for Batch 2 the final convergence judgment cycles. ecan be given to be 10-' as an appropriate value for
neutrons are different in accordance with different ordinal MC calculations, and h may be given by anaxial reactivity profiles. Therefore, calculated k,'s in engineering judgment. r is theoretically explained toearly stages of MC calculations are underestimated as indicate the degree of difficulty to attain convergenceshown in Fig.4, and overestimated as shown in Fig.5, due to weak neutron interaction of the physical systemthus leading to the different trends of calculated k,'s. ofconcern 3 .
This fact suggests a possibility to judge convergenceof calculated s by ensuring the same asymptotic 3.2 Procedure to Make Reverse Trend in Batch 2behaviors between the reverse trends of iterative MC Calculation and Final Decision of Convergencecalculations for a particular problem. It can be expected that the final iterative cycles for
Batch I might give the converged neutron3. Procedure of Acceleration and Judgment for multiplication or fission source distribution as the
convergence of MC Calculation unique solution for the given problem. But, due tofluctuation of MC statistic calculation and influence of
Fig.6 depicts a procedure proposed to accelerate different seeds of random number sequence, one canand judge the convergence of MC calculation. As seen not be confident to finish the MC calculation.in this Fig.6, the proposition is composed of two Then, Batch 2 calculation goes with the reversestages, the former acceleration stage and the latter asymptotic convergence direction tried to check thatjudgment stage. The latter one is further consisted of the tendency of MC calculated results is definitelytwo steps (let's call them as Batch I and Batch 2 of closing to the seemingly converged one attptined byMC iterative calculations. Batch 1. For example, if the trend of Batch I MC
calculation is asymptotic from underestimated k's,
keff me of k Tnd one must select a slightly overestimated initial fissionsource distribution for Batch 2 MC calculation so thatthe trend of Batch 2 MC calculation is asymptotic
:""� � �4 Allowed E., from overestimated k,'s. Theory goes that both trendsConvergence of Batch I and Batch 2 should come to the unique
solution of the given problem.It is possible to realize the process, for example, by
0 N (=TllogF/logp) 2N Cycles setting the fission source neutron distribution for
F�.6 Scheniaticofoonvergencejudgenientmeffiod Batch 2 initialization as follows.
3.1 The Former Acceleration Stage and the f2' = f + V1 <fl >) (2)Following Batch I Calculation
In the proposed method, acceleration is made in Here, f, is the fission source neutron distributionearly cycles of MC calculation by utilizing fission attained at the final cycle of Batch I and f,> can bematrix eigen-vector for correction of fission neutron obtained by integratingf, over whole range of space tosource distribution. Then the fission neutron make an average. f, is the fission source neutrondistribution created as a final one in this acceleration distribution for Batch 2 initialization. And P is astage is used for initialization of Batch I MC relaxation coefficient to appropriately reverse thecalculation, which may be almost approximate to the trend of Batch2 MC calculation as shown in Fig.7.converged one. In this Batch I MC iterative cycles,the convergence is ftirther promoted without Fission
correction applied. In this case, it will be convenient Batchlffssionsoureagrestarthanaverag:
to predict how many MC cycles might be required to Is made mom Increased to reverse th
attain convergence. The answer to this inquiry may be trend for Batch 2.
given by the following equation", in which N is the Average C I I d result for batch
number of MC cycles required for Batch 1. valueBatch I fission -rce lower than
N = h log (e) log (r) average is made more decreasedfor Batch 2.
Here in the above Eq. , e is the relative error order Position
reduction desired for the convergence. And r is the Fig.7 Procedure to reverse trend of keff calculation
dominance ratio defined as k,/k,, in which k, is the
neutron multiplication eigen-value for the The final step of the proposed procedure is to
fundamental mode, and k, is that for the first higher determine the convergence of MC calculation. In this
harmonic mode. Finally h is the relaxation coefficient step, judgement of convergence is made by checking
which is determined as to spare necessary MC cycles the difference of the calculated k,,,, in the final cycle
- 576 -

JAERI-Conf 2003-019
ofBatch I andthekff,2calculatedbythecurrentcycleof Batch 2 to be less than the allowed preset value aas shown in the following equation.
IK,I-k,,,21< a (3)
4. Conclusion
In this paper, the basic ideas and procedures areexplained to make acceleration and judgment ofconvergence, which gives sometimes difficulty inobtaining reliable kff's for a conventional MC iterativecalculation when it is applied to a problem with weakneutron interaction. It might be expected to encounterwith other difficulties when the proposed procedurehas to be implemented for a practical use of MCcalculation. These encountered difficulties and theirmeasures are treated in application to the OECD/NEAsource convergence benchmark problems in anotherpaper by the same authors in ICNC2003.
ReferencesI ) htip-//www.nea.fr/htmi/science/=ncs/convergm
02) Y.Nomura, T.Takada, H.Kadotani and T.Kuroishi,
"Acceleration of Cticality Analysis SolutionConvergence by Matrix Eigenvector for a Systemwith Weak Neutron Interaction," JAERI-Tech2003-020, 2003).
3) T.J.Urbatsch, "Iterative Acceleration Methods forMonte Carlo and Deterministic CriticalityCalculations," LA-13052-T, 1995)
- 577 -

JAERI-Conf 2003-019 JP0450110
Automated Suppression of the Initial Transient in Monte Carlo Calculationsbased on Stationarity Detection using the Brownian Bridge Theory
Yann RICHET - Olivier JACQUET - Xavier BAY'Institut de Radioprotection et de Saretg Nuclgaire, BP 17, 92262 Fontenay-Aux-Roses Cedex, France
'Ecole Nationale Sup&ieure des Mines de Saint Etienne, 158, cours Fauriel, 42023 Saint-Etienne, France
The accuracy of a criticality Monte Carlo (MC) calculation requires the convergence ofthe k-effective series. Once the convergence is reached, the estimation of the k-effectiveeigenvalue must exclude the initial transient of the k-effective series. The present paperdeals with a post-processing algorithm to suppress the initial transient of a criticality MCcalculation, using the Brownian Bridge theory.
KEYWORDS: Monte Carlo calculation, Initial Transient, Stationarity Detection,Brownian Bridge.
1. Introduction 2. Scalar series used to detect the initial transient
The initial transient of a criticality MC calculation The initial transient observed in the k-effectiveinduces a bias in the k-effective estimate. A "positive" series [k(i)j,,,, is obviously a consequence of thetransient corresponds to an initial overestimation and source distribution (or eigenvector) convergenceinduces a positive bias, whereas a "negative" transient process from the initial guess to the fundamentalcorresponds to an initial underestimation and induces a mode. Since it is much easier to study the convergencenegative bias. in a series of scalar values than in a series of Vectors,
For instance the fourth benchmark of the NEA and because the cycle k-effective series is used for theSource Convergence Expert Group') is designed to estimation of the k-effective eigenvalue a firstproduce a transient in the k-effective series due to a approach to suppress the initial transient - using thebad initialization of the sources distribution (Fig. 1). Brownian bridge2) theory - focused on the stationarity
Estimation of the k-effective ( o-kffAb0.00240 detection of the cycle k-effective series.')* 1.10327 without transient suppression However the apparent convergence of k-effective* 1. 1682 with an empirical transient suppression of series does not strictly imply the convergence of the
170 observations source distribution. Recently, a stationarity diagnosticI kfft i based on the Shannon entropy of source distribution,
4 using the two-sample F test, was proposed .4 Ani 3 advantage of this method lies in the use of a more
2 representative scalar value of sources distribution thanL k-effective.
Nevertheless the stationarity of Shannon entropyIA does not rigorously imply sources distribution
stationarity and moreover stationarity, of sourcesdistribution does not guarantee the convergence
o.7 towards the fundamental mode. Finally, it should be0.6 noticed that the transient suppression aims only at0 obtaining a stationary series and cannot guarantee the
0.1.) II)) 200 0 '30(�. 40 500.0 t00.0 700.0 !�00 100 100 0convergence of the sources distribution in any way.Fig. I Cycle k-effective series from NEA Source As a consequence, it is necessary to run a sufficient
convergence benchmark 4 number of generations to ensure that the MC powering
algorithm has converged to the true eigenvalue, or toThis example shows a bias of more than 001300 in use an improved powering method which guarantees
the k-effective estimate, and the k-effective MC that the most reactive parts of the system are correctlyuncertainty of 000240 is not sufficient to take into sampled after the transient.5)account this bias. The post-processing algorithms Keeping these points in mind, the stationaritydetailed in this paper are designed to suppress this detection can be based on the cycle k-effective serieskind of transient and the induced k-effective bias. or on the cycle Shannon entropy series. So, let us
define a series XX(011ici,;N of N observationsstanding for either a k-effective series or a Shannonentropy series resulting from a MC calculation.
'Corresponding author, Tel. 33-1-58-35-88-84, Fax. 33-1-46-57-29-98, E-mail: yann.richet�irsn.fr
- 578 -

JAERI-Conf 2003-019
3. Series and bridge processes In order to analyze the stationarity of the x series,
'Me underlying idea of the stationarity detection is G. Vassilacopoulos" suggests to work with the '�ank to consider a process revealing the stationarity or non- series" of x in place of the x eries. This ranLs series isstationarity of the series. defined as .R� W I 5i,5N where Rx(i) is the rank of x(i),
I i.e' the ascending sort order of x(i) among all x values.Let us consider x (j) XW. it can be proved that the (R,(i)l process is stationary
if the x series is stationary.Basically, when the series x is stationary, the series In the same way that Tr(j) let us define
[jWj)-T(N))),,,,,, has small values and iscentered around (see Fig. 6. On the contrary, in the R, R, M . Another 'bridge" process cancase of a negative (resp. positive) initial bias in theseries x, the series [j(3�(j)-x(N))j is not centered thus be based on the 'fan ks series" such that:
around and has a negative resp. positive) peak (see BR� j (R, W - R, W ) ,Fig. 7. N FN
Let us introduce the "series bridge" of X: for t<j<N, where -,FNN+IJ is the
• BS� j � = I i ( () -. � (N)) iT3N T FN sample standard deviation of the R. series.
for I<j<NWith T=Iim N Var CT N)) BR, 0)=0
• BS,(O)= .
x0)
El7 7
0
0 01 G IX, D 31-I i00 11 500 1� 6L.( 71A J 80E, 11 :)00 C 1)", lljl El -,Wl U( 0 100 06, 0 0 1)
Fig. 3 A stationary series Fig. 2 A non stationary series
R.( 1____._�.-�-Z
All 11 el
071 I
CEI 0C, 1,
3 -0 El
0 �,�W 1) SOO 1,01� 0 7W, W'D '00 i 00(; 1A 0 Mr� 0 -1(1� 7(1
Fig. 5 Ranks of a stationary series Fig. 4 Ranks of a non stationary series
Fig. 6 Bridges of a stationary series Fig. 7 Bridges of a non stationary series
579 -

JAERI-Conf 2003-019
Fig. 3 to 7 show respectively a stationary series, its - X. Bay shows that Srj. and Sr. both follow aranks series and its bridges and a non-stationary series, distribution having this cumulative density:
its ranks series and its bridges. Note that the bridges F,(,)= I - r I+r_ cot( - )�ranges are very low for stationary series and reach (1+r)'� Tr I+rhigh values in case of non stationary series.
All the statistics (denoted as S-) designed toThe terminology 'bridge" comes from the fact that characterize the minimum value of the bridges can
all the bridges processes equal when = and t = 1, only detect negative transients (for instance Sv.i. ,thus the curves look like bridges between the points Ss.i., Sri.). In the same way, all the statistics (denoted(0,O) and (1,O) (see Fig. 6 7 as ) designed to characterize the maximum value of
the bridges can only detect positive transients (forIt can be proved that bridges processes tend to the instance Sv- Ss-, Sr- ) A new kind of statistic
Brownian bridge, when the x series is weakly based on two symmetrical statistics and S' can bedependent - i.e. when two xi) observations widely defined as maxtS-,S'J. This kind of statistic detectsseparated from each other in the series are almost both positive and negative transients. We only testedindependent (in the sense of phi-mixing')) - and as N such statistics in our paper:tends to infinity. Schruben statistic based on the series bridge):
4. Characterization of stationarity Ss(BS,)=max (Ss,,,(BS,), Ss_(BS,)l
The bridges processes defined previously can be This statistic is correctly estimated only if T' is welluseful to determine if a series is stationary or not. known, but festimation is very influenced by the nonIndeed it is possible to determine the distribution of stationarity of the series. One way suggested tosome characteristic values (called statistics and improve the T estimation accuracy is to estimate T'denoted as S) of the bridges of stationary series. just on the last half of the series. The two following
Let us give some examples of such statistics used statistics avoid the estimation of this parameter.in literature, B. being BS, or BR.:Sv ,,(BJ=min(BJ B� (tif . Supremum ratios statistic based on the series
t.j (I - .,J bridge: Sr(BS,)=maxISr,,,(BS.),Sr_(BS,)I
Sv_(B.)�max(B.) Ss_(B�)= B. (t_)2 . Vassilacopoulos statistic based on the rankst- (I ) bridge6): Sv (BR.) = max I Sv .(BR.),Sv_(BR.)J
where t, (resp. t_ is the value at which the Nevertheless all the statistics distributions areminimum (resp. maximum) of B,(1) occurs.
But other characteristic values of the bridges can established for theoretical Brownian bridges, and thebe mentioned: k-effective or Shannon entropy series are all the more
- Bx(tj.) - B,(t_) far from weakly dependent processes (see section 3 asSr (BJ = B,(t_) Sr-(B.)= Bx(t,,J the length of the series N is low. In fact the series
Ss.6,(BJ Ss. (B.) resulting of MC calculations have various finiteSsr,., (B.) = Ss_(B.) Ssr_(Bx)= Ss,,,.(B.) lengths and are somewhat autocorrelated. In this paper,
2 the two main parameters considered as influencing theB, j statistics and their distributions are the lngth N andN
mino!5,� Sad(B,)=Y the first autocorrelation coefficient p of the series (seet(I-t) j-0 iL6 I - Fig. 8 9 The determination of theoretical statistics
N Ndistributions versus N and p has to be achieved.
and Sfc(B.)=to where to is the first value strictly However an empirical estimation of each statisticI I
greater than where B. (to - -) B� (to) < 0 distribution AN., is possible by estimating thisN Nstatistic for a great number of series with the same
In fact, the characterizations of minimum and values of N and p. For the purpose of our study, a planmaximum values of bridges are two symmetrical point of experiments has been defined to evaluateof views. Thus, the distributions based either on distributions of the Sr(BS,), Ss(BS.), Sv(BR.) statisticsminimum or maximum are identical. for N E 25,100,500, 1 00 I and p E 0.0, 0. 1 02
Note that when Bx is a Brownian bridge (i.e. bridge Practically, when an estimation of ,,, has to beof a weakly dependent series): performed with N or p not included in the previous• G. Vassilacopoulos shows that vi. and Sv. both plan of experiments, the distributions of the statistics
follow a Kolmogorov-Smimov distributiorfi) are linearly interpolated. This interpolation could be• L. Schruben shows that Ss.i. and Ss. both follow improved using a more dense plan of experiments and
X2 7) a better model than a simple linear interpolation.a 3 distribution
- 580 -

JAERI-Conf 2003-019
or - 6. Transientsuppress nprocedure
Let us define a series x of N observations fromwhich we want to remove the initial transient. Tests
Y are performed at first on the entire series. If te xseries is not considered as stationary, the series istruncated (of a certain number of initial observations)and the tests are performed again. This iterative
s long as the test h pothesis isprocedure is repeated a. y
ected and the number of remaining observations isSIM rej
I 0 Q L i C II 1: 2.0 statistically sufficient." Another way to truncate theFig' 8 Cumulative density functions (edf) series at each iteration could be to suppress it = t.N
of Ss statistic for N 150. 500, 5000 p 0.0 observations, t being the value . or -) where theKul ('55111111) - - - I 1 ------ considered bridge B,(t) reaches its supremum.
Of course. the efficiency of this iterative procedureatistic test erfo e& at each
depends on the st rMiteration.
0.105 The methodology of truncation and various
statio, ty tests (not only basedon Brownian bridgetheo are imolerriented in the OPOSSUM) post-processing tool of the MC code MORET 4).
I 7. ValidationMln
0 1 2 6 0 7 R LO 11 12
Fig. 9�Cumulatdve density functions of Ssj, statistic Jhe validation of this trans'len i Su ssionfo p (0.0 02 04), N 1000 methodology and the comparison of underlYing
stationarily tests are performed , on a,,� plari ofexperiments of artificial and although realisti s 'e
Stationarit pri m'Me series are modeled (see Fig. II) s the sum of
Considering a series x, an extreme statisfic,�alue of a stationary , series and of a transient-a bridge (BS, or BR,) points out te non stationarity of x W - x, W 4 T U) . where:this sries. Thus, a simple statistical test can be based x, is a stationary Gaussian autoregressive process:on each statistic previously defined: x,(i+ 0= X W+0+ 1) , where 00),
S being the statistic value obtained on the x series I P 1,,iN areof length N and first autocor Irelation coefficient p, independent Gaussian random variables of mean
and variance or' The parameter T (introduced inANp being the theoretical distribution of S for the series bridge definition in section 3 of the x,series of length N land first autocorrelation series equals T = O, / ( I - P)
coefficient p, T is a transient function defined as:cc being the level of significance of the test (for
A, for L<i <ainstance I %), TWJ
the stationarity hypothesis is accepted if: A-(b-i)1(b-a), fora_<i<bcdfj, ,(S(B,))< I -o( 10, . forb<i<N1
The series are chosen to reveal different transients.where cdf A is the cumulative density function of A.1., different lengths and different ranges while thedistribution (see Fig. IO). stationarity tests have the same level of significance
Test level 10%,) (10%).I
(al 11W ily slalionatitv
M)lWis warhY v -I h 0,acc led rejeA led
T 7
Fig. 10 Cumulative density function of test statistic N_00 4m) L") "Ap, 0 k 1(j"
and stationarity hypothesis acceptance region Fig. 11 Series model
- 58 -
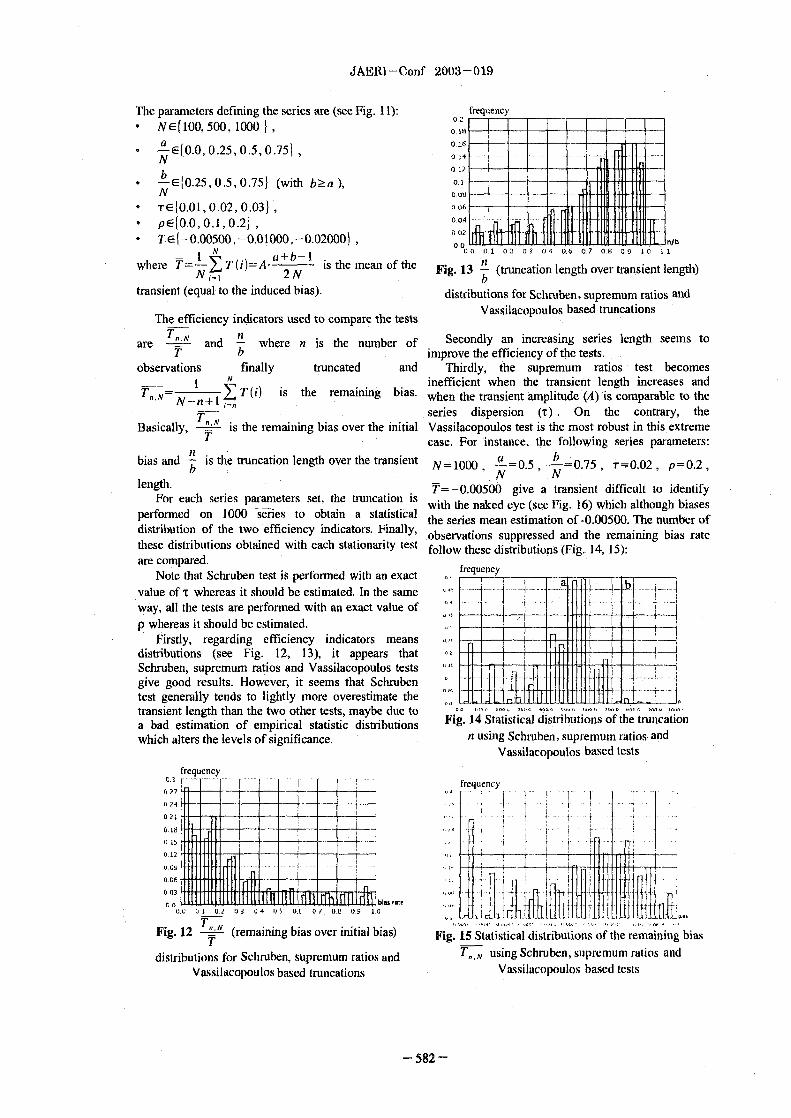
JAERI-Conf 2003-019
ne parameters defining the series are ee Fig. I ): 0 1 frequency• N E ( 100. 500. 1 000 11 0.16
a 0. i6• _E(0.0 025, 0.5 0751N 0.14
nl�-
bE[O.25,0.5,035] (with ba), O'l - 111111 1111 IIIHN I lill till IIIIi
T G f 0.0 1 002 0031 m ine 11111 I
PE 0.0, 0. 1, 0.2) O..402
TE(-0.00500,-0.01000,-0.02000) n/b0 N b- 1 02 O? 01 0.1� 0.7 0.8 0.9 IC 1.1
where T _ T ) = A ' is the mean of the Fig. 13 nf) (truncation length over transient length)Nj�j 2 N b
transient (equal to the induced bias). distributions for Schruben, supremum ratios and
Vassilacopoillos based truncationsThe efficiency indicators used to compare the tests
are T,, andn where n is the number of Secondly an increasing series length seems toT b improve the efficiency of the tests.
observations finally truncated and Thirdly, the suprernum ratios test becomesI N inefficient when the transient length increases and
T,, - T(i) is the remaining bias- when the transient amplitude (A) is comparable to theN-,z+ ;_� series dispersion (T) . On the contrary, the
Basically, is the remaining bias over the initial Vassilacopoulos test is the most robust in this extremecase. For instance, the following series parameters:
bbias and is the truncation length over the transient 0.5, w=0.75, T=0.02. p=0.2,N-1000, . N
length. T=-0.00500 give a transient difficult to identifyFor each series parameters set.. the truncation is with the naked eye (see Fig. 16) which although bises
performed on 1000 eries t obtain a statistical ,distribution of the two efficiency indicators. Finally, the series mean estimation of -0.00500. The number of
observationssuppressed and the remaining bias ratethese distributions obtained with each stationarity test follow these distributions (Fig. 14, 15):are corn ared..p
Note that Schruben test is performed with an exact uenCYb
value Of T whereas it should be estimated. In the same -away, all the tests are performed with an exact value of
p whereas it should be estimated.Firstly, regarding efficiency indicators means 2! n
distributions (see Fig. 12, 13), it appears that nSchruben, suprernum ratios and Vassilacopoulos tests
give good results. However, it seems that Schruben
test generally tends to lightly more overestimate the -'JI'lltransient length than the two other tests, maybe due toa bad estimation of empirical statistic distributions Fig. 14 Statistical distributions of the truncation
which alters the levels of significance. n using Schruben, suprernum ratios. andVassilacopoulos based tests
frequencyD3
- '] I I I 1 1 1 frequency1127242 t
0,18
1209
n0 U111111111111lu', " -- I I 1 n0 J
U.C 01 b.1 03 04 O, 0.( 01 OL 0�9 la
Fig.12 TN (remainingbiasoverinitialbias) Fig.15Statisticaldistrib,utiions,�"of",ther'e"main'ingbiasT
distributions for Schruben, supremum ratios and T., using Schruben, supremum ratios and
Vassilacopoulos based truncations Vassilacopoulos based tests
582

JAERI - Conf 2003 - 019
ReferencesI kill a lb
1) R. Bloniquist et al., '10ECD/NEA SourceConvergence Benchmark Program: Overview and
1 4 k Summary of Results", ICNC 2003.I 02 2) P. Billingsley, "Convergence of probability
measures", John Wiley Sons, 1968.3) 0. Jacquet et al., 'Ei genvalue uncertainty
evaluation in MC calculations, using time series0 i4 Methodologies", in A. Kling et al. (Eds), Advanced0 92 Monte Carlo for Radiation Physics, Particle0
0.0 1 0 20 >00 400 500.0 N00.0 700 0 �100 0 �ll)0 V 1000 0Transport Simulation and Applications, Springer-Fig. 16 Series from the plan of experiments with Verlag, Berlin Heidelberg, 2001.
N=100 I a = .5 , b = 0.75, T=0.02, p=0.2, 4) T. Ueki, F.B. Brown, 'Stationarity DiagnosticN N Using Shannon Entropy in Monte Carlo Criticality
T= -0.00500 leading to a 0.00500 bias on the Calculation F test". ANS Winter Meeting,k-effective estimation Washington, Nov 2002.
5) J. Miss, 0. Jacquet, A. Nouri, 'Development andThe following Table I gives the number of Comparison of Monte Carlo Techniques
observations suppressed and the remaining bias for Implemented in the MORET 4 Code for theeach test used with the automated truncation on the Calculation of Loosely Coupled Systems", in A.series Fig. 16. Kling et al. (Eds), Advanced Monte Carlo for
Radiation Physics, Particle Transport SimulationTable Truncation and remaining bias and Applications, Springer-Verlag, Berlin
Test used n T., N Heidelberg, 2001.6) G. Vassilacopoulos, 'Tcs ting for Initialization Bias
Schruben nl=511 -0.00186 in Simulation Output". Simulation Councils 1989)Supremurn ratios n2=302 -0.00370 7) L. Schruben, "Detecting Initialization Bias inVassilacopoulos n3=631 -0.00061 Simulation Output" ' Operations Research, vol. 30,
May-June 1982.
This result confirms the efficiency of an automated 8) P. Heidelberger and P. Welch, 'Simulation Runtruncation whereas an empirical truncation would have Length Control in the Presence of an Initialprobably give a bad result in terms of bias gains. Transient". Operations Research, vol. 31, Nov-Dec
1983.8. Conclusion and prospects 9) L. Heulers et al., "Me Graphical User Interface for
This study on bridges based statistical tests shows CRISTAL VI", ICNC 2003.good results in terms of transient bias gains, and even IO) 0. Jacquet, J. Miss, G. Courtois 'MO RET: versionwhen transients are not visible to the naked eye. 43 a multigroup Monte Carlo criticality code",
This preliminary study on automated transient ICNC 2003.suppression allowed to validate the iterative truncationmethodology and some stationarity tests. However, itis necessary to perform an exhaustive study of allstatistics detailed in section 4 (on the series but also onthe ranks series). For instance, a Schruben statisticperformed on the rank series may combine theefficiency of Schruben and Vassilacopoulos tests thatwe noticed thanks to the plan of experiments. It willalso be necessary to build a more efficient model forstatistics distributions than the simple linearinterpolation used.
Finally this plan of experiments and a set ofpractical cases could be used to compare and validateall these improvements.
- 583 -

JAERI-Conf 2003-019 JP0450111
Contribution of the Experimental Validation of the French Criticality-Safety Package 'CRISTAL V1': APOLL02 SN Route
Christophe. VENARD'*, Bernard. CAMOUS', Stdphane MENGELLE 2and Hervd TOUBON 3'Commissariat A I'Energie Atornique - Cadarache, 13108 Saint Paul-lez-Durance cedex, FRANCE
2Commissariat i Energie Atornique - Saclay, 91191 Gif-sur-Yvette cedex, FRANCE3AREVA/COGEMA 2 Paul Dautier, BP 4 78141 Vdlizy , France
Since 1995, the Commissariat A I'Energie Atomique (CEA) and the Institut de Radioprotection et de SfiretdNucidaire (IRSN) in collaboration with the AREVA/GOGEMA Company have been developing a criticality-safety package called'CRISTAL'. The CRISTAL system involves the newest accurate French codes, APOLLO2,MORET4 and TRIPOL14 and uses the JEF2.2 European File. The experimental validation of the VO version ofCRISTAL has revealed some insufficiencies and some parts need to be added. For version VI, the existingcalculation schemes were improved and new ones were conceived. These recommended design calculationroutes were checked by reference code calculations. Then, they were validated against specific criticalityexperiments.
1. Introduction a 99-group or 172-group structure and supports anyanisotropy degree development of the cross-sections.
The French criticality-safety package 'CRISTAL'I'l In the CRISTAL package the 172-group structure iswas developed within the framework of a joint project used.between the CEA, the IRSN and theAREVA/COGEMA company to respond to the needs DESIGN ROUTE REFERENCE ROUTF
of French nuclear industries reduction of theiroperational margins, taking bum up credit intoaccount.
I Depletion calcul onsThe experimental validation of the first version of (DARWrN, CES
this package, CRISTAL VO, highlighted someinsufficiencies (strong under-evaluation of the UPSmultiplication factor k, in the cases of the metal EA93
mediums and the S/A storage configurations) andsome parts need to be added such as slabs S/A cases.The purpose of the new version of CRISTAL, APOLL02
CRISTAL V[21, is to improve the prediction of the Sclf-shieldingFlux calculation, B.'
kff on the field aready covered by CRISTAL VO, and densation and homogenization
to extend it to other configurations found in the uelcycle. r TRIPOL14
APOLL02 Monte-Carlo
Sn calculations �M.nle MCaroEmI4tigroup Continuous Energy2. Presentation of the Criticality-Safety Package [ID, D Geomctri calculations 3D calculations
CRISTAL
The CRISTAL package presented in Figure I Fig. The CRISTAL criticality-safety package
includes two calculation routes an industrial ordesign route (SN or multigroup Monte-Carlo route) The self-shielded and homogenized cross-sectionswith the multiVoup cross section library CEA93 and from APOLL02 are used for Sn calculations or by thethe APOLL02 [31 and MORET4 141 codes, as wall as a multigroup Monte-Carlo code, MORET4, for
reference route using the continuous energy Monte- calculations.Carlo code, TRIPOLI 4t5l. Both routes are based on To take bum-up credit into account, the French fuel
161 depletion codes (CESAR['], DARWIN"") werethe Joint European nuclear data file JEF 22 .The industrial route is based on APOLLO2 a user connected to the CRISTAL package.
oriented, modular code. APOLL02 solves the integralform of the Boltzmann equation through the collision 3. Calculation schemes for the design routeprobability method (Pij method), and/or the integro- 'APOLL02 - Sn'differential transport equation, using the discreteordinates method. The Sn modules were developed to For the design route the calculation includes twoperform large 2D-geometry calculations methods steps such as the Sn-nodal technique, were implemented. creation of the self-shielded and homogenizedThe APOLL02 library, called CEA93, can be used in cross-sections by APOLLO2, using the Pij
method,
Corresponding author, Tel. 33.4.42.25.45.63, Fax. 33.4.42.25.79.79, E-mail : christophe.venard�cea.fr
- 584 -

JAERI-Conf 2003-019
- calculation of the keff on the studied 3.1.2 Homogenization strategy
configurations by APOLL02, using the Sn In order to homogenize arid/or collapse the self-method. shielded cross-sections, the best weighting function
must be found.These two steps require well-assessed calculation - Storage pools of PWR S/A
schemes adapted to each standard configuration of the The studies carried out for the former CRISTALnuclear fuel cycle. The development of these schemes version (VO) recommended a homogenization of theis based on an optimization of the ratio calculation overall PWR S/A. It also highlighted a systematicaccuracy computing time. trend of 600 pcm in flux trap concept (absorber plate
Their definition and their validation are carried out surrounding the S/A) due to the homogenization at theby using design calculation/reference calculation S/A boundary.comparisons. The reference calculation is either the To correct this, the assembly is homogenized byTRIPOL14 calculation, or the rigorous APOLL02 differentiating the peripheral cells from the centralcalculation. cells. Then, the environmental influence on the S/A
peripheral cells is taken into account more effectively3.1 Procedures for the Pij calculation (cf. Table 1).
The Sn and multigroup Monte-Carlo calculation Table 1 : Homogenization effect for storage pool ofaccuracy greatly depends on the validity of the UOX S/Ahomogenized, and potentially collapsed, cross sections.Therefore, special attention is given to the elaboration k.of these Pij procedures. CRISTAL VO CRISTAL V (Pcm)
In this paper, only the mdified and new Water blade 1.17645 1.18290 +548calculation schemes compared to the former version ofCRISTAL 191 are presented: Borated steel 0.93784 0.94579 +848
-storage pools of PWR S/A, blade I
-storage pools of plate-type S/A, - Storage pools of plate-Me S/A-metal medium. The multi-cells modeling used for LATR S/A is not
applicable to the plate-type S/A. The flux calculated3.1.1 Self-shieldingcalculation by the Pij method on the S/A 2D geometry generates
The APOLL02 self-shielding formalism has been very significant computing times. In APOLL02 aextensively validated in the area of reactor physics [101 module automatically determines a spaceby comparison with Monte-Carlo or fine slowing- discretization of the 2D geometry. The analysis of thedown methods. Hence, this validation work is useful flux space variations resulting from a previous Snfor criticality-safety. calculation automatically allows the collapse of the
- Storage pools of PATR S/A initial geometry meshes into flat flux meshes, with aSpecial attention has been given to the impact of given accuracy. The computing time of the Pij
the Dancoff effect at the S/A-water blade boundary. calculation is decreased, while the geometry modelingValidations studies have been carried out by remains in 2D. Table 2 shows the neutroniccomparison with a reference calculation where the parameters and computing time variation versus givenself-shielding of each ftiel pin of the S/A is accuracy on flux. This study was performed on adifferentiated. The main conclusion of these studies is SPERT-D S/Al"I infinite lattice.that an "average self-shielding" model (unique type ofself-shielding pin) is a good approximation the Table 2 Flat flux criterion influence over thediscrepancy with the reference calculation is only +5 neutronic parameters and the co uting timepcm for UOX and MOX S/A. E Meshes CoMp. A" AM2/M2 A.B2/B1 Ak"ff
- Storage pools of plate-jype S/A oog((Di/(Dj)<r) number time(s.) (pcm) (0/6) (pcm)The self-shielding calculation of the plate-type S/A 0 1235 6327.4 - - -
0.025 177 457.9 219 -0.04 0.93 6described by a D geometry requires significant 0.05 73 290.3 424 0.03 1.70 8computing time. The self-shielding calculation on a 0.07 53 253.6 599 0.07 2.36 10ID plane geometry, modeling the perpendicular axis 0.1 37 1 221.6 1554-FO 13 1 6.18 1 21to the plate-type ftiel, very strongly decreases the
computing time without reducing the calculation The optimum accuracy is around 0.05 as shown inaccuracy the discrepancy is only +2 pcm. Figure 2.
- Metal MediumFor the metal mediums, the self-shielding of the
cross sections does not improve the calculationaccuracy in the case of small moderation ratios. Theneutron flux spectrum is fast it is located out of theresonance field.
- 585 -

JAERI-Conf 2003�019
0 (A Q (At/ t) (AtIt) compared to a reference calculation (a S. calculation).
-*-(AB2/M/ (At/t) -X-(AVI�,P WA) The extrapolation to S. is made using the formula of
0.30 ............. .. .. .. . ...... ................ .......... . K ato in ter s of k ff (1)
k�ff (S.) = [4.keff(S2n)-kff(Sn)1/3 (1)0 2 5 ............ ........ .. ............ ................ ......... ..
However, for a very small configuration (radius <L 020 ....... . ........ .... .. 10 cm for a sphere, radius < cm for a cylinder and
half thickness < cm for a plate), the S32 angular5 0.150rder is necessary to obtain a lower discrepancy than
0.10 3 0 pern compared to a S. calculation.R
0.05 3.2.3 Anisotropic scattering
0.00 The CRISTAL VO experimental validation0 0.02 0.04 0.06 0.08 0.1 0.12 0.14 0.16 feedback had shown a kff under-prediction for metal
flatfiwaftMone mediums because of not taking into account the highFig. 2 Neutronic parameters sensitivity to energy anisotropy of the heavy nucleus.
the flat flux criterion Thus, the U and Pu isotopes with P9 expansion
The studies showed that it is necessary to were processed for the CEA93 library. As shown indifferentiate the S/A container, the ends of fuel plates Table 4 studies have led to
_ the use of a P3 modeling of the anisotropicand the peripheral fuel plate and the central fuel region scattering giving accurate results compared to the(cf. Figure 3. P9 modeling.
- The discrepancy with the reference calculation7T77777= (TFJPOL14) being reduced.
Table 4 Anisotropy degree effect for121PU-NET-FAST-001 benchmark[
exact geometry homogenized geometry Anisotropy Ak/k(P9) Ak/k(TRIPOL14)
Fig. 3 Plate-type S/A homogenization order (pcm) (pcm)PO +9679 +9545
The homogenization effect is about 400 pcm. pi -648 -769
P3 -1 -1233.2 Procedures for the Sn route P5 O -122P9 122
In the S method, we have to treat space, angular
and energy variables through discretization. We must 3.2.4 Spatial discretizationalso expand the scattering cross-sections in Legendre In order to respect the criteria (A/X)<2jgjj where Apolynomials. All these discretizations involve some is the mesh spacing, the mean free path and thenumerical inaccuracies that must be assessed against minimum value of 1g,,j in the quadrature set, wereference calculations. recommend:
3.2.1 Energy collapsing - with the S16 quadrature : mesh of I centimeter in
To reduce computing time, the cross sections are the fuel and 0.5 cm at the fuel-reflector boundary,_ with the S32 quadrature (metallic media) mesh
collapsed from 172 energy groups to 20 12 fast of 0.5 centimeter in the fuel and a few millimetersenergy groups, thermal energy groups). The energy at the fuel-reflector boundary.collapsing effect on various configurations is
presented in Table 3 4. Numerical and experimental validation
Table 3 Energy collapsin effect 4.1 Validation databaseConfiguration AU (pc
Bare Pu metallic sphere +22 A large experimental database is used to validateHighly enriched U solution sphere +103 these design route calculation schemes. Critical
UOX S/A storage pools +9 experiments are selected to investigate all thewith borated steel plates operations encountered in the nuclear fuel cycle.
These come from several different sources so as to
3.2.2 Angular discretization avoid systematic errors that might affect a wholeStudies have shown that accurate results can be experimental program provided by a single laboratory.
obtained with a S16 angular discretization. The kff The experiments used for the validation are takenvalues are calculated within 30 pcm accuracy
- 586 -

JAERI - Conf 2003 - 019
from the ICSBEP handbook 131 or carried out in calculation/experiment discrepancies for uranium andFrench experimental facilities. plutonium configurations are respectively 401 ± 113
The validation database of the CRISTAL VI pcm and 713 ± 372 pcm using P3 anisotropy degreepackage for the APOLL02-Sn route contains for the heavy nucleus against respectively 765 ± 161approximately 850 experimental configurations with pcm and 1271 305 pcm, using the PI
- updating of the CRISTAL VO validation approximation.database,
- additional data with experiments involving 200
slabs, arrays of UOX and MOX fuel rods, 0 T Tplate-type fuels, fuel-pin lattices in nitrate -200
solutions, fissile solutions, fissile powders,fissile metal, 400
- specific programs with heterogeneous lattices, _-6WE
- experimental programs dedicated to Bum U S.Credit conducted by the CEA and the IRSNI 14F A-800
COOO
The validation database contains the following -1200 9
experiments classified by type T-1400
- low enriched uranium solutions 33 cases) -1600- high enriched uranium solutions (I 5 cases) Uj W W W- plutonium solutions 121 cases) -18W M X
- mixed uranium and plutonium solutions M CRISTAL VO CRISTAL V1
(32 cases) Fig. 4: U, Pu metal systems - design- high and low uranium powders 69 cases) route/experiment discrepancies- mixed uranium and plutonium powders 33 cases)- array of low enriched UOX pins (I 81 cases) 4.2.2 Storage pools of PWR S/A
- array of MOX pins 60 cases) The PWR S/A storage pool calculation scheme is- array of high enriched uranium pins 9 cases) validated through the analysis of the CRIST02- array of plutonium pins 3 cases) experimenti"3. This experiment is devoted to- array of uranium plate-type fuels (I cases) subcritical high-density fuel storage with different- array of UOX and MOX in fissile solution absorber plates.
(6 cases)- high enriched uranium metallic systems - Numerical validation
(59 cases) Numerical validation is made with UOX and MOX- intermediate enriched uranium metallic systems S/A.
(11 cases) For the UOX S/A case, the design route/reference- plutonium metallic systems 27 cases) route discrepancy is reduced with the CRISTAL VI- mixed uranium and plutonium metallic systems calculation scheme, compared to VO as shown in
(33 cases) Figure 5. There is a systematic bias between thedesign and reference route of about 500 pm.
4.2 Validation results
In this paragraph, the first results of the validationof the CRISTAL VI design route, 'APOLLO-SN'arepresented. These mainly concerns the configurationsin which the calculation schemes were updated orcreated.
4.2.1 Uranium, plutonium metallic systems
Several configurations of plutonium and metaluranium spheres with different reflectors werestudied - HEU-MET-FAST-001, 004, 018, and 020
[13]ICSBEP benchmarks- PU-MET-FAST-001, 004, and 027 CSBEP
[131benchmarksTaking the heavy nuclei high-energy anisotropy
into account clearly improves calculation accuracy,(see the CRISTAL VI curve in Figure 4. The average
- 587 -

JAERI-Conf 2003-019
600 4.2.3 Storage pools of plate-type S/ANumerical validations were made on SPERT-D
400 SW"' infinite lattices with different water blade
200 thickness. Table shows a good agreement betweenTRIPOLI4 (CRISTAL reference route) andAPOLLO2-Sn (CRISTAL design route) calculationresults.
-200
-400 Table 5 : Plate-type S/A storage pool
-600 desi route/reference route comparison
800 * CRISTAL VO Water blade kff ke AkA- Thickness ff-1000 M CRISTAL VI (TRIPOL14) (APOLL02-Sn) (pcm)
1 1.67149 ± 000042 1.67415 +159E
E E 3.175 1.31703 ± 000037 1.31971 +203cr= _U� E EE
-E 5. ConclusionThe objective of the CRISTAL VIE21 package is to
Fig. 5: UOX storage pools improve the prediction of the k on the field alreadydesign route/reference route discrepancies covered by CRISTAL VO, and to extend it to other
configurations found in the fuel cycle.
For the MOX storage pools, the numerical The existing calculation schemes were improvedvalidation highlights an average over-prediction of and new ones were developed. Numerical validationabout 450 pcm for the design route compared to the shows a reduction of design route/reference route
reference route. discrepancies.Moreover, the validation database of the
- ELperimental validation APOLLO2-Sn design route was extended. The firstThe LEU-CONT-THERM-041 benchmark[151 results of the experimental validation sow an
(UOX S/A storage) is studied with the CRISTAL VI improvement of calculation quality compared to thedesign route. The calculation/experiment CRISTAL VO package.discrepancies are coherent with the experimentaluncertainty margins. Tese discrepancies are lower Referencesthan those obtained with the former CRISTAL version, [1] J.M. Gornit, P. Cousinou, A. Duprey, C. Diop,as shown in Figure 6 J.P. Grouiller, L. Leyal and E. Lejeune, "The new
CRISTAL criticality-safety package", Proc. Int. Conf.
1000 On Nuclear Criticality Safety, ICNC'99, Versailles,France, Sept. 20-24, 1999, I, 308 1999)
750 [2] J.M. Gomit, P. Cousinou, G. Fernandez de500 T Grado, F. Gantenbein, J.P. Grouiller, A. Marc, D.250 Mijuin, H. Toubon, "CRISTAL V I
Z_ criticalitypackage for Bum Up Credit calculations",E -250 Int. Conf On Nuclear Criticality Safety, ICNC2003,
-500 Oct. 20-24, 2003, Tokai-mura, Japan-750 [3 S. LoubWe, R. Sanc z, M. Coste, . e ert,
Z. Stankovski, C. Van Der Gucht and 1. Zmijarevic,-1000'APOLLO2 twelve years later", Mathematics and
-1250 computation, reactor physics and environmental
-1500 0 CRISTAL VO analysis in nuclear applications. M&C99 27-30 Sept.-1750 * CRISTAL VI 27-30, 1999, Madrid-2000 f M [4] A. Nouri, A. Le Cocq, J. Dupas, 0. Jacquet
C;r 15 and 1. Vortisch, " MORET4 a versatile and accurateE I
LO E E Monte-Carlo code for criticality calculations", CD-rorn Proc.CN ': 2 EE Int. Conf, On Nuclear Criticality Safety, ICNC'99,8 Versailles, France, Sept. 20-24, 1999, PI 41
[5] J.P. Both and Y. Peneliau, "The Monte-Carlo
Fig. 6: LEU-COMP-THERM-041 TRIPOL14 and its first benchmark interpretations",design route/experiment discrepancies PHYSOR 96 Conf. , Mito, Japan, Sept. 16-20, 1996
[6] "The JEF 22 nuclear data library", JEFFReport 7, May 2000
- 588 -

JAERI - Conf 2003 - 019
[7] M. Sansom, J.P. Grouiller, J. Pavageau P.Marimbeau, J. Pinel, and J.M. Vidal, "CESAR asimplified evolutions code for reprocessingapplications", Proc. Int. Nuclear Conf. On Recycling,Conditioning and Disposal, RECOD 98, Nice, France,Sept. 25-28, 1998, III, 986 1998)
[81 A. Tsilanizara & aL, "DARWIN anevolution code system for a large range ofapplications", ICRS-9, Tsukuba, Japan, Oct., 1999
[9] B. Roque, A. Santamarina, C. Mattera E.Lejeune, "Contribution to the experimental validationof the new French criticality-safety packageCRISTAL" Proc. Int. Conf. On Nuclear CriticalitySafety, ICNC'99, Versailles, France, Sept. 20-24, 1999,11,502 1999)
[10] M. Coste, H. Tellier, P. Ribon, C. Raepsaetand C. Van der Gucht, "New Improvements in theSelf-Shielding Fonnalism of the APOLL02 Code",Mathematical methods and super computing innuclear applications, Karlsruhe, Germany, Apr. 19-23,1993
[I 1] K. Woods, V. Dean, "SPERT-D aluminium -clad plate-type fuel in water, dilute uranyl nitrate, orborated uranyl nitrate", HEU-MET-THERM-006,NEAINSC/DOC(95)03, Sept. 2002
[12] R. D. O'Dell "Bare sphere of plutonium-239metal", PU-MET-FAST-001, NEA/NSC/DOC(95)03,Sept. 2002
[13] "International handbook of evaluatedcriticality safety benchmark experiments",NEA/NSC/DOC(95)03, Sept. 2002
[14] J. Anno, A. Barreau, J.P. Hudelot, E. Girault,P. Fouillaud, H. Toubon, "French fission productsbum Up experiments performed in Cadarache andValduc. Results comparison", Int. Conf. On NuclearCriticality Safety, ICNC2003, Oct. 20-24, 2003,Tokai-mura, Japan
[15] A. Santamarina, "Storage arrays of 3%-enriched LWR assemblies: the CRISTO II experimentin the Eole reactor", LEU-COMP-THERM-041,NEA/NSC/DOC(95)03, Sept. 2002
- 589 -

JAERI-Conf 2003-019 JP0450112
An Algorithm of a- and y-Mode Eigenvalue Calculations by Monte Carlo Method
Toshihiro YAMAMOTO", Yoshinori MIYOSHI1'Japan Atomic Energy Research Institute, Tokai-mura, Naka-gun, baraki 319-1195, Japan
A new algorithm for Monte Carlo calculation was developed to obtain o and y-mode ei-genvalues. The et is a prompt neutron time decay constant measured in subcritical experi-ments, and the is a spatial decay constant measured in an exponential method for deter-mining the subcriticality. This algorithm can be implemented into existing Monte Carlo ei-genvalue calculation codes with minimum modifications. The algorithm was implementedinto MCNP code and the performance of calculating the both mode eigenvalues were veri-fied through comparison of the calculated eigenvalues with the ones obtained by fixedsource calculations.
KEYWORDS. Monte Calro, eigenvalue calculation, prompt neutron time-decay constant,exponential method, spatial decay constant, MCNP
1. Introduction Monte Carlo technique.' ) 2 In MCNP version 4C andits later version, a function of calculating a constant
In subcriticality experiments such as pulsed neutron has already been implemented.')method, reactor noise method, and exponential This paper describes the development of eigenvaluemethod, measured values are a prompt neutron mode calculations for aand ywith a different approachtime-decay constant (i.e., cc) and a spatial neutron de- from the conventional techniques.
cay constant (i.e., y) and so on. For validation of acriticality calculation method, the calculated kff val- 2. Methodology of Eigenvalue Calculationues are compared with experimental keff values if keff The algorithms for obtaining eigenvalues of et and yis identified accurately. In most cases, the experimen- are almost te same as each other. At first, the y-modetal kff is measured in a fissionable system with its calculation techniques are explained and then thecritical state and the value is uniquely determined to et-mode later.be unity. On the other hand, in a system that is alwayssubcritical, the experimental keff values cannot be 2.1 y-Mode Calculationidentified, and a direct comparison of kff values is not It is assumed that a subcritical multiplicative sys-possible for validating.the criticality calculation tools. tem with an external neutron source has a uniformAn alternative method of validation is to compare a media in one direction, and that the horizontal buck-constant measured in subcritical experiments. In the ling is larger than the material buckling. Then, thefield of criticality safety, kff values are usually calcu- asymptotic neutron flux distribution in the direction islated by Monte Carlo method. Thus, it follows that the given by exp(-yz), and the three-dimensional neutronmeasured constants have to be calculated by Monte transport equation is rewritten in a two-dimensionalCarlo method for validating the calculation tool. Cal- form asculations of these constants by Monte Carlo techniqueare usually performed by neutron transport calcula- Q Vo(x, y, f2, E) + E, (x, y, E)O(x, y, 0, E)
tions with a fixed neutron source. These constants can fd1:2jdE'0(x, y, CY, E')Y., (x, y, CT-+ C1, E' E)be obtained by simulations of the pulsed neutron + XE)method or exponential experiment method. These dE'O(x, y, CY, E')vEf (x, y, E')simulations, however, require long computating time 4;r fand cumbersome variance reduction techniques. These + �yo(x, y, C2, E),
constants can alternatively be calculated by solving where is a directional cosine between te z-axis andeigenvalue equations in which the eigenvalue is ct or y. the direction of neutron flight and other notations areSolving eigenvalue equation is much easier than the standard. To take account of the last term in Eq.(l)Monte Carlo simulations of subcritical experiments during the random walk of Monte Carlo calculation,since the calculation techniques are fundamentally the weight of a neutron particle that flies by the lengthidentical to the criticality calculations for obtaining of ds is changed aseigenvalue kff. dW = �y ds. (2)
There have been several attempts to develop ei-genvalue calculation methods for a constant with Thus, after the flight of a length s, the initial weight
Corresponding author, Tel. +81-29-282-6743, Fax. +81-29-282-6798, E-mail: yamamoto,�me1odytokaijaerLgojp
- 590 -

JAERI-Conf 2003-019
WO is changed to W y-mode calculation. The equation to be solve for
where W= WO exp(�),s) (3) a-mode calculation is written as
The y value is given fi7om the previous cycle. The C1 V O(r,!�I, E) E (r, E)O(r, 6, E)
track length TLj after the i-th flight of the length s is dE'O(r, CY, E')E, (r, CY-> C1, E'- E)given by fA�l f (8)
TL = WO exp(�i ysi') dsi' + XP(E) fdC2JdE'O(r,!5', E')vpl;f (r, E')fo (4) 4)r
= WO (exp(�j ysi) - (�iy). + a O(r, 0, E) / v(E),
If a neutron collides with a nuclide and fission is pos- where r is a three-dimensional position vector andsible, n fission sites at each collision are stored for use v(E) is a neutron velocity with energy E. This equa-as fission source in the next cycle, tion is very similar to Eq. (1) except that the geometrywhere is three-dimensional and �y in the last term in Eq.(1 is
n = WF(Uf /,71) random number. (5) replaced by a/v(E). The algorithm shown in Sec. 21
As seen in Eq.(1), the second term in the right-hand can be utilized for cc-mode eigenvalue calculation byside for fission reaction is not divided by kff unlike replacing 4y with a/v(E). Since the eigenvalue to becriticality calculations. Thus, note that Eq.(5) is not solved is a prompt neutron time-decay constant, thedivided by keff, either. number of fission neutrons used in this calculation
All modifications to conventional Monte Carlo must be for a prompt fission. If MCNP is used for thecriticality calculation codes, which are required for the a-mode eigenvalue calculation, "totritt no" option hasrandom walk process in a -mode eigenvalue calcula- to be used.tion, are Eqs.(3) and (5) only. All other procedures in
a criticality calculation can be utilized for a y-mode 2.3 Verification of Algorithmeigenvalue calculation without any modifications. The algorithm of a- and y-mode eigenvalue calcu-
After all random walk processes in one cycle are lations developed in this paper is verified here. c ei-terminated, y-eigenvalue are esimated as genvalues were calculated in a one-dimensional infi-
nite slab by Monte Carlo method and a deterministicy = (N + Y, AW - 1, vEf TL )I, TLi -� 6 method for completely the same conditions, and the
where eigenvalues were compared with each other. 3-energyi is summed over all track lengths in a cycle, group constants were used and an isotropic scatteringN= number of source histories per cycle, was assumed. The deterministic calculations wereAW= W(exp(�iysj)-l)1(�ir)-WO_ performed with ONENDANT code 4) with S24 angular
The y-eigenvalue calculated by Eq. 6) and the fission quadrature. The multi-group Monte Carlo calculationssites determined by Eq. (5) are used for calculation in were performed with the same group constants as inthe next cycle. Like criticality calculations, the deterministic calculations. Both calculations werey-eigenvalues are averaged over all active cycles after performed under the same conditions except that theskipped cycles to determine a fal y-eigenvalue. approximations of angular and spatial discretizations
were taken in the deterministic calculations. In TableHowever, using the y-eigenvalue calculated by Eq. 6). 1, the calculated cc eigenvalues by both methods arein Eq.(3) causes unstable y-values for use of the next listed for different slab thicknesses. The Monte Carlocycle due to the large variations of y-eigenvalue cal- calculations used 7050 generations at 3000 neutronsculated by Eq. 6). In some cases, too many fission per generations. Fifty generations were skipped beforesites are generated and the calculation is abnormally averaging, resulting in 21 million histories. The resultsten-ninated. Hence, it is recommended that the of the Monte Carlo method agree with the determinis-y-eigenvalue for use in the next cycle be calculated by tic ones within the statistical uncertainties. The algo-
,Y = (N + Y,, A Wi vYf TLi + 1, TLi rithm of the Monte Carlo calculation for a andy-mode eigenvalues is judged to give correct solutions
(7) for Eqs. (1) and (8).
where rp is the y-eigenvalue in the previous cycle.Since Eq.(l) is a two-dimensional equation in terms of Table I Calculated a values by Monte Carlo methodgeometry, the Monte Carlo calculation for solving a and deterministic method.y-eigenvalue is performed for a system which is infi- Slab cc (/sec)
nite and uniform in the z-direction. thickness Monte Carlo ONEDANT(cm)
2.2 a-mode Calculation 14 3564 7* 3574The cc-mode eigenvalue calculation in Monte Carlo 16 1410 7 1423
technique can be performed in a way analogous to the *one standard deviation
- 591 -

JAERI-Conf 2003-019
Ap = AAa, (9)
This algorithm of a and y-mode eigenvalues can the underestimation of a value is deemed to be 16 ± easily be implemented into existing Monte Carlo (/sec).criticality calculation codes with minimum modifica-
tions. The capability to calculate a- and y-mode ei- Table 2 Measured and calculated cc values in STACYgenvalues was implemented into MCNP code. water-reflected core.
Solution Subcritic Measured Calculated3. Application of a- and y-mode Eigenvalue Calcu- height alitylations to Suberitical Experiments (cm) M a /sec) a (/sec)
46.70 0 122 4* 107 ± 203.1 x-mode Eigenvalue for STACY 42.23 2.4 392 7 374 ± 1
Prompt neutron time-decay constants were meas- 40.20 3.7 539 16 1 533 � 20ured with pulsed neutron method in the subcritical *one standard deviationexperiments of the Static Experiment Critical Facility
(STACY) at Japan Atomic Energy Research Insti- Considering the bias of -16 5 (/sec) in the calculatedtute.') The experimental case used for the calculations a values and the statistical uncertainties, the agree-in this paper is Run No. 29, and its core configuration ments of the calculated a values with the measuredis a water-reflected 60-cm-diamter cylindrical core ones are satisfactory. The standard deviations seem totank as shown in Fig. . This benchmark model is pub- be relatively large as compared to the a values. How-lished in the International Handbook of Evaluated ever, for example, the uncertainty of a values of 20Criticality Safety Benchmark Experiments of
6) The fuel is wt.% enriched uranyl (/sec) is equivalent to the uncertainty of k ofOECD/NEA . 0 I %Ak, which accounts for the uncertainty of the anitrate solution with uranium concentration of290.4g/f. The critical solution height is 46.70 cm values. The calculation of a for subcriticality of
2.4$ was run by 4000 neutrons per cycle. The transi-tion of a values in each generation up to 300-th cycle
no 25 is shown in Fig.2. The initial neutron sources wereVftw distributed uniformly within the fuel solution.
M
*--300--o -3004 1500
1300 -------------------- -------Average value- - - - - - - - - - - - - - - - -
IND 900 - - -
'a 700
500
M Z3 300
h.Wt100
-100T 20 -300 - - - - - - - - - - - - - - -
Do- . T -J -500 10 50 100 150 200 250 300
Fig. I Benchmark model of 60-cm-diameter cylindrical Cycle [-]core tank. Fig.2 Transition of calculated a vales in each cycle.
The fmal average value is 3 74 II (/sec).The measured and calculated a values are shown inTable 2 The calculated cc values were obtained by 3.2 y-mode Eigenvalue for STACYa-mode eigenvalue calculations of the modified For verification of the y-mode eigenvalue calcula-MCNP 4C with a continuous energy cross-section tion method, the y-mode eigenvalues were calculatedlibrary based onJENDL-3.2. The cross section library for STACY's experimental conditions by the Monteused for 235U, however, was based on JENDL-3.1 be- Carlo eigenvalue calculations and the fixed sourcecause JENDL-3.2 gives too high kff's for homogene- calculations simulating exponential experiments Theous enriched uranium systems. The calculated kff for calculations were performed for a 28-cm-thicknessthe critical condition is 100096±0.00032, and the slab core tank of STACY without water-reflector. Theprompt neutron generation time is 6.2x 10⁻⁵ sec. Thus, horizontal cross sectional view of the tank is shown inthis calculation system slightly overestimates the real- Fig.3. Fixed source calculations were performed for aistic experimental condition by 0.096%Ak. This over- system that is sufficiently long in the vertical direction.estimation corresponds to the underestimation of A neutron source was placed at the bottom of the sys-value. Using the relationship between Ap and Aa; tem and the exponential decay of neutron in the verti-
cal directions was calculated. The calculation system
- 592 -

JAERI-Conf 2003-019
was divided into planar slices with the thickness of 1 2)I _K�2 + B. (10)
cm. The neutron flux was represented by the accumu- k,,fflated track length within the slice. The calculated track where
length as a function of the vertical distance from the K (CM2) = buckling-reactivity conversion factor,source is shown in Fig.4 for Run No. 199 in which the 2 2uranium concentration was 268.7g/i. This condition of B, (cm- vertical buckling.the uranium concentration and the horizontal geome- While the K value can be measured at a critical statetry makes the system subcritical even for an infinite from the differential reactivity worth with respect tolength in the vertical direction. Figure 4 shows that the the solution height, the K value has to be obtained byeffect of higher order mode fluxes is seen near the calculation for subcritical states. The calculation or.
y 7)neutron source. The decay constant y was obtained b obtaining the K value requires an adjoint flux , makfitting the vertical neutron distribution in the region ing the Monte Carlo calculation for the K value diffi-where the higher order mode fluxes apparently decay. cult. However, the K value can be calculated by
Monte Carlo techniques as
Tank wall'---, K = Ilk- _ Y,_2 (I )eff
69.03 where
28.08 k' = kff value for a system which is infinite in the2.53 eff
Fuel solution vertical direction,
Dimension in mm y= yvalue calculated by Monte Carlo eigenvaluemode calculation.
Fig. 3 Horizontal cross sectional view of slab core Therefore, the eigenvalue mode calculation for y istank of STACY. The material of the tank is 304L usable for obtaining the K value by Monte Carlo tech-stainless steel. niques. If a yvalue is measured experimentally, the kff
of the system would be obtained using Eq.(10) and
lo, the K value.
Table 3 Comparison of values by fixed source and102 - ---------------------- igenvalue calculations.
Uranium Fixed EigenvalueRun concentra- source calculation
101 ---------------- it WE -------- No. tion calculation (/cm)also" (9/0 y (/cm) y
199 268.7 338 + 12* 330±110.1 - 1 150 453±12 453 ± I
0 20 40 60 80 100 120 140 160 *one standard deviationDistance from neutron source (cm)
4. ConclusionFig. 4 Vertical neutron flux distribution calculated bysimulation of exponential experiment for Run No. An algorithm in which a- and y-mode eigenvalues199. can be calculated by Monte Carlo technique was de-
veloped in such a way that modifications to conven-The verification calculation was also performed for tional Monte Carlo codes can be minimized. The al-
the STACY's slab core tank as shown in Fig.3 with gorithms for both eigenvalue mode calculations arethe uranium concentration of 150g/f. This is a hypo- very similar to each other. This algorithm was verifiedthetical condition for verification work, and the ex- by comparing a-eigenvalues between the Monte Carloperiments were not performed for this condition. The method and a deterministic method for an infinitedecay constant in the fixed source calculation was one-dimensional slab. This algorithm was imple-obtained in the same manner as in Run No. 199. The y mented into a continuous energy Monte Carlo codevalues calculated by the eigerivalue mode and fixed MCNP4C.source calculations are given in Table 3 The y values Using the modified version of MCNP with theobtained by both methods agree well within one stan- capability of the new eigenvalue calculation algorithm,
dard deviation. Consequently, the y-mode eigenvalue the a-mode eigenvalues for STACY experiments in acalculation method developed here is considered to water-reflected 60-cm-diameter cylindrical core tankaccurately give fundamental mode decay constants in were calculated and compared with measured a values.the exponential experiments. Taking into consideration the difference in kff be-
Once a ) value is determined, the kff of the system tween MCNP and experiment, the agreements be-is given by tween the calculated eigenvalues and the measured
- 593 -

JAERI-Conf 2003-019
values were satisfactory. celerated neutral particle transport code system,"The y values obtained by the eigenvalue calcula- LA-12969-M 1995).
tions and the fixed source calculations of MCNP 5) K.Tonoike et al., "Kinetic parameter Pff/� meas-agreed well with each other, and the y-mode eigen- urement on low enriched uranyl nitrate solutionvalue calculation of MCNP was also considered to be with single unit cores (600�, 280T, 800 � ofverified. The calculations of a buckling-reactivity con- STACY," J.Nucl.Sci.Technol., Vol.39, No.11,version factor, which is difficult to obtain with Monte 1227 2002).Carlo methods, can be facilitated by using a y-mode 6) T.Yamamoto et al., "Water-reflected 10% enrichedeigenvalue. uranium nitrate solution in a 60-cm-diameter cy-
lindrical tank," in nternational Handbook ofReferences Evaluated Criticality Safety Benchmark Experi-1) D.Brockway et al., "Monte Carlo a calculation," ments,"LEU-SOL-THER-004,NEAINSC/DOC
LA-UR-85-1224 1985). (95)03, Organization for Economic Corporation2) D.K.Parsons, "Alphalike calculations with and Development Nuclear Energy Agency.
MCNP," Trans.Am.Nucl.Soc.,84, xxx 2001). 7) T.Suzaki, "Subcriticality determination of3) "MCNP-A General Monte Carlo N-particle trans- low-enriched U02 lattices in water by exponential
port code, version 4C," LA-13709-K J. F. Briesmeis- experiment," J.Nucl.Sci.Technol., Vol.28, No.12,ter Ed. 2000). 1067 1991).
4) R.E.Alcouffe et al., "DANTSYS: A-diffusion ac-
- 594 -

JAERI-Conf 2003-019
TOPIC 6
EVALUATION OF NUCLEAR ATA

This is a blank page.

JAERI-Conf 2003-019 JP0450113
New Evaluation of ... U Neutron Resonance Parameters
Herve DERRIEN', Luiz C. LEAL and Nancy M. LARSONOak Ridge National Laboratory, Oak Ridge, 3 7831 TN, USA
The neutron resonance parameters of ... U were obtained in the energy range I keV to 20 keVfrom a SAMMY Reich-Moore analysis of high resolution transmission measurementsper-formed at ORELA. In the energy range I keV to IO keV, the analysis used as prior valuesthe ENDF/B-V1 resonance parameters. The analysis in the energy range 10 keV to 20 keVresulted in the creation of a set of resonance parameters for the representation of the crosssection in this energy range. The results are compared to the ENDFIB-VI evaluation. Somestatistical properties of the new resonance parameters are examined.
KEYWORDS: nuclear reaction, neutron, cross section, evaluation, statisticalproperfies
1. Introduction 2. The experimental data and the method ofanalysis
Inconsistencies in the resonance parameters and inthe measured capture cross sections of "'U have been The results of the ... U high resolution neutrona longstanding problem. In order to solve the transmission experiments of J.A. Harvey et al. werediscrepancies, a task force was set up by the Nuclear published at the Mito (Japan) conference in 1988.1)Energy Agency (OECD, Paris, France) in 1982. The The measurements were performed in the energy rangeresults of the task force were published in 1992 by M. I keV to I 0 keV on the 200-m flight path with sampleG. Sowerby; a set of resonance parameters was thicknesses of 0 1748,0.0396 and 001235 atoms/barnobtained in the energy range from thermal to 10 keV of 31U, with a very low experimental background.and adopted by the most important evaluated data Several neutron monitors allowed the determination oflibraries. More recently, it was found, from the analysis the normalization coefficient with an accuracy of aboutof various thermal reactor benchmarks, that the 2U 0.5%; the systematic error on the normalizedcapture cross sections could still be overestimated 2) a transmission was smaller than 1.reexamination of the resonance parameters in the low The analysis of the experimental transmission dataenergy range should be made. On the other hand, the was performed with the computer code SAMMV)high resolution neutron transmissions measured by This code uses the Reich-Moore formalism for theJ.A. Harvey et al.3) at ORELA (Oak Ridge Electron calculation of the cross sections. The fit to theLinear Accelerator) should allow the determination of experimental data, taking into account the experimentalthe resonance parameters in the energy range 10 keV effects (Doppler and resolution broadening, selfto 20 keV, for a better accuracy in the calculation of shielding, multiple scattering, background andthe self shielding factors and of the average value of normalization corrections, etc.), is obtained by Bayesthe capture cross section. method. A parameter covariance matrix is generated.
The aim of this paper is to present the results of the Several sets of experimental data can be analyzedresonance analysis of the Harvey transmission data in successively, the output covariance matrix of onethe energy range from I keV to 20 keV. In Section 2 sequence being used as input in the next sequence.of this paper, a short description of the experimental The average spacing of the "'U s-wave neutrondata and of the method of analysis is given. The resonances is about 21 eV. The current ENDF/B-VIresults of the analysis are given in Section 3 Some resonance file contains 473 s-wave resonances andstatistical properties of the parameters of the energy I 29 p-wave resonances for the description of the crossrange 10 keV to 20 keV are examined in Section 4 sections in the energy range eV to IO keV. Most of
the p-wave resonances are not seen in the low energyrange of the experimental data, due to the small valueof the penetration factor; the parameters of those smallresonances could only be guessed from the Wignerdistribution of the level spacings and the Porter-Thomas distribution of the reduced neutron widths.About 20% of the p-wave resonances are missing in the
Corresponding author, Tel. 865-574-7268, Fax: 865-576-3513, E-mail: derrienh�oml.gov
- 597 -

JAERI-Conf 2003-019
ENDF/B-VI file. At higher energy more p-wave potential scattering cross section, 47rR", is found to beresonances could be seen, and the number of constant over the energy range analyzed.resonances needed for the representation of the A free gas model of the Doppler broadening with anexperimental data in the energy range 10 keV to 20 effective temperature of 300±5 K was used in thekeV should be larger. Moreover, at high energy the analysis of the transmission data. The experimentalcontribution of the p-wave resonances to the capture resolution was approximated by a Gaussian function,cross section increases rapidly and the identification of with an exponential tail to take into account themost of these resonances becomes essential for an asymmetrical part due to the neutron moderator and toaccurate calculation of the capture cross section. the neutron detector. The parameter of the exponential
Because of the extremely large number of tail was adjusted to obtain the best fit of some isolatedresonances (and the consequent large amount of resonances or groups of resonances in the high energycomputer time required, especially for calculating part of the data.multiple-scattering corrections for capture crosssections), it was necessary to perforin the SAMMY 3. The results of the analysisanalysis in two separate pieces. In the energy rangefrom I keV to 10 keV the ENDF/B-VI parameters 3.1 The energy range from I keV to 10 keVwere used for starting values, and in the energy range The analysis of the Harvey transmission data wasfrom IO keV to 20 keV the priorvalues were obtained performed in the energy range I keV to I keV byusing the code RSAP.') The code RSAP creates a set using the ENDF/B-VI resonance parameters as priorof parameters by searching the energies of the dips in values to SAMMY. In this energy range the ENDF/B-the experimental transmission data and by attributing VI parameters were mainly obtained from analysis ofa neutron width value correlated to the area of the dips. the transmission data of Olsen et al.') by Sowerby )The code is directly connected to SAMMY for a with the Harwell code REFIT." The data of Harveypreliminary crude fit of the data. About 400 have better experimental resolution; hence betterresonances were identified by RSAP in the energy accuracy was obtained in the present work for therange 10 keV to 20 kV, corresponding to the largest resonance parameters in the energy range above keV.s-wave resonances and to some large p-wave The neutron widths of the two ENDF/B-VI fictitiousresonances. Small resonances were identified by eye resonances at 4400 eV and 14484 eV were readjustedobservation of the graphs of the thick sample at 129.35 keV and 204.36 keV, respectively, comparedtransmission, and added to the RSAP set. to 108.55 keV and 196.83 keV in ENDF/B-V1, with an
Results of capture cross section measurements with effective scattering radius of 9.45 frn. This adjustmentexperimental resolution comparable to the Harvey allowed the agreement between the calculated and thetransmission resolution were not available in the experimental average transmission to be within the 1%energy range 10 keV to 20 keV. The data of de experimental accuracy. The values of the total andSaussure et al.,') taken at ORELA in 1973 on a 40 m capture cross section at 00253 eV obtained with theflight path, show fluctuations corresponding to new resonance parameters were 938 b and 269 b,unresolved clusters of resonances in the high energy respectively, compared to 936 b and 272 b inrange. Nevertheless, the effective capture cross ENDF/B-V1. The thermal values were adjusted bysections calculated by SAMMY with the resonance modifying the parameters of an additional fictitiousparameters obtained by fitting the Harvey transmission resonance at 7 eV.could be compared to the de Saussure experimental The average values of the capture and elastic crossdata; from this comparison, a significant number of sections calculated from the present evaluation aresmall p-wave resonances, not seen in the transmission compared to the ENDF/B-VI values in Table 1, in thedata, could be taken into account. energy range I keV to 10 kV. On the average, the
Because there are strong potential resonant capture cross section is 38% larger and the elasticinterference effects in even-even nuclei [analogous to cross section is 28% larger than the ENDF/B-VIthe X/ I +X2) function in the single level Breit-Wigner values.formalism], the contribution of remote resonances isimportant in the total cross section of 21U . Thereforeit is necessary to include in the R-matrix. calculationnot only those resonances lying within the energyrange currently being analyzed, but also thecontribution from resonances outside that energy range(the external" resonances). A judicious choice of afew fictitious external resonances provides a goodapproximation to that contribution. Several methodsare available for the determination of the parameters ofthese external resonances.',') A good set of fictitiousexternal resonances is obtained if the effective
- 598 -
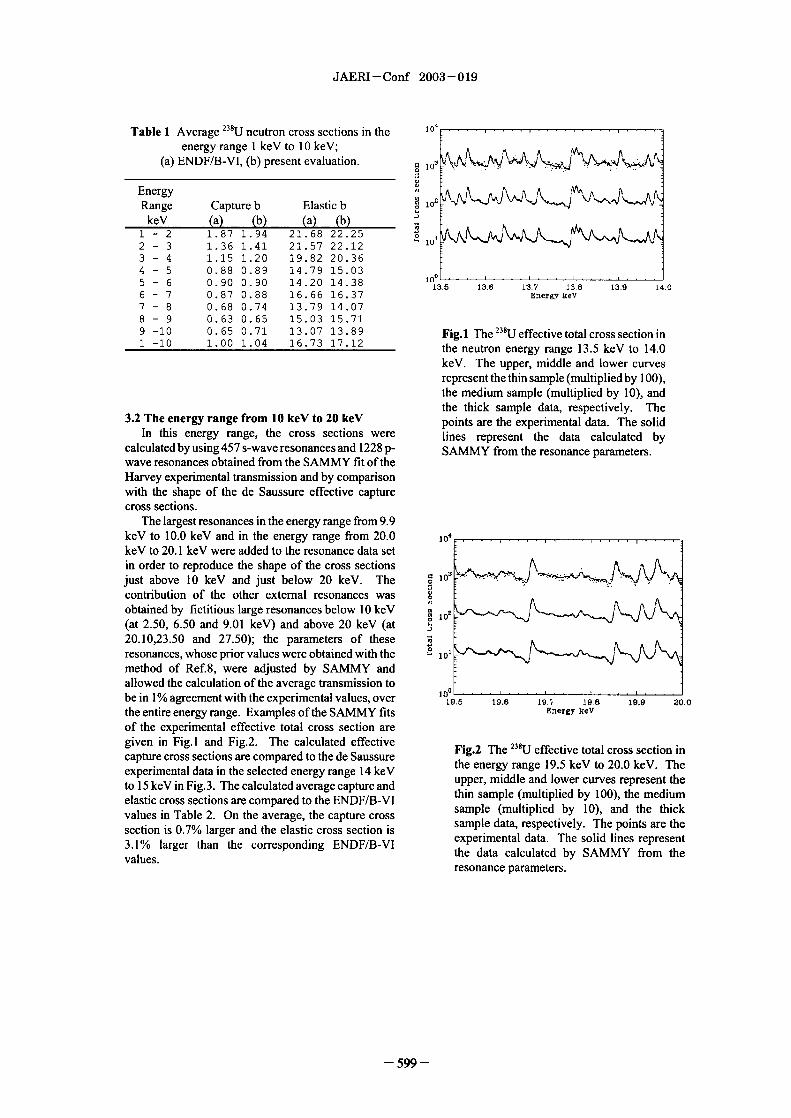
JAERI-Conf 2003-019
Table I Average 238 U neutron cross sections in the 10' -energy range I keV to IO keV;
(a) ENDF/B-VI, (b) present evaluation. 0 103
EnergyRange Capture b Elastic b 102 - \,A,
keV (a) (b) (a) (b)1 2 1 . 87 1 . 94 2 1 . 68 22 25 IO,2- 3 1.36 1.41 21.57 22.123- 4 1.15 1.20 19.82 20.364- 5 0.88 0.89 14.79 15.035- 6 0.90 0 90 14.20 14 3 no13.5 13.6 13.7 '�.8 I3.9 14.06- 7 0.87 0.88 6 6 6 6 3 7 Energy I�v7- 8 0.68 0.74 13.79 14.078- 9 0.63 0.65 15.03 15.719-10 0.65 0.71 3 7 13.89 Fig.1 The MU effective total cross section in1 1 0 1 . 0 0 1 4 6 7 3 7 . 2 the neutron energy range 13.5 keV to 14.0
keV. The upper, middle and lower curvesrepresent the thin sample (multiplied by I 0),the medium sample (multiplied by 10), andthe thick sample data, respectively. The
3.2 The energy range from 10 keV to 20 keV points are the experimental data. The solidIn this energy range, the cross sections were lines represent the data calculated by
calculated by using 457 s-wave resonances and 1228 p- SAMMY from the resonance parameters.wave resonances obtained from the SAMMY fit of theHarvey experimental transmission and by comparisonwith the shape of the de Saussure effective capturecross sections.
The largest resonances in the energy range from 99keV to 10.0 keV and in the energy range from 20.0 1 4. . . . . . . .
keV to 20.1 keV were added to the resonance data setin order to reproduce the shape of the cross sections 0,just above 10 keV and just below 20 keV. Thecontribution of the other external resonances wasobtained by fictitious large resonances below IO keV -,. lo'(at 250, 650 and 901 keV) and above 20 keV (at20.10,23.50 and 27.50); the parameters of theseresonan .0
ces, whose prior values were obtained with themethod of Ref.8, were adjusted by SAMMY andallowed the calculation of the average transmission to lool . . . . . . . .be in I% agreement with the experimental values, over 19.5 19.6 1 V. 19.8 19.9 20.0
the entire energy range. Examples of the SAMMY fits Energy cevof the experimental effective total cross section are
given in Fig. and Fig.2. The calculated effective Fig.2 The 21% effective total cross section incapture cross sections are compared to the de Saussure the energy range 19.5 keV to 20.0 keV. Theexperimental data in the selected energy range 14 keV upper, middle and lower curves represent theto 15 keV in Fig.3. The calculated average capture and thin sample (multiplied by 100), the mediumelastic cross sections are compared to the ENDF/B-VI sample (multiplied by 10), and the thickvalues in Table 2 On the average, the capture cross sample data, respectively. The points are thesection is 07% larger and the elastic cross section is experimental data. The solid lines represent3.1% larger than the corresponding ENDF/B-VI the data calculated by SAMMY from thevalues.
resonance parameters.
- 599 -

JAERI-Conf 2003-019
Table 2 Average ... U capture cross sections in the101 energy range 10 kV to 20 keV;
(a) ENDF/B-VI, (b) present evaluation
2
EnergyRange Capture b Elastic b10' I A keV (a) (b) (a) (b)
�AO 10-11 0 71 0. 68 4 67 4 7211-12 0. 68 0. 65 4 3 13 9112-13 0.66 0.65 14.40 15.3213-14 0.64 0.72 14.29 14.5614-15 0.62 0.62 14.18 15,54
14.0 14.2 14.4 14.6 14.8 15.0 1 5 1 0. 60 0 . 5 8 4 9 4 60Energy ,eV 1 6- 7 0. 5 8 0. 5 8 4 0 1 3 7 9
17-18 0.57 0.58 13.93 16.2518-19 0.55 0.53 13.86 14.57
Fig. 3 The 2U effective capture cross 1 9 2 0 . 54 0 . 52 3 7 9 12 91
section in the neutron energy range from 14 10-20 0 . 1 . 1 4 1 4 62
keV to 15 keV. The eror bars represent the
experimental data of de Saussure et al. The According to the 2J+l law ofthe level density spinsolid line represents the results ofa SAMMYcalculation using the resonance parameters. dependence, the number of J 12 p-wave resonances
should be roughly the same as the number of the s-
wave resonances and the number of J=3/2 p-wave
resonances should be twice this number. Aside from
4. Statisticalpropertiesofresonanceparametersin this rule, spin assignments were made quite arbitrarily
the energy range 10 keV to 20 keV because the shape of the transmission data is not
sensitive to the spin assignment of the p-wave
4.1 The number of resonances and the spin resonances. However, in some cases the area ofthe p-
Th:ssignments wave resonances in the capture cross sections could
average level spacing of the mixed s-wave and depend strongly on the spin assignment; a small
p-wave resonances should be about 53 eV, if one number of spin assignments could be made using this
assumes that the average level spacing of the s-wave property from the de Saussure capture data in the
resonances is 21 eV. Ideally, the calculation of the energy range 10 keV to 20 keV. The final set of
cross section in an energy interval of 10 keV should resonances obtained in the present evaluation contains
use about 470 s-wave resonances and about 1400 p- 457 s-wave resonances, 403 p (J=1/2) resonances and
wave resonances. Below 10 keV there are 473 s-wave 825 p (J=3/2) resonances; this choice, while not
and 1129 p-wave resonances in the ENDF/B-VI unique, is consistent with the (2J+1) dependence.
evaluation; the 20% missing p-wave resonances are
small resonances not seen in the experimental
transmission data, nor in the experimental capture data, 4.2 The level spacing distribution
and have no effect on the accuracy of the calculated The distribution of the s-wave resonance spacings
cross sections. The set of resonances obtained in the in the energy range 10 keV to 20 keV is compared to
present evaluation in the energy range 10 keV to the Wigner distribution in Fig. 4 showing good
20 keV contains 457 s-wave and 1228 p-wave agreement between the experimental data (histogram)
resonances; 35% ofthe s-wave resonances and 14% of and the theoretical distribution (solid line). Figure
the p-wave resonances could be missing; but those shows the spacing distribution corresponding to the
missing resonances are also small and have no effect mixed families of the p-wave resonances; the solid line
on the accuracy of the calculated cross sections. represents the superposition of two uncorrelated
The ... U resonances have spin and parity J=1/2' Wigner distributions in the ratio of the population of
for the s-waves and J= 1/2- or J=3/2- for the p-waves. the two spin states. The agreement between the
The identification of the largest s-wave resonances is experimental and the theoretical distribution is
possible from the asymmetry due to the potential- particularly good.
resonant interference effect. All of the resonances
which cannot be identified as s-wave resonances from
their shape had to be distributed among 3 families:
small s-wave resonances, 1/2- p-wave resonances and
3/2- p-wave resonances.
- 600 -

JAERI-Conf 2003-019
0.20 0.15 -
0 15
0.10
0.05
(.001 2 L 2 3 4
x�D/<D> X�D/ D>
Fig. 4 The distribution of the s-wavc level Fig. The distribution of the p-wave levelspacings in the energy range 10 keV to 20 spacings in the energy range 10 keV to 20keV. The histogram represents the keV. The histogram is the experimentalexperimental distribution. The solid line is the distribution. The solid line is the sum of twoWigner distribution. uncorrelated Wigner distribution in the ratio
of the population of the two p-wave states.
4.3 The neutron strength functions and thedistribution of the neutron widths
The neutron strength function of angular The differential distributions of the reduced neutronmomentum I is usually calculated with the following widths gV. of the energy interval IO keV to 20 keV arerelation: compared with the Porter-Thomas distribution in Fig.6
Si 1/(21 1/ AE) YgF,, and Fig.7 for the s-waves and the p-waves,respectively. The agreement between the experimental
where is the reduced neutron width of a resonance and the theoretical distribution of the s-wave valuesof angular momentum The symbol means that all shows that the s-wave resonance set is nearly complete.the reduced neutron widths are summed in the interval The distribution of the p-wave values shows a lack ofof energy AE. The reduced neutron widths for 10 (s small values, as expected.waves) and for I =1 (p waves) are calculated with therelations:
I,% = r. /E 112
r',= (r�E`2) (I +P) 0.4
P= I k2a2and a 13 5A 1/3
where a is the nuclear radius, A the atomic mass, and 0.3
k the neutron wave number.The s-wave and p-wave strength functions
calculated with the resonance parameters of the energy O.Zinterval 10 keV to 20 keV are, respectively:
S, = (L 120 ± 0074) x IO' 0.1S = 1.693 ± 0068) x IO-
The values calculated from the ENDF/B-VI resonanceparameters in the energy range eV to I keV are(0.947 ± 007) x IO' and 1.577 ± 006) x IO' for S, 1 2 3 4
and S, respectively. Our value of S, in the IO kV to x-W1dth/AvCraee dth
20 keV interval is significantly larger than the
ENDF/B-VI value. The difference could be due to the Fig. 6 The differential distribution of theuncertainties in the resonance spin assignments; a reduced nutron widths of the s-wavesignificant number of p-wave resonances could be mis- resonances in the energy range 10 keV toassigned s-waves. These values for S, and can be 20 kcV. The histogram represents thecompared with results from an as-yet unpublished experimental distribution. The solid line isstatistical model fit of the average total cross section in the corresponding Porter-Thomasthe energy range 10 keV to 100 keV, in which the distribution.authors of this paper obtained values ofS,=(1.077±0.016 x 10⁴ and S,=(1.846±0.03 1) x 10-4.
- 601 -

JAERI-Conf 2003-019
0.4 - Acknowledgments
0.3 The evaluation was performed in the framework ofthe Nuclear Criticality Program at the Oak RidgeNational Laboratory. The authors are grateful to J. A.
0.2 -Harvey for fruitful discussions concerning theexperimental conditions of the transmission
0.1 experiments. The work was sponsored by the Office ofEnvironmental Management, U.S. Department of
0.0 Energy under contract DE-AC05-00OR22725 with1 2 3 4 UT-Battelle, LLC.
X=Widlh/A�erage Wifth
References
Fig. 7 The differential distribution of thereduced neutron widths of the p-wave 1) M. G. Sowerby, "Summary of the work on theresonances in the energy range IO keV to 20 NEANDC task force on 211U ",NEANDC-313"U",keV. The histogram represents the (1994).experimental distribution. The solid line is 2) A. Courcelle, NEA WEPC sub-group 22 on Uthe corresponding Porter-Thomas evaluation 200 1).distribution. 3) J. A. Harvey, N. W. Hill, F. G. Perey, G. L.
Tweed, and L. Leal, "High Resolution6. Conclusions Transmission Measurements on 231U 29pU , and
238U ", Nuclear Data for Science and Technology,Very high resolution neutron transmission May3O-June3, 1988,MitoJapan(1988).
measurements, performed at ORELA, were analyzed in 4) N. M. Larson, Updated Users' Guide forthe neutron energy range I keV to 20 keV with the SAMMY, ORNL/TM-9179/R6 2003).computer code SAMMY. The new set of resonance 5) R. 0. Sayer, "RSAP A code for Display ofparameters gives higher elastic cross sections and Neutron Cross Section Data and SAMMY Fithigher capture cross sections than ENDF/B-VI, in the Results", ORNL- TM-2001/15, 2001); ORNL-energy range I keV to IO keV. In the energy range IO TM-2003/133(2003).keV to 20 keV, where the cross sections in ENDF/B_ 6) G- de Saussure, E. G. Silver, R. B. Perez, R.VI are calculated from average resonance parameters Ingle, H. Weaver, "Measurement of the 3U(unresolved resonance range), the present analysis is Capture Cross Section for Incident Neutronthe first attempt of a resolved resonance representation Energy up to I 0 keV", ORNL-TM-4059,(1973).of the cross sections. The set of parameters obtained in 7) F. H. Froehner and 0. Bouland, "Treatment ofthe energy range IO keV to 20 keV has about the same External Levels in Neutron Resonance Fitting.statistical properties as the one in the to 10 keV Application to the Nonfissile Nuclide 12 Cr", Nucl.energy range. It allows the calculation of the average Sci. Eng. 137, 70 2001).effective total cross section with about 1% accuracy 8) H. Derrien, "R-matrix Analysis of ... Pu Neutroncompared to the Harvey experimental data, and of Transmission and Fission Cross Section in thecapture cross sections in agreement with the Froehner Energy Range 1.0 keV to 25 keV", J. Nucl. Sci.evaluation,") with an accuracy of about 3%. Tech. 30 9 845(1993).
The present evaluation will allow better accuracy in 9) D. K. Olsen, G. de Saussure, R. B. Perez, E. G.the calculation of the self shielding factors in the Silver, F. C. Difilipo, R. W. Ingle, and H. Weaver,energy range 10 keV to 20 keV. It is expected that "Precise Measurement and Analysis of Neutronimprovements will be obtained in the thermal reactor Transmission Through Uranium-238", Nucl.benchmark calculations. The accuracy in the Sci..Eng. 62, 479 1977).multiplication factor k,, calculations will improve due 10) M. C. Moxon, "REFIT, A Least Square Fittingto more accurate calculated cross sections. A Program for Resonance Analysis of Neutroncriticality safety calculation for a nuclear system with Transmission and Capture Data", AEA-Intec-0470an energy spectrum that peaks in the intermediate (1991).energy region requires accurate cross sections in the 11) F. H. Froehner, "Evaluation of the Unresolvedresolved energy range; the results of the present Resonance Range of ... 'U", Nucl. Sci. Eng. 103,evaluation should improve the accuracy of the 119 1988).criticality safety calculations.
- 602 -

JAERI-Corif 2003-019 JP0450114
Unified Description of Neutron-, Proton- and Photon-induced
Fission Cross Sections in Intermediate Energy Region
Tokio FUKAHORI', Osamu IWAMOTO and Satoshi CHIBAJapan Atomic Energy Research Institute, Tokai-mura, Naka-gun, lbaraki-ken 39-1195 Japan
For an accelerator-driven nuclear waste transmutation system, it is very important toestimate sub-criticality of core system for feasibility and design study of the system. Thefission cross section in the intermediate energy range has an important role. A programFISCAL has been developed to calculate neutron-, proton- and photon-induced fission crosssections in the energy region from several tens of MeV to 3 GeV. FISCAL adopts thesystematics considering experimental data for Ag- 243Am. It is found that unified descriptionof neutron-, proton- and photon-induced fission cross sections is available.
KEYWORDS: fission, cross section, intermediate energy, systematics, neutron, proton,photon, nuclear data, un�fled description
1. Introduction If we adopt the description using fission probabilityaccording to excitation energy of the first compound
For an accelerator-driven nuclear waste nucleus, same trend can be seen for neutron- andtransmutation system, it is very important to estimate photon-induced fission reactions. Therefore, wesub-criticality of core system for feasibility and assumed that unified description of neutron-, proton-design study of the system. Neutron spectra in the and photon-induced fission cross sections can besystem are similar to those of fast reactors with about used.3% high energy tails. To estimate an effect of these For estimating intermediate energy fission crosshigh energy neutrons, fission cross section in the section, a program FISCAL has been developed tointermediate energy range has an important role as calculate neutron-, proton- and photon-inducedwell as the emitted neutron number per fission fission cross sections in the energy region fromreaction and fission neutron spectrum. On the other several tens of MeV to 3 GeV. The FISCAL adoptshand, experimental studies of fission cross section are the systematics considering experimental data ofrecently available. However the experimental data neutron-, proton- and photon-induced fission crossare not enough for actinide nuclei, especially for sections for "tA g_24'Am 29 isotopes).minor actinides. In addition, non-actinide heavynuclei are also made fission reaction by intermediate High-Energy Fission Cross Seclionenergy neutrons and protons. For example, lead and p allbismuth have fission threshold energies around 50 i 011:Mev. Theoretical approaches have not been - 238u Lachieved to explain such fission cross sections inintermediate energy region acc urate enough, . / / 232Thunfortunately. In this paper, reported is asemi-empirical approach of unified description for 20913-neutron-, proton- and photon-induced fission crosssections in the energy region from several tens ofMeV to 3 GeV. 10-2r
LL 208Pb2. Systematic Trend of Fission Reaction
Intermediate energy fission probability, which is a 197 Aun
ratio of fission cross section to total reaction cross atAgsection, has following trends, as shown in Fig.1 for Biproton-induced fission reaction. Ta
• The shapes of fission probability are similar 10-41 . - -- - - - . I -]for wide mass range from Ag to U. 106 1 B I 010
• The shape has saturation plat home and the ExcRation Energy [eV]value of heavier element is getting larger. Fig. I Energy Dependence of Fission Probability
• Threshold energy shape can be observed and (Fissility) by Intermediate Energy Protonsthe value of heavier element is getting lower.
Corresponding author, Tel. 81-29-282-5907, Fax. +81-29-282-5766, E-mail: fukahori�ndc.tokaijaeri.gojp
- 603 -

JAERI-Conf 2003-019
The systematics can be written by using following High-Energy Fission Cross Sectionequations; p + Pb-206
10 0 I I IT fill I I T II Itt
Pf,,(ZA.E)= pj1-expt-p,(E-P2))1lo-'
p =[I+ expli(q, - x) q,
pi = exp(qi I qi (i 2,3, X Z2 A) 10-2.2X) .02
C.0 lo-3
where P1j,' is fission probability (=CTfdCYR), rIj., and CTR
are fission and total reaction cross sections, Z and A izare atomic and mass numbers of first compound 10-4
nucleus, E is excitation energy, and q, is fittingparameters. The behavior of pi parameter is shownin Fig.2. The systematics can reproduce the trend of 10-506, 1 II] 11L_ I I I I I "L_ I I I I I UI I I I I 11pi parameter behavior. The obtained parameter 1 1 7 108 109 1010
systematics is summarized in Table 1. Excitation Energy [eV]High-Energy Fission Cross Section
p + P-207100
lo-,
0. -10-2
0P+pE 0.6 - a.co
U+n .2 10-3
0.4 - 209Bi+p
1950.2 - Pt+P 10-4
SystematicsBpst it F�ararneter0 - 1 10-5
34 36 38 40 III UL_ I I I 'Iji- I I I I I 111'30 32 2 1061 10 7 106' lo,, 1010
Z /A Excitation Energy [eV]Fig.2 Z21A dependence ofpi parameter
High-Energy Fission Cross Sectionp + P-208
100
Table I Obtained Parameter Valuespi lo-, A0
qj., 34.9 32.3 -35 9M.2 0.650 -0.861 0. 9 H7 10-2
0 Z
10-30
As seen from eq.(l), PI parameter showsU_saturation value of fission probability and has a trend
10-4that heavier elements are easier to occur fissionreaction. P2 parameter looks like threshold energyof fission reaction and has the lower value for heavier 10-5 I Wit- I I I I
elements. This fact has no contradiction with PI 106 lo7 i 08 1 9 1 010
parameter. Excitation Energy [eV]
3. Results and Discussion Fig.3 Comparison of proton-inducedfission probabilities (solid line) for lead
The results calculated by above systematics are isotopes with experimental datacompared with experimental data of proton-, neutron- (symbol)and photon induced fission reaction below.
- 604 -

JAERI-Conf 2003-019
High-Energy Fission Cross Section High-Energy Fission Cross Sectionp, + U-233 p, + Th-232
100 100 I W illi I 1 11114
lo-,
Z.
:5 10-2 10-2
M Xa.
a. .0 10-3 XC10-30
LL
U. 10-4 10-4
X
X
''M ill I 1111111 10-5 U' -lo-51 '�7 a 09 010 07' '"'ju�a' '1111109 1010
06 i 116 1 1 106 1
Excitation Energy [eV] Excitation Energy [eV]
High-Energy Fission Cross Section High-Energy Fission Cross Section
p + U-235 loo p + Np-237100 I (file
Io-,
Z.
10-210-2 .0'O0
a.a.00 io-3
lo-410-4
I G5 di "jL-7 L%8
10-5 061 I IIJL_ i I IIIILJL� I I 11J. I I IIII I
1 le 10a 1 09 1010 Excitation Energy [e\ii"]
Excitation Energy [eV]
High-EnergY Fission Cross Section High-Energy Fission Cross Sectionp, + U-238 p, + Pu-239
100 = I 11111111 I I I100 -T-TTIIIIII _-M M ITI, I I I
-7
lo-, +lo-,
.0
M10-2 .0M
0.2
0 CL10-3 10,30
EVM
10-4 10-4
orl I ''I LIL_ JL_ 1 o-5 I m in I 10
10-5 71 I 11111108 1 10101 1 0 109 I or lo,
Excitation Energy [eV] Excitation Energy [eV]
Fig.4 Comparison of proton-induced fission probabilities (solid line) for actinide elementswith experimental data (symbol)
- 605 -

JAERI - Conf 2003-019
3.1 Proton-induced Fission Reaction accelerator-driven system development. TheThe calculated results for proton-induced fission calculated result using present systematics can be
probabilities of lead isotopes are compared with compared these recent data.experimental data in Fig. 3 The systematics can Many of experimental data of neutron-inducedreproduce all experimental data well. Comparing fission reaction are measured as ratio to ... U(nf)within the isotope, Z21A dependence can be observed reaction. So, 235U neutron-induced fission crossand lighter isotope has larger fission probability and section is necessary as standard cross section tolower threshold energy. convert experimental ratio into absolute cross section.
Comparison of proton-induced fission probabilities At first, this cross section has been evaluated asfor actinide elements with experimental data is shown shown in Fig.5. Though there are a lot ofin Fig.4. The calculated results have good experimental data below 20 MeV, only data measuredagreement with experimental data, except at the by Lisowsky') at Los Alamos National Laboratorythreshold energy region of a few nuclides. (LANL) are shown here, since these data wereComparl within the uranium isotope (left half of measured in the widest neutron incident energy range.Fig.4), ZIA dependence can be observed same as The evaluation adopted JENDL-3.3 data below 20lead case (Fig.3), except 231U . General agreement MeV, standard cross section 2) evaluated bywith experimental data is better than experimental International Atomic Energy Agency (IAEA) in thedata uncertainty. It is necessary to obtain more energy range between 20 and 90 MeV andprecise experimental data set. For 232 Th result, it is preliminary result calculated by FISCAL above 90hard to conclude "good agreement" since MeV, respectively. The smooth cross section hasexperimental data have discrepancy each other and been obtained in the wide incident energy region. 235U,
even some data exceed .O. However the calculated For other actinide nuclides thanresult can reproduce most experimental data above 20 neutron-induced fission cross section is oftenMeV. For Np and Pu, the calculated results are measured as ratio to 235U(nf) reaction as mentiondagree with experimental data within enough accuracy, above. Recently those data were measured bythough experimental data is not enough and Shcherbakov3) at Petersburg Nuclear Physics Institutediscrepant. (PNPI). These data are compared with the result
There are rather many experimental data for calculated by present systematics as well as LANLproton-induced fission reaction of wide mass range measurements in Fig.6. For th 'e calculated results,nuclides, though there is discrepant data for some the data obtained from Fig.5 were used to calculatednuclides. However we conclude that the present fission cross section ratio. The present calculationsystematics can reproduce most of proton-induced can reproduce well the both experimental data offission experimental data with enough accuracy. actinide nuclides from 112 Th to 21'Np shown in Fig.6,
except 23'Np case. This is caused by that the3.2 Neutron-induced Fission Reaction saturation values of fission probability of 21'Np is
Experimental data for neutron-induced fission about 10% larger. The maximum value of Pi inreaction are much less than proton one. On the eq.(]) must be changed from unity.other hand results of such measurements can be Though there are not enough data available forobtained recently, in order to get fundamental data for neutron-induced fission reaction, the present
systematics can predict the experimental data within10% accuracy, except higher actinide nuclides.
3.3 Photorission Reaction2.5 I 235 Experimental data for photofission reaction are
JENDL-13 U(nj) sparse, except those of 235,238U, since photoabsorptionC Lisowsky LANL) et al.
- Present Evaluation cross section is 12 orders smaller than totalC 2 - nucleon-induced reaction cross section even in the
FISCAL giant resonace energy region. Here, onlyof 235,231U
photofission cross sections calculated byt e present systematics are compared with
I.- 1. - IAFA id experimental data.U
20 MeV 90 MeV Figure 7 shows comparison photofission crosssections between the present calculation,experimental data 4-11) and JENDL Photonuclear Data
I 00 102 103 File, (JENDL-PD). In the present calculation,I lo, photoabsorption cross section of JENDL-PD was
Incident Neutron Energy [MeV] used to derive absolute photofission cross section
Fig.5 Evaluated result of 235U(nfis) reaction from fission probability calculated by the presentcross section up to 3 GeV systematics. From Fig.7, Though overestimation
for 238U and underestimation for 235 U are observed at
- 606 -

JAERI-Conf 2003-019
21 f)/21 233U(n,0/211U(nj)0 'Th(n, 'U(no
0.5-
Shcherbakov' ShcherbakovU 0 Lisowsky Lisowsky
- best fit p best fit param..---- Sys systematics
50 100 150' 200 50 I& . . . . 0' 20f 0
Neutron Energy [NleV] Neutron Energy [MeV]
I . . . . . . . . . . . . . . . . . . . . . . . . . . . . . . . .238 237NP(nj)/23.5U(nj)
0 U(Nf)/"'U(nj).
0---------------
Shcherbakov0 Lisowsky
best fit pararn. ShcherbakovU U Lisowsky
Standard File beat' fit param.----- systematics
50 . . .I 060. . . 150 260 5' . . . .too 15'0'
Neutron Energy [MeV] Neutron Energy [MeV]
Fig.6 Comparison of calculated neutron-induced fission ratio with experimental data
the peak energy, agreement of three data is good in experimental data within 10% accuracy, thegeneral. prediction accuracy of FISCAL calculation can be
Though compared results only for 235,239 U, it can assumed in the similar level. By this systematics,be concluded that the present systematics can predict the prediction of fission cross sections in thefission probability for photofission reaction with intermediate energy region can be evaluated and onereasonable accuracy. of nuclear data useful for the sub-criticality
estimation will be available.
4. SummaryAcknowledgements
Semi-empirical approach was done for fission The authors wish to thank Prof. T. Ohsawa ofprobability prediction of neutron-, proton- and Kinki University, Drs. T. Nakagawa and A. Hasegawaphoton-induced fission reactions in the intermediate of Nuclear Data Center of Japan Atomic Energyenergy region. The results calculated by the present Research Institute for their helpful discussion.systematics can mostly reproduce experimental data.From this approach, it can be concluded that unified Referencesdescription of neutron-, proton- and photon-induced 1) P.W. Lisowskyi, J.L. Ullmann, S.J. Balestrini,fission probability is possible. A.D. Carlson, O.A. Wasson and N.W. Hill:
A program FISCAL has been developed to "Neutron Induced Fission Cross-Section Ratioscalculate neutron-, proton- and photon-induced for 232Th, 235,238U 27NP and 219pU from I to 400
fission cross sections in the energy region from MeV", Proc. of nt. Conf. on Nucl. Data for Sci.several tens of MeV to 3 GeV by using the present and Technol., May 30-June 31988, Mito Japan,systematics. Since the results calculated by pp.97 1988).FISCAL code have good agreements with available 2) H. Wienke (Ed.); "Update to Nuclear Data
- 607 -

JAERI-Conf 2003-019
Standards for Nuclear Measurements",INDC(NDS)-368,(1997). 400 2351
3) 0. Shcherbakov, A. Donets, A. Evdokimov, A. U(gfis)Fornichev, T. Fukahori, A. Hasegawa, A. Laptev, Ostapenko et al.V. Maslov, G. Petrov, S. Soloviev, YU. r- 300- . Caldwell et al.
Tuboltsev and A. Vorobyev: "Neutron-induced . Lepretre et al.Fission of ... U, "'U, 232 Th, 239 Pu, 237 Np, natPb to 200- Ries et al.and 209Bi Relative to 2U in the Energy Range rA
JENDL-PDF1-200 MeW, J. Nucl. Sci. Technol., Suppl 2 0230 2002). U Present
4) Yu.B. Ostapenko, G.N. Smirenkin, A.S.
Soldatov, Yu.M. Tsipenyuk, Phys. Rev. C24, X
529 1981). 60 go 100
5) J.T. Caldwell, E.J. Dowdy, B.L. Berman, R.A. Gaffuna-ray Energy [MeV]
Alvarez and P. Meyer, Phys. Rev. C21, 1215 21ILj(gf-(1980). IS)
6) A. Lepretre, H. Beil, R. Bergere, P. Carlos, J. TOC - 0Veissiere et al.E 0Ostapenko et al,
Fagot, A. De Miniacnd and A. Veyssiere, AKoreckaja et al.
Nucl. Phys., A367, 237 1981). Caldwell et al.
7) H. Ries, et al., Phys. Lett. B139, 254 1984). Bernabei et al.0Mafta et al.
8) A. Veyssiere, H. Beil, R. Bergere, P. Carlos, A. C4) TLepretre et al.L IN-
Lepretre and K. Kernbath, Nucl. Phys. A199, 45 xn VRies et al.0 JENDL-PDFa- -
(1973). u Present9) I.S. Koreckaja, et al., Yad. Fiz. 30, 910 1979).
10) R. Bernabei, et al., Nuovo. Cimento AIOO, 131
(1988).
11) O.Y. Mafra, S. Kuniyoshi and J. Goldemberg, 60- to I 0Nucl. Phys. A 186, 110 1972). Gamma-ray Energy [MeV]
Fig.7 Results for photofission reaction of23'U and 211U
- 608 -

JAERI-Conf 2003-019 JP0450115
Analysis of Evaluations of Neutron Cross-Sections for Structural and Technological Materials Nuclei
Vladimir P. GORELOV, Andrei N. GREBENNIKOV, Vladimir 1. IL'YIN,Nicolai A. KRUT'KO, Gennadiy G. FARAFONTOV
Russian Federal Nuclear Center - All-Russian Scientific Research Institute of Experimental Physics(RFNC-VNIIEF), Sarov, Nizhny Novgorod region, Russia
For 55 non-fissioning nuclei from hydrogen to bismuth there are presented results of analysisof different evaluations of neutron cross-sections in an effort to find out their correspondence toaccumulated measurement results. The analysis makes it possible to specify the evaluation ofcross-sections (for a specific nucleus) that can be recommended for the use in practicalapplications as the one that mostly agrees with measurement results. The results of analysis can betaken into consideration with constants support of programs of numerical solution of appliedproblems of atomic power.
1. Introduction used for specific nuclei with several available versionsFor several decades in different countries there of any evaluation or several revisions of the fixed
were conducted works on measurements of cross- version.sections of interactions of neutrons with nuclei from The latest data were used for a specific nucleusmaterial compositions which are applied or can be with several available versions of any evaluation orapplied in atomic power. The results of measurements several revisions of the fixed version.were used when evaluating or calculating these cross- The experimental results corresponded to thesections, in an effort to create as complete libraries of collection!) In the diagrams we used the results ofcross-sections as possible to be employed when measurements for the specific energy of the neutronsolving applied problems of atomic power. impacting a stationary nucleus-target in the form of
Nowadays the processes of experimental data two values:
accumulation and renewal of existing libraries CS.. = 07exp + 5cexpnoticeably slow down. This makes it possible to thinkthat the bases of experimental and evaluated neutron CSmm = Cexp go-expcross-sections have been practically filled.
Such conditions create a premise for analysis of The value yXP a published measured value, 8aXPdifferent evaluations of neutron cross-sections in an - an error of measurements. Values CS. and CS.,i,,effort to fd out their correspondence to the limit the region of cross-section values agreeing withaccumulated measurement results. The expediency of measurement results. As a rule, there were taken intoanalysis performance is conditioned by the fact that its consideration only those among the papers listed in [IIresults can be taken into account with constants where the measurements eor was specified. Only insupport of programs of numerical solution of atomic rare cases we broke this rule due to the desire either topower applied problems. avoid gaps in the measurement result array or to have
In the proposed paper the results of such an not one measurement results group but several groupsanalysis for 55 non-fissioning nuclei from hydrogen to obtained in different laboratories. The error frombismuth performed at RNFC-VNIIEF will be another work was ascribed to corresponding datapresented. where studied cross-sections were measured at close
2. Description of analysis procedure and its results energy interval or from the work fulfilled in theThe analysis of quality of different evaluations of similar period (years).
neutron cross-sections for stable nuclei with a number At availability of resonance structure andof protons from Z=1 (hydrogen) up to Z=83 (bismuth) insufficiently low energy resolution AE for severalas well as tritium was carried out mainly through nuclei the evaluations of average cross-sections weregraphic comparison of energy dependencies compared to the measurement results. For the givencorresponding to them with the results of differential energy E the average cross-section was calculated by
the formulae:measurements.
As evaluations there were considered evaluations E,
(or evaluation libraries) ENDL-78 and ENDL-82 fa(E)G(e, E, AE)dc(USA), revision 2 and 3 of JENDL-3 (Japan)
E,evaluation, versions 45 and 6 of ENDF\B (USA) C(E) - E2 (2)evaluation and revisions 12,3 and 4 of version 6 ofthe same evaluation, versions 2 and 3 of JEF fG(c, E, AE)dcevaluation (European Union), evaluations CENDL-2 E,
(Korea) and BROND-2 (Russia). The latest data were
- 609 -

JAERI-Conf 2003-019
where a(E - energy dependence of studied evaluation evaluations. A set of measurement results of totalof specific cross-section, G(e, E, AE - normal interaction cross-section was the most complete one
distribution of the value with expectation E and for each of nuclei.standard error s related to E with a simple formulae. Comparison of evaluations of cross-sections of
different reactions on different nuclei with results of
AE differential measurements and with recommended= - (3) values provided visual representation of the quality of
2VIn4) each of these evaluations in specific energy intervals.This allowed specifying of the evaluation that can be
When obtaining this formulae it is assumed that recommended for the use in practical applications asAE is width of normal distribution at its half-height. the one most consistent with measurement results and
The low limit of El integration equals the minimal with recommended values.energy of impacting neutron in the considered We present the table I in which analyzedevaluation, and the upper limit E2 equals the maximal evaluations of neutron cross-sections are listed and aneutron energy in the same estimate. recommended evaluation is specified for every studied
For the specific nucleus there were studied all nucleus. The table I sums the results of the performed
processes for which the collection') contained the analysis.results of measurements and whose cross-sections had
Table - List of analyzed and recommended evaluations of neutron cross-sections for nucleus fromhydrogen to bismuth
X2 Z nucleus*) analyzed evaluations of neutron cross- recommended evaluationssections of neutron cross-sections
I ENDL-82, JENDL-3.3, ENDF/B-6.4, JEF- ENDF/13-6.43, CENDL-2, BROND-2
2 1 H (D) ENDL-78, JENDL-3.3, ENDF/B-6.3, JEF- ENDF/B-6.3
I 3, CENDL-2, BROND-23 1 H (T) ENDL-82, ENDF/13-6, JEF-3, BROND-2
CENDL-2, BROND-24 2 -- 'He ENDL-82, JENDL-3.3, ENDF/B-6.1, JEF- CENDL-2
3, CENDL-2, BROND-25 2 IH e ENDL-82, JENDL-3.3, ENDF/13-6, JEF-3, JENDL-3.3
CENDL-2, BROND-26 3 -- Ti ENDL-82, JENDL-3.3, ENDF/B-6.1, JEF- BROND-2
3, CENDL-2, BROND-27 3 -- Ti ENDL-82, JENDL-3.3, ENDF/13-6, JEF-3, ENDF/13-6
CENDL-2, BROND-28 4 ENDL-7 8, JENDL-3.3, ENDF/13-6. 1, JEF- ENDFiB-6.1
3, CENDL-29 5 ENDL-82, JENDL-3.3, ENDF/13-6. 1, JEF- ENDF/B-6.1
3, CENDL-210 5 __rrB ENDL-82, JENDL-3.3, ENDF/B-6. 1, JEF- ENDF/13-6.1
3, CENDL-2I 1 6 C JENDL-3.3, ENDFIB-5, ENDF/13-6. 1, ENDF/13-6.1
BROND-2, JEF-312 7 ENDL-82, JENDL-3.3, BROND-2, JEF-3
ENDF/13-6. 1, JEF-3, CENDL-213 8 ENDL-82, JENDL-3.3, BROND-2, ENDF/13-6.2
ENDF/B-6.2, CENDL-214 9 F ENDL-82, JENDL-3.3, ENDF/B-6.1, JEF- JENDL-3.3
3, CENDL-2, BROND-215 1 1 __TFNa ENDL-82, JENDL-3.3, ENDF/13-6. 1, JEF- ENDF/13-6.1
3, CENDL-216 12 Mg ENDL-82, JENDL-3.2, ENDF/13-6, JEF-2, ENDF/13-6
JEF-3, CENDL-21 7 13 A I ENDL-82, JENDL-3.3, ENDF/13-6. 1, JEF- ENDF/13-6.1
2, CENDL-2
- 610 -

JAERI-Conf 2003-019
18 14 Si ENDL-82, JENDL-3.2, ENDF/B-6, JEF-2, JENDL-3.2CENDL-2
19 15 31P ENDL-82, J EN DL-3.3, ENDF/B-6. 1, CENDL-2CENDL-2, BROND-2
20 16 s JENDL-3.2, ENDFIBA CENDL-2, JEF-3 CENDL-221 17 Cl ENDL-82, ENDF/B-6, JEF-3, CENDL-2, CENDL-2
BROND-240
22 18 Ar ENDL-82, JENDL-3.3, JEF-3 JENDL-3.323 19 K ENDL-82, JENDL-3.2, ENDFIB-6, JEF-2, CENDL-2
JEF-3, CENDL-224 20 4oCa JENDL-3.2, JENDL-3.3 JENDL-3.225 20 Ca ENDL-82, JENDL-3.2, ENDF/B-6, CENDL-2
ENDF/B-6. 1, JEF-2, JEF-3, CENDL-226 22 Ti ENDL-82, JENIDL-3.2, ENDF/B-6, JEF-2, JENDL-3.2
JEF-3, CENDL-227 23 v ENDL-82, JENDL-3.3, ENDF/B-6. 1, JEF- CENDL-2
3, CENDL-228 24 Cr ENDL-82, JENDL-3.2, ENDF/B-5, JENDL-3.2 HAK CENDL-2
CENDL-229 25 Mn ENDL-82, JENDL-3.3, ENDF/B-6.2, JEF- ENDF/B-6.2
2, JEF-3, CENDL-230 26 Fe ENDL-82, JENDL-3.2, ENDF/B-5, CENDL-2
CENDL-231 27 JENDL-3.2,ENDF/B-6.1,JEF-3,CENDL- CENDL-2
232 28 Ni ENDL-82, JENDL-3.2, ENIDF/B-5, CENDL-2
CENDL-233 29 Cu ENDL-82, JENDL-3.2, ENDF/B-5, JEF-2, JENDL-3.2
CENDL-234 30 Zn CENDL-2, BROND-2, JEF-3 CENDL-235 3 Ga ENDL-82, ENDL-3.2, ENDF/B-6, JEF-2, JENDL-3.2
JEF-336 40 Zr ENDL-82, ENDF/B-6. 1, EF-2, CENDL- CENDL-2
2, BROND-237 41 Nb ENDL-82, JENDL-3.3, ENDF/B-6.1, JEF- ENDF/B-6.1
3, CENDL-2, BROND-238 42 MO ENDL-82, ENDL-3.2, ENDF/B-6, EF-2, JENDL-3.2
CENDL-239 47 Ag JENDL-3.2, CENDL-2 JENDL-3.240 48 Cd ENDL-82, JENDL-3.2, ENDF/B-6, JEF-2, JENDL-3.2
CENDL-241 49 In ENDF/B-6, CENDL-2 ENDF/B-642 50 Sn ENDL-82, CENDL-2, BROND-2 ENDL-8243 51 Sb JENDL-3.2, CENDL-2 CENDL-244 63 Eu ENDL-82, JENDL-3.2, ENDF/B-5 JENDL-3.245 63 D'Eu JENDL-3.3, ENDFIB-6, JEF-3 JENDL-3.346 63 JENDL-3.3, ENDF/B-6. 1, JENDL-3.3
BROND-2,JEF-347 64 Gd ENDL-82, ENDF/B-4, BROND-2 BROND-248 72 Hf ENDL-82, JENDL-3.2, ENDF/B-6, ENDF/B-6
CENDL-249 73 'x'Ta ENDL-82, JENDL-3.3, ENDF/B-6, JEF-2, CENDL-2
JEF-3, CENDL-250 74 w ENDL-82, JENDL-3.2, ENDF/B-6. 1, ENDF/B-6.1
CENDL-25 1 75 Re BROND-2 BROND-252 78 Pt ENDL-82, JEF-3 ENDL-82
- 611 -
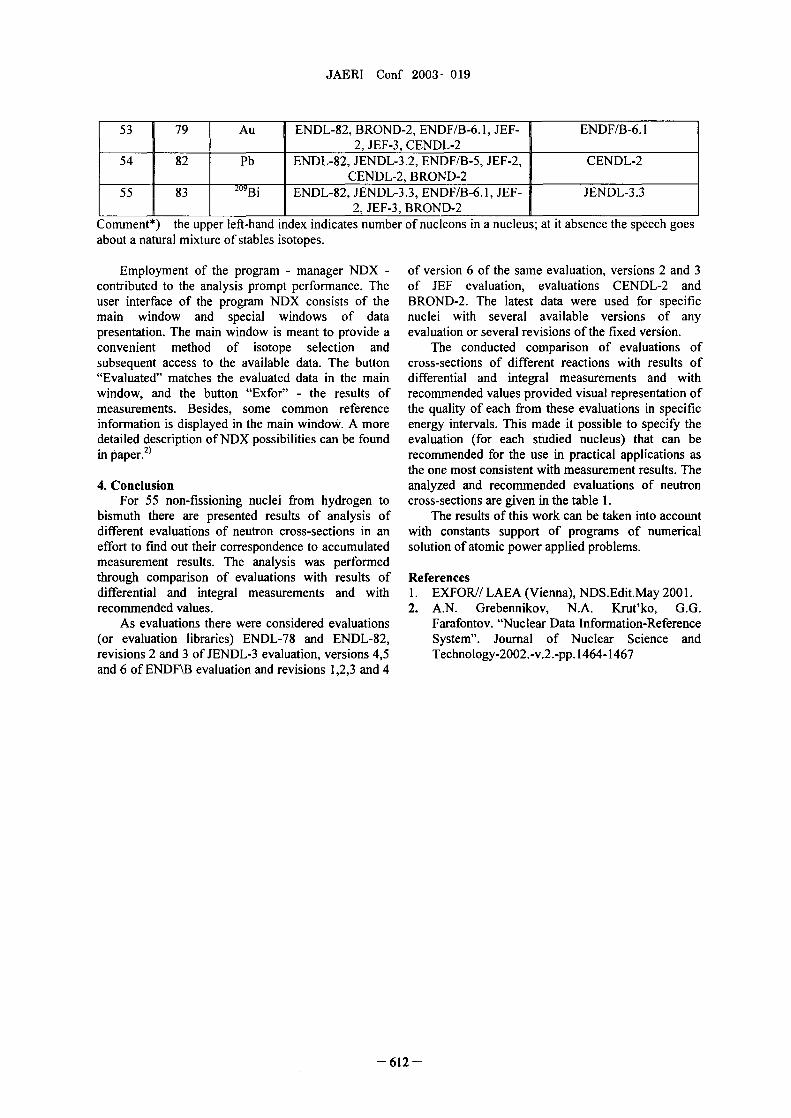
JAERI-Conf 2003-019
53 79 Au ENDL-82, BRON D-2, ENDF/B-6. 1, JEF- ENDF/13-6.12, JEF-3, CENDL-2
54 82 Ph ENDL-82, JENDL-3.2, ENDF/B-5 ' JEF-2, CENDL-2CENDL-2, BROND-2
55 83 ENDL-82, JENDL-3.3, ENDF/13-6. 1, JEF- JENDL-3.32, JEF-3, BROND-2
Comment*) - the upper left-hand index indicates number of nucleons in a nucleus; at it absence the speech goesabout a natural mixture of stables isotopes.
Employment of the program - manager NDX - of version 6 of te same evaluation, versions 2 and 3contributed to the analysis prompt performance. The of JEF evaluation, evaluations CENDL-2 anduser interface of the program NDX consists of the BROND-2. The latest data were used for specificmain window and special windows of data nuclei with several available versions of anypresentation. The main window is meant to provide a evaluation or several revisions of the fixed version.convenient method of isotope selection and The conducted comparison of evaluations ofsubsequent access to the available data. The button cross-sections of different reactions with results of"Evaluated" matches the evaluated data in the main differential and integral measurements and withwindow, and the button "Exfor" - the results of recommended values provided visual representation ofmeasurements. Besides, some common reference the quality of each from these evaluations in specificinformation is displayed in the main window. A more energy intervals. This made it possible to specify thedetailed description of NDX possibilities can be found evaluation (for each sudied nucleus) that can bein paper.') recommended for the use in practical applications as
the one most consistent with measurement results. The4. Conclusion analyzed and recommended evaluations of neutron
For 55 non-fissioning nuclei from hydrogen to cross-sections are given in the table .bismuth there are presented results of analysis of The results of this work can be taken into accountdifferent evaluations of neutron cross-sections in an with constants support of programs of numericaleffort to firid out their correspondence to accumulated solution of atomic power applied problems.measurement results. The analysis was performedthrough comparison of evaluations with results of Referencesdifferential and integral measurements and with 1. EXFOR// LAEA (Vienna), NDS.Edit.May 2001.recommended values. 2. AX Grebermikov, N.A. Krut'ko, G.G.
As evaluations there were considered evaluations Farafontov. "Nuclear Data Information-Reference(or evaluation libraries) ENDL-78 and ENDL-82, System". Journal of Nuclear Science andrevisions 2 and 3 of JENDL-3 evaluation, versions 45 Technology-2002.-v.2.-pp 1464-1467and 6 of ENDF\B evaluation and revisions 12,3 and 4
- 612 -

JAERI-Conf 2003-019 JP0450116
A New Set of Parameters for Gaussian Fission Yields Systematics
Jun-ichi KATAKURA*
Japan Atomic Energy Research Institute, Tokai-mura, Ibaraki 319-1195, Japan
A new set of parameters for Gaussian-type fission yields systematics has been proposed for applying to highenergy neutron or proton fission and to various kinds of fissioning systems including minor actinides. The mass yieldscalculated using the systematics were compared with various kinds of measured data including the fission with incidentenergy higher than I 0 MeV and the fission of minor actinide nuclides. The comparisons showed rather good agreementbetween the calculated values and measured ones for various kinds of fissioning systems.
KE YWORDS. fission yields, mass distribution, systematics, minor actinide, high energyfission
1. Introduction 11. Description of Gaussian mass yield sys-
When a nuclear criticality accident occurs, many ra- tematics
dioactive fission product (FP) nuclides are produced. Systematics has been developed based on the de-These radioactive nuclides emit radiations which cause scription by Moriyama-Ohnishi.2) In the Moriyarna-radiation exposure for personnel accessing the accident Ohnishi systematics, mass yields V(A) are expressedplace for after-accident treatment. As the energy and as follows:the radiation type of the released radiations depend onthe FP nuclides produced, it is important to know what V)(A) = N,,O,,(A) + N.V).(A)kinds of FP nuclides are produced after the fission. The = N, O., (A)distribution of the FP nuclides produced depends on the +N. [0h (A) V51 (A)kind of fissioning nuclide and the energy of incident + F V1h (A) 012 (A)J] ,particle impinging on the fissioning nuclide.
The evaluation of the yields of Fl? nuclides has been where (A) and V) (A) are symmetric and asymmet-traditionary performed for reactor and fusion applica- ric components respectively. The asymmetric compo-tion where important fissioning nuclides are uranium nent, 0 (A), is then divided into heavy Oh (A) and lightand plutonium isotopes and the energy ranges of the in- V, (A) components with two further components (I andcident neutrons are from thermal to 14 MeV Recently 2). Each component is assumed to be Gaussian fanc-several programs are proposed to transmute long-lived tion.radioactive nuclides produced in nuclear reactors into )2/2a2),short-lived ones in order to reduce the burden manag- 0. (A) exp -(A - A Xing radioactivity in a long term. In such a programFP yields data of minor actinides by neutron and pro- where subscript x denotes s, hl, h2, 11 and 12. Thenton with energies from thermal to higher energy than there are Gaussian functions in this systematics. The100 MeV, which have attracted less attention than ma- heavy components ?Phl(A) and IPU(A), however, re-jor actinides like uranium and plutonium, are needed late to the light components 1 I (A) and 012 (A) by re-to access the feasibility of the system proposed and the flecting about symmetric axis A, = Af - P/2. Thissafety related problems. relationship reduces the number of independent Gaus-
Fission yields data for fission of such minor actinides sian functions to 3 Each function has two parameters,by high energy incident particles have not sufficiently A,, and a,,. Then there are 6 independent parameters.measured. Then systematics to predict the fission yields Other parameters needed in the systematics are normal-is required. From the examination of available mea- ization factors, N, and N,,, which determine the con-sured mass distribution, the systematics with Gaus- tributions of symmetric and asymmetric components.sian functions has been developed. ) The systematics They are given by:
is rather simple but has wide applicability to various N� � 200/(1 + 2R),kinds of fissioning systems with incident energy fromthennal to higher than 100 MeV. In the present paper N. � 20OR/ (1 + F)(1 + 2R)),
fission yields systematics of 5 Gaussian functions with where R is the ratio of the asymmetric component to thenew parameters set is described. symmetric component and F the ratio of the asymmet-
ric component I to the asymmetric component 2 Thenormalizations given above assure the total yield, T tobe 200 as follows:
Corresponding author, Tel. 81-29-282-5482, Fax. +8 1 -29-282-5766, E-mail: katakura�ndc.tokaiJaeri.goJp T = N, N, 2 + 2F],
- 613 -

JAERI-Conf 2003-019
200 20OR x 2(1 + F) of the R parameter. The solid circles are derived fromY+ 2R + (1 + F)(1 + 2T)' the measured mass distribution of 21U fission by var-200. ious kinds of incident neutron energy. 5) The measured
mass distribution was decomposed to Gaussian func-In these expressions of the fission yields systemat- tions and the R value was calculated from the parame-
ics, there are parameters to be determined, that is, ters of the decomposed Gaussian functions. From theP, R, F, O's, 7hl, 7h2, Ah, and Ah2- These values measured data the energy dependence seemed to be pro-were determined by examining available measured data portional to I I Ec + C2) as seen in Fig. I and the pa-excepting the value which is adopted from the pro- rameters C and C2 were determined by least-squaresposal by Wahl.3) The available experimental mass dis- fit. Figure 2 shows the shell factor dependence of the Rtributions were decomposed to Gaussian functions by parameter. The solid circles are derived from the mea-least squares fit. The parameters mentioned above were sured data using the similar procedure to the above in-calculated from the parameters of the decomposed cident energy dependence. The parameter derived fromGaussian functions. The obtained parameters were ex- the measured data seemed to have sin function of theamined by assuming various kinds of ftinctional form. shell factor. Then the coefficients of the sin functionIn the examination, it was assumed that the parameters were determined by least squares fit.depended on mass and charge of fissioning nuclide, in- Other examples of the examination are shown incident energy and binding energy of incident particle Figs. 3 and 4 Figure 3 shows the F parameter val-and shell structure of the fissioning nuclide. In order totake the shell structure into consideration, the shell fac- 102
tor given by Meyers and Swiatecki4) was used as in thelo, En dependenceMoriyama-Ohnishi systematics. a Nf parameter
Examples of the examination are shown in Figs. I IGOand 2 Figure I shows the incident energy dependence 9
1 lo-, ee
LL 10-2 0
Energy dependence of R parameter10.3
lo, 10-4 Derived from measured data4) 0 Derived from measured data3 fled result 1 10 100 1000
> Incident energy (MeV)it
loO
Fig. 3 Energy dependence of F parameter.
l o -, . . . . . . . . . . . . .0.0 100.0 200.0 300.0 400.0 500.0
Incident Energy (MeV) 4.00 . . . . . . . . . . . .S dependence of F parameter
3.50Fig. Energy dpendence of R parameter. 3.00
2.50
'a 2.00103 U6 1.50
1.00S dependence of R parametera Derived from measured data %
0.50Fitted resutts
o.ou . . . . .
10, 4.5 5.0 5.5 6.0 6.5 7.0shell Factor
4,111, �11
Fig. 4 Shell factor dependence of F parameter.Derived from measured dataFitted Results
l o , I . . I . . I . I I I . I
4.0 4.5 5.0 5.5 6.0 6.5 7.0 ues derived from the mass distribution of 38 U neutronShell Factor induced fission by various incident energy. 5 ) It is diffi-
cult from this figure to suppose the clear energy depen-Fig. 2 Shell factor dependence ofR parameter. dence of the F parameter. Then we assumed that there
is no energy dependence for the F parameter. The shell
- 614 -

JAERI - Conf 2003 - 019
factor dependence, however, is clearly seen in Fig. 4 the paper by Dickens.6) The mass distribution of thisFrom this figure it was assumed that the F parameter case shows a typical asymmetric shape. The presentlinearly depends on the shell factor S. Similar exami- result reproduces the asymmetric shape and shows goodnations were performed fr other parameters. By these agreement with the measured data. Even in the wingexaminations, the functional forms of the parameters part where yields are decreasing more than one orderwere determined. of magnitude, the decreasing trend of the yields seems
The obtained parameters are listed below: to be reproduced. The scale of this figure, however,
P = 1.404 + 0.1067(Af - 236) is logarithmic and the difference between the measureddata and the calculated ones is not clearly seen. In order
+ 14.986 - 0.1067(Af - 236)] to make the difference clear, the difference is shown in
-[1.0 - exp(-0.00858E')] , Fig. 6 In this figure, percent differences, Pi, from the
R = ( 12.0 + 41.24 sin(3.675S)i measured values are shown as defined follows:
1.0 1.0 C - Ej
BNO.331 + 02067 TO-993+ 00951' P = Ej x 10'0'
F � 10.4 - 1.44S, where C is calculated value and E measured one.or, = 12.6,
ahl = (-25.27 0.0345Af + 0.216Zf) 2" Crn(nl) E=Thermallo,.333)0.0864,
.(0.438 + E + 0333BNO
9h2 = (-30.73 0.0394Af + 0.285Zf).333)0.0864, 100
.(0.438 + E + 0.333BNO
Ahl = 0.5393(Af - P) + 0.01542Aflo-,
Z2 )1/2,.(40.2 - lAf Tf
Ah2 = 0.5612(Af - FI) + 0.0191OAf 10-2Present
)1/2' Dickens 1981)-(40.2 _ Z2 lAff
where E* is the excitation energy of fissioning nuclide 10-3
and is the sum of the incident energy E and the bind- 60 80 100 120 140 160 180
ing energy BN. Parameters Af and Zf are mass and Mass
charge offissioning nuclides. S is the shell factor men-
tioned above. The T/ value is that given by Wahl as Fig. 245CM thermal neutron induced fission.
mentioned before. As for Ah, and Ah2 values, we as-
sumed tat they have similar functional form used by
Moriyama-Ohnishi but the coefficients were newly de- 245 Cm(n.0 E =Thermal
termined by using newer data than those they employed.
As seen in the equations of A h I and A h2, they have the 40.00
term proportional to 40.2 - Z'lAf )1/2 which limits 00f 20.00
the applicability of the present systematics. As the in-
side of the parentheses has to be positive, the condition 0.00
of Z2 lAf 40.2 has to be maintained when we usef E -20.00
the systematics. Most of the minor actinides important 140
for nuclear technology fields, however, are in the range -40.00
ofthe limitation and the present systematics can be em-ployed in practical use of nuclear technology fields. -60.00 (C-E)/E
Using the obtained systematics, comparisons with -80.00
measured data were performed for various kinds of fis- 60 80 100 120 140 160 180
sioning systems. The comparisons are shown in the Mass
next chapter. Fig. 6 Differences between measured values and calculated
111. Comparison with measured data ones for 245CM thermal neutron induced fission.
The systematics with new parameters set was used
to compare with measured mass distributions of various Maximum difference in this case is about 70 at
kinds of fissioning systems. Some of the comparisons A�� 1 15. Excepting this point te difference is stayed
are shown in this chapter. within about 40 in this case.
Figure shows mass distribution of ... Cm thermal As another example, mass distribution of 238U neu-
neutron induced fission. Measured data are taken from tron induced fission by 160 MeV neutron is shown in
- 615 -

JAERI-Conf 2003-019
Fig. 7 Even for this kinds of high energy fission, mass Table I the average deviations from the measured val-distribution by the present systematics seems to repro- ues for various kinds of fissioning systems are shown.duce the measured data. The measured mass distribu- The average deviation is defined here as follows:tion has no valley part and shows symmetric distribu-tion. The calculated yields also shows symmetric shape C - E 1 N C - E,) 2
although a slight dip at the peak area is seen in the cal- E N Ejculation. Figure shows percent difference between the
238 where Ci and Ej are calculated value and measured oneU(n, E 160 MV
lo, respectively As seen in Table I the average deviations
Table I Average Deviations for Various Fissiontoo
Fissioning System Incident Energy Deviation1 0-' 233u + n Thermal 0.2528
Present 235u + n Thermal 0.664310-2 Z611er 1995) 8.1 MeV 0.2889
238U + n 1.6 MeV 0.29175.5 MeV 0.1900
10-3 8.0 MeV 0.271560 80 100 120 140 160 180
Mass 13 MeV 0.619721 MeV 0.7204
Fig. 7 238U fission by 160 MeV neutron. 50 MeV 0.7069100 MeV 0.4358
160 MeV 0.1447
measured data and the calculated ones. The differences 238u + 55 MeV 0.3737
340 MeV 0.3377
238 U(n,� E.=160 MeV �Np n 5 MeV 0.6198
40.00 I I . . . . . . 239pu + n 7.9 MeV 0.4843
(C-E)/E 242pu + n 15.1 MeV 0.230330.00
24' Am 16 MeV 0.7910243AM p20.00 15.6 MeV 0.1923245CM + n Thermal 0.2084
10.00 248c + 20 MeV 0.8355
0.00
-10.00 do not exceed 1.0, that is, the deviation is less than 100
% on an average for various kinds of fissioning systems-20.00 . . .
60 80 100 120 140 160 180 including proton-induced fission. Considering that the
Mass mass yields change from a few percents at the peak area
to less than I % at the wing or the valley area, the sys-
Fig. Differences between measured values and calculated tematics giving the deviation less than 100 % for vari-
ones for 238U fission by 160 MeV neutron. ous fissioning systems is regarded as a rather good one
for applying to minor actinide fission by high energy
incident particle.
seen in this figure scatters from 20 to 40 %. The IV. Summary
overall agreement between the measured data and the
calculated ones of this case seems to be as good as that The new parameters set of Fl? yields systematics
ofthe 211CM thermal neutron fission. with Gaussian functions has been developed. The sys-
From those comparisons the present systematics tematics is able to reproduce the measured mass distri-
seems to be applicable to both low energy fission and butions of various kinds of fissioning systems includ-
high energy fission with similar precision. In the above ing minor actinides with incident particle energy from
examples, the mass distributions by neutron-induced thermal to higher than 100 MeV. The systematics, how-
fission are shown. The mass distributions by proton- ever, has the limitation OfZ2 lAf < 40.2. Then it is notf -
induced fission were also calculated and compared with used for the fissioning system having Zf and Af which
measured data. Even in the proton-induced fission sim- fulfill the condition of Z2 lAf > 40.2. The limitation,f
ilar agreement with the measured data was obtained. In however, does not restrict practical use of the present
616 -

JAERI-Conf 2003-019
systematics, because the range of the Z'lAf values offminor actinides interested in nuclear technology fieldssuch as minor actinide incineration using ADS or re-actor is stayed in the limitation. Then the present sys-tematics will be used for the application fields like thefeasibility study of the minor actinide incineration sys-tem.
Acknowledgment
The work was performed in the ftamework of1AEA's CRP (coordinate research program) titled "Fis-sion Product Yield Data Required for Transmutationof Minor Actinide Nuclear Waste". The author ex-presses thanks to the head of Nuclear Data Center, Dr.Hasegawa, for his support to joining the CRP and de-veloping the systematics. Thanks are also due to themembers of Working Group of Fission Product YieldsData Evaluation, Japanese Nuclear Data Committee,for helpful discussion.
References1) J. Katakura, "A Systematics of Fission Product Mass
Yields with Gaussian Functions." JAERI-Research2003-004 2003).
2) H. Moriyarna and T. Ohnishi,"Systematics of FissionFragment Mass-Yield Curves:' Tech. Rep. Inst. Atom.Energy, Kyoto Univ., No. 166 1974).
3) A. C. Wahl, "notes on Development of Models for Sys-teinatic Trends in Fission-Product Yields from High andLow Energy Fission Reactions - Sept. 20, 1999;' pre-sented at the 1999 CRP Mtg, IAEA 1999).
4) W. D. Meyers and W. J. Swiatecki, Nucl. Phys., 81, 1(1966).
5) C. M. Z611er et aL, Proc. VII School on Neutron Physics,Rahnino, E. Kornilov (Ed.) JINR, Dubna, 1995 Vol. Ip 1 30 1995).
6) J. K. Dickens and J. W. McConnel, Phys. Rev., C23, 331(1981).
- 617 -

JAERI-Conf 2003-019 JP0450117
Critical Mass Calculations for 24'Am, 242mAm and 24'Am
Hemanth DIAS', Nigel TANCOCK and Angela CLAYTONAtomic Weapons Establishment p1c, Aldermaston, Reading, Berkshire RG 7 4PP UK
Critical mass calculations are reported for 14 'Am, 14"Am and 243 Am using the MONKand MCNP computer codes with the UKNDL, JEF-2.2, ENDF/B-VI and JENDL-3.2nuclear data libraries. Results are reported for spheres of americium metal and dioxide inbare, water reflected and steel reflected systems. Comparison of results led to theidentification of a serious inconsistency in the 24 'Am ENDF/B-VI DICE library used byMONK - this demonstrates the importance of using different codes to verify critical masscalculations. The 24 'Am critical mass estimates obtained using UKNDL and ENDF/B-VIshow good agreement with experimentally inferred data, whilst both JEF-2.2 andJENDL-3.2 produce higher estimates of critical mass. The computed critical massestimates for 242'Am obtained using ENDF/B-VI are lower than the results roducedusing the other nuclear data libraries - the ENDF/B-VI fission cross-section for P42'Am issignificantly higher than the other evaluations in the fast region and is not supported byrecent experimental data. There is wide variation in the computed 243 Am critical massestimates suggesting that there is still considerable uncertainty in the 243 Am nuclear data.
KEYWORDS. critical mass, americium, MONK, MCNP, UKNDL, JEF-2.2,ENDFIB- VI, JENDL-3.2
1. Introduction atomic weapons programme. MONK5, which wasdeveloped in the late 1970's, combined the best
This paper reports critical mass calculations for features of the previous Aldermaston and Risley241,&
.M, 242m,&,M and 243 Am using the MCNP and versions of the code.8) MONK6 was developedMONK computer codes with various nuclear data during the early 1980's - a key feature of MONK6libraries. 1.2) MCNP was developed at Los Alamos was the incorporation of the DICE collisionNational Laboratory, New Mexico (USA) - this code processing package. The original version of DICEis widely used in the field of criticality safety. was developed at Aidertnaston.9) Historically, theMONK is the acknowledged standard criticality code DICE nuclear database was derived from thein the UK. UKNDL and all the early versions of the MONK
The latest version of MONK - MONK8b - is criticality code utilised only this nuclear data set.supplied with the UKNDL, JEF-2.2, ENDF/B-VI More recently, new development work onand JENDL-3.2 continuous energy libraries.3-6) For MONK has been coordinated under the auspices ofcomparison, calculations were performed with the NCD (Nuclear Code Development) collaborationMCNP using the JEF-2.2, ENDF/B-VI and JENDL- - the formal members of this collaboration are Serco3.2 point-wise nuclear data sets. The calculational Assurance and British Nuclear Fuels p1c.'0) MONK7methodology in both MONK and MCNP is based on and MONK8 developments have been describedthe continuous energy approach. Results are elsewhere. 11.12) The NJOY nuclear data processingreported for spheres of americium metal and dioxide system was used, inter alia, in the generation of thein bare, water reflected and steel reflected systems. additional JEF-2.2, ENDF/B-VI and JENDL-3.2This work is part of the UK contribution to the DICE libraries issued with MONK8.")Working Group for the revision of AmericanNational Standard 8.15 - "Nuclear Criticality 3. Nuclear Data Libraries
7)Control of Special Actinide Elements" .
3.1 UKNDL2. Historical Review of MONK The first UKNDL collation of data was produced
at Aldermaston in the early 1960 S.3) SubsequentMONK replaced the GEM computer code, which evaluations and revisions were conducted within the
was developed during the 1960's at the United UKAEA until the library was frozen in the earlyKingdom Atomic Energy Agency (UKAEA) Health 1980's - no maintenance or updates to UKNDL haveand Safety Branch at Risley in support of the UK been made since then. In contrast to more modem
Corresponding author, Tel. 44-118-982-7685, Fax. 44-118-982-4813, E-mail: hemi.dias�awe.co.uk
- 618 -

JAERI - Conf 2003 - 019
data evaluations, the UKNDL is "adjusted"; 3.4 JENDL-3.2i.e.certain nuclear data were adjusted, based on The 24'Am and 243AM data for JENDL-2 wereexperimental evidence, to ensure that computer evaluated by Kikuchi.'9) The 242mArn evaluation forcalculations show good agreement (or are JENDL-2 was by Nakagawa and Igarasi . Thesepessimistic) when compared with experimental data. data were revised for JENDL-3.2 by Nakagawa. 21)
Although only the 24 'Am evaluation was formallypublished, the last UKNDL americium evaluations 4. Resultswere all produced at Harwell. 14) Details of the 243 Am
neutron data evaluation, parts of which were adopted Tables 13 give the computed minimum criticalin JEF-2.2, can be downloaded from the Los Alamos masses of 24'Arn , 242'Am and 243 Am, respectively.T-2 Nuclear Information Service.") Results are reported for spheres of full density
americium metal and dioxide in bare, water reflected3.2 JEF-2.2 (30cm) and 304 stainless steel reflected (20cm)
The JEF-2.2 nuclear data library is described in systems. The densities of americium metal and4) 22)JEFF Report 17 . The JEF-2.2 DICE library was dioxide are based on the compilation by Haire.
frozen in 1996 to allow benclundrking studies. More Note that the ENDF/B-VI DICE library issued2)specific details of the JEF-2.2 aericium evaluations with MONK is release 4 Consequently, the
can be downloaded from the T-2 Nuclear MONK ENDF/B-V1 DICE library should contain theInformation Service. 5) most recent evaluations for 241AM and 242mArn - but
not the latest (release 5) evaluation for 243 Am (see
3.3 ENDF/B-VI Section 33).The ENDF/B-VI data evaluations have been The MCNP calculations for 241AM and 242mAM
periodically up-dated - the latest version available used the latest version of ENDF/B-VI available fromfrom the NEA is release 8. The T-2 Nuclear the NEA - release 8. So as to facilitate comparisonInformation Service provides full details of the with the MONK results, the results presented in
Table 3 were obtained using the ENDF/B-VIrlvarious evaluations in ENDF/B-V].") 243 Am evaluation. The 243 Am results obtained using
The CENDL-2 evaluation of the neutron nuclear24 16 ENDF/B-Vlr8 (i.e. including the latest evaluation fordata for 'Am was adopted in release 2 This 243
evaluation was revised for issue as release 3 by Am - release 5) are shown in parentheses.
Young and Madland."s) The 24 'Am evaluation isunchanged since ENDF/B-Vlr3. 5. Discussion
Apart from the addition of the delayed fission The results presented in Table I show significantneutron spectrum in release 1, the ENDF/B-VI242 differences between the MONK and MCNP
mArn evaluation is still unchanged from calculations for 24'Am using ENDF/13-VI. OerENDF/B-V."-'7'
_V 243 workers have reported minimum critical massThe ENDF/B Am evaluation was due to calculations for bare 24'Am metal - a value of
Mann et al.18) The cross section data were updated 57.01kg is quoted using ENDF/B-Vlr6.") Thisfor ENDF/B-V1rI by Weston.15) In 1996 a newevaluation of the neutron data for 243 Am was issued reported value of the critical mass comparesas ENDF/B-VIr5 - this was prepared by Young and favourably with the MCNP calculation, but is
243 inconsistent with the MONK result given in Table .Weston.'-') The Am evaluation is unchanged since This suggests that the MONK results for 24 'AmENDF/B-VIr5. using ENDF/B-VI may be in eror.
Table I Computed Minimum Critical Mass of 24'Am
Critical massChemical Reflector MONK MCNPform UKNDL JEF-2.2 ENDF/B- JENDL- JEF-2.2 ENDF/ JENDL-
VI 3.2 B-VI 3.2Metal Bare 56.4 75.7 88.0, 76.1 73.3 57.7 73.7
= 3.66 Water 50.9 68.3 79.9' 69.2 65.8 52.0 66.7g/cm, Steel 33.6 42.4 51.8' 45.4 40.9 33.8 43.6Dioxide Bare 98.2 132 161- 135 129 94.6 131p = 11.69 Water 92.0 124 15 I' 125 120 87.6 123g/CM3 Steel 65.4 86.0 109' 91.4 83.9 62.4 89.0
MONK results for ENDF/B-VI are subject to error - see text.
- 619 -

JAERI-Conf 2003-019
Table 2 Computed Minimum Critical Mass of 242mAm
Critical massChemical Reflector MONK MCNPform UKNDL JEF-2.2 ENDF/B- JENDL- JEF-2.2 ENDF/ JENDL-
VI 3.2 B-VI 3.2Metal Bare 13.0 13.9 8.96 12.3 14.2 9.06 12.5p = 13.72 Water 4.59 4.69 3.23 4.38 4.78 3.25 4.45g/CM3 Steel 5.21 5.11 3.73 4.97 5.21 3.74 5.02
Dioxide Bare 14.1 14.8 9.96 13.4 15.0 10.0 13.6p = 11.73 Water 5.23 5.34 3.74 5.04 5.39 3.74 5.08g/CM3 Steel 6.04 5.86 4.42 5.79 6.03 4.44 5.85
Table 3 Computed Minimum Critical Mass Of243AM
Critical mass (kg)Chemical Reflector MONK MCNPform KNDL JEF-2.2 ENDF/B JENDL- JEF-2.2 ENDF/ JENDL-
-VI 3.2 B-VI 3.2Metal Bare 181 217 222 296 206 211 (143)- 284p = 13.77 Water 165 200 205 277 189 194 (132)- 262g/cm 3 Steel III 133 144 193 127 135 (89.0)- 181Dioxide Bare 473 616 618 926 578 572 3 00) 864p = 11.77 Water 450 593 599 876 558 553 (282)- 822g/CM3 Steel 342 456 467 698 429 438 (215)- 662
Results in parentheses are for the ENDF/B-VIr8 evaluation - see text.
Following discussions with Serco Assurance, it is the evidence presented in Fig. 1, it is clear that theapparent that difficulties were encountered during JEF-2.2 fission spectrum for 24'Arn has beenthe creation of the ENDF/B-VI DICE library for substituted for the ENDF/B-VIr3 evaluation in the241AM.14) The ENDF/B-Vlr3 24'Am evaluation ENDF/B-VI DICE library. The ENDFIB-VI DICEutilised the Madland-Nix fission spectrum library for 241 Am is subject to error and is thereforerepresentation .25) The version of NJOY then unsuitable for critical mass calculations - the MONKavailable at Serco Assurance was unable to deal with results for ENDF/B-VI presented in Table I will notthis representation of the fission spectrum. [The be considered further in this analysis.Madland-Nix fission spectrum representation is notnormalised to unity - the spectrum has to be re- �EE')
normalised prior to processing into a form suitable 4e-7-- Energydistributionsfor2flAmfor Monte Carlo analys iS.24)] MT=1 8: (zfission) (E=4.OMeA
Nuclear data sets may be readily compared using 3.5e-7 --26 24 - MONKIDICE ENDF/B*the JANIS display program. ) The 'Am fission 3e-7 -- ----- ENDFIB-Vr3
neutron spectrum was abstracted from the ENDF/B-S.24) -ENDFIPAQVI DICE library in a form compatible with JANI 2.5e-7 - JEF-2.2
Note that the fission spectrum held in DICE is 2e-7simulated by a number of equiprobable ranges i.e.the energy distribution is approximated by a 1.5e-7 -
histogram with intervals chosen so that there is an le-7equal area under the histogram in each interval.9)
The 24 'Am fission neutron spectra from ENDF/B- 5e-8VI DICE, ENDF/B-Vlr2, ENDF/B-VIr3 and JEF-2.2were compared using JANIS - see Fig. 1. TheENDF/B-VI DICE fission spectrum for 24 'Am is a 30 100 10DO 1e4 1e5 1e6 1 e7 3e7
good representation of the JEF-2.2 evaluation, but is E'significantly different from the ENDF/B-VIr2 and 24 (in eV)ENDF/B-Vlr3 evaluations - see Fig. 1. Based upon Fig. 'Am fission neutron spectra
- 620 -

JAERI-Conf 2003-019
The 24 'Am minimum critical mass calculations There is wide variation in the computedfall into two groups - the higher critical mass minimum critical mass estimates for 24'Arn - Table 3.estimates are obtained using JEF-2.2 and JENDL-3.2, Calculations using the JEF-2.2 and ENDF/B-VIrIwhilst UKNDL and ENDF/B-VI yield lower critical data libraries compare favourably, whilst themass estimates (Table 1). The JEF-2.2 results for UKNDL gives lower estimates of the 24'Am critical24 'Am metal in bare, water reflected and steel mass. The largest estimates of 243 Am critical massreflected systems show good agreement with are obtained using JENDL-3.2. The JEF-2.2 results
17) 243calculations reported by Dultic and Anno. The for Am metal in bare, water reflected ad steelJENDL-3.2 results for 14 'Am metal and dioxide in reflected systems compare favourably withbare and water reflected systems compare favourably computations reported by Duhic and Anno.27' The
21) -3.2 results for 24'Arn metal and dioxide inwith the data reported by Nojiri and Fukasaku. JENDL
Critical masses of 24 'Am have been inferred from bare and water reflected systems are in reasonablereactivity coefficient measurements in fast critical agreement with the data reported by Nojiri andassemblieS.29,30) The inferred critical mass estimates Fukasaku .28)
are as follows: 58k - bare system; 51k - water There are large differences between the 243 Amreflected; and 34kg - steel reflected. The computed critical mass results obtained using the ENDF/B-results obtained using UKNDL and ENDF/B-VI are VIrl evaluation and those obtained using ENDF/B-in excellent agreement with the experimentally VIr -Table 3 For 243 Am metal the ENDF/B-Vlr8inferred data - Table 1. Note that the UKNDL results are 33% lower than the ENDF/B-VIrInuclear data may have been adjusted" to ensure calculations. For 243 Am dioxide the ENDF/B-Vlr8agreement with these experimental data (see Section results are 50% lower than those obtained using3.1). ENDF/B-VIrl. The results presented in Table 3
There are differences between the results suggest that the nuclear data for 243 Am are stillpresented in Table I and 24 'Am bare critical mass subject to considerable uncertainty.calculations reported by Brewer et a3 ') However, As noted in Section 2 the DICE nuclear databasethese workers assumed a density of 11.7 g/CM3 in was originally derived from the UKNDL. Secondarytheir study which seems to correspond to that of neutron energy data were defined for differentAmO2, rather than americium metal. incident neutron energy ranges. In more modem
The 242'Arn calculations with the UKNDL, JEF- nuclear data libraries, the secondary data are2.2 and JENDL-3.2 nuclear data libraries compare commonly defined at a series of incident energyreasonably well, although the EF-2.2 and JENDL- points - data for intermediate incident neutron3.2 critical mass estimates obtained using MONK energies are then obtained by linear interpolation.are slightly lower than those computed using MCNP Interestingly, although MONK is now issued with- Table 2 The JENDL-3.2 results for 242Am metal JEF-2.2, ENDF/B-VI and JENDL-3.2 DICE libraries,in bare, water reflected and steel reflected systems DICE has not yet been updated to perform thisshow good agreement with the data reported by interpolation.24) For most major actinides any effect
32)Okuno and Kawasaki . There are discrepancies will be insignificant because the secondary data arebetween the results given in Table 2 and the data well characterised. For some minor actinides thereported by Duluc and Anno. 27) In particular, these secondary data are occasionally more coarselyauthors claim that the critical mass of water reflected defined and errors may be introduced if the current242'Am metal obtained using JEF-2.2 is -6.5kg - DICE representation of the secondary data is used.this critical mass estimate is inconsistent with the For example, the ENDF/B-VI 242nAm fissionresults presented in Table 2 and should be treated spectrum is defined at four incident energies:with caution. WOW, 4MeV, 7MeV and 2MeV. The current
The ENDF/B_Vl 242,nAM critical mass version of DICE uses the thermal fission spectrumcalculations are significantly lower than the results up to 4MeV, the 4MeV spectrum up to 7MeV, andobtained using the other nuclear data libraries - the 7MeV spectrum up to 15MeV. [The DICETable 2 For example, calculations using UKNDL, energy grid does not extend beyond 15MeV.9)] TheJEF-2.2 and JENDL-3.2 give bare 242'Am Minimum 242'Am fission spectra were abstracted from thecritical mass estimates in the range 12.3 - 14.2kg, ENDF/B-VI DICE library in a form compatible withwhereas the bare 242'Am critical mass obtained using JANI S.24) The JANIS display program was thenENDF/B-VI is - 9kg. The ENDF/B_VI 242Am used to compare the fission spectra at these incidentfission cross section is significantly higher than the neutron energies - see Fig. 2 Close examinationUKNDL, JEF-2.2 and JENDL-3.2 evaluations in the reveals only barely discernible variations in thefast energy region (by - 0% at I MeV) and is not fission spectra (Fig. 2 All the other americiumsupported by recent experimental data.33,34) The evaluations considered herein are either well24"'Am critical mass estimates calculated using characterised or show barely discernible variations inENDF/B-Vl should therefore be considered spurious. the fission spectra. It follows that the DICE
- 621 -

JAERI-Corif 2003-019
Energy distribubons for 2"Arn
M NUDICE ENDF/B-V1 MT=18: zfission)ENDF/B-M - --------- E=1X10⁻⁵eV
p(EE') - - -E--4 MeVp(EE' 3.65e-7 - E=7 MeV
3.5 F;�] E=20 MeV -arms,3.625e-7-
3 e-7
2.5e? 3.6e-7
3.575e-7
2e-7 - 3.55e- --
1.50 -- 3.525e-7 -
le-7 -- 3.5e-7-
5e,8 3.475e-7-
50 100 10DO W 1e5 1e6 1e7 5e7 3e5 4e5 6e5 8e5 1e6
F VOn eV) (in eV)
Fig. 2 242Arn fission neutron spectra
representation of secondary data is unlikely to Research Establishment Report No. 70/63,introduce any major source of error in the critical UKAEA, 1965.mass calculations reported herein. 4) Nuclear Energy Agency, "The JEF-2.2 Nuclear
Data Library", JEFF Report 17, OECD 2000).6. Conclusion 5) V. McLane, "ENDF-102 Data Formats and
Procedures for the Evaluated Nuclear Data File
Minimum critical mass calculations are reported ENDF-6", Brookhaven National Laboratoryfor 241AM, 242-AM and 241AM using the MONK and Report BNL-NCS-44945-01/04 2001).MCNP computer codes with the UKNDL, EF-2.2, 6) T. Nakagawa, K. Shibata, S. Chiba, T.ENDF/B-VI and ENDL-3.2 nuclear data libraries. Fukahori, Y. Nakajima, Y. Kikuchi, T.Results are reported for spheres of americium metal Kawano, Y. Kanda, T. Ohsawa, H. Matsunobu,and dioxide in bare, water.reflected and stainless M. Kawai, A. Zukeran T Watanabe, S. Igarasi,steel reflected systems. K. Kosako and T. Asami, "Japanese Evaluated
Nuclear Data Library Version 3 Revision-2:
Acknowledgements JENDL-3.2", J. Nucl. Sci. Technol., 32, 1259The authors wish to thank Mr C. Dean (Serco (1995).
Assurance) for the provision Of 41AM and 242mAm 7) American National Standards Institute,fission spectra abstracted from the MONK ENDF/B- "Nuclear Criticality Control of SpecialVI DICE library and for useful advice. Mr K. Cooke Actinide Elements", ANSI/ANS-8.15,(AWE) assisted with the computational processing American Nuclear Society (I 98 1).of data. 8) V. S. W. Sherriffs "MONK - A General0 British Crown Copyright 2003/MOD. Published with Purpose Monte Carlo Neutronics Program",the permission of the Controller of Her Britannic Safety and Reliability Directorate Report SRDMajesty's Stationery Office. R 86, UKAEA 1978).
9) J. B. Parker (Ed.), "DICE Mk V - TheReferences Preparation of Nuclear Data into a FormI J. F. Briesmeister (Ed.), MCNP - A General Suitable for Monte Carlo Calculations Using an
Monte Carlo N-Particle Transport Code", Electronic Computer", Atomic WeaponsVersion 4C, Los Alamos National Laboratory Research Establishment Report No. - 27/66,Report LA-13709-M 2000). UKAEA 1966).
2) M. J. Artnishaw "An Introduction to the New 10) R. J. Brissenden, The Next Generation ofFeatures of MONK Version 8B, MONK7 Criticality Code", Proc. Int. Conf onANSWERS/MONK/REPORT/001, Serco Nuclear Criticality Safety, ICNC'9 1, Oxford,Assurance 2001). Sept. 913, 1991 3 15 199 1).
3) K. Parker, The Aldermaston Nuclear Data 11) N. R. Smith and G. A. Morrell, "AnLibrary as at May 1963", Atomic Weapons Introduction to MONK7", Proc. Int. Conf on
- 622 -

JAERI-Conf 2003-019
Nuclear Criticality Safety, ICNC'95, compidmentaire et comparative", ServiceAlbuquerque, Sept. 17-21, 1995, 1 33 1995). d'ttudes de Criticitd Rdf-
12) N. Smith, M. Armishaw, L. Hutton and J. CEA/VASEC/T/02.322, Institut deSidell, "The Unification of MONK - Radioprotection et de Sftretd Nucldaire,Extending the Monte Carlo Horizon", Proc. Int. Fontenay-aux-Roses 2003).Conf. on Nuclear Criticality Safety, ICNC'99, 28) 1. Nojiri and Y. Fukasaku, "Calculational StudyVersailles, Sept. 20-24, 1999, 1, 38 1999). for Criticality Safety Data of Fissionable
13) R. E. MacFarlane and D. W. Muir, "The NJOY Actinides", Proc. Int. Conf, Future NuclearNuclear Data Processing System, Version 9 ", Systems - Global'97, Yokohama, Kanagawa,Los Alamos National Laboratory Report LA- Japan, 2 1397 1997).12740-M (I 994). 29) C. C. Byers, G. E. Hansen, J. J. Koelling, E. A.
14) J. E. Lynn, B. H. Patrick, M. G. Sowerby and E. Plassmann and D. R. Smith, "ReactivityM. Bowey, "Evaluation of Differential Nuclear Coefficients of Heavy Isotopes in LASL's FastData for Americium Isotopes. Part 1: 24 'Am", Critical Assemblies", Trans. Am. Nucl. Soc.,Progress in Nucl. Energy, 5, 255 1980). 28, 295 1978).
15) T-2 Nuclear Information Service hornepage, 30) R. G. Sanchez, "Proposal for Experiments withhttp://t2.lanl.gov/. Actinide Elements", LA-UR- 1 627 1994).
16) Zhou Delin, Gu Fuhua, Yu Baosheng, Zhuang 31) R. W. Brewer, R. M. Westfall and A. Clayton,Youxiang, Liu Tong, Shi Xiangjun, Yan "Americium-241 Critical Mass", ANSShiwei, Wang Cuilan and Zhang Jingshang, Transactions, 86, 55 2002)."Evaluation of Neutron Nuclear Data for 32) H. Okuno and H. Kawasaki, "Critical and24 'Am". In: "Communication of Nuclear Data Subcritical Mass Calculations of FissionableProgress - No 6 Supplement", China Nuclear Nuclides Based on ENDL-3.2", Proc. Int.Information Centre Report CNIC-00690, Symp. N`UCEF 2001 - Scientific Bases forAtomic Energy Press, Beijing 1992). Criticality Safety, Separation Process and
17) F. M. Mann, R. E. Schenter, L. Weston, C. R. Waste Disposal, JAERI, Tokai, 423 2002).Reich and R. J. Howerton. In: R Kinsey 33) B. 1. Fursov, B. F. Sainylin, G. N. Smirenkin(Comp.) "ENDF/B Summary Documentation", and V. N. Polynov, "Fast Neutron InducedBrookhaven National Laboratory Report BNL- Fission Cross Sections of 242mAM, 241CM,
NCS- 1 7541 1979). 147CM,,, proC. Int. Conf, Nucl. Data for Science18) F. M. Mann, R. E. Schenter, R. Benjamin, R. J. and Technol., Gatlinburg, Tenn, May 913,
Howerton and C. R. Reich, ibid. 1994,1,269 1994).19) Y. Kikuchi, "Evaluation of Neutron Nuclear 34) T. Nakagawa, 0. Iwamoto and A. Hasegawa,
Data for 241AM and 24'Am", JAERI-M 82-096 "Re-evaluation of Neutron Nuclear Data for(1982). 242MAM, 243AM, 99Tc and 14OCe", JAERI-
20) T. Nakagawa and S. Igarasi, "Evaluation of Research 2002-035 2002).Neutron Nuclear Data for 242mAm and 242gAM,,,
JAERI-M 8903 1980).21) T. Nakagawa, "Evaluation of Neutron Nuclear
Data for Americium Isotopes", JAERI-M, 89-008 1989).
22) R. M Westfall, private communication.23) S. Ganesan and H. Wienke, "A Detailed
Reassessment of the Criticality Property ofPure 24'Am", J. Nucl. Sci. Tech., Suppl 2 951(2002).
24) C. Dean, private communication.25) D. G. Madland and J. R. Nix, "New
Calculation of Prompt Fission Neutron Spectraand Average Prompt Neutron Multiplicities",Nucl. Sci. Eng., 81, 213 1982).
26) A. Nouri, P. Nagel, N. Soppera, A. Ahite B.Taton, J. Patrouix, F. Lecompagnon, C. Cunin,0. Rioland and L. D'Eurveilher, "JANIS: ANew Software for Nuclear Data Services", J.Nucl. Sci. Tech., Suppl 2 1480 2002).
27) M. Duluc and J. Anno, "Valeurs minimalescritiques sph6riques des actinides m6talliqueset en solution, nues ou rdfldchies. Etude
- 623 -

This is a blank page.

JAERI-Conf 2003-019
TOPIC 7
BURNUP CREDIT

This is a blank page.

JAERI-Conf 2003-019 JP0450118
Current Studies Related to the Use of Burnup Credit in France
Jdr6me RABY'*, Caroline LAVARENNE'**, Anne BARREAU2, Philippe BIOUX3, Michel DOUCET4,Eric GUILLOU5, Georges LEKA 6, Cdcile RIFFARD2 , 136nddicte ROQUE 2, Herv6 TOUBON 7
Institut de Radioprotection et de Sz2retj Nucljaire (IRSY), BP I 7, 92262 Fontenay aux Roses, France2Commissariatii VEnergie Atomique (CEA - Cadarache, 13108 Saint Paul Lez Durance, France
3Electricitj De France - DRD I avenue du Gnjral de Gaulle, BP 408, 92741 CLAAMRT4FRAAMTOME ANP, 10 rue Juliette Ricamier, 69456 Lyon Cedex 06, France
5 COGEAM - Etablissement de La Hague, 50444 Beaumont Hague, France6SGN I rue des Hirons Montigny le Bretonneux, 78182 St Quentin en Yvelines, France
'COGEAM, BU-TIDPPISRD 2 rue Paul Dautier, BP 4 78141 Velizy Cedex, France
AbstractIn order to avoid criticality risks, a large number of facilities using spent fuels have been designed
considering the fuel as fresh. This choice has obviously led to considerable safety margins.In the early 80's a method was accepted by the French Safety Authorities allowing to consider the changes in
the fuel composition during the depletion with some very pessimistic hypothesis: only actinides wereconsidered and the amount of burnup used in the studies was equal to the mean burnup in the 50-least-irradiatedcentimeters.
As many facilities still want to optimize their processes (e.g. transportation, storage, fuel reprocessing), themain companies involved in the French nuclear industry, researchers and IRSN set up a Working Group in orderto study the way burnup could be taken into account in the criticality calculations, considering some fissionproducts and a more realistic axial profile of burnup.
The first part of this article introduces the current French method used to take burnup into account in thecriticality studies. The second part is devoted to the studies achieved by the Working Group to improve thismethod, especially concerning the consideration of the neutron absorption of some fission products and of anaxial profile of burmip: for that purpose, some results are presented related to the steps of the process like thedepletion calculations, the definition of an axial profile and the criticality calculation. In the third part, someresults (keff) obtained with fission products and an axial profile are compared to those obtained with the currentone.
The conclusions presented are related to the present state of knowledge and may differ from the falconclusions of the Working Group.
KE YWORDS.- Burnup Credit, Axial profile, Fission products, French Working Group.
1. Introduction the depletion of 231U and 23"U during theirradiation,
Up to the 80's, the nuclear facilities which were w the amount of burnup used in the criticality studiesdealing with spent fuel were designed with the was lower than the value reached in theassumption of fresh fuel. This assumption led to 50-least-irradiated-centimeters,considerable safety margins. - the value of the mean burnup in the 50-least
In the early 80's, in order to use the existing irradiated-centimeters was verified by adevices at La Hague reprocessing plant for some measurement.irradiated U02 fuel initially enriched at 44 (this The calculations were supported by the HTCenrichment was higher than the highest enrichment of experiments which were achieved in Apparatus in3.1 considered at the designing stage), a method VaIduc. Those subcritical experiments') involved fuelwas proposed by COGEMA to enable them to pins, representative of a fuel initially enriched atconsider a certain amount of burnup in the criticality 4.5 and irradiated at 37.5 GWd/t, manufacturedstudies. However some pessimistic assumptions were only with actinides. The pins arrays were arranged inmade to guarantee some safety margins: different types of configurations which were
only uranium and plutonium were considered after representative of reprocessing, storage and transport.This actinide-only method was accepted by the
Corresponding &idiom, Tel. 33 1 58 35 99 25, Fax. 33 46 57 29 98, E-mail: jerome.raby�irsnfr
Responsible for the French W, G, Tel. 33 1 58 35 78 67, Fax. 33 46 57 29 98, E-mail: carohne.lavarerme�irsafr
- 627 -

JAERI-Conf 2003-019
French Safety Authorities and was, afterwards, used the bumup is determined by the calculated ratio offor the transport of irradiated fuel and, also, at the some isotopes concentrations (e.g. Nd); thus thedesigning stage of the UP3 and UP2-800 at La Hague qualification of the method will be tightly linked toreprocessing plant. the chosen "indicator of bumup".
But, since the initial enrichment is increasing and The conservatism of the depletion calculationsthe needs of interim storage of irradiated ftiel is depends on:growing, it is becoming necessary for the nuclear the conditions of irradiation nternal EDF studies);industry to reduce the conservatisms due to the very the Group decided to quantify there effectpessimistic hypotheses of this actinide-only method. considering (i) the spectrum hardening, (ii) the fuel
For that purpose, a Working Group was created in temperature variations (Doppler effect), (iii) the1997, gathering most of the French nuclear companies, temporal variation of the flux level (variations ofto analyze different propositions of introduction of specific power), (iv) the cooling time,some fission products plus a more realistic axial the qualification of the depletion codes which areprofile of bumup in criticality studies. used for the calculations i.e. CESAR 3) (industrial
code) or DARWIN 4) (reference code).2. Work in Progress 2. 1.1 Irradiation history
The main parameters which are responsible forThe new points introduced by the method are changes in the fuel inventory (neutron spectrum, fuel
related to: temperature, specific power, cooling time) are• the neutron absorption of some fission products discussed in this paragraph.
the method proposes to first take into account the 5ppq
JAERI-Conf 2003-019
absorptions on the 238U (and then to more productions Cooling timeOf 239pU). Consequently, the temperature of the fuel Many studies have shown that, after themay be set to the maximum value of the effective irradiation and up to a cooling time of 100 years, thetemperature of the fuel. reactivity decreases. This decrease is mainly due to
TenVgg effect the decay of the 241pU (to 24 'Am) plus the increase ofThe temporal effects are linked to the variation of "'Gd.
the specific power (SP). Actually, this effect is the After 100 years of cooling time, the reactivity startsconsequence of the competition between neutron to increase again (as the 24'Am decays) until aroundabsorptions (which are directly related to the value of 30 000 years.the burnup) and decay reactions (related to the time The needs, in terms of cooling time, for the Frenchspent in the reactor). Working Group participants mainly concern some
Some studie 2 showed that an increase of the devices which are to be used for cooling times of lessspecific power is conservative (when no cooling time than 50 years. For those applications, it should beis considered) even if fission products are taken into acceptable to consider, in the criticality studies, theaccount. The results obtained for a single assembly minimum of the cooling time that can be justified bysurrounded by 20 cm of water (initially enriched at the operators'.4.5 % and irradiated at 44 GWd/t) are given below. However, for interim storage, this approach raises
the problem of how operators can guarantee that, afterTable I Single assembly (depleted with the 100 years of cooling time, a solution will exist to
control rods inserted - 15 Fissions products) move the fuel to some other adapted storage? For thiskeff (a < 000095) type of storage and for cooling times greater than
100 years, some special studies will have to be done toSP I I GWd/t 33 GWd/t determine the maximum of the reactivity when the
cooling time is growing. It should be decided not to5 W/g 0.8639 0.7757 take into account the 24 'Am in those studies.
cooling time: 20 W/g 0.8648 0.7837 2.1.2 Qualification of the Depletion Codes0 year 40 W/g 0.8664 0.7832 The depletion codes that have been used yet are
60 W/g 0.8668 0.7820 CESAR or DARWIN 4 Codes. They have been
5 W/g 0.8626 0.7603 qualified on an experimental basis.9) This qualificationcooling time: 20 W/g 0.8623 0.7637 rests on comparisons between calculated values of the
5 years 40 W/g 0.8589 0.7634 concentrations and measured ones. 10) Those60 W/g 0.8587 0.7595 comparisons have been achieved, on both (i) punctual
analysis of irradiated fael (with initial enrichment of
It emerges from the table that, for a cooling time of 4.5 and burnup up to 60 GWd/t) (ii) global analysis5 years, the highest specific power does not give the during the dissolution of irradiated assemblies (withmost reactive result. This has already been shown in initial enrichment comprised between 31 and 35 some previous publication 6 and can be explained by and burnup up to 45 GWd/t).the behavior of some isotope concentrations when the These comparisons will be used to determinespecific power varies. correction factors for the calculated concentrations of
While considering the isotope concentration each of the actinides and fission products which arevariations, the calculations pointed out that, when the considered in the method.specific power increases, the concentrations of theabsorbent isotopes decrease and the fissile ones 2.2 Definition of an axial profile of burnupincrease, except for the following isotopes: Until now the value of the burnup, which was• "9Sm and "'Sm which increase respectively by applied on the whole length of the assembly, was
52 and 5.5 % when the specific power grows equal to the mean value of thefrom W/g to 60 W/g (at a burnup of 40 GWd/t), 50-least-irradiated-centimeters of the assembly.
• 242pU which slightly increases by 28 when the This assumption was very conservative for anspecific power grows from 5W/g to 40 W/g (at a actinide only methodology and the geometricalburnup of 45 GWd/t), configurations studied, giving a reduction of 22 of
• "'Eu (father of "'Gd), which increases by 26 (at the mean burnup for a standard profile (e.g. 34 GWd/t20 GWd/t) and 44 (at 44 GWd/t) when the will be applied to the whole length of the assemblyspecific power grows from to 60 W/g. whereas the real mean burnup would be equal to
The different behaviors observed in the table have 44 GWd/t).been published and analyzed in.') In order to consider a more realistic profile, it was
Then the assumption of a maximized specificpower, which leads, for no cooling time, to a
conservative value of the keff is no more conservative For no cooling time, the aount of 239Pu has to be increasedwhen a year cooling time is considered. with the amount of 29U and z9Np.
- 629 -

JAERI-Conf 2003-019
decided to determine a profile for the criticality to perform automated criticality calculations usingstudies by: burnup credit like in figure 1. This package uses them examining the profiles measured at La Hague depletion code CESAR or the DARWIN 20 system,
reprocessing plant (more than 3000 irradiated the APOLLO 2 12) computer code for cross sectionsassemblies have been measured), calculations from 172 energy-groups libraries, and thecalculating different types of profiles to determine a multigroup Monte Carlo computer code MORET4. 13)
penalizing one. Next paragraphs will present the steps of theThose two studies pointed out that: process described in figure 1, the fission productthe systematic use of a penalizing profile is very programs for qualification and the problem of looselypessimistic (the value of the keff can raise of 12 coupled units.in Ak) ) and it is needed to ensure that the profile 2.3.1 Calculation process 15)
will always be penalizing for every possible reactor CRISTAL V.1 ") contains an interface , coupledmanagement, with the depletion code. It is designed to issueAs part of burnup axial profile study, 3000 profiles automatically data files for the criticality calculations.have been measured at La Hague - COGEMA plant. It will allow choosing and automatically taking intoThese measurements pointed out that most of the account:profiles were quite similar. The statistical study of 11 correction factors (applied to the concentrations ofthese profiles will allow us to determine a the actinides and the fission products chosen)conservative axial profile (for "most of the determined by the qualification of the evolutionprofiles" already measured). The conservatism of calculations and by the qualification of thethe axial profile used in the studies will have to be cross-sections,demonstrated (e.g. checked by a measure of each the axial profile (flat profile, penalizing profileassembly and the measured burnup will have to be without measurement verification, conservativegreater (at different points along the fuel assembly) profile with precise measurement guarantied 16)
than the one used in the criticality studies). The the number of axial zones chosen.number of zones used for the profile model will be 2.3.2 Qualification of the Fission Products Crossdetermined to give a value of the keff which is not Sectionstoo conservative if important margin exists for the . The fission product programs 17) are based on twoconfiguration studied, there is no need to consider a types of experimental data.high number of zones (the keff will decrease as N IRSN carries out experiments in VaIduc 18,19) usingincreases). different fission product isotopes to validate the
calculation scheme. The criticality calculation chain2.3 Criticality calculation step has already been qualified in 1991 with 149SM.
The new French CRISTAL V. I package will allow
Profile of Qualification of he QualificationBumup depletion codes ofthe
criticalitycalculation
A
P NRZL�
CESA f0DAR2
ONE
Depletion alculations with ESAL-- ftc criticality 641cuhwhR� ffi xmi� ffl
Fig.1 Steps of the process to take Burnup Credit into account in a criticality calculation with CRISTAL
- 630 -

JAERI-Conf 2003-019
The following isotopes have been studied: 'O'Rh, 3. Gain Estimation133cS, 143 Nd, 149SM, 112SM and "'Gd. It tests the
capacity of the codes to calculate some critical The comparisons between the keff value obtainedsituations representative of dissolution and storage. with the actinide-only method and with a "newThe completion of the VaIduc program will make it approach 7 could be presented as: k = k(currentpossible to determine whether some correction factors method) - k(new approach with control rods inserted).have to be considered for the cross-sections (for that The values of k for different configurations ofpurpose the corrections factors will be applied to the storage (e. g. interim storage at La Hague) andconcentrations in the criticality studies) of the fission transportation (e. g. TN17-2) are given below. Forproducts (possibly, in order to take into account an those calculations 17 axial zones were used. Someover-estimation of the absorption of a given fission very pessimistic correction factors were used for theproduct) or, eventually, if a margin must be added to fission products and for the actinides to take intoreduce the value of the keff limit in the criticality account, (i) the discrepancies observed between thestudies. results of the depletion calculations and the
Another program was led out at CEA/Cadarache, experimental data, (ii) the differences in the crossdivided into two parts. The former one is devoted to sections (condensate to I group of energy, for a givenfuel inventory validation by chemical analyses and spectrum) noticed during the MINERVE program.microprobe measurements of PWR pins. The latter Moreover, the pessimistic assumptions, regarding theone, involving oscillation experiments, is related to conditions of irradiation described in paragraph 2 LI.,the reactivity effect of the different nuclei responsible were taken into account.for the burnup credit. It validate the cross section ofevery individual fission product for 3 different types Table 2 Comparisons between the keff valueof spectrum. This experiments performed at obtained with the actinide-only method and withMINERVE 20) showed that the calculated cross the new method (cy < 0. I %)
sections were in good agreement with the measured BU and type of Ak = kcurrent method) -ones or that the cross sections of thermal absorbers profile used in k(new method with controltended to be underestimated (which is satisfactory in the new method rods inserted)the point of vue of safety), except for the 133CS (the I I GWd/tcalculated value is up to 4 greater than the penalizing 1.8 % to 2.6 %measured one), for the 103 Rh (the calculated value is Q profitup to 13 % greater than the measured one), and for the .9 I I GWd/t99Tc (the calculated value is up to 4 % greater than the CO 1.1 %to 1.5 %-Ei standard profilmeasured one). 00 22 GWd/t2.3.3 Loosely coupled units 0 standard profil 1.6 %to 2 %0
In the case of storage or transport of irradiated fuel, 33 GWd/t1.1 %to 1.8 %
the level of the reactivity is mainly due to the edges of standard profilthe assemblies, which are the least irradiated areas 44 GWd/t 1.2 % to 1.5 %
It raises the problem of the calculations of loosely standard profitcoupled units with Monte Carlo codes; a special 22 GWd/t 2.9 % to 33 %Working Group has been created at the OECD to standard profil
21study this problem. Meanwhile different statistical 33 GWd/tmethods have been implanted in the CRISTAL standard profil 3.3 % to 3.9 %Package such as (i) the super history powering, (ii) the 0 44 GWd/tfission matrix (kiJ matrix) method, (iii) the stratified standard profit 3.2 % to 3.9 %sampling those methods are being studied 22) to solvethis particular type of problem. Finally, we can notice that, even if the correction
Until the completion of the studies in that field, the factors are pessimistic and the irradiation history isR&D studies should be achieved with the following very conservative and no realistic, the new methodprescriptions: already gives a gain up to Ak = 39 %. This gain will• at the beginning of the calculations a certain be increased if the presence of control rods during the
amount of neutron sources has to be distributed in whole irradiation can be excluded with no coolingall of the different fissile units (the sources can be time, a standard profil and for a burnup of 44 GWd/t,shared so that every fissile unit will include the the gain will be up to Ak = 6 %.same amount of starters at the first stage of thecalculations), 4. Conclusion and Prospects
• at the beginning of the calculations, someadditional neutron sources will be placed at the top The objective of the Working Group is to study theand the bottom of the fissile assemblies. conservatism of all steps of the process to take fel
burmip into account in the criticality-safety studies,
- 631 -

JAERI-Conf 2003-019
considering fission products and axial burnup profile. Databa§e for the validation of depletion calculationThe next studies are performing on tools", Proc. nt. Conf. on Nuclear Criticality
• the possibility to exclude the addition of different Safety, ICNC'2003, Tokai Mura, Japan, Oct. 2003.conservatisms, I )B. Roque et al., "Experimental validation of the
54• the influence of the irradiation history on Eul code system DARWIN for spent fuel isotopiccS134, cS137 and Nd 148 in order to study the effect on predictions in fuel cycle applications",the Bumup measure precision, PHYSOR'02, Seoul, South Korea 2002).
• the influence of the burnable poisons used in I I)M. Maillot, E.Guillou, D. Biron, S. Janski,France, "Search for an Envelope Axial Bum-up Profile for
• the effect of an horizontal profile of bumup and the Use in the PWR Criticality Studies with Bum-upcontrol rods insertion histories, Credit", ICNC'99, Versailles, France, Sept. 20-24,
• the determination of correction factors, 1999, p. 1684-1692 1999).• the variation of the fuel density during the 12)R. Sanchez, J. Mondot, "APOLL02 a
irradiation and its effect on the reactivity, User-Friendly Code for Multigroup Transport• the "stretch-out" effect. Calculations", Proc. Int. Conf. on Nuclear
The conclusions presented are related to the present Criticality Safety, Santa Fe.state of knowledge and may differ from the final 13)O. Jacquet et al., MORET: Version 4.13 aconclusions of the Working Group. The Working Multigroup Monte Carlo Criticality CodeGroup is still working on the effect of the parameters Package", Proc. Int. Conf. on Nuclear Criticalityof the irradiation history and the gain estimation. Safety, ICNC'2003, Tokai Mura, Japan, Oct. 20-24,References 2003.1) C. Lavarenne et al., "Taking Bum-up Credit into 14)J.M. Gomit et al., "CRISTAL VI: Criticality
Account in the Criticality Studies: the Situation as Package for Bumup Credit calculations", Proc. Int.it is Now and the Prospect for the Future", 27th Conf. on Nuclear Criticality Safety, ICNC'2003,Water Reactor Safety Meeting, October 25-27, Tokai Mura, Japan, Oct. 20-24, 2003.1999 - p. 447458. 15)L. Heulers et al., "The Graphical User Interface for
2) C. Lavarenne et al., "Current studies related to the CRISTAL VI", Proc. Int. Conf on Nuclearuse of Bumup Credit in France", RAMTRANS Criticality Safety, ICNC'2003, Tokai Mura, Japan,Vol. 13, No 2 pp.93-100 2002 - Nuclear Oct. 20-24, 2003.Technology Publishing. 16)A. Lebrun et al., "Cross-Checking of the Operator
3) J.P. Grouiller et al., "CESAR: a Simplified Data Used for Burn Up Measurements", in Proc.Evolution Code for Reprocessing Applications", of The IAEA Technical committee meeting on theRECD'98 Nice (France), October 1998. requirements, practices and developments in
4) A. Tsilanizara, et al., DARWIN: an Evolution bumup credit applications, Madrid, April 2002.Code System for a Large Range of Application," 17)J. Anno et al., "French Fission Products BumupJ. Nucl. Sci. Technol., Supplement 1, p 845-849, Experiments performed in Cadarache and Valduc.March 2003. Results Comparison", ICNC'2003, Tokai Mura,
5) A. Barreau, "Parametric study of the effect of Japan, Oct. 20-24, 2003.MOX environment and control rods for Bumup 18)J. Anno et al., ICSBEEP HandbookCredit implementation", Proc. Int. Corif on LEU -COMP-THERM-050 released in SeptemberNuclear Criticality Safety, ICNC'2003, Tokai 2000.Mura, Japan, Oct. 20-24, 2003. 19)J. Anno et al., "Status of the Joint French
6) M. DeHart, "Parametric Analysis of PArR Spent IPSN/COGEMA Qualification Program of FissionFuel Depletion Parameters for Long Term Products", ANS November 200 .Disposal Criticality Safety", ORNL/TM-1999/99, 20)N. Thiollay et al., "Bum-up Credit for FissionFebruary 1999 Product Nuclides in PWR (UO2) Spent Fuels",
7) C. Lavarenne et al., "A new method to take ICNC'99, Versailles, France, Sept. 20-24, 1999,bum-up into account in criticality studies p. 612-621 1999).considering an axial profile of bum-up plus some 2 1) R. Bloniquist et al., "OECD/NEA Sourcefission products", in Proc. of The 1AEA Technical Convergence Benchmark Program: Overview andcommittee meeting on the requirements, practices Summary of Results", Proc. Int. Conf. on Nuclearand developments in bumup credit applications, Criticality Safety, ICNC'2003, Tokai Mura, Japan,Madrid, April 2002. Oct. 20-24, 2003.
8) J.C. Wagner and C.V. Parks, "Recommendations 22)J. Miss et al., "Development and Comparison ofon the Credit for cooling time in PWR Bumup Monte Carlo Techniques Implemented in theCredit Analyses", ORNL/TM-2001/272, January MORET4 Code for the Calculation of Loosely2003. Coupled Systems", Conference MC 2000 - Lisbon
9) B. Roque et al., "The French Post Irradiation 23-26 October 2000.
- 632 -

JAERI - Conf 2003 - 019 JP0450119
UK Regulatory Perspective on the Application of Burn-up Credit to the BNFLThorp Head End Plant
D N Simister, Health and Safety Executive, St Peter's House, Balliol Road, Bootle, Merseyside, UK,L20 3LZ.
P D Clemson, Risk Management Consultants Ltd, Genesis Centre, Garrett Field, Birchwood SciencePark, Warrington,
Cheshire, UK, WA3 713H.
ABSTRACT parameters, requiring review of thedevelopment and basis of the correlations used
In the UK the Health and Safety Executive, to underpin the measurement process.which incorporates the Nuclear InstallationsInspectorate N11), is responsible for regulation Overall, it was concluded that the case asof safety on nuclear sites. presented was adequate. Gadoliniurn
reduction has been successfully implementedThis paper reports progress made in the as part of current operational procedures atapplication and development of a Sellafield.UK regulatory position for assessing licensee'splant safety cases which invoke the use of IntroductionBum-up Credit for criticality applications.The N11's principles and strategy for the The safety of nuclear installations in the UK isassessment of this technical area have been regulated by the Health and Safetydeveloped over a period of time following Executive (HSE). HM Nuclear Installationsexpressions of interest from UK industry and Inspectorate N11) is the part of HSE whichsubsequent involvement in the international regulates nuclear safety, including nuclearcollaborations and debate in this area. This criticality safety.experience has now been applied to the firstmain plant safety case application claiming The N11 has followed and participated in theBum-up Credit. This case covers the extensive international debate concerning theBNFL Thermal Oxide Reprocessing possibility of taking credit for fissile fuelPlant (THORP) dissolver at Sellafield, where depletion following in core irradiation. Thisdissolved gadolinium neutron poison is used as methodology is known as "Bum-up Credit". Ita criticality control. The case argues for a is a complex technical issue involving manyreduction in gadolinium content by taking areas of nuclear criticality safety. The generalcredit for the bum-up of input ftiel. trend internationally is an acceptance of the
principle, and a prudent and cautious moveThe UK regulatory process, assessment towards progressive application. Until 2002principles and criteria are briefly outlined, there were no commercial plant applications inshowing the regulatory framework used to the UK which invoked Bum-up Credit.review the case. These issues include thefundamental requirement in UK Health and The N11's regulatory pnciples and strategy inSafety law to demonstrate that risks have been this area have been outlined previously (ref 1).reduced to as low as reasonably practicable The main purpose of this paper is to discuss(ALARP), the impact on safety margins, the progress made in the development andcompliance and operability procedures, and the application of this approach following theneed for continuing review. Novel features of submission of a safety case from a licensee.methodology, using a "Residual Enrichment" The first such major application in the UK isand "Domain Boundary" approach, were the proposal by British Nuclear Fuels, BNFL,considered and accepted. The underlying to take Bum-up Credit for the THORPvalidation, both of criticality methodology and dissolver (ref 2 and 3, allowing a consequentisotopic determination, was also reviewed. reduction in the concentration of dissolvedCompliance was seen to rely heavily on local gadolinium neutron poison. A full descriptionin-situ measurements of spent fuel used to of the plant and process, the methodology fordetermine "Residual Enrichment" and other deten-nining residual enrichment and domain
- 633 -

JAERI-Conf 2003-019
boundaries and compliance measurements is UK Regulatory View of Burn-Up Creditgiven elsewhere 4). N's regulatory reviewidentified several novel technical assessment NII's SAPs, include the need for aissues which needed to be considered, demonstration of "defence in depth" andincluding the impact on overall safety and adequate redundancy in safety features. Ameasures to show that risks have been reduced "hierarchy of control" is preferred in licenseesto as low as reasonably practicable (ALARP). safety cases (SAP Principles 61 and 62) withThese are outlined and discussed below. The robust fail-safe engineered features takingrelative lack of operational experience in precedent, and reliance on operator control andimplementing this methodology suggested that administrative features being least favoured.a prudent and cautious approach should be The use of Bum-up Credit has been recognisedfollowed reflecting existing regulatory at an early stage, in SAP 284, for possibleprinciples published in NII Safety Assessment inclusion in safety methodology. However,Principles (ref 5) and the precautionary the principle of reducing risks to as low asapproach advocated (ref 6). The application reasonably practicable (ALARP) encouragesof this approach to the specific application conservative assumptions, such as assumingrequired detailed review and assessment of the fuel to be unirradiated, and to change from thisnovel areas of methodology, and resolution of position to taking credit for Bum-up maytechnical issues. A similar detailed review of appear to run contrary to the ALARP principle.related plant measurement, compliance and However, it can be justified if there are wideroperability issues was also required. safety gains to be made overall.
UK Regulatory /Process In general, NII would expect a prudent andcautious approach to Bum-up Credit, in cases
In the UK, nuclear safety is regulated mainly where there is little or no operating experienceunder two pieces of legislation. Firstly, the in many of the novel technical areas. A phasedHealth and Safety at Work etc Act 1974, approach, using "actinide only" assumptions,which inter alia, imposes a general duty of care and concentrating first on well definedand imposes a duty on employers to reduce PWR fuel designs is likely to attract the leastrisks so far as is reasonably practicable regulatory attention. Once experience has(ALARP). started to build up, extension of the application
to other fuel types may be considered.Secondly, the Nuclear Installations Act asamended (I 965) provides a permissioning Of key importance to any new application isregulatory structure based on standard licence the underlying validation, of analytical models,conditions attached to nuclear site licences. as reflected in SAP P87. For Bum-up CreditThis is a non-prescriptive regime, where, inter applications, this is a complex area which mustalia, the operator has the responsibility for include the validation of isotopic compositiondeveloping case specific safety submissions. predictions, in addition to reactivityThis allows the flexibility to develop safety calculations. NII considers the internationalcases suited to local applications. The comparison of codes and data to be of greatUK regulatory process centres around the value in this area - one example being theagreement from the regulator to a proposed UK's participation in the OECD-NEAactivity which is supported by the submission benchmark programme. Licensees can gainof detailed safety cases at various key stages regulatory confidence in their safety case bythroughout plant design, commissioning, and showing consistency with "state of the art"operation. The regulator assesses the safety methods from international comparisons, andcase and may challenge the icensee in regard evidence that the applicant is fully conversantto the adequacy of the case in demonstrating with methods and data used elsewhere ), andALARP and requiring a more detailed can make strong arguments to demonstrate thatjustification. MI believe there are advantages methods and data of equivalent standing arein adopting flexibility in its regulatory being applied.approach, in contrast to setting prescriptiverules and guidance. The NII SAPs (ref 5) UK Regulatory Assessment Criteriacomplement this approach, by outlining theunderlying principles considered to reflect best N11's starting point in assessing the adequacypractice. of a licensee's safety case is a comparison with
the Safety Assessment Principles (ref 5) Inthe case of applying bum-up credit NII mayexpect to see robust engineered controls
- 634 -

JAERI - Conf 2003 - 019
consistent with SAPs P61/P62 wherever ALARPpossible and a minimisation of operator basedcontrols. From a regulatory standpoint, the commercial
benefits from Burn-up Credit carry littleThe methods and data used in the safety case weight in terms of Nil's assessment prioritieswould be expected to reflect current good compared to necessary improvements in safety.practice in industry being equivalent to As taking credit for Bum-up for normalinternational standards as demonstrated by operations may appear to be moving againstbenchmark comparisons. Any specific the ALARP principle, consideration of theapplications must demonstrate consistency safety related benefits overall were considered.with the known range of applicability and In this application the operator has argued thatvalidation of the methods and data. the reduction in gadolinium concentration
required to control the dissolver would lead toNil expects operators to have in place a robust significant reductions in high active wastecompliance regime which include operational arisings. This in turn is claimed to haveclear definitions of compliance check several knock-on safety related benefits arisingparameters linked to clear and simple from reductions in risk in storage and handling,procedures with audit trails available. The and reductions in operator dose. The overallsystem would be expected to be easy and clear effect was that the reduction of gadoliniurnto use in a practical way on plant, with a high concentration did not significantly degradedegree of "ownership" vested in the safety.operational staff. Rigorous controls on fuelidentification and handling would be expected,together with additional safeguards such asengineered systems to prevent feed of out of Justification of Bum-up credit Methodgloaspecification fuel, eg mechanical interlocksconnected to monitoring instruments. These Nil carefully reviewed the methodology usedaspects have been reviewed as part of Nil's in the application to assist in forming aassessment of these areas and included in a detailed view on its fitness for purpose. Aseries of plant visits, which gave the operator number of independent calculational checksopportunity to demonstrate the compliance were also performed. The Domain Line regime currently in place, and show how this Residual Enrichment (RE methodologycould be extended to meet the requirements for appears elegant and simple to apply in practice.Bum-up Credit safety cases. It appears to fold in a wide range of variables
and seems to provide a robust "go/no go"UK Regulatory View of THORP compliance check parameter. However, NilApplication were aware that care was needed to ensure that
the elegance and superficial ease of theUK Regulato1y "Case by Case" Approach RE method did not obscure underlying
uncertainties which may be buried in the detailThe application of Bum-up Credit to the of the method and Nil sought, and gained,THORP dissolver at Sellafield represents an further assurance from the licensee on thisindividual specific case. This is consistent point.with the UK regulatory regime of a non-prescriptive pertnissioning licensing system. An example of one of Nil's methodologyAn operator has freedom to develop a specific concerns was the detailed definition andcase best suited to local conditions, but has the application of the "Residual Enrichment"responsibility of justifying and demonstrating parameter. This was constructed by relatingadequacy to the regulator. the fissile Pu content of irradiated fuel to an
"equivalent" amount of U-235. Adding this toFor this first plant application of Bum-up the residual U-235 allows a "ResidualCredit in the UK, where credit is used for Enrichment" to be estimated, to be used in thenormal operations rather than to mitigate compliance check. Crucially, it is thisremote faults, the demonstration of the parameter, "Residual Enrichment" which isadequacy of the safety case has no specific measured by the THORP Feed Pond Fuelprecedent. Therefore, Nil expected the Monitor, using a semi-empirical calibrationlicensee to undertake a full analysis of the based on a database of correlatedproposed modification based upon the measurements. The Pu fissile - U-235principles of prudence and caution. equivalence for these correlations assumes a
well thermalised neutron spectrum, which
- 635 -

JAERI-Conf 2003-019
arguably is a good representation of the Out of this regulatory review NII has identifiedmeasurement environment, and the a generic issue which is the ongoing need fordemonstrably good correlations obtained were methods and data validation, particularly forargued to support this. However, using the isotopic compositions. This is one of asame Pu fissile - U235 equivalence in the number of areas which needs to be kept underdissolver is not strictly accurate, as the neutron review.spectrum would be expected to be "harder"due to the thermal absorptions in the dissolved Safety Marginsgadolinium. After due consideration, it wasargued by the licensee, and N11 accepted, that The criticality safety criterion used by thethis effect does not compromise the method, operator is of the general form:but it illustrates how careftil and detailed theexamination must be to ensure there are no Kff + 3cr <1 - X - E)unrevealed uncertainties.
Where Kff is the MONK prediction withFurther confidence was gained by N11 from uncertainty c, X a sub-critical margin (usuallyplant operational evidence which was also 0.05 for normal operations) and E) is a sumincluded. This showed that in practice the of various uncertainty terms relating toobserved dissolution rates were such that the program, data and modelling. An additionalarrangement of fuel assumed in the dissolver term, E3uc is included for the Bum-up Creditas the worst credible hold-up configuration in case, made up of Bum-up related componentsthe safety case was in fact far from the representing fuel inventory, modelling andoperational norms and likely to be highly nuclear data uncertainties related to theconservative. reduction in reactivity with Bum-up. These
uncertainties were subjected to a criticalMethods and Data Validation review, to ensure that due allowance was
being made consistent with the validationRegulatory confidence can be gained by evidence and the sensitivity assessments. Inproviding and reviewing strong validation particular, due to the novelty of the application,evidence. The Licensee's review should seek it was expected that a prudent and cautiousevidence of good agreement with experiment, approach would be to some degree reflected inand demonstrate that any biases will be a conservative choice by the operator ofconservative in applications, and/or folded into uncertainty values. N accepted BNFL's viewan appropriate treatment of uncertainties. that the value of E was adequate for thisValidation evidence for the criticality models particular application.was supplied by the operator and reviewed.This comprised of "general" validation data, Plant Measurements Validationsdrawing on well recognised benchmarks, and
more specific data. As part of NII's regulatory The routine use of plant measurements as aassessment it was felt necessary to seek 44 go/no go" safety compliance check wasadditional specific evidence for considered to be an important feature of theMOX/gadoliniurn systems, representative of licensee's safety case. As part of NII's reviewirradiated fuel fissile compositions, since it to build confidence in the licensee'swas considered necessary to be convinced that arrangements detailed evidence was sought,the methods and data were adequate for these and provided, to demonstrate the effectivenesscomplex mixed systems with a specific heavy of this system. It was argued that this range ofthermal absorber, gadolinium. NII was data as enabled a robust determination of thesatisfied that agreement was acceptable, with raft of calibration data required, allowingresidual biases being conservative. representative measurements with a
The adequacy of validation evidence determined uncertainty.
supporting the calculation of isotopic NII's regulatory assessment included concernscompositions was also assessed. These that the calibration data may be susceptible toincluded results of WIMS predictions for a systematic error, if, for example, all reactorrange of CERES (ref 7 PIE analyses, which fuels used for calibration purposes used theshowed conservative biases in the fissile same isotopic or Bum-up calculation modelisotopes. The sensitivity of the criticality which may have an unrevealed systematic bias.models to uncertainties in the isotopic It was demonstrated by the licensee that thecomposition was also included as part of the range of fuel types used for calibration meantsafety case. that data was supplied from a wide variety of
- 636 -

JAERI-Conf 2003-019
reactors which resulted in sufficient diversity Given the novelty of the application, it wouldof methodology for there to be little risk of be expected that a cautious phased approach tosignificant urevealed systematic errors. the application would be adopted,
concentrating first of all on PVrR fuel which isIt was noted that an important benefit from well characterised. Once operating experienceroutine plant measurement is that the database has started to build up, later phases may beis continually increasing. This allows periodic expected to consider other fuel typesreview to continually test and refirie the system. dependent on the outcome of the formalThis aspect of the licensee's arrangements was reviews.welcomed. It was also noted that there is aneed to be able to demonstrate that specific Summaryinstrument systems may be compliant againstreferenced national standards. The ALARP implications of the application
have been considered. It is argued by theCompliance Arrangements operator that the reduction in high active waste
arisings; following a reduction in gadoliniurnTaking credit for fuel Bum-up places a heavier concentration will have safety benefits inburden on the need for robust means to be in reduced risk and radiation dose. This is arguedplace to ensure that all fuel fed to the dissolver to offset the reduction in conservatismcomplies with the restrictions required by the resulting from Bum-up Credit.safety case. In this case this reduces to thecompliance check that the measures "Residual Extensive calculations have been carried outEnrichmenf' is not greater than the defined by the operator and supplied for review.limit. It was argued by the operator that Based on these calculations, the operator hasalthough credit has not previously been taken developed a simple compliance check based onfor fuel Bum-up, similar plant measurements the comparison of the "Residual Enrichment"have been routinely applied since the plant of feed fuel, an estimate Of U235 equivalent,started operations in 1994). It was argued that with a limiting safe enrichment. Theexperience to date has been good, with no calculations were reviewed in detail,significant discrepancies between declared and particularly to ensure that there were nomeasured data. The significant difference with "hidden" uncertainties or unrevealed errorsBum-up Credit of course would be that this which may be unknowingly propagated. Also,measurement would now become a key safety the validation evidence for the criticality andcheck, and the measuring device identified as isotopic calculations was reviewed.an important safety mechanism. However, thegood experience to date gives some confidence The application of the compliance checkthat a robust regime with rigorous controls on crucially depends on the measurement of thefuel identification and handling has been "Residual Enrichmenf' by the Feed Pond Fuelestablished. Monitor prior to fuel feed, forming a "go/no
go" test. The development of this monitor hasApplication Reviews taken place over many years, and rests on a
semi-empirical data base of correlations. TheIn line with a prudent and cautious approach to width and depth of this database was claimednovel applications, it is expected that there will to provide a robust foundation to thebe a continuous review of the system as methodology, allowing measurements with aexperience builds up. In particular, NII would known precision to be undertaken on a routineexpect to see periodic formal reviews of basis.compliance arrangements, the performance ofnovel safety related engineering features and The operational aspects of the system wereoperational control/administration features, reviewed by inspection, where attention wasresults from measurements of fuel parameters particularly given to examining the fuelused for compliance testing, and the handling and identification methods, the fuelaccumulation and application of calibration monitoring systernand the safety mechanismsdata. The results from such reviews, combined used to ensure correct fuel feed.with the results from ongoing methods anddata validation work, would be expected to Overall, it was concluded that the case asfeedback into formal reviews of the Bum-up presented appeared well founded and robust.Credit safety case. To date, no major issues have emerged which
NII feels would obviously undermine theBum-up Credit case. NII has granted formal
- 637 -

JAERT-Conf 2003-019
consent, noting that a prudent and cautiousphased approach to commissioning will beimplemented, starting with well definedPWR fuel. As operating experience andevidence builds up, N1 would expect formalreviews to take place.
Conclusions
The development of Bum-up Credit is now atthe stage in the UK where the principle isestablished, and the first major plantapplication has been implemented. Thisapplication is the use of Bum-up Credit in theBNFL THORP dissolver, where the operatorhas reduced the concentration of the dissolvedgadolinium neutron poison used for criticalitycontrol. NII has reviewed and accepted theplant safety case.
The views expressed in this paper are those ofthe authors and not necessarily the Health andSafety Executive or RM Consultants.
References
1. UK Regulatory Perspective on theapplication of bum-up credit in plant criticalitysafety cases - D N Simister, P D Clemson.
ANS Embedded Topical Meeting on PracticalImplementation of Nuclear Criticality Safety,Reno NV, I I - November 200 .
2. The Development of Bum-up creditcriticality safety case for the ThorpReprocessing Plant; Harris, Edge & Olgilive,ICNC 99 Versailles 622 - 688.
3. Criticality Safety of the BNFL Thorp FuelDissolvers, A Rice, J M Hobson, ICNC 91Oxford, V - 19.
4. The implementation of a bum-up creditbased criticality safety assessment in the Thorphead end plant, J Gulliford et al ICNC 2003,P046.
5. HSE's Safety Assessment Principles 1992,ISBN 0- 1882043-5.
6. HSE's decision-making process. ISBN -7176-215 1 -0 HSE Books.www.hsebooks.co.uk.
7. The Methodology adopted by BNFL inclaiming credit for reactor fuel bum-up incriticality safety assessments; Bowden,Thorne and Strafford, ICNC 95, Albuquerque,1133.
- 638 -

JAERI-Conf 2003-019 JP0450120
Specific Application of Burnup Credit for MOX PWR Fuels in the Rotary Dissolver
Grdgory CAPLIN", Alexandre COULAUD', Pavel KLENOV1, and Herv6 TOUBON 2
Socigl� G9n&ale pour les techniques Nouvelles I rue des h&ons, 78182 Saint-Quentin-en- Yvelines, France2COmpagnie GEngrale des AL4ti&es nucl&ires 24 rue Paul Dautier, 78140 Vilizy, France
In prospect of a Mixed Xide spent fuels processing in the rotary dissolver inCOGEMA/La Hague plant, it is interesting to quantify the criticality-safety margins fromthe burnup credit. Using the current production computer codes and considering a minimalfuel irradiation of 3 200 megawatt-day per ton, this paper shows the impact of burnup crediton industrial parameters such as the permissible concentration in the dissolution solution orthe permissible oxide mass in the rotary dissolver. Moreover, the bumup credit is brokendown into five sequences in order to quantify the contribution of fissile nuclides decreaseand of minor actinides and fission products formation.
The implementation of the bumup credit in the criticality-safety analysis of the rotarydissolver may lead to workable industrial conditions for the particular MOX fuel studied. Itcan eventually be noticed that minor actinides contribution is negligible and thatconsidering only the six major fission products is sufficient, owing to the weak fuelirradiation contemplated.
KEYWORDS: Burnup credit, spent MOX fuel, rotary dissolver, CRISTAL
1. Introduction Criticality studies about the rotary dissolver areThe current criticality-safety analysis regarding the peculiar because of the reference fissile material - an
processing Of U02 spent fuels in the rotary dissolver in heterogeneous system of oxide pellets in dissolutionCOGEMA/La Hague plant, France, only considers the into a nitrate aqueous solution which is fissile anddecrease in fissile nuclides due to fuel irradiation in moderator in the same time. The purpose of thesereactor (actinide-only bumup credit). studies is to determine upper safety limits for fissile
In the perspective of a Mixed Xide (MOX) spent concentration in the nitrate solution and for oxideftiels application, COGEMA and SGN have studied mass in each bucket of the rotary dissolver.criticality-safety conditions of the rotary dissolver The study described in this paper is conductedusing the entire burnup credit (BUC) method for a with the french computer codes currently used forparticular MOX P'R fuel application. This bmup production studies. Restricting hypotheses on fuelcredit method takes into account: bumup and fuel inventory are made. The aim is to* the decrease in fissile nuclides and the presence of prove that using a minimal BUC for the criticality-
fission products (FPs) and minor actinides (mAs) safety analysis of the rotary dissolver may lead todue to the fuel irradiation in reactor, workable industrial conditions for the particular MOX
* the decrease in fissile nuclides due to the spent PWR ftiel studied.fuel cooling after irradiation.
In this study the BUC is broken down into five 2. Reference Fissile Materialssequences thus highlighting their relative importance. 2.1 Main HypothesesThese squences consider the following media: The reference fissile material in the buckets of the
I fresh MOX ftiel, rotary dissolver is an array of MOX pellets2. MOX fel aged, (UO2+PU02) moderated by the dissolution solution.3. spent MOX fuel without FPs, The dissolution solution can be:4. spent MOX fuel with 6 FPs, An uranium VI and plutonium III nitrate aqueous5. spent MOX fuel with 15 FPs. solution - U02(NO3)2 + Pu(NO3)3 - in which the
There are not yet qualified burnup measurements isotopic composition in uranium and plutonium isimplemented for MOX spent fuels, but the identical to the pellets' one. The free nitric aciditymeasurement method already exists. So, only with a of the solution is put equal to zero so as toqualitative bumup measurement, the MOX fuel minimize neutron absorption. The fissileirradiation can be guaranteed and consequently we are concentration in the nitrate solution is maximizedallowed to take into account a minimum bumup of up to the upper safety limit in infinite system.3 200 megawatt-day per ton. This value is An aqueous nitric acid solution - HN03 - whichrepresentative of the 50-least-irradiated-centimeters of is the process starting solution. In that case, theassembly rods irradiated during a single irradiation nitric acidity of th .e solution is estimated at thecycle. lowest value of 3 N.
Corresponding author, Tel. 33-01-39-48-61-53, Fax. 33-01-39-48-97-98, E-mail: grcap1in�sgn.cogerna.fr
- 639 -

JAERI-Conf 2003-019
In this study, it was established that the most Note: For the second sequence, the fuel inventory isreactive configuration of the rotary dissolver is always not computed by depletion codes but is establishedobtained with the uranium and plutonium nitrate from 14'Pu half-life which is 14.35 years.solution. Thus, the only results presented in this paperare obtained with the nitrate solution. Table 2 nuclides considered in the calculations for
Considering that pellets are in dissolution, their each BUC sequence: (a) are nuclides which balance isradius can be lower than the nominal value. So the altered compared with the previous sequence, (b) arepellets' radius is set in order to maximize the dissolver nuclides added compared with the previous sequence.reactivity. Furthermore, the moderator-to-fuel ratio Nuclides with the same balance as the previous(defined as the ratio between nitrate solution volume sequence are not repeated.and MOX pellets' volume) is optimized. Finally, the sequence nuclides altered (a) and added (b)pellets' clad is not considered. The initial fissile 1. initial U: 235,238isotopic composition of the MOX pellets (thus for the sequence Pu: 239,240,241,242nitric solution) is given in the Table 1. 241PU a Pu: 241
2.
Table initial mass isotopic composition of the decay b 241 Amstudied MOX fuel U: 235,238
235u / u 0.72 % a Pu: 239,240,241,242 '241AM
238u / u 99.28 % 3i.n-adiation U: 234,236739P / PU 67.69 % b Pu: 238140p / pU 21.02 % mAs: 242MArn 243AM 243cin 244CM 295CM
241p / pU 8.62 % 4. 6 FPs b 103n, 133CS, 143Nd, 149SM, 151sM, 155Gd
142pU / pU 2.67 % 95Mo, 99Tc, 111tu, 19Ag, 145Nd, 147sin,
Pu / (U+Pu) 4.05 % 5. 15 FPs b 150SIn, 152Sm, 153EU
2.2 Burnup Credit Hypotheses 3. Rotary Dissolver Modeling
The burnup credit is broken down into the five The rotary dissolver is made up of a fixed elementfollowing sequences: - the tank - and of a rotary element - the wheel -
1. fresh MOX fuel (reference sequence), which comprises twelve buckets. The wheel is partly2. MOX fuel aged, submerged in the dissolution solution. Each bucket is3. spent MOX ftiel without FPs,4. spent MOX fuel with 6 FPs, about I 10 liters volume. During the process, only four5. spent MOX fuel with 15 FPs. consecutive buckets contain fuel rods in dissolution.
For each sequence, nuclides considered in the The others are empty or out of the dissolution solutioncalculations are given in the Table 2 Major actinides (then the dissolution process is completed).(MAs: U and Pu isotopes and 24'Am), minor actinides The rotary dissolver model on the Fig. I is built on(mAs) and fission products (FPs) taken into account two buckets and a reflection to simulate two otherare those identified for MOX burnup credit buckets submerged in the dissolution solution. Thecalculations.') The six FPs of the sequence 4 are the buckets are equally filled with the array of MOXsix most important in term of reactivity worth among pellets moderated by the dissolution solution. Thethe fifteen usual FPs.1) filling level depends on the fissile mass per bucket and
The fuel bumup is reduced to the minimal value of on the moderator-to-fuel ratio. A reflection by the3 200 megawatt-day per ton - MWd/t. This value is dissolution solution surrounds the buckets and arepresentative of the least irradiated chopped rods (due reflection by water surrounds the dissolver tank.to the axial profile burnup of fuel assemblies) andneeds no previous bumup measurement to be Dissolver .... .... ....
Tank N,guaranteed (only an irradiation confirmation). This ... .. .. ...hypothesis about the fuel burnup is very conservative (nitrate rnitri aid)for standard MOX fuels with average fuel assemblyburnup between 20 and 40 GWd/t. As the fuel bumup Pellets inis minimized, the impact of the irradiation conditions X.simulated in the depletion calculation on nuclidesbalance is attenuated.
The MOX fuel studied here is supposed to be years old (irradiation and cooling time).
For sequences 2 to 5, the nitrate solution is anuranium VI, plutonium III and americium III nitratea ueous solution - U02(NO3)2 + PU(NO3)3 +
241 Am(NO3)3 - with free FPs for sequence 4 and .Fig.1 Schema of the rotary dissolver modeling
- 640-

JAERI-Conf 2003-019
4. Method 4.2.1 Study of the Nitrate Solution in Infinite System
4.1 Computer Codes Used The first stage of the calculation scheme is the4. 1.1 Depletion Code study of the nitrate solution in infinite system. This
stage is represented in the Fig.2.The fuel inventory after irradiation is computed by The atomic composition of the nitrate solution
the depletion code CESAR 436." This code needs a excluding FPs and mAs (thus only considering majordedicated macroscopic cross-sections library which actinides MAs: U and Pu isotopes and 24'Am isshall be created for any given MOX fuel and is computed by the CIGALES code with an isopiesticthereafter built by the APOLLO1.33 and density law. CIGALES requirements include theAPOGENE 32 computer codes. APOLLO, associated relative composition of U, Pu and 24'Am and theirwith the "CEA86" cross-section library, computes the initial concentration in the solution. Then, mAs aton-ticneutronic parameters of fissile materials on a two- concentrations are added using the mAs / MAs atomicdimensional mixed rod array. APOGEN then builds ratio from the depletion calculation. The FPs atomicthe CESAR library from APOLLO results. concentrations are likewise added using the FPs / MAs
This computer codes linking is the current way of atomic ratio. In that case, the MAs concentrationsdepletion calculation for production studies used at provided by CIGALES are not altered.SGN. The infinite multiplication factor (k.) of the nitrate
Two fuel assembly designs are processed. solution is computed by APOLL02 code and is thenPreliminary calculations show that the impact of the compared with the safety criterion: k.: 093. Then,design on fiiel inventory is negligible because of the this whole stage is repeated with other fissilelow fuel burnup studied. concentrations in order to find the upper safety
4.1.2 Criticality Calculations concentration by interpolation.
The Calculations of the neutron multiplication ce o ss e coneritration �infactor k. tion I
,ff) are performed with the standard way of the solutioncriticality-safety package CRISTAL VO (CIGALES, depletion results:APOLL02 and MORET 4 CodeS).11' 4) UpU,141 AM relative
CIGALES 20 computes the atomic densities of compositionUy,,24'Arn atomic composition
the fissile mixtures with the density laws. For nitric mAs ±30% / MA�_ in the nitric solution (CIGALES
solutions, an "isopiestic" density law is used.5) Then, ratio isopiestic dnsity law)
CIGALES generates the calculation file for Fps 30% MAs ..............................
APOLL02 code. ratio - ...............................
APOLL02 associated with the "CEA93-V4"cross-section library computes the neutronic entire composition of the r�o
2 dissolution solutionparameters - material buckling B . and k. - of thereference fissile materials and generates, for all fissile
k,,,.i. of the solutionand non-fissile materials, 172-group macroscopic (APOLL02)
cross-sections usable by MORET code. The CEA936)library is based on JEF2.2 .
The MORET 4 code uses cross-sections fromAPOLL02 to compute kff in a three-dimensionalgeometry through a Monte-Carlo method. fety criterio -------
k 0.93
4.2 Calculation Sequence
The preliminary stage of the calculation sequence yesis the determination of the MOX fuel inventory afteran irradiation of 3 200 MWd/t and a cooling time rotary dissolver calculation
making the MOX fuel 15 years old. Then, the material Fig.2 Calculation diagram of the nitrate solution'sbalance for the 15 FPs used and for absorbing mAs study(243 Am and 244CM) is reduced by 30 %. The materialbalance for fissile mAs (242mAM, 243CM and 245CM) is 4.2.2 Rotary Dissolver Calculation
increased by 30 %. These conservative hypotheses, The second stage of the calculation sequence is the
which reduce the ratio non-fissile / fissile nuclides in rotary dissolver calculation. This stage aims at
the reference fissile materials used, are ventured so as determining:to allow a margin for the implemented calculation * the permissible fissile mass in each bucket of the
scheme. rotary dissolver (mass control mode - MCM),
Then, for each of the five BUC sequence described * the k of the rotary dissolver in a geometry
in section 2.2, the calculation scheme is as displayed control mode - GCM (buckets are full of MOX
in the following subsections. pellets with an optimized moderator-to-fuel ratio).
- 641 -

JAERI - Conf 2003 - 019
In these calculations, the fissile concentration in the 450
nitrate solution is the upper safety concentration from Critical
the previous stage rounded up to the superior value. Its 400 rinissib 393 400 400
composition is computed as presented in the Fig.2.Moreover, the MOX pellets' composition from the 350 -
depletion calculation is maximized up to a 0.5 2" 3 0�8 309
density. 300 287
For a given fissile mass in the buckets (mass + Fill 269
control mode - MCM), the pellets' radius is chosen in +250
order to maximize the dissolver reactivity and the
moderator-to-fuel ratio is optimized the same way. 200 1. Initial 2. 241 PU 4. 5.The filling level of the buckets is fitted for each value sequence decay 3. Irradiation 6 Ps 15 Psof the fissile mass and of the moderator-to-fuel ratio.The usual permissive criterion for the rotary dissolver Fig.3 Permissible and critical fissile concentration inin mass control mode is k + 3cr 097 (where cy is the nitrate solution for each BUC sequence.
the standard deviation). The permissible and critical 5.1.2 MOX Pellets in Dissolutionmasses are determined by interpolation. The bumup credit for an infinite system of MOX
For the geometry control mode - GCM (buckets pellets in dissolution should first be considered, priorfull of MOX pellets), the pellets' radius is set in order to the examination of the rotary dissolver calculationto maximize the dissolver reactivity and the results. The maximum k. (whatever the pellets' radiusmoderator-to-fuel ratio is optimized the same way. and the moderator-to-fuel ratio are) of each BUCThen, each value of the moderator-to-fuel ratio sequence is computed by the APOLL02 code. Thecorresponds to a fissile mass per bucket. This results on the Table 3 show that the entire bumupcalculation is performed only when the fissile mass credit reaches almost 600 pcm. More than half ofper bucket in a mass control mode and the optimized credit comes from the second sequence (because ofmoderator-to-fuel ratio associated lead to a filling the 15 year-old fuel) and only 16 % comes from FPs,level near ftill. The transition from a MCM to a GCM of which the main 6 contribute nearly 90usually happens for an oxide mass per bucket around170 kg. Table 3 Infinite system of MOX pellets in
dissolution: cumulated credit and sequence share of5. Results and Analysis each of the five BUC sequences. The maximal value
5.1 Infinite System of k. is always reached for a 04 cm pellets' radiusand a .0 moderator-to-ftiel ratio.
5. 1.1 Nitrate Solution sequence k. max. cumulated contributionFor each BUC sequence, the upper safety fissile credit (pcm) M
concentration and the critical fissile concentration in I initialthe nitrate solution are given in the Fig.3. sequence 1.33617 - -
It can be noticed that the bumup credit for the 2. 241pu
dissolution solution is rather significant (from 234 to decay 1.27085 4 890 57
309 g/I permissible and from 287 to 400 g/I critical). 3. irradiation 1.24063 7 150 26The main credit comes from the second and the thirdsequence. Since the FPs are taken into account, the 4 6 FPs 1.22281 8 480 16
margin is only about 10 g/I for the permissible 5. 15 FPs 1.22135 8 590 1concentration, due to the restricting hypotheses
ventured about irradiation and FPs balance. Te 5.1.3 Minor Actinides Contributionconcentration credit between the sequences 4 and islower than I g/l, the whole FPs credit then comes Some calculations in infinite system for thefrom the 6 FPs. dissolution solution and the pellets in dissolution have
In the case of the spent U02 fuels processing, the been made in order to quantify the niAs contributionnominal fissile concentration in the nitrate solution is in the sequences 3 to .around 200 g/I and the safety calculations are ade With regard to the dissolution solution, thewith a restricting maximal concentration of 400 g/l. In permissible and critical concentrations are notour case, this concentration is not permissible een modified if the m-As are not taken into account, whichwith the entire burnup credit (sequence 5), but it is just means that the concentration credit of mAs is lowercritical. Even so the MOX processing is still than g/I for the nitratelsolution.conceivable because of a permissive concentration Considering the array of pellets in dissolution, thearound 300 g/l. difference in does not exceed 20 pcm whether the
mAs are taken into account or not (Table 4 and thedifference in Bn' is around 0.08 %. The reactivity
- 642 -

JAERI-Conf 2003-019
worth is greatly included in the uncertainty in the dissolution is quite higher for the sequence than forvalue of keff for the rotary dissolver application. the sequence 4 because of the number of nuclides
The mAs contribution to the burnup credit is processed. Considering the number of calculationsnegligible because of the very low fuel bumup needed for one value of kff (about four pellets' radiusconsidered and their consequently weak balance in the and eight moderator-to-fuel ratio for each radius), thefuel inventory. Thus, the mAs have not been taken sequence 4 study is sufficient.into account for the rotary dissolver application(section 52). 1.010
Table 4 Infinite system of MOX pellets in 1.000 5.2 Gemdissolution: comparison between a model with minor 0.990actinides (a) and a model without minor actinides (b).
b0.980 Z1 VICYkThe maximal value of k. is always reached for a
+ s.3 GCM-0.4 cm pellets' radius and a 5.0 moderator-to-fuel le 0.970
ratio.0.960
k. max. A" S.5 WMsequence 0.950 � �
(a) (b) pcm 30 50 70 90 Ito 130 150 170
3. irradiation 1.24063 1.24088 -20 Oxide =ss, kg per bucketFig.4 maximal kfr+ 3cr values (whatever pellets'
4 6 FPs 1.22281 1.22304 -19 radius and moderator-to-ftiel ratio are) for MOX
5. 15 FPs 1.22135 1.22156 -17 pellets in dissolution into the rotary dissolver. "s.i isrelative to the BUC sequence number i. MCM andGCM respectively mean "mass control mode" and
5.2 Rotary Dissolver Application "geometry control mode".
The application of the burnup credit to the rotarydissolver geometry will be considered in this last Table Permissible and critical oxide mass persection, so as to convert the infinite credit in pcm into bucket for a mass control mode - MCM - anda concrete parameter such as the permissible oxide maximal value of keff + 3a) for the dissolver in amass in dissolver buckets. geometry control mode - GCM (whatever the oxide
The dissolver calculations' results in a MCM and mass per bucket is).in a GCM are represented by the curves of the Fig.4. MCM GCMThe values of the permissible and critical massesinterpolated from these results are given in the sequence permissible critical kff + 3aTable 5. For these calculations, the uncertainty cy in mass, kg mass, kg max.the value of kff is less than or equal to 200 pcm. I initial
For the initial sequence (fresh MOX fuel), the sequence 41 62 >> Ipermissible oxide mass per bucket is 41 kg and an 2. 241puadded mass of 21 kg of oxide per bucket suffices to decay 82 n/a 0.996lead to ctical conditions for the dissolver. Such aconstraint does not allow a workable industrial 3. irradiation 147 n/a 0.974
application because one fuel assembly should be 4 6 FPs n/a n/a 0.964
processed in 15 or more buckets. Then, the answer 5. 15 FPs n/a n/a 0.961could be to poison the dissolution solution, withgadolinium for instance.
In the following BUC sequences, the mass credit is 6- Conclusionquite remarkable. Just from the second sequence, the From a criticality-safety view with the currentpermissible mass is twice the first sequence's one and approach of safety analysis, the industrial processing,the dissolver is sub-critical in GCM. Moreover, when in the rotary dissolver in COGEMA/La Hague plant,taking into account FPs (sequences 4 and 5) the of the particular spent MOX fuel studied can not bemaximal kff + 3a value in GCM (whatever the oxide realized without poisoning the solution dissolution.mass per bucket is) is slightly lower than the current The permissible concentration in the solution is onlyacceptable criterion. So, the reactivity worth between equal to 234 g/I and the permissible oxide mass perthe sequences 3 and 4 is not sizeable but it allows the bucket is only equal to 41 kg.transition between a MCM and a GCM in this case This study points out that the use of the burnupstudy. credit method allows 'a 600 pcm margin benefit.
It can be noticed that the credit between the These credit corresponds to a pern-tissible fissilesequences 4 and is negligible seeing that it is of the concentration in the solution equal to 309 g/I andsame order as calculations uncertainties. The cross- allows a geometry control mode for the dissolver.sections calculation time, by APOLL02, for pellets in These conditions permit to envisage a processing
- 643 -
JAERI-Conf 2003-019
without poisoning (as it is currently done for U02 Meeting on Bum-up Credit Applications, Madrid,fuels) or at least permit to benefit by safety margin in Spain, April 22-26, 2002.a poisoned process. These results are all the more 2) M.Samson, J.P.Grouiller, J.P.Pavageau, J.Pinel,worthwhile because of the restricting hypotheses made P.Marimbeau, J.M.Vidal, "CESAR: a simplifiedabout fuel irradiation (minimized to 3 200 MWd/t), evolution code applied to reprocessingFPs balance (minimized by 30 %) and mAs balance application", RECOD 98, Nice, France, October(minimized by 30 for non-fissile mA nuclides and 25-28, 1998.
increased by 30 % for fissile mA nuclides). 3) CRISTAL hornepage, httj):Hwww.irsn.fr/cristal/Considering these restricting hypotheses, it is also
shown that taking into account minor actinides is 4) B.Roque, A.Santamarina, C.Mattera, E.Lejeune,negligible regarding their impact on reactivity. "Contribution to the experimental validation of theFinally, the breakdown into five sequences of the new French criticality-safety packagebumup credit shows that the use of the fifteen FPs is 'CRISTAL"', Proc. Int. Conf. ICNC'99,not more advantageous than using only the six more September 20-24, 1999, Versailles, France.important FPs. 5) G.Poullot, J.Anno, G.Courtois and N.Leclaire
"Density laws of actinides nitric solutions and their7. References mixtures: Uranium (VI), Uranium (IV),1) B.Roque, A.Santamarina and N.Thiollay, "Bumup Plutonium (IV), Plutonium (111), Americium (III)
credit calculation route for PWR MOX assemblies and Thorium(W)", CRISTAL-VO/DT/03.01/A,and experimental validation in MINERVE Rl- IRSN, Jan. 30, 2003.MOX and SLBI P.I.E.", Technical Committee 6) JEFF Report 17 "The JEF2.2 Nuclear Data
Library", May 2000
- 644 -

JAERI-Conf 2003-019 JP0450121
The REBUS Experimental Programme for Burn-up Credit
(2 (2)Peter Baeten(')*, Pierre Mond'), Leo Sarind'), Daniel Marloye ), Benoit Lance(2) (2)Alfred Renard Jacques Basseller
(1) SCK*CEN, Boeretang 200, B-2400 Mol, Belgium(2) Belgonuclkaire, Av. Arianelaan 4 B1200 Brussels, Belgium
An international programme called REBUS for the investigation of the bum-up credit hasbeen initiated by the Belgian Nuclear Research Centre SCK*CEN and Belgonucl6aire withthe support of EdF and IRSN from France and VGB, representing German nuclear utilitiesand NUPEC, representing the Japanese industry. Recently also ORNL from the U.S. joinedthe programme. The programme aims to establish a neutronic benchmark for reactorphysics codes in order to qualify the codes for calculations of the bum-up credit. Thebenchmark exercise investigates the following fuel types with associated bum-up: referencefresh 33% eriched U02 fuel, fresh commercial PWR U02 fuel and irradiated commercialPWR U02 fuel 54 GW&M), fresh PWR MOX fuel and irradiated PWR MOX fuel 20GWd/tM). The experiments on the three configurations with fresh fuel have beencompleted. The experiments show a good agreement between calculation and experimentsfor the different measured parameters: critical water level, reactivity effect of the waterlevel and fission-rate and flux distributions. In 2003 the iadiated BR3 MOX fuel bundlewas loaded into the VENUS reactor and the associated experimental programme wascarried out. The reactivity measurements in this configuration with irradiated fuel show agood agreement between experimental and preliminary calculated values.
KEYWORDS: Burn-up Credit, VENUS, Criticality Experiment
1. Introduction bundle with a bum-up of 20 GWd/tM. Other fueltypes can be investigated in future extensions of the
Present criticality safety calculations of irradiated programme, like BWR fuel. At the same time wefuel often have to model the fuel as fresh fuel, since will measure fission rate and flux distributions inno precise experimental confirmation exists of the the different configurations.decrease of reactivity due to accumulated bum-up.In other occasions only actinide depletion is Since the commercial PWR U02 spent fuel rodsallowed to be taken into account and the influence have a length of 4 meter, these rods have to beof fission products has to be disregarded. The fact refabricated into I meter rodlets. Afterwards thethat this so-called "bum-up credit" cannot rodlets will be cleaned thoroughly, since the(completely) be taken into account has serious contamination level of the VENUS reactor has toeconomical implications for transport, storage and remain very low. Also the BR3 spent fuel rods havereprocessing of irradiated fuel. For long-term to be cleaned, but no refabrication is needed. Aftergeological storage it is almost imperative to apply cleaning the rodlets will be assembled in thebum-up credit. experimental 7x7 bundle. This will be executed in
the SCK-CEN hot cell laboratory.2. General description of the REBUSprogramme Together with a precise measurement of the
reactivity effect, it is also indispensable to have aThe aim of the REBUS programme is to establish good characterization of the fuel. Thean experimental benchmark for validation of reactor characterization of the spent fuel is performed inphysics codes for the calculation of the loss of two steps.reactivity due to bum-up, both for U02 and MOXfuel bundles. The first step is non-destructive and is performed
before the reactivity measurements. All spent fuelThe reactivity effect of PWR U02 spent fuel will be rods will be measured by gross gamma-scanning inmeasured in the. VENUS critical facility on a order to determine the distribution of total gammabundle of commercial spent fuel with a bum-up of activity in the fuel rods. One specific rod will be54 GWd/tM. The same will be done on a MOX investigated by gamma-spectrometry, together with
Corresponding author: Tel 32 14 33 21 93, Fax 32 14 32 15 29, E-mail: pbaeten�)�sckcen.be
- 645 -

JAERI-Conf 2003-019
a well-qualified calibration source, to determine the 0 Fresh PWR MOX fuel, originating from the131CS content and in this way the bum-up of the rod. BR3, an experimental Belgian PWRVia the gross gamma-scans this will give a good 0 Irradiated PWR MOX fuel 20 GWd/tM), alsopicture of the bum-up of all rods. This first step is from the BR3 reactornecessary to verify that the selected rods have asimilar bum-up and is necessary to account for the All test bundles will be loaded as a 70 fuelbumup distribution of the rodlets for an accurate assembly in the centre of a 23x23 33% enrichedsimulation with the computer codes. U02 fuel driver zone surrounded with two outer
rows of 4.0% enriched U02 fuel. The 0 assemblyThe second step is destructive and is consequently is chosen because calculations show that such anperformed after the reactivity measurements. It assembly will result in a reactivity effect that isaims at detem-lining both the actinides content, large enough for benchmark purposes 2000 pcm)some bum-up indicators (Cs, Nd) and the 19 most and for practical reasons because VENUS hasimportant fission products with respect to neutron removable grids where this assembly fits in.absorption (representing >80% of the neutronabsorption in the spent fuel). The sample for this The reference 33% enriched U02 fuel bundledestructive, radiochemical assay is taken from the (figure 2a) consists of the same 33% enriched U02
same rod, on which gamma-spectrometry as been fuel as there is in the driver zone. Its purpose is toperformed. validate a keff calculation.
The fresh fuel content has been well-documented I T I I I t. 1 I
during fabrication. 11. I I 111. A .1
+3. Short description of the VENUS reactor I A' I AI Ci
The VENUS critical facility is a water-moderated 1 1"t, A 4, V I. _=7zero-power reactor. It consists of an open non- 1 AAA 11.11 i
It tA11 It I
pressurized) stainless-steel cylindrical vesselJW7
including a set of grids which maintain fuel rods ina vertical position. After a fuel configuration has RE .3 3X VO�'been loaded, criticality is reached by raising thewater level in the vessel.
Fig. 2a: Reference U02 fel configuration design
The fresh commercial U02 fuel bundle (figure 2b)Rajconsists of a 5x5 fuel assembly, surrounded with3.3% enriched U02 fuel. The central investigatedftiel is 38% enriched U02 fel, fabricated at
I Framatorne ANP (formerly SIEMENS), Germany.It is the original composition of the irradiatedcommercial fuel.
The iadiated commercial fuel bundle has the sameconfiguration as the fresh bundle, as is obvious forexperimental reasons (clean comparison of the fresh
Fig. 1: Vertical cross-section of VENUS and irradiated bundle). The central investigated
4. Measurements performed at VENUS in the irradiated fuel is provided by GKN, the operator offramework of REBUS the Neckarwestheim NPP in Germany.
Five fuel bundles or assemblies will be investigatedin the framework of the REBUS programme. Thesefive bundles are:• Reference fresh 3.3% enriched U02 fuel• Fresh commercial PWR U02 fuel, constructed EJ
by Framatome ANP formerly SIEMENS) EJ• Irradiated commercial PWR U02 fuel 54
GWd/tM), originating from Neckarwestheim CJ
NPP, Germany Fig. 2b: Central 0 U02 bundle
- 646-

JAERI - Conf 2003 - 019
The fresh BR3 MOX fuel bundle (figure 2c)consists of 24 ftiel rods (a 7x7 overmoderatedassembly). In this way the Mghest reactivity effectcould be obtained with the available rods. The fuelis 69% enriched fissile MOX fuel, fabricated atBeigonucldaire, Belgium. It is the originalcomposition of the irradiated BR3 fuel. Theirradiated PWR MOX fuel of intermediate bum-uporiginates from the BR3 reactor, Belgium. The fuelis provided by SCK*CEN. The bundle design of teirradiated bundle is the sme as for the fresh bundle(figure 2c). 74�T
a Afeazwv�n�t poxgwn ��alJkSS%&n �ale disillbulla"
Afsasur�nv�a p"tfian .117, �aJ,is.ria�z raie disfibufzan
m�ion flux 6:h
PvsAlradiated NOX Fig. 3 Measurement positions for horizontalX si�ctu�* fission rate distribution
:_J IfZ0Fig. 2c: Central 7x7 MOX bundle 5. Results
The reactivity effect will be measured by loading 5.1 Characterization of spent fuel rodsthe different bundles in the centre of the driver zoneand measuring each time the critical water level and The fresh fuel rods originating from the VENUSthe reactivity effect of a change of the water level. and BR3 (driver zone, reference bundle and MOXFrom these measurements the reactivity effect can fuel) have already been used in previous benchmarkbe estimated. However, a more direct way of programmes and their characteristics are wll-validating the reactor codes is simply calculating documented. Additionally, the VENUS rods havethe kfl- for the different configurations at the been elongated from 50 cm to I m and during thismeasured critical water levels. This is a more direct elongation we took the pportunity to performcomparison and more accurate, since the some extra measurements with respect to thedetermination of the reactivity effect from the cladding inner and outer diameter and the positionmeasured parameters is subject to some of the lower end plug.approximations.
The irradiated MOX fuel from the BR3 has beenIn addition of the reactivity measurements the examined in the hot cell laboratory wit respect tofission rate distribution and the flux distribution at gross-gamma scanning, bum-up by gamma-the main axes will be measured (see figure 3 Due spectrometry, profilometry and ftiel column length.to the impossibility of measuring this parameter inthe spent fuel assembly, wire activationmeasurements will be performed in this assembly tomeasure the thermal and epithermal neutron flux.Table 1: Overview the measurements in the
.f Tipdifferent configuratioConfig Critical dp/dh Fission Flux
I level raleRef. U02 X X
Fresh U02 X X X XJJT. UO, X X In driver XFresh MOX X X X X Fig. 3 Measurement f the gross-ganinia scan fIff. MX X X in driver X an irradiated MOXPWR rod
The gross-gamma scan (see figure 3 results showfor certain MOX rods a rather high degree of Csmigration. indicating a high linear power duringirradiation.
- 647 -

JAERI-Conf 2003-019
5.2 Experiments in the critical facility VENUS: depicts these measured and calculated fission-ratefresh configurations distributions, which were normalized at fuel pin
location 7.In 2002, the three configurations with only freshfuel, namely the reference configuration, the freshGKN U02 configuration and the fresh BR3 MOXconfiguration were loaded in the VENUS critical X(MI
Xic)facility. For all three configurations, the predefined Cr I a M) --- -- ---
experimental programme as laid out in paragraph 4was executed.
Table 2 summarizes the results for the 0.5
determination of the critical height and makes acomparison with calculations which were made for 6 8 11) 1, 14
the pre-deterniination of the cores. Two different HO On -fi..
calculation schemes, a 3-D Monte Carlo (WIMS-KENO) scheme and a 3-D deterministic (WIMS- Fig. 4 Comparison of calculated (C) and measuredTHREEDANT) scheme, were used to calculate the (M) fission-rate distributions for the fresh MOXcritical water level. In both calculation schemes the bundle along the X-axis and the X-Y diagonal
geometrical model was the same. Figure 4 shows that there is a good agreement
Table 2: Comparison of calculated and between the measured and calculated fission-ratedistributions along the two axes. In fi ure 5, theexperimental critical heights 9
(C-E) (-) Ref. Fresh Fresh measured and calculated fission-rate distributionsU02 U02 MOX for die fresh GKN U02 configuration are
WIMS-KENO (31)) - 354 - 326 - 450 illustrated.WM- - 355 - 450THREEDANT (3D)
2
ox _fm)
Table 2 shows that there is not only a good X ." W)agreement between the two different calculationschemes, but also between calculation and 4 XN"img(c
experiment. A small systematic bias of about 300 2
to 400 pcm is observed. A'i6
For the comparison between measured and 0 4 6 8 I'l) 1'2 1
calculated water level reactivity variations, the 2-D F-1 pi. -1i-
deterministic WIMS scheme and the 3-Ddeterministic WIMS - THREEDANT scheme was Fig. 5: Comparison between calculated (C) andused (see table 3 The Monte Carlo KENO was not measured fffission-rate distributionsfir thefireshsuited for this purpose due to the statistical U02 bundle along the X-axis andX- Y diagonaluncertainty.
Figure points out that there is relative goodTable 3: Comparison of calculated and agreement between calculations and experiment,experimental water level react ity variation but that one notices a discrepancy of about 7 % (C-(C-EYE Ref Fresh Fresh E)/E in the central zone with GKN U02 fuel.
U0, U0, MMWIMS (21)) + 14 + 16 + 12 5.3 Loading of irradiated fuel into the VENUSvvqms- - 12 1 - 3 reactorTHREEDANT (3D)
As for every zero power reactor, the loading ofTable 3 shows that for the 3-D code calculation irradiated fuel coming from a nuclear power plant isscheme the calculated and measured values not a standard operation, since in such ypes ofcorrespond very well, but for the 2-D calculation reactors only the manual loading of fresh fuel pinsscheme a systematic bias of about - IO% occurs. is foreseen. In order to achieve this goal, a specific
loading procedure and necessary equipment wasFor the fi7esh BR3 MOX configuration and the fresh developed and constructed.GKN U02 configuration, also the horizontalfission-rate distribution was measured along two For the transport from the hot-cell laboratories toaxes, the X-axis and the X-Y diagonal. Figure 4 the VENUS facility, the REBUS container with the
- 648 -

JAERI-Conf 2003-019
irradiated REBUS bundle is put in an additional distributions outside the bundle. Also Co activationtransport container to reduce the radiation level wires were inserted at several positions in the corebelow 2 mSv/h in contact. In the reactor hall the and in te bundle around core midplane. Thecovering plates of the transport container are analysis of the measurement data is ongoing, butremoved and the REBUS container is lifted out of already the critical height and the reactivity effectits transport container and put in a vertical position were detennined. Te calculation results are based(Figure 6 preliminary raw calculations corrected by axial
burnup profile, anisotropic cross sections effectPO/PI and calculation bias.
By comparing the calculated value with theexperimental one, we see that for the critical waterlevel an underestimation of 3 is present and forthe reactivity coefficient te calculated value wasoverestimated with 16%.
The reactivity effect of replacing the fresh MOXbundle by the irradiated bundle yields a reactivity
Figure 6 ififing qf he REBUS container out ol he effect between - 1900 and 2200 pcm depending ontransport container the way that te reactivity effect is inferred from
the critical height and the reactivity coefficients.Afterwards, the REBUS container is transferred Such a reactivity effect is anyway larger than teinto the bunker by means of the tackle and reactivity effect foreseen in the early phase of thepositioned in a uique location on top of the reactor programme (- 600 pcm).(Figur 7 When the cable of the telescopic arm isconnected to the top of the irradiated bundle in the 6. ConclusionsREBUS container, the shielding doors of the bunkerare closed and the bundle is lowered remotely into The REBUS programme provides an experimentalthe reactor from the control room. benchmark for burn-up credit, taking into account
both fissile isotopes depletion and the production ofneutron absorbing fission poducts.
With the results of the REBUS programme avalidation of reactor physics codes with respect tobum-up credit of PWR UO, fuel with intermediateand high bum-up is possible. Based on the resultsof this validation., and the quoted uncertainties ofthe experiment., safety margins can be determinedthat have to be implemented for burn-up creditcalculations.
The REBUS programme is being executedcompletely at SCK*CEN in its hot cell laboratory,radiochemistry lab and the VENUS reactor.
Gamma scans, profilometry, length determinationand gamma-spectrometry measurements on theMOX fuel have been performed. The experiments
Figure Positioning I e REBUS container o for the three fresh configurations show a goodthe supporting structure over VENUS agreement between calculation and experiments for
the different measured parameters: critical water5.4 Reactivity measurements of the irradiated level, reactivity effect of the water level andBR3 MOX configuration fission-rate distributions.The experimental progamme for the configuration
t� In 2003 the iadiated BR3 MOX bundle waswith the irradiated BR3 MOX bundle was loaded into the VENUS reactor. The eactivitycompleted in June 2003. The critical water level effect of replacin a fesh MOX bundle by the sameand the eactivity effect of the water level were bundle after irradiation in a power reactor wasmeasured together with axial and radial fission-rate determined experimentally.
- 649 -

JAERI-Conf 2003-019 JP0450122
Sensitivity Study Applied to the CB4 WER-440 Benchmark on Burnup Credit
Ludmi la MarkovaNuclear Research Institute at Rez, pic., Czech Republic
mar�nri.cz
Abstract
A brief overview of four completed portions (CBI, C132, CB3, CB3+, CB4) of the international VVER-440benchmark focused on burnup credit and a sensitivity study as one of the fal views of the benchmark resultsare presented in the paper.Finally, the influence of real and conservative VVER440 ftiel assembly models taken for the isotopicscalculation by SCALE sas2 on the system kff is shown in the paper.
KEYWORDS: burnup credit, criticality safety calculations, multiplication factor, VVER reactor type
1. Introduction VVER spent fuel isotopics resulting from the CB2calculations with different codes for an infinite array
In 1996, when the Czech Republic joined OECD of the VVER440 spent ftiel pin cells was performedNEA, the Nuclear Research Institute at Rez (NRI) using MCNP code and published as an IAEA TCMpresented an international VVER Burnup Credit 2000 contribution.Calculational Benchmark Proposal to participants of As in this previous study, the present paper assessesthe Atomic Energy Research (AER) research activity multiplication factors resulting from a series ofof the countries operating VVERs. The specification criticality calculations for a more complicated systemof the benchmark was based on the previous and - the conceptual cask of CB4 benchmark. Usingcurrent work of the OECD/NEA/NSC` Burnup Credit KENO VI code and changing the isotopics input dataCriticality Benchmark Working Group. One of resulting from the CB2 calculations, the multiplicationbenchmark goals was to start with performing the factors of the finite array of the VVER440 fuel pinburnup credit studies in the VVER application area cells were calculated. The evaluation of the resultsand compare the results with those obtained shows the sensitivity of the calculated finite systempreviously for PWR under OECDNEA/NSC activity. reactivity to different calculational methodologies
Step by step, four phases (CB I, CB2, CB3 and used for the spent fuel inventory computation. TheC134) of the benchmark were specified, calculated and previously performed sensitivity study mentionedcompleted. In the course of evaluations, the fel of above differs from these calculations just due to the3.6 enrichment specified in the first benchmark and finite system of the CB4 conceptual cask. On the otherwidely used in VVER-440 as well had to be changed hand, spent fuel of uniform burnup and 36 wt.% ... Uto prove that its 'end effect' could also be positive, as initial enrichment is used in this study in contrast within the case of the PWRs of the western type. The the original CB4 benchmark specification using 44change of ftiel enrichment to 44 created a need to wt.% and axially profiled bumup.specify a new, modified portion of the benchmark,CB3+, similar to C133. Further, a modification of theCB2, named CB2-S, centring on source calculations,was specified additionally. The individual benchmark 2. Overview of the VVER Burnupresults were compared with one another and then Credit Calculational Benchmarkcompared as a whole with the results of the adequate PortionsOECD/NEA/NSC benchmark phases for PWR.
After the CB2 benchmark completion, the study Table 1, below, provides a brief description of theof multiplication factor sensitivity to the spread of individual phases of the VVER benchmark.
650 -

JAERI-Conf 2003-019
Table I VVER Burnup Credit Benchmark: A Brief Description
Phase Primary Objective Specified/CompletedReference
CBI Criticality calculations of an infinite array of fresh and spent VVER-440 fuel 1996/1998pins were aimed at the examination of calculational effects of major actinidesand major fission products on the multiplication factor and the methodology 1)intercomparison.lsotopics specified: initial enrichment of 36 ... U 030-40 GWd/tu burnupand 1-5 y cooling time.
C132 Computation of nuclide concentrations for depletion in a simple VVER-440 1997/2000pin cell followed by the methodology intercomparison .Specification: fuel initial enrichment of 36 Wt % 23'U, 30-40 GWd/tu burnup 2)andO-1-5 coolingtime.
sensitivity Using the MCNP 4B code and changing the isotopics input data as resulting 2000study from CB2, the multiplication factor of an infinite array of the VVER440 fuel 3)
pin cells was calculated. The spread of the k-results relative to the mean wasfound to be less than or about ± M
CB3 Criticality calculations of a radially infinite array of fresh and spent VVER440 1998/2000fuel pins with axially distributed burnup were aimed at the examination ofeffects of burnup profile as well as major actinides and major fission products. 2)The methodology intercomparison followed.Isotopics specified at 36 Wt % 115U, 0-10-3040 GWd/tu (Jaslovske BohimiceNPP axial burnup profile) and 1-5 y cooling time.
CB3+ The same objectives as CB3 but isotopics specified at 44 Wt % 23-IU (Kola NPP 2000/2001axial burnup profile). 4)
CB2-S Based on the CB2 specification, the portion is aimed at source calculation and 2000/2002intercomparison. 5)
CB4 Criticality calculation of a conceptual WER-440 spent fuel cask, the 2001/2002intercomparison followed.Isotopics specified at 44 wt ... U, 010-3040 GWd/tu (Kola NPP axial 6)b file) and 1-5 y cooling time.
sensitivity Using the KENO VI code and changing the isotopics input data, as resulting 2003study from CB2, the multiplication factor of the conceptual VVER440 cask system,
as defined by CB4, was calculated. The spread of the k-results relative to the the presentmean can be seen in Table 2 work
contributors to the spent ftiel reactivity recommended3. Sensitivity Study for the burnup credit calculations, were: U-235, 236,
238, Pu-238, 239, 240, 241, 242, Am-241, 243, Np-The C132 benchmark results consist of 12, 10, 11 and 237, Mo-95, Tc-99, Ru-101, Rh-103, Ag-109, Cs-133,10 sets of 26 nuclide concentrationS2) submitted by the Nd-143, Nd-145, Sm-147, Sm-149, Sm-150, Sm-151,C132 benchmark participants for cases involving 30 Sm-152, Eu-153, Gd-155.GWd/tu burnup and I year of cooling time 30 1), 30 The C132 evaluation 2) showed the spread ofGWd/tu burnup and years of cooling time (30_5), 40 nuclide concentrations calculated by the participants.GWd/tu burnup and I year of cooling time 40_1), and If the estimated standard deviation of 10% was chosen40 GWd/tu and years of cooling time 40_5) to define the difference between 'good' and 'poor'respectively. Each set of nuclide concentrations agreement in the calculations of the nuclideresulted from a calculation using a calculations[ concentration for a given isotope by the participants,methodology specific to the given participant. The there were several more spread isotopes: Am-241nuclides selected for CB2 evaluation consisted of I I (I I %), Ani-243 12%), Ag- 1 09 13%), Sm 149 12%),actinides and 15 major fission products, the main Sm-151 (15%) and even Gd-155 52%). It should be
- 651 -

JAERI-Conf 2003-019
noted that a similar spread resulted from the evaluated again and found to be distributed normally. Theresults of the similar OECD benchmark (Pu-238 outliers and the mean and estimated standard(14.78%), Ani-243 10.71%), Ag-109 10.62%), Sm- deviations are mentioned in the titles of the separate149 (14.92%), Sm-151 22.15%) and Gd-155 figures.(33.23%))').
Each set of original final CB2 resultS2) was
used as the input data for a reference criticality 4. Revised CB2 Calculationscalculation by KENO VI with the 44GROUPNDF5library. Thus, in total, 12, 10, 11 and 10 sets of Before the KENO VI calculations and the evaluationmultiplication factors for the CB4 finite system described above, data for the SCALE sas2 calculations(VVER440 conceptual cask loaded with spent ftiel of of the CZ- and SK- participants were changed to3.6% ... U initial enrichment) were computed. As in model the VVER440 fuel assembly more exactlythe case of the previous sensitivity study for the than in their original CB2 calculations. Both isotopicsinfinite system it was believed that the 3) -results resulting from the latest SCALE sas2 calculations and
should be normally distributed for each separate case the original CB2 results then entered the KENO VIof a given burnup and cooling time if the calculational criticality calculations but only kff obtained for themethodology was adequate and used appropriately. In revised isotopics represented the CZ- and SK-order to either confirm or reject this hypothesis, all the participants in the statistical evaluation.sets were statistically explored and tested (a=0.05). All the calculated values of keff are shown in Fig. The statistical evaluations found three outliers (see Fig. Fig. 4 and also can be found in Table 2 below. SinceI - Fig. 4 below); two of them were also indicated in the revised VVER-440 fuel assembly model used inthe previous sensitivity stud Y3) as being due to the use the new SCALE sas2 calculations is less conservative,of a fixed (non-problem-dependent) library for the the multiplication factors resulting from the KENO VIisotopic concentration calculations. After removing calculations using the revised isotopics data are lower,the outliers, the sets of k-results were explored once which decreases the spread of the results.
Table 2 The CB2-CB4 kff results ±0.0004)
isotopics data2) 30-1 30-5 40-1 40-5
SCALE, Finland 0.8612* 0.8408* 0.8018* 0.7685*
Casmo4, Finland 0.8840 0.8615 0.8311 0.7945
Origen2, Cuba 0.8537* not calculated not calculated not calculated
HELIO 0.8780 0.8592 0.8209 0.7955S1.5 CZSCALE, CZ - the original CB2 results*** 0.8919 0.8774 0.8456 0.824
SCALE, CZ - ftiel assembly corrected model 0.8804 0.8644 0.8274 0.8068
WIMS7, CZ 0.8900 0.8726 0.8391 0.8153
NUKO, Germany 0.8779 not calculated 0.8201 not calculated
WIMS7B, UK 0.8890 0.8713 0.8379 0.8141
MCU, Russia 0.8794 0.8629 0.8234 0.8012
SCALE, SK - the original C132 results*** 0.8866 0.8709 0.8397 0.8184
SCALE, SK- fuel assembly corrected model 0.8759 0.8605 0.8231 0.8011
SCALE4.4, Spain 0.8896 0.8742 0.8419* 0.8206
TVS-M, Russia 0.8834 0.8719 0.8286 0.8138
mean ** 0.8828 0.8665 0.8280 0.8070
estimated StD 0.6 0.7 0.8 1.2
recognized as an outlier in the course of the statistical evaluationoutliers excluded from the samplenot considered in the evaluation
- 652 -

JAERI-Conf 2003-019
5. Conclusions 3) L. Markova, "Study of multiplication factor
sensitivity to the spread of VVER spent fuelThe calculations presented above were performed at isotopics calculated by different codes", UJVthe end of VVER-440 bumup credit benchmarking so 11470, TCM on the Evaluation and Reviewthat the influence of different methodologies for the of the Implementation of Burnup Credit inisotopic concentration prediction on the multiplication Spent Fuel Management System, IAEA-factor computation could be assessed in a fite case TECDOC-1241, IAEA Vienna, July 10-14,similar to that of a real spent fuel system. 2000.In agreement with the conclusions of the sensitivity 4) G. Hordosy, "Final evaluation of the CB3+study previously performed for TCM 20003), it i burnup credit benchmark addition", Meeting
shown (see Tab. 2 above) that the relatively big of the OECD/NEAINSC WPNCS Expertdifferences among the CB2 iSotopiCS2) leads to a Group on Burnup Credit, Paris, December
spread of less than or about 1 in the multiplication 3-6, 2001factors for all the calculated cases of different burnups 5) V. Chrapciak, "The Numerical Benchmark(30 and 40 MWd/kgU) and cooling times (I and CB2-S, Final Evaluation", Proc. 12'h AERyear) in this finite case of the conceptual VVER-440 Symposium, Sunny Beach, Bulgaria,cask. In other words, hypothetic cask designers using September 22 - 28, 2002.the different methodologies for isotopics prediction 6) L. Markova, "Final Evaluation of CB4compute the loading curve by putting values that can VVER Benchmark", UV 11 785, 1 Vh
differ up to about 1% into criticality criteria. meeting of the OECD/NEA/NSC WPNCSAs far as the assessment of the conservativeness of the Expert Group on Burnup Credit Criticality
Safety of the Working Party on Nuclearsimplified model used in SCALE sas2 calculation (see Criticality Safety, Issy les Moulineaux, Paris,Fig. I - 4 above) is concerned, the results support a France, Sept. 912, 2002.recommendation for VVER SCALE users to model 7) M. D. DeHart, M. C. Brady, C. V. Parks,the VVER440 fuel assembly in the SCALE sas2 "OECD/NEA Burnup Credit Calculationalinput as follows Criticality Benchmark, Phase -B Results",3 044 0.515 3 0640545 500 72185 3 73505 6 NEA/NSC/DOC(96)-06, ORNL-6901, June7.56053 1996.instead of the SCALE sas2 problem inputs in 8) which 8) L. Markova, "SCALE User's Manual forcould be considered to be only a rather conservative VVER-related Applications", LAEA Vienna,simplification June 1998.3 044 5 0.51 3 0640545 50 73505 6 756053
The paper is available at ftp://nri.czJpub/OECD/BUC.
6. References
1) L. Markova, "Continuation of the VVERBumup Credit Benchmark: Evaluation ofCBI Results, Overview of CB2 Results toDate, and Specification of CBY, Proc. 8hAER Symposium on VVER Reactor Physicsand Reactor Safety, Bystrice nadPernstejnem, Czech Republic, September 2 -25, 1998.
2) L. Markova, "Final Evaluation of CB2 resultsand Preliminary Evaluation of CB3 results(VVER440 Burnup Credit Benchmark)",UJV II 412, 5h Meeting of the AER WorkingGroup E, Rez near Prague, Czech Republic,April I I - 2 2000.
- 653 -

JAERI-Conf 2003-019
0.9revised CB-2 data
0.89
0.88
0.87outlier outlier
0.86
0.85
0.84
0.83N N
U U go
o 0-� Ln P9
W 0 U Uto T W� cc
UO
Fig. I KENO VI keffsensitivity calculations for VVER conceptual cask with 36% fuel, 30 MWd/kg uniformburnup, ly cooling time (the mean of the original data: 0879, a=1.3%, the mean of the data without the outliers:0.883, y=0.6%)
0.89 -revised CB-2 data
0.8 -
0.87
0.86outlier
0.85
0.84
0.83
0.82
U Ukq
V
U U UCA
Fig. 2 KENO VI keff sensitivity calculations for VVER conceptual cask with 36% fuel, 30 MWd/kg uniformburnup, 5y cooling time (the mean of the original data: 0864, a=1.1%, the mean of the data without theoutlier: 0867, 7=0.7%)
- 654 -

JAERI-Conf 2003-019
0.85 revised CB-2 data outlier
0.84
0.83
0.82
0.81outlier
0.8
0.79
0.78
0.77.S 4
kK 009
C-oO
C 04 �4
Fig. 3 KENO VI keff sensitivity calculations for VVER conceptual cask with 36% fuel, 40 MWd/kg uniformbumup, I y cooling time (the mean of the original data: 0827, r=1.4%, the mean of the data without the outliers:0.828, Y=0.8%)
0.83 -revised CB-2 data
0.82
0.81
0.8
0.79
0.78outlier
0.77
0.76
0.75
0.74
letU 0 U(n �-4
Fig. 4 KENO VI keff sensitivity calculations for VVER conceptual cask with 36% fuel, 40 MWd/kg uniformburnup, 5y cooling time (the mean of the original data: 0803, y=1.9%, the mean of the data without the outlier:0.807, cr=1.2%)
- 655 -

JAERI-Conf 2003-019 JP0450123
Source Convergence Problems in the Application of Burnup Credit forWWER-440 Fuel
Gdbor Hord6sy'KFK[Alomic Energy Research Institute, 112IBudapest, Konkoly-Thege u. 29-33, Hungary
The problems in Monte Carlo criticality calculations caused by the slow convergence ofthe fission source are examined on an example. A spent ftiel storage cask designed forWWER-440 ftiel used as a sample case. The influence of the main parameters of thecalculations is investigated including the initial fission source. A possible strategy isproposed to overcome the difficulties associated by the slow source convergence. Theadvantage of the proposed strategy that it can be implemented using the standard MCNPfeatures.
KEYWORDS: burnup credit, source convergence, WWER-440
1. Introduction diagnostic features incorporated in Monte Carlo codesare not in every case sufficient to decide whether the
The slow convergence of the source in Monte Carlo convergence is achieved or not. The same holds forcriticality calculations of loosely coupled systems is a the fission distribution convergence.widely known problem. Real-life examples of such It seems to be straightforward to use the role of thesystems occur in spent fuel storage. This effect has initial source in diagnosing the convergence. If weparticular importance in the application of burnup perform k.ff calculations with strongly different initial
credit, because an irradiated fuel assembly necessarily source, initially the calculated values of thehas higher burnup at its middle part and lower burnup multiplication factors will be different. When theat the ends. In the case of high burnup the reactive fission ractions are apparently converged in theparts of the assembly are separated by the strongly different calculations and the kff values resulting fromabsorbing central part. This may result slow or even calculations with different initial source are equalerroneously identified source convergence which can within the statistical error, it is reasonable to assumelead to the underestimation of the multiplication that the convergence is achieved.factor. According this strategy we suggest performing a
The source convergence will be investigated on the series of calculations with different number of neutronexample of a conceptual dual purpose cask designed per cycles, inactive and active cycles and withfor WWER-440 fuel. The axial length of such fuel is different initial sources. Beside, we define separate244 cm, which is less then that of a typical PWR fuel. tallies for fission fraction in a number of layers andThis may result less difficulties in source convergence. during the individual calculations periodically makeHowever, the regular use of absorber rods during complete printout for the tallies by the MCNP. (Thesenormal WWER-440 reactor operation increases the periodic printouts will be referred as control steps.)asymmetry of the axial burnup distribution, which Completing all the calculationsincreases the source convergence difficulties 0 Discard the cases when MCNP doesn't print finalaccording the recent experiences. The purpose of this keff result because of normality check failurepaper is to develop a strategy which can help a 0 Discard the cases when MCNP give warning(s)criticality analyst in the identification of the properly for keffconverged kff and to get an estimation of the 0 Check the periodic printout of the ten statisticalnecessary number of neutrons and cycles. checks for tallies. Discard the cases, when there
is no at least a few control steps, when all the2 A possible strategy for the investigation of the fission fraction tallies meet all the statisticalsource convergence checks
0 Investigate the behavior of the statistical checksIn a Monte Carlo criticality calculation the basic as function of control steps. Select those cases
factors influencing the accuracy of the calculations is where all tallies meet all the checks during thethe number of neutron per cycle, the number of cycles last few control stepsskipped and the number of active cycles. Using 0 Investigate the fission fractions change in thesesufficiently large number of neutrons, the proper value control steps whether it is really so small asof the keff can be calculated. However, the standard expected
CaTespondingauthorTel.+36-1-392=, Fax+36-1-395-9293,E-mafl:hordosy�sunservkiMhu
- 656 -

JAERI-Conf 2003-019
Compare the fission fractions from those and the isotopic composition were given in these 0calculations which are seemed to be converged nodes and were taken from the 3C133+ WWER-400Compare the kff calculated from cases where the burnup credit benchmark addition ). The detail of thefission fractions converged inside a calculation geometry and material composition of the cask as welland the fission fractions from different as of the fuel is given in the benchmarkcalculations are close to each other. specification 1,3). This problem has aready been used
4)The advantage of this approach is that it can be for source convergence studiesimplemented using the standard MCNP features. Thefeasibility of the method will be investigated on a 3.2 Description of the calculationssample case. To examine the source convergence on a system
with such characteristics, two sets of criticality3. Investigation of the sample case calculations with different parameters were made for
the cask. In the first set relatively small number of3.1 Description of the investigated system neutron was used: 5000, 10000 and 15000 neutron
The strategy described above was applied to a per generation, 50, 100 and 150 skipped and 800conceptual storage cask designed by using the burnup active cycles were used. In the second set thecredit for WVVER-440 fuel. The investigated case was corresponding numbers were 20000, 40000 and 60000taken from the CB4 burnup credit benchmark defined neutron per generation, 300, 500 and 700 skipped andby Markova'). This benchmark is the last part of the 1000 active cycles. All calculated cases wereburnup credit benchmark series which was studied in investigated using four initial sources:the AER collaboration of the WWER-440 reactor a, uni source along the total axial length of theusing countries and which corresponds to the burnup fuelcredit benchmark series organized by the b, source in the nodes at the topOECD/NEA 2). In the C134 part of the benchmark c, source in the nodes at the bottomseries the influence of the axial burnup distribution on d, source in the nodes with highest burnup (third nodethe criticality of a spent fuel cask was studied. In this from top). Loosely speaking this case will be referredbenchmark a cask filled with 84 spent fuel assemblies as middle.was investigated. The horizontal cross section of the Altogether, both sets consist of 36 calculations. Forcask is shown on Fig. 1. the identification of the individual cases in a set the
k/n/z abbreviation will be used. Here k is the numberof neutron per generation in thousands, n is thenumber of skipped cycles in hundreds, and z refers tothe initial source: U for uniform, T for top, forbottom and M for highest burnup source. As anexample, 15/0,5/T refers to a calculation with 15000neutrons per generation, 50 cycles skipped and sourceis defined at the top.
The fission fraction was evaluated in ten layerscorresponding to the nodes of the assemblies. Thefission fraction in each layer was defined as a separatetally and they were printed after each 50 active cycles.The notation Fij will be used for the fission fractionsfrom a particular calculation. Here i is the number ofthe control steps and j is the number of the node.(Themaximal value of i for the first set of parameters is 16,for the second set is 20.) The meeting of the tenstatistical checks used by the MCNP is examined in
Fig.1 Horizontal cross section of the cask these control steps. (It should keep in mind that as theresult of a Monte Carlo calculation is subjected to
The initial enrichment of the assemblies was 44 statistical fluctuation, the same holds for the results ofand they had identical axial burnup distribution. In the the statistical checks.)case selected for examining the source convergence, In the following in comparison of two calculatedthe average burnup of the assemblies was 40 values, y and Y2 for example, their differenceMWd/kgU and the cooling time was years. 12 generally will be expressed as a relative quantity A=
actinides and 15 fission products were considered in (YI-Y2)1 01 where ---= F2 2the calculations. The axial length of the active part of U 1 fl (1)
the ftiel assemblies is 244 cm. Here cy, and 72 are the variances of the two quantitiesThe assemblies were divided into ten axial nodes to be Compared. Loosely speaking the agreement is
with equal length. The axial distribution of the burnup
- 657 -

JAERI - Conf 2003 - 019
acceptable if A is less about two. would be superior to the 15/l/T or 15/1.5/T. Based onthe statistical checks the case 15/0.5/T seems to be
3.3 Results of the calculations using the first set of best: the statistical criteria were met during the lastparameters nine control steps. This case will be considered as
Using the first parameter set, in five cases MCNP reference case for this set of calculations.even did not print final kff because of the total lack of For these best cases the "inner" convergence of thenormal distribution of the individual kff values. In fission fraction distribution was examined during thethese cases the number of skipped cycles was 50 last control steps. The change of the difference F16 -
with bottom and middle initial source. Four other Fij with varying value of i was considered for thecases were discarded because MCNP issued some different calculation. In several cases the differencewarning on kff.. In that cases also bottom and middle was significantly higher than the supposed A 2 Ininitial source was used with 50 or 100 skipped some cases this difference was higher than two evengeneration. Eight additional cases were excluded in the last two control steps. This is illustrated on thebecause there were no control steps when all tallies example of 10/l/T shown on Table 2.would have passed the 10 MCNP statistical tests. Inthese cases bottom, middle and uniform initial source N NC=12 NC=13 NC=14 NC=15was used with different combination of the two other 1 -2.81 -2.74 -2.47 -1.50varying parameters. 2 -3.63 -4.60 -2.60 -2.05
The closer look of the remaining seventeen cases 3 -5.14 -4.86 -2.74 -2.18shoes that the statistical tests shows quite random 4 -6.09 -5.15 -3.61 -2.28behavior during the calculations. This illustrated on 5. -5.07 -4.44 -3.44 -1.14the Table 1, where the number of tallies passed all 6 -1.65 -2.28 -2.28 -0.50MCNP statistical checks is sown as the function of the 7 -0.53 -1.90 -2.33 -0.59control steps for some sample cases. The total number 8 -0.27 -1.22 -0.61 0.39of tallies is IO. 9 1.60 2.48 2.10 0.66
NC 5/0.5/T 15/0.5/T 5/1.5/M 10/1.5/U 101 2.75 3.84 .99 1.13
1 7 6 7 4 Table 2 Deviation of the fission fractions from the2 7 10 7 8 finally calculated values for the last four control steps3 10 9 8 6 in the case of 10/l/T. N is the node number from4 8 10 6 9 bottom to top, NC is control step number. For these5 10 9 6 10 four control steps all MCNP checks were met for all6 10 10 10 10 of the nodes.7 10 9 9 10 The source convergence seems to be even worse if8 10 10 10 9 we compare the final fission fraction distributions9 10 10 10 8 from different calculations with distribution from the
10 10 10 10 10 reference case. This is shown in Table 3 for someI 7 10 8 8 sample cases. Examining the best six cases selected12 10 10 8 9 above, the differences frequently are as high as about
3 10 10 9 8 A=10.14 10 10 8 715 10 10 8 8 N 5/0.5/T 10/l/T 10/1.5/T 511.51U16 10 10 8 8 1 6.77 2.17 4.74 9.14
2 0.07 2.98 5.64 4.73
Table 1 Number of tallies passed all statistical 3 -8.45 4.73 7.68 6.70checks during the calculation for sample cases. NC is 4 -9.11 2.34 3.12 -1.69the number of control step. 5 -10.84 -3.95 -1.00 -7.12
From these seventeen cases there were six, where 6 -7.87 -5.21 -3.93 -9.09all the tallies passed all the MCNP statistical checks 7 -3.34 -5.14 -5.17 -5.25during the last four or more control steps. This choice 8 -0.93 -6.68 -8.36 4.25of the last four control steps is somewhat arbitrary. 9 3.24 3.66 2.99 2 7 3HThese cases are as follows: 5/0.5/T, 5/1.5/U, 10/0.5/T, I 4.77 7.67 7.86 7.2010/l/T, 10/1.5/T and 15/0.5/T. These results are not
quite similar which one can expect. An observable Table 3 Difference among fission fractionstendency is the good results with initial source at the calculated for different case compared to the referencetop. Here it should be reminded, that the meeting of case. N is the node number from bottom to top. Forthe statistical criteria is subjected to statistical these cases all MCNP checks were met for all of thefluctuation. There is no reason that the 15/0.5/T case nodes during at least for the last four control steps.
- 658 -
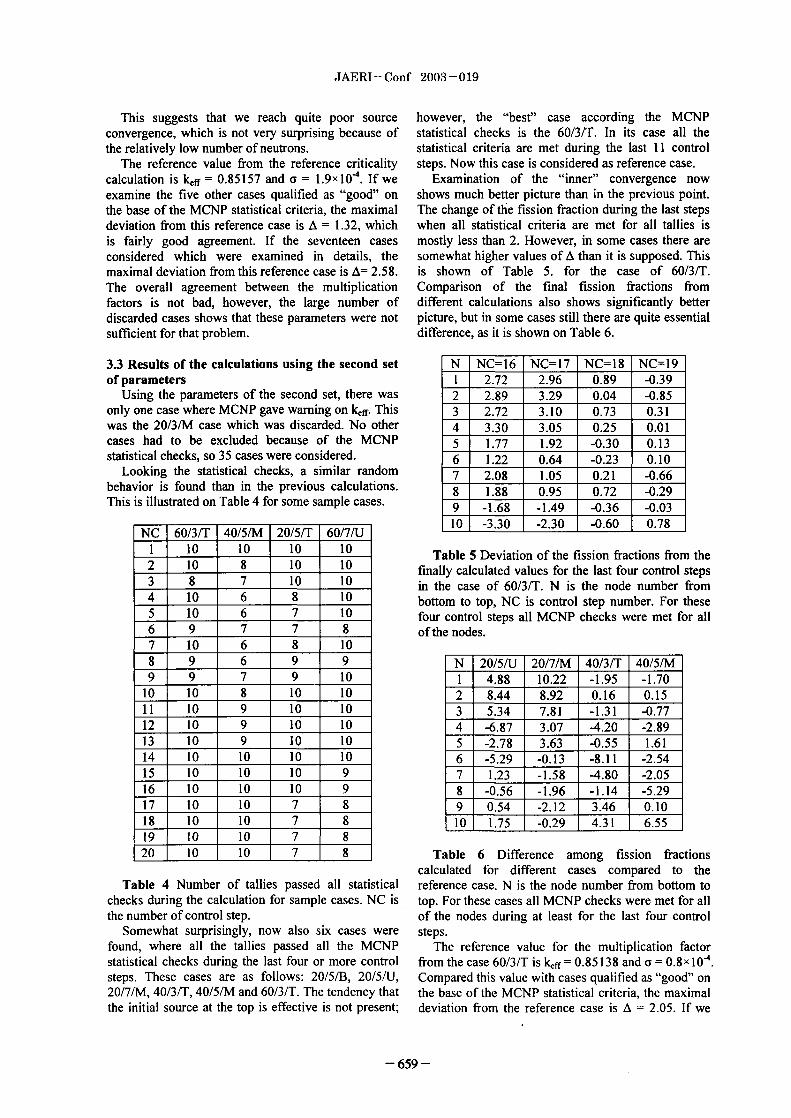
JAERI-Conf 2003-019
This suggests that we reach quite poor source however, the "best" case according the MCNPconvergence, which is not very surprising because of statistical checks is the 60/3/T. In its case all thethe relatively low number of neutrons. statistical criteria are met during the last I I control
The reference value from the reference criticality steps. Now this case is considered as reference case.calculation is keff = 085157 and a = 1.9xIO-4. If we Examination of the "inner" convergence nowexamine the five other cases qualified as "good" on shows much better picture than in the previous point.the base of the MCNP statistical criteria, the maximal The change of the fission fraction during the last stepsdeviation from this reference case is A = 132, which when all statistical criteria are met for all tallies isis fairly good agreement. If the seventeen cases mostly less than 2 However, in some cases there areconsidered which were examined in details, the somewhat higher values of A than it is supposed. Thismaximal deviation from this reference case is A= 258. is shown of Table 5. for the case of 60/3/T.The overall agreement between the multiplication Comparison of the final fission fractions fromfactors is not bad, however, the large number of different calculations also shows significantly betterdiscarded cases shows that these parameters were not picture, but in some cases still there are quite essentialsufficient for that problem. difference, as it is shown on Table 6.
3.3 Results of the calculations using the second set N NC=16 NC=17 NC=18 NC=19of parameters 1 2.72 2.96 0.89 -0.39
Using the parameters of the second set, there was 2 2.89 3.29 0.04 -0.85only one case where MCNP gave warning on kff. This 3 2.72 3.10 0.73 0.31was the 20/3/M case which was discarded. No other 4 3.30 3.05 0.25 0.01cases had to be excluded because of the MCNP 5 1.77 1.92 -0.30 0.13statistical checks, so 35 cases were considered. 6 1.22 0.64 -0.23 0.10
Looking the statistical checks, a similar random 7 2.08 1.05 0.21 -0.66behavior is found than in the previous calculations. 8 1.88 0.95 0.72 -0.29This is illustrated on Table 4 for some sample cases. 9 -1.68 -1.49 -0.36 -0.03
NC 60/3/T 40/5/M 20/5/T 60/7/U 101 -3.30 -2.30 -0.60 0.78
1 10 10 I 0 10 Table Deviation of the fission fractions from the2 10 8 10 10 finally calculated values for the last four control steps3 8 7 10 10 in the case of 60/3/T. N is the node number from4 10 6 8 10 bottom to top, NC is control step number. For these5 10 6 7 10 four control steps all MCNP checks were met for all6 9 7 7 8 of the nodes.7 10 6 8 1 0
8 9 6 9 9 N 20/5/U 20/7/M 40/3/T 40/5/M9 9 7 9 10 1 4.88 10.22 -1.95 -1.70
10 I 0 8 10 10 2 8.44 8.92 0.16 0.151 1 10 9 1 0 1 0 3 5.34 7.81 -1.31 -0.7712 1 0 9 10 I 0 4 -6.87 3.07 -4.20 -2.8913 1 0 9 10 10 5 -2.78 3.63 -0.55 1.6114 10 10 10 10 6 -5.29 -0.13 -8.11 -2.541 5 1 0 1 0 1 0 9 7 1.23 -1.58 -4.80 -2.051 6 1 0 10 I 0 9 8 -0.56 -1.96 -1.14 -5.291 7 10 10 7 8 9 0.54 -2.12 3.46 0.10
10 1 7 8 1 0 1.75 -0.29 4.31 6.5510 I 0 7 810 10 7 9 Table 6 Difference among fission fractions
calculated for different cases compared to theTable 4 Number of tallies passed all statistical reference case. N is the node number from bottom to
checks during the calculation for sample cases. NC is top. For these cases all MCNP checks were met for allthe number of control step. of the nodes during at least for the last four control
Somewhat surprisingly, now also six cases were steps.found, where all the tallies passed all the MCNP The reference value for the multiplication factorstatistical checks during the last four or more control from the case 60/3/T is kff = 085138 and a = 0.8x 10⁻⁴.
steps. These cases are as follows: 20/5/13, 20/5`U, Compared this value with cases qualified as "good" on20/71M, 40/3/T, 40/5/M and 60/3/T. The tendency that the base of the MCNP statistical criteria, the maximalthe initial source at the top is effective is not present; deviation from the reference case is A = 205. If we
- 659 -

JAERI - Conf 2003 - 019
consider the thirty five cases which were examined indetails, the maximal deviation from this reference case 2.50E03
is A= 248. 2.00603
The absolute value of the difference between the 1z�e 1.50603-minimal and maximal values of kff for these 36calculations is 5.8xlO-4. This spread seems rathersmall compared that 3 different munbers of neutron 5.0015-04
per gneration 3 different number of inactive cycles 0 OO&OOand 4 different initial sources were used. This 100 200 300 400 500 600 700 00 900 1000
probably can be explained by the large number of numbe, of the actiw cycles
neutrons used in any combinations. This number washigh nough that the kff values calculated by differentinitial source converge close to each other. Ts Fig. 3 Change of the kff spread with active cyclephenomenon is illustrated on Fig.2. number
Keff from diff erent initial sources for the 4. Conclusions60000/300 cases The convergence of the fission source was
examined on the example of a WWER-440 spent fuel0 525P storage cask. For the investigations standard MCNP
O.M I features were used only. The strong fluctuation of the
0.6515 number of passed statistical checks during thecalculations was observed. Using different initialfission sources for diagnosing the convergence of the
3 multiplication factor was found to be useful. The
discrepancies in the fission source sometimes haveonly minor influence on the mtiplication factor. Itwas found that for this type of criticality problems a
2.805 few times ten thousand neutrons pr generation a few
hundred skipped cycles and 600-700 or more activea Im 3W W M no no low cycles is necessary.
Nun-ber of active cycles
AcknowledgmentsThe author wishes to thank the possibility of using
Fig. 2 Kff calculated by four different initial sources the computers of the Hungarian National Informationas ftinction of the active cycles. Infrastructure Development Center.
On ts figure the tree upper curves corresponding Referencesto uniform, top and iddle initial source come very 1) L. Markova: Final Evaluation of CB4 VVERclose to each other. The curve due to the bottom Benchmark (NRI 11 785, 1 Ith Meeting of thesource tends to a lower value. The difference to tis OECD/NEA/NSC WPNCS Expert Group onlower value in kff is about 38 x 10-4. Bumup Credit Criticality Safety of Working Party
This small spread in keff suggests that the number on Nuclear Criticality Safety, Issy les Moulineaux,of neutron used in the calculations is sufficient to Paris, September 912, 2002)calculate the multiplication factor with widely varying 2) L. Markova: Calculational Burnup Creditinitial source. The question whether this small spread Benchmark Proposal 6th AER Symposium onof the multiplication factor is true with lower number VVER Reactor Physics and Reactor Safety,of active cycles but keeping the other parameters Kirkkommu-ni, Finland, Spt. 23-26, 1996)unchanged was examined. The difference of the 3) G. Hord6sy. Final Evaluation of the CB3+ Burnup
maximal and minimal keff as the ftinction of the Credit Benchmark Addition The 5thnumber of active cycles was evaluated for the 36 OECD/NEAINSC WPNCS EGBUC Meeting,combination of neutrons per generation, passive Chateau de la Muettc, Paris, France, December 36,cycles and initial sources used in the previous 2001)calculations. The result is shown on Fig. 3 4) J. Kyncl, "A Note on Numerical Solution to the
It can be seen. that above 800 active cycles the Problem of Criticality". Proc. Of the 12t" Symp Ofspread is pctically unchanged and above 600 the Atomic Energy Research Cooperation on WWER
1 0-3 Reactors, Sunny Beach, Bulgaria, Sept. 22-28,spread is still bellow about . This suggests that theuse of 700-900 active cycles is sufficient for such 2002problems using similar set of the other parameters.
- 660 -

JP0450124JAERI-Conf 2003-019
Comparative Analysis of Isotope Cmposition of VVER-1000 Spent Fuel Depending on TheirManufactory and Operation Conditions
Y.Kovbasenko, Y.Bilodid, M.Yeremenko
State Scientific and Technical Centre on Nuclear and Radiation Safety (SSTC NRS)35-37 Radgospna st., 03142, Kyiv, Ukraine
ypjovbasenko�sstc.kiev.ua
Isotope composition of spent fuel is determined by not only of its burnup level, but also those conditions,or, more exactly to say, by that neutron spectrum under which this burnup occurred. Spent nuclear fuel with thesame burnup value can have different isotope composition depending on neutron spectrum in which this burnuptook place. This work has analyzed the impact on VVER I 000 spent fuel isotope composition caused by thedifferent operational conditions, such as the presence or absence of absorber-rods in an assembly, oscillating theconcentration of boric acid, dissolved in the moderator (water) during the campaign, fuel and/or moderatortemperature, as well as changes in water amount at the periphery of an assembly due to its location in the centralor periphery part of the core and/or due to changes in inter-assembly gaps. Also, impact caused by technologicalallowances applied while manufacturing fuel assembly (FA) was analyzed, being equal to 45 kg/FA by weightof fuel, and 0.05% by its enrichment.
Calculations were made for reactor cell of fuel assemblies for VVER -1000. This was composed of thefuel assemblies with the maximum multiplying purpose (enrichment of 4.4% aanged with pitch of 23.6 cm.
Concentration as function of burnup of ten isotopes which are the most usable in "burnup credit"methodology, such as main ftiel isotopes U235, U236, U238, Pu239, Pu240, Pu241, as well as some actinides,and fission products, such as Pu242, Am24 1, Sm 49, Sm 1 51 was analyzed.
KEYWORDS: spent fuel, isotope composition, burnup credit, VVER-1000
1. Introduction The more hard was neutron spectrum, the more U238is involved into the burnup process (mainly, due to
Determination of isotope composition of spent fuel generation of Pu239), and the more U235 is remainedis necessary to solve the tasks related to: in spent fuel under the same burnup level. Therefore,
- Account and control of quantity of nuclear hazardous this work considers those operational parameters,material; which changes are capable of influencing upon in-core
neutron spectrum hardening.- Determination of source terms during analysis of Let us separate the main factors, which can affectradiation safety; changes in the neutron spectra during the campaign,
- Using burnup as the nuclear safety parameter while along with the changes in spent fuel isotopesubstantiating safety of spent ftiel management composition:
systems ("burnup credit" principle). 1) The presence of absorbers in an assembly, such
as rods of burnable absorbers or control rods (CR)Assessment of spent fuel isotope composition can clusters.
be subdivided into the two main stages. These are 2) The change in the concentration of the boricdetermination of fuel burnup and determination of fuel acid dissolved in the moderator (water) during theisotope composition depending on its burnup. Theresults presented here deals with the matters of the 2 nd reactor cmpaign.stage. 3) Oscillations of fuel and/or moderator
The isotope composition of spent fuel depending temperature in different areas of the core during theon its bumup is determined, as a rule, by means of the reactor campaign.reactor cell programs, such as CASMO, HELIOS, 4) Oscillations of fuel assembly power density.
WIMS, NESSEL, KASSETA, etc., or by means of the 5) Changes in water amount at the assemblyspecialized calculation programs for spent fuel isotope periphery fuel pins due to location of assembly in thecomposition such as ORIGEN, NLJK0, etc. central or periphery part of the core during the fuel
As it is well known, isotope composition of spent campaign and/or due to changes in inter-assemblyfuel is determined by not only of its burnup level, but gaps.also those conditions, or, more exactly to say, by thatneutron spectrum under which this burnup occurred.
- 661 -
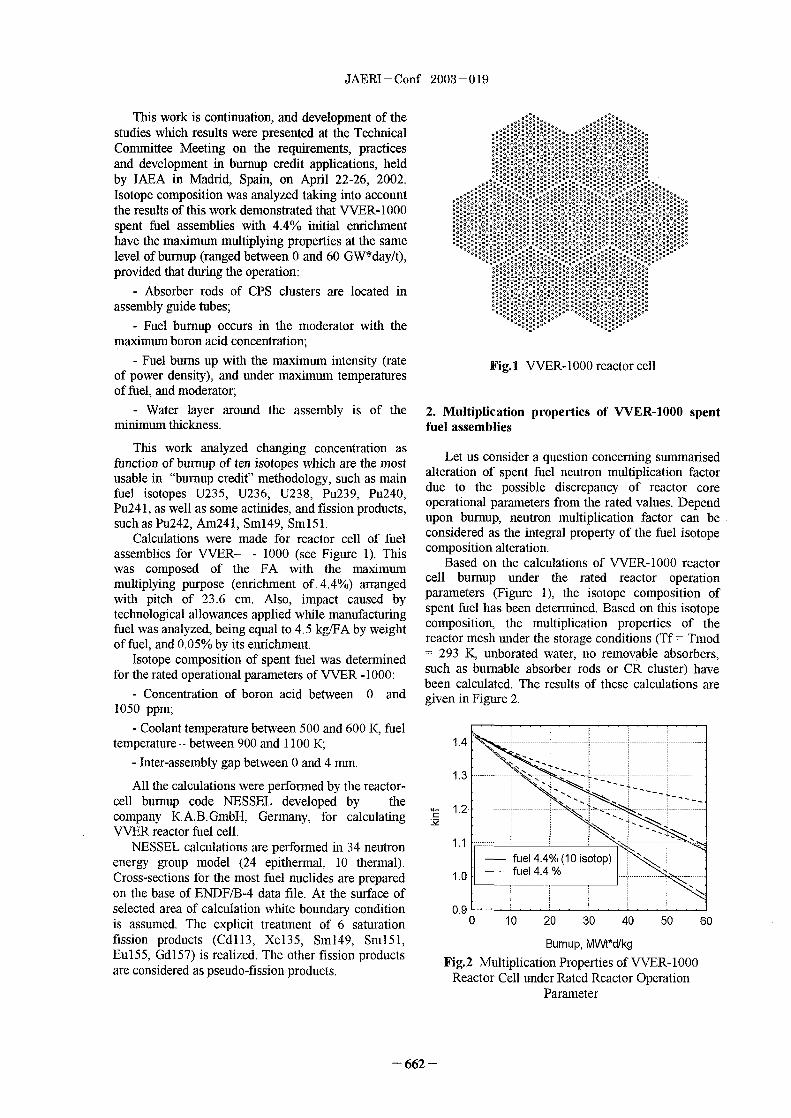
JAERI-Conf 2003-019
This work is continuation, and development of thestudies wich results were presented at the TechnicalCommittee Meeting on the requirements, practicesand development in burnup credit applications, heldby IAEA in Madrid, Spain, on April 22-26, 2002.Isotope composition was analyzed taking into accountthe results of this work demonstrated that VVER-1000spent fuel assemblies with 44% iitial enrichmenthave the maximum multiplying properties at the same . ........ . ...... .level of burnup (ranged between and 60 GW*day/t),provided that during the operation:
-N- Absorber rods of CPS clusters are located in
assembly guide tubes; w:
- Fuel burnup occurs in the moderator with themaximum boron acid concentration;
- Fuel bums up with the maximum intensity (rate Fig.1 VVER-1000reactoreellof power density), and under maximum temperaturesof fuel, and moderator;
- Water layer around the assembly is of the 2. Multiplication properties of VVER-1000 spentminimum thickness. fuel assemblies
This work analyzed changing concentration as Let us consider a question concerning summarisedfunction of burnup of ten isotopes wich are te most alteration of spent fuel neutron multiplication factorusable in "burnup credit" methodology, such as main due to the possible discrepancy of reactor corefuel isotopes U235, U236, U238, Pu239, Pu240, operational parameters from the rated values. DependPu24 1, as well as some actinides., and fission products, upon burnup, neutron multiplication factor can besuch as Pu242, Am24 1, Sml 49, Sin 1 5 1. I considered as the integral property of te fuel isotope
Calculations were made for reactor cell of fue composition alteration.assemblies for VVER- - 000 (see Figure 1). This Based on the calculations of VVER-1000 reactorwas composed of the FA with the maximum cell bumup under te rated reactor operationmultiplying purpose (enrichment of 44%) arranged parameters (Figure 1), the isotope composition ofwith pitch of 23.6 cm. Also, impact caused by spent fuel has been determined. Based on this isotopetechnological allowances applied wle manufacturing composition, the multiplication properties of thefuel was analyzed, being equal to 45 kg/FA by weight reactor mesh under the storage conditions (Tf = Tmodof fuel, and 0.05% by its enrichment. = 293 K, unborated water, no removable absorbers,
Isotope composition of spent fuel was determined such as burnable absorber rods or CR cluster) havefor the rated operational parameters of VVER -I 000: been calculated. The results of these calculations are
- Concentration of boron acid between 0 and given in Figure 2.1050 ppm;
- Coolant temperature between 500 and 600 K, fueltemperature -between 900 and II 00 K; 1.4 - -----
- Inter-assembly gap between and 4 nun.1.3 --- ------ ---
All the calculations were perfornied by the reactor-cell burnup code NESSEL developed by the
1.2 --- ---- j- --- ----company K.A.B.GmbH, Germany, for calculatingVVER reactor fel cell,
NESSEL calculations are performed in 34 neutron- fuelenergy group model (24 epithermal, 10 thermal). 4.4- fuel 44Cross-sections for the most fuel nuclides are prepared 1.0 ---- ---------- -------
on te base of ENDF/B-4 data file. At the surface ofselected area of calculation wte boundary condition 0.,9is assumed. The explicit treatment of 6 saturation 0 1 0 20 30 40 50 60
fission products (CdII3, XeI35, SmI49, SmI51, Burnup, MV\ft*d/kg
Eu155, GdI57) is realized. Te other fission products Fig.2 Multiplication Properties of VVER-1000are considered as pseudo-fission products. Reactor Cell under Rated Reactor Operation
Parameter
- 662 -

JAERI-Conf 2003-019
The two series of calculations were carried out.During the process of neutron multiplication factor Table I - Operational parameters, which were useddetermination, in the first series of calculations, all the while performing isotope composition calculation
isotopes (more than 100 ones), which were used in Set of parameters Av. Max. Min.master-library for reactor-cell code NESSEL, were Enrichment, w&/o 4.4 4.45 4.35taken into account, except for XeI35. During the Weight, kg/FA Av. +4.5 4.5second series of calculations, in the process of themultiplication factor determination, the concentration CR in guide tubes - + -
of only 10 isotopes (U235, U236, U238, Pu239, Boric acid 525 1050 0Pu240, Pu241, Pu242, Am241, SmI49, Sml5l) was concentration, ppmtaken into account. Inter-assembly gap, 2 4 0
The solid lines correspond to the mean rated mm
operational conditions. The mean dashed lines were Coolant temp., 578 600 500received conservatively taking into account ad Kmanufactory tolerances for the fuel productionaccording to uranium enrichment and uranium �Fuel temp., grad K I 100
quantity. The above dashed curves corresponded tothe most conservative meaning of the nominaloperational parameters from the point of view on the The results of conducted calculations of nuclidemultiplying properties of spent fuel. concentration vs. burnup are presented below in
The results, which are shown in the Figure 2 Figures 3 - 12.demonstrate that mentioned above 10 isotopes permitto take into account from 60% to 70% of 0.05multiplication properties variation of spent fueldepending on the ftiel operational parameters chosenfor calculations. 0.04
The maximum multiplication properties have thespent assemblies whose burnup took place under the 0.03 ..............presence of CR clusters, in water with the maximum Ld
boron acid concentration (in our case - 1050 ppm), 0N 0.02under the minimum water layer thickness around the Dassembly (in our case it is 2 mm as to the ratedvalue). 0.01
As the above results indicate, the operationalconditions have more serious influence on spent ftiel 0multiplication properties than fuel manufactory 0 20 40 60
tolerances. Bumup GM d AIn fact, the dashed curves shown in the Figure 2
can be regarded as the most conservative assessment Fig.3 Concentration of U235 vs. burnup.of VVER-1000 spent fuel multiplication properties vs.burnup taking into account manufactory tolerances 0.0075and operational conditions.
3. Isotope composition of WER-1000 spent fuel
0 .0 0 5 0 .................... ....... .......... ... ............................................
In correspondence with the generally accepted _0rules, the calculations which results are presented inthis section have been conducted on an example of thefuel assembly with the maximum multiplication 0 .0 0 2 5 ...... ........................properties taking into account the manufactorytolerances of VVER-1000 reactor fuel assembly 4.5kg/FA by weight of fuel, and 0.05% by itsenrichment). 0
The isotope composition of spent fuel has been 0 20 40 60determined for 3 sets of operational parameters in the Bumup, GM d Aframe of rated (or normal) operational conditions of
VVER I 000 reactor, Table 1. Fig.4 Concentration of U236 vs. bumup.
- 663 -

JAERI-Conf 2003-019
0.96 0.003
0.94 &Z 0.002
C,> (14
0.92 Max. IL 0.001W.rnin.
0.90 010 20 40 60 0 20 40 60
Bunup, GW d A BwW, GW d A
Fig.5 Concentration of U238 vs. burnup. Fig.8 Concentration of Pu241 vs. burnup.
0.010
0 .0 0 8 . .. ... .......... ..
.4Z OM B . .. .. ......In0 .0 0 6 . ...... ..... ..............
M 040.004 a.
0.(X )D4 .. ... .......
0.002
00 20 40 60 20 30 40 50 60
Bumup, GW d A BLrmip, GVV d A
Fig.6 Concentration of Pu239 vs. burnup. Fig.9 Concentration of Pu242 vs. burnup.
1.0xio-,0 .0 0 3 ...... ............. ........ ..................................... .............. .
...........................0.8xle
0 .0 02 O .EkKl 0 -4 .......... ........ .. .. ........ . .....................
04m I ................... ..0. E OAxle
0.001 . .. ............ <
0.2xle
O 00 20 40 60 0 20 40 60
BLrnup, GW d A Bumup, GW d A
Fig.7 Concentration of Pu240 vs. burnup. Fig.10 Concentration of Am241 vs. burnup.
- 664 -

JAERI - Corif 2003-019
We (about 1%) depend on manufactory tolerances andoperational conditions'
Variation of Pu.242 (Figure 9 concentration showsthat the analyse conditions (Table 1) are not extreme
. ......... .... ....... ... in the view of this isotope concentration. So,200' depending upon the fuel operational parameters,
Vd variation of Pu242 concentration needs the additional,Nt more precise, examination.E The structure of reactor-cell code NESSEL allows1xie
to print out only a part of burnup chains resulted inSm 49 (Figure I ) and Sm 1 51 (Figure 12). Partially,SmI49 and SmI51 are accounted in code integrallyas the common pseudo-fission products. Because of
00 20 40 60 this, the results shown in the Figures II and 12 are
conservative (reduced) in respect to the absolute valueDxnup, GW d /t of these isotopes concentration.
Other isotopes concentration varies within theFig. 1 1 Concentration of Sm I 49 vs. burnup. limits from 20.5 to 82.0 %%.
The isotope concentrations, that we determine for1.0xio-, the average rated operational parameters, are not mean
ones for the most of the considered isotopes U235
..... ..................... .................................. (Figure 3), Pu239 (Figure 6), Pu24O (Figure 7), Pu24I0.8xio,
(Figure 8), Am241 (Figure IO), Sm 149 (Figure II)and Sm 1 51 (Figure 12). Their concentrations are more
0.6xie ................... correspond to the minimal possible operational
parameters. Such results are connected with the
E O.*107' presence of CR clusters in fuel assembly, which hasU) the significant influence on spent fuel isotope
composition.0.2007' The 10 isotopes that were analyzed in this work
(report) allow to take into account from 60% to 70%01 of multiplication properties variation of spent fuel
0 20 40 60 depending on the fuel operational parameters chosen
Burrup GM d /t for calculations.The obtained results allow to define, in particular,
Fig.12 Concentration of Sml 51 vs. burnup. the conditions needed to calculate isotope compositionfor its subsequent using under nuclear safetyassessment for the spent ftiel management systems
4. Conclusions taking into account the "burnup credit" principle.
The conducted studies demonstrated that VVER_ Acknowledgements1000 spent assemblies with 44% enrichment at theburnup level of 60 GWtd/t have the following ranges The authors are grateftil to the US Government forof possible fluctuations of the isotope concentration: financial support in realization of this work.
for U235 - 96.0% of its average value,for U236 - .0% and U238 - 12%,for Pu23 - 85.0% and Pu24O - 20.5%,for Pu24 - 67.0% and Pu24 - 12.3%,for Am.24 - 82.0%,for Srnl49 - 135.0% and Sml5l 80.0%.
correspondingly.
As the results of the sections 2 and 3 indicate, theoperational conditions have more serious influence onspent fuel multiplication properties and isotopecomposition than fuel manufactory tolerances. Onlyfor two isotopes U236 (Figure 4 and U238 (Figure 5),the calculated concentration changes are negligible
- 665 -

JAERI-Conf 2003-019 JP0450125
French Fission Products Experiments Performed in Cadarache and Valduc.Results Comparison.
Dr. Jacques ANNO', Anne BARREAU2, Jean Pascal HUDELOT 2,
Emmanuel GIRAULT', Patrick FOUILLAUD', Herv6 TOUBON 4
1 IRSN, BP 17, 92262 Fontenay aux Roses Cedex, France2 CMMiSSarial Li VEnergie Atomique, 13108 St Paul lez Durance Cidex, France
3Direction des Applications Militaires - CVA, 21120 Is sur Tille, France4 ARE VAICogema 2 rue Paul Dautier, BP4, 78141 Vjlizy Cedex, France
Cofunded by Cogema, two complementary experimental programmes on bum up credit (BUC)related to fission products (FPs) are perfon-ned by CEA & IRSN at Cadarache and Valduc. Aftershortly recalling the main characteristics of each experiment, a first comparison of some results ispresented, especially the energy range in which most part of cross section absorption arequalified. Both experiments exhibit great quality and accurate results, giving a high degree ofconfidence to the whole experimental French process of qualification devoted to BUC.
1. Introduction obtained by taking into account the water holesdevoted for control and detection devices.
As theoretical studies have shown the economicalinterest of using FPs in safety assessments at various To improve the 'dissolution' qualification (whosestages of Fuel Cycle, France has been engaged since neutron spectrum is more thermal than the previousmany years in an extensive programme related to ones), a second series of experiments, namedBUC in order to qualify FPs absorption cross 'Elementary Dissolution' type, has been performed.sections and calculation tools for criticality FPs are then in close interaction with the U, Pu Amcalculations in storage, transportation and dissolution isotopes of inner array Of U02 rods or HTC rods (withof spent ftiels. Cofunded by Cogema, two a square pitch of 1272 cm) in the Zr tank. The U02
Wto/ 2U,experimental complementary programmes have been rods have an initial ftiel enrichment of 4738separately performed in Valduc and in Cadarache ) and the HTC rods, so-called 'Haut Taux deon six (chosen by IRSN) or better, fifteen (chosen by Combustion', simulates U, Pu & Am composition for a
0 3 WI% 235UCEA) main FPs, responsible for and 80% ) of U02 fuel with initial enrichment of 45 0the total FPs absorption (see Table 1). This paper irradiated at 37.5 GWd/t, without FP. This secondpresents a short overview of the two French series is itself divided in two cases: FPs in acidprogrammes. After recalling the main aspects of each solutions (HN03 -IN) or FPs in Depleted Uranylprogramme, aready published in ICNC or ANS Nitrate Solution (DUN). All these cases aremeetings, some new results are given, completed by a completed.comparison between the two experiments analysis. Other experiments were performed on natural Gd
solution, on 95Mo in thin slices of CH2/natural metallic2 Vaiduc Experiments Mo, and on F as polytetrafluorethylene (PTFE) solid
block. In all, 156 experiments have been performed.2.1 Description
The Valduc experiments are performed in three A third series of experiments, named 'Global orgradual steps at Valduc 1,3) in so-called 'B Apparatus' Advanced Dissolution' type, is planned. It consists ofby using the sub-critical approach technique based on a large SS tank 70.4 x 70.4 cm) containing an 44 xthe rising of moderating and reflecting water of a 44 HTC rod array (square pitch 16 cm) steeping in adriver array up to Keff = I P 10. In the centre of the DLN solution poisoned with 6 FPs. The 16 cm pitchdriver, FPs are in solution in a Zr tank, alone or mixed, leads to an even more thermal neutron spectrum, morewith or without interactions with U, Pu, & Am. convenient to 'dissolution' qualification if necessary.
The first series of experiments, called 'Physical' FP solutions are very carefully and accurately donetype experiments, is representative of storage and by dissolving known masses of FPs in knowntransportation conditions: the square pitch of the driver quantities of nitric acid. A Saclay/CEA qualifiedarray 13 cm) leads to a thermal neutron spectrum, laboratory independently checks concentrations andrepresentative of the nominal square pitch 1.27 cm) of isotopic compositions of FPs. The adequacy and thestorage and transportation. The 13 cm square pitch is accuracy of the model are checked on critical
' Corresponding author IRSN, Tel. 33 1 58 35 81 15, Fax. 33 48 57 29 98, E-Mail: jacques.anno�irsn.fr2Corresponding author CEA, Tel 33 4 42 25 33 49, Fax 33 4 42 25 79 79, E-Mail: barreaua�drncad.cea.fr
- 666 -

JAERI - Conf 2003-019
experiments performed with slightly acid water Each sample is measured at least three times in(without FP) solutions or with boron (well known order to avoid systematic errors. The fission productscross sections) solutions. poisoning worth is directly derived by subtracting the
fission product sample reactivity from a reference2.2 Experiments Analysis sample reactivity that differs just by its lack of fission
Description and analysis of experiments follows products.ICSBEP methodology, with special effort foruncertainty weight evaluation. Thus, clean benchmarks Two kinds of PWR-type samples wereare available. Calculations are performed using the manufactured:standard CRISTAL route 4) with APOLL02-MORET4 - calibration samples: fresh U02 with increasing Uand its CEA93 library (a 172 group library using the enrichment and borated samples to relateEuropean JEF2.2 file )). TRIPOLI4.1, with pointwise experimental signal and calculated reactivity (215U
JEF2.2 or ENDF BVI cross-sections is also used to and 10B are well-known isotopes),perform some calculations. Uncertainty weights are -separated fission product isotopes added withobtained by keff difference of standard APOLL02 S different matrices (natural U02 or inert) to validateresults (on related cylindrical geometry of the model) every CBU fission product poisoning worth.or by using MORET4 Perturbation 6 correlatedsamples method), giving very accurate results. For each sample, 13 pellets were manufactured. 0
Note that calculations taking account of FP self of them constitute the sample, and the 3 others wereshielding were made to estimate its effect: this one is used for chemical or mass spectrometer analysis. Eachvery small in Valduc experiments (being generally in mass of fission product isotope by sample wasthe thermal range), except for 133CS (effect - 40 1 0-'). optimized in order to obtain a similar reactivity worth
corresponding to the maximum accuracy in2.3 Results MINERVE worth measurements. For the most
Keff were calculated by APOLL02-MORET4. resonant absorbers, i.e. 133CS_103Rh_109Ag, severalThe benchmark keff results are close to 1, with an samples have been manufactured with increasingaverage reactivity weight of total uncertainty about fission product isotope amount, in order to investigate50 10-5 . The most important uncertainty comes from the resonance self-shielding effect.the outer clad diameter (on which we have done 300measurements after the new cladding, following LEU`- 3.2 Experiments AnalysisCOMP-THERM-50 experiments, put in ICSBEP The MINERVE reactivity worth measurementsHandbook 7)). were computed with the French criticality calculation
Table 2 (A) presents calculation-experiment package CRISTAL VI 4 using the APOLL02 codecomparison (C/E-1) (%) on FP reactivity worth, (version V2.5) and its CEA93 library (version V6).depending on the reference (model or average Keff Neutron fluxes in the MINERVE RI-UO2 and 112-water cases). U02 Test Zones were obtained by a D transport
calculation. The Pu method was used in APOLL02 in3. Cadarache Experiments order to account for the exact heterogeneous geometry.
The resonance self-shielding is rigorously calculated,3.1 Description for all fission products, through effective cross-section
The Cadarache experiments consist in measuring formalism.the BUC nuclide reactivity worth by the oscillationtechnique in the MINERVE experimental reactor. 3.3 Results
The oscillation technique consists in oscillating Calculation to experiment comparisons on 6 fissionperiodically the central pin of the MELODIE lattice products (common to the VaIduc programme)through the core, so the sple under study is reactivity worth in RI-UO2 and R2-UO2alternatively in and out of the core. A rotating control configurations are summarized in Table 2 B): therod is automatically operated so as to maintain the thermal absorbers capture cross-section of 143 Nd,count rate of a flux detector. The corrected rotation 149SM and 155Gd are underestimated. 103 Rh (ny) cross-amplitude is in very close linear relationship with the section tends to be overestimated by approximativelysample reactivity. 12 %. It could be due to chemical analysis problem,
investigation about it is in progress. The 133 Cs resonantBy using various specific appropriate lattices in the capture is overestimated by + 4 %, while the 152sM
test zone located at its centre, MINERVE can provide capture cross-section seems to be well known.a large range of spectra. Two UOX configurations The final uncertainty combines three independentwere implemented. The first one, RI-UO2 (Figure 1), uncertainties corresponding to:is devoted to storage and transportation. The second - The knowledge of the fission product massone, R2-UO2 (Figure 2), aims to mock-up the softer introduced in the sample,spectrum corresponding to the optimum moderation- -The reactivity measurement itself,ratio in a fuel dissolver. - The calibration of the signal.
- 667 -

JAERI-Conf 2003-019
4. Comparison of Cadarache and Valduc CRISTAL route APOLL02 MOTET4 qualification.Experiments They are complementary, both of a great quality, and
their accurate results give a high degree of confidence4.1. Energy zone of absorption qualification to the whole qualification experimental French process
Table 3 gives the FP cumulative normalized devoted to BUC.absorption ratio in the neutron flux of the experimentcell for Cadarache and Valduc experiments, which are Referencesdisplayed in Figures 31, 32 and 33 for three PF,103 Pth, 149SM and 152 Sm: the qualification energy zones 1) J. Ano, G. Poullot, E. Girault, P. fouillaud D.are roughly the same, although the ratio values (q) Hynek & H. Toubon, "Status of the joint Frenchfrom Cadarache experiments seems to define different IPSN/COGEMA Qualification Programme ofenergy zones. Fission Products,". ANS Winter Meeting, Reno,
Nov 200 )4.2 Sensitivity 2) A. Santamarina, N. Thiollay, C. Heulin, J. P.
For comparing the VALDUC experiments Chauvin, "The French Experimental Programmesensitivity against MINERVE's one, calculations with on Burnup Credit,"Criticality Safety Challenges inMORET4 Perturbation 6) were made to obtain the the Next Decade", CSCND'97 Lake Chelanimpact of FPs concentration variation (10%), with a Sept.7-11, 1997).standard deviation - 0. Table 4 points out that a low 3) J. Anno J. Krebs, "Estimation des marges deoverestimate or underestimate capture cross-section sdcuritd dues A 6 PF dans les combustibles irradids(about 4 %), detected through MINERVE en transport et stockage sous eau ", Proc. Int.experiments, will induce smaller differences k = 32 Conf. On Nuclear Criticality Safety, ICNC'91,to 72 10'5). This shows the present sensitivity limits of Oxford, UK, Sept.9-13, 1991, I, II-58 1991).VALDUC experiments in the field of nuclear data 4) J. M. Gomit, P. Cousinou, C. Diop, F. de Grado F.validation. It can be stated that, all data being constant, Gantenbein, J. P. Grouiller, A. Marc, D. Mijuin, &these experiments can surely detect absorption cross- H. Toubon , "CRISTAL VI: criticality package forsection variations of 12% for k = 20.10-5. This is burnup credit calculations", Int. Conf. on Nuclearpessimistic, because theoretically, MORET4 Criticality Safety, ICNC'03, Tokai-mura, Japan,Perturbation can detect a smaller variation about Oct. 20-24 2003).Ak = 5. 1 0--. 5) JEFF Report 17, "The EF2.2 Nuclear Data
Library", May 2000
5. Conclusion 6) J. Ano, 0. Jacquet & J. Miss, Validation ofMORET4 Perturbation against 'Physical' Type' FP
Till now, only so called VALDUC 'Physical' type Experiments", Int. Conf. on Nuclear Criticalityexperiments are evaluated, which are a little more in Safety, ICNC'03, Tokai-mura, Japan, Oct. 20-24the thermal range than the MINERVE experiments. (2003)We intend to continue the comparison with other set of 7) ICSBEP Handbook release 2002 - LEU COMPVALDUC Experiments (so called 'Elementary' and T14ERM 050'Advanced' Dissolution type, the first ones being now 8) R. Sanchez, J. Mondot, Z. Stankovski, A. Cossic &completed and evaluated). 1. Zmijarevic, "APOLLO2 a User-Oriented,Nevertheless, up to now, the comparison of the various Portable, Modular Code for Multigroup TransportVALDUC and CADARACHE experimental results Assembly Calculations", Nuc. Sci. Eng. 100, 352-gives a very high consistency of the whole 362, 1988.complementary French qualification programmes onfission products for Burnup Credit applications:MfNERVE experiments are mainly devoted to nucleardata validation, and VALDUC experiments to the
- 668 -

JAERI-Conf 2003-019
Table I Fission products contribution to UOX spent fuel reactivity loss, AK/K (10-5)WO/ 235UPWR 17x 1 7 - Initial enrichment = 35 0 Cooling Time = years
NO FP1 BU 20 40 60 FP BU 20 40 60 NO
I "'Sm 980 1030 1050 99Tc, T=2, 1 I 0 5a 240 440 610 8
103p2 'h * 1360 1700 145Nd 230 410 540 9
3 143 Nd * 530 900 1100 153 Eu 150 390 610 10 I
13 1Xe (g) 470 790 940 95mo 150 1290 400 1 1
4 133CS 420 750 1010 147 Sm 150 230 270 12
5 155 Gd 390 1550 2990 147 Pm, T=2,6a 120 140 130
6 '5'Sm, T=90a 350 500 600 150SM 120 270 380 13
7 152SM 250 1490 660 109Ag 100 250 360 14
10'Ru 100 220 330 15
15 FP K/K 10-') 4950 9080 12610 7 FP A" (10-') 3120 6370 8910
(%) (81) (79) (78) M (51) (55) (55)
200 FP 6120 11500 16200
BU (GWd/t), (g)= gaseous, 7 = 6 initial IRSN choice + 9Mo, recently added. 15 = OECD/CEA choice
Table 2 FP reactivity worth (C-E)/E in %
A / Valduc Physical Type Experiments B / Minerve Experiments
Fission E = Model Exp. Keff W = Average Water RI-UO2 R2-UO2
Products (C/E)- I Keff (C/W)- I (C/E)- I 0/6) (C/E)- I
143Nd 0. 155 (as Nd nat) 0.0 1 3 (as Nd nat) 4.5 ± 2.5 -10.0 ± 3.0
149sm. 0.182 - 0.013 -5.7 ± 2.1 -9.8 ± 2.5
152sm, 0.061 0.0135 -0.2 ± 3.2 -1.2 ± 4.2
103Rh 0.213 0.017 +13.3 ± 4.0 +11.9 ± 3.8
155Gd 0.182 0.014 -1.9 2.9 -11.0 ± 3.6
133 Cs 0.103 0.078 4.3 1.9 2.0 ± 2.0
Table 3 Normalized cumulative absorption ratio from Upper Energy Limit down to 0.625 eV
(Fast and Epithermal range)
CADARACHE VALDUC CADARACHE VALDUC
RI-UO2 R2-UO2 PFPHYS RI-UO2 R2-UO2 PFPHYS103P 155 10-2 10-3,h 5.56 10-' 3.91 O-' 3.01 IO-' Gd 1.16 5.58 IO-' 2.80
152sm. 4.78 IO-' 3.28 IO-' 4.08 IO-' 149sM 1.41 10-2 7.73 10-3 5.04 10-3
143 Nd ,1.15 IO-' 6.10 10-2 , 2.99 10-2 133cS 7.24 IO-' 5.78 IO-' ,4.25 IO-'
Table 4 Example of MORET4 Perturbation Calculation Results
Exp nt Perturbation PF Experiment Perturbation PF
AC (/o) or cross section AC (%) or cross sectionPF C PF (g/1) C+ 10% variation at C = constant PF CPF(gll C10% variationatC=constant
AKIO--' for2OlO--' for5 10-5 AK 10-5 for 20 10-5 for 5 10-5
103Pth -39,0 183 1,05 0,247 "'Sm -47,3 191 1,04 0,268
103 Rh -19,5 138 1,46 0,364 152SM -23,6 184 1,09 0,273
133cS -130 148 1,35 0,339 15'Gd, -0,214 157 1,28 0,320133CS
-76,5 III 1,81 0,452 "'Gd A, 107 126 1,57 0,393
Ndnat -119,6 120 1,68 0,419 149SM -0,215 179 1,12 0,272
Average on 32 values 9) 1,2 0,3 14ISM _0.101 143 1,40 3 1
- 669 -

JAERI-Conf 2003-019
01 M3% 0 C.,- 02 3
0 c- d.� 0 C-d
o 0 d..h."-
Fig. 1 MINERVE Test Zone - R-UO2 lattice Fig. 2 MNERVE Test Zone - R2-UO2 lattice
Normalizod CumutdlwAbsorptio. Rutio 103m
I.OE-00
I.OE-01
R1UO2
CadaracheR2 UO,
1.0&02
E.V 2833 Va duc
0,625 eV
I.OE03 - -
I.DED4
I.OE-09 1.0608 1.0607 1.0606 1.0605 i.OE-0.4 1.DE-03 I.DE02 I.OE-01 I.OEIOO I.O&O1 J.OE-02
Energy (MeV)
Fig. 31 - Variation of the Normalized Cumulative Absorption Rate from Upper Energy LimitI
172 with a ai = absorption cross section in group i,
Ua,*n*�Oi
and n = atomic density of the fission product, o = neutron flux in group .
- 670 -
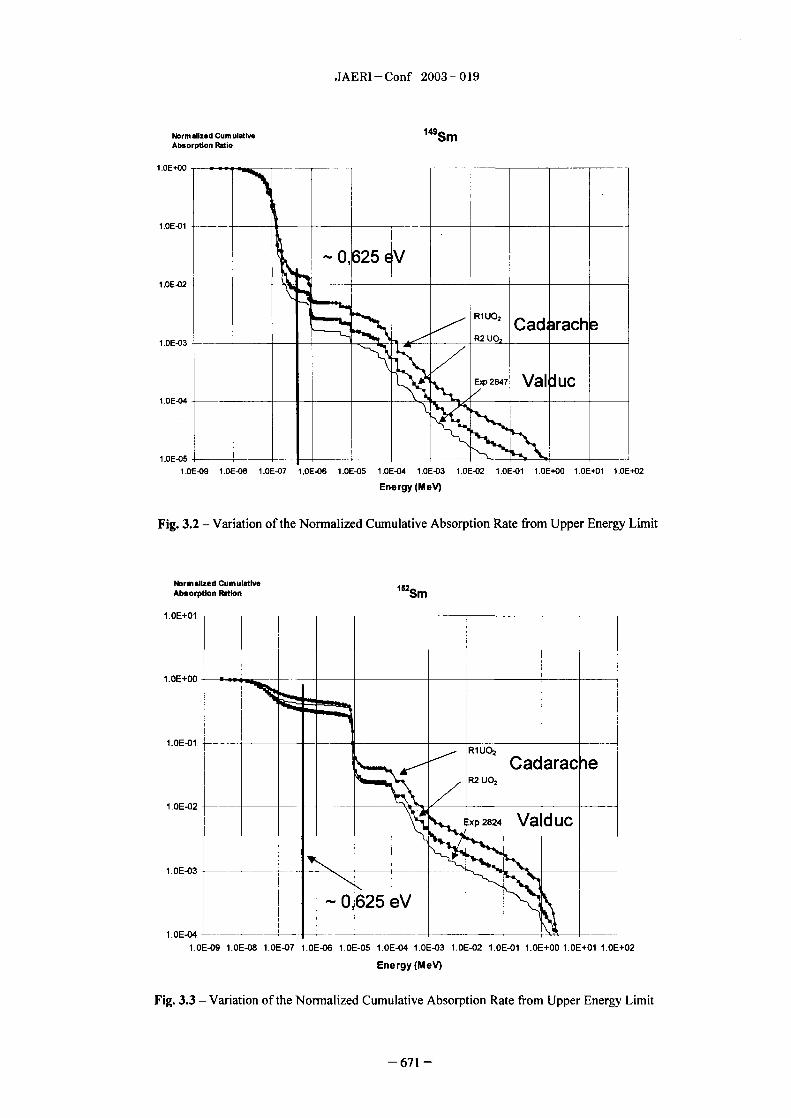
JAERI-Conf 2003-019
Normalized Cumulative IIsmAbsorption Ratio
1.OE+00
1.OE-01
0,625 �vI.OE-02
R1 UO, Cad rach1.OE-03 R2 U02_ a
Exp 2847 VaIduc1.OE-04
1.OE-05
1.OE-09 I.OE-08 1.OE-07 1.OE-06 I.OE-05 1.OE-04 1.OE-03 1.OE-02 I.OE-01 1.OE+00 1.OE+01 I.OE+02
Energy (M eV)
Fig. 32 - Variation of the Normalized Cumulative Absorption Rate firorn Upper Energy Limit
Normalized CumulattveAbsorption Ration "'Sm
1.OE+01 - 7-
1.OE+00
1.OE-01R1UO2
Cadarache
1.OE-02 - R2 UO,
Exp 2824 VaIduc
1.OE-03
1.OE-04 0,6251.OE-09 1.OE-08 1.OE-07 1.OE-06 1.OE-05 1.OE-04 1.OE-03 .E-02 1.OE-01 1.OE+00 .OE+01 I.OE+02
Energy (M eV)
Fig. 33 - Variation of the Normalized Cumulative Absorption Rate from Upper Energy Limit
- 671 -

JAERI-Conf 2003-019 JP0450126
Generation of Bounding Axial Burnup Profilesas a Continuous Function of Average Burnup
Jens-Christian NeuberFramatome-ANP GmbH, P.O. Box 101 063, 6301 0 Offenbach, Germany
jens-christian. neuber�framatome-anp. com
In the paper on hand a method is presented which makes it possible to generate a bounding axial burnup profilethe shape of which is a continuous function of the average bumup of the fuel. Application of this method resultsin continuous loading curves, therefore. The method consists in an analysis of the characteristics of the shape ofreal axial profiles. No restrictions are placed on the number or characteristics of the real profiles that could beused in such an analys s. In the paper on hand the mathematical tools used this analysis are described, and it isdemonstrated that the bounding axial burnup profile generated is in fact bounding.
1. Introduction therefore. The variation in the end effect due to vary-
The shape of an axial burnup profile of an irradiated ing axial shapes has to be considered in a burnupfuel assembly is usually asymmetric due to the lower credit criticality safety analysis. The objective of suchmoderator density in the upper half of an operating an analysis usually consists in determining a loadingcore (cf. Fig. 1). The asymmetric component is de- curve specifying the minimum average burnup neces-pendent on the average burnup of the fel. assembly sary for a fuel assembly with a specific initial erich-and is strongly affected by reload patterns applied, ment to be placed in the spent fuel management sys-control rod movements during operating cycle, pres- tem of interest. The end effects due to axial burnupence of axial shaping rods or burnable poison rods, shapes have to be covered by the loading curve, there-presence of integral burnable absorbers as well as fore. To attain sufficient confidence that the highestextended low power operations. In other words, axial reactivity effect due to the operation strategies used isburnup shapes are strongly affected by the operation covered by the loading curve it is necessary to evalu-strategies used. They are plant specific, therefore. ate a huge number of profiles covering all the parame-
The impact of an axial burnup profile on the reactivity ters affecting the shape of the profiles.
of a spent fel management system is usually ex- 2. Method Used for Generating a Bounding Load-pressed in the difference Ak between the system's ing Curve
neutron multiplication factor obtained with the profile In Ref 2 a method was introduced which makes itand the system's neutron multiplication factor ob- possible to consider any number of axial burnuptained by assuming a uniform distribution of the aver- shapes in the evaluation of the loading curve. This isaged burnup of the profile. This difference is called accomplished by applying an appropriate statistical"end effect". test procedure which consists in comparing the neu-
The end effect varies with the shape of the axial po- tron multiplication factor of any real axial shape withfiles and depends on the operation strategies used, a curve called "calibration curve" giving the neutron
60Fuel Assembly 401
,A A-50 A A, EOC 8
'Al45
Co 40
EOC735
30E
25
E C620 20
T.p10
50 50 100 150 200 250 300 350 400
Active Length I cm
Fig. 1: Typical axial burnup profiles from the axial profile database Reference /I/.
- 672 -

JAERI-Conf 2003-019
1 .2 0 - .... .. ......... .... .. ... ..... .. . . ...... ................... . .... ............. .............................................. .... ...
Ceff � a F.Ctlon of Unit B-P-C.11bration Cur�')
1.10
1.05 k.ff (Axial Shape
1.00 k
0.95
0.90
0.85
0.60
0.75 Equi..I.n Uiform A",ag. B-nupB.-up __j V fth. Sh.p.
0.70 1,0 15 20 25 30 35 40 4.5 5.0 5I5 60 65 70
Uniform Burnup / Wd/kg U
Fig. 2 Evaluation of the end effect
multiplication factor under the hypothesis that the culate the neutron multiplication factor of hundreds ofburnup is uniformly distributed within the active axial bumup shapes under the conditions of the spentzones of the fuel assemblies, cp. Fig. 2 The uniform fael management system of interest, and hence someburnup which results in the same neutron multiplica- attempts were already made to generate an axial pro-tion factor kff as the real axial shape is called "equiva- file which is bounding with respect to all end effectslent uniform burnup". As follows from the definition to be considered. These attempts consisted in dividingof the end effect, if there is any end effect k different the average burmip scale into a relatively small num-fi-om zero the equivalent uniform bumup will differ ber of intervals and generating a bounding axial shapefrom the average bumup of the shape, cf. Fig. 2 The for each of these intervals (cf. Ref. 3/ for instance).end effect k can be expressed, therefore, in the dif- The outcome of these attempts is thus a set of discon-ference AB between the average burnup (B.,.) and the tinuous shapes, and application of this set results inequivalent uniform burnup(B..,J, discontinuous loading curves.
In the following section a method is presented whichAB = B., - 13�.,,.. (1) makes it possible to generate a bounding axial profile
Due to the fact that the calibration curve as well as the the shape of which is a continuous function of theneutron multiplication factor of an axial shape are average bumup in such a way that the bounding curveusually encumbered with statistical uncertainties (due equation 2) (as for example that one shown in Fig. 3)to the fact that Monte Carlo codes are usually used for can be directly derived. This is demonstrated with thecalculating the kff values), the resultant difference AB aid of the axial profile database Ref. /1/, i.e., theis usually given in form of a confidence interval, cf. shapes of the axial profiles compiled in this databaseRef. 2/. The 95% confidence intervals of AB obtained are evaluated to generate the bounding shape as afor the 850 axial bumup shapes compiled in the axial continuous function of the average burnup.profile database Ref. /I/ are shown in Fig. 3.
As illustrated in this figure, taking the whole set of AB 3- Description of the Method of Generating aintervals obtained into account a curve is derived Bounding Axial Burnup Shape as a Continuouswhich gives a bounding description of the end effect Function of the Average Burnup
as a function of the average bumup of the fuel assem- The axial profile database Ref. /I/ consists of 850blies, axial burmip shapes received from Nuclear Power
= f (Bav.). (2) Plant (NPP) Neckarwestheirn IL All these shapes(ABL.d. belong to one and the same fuel assembly type, the
Once this bounding curve is established the determi- Siemens Convoy Series fuel assembly type FOCUSTM.
nation of the loading curve can be based on the as- For this type the shapes were gathered from the cyclessumption of uniformly distributed bumups, because 5 through 12 of NPP Neckarwestheim IL
the loading curve thus obtained can be corrected with The shapes were derived from in-core 3D power den-the aid of the bounding curve (AB)bo.d = fB.j. Due sity distribution measurements based on flux meas-to this correction the final loading curve thus obtained urements. At 28 fuel assembly positions the flux datacovers the end effect. are monitored at 32 equidistant axial nodes. These
However, it is a considerable amount of work to measurements are performed every fourteenth day.calculate the neutron multiplication factor of hundreds
- 673 -

JAERI-Conf 2003-019
1 2 0 . . .......... ... .. ............ ....InMel nrichment 40 %vL-% IM
11.0 Cooling dne: 5 yean;
10.0
9.0 Bounding CuFvo
7.0
6.0AwIffo ::-�L5.0
4 0
ir3.0 -
2.0 -
1 0
0.0
10 1� 2� 25 30 3� 40 4� 50 56 60
AvMFSgG BUFnup MWd&g U
Fig. 3 Evaluation of the profile database Ref. /1/: End effect of the individual profiles and bounding AB curve.
The high spatial resolution and the high frequency of and
the measurement campaigns as well as the accuracy of cc(n = 32) = rx(l)) (6)the measurement device cf. Ref. //) result in shapesof outstanding quality. where r(a(i)) denotes the respective regression fimc-
To extract from these shapes the bounding shape tion resulting from the regression analysis of the data.sought-after the following steps have to be taken: The solid line in Fig. 4 represents the regression fimc-
First of all the shapes are normalized by forming the tion obtained for i = 2 and the dotted line in this fig-ratios ure gives the lower 950/o/95% tolerance limit of this
function (cf. Ref. 151).
aij = Bij n (n = 32) (3) The ratios aj obtained for the nodes through 31
Bi j N (N = 50) according to eq. 3) are evaluated in the followingway: The quotients (a,,I / aj) are plotted versus the
of the burnup Bj at node i of the j-th axial shape to the respective average burnup values Bj for i = 7 throughaverage burnup Bj of this shape. For n equidistant i = 30. As shown in Fig. for i = 7 for example, it isnodes Bj is given by observed that
I 0 * the quotients (alj / cQ are virtually independentB = -EBij (4) from the average burnup B, for i = 7 through
n ., i = 30.
As indicated in Fig. 1, in compliance with the nomen- As can be seen from Fig. 1, this was to be expectedclature used at NPP Neckarwestheim 11 i = I denotes due to the shape of the axial profiles.
the node at the top of the fuel zone (top node), and By means of linear regression analysis the followingi = n = 32 denotes the node at the bottom of the fuel recurrence formula can be extracted from the data:zone (bottom node).
The ratios cilj of the (i+l)-th node are plotted versus a(i + 1 = a(i). rj' (B,,,.), i = 7.., 30, (7)
the ratios aj of the i-th node for i = 1,...,n-2, and the where r,,,i (B.,,.) denotes the respective regressionratios ot.,,j of the bottom node are plotted versus the flinction resulting from the regression analysis of theratios aij of the top node. As shown in Fig. 4 for i = 2 quotients (aiij / aj). The solid line in Fig. repre-for example, it is found that sents the regression fnction obtained for i = 7.
• the ratios Li+lj are strongly correlated to the ratios With the set of recurrence equations (5) through 7 aaij for i = I through i = 6 and that set of model functions x(i) is given fori-ning an axial
• the ratios anj of the bottom node show a significant model shape. However, this set of equations can becorrelation to the ratios aij of the top node. solved only then, if one has a model
Therefore, by means of linear regression analysis (cf. a(]) = f, (Bav.) (8)Ref, 151) the following recurrence formule can beextracted from the data: for node 1. To get such a model the ratios a Ij obtained
a(i + 1) = ra(i)) for i 6, (5) for node I according to eq. 3) are plotted versus the
- 674 -

JAERI-Conf 2003-019
1 .0 0 - ...... .. . . . .. . ............................................................................................... ............... ........ . ........... ... .. .. .......... ...RegressionCurve
0.95
0.90 N
LOWOF 9%195% Tolerance Limitofthe Regression Curve
F 05
Q
0.80
0.75
0.700.55 0.50 0.65 0.�5 0.80 0.85
AJpha (Nods 2)
Fig. 4 Evaluation of the profile database Ref, /I/: o,lj versus aj, i 2,j=l,...,N (N 850)
1 .2 .. ........ .......... ....... .. .. .............. . ................. .. . ... ... ................. ................................. ................. ..... .... .. .. .. ........ .. .
R0807 AJPha(Node8)/AJpha(Node 7)1.150
IAM
1.0501189F600ion Curve
1.0010
0.950
0.9M
0.850
O.8W0 5 10 1 20 25 3D 35 40 46 50 Ss Go
Average Burnup WW"g U
Fig. 5: Evaluation of the profile database Ref /I/: (ccil / aj) versus Bj, , i = 7 j= 1,...,N (N = 50)
respective average burnups Bj. As can be seen from lower bound and is taken as model fttnction eq. (8),Fig. 6 there is no correlation of xlj to Bj. This was to therefore. This function has the formbe expected due to all the different irradiation histories a
represented by the axial profiles of the database ct(l) + d [I - exp(- X (B.. c],Ref. /I/. However, all the regression functions rcc(i)) b (Ba,. + CY Iobtained for i = I_. 6 (cp. equation (5)) lead to a de- a, b, c, d, X = const. Ecrease of a(i+]) with decreasing c(i) cf. Fig. 4 for (9)
example). Therefore, the lower the value of a(l) is According to their definition eq. 3) the ratios aj areassumed to be, the lower are the values obtained for bounded bya(i), i = 2.. 7 i.e., the higher is the asymmetry of theaxial model shape. It is well-known that the higher the nasymmetry of a shape is the higher is the end effect. Z cc = n . (10)Therefore, due to the fact that one is looking for a i=1
bounding axial shape, only a model function eq. (8) Due to the fact that the model function eq. 9) repre-for c(]) is needed which represents a lower bound of sents a lower bound and that the regression functionsall the ajj values observed. The curve named as in equations (5) through 7) do not necessarily con-"Lower Bound" in Fig. 6 obviously represents such a serve te normalization condition (10), the values
- 675 -

JAERI-Conf 2003-019
1 .0 0 .................................................................... .................................................... ......... ..... .. ..... .. .... ........ ............................ ............... .......................... ... .......................................................................................................... .....
0.95
0.90
0.85 -
0 0
0.75evised Model Function
0.70
6Lower Bound
0 OS
60 r0.55 "g Ott;*
0 50
0.:0
0.35
0 qn
0 5 10 15 20 25 30 35 40 45 50 55 60
Average Rurnup 7AWd&g U
Fig. 6 Evaluation of the profile database Ref /1/: aij versus Bj 0=1,...,N 850) and ct(l) model ftinctions
12.0 -- -
11.0
10.0
9.0
8.0
7.0 --Top a
6.0VW
!-Far-& -V :;' MIF
4.0 - _; �JrM
3.0
2.0
1.0
t0l
0.0
-1.0
5 10 15 20 25 30 35 40 45 50 55 60
Average Burnup kfW"g U
Fig. 7 Evaluation of the profile database Ref. /1/: End effect of the individual profiles and AB curves generatedwith the aid of the a(l) model function named as "Lower Bound" in Fig. 6.
(x(i = f(B av.), i = n, obtained from equations (9) ... .. ....... .... .............. ..... .. ..... .....and (5) through 7) have to be re-normalized. How-ever, because of being defined as a lower bounda(l) given by eq. 9) cannot be included in the re- -.. f th. Mph. (1)
M." Fur.IJ- Souncr Jet ft 5)
normalization. In addition, the regression functions in %.Req. (5) reflect the strong correlations between the a
values of nodes I through 7 Therefore, these correla-tions cannot be included in the re-normalization, sincea(l) has to be excluded from the re-normalization.
The re-normalization is therefore restricted to a cor- A..rqp Run,.p I MW&kg
rection of the cc values of nodes 14 through 28 in such Fig. 8: Evaluation of the axial database Ref Ct6j
a way that the asymmetry of the axial model shape is versus Bj 0=1,...,N = 50) and a(6) modelincreased: The a(i) values of the nodes i = 14 through function obtained with the cc(l) model func-i = 28 are multiplied with a node-dependent factor gi tion named as "Lower Bound" in Fig. 6given by
- 676 -

JAERI - Conf 2003 - 019
9i � S, (i - 13)+1 for i 14,..., 28, (I 1) words, the chosen a(l) model function is bounding
where s is given by with respect to the aij values observed for node 1, butthis function is contradictory to the strong correlations
28 n observed between the otij values of nodes I through 7.S (i - 13). x(i n (12) The oc(l) model function has therefore to be revised
i=14 by making use of the inverse functions of the recur-
With the model function eq. 9), the set of recurrence sion functions eq. (5). The revised x(l) model func-equations (5) through 7), and the subsequent applica- tion thus obtained by adjusting the parameters a, b, c,tion of the correction factor eq. (I 1) to the cc values d, and in eq. 9) appropriately is presented in Fig. 6obtained for the nodes 14 through 28 from equation too. The AB curve obtained with this revised model(7 a normalized axial model shape is formed which is function was already shown in Fig. 3 and is in facta continuous function of the average bumup B,,.. It bounding. (The AB curve is given by a linear leasthas to be checked now, whether or not this model squares ft of the AB confidence intervals obtainedshape is the bounding shape sought-after. with the axial burmip model shapes derived from the
normalized axial model shape as a function of the
4. Results Obtained and Revision of the Node average burnup.)Model Function
5. ConclusionsAs can be seen from Fig. 2 the procedure used to It was shown that bounding axial profiles can be gen-express the end effect in terms of the difference AB erated as a continuous function of the average burnup.between average burnup and equivalent uniform burn- The generation of such profiles can be based on anyup neither depends on the shape of the axial profiles number of real shapes, i.e., thousands of shapes can benor on the description of the shapes that has to be taken into account whereas the determination of thechosen to be able to compute the keff values of the bounding AB curve can be based on a relatively smallprofiles. The procedure to determine AB can be ap- set of bounding profiles derived from the normalizedplied to any profile, whatever its origin and shape axial model shape as a function of average burnup.might be. In particular, it can be applied to axial burn- (The AB curve presented in Fig. 3 is based on 26 ofup model distributions derived from the normalized such profiles.)axial model shape developed in the preceding section.
The AB curve generated thus with the aid of this The use of AB curves has the advantage that the de-model shape is given by the solid line in Fig. 7 The termination of the loading curve can be based on theAB curve represented by the dashed line is obtained assumption of uniformly distributed burnups. This iswhen instead of the regression functions r(a(i)) the of particular interest for instance for transport or stor-lower 951/o/95% tolerance limits of these functions (cp age casks used for different power plants. The end
' effect, wich may be plant specific as explained in theFig. 4 are applied in equation (5). The use of these first chapter, can be covered by correcting the loadinglower tolerance limits obviously results in an overly curve with the aid of the respective plant specific ABconservative approach for burnups greater than curves.20 MWd/kg U. However, for burnups less than20 MWd/kg U neither this approach nor the AB curve The whole method described was checked by applyinggiven by the solid line are completely bounding. This it to different axial burnup profile databases. It wasis due to the fact that the "Lower Bound" cc(l) model found that x(l) model functions of the form given byfunction (cp. Fig. 6 has its minimum value at equation 9 and correlations between the aj values of15 MWd/kg U whereas the minimum values aj for the neighboring nodes are characteristic of axial burnupnodes 2 through 7 are observed in the range of profiles.I MWd/kg U (cf. Fig. 8, for example). In other
References
/I/ Jens-Christian Neuber and Thomas Lamprecht, /3/ U.S. Department of Energy, Office of Civilian"Phase II-C: Benchmark on the Effect of Axial Radioactive Waste Management, "TopicalBurmip Sapes", Appendix A, OECD NEA Data Report on Actinide-Only Burnup Credit for PWRBank, Working Party on Nuclear Criticality Safety Spent Nuclear Fuel Packages", DOE/RW-0472
/2/ Jens-Christian Neuber, "Burnup Credit Applica- Rev. 2 September 1998tions to PWR and BWR Fuel Assembly Wet Stor- /4/ 1. Endrizzi and C. Wenndorf, "PDD and Aeroballage Systems", Proceedings of the 1998 Interna- improveflexibility", Nuclear Engineering Interna-tional Conference on the Physics of Nuclear Sci- tional. December 1990ence and Technology", Long Island, New York, 151 Kurt Stange, "Angewandte Statistik", Zweiter Teil,October 5-8 1998), pp.631-638 Springer Verlag Berlin, 197
- 677 -

JAERI-Conf 2003-019 JP0450127
Conceptual Cask Design with Burnup Credit
Seong Hee Lee, Joon Gi Ahn and Hae Ryong Hwang
shlee9�kopec.co.kr, jgahn�,kopec.co.kr and hae�kopec.co.krKorea Power Engineering Company, Inc.,
150 Duckjin-dong, Yusong-gu, Daejeon, Korea, 305-353
Abstract
Conceptual design has been performed for a spent fuel transport cask with bumup credit and aneutron-absorbing material to maximize transportation capacity. Both fresh and burned fuel areassumed to be stored in the cask and boral and borated stainless steel are selected for the neutron-absorbing materials. Three different sizes of cask with typical 14, 21 and 52 PWR fuel assembliesare modeled and analyzed with the SCALE 44 code system. In this analysis, the biases anduncertainties through validation calculations for both isotopic predictions and criticalitycalculation for the spent fuel have been taken into account. All of the reactor operating parameters,such as moderator density, soluble boron concentration, fuel temperature, specific power, andoperating history, have been selected in a conservative way for the criticality analysis. Twodifferent bumup credit loading curves are developed for boral and borated stainless steel absorbingmaterials. It is concluded that the spent fuel transport cask design with bumup credit is feasibleand is expected to increase cask payloads.
Key Words: Cask, Burnup Credit, Criticality, Poison Material, Spent Fuel
1. Introduction cask and boral and borated stainless steel (BSS) areselected for the neutron absorbing material. First of
The current standard practice in the criticality all, the pitch of fuel array of the conceptual design forsafety analysis for certification of light water reactor cask has been determined based on the criticalityspent-fuel shipping casks is to use a fresh uel analysis. Secondly, the loading curves, that is, theassumption. This assumption ignores the decrease in minimum burnup required for a fuel assembly with areactivity as a result of burnup and results in specific initial enrichment, have been developed forexcessive conservatism in the calculated reactivity each of absorbing materials.values. With the application of burnup credit methods, Section 2 briefly describes the conceptual designit is possible to take credit for the reactivity reduction for cask. In Section 3 the calculational tools,associated with fuel burnup, hence reducing the validation of calculational method and sensitivityanalysis conservatism while maintaining an adequate analysis for design parameters are provided. Thesafety margin. Over the last decades, technical calculational results are provided in Section 4feasibility and economic gains for allowing burnup followed by the conclusions in Section .credit in spent fuel shipping cask applications havebeen analyzed and resulted in substantial incentives 2. Conceptual Design for Caskby increased cask payloads and the correspondingdecrease in total number of shipments. Also, a series The conceptual design for cask considered caskof limited recommendations for burnup credit payloads and neutron absorbing material. In general,approach in criticality safety analysis for PWR spent cask payloads of the existing cask are about 20 PVVRfuel casks have been provided through various assemblies. In this analysis, three different caskresearch programs and the validation analyses for models of payloads (I 4ea, 21 ea, 52ea) are consideredlicensing of casks. to evaluate the effect of payloads on the criticality
The objective of this paper is to demonstrate the analysis. It is assumed that these casks simply consistvalidity of applicable casks as the development of of a honeycombed fuel basket and carbon steeladvanced casks for transportation and storage of fuel cylindrical shell (1.5 inches in thickness) surroundingassemblies is required in the immediate future. In this the basket.paper, criticality safety analysis for conceptual design Two types of cask basket structure are consideredfor cask has been performed with bumup credit. Both for criticality control. The basket using boral is afresh and burned fuels are assumed to be stored in the stainless steel honeycomb structure with rectangular
- 678 -

JAERI - Conf 2003-019
ftiel load cells and poison (boral) plates attached to 3. Method of Criticality Safety Analysistheir outside surfaces. Boral as a neutron absorbing 3.1 Calculational Toolsmaterial is mechanically attached to the cells such The computational tools used in this analysis are thethat the fuel assemblies are fully surrounded by the shielding analysis sequence SAS2H and the criticalityneutron absorbing material. The neutron absorbing safety analysis sequence CSAS from SCALE 44material extends the full height of the active fuel. The computer code system. SAS2H module is used on theB-10 content in boral is assumed as 0020 g/cm2. The spent fuel nuclide composition calculation with theother type of basket uses borated stainless steel (BSS) core operating parameters, and the kff calculation ofas a basket structure material. This basket consists of the conceptual design for cask is performed using theinterlocking flat BSS plates which form square fuel CSAS module. The cross-section library used in thisload cells, and a loaded fuel shares the plate walls of study is the SCALE 44-neutron-group ENDF/B-Vbasket fuel cell with adjacent fuels. The boron library (44GROUPNDF5).content in BSS is assumed to be the maximum limitof 20 wtO/o evaluated for the quality of material. A 3.2 Validation of Calculational. Methods1/8 in. thickness of BSS plate is applied to the 3.2.1 Selected Nuclides for Criticality Analysisanalysis because it usually ranges between I/ 2 to 1/8 To make the analysis practical, a subset ofin. depending on the manufacturing company. The B- important nuclides that can adequately represent the10 content in this BSS thickness (1/8 in.) is about a behavior of a spent fuel in criticality analysis modelshalf (0. I g/cm2) of that in boral. is selected. Isotopes to represent the spent fuel
The assumed basic data of poison material for the composition are selected under a conservativeconceptual cask are given in Table 1. Figure I shows consideration. A set of 12 actinide isotopes, 15 fissionthe schematic geometry model of the conceptual products, and 016 is considered for this work asdesign for cask. shown in Table 2.
Table Assumed Basic Data of Poison MaterialBoral basket BSS basket
Boron content in boral 0020 g of B-IO/ cm2 BSS density: 8.0 g/cm 3Boral thickness, width: 0075 in., 75 in. Boron wtO/o in BSS 20 wtl/oS. Steel thickness: 0075 in. BSS wall thickness: 0 125 in.Fastener thickness 0025 in.
k� s. (wbm Sh" rmdhn: 70 UX "Jsbwrbwl " 'SS
Inaw dken decks 1.51(3.81 *6: 9.0'(22M cm)(carbm so"bm WV%,raa
.. ... .... .. .......... ...... ..
MM Vida
BSS
Fig. I The conceptual design for cask
- 679 -

JAERI - Conf 2003- 019
Table 2 Set of isotopes used in criticality calculations the lower power yields slightly higher kff than theU-234, U-235, U-236, U-238, Np-237, Pu-238, higher one. A higher boron concentration in depletionPu-239, Pu-240, Pu-241, Pu-242, Am-241, Am- calculation yields a higher reactivity of spent fuel243 assembly for all operating conditions. A longerMo-95, Tc-99, Ru I 0 1, Rh- 1 03, Ag- 1 09, Cs- 33, cooling time after discharge of fuel yields a lowerNd- 1 43, Nd- 1 45, Sm- 47, Sm- 1 49, Sm- 1 50, Sm- reactivity of spent ftiel assembly.15 1, Sm- 52, Eu- 53, Gd- 1 55 To evaluate the effect of axial bumup profile of0-16 spent fuel, a flat burnup and an actual axial burnup
3.2.2. Isotopic Prediction Validation distribution have been considered. Only the top halfThe spent fuel material composition is calculated of fuel rods has been modeled for axial burnup
using the SAS2H module. For the validation of the distribution. The results show different trends withSAS2H isotope calculation method, a deterministic the initial enrichment, discharge burnup, and coolingCSASIX (XSDRNPM)') calculation has been time after discharge of fuel and are summarized as
performed. CSASIX calculates k. of the spent fuel follows:pin array based on the calculated and the measured . For high initial enrichment and high burnup a flatisotopic values. The 38 spent fuel samples from burnup distribution causes lower kff than actualORNL documents (2,3) have been used for this burnup distribution, which is more severe at a long
calculation. Evaluated bias and 95/95 uncertainty of cooling time.ftiel depletion calculation by SAS21-1 are 000073 Ak . For a relatively low initial enrichment and a high
burnup, the flat burnup distribution yields lower kffand 002689 Ak, respectively. than the actual burnup distribution, which is also
magnified with the long cooling time. However, the3.2.3. Criticality Calculation Validation degree of difference is less than the high enrichment
A set of 95 critical experiments 48 U02 and 47 and high burnup case.MOX experiments) data from reference 4 through . For a high initial enrichment and a relatively lowreference 12 has been benchinarked using CSAS burnup, the flat burnup distribution yields higher kffmodule with 44GROUPNDF5 cross section library to than the actual burnup distribution at no cooling timedemonstrate its applicability to criticality analysis and and I-year cooling time. However, the lat burnupto establish the bias and uncertainty. Calculated distribution gives lower k than the actual burnupresults are shown in Table 3. distribution at 5-year cooling time.
Table 3 The results of the validation calculation . In all 5-year cooling time cases, the flat burnupdistribution gives lower k.
Experiment Average Bias Deviation ff than the actual burnupdistribution.
k,,ff (average kff -I) ((Y In the conceptual design for cask, the typicalU0, 0.999921 -0.000079 0.003751 expected burnup and initial enrichment of spent fuel
Mox 1.000292 0.000292 0.004422 to be loaded are 36 G,,rD/MTU and 43 wtO/o with TOTAL 1.000104 0.000104 0.004101
yrs cooling time. For this case, the criticality
3.2.4. Sensitivity Analysis for Various Operating calculation with the actual axial burnup distribution isParameters more conservative than the flat burnup distribution.
Sensitivity analyses have been performed to Nevertheless, the flat burnup profile is assumed in thedetermine the input parameters that have a significant criticality analysis of this conceptual design for caskeffect on the depletion and criticality analyses. The because the difference in the reactivity is small.
considered parameters are initial enrichment 1.7 30, 4. Criticality Analysis of the Conceptual Design4.6 wt%), discharge bumup (I 8, 36, 54 GVrD/MTU), for Caskcore moderator temperature (T.,g, Th0j, core specific
power level (P,,g, qk MWt/MTU), boron 4.1 Criticality Calculationconcentration in the coolant (C.,9, C...,), cooling time The CSAS25 module and 44GROUPNDF5(0, 1, 5 years), and axial burnup profile of spent fuel library of SCALE 44 have been used to calculate the(actual, flat). The following effects and trends for kff for the conceptual design for cask under normaloperating parameters and axial burnup distribution and accident conditions. The SAS2H module wasare observed.
A higher moderator temperature in depletion used to determine the isotopic content of spent ftielcalculation yields a higher reactivity of spent ftiel for those calculations involving burned ftiel. Theassembly for all other operating conditions such as accident case assumes a single fully loaded andboron concentration, specific power level, cooling undamaged cask filled with water. But it is expectedtime, initial enrichment and discharge burnup. There that the kff value would be very low in case ofis no significant difference in the calculated kff at maintaining the normal dry transport condition.different power levels when no cooling time is Therefore, an appropriate pitch of ftiel array in caskconsidered. However, for I and 5- year cooling time, has to be decided by the criticality analysis for
- 680 -

JAERI - Conf 2003-019
accident case. The pitch size was decided according at least 10.2 in. (cask inner radius: above 80 cm) isto the results of the criticality calculations for various required in order to load 5.0 wtO/o fresh fueldistances among fuel assemblies. Following assemblies into the cask with 21 fuel assemblyoperating parameters are used in this study. capacity without bumup credit. These results
represents that the cask volume can be reduced byFuel assembly: CE Plant type 16 x 16 fuel assembly about 13 as burruip credit be introduced in theInitial fuel enrichment and bumup: criticality calculation. For these criticalityMaximum enriched fresh fuel: 50 Wt% U02 fuel calculations of fresh fuel, it should be noted that
(no burmip credit assumed) about 2% k is considered as a bias and uncertainty.Low enriched fresh fuel: 1.8 wto/ U02 ftiel Meanwhile, in the case of BSS as a basketBurned fuel istory parameters: structure material, the pitch size of 9 in. (cask inner
initial enrichment: 43 Wt% U02 fuel, radius: 70 cm) is calculated to safely load the 1.8irradiation time: 2 cycles 450 days cycle) wt% fresh fuels. If the 43 wt% spent fuels are loadedburnup: 36 GWD/MTU into the cask with 9 in. pitch, the calculated kff is less
(specific power: 40 MWt/MTU) than 09. In this case, therefore, the appropriate pitchcooling time: yrs size is estimated to be 9 in.. Also, it is anticipated thatcore cycle average boron concentration: 565 ppm the pitch which can load the 5.0 wtO/o fresh fuels iscore average coolant temp.: 580 OF very large and not practical in engineering sense. Notaxial burnup: uniform g/CM3 taking bumup credit, the volume and weight of the
Pellet stack density: 10. 14 (92.28% of cask will increases significantly more for 5.0 wt%theoretical density) fresh fuels.Water density in the cask: 1.0 g/CM3 (accident case) The BSS considered in this paper has lower boronFuel position in the cask cell center content than that of the boral and it is arrayed that the
structure of basket is less conservative relatively.Calculated results are shown in Table 4 From Therefore, to use BSS without burnup credit, the
these results, the inimum cask cell pitch size that thickness should be increased considerably. It is alsosatisfies the criticality safety limit of 095 kff can be found that under the same pitch sizes, as thedetermined. payload capacity increases, the kff in cask increases.
For the cask using boral as a neutron absorbing This suggests that a more restrictive loadingmaterial, it is possible to load 1.8 wtO/o fresh fuel and condition of fuel assembly needed for the largerthe 43 wtO/o burned fuels with the pitch size of 86 in., payload capacity. However, a larger payload capacitywhich corresponds to 65 cm cask inner radius, cask would be preferable since the degree of increaseconsidering te sizes of fuel assembly and basket in keff is very small.structure. Also, it was evaluated that the pitch size of
Table 4 kff for various pitch sizeskff' (neutron absorber: Boral)
pitch 5.0 wt% fresh fuel 1.8 wtO/o fresh fuel 4.3 wt%, 36 MWD/MTU(in.) (no burnup credit) (cooling time: yrs)
No. of fuel assembly No. of fuel assembly No. of fuel assembly14 2 52 14 2 52 14 2 52
8.6 - 1.09400 1.12671 0.81429 0.83650 0.86069 0.78430 0.80405 0.82922(0.35273)b (0.23481)b
10.0 0.93619 0.94959 0.96696 - - - - -10.2 - 0.92760 0.94272 -10.4 - 0.92001 - -
kff' (neutron absorber: BSS)
pitch 5.0 wt% fresh fuel 1.8 wt% fresh ftiel 4.3 wt%, 36 MWD/MTU(in.) (no bumup credit) (cooling time: yrs)
No. of fuel assembly No. of fuel assembly No. of fuel assembly14 21 52 14 21 52 14 21 52
9.0 1.15091 1.17687 1.20903 0.89288 0.91419 0.93692 0.85245 0.87009 0.89369(0.23718)b
10.0 - 1.09437 - - - - - -11.0 - 1.02987 -
a. The bias and uncertainty is not included.b. The kff under nonnal condition (dry condition)
681 -

JAERI - Conf 2003- 019
Based on the above evaluated pitch sizes, the k,,ff The minimum allowable burnups for the maximumhas been calculated for various combinations of allowable initial enrichment (5.0 wtO/o U-235) areinitial fuel enrichments and burnups to determine the approximately 30 GVM/MTU for boral cask and 42initial enrichment and burnup of a fuel assembly GWD/MTU for BSS cask. In general, the acceptablewhich can be loaded into the cask. This calculation burnup and initial enrichment of the boral cask casehas been performed only for the 21 capacity cask. in Figure 2 corresponds to the typical spent fuel
Two cases of the kff were calculated on the condition of a PWR plant. Also, it should be noteddetermined pitches (boral: 86 in., BSS: 90 in.) in that, in order to transport the fresh fuel with 5.0 w/oorder to estimate the loading allowable burnup for the U-235, the array interval (pitch) of fuel assemblygiven initial fuel enrichments of a fuel assembly. The should be increased. In this case, the volume of thefollowing initial enrichments and burnups are used in cask would have to be increased by 1.5 times asthis case study. discussed in the previous subsection.
Initial fuel enrichment: 20 25 30 35 40 45,5.0 wtO/o 5. ConclusionsFuel burnup: 18, 36, 54 GWD/MTU
The criticality analysis of the conceptual designIn order to take into account the bias and for cask has been performed with burnup credit.
uncertainties on the criticality analysis, the following Three different sizes of cask with 14, 21 and 52 PWRparameters have been considered: fuel assemblies are modeled and two different
Bias and uncertainty for burnup calculation absorbing material, boral and BSS, are considered forBias and uncertainty for criticality calculation the conceptual cask. A pitch of 86 in. was decidedIndividual calculational uncertainty of Monte Carlo for the cask using boral as a neutron absorbing
method material by the criticality analysis for accident case.- Tolerance and uncertainty due to the deviation from Likewise, a pitch of 9 in. was selected for the casknominal condition (temperature, fuel rack pitch, rack using BSS. Two different burnup credit loadingsteel thickness, aount of poison material, most curves are also developed based on the determinedreactive position of fuel assembly in cells, etc.) pitches for boral and BSS absorbing materials.
Increased cask payloads and the corresponding4.2 Calculation Results decrease in total number of shipments result in
CSAS25 has been run for various combinations substantial incentives by allowing burnup credit forof initial fuel enrichments and burnups to determine PWR spent fuel cask applications. The cask designedkeff as a function of burnup for the given initial fuel with burnup credit can load about 1.5 times more fuelenrichments. Figure 2 shows the minimum allowable assemblies than that without burnup, credit for theburnup for a fuel assembly which could be loaded in case of 21 capacity cask using boral with the samethe 21 capacity cask. The minimum allowable burnup volume. Additional benefit could be expected byis the value above which the criticality safety limit of considering that the potential accident risks and0.95 kff is satisfied. Therefore, the spent fuel occupational exposure are decreased by means ofassemblies with burnup and initial enrichment above decreasing the total number of shipments.the curve in Figure 2 are qualified for loading into thecask. References
1) "SCALE 44: Modular Code System for
CASK Burnup vs Enrichment Performing Standardized Computer Analyses forLicensing Evaluation for Workstations and
4,5000 Personal Computers," C00545/MNYCP00, Oak
40000 Acxewobie Ridge National Laboratory, 1998.'woo Region 2) "Validation of SCALE System for PWR Spent
Fuel Isotopic Composition Analyses,"30000
ORNUTM-12667, Oak Ridge National0 25400
Laboratory, March 1995.20000 3) "An Extension of Validation of SCALE(SAS2H)
E 1500u Isotopic Predictions for PArR Spent Fuel,"n
WOO dCi:eotHtj1Q ORNUTM-13317, Oak Ridge National50130 Reg an Laboratory, September 1996.
0 4) "Critical Experiments with Subcritical Clusters of2.0 25 0 3.5 40 45 5.0 2.35 wtl/o and 431 wtO/o U-235 Enriched U02
Fuel Initial Enrichment(wt%) Rods in Water at a Water-to-Fuel Volume Ratio ofCASE I Boral) - CASE2(BSS) aci c o west La oratory,
July 1980.Fig. 2 Minimum allowable bumup for 21 capacity 5) "Criticality Experiments with Subcritical Clusters
of 235 wtO/o and 429 wtO/o 235U Enriched U02
- 682 -

JAERI-Conf 2003-019
Rods in Water with Uranium or Lead ReflectingWalls," PNL-2827, Pacific Northwest Laboratory,April 1979.
6) "Criticality Experiments with Subcritical Clustersof 235 wt% and 431 wtO/o 235U Enriched U02Rods in Water with Steel Reflecting Walls," PNL-3602, Pacific Northwest Laboratory, April 198 .
7) "Clean Critical Experiment Benchmarks forPlutonium Recycle in WRs," EPRI NP-196(Volumes I and II), Electric Power ResearchInstitute, April 1976 and September 1978.
8) "Saxton Plutonium Critical Experiments for theSaxton Partial Plutonium Core," WCAP-3385-54,Westinghouse Electric Corporation.
9) "Water-Reflected Mixed Plutonium-uraniumOxide 20 wt%) Pins," MIX- COMP-THERM-00 1, International Handbook of EvaluatedCriticality Safety Benchmark Experiments,NEA/NSC/D0C 95)03 Volume VI, NuclearEnergy Agency, Organization for Cooperation andDevelopment (OECD), Paris, France.
10) "Critical Arrays of Mixed Plutonium-uraniumFuel Rods with Water-to-fuel Volume RatiosRanging from 24 to 56," MIX-COMP-THERM-004, International Handbook of EvaluatedCriticality Safety Benchmark Experiments,NEA/NSC/DOC 95)03 Volume VI, NuclearEnergy Agency, Organization for Cooperation andDevelopment (OECD), Paris, France.
I 1) V. 0. Uotinen, et al., "Lattices of Plutonium-Enriched Rods in Light Water - Part I Experimental Results," Nuclear Technology, (15)257, August 1972.
12) International Handbook of Evaluated CriticalitySafety Benchmark Experiments, "NEA/NSC/DOC(95)03, Nuclear Energy Agency, Organizationfor Cooperation and Development(OECD), Paris,France.
- 683 -

JAERI-Conf 2003-019 JP0450128
Evaluation of Burnup Credit for Accommodating PVVR Spent Nuclear Fuel infth-capacity Cask Designs
John C. WAGNER'Oak Ridge National Laboratory� P. 0. Box 2008, Oak Ridge, Tennessee 3 7831-63 70, USA
This paper pesents an evaluation of the aount of burnup credit needed for high-density casks totransport the current U.S. inventory of commercial spent nuclear fuel (SNF) assernblies. A prototypic32-assembly cask and the current regulatory guidance were used as bases for this, evaluation.By compariiig actual pressurized-water-reactor (PWR) discharge data (Le., ftiel burnup and itialenrichment specifications for fuel assemblies discharged fiom U.S. PWRs) with actinide-only-basedloading curves, this evaluation finds that additional negative reactivity hrough eher increased credit forftiel bumup or cask design/utilization modifications) is ncessary to accommodate the majority of SNFassemblies in high-capacity storage and tranTortation casks. Te impact of varying selectedcalculational assumptions is also investigated, and considerable improvement in efrectiveriess, is shownwith the inclusion of the principal fission products (FPs) and minor actinides and the use of a boundingbest-estimate approach for sotopic validation. Given sufficient data for validation, the most significantcomponent oil would improve accuracy, and subsequently enhance the utilization of bumup credit, is theinclusion ofFPs.
KEYWORDS. burnup credit, criticality safety, spent nuclearfuel, transportation
1. Introduction in some detail and considerable pgress has been made nunderstanding the issues and developing approaches for a
Historicafly, citicality safi* analyses for commercial light sakty evaltration. Based on these sdies, the U.S. Nuclearwater reactor WR) spent fuel storage and transportation Regulatory Commission (NRC) issued Interim Staffcasks have assumed the spent ftiel to be fresh (unirradiated) Guidance8revisionloSG-8rl)inJulyl999.') Adiscussionwith uniform itopic compositions corresWriding to the of the technical considerations did helped form themaximum aowable enrichment. Thisfivsh-fitel asmwphon development of ISG-8 can be found in Ref 2 Subsequently,provides a smple bounding approach to the criticality analysis ISG-8 revsion 2 OSG-80) wch eminated or lessenedand elirrmates concerns related to the fuel operating history. several of the imitations in ISG-8rl, was issued in September
However because do assumption ignores the decrease in 2002.')reactivity as a result of irradiation, it is very conservative and The initial issuance and subsequent evisions of ISG-8can result in a significant reduction in spent nuclear fuel (SNF) have provided the impetus for mdustry to proceed with a newcapacity for a given cask volume. Numerous publications generation of high-capacity cask designs using burnup audithave demonstrated that increases in SNF cask capacities fiom However, concenis have been rased dial additional credit forthe use of bumup =& can enable a reduction in the nmber fuel bumup, beyond that currently recommended in ISG-8,of casks and shipments, ad thus have notable financial will be necessary to accommodate the ajority of SNFbenefits while poviding a risk-based approach to improving assemblies in high-capacity (Le., 32 assembly) casks.safay The cncept of taking credit for the reduction in This paper summarizes recent effbie to evaluate the usereactivity due to irradiation of nuclear fuel (i.e., fuel bumup) is of burnup credit to accommodate SNF in high-capacitycommonly eferred to as bwW credit. The reduction in storage and transportation casks. The evaluation is based onreactivity that occurs with fuel burnup is due the cange in comparisons of PWR discharge data (Le., fuel bumup andconcentration (net reduction) of fissile nuclides and the initial erichment specifications for fael assemblies dischargedproduction of parasitic neutron-absorbing nucUdes [non-fissile from U.S. PWRs wh bumup-credit loading curves for theaLtinides and fission products (FPs)]. prototypical high-capacity GBC-32 cask-) and determinations
The utilization of credit for fuel burnup in an of the percentage of assemblies id meet the loading criteria.away-fi-om-reactor riticality safety evaluation necessitates Subsequently, vriations in the pncipal analysis asumptionscareful consideration of the fuel operating history, additional are considered to assess the potential for eanding thevalidation of calculmonal methods (for prediction and use of percentage of assemblies dig may be accommodated SNF isotopic compositions), consideration of new conditions high-capacity casks.and configurations for the licensing basis, and additional Bumul>-ci� loading curves (see Figure 1) definemeasures to ensure proper cask loading. For pressurized assembly acceptability i trms of minimum required umupwater-reactor (PWR) firel, each of these arm has been sudied as a firriction of hitial assembly eichment. Each burtrup
Corresponding author, Tel. 865-241-3570, Fax. 865-576-3513, E-mail: wagnedc�oml.govManaged by UT-Battefle, LLC, for the U.S. Department of Energy under contract No. DE-AC05-00OR22725.
- 684 -

JAERI-Conf 2003-019
and enrichment combination on the loading curve corresponds and skipped the first 100 generations before averaging; thus,to a limiting value of the effective neutron multiplication brtor each calculated kf value is based on 2 illion neutrori(k.f) for a given configurzition (eg., a cask). histor�ies. Te KENOVa calculations utilized the SCALE
238-group cross-section library.
60 The determination of burnup-erinchment combinations fora bumup-avdit loading curve equires a senes ofdepleetion and
50 Acceptable cnficality (STARBUCS) calculations associated wh anfor cask �adin�� wave search andVor interpolation. This process is
Z 40 automated via an iterative sean;h capabW ) that aows
I repeated STARBUCS calculations to be perfmied, using aa 30 least-Auares analysis of the results to aomatically adjustCL Una= 20 cceptable eimchment into a desh-ed kfvahie is obtained withi a desirWE for cask loading tolerance for a user-suMlied series ofbumup steps. For this
lo work, loading curves were gnerated for a arget 4 valu of
0 0.94andconvergencecdterionof±0.002. Tusallbading
2 3 4 5 curves shown in this paper contspond to kf = 0.940 ± 0.002.
Enrichment [wt% 235q 3. Burnup-Credit Analyses
In a separate effort elated to bumup credit, a generic
Fig.1 Illustrative burnup-cnadit loading curve. Thevertical high-capacity (32-assembly) cask designated GBC-32, was
portion. ofthe loading curve at low burnup mesponds t a defined as a computational benchmark to provide a re&vrice
region in which the reduction in reactivity due to bumup Ls confipnitiori for the estimation ofreactivity margin available
smaller than the maease in reactivity associated with the from FPs ad mor actinides.) The GBC-32 cask is
conservatism in the burnw-credit evaluatiori. Hence, no representative of burritip-ctedit casks currently being
credit is taken for buimup in this rgion. considered by U.S. industry and is therefore a relevant and
appropriate configurtion for this evahiatiori.
2. Computational Methods The mplatoty gLudance for bumup credit (ISG-8r2)
mcomniends limiting the arriount of burnup ak to did
Bumup-credit analyses involve depletion calculations to available from atimde compositions in SNF with an
determine te SNF isotopic compositions, extrwtion of SNF assemb]ywaveraged burnup up 50 GW&MW and cooled
sotopic oomposidons from the depletion %got for use i a out-of-reactor for a time pwiod between I and 40 years. Te
cnticality model, and a mlicality calculation to detennine the computational mediodologres used for predicbrig the atitude
kf value. The rem* developed STARBUCS seWence� compositions and detennining the kf value are be property
which adomates buimup-� analyses by coupling the validated. Calculated isotopic predictions are t)pk*7)depletion ad criticality modules of SCALE , was used for validated Against destructive chemical assay msurements
this analysis in particular, STARBUCS couples the from SNF samples, while criticality analysis methods are
following SCALE code nxxHes to achieve the automation: validated against applicable atical experiments. Thusthe
ARP, ORIGEN-S, CSASL WAY, and KENO Va. The ARP nuclides i a &*ty analysis am lh� pimai* by the
code prepm cross sections for each burnup step based on availability of measured/experinental data for validation.
intetpolatim for fuel ermchirvirt and nudcYcle burnuip from a Regmt1ing modeling asstiniltons, it s recommended that the
user-supplied ARP library dim contains problem-dependent applicant enstire dig the actinide compositions used
cross sectiom The ORIGEN ARP methodology offers a analyzing the licensing safety basis are calculated using fbel
fiisw alternative to the SAS2H deplebm analysis sequence in design and m-reactor operating prameters selected to provide
SCALE, while maintaining calculational accuracy.8) conservative estimates ofthe kf value under cask cnditions.
Using an ARP-generated cruss-sectiori library ORIGEN-S Furthermorr, it is recommended dig the calculation ofthe 4
peribmis the depletion calculations to generate fuel value be perfmned using cask odels, appropdate analysis
compositions for all unique fel regions (e.&, different axial- assumptions, and code inputs do allow adequate
and/or horizontal-bumup regions). The CSASI module is representation of the physics of the snt fuel cask
used to automate esonance self-4melding calculations and environment
prepare macroscopic cross sections for each unique fuel region. Following the mcommendations embodied in the
Sequentially with CSASL the WAX odule is executed t regulatory guidance) loading rves were generated for the
append the cross sections into a sgle cross,-section library. GBC-32 cask for each of the following assemby tRes:
Finally, the STARBUCS module executes the Combustion Engineering (CE) 14 x 14, Babcock Wilcox
duw-dimensional O-D) KENO Va (or KENONO (B&W) 15 x 15, CE 16 x 16 a Westinghouse VVE)
Monte Carlo criticality code using the generated cross sections. 17 x 17. Unless specifically stated otherwise, the following
To ensure proper convergence and reduce substical calculallonal assumptions were used:
uncertainty the KENOVa calculations simulated principal actinides only (Le., 24U, 25U, zU, B8N "9R4
1 1 00 generations, with 2000 neutron hstories per generation, IIIk4 241PL4 242pL4 and "Arri);
- 685 -

JAERI-Conf 2003-019
• onservative operating parameters for fuel teruperature absorbers, including BPRs, on the reactivity of PWR SNF is(HOOK), moderator temperatureidensity (61OK/ discussed in Ref. 12. Additional calculational details are0.63 g(cc), specific power continuous operation at available in Ref. 4. The discharge data"' used for ts60 MW/MTIJ), and soluble b oron concentation evaluation corresponds to SNF assemblies dscharged from
(cycl"veragevalue of 1000ppm)-4) U.S. PWRs through the end of 1998 (see Figure 2).• bumup-<lependent axial and horizontal burnup
dist6butions suggested in Ref. 10; 4. Results• 5year cooling time, and
• isotopic correction factors OCFs), used to adjust predicted The loading curves for the four assembly types arecompositions for individual nuclides for bias and Provided in Figure 3 and the acceptability of the SNFuncertairity (to a 95'/o(95% confidence level), as assemblies for each ftiel type is summarized in Table .determined from comparisons of calculated and Consistent with the regulatory gdance, assemblies thatmeasirred isotopic compositions from Ref I . require bumup > 50 GWdVM are lassified as uacceptable
Bemuse BW and WE assemblies have used burnable Also, the determination of acceptability does not account for
poison rods (BPRs), those cases assumed BPR exposure for burnup uncertanily, which would reduce the percentage ofthe ft 20 GWdWM of bump. The effect of fixed
0<50 0 50 - 200 11201 - 300 M 301 - 500 El > 501
60 - 3
r -IT-1-1
2RI I1763 3 14 1 a1 7 1 1 4ril I 1 3 9 1911614 3 151 5122 51 2. . I
2 1 12 8 31 6 19 1 5 181 2137111 12 25 12 1
7 10 9 4i 15129 27 311 3144123 12 ]-�( I
is 22 26 15 72 15 4L 44 451 10147F12 6 4 1 5 1 25 - F1-1 Fl� --1O9 35 39 99587 58 911 5137129 7 1 2
3 3 8 1 21 11 22 105 �51 A19 5T MI 71 28 27 121 24 22
:MII15 51 94 dB 97 '91 its 91 76� 1.541 361114 7 5 11238 7 761 20 84 2 3
F4 0102 127 130 238 146 262 97
2131�54116 71 75 57 ISO R5 238 141 300 67, goI 19 4 1
F -i-6 -1
24 113 IG6 53 191 145 74 7 32 34 1
1 4131 1 41 1 1 L7. 129 I35 134 36 260 145 74 175 I, 'O I10 151 133 134 lid 141 38 43 8 71 6
M 16 3 5449 76 53 126W233 �'4 20 814
40 Z' 161 283 262 292 T91 192 132 189 61 57 8 943 59 241 �'M 231 UV1264 138 94: 157 15 3 13
40 104 235 224 = '5011 207 ilo �76 189 22 22
M235 75 A -To 192 it6 Ml
267 JU 7:61 1M 140 07 01 213 155 2 7r I 4 1 64 218 287 2501 17 80 '73 84 177 4 3
[�2 1 I1 17 106 90 125 176 251 219 '2201 IG4 76 63 51 73 203 5 3
i 7] 28 43 5" 84 212 186 1%] 84 39 46 36 68 1223 91 251 127 �153 19 39 44 31 70 9'
71-1 16121171 42 59 T4 z 233 254 29i 217 230 7 1III- 34 4 24 50 log
0 30 F-1-1 :q 60129151911 3 58 210 176 221 210 135 119 42 IL 9 2 1 50 19 107 211 _3 1 1 5 43 273 165 1751124 243 207 83 4 2 33 6 43 42 14 24 1 9 2
6 1120 22142135 169 53 243 113 125 113 216 1271 92 15 17 S II 55 it 36 9
-1 16 9 15 2,4 64 132 309 231 95 77 71 179 87 76 9 62 6 23 30 16 31 7
2 7 43 39 37 198 36 73 201 105 82 66 97 '96 22 14 76 3 6 19 10 19 7 RI F-Q6 9 29 6i 63 14 6 61 124 60 22 16 60 71 23 13 29 4 11 12 17 6
17 11 46 1dd 41 13 1 14 B. 11 2d . 11 3 12 1 I, 1 7 12 II 30 1
6 6 25 I66 47 88 7 47 159 27 J9 21 2 31 1112 11 39 11IS 35 8 20
11 21 49 0 21 13 1 9 21 13
15 40 15 88 61 19 32 33 88 19 3 U 23 87 4 2 6 1 2121 1 2 1 1I6 F4720 20 19 Iff i85 11 11 70120 6 1 53 10 17 4 26 1 53 6
4 37 20 2OU 138 2 20 17 22 1 2 52 3 5 2 9 9 1 12
a I 1A 89 4 17 16 1 1 6 1 4
2 131 93 145 228 24 36 2 II I 2iI. 152 128 62 21 1 1 K 13
27 129 45 22 51 a 15 1 4 1 2 16 1 11311 58 47 27 11 49 4 1 6 P43 Pfl37 1 49 39 13 1 21 1 311 3 1 I r 2 T 2
4 :4 1_ I 9 5 11 2 TTI 13 64_ I I 2 2 112 2d 27 2
r 2 4_7_R is 204
R 16 12 24 ��2
9
M Eff8r -,I
UD F4 P-q
F 21
0 5-3 I MF 41 FT-1 F-2
1.5 2 2.5 33.5 4 4.5 5
Eumhnrnt fw(Po 235 U]
Fig, 2 U. S. PWR SNF discharge data through 1998 numerical values correspand to the number of assemblies).
- 686 -

JAER1 Conf 2003 -- 019
60 60+ accept 77% + % +
X50 X reject 23%), 50 X
40 40
X30 30 XCL 0.:3 :3E E20 20 X
X X XX XK X
1 10
X
0 0
1 2 3 4 5 1 2 3 4 5
Enrichment [Wt%2"Lq Enrichment [Wt% 235tj]
(a) CE 14 x 14 (b) B&W 15 x 15
60 - 60+ accept 62%) + + ac
50-- X reject(38%) 50 r
40 - 40
30 - W Y, 30 - ++-a CL
E E 2020 XX
10 10 RX0 M 0 X I
1 2 3 4 5 1 2 3 4 5
Enrichment [wt% IIIIA Enrichment [wt% 111U]
(c) CE 16x 16 (d) WE 17 x 17
Fig. 3 Comparison of discharged SNY assemblies to actinide-only-based loading curves for the GBC-32 cask
Table Summary of SNF acceptability in the GBC-32 cask acceptable assemblies. The results indicate that,.,,hfle burnupwith actinide-only burnup credit for the four assembly ypes credit can enable loading a arge percentage of the CEconsidered assemblies in a high-capacity cask, its effectiveness under the
Total in Number Number current regulatory guidance is minimal for the B&W and WEAssembly discharge acceptable for unacceptable assembly designs considered.
type data loading for loading To evaluate the effect of selected calculational. assumptions
CE 14x 14 5453 4194 77%) 1259 23%) Figure 4 compares the reference case loading curve for theWE 7 x 17 assembly with loading crves for the following
B&W l5x15 6439 190 3-/) 6249 97%) individual variations: (1) extended cooling time 20 years);(2) inclusion of the pincipal Ps rMo, 9'-Fc, JOIR,4 103pj�
CE 16x 16 5809 3618 620%) 2191 380/.) 109Ag, 133CS, 147SM, 149sm, 150sm, 151sm, 152sm, 143 Nd, 145 Nd,
WE 17x 17 21569 2437 11%) 19132 (89%) 151E,,, 153EU, 155 Gd) and inor actinides C6u, 237 Np, 243 Am)with ICFs based on comparisons") with available assay data;
Total 39270 10439 27%) 28831(73-/) (3) inclusion of the principal Ps and minor actinides based on
a best-estimate approach") for bounding isotopic validation;and 4 inclusion of the principal FPs and minor atinideswithout any correction for isotopic validation. Note that for afew of the relevant FPs, no measured assay data are available.
- 687 -

JAERI-Conf 2003-019
Thus, with the exception of the final case, no credit was taken high-capacity casks. The loading curves presented in thisfor their presence in the SNE paper are such that a notable portion of the SNF inventory
From Figure 4, it is apparent did extended cooling time can would be unacceptable for loading because the burnup value isbe used efectively to incrementally increase the prcentage of too low for the initial enrichment Relatively srnall shifts in aacceptable assemblies. (A more detailed discussion of the cask loading curve, which increase or decrease the minimurneffects of cooling time is available in Ref. 14.) However, required bumup for a given enrichment� can have a significantinclusion of FPs and/or the use of more realistic approaches for impact on the number of SNF assemblies that are acceptableisotopic validation oers significantly larger potential benefits. for loading. Thus, as the uncertainties and correspondingFor the GBC-32 cask, the percentage of acceptable assemblies conservatisms in bumup credit analyses are better understoodincreases from II to 58% with the inclusion of the principal and reduced, the population of SNF acceptable for loading inFPs and minor actinicles (both cases at 5-year cooling), and high-capacity casks will increase. Therefore, firture workfrom 58 to 94% with the use of a bounding best-estimate should focus on improving the accuracy associated withapproach for isotopic valiclation, as descl:)ed in Ref I . he estimates of subcritical margin ith bumup credit. Givenfinal case shown in Figure 4 corresponds to fiII credit for the appropriate data for validation, the most significant componentcalculated acbnicle and pcipal FP compositions and that would improve accuracy, and subsequently enhance therepresents a limit in terms of the potentially available negative utilization of burnup credit is the inclusion of Ps.reactivity. For the cases ith Ps included no explicit Consequently, an eective approach for validation of FPs is aconsideration of criticality validation with Ps is included. key element necessary for the expansion ofbumup creditHowever, the loading curves are a based on an upper Because the CE assemblies am considerably less reactivesub,critical imit of 0.94 (as opposed to 095), which inherently than the WE and BW assemblies considered herein, loadingallows I% Ak for criticality calLulational bias and uncertainty. curves for the CE assemblies are notably lower thart those for
WE and B&W assemblies. Assemblies w are not qualified
for loading in a given high-capacity cask (i.e., do riot meet the
Reference (accept 6�) minimurn burnup requirement for its irritial enrichment value)must be stored or transported by oher means. These include
20-y cooling time (accept 26%) (1) high-c�acity casks ridi desigAitilization modifications
and 2) lower-capacity (e.g., 24-assembly) casks that dlizeIncludeFP,�8,,,Inorac,nideswlhlCFs(accept58%) flux traps and/or increased fixed-poison oncentrations In
previous section loading crves developed for atinicle-only
include FPs & minor actinides w ith best-estimate burnup credit with an established 24-assembly cask design are
isotopic validation (accept 94%) such dig all or very nearly all assemblies with initialA Include Fs & inor actinides w ithout any isotopic
validation (accept 98%) entichments up to wt % 235U are acceptable. Also, loadingcurves developed for the GBC-32 cask with selected design
60 (increased poison loading) and udlization (rods inserted into
50 the assembly guide tubes) moclifications� iustrate aternativemeans for increasing the number of assemblies acceptable for
40 loading in high-capacity cask designs. Although the use of
rod inserts impacts operational procedures, te approach
0 30 01 (coupled with burnup credit consistent with current regulatory
gwdance) offers a great deal of flexibility to achieve neededE 20
reductions in reactivity in an existing high-capacity cask
10 design.
0- Acknowledgernents
1.5 2.0 2.5 3.0 3.5 4.0 4.5 5.0 The author gratefully acknowledges C. V Parks of
Enrichment [wt%2351A OakRidge National aboratory and C. J. Withee ofthe
U.S. NRC for providing gdance and valuable comments,/
Fi& 4 Effect ofcalculational assumptions on loading curves suggestions for this work.
for the GBC-32 and WE 17 x 17 assemblies.References
I ) "Interim Staff Guidance - 8, Rev. I - Limited Burnup
5. Conclusions Credit�" U.S. Nuclear Regulatory Commission, SpentFuel Project Office (July 1999).
Comparison of actinicle-only-based loading cves for the 2) D. E. Carlson, C. J. Withee and C. V Parks, "Spent fuel
GBC-32 cask with PWR SNF discharge data through the end bumup credit in casks: An NRC perspectives
of 1998) leads to the conclusion that additional negative Proc. U.S. Nuclear Regulatory Commission's
reactivity through either increased credit for fuel bumup or Twenty-Seventh Water Reactor Safety Information
cask clesign/utflization modifications) is necessary to Meeting, Oct 25-27, 1999, Bethesda, Maryland,
accommodate the ma ority of SNF assemblies in NUREG/CP-0169,419-436 2000).j
- 688 -

JAERI-Conf 2003-019
3) "Interim Staff Guidance - 8, Rev. 2 - Limited Bumup 9) L C. Gauld and C. E. Sanders, Development adCredk" U.S. Nuclear Regulatory Commission, Spent Applications of a Prototypic SCALE Control ModuleFuel Project Office (Sept 2002). for Automated Burnup Credit Analysis:' Proc. 2001
4) J. C. Wagner and C. E. Sanders, "Assessment of ANS Embedded Topical Meeting on PracticalReactivity gins ad Loading Curves for PWR Implementation of Nuclear Criticality Safety, Reno, NV,
Bumup Credit Cask Designs," NUREG/CR-68W, Nov. 11-15,2001,35238.pdf(2001).ORNLTM-200216 2003). 10) 'Topical Report on Actinide-Only Burnup Credit for
5) J. C. Wagner, Computational Benclimark for PWR Spent Nuclear Fuel Packages�' DOE/RW-0472,Estimation of Reactivity Margin from Fission Products Rev. 2 U.S. Department of Energy (SepL 1998).and Minor Actinides, in PWR Bumup reW' 11) I. C. Gaukt Strategies for Application of IsotopicNUREG/CR-6747, ORNL/rM-2000/306 (2001). Uncertainties in Burnup CrecK" NUREG/CR-681 ,
6) 1. C. Gauld and S. M. Bowman, "STARBUCS A ORNL/TM-2001/257 2003).Prototypic SCALE Control Module for Automated 12) J. C. Wagner ad C. E. Sanders, Investigation of theCriticality Safety Analysis Using Burnup CrecK" effect of fixed absorbers on the reactivity of PWR spentNUREG/CR-6748, ORNL/rM-2001/33 2001). nuclear fuel for bumup aW ' Nuc]. Technol. 139(21
7) "SCALE: A Modular Code System for Performing 91-126(2002).Standardized Computer Anal1yses for Licensing 13) "RW-859 Nuclear Fuel Data," Energy InformationEvaluation," NUREGYCR-0200, Rev. 6 (ORNIJ Adminisfi-ation Mm. 2000).NUREG/CSD-21R6), Vols. II, and III 2000). 14) J. C. Wigner and C. V Pks, Recommendations on the
8) L. C. Leal, 0. W. Hffrnann, S. M. Bowman and C. V Credit for Cooling Tirne in PWR Burnup CreditParks, Autornatic rapid process for the generation of Analyses�' NUREG/CR-6781, ORNUIM-20OIrMproblern-dependent SAS2HORIGEN S cross- section (2003).librar�'Nuc]. Technol. 127(1 123 1999).
- 689 -

JAERI-Conf 2003-019 JP0450129
Investigation of Several Methods to Set Burnup for Criticality SafetyAssessment of Spent Fuel Transport Casks
Yasushi NOMURAJapan Atomic Energy Research Institute, Tokai-mura, Naka-gun, baraki 319-1195, Japan
Several currently available methods to set burnup for depletion calculation are reviewedand discussed about its adequacy for criticality safety assessment of spent fuel (SF)transport casks by taking bumup credit (BQ into accounts. Various errors associated withBC criticality analyses are evaluated and converted to equivalent burnup to compare eachother. Methods are proposed to use some reduced burnups equivalent to compensation ofthese associated errors. Effects of assumption of axial burnup distribution on criticalitycalculation and irradiation history parameter variation on depletion calculation areevaluated with OECD/NEA BC international benchmark data.
KEYWORDS: burnap credit, spentfuel transport cask, criticality safety assessment,upper 50 cm averaged burnup, axial burnap distribution, correction factors, irradiationhistory data variation, equivalent uniform urnap, equivalent initial burnap
1. Introduction example calculations by using a realistic modelproposed in OECD/NEA BC international benchmark.
The most important and basic amount for BCcriticality safety analyses of the SF facilities may be 2. Upper 50 cm Averaged Burnupburnup of the fuel if BC is taken into account incriticality safety design and control. Averaged burnup In European countries such as UK and France, anof SF assembly is derived from heat output and upper 50 cm averaged bumup of SF is approved bynuclear radiation measurement during reactor regulations') to be used for BC criticality safetyoperation, and usually referred to reactor management assessment. This reduced burnup may be said todata accompanying SF assembly itself Upper 50 cm compensate measurement errors accompanied with SFaveraged burnup, which is in practice used for BC assembly averaged bumup. In fact, it is said that therecriticality safety evaluation and control, should be is some difference between the assembly averagedexamined of its safety margin secured by this method. burnup obtained from reactor management data andSystematic errors associated with burnup the urnup measure prior to F acceptance in storagemeasurements, biases inherent to depletion calculation or transport facilities. Here, the upper 50 cm averagedcodes together with statistic errors associated with burnup is evaluated with axial burnup distribution datainput data of irradiation history parameter variation measured by the PIE (Post Irradiation Experiment) )should be appropriately addressed. And deviation performed at JAERI using Takahama-3 PWR SF anderrors produced with burnup profile assumption for the other publicly available or recommended data tocriticality analysis, should be duly evaluated to give compare with the whole length averaged burnup. Fig. Ithe maximum neutron multiplication factor, K,, of the shows one of 18 sets of gamma scan data acquired insystem to judge its criticality safety by comparing the PIE, which is an equivalent to the axiallywith the safety criteria such as 095'). In fact, there are distributed burnup. As a result, the ratios of upper 0several methods proposed and published to cm averaged burnup to whole length aeraged burnupcompensate these errors for BC criticality safety range from 074 and 084 for these PIE data. It seemsanalysis on the conservative side such as application that there is no tendency in these ratios with regard toof correction factors to isotopic composition burnup as shown in Fig.2. In order to justify this uppercalculated by depletion code, and usage of Equivalent 50 cm averaged burnup for use in SF criticality safetyUniform Burnup (EUB), or Equivalent Initial assessment, burnup measurement error should be dulyEnrichment (EIE) to initiate depletion calculations for 1.80SF transport or storage criticality safety assessment. 1.60
In this paper, some currently available methods to 1 140
set equivalent burnup compensated for the associated 'S,errors are briefly reviewed and evaluated of their 00adequacy for BC criticality safety assessment for SFtransport and storage facilities. And, a new method isproposed to derive compensated bumup equivalent tocorrection factor applications. In addition, safetymargin secured by these methods are evaluated with
0 so 1000 Im zew 2500 3000 3ND
Mt- ft- tp �W (-)Fig.1 AMW bwn.p dd,1btk. f TAW�3 PWR f.W od unVb
- 690 -

JAERI-Conf 2003-019
evaluated by performing direct measurement on the 0.95
error itself0.9 A-g.d b-p 32GWd/t
0 86
Q� 0.84 0.85E
0.82 90.8
0.8LI
0.78 A�6,sgd b.4p 5GWd/�0.75
E 0.76
0.74 0.7
0.72 -20 25 30 35 40 45 50 0.65
0 2 4 6 8 10 12whole length averaged burnup (GWd/t) Deflection of mial bun,up mfde M
Fig. 2 Upper 50 cm averaged bunnup ratio for Takahama-3 spent fuel. Fig. 4 Calculated keff as a function of eflection of axial burnupprofile with actinide and fission products considered.
3. Axial Burnup Distribution Assumption 4. Correction Factors Applied to CalculatedMade for Criticality Analyses Isotopic Composition
It is well known that results of criticality safety Correction factors have been derived from C/Eanalyses for SF transport and storage system are valueS6), which are the ratios of calculated isotopicsensitive to the assumption of axial burmip composition to corresponding PIE data, so as to getdistribution. Recent practice of the sensitivity kff values compensated on the conservative side foranalyseO) made with OECD/NEA BC benchmark criticality safety assessment. Here, the effect of thePhase 110) indicate that change of unbalance of axial correction factors is examined in application to theburnup distribution, namely asymmetry or deflection realistic cask model proposed by the OECD/NEA BCof burnup profile along spent fuel rod axis, results in benchmark, and the compensated reactivity could besignificant variation of the calculated k,'s depending converted to burnup reduction from the assemblyon averaged burmip and degree of its asymmetry as averaged burnup as shown in Fig.5. It is turned outshown in Fig.'s 3 and 4 In these figures, the axially that the maximum 30 % burnup reduction from the SFsymmetric burnup profile and the uniform bumup assembly averaged can be attributable to the effectdistribution have the same deflection of axial burnup made by the correction factors. It seems that theprofile with different calculated kff's apparently small current derivation method for correction factors couldenough compared with those for greater deflection of induce an excessive safety margin so that modificationthe profile. If compensation is made on the should be made to the method for an appropriate BCconservative side for the effect of difference of criticality safety assessment. Nevertheless, it isassumed axial bumup dstribution in the case of apparent to be convenient in using this reducedactinide only BC criticality safety analysis, this range equivalent bumup for criticality safety assessmentof kills variation can be converted to some 15% instead of applying correction factors to eachreduction from assembly averaged burnup in calculated isotopic composition because of itsapplication to a typical SF transport casks proposed in simplicity in usage.the OECD/NEA BC benchmark.
Base case calculationied ooffecbon facto
A-n WWt0.95
Calcu-lated
0.kew
es0.85
-2 A-, W.d bun,up 5GWdJt
0.8
0.90.75
0.7 77 � ---- --- ------0 2 4 8 8 10 i2D.A�m f.,ml � �fil. W
Fig,3 .I.,"t.d kff as a function of dflctin f ..W bu-p p,.fil. 0.10 20 30 40 50,Mth .tinid. .* -id-d. Averaged Burnup (GWdA)
Fig-5 DiagramtoobtainEUBfromaveragedbumup
- 691

JAERI-Conf 2003-019
is containing 21 PWR assemblies proposed by5. Irradiation History Parameter Variation for OECD/NEA BC international benchmark activities').Input Data of Depletion Calculation The difference of the two conversion curves is so
small as shown in Fig.6 that a common conservativeNuclide isotopic composition calculated with a design curve to get EUB value might be deduced for a
depletion code such as ORIGEN2. V) could be affected given SF assembly averaged bumup irrespective ofby several input parameter variation of irradiation difference in number of SF assemblies andhistory such as boron concentration in cooling water, specification of transport casks.cooling water temperature, specific power of reactor On the other hand, EIE is further simple andoperation, periodic inspection interval and pattern of convenient for use in BC criticality safety assessmentreactor operations). Therefore, the effect of the without depletion calculation performed. By using theparameter variation on calculated kff values should be value of EIE converted from a given assemblyduly evaluated and compensated on the conservative averaged burnup with aid of an appropriate conversionside for BC criticality safety assessment. Here, the curve prepared beforehand, one can evaluate kff of thecompensation is made, as an example, by reducing the system directly from KENO-V.a criticality calculationbumup from te SF assembly averaged for criticality assuming a uniform axial bumup profile of SF rod.safety assessment in application to the realistic Moreover, EIE is almost insensitive to systemtransport cask model proposed by OECD/NEA BC reactivity, structural material constitution and otherbenchmark. It is turned out that some 15 reduction specifications of SF containers as shown in Fig.7, thusof bumup at 5GWd/t can be attributable to the suggesting a possibility to prepare a universal designirradiation parameter variation to obtain k,, values on curve to obtain appropriate EIE converted fromthe conservative side in consideration of errors assembly averaged bumup.produced by the depletion calculation code. Currently, these EUB and EIE are prepared for
specific PWR SF transport casks by using the PIE data.6. "Equivalent Uniform Burnup" and "Equivalent It could be beneficial to establish general methods toInitial Enrichment" derive EIE from EUB, which is evaluated by each
error components discussed herewith in comparison ofTwo unique and each related methods have been calculated and experimental data.
developed so far to set up equivalent burnups for usein simplified and synthetic depletion/criticality safety 3.3
analyses such as "Equivalent Uniform Bumup (EUB)"and "Equivalent Initial Enrichment (EIE)').
EUB is set as a reduced burnup taking errors Isassociated with both depletion calculation and 7 - - -- :7� 14 SF -biy
2.3criticality analysis into consideration. Errors F., 21 3F .- I* Wftd .k
associated with burnup measurement and irradiationparameter variation are also considered in inducingEUB for SF criticality safety assessment. Afteracquiring the value of EUB from the given assembly Is 25 W N a a a Waveraged bumup with aid of an appropriate conversioncurve prepared beforehand, one can evaluate k, of the F19.7 C.,,4-h.. d ENE -- 6. Mw.M -k
system easily and reliably by ORIGEN2.1 depletioncalculation and K-ENO-V.a'O) criticality calculation 7. Conclusion
assuming a uniform axial bumup profile in SF rod. Several methods to set equivalent burnup valuesFig.6 shows the conversion curves of assembly for depletion calculation in consideration ofaveraged bumup to EUB derived from PIE data') of calculation errors associated with BC criticality safetyTakahama-3 PWR for different SF transport cask evaluation have been examined and compared eachmodels, in which one is based on a realistic model other in application to some realistic PWR SFcontaining 14 PWR assemblies') and the other model
transport cask models. Conservative safety marginsexerted by correction factors applied to calculated
30 isotopic composition have been evaluated, and
25 recommended to make modification to the present20 F� method to derive new correction factors with
appropriate safety margin. It could be also.1 F mosmis recommended to develop a general method to derive
EUB and ElE simplified and synthetic BC assessmentmethods with duly evaluated calculation errors.
UA10 is 20 25 30 35 40 45 so 56
Asembly Food bum.p (GWd1Q
Fig.6 Co.Wswisai of EUB w- f- dffwwt msk spscMc9km.
692 -

JAERI-Conf 2003-019
References
1) Nuclear Fuel Cycle Facility Safety ResearchCommittee, "A Guide Introducing Bumup Credit,Preliminary Version (in Japanese)," JAERI-Tech2001-055 2001).
2) Y.Nomura, S.Fujine, K.Itahara and S.Matsuoka,"Present Status of Regulations on Bum-up CreditImplementation in Criticality Safety Control,"Proceedings of International Workshop on SafetyAssessment and Regulation of Nuclear FuelCycle Facilities 2003 2003).
3) (Eds.) Y.Nakahara, K.Suyama and T.Suzaki,"Technical Development on Bumup Credit forSpent LWR Fuels (in Japanese)," JAERI-Tech2000 071 200).
4) T.Kuroishi, A.T.Hoang, Y.Nomura and H.Okuno,"Extended Calculations of OECD/NEA Phase II-C Bumup Credit Criticality Benchmark Problemfor PWR Spent Fuel Transport Cask bu. UsingMCNP-4B2 Code and JENDLE-3.2 Library,"JAERI-Tech 2003-021 2003).
5) hnpo//www.nea.fr/html/science/nncs/specificationsl.phase2C
6) K.Suyarna, M.Murazaki, H.Mochizuki andY.Nomura, "Derivation of Correction Factor tobe Applied for Calculated Results of PWR FuelIsotopic Composition by ORIGEN2 Code (inJapanese)," JAERI-Tech 2001-074 2001).
7) K.J.Notz, '�ORIGEN2, Version 21 Release Notes,"CCC-37 1,pp. 200 - 208 199 1).
8) T.Hayashi, K.Suyama, H.Mochizuki andY.Nomura, "Reactivity Effect of Spent FuelDepending on Bumup History (in Japanese),"JAERI-Tech 2001-041 2001).
9) Y.Nomura, M.Murazaki and H.Okuno,"Preparation of Data Relevant to EquivalentUniform Burnup and Equivalent initialEnrichment for Burnup Credit Evaluation (inJapanese)," JAERI-Data/Code 2001-029 2001).
10) C.V.Parks, SCALE-4.3: Modular Code System forPerforming Standardized Computer Analysis forLicensing Evaluation for Workstations and PersonalCornputers," CCC-545 1995).
- 693 -

JAERI-Conf 2003-019 JP0450130
Parametric Studies of the Effect of MOx Environment and Control Rodsfor PWR-UOx Burnup Credit Implementation
Anne BARREAU'*, Bdnddicte ROQUE', Pierre MARIMBEAU', Christophe VENARD'Philippe BIOUX2 , Herv6 TOUBON 3
CEA Cadarache, -13108 St Paul-Lez-Durance Cedex, France2Eleclricit� De France, 1, avenue du Gn&al de Gaulle, B.P. 408, 92141 Clamart, France
3AREVAICOGEAIA 2 rue Paul Dautier, BP4, -78141 Vilizy Cedex, France
The increase of PVrR-UOX fuel initial erichment and the extensive needs for spent fuelstorage or cask capacities reinforce the interest in taking burnup credit into account in criticalitycalculations. However, this utilization of credit for fuel burnup requires the definition of amethodology that ensures the conservatism of calculations. In order to guarantee the conservatismof the spent fuel inventory calculation, a depletion calculation scheme for burnup credit is underdevelopment.
This paper presents the studies on the main parameters which have an effect on nuclidesconcentration: the presence of control rods during depletion and the fuel assembly environment,particularly the presence of Mx fels around the U02 assembly. Reactivity effects which arerelevant to these parameters are then presented, and physics phenomena are identified.
Keywords: Credit burnup, MOx environment, control rods, DARWIN, CRISTAL
1. Introduction on the main parameters which have an effect onnuclides concentration: the presence of control rods
Criticality and safety analyses have traditionally during depletion and the fuel assembly environment,assumed that the spent nuclear fuel is fresh. This particularly the presence of Mx fuels around theassumption is very conservative since the negative U02 assembly. Reactivity effects which are relevant toreactivity of actinides and fission products is not taken these parameters are then presented, and physicsinto account. phenomena are identified.
The concept of taking credit for this reduction in 2. Presentation of the calculation toolsthe reactivity of nuclear fuel due to fuel burnup isreferred to as ((Burnup Credit)) (BUC). Allowing The studies have been carried out using thereactivity credit for spent fuel offers many economic DARWIN package 3),4) to calculate isotopicincentives. Various design studies pointed out that a concentrations in spent fuel and the criticality-safetyload increase in several fuel cycle devices (casks, package CRISTAL 5) to predict the Keff of a spentstorage pools, dissolvers) is possible when actinides nuclear fuel device. These are both based on theand fission products are accounted for in criticality APOLL02 6) code.studies". However, this utilization of credit for fuelburnup requires the definition of a methodology that APOLL02 is a modular code which solves theensures the conservatism of calculations. A working Boltzmann equation either with the integral for bygroup composed of French Nuclear industrialists and using the collision probability method or with theresearchers was created in 1997 to discuss this differential form by using the Sn method. The Neutronmethodology 2 Data Library used is the 'CEA93' library in a 172-
group structure. These multigroup cross-sections andIn this working group, the CEA (Commissariat A effective cross-sections were processed by NJOY
I'Energie Atomique) teams are involved in the from the JEF2.2 European Filedevelopment of a conservative depletion calculationscheme for ]7x]7 UOX assemblies. In order to DARWIN is the French reference calculationguarantee the conservatism of the spent fuel inventory package for the fuel cycle studies. It was developed bycalculation, we are looking in this paper at the impact the CEA and its French partners (COGEMA, EDF andon UOx assemblies reactivity of some depletion FRAMATOME) to estimate the physical quantitiesmodelling parameters. This paper presents the studies characterizing the burnup ftiels from reactors: material
Corresponding author, Tel. 33 4 42 25 33 49, Fax. 33 42 25 79 79, E-mail: barreaua�dmcad.cea.fr
- 694 -
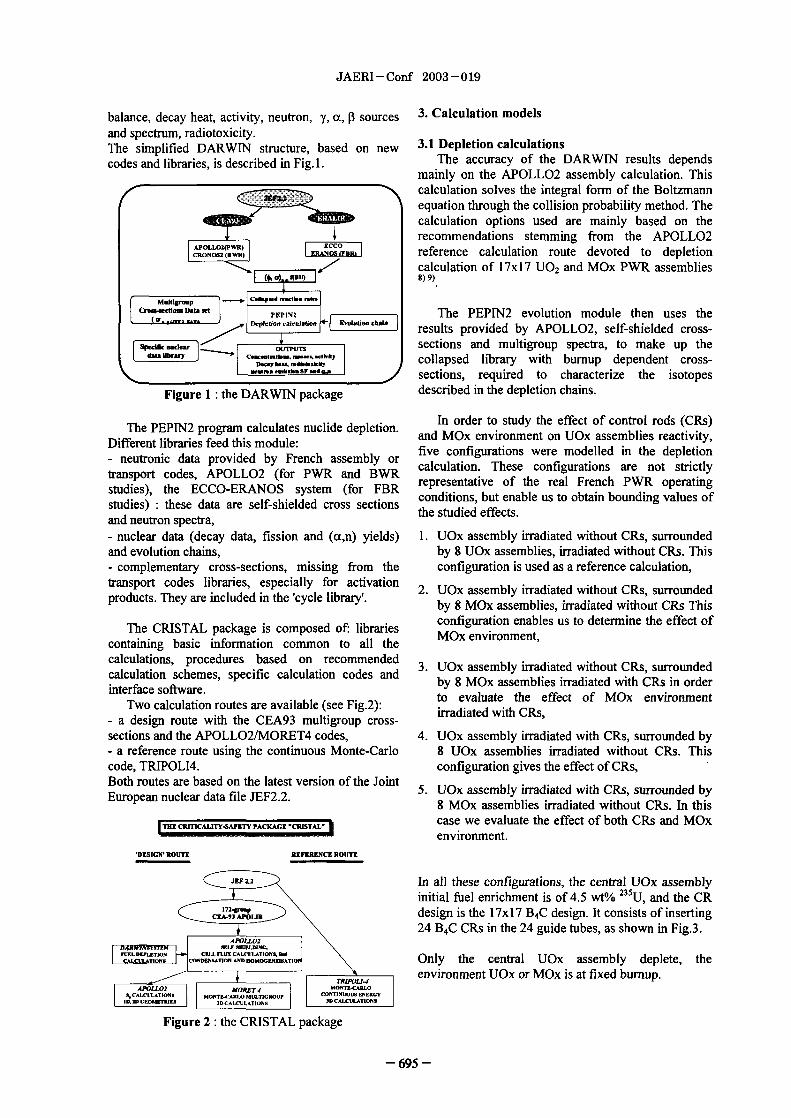
JAERI-Conf 2003-019
balance, decay heat, activity, neutron, y, a, sources 3. Calculation modelsand spectrum, radiotoxicity.The simplified DARWIN structure, based on new 3.1 Depletion calculationscodes and libraries, is described in Fig. . The accuracy of the DARWIN results depends
mainly on the APOLL02 assembly calculation. Thiscalculation solves the integral form of the Boltzmannequation through the collision probability method. Thecalculation options used are mainly based on therecommendations stemming from the APOLL02
"OLL02(PWR) cc-I ONOS2 DWRLJ reference calculation route devoted to depletion
calculation of 17x 7 U02 and Mx PWR assemblies8 9)
Muldgroup cftp.d
Date W The PEPIN2 evolution module then uses theC7 - _= __ 11 Dplai lation results provided by APOLLO2, self-shielded cross-
rSMd& -ed._.___� sections and multigroup spectra, to make up the'datz We"
D- bw, dift collapsed library with burnup dependent cross-F sections, required to characterize the isotopes
Figure 1 the DARWIN package described in the depletion chains.
The PEPlN2 program calculates nuclide depletion. In order to study the effect of control rods (CRs)Different libraries feed this module: and Mx environment on UOx assemblies reactivity,- neutronic data provided by French assembly or five configurations were modelled in the depletiontransport codes, APOLL02 (for PWR and BWR calculation. These configurations are not strictlystudies), the ECCO-ERANOS system (for FBR representative of the real French PWR operatingstudies) these data are self-shielded cross sections conditions, but enable us to obtain bounding values of
and neutron spectra, the studied effects.
- nuclear data (decay data, fission and (an) yields) I UOx assembly irradiated without CRs, surroundedand evolution chains, by UOx assemblies, irradiated without CRs. This- complementary cross-sections, missing from the configuration is used as a reference calculation,
transport codes libraries, especially for activation 2. UOx assembly irradiated without CRs, surroundedproducts. They are included in the 'cycle library'. by Mx assemblies, irradiated without CRs This
The CRISTAL package is composed of: libraries configuration enables us to determine the effect of
containing basic information common to all the MOx environment,
calculations, procedures based on recommended 3. UOx assembly irradiated without CRs, surroundedcalculation schemes, specific calculation codes and by Mx assemblies irradiated with CRs in orderinterface software. to evaluate the effect of Mx environment
Two calculation routes are available (see Fig.2): irradiated with CRs,- a design route with the CEA93 multigroup cross-sections and the APOLLO2/N4ORET4 codes, 4. UOx assembly irradiated with CRs, surrounded by- a reference route using the continuous Monte-Carlo 8 UOx assemblies irradiated without CRs. Thiscode, TRIPOLI4. configuration gives the effect of CRs,
Both routes are based on the latest version of the Joint 5. UOx assembly irradiated with CRs, surrounded byEuropean nuclear data file JEF2.2. 8 Mx assemblies irradiated without CRs. In this
MU CRITICAUTY-SA"TV PACKAGE 'CIWTAL' case we evaluate the effect of both CRs and Mxenvironment.
'DIESIGN'ROUTIE RZFERMCIE ROUTIE
In all these configurations, the central UOx assemblyinitial fuel enrichment is of 45 wt% ... U, and the CR
LA-93 APO design is the 17xl7 B4C design. It consists of inserting24 B4C CRs in the 24 guide tubes, as shown in Fig.3.
D Q n CA�[AnO
Hom� Only the central UOx assembly deplete, theenvironment UOx or MOx is at fixed burnup.
APOLL%CALC UP MNUOUS uu�
ID.WGKO 3DCA�L.TI.N. DCAIXULATIONI
Figure 2 the CRISTAL package
- 695 -

JAERI-Conf 2003-019
The UOx assembly spent fuel inventory, calculatedusing the DARWIN package (with no cooling time), is
- 77- injected as input data in the criticality calculation to- -- - - - - - predict the Keff.
In order to separate the "end effect" problem andthe inventory calculation one, the calculations areperformed with a flat average bumup distribution.
The spent ftiel is composed of the following BUC
77 nuclides:
the fifteen fission products corresponding to themost absorbing, stable and non volatile elements:149sM, 103R-h, 143 Nd, 133CS, 155 Gd, 151SM, 152SM, 99Tc,
4 153 95mo, 147sM, 150sin, 1095Nd, Eu, Ag and 1Ru 11),
234u, 235u, 236u, 238u, 238PU, 239PU, 24OpU,actinides241pU 242p S 237NP 24and u and also minor actinide 'Am
. . . . 243and Am, whose contribution to the negative
tivity worth becomes significant for an averageUOx spent fel at about 40 GWd/t.
B4C control rods 4. Effect of MOx environment and control rodsInstrument tubeFuel rod
4.1 Physics phenomena
Figure 3 17x 7 assembly lattice with control rods The presence of MOx environment or control rodslocation during the depletion of an UOx assembly increases the
reactivity of burned fuel y hardening the neutron
The Mx fuel, surrounding the UOx assembly, is a spectrum (due to the removal of thermal neutrons by17xl7 assembly with an initial Pu amount in the capture and the displacement of the moderator),
leading for a given burnup to:central zone of 56 wt%, irradiated at 15 GWd/t. - an increase of235 U and Pu isotopes concentrations,In the reference case, where the UOx assembly is due to a decrease in 235U fission and an increase insurrounded by UOx assemblies, these last ones 238U capture,consist of UOx with an initial enrichment of 35 wtO/o of 24 243
235U irradiated at 24 GWd/t. - an increase 'Am and Am concentration,linked respectively to the 241pU and 242pU increase,
The other parameters used for the depletion - an increase of most fission product concentration,calculations are summarized in Table 1. due to the decrease of neutron capture by fission
product, mainly those which are absorbing in the
Table 1 : Summary of parameters used for the thermal range (149SM, 151SM, 143 Nd and 155 Gd).
depletion calculations The following paragraphs present the impact ofFuel temperature (K) 955 both control rods and Mx environment on theClad temperature (K) 673 reactivity of an infinite array of UOx assemblies underModerator temperature (K) 577Power density (MW/t) 60 water.
Moderator boron concentration (ppm) 1200 4.2 Effect of MOX environment
These parameters are very conservative in relation to In France, the plutonium from the La Haguereprocessing plant is recycled in PWRs. Currently
the reactivity itself. But we have checked that the Ap twenty-four 900 MWe PWRs are devoted to Pupresented in the following paragraphs are not sensitive recycling in 30% mixed core loading. We are thento variations of these parameters. interested by quantify the effect of MOx fuel around
an UOx assembly. However, the assumption of an3.2 Criticality calculations UOx assembly completely srounded by Mx
The CRISTAL calculations are performed with the assemblies 4 on sides and 4 in comers) is verydesign route, APOLL02 Pij and Sn '0). The conservative.configuration represents a storage pool (i.e., 20'C with
no soluble bore present). We use then the reference Table 2 gives the impact of MOx environment oncalculation scheme that models an infinite array (XY reactivity (configuration 2.calculation) of UOx assemblies under water.
- 696 -

JAERI-Conf 2003-019
In this table A is the reactivity defined as This table shows that the spectrum hardening dueK (Mox env) to the Mx environment leads to a significant increase
effAP = (Moxen, - (Uoxenv = Ln K (UoX env) in reactivity 1250 pcm (10") for an infinite array of
eff UOx assemblies irradiated at 40 GWd/t andand expressed in pcm (10-5). completely surrounded by MOx.
Table 2 Impact of MOx environment on an infinite We have also evaluated the impact on reactivity ofarray of UOx assemblies the burnup of the Mx environment. Table 3 shows
UOx depletion that the reactivity of an UOx array irradiated with acalculation BU P (MOxenv - p UOxenv) MOX environment at 30 GWd/t is lower than the
10 GWd/t +45 pcm reactivity with a MOX environment at 15 GWd/t. Thisis due to the decrease of "9Pu concentration with
20 GWd/t +300 pcm increasing burnup in the MOX environment, leading
30 GWd/t +670 pcm to a softer neutron spectrum. Anyway, the impact of
40 GWd/t +1250 pcm the Mx environment burnup is very slight.
Table 3 Im ct of the MOx environment urnup
UOxdepletion p(MoxenvIOGWd/t)- p(Moxenv 20 GWd/t - P(Moxenv 30 GWd/t -calculation BU p(Moxenv 15 GWd/t) p(Moxenv 15 GWd/t) p(Moxenv 15 GWd/t)
20 GWd/t -1 pcm -25 pcm -50 pcm
40 GWd/t +85 pcm -120 pcm -260 pcin
The last study devoted to the impact of a Mx Table 4 Impact of insertion of control rods inenvironment on the reactivity of an array of UOx MOx environmentassemblies concerns the assumption that the Mx UOx depletion p (MOxenv CRs inserted) -fuels surrounding the UOx assembly were irradiated at calculation BU p (MOxenv no CRs)15 GWd/t with control rods inserted. Thisconfiguration may enhance the hardening of the IO GWd/t -5 pcmspectrum. However, this effect is quite small compare 20 GWd/t +5 pcmto the effect due to the Mx environment itself. The 30 GWd/t +40 pcmcorresponding values are detailed in Table 4 40 GWd/t +30 pcm
4.3 Effect of CRs insertion The results are presented in Table 5. In this calculationFrench PWR operations can involve periods of the central UOx assembly, with CRs inserted, is
partial CRs insertion. In order to bound the reactivity surrounded by UOx fuels depleted without CRs.effect due to this insertion, we have considered a ftill The effects of a short insertion period correspondingaxial control rods insertion during the entire burnup. approximately to one cycle of irradiation, are also
given in Table .
Table 5 Impact of control rods insertion on UOx reactivity
p (UOx with CRs - p UOx without CRs), Oxenv
UOx depletion UOx with CRs Uox with CRs UOx with CRs Uox with CRscalculation BU from to 40 GWd/t from to 12 GWd/t from 12 to 24 GWd/t from 24 to 40 GWd/t
IO GWd/t +270 pcm +270 pcm -
20 GWd/t + 070 pcm +470 pcm +420 pcm -
30 GWd/t +2260 pcm +440 pcm +810 pcm +480 pcm
40 GWd/t +4050 pcm +520 pcm +680 pcm +2090 pcm
Due to the spectrum hardening, the presence of However, in the previous calculations, we haveCRs in the UOx assembly leads to a significant considered a full axial CR insertion, whereas CRs areincrease in reactivity. This one is all the more not fully inserted during French power operations.significant as CRs are inserted for a long time or when To quantify the effect of a partial insertion, weit occurs later in the assembly burnup. The maximum have also modelled that CRs are inserted from to 40value reaches 4000 pcm when the CRs are inserted GWd/t in the upper portion of the active fuel with aduring the entire burnup. depth of 70 cm, as shown in Fig.4.
- 697 -

JAERI-Conf 2003-019
This study was performed using the CRISTAL The impact of the partial CR insertion for anpackage in a RZ geometry. infinite array of UOx assemblies irradiated at 40
GWd/t is 1220 pcm.
4.4 Effect of both CR insertion and Mx
Axial Depletion environmentdepth of isotopics based Table 7 gives the impact of both CR insertion and
CR on 134C CRs MOx environment on reactivity (configuration 5),insertion present during considering a full axial CR insertion.
70 cm depletion
DepletionActive ftiel isotopics without
region any CRs presentduring depletion
(a) Partial CR insertion (b) Criticality model
Figure 4 Illustration of (a) partially inserted controlrods and (b a cross section of the criticality model
Tab 7 ct of both CR insertion and MOx environment
I p Ox with CRs, MOxenv - p (UOx without CRs, UOxenv)
UOx depletion UOx with CRs UOx with CRscalculation BU from to 40 GWd/t from 24 to 40 GWd/t
IO GWd/t +410 pcm.
20 GWd/t + 1 500 pcm
30 GWd/t +3090 pcm -
40 GWd/t +5240 pcm +3280 pem
The effects of CR insertion and Mx environment (ii) CRs are not fully inserted during French powerare added, leading to an increase in reactivity of operations. This parametric studies will be carried+5200 pcm at 40 GWd/t for the studied on in order to take into account the current Frenchconfiguration. This increase is all the more PWR operation.significant that we have considered a full axial CRinsertion. Furthermore, we are looking at some others
depletion modelling parameters, such as ftiel5. Conclusion temperature, moderator temperature, moderator
boron concentration and power density, whoseThis paper has presented the reactivity effects of impacts in reactivity are less important than CR
the main parameters which have an impact on insertion or Mx environment, but have to bemiclides concentration: the presence of control rods considered for BUC implementation.during depletion and the presence of Mx fuelsaround an U02 assembly. Other studies are also planned such as the
determination of corrections factors on nuclidesThe criticality calculations, carried out with the concentration deduced from the validation of theCRISTAL package, have pointed out the significant DARWIN package 12) and fi-orn French experimentsimpact in reactivity of a full axial CR insertion for the fission products capture cross-section(+4000 pcm for an insertion from to 40 GWd/t) validation 13)
and of a Mx environment 1200 pcm for Mxsurrounding assemblies) for an infinite array ofUOx assemblies irradiated at 40 GWd/t. However,these values are very conservative because (i anUOx assembly is not completely surrounded byMOx fuels in PWR 30% Mx - 70% UOx), and
_ 698 -

JAERI - Conf 2003 - 019
References 8) C. Chabert, A. Santamarina, P. Bioux,I ) M.C. Brady, TL. Sanders, "A validated "Elaboration and experimental validation of the
methodology for evaluating burnup credit in APOLL02 depletion transport route for PWRspent ftiel casks", Proceedings of the ICNC'91 Pu recycling", Proc. Of Int. Conf. PHYSORConference, Vol 1, 11-68, Oxford Sept 913, 2000, Pittsburgh, USA, 2000)1991. 9) C. Chabert and A. Santamarina, "Qualification
2) J. Raby et al., "Current studies related to the use of the APOLL02 assembly code using PWR-of burnup credit in France", Int. Conf. on U02 isotopic assays. The importance ofNuclear Criticality Safety (ICNC'03), Tokai- irradiation history and thermo-mechanics onmura, Japan, October 20-24, 2003 ftiel inventory prediction", Proc. Of Int. Conf.
3) P. Marimbeau et al., "The DARWIN Fuel Cycle PHYSOR 2000, Pittsburgh, USA, 2000)Package. Procedures for Material Balance 10)C. Venard et al., "Contribution of theCalculation and Qualification", ENC'98, Nice, experimental validation of the French criticality-France, October 25-28 1998 safety package 'CRISTAL VI' APOLL02 Si
4) A. Tsilanizara et al., "DARWIN: an evolution route", Int. Conf. on Nuclear Criticality Safetycode system for a large range of applications", (ICNC'03), Tokai-mura, Japan, October 20-24,ICRS-9, Tsukuba, Japan, October 1999 2003
5) J.M. GOMIT et al, "CRISTAL VI: Criticality I I)A. Santamarina et al., "The Frenchpackage for bumup credit calculations", Int. Experimental Programme on Burnup Credit",Conf. on Nuclear Criticality Safety (ICNC'03), CSCND'97, Lake Chelan (USAJ SeptemberTokai-mura, Japan, October 20-24, 2003 1997
6) R. Sanchez et al., "APOLLO2 a User- 12)B. Roque et al., "Experimental validation of theOriented, Portable, Modular Code for code system DARWIN for spent fuel isotopicMultigroup Transport Assembly Calculations", predictions in fuel cycle applications", Proc ofNuclear Science and Engineering 100, 352-362, Int. Conf. PHYSOR 2002, Seoul, Korea,1988 October 710, 2002
7) JEFF Report 17, "The JEF2.2 Nuclear Data 13)N. Thiollay et al., "Bum up Credit for FissionLibrary", May 2000 Products Nuclides in PWR (UOx) Spent Fuels",
International Conference on Nuclear CriticalitySafety (ICNC'99), November 20-24, 1999,Versailles, France
- 699 -

JAERI-Conf 2003-019 JP0450131
Testing the SAS2H SCALE Control Module on VVER Type Fuel
Yevgen BILODID, Maxim YEREMENKO, Yuriy KOVBASENKOState Scientific and Technical Centre on Nuclear and Radiation Safety (SSTC NRS),
Radgospna st. 35-3 7 03142 Kyiv, Ukraine
Description and comments concerning validation control module SAS2H SCALE inNPPs experiments and international VVER benchmarks are provided. While testing, theexperimental data from the NPP as well as calculation benchmarks CB-2 (VVER440) andOECD/NEA (VVER-1000) were used. Here, the special attention was paid to isotopes,which are important in respect to criticality analysis of spent nuclear fuel managementsystem. The results listed below show compliance of the received data and those from thebase. For the calculation of VVER reactor ftiel isotope composition it is recommended toconsider the fuel pins position in fuel assembly.
KEYWORDS. Nuclear Power Plant, VVER reactor, spentfuel, burnup credit, SCALE,SAS2H, benchmark
1. Introduction use of additional programs included into the SCALEpackage.
In the case of the bumup credit criticality The aim of this article is to analyze theassessment as to the spent fuel management system applicability of the ORIGEN-S code 5) as a constituentthe methodology of bumup credit criticality of the SCALE code package to the calculation ofcalculation should be checked up thoroughly, and changes in isotopic composition of VVER ftielsafety margins studied. depending on its burnup. This was done in two parts:
This research became possible with the availability 0 modeling the content of individual isotopes inof computer and experimental methods that permitted spent nuclear fuel of VVER-440 and VVER-1000 bymodeling and monitoring isotopic composition of means of the programs for reactor cell calculation withspent nuclear fuel with high accuracy. subsequent comparison of its results with the results of
Due to specifics of the Western computer codes in SCALE-4.3 and SCALE-4.4a;the Westem-reactor orientation, until now, insufficientinformation was available concerning the applicability modeling the isotopic composition of VVER440of the SCALE code package') to miclide inventory and VVER-1000 spent nuclear fuel by means of thecalculations of systems with fuel of VVER reactors. SCALE code package Control Modules SAS214 - toConsequently, it was necessary to conduct testing analyze and compare the obtained results and to makeusing experimental or operational results. the conclusions on the applicability and errors of the
This work is continuation of the comprehensive control module CSAS26 of the SCALE4.3 andtesting complex SCALE on VVER ftiel. SCALE4.4a code packages in the calculation of
The first stage consists of testing Control Module isotopic composition of VVER spent nuclear fuel.of criticality calculations by means of code KENO-VI,and has been made out as NUREG/CR-6736 . As the experimental data, the results of studying
The second stage provides testing isotopic isotopic content of VVER-440 and VVER I 000, SNFcalculations using SAS2H and ORIGEN-ARp 4 completed in different years were used.complexes. This article presents the results of isotopic While testing Control Module SAS2H, the specialcalculations using Control Module SAS2H. attention was paid to those isotopes which are
One of the best-known up-to-date computer suggested to be used while undertaking the work onprograins for calculating isotopic composition of spent substantiation of nuclear safety taking spent fuelnuclear fuel is the ORIGEN code. The disadvantage of burnup into account:this code is that its input libraries of neutron-physicalconstants are applicable to the Western types of - first of all, these are fuel isotopes, i.e. thosereactors - PWR, BWR, CANDU. The use of this participating in chain reaction:program as a constituent of the SCALE code package 235 U, 236u, 238u, Ta 231pu, 240pu, 24 PU;
permits overcoming this disadvantage and preparingthe problem-oriented libraries of neutron-physical - secondly, actinides:constants. 234u, 238PU, 242PU124 'Am , 243 Am , 237NP;
SCALE Control Module SAS2H is designed tocalculate changing isotopic composition of fuel as itbums up. Control Module SAS2H prepares libraries of - as well as 18 main products of ftiel isotopesthe neutronic constants for each separate task with the fission caused by chain reaction:
- 700-

JAERI-Conf 2003-019
95 MO, 99Tc, 101RU, 103R-h, 105 Pd, 18Pd, 109Ag,133cS, 135cS, 143 Nd, 145Nd, 147SM, 149SM, 150SM, 15ISM, 0 0 0
152SM, 153 Eu, 155W� 0 0 0 0 0 4
Here, the results of completed testing are presented.Upon which base the conclusion is made concerning 0 0 0 0 0 0possibility of using the control module SAS2H to 0 0determine the isotopic content of VVER-440 and 000400 004 4 4VVER-1000 fuel. Errors of identifying concentration 0 0 0 0 0 00000of particular isotopes are being determined. 0 0 a 0 0 0 0 0 0
The report was prepared within the framework of 0 0 0 (9 0 0 0
project Validation of ORIGEN-ARP and SCALE 0004D0SAS2H for VVER and RBMK Fuel Designs)).
/__T2. Analysis of data used for testing 127
2 I. Modeling VVER-440 Fuel Assembly I- central tube; 2- fuel rod; 3- fuel assembly shroud
The main technical parameters of the VVER-440 Fig. VVER-440 Fuel Assembly Lattice
fuel assembly (FA) are provided in reference 67).
The SAS2H control module is based on theORJGEN-S code modeling fuel in one-dimensionalapproximation. A fuel assembly is described asinfinite lattice of fuel rods. For VVER, this lattice ishexagonal. However, a number of elements disturbsthe regularity of this lattice. For VVER-440 fuel, thecomponents that disturb the regularity of the fuel rodhexagonal lattice are central tube, water gap betweenassemblies, and fuel assembly shroud (Figure 1).These components essentially impact on the neutronspectrum and fuel irradiation conditions, therefore, thepossibility of their modeling should be provided incalculations.
The SAS2H capabilities allow consideration ofsome differences between the actual fuel assemblydesign and a standard one. This is done through the
INPLEVEL command permitting different options in Uranium-water mixture 4)modeling a fuel assembly. For example, if a
completely regular fuel lattice is modeled, the Zirconium central tube 2) or assemblycommand INPLEVEL = I is used. If we need to -shroud 6)model deviations from this regular structure,commands INPLEVEL=2 or 3 should be used. Water 1,3,5,7)
Possibility of modeling VVEk-440 fuel 0
components (Figure 2 that disturb the regularity of Fig. 2 Model of VVER-440 fuel for control modulethe fuel rod hexagonal lattice should be provided in SAS2HSAS211 calculations.
All the above-mentioned is related to theconditions of modeling a fuel assembly as a whole, i.e. The VVER-440 fuel assembly can be conditionallycalculations of isotopic content averaged by FA are divided into three main zones:
concerned. Experimental data of isotopic content were 1. fuel rods located near the central tubeobtained for individual fuel rods; in so doing, location (conditions of their irradiation are resulted fromof these fuel rods in the FA lattice impacts on their additional impact of water in the tube);
isotopic composition. 2. fuel rods located in te FA central part (their
lattice is regular);
3. fuel rods located at the FA periphery(conditions of their irradiation are resulted fromadditional impact of water in the interassembly gap).
- 701 -

JAERI-Conf 2003-019
In the above regard, experiments should be loading diagrams during the campaigns weremodeled taking into account actual location of the fuel determined with the DERAB code9) for modeling therod selected for the further analysis. reactor core with fine mesh. They have been
2.2. Modeling VVER I 000 Fuel Assembly successfully used for the recent six years to model fuelcampaigns of all VVER-440 and VVER-1000 reactors
VVER-1000 reactor fuel (Figure 3 is something operating at Ukrainian NPPs.more difficult in comparison with VVER-440 fuelfrom the point of view on geometrical modeldevelopment for the calculational sequence SAS2H.
The VVER-1000 assemblies are hexagonal indesign and consist of one central tube, 312 fuel pinlocations and 18 guide tubes. VVER-1000 assembly iswithout shroud.
But, in general, the similar fuel pins separationinto groups according to their allocation in theassembly as for VVER-440 Figure 4 is used.
3
Fuel with gadolinium (benchmarkNEA/OECD) or water (1)
Uranium-water mixture 4)
Zirconium, fuel pin cladding or central-tube 2)
Water (3,5)s
I fuel pin; 2 - guide tube for control rod or burnableabsorber; 3 - central tube Fig. 4 Model of VVER-1000 fuel for control module
SAS2HFig. 3. VVER-1000 Fuel Assembly Lattice
All the above-mentioned is related to the These codes were used for determining loadingconditions of modeling a fuel assembly as a whole, ie. diagrams of VVER-440 fuel rods with 36% initialcalculations of isotopic content averaged by FA are enrichment, and then isotopic composition ofconcerned. Experimental data of isotopic content were VVER-440 spent nuclear fuel was calculated for them.obtained for individual fuel rods; in so doing, location The best results are obtained when the 27bumuplibof these fuel rods in the FA lattice impacts on their library is used and the computer code is corrected toisotopic composition. In the above regard, incorporate the fuel rod location in the assembly.experiments sould be modeled taking into account Below (Table 1) the average errors in calculatingactual location of the fel rod selected for the arther concentrations of individual isotopes are presented.analysis. The Table uses the following notions:
27burnupli - SCALE package standard librarywithout correction of the computer model to
3. Calculation results of experiments with SAS2H incorporate fuel rod position in the assembly.
control module 27burnuplib (correction) - SCALE package
3. 1. VVER-440 experiment standard library with correction of the computermodel to incorporate fuel rod position in the assembly.
For this part of work, fuel operation in the core ofNovovoronezh NPP VVER-440 during the threeinitial campaigns was modeled. The reactorperformance was modeled with the PYTHIA code )
- 702 -

JAERI-Conf 2003-019
As it can be seen from the Table 2 results, whichTable Errors in calculating concentrations of were received with the help of different libraries,
individual isotopes in VVER-440 spent fuel correlate good with each other in the majority of cases.
Isotope Effor(Calde r.-I)'100% Their difference is much less than the calculation and44groupndfS 27bumuplib 238groupndf 27bumuplib experimental data difference. On that ground, it can be
"IT- 5 (correction) stated that the experimental data were insufficient orU -9 I -7.3 -9.6 -5.9 were received with the considerable fallibility.
235U 5.0 5.1 6.7 -2.2
236U -2.1 -2.1 -2.5 -2.6 4. Results of Benchmark Calculations with SAS2HMVU__ 0.3 0.2 0.2 0.4 Control Module7"rPu _ 12.0 -5.9 -12.3 -9.8
7"'P- u 7.2 10.1 10.0 -4.6 4. 1. VVER-440 Reactor. AER CB-2 Benchmark74'T-u- 4.9 0.9 6.8 -5.6 Calculations
'241PU 7.3 14.1 9.8 5.8 Works 11). 2) describe the calculational benchmarkN7Pu - 7.1 -3.3 7.8 -0. 1TA-m- 67.9 54.4 68.5 34.8 prepared by the international research group AER242cM -7.7 4.0 1 -5.4 1 -1.2 (Atomic Energy Research) that combines experts fromarm 121.4 82.2 1 137.5 1 78.2 the countries operating VVER. The benchmark was
developed for the purpose of exploring the possibilityto use different codes for determination of isotopic
3.2. VVER-1000 experiment composition of VVER-440 spent nuclear fuel and the
Isotope composition of VVER-1000 reactor ftiel further use of this information in criticalityassembly was calculated according to the materials of calculations of fuel storage systems (application of thereferences). bum-up credit to VVER fuel). Taking into account
Referencelo) presents the results of isotopic content that there is the experimental information insufficientmeasurement of spent fuel in WER- I 000 reactor. For or absent on the isotopic concentration in spent.this measurement, one FA was used from VVER- I nuclear ftiel, comparison with the benchmark resultsunder operation at Zapori2hya NPP. Its in i permits us to conduct testing for the greater number of
enrichment was 392%. This was under ope nuclides.during one campaign, and unloaded from the core The benchmark describes assembly selected, its1999. Isotopic composition of three specimens with loading modes during operation, and the resultsdifferent bumup levels is presented. The obtained. During benchmark calculations with theconcentrations of the most important transuranium SAS2H control module, fuel design, loading modeselements that have the most significant influence on during operation, and cooling modes were specifiedspent fuel characteristics were analysed. according to the benchmark data.
Table 2 presents the main calculation results, Below, Table 3, the average errors are presented inwhich were received with the different libraries of calculating concentrations of individual isotopes givencontrol module SAS2H. the use of the 27bumuplib library:
Accuracy of the relevant experimental data isaccepted as 5 %. Table 3 Deviation in calculating concentrations of
individual isotopes in VVER-440 spent fuel
Table 2 Deviation in calculating concentrations of Isotope Deviationindividual isotopes in VVER-1000 spent fuel Z.33U 0.8%
236U 1.3%Isotope Deviatio (Calc/exper.- *100% 23SU -0.4%
44groupndf5 238groupndf5 27bumuplib 237 Np 13.2%"'_ -13.37 -13.54 -12.04 zj5pu 6.1%'7'-U -0.50 -0.11 -0.64 239PU 3.2%"T__ -18.49 -19.07 -18.31 1 Z40pU
238u 0.09 0.08 0.08 241pu -1.0%
M-Pu -29.92 -30.56 -27.22 242PU 3.9%... Pu -14.91 -13.84 -11.19 -24 -9.5%
'Am 4.3%M"P-u- -7.76 -12.19 -17.95 __243 Am -2.1%M-Pu -17.20 -8.11 -5.60 95mo242PU -11.75 -3.98 -16.65 99 0.1 %
A m -91.41 -90.57 -90.51 Tc 0.7%101Ru -1.0%
"7Am -33.08 -27.69 -36.92 103P
-11.89 1 -4.93 LEL86 h 0.9%__J 109Ag 11.0%
I JJJCS 2.2%
- 703 -

JAERI-Conf 2003-019
14JNd 0.4%143Nd 0.9% Several calculation states were included into the141sM -0.7% benchmark exercise. These states cover the149sM 12.6% operational states, and cold conditions. The requested150SM 4.7% results include ki,,f values, pin power distributions, andDISM 16.5% isotopic concentrations.1.5YSm 7.4% The benchmark is completely calculated, and
153Eu -8.8% uncertainties are indicated in comparison with thel:'3Gd 89.7% calculation results of other participants.
The modeling of this benchmark is enough
In general, the calculational results satisfactory difficult because fuel assembly includes several typescorrelate. However, the rather great discrepancy for fuel elements, which results in necessity of155 Gd should be noted. simplification while modeling and in uncertainties
while results processing, Tables 4 and .
4.2. VVER- I 000 Reactor. OECD/NEA BenchmarkCalculations
Benchmark OECD was chosen for calculations 13). Table 4 Uncertainties in calculating concentrations ofindividual isotopes in VVER-1000 spent fuel
It includes the calculations of uranium and MOX fuel (assembly averaged)for the VVER reactors. Below, the calculation resultsof uranium fuel only are presented. Isotope Error alc/exper.-I) 100%
The benchmark model consists of assemblies that 44groupndf5 238groupndf5 27bumuplibare typical for the advanced designs that are under 2 35 U -1.10 -0.52 -0.49active development in Russia for the VVER-1000 Tj6Q 3.36 2.89 3.74reactors. The VVER-1000 assemblies are hexagonal TjgU 0.11 0.10 0.07in design and consist of one central tube, 312 ftiel pin 239PU -3.43 -0.58 2.87locations 12 of which are U/Gd rods), and 18 guide 240PU 1.12 4.02 -2.90tubes. The clad and structural materials are composed 11-pu 0.03 2.69 9.58of a Zr-Nb alloy. The UGD assembly is shown in 742pu- 8.12 9.85 -2.19Figure 5, and consists of fuel rods with 37 wt.% T55G-d -22.40 -20.70 -
235enrichment. The 12 U/Gd pins have a U enrichment TrGd -38.08 -36.98of 3.6 wt.% and a Gd2O3 content of 4.0 wt.%.
Table Uncertainties in calculating concentrations ofindividual isotopes in VVER-1000 spent ftiel(comer fuel pin)
Error aic/exper.-I) 100%Isotope +,+groupndf5 238grouvndf5 27bumuplib
U 0.73 1.63 0.587wU -3.78 -4.32 -3.597"U 0.23 0.18 0.22239 Pu -14.98 -11.23 -13.19240PU -13.44 -10.69 -18.09
7'r'. -24.27 -20.82 -20.3979P� -22.52 -20.29 -29.78
5. Conclusions
Analysis of the results permits the following
Cell types: conclusions:1. Central tube cell. 1. SCALE code package SAS2H control module2. Fuel cell 3.7 wt.% LEU). permits sufficiently accurate determination of isotopic3. Guide tube cell. composition of VVER spent nuclear fuel.
4. Fuel cell 3.6 wt.% LEU with 4.0 wt.% Gd2O3). 2. The most comprehensive testing based on
Fig. 5 UGD assembly configuration independent sources including both experimental
results and calculational benchmarks has beenconducted for 231U, 236u, 238u, 239PU, 240PU, 241PU,
242pU fuel isotopes.
- 704 -

JAERI - Corif 2003 - 019
3. More accurate are results received during RBMK-1000 Reactors. Russian Scientificcalculation taking into account the disposition of Center "Kurchatov Institute", 2002 (in Russian).experimental fuel pins, and their operational I 1) L.Markova. Calculation Burnup Creditconditions. Benchmark No.2 (CB2). 7th AER
4. The SAS2H sequence using is more SYMPOSIUM on VVER Reactor Physics andappropriate in comparison with ARP sequence Reactor Safety Hornitz near Zittau, Germany,especially in difficult cases (presence of control or Sept. 23-26,1997.burnable absorber rods, etc.) 12) L.Markova. CB2 Result Evaluation (VVER-440
Burnup Credit Benchmark). 7th AER5. SCALE Libraries 27BURNUPLIB or Symposium on VVER Reactor Physics and
44GROUPNDF5 can be recommended for calculating Reactor, Slovakia, October 48, 1999.isotopic composition of VVER spent nuclear fuel. 13 A VVER-1000 LEU and MOX Assembly
Computational Benchmark. Specification andResults. OECD, 2002.
Acknowledgements
The authors are grateftil to the US Government forfinancial support in realization of this work.
References
1) SCALE: A Modular Code System for PerformingStandardized Computer Analysis for LicensingEvaluation, NUREG/CR-0200, Rev. 6(ORNL/NUREG/CSD-2R6), Vols. 1, 11, and III,May 2000. Available from Radiation SafetyInformation Computational Center at Oak RidgeNational Laboratory as CCC-545.
2) Y.Kovbasenko, V.Khalimonchuk, A.Kuchin,Y.Bilodid, M.Yeremenko, O.Dudka "Validationof SCALE sequence CSAS26 for criticality safetyanalysis of VVER and RBMK fuel designs"NUREG/CR-6736, PNNL-13694,2002.
3) 0. W. Hermann, C. V. Parks. SAS2H A CoupledOne-Dimensional Depletion And ShieldingAnalysis Module. Oak Ridge Natl. Lab., 2000.
4) S. M. Bowman, L. C. Leal. ORIGEN-ARP:Automatic Rapid Process For Spent FuelDepletion, Decay, And Source Term Analysis.Oak Ridge Natl. Lab., 2000.
5) 0. W. Hermann, R. M. Westfall. ORIGEN-S:SCALE System Module To Calculate FuelDepletion, Actinide Transmutation, FissionProduct Buildup And Decay, And AssociatedRadiation Source Terms. Oak Ridge Nati. Lab.,2000.
6) R.Z. Arninov, V.A. Khrustalyov,A.S.Dukhoven'sky, A.S.Ocadchy. NPP withVVER: Modes, Characteristics, Efficiency.Energoatomizdat, Moscow, 1990 (in Russian).
7) Design and Performance of WWER Fuel,Technical Report Series No. 379, LAEA, Vienna,1996.
8) Programm PYTHIA zur Berechming desMakroabbrands in Druckwasserreaktoren vomTyp WWER, K.A.B.GmbH, Berlin, 1998.
9) Moller A. DERAB Code Manual, K.A.B.GrnbH,Berlin, 1998
10) A.L.Tataurov, V.M.Kwator. Report on RD Work:Calculated-Experimental Studying NuclideComposition of Fuel Spent in VVER-1000 and
- 705 -

JAERI-Conf 2003-019 JP0450132
The Implementation of a Burnup Credit Based Criticality Safety Assessmentin the THORP Head End Plant
J. Gulliford, J. A. Edge, J. Gracey and N HarrisBNFL Rutherford House, Risley, Warrington, WA3 6AS UK
jim. gulliford�bnfl. comAbstract
A new criticality safety assessment based on Actinide-Only Burnup Credit has been developed to cover op-erations in BNFL's Thermal Oxide Reprocessing Plant (THORP). Reduction of the gadolinium concentrationleads to significant reduction in active waste volumes. Detailed description of the methodology was presented atICNC 1999 and the basic components of the approved safety case have remained unchanged from those proposedthen. This paper presents a brief summary of the new methodology, and describes further analyses carried out toquantify additional safety margins. These additional margins are not credited in the derivation of the operatinglimits, but provide further evidence of the fault tolerance inherent in the new regime.
As part of the arrangements to monitor the overall performance of the plant and instrumentation under the newregime, various analyses of plant data are made, including 'on-line' cross checks of measured versus expected fuelparameters (i.e. in addition to the checks on Residual Enrichment). Statistical analyses of data are made andcompared with similar data from earlier batches. A summary of analyses made on some of the early fuel batches ispresented here. A summary of the likely further development in the Burnup Credit methodology is given in thispaper.
KEYWORDS. Burnup Credit, Criticality Safety, Residual Enrichment,
1. Introduction compliance checks it is necessary to make suitableallowance for uncertainties. These are derived from
The BNFL Sellafield Site provides facilities for the comparison of measured values with values deriveddissolution of sheared fuel, clarification and accoun- fi7om suppliers' data for individual fuel elements.tancy of product liquor and buffer storage and condi-tioning of this liquor, prior to transfer to the chemical Statistical analyses of data for batches of fuel ele-separation stage of the Thermal Oxide Reprocessing ments are made and compared with similar data fromPlant (Thorp) earlier batches, to check that the performance of the
measurement system remains within required limits. AA new criticality safety assessment based on Acti- summary of analyses made on some of the early fuel.
nide-Only Burnup Credit has been developed to cover batches is presented here.operations in te head-end of Thorp. The originalcriticality safety case was based on the 'fresh fuel' The implications of the permanent inclusion of ftielsassumption, which resulted in a significant at increased initial enrichment and higher burnableover-poisoning of the dissolver acid with gadolinium. poison loading in the permitted baseload, along withReduction of the gadoliniurn concentration leads to other non-standard fel elements, is currently beingsignificant reduction in active waste volumes. Fol- assessed. A summary of the likely further developmentlowing Regulatory approval, the new operating regime in the Burnup Credit methodology is also given.was introduced in June of 2002. Detailed description ofthe methodology was presented at ICNC 1999 and thebasic components of the approved safety case have 2. Brief Description of Processremained unchanged from those proposed then. Thispaper presents a brief summary of the new methodol- Enriched uranium oxide ftiels are sheared into shortogy, and describes further analyses carried out to lengths by a shearpack and this sheared fuel passesquantify additional safety margins. These additional down the dissolver feed chute into a perforated steelmargins are not credited in the derivation of the oper- basket in one of three dissolver vessels. The dissolverating limits, but provide further evidence of the fault contains the required volume of a hot solution of nitrictolerance inherent in the new regime. acid and gadolinium nitrate soluble neutron poison.
While fuel is being sheared into the dissolver basket,Implementation of the new methodology involves steam may also be injected into the process side of an
measurements of the Residual Enrichment (RE) in the Off Gas Condenser.spent fuel to demonstrate compliance with the safelimits. In implementing this measurement as part of the
- 706 -

JAERI-Conf 2003-019
When shearing has ceased and the required mass, up through comparison with a range of MOX benchmarksto the peak batch inventory, has been transferred to the (including a case with gadolinium dissolved in thedissolver, the feed chute is removed, the dissolver lid moderator). Further evidence of the accuracy of theclosed and the dissolver contents heated to leach tem- code scheme was provided by benchmarking againstperature. After leaching, full cooling is applied to the the CERES International experiments on spent fueldissolver jacket and the liquor allowed to cool. Nx reactivitygases are then added to condition the liquor and fol-lowing conditioning fines suspended in the product Both depletion and k-effective calculations wereliquor are allowed to settle to the base of the vessel. carried out in such a way as to provide conservative
estimates of safe conditions. Some key assumptions inWhen the dissolver temperature is sufficiently low the depletion calculation include:
and after the quiescent period of fines settling, product a High soluble boron concentration (PWR fuel)liquor is then transferred to the centrifuge feed tank * Low cooling timeprior to sentencing to downstream chemical separation 0 High power ratingprocesses. & High fuel-to-moderator (maximum rod diame-
The criticality assessment described here covers the ter, minimum pitch)
dissolution and settling process. Separate assessments For calculations of k-effective in the dissolver, twoare made for chemical separation. key assumptions are made:
No credit is taken for dissolution during ftiel3. Summary of Methodology charging (reactivity is highest in the undissolved state)
Optimum packing fraction of the sheared ftiel piecesThe original criticality safety assessment for the in the acid.
Thorp Head-end plant was based on 'fresh-ftiel' as-sumptions. This allowed a relatively simple, but very Having determined the appropriate criticality safetyconservative, safety justification, which included a criteria, the next stage of the project was to establish allrequirement to the inclusion of dissolved gadoliniurn in the combinations of Initial Enrichment (IE) andthe dissolver acid to achieve compliance with critical- Bum-up (BU) which satisfy these criteria during nor-ity safety criteria. mal dissolver operations and under fault conditions,
known as the 'Safe Fuel Domain'.The presence of the gadoliniurn in the liquors fed
forward to the rest of the process results in significant This concept is illustrated below in Figure 1. Theincreases of waste volumes. Reduction in waste vl- domain boundary is formed from a series of IE/BUumes provide reductions in both overall risk and cost of points which exactly satisfy the relevant criterion.operations. It was recognised that burnup credit couldbe used to establish a less conservative criticality as-sessment and consequent reductions in gadolinium Dilutionconcentration in the dissolution process. Normal Acid
ConditionsDetailed description of the methodology was pre-
Esented at ICNC 1999') and the basic components of theapproved safety case have remained unchanged fromthose proposed then. The methodology applies 'Acti-nide-only' bumup credit, taking account of reactivitylosses associated with changes to the uranium andplutonium content of fuel during irradiation. 2 2.5 3 3.5 4 4.5
Initial Enrichment
Extensive calculations were performed using the Fig.l: Safe Region ofthe Initial Enrich-
reactor physics code WIMS7 in conjunction with the ment/Bum-up Domain
Monte Carlo Neutronics code MONK7. WIMS7 was
used to calculate fuel inventories at a range of initial As described previously, WIMS7 was used to cal-
enrichment and bum-up. Both WIMS7 and MONK7 culate the uranium and plutonium inventories at a range
were used to calculate k-effective or various spent fuel of fuel bum-ups. For each condition considered,
scenarios needed to justify the criticality safety as- WIMS7 was then also used in scoping calculations to
sessment. Calculations were also carried out to under- determine the approximate position of a domain
pin the validity of the methodology. Comparison with boundary. The calculations identified the maximum
Post Irradiation Experimental (PIE) data is used to fuel enrichment to satisfy the criterion at zero irradia-
establish the accuracy of the depletion calculations. tion and determined the bum-up required to satisfy the
Validation ofthe k-effective calculations is established criterion at higher pre-irradiation enrichments.
- 707 -

JAERI-Conf 2003-019
At each bum-up/enrichment combination the pack- 5 Implementationing fraction of the fuel in the acid requiredre-optimising; resulting in a large number of WIMS7 5.1 Residual Enrichment Measurementcalculations being required. Having determined the Before being passed to the shearing cell all elementsoptimum packing fraction, MONK7 was then used to pass through the Thorp Fuel Pond Feed Monitors.accurately calculate the system k-effective values and These carry out a range of measurements to confirmdemonstrate compliance with criteria. that the fuel is compliant with criticality and radio-
logical safety criteria. The measurements include;Further checks were made to determine how Re- Cooling time, Burnup, Residual Enrichment (RE), and
sidual Enrichment varies along the domain boundary. Initial Enrichment (IE).This parameter is measured for each element beforeshearing. Since spent fuel Residual Enrichment (de- RE is derived from measurement of sub-criticalrived in U235-equivalent) is closely related to spent neutron multiplication, calibrated against data receivedfuel reactivity, it provides a convenient way of verify- from the suppliers of the fuel. This data is used to forming compliance. It was demonstrated that Residual the equivalent U235 enrichment from the residualEnrichment along the boundary is bounded (i.e. is a U235, Pu239 and Pu24I in the fuel. For Pu239 andminimum) by the value at zero burnup. This is to be Pu241 factors are applied to create their equivalent (inexpected, since the presence of non-fissile plutonium reactivity) U235 mass. These factors are based on theisotopes at higher burnup is balanced by higher fissile relative thermal fission cross-sections.content (relative to the zero burnup case)
The values of RE derived from the suppliers data4. Rationale for Applying Actinide-Only Credit may then be used to convert the measurements of neu-
tron multiplication into Residual Enrichment. ThisPrior to applying burnup credit, consideration was calibration is carried out prior to each fuel campaign,
also given to possible alternative ways of achieving based on a selection of elements covering the appro-reduction in gadolinium poison concentration. In prin- priate range of fuel parameters.ciple it might have been possible to take credit for fueldissolution and/or 'real' packing fractions. It might 5.2 Performance Checks on Monitorsalso be possible to batch the ftiel by initial enrichment As part of a programme of checks on plant, theband, so that lower enriched elements might be dis- output of the Fuel Pond Feed Monitors is under con-solved in lower gadoliniurn concentrations. stant review to ensure that these remain within required
performance limits. These checks include review of theHowever, it was decided that Actinide-only credit original calibration settings, as more data become
offered the most practicable option. In particular the available, and on the level of agreement between de-following issues are pertinent: clared and measured values for individual elements.
• Burnup is an intrinsic part of the fuel composi- Analysis of the differences between declared andtion measured values provides an estimate of the uncer-
• Other candidates (e.g. fuel dissolution) might be tainties in the various parameters. For RE, which hasundermined by accident conditions (dilution) increased significance since the introduction of burnup
• Global packing fraction in the dissolver is rea- credit, detailed analysis of the monitor results has led tosonably well known, but local variations are refinement in the calibration algorithms and to im-difficult to quantify provements in the representation of uncertainty.
• Batching by initial enrichment would involvevariable safe limits on gadolinium, which The latter is illustrated in Figures 2a & 2b below,would be complex to implement which compares frequency plots of observed differ-
ences using the old and the new algorithms. For the
It was decided that Actinide-Only credit offered a 'old' data the uncertainty in RE was assumed to bereliable way of reducing gadolinium concentration (by independent of the RE value and it is seen that there isa factor of about 2 in a way that could be readily im- evidence of non-normal distribution in the differences.plemented on the plant. In particular, the use of meas- In the second plot the uncertainty has been derived asured Residual Enrichment provides a well-proven linear function of the RE (derived from analysis of themethod of demonstrating compliance with the Safe observed differences over the ftiel campaign). It is seenFuel Domain. that the distribution is very close to normal and with no
sign of significant bias.
- 708 -
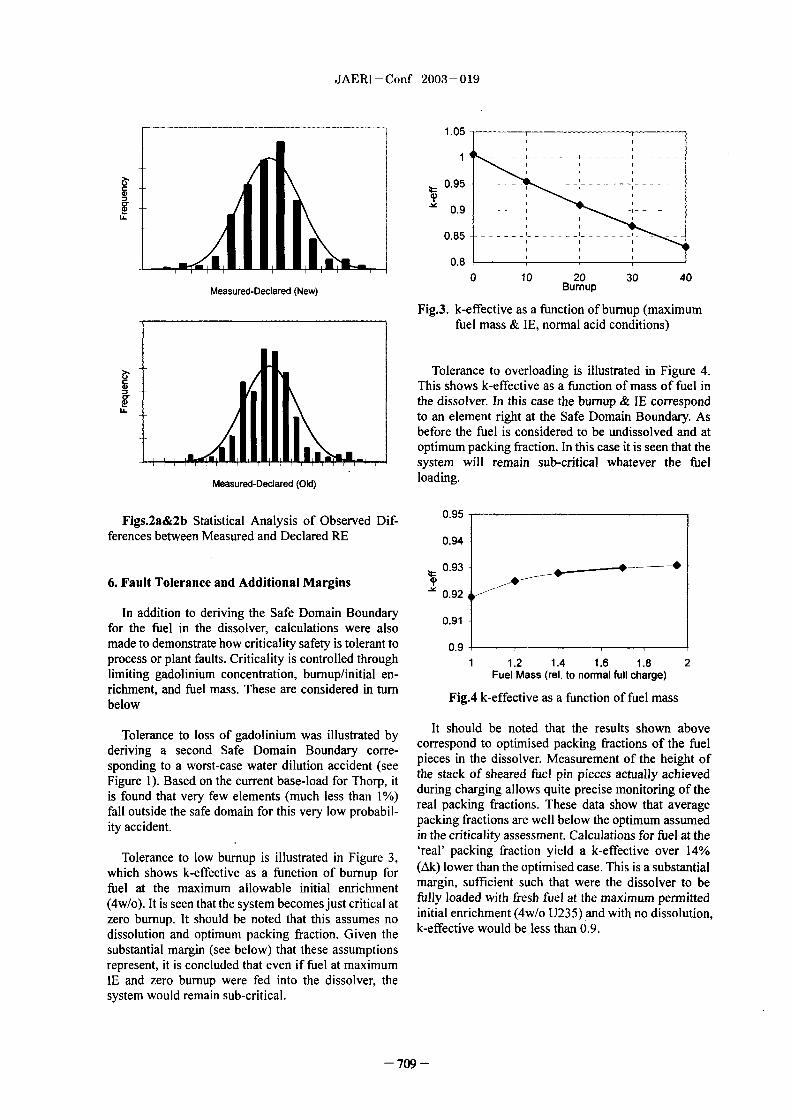
JAERI-Conf 2003-019
- ----- 1.05
0.95 ----------------
AC 0.9 ------
0.85 ----------------------
0.80 10 20 30 40
Measured-Declared (New) Burnup
Fig.3. k-effective as a function of burnup (maximumftiel mass & IE, normal acid conditions)
Tolerance to overloading is illustrated in Figure 4.This shows k-effective as a function of mass of fuel inthe dissolver. In this case the burnup & IE correspond
LL to an element right at the Safe Domain Boundary. As
before the fuel is considered to be undissolved and atoptimum packing fraction. In this case it is seen that thesystem will remain sub-critical whatever the fuelloading.Measured-Declared (Old)
Figs.2a&2b Statistical Analysis of Observed Dif- 0.95ferences between Measured and Declared RE 0.94 -
r_ 0.93 ----------6. Fault Tolerance and Additional Margins il
-IC 0.92
In addition to deriving the Safe Domain Boundary 0.91for the fuel in the dissolver, calculations were alsomade to demonstrate how criticality safety is tolerant to 0.9process or plant faults. Criticality is controlled through 1 1.2 1.4 1.6 1.8 2limiting gadolinium concentration, burnup/initial en- Fuel Mass (rel. to normal full charge)
richment, and fuel mass. These are considered in turn Fig.4 k-effective as a function of fuel massbelow
Tolerance to loss of gadolinium was illustrated by It should be noted that the results shown abovederiving a second Safe Domain Boundary corre- correspond to optimised packing fractions of the fuelsponding to a worst-case water dilution accident (see pieces in the dissolver. Measurement of the height ofFigure 1). Based on the current base-load for Thorp, it the stack of sheared fuel pin pieces actually achievedis found that very few elements (much less than 1%) during charging allows quite precise monitoring of thefall outside the safe domain for this very low probabil- real packing fractions. These data show that averageity accident. packing fractions are well below the optimum assumed
in the criticality assessment. Calculations for fuel at the
Tolerance to low bumup is illustrated in Figure 3 'real' packing fraction yield a k-effective over 14%which shows k-effective as a function of burnup for (Ak) lower than the optimised case. This is a substantialfuel at the maximum allowable initial enrichment margin, sufficient such that were the dissolver to be(4w/o). It is seen that the system becomes just critical at fully loaded with fresh fuel at the maximum permittedzero burnup. It should be noted that this assumes no initial enrichment (4w/o U235) land with no dissolution,dissolution and optimum packing fraction. Given the k-effective would be less than 09.
substantial margin (see below) that these assumptionsrepresent, it is concluded that even if fuel at maximumIE and zero burnup were fed into the dissolver, thesystem would remain sub-critical.
- 709 -

JAERI-Conf 2003-019
Calculations were also made to assess the size of this dissolved gadolinium requirement of nearly 50%,margin (packing fraction) relative to loss of gadolinium. which in turn permits a significant reduction in wasteThese showed the reactivity effect is equivalent to a volumes.dilution of the gadolinium by a factor of about 2 - wellabove the bounding dilution accident identified by the In calculating the safe domain boundary some sig-safety assessment. nificantly conservative assumptions were made, par-
ticularly with respect to packing faction and fuel dis-7. Future Development of BUC Methodology solution during charging. Additional calculations have
shown that these assumptions represent a large addi-Work is continuing to develop Bumup Credit to tional safety margin. It is shown that criticality safety is
cover anticipated requirements in Thorp. In particular highly fault tolerant, being capable of withstanding athis is expected to involve processing of elements at full load of fresh fuel or a reduction of gadoliniumhigher initial enrichment. Analyses of a wide range of concentration by more than the bounding dilution ac-PIE data, show no significant trend in accuracy of cident.depletion calculations with lE, but further work will bepresented to establish validation for any extension to Since implementation of the new regime, detailedhigher IE. In support of these efforts BNFL continues analysis of the Fuel Pond Fuel Monitor results has beento participate in international programmes such as made to ensure that the system continues to performARIANE and MALIBU, which provide spent fuel with the required accuracy. On the basis of data col-isotopic data for different ftiel types and for a wide lected over several campaigns improvements to therange of nuclides significant to bumup credit. These calibration and uncertainty algorithms have been iden-include a set of fission products controlling about 75% tified.of the total fission product reactivity contribution.
Studies on the effects of integral burnable poisons onboth the depletion and k-effective calculations are Referencesunderway. To date the effects of this feature of ftiel I Neil Harris, Jane Edge and Fiona Ogilvie, "Thedesign has been accounted for on a case-by-case basis, Development of A Bum-Up Credit Criticalitybut at some stage it may become more appropriate to Safety Case for the Thorp Reprocessing Plant",establish some bounding approach. In support of these Proc.Intemational Conference on Nuclear Criti-types of study BNFL continue to participate in the cality Safety, ICNC'99. Session D2. 1, Versailles,OECD-NEA Experts Group on Burnup Credit. 1999.
8. Conclusion 2) A W Butement, "JEF Benchmarking for ReactorPhysics Applications: A - LWR and CAGR Fuel
Actinide-only burnup credit has been developed and Isotopics", AEA-TSD-0857. September 1995.approved for application to criticality safety in theThorp Head-end plant. This allows a reduction in the
710 -

JAERI-Conf 2003-019 JP0450133
Application of Gadolinia Credit to Cask Transportationof BWR-STEP3 SFAs
-ichiro ITO' and Yu NATsukasa KIKUCHI' Ishi MITSUHASHI1, Dai KAM PA
'Toshiba Corporation, Ukishima-cho, Kawasaki-ku, Kawasaki 210-0862, Japan2Mitsui Engineering Shipbuilding Co., Ltd., Nishi-Kasai, Edogawa-ku, Tokyo 134-0088, Japan
3Nuclear Fuel Transport Co., Ltd., Shiba Dainion, Minato-ku, Tokyo 105-0012, Japan4Present Address, Nuclear Power Engineering Corporation, Toranomon, Minato-ku, Tokyo 105-0001, Japan
Instead of the ftesh-fuel assumption, the application of gadolinia credit to casktransportation of BWR SFAs is studied. Its efficacy for BWR-STEP2 SFAs had alreadybeen estimated. This paper reports on the application of gadolinia credit to casktransportation of BWR-STEP3 SFAs.
KEYWORDS. gadolinia credit, cask transportation, WR-STEP3 SFAs model bundle,fuel design code, KENO- Va code
1. Introduction 2. Application Procedure
In the design for the cask transportation of pent- Firstly, the maximum value of the infinitefuel assemblies (SFAs), it is assumed that the SFAs, multiplication factor in the cold stand-by system iswhich include the maximum reactivity supposed, will determined for actual fuel assemblies. Next, thebe loaded in the cask. In the conventional design, the infinite multiplication factor in the basket (stainlesseffects of bum-up and burnable neutron poison are not steel containing 1.0 w/o-boron) system is estimatedconsidered, and only the initial content of fissile for the selected assembly.material is considered (fresh-fuel assumption). Based From the viewpoint of criticality management,on this assumption, highly enriched fuel assemblies some TRU and FP nuclides, which are effective indesigned for high bum-up have been used to provide a restraining the reactivity of the SFAs, must be selected.wide margin for criticality management. In the design For this selection, nuclides with the followingof BWR fuel assemblies, the initial reactivity excess attributes are rejected: (i) small effect of neutronhas been restrained by using gadolinia (Gd2OA which capture, (ii) short half-life, (iii) gaseous or volatile andis a burnable neutron poison. Therefore, the approach (iv) comparatively volatile. Accordingly, 12 TRU andusing the restraining effect of gadolinia (Gadolinia 14 FP nuclides are selected. They are listed in Table
2 3 4)Credit) is also available for criticality management of and Table 2BWR SFAs. "Gadolinia Credit" means taking thenegative reactivity of gadolinia in fuels into account Table I Selected 12 TRU nuclides to be consideredduring the criticality analysis. Its efficacy for in the gadolinia creditBWR-STEP2 SFAs had already been estimated" U-234, U-235, U-236, U-238After that, BWR-STEP3 ftiel assembly whose rod Pu-238, Pu239, Pu-240, Pu-241, Pu-242arrangement is 9x9 lattice had been developed. In this Np-237paper, the application of gadolinia credit to cask Am-241, Am-243transportation of BWR-STEP3 (A type) SFAs isreported. Table 2 Selected 14 FP nuclides to be considered in
The transuraniurn (TRU) and fission products (FP) the gadolinia creditare accumulated in the SFAs and their effects restrain Mo-95the reactivity of SFAs are significant. So, it is Tc-99necessary to consider these effects of TRU and Fl? in Ru-101the criticality management. In this application, the Rh-103contributions of TRU and FP are considered. Cs-133
Furthermore, the accumulated amounts of TRU and Nd-143, Nd-145FP depend on the specific power. So, the change of Sm- 47, Sm 149, Sm- 1 50, Sm- 1 5 1, Sm- 52specific power is also considered in this application. Eu-153
Gd-155
Corresponding author, Tel. 81-34512-2593, Fax. 81-34512-2599, E-mail: ts.-kikuchi�nupec.orjp
- 711 -

JAERI - Conf 2003 - 019
In comparison to the value for all nuclides, thefractions of neutron capture are more than 99% for the Reflective Condition12 TRU nuclides and about 70% for the 14 Pnuclides. In this application, the 12 TRU nuclides arealways considered. The FP nuclides are consideredunder the following conditions: (i) all FP nuclides areconsidered, (ii) 14 FP nuclides are considered and (iii)no FP nuclide is considered. From the viewpoint ofcriticality safety design, the conservatism is large forthe condition that no Fl? nuclide is considered, but themerit of comparison with the fresh-fuel assumption is fsmall in this case.
Furthermore, the accumulated aounts of TRU andFP depend on the specific power. In this applicationthe estimation was performed under two specific LLpower condition, nmely, the standard and maximumpower conditions. The specific power and bum-upcalculation condition am shown in Table 3.
Table 3 Specific power in standard and maximum W.9ter (Cold Cnditionpower condition and bum-up calculationcondition Assembly Pitch: 15.24cm
Specific Power(Mw/t)
Standard Power 25 Fig.1 Calculation model of the cold stand-by system,Condition using the nuclear design code of BVrR fuelMaximum Power about 1.5 timesCondition of standard Reflective Condition
Void Fraction
Bum-up CalculationCondition 0,40,70
Based on the above estimation of the infinitemultiplication factor, the model bundle, whose infinitemultiplication factor is larger than that of the wholeactual fuel assemblies is designed, from the viewpointof criticality safety. And the criticality safety isestimated in the actual cask system storing this modelbundle.
3. Design of Model Bundle
3.1 Maximum Reactivity for Actual SFAs uel AssemblyOne of the typical designs for BWR-STEP3 (A Water (Cold ConditioW
type), which is considered in this application, is tile asket Material qlainle- teel containing Boron)adoption of partial length rods (PLRs). Therefore,there are 66 active fuel rods in the upper region and * Inner Width of Basket: 15.3cmthere are 74 active fiiel rods in the lower region. The * Thickness of Basket Material: .cmreload fuel assembly for which the infinite * Boron Concentration: .wt%multiplication factor is the largest in the BWR-STEP3 (natural composition)(A type) conventional design was selected for theestimations, and the estimations were performed assemblyseparately for the cross sections of the upper andlower regions. Fig.2 Calculation model of the basket system, using
Considering the change of fuel composition with the nuclear design code of BWR fuel assemblybum-up, the infinite multiplication factors in the coldstand-by system and the basket system were estimated. factors, the nuclear design code of BWR fuelIn the calculation of these infinite multiplication assembly 5 ) is used. This calculation performed in
- 712 -

JAERI-Conf 2003-019
two dimensional XY systems. The estimation between the condition that 14 FPs are considered andprocedure is as follows: (i) the bum-up calculation for the condition that no FP is considered is 35%.the selected reload assembly is perforined and (ii) the Therefore, the reactivity restraining effect of the 14 Fl?infinite multiplication factors in the cold stand-by nuclides is 70% of that of all Fl? nuclides.system and the basket system are calculated by using Next, for the assembly whose maximum value ofthe fuel composition of each bum-up calculation point. infinite multiplication factor in the cold stand-byThe calculation models for the cold stand-by system system was indicated, the infinite multiplication factorand the basket system, using the nuclear design code in the basket system was estimated under theof BWR fuel assembly, are shown in Fig.1 and Fig.2, condition of being filled water. As for the infiniterespectively. multiplication factor, the maximum value in the entire
The bum-up calculation using the nuclear design bum-up term appears at around the same bum-up incode of BWR fuel assembly was performed for the the cold stand-by system. The maximum values of thevoid fraction of 0%, 40% and 70%. The infinite infinite multiplication factor for each Fl? considerationmultiplication factors in the cold stand-by system condition are shown in Table 4 b). By storing SFAswere estimated by using the fuel composition of each in the basket system, the infinite multiplication factorsbum- up calculation point. The behavior of the infinite become 04 to 045 smaller than those in the coldmultiplication factor with bum-up is as follows: the stand-by system.initial reactivity is restrained by the burnable neutronpoison, gadolinia, and the reactivity increase by 3.2 Definition of Model Bundlebum-up. Their maximum values appear at around the An example of criticality safety design adopting thebum-up ranging from 10 to 15GWd/t. After that, the gadolinia credit is the management of in-site storageinfinite multiplication factor decreases due to bum-up. pool for SFAs in a nuclear power plant. In thisAs for the infinite multiplication factor, the maximum procedure of criticality safety design, the value of thevalue in the entire bum-up term appeared at around IO multiplication factor in the cold stand-by system isGWd/t for the cross section of the upper region and at firstly set up, including a margin, and the modelaround 15 GWd/t for that of the lower region. The bundle is designed such that the infinite multiplicationmaximum values of infinite multiplication factor for factor in the cold stand-by system is the value set up.each Fl? consideration condition are shown in Table 4 Conventionally, this value set up, including a margin,(a). As shown in this table, the difference between the is 13. However, in the conventional design adopting
the gadolinia credit, the consideration condition for Fl?Table 4 Estimation results on maximum infinite nuclides is that all Fl? nuclides are considered. From
multiplication factors the viewpoint of citicality safety, the most reasonable(a) Cold stand-by system condition is that the 14 FPs are considered and it is
Maximum Remarks conservatively reasonable to adopt the condition thatK_ no Fl? is considered.
All FPs Upper Cross Section, The maximum value of the infinite multiplicationCondition 1.269 Void Fraction 40%, factor in the cold stand-by system, estimated in
and Standard Power section 31, has a margin of about 3% with respect to14 FPs Upper Cross Section, the set-up value, 13, in the case of the condition thatCondition 1.284 Void Fraction 40%, all FPs are considered. However, the margin decreases
and Maximum Power to half that value, 1.5%, for the case that the 14 FPsNo FP Upper Cross Sction, are considered. Furthermore, the maximum value of
Condition 1.319 Void Fraction 40%, the infinite multiplication for the case that no Fl? isand Maximum Power considered exceeds the value, 13.
(b) Basket system Further, regarding the requirement for the modelMaximum bundle, it is necessary to exceed the maximum value
K_ Remarks of the infinite multiplication factor of actual SFAs inUpper Cross Section, the basket system. Based on the above, the set-up
All FPs 0.844 Void Fraction 40%, value of the infinite multiplication factor in the coldCondition and Standard Power stand-by system and the target value of the infinite
14 FPs Upper Cross Section, multiplication factor in the basket system required forCondition 0.853 Void Fraction 40%, the model bundle are decided. For example, Table
and Maximum PowerNo Fl? Upper Cross Section, shows the required infinite multiplication factor in the
0.873 Void Fraction 40% 70%, cold stand-by system. The infinite multiplicationCondition and Maximum Power factors in the cold stand-by system were set with a
N13: The power condition which appears maximum reactivity margin of about 3. And the infinite multiplicationdepends on the FP consideration condition. factors in the basket system should be given as
condition that all FPs are considered and the condition exceeding the maximum value of actual SFAs.that no Fl? is considered is 5%, and the difference The model bundle for the condition that all FPs are
- 713 -

JAERI-Conf 2003-019
considered was made of two kinds of fresh fuel rods: The model bundle for the condition that the 14 FPsthe fuel rod of the maximum enrichment used in are considered was also made of two kinds of freshconventional BWR 4.9 wt%-U235) and the fuel rod fuel rods: the fuel rod of maximum enrichment used inof lower enrichment. In the condition that the infinite conventional BWR 4.9 wt%-U235) and the fuel rodmultiplication factor in the cold stand-by system is set of lower enrichment. In the condition that the infiniteup to 130 and the enrichment of higher fuel rod is multiplication factor in the cold stand-by system is setfixed to 49 wtO/o, simulating the actual distribution of up at 132 and the enrichment of higher fuel rod isenrichment. The concept of fuel rod arrangement for fixed to 49 wtO/o, simulating the actual distribution ofthe model bundle, summary of design and the infinite enrichment. The concept of fuel rod arrangement formultiplication factor in the cold stand-by system and the model bundle, summary of design and the infmitethe basket system are shown in Fig.3. The infinite multiplication factors in the cold stand-by system andmultiplication factor in the cold stand-by system is the basket system are shown in Fig.4. The infinite1.30, and the infinite multiplication factor in the multiplication factor in the cold stand-by system isbasket system is 0856 wich exceeds the target value 1.32, and the infinite multiplication factor in thementioned in section 31. basket system is 0862, which exceeds the target value
mentioned in section 31.Table Required infinite multiplication factors for
model bundle in cold stand-by system
All FPs Condition 1.300 Lower enrichment region (about 2.OwtO/o)..................................
14 FPs Condition 1.320 Higher enrichmentregion (4.9vV/6)
No FP Condition 1.360
Lower enrichment region (about 1.5w&/) %..........................................................
Higher enrichment ..............................region (4.9welo)
fraction of higher and lowerenrichment fuel rod is about5 by 2,higher enrichment fuel rodsare located at inner position,andenrichment of lower fuel rodsis about 2.Owt%.
fraction of higher and lower K-infinityenrichment fuel rod is about1 by 1, Cold Stand-by System 1.320
higher enrichment fuel rods Basket System 0.862are located at inner position,and
enrichment of lower fuel rods Fig.4 Fuel rod arrangement and k_ of model bundleis about 1.5wt%. for the condition tat 14 FPs are considered
K-infinity The model bundle for the condition that no FP is
Cold Stand-by System 1.301 considered was made by adjusting the enrichment offuel rods, so that the infinite multiplication factor in
Basket System 0.856 the cold stand-by system should be 136. The set-up
condition is only the infinite multiplication factor,1.36. The concept of fel rod arrangement for the
Fig.3 Fuel rod arrangement and k_ of model bundle model bundle, summary of design and the infinitefor the condition that all FPs are considered multiplication factors in the cold stand-by system and
the basket system are shown in Fig.5. The infinite
- 714 -

AERI-Conf 2003-019
multiplication factor in the cold stand-by system is considered and the model bundle for the condition that1,36, and the infinite multiplication factor in the no FP is considered. The calculation model for thebasket system is 0889 wich exceeds the target value horizontal cross section of the NFT-38B cask systemmentioned in section 31. is shown in Fig.7.
As mentioned above, tree kinds of model bundlewere designed for each FP consideration condition.The estimation of storage in the cask system isperformed for te model bundle for the condition that SCALEall FPs are considered te infinite multiplicationfactor in the cold stand-by system is 130), which isthe conventional estimation condition, and the modelbundle for the condition that no FP is considered (the BONAMIinfinite multiplication factor in t cold stand-by is NITAWL1.36), which is the most conservative.
XSDRNPM
Uniform enrichmentregion (about 3.OwM)
HomogenizedGroup-ConstantWR)
(WR)
KENO-Va(keff Cale.)
Fig.6 Calculation flow of keff by using the
use of one kind of fresh fuel KENO-Va code
rods, and,enrichment of fuel rods is
about 3.Owt%. Reflective Condition
K-infinity
Cold Stand-by System 1.360 VacuumVacuum
Basket System 0.889
)rERE' FamOR_
Fig.5 Fuel rod arrangement and k- of model bundle ls`Ufor the condition that no FP is considered
4. Estimation of Criticality Safety
The criticality safety in the NFT-38B cask system,which is used in the actual cask transportation, storingthe model bundles is estimated by calculating theeffective multiplication factor, using the KENO-Vacode') . The calculation of the KENO-Va code wasperforined for the homogenized assembly in ode],using 238-group cross-section library in the SCALE Fig.7 Analysis condition for the NFT-38B caskSySteM7 ). The calculation flow of the KENO-Va code, systemusing the SCALE system, is shown in Fig.6.
The estimation of criticality safety is performed forthe NFT-38B cask system storing the model bundles The calculated results of the effectivewhose selection is described in the previous chapter, multiplication factors in the NFT-38B cask system,i.e. the model bundle for the condition that all FPs are using the KENO-Va code, are shown in Table 6 The
- 715 -
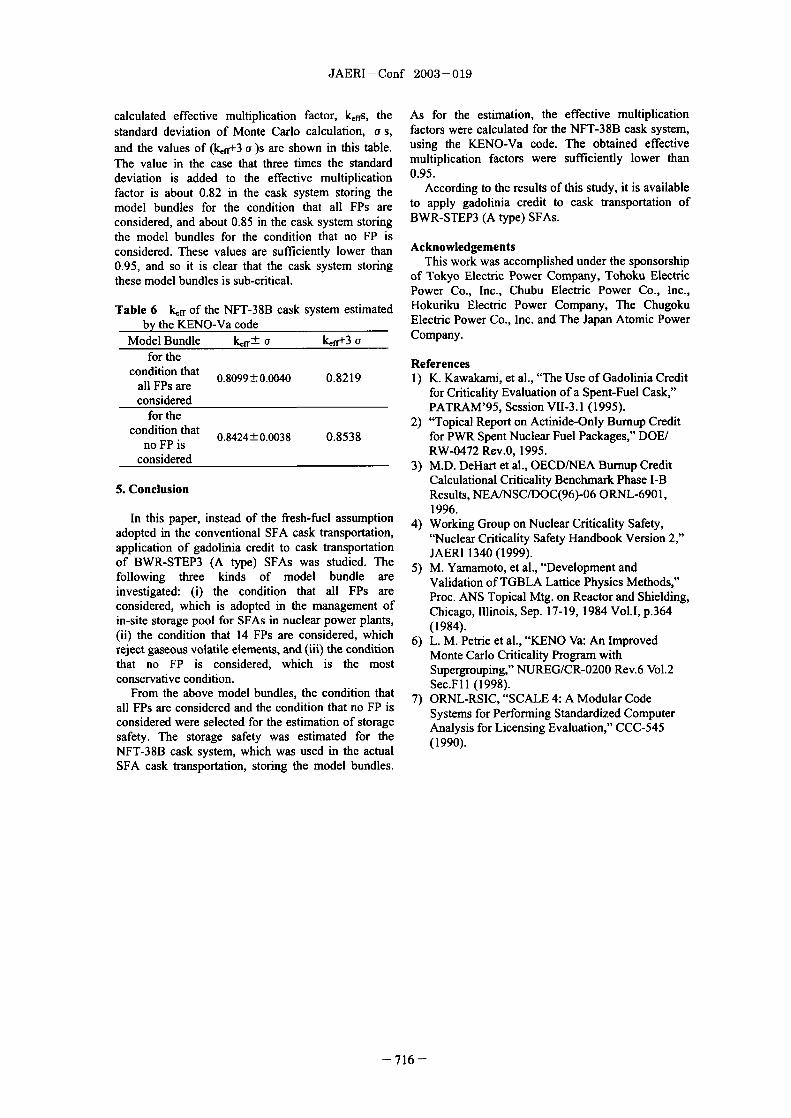
JAERI-Conf 2003-019
calculated eective multiplication factor, kfys, the As for the estimation, the effective multiplicationstandard deviation of Monte Carlo calculation, as, factors were calculated for the NFT-38B cask system,and the values of kfr+3 u )s are shown in this table. using the KENO-Va code. The obtained effectiveThe value in the case that three times the standard multiplication factors were sufficiently lower than
deviation is added to the effective multiplication 0.95.factor is about 082 in the cask system storing the According to the results of this study, it is availablemodel bundles for the condition that all FPs are to apply gadolinia credit to cask transportation ofconsidered, and about 0.85 in the cask system storing BWR-STEP3 (A type) SFAs.the model bundles for the condition that no FP isconsidered. These values are sufficiently lower than Acknowledgerrients0.95, and so it is clear that the cask system storing This work was accomplished under the sponsorshipthese model bundles is sub-critical. of Tokyo Electric Power Company, Tohoku Electric
Power Co., Inc., Chubu Electric Power Co., Inc.,
Table 6 kff of the NFT-38B cask system estimated Hokuriku Electric Power Company, The Chugokuby the KENO-Va code Electric Power Co., Inc. and The Japan Atomic Power
Model Bundle k,�ff ± a kfr+3 a Company.
for the References
condition that 0.8099±0.0040 0.8219 1 ) K. Kawakami, et a., "The Use of Gadolinia Creditall FPs are for Criticality Evaluation of a Spent-Fuel Cask,"considered PATRAM'95, Session VII-3.1 1995).
for the 2) "Topical Report on Actinide-Only Burnup Creditcondition that
no FP is 0.8424±0.0038 0.8538 for PWR Spent Nuclear Fuel Packages," DOE/
considered RW-0472 Rev.0, 1995.3) M.D. DeHart et al., OECD/MEA Burnup Credit
5. Conclusion Calculational Criticality Benchmark Phase I-BResults, NEAINSC/DOC(96)-06 ORNL-6901,
In this paper, instead of the fresh-fuel assumption 1996.adopted in the conventional SFA cask transportation, 4) Working Group on Nuclear Criticality Safety,application of gadolinia credit to cask transportation "Nuclear Criticality Safety Handbook Version 2"
of BWR-STEP3 (A type) SFAs was studied. The JAERI 1340 1999).following three kinds of model bundle are 5) M. Yamamoto, et al., "Development andinvestigated: (i) the condition that all FPs are Validation of TGBLA Lattice Physics Methods,"considered, which is adopted in the management of Proc. ANS Topical Mtg. on Reactor and Shielding,in-site storage pool for SFAs in nuclear power plants Chicago, Illinois, Sep. 17-19, 1984 Vol.1, p.364
(ii) the condition that 14 FPs are considered, whic� (1984).reject gaseous volatile elements, and (iii) the condition 6) L. M. Petrie et al., KENO Va: An Improvedthat no FP is considered, which is the most Monte Carlo Cticality Program withconservative condition. Supergrouping," NUREG/CR-0200 Rev.6 Vol.2
From the above model bundles, the condition that Sec.F I I 1998).all FPs are considered and the condition that no FP is 7) ORNL-RSIC, "SCALE 4 A Modular Codeconsidered were selected for the estimation of storage Systems for Performing Standardized Computersafety. The storage safety was estimated for the Analysis for Licensing Evaluation," CCC-545
NFT-38B cask system, which was used in the actual (1990).SFA cask transportation, storing the model bundles.
- 716 -

JAERI-Conf 2003-019 JP0450134
Burn-up Credit Applications for U02 and MOXFuel Assemblies in AREVA/COGEMA
H. TOUBON", C. RIFFARD2, M. BATIFOL', S. PELLETIEWCOGEAM VELIZY 2 rue Paul Dautier 78141 VELIZY Cedex, France
2 CEA Cadarache, 13108 St Paul-Lez-Durance Cedex, France3COGEMA LA HAGUE, 50444 BEAUMONTHAGUE Cedex, France
4 Canberra-Eurisys 4 avenue des Fr9nes, 78067 St Quentin-en- Yvelines Cedex, France
For the last seven years, AREVA/COGEMA has been implementing the second phase of its bum-up creditprogram (the incorporation of fission products). Since the early nineties, major actinides have been taken intoaccount in criticality analyses first for reprocessing applications, then for transport and storage of fuel assembliesNext year 2004) COGEMA will take into account the six main fission products (RhIO3, CsI33, NdI43, SmI49,SmI52 and GdI55) that make up 50% of the anti-reactivity of all fission products. The experimental programwill soon be fmished. The new bum-up credit methodology is in progress.After a brief overview of BUC R&D program and COGEMA's application of the BUC, this paper will focus onthe new bum-up measurement for U02 and MOX fuel assemblies. It details the measurement nstrumentationand the measurement experiments on MOX fuels performed at La Hague in January 2003.
Keywords: R&D Program for BUC applications, Criticality experiment, code qualification,burn-up measurement, spentfuel, UOx, MOx.
1. Context of Burn-Up Credit (BUC) used to interpret bum-up measurements which will be
For over ten years, burn-up credit (actinides only) has applied to both U02 and MOX fuel assemblies.
been used at the COGEMA plant in La Hague forspent fuel transport, interim pool storage and 2 A brief history of allowance for BUC inreprocessing applications. More than five years ago, COGEMA La Haguean intensive research program was begun jointly with 2.1. 1980 1990the French Atomic Energy Commission (CEA) andthe French Institute for Radiological Protection and At this time, all criticality studies were done at theNuclear Safety (IRSN). This research program will optimum of moderation without BUC. No difficultiesmake it possible to take the main Fission products were encountered in the design of the first plants UPI(neutron absorbers) into account in criticality studies. (at Marcoule) or UP2400 (at La Hague) because theThese Fission products are listed in Figure I below. fuel assemblies were less enriched and the facilities
BU 20 GWd/tU 40 GWd/tU were smaller.SmI49 980 1030 At the same time (in the mid-eighties) COGEMARhlO3 790 1360 began its first R&D program for qualification of U andNd 143 530 9W0133 420 750 Pu (actinides only BUQ. This IRSN R&D programGdI55 390 1550 was called the "HTC program" and it was conductedSm152 250 4" at VALDUC.sm 151 350 500 1
Tc99 440 2.2.1990 - 2000NdI45 2 410 1990 was the start-up of UP3. Since then, the BUCEu 153 150 3"
_M095 150 290 has been systematically applied for reprocessingSm 147 150 230 because, without the BUC, the dissolver wheel isSM150 120 270 critical for enrichments higher than 25%. LikewiseAgIO9 100 250RUM 100 we started UP2-800 in 1995. Consequently a burn-upTotal for 200 fission products 6120 measurement is systematically performed to ensureTotalfor 6flssion products 3460 (.56%) the reprocessing times of both plants at La Hague
I Totalfor 15fission products 4950 (81 During this period, the increase of initial enrichment
Figure I of the fuels led to the necessity of BUC not only for
After a brief history of BUC implementation at La reprocessing but also for transportation and poolHague (chapter 2 the first part (chapter 3 of this storage at La Hague. The actinide-only BUC was then
article will describe the collaborative research used in Europe for:
program between COGEMA and CEA or RSN, transport of the fuels from Germany, Holland,which is nearing completion. The second part of this Switzerland, and Belgium to Francearticle (chapter 4 gives details of the new method
Hervd TOUBON, Tel.33-1-39-26-43-63, E-mail: htoubon�cogema.fr
- 717 -

JAERI-Conf 2003-019
storage of all fuels (French and foreign) at La 3.1 Minerve experimental and qualificationHague pools. program
In conjunction with the use of UC we adopt less The aim of this program is to:penalizing criticality hypotheses. For example in the I Measure the effective capture cross-sections ofcase of fuel storage, one less penalizing hypothesis the 15 major fission products in the Minerveconsists mainly of taking into account a fixed number reactor operated by the French Atomic Energyof rods (the criticality studies are no longer done at the Commission at Cadarache. These measurementsoptimum of moderation). Obviously this number of are made by oscillations of individual samples ofrods has to be guarantied. the fission products in the reactor. Oscillations of
In parallel with this generalization of use of actinides- spent UOX and MOX fuel samples is also underonly BUC, COGEMA decided to begin a second way. These measurements are being carried outextensive R&D program to take fission products into by the SPEX Department to qualify theaccount. This program is detailed in chapter 3 APOLL02 S option of the CRISTAL package.
2.3. 2000 - 2010 2. Measure and analyse samples of spent fuel fromFrench and German pressurized water reactors
The complementary needs of BUC concern the which will allow the SPRC Department of theextension of the range of acceptable fuels Atomic Energy Commission at Cadarache to
• MOX qualify the Darwin fuel cycle package and the
• U02 up to 5% enriched Cesar code (see respectively References 2] and[31).
MTR Some results have been published (see Reference 4]).
The need to incorporate fission products in BUC can 3.2. VALDUC experiments and interpretationb6 explained by the two levels by which the BUC canbe applied: The program involves experiments and qualification
• the first level results in little gain (a single and of the French criticality package CRISTAL.minimum fuel cycle in the core) but with a little The experiments are carried out by IRSN at VaIduc.constraint which consists only of a simple These experiments represent a sub-critical approachirradiation check involving the raising of the water level. Various
configurations are studied, ranging from individual• the second BUC level can give the bum-up in the fission products to more general experiments on
50 least irradiated centimeters of the ftiel. mixtures of products (see Reference [5]).
Nevertheless, this higher gain requires the The experiments are interpreted by the Criticalityimplementation of a quantitative bum-up Study Department of IRSN at Fontenay-aux-Rosesmeasurement. with a goal of qualifying the industrial version
The incorporation of fission products is consequently (Apollo-Moret) of CRISTAL (see Reference [51).particularly interesting when the bum-up measurementis not easy to implement. The first level of BUC (with 3.3. CRISTAL, the French criticality packageincorporation of fission products) can sometimes be CRISTAL comprises three calculation routes:
enough. This is the case for EDF fuel storage at La 1. The Monte Carlo route with the Tripoli codeHague, for which today no BU measurement has been developed by the CEA's Department for the Studyimplemented, and also for the reprocessing of MOX of Reactors and Advanced Modeling (SERMA inThe paper in reference I gives a good example of the Saclay.
contribution of fission products for MOX In this 2. The APOLL 2 SN route used to make ID and Dparticular case with only a first level of BUC (with calculations (calculations of standards); it isfission products) no gadolinium has to be used for qualified by the CEA's Department of Reactorreprocessing. Physics in Cadarache.
Another application of BUC (with fission products) is 3- The industrial route with coupling between thethe ability to guaranty some liquid tank transfers - APOLLO 2 code used to assess multi-group cross-particularly liquids with high Pu concentrations. sections in infinite surface areas. And the MORET 4
code used to calculate complete 3D geometriesusing the Monte Carlo method but with cross-sections calculated by APOLLO, which requires aconsiderably shorter calculation time than the
3. The finalising criticality R&D program direct Monte Carlo method. This route has been
This R&D which began in 1995 consists of two parts: qualified by the Criticality Study department of thean extensive experimental program at VALDUC and CEA in Fontenay-aux-Roses.
CADARACHE sites, and a code development and Figure 3 below shows the various codes andqualification program. The French criticality package sequences making up the CRISTAL package.CRISTAL is the main result of this R&D.
- 718 -

JAERI-Conf 2003-019
operate at room temperature. A considerable amountof development work was required nonetheless to
CIGALES 21, �W optimize these detectors and the associated electronicsDIL�10N WNS
tam for this type of application, since they are crentlyWM6v�NT'
APROC ROCEDUR F. 8 THEMISINJOY: THEM used almost exclusively in e e o nuc earmedicine to measure low energy rays at low countrates.
CESAR 4
INE V! n, The detectors were extended, making it possible tomeasure all the gamma rays of interest 661 keV for
6 117C 134Cs, 796 keV for s and most importantlyQ MRIPWAS 1540X 1274 keV for Eu). The electronics were optimizedW 171A M :0 to handle count rates of 50,000 counts/second. Dual
4 4 i +parameter analysis (energy and pulse shape) results in
on MM improved resolution and makes it possible to separatethe Eu peak from those of Co at 1173 keV and
Figure 3 1332 keV A resolution of the order of 1.5% has beenachieved i.e. 10 keV at 661 keV and 20 keV at
4. A new BU measurement for U02 and MOX fuels 1.4 MeV.
4.1. Industrial and development objectives 4.3. Interpretation of the measurements
COGEMA currently uses two methods for measuring A considerable amount of work has also been carriedbum-up, one based on gamma spectrometry and the out as regards analysis of the measurement results. Aother on passive neutron measurement. Both combined measurement analysis algorithm has beenmeasurement systems are located in the shearing and developed. It comprises four major stages that occurdissolution facilities of both UP2 and UP3 after the fuel assemblies pass in front of the detector.
reprocessing plant at La Hague. I Blind nterpretation to be able to know with no
There is also a portable system known as Python data on the fael assembly measured if the fuel is a
which uses a single neutron measurement and a total MOX or an U02 fuel.gamma measurement to obtain a bum-up profile along 2. Validation of the average bum-up of the file]the axis of a ftiel assembly. This system has been assembly by analysis of neutron measurement (useinstalled in various reactor spent fuel pools in Europe, of certain data such as irradiation history, burn-upmaking it possible to use bum-up credit for the of fuel cycles, initial isotopic composition).
transport of spent fuel casks and their interim storage 3. Determination of bum-up at one end of fuelin the COGEMA pools at La Hague. It does not assembly due to acquisition of the axial profile ofinvolve gamma spectrometry since the technique 137cS.
currently used at La Hague requires a germanium 4. Validation of data provided by reactor operatordetector with a liquid nitrogen cooling system that (use of gamma spectrometry ray ratio to detect anycannot easily be installed underwater in a reactor pool. possible inconsistencies in the data provided).
These two systems can be used to measure the bum-up The first stage ensures that MOX fuel assemblies areOf U02 fuel assemblies and are qualified by the French not mistaken for U02 assemblies. Indeed, for a givenSafety Authorities for such fuels but not for MOX fuel bum-up, a MOX ftiel assembly can have a far higherassemblies. reactivity than a U02 fuel assembly. Likewise, the
The studies currently under way are therefore aimed at data validation module (Stage 4) guarantees that anydeveloping a system that could be used to measure the significant error regarding the initial enrichment (ofbum-up Of U02 and MOX fuel assemblies as simply pu content in the case of MOX fuel assemblies) willas possible, without the need for a liquid nitrogen be detected. In addition to the average bum-upcooling system. validation stage (Stage 2), Stage 3 makes it possible to
Furthermore, the combination of neutron set a minimum bum-up value which must be highermeasurements and gamma spectrometry would simply than the bum-up used for the criticality-safety study.
involve modifying the software of the existing All of these stages use laws of correlation between asystems at La Hague, without any effect on the physical quantity (gamma peak ratio or neutronhardware. measurement) and bum-up. An evolution code is
4.2. Measurement system therefore required and is used on-line. This code isknown as CESAR (see Reference 2]). A large amount
In view of the industrial objectives mentioned of research and development work has been carriedpreviously, preference was given to a system that out (especially for MOX fuel assemblies) to createcombined gamma spectrometry and neutron neutron effective cross-section libraries that are usedmeasurements and yet remained portable. There was to accurately characterize entire fuel assemblies.no alternative but to use Cd-Zn-Te detectors which
- 719 -

JAERI-Conf 2003-019
This new measurement system can be used to measure the bum-up credit of MOX fuel assemblies (actinidesboth U02 and MOX fuel assembly bum-up and is far only to begin with). To this end, a new device formore accurate than existing bum-up measurement measuring the bum-up Of U02 and MOX fuelsystems thanks to its data validation module. assemblies has been successfully developed. The
The system is developed by CANBERRA under CEA system is now at the qualification stage after realspecification. measurement on MOX fuels at La Hague.
All this R&D (in the fields of criticality and nuclear4.4. Qualification Program measurements) should ensure that COGEMA will be
Since the R&D work is nearing completion, a program in a position to handle, in its La Hague facilities, thehas been devised for qualif��g the system. different types of fuel currently envisaged by
Hot testing on 20 MOX fuel assemblies has been electricity companies and fuel designers without any
performed at COGEMA La Hague in January 2003. major problems.
The bum-up of these 20 MOX fuels have measured. 6. References
Figure 4 below shows the positions of the detectors onthe bum-up measurement stations in the shearing and [1] Grdgory CAPLIN (SGN), Hervd TOUBONdissolution facilities in COGEMA's UP2 and UP3 (COGEMA), Specific appplication of Bumupplants at La Hague. credit for MOX PWR Fuels in the rotary dissolver
ICNC2003, TOKAI (JAPAN) October 20-24,Tranevemal secUan of Me burn-W measurenvent vall 2003.
Neutmn detedor [2] M. Samson, J.P. Grouiller, J.P. Pavageau,
Gamma detedor P. Marimbeau, J.M. Vidal (CEA), J. PinelK, �4" ollimator (Ge or Cd-Zh-Te) (Cogema).
CESAR: a simplified evolution code applied toreprocessing application.RECOD 98, Nice (F) October 25-28, 1998.
7 plementary
[3] P. Marimbeau, V. Allais, C. Monier, B. Nimal,My A. Tsilanizara, C. Garzenne.
The Darwin fuel cycle package - Procedures formaterial balance calculation and qualification.
Figure 4 ENC'98, Nice (F) October 25-28, 1998.
The qualification note is under progress, but we can [4] N. Thiollay and al.already give the following results: Bumup credit for fission product miclides in PWR
(UO2) spent fuels.The system will be able to validate the burn-up ICNC'99 - Versailles (F - September 1999.within +/-IO%.
[5] J. ANNO and al.A mistake in one declared irradiation cycle will Status of the joint french IRSN and COGEMAbe detected even if it does not change the cooling qualification programme of fission products.time of the ftiel (ex. for a given fuel a declared ANS Winter Meeting, RENO (NEVADA)irradiation history during reactor cycles 2 3 and November 2001.5, and real irradiation history during reactorcycles 2 4 and can be detected)
The initial 235U enrichment or Pu content can bevalidated within a variation of about 1% (ex: adeclared value of 5%Pu content can bedistinguished with a 6%Pu content value)
This should mean that, in 2004, it will be possible tosubmit a report on the new U02 and MOX fuelassembly measurement system to the French safetyauthorities for approval.
5. Conclusion
The R&D work being carried out by COGEMA, CEAand IRSN on the subject of bum-up credit is nowentering its second phase (with allowance being madefor the major fission products as well as majoractinides). It is also intended to make allowance for
- 720 -

JAERI-Conf 2003-019 JP0450135
Preparation and Testing ORIGEN-ARP Library for VVIER Fuel Design
Maksym YEREMENKO, Yuriy KOVBASENKO, Yevgen BILODID
State Scientific and Technical Centre on Nuclear and Radiation Safety (SSTC NRS),Radgospna st. 35-3 7, 03142 Kyiv, Ukraine
The main results of neutron-physical constant libraries preparing and testing for assessmentVVER reactors spent fuel isotope composition with the SCALE control moduleORIGEN-ARP are presented in this report.
The libraries were tested on the basis of the comparison between the calculation resultswith the experimental data, and with the calculation benchmarks. It should be mentioned thatthe particular attention was paid to iportant in the view of criticality analysis isotopes thatare contained in the spent nuclear fuel.
KEYWORDS. Nuclear Power Plant (NPP), reactor VVER, spentfuel, burnup credit,SCALE, ORIGEN-ARP, benchmark
1. Introduction testing of code package SCALE for VVER reactorsfuel.
Improvement of NPP capabilities in terms of spent For the previous stage results as regards testingnuclear ftiel (SNF) management and storage, SCALE criticality sequence calculation, see, for-reactor cooling ponds and shipping instance, refe 1) 2)upgrading near rences andcasks, construction of SNF storage facilities require the Now, the testing was carried out by comparison ofrelevant nuclear safety substantiation. the results calculated by ORIGEN-ARP with the results
According to the existing normative base, nuclear of experiments, and calculations made by othersafety as to SNF management and storage system shall programs.be analyzed without fuel burnup taking into account As the experimental data, the results of studying(i.e. fuel shall be treated as fresh one). This is too much isotopic content of VVER-440, and VVER-1000 SNFconservative, and does not meet state-of-the-art science completed in different years were used.and technology. As the calculated data used for testing
Presently, there are researches undertaken both in ORIGEN-AR-P with libraries for fuel assemblies ofUkraine and in many other countries, aimed at VVER440, and VVER-1000, the special calculatedsubstantiation, and development, of such normative benchmarks were used.requirements allowing to use burnup credit while While testing libraries, the special attention wasanalyzing criticality of SNF management and storage paid to those isotopes, which are suggested to be usedsystems. One of these activity main components is to while undertaking the work on substantiation ofidentify the isotopic content of ftiel spent in VVER440 nuclear safety taking the spent fuel burnup intoand VVER I 000 type reactors constituting the basis of account:nuclear power in Ukraine. - first of all, these are fission isotopes, i.e. those
To determine isotopic content of VVER440 and participating in chain reaction:VVER-1000 SNF, we use the package of computercodes SCALE') and, in particular, code 235U, 236U, 238U, and 239Pu, 24OPu, 241Pu;OFJGEN-ARp4) . This program is among the mostadvanced ones with which help the isotopic content of - secondly, actinides:SNF can be calculated. However, this program (itsneutronic constant libraries) is oriented, firstly, at using 234U, 238Pu, 242Pu, 24lAm, 243Am, 237Np;for PWR, BWR, and CANDU reactors. That is why,while using this code to calculate isotopic content of - as well as 18 main products of fuel isotopes fissionVVER SNF, one shall, first of all, prepare the libraries caused by chain reaction:of neutronic constants for VVER fuel, test them, andsubstantiate their applicability. 95Mo, 99Tc, 10IRu, 103Rh, 105Pd, 108Pd,
Here, the main results are presented as to testing 109Ag, 133Cs, 135Cs, 143Nd, 145Nd, 147Sm, 149Sm,ORIGEN-ARP libraries of neutronic constants I50Srn, 15ISm, 152Sm, 153Eu, 155Gd.prepared by the authors taking into accountgeometrical structure, and material composition of ftiel Here, the results of completed testing are presented.assemblies for VVER-440 and VVER I 000. Upon which base the conclusion is made concerning
This work is the continuation of our comprehensive possibility of using the libraries prepared for code
- 721 -
JAERI - Conf 2003 - 019
ORIGEN-ARP to determine isotopic content of 2.1.3 Publications 10) and
VVER-440 and VVER I 00 fuel. Errors of identifying AER Calculational benchmark and ) isconcentration of particular isotopes are being developed to study possibility of using various codes todetermined. determine isotopic content of SNF, and subsequent
The report was prepared within the framework of using this information while calculating criticality ofproject alidation of ORIGEN-ARP and SCALE fuel storage systems (using "bum-up credit" for VVERSAS2H for VVER and RBMK Fuel Designs)>. fuel). It was developed in the framework of the
International Scientific Team AER (Atomic Energy2. Analysis of the data used for testing. Research) gathered experts from many countries were
VVER reactors are now under operation (Bulgaria,Hungary, Russia, Slovakia, Czechs Republic, Finland).
Let's consider in more detail the experimental This benchmark presents description of the used fuelresults and calculation benchmarks data used for assembly, operation modes, and the obtained results.testing. Bumup of fuel, and concentration of isotopes were
2.1 Fuel for WER-440 Reactor determined by calculation. Error is not presented.Benchmark was calculated by a number of
2. 1.1 Publication 6 and 7) organizations. The following codes were used:
7) CASMO4, WIMS 7 NUKO, HELIOS, MCU, andInformation presented in and is based upon the ORIGEN2. Fuel bumup and subsequent storage
results of measuring isotopic composition of SNF from conditions and, also, fuel structure are presentedVVER440. Bumup of fuel, and concentration of enough particularly.
isotopes were determined experimentally. Error is 2.2 Fuel for WER-1000presented to each value of fuel bumup, and
concentration of isotope, and this equals to about 2.2.1 Publication 12)
5 7 %. Unfortunately, isotope concentration wasdetermined long time ago (more than 20 years ago) for Publication 12) presents the results of isotopicobsolete types of fuel. During experiment, only content measurement as to the VVER-1000 spent fuel.concentration of fuel isotopes, and actinides, was For this measurement, one FA was used frommeasured. The data required for the detailed modeling VVER-1000 under operation at Zaporizhya NPP. Itsbumup conditions and for the subsequent storage of initial enrichment was 392%. This was underfuel are presented insufficiend. Because of this, we've operation during one campaign, and unloaded from theused the average parameters. Fuel structure is typical core in 1999. Isotopic composition of three specimentsfor the reactors VVER440 (Figure 1). with different bumup levels is presented. This
assembly was operated over comparatively not so long
2.1.2 Publication ) time ago, and SSTC NRS has the informationnecessary to calculate loading FA throughout the period
For measurement, four FA were used from of its operation inside the core (fuel pattern, andVVER-440 of Novo-Voronezh NPP. Initial enrichment refueling, reactor power during operation of unit, etc.).of fuel was 33% and 36%. Selected assemblies were Bumup of fuel, and concentration of isotopes wereused during 1 3 and campaigns. Totally, isotopic determined experimentally. Error is presented for eachcontent of 21 specimens with different bumup levels value of burnup, and isotope concentration, being equalwas determined. Reference 9 presents the data needed approximately to 1�7 %. Isotope concentrations wereto calculate loading FA during operation inside core: measured quite recently, and for the fuel of new type.schemes of fueling and refueling, schedules of However, this assembly was operated for one campaign,in-service loading, etc. Bumup of fuel, and and the achieved level of bumup is insufficient. Duringconcentration of isotopes were determined the experiment, only fuel isotopes, and actinides,experimentally. Frror is presented to each value of fuel concentration was determined. Conditions of fuelburnup, and concentration of isotope, and this equals to bumup, and subsequent cooling are described quite inabout 5 7%. Concentration of isotopes was measured detail. Fuel is of the known design.
quite long time ago, and for obsolete fuels. During 2.2.2 Publication 13)
experiment, only concentration of fuel isotopes, andactinides, was measured. Conditions of bumup and Here, the calculation benchmark specification, issubsequent storage of fuel are described enough presented which was developed for study of differentparticularly. Fuel structure is typical for the reactors codes possibilities for the modeling of modemVVER-440 (Figure 1). VVER-1000 reactor fuel types (fuel with gadolinium
burnable absorber, and MOX ftiel). The main attentionwas paid to Ki,,f calculation and to determination ofspent ftiel isotope composition. Benchmark was
- 722 -

JAERI-Conf 2003-019
prepared in the framework of NUCLEAR ENERGY INPLEVEL = I is used. If we need to model theAGENCY ORGANISATION FOR ECONOMIC deviations from this regular structure, then theCO-OPERATION AND DEVELOPMENT commands INPLEVEL=2 or 3 should be used.(NEA/OECD). This benchmark presents spent SAS2H capacities of modeling fuel elements latticeassemblies description, their operation conditions and irregularity was used. SAS2H control moduleresult of calculations for fuel burnup and isotopes calculational model for the VVER-440 reactorconcentration. Uncertainty isn't indicated. Several assembly is presented in the Figure 2 Provided theorganizations had carried out the benchmark material quantity is kept constant for the correspondingcalculation. The following codes were used: MCU, calculational zones, the following equivalentTVS-M, WIMS8A, HELIOS and MULTICELL. dimensions (cm.): r=0.440; r2=0.515; r3=0.64054;Burnup conditions and fuel structure are described r4=7.21858; r5=7.40303; r6=7.56054; r7=7.71805- wereenough particularly. calculated.
Below in this report only the data were used ondetermination of isotope composition of fuel withgadoliniurn burnable absorber.
�see���3. Preparing of neutron-physical constant librariesfor ORIGEN-ARP.
0 0 0 0 0 0 0 0It should be mentioned that ORIGEN-ARP is the 0000000004
method of isotope content in spent fuel calculation 0 0 0 0 0 0 0 0 0based on the neutron-physical constant libraries 0 0 0 0 0 0 0extrapolation. These libraries were received with te 0 0 0 0 0 0 0help of control module SAS2H'). 4114,
Taking into account this fact, the ORIGEN-ARP 10calculations were done after the requiredORIGEN-ARP libraries were calculated with the helpof control module SAS2H 5). After receiving the
17TI72.27-necessary libraries, the spent fuel isotope composition 1 2 -
was calculated for the comparison with the data ofexperiments and benchmarks. While ORIGEN-ARP I- central tube; 2- fuel rod; 3- fuel assembly shroud
libraries calculating, SCALE standard library Fig. Scheme of Fuel Rod Lattice of VVER-44044GROUPNDF5 was used. The choice of this library is Fuel Assemblyconditioned, firstly, by proposals of SCALE codespackage manuals and, secondly, by precence of theparticular gadolinium isotopes in the library.
3.1 Neutron-physical constant libraries forVVER-440 fuel
The SAS2H control module is based on theORIGEN-S code modeling fuel in one-dimensionalapproximation. A fuel assembly is described as infinitelattice of fuel rods. For VVER, this lattice is hexagonal.However, a number of fuel rods disturb the regularityof this lattice. Central tube, inter-assembly water gapand assembly shell are the elements that disturbregularity of gexagonal fuel pins lattice (Figure 1) forthe VVER-440 fuel.
These components essentially impact on the neutron
spectrum and fuel irradiation conditions, therefore, the Uranium-water mixture 4)possibility of their modeling should be provided incalculations. Zirconium, central tube 2) or assembly
The SAS2H capabilities allow consideration of -shroud 6)
some differences between the actual fuel assembly 0 - Water 13,5,7)design and the standard one. This is done through the
INPLEVEL command permitting different options in Fig. 2 Model of VVER-440 fuel for controlmodeling a fuel assembly. For example, if a completely moduleSAS2Hregular fuel lattice is modeled, the command
- 723 -

JAERT-Conf 2003-019
3.2 Neutron-physical constant libraries for account actual location of the fuel rod selected for theVVER-440 fuel ftirther analysis.
The ORIGEN-ARP codes libraries for the fuelVVER-1000 were calculated with the help of controlmodule SAS2H according to the same scheme as forthe fuel VVER-440. Fuel assembly sketching ispresented in the Figure 3 Position of fuel pins withgadolinium refer only to fuel assembly from the
13)benchmark NEA/OECD .In the other fuel, the usualfuel pins are situated at these places.
1 2 4
ot, a 4 i A r-
A C
RIM
Fuel with adoliniurn (NEA/OECDM 9R W -benchmark or water (1)
Uranium-water mixture 4)
Zirconium, fuel pin cladding or centrala 0 2 A 64 9% agoA Aw *0 0 *6 6 0 0 tube 2)
�w ,g j g,'R Q �90"ga OE M m Water 3,5)
0AO 0� a a a 12.75
Fig. 4 Model of VVER-1000 fuel for control moduleSAS2H
I - fuel pin; 2 - guide tube for control rod or burnable It's impossible to do this, in calculations with theabsorber; 3 - central tube; 4 - fuel pin with or without help of ORIGEN-ARP sequence because of the sotopesgadolinium. concentration for the fuel assembly is determined in
Fig. 3 Scheme of Fuel Rod Lattice of VVER-1000 this calculations altogether. It is possible to take intoFuel Assembly account the real fuel pins placement while isotope
concentration calculations with the help of SAS2H
For the modeling of fuel pins lattice irregularity of sequence (these results are presented in the report 14)).
VVER-1000 reactors assembly, the calculationalmodel (presented in the Figure 4 SAS2H control 4. Results of calculations
module capacities were used as in the previous case. Tables I and 2 present the mean uncertainties of theUnder the condition that the material quantity is kept particular isotopes concentration calculation for theconstant, the following equivalent dimensions for the spent fuel VVER-440 and VVER-1000, which werecalculational zones (cm) were calculated: received while calculating of experiments and
fuel with gadoliniurn (benchmark benchmarks.NEA/OECD) rl=0.55; r2=0.65; r3=0.66942; In accordance with the experiments and benchmarksr4=2.866; r=2.92056; data, the fuel was modeled, which burnup and storage
fuel without gadolinium rl=0.55; r2=0.65; time are presented in the Table 3.r3=0.66942; r4=2.866; r5=2.92056. Generally, it can be mentioned that according to the
calculations carried out by ORIGEN-ARP, the
All the above-mentioned in sections 31 and 32 is correctness of the used models and libraries wasrelated to the conditions of modeling a fuel assembly as demonstrated. Results have negligible deviation froma whole, i.e. calculations of isotopic content averaged the benchmark data. Coincidence with the experimentby FA are concerned. Experimental data of isotopic data is worse, but one should remember that it'scontent were obtained for individual fuel rods; in so impossible to take into account the real fuel pinsdoing, location of these fuel rods in the FA lattice position in the assembly while experiment conditionimpacts on their isotopic composition. In the above modeling with the help of ORIGEN-ARP. It canregard, the experiments should be modeled taking into involve the additional deviations.
- 724 -

JAERI-Conf 2003-019
Table Deviation of calculation results from Table 3 Experiments and benchmarks data inexperiment and benchmarks data for VVER-440 fuel reference to the bumup and the storage time of fuel.
Comparison with Comparison with Bumup, Cooling time, yearsexperiment benchmarks VVER MwtD 1-1
234u -10.2% Exp. Bench. ench.
235U 4.5% -0.8% 440 8.7-54.8 3040 0-5
236U -2.3% 4.0% 1000 16.1-17.2 0-40 0
238u -0.2% -1.6% It should be underlined that the available results of237NP 3.2% experimental assessment of VVER spent fuel isotope
239PU -12.7% -0.9% composition and calculational benchmarks data don't
23'Pu 3.2% -3.2% allow to provide the full ORIGEN-ARP libraries24OpU -1.6% -1.4% testing for all the isotopes chosen for the burmip credit241 Pu while analysis of storage and transportation systems
18.9% 0.5% criticality. So, by the moment, the criticality242pu 17.5% 7.2% assessment for VVER spent fuel management systems
241,4M - 4.1% with "bum-up credit" approach can be fulfilled only243,4 taking the fissionable isotope concentration into
,M 79.4% 11.5% account.95MO 0.4%
99TC 0.9% 5. Conclusion
10'Ru -0.8%103F Analysis of the results permits the followingth 3.2% conclusions:
109Ag 12.5%133cS 2.5% 1. ORIGEN-ARP sequence pen-nits sufficiently
accurate determination of isotopic143 Nd 0.2% composition of VVER440 spent nuclear145Nd 0.9% fuel.
147sM 3.0% 2. The most comprehensive testing based on
149sM -5.3% independent sources including both
150SM 13.6% experimental results and calculational
151SM 15.1% benchmarks has been conducted for 235U,
152SM 14.1% 236U, 238U, 239Pu, NON, 24IPu, 242Pufuel elements.
153Eu 0.3% 3. While experiment condition modeling with
155 Gd -35.8% the help of ORIGEN-ARP, it is impossible totake into account the real fuel pins position in
Table 2 Deviation of calculation results from the assembly. That creates additionalexperiment and benchmarks data for VVER I 000 fuel inaccuracy. SAS2H control module usage is
Comparison with Comparison with more reasonable for this purpose.experiment benchmarks 4. The usage of control module SAS2H
234u -17.0 - altogether with the 44GROUPNDF5 library
235u -2.6 -0.9 can be recommended for the ORIGEN-ARP236u library preparing for the further VVER-440238u -19.5 17.9 and VVER-1000 spent ftiel composition
0.2 0.0 calculation.
238pu -31.3 -
239PU -11.9 -3.9 Acknowledgements
24ON -12.6 -0 I The authors are grateful to the US Government for
24 'Pu -15.1 4.0 financial support in realization of this work.242PU -15.1 12.7
24 'Am -81.6 - References24 Am 40.8 -149sM 1) Y.Kovbasenko, VKhalimonchuk, A.Kuchin,1 5 - 1.0 Y.Bilodid, M.Yeremenko, O.Dudka "Validation of
5Gd 0.0 SCALE sequence CSAS26 for criticality safety
- 725 -

JAERI-Conf 2003-019
analysis of VVER and RBMK fuel designs"NUREG/CR-6736, PNNL-13694,2002.
2) Y.Kovbasenko, Y.Bilodid "Study of Local PowerDistribution in Fuel of VVER I 000 Reactors withSCALE-4.3", Sixth International Conference onNuclear Criticality Safety (ICNC'99), Proceedingv.11 1, p. 104-1113, September 20-24, 1999, France.
3) SCALE: A Modular Code System for PerformingStandardized Computer Analysis for LicensingEvaluation, NUREG/CR-0200, Rev. 6(0RNL/NUREG/CSD-2R6), Vols. 1, 11, and III,May 2000. Available from Radiation SafetyInformation Computational Center at Oak RidgeNational Laboratory as CCC-545.
4) S. M. Bowman, L. C. Leal. ORIGEN-ARP:AUTOMATIC RAPID PROCESS FOR SPENTFUEL DEPLETION, DECAY, AND SOURCETERM ANALYSIS. Oak Ridge Nad. Lab., 2000.
5) 0. W. Hermann, C. V. Parks. SAS2H A COUPLEDONE-DIMENSIONAL DEPLETION ANDSHIELDING ANALYSIS MODULE. Oak RidgeNati. Lab., 2000.
6) A. Herman, W. M611er "Bestimmung derAbhangigkeit von Nuklidgehalten in VVER440Brennstoff nach rechnerischen und experimentellenMethoden", Kemenergie 27 1984), p. 255.
7) B.Bibichev, V. Mayorov, Yu. Protasenko P.Fedotov "Measuring fuel burnup, and U and Pucontent in FA for VVER440 as regards activity of134Cs, and 137Cs"- Atomic Energy, 1988, v. 64,issue 2 p. 147 (in Russian).
8) A.Stepanov, T. Makarova, B. Bibichev, et al.Determination of bumup, and isotopic compositionof SNF from VVER440. -Atomic Energy, v. 55,issue 3 September, 1983 (in Russian).
9) Kravchenko Yu.N., Polyakov Yu.N., Aleshin S.S.BENCHMARK CALCULATION OF FUELBURNUP AND ISOTOPE COMPOSITION OFVVER440 SPENT FUEL. 8th AER Symposiumon VVER Reactor Physics and Reactor
IO) L. Markova. Calculation Burnup Credit BenchmarkNo.2 (CB2). 7th AER SYMPOSIUM on VVERReactor Physics and Reactor Safety Homitz nearZittau, Germany, Sept. 23-26,1997
1 1) L.Markova. C132 Result Evaluation (VVER-440Bumup Credit Benchmark). 7th AER Symposiumon VVER Reactor Physics and Reactor, Slovakia,October 48, 1999
12) A. Tataurov, V. Kvator. R&D Report.Calculated-experimental studying nuclidecomposition of SNF from VVER- I 000, andRBMK I 000. RNC "KI", 2002 (in Russian).
13 A VVER I 00 LEU and MOX AssemblyComputational Benchmark. Specification andResults. OECD 2002.
14) Y.Bilodid, M.Yeremenko, Y.Kovbasenko.TESTING THE SAS2H SCALE CONTROLMODULE ON VVER TYPE FUEL. AbstractNo 2 ICNC2003
- 726 -

JAERI-Conf 2003-019
TOPIC
ASSESSMENT OF CRITICALITY ACCIDENT

This is a blank page.

JP0450136JAERI-Conf 2003-019
Development of INCTAC Code forAnalyzing Criticality Accident Phenomena
Susumu MITAKE*, Yamato HAYASHI" and Shungo SAKURAI**
Institute ofNuclear Safq� NUPEC
17-1 Toranomon 3-chome, Minaloku, Tokyo 105-0001, Japan
Aiming at understanding nuclear transients and thermal- and hydraulic-phenomena of thecriticality accident, a code named INCTAC has been newly developed at the Institute ofNuclear Safety. The code is applicable to the analysis of criticality accident transients ofaqueous homogeneous fuel solution system. Neutronic transient model is composed ofequations for the kinetics and for the spatial distributions, which are deduced from the timedependent multi-group transport equations with the quasi steady state assumption.Thenno-hydraulic transient model is composed of a complete set of the mass, momentumand energy equations together with the two-phase flow assumptions. Validation tests ofINCTAC were made using the data obtained at TRACY, a transient experiment criticalityfacility of JAERL The calculated results with INCTAC showed a very good agreement withthe experiment data, except a slight discrepancy of the time when the peak of reactor powerwas attained. But, the discrepancy was resolved with the use of an adequate model formovement and transfer of the void in the fuel solution mostly generated by radiolysis. Witha simulation model for the transport of radioactive materials through ventilation systems tothe environment, INCTAC will be used as an overall safety evaluation code of the criticalityaccident.
KEYWORDS. INCTA C, criticality accident, safety evaluation, aqueousfuel solution,multi-group transport equations, validation test, radidlysis void, T,4CY
1. Introduction2. Development of INCTAC
With the JCO criticality accident in 1999 a need forstudying criticality accident was greatly increased. 2.1 Basic RequirementsParticularly, from the view point of safety evaluation The code should be applied for analyzing theof the fuel reprocessing plant, its commercial plant is nuclear transients and thermal- and hydraulic-now under construction in Japan, the analysis of the phenomena of the criticality accident postulated fornuclear transients and thermal- and hydraulic- the ftiel solution system. The transients will be veryphenomena of the criticality accident postulated for rapid and short in those cases generally postulated, butfitel solution system has become one of important will continue for a couple of minutes or hours underitems to be studied. some uncommon conditions. For completing the
A study of the criticality and thermo-hydraulic safety assessment of the accident, the analysis ofphenomena of the JCO accident was made with a behavior and transport of radioactive materialssimplified model of the point reactor kinetics including fission products generated by the chainincluding temperature and void reactivity coefficients reactions should be included too. But, analysis ofand models for void dissipation and heat removal.') A mechanical failure of components, which might becouple of noteworthy study items were obtained from caused by the accident, will be excluded, and anthe study: behavior of radiolysis void and heat transfer extended change of the boundary conditions, such ashave important influences in determining the deformation of fuel solution vessel, relocation of fuelneutronic kinetics in short and long ranges of the solution or additional heating up by any other cause,transient respectively, use of reactivity coefficients is will not be considered.not preferable because of complicated thermo-hydraulic phenomena during the transient and 2.2 Model and Equationsdifficulty of coefficient evaluations, and nuclear cross 2.2.1 Neutronic Modelsections and their changes in the system should be Two basic equations, the time-dependent transportdirectly treated in the analysis. equation for the neutron flux (the Boltzmann transport
Corresponding author, Tel: 81-3-4512-2773, Fax: 81-3-4512-2799, E-mail: MITAKE�nupec.orjp.On loan from TOSHIBA CORPORATION.
- 729 -

JAERI-Conf 2003-019
equation) and the time-dependent equations for the models based on the quasi-steady state approximation.delayed neutron precursor densities, are used. This module is based on two-dimensional discrete-
With the assumption that the time-dependent ordinate method code TWODANT developed at4)neutron flux distribution is described as a product of LANL .
the amplitude and the shape functions, the numerical 2.3.3 Thermal- and Hydro-Dynarnics Modulesolution method based on the quasi-steady state Numerical analysis of the thermo-hydraulic modelapproximation is applied. The amplitude function is is embodied with TRAC code, which has beendetermined with the equation for the point reactor developed at LANL and used widely in thekinetics with appropriate coefficients, which are liquid-gaseous two-phase flow analyses. The senii-deduced for each term in the basic transport equation. implicit method is applied for numerical integrations:The time-dependent equation for the normalized value the pressure propagation and the liquid-gaseous phaseof the delayed neutron precursor density is also interactions which have a relatively short time scale inobtained. The shape ftinction is determined with the their changes, are treated by the implicit method,equation similar to the basic time-dependent transport whereas the propagations of mass, momentum andequation under the normalization constraint. energy, or the convection terms, which have a2.2.2 Thenno-Hydraulic Model relatively long time scale in their changes are treated
The two-phase flow model with two components, by the explicit method.liquid and gaseous phases, is applied, and a set of the In the TRAC code, in addition to the evaporatedsix differential equations for mass, momentum and vapor, incondensable gases can be treated in theenergy is prepared. An additional set of the equations gaseous phase, and this feature is very useful in theto determine the momentum and energy transfer analysis of criticality accident, where a large amountbetween the phases, and the laws to describe the of the radiolysis gases will be generated. Models forfriction loss and the heat transfer at wall surfaces is describing the radiolysis gas generation arealso used. Because a very wide change of two-phase additionally prepared.conditions, from liquid to gaseous, is expected during 2.3.4 Cross-section Preparation Modulethe transient, many different modes of the ffiction loss All neutron cross-sections to be used in the reactorand the heat transfer for the two-phase flow should be dynamics module are prepared in the cross-sectionconsidered in the thermo-hydraulic models. preparation module with fitting functions. Fuel
solution is the major component or material to be
2.3 Structure of INCTAC considered in the criticality accident analysis, and itsneutronic characteristics are generally dependent on
2.3.1 Overall Structure the temperature and the density, and additionally on
The INCTAC code is composed of a couple of the ftiel or fissionable nuclides concentration whenmodules corresponding to the analytical models, and intense evaporation is expected.these modules are connected and operated on a The neutron cross-sections of structure materialsParallel Virtual Machine (PVM) under the regulation and control rods are also prepared in the cross-sectionof the master control module as shown in Figure 1. preparation module, but their dependencies on the
The PVM is developed at ORNL 2) and other thermal and hydraulic conditions are not considered.institutes for realizing the parallel processing on a Preparation of the original cross-section data usingnon-parallel computer, and is used in the INCTAC the SCALE4.4 systems , and generation of thecode for linkage of the analytical modules. fitting functions using the least square method is also
The master control module makes overall control, integrated into the module.but the data necessary for calculations in each module 2.3.5 Fission Product Analysis Moduleare directly transferred between the analytical modules. To evaluate the radiation source term to theThe calculated results are stored as database for later environment, the fission product analysis module isoutput and retrieval. prepared to calculate the amounts of the fission2.3.2 Reactor Dynamics Module products during the criticality accident. Widely used
The reactor dynamics module is composed of two point depletion code RIGEN 6 i used.sub-modules: amplitude function module and shape 2.3.6 Overall Controlfunction module. As shown in Figure 1, the operation of the
In the amplitude function, or reactor kinetics, INCTAC code is regulated with the master controlmodule, the reactivity for whole reactor is evaluated module. The module has two key functions ofwith the angular fluxes and the adjoint angular fluxes controlling the analytical steps: control of theand then the power of reactor is calculated. This subordinate process modules and control of the eventmodule is developed based on the Kaganove's method time. The former control function includes the
3)used in the TRAC-PF I code. selection of the analytical modules and the direction of
In the shape ftinction module, the angular fluxes, their start-and-stops, and the latter monitor the datathe reactor power distributions and the fission rates for generated by each analytical module and controls thewhole reactor are calculated with the analytical time progression.
- 730 -

JAERI-Conf 2003-019
2.3.7 Database and the trend section to store the calculated resultsThe results calculated in the reactor dynamics during the transient.
module and in the thermal- and hydrodynamics The database can be handled similar to ordinarymodule and the applied calculation conditions are used one, and the functions of 'add,' 'delete,' orstored into the database. Member of the database 'retrieval' of the data is provided. Printing or plottingcorresponding to each calculation case is composed of of the data is also possiblethe header section to store the calculation conditions
USER
INTERFACE
MASTER . . . . . . . . .. . . . . . . . . .
CONTROL ... . . . .Foss-. . . . . . . . . . . . . . . . . . .. . . . . . . . . MODULE
. . . . . . . . . . . . .. . . . . . . . . . :::AAal. . . . . . . . . . .
.. . . . . . . ..... . . . . . . . . . . . . . . . . . .. . . . . . . . . . . . . . . .�A. . . . . . . . . Subordinate :DyirinWs:::::::. . . . . . . . . . . . . . . . . . . . .. . . . . . . . . . m odule:::::. - . . . . . . . . .. Fission.. . . . . . . . . 1� ::Process K044
ProductsControl
. . . . . . . . . . . . . . .Void
Density,Power Temper-
. . . . . . . . . . atureEvent. . . . . . . . .. . . . . . . . .. . . . . . . . Tim e .. . . . . . . ..... . . . . . . . . . . . . . . . . . .. . . . . . . . . . . . . . . . . . .. . . . . . . . . . Control bai:....... . . . . .
. . . . . . . . . . C. . . . . . . . . . . . . . . .. . . . . . . . . . . . . . . .. . . . . . . . . . . . . . . .. . . . . . . . . . . . . . . .
Fig. Module structures and calculation flows of INCTAC code.
3. Validation Tests and observed results were available in the databookpublished recently, and the validation tests of
3.1 TRACY Experiments INCTAC were made for a couple of experiments of
3. 1.1 Outline of Facility different experiment conditions.
TRACY is a JAERI's transient experiment critical 3.1.2 Data Preparationfacility, and is used for the study of transient The analytical model of TRACY is schematicallyphenomena under the supercritical condition of uranyl shown in Figure 2 The reactor-tank is made ofnitrate solution: to confirm the safety margin included stainless steel (SS) and the absorption material ofin the safety evaluation of the critical accidents borated carbon (134C) is used in the transient-rod.postulated in a fuel reprocessing plant. TRACY Cover gas of the fuel solution in the reactor-tank is air,attained its first criticality in December 1995.The but is replaced with aluminum (Al) in the model forreactor core of TRACY is an annular tank of 50 cm in preventing too slow convergence of the neutron
diameter and the aqueous solution of uranyl nitrate of fluxes.IO enriched. At the central hole of 7 cm in diameter, To complete the transient calculation within ana transient-rod is equipped. acceptable computation time, as small as nine neutron
energy groups were used, and the atomic numberThree different methods of reactivity inserting are densities of the fuel solution were calculated using the
provided: ramp or pulse withdrawal of the formula of Moeken.') Determination of the fittingtransient-rod and fuel solution feeding. functions and regeneration of the cross-section data
Details of the facility and the experiment conditions
- 731 -

JAERI-Conf 2003-019
with the fitted functions were precisely examined andtheir applicability were confirmed. lo,
RunI09The parameters for reactor kinetics, such as delayedneutron fractions, decay con stants of the precursor lo, ....... .............. ...... ...... ..... ...................... .... ..... ......... ........ .... ..... ........ . .... ............. . ..............
nuclides and energy spectra of the delayed neutrons, INCTAC 2000)were also prepared with appropriate calculation MCTAC (001)l o , . . ............ .. .. . ....... .. ... ... .... .................. ............... .... .... ........ ... ......... .....
models and data including fel conditions.Observed
VI
lo-
Transie -61.9Reactor-rod 4.9 "OV4"p 4 -06
1 0 , - - - ........................... .... ................. .. ............ ............ . ................. .
.0 tank
4 2 0...... ........ . ..... . ...... . ....... ........ ... ..... .............. ............ ............ . .... ........................ ..... .
Air Air
(A l) (A l) 1000 ......... . ....... . ... ... ... ..... ............ - ........................ .....
100 . . . . . . . . .
0 2 4 6 8 10
Time in Sec
Fig. 3 Power transient of Run No. 109.
........... ............................ ... 80.0 3.3 Fuel Solution Feeding
. .. . . . . .. . ........ TRACY Run 163, one of the fuel solution feeding
6�3 experiments, was made at July 4th, 2000. The fuelIq-3 solution was fed at the rate of 60 liter/min, or the
500.0 ------ solution level rising at about mm/sec, for the520.0 duration of about 34 seconds, and the inserted
Unit in mm (not in scale) reactivity was integrated to 125 .The calculated result of the INCTAC 2001) code
Fig. 2 Analytical model for the TRACY was shown and compared with the observed result inexperiments: annular reactor-tank and transient-rod Figure 4 A very good agreement with the observedat the center. transient for the shape and level of the power after the
initial short transient was obviously indicated.
3.2 Transient-rod Ramp WithdrawalTRACY Run 109, one of the transient-rod ramp
withdrawal experiments, was conducted at November RunI63
10th, 1998. The rod was withdrawn at the speed oflo , . ... . ..... . ..................... ............................... .. ..... .......... .... ...... ........ ..... .......
875 cm/min, and the integrated reactivity of 297 INCTAC 200 )$ was inserted in 7 seconds. lo, . .... .......... ....... ......... .. ........... O b ser e d.... .... .. .................. .. ..... ..... ..........
The calculated results of the INCTAC code wereshown and compared with the observed one in Figure3. Using the INCTAC code at the development stage Io, ................... .of 2000 a relatively good agreement of the calculation - ------an d th e o b servatio n w as con firm ed for th e o v erall 104 .. ... ... ........ ... .... ...... .................... ......... ..... .................. .... .......................................... ..... .
transient, except a slight discrepancy of the time when 0.4
the reactor pow er reached its peak and the sh ape by 1000 ........... ......... ..... ..... ..... .. .. ... ...... .......................... .. ... .. ............... ...............which the power was declining after the peak. Aninadequate model for the hydraulics or the behavior of
1 0 0 .. ...... ..... .. .. ... .... .... ........... ... ............................. ........ .............radiolysis voids was thought as a cause of thediscrepancy. And, the more precise model for thethermo-hydraulics described in sections 2.2.2 and 102.3.3 was programmed. As sown in the figure, the 0 5 10 15 20 25 30
improved result with the INCTAC (2001) code Time in Secshowed a very good agreement with the observed Fig. 4 Power transient of Run No. 163.results for the timing of peak power and the shape oftransient.
- 732 -

JAERI-Conf 2003-019
4. Further Development the environment, NCTAC will be used as an overallsafety evaluation code of the criticality accident in the
4.1 Long-sustained Transients near future.
Long-sustained transient experiments, up to five Acknowledgementshours, were conducted for the ftiel solution feeding The authors would like to thank Tomohiro Sakaicases. and Riichiro Okawa of Te Japan Research Institute
Simulation of theses experiments will be useful for for their extensive work in developing the INCTACvalidation study of the thenno-hydraulic models code.including heat removal mechanisms and void transferbehaviors under higher temperature and evaporationconditions. And also to be studied in the simulation of Referencesthe long-sustained experiments is the generation and 1) S. MITAKE, et al., "Analytical Study on theaccumulation of fission products in fuel solution, Criticality Accident at Uranium Processing Plant,which might be a source of the radioactivity haza d (1) Analysis of Added Reactivity and Criticalitywith criticality accidents. Transients," J. At. Energy Sc. Japan, 42, 1079
(2000).
4.2 Overall Safety Evaluation 2) PVM homepage,http:Hwww.epm.ornl.gov/pvm./pvrn - home.htmi.
Safety evaluation of the criticality accidents is one 3) J. J. Kaganove, "Numerical Solution of theof the important study items where the INCTAC code One-Group Space-Independent Reactor Kineticswill be applied. For this purpose, physical and Equations for Neutron Density Given the Excesschemical models of analyzing the radioactive material Reactivity," ANL-6132 1960).and fission product transfer from fuel solution to 4) "DANTSYS3.0 I D, 2-D MultiGroup Discreteupper covering space, and simulation models of Ordinate Method Transport," RISCC Computerpredicting radioactivity release to the environment Code Collection CCC-547 1997).through cover gas treatment and ventilation systems 5) "SCALE: A Modular Code System for Performingshould be integrated to the code. Standardized Computer Analyses for Licensing
Evaluation," NUREG/CR-0200, Rev.65. Conclusion (ORNL`NUREG/CSD-2/R6),(l998).
6) A. G. Croff "A User's Manual for the ORIGEN2Aiming at understanding the nuclear transients and Computer Code," ORNL/TM-7175 1980).
thermal- and hydraulic-phenomena of the criticality 7) "TRACY TRANSIENT EXPERIMENTaccident, a numerical analysis code named INCTAC DATABOOK," JAERI-Data/Code 2002-005 towas newly developed at the Institute of Nuclear -007 (2002).H. H. Ph. Moeken, Anal. Chim. Acta.,Safety. 44, 225 1969).
The code is applicable to the analysis of criticalityaccident transients of the aqueous homogeneous fuelsolution system. The neutronic transient model iscomposed of the equations for the kinetics and for thespatial distributions, which are deduced from the timedependent multi-group transport equations with thequasi steady state assumption. The thermo-hydraulictransient model is composed of a complete set of themass, momentum and energy equations together withthe two-phase flow assumptions.
The validation tests of INCTAC were made usingthe data obtained at TRACY. Both the transient-rodramp withdrawal at its nearly maximum speed and thefuel solution feeding at a fixed rate were simulatedand studied. The calculated results with INCTACshowed a very good agreement with the experimentdata. A slight discrepancy calculated with an earlierversion of the code for the time when the peak ofreactor power was attained was resolved withapplication of the adequate model for movement andtransfer of the void in the fuel solution mostlygenerated by the radiolysis process.
With simulation models for the transport ofradioactive materials through ventilation systems to
- 733 -

JAERI-Conf 2003-019 JP0450137
Modelling Transient 3D Multi-phase Criticality in FluidisedGranular Materials - The FETCH Code
CC Pain, J L. M. A. Gomes, M. D. Eaton, A. K. Ziver A. Umpleby, C R. E. de Oliveira, A. J. H. GoddardImperial College ofScience, Technology and Medicine, Computational Physics and Geophysics,
Earth Science and Engineering, Prince Consort Road, London, United Kingdom.
The development and application of a generic model for modelling criticality in fluidised granular materials isdescribed within the Finite Element Transient Cticality (FETCH) code - which models criticality transients inspatial and temporal detail from fundamental principles, as far as is currently possible. The neutronics model inFETCH solves the neutron transport in full phase space with a spherical harmonics angle of travel representation,multi-group in nutron energy, Crank Nicholson based in time stepping, and finite elements in space. The fluidsrepresentation coupled with the neutronics model is a two-fluid-granular-temperature model, also finite elementfased A separate fluid phase is used to represent the liquid/vapour/gas and the solid fuel particle phases, respcc-tively. Particle-particle, particle-wall interactions are modelled using a kinetic theory approach based on ananalogy between the motion of gas molecules subject to binary collisions and granular flows. This model hasbeen extensively validated by comparison with fluidised bed experimental results. Gas-fluidised beds involveparticles that are often extremely agitated (measured by granular temperature) and can thus be viewed as a par-ticularly demanding application of the two-fluid model. Liquid fluidised systems are of criticality interest, butthese can become demanding with the production of gases (e.g. radiolytic and water vapour) and largefluid/particle velocities in energetic transients. We present results from a test transient model in which fissilematerial (139pU) is presented as spherical granules subsiding in water, located in a tank initially at constant tem-pemture and at two alternative over-pressures in order to verify the theoretical model implemented in FETCH.
KEYWORDS. Criticality, multi-phase; granular materials; coupledmodels;fluidised bedreactors.
1. Introduction clear waste with traces of fissile materials.
Imperial College has developed a D modelling The aim of this paper is to present a summary ofcapability in its FETCH' code to solve nuclear criti- the basis and applications of the fluidised granularcality problems in fluidised granular materials. criticality model. In particular a representative testFETCH has already been validated against transient transient model has been set up to verify the theoreti-criticality experiments in multi-phase solutions. We cal model implemented. We have explored criticalitypresent a summary of the basis and applications of the transients due to solid granules taking into accountnew fluidised granular criticality model, in particular their surroundings in a coupled neutronics/two-fluidsthe fluids model, which has recently been imple- model'.mented in FETCH. It has been found that themulti-fluid approach to modelling of granular materi- The neutronics part of the granular fluidised tran-als is often the only feasible approach2. The alternative sient criticality models is based on the solution of'Discrete Element Method' may not treat sufficient seven-dimensional space using the second-order evennumbers of particles and for sufficient long time peri- parity form of the transport equation 4 A six-energyods and therefore it may not present a feasible option. group scheme was used in transient calculations,
which were derived from the cell code WtMS5 usingThe granular criticality model implemented within the 69 group library, taking into account resonant self
FETCH is proving to be particularly flexible and use- shielding and particle (granules) spatial effects in-ful as demonstrated by its application to a range of cluding neutronics properties of its surroundings. A setproblems from, modellin new nuclear reactors whose of cross sections were generated for various tempera-fuel is in granular form modelling pebble bed nu- tures and these are used to obtain, using a temperatureclear reactors, to modelling the ingress of powder into interpolation procedure, the local cross section formoderating water and the study of collapse of granular each element of the finite element spatial mesh.material in water. The lattcr two scenarios may in-volve the production of steam along with an increase In the two-fluid models (TFM) presented, both phasesin pressurisation of the system. Modelling of pressure have been represented with separate density, tempera-is particularly important as this can provide useful ture and velocity fields. The interaction terms haveinformation about the integrity of containers of nu- been used to represent the coupling between phases.
Corresponding author, Tel. 44-20-7594-9321, Fax. 44-20-7594-9341, E-mail: c.pain�impefial.ac.uk
- 734 -

JAERI-Conf 2003-019
The TFM requires additional closure laws to describe are neglected. The corresponding momentum equationthe rheology of the particulate phase, which are based is for again k=gas and k=liquid/gas phases:on the assumptions of kinetic theory of granularfloWS6 . To avoid empirical correlations'-" beingused for the rheology of the granular phase, in the a a (Ekpkvkivkj)=proposed model the solid viscosity and the normal (Fkpkvki)+ ax.stress are derived using an analogy between the parti-cle-collision during the granular flows and the gaskinetic theory. Hence, the concept of granular tem- 0perature as a measure of the agitation of particles was 9 +introduced. The granular temperature is therefore, a k ax. 'Vk6ilink between the kinetic theory and conventional fluid (2)mechanics. The set of TFM conservative equationsthat describes the gas-solid flow and additional clo- P(V v Vsure laws are given in Pain et a."O where more de- k'i ki kij k kitailed information is available. In this paper, we de-scribe the granular fluids model developed, some ofthe approximations made and present results from a In equation 2), the first and second terms are relatedtest transient criticality study. to buoyancy and gravitational forces and gi is the
component of gravity in the ith direction, k' denotes2. The Two-Fluid Granular Model the opposite phase, p, is the shared pressure and is2.1 Governing Equations the friction coefficient and is obtained from a modi-
fied form of the Ergun equation. The wall-particleThe governing equations 8solved here are the two fluid boundary conditions are applied as described in refer-equations with separate phases for the gas and the ence 3 The third and fourth terms are, respectively,particle (solid) phases. In each phase, conservation the interaction force representing the momentumequations for continuity, namely mass, momentum, transfer between the fluid and the solid phases and theenergy and volume fraction are solved, which are stress tensor. The last term represents the frictionalcoupled to suitable equations of state - ideal gas for force exerted by the phase k on the wall.the gas phase, and incompressible for the particlephase. In the solid phase, the particle-particle interac- The thermal energy equations are described as:tions are modelled using a kinetic theory based on thegranular temperature, which represents the width ofthe Maxwellian distribution of particle velocities. (Cf Ef pf T -p (F + (E
Solid particles representing the fissile material are at f f a. f fi ax Siassociated with the solid phase and its neutronicsproperties, like delayed neutron precursor concentra-tions, are advected with the solid particle phase.,The Ifffliquid phase (water) and gas are treated together. +- (E K - )+a(T -T )+L2ax. f f ax. S f wf
The continuity equations for phase k, where kg de- (3)notes liquid/gas phases and ks denotes solid particlesare:
(3TS +(CsFspsT S ( IC
0 at ax. S S ax4a ('kpk ) ('kpkvki (1)9t ax.
ct(Tf - T S) + fl WsWhere Pk and k are the density and volume fractionof phase k, Vki is the velocity of phase k in the j1h di-rection, t is the time and xi is the spatial coordinate in The last three terrns in the right hand side of equationsthe i1h direction. The first term on the left-hand side of number 3) represent the thermal energy transferredequation (1) which is written for k=solid and by conduction, convection and between phase k andk=liquid/gas phases are related to the rate of mass the wall respectively.accumulation per unit volume and the second term We have defined the solid fluctuation energy equationrepresents the net rate of convective mass flux. In the for smooth slightly inelastic and spherical particlesformulations presented here mass and heat generation representing the granules as:due to chemical reactions and radiative heat transfer
- 735

JAERI-Conf 2003-019
2.2.2 Fluid Phase Dnsity3 a- - (6 0 + (E 0) The density of the water-steam system was obtained2 6 t S S ex. S S Si through an empirical equation of state 9 for 0 IO ZPZ
9000 bars and 273.15 T 1273.15 K. For largeov Si aqf (4) pressures and temperatures, a fitting curve based on a
+ T - - - _ - 3PO modified Redlich-Kwongio equation of state was used.Sj ax ax
i i 2.2.3 Stress Tensor
Where the granular terriperature is expressed as: The gas-phase turbulence has been neglected in themodel used in this work. This is due to the uncer-tainty in the turbulence model closures and large gasphase space turbulent suppression in densely packed
3 1 2 beds. Either a constant viscosity which equals the gas0 C (5) viscosity is used or a larger viscosity to act as an eddy
2 2 viscosity. In densely packed beds, the solid stressesare dominated by inter-particle friction rather than bycollision or fluctuation motion 3.
The second, third and fourth terms on the righthand side of the equation 4) represent the diffusive 2.2.4 Solid Phase Pressureflux of granular energy, the rate of granular energydissipation due to inelastic collisions, and the transfer The solid phase pressure, p,, represents the solid-phaseof granular energy between the fluid and solid phases. normal forces due to particle-particle interactions andThe granular temperature, 0, is proportional to the can be written in two parts representing (1 a kinetic'granular energy' of the continuum, defined as the and 2) collisional contributions:specific kinetic energy of the random fluctuationcomponent of the particle velocity. Here, C is the av- Ps = ESP 2erage of the sum of the fluctuating granular particle SO 2vr PO(l + e PO (6)velocity components.
2.2 Constitutive Equations and Empirical Correla- In 6), v is the radial distribution function and epp istions the particle collision coefficient. The kinetic part is
expressed by the first term on the right hand side of
The conservative equations described in the previ- the equation by the shear stress caused by the flow ofous section comprise a number of variables that are granules (or particles). The second term is the colli-defined by specific functions. These functions are es- sion contribution due to the momentum transferredtablished either by fundamental equations or by em- between particle collisions.
pirical or experimental correlations. In this section, we 2.2.5 Solid Phase Shear Viscositybriefly describe them below. Interested reader shouldconsult reference 3 for more detailed information. Several empirical correlations were developed to cal-
2.2.1 Drag Coefficient culate the solid shear viscosity, � , most of them aresuitable for densely packed beds, however they differ
The momentum transfer between the fluid and solid in dilute regions. We have used the relationship re-phases, is usually obtained experimentally from ported by van Wachem ".
pressure drop experiments and there are several corre- 2.2.6 Solid Phase Bulk Viscositylations available in the literature, acquired from fixedor fluidised beds operating with either gas-liquid, The solid bulk viscosity can be defined as the resis-gas-solid, or solid-liquid systems. Many of these cor- tance of the particle suspension against compression.relations are valid for a wide range of granular diame- 12ter and porosity. In the present work, we have used a This relationship has been taken from Lun et al.
hybrid equation that applies to the Gidaspow's corre- 2.2.7 Inter-phase Heat Transferlation for a range of porosity, and a swarm-correctedsingle particle drag law for volume fractions less than The inter-phase heat transfer is defined as the tem-0.2, as suggested by Pain et al.' perature gradient between theoretical fluid-layer along
the surface and the surface itself. We have used the
- 736 -

JAERI-Conf 2003-019
volumetric inter-phase heat transfer coefficient to rep- Group cross sections were then obtained for tempera-resent uniformly sized granules. The fluid/particle tures ranging from 550K to 2000K by condensing toheat transfer coefficient was represented by Gunn 314 six groups the standard WIMS 69 group library.and used in this work. His expression represents theNusselt number as a function of the local flow dy- 4. Resultsnamics, represented by the granular Reynolds number.The then-no physical properties of the fluid phase are 4.1 Test Problem Descriptionexpressed by the Prandtl number. This model is accu-rate for the large volumetric heat transfer coefficients A test case has been set up to illustrate the applicationas the temperature differences between the phases of the coupled neutronics - granular two-fluid modelremain small. in FETCH. The test case is a cylindrical 'tank'
bounded by a solid material which does not interact2.2.8 Thermal Conductivities neutronically. Fissile material in solid granules is al-
lowed to collapse under gravity in the water untilThe conductive mechanism is concerned with the criticality is achieved somewhat above the 'fully' col-thermal diffusion through a phase. In the fluid phase, lapse condition with the conditions chosen the initialthe conduction is a function of the thermo-physical temperature feedback of reactivity will be positive.properties, whereas in the solid phase, the in-ter-particle collisions and granular bulk formation 4. 1.1 Geometry and Materialsprovide an additional effect. We have used the correla-tion suggested by Hunt 1 5to represent thermal conduc- The cylinder has a radius of 20.0 cm and the a totaltivities. height of 200cm and is filled with water. The Pu-239
concentration in granules is chosen so that in the ide-3. Neutronics alised fully slumped condition the excess reactivity
would be 2. The initial temperature is taken to beThe Boltzmann neutron transport equation is solved 40.0 degrees C. The tank is open at the top (fluids areusing finite elements in space, spherical harmonics allowed to escape freely). The spherical granular par-(PN) in angle, multi-group in energy and implicit two ticles of uniform diameter 25 cm are represented as alevel time discretization methods. These methods have homogeneous mixture of Pu-239 fissile isotope inbeen applied using the second-order even-parity varia- SiO - representing a medium which does not interacttional principle in the EVENT4 computer code. Its neutronically.lowest mode of angular resolution is equivalent todiffusion theory.At each time-step the interface module organizes thefeedback from FLUIDITY of spatial temperature,density and delayed neutron precursor distributionsinto the EVENT neutronics module and also, in thelight of these fields, updates the spatial distribution ofmulti-group neutron ross-sections.- For a given ele-ment of the finite element (FE) mesh, a cross-sectionset is obtained by interpolating in temperature and gascontent a cross-section data-base. This database hasbeen group-condensed taking into account resonanceself shielding and thermal temperature effects, into sixgroups using the WIMS8A code 16 and a representativegeometry. The neutronics module generates, forFLUIDITY, spatial distributions of fission-power anddelayed neutron generation rates.
Material cross sections are generated as follows usingthe lattice cell code WIMS8A. First the cross sectionswere self-shielded using the equivalence theorymethod in WHEAD (part of WIMS) which relates theheterogeneous problem to an equivalent homogeneous Fig. I Schematic of the geometrical model showingmodel. A subgroup resonance calculation was then the cylindrical tank and the volume fraction (right)performed using the WPROC (part of WIMS) colli- solid temperature contours (left) after the transientsion probability routine which calculates collision took place (0.2s) and for 60 bars over-pressure. Alsoprobabilities using a synthetic approximation for a shown is the inner and outer boundaries of the solidsystem of spherical grains packed in annular geometry. material
- 737 -
JAERI - Conf 2003-019
4.2 FETCH Predictions
Transients have been initiated at two over pressures ofI bar and 60 bars to illustrate the initial effectover-pressure in suppressing boiling.
'2)0. D
4.
3. 1).+2t 4
2 N). M .. . ....... ............................................ . . .... ...... ....... .... ..
3. t4 D. 8 '.24
Fig. 4 Variation with time of the maximumsolid-phase temperature in the FETCH model for 60bar and I bar over-pressure.
O.Ot 0.36 0.12 0.18 0.24
SCO.C
Fig. 2 Variation with time of fission rate in theFETCH model for 60 bar and I bar over-pressure.
6COA
IL
40.0 F
ic.L
.. ... ...... .. ....... .. .. ..... ....... ...... ..... ..
C.K 0-�4 C.2 la
C.04 3 L2 C.--S 0.24
L- 11 Fig. 5. Variation with time of the maximum gas tem-Fig. 3 Maximum deviation of pressure from hydro- perature in the FETCH model for 60 bar and I barstatic pressure in the FETCH model versus time for 60 over-pressure.barand I barover-pressure.
In Table I below we surnmarise the maximum valuesIn Figs. 25 w show results, obtained from the two of the important parameters calculated:numerical simulations, presenting fission rate, maxi-mum pressure and solid and gas phase temperatures,respectively. As the system becomes super-critical, Table 1. Calculated maximum values of significantthe release of energy (t > 0.10 s) raises the particle parameters during the criticality transient.temperature, which rapidly vaporises water, and soincreases sharply the maximum gas pressure. Initial Max. Max. Max.The simulation performed with the larger over pres- max.Press. Fissions Solid Gas Pressuresure, i.e., 60 bars, has a larger yield and temperature. (bar) (flssions/s) Temp. Temp. (bar)This is mainly due to negative feedback effect associ- CO (.C)ated with the production of steam occurring at a 1.0 1.57E+20 858 609 115.3higher temperature at the larger over pressure. The 60.0 4.23E+20 1690 774 5681main factor in reaching a subcritical state is the pro-duction of steam further which increases the neutronleakage out of the system. The transients will sub-sequently self-stabilise at a critical state where heat,production and loses are in balance.
- 738 -

JAERI-Conf 2003-019
5. Conclusions Academic Press (1 994).9) L. Haar, J. S. Gallagher, G Kell. NBS/NRC Steam Ta-
A numerical model of two-fluid granular equations bles - Thermodynamic and Tnsport Pperties andhave been developed and coupled with the Computer Programs for Vapor and Lquid States of Wa-time-dependent finite element neutronics code to ter in SI Units. New York MGraw-Hill Internationalstudy criticality transients in two-fluids systems con- (1975).taining granular (solid) materials. The whole method- 10) H. Halbach, N. D. Cha*ee. An empiricalology is implemented in the FETCH code. The model Redfich-Kwong-Type equation of state for water tohas the capability to address problems in waste man- I 00 C and 200 kbar, Contributions to Mineralogy andagement in chemical plant (e.g. spillage or collapse of Petrology, 79:337-345 1982).granular materials) and also in investigating new re- 11) B. van Wachern. Derivation, Iniplementafion and Vali-actor concepts such as fluidised bed reactors. dation of Computer Simulation Models for Gas-Solid
Fluidized Beds. Ph. D. Thesis, Delft University ofWe have demonstrated the application of the numeri- Technology 2000).cal model coded in FETCH using a test case, which 12) C. K K Lun, S. B. Savage, D. J. Jefferey N.represents the collapse under gravity of fissile Chepurnry Knetic theories for granular flow: inelasticgranular material in a tank containing water. particles in couctte flow and slightly inelastic particles in
a general flow field, Journal of Fluid Mechanics,140:223-256 1984).
Acknowledgernents 13) D. J. Gunn. Transfer of heat or mass to particles in fixedJ.L.M.A. Gornes is supported by CAPES/Brazil and and flwdmd beds, International Journal of Heat andby UERJ (PROCASE)/Brazil. Partial funding of this Mass Transfer, 21:467476 1978)work to Imperial College came from the Health and 14) D. Kunii, 0. Levenspiel. Fluidization Engirieering,Safety Executive (UK). The views expressed in this Boston:Butterworth-Heinemann (I 99 1).paper are those of the authors and not necessarily the 15) M. L. Hunt. Discrete element simulations for ganularviews of the Health and Safety Executive. material flows: effective thermal conductivity and
self-diftity International Journal Heat Mass Transfer,References 40:3059-3068 1997).
16) AEA Technology Report ANSWERS/WIMS:I ) C. C. Pain, C. R. E. de Oliveira, A. J. H. Goddard WIMS8A: User Guide - Version 8(1999).
Transient Criticality in Fissile Solutions - Com-pressibility Effects. Nuclear Science and Engi-neering, 138:78-95 2001).
2) Chapman, S. Cowling, T.G. The mathematicaltheory of non-uniform gases. Cambridge UK:Cambridge University Press 1970).
3) C. C. Pain, J. L. M. A. Gomes, M. D. Eaton, C. R. E. deOliveira, A. P. Umpleby, A. J. H. Goddard, H. van Dam,T. H. J. J. van den Hagen, D. Lathouwers.Space-dependent kinetics sirriulation of a gs-cooledfluidized bed reactor, Nuclear Engineering and Design,219:225-245 2002)
4) C. R. E. de Oliveira. An arbitrary geometry finiteelement method for multi-group neutron transportequation, Prog. Nucl. Energy, 18:227-238, 1986).
5) M. J. Roth et al., "The WIMS-E Module ofW-PROC, " AEE, Wiriffith Report, AEEWR1365, 1980).
6) C. C. Pain, C. R. E. de Oliveira, A. J. H. GoddardNon-Linear Space-Dependent Kinetics for Criti-cality Assessment of Fissile Solutions, Progress inNuclear Energy, 39:53-114. 2001).
7) C. C. Pain, S. Mansoorzadeh, C. R. E. de Oliveira, A. J.H. Goddard Numerical Modelling of Gas-Solid lu-idizod Beds using the Two-Fluid Approach, nterna-tional Journal of Numerical Methods in Fluids,36:91-124 2001).
8) D. Gidaspow. Multiphase Flow and Fluidization - Con-tinuum and Kinetic Theory Descriptions, New York:
- 739 -

JAERI-Conf 2003-019 JP0450138
Development of Criticality Accident Analysis Code AGNES
Yuichi YAMANE% Ken NAKAJIMA', Toshihiro YAMAMOTO and Yoshinori MIYOSHIJapan Atomic Ener�y Research Institute, Tokai-mura, Naka-gun, baraki 39-1195, Japan
A one-point kinetics code, AGNES2, has been developed for the evaluation of thecriticality accident of nuclear solution fuel system. The code has been evaluated through thesimulation of TRACY experiments and used for the study of the condition of the JCOcriticality accident. A code, AGNES-P, for the criticality accident of nuclear powder systemhas been developed based on AGNES2. It is expected that these codes be useful for theevaluation of criticality safety for ftiel reprocessing and fabrication plants.
KEYWORDS. A GNES2,A GNES-P, One-point Kinetics, Criticality Accident, SolutionSystem, Powder System, JCO, TRACY
1. Introduction powder system. AGNES-P code has been developedfor general powder system, both uranium and
For the aim of the evaluation of criticality accident plutonium with the additive powder which mayfor reprocessing plants, a numerical simulation code, contain hydrogen.AGNES2'), has been developed at the Japan Atomic This paper presents the current status of theEnergy Research Institute, JAERL development of AGNES2 and AGNES-P codes. In the
The efforts to understand the unique character of next section, the outline of the AGNES2 code and thethe criticality accident of solution ftiel have yielded a examples of simulation using AGNES2 are described.number of numerical codes such as CRITEX2), The description of AGNES-P is in section 3.CREST'), SKINATH'), TRACE') and FETCH 6), and This work includes part of the research resultsfor such purpose experimental works have also been carried out under the contract with Ministry ofdone using CRAC'), SHEBA'), SILENE9) and Economy, Trade and Industry.TRACY 10,12) reactors. From the JCO criticalityaccident in 1999, it was found that the heat loss from 2. Analysis of Solution Systemthe fuel by the cooling system sustained the high levelof the power and there was the requirement for the 2.1 Outline of AGNES2 codemethod to evaluate quickly the effect of a 2. 1 I One-point kinetic equationcountermeasure on the accident. And the basic The calculation geometry consists of three regionsmechanism and effect of radiolyitc dissociation gas such as fuel, container and coolant. The calculationvoids are still not clear. The AGNES2 code has been regarding neutron is done in ftiel region only. Thedeveloped for the evaluation of the criticality accident basic equation of AGNES2 is the one-point kineticsof solution system and is expected to be useful for the equation as follows;designing of a ftiel reprocessing plant, the quick dP p -6 1 dC+ YW + S _P_2C.evaluation of the effect of a countermeasure against di A dt Athe accident and the study of the nature of the The following equation was derived from the above,criticality accident of solution system. and is used to calculate the power density, P, and the
A numerical code, AGNES-P, for nuclear powder delayed neutron precursor densities, Q, in course ofsystem based on AGNES2 has been developed in time;recent work. In this field, the numerical codes such asPOWDER 13) have been developed for uranium
Al G (Ik(-)-'k I
Pk., ewAA1 Pk I - (Pk.] -Pk +I &)Ck(.) e (M) At S e At2A )I -1 Yk - Wk Cok
C( � C(-) +_Lk� (e`(L71 ey k A )k-) At)
wherep _6 + G + S
H k Aw.Wk Yk
A k - Pk Adk
Contsponding author, Tel. 81-29-282-6743, Fax +81-29-282-6798, E-mail: yamane�melodytokaLjaeri.gojpPresent adress: Research Reactor Institute, Kyoto University, Kumaton-cho, Sennen-gun, Osaka, 590-0494 Japan
- 740 -

JAERI-Conf 2003-019
Pk is the abbreviated form of P(td and At = tk - tk. materials. The cooling through this virtual region is(m) denotes the number of the group of delayed modeled as the Newton's law of cooling;
neutron. q = k.4 t t-Nuclear solution fuel region is assumed to be X
homogeneous and only cylindrical shape can be where q is conduction heat transfer rate, k, thermalcalculated by using R-Z coordinate. Total reactivity, conductivity, A, the area of heat exchange, t, thep, is the sum of initial reactivity, po, added reactivity, temperature of the container, to, the temperature ofAp., temperature feedback reactivity, AA, and the atmosphere and x, the distance between thereactivity due to radiolytic dissociation gas voids, container and the atmosphere.Ap,, and is represented as follows; The heat exchange between the container and
p = po Ap. +Ap, Ap�_ coolant regions is calculated using the model of the
As temperature reactivity feed back, many effects natural convection of air near vertical plane.such as Doppler effect, scattering cross section effect, The conduction heat transfer rate q is denoted as
density effect, and volume expansion effect can be follows;taken into account, if the reactivity coefficients of q = h.4(t� - t.those are evaluated beforehand. where h is convection heat transfer coefficient, t2, the2.1.2 Thermal Calculation temperature of the container, t. the temperature of
Temperature is considered in fuel, container and atmosphere. The symbol h is denoted as a fianction ofcoolant region. The fuel and coolant regions connect Nusselt number as follows;to only the container region, and the energy released h = Nu Vby fission in the fuel region goes to the coolant Hregion through the container region. The where Nu is Nusselt number, k, the heat conductivitytemperatures denoted by T are calculated as follows; between the container and air, and H, the height of
ai = yPV+(hA),-,(T T the heat exchange area. For the expression of Nu, theV (PC, ),a -, - M), (T - T, following model recommended by Churchill" is
where i denotes region number; I is fuel, 2 container used;and 3 coolant region. The first term of the right hand 1 6 2
side is the energy released in the region i, and the Nu= 0825+ 0.387Ra'second and third are the energy transferred from or to [I + 0.492 Pry'the next region. In the coolant region, this equation iswritten in the following form; where Ra is Rayleigh number and Pr, Prandtl number.
aT3 They are denoted as follows;V (PC,), - = Y3PV1 + (hA)2 (T2 T) O)C11 (T. TJI 3
g,8e (T, - T. H Vwhere o) is the flow rate of the coolant and Cp3 is the Ra Pr=
specific heat of the coolant. T,,,,, and represent the g is gravitational acceleration, j8e, volumetric thermaltemperatures of the coolants at the outlet and inlet, expansion coefficient and y, the kinematic viscosityrespectively. The temperature T3 of the coolant of air. a is thermal diffusivity and is denoted asregion is assumed to be the average of T,,,, and T, as follows;follows; k
T3 (T. + Ti� PC,2 2.1.3 Radiolytic dissociation gas void
2.1.3 Cooling by Conduction and Natural Convection It is known for the criticality accident of solutionFrom the JCO accident, it was observed that the that at some level of the power, radiolytic gas voids
high power was sustained by the heat loss from are formed along the tracks of fission products andsolution by the cooling system. That implies the they grow enough to give some feedback effect to thecontinuous removing of heat energy from the fuel criticality of the solution system. The feedback ofgives rise to large amount of radiation, which is such gas voids is treated as follows; the fuel region isimportant parameter for the planning of the counter divided into some meshes in R-Z coordinate. Theaction. Therefore cooling is important problem. balance equation of the void fraction Fjj in a mesh
Adding to the original cooling model described in (ij) is denoted as follows;the previous section, a new model of cooling hasbeen implemented in recent development work. In V,.Yij.P_(Cw -COYO(ci, C.)_1�.j Ithe new model, the heat energy is removed fi7om the at &Zcontainer region by the structural materials connected where v, is void-energy transfer coefficient, yj, powerdirectly to the container and by the natural fraction and Co, the saturation mol density ofconvection of air. dissociation gas. Oo is Heviside function. Cj is the
A virtual structural material is considered to take mol density of dissociation gas, which satisfies theinto account the heat loss by many structural following equation;
- 741 -

JAERI-Conf 2003 -019
acw C", IF,, aw temperature plotted in Fig.2 is almost between twoat =G-y,,, -P- F,.j Vw az ar experimental values. The temperature increases like a
where G is gas production rate and r, the dissolution step, and each step corresponds to each peak intime of dissociation gas. power profile. Experimental value measured at 45cm
from the bottom increases about 2 seconds after other
2.2 Examples of Simulation data at the first step. Since convectional flow of2.2.1 Simulation of TRACY experiment solution arise at the first power peak, a hot part of the
From the view point of the analysis of the solution ascends to the solution surface. Such effectcriticality accident of nuclear fuel solution, there are seems small at the bottom.two important time scales. The power profile during For another experiment, the power profile duringthe fst several minutes affects the dose of workers much longer term was also measured and plotted inuntil their evacuation. The power during the Fig.3. In this experiment, Uranium concentration wasfollowing several hours is important parameter for 382.3 gU/Lit. Acid molarity was 062 mol/Lit. Thethe planning of the counter action against the excess reactivity of 1.5$ was inserted by feedingaccident. In this section, two corresponding cases of solution with the rate of 0.15 $/sec. No externalTRACY experiments and the simulations using neutron source was used. The measurement wasAGNES2 code are presented. continued about hours after the reactivity insertion.
TRACY is a reactor which uses 10% enriched It was observed that a deep bottom in the poweruranyl nitrate solution as fuel. Its core tank has a profile at about 2000 seconds and the followingcylindrical shape. There is a transient rod for oscillation. In this time scale, the heat loss from thereactivity insertion in the center of the core tank core tank is dominant for the change of the power.which contains 134C inside it. The simulated value shows good agreement with
experiment until 4000 seconds. However, as shownAn example of the measured power profile of a in Fig.4, the simulated value of temperature is higher
TRACY experiment and the result of the simulation than the ex erimental value. Such difference may befor it using AGNES2 code are shown in Fig. I. In the Pexperiment, the fuel solution was pumped into the due to the problem of the new cooling model.core tank from its bottom to insert 26S of total 2.2.2 JCO criticality accident
excess reactivity. Uranium concentration was 422 I.E+08gU/Lit. Acid molarity was 077 mol/Lit. The feed rateof the ftiel solution was 60 Lit./min, and ExperimentI.E+07 Simulationcorresponding average reactivity insertion rate was0. 1 8 $/sec. No external neutron source was used. l.E+06
In Fig. , after the large first peak, small oscillationdue to some feedback effect due to radiolytic gas I.E+05voids is observed in the power profile.
The result of the simulation shows good agreement 11+04with the experiment until the second peak of thepower. After the second peak, the result of simulation I.E+03is longer in the period of the oscillation than the 0 20 40 60 80 100 120experimental result. For the simulation, a weight for Time (sec)
the reactivity temperature coefficient was used to Fig.1 Power profiles of a TRACY experiment andtake into account the temperature distribution due to simulation in the first 2 minutes.the distribution of power at the first power peak. Thevalue of the weight was 1.5 at the first peak power,then decreases exponentially to be 1.0 in five seconds 80after the first peak, because the solution was stirred Final solution level = 53.5cmby convectional flow due to temperature difference 70 Experiment Simulation (average value)and radiolytic gas voids after the first power peak. 9 60 (at 45cm from the bottom)Since the heat loss from the core tank during the first Eseveral minutes is negligibly small for this case, an 50assumption is possible such that the surface of the E 40tank is adiabatic.
For the same experiment, the temperature was also 30 arimentmeasured and plotted in Fig.2. The figure shows the (at 5cm from the bottom)
values measured at two different levels in the 20 0 20 40 6.0 8.0 100 120solution. The temperature measured near the surface Time (sec)of the solution is higher than one near the bottom ofthe core tank, because a hot part of the solution Fig.2 Temperature profiles of a TRACY experimentmoved up to the surface. Simulated value of average and simulation in the first 2 minutes.
- 742 -

JAERI-Conf 2003-019
I.E+09 . . ... ... ...... LE+08
1 st Peak Power 0 Gamma-rayExpa,��t / mutation
l.E+06 l.E+07 I OMW 0 . area monitor17MW 3.0$)
E+03 11+06 3.0$0
0I.E+00 I.E+05
1.E+04 0I.E-03
0 2000 4000 6000 8000 10000 12000
Time (sac) I.E+030 50 100 150 200
Fig.3 Power profiles of a TRACY experiment and Time(sec)
simulation during 200 miuntes.
A criticality accident which occurred at a Fig.5 Simulated power profile and the record of aprecipitation tank in the JCO company Tokai-works gamma-ray area monitor during 200 seconds.
in 1999 was simulated using AGNES2 code for the 1.E+08
investigation of the condition which initiated the 1.E+07 Simulationaccident. In this section, an example of thesimulation is presented. I E+06 0 Garnma-ray area monitor
The geometry of the precipitation tank was very 914 ' 1,E+01complicated however, a cylindrical shape was 0
used for the simulation. It contained 18.8% enriched I.E+04
uranyl nitrate solution at that time. The uranium I.E+03
concentration was 37OgU/Lit. and the acid molaritywas 0.5mol/Lit. The solution was poured into the I.E+02
tank using a bucket when the criticality achieved. 0 500 Time sac) 1000 1500
Since there were no information for tile inserted
reactivity and its insertion rate, parameter survey was Fig.6 Simulated power profile and the record of aperformed. The range of the parameters is as gamma-ray area monitor during 25 minutes.follows; the excess reactivity between 1.5 and 45 ,reactivity insertion rate between 15 and 70 $/sec and 1500seconds is shown in Fig.6. The value of totaltotal thermal conduction rate from the solution to the thermal conduction rate for the simulation was 344coolant between 20 and 700 J/(s-m 2X). An example J/(s-m'-K) for this case. The result of simulationof the result of such simulation is shown in Fig.5. shows good agreement with the value of the
Figure shows the two different reactivity gamma-ray area monitor. From this result, the totalinsertion cases and the estimated value of the power thermal conduction rate is estimated close to suchbased on the record of a gamma-ray area monitor of value. But further investigation is needed for muchthe jCO14) . The simulated values show good better estimation.agreement with the value of the gamma-ray areamonitor except the detail fluctuation. From this result, 3. Analysis of Powder Systemthe inserted reactivity is estimated to be close to 1. -3.0$. 3.1 Development of AGNES-P code
Another example of the power profile during For the criticality accident of MOX powder system,a one-point kinetics code, AGNES-P, has been
70 developed at JAERLOne of the main targets of AGNES-P is the
65 homogenizing process of oxide uranium andZ., plutonium powders in a MOX fabrication plant.
Since the delayed neutron fraction of Pu-239 is60 smaller than that of U-235, the margin for prompt
Experiment SimulationE critical becomes smaller. The additive powder such(at 30cm from the bottom) (average value)
55 as zinc stearate, used as a lubricant, containsFinal solution level = 57.Ocm hydrogen and acts as a moderator. The behavior of
50 particles of MOX powder and additives at criticality0 2000 4000 6000 8000 10000 12000 accident is not known well, because there is no
Time sac) experimental result. Zinc stearate is solid at roomtemperature, melts at about 120-130'C, which is
Fig.4 Temperature profiles of a TRACY experiment higher than the boiling point of water, and dissociatesand simulation during 200 minutes.
- 743 -

JAERI - Conf 2003 - 019
16-11)into gas at about 400-4200C Such character total reactivity decreases after the peak of the powercould give quite different result in a criticality due to the feedbacks of temperature and boiling.accident from the wet powder system. 3.2.2 MOX Powder System
AGNES-P has the same feature in neutronic and The criticality accident with the homogeneousthermal calculations as AGNES2, and it implies the mixture of MOX and zinc stearate powder wasassumption of homogeneity for fuel region. Part of considered and calculated using AGNES-P code toradiolytic gas void calculation is omitted, while the evaluate the power, the number of fission and thedissociation of additive powder is taken into account. achieved temperature. A typical result of preliminary
Dissociation is different phenomena from phase calculations is shown in this section.change such as melt or vaporization. In AGNES-P, The calculation conditions were as follows; Thehowever, a simple assumption is adopted that the mixture of MOX and zinc stearate powder wasexcess energy is consumed for a process such as melt, contained in a cylindrical vessel of which both of thevaporization or dissociation at the specific radius and height was 40cm. The initial temperaturetemperature point of the process. According to this of the mixture was 20'C and its density was 14 g/CM3.
assumption, the energy balance equation in the ftiet It was assumed that water flew into the mixture andregion introduced above is re-written in the following criticality was achieved. In this assumption, the rateform; of reactivity insertion was 0.01$/sec, the duration
He = y, PV - hA)� (T - T time was IO sec and thus the total inserted reactivityin ten seconds was 0. I$.
aT Figure 9 shows the result of the power, the numberV� (pCP at = He for He 0, of fission and the temperature calculated using
El =He -At for He 0, AGNES-P. Because of the smallness of the insertedreactivity, the power increases slowly to the peak,
where El represents the latent heat. In this model, the which corresponds to the rise of temperature. It israte of phase change, or dissociation, is determined known that the density of zinc stearate is smaller thanby the combination of the rates of the fission release water, but there is no data of its specific heat. In thisand the cooling. The mass of each phase and the calculation, it is assumed that the specific heat of zincfeedback reactivity are calculated from El. stearate is the same as water. This assumption gives
smaller value of heat capacity to zinc stearate than3.2 Example of Simulation that of the water of the same volume. Thus zinc3.2.1 Uranium Powder System stearate is easy to be warmed rather than water in this
A uranium powder system was calculated using calculation.AGNES-P and PWDER code to evaluate the power, Figure 10 shows the reactivity change calculatedthe number of fissions and the achieved temperature.The calculation condition was as follows; The I.E+18 300
mixture of uranium oxide powder and water was ES
contained in a cylindrical vessel of which both of the POWDERI11+15 200
radius and height was 40cm. The temperature of theM3 Itmixture was 20'C and its density was 1.4g/c
was assumed that a small amount of water flew into E3: 11+12 100 1�the mixture and it became critical. 0
The reactivity insertion continued until the .........
termination of the calculation. The insertion rate was 1.E+09 0
0.01 $/sec. This case was calculated using AGNES-P 60 70 80 90 100
and POWDER codes. Figure 7 shows the result of the Time (sec)
power, the number of fissions and the temperature of Fig.7 Power and temperature profiles calculatedthe powder. In Fig.7, the temperature calculated using AGNES-P and POWDER codes.using AGNES-P code is the average value of the fuelregion and the result of POWDER code is the value 2
of the center of the representative particle of thepowder. The power increases up to the order of 1017 0
fission/sec. The calculation by PWDER codeterminated at the beginning of nucleate boiling soon 2
after the peak of the power. The inserted reactivity Tt.1 ... tmty
until the peak power was about 09$. While no 4 F..&.ck reactivit
discrepancy is seen between the results of both codes, � -T.
the comparison to experimental results is needed for 60 70 80 90 100the evaluation of AGNES-P code. Figure shows the Tim. ... )
reactivity change calculated using AGENS-P. The Fig.8 Reactivity profiles calculated using
AGNES-P code.
744 -

JAERI-Conf 2003-019
using AGNES-P code. The total reactivity becomes (2002).O.I$ in the first 10 seconds, then decreases to be 2) D.J.Mather, et al., "CRITEX - A Computernegative due to the reactivity of temperature feedback. Program to Calculate Criticality Excursions inAs seen in Fi IO, the fnally achieved temperature is Fissile Liquid Systems," SRD R 380 1984).less than 40'C, so zinc stearate keeps in solid state 3) R.Kato, et al., "The Code CREST to simulateand there is no reactivity feed back due to phase Criticality Accident Power Excursion in Fuelchange. Solution," Proc. Safety Margin in Critical Safety,
San Francisco, U.S.A., Nov. 26-30, 1989I.E+18 45 (1989).
.2 4) H.L.Dodds, et al., "SKINATH - A Computer11+15 40
Prograin for Solving the Reactor Point Kineticsi P2 Equations with Sample Thermal Hydraulictu 11+12
Feedback," ORNL/CSD/TM-210 1984).I.E+09 30 5) B.Basoglu, et al., "Development of a NewE
F! Simulation Code for Evaluation of CriticalityE+06 25 Transients Involving Fissile Solution Boiling,"
JAERI-Data/Code 98-011 1998).E+03 0 1000 20 6) C.C. Pain, et al., "Transient Criticality in Fissile2000 3000 4000
Time (sac) Solutions Compressibility Effects", Nuc. Sci. andFig.9 Power, energy and temperature profiles Eng., 138 78-95 2001).calculated using AGNES-P code. 7) P.Ldcorchd, et al., "A Review of the Experiments
Performed to determine the Radiological0.15 -- --- ---------- . . .......................... .. ........ Consequences of a Criticality Accident,"
0.1 Phase Change Feedback Y-CDC-12 1973).
8) C.E.Newton, et al., "An Assessment of theZ. 0.05 Total Reactivity Minimum Criticality Accident of Concern", H &
0 R 82-2 1982).
-0.05 9) F.Barbry and J.P.Rozain, "Objectives and
-0.1 Summary of Experiments on The Formation ofTempearture Feedb k Radiolysis Gas Carried Out using The Silene
-0.15 Reactor," SRSC 89.08 1989).
-0.2 IO)K.Nakajima, et al., "TRACY Transient0 1000 2000 3000 4000 Experiment Databook I)Pulse Withdrawal
rime sac) Experiment," JAERI-Data/Code 2002-005 2002).Fig.10 Reactivity profiles calculated using I 1) K.Nakaj ima, et al., "TRACY TransientAGNES-P code. Experiment Databook 2)Ramp Withdrawal
4. Summary Experiment," JAERI-Data/Code 2002-006 2002).12)K.Nakajima, et al., "TRACY Transient
A numerical simulation code, AGNES2, has been Experiment Databook I)Ramp Feed Experiment,"developed for the evaluation of the criticality JAERI-Data/Code 2002-007 2002).accident of solution fuel system. Through the 13)P.Rozain, et al., "Criticality Excursions in Wettedsimulation of TRACY experiments and the JCO U02 powder," Proc. Int. Conf. on Nuclearaccident, it showed the applicability of the code to Criticality Safety, ICNC'91, Oxford, UK, Sep.both short and long time phenomena. Still, part of 9-13, 199 1 VI-40 199 1).cooling and void calculation should be improved. 14)K.Tonoike, et al., "Power Profile Evaluation of
AGNES-P code has also been developed for the JCO Precipitation Vessel Based on Record ofnuclear powder system and some preliminary the Gamma-ray Monitor," Nucl. Technol., 143,calculations have been performed. The data output by To be published 2003).these codes such as the power, fission, temperature, 15)S.W.Churchill, et al., "Correlating Equations forfeedback reactivity, etc. are useful for the designing Laminar and Turbulent Free Convection fi7orn aof a fuel processing process and the evaluation of the Vertical Plate," Int. J. Heat Mass Transfer, 18,effect of a countermeasure against the criticality 1323 1975).accident. 16)http://www.osha-sic.gov/SLTC/healthguidelines/z
incstearate/recognition.html.
References 17)http://www.sainathplastochem.com/zinc%20stear1) K.Nakajima, et al., "A Kinetics Code for ate.htm
Criticality Accident Analysis of Fissile Solution 18)http:Hwww.ilo.org/public/english/protection/safeSystems: AGNES2," JAERI-Data/Code 2002-004 work/cis/products/icsc/dtasht/-icscO9/icscO987.ht
m
- 745 -

JAERI-Conf 2003-019 JP0450139
Applicability of Simplified Methods to Evaluate Consequences of Criticality
Accident Using Past Accident Data
Ken NAKAJIMA'Research Reactor Institute, Kyoto University, Kumatori-cho, Sennan-gun, Osaka 590-0494, Japan
Applicability of four simplified methods to evaluate the consequences of criticalityaccident was investigated. Fissions in the initial burst and total fissions were evaluatedusing the simplified methods and those results were compared with the past accident data.
The simplified methods give the number of fissions in the initial burst as a function ofsolution volume; however the accident data did not show such tendency. This would becaused by the lack of accident data for the initial burst with high accuracy. For totalfissions, simplified methods almost reproduced the upper envelope of the accidents.However several accidents, which were beyond the applicable conditions, resulted in thelarger total fissions than the evaluations. In particular, the Tokai-mura accident in 1999gave in the largest total specific fissions, because the activation of cooling system broughtthe relatively high power for a long time.
KEYWORDS. criticality accident, simplified method, accident evaluation, totalfilsions,fissions in the initial burst, duration
1. Introduction The other 21 accidents were occurred with solution orslurry systems. Total fission numbers were between
Several simplified methods to evaluate the 1xI0"and4xI0'9. Mostofthem(17cases)resultedconsequences of criticality accidents in fissile in IXI016 to 3x10¹⁸ fissions. Figure I shows thesolutions were proposed in the 1970s to the mid chronological record of the accidents.1990SI-4). Those methods are very useful to estimate In the present paper, 21 accidents, except one withthe scale of the accident quickly using the limited Pu metal, were evaluated using the simplified methods,information. Most of those methods are based on the because the proposed simplified methods wereexperimental data using highly enriched uranium developed for solution systems.(HEU) solutions, such as CRAC'), SILENE6), andKEWB 7) . Although some of them were applied or 3. Simplified Methodsverified for the past criticality accidents occurred inthe US and UK, the number of the accidents was or We will investigate the applicability of fourless at that time and it was insufficient to examine the simplified methods, proposed by Tuck, Olsen, Barbry,applicability of those methods to the real accident. and Nomura. In Table 2 the evaluation formulas
In the late 1990s, the Russian federation disclosed and the applicable conditions of each method arethe technical information about the past criticality described. The main features of each method are asaccidents, and two accidents were happened in the follows.Russian federation 1997) and in Japan 1999).Consequently, the number of the accident became 22, 3.1 Tuck's Methodwhich is more than twice as that of earlier. Thus, we This method is based on the past 6 accidents withwill examine the applicability of the proposed fissile solutions, which were occurred in the US andsimplified methods using all the available data of past UK until 1965, and experiments of CRAC and KEWB.accidents in this study. The evaluated items are: maximum fissions in a 5-sec
interval, maximum specific fission rate in a 5-sec2. Criticality Accidents interval, total fissions, maximum pressure, and
average power during boiling. Different formula wasUp to the present, twenty-two criticality accidents used for uranium system and plutonium system,
in nuclear fuel processing plants have been reported8). respectively, to evaluate the maximum fissions in aTable I shows the main characteristics of the 5-sec interval. For the evaluation of total fissions,accidents, which are quoted from Ref. 8. One of evaporation of all the solution with 20% heat loss isthem was occurred in handling of plutonium metal. assumed.
Corresponding author, Tel. 81-724-51-2457, Fax 81-724-51-2620, E-mail: nakajima�rri.kyoto-uacjp
- 746 -

JAERI-Conf 2003-019
Table I Summary of criticality accidents in nuclear fuel pmcessing plants
SpecificFissions - . SpecificFuel Vessel Fissions in Total
No. Sitel) Date Fueltype Fissile Volume Volume in linitial Initial Fissions Total DurationBurst Burst Fissions
(1) (1) (fiss) (fiss/liter) (fiss) (fiss/liter)I Mayak 1953/3/15 Solution PU 31 40 unknown unknown 2.Ox I 0 7 6.5x1O' 5 1 min 3)
2 Mayak 1957/4/21 Slurry U(90) 30 100 unknown unknown I.Ox I 0" 3.3x1O15 10min3 Mayak 11958/11/2 Solution U(90) 58.4 442 2.Ox I 0 7 3.4xlO" 2.Ox I 0 7 3.4x1O15 I min 3)
16 14 IT 164 Y12 1958/6/16 Solution U(93) 56 208 1.OxIO 2.Ox 1 0 1.3x1O 2.3xI0 20min5 LASL 1958/12/30 Solution(Org) Pu 160 982 1.5x 10¹⁷ 9.4xlO" 1.5x 10¹⁷ 9.4xI0 14 - TM 761CPP 1959/10/16 Solution U(91) 800 18900 1.OX1017 .OX1014 4.OxIO" 5.Ox 1 0" 20min
177Mayak 1960/12/5 Solution Pu 19 40 unknown unknown 2.5x1O 1.3x1O" I h5Omin8 CPP 1961/11/25 Solution U(90) 40 461 6.Ox I O' 6 1.5xlO'5 E-110" 1.5xlO'T 3min 4)
9 Tomsk 1961/7/14 Solution(Org) U(22.6) 42.9 65 none none 1.2-x II 00" 78x -10-'r -Fi=n10 Hanford 1962/4/7 Solution PU 45 69 I.Ox 1 O's 2.Ox 1014 8.2x1O' 7 1.8X1O,6 37.5h1 1Mayak 1962/9/7 Solution PU 80 100 none none 2.Ox I 0" 2.5xIO"5 1 h4Omin12 Tomsk 11963/11/30 Solution U(90) 35.5 49.9 unknown unknown 7.9x 10¹⁷ 2.2xlO' 6 1 Oh2Omin13 Tomsk 1963/12/2 Solution(Org) U(90) 64.8 100 none none 1.6xI0 16 2.5xIO 14 16h14 Wood River 1964/7/24 Solution U(93) 51 103.7 I.OxlO" 2.4x 1 0'-' 1.3x 10¹⁷ 2.5xlO" 1.5h15 Electrostal 1965/11/3 Slurry U(6.5) 100 300 none none I.O 1 OIT 7-ox 1-01-r -TM-i.=16 Mayak 1965/12/16 Solution U(90) 28.6 100 none none 5.5xIO 17 1.qx1O16 7h17 Mayak 1968/12/10 Solution(Org) Pu 28.8 62.1 3.Ox I 0" I.OXIO11 .OX 7 3.5x 10¹⁵ 15min
18 Windscale 1970/8/24 Solution(Org) Pu 40 156 none none 1.OxIO" 2.5xIO" los19 ICPP 1978/10/17 Solution U(82) 315.5 315.5 unknown unknown 2.7x1O18 8.600" 1.5h20 Tomsk 1978/12/13 Metal PU 0.54 3.2 3.OxIO" 5.6 x 1 O'5 3.Ox 1 O'5 5.6x1O15 -F-in-'F-21 Novosibirsk 1997/5/15 ISlurry WO) 700 none none 5.5xlO' 5 27h5min
I 22ITokai-mura 1 1999/9/30 ISolution I U T 8 8-)T 45 100 5.Ox 1 5x1O'-j 56X10, 6 19h4Omin
1) Mayak: Mayak Production Association (Russia), Y12:Oak Ridge Y12 Plant USA), LASL: Los Alamos Science Laboratory (USA),ICPP: Idaho Chemical Processing Plant (USA), Tomsk: Siberian Chemical Combine (Russia), Hanford: Hanford Works (USA),Wood River: United Nuclear Fuel Recovery Plant (USA), Electrostal: Electrostal Machine Building Plant (Russia),Windecale: Winscale Works (UK). Novosibirsk: Novosibirsk Chemical Concentration Plant (Russia),Toksi-murs: JCO Fuel Fabrication Plant (Japan).
2) Number in parentheses shows nrichment of U. 3 Set I min for 'a short time' or 'single excursion.'4) Set 3min for 'a few minutes.' 5) Set 15min for 5min alpha.'
IE+20
Russia(13)IE+19 USAM
UK(1).0 1E+18 Japan(l)(a
4-
- IE+17co4-J0
I E 6
I E+1 5
IE+14 . . . . . . . . .CD U') CD U,) 111�1 C> U-3 C> ul� C>LO U) CD UD r- r- 00 00 C* M C>
Year of accident occurred
Fig.1 Chmnological record of criticality accidents in nuclear fuel processing plants
- 747 -

JAERI-Conf 2003-019
Table 2 Shwhfied Mdhods
Items Evaluation formulas
15Maximum fissions FB�2.4xlO V ... U system 70%,-90%)
in the initial burst 16 14 0.1 .(I - H)a(Maximum FB=4.6x] a e.p[O.0177D- ... Pusystem (+100%,-70%)
fissions during a D I5-sec interval) where V: tank volume (t), a: solution feed rate (t/s), D: tank diameter (cm), H: tank height(cm) if
H> 1 50, then use 150.
Maximum specific f = 7.7 x 10²³ . k-a- (L) 1/2 (+110%,-70%)fission rate in the H3D2 S
initial burst where k: source initiating parameter (U system: I - I 0, Pu system: 1), L longest dimcnsion(H or(fission/t-s) D in cm), S: shortest dimension (H or D in cm), H = 0cm for D = 29-40cm, H = 0cm for D >
40cm.
Tuck Total fissions F = V 10" (*20%)
Fissions needed to evaporate the solution with about 20% heat loss.
1) Solution feed rate is the maximum design capacity of the system. It must be between 047 and0.006 s.
2) Tank volume refers to the largest tank in the system. The diameter must be between 28 and 152cm.
3) Fissile solution volume is the maximum one for normal operations plus that which couldApplicable credibly be inadvertently added.conditions 4) The tank bottom is 30cm, or more above any reflecting material such as concrete.
5) The fuel concentration is that which will produce the worst accident for the conditions involved.6) After a cticality alarm, any operating equipment, such as pumps or valves, is not shut off by the
operator.7) The heat transfer from the tank to the environment must be not greater than a bare tank cooledby room air. Little venting stearn will condense in the vent lines and drain back into the tank.
FB = 295 x 1 5 . 0.85Fissions in the
initial burst where Vii solution volume at the time of the burst.This model is mainly applicable to highly enriched uranium. For Pu systems, FB becomes half orless. It is not estimated for slightly enriched uranium system.
Olsen Fissions in the Fp = 32 I 8 (I - t)-o- "
plateau where t: duration of the plateau.
Total fissions Fr = F13 + p
Applicable 1) Tank diameter must b between 30 and 80 cm.conditions 2) Solution feed rate must be between 0027 and 052 s.
V-tTotal fissions 3.55x 10⁻¹⁵ 638 x 10-17
where V solution volume (t), t: duration (s) that should be less than 600 s.
Barbry 1) The model is valid for uranyl nitrate solutions in a homogeneous media with highly nricheduranium, and having an appreciable nominal internal neutron Surce.
Applicable 2) The model should be applicable to Flu solutions.conditions 3) Experimental data with the following conditions are used.
Fuel concentration: 20-36OgU/t, Tank: cylindrical shape with diameters of 30, 8 cm(CRAQ and 36 cm (SILENE).
16Fr =2.6xlO V ... for non-boiling (Case 1).
Total fissions Fr = 6 1016 V ... for boiling (Case 2).
Nomurawhere V solution volume (t).
Applicable 1) Excursion will terminate by the temperature rise ftom 20 to I I 9C for Case 1.conditions 2) Excursion will terminate by the evaporation of 25 of solution volume during boiling for Case
#2.
748

JAERI-Conf 2003-019
In these evaluations, vessel (tank) volume is used, the maximum solution feed rate of 047 liter/s wasand solution feed rate is also required for the employed.evaluation of several items Although those formulas show the dependence on
the solution volume, the accident data have no3.2 Olsen's Method significant relation with the volume. We can say that
Formulas to evaluate the fissions in the initial burst it is difficult to determine or evaluate the powerand the plateau are proposed. For the plateau, behavior in the initial burst of the past accidents, andfissions as a function of duration are evaluated. This then the accuracy of the reported value is not enough.method is developed based on the data of CRAC Therefore, we can not judge the applicability of theexperiments, thus the method is applicable for HEU simplified methods using the present results.system. It is estimated that the fissions in the initialburst for plutonium system will be half of that for 4.2 Total Fissions as a Function of VolumeHEU system. There is no estimation for slightly Figure 3 shows the evaluated total fissions as aenriched uranium system. function of solution volume using Tuck's and
Nomura's formulas. Nomura's formula #1 (for3.3 Barbry's Method non-boiling case) gives the upper envelope value
Formula gives the time change of fissions for the except two cases. These are the Tokai-mura accidentfirst 600 seconds of excursion. This method is based (No.22 in Table 1) and the ICPP one (No.6). In theon the CRAC and SILENE experimental data. It is Tokai-mura accident, the cooling system wasapplicable for the HEU solution having a significant activated and that resulted in the relatively high powerneutron source. It is estimated that the formula is level for long time. In the ICPP accident, half of thealso applicable for Pu solutions. solution was evaporated due to the violent boiling.
3.4 Nomura's Method i o2O UPP(No.§)Two formulas to evaluate the total fissions for
non-boilin case and for boiling one are proposed. C9 1019For non-boiling case, it is assumed that the ......temperature rise of 90'C terminates the excursion. CFor boiling case, evaporation of 25% of solution .0 1018 ......................................... ...-covolume is assumed. The formulas are verified for the 0CRAC experiments and past accidents in the US and iZ A1017 0 ......... - NomuralUK. Nomura24a
0 1016 0 ----- Tuck4. Evaluation of Accidents Q o U-system
& Pu-system
4.1 Fissions in the Initial Burst W5 i
Figure 2 shows the evaluated fissions in the initial lo- 160 1000burst using Tuck's and Olsen's formulas, in Volume (liter)comparison with the past accidents. In Tuck'sformula for Pu system, the tank height was changed as Fig.3 Total fissiorts as a firriction of fuela parameter (for H > 50 cm, H = 50 cm), while the volume estimated by Tuck and Nomura
diameter was set to the maximum one 152 cm), and Both cases are beyond the applicable conditions for
4-1 1019 Nomura's formula #1. On the other hand, Nomura'sformula 2 (for boiling case) reproduces those two-Tuck for Usystem
Tuck for Pu-sysem accidents well. However, the Tokai-mura accident is----- Olsen also beyond the conditions, thus we think that this
o U-systemZ 1018 - Pu-system agreement is caused by coincidence. Tuck's formula
overestimates all the accidents; this indicates that theassumption of all volume evaporation is too
+J conservative.loll After all, Nomura's two formulas give good results
for all the cases except the Tokai-mura accident.C0 Figure 4 shows the evaluated total fissions as a0 function of solution volume using Olsen's and.2 io16U_ Barbry's formulas with infinitive duration. In
10 100 1000 Olsen's formula, fissions in plateau 3.2-10" for tVolume(liter) --+00) are dominant, and hence the result becomes
Figl Fissions in the initial burst es� by almost constant. Barbry's formula gives the almostTuck and Olsen same result with Nomura's formula #1; however it
- 749 -

JAERI-Conf 2003-019
underestimates the fissions for several cases. relatively high power for a long time. For the
i o2O ICPP(No.6) evaluation of the Tokai-mura accident, it is necessary-- 7- to develop a new formula including the cooling effect.
1019 Tbkaiqnura(No22) W7 ICPP(No.6) Tdm-Lu*Non)
.e �_-lo18 . ... .............. .- 0
.2 1016LL. A 4-
lo17A� OL
co 00
Barbry .2 101510 16 0 0 0 1 s e n co .. ............ ......... .... ........ .....
coo Usystem
Pu-system U_ 0lo15 D ..2 1014
10 100 1000 t 7 - Barbry0 i o Usystem
Volume (liter) 0 0OL & Pu-system
C/) lo13Fig 4 Total fissions as a function of fuel
co 104 105 106volume estimated by Olsen and Barbry 4� lo, lo, lo,
0
Duration
4.3 Total Fissions as a Function of Duration
Figure shows the evaluated total fissions as a F)P6 Total specific fissions as a fimcdon ol
function of duration using Olsen's formula. As duration munated by BarbFy
previously mentioned, fissions in the plateau becomes
dominant with increasing duration in Olsen's formula. 5. Conclusions
The evaluation shows the upper envelope for the total
fissions except one case of the ICPP accident (No.6), Applicability of four simplified methods, proposed
in which the violent boiling was occurred and large by Tuck, Olsen, Barbry and Nomura, to evaluate the
numbers of fission yielded in a short time. consequences of criticality accident was investigated.
Figure 6 shows the evaluated total specific fissions Fissions in the initial burst and total fissions were
as a ftinction of duration using Barbry's formula- evaluated using those simplified methods and the
The evaluation almost reproduces the upper values results were compared with the past accident data.
with the difference of 50% except two cases, i.e., The following conclusions were obtained in the
Tokai-mura(No.22) and ICPP(No.6). It is found present study.
from the figure that these two accidents give the quite The simplified methods give the number of
larger total specific fissions than the others. In fissions in the initial burst as a function of solution
particular, Tokai-mura accident gives the largest total volume; however the accident data did not show
specific fissions in the past accidents. This is due to such tendency. This would be caused by the lack
the solution cooling effect, which brought the of accident data for the initial burst with high
accuracy.
io2O For the total fissions as a function of solution01senflateau)
ID 0 Olsen(Total) volume, Nomura's formula reproduced theICPP(NO-6) o U-system upper envelope of the accidents for non-boiling1019
Pu-systemcases. Nomura's formula 2 predicted well the
total fissions of the boiling accident of ICPP(No.6)..0 1018co For the Tokai-mura accident, in which the coolingco 0 C)o A
iz system was activated, Nomura's formula 2
io17 t. showed good agreement, however it would be
caused by coincidence. Barbry's formula with
io16 infinitive duration showed the similar tendency
with the Nomura's formula # 1.
e For total fissions as a function of duration, Olsen's1015
formula shows the upper envelope for the totallo, 101 101 104 lo, 106 fissions except one case of the ICPP accident
Duration (s) (No.6), in which the violent boiling was occurred
and large numbers of fission yielded in a short
Fig.5 Total fissions as a function ofduration time. Barbry's formula amost reproduces the
estimated by Olsen upper values of total specific fissions with the
- 750 -

JAERI-Conf 2003-019
difference of 50% except two cases, i.e.,Tokai-mura(No.22) and ICPP(No.6). These twoaccidents gave the quite larger total specificfissions than the others. In particular,Tokai-mura accident gave the largest total specificfissions in the past accidents. This is due to thesolution cooling effect, which brought therelatively high power for a long time. For theevaluation of the Tokai-mura accident, it isnecessary to develop a new formula including thecooling effect.
ReferencesI G. Tuck, "Simplified Methods of Estimating the
Results of Accidental Solution Excursions," Nucl.Technol., 23,177 1974).
2) A. R. Olsen et al., "Empirical Model to EstimateEnergy Release from Accidental Criticality,"Trans. Am. Nucl. Soc., 19,189 1974).
3) F. Barbry et al., "Criticality Accident Studies inFrance: Experimental Programs andModefisation," Proc. Int. Seminar on NuclearCriticality Safety, ISCS'87, Tokyo, Japan, October19-23, 1987, p. 423 1987).
4) Y. Nomura and H. Okuno, "Simplified EvaluationModels for Total Fission Number in a CriticalityAccident," Nucl. Technol., 109,142 1995).
5) P. Lecorche et al., "A Review of the Expriments;Performed to Determine the RadiologicalConsequences of a Criticality Accident,"Y-CDC-12 1973).
6) F. Barbry "A Review of the SILENE CriticalityExcursions Experiments," Proc. 1993 TopicalMeeting on Physics and Methods in CriticalitySafety, Nashville, TN, USA, September 19-23,1993, p. 34 1993).
7) M. S. Dunenfeld et al., "Summary Review of theKinetic Experiments on Water Boilers,"NAA-SR-7087 1963).
8) T. P. McLaughlin et al., "A Review of CriticalityAccidents, 2000 Revision," LA-13638 2000).
751 -

JAERI-Conf 2003-019 JP0450140
Criticality Accident Studies and MethodologyImplemented at the CEA
Francis BARBRY Patrick FOUILLAUD', Ludovic REVERM2 and Dominique MIJUIN 2'Commissariat a Energie Atomique, CE VaIduc, 21120 Is-sur-Tille, France
2COMMissariatei VEnergie Atomique, CE Saclay, 91191 Gif-sur-Yvette, France
Based on the studies and results of experimental programs performed since 1967 in theCRAC, then SILENE facilities, the CEA has devised a methodology for criticality accidentstudies. This methodology integrates all the main focuses of its approach, from criticalityaccident phenomenology to emergency planning and response, and thus includes aspectssuch as criticality alarm detector triggering, airborne releases, and irradiation risk assessment.
KEYWORDS. criticality, accident, CRAC, SILENE
1. Introduction preparing possible actions for return to a subcriticalstate.
As part of the organization it has set up to prevent Experiments conducted at the CEA's Valducrisk of criticality [11, the CEA has developed a set of laboratory, first in the CRAC facility (from 1967decisionmaking and assessment aids for criticality to 1972) 2] then in the SILENE reactor (from 1974 tomanagers. These tools include written guides that present) 3 were designed to reproduce accidentalevoke regulatory principles and precautions relevant to criticality excursions resulting from divergence of acriticality safety. highly enriched uranium solution. The key focuses of
A similar approach is now being applied to these programs were:criticality accidents. It entails: 0 criticality accident physics and understanding
• proposing a methodology to provide suitable of accident behavior mechanisms, with theinput for safety assessments as part of criticality accompanying development of computerizedaccident studies, safety assessment models;
• drawing on state-of-the-art knowhow to devise 0 accident detection capabilities, including timelyguides that review every aspect of a criticality triggering of criticality alarms for immediateaccident, evacuation of workers potentially exposed to
• improving the means available to managers for radiation;emergency preparedness planning and 0 study of airborne releases, by measuring theresponse, relevant fission gases and aerosols and
• ensuring ftirther training efforts and regular estimating their impact on human populationsdrilling of emergency response teams, and the environment;
• sharing knowledge and pooling the resources at 0 "dosimetry," i.e. determination of doses due tothe international level. accident-induced neutron and gamma radiation
and of dose levels at different distances fromThis approach amply relies on data from multiple the source, for irradiation risk assessment;
experiments conducted since 1967 on criticality 0 radiobiology as it applies to treatment of acuteaccidents and their consequences, using CRAC and irradiation resulting from the complex radiationSILENE test facilities. fields emitted by criticality accidents;
M emergency response, whose immediate2. Recap of CRAC and SILENE program objectives concerns are evacuating personnel, rapidly
grouping exposed workers, training emergencyThe purpose of studying criticality phenomena and teams to deal with emergencies and quenching
modeling them in dedicated computer codes is to the accident by return to subcritical conditions.describe various accidents postulated to occur in a Such provisions must be incorporated intogiven experimental or industrial process. This means onsite and offsite emergency response plans.assessing radiation risks to operators, specif�ririgaccident detection capabilities, evaluating the long Figure I shows a summary of the topics covered byterm behavior of critical configurations, estimating CEA research programs.their consequences in terms of radiological impact and
Corresponding author, Tel. 33-3-80-23-45-16, Fax. 33-3-80-23-52-14, E-mail : francis.barb!y(Mcea.
- 752 -

JAERI-Conf 2003-019
accident studies proposes two. approaches, which areillustrated in Figure 2 Choice of one or the otherdepends on whether the goal is an order-of-magnitudeestimate of accident characteristics, obtainable fromsimplified models, or the accurate calculationsresulting from a precise criticality scenario andconfiguration.
FAW NYM ------------------------
Fig.1 Scope of criticality accident studies.
Auff.l.pftff
Results of CRAC and SILENE experiments have mbeen brought to the attention of the international q�� - Stan" (KWVF;
community 41 [5] and widely used for modeling 6]. -i�i d.LI -773. Development of a guide to criticality accidentstudies
The CEA has identified a need for assembling thevast body of existing knowhow on criticality studies inmethodological-type synthesis documents or helpguides for performance of the studies required in safetyassessments of its own research facilities.
The information used in these documents iscompiled from results of both French studies and )ORION
research in other countries as well as the lessonslearned from criticality accidents recorded worldwide.
Recent synthesis efforts have centered on the EDACcriticality detection system 7] developed by the CEAand on studies of radionuclide releases [8].
Within three years, the guide currently in Fig.2 Flow diagram of a criticality accident study.
preparation should provide all the information neededto define specifications or to perform for a criticality 4. Emergency preparedness, response and trainingaccident study, under the following headings: actions
Criticality accident phenomenology,Current state-of-the-art, as exemplified by To supplement te work described above, the CEAexperimental results and criticality accident is currently placing emphasis on emergencyexperience, preparedness planning and response.Approach to criticality accidents This entails two types of actions specifically gearedmethodology, to national and local response:
M devising synthesis documents known asAccident physics modeling (trends in power, Itenergy and temperature over time), emergency checklists" that provide teamRisk of direct exposure to neutron and gamma leaders with essential crisis managementradiation, inforination. This may include, for each majorContamination and exposure risks associated type of medium potentially involved in anwith fission gas releases: radiological impact, accident (powder, solution, metal, fuel rods inEffects of biological shielding and other water, etc.), a recap of envelope scenarios andmaterials present in nuclear facilities, their foreseeable outcomes, models for rapidlyDetection systems and related provisions for estimating accident consequences, andthese facilities, measuring devices used to predict accident
behavior;Emergency preparedness planning andresponse measures, another more pragmatic focus concerns theTraining drills, training provided to the various possible playersLessons learned from past accidents and in a criticality accident, and organization ofincidents, regular emergency drills.etc. Personnel are then trained to know what
The chapter devoted to methodologies for criticality measures to take inside the facility (e.g.
- 753 -

JAERI-Conf 2003-019
criticality alarms) and how to recover exposed on Physics abnd methods in Criticality Safety, 34,workers (medical and other aspects). Sept. 19-23,1993 - Nashville, TN.At the SILENE reactor facility, practical drills 4) P. LECORCHE, R.L. SEALE, Review of thewith reproduction of a criticality accident are Experiments Performed to Determine theorganized annually, to help train the health Radiological Consequences of a Criticalityphysicists and radiobiologists responsible for Accident, Oak Ridge, TN, Y-CDC-12 1973).worker dose estimates, using techniques such as 5) F. BARBRY, P. FOUILLAUD, "Criticalityneutron-activation of detectors, sodium or Accident Studies and Research Performed in theintegument activation or biological dosimetry. VaIduc Criticality Laboratory, France," IAEA
International Conference On Topical Issues in5. International partnerships Nuclear Safety, nternational Atomic Energy
Agency, Vienna, Austria 3 -6 September 200 )On two separate occasions, the SILENE reactor has 6) Y. NOMURA, "Theoretical Derivation of
been made available to the international community for Simplified Evaluation Models for the First Peak ofintercomparisons of criticality accident dosimetry a Criticality Accident in Nuclear Fuel Solution,"data 9]. Nuclear Technology, Vol. 13 1, July 2000
Results of experiments performed in CRAC and 7) L. REVERDY, "CAAS - An Expert WorkingSILENE are regularly forwarded to the OECD for use Group Revisits the Safety Files for the Frenchas benchmarks in qualifying computer codes. The CEA Nuclear Industry," Proc. Int. Conf. on Nuclearalso plans to participate in drafting ISO standards [IO] Criticality Safety, ICNC'03, Tokai-Mura, Japan,on issues linked to criticality accident studies - yet Oct. 20-24, 2003another way to share with others the fruit of its 8) L. REVERDY, P. FOUILLAUD, "Guide d'dtudeexperience. d'impact radiologique en cas d'accident de criticitd",
CEA/DPSN, 2003References 9) B. VERREY, SILENE Facility: a Tool for
International Intercomparisons of Criticality1) D. MIJUIN, H. CARROS, B. SEVESTRE, "The Accident Dosimetry 9 Symposium on Neutrons
Organization of Criticality Hazard Prevention at the Dosimetry, Delft, Netherlands, 28/09 - 03/10/2003CEA," Proc. Int. Conf. on Nuclear Criticality I )C.M HOPPER, "A Tool for Criticality AccidentSafety, ICNC'O3, Tokai-Mura, Japan, Oct. 20-24, Emergency Planning, Training and Response,"2003 International Workshop on the Safety of the
2) F. BARBRY, CRAC - Essai de synth�se des Nuclear Fuel Cycle, Tokyo, Japan 29-31 Mayr6sultats expdrimentaux", CEA, Rapport 2000)DSN/SEESNC N 17, septembre 1973
3) F. BARBRY A Review of the SILENE CriticalityExperiments, Proceedings of the Topical Meeting
- 754 -

JAERI-Conf 2003-019 JP0450141
FRAMATOME-ANP France U02 Fuel Fabrication -Criticality Safety Analysis in the Light
of the JCO Accident
M. Doucet Frmnafome-ANP Fuel Technology Serocemichel.doucet�framatome-anp.com
S. Zheng Framatome-ANP Fuel Technology ServiceJ. Mouton Framatome-ANP Fuel Fabrication Plant (FBFC)R. Porte Framatome-ANP Fuel Fabrication Plant (FBFC)
AbstractIn Fnce the 1999' Tokai Mura criticality accident in Japan had a big impact on the nuclear fuel
manufacturing facility community Moreover this accident led to a arge public dscussion about a thenuclear facilities. The French Safety Authorities made song requirements to the industrials to revisitcompletely their safety analysis files mainly those concerning nuclear fuels treatments heFRAMATOME-ANP production of its French low enriched (5 wo) U02 fuel fabrication plant(FBFC/Rornans) exceeds 1000 metric tons a year Special aention was given to the emergencyevacuation plan that should be followed in case of a citicality accident If a criticality accident happens,site internal and external radioprotection requirements need to have an emergency evacuation planshowing the different routes where the absorbed doses will be as low as possible for people. The FrenchSafety Authorities require also an update of the old based neutron source term accounting for state of theart methodology U02 blenders units contain a arge amourit of dry powder strictly controlled bymoderation a hypothetical water lakage inside one of these apparabas Ls simulated by increasing thewater content of the powder. The resulted reactivity inscr�tion is perfortned by several static alculations.The French IRSN/CEA CRISTAL codes are used to perform these static calculations. The kneticcriticality code POWDER simulates the power excursion versus time and detemiines, the consequent totalenergy source term. MNCP413 prrfmm the source term propagation (including neutrons and gmma)used to determine the isodose curves needed to define the emergency evacuation plant
This paper deals with the approach FRAMATONIE ANP has taken to assess Safily Authoritiesdemands using the more up to date calculation tools and methodology
KEYWORDS: Criticality Accident, Kinetics, Neutron Source Term, Propagation, Isodosecurves.
1. Introduction operations. The accidental conditions accounted for incriticality studies often overstep the double
The "Franco Belge de Fabrication de Combustible" contingency principle without breaching the criticality(FBFC) Framatorne-ANP France' PWR fuel safety criteria. Nevertheless amazing and hypotheticalfabrication plant located in Romans (France) produces accidental conditions has been used to define thearound 1,500 assemblies a year. Fissile materials inside and outside emergency evacuation proceduresamounts in the factory are therefore important to allow an "as low as possible" people doseregarding the criticality safety. Knowing that the inhalation.minimal critical mass of well moderated and reflectedU02 is less than 50 Kg for an enrichment of 5% in 2. Calculation Codes and MethodologyU235, there is a big concern about the criticality safetyviewpoint. The 1999' JCO criticality accident The calculation methodology is divided into dim mainreinforces the French Safety Authorities to carefully steps:revisit the criticality safety files of the ftiel fabrication a. neutron satic calculations,and reprocessing plants. Till 1999 typical source term b. neutron kinetic calculations,used for a criticality accident was based on an agreed c. neutron and photon propagation.value of 1018 fissions. The JCO' criticality accidenthas led to a power excursion releasing 25 1018 2.1 Neutron static calculationsfissions. As this value exceeds the agreed one, The neutron static alculations are performed with theindustrials have been required to revisit in depth "iKhistrial"routeoftheCRISTALpackage(Figurel)[1].Thisscenarios of criticality accidents. package includes mainly the following odules: data
On the other hand the Safety Analysis Reports preparation, spectral alculation for cross sections generation(SAR) account for normal, incidental and accidental and 3D Monte Carlo alculations.conditions leading to agreements for industrial The goal of the stic calculations is performed to reach a
- 755 -
JAERI-Conf 2003-019
nearly citical situation by addition of different water contents ICRP60.in the U02 powder blender or mixe Tanks to the CRISTAL For the emergency evacuation plan we used thepackage (Cigales-Apollo2-Moret4 codes), parametric studies following values:are able to detern-iine a shape of increased reactivity vsus a Evacuation limit (plant) :50 mSvwater leaking inside a U02 blender and a U02 mixer m Preventive limit (population) 10 mSvsimulated by an increase of the powder humidity Those resultswill be the basic input data for the kinetic alculations 3. Calculation results
2.2 Neutron dnefic calculations 3.1. Static calculationsThese calculations are made to determine the 3. 1. 1 U02 blender case
source term being representing the released energy in The goal of these calculations is to increase thefissions. Knowing the fissile materials and its volume reactivity to be as close as possible regarding thethere are empirical models which can evaluate the criticality. A set of calculations is performed with theemitted neutrons value (Barbry - Olsen - Nomura - following hypothesis:models). Nevertheless Framatome-ANP decided to The U02 blender is simulated by an unreflecteduse a computational tool, called POWDER [2] cylinder,developed by CEA/SRSC and AEA SRD based on the w Three tons of % enriched U02,resolution of the following kinetic equation: w Powder mass densities: 1. - .5 - 25 g/cm3,
dn(t = (p(I))-,Y w H/U variation to reach Keff = 0999n(t)+ A, C, (t) Results are given Table I
di A
dC,(Q A Table - - rr(l)-,�Cjl) U02 Powder Cylinder ynder
dt A dens' volume height radius K� K,Where: = (cm) (cm) (,M) Apollo2 Moret40 is the delayed neutron fraction per neutron fission 2.5 12E-+6 173.45 46.93 3.04 133 0999Oi is the delayed neutron fraction coming from 1.5 20E+6 215.62 5434 458 139 0999preceding nuclides for group i r-1--0- 3.0E46 1 254.70 ,61.23 1 6.35 1.43 , 0999
Xi is the decay constant of the preceding nuclides.for group i 3.1.2 U02 mixer caseCi (t) is relative to the preceding nuclides The hypothesis for the U02 mixer case are theconcentration for group i concentration same as the U02 blender case ones excepted the massn(t) is the energy released (fission/s) inside the content which is in this case 800 Kg.medium Results are given Table 2A is the neutron generation lifetimep(t) is the medium global reactivity Table 2
The global reactivity p (t) is K' I Kff being the U02 Powder Cylinder� Cylinder K- 4fK density volume height radius
-ff (cm) (cm) Apollo2 Moret4ff/U
effective neutron multiplication factor. Global 1.0 8.OE+5 156.76 4030 10.65 1.45reactivity p (t) may be set to:
p(t = external p(t) + feedback p(t) 3.2. Kinetic calculationsWith external p(t) being the reactivity coming from 3.2. 1 U02 blender case
the water leakage inside the U02 powder and The goal of these calculations is to determine thefeedback p(t) being the accounting for thermal neutron source term, integrated fission number overexpansion, 136pple effect, water temperature effect ... the accident time evolution.
More explanation on this methodology can be A set of POWDER calculations is performed withfound in 3]. the following hypothesis:
nCylinder dimensions similar to the static2.3 Photons propagation calculations ones,
Neutron energy release calculated in section 22 is -Three tons of % enriched U02,then used to normalize the propagation calculation 0"Wet" powder mass density corresponding to theperformed with the well known MCNP413 3D Monte H/U ratio leading to Keff = 0999,Carlo code 4 Te different buildings in the mReactivity insertion simulated by a water leakageneighbourhood of the potential accident workshop are inside the U02 blender.roughly described to ensure a penalizing neutrons and A close relation exists between the water leakagephotons propagations inside the fuel plant as well as and the reactivity increase; in this case the equivalentoutside this latter one. Equivalent dose H for particles of a few litres of water/minute is taken as a 0.01 $/sof energy E is derived from absorbed dose and the s reactivity insertion [5].called quality factor Q taken from the updated
- 756 -

JAERI-Conf 2003-019
Results are given Table 3 taken in the fuel fabrication plant such an accident isnot possible. Nevertheless the exercise presented in
Table 3 this paper show the capability of theDryUO2 Wet U02 Accident Energy released FRAMATOME-ANP France codes and methodologydensity density duration (fission number) to handle such a situation to determine the risks of&cm) (g(cm) (S) dose inhalation for people inside and outside of the
2-5 2-753 392 9.9E+18 site1.5 1.729 471 1.6E+191.0 1212 529 22E+19
3.2.2. U02 mixer caseThe hypothesis and the goal of these calculations r
are the same as for the blender case ones excepted the Jomass content which is in this case 800 Kg. The ESAR4
OARV"penalizing case of the U02 blender casecorresponding to a "dry" powder mass density Of 1.0g/crn3 is retained here.
Results are given Table 4 Noww6ft
Table 4DryU02 Wet U02 Accident
densi density dunition Energy released WN51 B(O(an) (S) (fission number) Figure
1.0 1355 505 63E+18References
4. Isodose curves 1) The New CRISTAL Criticality sa* Package - im.Gomit and al. - ICNC` 1999.
The isodose curves are drawn accounting for the 2) Rapport AEA SRD R 549 - POWDER - Aaccident energy released as well as the workshop computer code to model the transient criticalitypositioning inside the fuel fabrication plant. For the behaviour of a bed of welled Uranium dioxidehigher energy release, i.e. 2.2E+19 fissions, the Table powder.5 hereafter gives as a function of the four cardinal 3) Note technique SRSC n' 00-13 - Description desdirections the distances for typical dose values: mod6les physiques du code POWDER version 3
4) MCN - A General Monte Cado N particle Tnsport
Table Code - Version 4B - LA 12625-M5M 100 50 10 5 1 5 Simulation of Hypothetical Cticality Accidents
n-Sv niSv mSv n-Sy mSv mSv Involving Homogeneous Damp Low-Enriched
North 55 110 145 260 325 500 U02 Powder Systems - B. Basoglu et al.(n� Nuclear Technology Vol. 105 Jan. 1994.
South(n� 140 255 315 480 560 760
East O 65 80 110 245 320 510
West (m) 33 65 90 165 Z!O 395
Keeping in mind those results we can draw thefollowing conclusions:• The closest inhabitant area is 600 in far away from
the site and the dose limit of 10 mSv is always metwhatever the cardinal direction.
• For the dose limit of 50 mSv at the border of thesite, some breachings of the criterion appear.Radioprotection improvements have been alreadyengaged to decrease the dose values to ensure thecriterion in the concerned cardinal directions.
5. Conclusion
Thanks to the various safety operational features
- 757 -

JAERI-Conf 2003-019 JP0450142
"Oh, No It Isn't!" "Oh, Yes It Is!"The Omission of Criticality Incident Detection Systems in the UK
Peter R Thorne, Russell L Bowden, and Jack VennerNuclear Technologies p1c., Chadwick House, Birchwood Park, Warrington WA3 6AE,
United KingdomTel 44 1925 817080
peter.thorneAnuclear.co.uk
In the UK, the default position is that every process involving fissile materialshould have a Criticality Incident Detection and Alarm System (CIDAS), unlessa robust argument is made that such a system can be omitted. Implementationhas been inconsistent and inefficient. In practice decisions appear to besubjective and there are different views and opinions. This paper argues twoopposing points of view and presents some simple ground rules.
1. IntroductionIn the paper, as a thought experiment, two
In the UK, the default position is that every extreme positions will be proposed. A strongprocess involving fissile material should have a argument will firstly be made for a range ofCriticality Incident Detection and Alarm plants to show that a CIDAS should always beSystem (CIDAS), unless a robust argument is fitted, followed, secondly, by a strong argument,made that such a system can be omitted. The for the same plants, that a CIDAS need never be
most commonly accepted criteria for CIDAS fitted!omission, which are still in use in the UK, were The paper will conclude by presenting a set offormulated in the 1960's. The criteria were simple rules that should be followed to aid thederived after a thoughtM and intelligent decision about installing or omitting a CIDAS.
consideration of the issues, but theimplementation of the criteria by differentorganisations over the years has led to 2. Backgroundinconsistency and inefficiency. In the past some All plant, which handles fissile material, mustplants have had a CIDAS fitted simply because be shown to be safe from Nuclear Criticalityno attempt was made to make an omission incidents.argument, In these cases, it is a complicated Sound engineering principles are followed atALARP issue as to whether it is possible at a the design stage, which gives some inherentlater date to downgrade or even disconnect the safety to the plant. Sometimes devices areCIDAS. needed to protect against maloperations that
In this paper, the many issues associated with could potentially lead to a criticality incidentCIDAS omission arguments will be discussed and operators have to take actions under certainfully and some solid ground rules will be circumstances to give comprehensive andsuggested. Many opinions that have been robust assurance that the occurrence ofexpressed over the years will be examined and a criticality is incredible.comparison will be made of the British So, in summary, a Criticality Safety Caseapproach to the American approach. The demonstrates the incredible nature of an event,authors have experienced various approaches to taking controls, protection systems and safetywriting CIDAS omission arguments by several measures into account.different organisations and have had lengthy Meeting the 'Double Contingency' principlediscussions with the UK Regulator. This criterion and/or the achievement of a quantifiedexperience means that the paper will present risk target are equivalent to the demonstrationsand discuss several different ideas and of safety to that given above.approaches, giving both the advantages and However, regardless of the way the safety casedisadvantages of each approach. is framed, there is a remaining concern that,There are criteria based on low dose following an incident which may occur becauseconsequences, but these are not discussed here. of a fault sequence that has not been anticipated,
that the plant should remain under control and
- 758 -

JAERI-Conf 2003-019
that doses should be reduced as far as possible reactivity or of the intrusion of material unlikelyby rapid evacuation. to be present. Also, the assessor should notIn order to address this concern, Criticality countenance abnormal accumulations ofIncident Detection and Alarm Systems material well beyond those which could be(CIDAS) are installed in plant dealing with expected in the natural order of events or withinfissile material. The alarm systems are used to a period in which the control failure is bound toevacuate personnel from the plant in the event be revealed.of a criticality incident. So, in summary, the safest case has toSometimes arguments can be and have often demonstrate that an incident is incredible whenbeen made to omit a CIDAS from a particular all the controls are in place and the CIDASarea. Several sets of omission criteria that have omission argument as to demonstrate that anbeen used are described below. In some incident is "not reasonably expected' when allorganisations, if a CIDAS omission argument the controls have failed.cannot be made, extra shielding is added toconfine problematic doses to an area that is All plant, which handles fissile material, mustamenable to control. have a robust safety case based on zero or low
risk and defence-in-depth with regard to safety3. The Criteria measures. With that in place, a decision has to
be made about which plants can be operated
3.1 Aspinall and Daniels (A&D) with a CIDAS omitted and which ones cannot.How do we decide when we can omit a
The criteria that are accepted by the majority of CIDAS? We believe that Aspinall and Danielsthe UK nuclear industry were formulated by tried to differentiate between plants that wouldAspinall and Daniels in 1965'). Their paper be expected to move towards a critical situationincluded a review of the custom and practice at if the controls were removed and plants thatthe time with regard to CIDAS systems, a would be expected to remain safe by the naturediscussion of the philosophy of Criticality of the material and the process involved.Incident Detection some recommendations and An illustration we give of the two types of plantsome proposals for criteria. Their report is can be seen by comparing the steering wheel ofwritten in a non-prescriptive way and the a truck and the flood barrier on the riverauthors have rightly adopted a pragmatic Thames in London. If the driver of a truck on aapproach so that several alternative routes may cliff road stopped controlling the direction ofbe followed. They say that the enquiry into the truck with the steering wheel, there wouldwhen alarm systems should and should not be soon be an accident. If the flood barrier on thefitted was the most elusive part of the review. river Thames were removed from service for sixThey said that it was commonly believed that months, then it would not be reasonable tothere was a real need for guidance as to when a expect floods in London during that time.
CIDAS could be omitted, but that it was 3.2 The HSE SAPsdoubtful that general definitive rules to this end
could be fi-amed. Their intention was that the The UK regulator of nuclear plants is thecriterion should be flexible and be based on Nuclear Installations Inspectorate (NII) of thejudgement. The criterion is: - Health and Safety Executive (HSE). The HSE
"Criticality detection and alarm systems shall produced a set of Safety Assessment Principlesbe provided at all places where fissile material to be used by the NII in establishing whether amay be used or stored unless it is confidently safety case is adequate.judged that in the event of the failure of any or With regard to CIDAS they say: -
all of those criticality controls that rely on "Safety systems should be provided to deal withhuman agency or on mechanical or electrical criticality incidents in line with thedevices, criticality would not be reasonably requirements of the principles presented aboveexpected having regard to the nature of the and they should be the primary defence againstparticular operations andfacility concerned. such events. However, in many operatingThey also say in support of the criterion that situations it is not possible to be confident thathaving countenanced the failure of controls that all the potential criticality fault sequences havefurther improbabilities should not be imported been foreseen and, therefore, that the safetyinto the situation. For example, the assessor systems will be adequate. A CID systemshould not countenance the deliberate and provides an additional layer of safety bydifficult manipulation of material into ingeniousbut unnatural forms and shapes of extra
_ 759 -

JAERI-Conf 2003-019
causing prompt evacuation of personnel and b) Numerical valuefor reasonable expectation.therefore limitation of consequential dose. The Safety Case demonstrates that an incidentPrinciple (P210): Adequate criticality incident is incredible. Probabilistic Risk Assessment candetection (CID) systems should be provided at be used to quantify the frequency of a criticalityall places where fissile material is present, event and a value of 10-6 per year, say, isunless an assessment shows that ... the predicted equivalent to 'incredibility'. When the A&Dfrequency ofthe excursion is acceptably low criterion is being used, it would seem sensible
therefore to try to use PRA to demonstrate thatOn the face of it this looks like a different a criticality event is 'not reasonably expected'criterion to A&D. After all, there is no mention and to defirie an equivalent numerical target.of failure of controls so the 'predicted Unfortunately the many attempts that have beenfrequency' of the excursion could include made to do this have ended in failure and thesuccessful operation of safety measures and the conclusion was reached that the techniques ofcriterion is suggesting that a numerical PRA are not compatible with Aspinall andfrequency should be predicted. Daniels. There are several reasons for this.However, it is known that the NII think that the Firstly, PRA arguments are of necessity based
A&D approach is a valid one in principle and around and rely on components of the safetycan be considered to be broadly equivalent to case that can be given a numerical value. Thesethe SAPs Principle (P210). The NII would not components are often to do with the reliabilityreject cases because they were not based on a of hardware systems. If the safety case is justnumerical calculation and they would look for a based on this type of component, and all thejudgement about the quantity and nature of the controls are then deemed to fail, the casematerial and the nature of the process. For collapses and the indication is that criticalityexample, in an area where there was a large would be expected. Many successful safetyinventory of fissile material and a lot of active cases are not quantified and do include factorscontrols, particularly ones relying on human about the nature of the material that it is notintervention then it would be likely in their necessary to quantify. Secondly, the usual wayview that a CIDAS could not be omitted. of performing PRA is to stop when the target
frequency has been reached. In reality the real4. Implementation issues frequency of criticality may be slightly less than
the criterion or a lot less than the criterion. ThisImplementation of the criterion in the UK has again means that when the failure of theoften resulted in disagreement and conflict, controls is assumed, the safety case collapsesinefficiency and inconsistency. It is usual in our and criticality looks likely.experience that an assessor and a peer reviewer With regard to the numerical frequency that iswill not share the same opinion about whether a equivalent to 'unreasonable expectation', somesuccessful CIDAS omission case can be made. workers suggested a igure of 10" per year. NoThe following issues have contributed to the consensus was reached on this, however, andvariation in opinion. suggestions from assessors varied widely.
a) Definition of Control. Some controls are c) Upstream plant. The controls in an upstreamclearly in place to help to prevent a criticality plant may have a significant affect on the safetyincident. There are other controls that are in of the area under consideration. The applicationplace to ensure that the process under of the A&D criterion must include aconsideration is carried out properly. For consideration of the controls in upstream plant;example, in a fissile material dissolution but do the controls in that plant have to beprocess it is important to know that that the assumed to have failed? Further, could it bedissolution has been complete and the assumed that the presence of a CIDAS in anundissolved residue is free from fissile material. upstream plant would protect the plant underThere would be a criticality control on the consideration from criticality?fissile content of the residue using a directmeasurement. There would also be a d) Calibration. The guidance given by A&Dtemperature control on the dissolver that would states that the failure should not be assumed tobe there to make sure that the temperature continue for a length of time beyond what isneeded for efficient dissolution was maintained. reasonable. Many instruments are calibrated orThe question would then arise as to whether the standardised at regular intervals and so it seemslatter control was a criticality control? unreasonable to assume that they are in a failed
state for a prolonged period. For example, if adrum monitor is calibrated after every drum
- 760 -

JAERI-Conf 2003-019
measurement, then is it acceptable to assume in our view, by assessors, approvers, peerthat only one drum could be incorrectly reviewers and regulators alike is to quicklymonitored? On the other hand, should the develop an almost instinctive feeling that acalibration itself be assumed to have failed CIDAS is needed or can be omitted. Evidence isbecause it relies on human agency? then quite naturally sought to bolster or
underpin the original 'gut feeling'. This has lede) Reasonable duration. Many plants work a to omission arguments that are rigorouslyshift system where the operators are replaced constructed using the A&D principles beingevery eight hours, for example. When applying rejected by safety committees, peer reviewersthe A&D criterion it is often assumed that the and assessors. This point is continued below.controls will only be failed for three shifts. Thislength of time relates to our every day h) Lack of consistency. In our experience, it isexperience and our perception of multiple rare that a CIDAS omission argument isfailures to perform certain tasks. Is this accepted by all of the approvers, peer reviewers,reasonable and would a slow deterioration of safety committees, independent nuclearsafety go unnoticed for longer? assessors and regulators that pass judgement on
it.f) Magnitude offailure. This has proved to be Sometimes a CIDAS omission case is writtenone of the most contentious points in making a strictly following the guidelines of Aspinall andCIDAS Omission argument. The A&D Daniels but the reviewer still 'feels' that heguidance says that all controls must be deemed would be much happier if a CIDAS system wasto have failed but that parameters that are the installed.subject of these controls should not be assumed Sometimes, the reviewer is working to anto attain values that are beyond what is alternative set of criteria that he personally feelsnormally expected, taking into account the is valid.nature of the material and the normal rate at On other occasions the reviewer agrees inwhich it arises. To an extent, once the controls principle with A&D but feels that 'worst casehave been deemed to fail, there is an element of values' should be assumed for parameters.judgement about how far a parameter should be Sometimes authors just repeat the 'safety case'assumed to have varied following the failure. because they feel that to sanction the failure ofThe values that could be assumed are: all the controls simultaneously is too onerous.
Typical levels Sometimes the arguments put forward haveWorst level ever seen nothing to do with the failure of controls butManagement process action levels rather are to do with the pessimism of theWorst non-nal level in the Safety Case method used to demonstrate safety.Worst foreseeable contingency level Sometimes the author will claim that operationsWorst iaginable level are so meticulously carried out and checked by
extremely conscientious and ighly trained
In our view the level that should normally be operators that they don't have to sanction thechosen is the 'worst normal level in the Safety failure of those operations.Case'. This level has been chosen in the safety We would like to point out that we have manycase to pessimistically bound all expected times been in the position of author and manyvalues, but will still comply with the spirit of times in the position of reviewer.
Aspinall & Daniels. The use of more optimistic 5. Comparison of UK and USA criteria.values would need to be fully justified.
Obviously these are not parameters that are ANSI/ANS-8.3-1997" is the consensuscertain to get worse because the control has standard in the US that many regulators havefailed. An example would be the moisture adopted. In cases where the inventory ofcontent of plutonium oxide powder, which is "fissionable" material exceeds specified limits,low because of the way it is produced and a Criticality Accident Alarm System (CAAS isstored and not because it is monitored. required. Installation of an alarm implies a non-Some assessors in the past have erroneously trivial risk of criticality. DOE 420.1 allows anproposed that with all criticality controls failed exemption if it can be shown that a criticalitythe worst imaginable parameter values should accident is incredible due to the physical formbe assumed. This is not in the spirit of Aspinall of the material or if the frequency is determined& Daniels. to be less than 10-6 per year.
g) Subjective bias. The way that CIDAS This does not, at first glance, appear to be theomission arguments are normally approached, same as the UK guidance.
- 761 -

JAERI-Conf 2003-019
The omission argument in the US can be based 7. Extreme Position 2on engineering judgement rather than a formalPRA. This is in the same spirit as the A&D In this section we will adopt the position that aguidance. CIDAS need never be installed.The US Standard suggests that overall risk "Every plant must have a safety case thatshould be evaluated. This not currently required demonstrates a sound engineering basis,in the UK. defence in depth and a robust justifiedThe US policy allows for the physical form to assertion that a criticality event has a very lowbe taken into account, which echoes the A&D frequency of occurrence. This means that allguidance. plants are equally safe in theory. When a safetyThe questions remaining are: - case is constructed, it is really the frequency of
• When all the caveats are included, how an event that is shown to be acceptable. Thedifferent are the two methodologies? actual risk is not calculated although the
• Would the outcome be the same for assumption of a fatal dose does address risk toidentical plants in the UK and the US? an extent. The presence of a CIDAS is not
• Can a new safety measure be added in included in the demonstration of safety. It is noteither methodology to remove the need for referred to in the safety case. An acceptablea CIDAS/CAAS? level of safety and an acceptably low frequency
• Could a new passive feature be added to is achieved without reference to the CIDAS.remove the need for a CIDAS/CAAS? If we were going to calculate real risk saving,
• Is there as much disagreement in the US as we would have tothere is in the UK? a) Calculate a total yield that would result from
criticality in the specific system under
6. Extreme Position I consideration.b) Determine the 'shape' of the excursion to see
In this section we will adopt the position that a if there is a single spike or repeated spikes andCIDAS should always be installed. "The if there are repeated spikes, how far apart theyfundamental point is that the safety of the plant are in time.must be demonstrated as a whole from c) Calculate the real frequency of criticality andconception to implementation. There must be not just show that a target is achieved.sound engineering and a robust deterministic d) Include an accurate location and shielding inbasis demonstrating defence-in-depth followed the dose calculation.by an assessment probabilities and risk. Beyond e) Include the occupancy, the speed ofall that, if there is a criticality incident, we must evacuation and the path taken by the evacueesknow about it so that we can rapidly evacuate 0 Include the dose at the evacuation assembly
affected personnel to minimise the risk to them. point.The CIDAS is an important part of the 'whole' g) Include in the calculation of risk thesafety case. likelihood of conditions necessary for criticality.It is well known that many incidents and h) Include the reliability of the alarm system
potential near misses in the past have occurred itselffollowing sequences of events that had not been i) Include data on accidents arising from 'False
foreseen until they happened. One event in the Alarms'UK resulted fom the presence of solvent in a j) Include resulting non-criticality relatedvessel where it had not been expected and accident risk.another resulted from the fact that plutonium It is unlikely that these calculations would benitrate solution fon-ned a solid accumulation undertaken and so the real risk saving, if any,when it leaked from an evaporator vessel. We will never be known.must guard against the unforeseen fault It is well known tat criticality incidents cansequences and include a CIDAS as a final have a range of characteristics, including anbackstop to guard against them. A large number initial fission spike, a plateau of constant fissionof plants contain many critical masses and it is generation, repeating fission spikes or someonly carefully maintaining a specific combination of these. A CIDAS would notconfiguration that prevents criticality. This is protect personnel from a single spike. A CIDASfurther evidence that it is only administrative would only save lives if the spike was not lethal,procedures that are keeping the plant safe. but subsequent dose accumulation was lethal.Moreover, consideration should be given to This narrows down the range of incidents thatadding shielding around those areas where there might be mitigated by a CIDAS.is the highest likelihood of a criticality incident" It is not a requirement that personnel should be
behind shielding when they carry out tasks and
- 762 -

JAERI-Conf 2003-019
the implication of this underpins the fact that f) Assume failure has gone on for three shiftsrobust safety case is sufficient. Combining this g) Don't assume that an upstream CIDAS offersfact with a single spike incident means that the protection but don't assume that upstreammaximum individual dose would not be reduced controls are completely absent.by the evacuation. h) Try to construct a model that would resultExtra risk saving is supposed to be judged from the failure of the criticality controls.against the ALARP Principle. This principle i) If this model is safely subcritical you havestates that risks should be As Low As achieved successReasonably Practicable and to comply with it, j) Make a judgement as to whether this is thethe risk saved by a measure, must be shown to type of plant that would move rapidly towards aoutweigh the cost of the measure. It follows critical configuration if the criticality controlsfrom the fact that no attempt is made to were removed.calculate the risk saved that the installation of a k) Be extra cautious if there is a large fissileCIDAS cannot be shown to meet the ALARP inventory and/or lots of operational control.principle. The US Standard, by the way, 1) If there are no criticality controls; byimplies that overall risk should be reduced but definition a CIDAS will not be required.again if the overall risk is not calculated or not in) Judge whether a CIDAS can be omitted.calculated properly then how can a decision bemade? 8. Conclusions
In summary, The history of CIDAS omission arguments has• Plants are shown to be adequately safe and been characterised, over many years, by
to meet low frequency targets. disagreement between authors and reviewers.• Modem safety cases have pretty well got This has led to prolonged debate, extra human
all possible fault sequences covered. resource usage and delayed implementation.• The frequency of criticality is probably a The ideal situation would be to have a national
lot less than quoted because most safety consensus on the formulation of CIDAScases contain a great deal of pessimism in omission criteria. Once this was in place,the model. training could be given to all personnel
• This means that potentially the CIDAS is intending to author or review CIDAS omissionmoving the risk from 'negligible' to cases. Only personnel who had been through,extremely negligible'. the training would then be accredited to author
• The risk saving is not quantified and it or review cases.would be very difficult to quantify it as Clearly this process would be managed by thethere are many factors influencing it. UK ndustry criticality forum with a significant
• A CIDAS would only reduce risk from input from the regulator.
dose in a narrow band of incidents wherethere was frequent occupancy, little References
shielding, efficient evacuation and where 1) K.J.Aspinall and J.T.Daniels "Review ofthe fission yield curve was such that the UKAEA Criticality Detection and Alarminitial spike dose would not be fatal but the Systems 1963/64 Part 1: Provisions and Designaccumulated dose would be fatal. Principles, also Amendment of Proposals
For all these reasons it is clear that a CIDAS concerning Plutonium Systems, AHSB(S) R92,can always be omitted and maloperations 1965.
detected in other less rigorous ways." 2) ANSI/ANS-8.3-1997 American National
8. Ground Rules For Successful Argument. Standard: Criticality Accident Alarm SystemMay 1997.
a) The CIDAS omission argument must startwith the safety case.b) For each area the controls are identified.These are the key criticality controls identifiedand criticality controls arising from aconsideration of the ALARP principle.c) Assume that these controls have failed.d) Yes, You really do have to assume all thecontrols have failed!e) Allow other parameters to attain the worstnormal values quoted in the safety case.
- 763 -

JAERI-Conf 2003-019 JP0450143
Updated Rules for Mass Limitation in Nuclear Plants
Vdronique ROUYER'*, Xavier KNEMP', Igor LE BARS', Julien RANNOU1 and Christelle WEBER 2'Institut de Radioprotection et de Sfiret9 Nucliaire, BP I 7 92262 Fontenay-aux-Roses Cedex, France2Nuclear Engineer Student at ENSPG (Ecole Nationale Supgrieure de Physique de Grenoble), France
The safety justification of uranium and plutonium handling in nuclear plants can followsimple rules which impose, for each criticality unit, fissile mass limits according to thequantity of moderator likely to be in contact with the fissile material.
The study aims to formulate proposition of new practical recommendations to preventcriticality hazards during the handling of fissile material masses. Its major objective is toreformulate current rules to make them easy to apply, without any ambiguity in theirinterpretation and to avoid any mistake in the practical use. Particularly, the effect of anon-homogeneous repartition of moderation by water is studied. This proposition resultsfrom a validation study using today's criticality calculations tools and nuclear data libraries.
KEYWORDS. mass limitations, non-homogeneous repartition of moderation
1. Introduction - when a double loading is impossible andconsidering a minimum distance of 60 cm
In some nuclear facilities where plutonium or between two neighboring criticality units.uranium are processed, nuclear criticality safety isachieved by exercising control over the mass of fissile Table Usual recommended mass limits ofmaterials and by limiting the moderating media that plutonium.can be added to it. *for Pu in y form (oxide, metallic a or 8).
For many of them, criticality safety disposals are Moderation H <2 2< H 20 H >20based on recommendations established by the former area _Fii PU - PuFrench "Atomic plants safety commission (CSIA)". 10 kg of PuThe aim of these recommendations, dating from years in oxide1966 and 1968, was to provide practical easy rules to formplant operators 1-2). These rules derived from data Impossible (maximumobtained while using old calculation codes. double of density)
The aim of the present study is to perform new loadingcalculations using recent criticality codes (standard 5.2 kg of 3.4 kg 350 groute of CRISTAL VO package 3)) in order to propose (separated metallic Pu of Pu* ofPu*new formulations of the former recommendations, by 60 cm (5 phase)edgetobased on limits of fissile material mass and water edge)volume, which are easier to apply by plant operators. 4 kg ofThese fonnulations will take into account the impact metallic Puof a non-homogeneous repartition of water in the (a phase)
fissile material and the risk of a double loading during Double 6 kg of Pu inthe fissile material handling. Moreover, the increase of loading not oxide formreactivity due to the presence of different reflectors totally (maximum
near fissile material has been assessed. excluded of density) 2 kg 200 g
2. Current French rules (separated 2.5 kg of Of Pu* ofPu*by 30 cm metallic Pu
The recommendations presented in "Table I" and edgeto (a or "Table 2 deal with the maximum allowable mass of edge) phase)
fissile material per criticality unit, for plutonium andhigh-enriched uranium and for three moderation ratioareas:
when a double loading is not totally excludedand considering a minimum distance of 30 cmbetween two neighboring criticality units,
Corresponding author, Tel. 33-1-58-35-74-04, Fax. 33-1-46-57-29-98, E-mail: veronique.rouyer�irsn.fr
- 764 -

JAERI-Conf 2003-019
Table 2 Usual recommended mass limits of uranium of water deduced from mass limits of fissile materialin any form. related to H/X limits. It seems to be more relevant to
Moderation H < 2 :2 < H < 20 H > 20 base the mass limits per criticality unit on valuesarea U U U defined as couples (fissile mass, volume of water or
Impossible equivalent).doubleloading 600 g 3. Calculation methods
(separated 16 kg of U 4 kg of U of U 3.1 The CRISTAL package 3)by 60 cmedgeto The calculations have been made with theedge) CRISTAL criticality package VO.2 version developed
Double by the COGEMA Company, the Commissariat Aloading not I'Energie Atornique (CEA, France) and the Institut de
totally Radioprotection et de Sfiretd Nucidaire (IRSN,excluded 350 g France). The CRISTAL package uses different(separated 10kgofU 2.5kgofU of U computer codes (APOLL02, MORET4 and
by 30 cm TRIPOL14) with JEF2.2 and CEA93 cross-sections
edgeto libraries.edge) The CRISTAL package is based on two calculation
schemes:
These recommendations are resulting from two - the "standard scheme" uses multi-group4) cross-sections obtained by the APOLL02
studies published in 1966 and 1967 . The fissile computer code through condensation andmedia retained are high-enriched metallic uraniumwith water, metallic 239pU in a and phases with water homogenization of the CEA93 cross-sectionsand oxide form 239PU02-H20. The calculations basis library (these library being established by theconsidered are an homogeneous distribution of the NJOY processing of the EF2.2 evaluation). Thefissile material and an homogeneous distribution of scheme is also based on the collision probabilitymoderation by water. method Pij) and the resolution of the Boltzmann
The first step of the method used to establish these equation by the Monte Carlo computer coderecommendations consists in determining the MORET4 (using 172-group cross-sectionsminimum critical mass of an isolated sphere of fissile previously calculated by APOLL02) or the Simedium reflected by 20 cm of water (full reflection). modules of APOLL02 (after a 20-groupThen, by applying to this mass the safety coefficients cross-sections homogenization);usually used in France5), namely 043 in case of a - the "reference scheme" is based on thedouble loading risk and 07 if the risk of double Monte-Carlo continuous-energy computer codeloading is excluded, the corresponding safe masses are TRIPOL14 using point-wise cross-sections from
established. the EF2.2 evaluation.
In the second step, to prove that these safe masses The calculation scheme APOLL02 Sn also enablescan be acceptable limits in presence of several to determine the value of a geometrical parameter (thecriticality units, check calculations are made for an radius of a fissile material sphere for instance) givinginfinite plane array of fissile material spheres a predetermined ktT value: this method based on asurrounded by a variable thickness of water and dichotomous calculation model has been used todistant edge to edge of 30 or 60 cm. The conditions of establish the mass limits presented in the chapter 42.reflection, equivalent to 20 cm of water, are
represented by a 60% optical reflection on the superior 3.2 Density of fissile materialand lower plans of the lattice array. As the former CSIA recommendations are based on
Several improvements can be brought to the old calculations codes, using nuclear data libraries andmethod described above. First of all, the physical data that are mainly different from thoserecommendations don't take into account the performed with CRISTAL package, the calculationspossibility of a non-homogeneous distribution of done for this study can give different results than themoderation that could lead to a significant increase of previous ones.
reactivity. Secondly, these mass limits are not Another main difference between the calculationsestablished for more constraining conditions of done in this study and the former calculations is thereflection than water such as concrete. density considered for the fissile material studied. The
Besides, the classification of the mass limits new calculations are done with the largest valuesaccording to the moderation ratio H/X makes q found in different standards and handbooks in order todifficult the use of these values. The applicatio be upper-bounded.
this classification may be confusing for The following table presents the densities takenoperators when implementing equivalent mass 1i
- 765 -

JAERI-Conf 2003-019
into account in today's study and in the calculations 8
used to establish the CSIA results. -7 -------
11�_ �Table 3 Density of the fissile material considered inthe study-
J) --------X dens ty (g/cmFissile material 4
Today's Former CSIAM study study 3
metallic U 18.9 18.8 How
metallic Pu (cc phase) 19.86 19.6 or 19.26 Me
metallic Pu 5Thase) 15.65 1 65Pu in oxide form I 0 I I J9 �� � 0 5 10 15 20 25 10
U mass (kg)
The previous table shows that the density Of P02 Fig. I Critical curves of high-enriched metalliccorresponding to the values supplied in the last line of uranium for an homogeneous repartition (dotted line)the table is equal to 11.46 g/cm' in the today's study and a non-homogeneous (continuous) repartition ofand 10.5 g/CM3 in the former one. moderation by water.
The dilution laws linked to the fissile material
studied (U metal, Pu metal in cc or phase, Pu in For uranium, the non-homogeneous distribution ofoxide form) are based on the theoretical volume moderation (continuous line) is more restrictive thanaddition law which states that the molar volume of the the homogeneous distribution of moderation (dottedfissile material is constant through the all line). The maximum difference on the kff valueconcentration range. between these two types of moderation is equal to 3.
For uranium, the non-homogeneous distribution of4. Results moderation is selected for further calculations.
Moreover, for all the physic-chemical forms of4.1 Effect of the distribution of moderation by plutonium, no significant difference appears betweenwater both types of moderation distribution. For plutonium,
The APOLL02 Sn model calculation taking into the homogeneous distribution of moderation isaccount a non-homogeneous distribution Of selected for further calculations.moderation by water is made up of three concentric
6)spheres in order to be the most upper-bounded 4.2 Proposition of new limits
This model includes, from the center to the external For a sphere reflected by 20 cm of water,area, a sphere of fissile material moderated by water, a calculations were performed to check the coherenceenvelope of dry fissile material (H/X=O) of variable between the mass limits presented in "Table I" andthickness and then 20 cm of water. "Table 2 with the following criteria:
For each thickness of dry fissile material, the radius (kff + validation bias) 095 in a normal situation andof the central sphere leading to a predetermined kff (ice.ff + validation bias) 0975 when an abnormalvalue is calculated with different H/X moderation double loading situation is not totally excluded.ratio into this sphere. Validation biases are defined in the chapter .
Results are presented according to the two The 0975 criteria corresponding to an abnormalinteresting variables: mass of all the fissile material situation of double loading, which can't be completelyand the corresponding volume of water. excluded in spite of the implemented particular
"Figure I" presents results obtained for uranium. disposals, is justified by the margins taken intoEach curve is relative to a specific value of the dry account and because of high numbers of criticalenvelope thickness (variable between 0.01 cm and experiments, which characteristics are very close to3 cm). The tangent of the set of curves limits the calculations model.domain inside which the predetermined kff value This check shows a good agreement betweencan't be exceeded for any moderation distribution former and new calculations. The main difference(upper-bounded curve). observed is relative to dry plutonium oxide and is due
to the choice of the density for this fissile medium.The current mass limits for the P02 are 6 kg of Pu(double loading not totally excluded) and 10 kg of Pu(double loading excluded) for a realistic density of10.5. New calculations indicate that the minimumcritical mass of the Pu in oxide form is equal to11.96 kg, corresponding to a theoretical P02 densityof 11.46. For this density, the maximal allowablemasses of kg of Pu and kg of Pu can be proposed
- 766 -

JAERI-Conf 2003-019
as new limits respectively when the double loading loading and 1.8 liters in case of double loading can becannot be totally excluded and when the double used for every fissile media.loading is excluded. For dry metallic plutonium As an illustration of margins, the couples (mass,(cc phase), the kff + validation bias) value for kg of volume) presented in "Table 4 are compared withfissile material full reflected by water is slightly over values obtained for different kff as presented on0.975, not enough to reduce the current mass limit of "Figures 2 3 and 4 in the last page. In the case of a2.5 kg in the case of an abnormal situation of double possible double loading, the represented kff values areloading. relative to 2M kg of fissile material moderated by
The envisaged recommendations are essentially 2V liters of water.based on a couple of parameters ssile mass limit,volume of water or equivalent limit) to be applied to 4.3 Validation of proposed limits in case ofevery criticality units stored in a lattice array. The presence of different reflectors and effective doublemain concern in this process is to preserve a loading of fissile materialmaximum of coherence with the current The propositions of new mass limits presented inrecommendations and to maintain three moderation "Table 4 have been established so that the effectiveareas by the definition of the three following multiplication factor including calculation bias, for ancategories: low moderation, limited moderation and isolated sphere of fissile material reflected by 20 cmunlimited moderation. Particularly, for the limited of water, should be lower than 095 when the doublemoderation category, a common volume of water is loading of fissile material is impossible and lower thanproposed for all types of fissile material. These 0.975 on abnormal double loading situation.proposals are consistent with the CSIA limits defined It has been checked that the maximum allowableby H/X=20. The notions of possible and impossible masses of fissile material and water per criticality unitrisk of double loading as well as the distances between respect the foresaid criteria for an infinite plane latticeunits 30 or 60 cm) are kept. The water volumes array of fissile spheres as presented in the chapter 2.]igniting these three new areas are different if the risk The same model has been used with differentof double loading is possible or not. reflectors, installed at the same distance than the
All these new limits are compiled in "Table 4. former CSIA calculations 30 cm or 60 cm) or incontact with fissile material on both sides: the
Table 4 Fissile mass limits versus the water volume reflectors studied are a 20 cm thickness of water and a(or equivalent) in the fissile medium. 60 cm thickness of concrete.
*for U in any The calculations have been made with a variableU* PU02 PU 8 PU a thickness of water around the fissile spheres. In case
d<18.9 d<10.11 d15.65 d19.86 of possible double loading, one of the spheres in thelattice is considered as having a double mass.
Low 16 kg 8 kg The results given by the APOLL02-MORET4Impossible moderation V.5'1.51 V.:52 I calculation route show that the different mass limits
double established for isolated spheres of fissile material areloading 4 kg still valid when the double loading of one of the
(minimum Limited spheres is effective and with an optimization of the60 cm moderation 7 kg 5.2 kg water envelope thickness.edge to V< 3 liters The ipact on the reactivity due to the presence of
edge) -- concrete as reflector has been performed. The biggestFUn!1imited 600 g 350 g difference on the kff values between thisI moderation configuration and an isolated sphere reaches 2% for
dry plutonium in oxide form. The maximum of kffLow 10 kg value (including uncertainties) is equal to 098 for
Double moderation VSO.61 PU02 with a double loading. So, limits should beloading reviewed if a concrete reflector in contact with fissile
not totallyexcluded Limited material must be retain for criticality units.
(separated moderation 2.5 kgby 30 cm V< 1.8 liters 5. Validation of the CRISTAL packageedgetoedge) The complete validation of the CRISTAL VO.2
Unlimited 350 g 200 g package is detailed in an other paper presented duringmoderation ICNC2003 conference. It contains about 540
experiments from the ICSBEP database and gathers aThe curves (mass, volume) show that, for the large variety of geometries, fissile material
limited moderation category, the values of water characteristics and moderation ratios. In order tovolume limits defined as 3 liters in case of simple determine the bias of calculation eventually due to the
- 767 -

JAERI - Conf 2003 -019
standard scheme of the CRISTAL package used to and the "reference scheme" has been performed for allobtain the previous results, a comparison between the the results given in "Table 4 the discrepanciesfissile material taken into account in the study and the between the three calculation routes are lower than thevalidation base has been realized. uncertainty 3a (with a equal to ±0.002) on the kff
The data relative to plutonium nitrate solutions and values given by the Monte-Carlo continuous-energyhighly enriched uranium have been chosen. These computer code TRIPOL14.fissile material are moderated by water and reflected By considering the safety margins taken intoby polyethylene (CH2),,, water or are non reflected. account to set up the new mass limits in the study and
The "Tables and 6 show the discrepancies the low discrepancies on the kff values between thebetween the CRISTAL calculations and the CRISTAL calculations codes and the experimentsexperiments results for the selected benchmarks from results from the ICSBEP database, it can be said thatthe validation data bank. the results given in the study are accurate enough and
validated.Table "Calculation - Experiment" discrepancies
for Plutonium benchmarks. 6. ConclusionBench- Code Nb. of 24 H/Pu AJI'ffmark exp. wt. This proposition of new practical recommendations
0.5 to 100 intends to prevent criticality hazards during thePU A2-M4 67 19 to +0.61 handling of fissile material masses. Its major objective
SOL 2800 is to reformulate former rules to make them easy toTHERM 0.5 to 100 apply, without any ambiguity in their interpretation
A2 Sn 18 19 to +0.79 and to avoid any mistake in the practical use. These2000 recommendations result from a validation study using
PU A2-M4 8 1.8 to 0 -0.68 today's criticality calculations tools and nuclear dataMET 20.1 libraries.
FAST A2 Sn 9 1.8 to 0 -1.1320.1 References
1) CSIA recommendation N' 66-216, 1966).Table 6 "Calculation - Experiment" discrepancies 2) CSIA recommendation N' 68-304, 1968).
for Uranium benchmarks. 3) J.M. Gornit (et al.), "The new CRISTALBench- Nb. of 215U Ak�ff criticality-safety package", Proc. Int. Conf onmark Code exp. wt. HIU (%) Nuclear Criticality Safety, ICNC'99, Versailles,
40 to France, Sept. 20-24, 1999, I, 308 1999).HEU A2-M4 26 93.1 1000 +0.70 4) "Nonnes pouvant s'appliquer A des chaines deSOL 64 to fabrication mettant en euvre du plutonium et dont
THERM A2 Sn 6 93.1 77 +0.23 la sdcuritd est assur6e par des limites de
90 to masse", note SCMC N'66-165, 1966), andHEU A2-M4 6 97.7 0 -0.51 "Nonnes pouvant s'appliquer A des chaines de
MET 90 to fabrication mettant en ceuvre de l'uraniurn enrichiFAST A2 Sn 5 97.7 0 -0.77 et dont la s6curM par une limite de masse", note
SEC N-67-125, 1967).
The benchmarks taken into account show a good 5) L. Maubert, "Standard de criticit - Massesagreement between the CRISTAL "standard scheme" minimales critiques", note CEA-N-2051, 1978).and the experiments results. Moreover, the 6) L. Aguiar, 1. Le Bars and M.Vertnuse, OriginalAPOLL02-MORET4 and APOLL02 Sn calculation method for determining maximum permissible orroutes give very close results. For highly moderated critical minimum (fissile material mass/ moderatorsolutions, it can be seen that the two routes lead to a mass) pairs", Proc. Int. Conf. on Nuclear Criticalityslight over-estimation of the keff values, and for non Safety, ICNC'99, Versailles, France, Sept. 20-24,moderated metallic material the CRISTAL VO.2 1999,1, 237 1999).
"standard scheme" give a little under-estimation of theeffective multiplication factor. In the study, except forunlimited moderation cases, calculation bias of 0.5%for uranium and 07% for plutonium are considered.
Then, a comparison between the "standard scheme"
- 768 -

JAERI-Conf 2003-019
'7
6_A7 --w--puO2
_T --,b- Po deltaT
Mm knit fir Ri 8 andS 5 --41--Pu apha
RQ vA= V 3 less
4 -Mas limit for RQ
- - - - - - - - - - - Wilh low
3
B - - - - - - - - - - - - -
2
> L- - -NIM hn* for R CX
wban V 2 3 lim
0 2 4 6 9 10 12
M Fissile material am per unit (kg)
Fig. 2 Poposition of new plutonium mass limits with an ipossible double loading keff < 095).
5
Mm bnk Ex Po in any - - - - - - L --8-PuO2
fC1MvAICnV!5l.81ibS Po delta
L77 - - -- - - - - - _ --o- Po alpha
Mass t for PuO, with
lowroodwation
T
0
0 1 2 3 4 5 6 7
M Fissile material man per uRit (kg)
Fig. 3 Proposition of new plutonium mass limits when a double loading is not excluded keff < 097).
5 1 . I I I I I I I I
MaslimitwhmV:53libms -0---Irnp..sible double loading
4 (inVo-ble double ba&W --*--Double loading not excluded
3
for low Modwom MEISS holl fr low nmdwatim
ofdoubieloakig I(impossible duti* loadmo
2 P-7=
31
> Mao limit when V:� 1.8 km
in case ofdouble loading
0
0 5 10 is 20 25
M Fissile material mass per unit (kg)
Fig.4 Proposition of new uranium mass limits with a non-homogeneous repartition of moderation.
- 769 -

JAERI-Conf 2003-019 JP0450144
Irradiating Complex on BIGR Reactor for SimulationAccidents of RIA Type
Vladimir N.BOGDANOV, Vladimir 1. IL'IN, Vladimir F.KOLESOV, Michail LKUVSHINOV,Valery TYUNIN, Vladimir V.SAZHNOV, Igor G.SMIRNOV, Yury A. TRUTNEV, Vasily A.USTINENKO
Russian Federal Nuclear Center - All-Russian Scienrific Research Institute ofExperimental Physics60 7188, Sarov, Nizhni Novgorod Region, Russia
There are adduced the description and characteristics of irradiating complex built on the pulse reactor BIGR forsimulation of emergencies with rise of reactivity.
The current condition and prospects for the inturnescense at fuel condition close to meltdown.development of nuclear power needs the Such intumescense leads to overlapping of gapssubstantiation and safety increase of NPP and their between fuel elements and blocking coolant flow.competitiveness in the power market. Thus, in the course of researches it turned out to
To solve these tasks it is necessary to ensure first be that it is necessary to carry out detailed researchestesting and licensing of existing and promising fitel of thresholds and mechanisms of fuel elements andwhat is impossible without experimental their components failure depending on burnout,investigations of nuclear ftiel characteristics. In duration and velocity of energy release in fuel, fuelconnection with the existing tendency of fuel burnout composition, material of cladding, etc. Moreover,growth for the purpose of improving economic there takes place a gradual transfer to new materials ofindexes of NPP, of particular acuteness is the cladding, technology of ftiel production, types of fueldefinition of fuel burnout degree effect to the limits of elements, higher burnout of fuel (to 6MW-day/kgits operability. Most representative are reactor in 4- and 5-year operational periods). All these aspectsinvestigations of ftiel that make it possible to simulate speak for the necessity of creation, perfection andmost completely the processes taking place in power development of reactor base needed to carry out ftielreactors. investigations. It should be mentioned that prior to the
One of significant aspects in this case is the early 90-s of the 20th centuy the experimental base fordetermination of power thresholds of fuel failure with the carrying out of the corresponding researches wasfresh and burnt out fuel under the condition of missing in Russia while the one available in the USSRreactivity accidents and the creation of database on had been actually lost.fuel behavior under different modes of loading and Over several years there have been and are beingconditions of fuel and coolant. carried out on BGR reactor A/ in VNIIEF the works
Deep researches of fast dynamic processes on the creation and investigation of fuel elementsoccurring as a result of neutron burst in the reactor behavior under the conditions simulating accidentsstarted in the seventies in the USA when there was with the reactivity growth.established nuclear regulatory commission (NRC) The fast pulse reactor BIGR possesses the recordand enhanced license requirements. Then, there were values of fast neutron fluences in large volumeselaborated the requirements to the designing of PWR accessible for irradiation, namely, - I - 1015 n/cM2 at theand BWR reactors in predicting severe consequences external surface of the core -800mm in diameter.caused by a possible accident of RIA type (RIA - One of BIGR reactor distinctions is the possibilityReactivity Initiated Accident). The peak fuel enthalpy of generating two types of pulses:(HPFE) was taken as a criterion; it must not be with half-width rj/2 - 210rns and T1/2 >0,4s. Thisexceeded at any abnormal or any other situation for makes it possible:any fuel element at any level of the core /I/. It was to compare the behavior of VVER fuel with PWRassumed that at such level of enthalpy there should and BWR ftiels (in the most complete program ontake place no failures in the core leading to violation fuel testing that have been being realized in Japanof heat removal capability sufficient for the core on NSRR reactor 56/ for more than 20 yearscooling. Initially HPFE was taken to be equal to with PWR and BWR fuels there can be used as a280cal/g of fuel for PWR and 170cal/g - for BWR 2/. rule "short" pulses I/2-(3-15)ms);These values were found basing on the results of - to analyze abnormal situations with durationexperiments performed with fresh fuel. (half-width) of pulse energy release TI/2-1-3s.
Further researches demonstrated that there exists The main goals of the works were as follows:appreciable dependence of threshold HPFE values on - development and creation of irradiating devicethe value of fuel burnout, degree of the shell oxidation, ensuring the levels of pulse energy input to theits composition and other parameters. The character of models of NPP fuel elements (including thosefailure may differ appreciably as well. For example, in with the burnt out fuel) achieving the thresholdsthe experiments on PBF 3 in RA 1-1 experiment of their destruction;there took place - through gas release - essential
- 770 -

JAERI-Conf 2003-019
definition of fuel element operability boundariesand getting of experimental results to provide for C.viftiel testing and licensing;creation of database for codes verification throughthe calculation of ftiel elements behavior under FC -
abnormal situations.Throughout the years passed there were
investigated several types of fuel elements, includingVVER 440 and VVER-1000.
The lack of reflector around the BIGR reactorcore makes it possible to irradiate models in large F..1 .d
irradiating facilities located near its surface. The last B.+gaphiL. F�+CH,
circumstance broadens essentially the potentialities of M-BIGR C-
the reactor because it practically lifts restrictions in Ca�i.g d C-
size and number of different additional devices (loop W.t.,+P.1YthY1-
facilities, breeders etc.) as compared to the reactors 7 777777"using only internal channels for irradiation. Moreover,
the experiments with ftiel (especially irradiated) are Fig. I Scheme of experiment realizationmuch more safe when they are realized outside thereactor core because of less probability of damaging The specialists of Russia Scientific Centerthe reactor itself and due to the lack of strict "Kurchatov Institute" and INM also took a part in thelimitations in material composition, size and design of whole program of investigations.objects and trial ampoules. Much attention was paid to the detailed
The irradiating devices on BIGR reactor are methodical substantiation of researches. Particularproduced in the form of blocks of reflector-moderators emphasis was given to calculation and experimental(BRM) with the characteristic dimensions of -600mm techniques of defining energy release and fuelplaced imediately adjacent to the side surface of the enthalpy. There was performed a series of specialcore. It has been already mentioned that the activities methodical experiments to verify and calibrateoutside the reactor core assists in increasing nuclear measuring techniques, substantiate the measuredand radiation safety at carrying out experiments and values and amplitude-time dependencies. Moreover,allows as well variation in wide limits of configuration for the experiments with fresh fuel elements VVER-and composition of experimental assemblies. 1000 there were elaborated the techniques of
There were performed the procedures of measuring pressure both in the capsule containing fueloptimizing geometry, location and material element and inside fuel cladding, fuel cladding surfacecomposition of BRM itself and components used in temperature. Typical dependencies for the experiment(trial ampoules, absorbing filters etc.) through with de-pressurization ftiel cladding are presented oncalculation and experiment. The realized goal of such figures 2 and 3.optimization is as follows: the levels of energy inputand, correspondingly, peak mean radial enthalpy 1000 sufficient to reduce to destruction fuel elements with ___T1 -Cfresh fuel and re-fabricated fuel elements with burnt 800 -- T2 -C
_T3 'Cout fuel (burnout - up to 6MW. day/kg) are achieved. _0.8
There were created two BRMs: on the base of O 60
graphite (BRM-1) and on the base of beryllium i
(BRM-2). They have multi-component composition 400-04
(see fig. ) A scaled filled with water capsule with theinvestigated shortened fuel rod is positioned inside 200 -0.2
BRM.The fresh fuel samples had been produced at
Institute of Nonorganic Materials (INNI). 0 0.5 tIS 1.5 2
The burnt fuel elements had been fabricated and Fig. 2 The time profiles o power (dE/dt) and fuelestablished in tight ampoules at Research Institute of cladding surface's temperature (TOC)Atomic Reactors (RIAR), where after irradiation on T1,T2,T3 are the data of thermocouplesBIGR they were extracted and underwent placed along irradiating rodinvestigations.
To close the entire technological chain of teststhere was developed and produced a transportationpackage set (TPS) aimed at re-fabricated fuel elementstransportation from RIAR to BIGR and back. Thecertificate - permission is received for TPS design anditinerary; this TPS is included to the state register.
- 771 -
JAERI-Conf 2003-019
30- - there are performed capsule experiments with
burnt out fuel elements burnout - up to 6025- 6OMW- day/kg) at different levels of loading up
20 to failure;P - there is elaborated the possibility of investigating
fuel elements of fast reactors (including reactor of15 "BREST" type within the frames of president
10- initiative) in ampoules with the correspondingheat-carrier (and temperature) to study their
5- behavior at different loading conditions, and fuelelements of RBMK reactor;there is developed a set of programs to calculate
0 0.5 1 1.5 2 the values and radial distributions of energy inputt s
Fig 3 The dependence of pressure inside fuel cladding to burnt out fuel and analyze the experimentalon time. results;
there is created a measuring complex to register
By today there have been done the following: reactor pulse shape and simulator parameters in- created the measuring and methodical base of the course of experiment.
tests, As a whole there is obtained a large information- elaborated the techniques of experiments with content that is of serious practical value, for the
ftiel element models under BIGR pulse, creation of database to verify codes by calculations oftechniques of defining energy release in fresh fuel, fuel elements behavior under possible abnormalenergy release and peak mean radial enthalpy conditions and to test and license fuel.
corresponding to the threshold of the claddingdepressurization, References
- compared the results of experiments to similar 1) Nuclear Regulatory Commission, Regulatory Guidedata obtained on IGR reactor (Semipalatinsk), 1,77, Assumptions Used for Evaluating a Control
- studied the effect of pulse duration and initial Rod Ejection Accident for Pressurized Watercondition in the capsule (pressure, temperature, Reactor, May 1974.medium) to the behavior of ftiel element. 2) Nuclear Regulatory Commission, Fuel SystemOn the created irradiating complex there were Design, Sec.4,2 in U.S. Nuclear Commission
performed several series of experiments (about 65 Standard Review Plan. - NRC Report NREG-work pulse reactor start-ups all in all (methodical not 75/087, 1975, Rev.l.included)) with fuel elements having fresh fuel and re- 3) P.E.MacDonald "Assessment of Light Waterfabricated fuel elements burnt out up to 6MW. Reactor Fuel Damage During a Reactivity Initiatedday/kg)- Accident".-Nucl. Safety, vol.21, 25, Sept.-Oct.,
As a result of the works realized: 1980, p.582-601.- there is created on the base of BIGR pulse nuclear 4) M.I.Kuvshinov, V.F.Kolesov, A.M.Voinov,
reactor the experimental complex (unique in I.G.Sinimov. "Aperiodic Self-Quenching BIGRRussia) to test simulators of fuel elements of Reactor". in Proc. of Int., Embedded Topical MtgVVER type including those burnt out. The level on Physics, Safety and Application of Pulseof energy release to the fresh ftiel of 44% Reactors., November 13-17, 1994, Washingtonenrichment constitutes -2kJ per gram Of U02 t D.C., p 126-127.burnt out fuel - I kJ per gram Of U02 50 MW. 5) M.Ishikawa, T.Inabe. The nuclear safety researchday/kg of U at 44% initial enrichment); reactor (NSRR) in Japan. Advance in nuclear
- there is performed a cycle of researches of fresh science and technology. New-York/London, 19796) K.Ishijima, S.Katanishi, S.Kobayashi, T.Fujishiro.
VVER fuel elements under different conditions "JAERI's Pulsing Research Reactor NSSR - Itsand for two cladding materials. The fuel rods Unique Performance and Wide Applications" inwere located inside the capsule in water medium Proc. of Int., Embedded Topical Mtg on Physics,(at atmospheric pressure and pressure -150atm) Safety and Application of Pulse Reactors.,or in air. The half-widths of pulses were regulated November 13-17, 1994, Washington D.C. p. 25-32.in the range from -2rns to -Is;
- TPS is developed, produced and certified forvehicle delivery of burnt out fuel;
- 772 -

JAERI-Conf 2003-019 JP0450145
Analysis of Reactivity Effects in Reactors with Cavities
V.F.Kolesov, V.Kh.Khoruzhi
(Federal Nuclear Center of Russia - All-Russia Research Institute ofExperimental Physics)
E-mail: otd4(d)expd.vnHefru
Evaluations of ultimate energy releases in these events as well as information on theabsence of the dangerous autocatalysis effect display in the systems mentioned are ofimportance when analyzing consequences of postulated incidents on reactors and criticalassemblies. In the report there are given results of calculation of fission bursts in super-criticalassemblies with large central cavities implemented at VNIIEF using multi-group neutron andgas dynamic programs.
From calculations it follows that:1. In the assemblies with empty cavities the effect of auto-catalysis is not observed.2. The same assemblies, if one places some matter in their cavities, exhibit a very strong
auto-catalysis as a multi-time (up to 40 thousand times) increase of the nuclear burst energy[1,2]. he effect is observed in the assemblies with neutron absorber on the periphery or in thecavity volume, and it is increased at additional introduction of neutron moderator into the cavity.The effect is most explicit in the event of fast systems and such fillers as boron IO and hydrogen.
KEYWORDS: reactor incidents, super-critical assembly, central cavity, neutronabsorber, boron-10, fission burst, autocatalysis
1. Introductory notes from earlier calculations it was traced in VNIIEFactivities that the effect to energy output in bursts of
When analyzing outcomes of postulated incidents not only central cavity itself but different fillers asat the reactors and critical assemblies the estimations well.of ultimate energy outputs in these events is of major At carrying out these activities there wereimportance. In particular, of importance are calculated assemblies highly super-critical at theconclusions on the availability of lack in abnormal initial time moment (shape of assemblies is as a ruleprocesses of positive reactivity effects often called spherically symmetric). In calculation model theauto-catalytic effects. The works in this field have assemblies underwent nuclear explosion accompaniedbeen being published since the 50-s till today.'-6) In by melting and evaporation of the core material,terms of autocatalysis there are investigated the scattering of material outside and its implosion to thephenomena related both to geometric reconstruction of cavity. The reactivity feedback in these processes wasmaterials distribution in the reactor and to purely characterized almost wholly by the phenomena ofnuclear effects changing interaction cross-sections of assembly materials space re-distribution while thefissile materials and neutrons. effects of nuclear cross-sections change with
In the papers on autocatalysis the problem of the temperature growth were not essential. The final breakeffect to energy output in abnormal bursts of the of chain reactions in the assemblies was realized as ainternal cavity in the core is also tackled. The data result of the core material scattering.available for that time moment testified to the fact that The initial super-criticality of assemblies Akeff(O)under real conditions of fissile material shifts the kff(O) -1 was established within the range from 0.005autocatalysis related to the availability of cavities in to 0.05 (keff(O - initial value of neutron multiplicationthe core was most probably not revealed. The coefficient). It was assumed that the initial reactivitydeveloped and all-round investigation of this problem Ake 0) is introduced instantaneously.
7-9) �ff(is carried out in VNIIEF . The corresponding In the calculations there were compared thecalculations have been being performed in VNIIEF characteristics of fission bursts at one and the samesince 1994 with the aid of multi-group 26 groups) initial supercriticality in the systems with no cavity,neutron-gas-dynamics programs ARCTUR and with empty cavity and with the cavity containingNEPTUN and their predecessors. As differentiated unfissile material. The comparison of energy of bursts
- 773 -

JAERI-Conf 2003-019
confirmed reasonability of prior notes concerning the cavity. These results point directly to the lack atprobable lack of autocatalysis in the assemblies with least in assemblies with enriched metal fuel ofempty cavities. Moreover, it turned out to be that manifestations of autocatalysis associated with thesome cavity fillers lead to the occurrence of a cavity in the core, - the core that is not filled ormomentary positive component in reactivity feedback contain material that is not a strong absorber ofand abrupt growth of the burst energy, i.e. to strong neutrons.reveal of autocatalysis effect. The effect was observedin the assemblies with neutron absorber in the cavity 3. Assemblies on fast neutrons with a cavityand amplified when neutron moderator is added to the containing strong absorber of neutronscavity. The relative energy increase of the burst growswith the increase of the cavity radius and when the There were fulfilled presented the calculationassembly is equipped with a reflector of heavy results of fission bursts in 19 critical assemblies onmaterial. In any system with a reflector or without it fast neutrons with the core of metal highly enrichedthe increase of the burst energy is most expressed in uranium, with a reflector of tungsten, iron, berylliumcase of 1013 and hydrogen fillers. or with no reflector. Many calculation versions refers
The mentioned above ARCTUR and NEPTUN to the systems with filler in the form of 13.programs are the programs of one-dimensional The comparison of burst energies in the assembliescalculation of neutron-gas-dynamics processes as well with the cavities of 12cm radius, wolfram reflectoras of (neutron multiplication constant) and kff and kff(O) =1.05 demonstrated that the positioning ofparameters of nuclear systems. 8) The fst program the layer of 1013 in the cavity of assembly leads toput into operation in 1996 is mainly oriented to the approximately 1.5-fold growth of uranium mass in thecalculation of systems possessing high energy release. core and 37-fold increase of energy release in the burstThe NEPTUN program was created in 1995 especially at the same supercriticality. The introduction to theto calculate the systems operating in the mode of non- cavity (in addition to boron) of a moderator ofexplosive chain reaction. Nowadays one can calculate neutrons in the form of gaseous hydrogen or solidwith the aid of this program the systems possessing beryllium considerably raises energy release in burst.low energy release as well. Both programs created as As a means of energy release increase hydrogen isindependent ones were combined in 1998 into a much more efficient than beryllium. The energyunique complex and now. they differ only in modules release in assembly containing hydrogen and 1013 isof gas dynamics calculation. The task of neutrons 230 times higher than the energy release in assemblymultiplication and distribution in both programs is that does not contain neutron moderator and absorber.solved in a kinetic multi-group approximation in terms It was demonstrated a considerably higherof scattering anisotropy and with the aid of DS,,- efficiency of tungsten as neutron reflecting material asmethod in Lagrange system of coordinates. compared to iron and beryllium. The manifestations of
In the report there are presented: autocatalysis effects are essential also in assemblies- the results of the carried out in VNIIEF without reflector, although the effect of the core
calculations of energy releases in different-type expansion competing the effect of autocatalysis turnssystems with no cavities, with empty cavities and out to be in this case more considerable. As a result ofcavities containing neutron absorber; placing moderator and boron to the cavity the increase
- the based on calculations conclusions on the lack of energy release in burst is in this case approximatelyor presence of autocatalysis manifestation in 16-fold.hollow assemblies on fast neutrons with the cores The calculation data testify also to the considerableof metal uranium, in the assemblies of composite decrease of autocatalysis to energy release per burstmaterial with a moderated neutron spectrum as with the reduction of the cavity radius and to thewell as in pulse reactor models BR I and BR-K 1. equally essential increase of this effect at the reduction
of super-criticality level of the assembly A ke�ff(O in2. Assemblies with empty cavities or those filled the second case the relative growth of energy output iswith low-absorbing material meant).
So in assembly with A kff(O) =0.05, tungstenSuch data were obtained for five couples of reflector and 12-cm cavity radius the autocatalysis
assemblies on fast neutrons with a core of metal effect leads as mentioned above to the 230-timesuranium of 90-% or 36-% enrichment by 135U, and growth of energy output while in the similar assemblywithout cavity or with cavities different (from 915 to with the 5-cm cavity radius - only to 8-times growth.18,1 cm) radii. In assembly differing from first system only in initial
From the calculation it follows that the energies of super-criticality Akfl(O) equal to 0.005 the energybursts in the assemblies with empty cavity and in the release per burst increases due to the autocatalysiscorresponding assemblies with no cavity do not effect 40 thousand times approximately.practically differ. The other data show that the burst It should be mentioned that in the overwhelmingenergy in the assembly with a cavity containing low- majority of the performed calculations relating to fastabsorbing inert material (for example mixture of systems at no moment of fission burst the value keff(t)fluoride of natrium and zirconium) is even lower than does not exceed its initial value kfr(O).Thus, thein equivalent assemblies with no cavity or with empty
- 774 -
JAERI-Conf 2003-019
increase of energy release in this case occurs not dueto the system super-criticality rise but because of thereduction of kff fall in burst, i.e. as a result of thesystem longer occurrence in supercritical state.
The considered manifestations of autocatalysis inthe assemblies with cavities are explained by the factthat at the cavity collapse there reveals reactivitybound by boron in the initial geometry. Boron locatedin a large central cavity in the core acts in the initialgeometry as a strong neutron absorber. The implosionat the fission burst decreases many times the Fig. IConfiguration of assemblies with nodimension of cavity and, in accord with the reduction neutron reflector (a) and with neutron reflector (b) I -of solid angle of the shell visibility from the presented uranium polyethylene mixture; 2 - cavity; 3 -points of uranium bulk its role of neutron absorber tungsten reflector.decreases drastically.
It was demonstrated that besides 10B there can beas well other materials with large capture cross- I's S
�- 4 Jsection of thermal and interim neutrons (of :Q0,9 -gadolinium, samarium, europium) that are potentially
promising as materials coupling reactivity in 6 2 -
assemblies with cavities, though they are not so 0.3
efficient as 0B. In the system with cadmium the 0 % IOU Is 2 250 00 10 200 2SO
absorber effect is inconsiderable. 5 eIn paper 7 it was mentioned that the discussed 4
3 Aeffect of autocatalysis can potentially increase many :times the scale of postulated accidents. This effect 2 20 -
should be taken into account while its sources should I be excluded if possible when designing research 0 100 200 40!0 100--c-0Z 0
reactors and setting up experiments on these facilities. 7 4 tj 4 6The specified recommendations are particularly acuteas applied to reactors with neutron reflectors and large 7 0internal cavities. The screening of the cavity with 6 -4 - .4
boron or other strong absorber should be excluded in :4 .8this case.
4. Assemblies on moderated neutrons with a cavity0
containing strong neutrons absorber -2 0
4
Fast systems with a core of metallic uranium 0
were discussed above. There also were carried out the 100 200 300
calculations of fission bursts in assemblies with 1, RCmoderated neutron spectrum, namely, in spherical Fig. 2 Dependence on time of energy releasesystems with the cores of homogeneous mixture of power dE/dt and neutron multiplication constant inuranium 90% enrichment) and olyethylene with the tasks I (a) (assembly without boron; cavity radiusindex of uranium dilution n(H/21 U) in the range from 5.5cm) 2 (b) (assembly with boron; cavity radius5 to I 0 ) (Fig. ). The central cavity radius was either 5.5cm); 3(c) (assembly without boron; cavity radius5.5 or 12cm, the thickness of tungsten reflector was 12cm); 4(d) (assembly with boron; cavity radiusequal to 5cm while the thickness ofi�B layer - 0.5cm. 12cm) calculated using ARCTUR -) andIn the calculations the index of uranium dilution NEPTUN (m).(relation n=IV235U; n=5, 10, 20, 100), central cavity At analyzing the calculation results first of all wediameter and initial value of kff.(kff(O = 103; 1.05; noticed a good agreement of independent results1 IO) were varied. obtained with the use of ARCTUR and NEPTLIN
Fig.2 presents as an example the calculated programs (see Fig.2). The obtained data speak for thedependencies of power and neutron multiplication considerable increase of energy release per burst whenconstant on time in assemblies with reflector '�B is introduced to the cavity. The effect becomespossessing small and large cavities. The data more expressed with the decrease of uranium dilutionpresented on Fig. 2 are grouped for couples of coefficient n. The data obtained for assemblies withassemblies under the condition that each of couples moderated neutron spectrum basically repeat thecontains assemblies similar by cavity size, n index and dependencies stated before for the assemblies on fastkff(O) level with boron and without it. neutrons. The studied effect is as before more intense
in the assemblies with neutron reflector andessentially grows with the increase of cavity radius.
- 775 -

JAERI-Conf 2003-019
Moreover, there take place essential peculiarities cavity whose diameter in terms of covers is 10 andin the manifestations of this effect in the assemblies height - l8cm. or in the output radiation flow outsidewith moderated neutron spectrum. First, as compared the reactor core.to the assemblies on fast neutrons the effect scale hereis considerably less. The second essential J i 4 5 6
peculiarity of the effect in assemblies with moderatedneutron spectrum is its evidence in this case consistingin real for assemblies with absorbers and reflectorgrowth of (and keff) at the initial segment of thisparameter dependence on time (see Fig.2). The thirdpeculiarity of the effect in this case consists in itscomparatively weak dependence on the properties ofmoderator in the cavity.
In terms of nuclear safety the investigated effect isconsiderably less dangerous for reactors withmoderated neutron spectrum than for reactors on fast Fig.4. BR-K I core in axial section: I - containerneutrons. aimed at irradiated samples horizontal loading; 2 -
bronze regulating block; 3 - mobile block; 4 6 7 -immobile blocks; - safety block; - pulse block and
5. Spherically-symmetric models of pulse reactors stop block (both of beryllium)BR-1 and BR-K1
The BR-KI reactor core is also cylindrical butAs it has been mentioned above the investigated with horizontal orientation of axis. The alloy of
effect of autocatalysis can increase danger of the uranium (36-% enrichment b 235U) and 9 ofworks on reactor facilities. In this connection there molybdenum by mass was the material of BR-K I core.were calculated fission bursts in aperiodic pulse The total mass of uranium-molybdenum alloy in thereactors of VNIIEF: BR-I and BR-K. 9 core is equal to 151 lkg. The length and maximum
The cores of BR-I and BR-KI reactors are external diameter of the BR-KI core by fuel arepresented in axial section on Fig.3 4 The core of correspondingly equal to 74.8 and 61.7 cm. )BR-I has te form of hollow cylinder separated to In BR-KI there is available a cylindrical cavity offour parts: immobile upper block, mobile lower block, -36cm diameter and depth by fuel to irradiate theregulating and pulse blocks. The core size by fuel is as samples. To place the samples to the cavity there isfollows: height - 26.6, external diameter - 26.8, axial provided a container of horizontal loading whosecavity diameter -1 1.6cm. An alloy of uranium 90-% housing is equipped with a screen bulk boron carbideenrichment b 23-IU isotope) and 9 mass of of _ I g/CM2 thickness by 10B. The internal diametermolybdenum is the material of the core. The total and height of the container are equal to 31 and 36cm,mass of alloy is -I 76kg. 1) correspondingly.
7 7.8 8.54 R R-0.3
'L-4.0796Fe-i�.W6 1�1-0 I I
2 0 IN 10.7 19., R K+ 3 R+3.(.a f-14,93
f-7,8 f-1.8's3 2 Fe Fe In,-
7 11"'45 'u-mal
C.O. 1 M WA. II 6 7Fe-41.25
6 4 Fig.5 BR I (a) and BR-K I (b) at performing
calculations using a one-dimensional neutron-gas-dynamics program. (The core radius R is selected
Fig.3 BR I core in axial section: 1 3 - fuel ring of according to the required values of Akff(O); thethe upper and lower block correspondingly; 2 - dimensions are given in centimeters, density - in
demountable cover; 4 - regulating block and pulse g/cm).block correspondingly; 6 - non-demountable cover; 7
-screw constringing the demountable cover; - cavity In the calculation the real cylindricalfor samples irradiation. configurations of BRA and BR-KI reactors were
Each of four blocks of BR I core is enclosed to an reduced to their idealized spherically-symmetricanticorrosion case of stainless steel. At the outward models (Fig.5). In the models the volumes of internalsurface of the core and at the cavity surface there are cavities serving for irradiation, composition and totalprovided protective screens containing 10B. The mass of boron screens, composition and averageirradiation of samples is performed either in the axial
- 776 -

JAERI-Conf 2003-019
densities of fissile materials, total mass of iron or reactors reliably. Neither BR-I nor BR-KI can bethickness of the iron layer are taken to be equal to made critical at such loads under normal mode.those available in real BRA, BR-KI reactors. It was shown 9 that in condition of limited
The specific calculations were performed for the resource, in worse situation autocatalysis onpresented in Table I evaluated kff(O) corresponding polyethylene load may result in the increase ofto the situations of maximum rated accident (MRA), abnormal burst energy by a factor of A:maximum beyond-rate accident (MBRA) and ultimatehypothetical accident (UHA) in BRA reactor and to (a) 3situations of MBRA) and UHA in BR-K I reactor. AKeff AK(P)
A effAK (a)
Table Initial super-criticality values Akeff(O) of BR- eff1, BR-K I reactors corresponding to different types of
accidents where AKeff(') - reactivity introduced during the
accident; AKeP - excessive reactivity resource.Accident Reactor In terms of afore appointed AKP) and
type BRA BR-KI formula (1) it was obtained:- under MRA, MBRA and UHA situations in
MRA 0,0075 (I'lAO) < 000096 reactor BRA the account of catalysis when(0, 13,8�0) bringing small polyethylene loads in the cavity
MBRA the total effect of autocatalysis in terms of boron0,0205 (3,8�0) 0,0221 31610) screen constitutes 50, 26 and 15%
correspondingly;
UHA 0,0864 02,7,9�,p) 0,0883 (12,8,,p) under MBRA and UHA situations in reactor BR-KI the account of autocatalysis when bringingsmall polyethylene loads in the cavity the total
Was obtained that the presence of boron in the effect of autocatalysis in terms of boron screenreactor cavities under all considered abnormal will result in the increase of energy release insituations leads approximately to 15-% (in BRA) and burst by a factor of 4.1 and 19.30-% (in BR-K I) increase of abnormal energy release. Thus, though the effect of autocatalysis on theMuch more serious is the effect of loading consisting loads absorbing neutrons in the cores of BRA andof boron and polyethylene. In this case in BRA at BR-KI reactors, especially BR-KI, can abruptlyNIRA, MEBRA and UHA the energy release per burst increase the scale of abnormal bursts, in reality thisis increased due to catalysis by a factor of 9 27 and hardly can be observed because of limited reactivity2.3, correspondingly, while in BR-KI at MBRA and resources available. The abrupt rise of accident burstURA - by a factor of 520 and 25, correspondingly. scale can occur only at a low-probable casual or
Some of the obtained calculated data look quite deliberate increase of the mentioned resource.troublous if we directly introduce them to practice. Basing on what is said on the BRA and BR-KIHowever, in reality if we take into account significant reactors safety of particular significance is thecircumstantial factors we may see that the realization available level of reactivity excessive resource. Theof specified dangerous growth of energy release in inhibition for the change of these reactorsabnormal bursts would improbable. configurations leading to the increase of reactivity
Large energy release values are obtained in the resource should be keeped with particular severity.supposition that BRA and BR-KI can function in The analysis results presented in the given reportconfiguration with loads absorbing neutrons as usual in the aspect of statement of danger of presence inpulse reactors, i.e. they can be initially (prior to pulse inter-reactor cavities of standard loads absorbinggeneration and abnormal process development) made neutrons relate to every research reactors possessingcritical or supercritical at the required level for pulse cavities in the cores.production. In this supposition the abnormal burst isdeveloped first with no participation of autocatalysisand the autocatalysis makes it stronger then. In fact Referencesthis condition is realized as applied only to boronscreens that are always available in the core. As 1) V.Z.Jankus, "A theoretical study of destructiveapplied to polyethylene load this condition is not nuclear bursts in fast power reactors," In: Physicsrealized in principle, so far as the standard resource of of fast and intermediate reactors, 3 209 1961)..excessive reactivity of BRA and BR-Kl reactors is 2) R.B.Nicholson, "Methods for determining thestrictly limited (-O. I ff is higher than the upper energy release in hypothetical fast reactorcritical state in BRA reactor and 1.450,,ff in BR-KI). meltdown accidents,". Nucl.Sci.Engng., 18, 207Under such conditions the considered loads of (1964).polyethylene introducing very high negative reactivity 3) W.R.Stratton, T.H.Colvin, R.B.Lazarus,(-IOPff in BRA and -25pff in BR-KI) shut down the "Analysis of prompt excursions in simple systems
and idealized fast reactors," Proc. of the Second
- 777 -

JAERI-Conf 2003-019
Intern. Conf. of the Peaceful uses of AtomicEnergy held in Geneva 113 Sept, 1958, 12, 196(1958).
4) H.H.Hummel, D.Okrent, "Reactivity coefficientsin large fast power reactors," AN L (I 970).
5) D.L.Hetrick, "Computer simulation ofhypothetical criticality accidents in aqueousfissile solutions," Trans. Amer. Nucl. Soc., 63,226 1991)
6) I.Pazsit, "Comment on the modeling of thinabsorbers via 5-functions," Nucl.Sci.Engng., 116,223 1994).
7) V.F.Kolesov, V.S.Bosamykin, V.Kh.Khoruzhy,V.F.Yudintsev, "Nuclear safety of the criticalassemblies, with neutron absorber," Atornnajaenergija, 83,.105 1997).
8) V.F.Kolesov, R.Ya.Gatilova, L.F.Gudarenko,G.G.Ivanova, T.G. Ivchenko, V.G.Kudelkin,S.V.Mzhachikh, G.G.Farafontov, V.Kh.Khoruzhy,"Positive reactivity effects in the hollow criticalassemblies with the moderated neutrons," In 7],88, 323 2000)
9) V.F.Kolesov, V.Kh.Khoruzhy, V.F.Yudintsev,"Displies autocatalysis in the BR-1 and BR-KIpulse reactors," In 7], 85,.179 1998).
10) A.I. Pavlovskii, A.A.Malinkin, V.F.Kolesov.A.S.Koshelev, Yu.M.Odintsov, "Buster-reaktorBR-1 (BR-1 booster-reactor)," VANT. Ser.Impulsnyye reaktory i prostyye kiticheskiyesborki, 1_3 1985).
11) V.S.Bosamykin, A.A.Makinkin, V.F.Kolesov,S.K.Shtarev, V.S.Gladkov, N.A.Nikitin,A.S.Koshelev, Yu.M.Odintsov, V.Kh. Khoruzhy,"Konstruktsiya i fiziko-tekhnicheskiyekharakteristiki Buster-reaktora BR-KI(Construction and physical-technicalcharacteristics of BR-KI Booster-reactor),"VANT. Ser. Fizika yadernykhreaktorov, 1, 3 1996).
- 778 -

JAERI-Conf 2003-019 JP0450146
On the Fictitious Aspect of the Critical State
Boukhmes Wchitoua
Commissariat � I'Energie Atomique
BP12
91680 Bruy6res-Le-Chitel
FRANCE
c-mail : boukhmes.mechitoua(9cea.fr
ABSTRACT The process is Markovian.
It is known that the transport equation describes Let pi i, C2, v, t) be the probability that one neu-the variation of the average neutron density and tron at position at time t with properties C2, V)that stochastic neutronics can be used to study the will give i neutrons at final time T in the studiedfluctuations of the actual neutron population. system.We show in this paper that if the fluctuations are During interval At, the neutron may have a colli-very large, the average value loses most of its signi- sion with the probability Et v At and that collisionfication. may be:Key Words: stochastic neutronics, criticality, neu-tron transport codes. Capture: This collision contributes to the extinc-
tion so we will have a Dirac on i=O for the transi-tion probability.
1 Introduction Elastic scattering, inelastic scattering inclu-
In some special problems, we can show that the ding (n,2n) (n,3n) ...
second moment of the transition probabilities in- Fission: We need to use the fission multiplicitycreases linearly with time for an exactly critical frequency fk. Let us recall that the classical fissionsystem that is the first moment of the transition neutrons yield is the first moment of fk. So thereprobabilities does not change: birth and death ba- is a "loop" over the fission multiplicity frequencylance. (k ranging from to K).
It means that for a long duration the probabi- The neutron may not have a collision with the pro-lity to have a constant neutron population is very bability - Et v At.weak: Such a case signifies that the critical statemay in some configurations be fictitious 2). We obtain the backward system of differentialIn the following sections, we will recall some ele- equations written below 7)
ments of stochastic neutronics theory 1 3 4 and wewill show two examples: critical state with large Let pi (i, C2, v, t) be pi.fluctuations with respect to the point model hy-
pothesis and with a more realistic test case using This system is to be solved with the conditions:PANDA code 8).
We do the assumption that there is just one type For neutrons which are on the boundary with lea-of neutrons (delayed neutrons are included with no kage direction, we have po (i, 15, v, t = andtreatment of their specificities). -Pi 1, 0, V, t = if
2 Elements of theory And at the final time, the conditions are
2.1 Transition Probabilities Pi i, C2, v, t = T = for all (;F, 5, v)and pi i, Q, v, t = T = for all i : I
The transition probabilities are important sto-chastic neutronics tallies. We recall in this sectionthe main definitions and equations.
- 779 -

JAERI-Conf 2003-019
(Scattering) A= E, if h, (C2, v; d, v)pi (i, d, VI, t)ddldv'
K 2n) B = E2 h2(C2, V; fy v)pj (i, a, VI, t)dSi'dv'=0
I I h2 (C2, v; id', v)pi-j (i, d, VI, t)d!ffldv'
K 3n) C = E3 E h3(0, V) if', v)pj, (i, d, VI, t)ddldv'
h3 v; Si, v)pj, (i, d, VI, t) d!ffldv'
h3 V; a, V)Pj, (4 d, VI, t) d!ffldv'
K k(Fission) D =f fk hf (V, VI) pj (idIv',t)dSiIdv'E II 47r
k=O jO+ +jk=iM=O
(Capture and other reactions) E = EJ(i - 0) +
The branching process is explicitly modeled in the above relations.
Finally we obtain the generic equation of the system:
1,9pi - -'t QVpi + Etp, z A B + C + D + E
V O
- 780 -

JAERI - Conf 2003 -019
2.2 Moments of the Neutron Num- multiplicative events in the fission term to makeber Probability Distribution the equations more compact.
The first two moments are calculated using the We have shown equations for one source neutrongenerating function methodology 5 6 8) but one can easily derive such equations with ge-
neral neutron source distribution.00
Y�(Tl 1, i, iU, t) E ipi (i, �, v, t) In the next sections we will writen=O00
Ml (t) =_ �i(Tl 1, i, �r, t) and M2 (t) = W2 (TJ 1, i, iU, t).n2 (TJ 1, i,,U, t) i2p, ;F, C2 V t)
The variance is defined by: 3 Point Model Test Case
- 2 We simplify the equations of the first two mo-V(TJ1, i, 6,t = (W -- a )TJl'g't7't) ments with respect to the hypothesis of the point
We get the first moment or mean neutron number model, that is infinite and homogeneous mediumwith monoenergetic neutrons.
equation. And we choose nuclear data in order to have a
1 system just critical. Neutrons can have only two_V reactions: Capture and Fission (same probabilities
E,=Ef)withaneutronyieldequaltotwo(f2=1).
E, (i, iU, V)fi(TJ 1, i 1U, t) d3v' + In view of such assumptions the moments equa-
+ J TFEf (i, v, v)-f�(Tl 1, i, V, t)d3v' tions shown in the previous section reduce to thefollowing ones:
This equation is subject to terminal and outward First moment:boundary conditions.
ff(TJ 1, i,,U, T = a + E,) Ml (t = 2 El Ml (t)at
iT(T 1, i, 6, t = for iiB 0'> 0
One can verify that the mean neutron number is so- We obviously obtain:lution of the classic linear adjoint Boltzmann neu- 1tron transport equation. And we get the second --- Ml(t = moment equation. V t
1 0 - So we have verified that for such a critical systemNV N - ff"� + E ) n2 (T 1, i,,U, t) the first moment (or mean neutron number) does
not change and is equal to one (final time condi-E, (i,,U, �;)W2 (TJ 1, i, 1U, t) d3v + tion)
+ I -vEf (i, v, v)W2 (TJ 1, i, 1U, t) dv + Second Moment:
. XW) 3VI 2 a+V(V - 1)Ef (i, V) W(TI 1, i, i?, t)d - - + E)M2(t = 2 E M2(t) 2 E M'
47r V t (t)
This equation is subject to terminal and outward
boundary conditions. We finally have (final time condition one for the
second oment):
n2(TJIi,,FT =
n2(TJliB, Vt = fr iiB- _ M2(t) = 2 v Eft + 1
The second moment equation is also an adjoint
transport equation coupled to the first moment We use an adj oint approach so the time moves " ba,
equation by an additional source term. ckward" from T to -oo, that means that the va,
riable t varies from zero to -oo. It is obvious that
In the above equations we have included all the for a large duration (t -� -oo) the second moment
- 781 -

JAERI-Conf 2003-019
becomes very large (-+ oo) and so does the va- result. The additional terms for the second momentriance. That eans that the "constant state" is an equation uses the fission multiplicity parametersillusion, actually the fluctuations are so large that which are computed using the Terrell models.the neutron population has a very weak probabilityto remain constant 2).
4.3 Results
4 Critical Uranium Sphere PANDA was used with 16 and 48 groups andgave very close results with the two multigroups
Test Case choices.
4.1 Description of the Problem We can see in the figure I that the first moment isa constant and that the second moment increases
The studied system is a pure U235 sphere just cri- in a way very close to a straight line in function oftical and the neutron source is a Dirac function in time duration.time with an uniform distribution in volume and a The more the difference is large between initial andfission spectrum energy distribution (Fission Watt final time and the more the second moment is large,spectrum)- so the variance increases in the same way (the first
We calculate the first two moments at final time for moment is a constantY
a varying initial time. The code we use is PANDA'). This result shows clearly what has been writtenPrompt and delayed neutrons are taken into ac- above: This system is just critical but the actualcount in the same way, this study is limited in that neutron population has a very low probability tosense that it is special case. be close to the mean neutron population.
For this system the critical state is fictitious
4.2 PANDA code First and second ntoments
PANDA is a general purpose deterministic trans- 30 Uranium spherejust.critical
port code with stochastic neutronics options. Thetransport equation is solved using standard dis-crete ordinates and multigroup methods. One andtwo dimensional geometries with artesian and cur- 25
vilinear coordinate systems are treated using or-thogonal structured spatial grids and angular SN
discretization of the unit sphere. The time inde-pendent transport equation is used for fixed source 20
and eigenvalue problems (a and k). In addition toclassic criticality applications PANDA is used for Mttime dependent survival probabilities, mean and 15variance of the neutron number and asymptotic ex-tinction probability calculations. z
The single initial neutron mean number equationis the time dependent homogeneous adjoint trans- 10port linear equation. This equation is routinely sol-ved by standard transport numerical methods likethe classic deterministic SN method. The second 5
moment equation satisfies transport equation withthe same kernel used for the adjoint linear trans- M,port problem. Therefore, this equation should besolved by the SN method devised for numerical 0 .......
0 1-08 2-08 3-08 4-08 5,-08solution of the direct and adjoint linear transport T-, (�): fidfi-.,6-d..d.
equations.The additional term of the second moment equa-
tion depends on the first moment, these equationsare coupled. The backward solution, starts form FIG. - First two moments, just critical "the terminal time. On each time step the mean spherenumber equation is solved first, then the secondmoment equation is solved using the first moment
- 782

JAERI-Conf 2003-019
5 Conclusion5) T. E. Harris, "The Theory of Branching Pro-
We have shown in this paper that in some cases cesses." Dover Publications, Inc., New York, 88,the critical state can be fictitious. That is the ac- 1989.tual state of the system fluctuates in a way thatthe variance of the number of neutrons increases 6) M.M.R Williams "Random Processes in Nu-linearly with the time. clear Reactors." Pergarnon Press 1974).
We have calculated the variance of the neutron po- 7) D. Verwaerde, "Une Approche Non D6termi-pulation in function of the difference: final time - nist, de la Neutronique - Mod6lisation" CEA - Ninitial time with varying initial time (backward or 2731 Sept. 1993.adjoint approach).
8) Ph. Humbert, Stochastic Neutronics with PANDAIn practice, the fluctuations are limited by control Deterministic Code." Nuclear M&C Meeting Aprilrods and the source is never a Delta function but 2003- Gatlinburg, Tennessee.such a paper may be interesting to show what canbe the contribution of stochastic neutronics for a 9) B. Wchitoua "Stochastic Neutronics - Montebetter understanding of criticality. For example neu- Carlo Estimation of Transition Probabilities." SMORNtron noise theory equations are derived from sto- 8 Meeting May 2002 Goteborg (Sweden)chastic neutronics.
10) J. Terrell, "Distributions of Fission NeutronTo speak more general, classical neutronics is a spe- Numbers," Phys. Rev., 108, pp. 783 1957).cial case of stochastic neutronics that is stochasticneutronics with very weak fluctuations. 11) R. E. Uhrig "Random Noise Techniques in
Nuclear Reactor Systems," Ronald Press Company.The deterministic 2D SN code PANDA has been New York 1970).adapted to solve adjoint time dependent linear andnonlinear multigroup transport equations. These 12 T E. Valentine, "MCNP-DSP Users Ma-stochastic developments of this code will be used nual," ORNL/TM-13334, R2 2001).for nuclear safety applications.It may be remarked that an other numerical me-thod may be used, that is Monte Carlo method').
In the future, neutron noise measurements appli-cations will also be considered.And interesting comparisons with more classicalapproaches of neutron noise applied to subcriticalmeasurements will be possiblell) 12).
References
1) L. Pal, "On the Theory of Stochastic Pro-cesses in Nuclear Reactors." Nuovo Cimento Vol.7, Serie 10 pp 25-42 1958)
2) L. Pal, "Neutron Noise and Random Trees- Links Between Past and Present (Special Lec-ture)." Progress in Nuclear Energy. Vol. 43 No 14pp 525(2003)
3) J. L. Muiioz-Cobo, R. B. Perez, G. Verdu,"Stochastic Neutron Transport Theory: NeutronCounting Statistics in Nuclear assemblies." Nucl.Sci. Eng., 95, pp. 83-105 1987).
4) 1. Paszit "Duality in Transport Theory." Ann.nucl. Energy, Vol. 14 No pp 25-41, 1987
- 783

JAERI-Conf 2003-019 JP0450147
Measurement and Evaluation of Leakage Neutron Spectrum at TRACY
Takemi NAKAMURA', Kiyoshi SAKURAI and Yoshinori MIYOSHI
Japan Atomic Energy Research Institute, Tokai-mura, Naka-gun, lbaraki 319-1195, Japan
The leakage neutron spectrum of the Transient Experiment Critical Facility (TRACY)at the Japan Atomic Energy Research Institute was measured. The experimental core iscomposed of I wtO/o enriched uranyl nitrate solution in a 0cm inner diameter cylindrical tank.As measuring methods, we used the recoil proton proportional counter method and themulti-foil activation method. In order to evaluation a spectrum, the former unfolding code isSPEC-4') and the latter is NEUPAC-JLOCx We had improved the NEUPAC-JLOG 2) in orderto use for the thermal reactor. In the case of measurement by the recoil proton proportionalcounter, it was performed under the stationary state operating condition. The evaluatedneutron spectrum was in good agreement with the tendency of calculation using MCNP4B')with JENDL3.2 4) library. For the multi-foil activation method, they were performed under thestationary state and the transient state operating conditions. The neutron spectrum as a guessspectnim was calculated using MCNP413 with JENDL3.2. The result of neutron spectrumanalyzed by MCNP is reliable for the steady state. In case of the transient state, the unfoldingspectrum of the fast neutron region was almost the same result as the initial spectrum. In thethermal neutron region, the unfolding spectrum was somewhat greater than the initialspectrum. This is considered to be caused by generation of void by the transient.
KEYWORDS: Proton Proportional Counter, NEUPAC, Neutron Spectrum, Unfolding, Covariance,TRA CY, MCNP
1. Introduction TRACY is designed to obtain the data onsuper-critical phenomena using IwtO/o enriched
The information of the neutron spectrum is uranyl nitrate solution. The concentration of uraniumfundamental characteristics for all reactor and in the solution can be varied up to 500 gU/L. Figure Ineutron irradiation field. Generally, it can be obtained show a photograph of TRACY core tank.by experiment and calculation. At the moment, the TRACY is operated at first by feeding the uranylneutron spectrum with remarkable accuracy and nitrate solution with a pump into a cylindrical shapedprecision is calculated by using Monte Carlo code. core tank made of stainless steel. The diameter and
In this report, the evaluated method of the leakage height of the core tank are 50cm and 200cm,neutron spectrum at TRACY is described. Until now, respectively. Delayed criticality is attained by thethe evaluation of the leakage neutron spectrum was feeding the solution. Then, transient operation isnot performed for TRACY. The experiment was initiated by either withdrawal of a unique control rodconducted by two measuring methods. We used recoil inside the tank, named 'transient rod', or continuousproton proportional counter method and multi-foil feed (max. 65L/min.) of the solution exceedingactivation method. The measurement of the recoil criticality. The transient rod can be driven by twoproton proportional counter was performed under the sorts of mechanisms, i.e. (1) rapid withdrawal bystationary state operating condition that the compressed air (within 0.2 sec.), 2 rampedtemperature of the solution did not change. For the withdrawal with an electric motor (max. 900cm.min.).multi-foil activation method, it was performed under The reactivity insertion is licensed up to 3 dollars forthe stationary state and the transient state operating the transient operation. Peak power and integratedconditions. The temperature of solution was increased. power are also limited up to 5,OOOMW and 32MJThe neutron spectrum was used unfolding code. The (equal to 1018 fissions), respectively. Table I showsinitial neutron spectrum was calculated using major specifications of TRACY.MCNP413 with JENDL3.2.
2.2 Experimental System2. Description of TRACY The multi-foil activation method was performed
with ramped withdrawal. Addition reactivity was2.1 Core Tank 2.98$, and withdrawal speed was 875cm/min, and
Corresponding author, Tel.+81-29-282-5697, Fax. 81-29-282-6798, E-mail:nakamura�melody.tokaijaeri.gojp
- 794 -

JAERI - Conf 2003-019
initial power was mW. Moreover, in the stationary a(E) are important and especially the formerstate, the reactor power was kept at lkW, which influences a result. As most important one for theproduced 5MJ of integral power. On the other band, unfolding method, we have to adopt i(E) that is bestfor the measurement of recoil proton proportional estimation using radiation transport code. Now,counter, the reactor power was kept at 3niW, which continuous energy Monte Carlo code MCNP isproduced 408J of integral power. Details of the widely used in the world.experimental conditions are shown in Table 2 A We used NEUPAC-JLOG unfolding code that isreactor room arrangement is shown in Figure 2 improved for thermal reactor. The code is processing
the covariance data of i(E), ;(E), and reaction rate.3. Measuring Method As a result to the adjusted spectrum, covariance data
is also given. The microscopic cross sections for3.1 Recoil Proton Proportional Counter Method NEUPAC-JLOG are edited with MGCLI37 groups
The recoil proton spectrometers consists of four from JENDL Dosimetry File 6). The microscopic crossspherical hydrogenous proportional counters. Each section for (ny) reaction was treated in considerationproportional counter covers the following energy of the resonance self-shielding effect correction andrange. the self-shielding correction for the foil thickness.
SP2-1 : 2-inch inner diameter, hydrogen gas 4. Measurement and Evaluationatmospheric pressure, (50keV-200keV)SP24 : 2-inch inner diameter, hydrogen gas 4 4.1 Measurement and Evaluation with the Recoilatmospheric pressure, (100keV-500keV) Proton Proportional CounterSP2-10 : 2-inch inner diameter, hydrogen gas 10 The recoil proton spectrometer was installed 2 matmospheric pressure, (400keV - 1.5MeV) away from TRACY reactor core tank surface.SP6: 6-inch inner diameter, Ar- methane gas Measurement was performed at the mW criticalatmospheric pressure, (l.0MeV-4.5MeV) state for 4 hours. The dose rate at the measurement
location was lmSv/h. The eor of adjustment forFigure 3 show a photograph of the recoil proton recoil proton proportional counter in the range ofproportional counter. 50keV to 4.5MeV, when based on the result
The recoil proton proportional counter does not calibrated using the Cf-252 standard source calibrateddepend on the direction of the incidence of neutron, by NIST in Bubble Technology Industries, was aboutbecause proportional counters have the sphere shape. 7% (I CF)7) of the integrated fluence value. ForThese detectors are on a rotating platform. One fluence, dose, and neutron spectrum, errors are notrotation time is about 20 seconds. The measurement shown about the results after adjustment. For thisenergy range for the recoil proton proportional reason, the eor guaranteed by the maker iscounter is from the thermal energy to 4.5MeV. estimated to standard value.However, the energy range for unfolding is from Unfolding results are shown in Figure 4 and Table50keV to 4.5MeV. 3. For the neutron spectrum, a tendency which
From the result, the amount of differentiation is resembled well the result calculated by MCNP iscalculated using unfolding code SPEC4. The shown. There is a region where the ratio of MCNP/maximum dose of these detectors is mSv/h. recoil proton proportional counter is greater than 20%Therefore, accurate measurement of a neutron at below 500keV. However, this is due to thespectrum demands long measurement time. influence by the end of the energy measurement
range of each globular form detector. For the neutron3.2 Multi-Foil Activation Method fluence, the adjustment is less than 1% in the range of
The transient operation of TRACY is usually 50keV to 4.5MeV.performed with several 100 MW power. Foilactivation/unfolding method is a general method in 4.2 Measurement and Evaluation with Multi-Foilsuch the neutron and gamma ray mixed field in high Activation Methoddose rate. Foils used multi-foil activation method are
This method adjust from initial neutron and Au- 97, Au-Cd, Cu-63 for the thermal neutron regionseveral reaction rate to best estimate spectrum. The and In-115, and Ti-48 for the fast neutron region.C/E's of all reaction rates set equal to 1.0; this Twelve kind reactions were prepared for thecompares CIE of calculated reaction rate iu (C) with multi-foil activation method. Less than half of themmeasurement reaction rate (E). In this case, i(E) and were actually irradiated. This number is a limit when
- 785 -

JAERI-Conf 2003-019
the irradiation environment of the present TRACY is The covariance of the diagonal element of the initialconsidered. However, five kinds of foil, which can be spectrum was estimated about 20% for the thermalmeasured, cover the neutron energy range of the and the fast region, and others were estimated as ythermal and fast energy region. Details of each of FSD in the Monte Carlo calculation. The unfoldingactivation foil are shown in Table 4 The gamma ray result is shown in Figure 7 As Monte Carloemitted from activation foil measured with the high calculation conditions, the eigenvalue calculation forpurity germanium detector (HPGe). the usual steady state was performed. The adjusted
In regards to the covariance for NEUPAC-JLOG� neutron spectrum is high about 3 in the thermalonly the diagonal element of each activation foil and neutron region, although the shape of the spectrum isan initial spectrum were taken into consideration. All same as initial neutron spectrum. The C/E (see Tableof the off-diagonal elements were made into zero. 6) of the reaction rate is adjusted to .0; the change of
Au-Cd, Cu, and Ti after adjustment is 19%, 19%,4.2.1 Stationary Sate and 02%, respectively. The difference is about 03%,
The value by the indicator with which the integral which has been disregarded. Here, the i(E ispower was proofread by FP analysis is 5MJ. The incalculable with sufficient accuracy because oftemperature of solution was about 35 'C. For such complicated conditions of the transient state.operating conditions, unfolding was performed usingfive kinds of activation foils, and the neutron 5. Summaryspectrum was evaluated. MCNP4B with JENDL3.2were used for calculation of an initial neutron The information of the neutron spectru isspectrum. As calculation conditions, eigenvalue fundamental characteristics for all reactor andcalculation of the usual steady state was performed. neutron irradiation field. Therefore, the leakageThe 3a of the statistical error (FSD) of each energy neutron spectrum was evaluated using the Transientbin in MCNP calculation was used on the covariance Experiment Critical Facility (TRACY) at the Japanin the diagonal element from the initial spectrum. The Atomic Energy Research Institute. As measuringunfolding result is shown in Figure 5. The adjusted methods, we used the recoil proton proportionalneutron spectrum is overestimated about 1% in the counter method and the multi-foil activation method.thermal neutron region, although it 'becomes thealmost same shape to an initial neutron spectrum. [Recoil Proton Proportional Counter Method]Moreover, in near lMeV, the adjusted spectrum is When the measurement was performed by usinglarge about 5%. The C/E (see Table 5) of the reaction the recoil proton spectrometer, the reactor power wasrate of integration value is adjusted so that 1.0 may kept at 3mW, which produced 408J of integralbe approached; the amount of change of Au, In, and power. The measurement was performed for 4 hours.Ti after adjustment is 0.5%, 03%, and 14%, For the neutron spectrum, a tendency whichrespectively. However, this.result means that Au-Cd resembled well the result calculated by MCNP isand Cu do not necessarily approach 1.0 from overall shown. For the neutron fluence, the value of the C/Eadjustment of five reaction rate values. The difference is in agreement by less than 1% in the range of 50keVis about 04%, which has been disregarded. The C/E's to 4.5MeV.of reaction rates were hardly changed afteradjustment. It means that the calculation of initial [Multi-Foil Activation Method - Stationary Sate]neutron spectrum is best estimation. The integral power is 5MJ, and the temperature of
solution was about 35 C. Under such operating4.2.2 Transient State conditions, reaction rate measurement was p erformed
The transient operation mode is ramped using five kinds of the activation foil, and the neutronwithdrawal. The power change of the operation is spectrum was adjusted. MCNP4B with JENDL3.2shown in Figure 6 From the figure, the 2nd and 3rd were used for calculating of an initial neutronpeak are seen after the I st peak. The integral power is spectrum. As calculation conditions, eigenvalue19.2MJ. The solution temperature was about 65 'C. calculation of the usual steady state was performed.During this time, the radiolysis gas was generated, The adjusted neutron spectrum is high about 1 inand change of a solution level was created by void. the thermal neutron region, although it becomes theAlthough attached in the same radial as the foil for almost same shape to an initial neutron spectrum. Thethermal neutrons, large variation is conspicuous. In C/E's of reaction rates were hardly changed afterthis time, the standard deviation that was calculated adjustment. It means that the calculation of initialby the reaction rate of three Au foils was about ±7%. neutron spectrum is best estimation.
- 786 -

JAERI-Conf 2003-019
[Multi-Foil Activation Method - Transient State] Table I Specification of TRACY
The transient operation mode is ramped Core tank Diameter Approx. 50cmwithdrawal. The integral power is 19.2MJ, and the Height Approx. 200cm
solution temperature was about 65 IC. During this Uraniu-235 Approx. 10%time, radiolysis gas was generated, and change of a Solution fuel: enrichment
solution level was created by void. From the above U02(NO3)2 aq. Uranium up to 5OgU/L,phenomenon, the standard deviation of thermal concentration currently 4OgU/L
neutron region was about ±7% that was calculated by Critical height 40 to 100cm,the reaction rates of three Au foils. As calculation currently 50cm
conditions, eigenvalue calculation of the usual steady Excess reactivity for transientstate was performed. he adjusted neutron spectrum operation up to 3Sis high about 3 in the then-nal neutron region, Peak up to 500OMW
although it becomes the almost same shape to an Power up to 32MJinitial neutron spectrum. Here, the reliability of i(E) Integrated (=10'8 fission)is incalculable with sufficient accuracy because of the Room te perature,complicated conditions of the transient state. in
Initial temperature Typically26 C
References up to 40 'C1) Radiation shielding information center, `RSIC
peripheral shielding routine collection -SPEC4 Table 2 Exp condition of TRACYcalculated recoil proton energy distributions Run I Operation Power Integral Measuringfrom monoenergetic and continuous spectrum No. mode (W) power(J) Methodneutrons-, "PSR-99 1976).
2) K. Sakurai, Y. Miyoshi, T. Nakamura and 0. Sato, R148 Stationary 30m 408 Recoil"Preparation of Dosimetry Code for Static state proton
Experiment Critical Facility TransientSTACY, "JAERI-Data/Code 99-021 1999). R175 State 19M Multi-foil
3) J. F. Briesmeister, Ed., MCNP-A General Monte (Ramped activation
Calro N-Particle Transport Code, Version withdrawal)4A, "LA-12625-M 1997). RI 83 Stationary l0k 5M Multi-foil
4) K. Kosako, F. Maekawa, Y. Oyama, Y. Uno and state activation
H.Maekawa, "A continuous energy cross sectionlibrary for MCNP based onJENDL-3.2, "JAERI-Data/Code 94-020 1994).
5) H. Ing, T. Clifford, T. McLean, W. Webb, T.CousinsandJ.Dhermain, "ROSPEC-Asimplereliable high resolution neutron spectrometer,Radiat. Prot. Dosim. 70, Nos. 1-4,.273 1997).
6) M. Nakazawa, K. K obayashi, S. Iwasaki, T.Iguchi, K. Sakurai, Y. Ikeda and T. Nakagawa,"JENDL Dosimetry file, "JAER1 1325 1992).
7) Bubble Technology Industries, " ROSPEC 1Calibration, private communication 1999).
- 787 -

JAERI-Conf 2003-019
Table 3 ��� sonof neutron fluence
Energy range Proton MCNP C/E(MCV) recoil (E) (C)
0.05 - 45 1 I 8E+07 1 I 7E+07 0.992Units: (n/cM2)
Table 4 The details of each activation foil in NEUPAC-JLOG
Nuclear Half Ener range Cross section Resonance y rayreaction life min. max. (bam) energy (keV)
197 Au(ny) 2.694d 2.44E-02 6.39E+00 98.65 4.906eV 412197 Au(ny)-Cd 2.694d 6.90E-01 6.OOE+02 98.65 4.906eV 412
63 Cu(ny) 12.70h 2.03E-02 9.61E+03 4.51 58OeV 1346115 ln(nn') 4.486h 1.07E+06 5.62E+O 170m l.2MeV 33641 ITi(np) 43.68h 5.76E+06 I 1.23E+07 30.3m 7.6MeV 1312
*The energy range is decided by TRACY spectrum.In and Ti is threshold value
Table C/E of the reaction rate in the analysisresult of NEUPAC-JLOG (Stationar sate)
Nuclear Before Afterreaction unfolding unfolding
C/E C/E197Au(ny) 0.984 0.989
'97Au(ny)-Cd 1.013 1.01761Cu(ny) 1.000 1.004115ln(nn') 1.037 1.0344'Ti(np) 0.971 0.984
]!Miller
Table 6 C/E of the reaction rate in the analysisresult of NEUPAC-JLOG (Transient state)
Nuclear Before Afterreaction unfolding unfolding
C/E C/E197 Au(ny) 0.997 0.994197 Au(ny)-Cd 1.028 1.009
61 Cu(ny) 0.971 0.989
115 In(nn') 0.999 1.0014'Ti(np) 0.877 0.919
Fig. Overall view of TRACY
- 788 -

JAERI-Conf 2003-019
Homogenized odinary oncrete and steel bars0 500 (m)
Tank srface (ordinary conci-ete:88%+SD345:12%)
Foil
y Homogenized glove boxHc4cni (SUS304L:I%+SS400 02/ Core tank (se
Installation of foil void:99.9%) Dnp tray(0.4cniT SUS_
Supporting gtruCtUre(ordinary concrete)
4inner diam. 50N6 outer diain. 7,618Outer diam. 52.146
Top plate(SUS304L�-
Guide pipe fortransient red tage at z= cin Reflector tank, empty inside
(SUS304LTP) (I mT SS40 (0.5cmT SUS304L)Side wall
(SUS304L)
solution
Bottom platex1y "N"
Off-gas sllution 111tank, emptyinside
uniccin
Fig. 2 Installation requirements in TRACY reactor roomA brand name of recoil proton proportional counter is ROSPEC.
LE+07coil proton proportional co
MCNP
Li
1.13+06
Distance 2M
z Run time 4hDose 0.877mSv/h
LE+05 I 1
1 3 ....... ................................................ .. ... ........... .... ................................................ ................
M1.2
rl1.11.0
0.9 LI0.8ls.
0.7
0.6
0.5
0.4
LE-02 1.13-0 I LE+00 LE+01
Neutron Energy(MeV)
Fig. 3 Recoil proton proportional counter overall Fig. 4 Comparison with recoil proton proportionalview counter and MCNP
- 789 -

JAERI-Conf 2003-019
I.E+ I -- -------------- LE+12 ---
Initial neutron spectrum ron spectrunt...... Analysis spectrum =trum
LE+10
I.E+ I
I.E+09
z z
1.13+08 LE+10
1.02 1.04n S n1.00 U 1.02
0.98 r 1.00
0.96 0.98
0.94 0.96
0.92 0.94A
0.90 0.92LE-02 I.E+00 I.E+02 I.E+04 11+06 I.E+08 LE-02 I.E+00 I.E+02 I.E+04 LE+06 11+08
Neutron energy (eV) Neutron energy ()
Fig. Unfolding result of NEUPAC-JLOG Fig. 7 Unfolding result of NEUPAC-JLOG instationary state transient state
LE+09
TRACY R175
LE+08
11+07
LE+06
LE+05
I.E+040 1 0 20 30 40 50 60 70
Time(Sec.)
Fig. 6 Power change of transient state operationon TRACY
- 790 -

JAERI-Conf 2003-019 JP0450148
Transient Characteristics Observed in TRACYSupercritical Experiments
2Yuichi YAMANE% Ken NAKAJIMA1, Kazuhiko OGAWA,Eiju AIZAWA, Hiroshi YANAGISAWA 2 and Yoshinori MIYOSHI
Japan Atomic Ener�y Research Institute, Tokai-mura, Naka-gun, Ibaraki 319-1195, Japan
A series of supercritical experiments has been performed using the transient experimentcriticality facility, TRACY, and some transient characteristics of low-enriched uranyl nitratesolution have been observed. The peak power and the number of fissions have beenmeasured with three types of reactivity insertion method. The data useftil for the evaluationof criticality safety for reprocessing plants were obtained.
KEYWORDS. TRACY, Supercritical, Low-enriched, Uranyl nitrate solution, CriticalityAccident, NUCEF
1. Introduction SUS304L. It has a cylindrical shape with 50cm-diameter and is placed in the center of the reactor
In order to investigate the criticality accident room as shown in Fig. 1. In the center of the core tank,phenomena of solution fuel, an experiment program there is a guide tube with 76mm outer diameter for ausing the transient experiment criticality facility, transient rod, Tr-rod, as shown in Fig.2. Tr-rodTRACY, has been conducted by Japan Atomic Energy contains B4C inside it and is used for reactivityResearch Institute. Since the first criticality was insertion. Reactivity is controlled by the level of fuelachieved in 1995, more than 200 of the operations of solution or by the position of Tr-rod. The maximumTRACY have been performed and many basic data for excess reactivity is 3 for any experiment. The fuellow-enriched uranyl nitrate solution were obtained. solution is pumped into the tank from its bottom. AData such as power profile and the number of released number of neutron detectors are placed on the ceilingfissions were measured under various experimental as shown in Fig.2. There are thermocouples and aconditions. contact type level gauge inside the core tank and a
The obtained data are expected to be useful for the pressure gauge on the side wall of the core tank Noemergency planning for a reprocessing plant ' reflector was used during the series of experiments.determining the action against an emergency situationand te estimation of the fission yield released at acriticality accident. The experiments usinghighly-enriched uranium solution were also performedwith CRAC') and SILENE 2) reactors before, however,there are little experimental data for low-enricheduranium solution.
This paper presents the review of the preliminaryresults of the TRACY experiments which wererecently published3-5). In the next section, the outlineof the experiment is explained. The main results arepresented in section 3.
2. Outline of TRACY Ex eriment
2.1 FacilityTRACY is a reactor which uses 10% enriched
uranyl nitrate aqueous solution as fuel. Its uraniumconcentration was maintained to be in the rangebetween 350 and 450 gU/Lit. and acid molarity was inthe range between 0.5 and 1.0 mol/Lit. during theseries of experiments. The core tank is made of
Fig.1 TRACY core placed in the center of core room.
Corresponding author, Tel. 81-29-282-6743, Fax. 81-29-282-6798, E-inafl: yamane�melodytokaijaeri.gojp'Present address: Research Reactor Institute, Kyoto University, Kurnatori-cho, Sennen-gun, 0saka, 590-0494 Jpan2Present address: S=etariat ofNuclear Safety Commission ofJapan, Kasumigaseld, Chiyoda-ku, Tokyo, 100-8970, Japan
- 791 -

JAERI-Conf 2003-019
2.2 Condition of Experiment about 40 to 65cm. In most cases, no external neutron2.2.1 Method of Reactivity Insertion source was used. The initial temperature of solution
There are three methods of inserting reactivity. fuel was about 25'C.(1) Pulse withdrawal mode In the experiments, the power, temperature, and
At the pulse withdrawal, PW, mode, Tr-rod was pressure were measured to observe the transientwithdrawn pneumatically in about 02 sec. The characteristics of aqueous uranyl nitrate solutioninserted reactivity was in the rage of 025$ to 296$. during the supercritical experiments.The effect of the inserted reactivity on the transientpower behavior was mainly measured. 3. Results(2)Ramp withdrawal mode
At the ramp withdrawal, RW, mode, the reactivity 3.1 Effect of Excess Reactivity on Peak Powerwas inserted by withdrawal of the transient rod in a In the PW experiments, a sharp peak and followingconstant speed using a motor drive system. The small oscillation appear in power profile after theinserted reactivity was in the range of 1.5$ to 3, and insertion of more than I reactivity. Three typicalthe rate of transient rod withdrawal was 6 to 875 cases are plotted in Fig.3. For each case, Tr-rod wascm/min. In these experiments, the effect of the withdrawn at second. It is seen that a smallerinitial power level on the transient power behavior amount of excess reactivity gives a smaller andwas also measured as well as that of the reactivity broader peak in power profile. In the experiments,insertion conditions (i.e. the amount and rate of the radiolytic gas voids, which causes negative feedback,inserted reactivity). was observed 6) after the power peak. The cases of less(3)Ramp feed mode than 1$ reactivity insertion are plotted in Fig.4. Much
At the ramp feed, R, mode, the reactivity insertion broader and smaller peaks are seen, however, thewas conducted by feeding fuel solution in a constant dependence of the peak power on the excess reactivityfeed rate into the core tank, while the transient rod is the same as the higher reactivity cases.was being fully withdrawn from the core. The Peak power is plotted in Fig. as a function ofinserted reactivity was in the range of 0.5$ to 27$, excess reactivity for the PW and R experiments ofand the solution feed rate was 20 to 60 liter/min. In more than 1$ insertion. The average reactivitythese experiments, the effect of the reactivity insertion insertion rate is about 0.15$/sec for each case of theconditions on the transient power behavior was RF experiments. It seems that the peak power is verymeasured.
1.E+102.2.2 Other Parameters and Obtained Data2.97$
The solution level was determined to meet each 1.E+09 2 $
experimental requirement and its range was fom $1.E+08
I.E+07
I.E+06
Transient Linear Ch.B Transient Linear Ch.Ai E+05
Transient Log Power C Transient Rod 1.E+04
11+03
0 1 2 3
Time (sec)
Fig.3 Examples of power profile for PW
Level Gauge experiments.Thennocouples
l.E+06Guide Te 'A7$
0.5$
Pressure Gauge 0.4$
!BONN 0.3$
MEMO 0
1 E04
Fuel Solution
Feed and Drain I I.E+03
0 100 200 300 400
Time (sec)
Fig.2 Schematic view of TRACY core tank and Fig.4 Examples of power profiles for smallerequipments. reactivity insertion.
- 792 -

JAERI-Conf 2003-019
sensitive to the excess reactivity. As the excess Tr-rod depends on its position and is not constantreactivity increases, the peak power increases in the through withdrawing, the reactivity insertion rate isrange of two decades for the PW experiments, while not constant. In the R experiment, reactivity isthe peak power keeps in the range of less than one inserted by pumping the solution ftiel into the tank at adecade for the R experiments. This can be explained constant rate. Since the differential reactivity worthas following; since the reactivity insertion rate for the depends on the solution level, the reactivity insertionRF experiment is much smaller than that for the PW rate is not constant. In this paper, the averageexperiment, the effective excess reactivity inserted reactivity insertion rate is considered, which is defineduntil the first power peak is almost for most cases as the ratio of total excess reactivity to the time for itsexcept those cases for which the reactivity insertion insertion.rate is extremely large or small. The extra reactivity The peak power is plotted as a function of averagebeyond gives rise to the change of the power reactivity insertion rate in Fig.7. The excess reactivityprofile after the first peak. n Fig.6, the oscillation is between 1.8 and 3 for the RW experiments andwith large amplitude is seen in the power profile after between 16 and 27$ for the R experiments. Thethe first peak for the case of 264$. It is clear that a initial power is I W for the RW experiments, while thesmaller amount of reactivity insertion gives smaller initial state is subcritical for the R experiments. It isamplitude and longer period of oscillation. found that the achieved peak power increases with the
I.E+10 reactivity insertion rate. While the peak power is verysensitive to the rate for the cases in the range between
PW0.01 and 0.3$/sec, it is not so sensitive in the range
=AR F15+09 -------------------- --------- I between 0.5 and 0.8$/sec.
1.E+09
1.E+08 ---------------------------EL
1.E+08 ---------------O A A
15+07 --------------------------- I.E+07 -A--- --------------
0CL
1.E+06 ---------------------- --------I.E+06
1 2 3 L76RW1.E+05 -------
WExcess Reactivity AA RF
Fig.5 Peak power as a function of excessI.E+04
reactivity. 0.0 0.2 0.4 0.6 0.8
Average Reactivity Insertion Rate ($/sec)
1.E+082.64$ Fig.7 Peak power as a function of average reactivity
1.8$1.E+07 ...... . insertion rate.
.,.,1.25$
1.E+06 3.3 Effect of Initial Power to Peak Power
In rough explanation, for the case of slow reactivityno 1.E+05 insertion, the first peak of power profile is dominated
by temperature effect, in other words, the temperatureI.E+04
of the solution increases so that the feedback reactivity
I.E+03 balances to the inserted reactivity. Since the higher0 20 40 60 80 initial power causes the faster release of the energy,
Time (sec) the power reaches a peak faster and the height of the
Fig.6 Examples of power profile for RF peak becomes lower. In Fig.8, the first peak power isexperiments. plotted as a function of initial power for the RW
experiments. The excess reactivity is 298$ and theinsertion rate is 0.7$/sec for each experiment. The
3.2 Effect of Reactivity Insertion Rate to Peak figure shows that a larger amount of initial powerPower gives a smaller peak power. Figure 9 shows the
The rate of reactivity insertion is one of the most examples of the power profiles of the experimentsimportant parameters for the RW and RF experiments, corresponding to those in Fig.g.
however, it is difficult to take into account the actual 3.4 Relation between Inverse Period and Peakinsertion rate. In the RW experiment, reactivity is Power
inserted by withdrawing the Tr-rod at a constant According to the Nordheirn-Fuchs mode 17-1), whichvelocity. Since the differential reactivity worth of
- 793 -
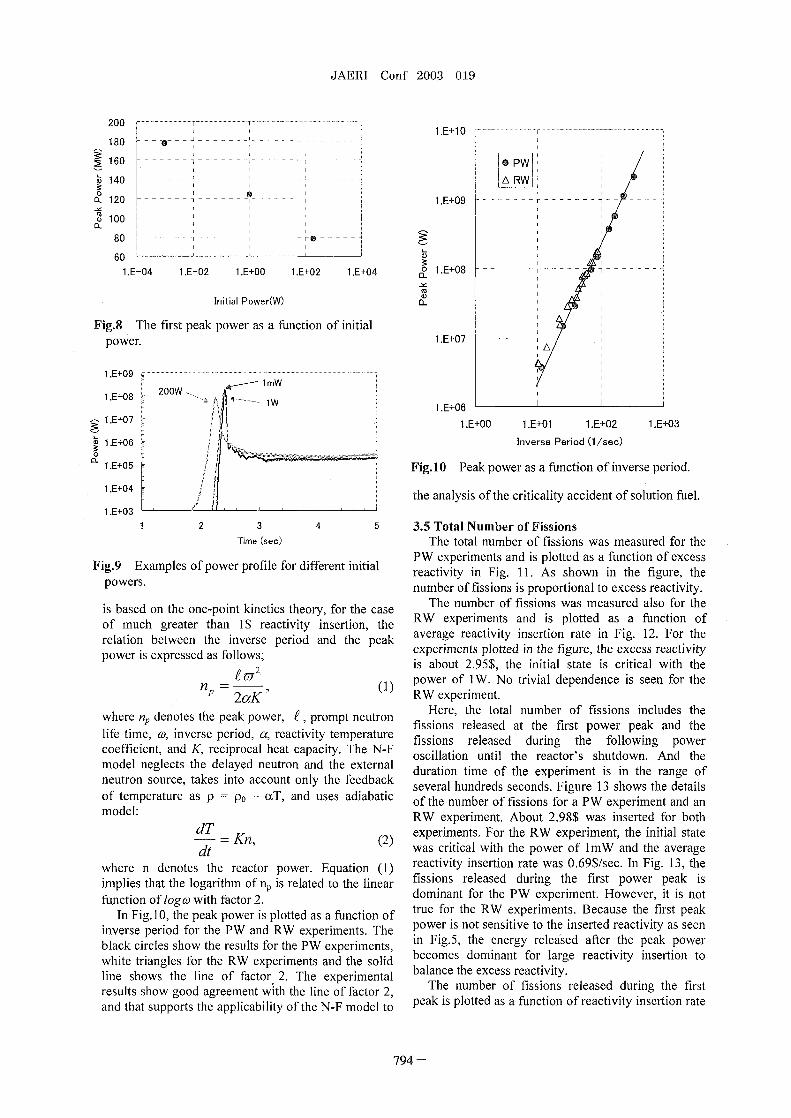
JAERI-Conf 2003-019
2 0 0 .. .... ............................ 1 .E 10 . .. . .......
180 ---- o---
160 ------ I0 ------ WI
140 ------- !A RW
a- 120 ---- I.E+09 --- ---- r ------- 7100 - - - - - - - - - - - - - - - - - - - -
80 FO 3.
601.E-04 1.E-02 l.E+00 1.E+02 1.E+04 o 1.E+08 -------- ----EL
cod)Initial Power(W) EL
Fig.8 The first peak power as a function of initialI.E+07 - - - - - - - -power.
1.E+091mW
200WI.E+08 --- --- 1 W1.E+06
I.E+00 1.E+01 I.E+02 1.E+0315+07
I.E+06 Inverse Period (1/sec)0n
E+05 Fig. I 0 Peak power as a function of inverse period.
.E+04the analysis of the criticality accident of solution fuel.
1.E+03F1 2 3 4 5 3.5 Total Number of Fissions
Time (see) The total number of fissions was measured for the
Fig.9 Examples of power profile for different initial PW experiments and is plotted as a function of excessreactivity in Fig. I As shown in the figure, the
powers. number of fissions is proportional to excess reactivity.
is based on the one-point kinetics theory, for the case The number of fissions was measured also for theof much greater than 1$ reactivity insertion, the RW experiments and is plotted as a function ofrelation between the inverse period and the peak average reactivity insertion rate in Fig. 12. For thepower is expressed as follows; experiments plotted in the figure, the excess reactivity
is about 295$, the initial state is critical with the
np power of 1W. No trivial dependence is seen for the2aK RW experiment.
where np denotes the peak power, �, prompt neutron Here, the total number of fissions includes thelife time, o, inverse period, a, reactivity temperature fissions released at the first power peak and thecoefficient, and K, reciprocal heat capacity. The N-F fissions released during the following powermodel neglects the delayed neutron and the external oscillation until the reactor's shutdown. And theneutron source, takes into account only the feedback duration time of the experiment is in the range ofof temperature as p po - xT, and uses adiabatic several hundreds seconds. Figure 13 shows the detailsmodel: of the number of fissions for a PW experiment and an
RW experiment. About 298$ was inserted for both
dT Kn, (2) experiments. For the RW experiment, the initial statedt was critical with the power of mW and the average
where n denotes the reactor power. Equation (1) reactivity insertion rate was 0.69$/sec. In Fig. 13, theimplies that the logarithm of np is related to the linear fissions released during the first power peak isfunction of logo) with factor 2 dominant for the PW experiment. However, it is not
In Fig. IO, the peak power is plotted as a function of true for the RW experiments. Because the first peakinverse period for the PW and RW experiments. The power is not sensitive to the inserted reactivity as seenblack circles show the results for the PW experiments in Fig.5, the energy released after the peak power
i becomes dominant for large reactivity insertion towhite triangles for the RW experiments and the solid balance the excess reactivity.line shows the line of factor 2 The experimental The number of fissions released during the firstresults show good agreement wth the line of factor 2 peak is plotted as a function of reactivity insertion rateand that supports the applicability of the N-F model to
- 794 -

JAERI-Conf 2003-019
80 Howing Oscillati
st Pea6
7
.2 4 - - -
LL 6012 .0
W
W 5EDz
0
1.0 1.5 2.0 2.5 3.0 x 4
Excess Reactivity ($) C0
Fig.11 Total number of fission as a function of U)3Eexcess reactivity for PW experiment., 4-0
2
8 E
0 z
6 - - - - - - -- - - - - - - - - - - --
C> 0 so0
PW RW4 - - -
Reactivity Insertion MehodLL0
2 Fig.13 Number of released fssion for two typesE of experiments.z
00.0 0.2 0.4 0.6 0.8 3.0
Reactivity Insertion Rate ($/see) 0
Fig.12 Total number of fission as a ftinction of 2.0
average reactivity insertion rate for RW01.5experiment.
in Fig. 14. As mentioned in the section 3 , the 01.0 ---effective excess reactivity given until the power peak E0.5 - - -
is about I$ for most of the RW experiments and thus z0.0the number of fissions released in the first peak is also 1.E-02 1 E-01 1.E+00
close to each other. This result is consistent with the Reactivity Insertion Rate Wsee)
result shown in Fig. I . Fig.14 Number of fission released during the
3.6 Effect of Structural Material in Core to Power first peak as a function of reactivity insertionProfile rate for RW experiment.
Figure 15 shows the results of two experiments, for conditions in which Tr-rod withdrawn, Tr-UP, orwhich only the difference is that there is a cluster of Tr-rod inserted, Tr-DO" . During the measurement,thermocouples in the solution for one experiment. the core tank had been surrounded with an insulator toPeriodic oscillation is seen in power profile for the keep the solution temperature at the desired point. Theexperiment without a cluster of thermocouples, while corresponding reactivity to each solution level wasno periodic change is seen for the experiment with it. estimated by the solution level difference method").
The result implies the possibility such that the Figure 16 shows the result. The black and whitestructural material prevents the natural convection of circles show the critical solution level and reactivitythe solution and that can change the power profile. change for the condition of Tr-UP. The triangles are
3.7 Reactivity Temperature Coefficient for the Tr-DOWN. From the experiments, theThe reactivity temperature coefficient was also preliminary value of the temperature coefficient is -5.0
cent/'C for both conditions, while the calculated valuemeasured for the uranium concentration of 402.0 using SRAC code SySteM12) with JENDL-3.2 13) crossgU/Lit. as follows; the solution which had been heated section library is - 4.7 cent/'C.beforehand was pumped into the core tank, then thecritical solution level was measured for both
- 795 -

JAERI-Conf 2003-019
criticality accident of solution fuel, however, it may beI.E+08 needed that further understanding of the feed back
mechanism by solution temperature, radiolytic gasI.E+07 with a cluster of thermorupi voids and convection flow of fuel solution.
§i I.E+06 AcknowledgementsThe authors wish to thank the members of
1.E+05 Criticality Safety Lab. and Criticality Technology
Group for their help in the measurement and operationI.E+04 during the series of TRACY experiments.
without a cluster of thermocuples
I E+03 -I 20 30 40 50 References
Time (sec) 1) P.Ucorcli.6, et al., "A Review of the ExperimentsPerformed to determine the Radiological
Fig.15 Examples of power profile with or Consequences of a Criticality Accident,"without thermocouples inside core tank. Y-CDC-12 1973).
2) F.Barbry and J.P.Rozain, "Objectives and
750 40 Summary of Experiments on The Formation ofLc �forTr-UP Radiolysis Gas Carried Out using The Silene
700 - - - - - - -- - - - - - 20-A- Lc for Tr-DOWN Reactor," SRSC 89.08 1989).-0- RC for Tr-UH 0 3) K.Nakajima, et al., TRACY Transient
650 --A- RC for Tr-DOWN 0 Er Experiment Databook I)Pulse Withdrawal-- - -- - - - -20 -Data/Code 2002-005 2002).
600 Experiment," JAERI0 4) K.Nakajima, et al., "TRACY Transient
---- --- Experiment Databook 2)Ramp Withdrawal
Experiment," JAERI-Data/Code 2002-006 2002).0 500 - - - - - - -- - - - - -- -60
5) K.Nakajima, et al., "TRACY Transient450 -80 Experiment Databook 3)Ramp Feed Experiment,"
20 25 30 35 40 JAERI-Data/Code 2002-007 2002).Solution mperature (IC) 6) K.Ogawa, et al., "Development of Solution
Fig.16 Critical solution level and reactivity Behavior Observation System under Criticalitychange as a function of solution temperature. Accident Conditions in TRACY," J. Nucl. Sci.
Technol., 37, 1088 2000).4. Summary 7) K.Fuchs, "Efficiency for very slow assembly,"
LA-596 1946).For the study of the criticality transient 8) L.Nordheim, "Pile kinetics," MDDC-35 1946).
characteristics of uranyl nitrate solution fuel, a series 9) B.E. Simmons and J. S.King, "A Pulsed Neutronof super critical experiments has been performed Technique for Reactivity Determination," Nucl.using TRACY. The power profile and number of Sci. Eng. 3 595 1958).released fissions have been measured for various sets IO)K.Sumita, et al., "Reactivity Measurement on theof parameters such as excess reactivity, reactivity Reflected Semi-Homogeneous Critical Assemblyinsertion rate and initial power. by Pulsed Neutron Technique," J. Nucl. Sci.
It is found that for the PW experiment, the peak Technol. 4 825 1962).power and total number of fissions were sensitive t I I)A.F.Henry, "The Application of Reactor Kineticsexcess reactivity. For the RW and R experiments, the to the Analysis of Experiments," Nuct. Sci. Eng 3,peak power was sensitive to the reactivity insertion 52 1958).rate and initial power, but not sensitive to the excess 12)K.Okamura, et al., "SRAC95; General Purposereactivity. The number of fissions released during the Neutronics Code System," JAERI-Data/Codefirst power peak was not so sensitive to reactivity 96-015 1996).insertion rate for the RW and R experiments, while 13)T.Nakagawa, et al., "Japanese Evaluated Nuclearmost of fissions were released in the first peak of the Data Library version 3 revision-2: JENDL-3.2, J.power for the PW experiment. Nucl. Sci. Technol, 32, 1259 1995).
The obtained data are useful for te analysis of the
- 796 -

JAERI-Conf 2003-019 JP0450149
Re-evaluation of Gamma-ray Exposure Rates during TRACY Power BurstExperiments Based on the Latest ENDL Files
Hiroshi YANAGISAWA*, Hiroki SONO and Jun-ichi KATAKURAJapan Atomic Energy Research Institute, Tokai-mura, Naka-gun, Ibaraki 319-1195, Japan
Gamma-ray exposure rates during reactivity-initiated power burst experiments performedin the Transient Experiment Critical Facility (TRACY) were re-evaluated for the purpose ofvalidation of the latest JENDL series nuclear structure data and nuclear data files. For theexposure rates contributed by fission products (FPs), aggregate FP photon yields for l8s af-ter the termination of the initial power burst were calculated by using the ORIGEN2 codetogether with the updated photon and decay databases based on the latest nuclear structuredata file, JENDL FP Decay Data File 2000. As results of Monte Carlo photon transport cal-culations using the photon yield as a fixed source, the calculated exposure rates were ingood agreement with the measurements. It was, therefore, confirmed that the updated data-bases were valid for evaluating photon yields fi7om short-lived FP nuclides. The gamma-rayexposure for the duration of the initial power burst contributed by neutron-induced reactions,such as fission and neutron capture, was also re-evaluated using the latest nuclear data li-brary, JENDL-3.3. The re-evaluation indicated that there is little difference in the exposureby Monte Carlo neutron-photon combined transport calculations between the JENDL-3.3library and the former version library, JENDL-3.2.
KEYWORDS. gamma-ray exposure rate, reactivity-Inidatedpower burst, TRACY, nu-clear structure data, nuclear data, fission product, ORIGEN2, JENDL P Decay DataFile 2000, Monte Carlo calculation, ENDL-3.3
1. Introduction A new FP decay data file, the JENDL FP DecayData File 2000 (JENDLIFPD-00), has been available,
For the assessment of external radiations under which contains the photon spectra of such short-livedcriticality accident conditions, y-ray exposure rates nuclides based on theoretical estimations.8) By usinghad been determined at the Transient Experiment JENDL/FPD-00, the ORIGEN2 database files wereCritical Facility') (TRACY) in the Japan Atomic En- updated.9) In the present work, the aggregate FP ex-ergy Research Institute (JAERI) using an ionization posure rates were re-evaluated by computationalchamber system with fast time-response.2,3) In par- analyses using the updated databases for the ORI-ticular, determination of the exposure rates from GEN2 code, and compared with the experimental re-short-lived fission products (FPs) was one of impor- sults.tant issues from the viewpoints of not only personal In addition, re-evaluation on the y-ray exposuredosimetry but also discrimination between neutrons contributed by neutron-induced reactions for the dura-and y rays for power monitors in TRACY . tion of the initial power burst was performed using thepurposes, aggregate y-ray exposure rates from latest nuclear data file, JENDL-3.3,10) results of whichshort-lived FPs had been experimentally evaluated are also described in this paper.within 18s after the termination of an initial powerburst as well as those contributed by neutron-induced 2. Review of Experimentsreactions, such as fission and neutron capture, for theduration of the power burst, within I Oms. The experiments were performed in TRACY,
The computational analyses had been also per- which is a pulse-type reactor to simulate reactiv-formed by using Monte Carlo particle transportation ity-initiated power bursts. In TRACY, 10% enrichedtechnique together with aggregate FP photon yields uranyl nitrate solution is used as fuel. The reactivityvarying with time calculated by the ORIGEN2 code .7) was inserted up to 293$ for the measurements ofIt was, however, clarified that the calculated FP ex- y-ray exposure rates at the position being 2m awayposure rates were very smaller than those obtained in from the TRACY core tank. The concentration of ura-the experiments. The underestimation was found to be nium, concentration of free nitric acid and initial solu-due to the lack of data on photon spectra of short-lived tion temperature were in the range of 385 to 388g/f,FP nuclides (half-life: -0.1 to -10s) in the photon 0.51 to 0.60mot/f and 25.6 to 26.20C, respectively.
2,3)database file attached to the ORIGEN2 code. Prior to the burst experiment, the solution level was
Conesponding author, Tel. 81-29-282-6024, Fax. 81-29-282-5937, E-mail: yanagisw�nuceftokaijaeri.gojp
- 797 -

JAERI-Conf 2003-019
adjusted at 55.7 to 62.2cm in height, depending on the database although the original photon database con-�9)
amount of inserted reactivity. The details of experi- tained 240 unstable FP nuclides. ment were described in the earlier report .2) The ex- The aggregate photon yields from FP nuclides af-perimental results are briefly reviewed below. ter the termination of initial power burst were calcu-
Figure I shows 7-ray exposure rates for the dura- lated by using the ORIGEN2 code together with thetion of the initial power burst. The exposure per fis- updated databases. Using the photon yield as a uni-sion in the initial burst was evaluated to be form volumetric source in the TRACY core, the pho-(7.l3±0.43)xl0_'9C/kg/fission, which was contributed ton flux for 35 energy-groups up to MeV was cal-mainly by neutron-induced reactions, such as fission culated by the MCNP version 4C (MCNP4C) code.")and neutron capture, because of very short durations The number of particle histories was I million. Figureof the initial burst. Using the above value of exposure, 3 shows geometrical models of the MCNP calcula-the measured 7-ray exposure rates after the termina- tions, in which major equipment in the TRACY reac-tion of the initial power burst were discriminated be- tor room is taken into account as much as possible.tween those contributed by FPs yielded in the initial Atomic number densities for the solution fuel wereburst and done by neutron-induced reactions. Conse- calculated using the density equation reported by Sa-quently, the FP exposure rates were evaluated kurai et al.") For the materials except the solution,experimentally, as shown in Fig.2. atomic number densities were determined using the
list of atomic compositions previously reported by oneX101 of the authors. 14) The photon and electron reaction
1.8 data attached to the MCNP code were used. The1.6 ............. ............... .............................. ... ......... thick-target bremsstrahlung model") was applied for
7.............. ............... 7.............. ................ .....1A ;z I : the approximation of electron transportation. The ex-p: inserted reactivity
2 1.2 ............ posure rates were obtained by the following conver-1.0 ....... .......... . . ... ........ ............... .............. .............................. s io n fo rm u la .
0 . .........0.3 ....... ........ .............................. .............. .............
0.6 ................ . ....... . ......... X 1.602 x I 0 0 3600 a x
lor" OA E, O(E,, t)E xE ...............
0.2 ...........
0.0 where,0. 16 0.20 0.25 0.30 OM OA0 OAS 0.60 , (t): exposure rate from FPs, (C/kg/h),
Lapse of time after insertion of reactivity ) (,u_ / pi photon mass energy-absorption
Fig.1 Exposure rates for the duration coefficients") of the i-th group forof initial power burst .2) dry air, (CM2/g),
O(Ej): photon flux of the i-th group,10 3 /CM 2/S),
's
p nerted activity E, photon energy of the i-th group,E
0 . ....... I ............... ................................ ............................... (M e V ),013 .8 raEl tio of exposure to collision
kerma 16), = 0.0294C/kg/Gy),................ . . ......lo ' ............ ........ ....... J . .....................
I lapse of time.
P=2.93$A p=2AO$l10 0 a p=2.00$0 P ........... ..................... For the other purpose of re-evaluation, the 7-ray
ox P=1.60$exposure for the duration of initial burst contributedS
E by neutron-induced reactions was also calculated us-ing the JENDL-3.3 nuclear data library. Using thelo" lo' 101
Lapse of time after initial burst ) MCNP4C code, photon fluence for 35 energy-groups
Fig.2 Exposure rates from FPs after the termination up to MeV was obtained by neutron-photon com-2) bined eigen-value calculations. In the calculation, twoof initial power burst.
sorts of eigen-value analyses, static (by KCODE
3. Calculation Methods for Re-evaluation card") and F, rompt-neutron dynamic modes (byACODE card' )), were applied for comparison. It is
The main purpose of re-evaluation is validation of considered that the prompt-neutron dynamic modethe updated photon and decay databases for the ORI- may simulate exactly neutron behavior during theGEN2 code. The updated databases were compiled power increase in the burst. Te number of fissions inusing the latest nuclear structure data file, the core was also calculated to obtain the exposure perJENDL/FPD-00. In particular, 695 unstable FP nu- fission. The number of particle histories was I millionclides are taken into account in the updated photon (5,000 particles/cycle 200 cycles). The geometrical
models and atomic number densities were the same as
- 798 -

JAERT-Conf 2003-019
described above. The exposure was obtained by means where, x,,.: exposure per fission, M g/fission),of the similar conversion formula to Eq.(I), (D(E,): photon fluence of the i-th group,
11.602x 10-"' Y (p_ / p), Ej (D(Ej) (I /CM),I I 1 (2) NF the number of fissions.F NF
Homogenized ordinary concrete and steel bars300 400 (ordinary on-W 88%-SD345:12%)
(CM)0
X
r dia 6.904,inne diam. 50.046, outer diarn 761 outer Mam. 52.146 Homoge Azed glow box
z i (SLIS3041:1%-SS400:0.2-ATop plate,(SUSF304L)
Guide pipe fortransient rodSUS304LTP) -- -- -- -
Side wall X(SUS304L)----_
Uranyi nitrateSolution Raflectortan
0 Stage IBottom plate I emptyinside OR(SUSF3M) at z=-60cm .. . . . .. . . . . (0.5anT SIS304L)
(ImTSS400)
y
Support(SUS304L),--,
Off-oas dillutiontank, empty inside(0.6cmT SUS304L)A
unit: cm
The stages comprise plates, ............ Stage at z=200cm 1cmT SS400)beams etc. fSS400. I I Stag&atz=510cmjIcmTSS40D)
- - Stage at z=770cm I=T SS400)
(a) Cross-sectional view of core (b) Honzontal arangement of reactor roomHomogenized ordinary concrete and steel bars(ordinary onerele: 88%.SD345:12%)
0 100 2D 300 40 (cm) Z
t z=770cm (1 cmT S400)
Homogenized equipment forcontrol devices (BC:I%-SUS3041- I Y.id:88%)
Stageat z=51 Ocm (I -T SS400)
Off-gas dillution Core tantank, I- Ro.31allemptyinside(O.GMT SUS304L) Stage
atz=200cm(I anT SS400)
empty insi(0.5Q.T SUS304L)
Fig.3 Calculation model,
Stage at Homogenized 'SUS304l2,'SUSF304U,'SUS304LTP',z' 60cm Supporting structure glove box 'SS400'and'SD345'indicate Japanese sandard
(IcrnT SS400) (ordinary -mts) (SUS304L:I%
Drip tray (0.4cmT SIS304L) +SS400:0�:'%) designations of steels. 12)-void:9 8%
The stages comprise plates, beams etc, ofSS400.
(c) Vertical arangement of reactor room
- 799 -

JAERI-Conf 2003---019
4. Results and Discussion
4.1 Exposure rates from Fission Products After the Table FP nuclides in ORIGEN2 databases,Termination of Initial Power Burst sixty short-lived FP nuchdcs having large contribution to
Figure 4 shows results of re-evaluation. The ex- total photon yieldjust after fission:0.5382 photon/s/fission.
perimental data are averaged and divided by the num- D.t. fr.. JENDLJFPD-00 Status of ORIGEW2 database'
ber of fissions in the initial power burst. It is con- Ind.p.n- Photon yield Original Updatedfinned that the re-evaluated exposure rates using the N-Ii , fi d-.nt Hell- E..h Cum
d _M life nuclide C.ntri Wmyield. W photon/s b.ti.n ... in Decay Pholon Decay Ph.t.nf .".) b.ti
updated ORIGEN2 databases well reproduce the ex ission) 1%)
periments while the exposure rates based on the Sr-97 0.0197 0.43 0.0520 9.66 9.66 indclud.d N/A included included
original databases are very small. This is because S,-96 0.0370 1.06 0.0372 6.91 25.05 indcluded NIA included included
many FP nuclides havin large contribution to the I I C,Rb-95 O.OD81 3 0.0223 4.15 33.49 included NIA included includedZr-99 0.0327 2 .0202 3.7: 37.25 inc:ud:d NIA inc:uded inc:ud:dphoton yield are newly added in the photon database, Rb-96 0.0020 0.120 0. 0159 2.9 40.20 inc ud d N/A ic ud:d I udd
1. nc, lu
as listed in Table 1. The updated databases are, there- Cs-142 0.0223 1.770 0.0156 2.91 43.11 included NIA included Inc dedY-99 0.0202 4 0.0148 2.76 45.87 included NIA Iud d nclud'd
fore, valid for evaluating photon yields ftom S,-99 0.0035 0.27 0. 01448 2,71 4:'62 included NIA 1.,,uded in ddK,-92 0.0169 1. 84 0.012 2. 30 1 93 included included Iud.d in clud.d
short-lived FP nuclides. Y-98 0.0073 0. 55 0. oil '. 2. N12 included N/A included includedRb-94 0.0157 2.70 0.0113 2.II0 55 .23 iZ.d:d included i..:ud:d inn.:uud:dSr-98 0.0068 0. 65 0.0109 2. 03 57,26 inc ud d N/A in ud d c d dX.441 0.0131 1. 73 0.0094 1.75 2.07 inc:.d:d N/A included included
10-11 6 Rb-97 0.0008 0.17 0.0079 1.47 6 4 inc,ud.d N/A inc ud d innc:udedY-101 0.0040 0.45 0.0074 1.37 61.84 inc d d NIA I:u d:d I . ud.dZr-1101 0.0264 2.30 0.0066 1.23 63.07 included included included included
C B.446 0.0098 2.22 0.0064 1.20 64.27 included NIA included includedKr-93 0.0052 1.29 0.0061 1.13 65.40 included N/A included included
U) 1 011 6 .... . ............................ ............................ C.443 0.0143 ,.77 0.0058 1.07 66.47 included N/A included included2 Nb-1103 0.0162 1.50 0.0057 1.07 67.54 included N/A included included
M Kr-94 0.0022 0.21 0.0053 0.98 69.56 included N/A included included
Kr-91 0.0318 8.57 0.0052 0.97 70.54 included N/A included includedco 7 ................... In-130 0. 009 0,:052 0.97 71. 1inc:uddedd included in.:uded included
.......... ................................. ................... 0 022 2I 0-1 1-140 .86 .051 .94 72.54 1nc u N/A in.ud d included
EWA_Br-90 0.0066 1.92 0.0040 0.88 75.16 included N/A included includedZr-102 0.0208 2.90 0.0043 0.81 75.97 included NIA included included
1 o- Based on ORIGEN2 updated databas4 . .... .. Rb-93 0. 308 5.84 0.0043 0.79 76.76 included N/A included includedX 3s 04) Based on ORIGEN2 original database Ba-1145 0.0179 4.31 0.0042 0.78 77.54 included N/A included includedCL Xe-134m 0.0006 0.29 0.0039 0.72 78.26 included included included included
SILL O Experimental WY-102 0.0026 0.90 0.0036 0.67 79.63 included N/A included included
1 0- 9 J ZMOO 0.0524 7.10 0.0035 0.65 80.28 included N/A included included-1 0 1 102 Y-100 0. 0013 0.74 0.0031 0.58 80.86 included NIA included included
10 10 10 Ba-1143 0.0381 14'33 0. 030 0.56 :1.42 innc:ud:dd N/A included included
Lapse of time after initial burst (s) La-148 0.0025 1.05 C, .: 030 0.56 .97 1 cud NIA inc:ud:dd inc:udedBr-91 0.0024 0. '4 0.0027 0.49 82 .47 included N/A I.. ud inc ud d
.9 C,
Fig.4 Results of re-evaluation of exposure rates Xe-140 0.0357 113,60 0.0027 0.49 82 96 inc:udd:d NIA included inc,,d dCs-1144 0.0035 00 0.0026 0.47 83." I c u d NIA in d.d inc d'd
from FPs after the termination of initial power burst. Sb-1137 0.0005 0.14 O.:025 0.47 9. includ d NIA included InCI.d dS.-88 0.0033 3 0. 024 45 4,35 Inel uded NIA i d.d i.Iud dBr-89 0.0121 4.40 M024 0. 44 84.80 Included NIA In clud.d Included
However, there remains a problem found in the 62-87 0.0002 0.07 0.0023 0.43 85.67 included NIA included included
present re-evaluation. The re-evaluated exposure rates X.4412 0.0044 1.24 0.0023 0.43 86.10 included NIA included included
S.-87 0.0071 5 85 O.:02,1 0.40 86.92 included NIA inc:udded ic:udedare slightly smaller than those by experiments, as Nb-l 01 0.0188 7',0 0. 02 C.3 87.30 included M. inc d in uded
shown in Fig.4. This is because 33 isomers have not As-88 0.0003 0.16 0.0020 0.38 88.05 included NIA inc:ud:d in2ud:dd
been still taken into account in the databases although T.-135 0.0312 19.00 0.0020 0.37 88.43 included included I.. ud d i c udNb.100m 0.0030 2.99 0.0020 0.36 88.79 included N/A included included
they are included in JENDL/FPD-00.9) In particular, 1-139 0.0097 2.29 0.0019 G.3S 89.14 included N/A included included14 93.y, 96.y, 97my, 98my, 100my, 1-138 :.0153 6.49 0.0019 0.35 89.48 included included included included
such isomers as 'As, ,,Kr-90 . 448 32.32 0.0017 0.31 89.79 included included included included
102mNb, 104fflNb, 128mIn, 146mLa, have relatively large
contribution to the photon yield, as listed in Table 1. a. data from JNDC 2nd version.'7)The contribution of them is about 18% of the total b. N/A: not available.photon yield just after fission (zero cooling time). Toattain better accuracy, further modification is needed
on handling those isomers.
4.2Exposures for the Duration of Initial Power For the prompt-neutron dynamic eigen-value cal-
Burst culation (ACODE), the exposure is slightly smaller
than that by the KCODE calculation, but the differ-
Table 2 lists results of re-evaluation. It is found ence is in the range of the standard deviations of cal-
that there is little difference in the exposures by the culation. It had been confirmed that there were not
static eigen-value calculations (KCODE) between the significant differences in the neutron and photon en-
JENDL-3.3 and JENDL-3.2 libraries. The discrepancy ergy spectra between the ACODE and KCODE calcu-
in the exposure between the calculation and measure- rations .3) The result of re-evaluation is consistent with
ment is 6, which is the same range of the experi- this point.
mental uncertainty described in Sec.2.
- 800 -

JAERI-Conf 2003-019
Conf Nuclear Criticality Safety (ICNC'99),Table 2 Results of re-evaluation of exposure for the Versailles, France, September 20-24, 1999,
duration of initial power burst. V01.11, .900 (1999).
JENDL Mode Exposure per fission C/E 2) H. Yanagisawa, A. Ohno, E. Aizawa,version (C/kg/fission� "Determination of Gamma-Ray Exposure Rate
3.2a KCODE (6.70± 0.05)XjVv b 0.940 from Short-Lived Fission Products under
3.3 KCODE (6.68±0.Wx%�9 0.937 Criticality Accident Conditions," J Nucl. ScLACODE (6.64±0.05)x0"� 0.931 Technol., 39[5], 499 2002).
a. Ref 1 8. 3) H. Yanagisawa, Study on Evaluation of Powerb. cited from ReQ, Histories and Photon Exposure Rates during
calculated by the MCNP version 4B code. 19) Reactivity-Initiated Power Burst Experiments fora Solution Fuel System, D. Eng. Dissertation,Nagoya Univ., Grad. School of Eng., Japan
5. Conclusion (2002) [in Japanese].4) H. Sono, H. Yanagisawa, A. Ohno, et a,
To validate the latest JENDL series nuclear struc- "Measurement of Neutron and Gamma-Ray Ab-ture data and nuclear data files, the re-evaluation was sorbed Doses under Criticality Accident Condi-carried out on the y-ray exposure rates during reactiv- tions at TRACY Using Tissue-Equivalent Do-ity-initiated power burst experiments performed in the simeters," Nucl. ScL Eng., 139, 209 2001).Transient Experiment Critical Facility. 5) H. Yanagisawa, K. Nakajima, A. Ohno, et al.,
For exposure rates contributed by fission products "Evaluation of Photon Shielding Capability for(FPs), aggregate FP photon yields after the termina- Epithermal Neutron Detection during Reactiv-tion of initial power burst were calculated by using the ity-Initiated Power Burst Experiments," J Nucl.ORIGEN2 code together with updated decay and Sci. Technol., 39[7], 800 2002).photon databases based on the JENDL FP Decay Data 6) K. Nakajima, H. Yanagisawa, Y. Miyoshi,File 2000. As results of the photon transport calcula- Measurements of Power Profile in TRACY Su-tions using the photon yield as a fixed source, the percritical Experiment by Detecting Epithermalre-evaluated exposure rates were in good agreement Neutrons, JAERI-Tech 2003-028, Japan Atomicwith the measurements. It was also indicated that the Energy Research Institute 2003) [in Japanese].further improvement on handling some isomers in the 7) A. G. Croff, "ORIGEN2 A Versatile ComputerORIGEN2 calculation is needed for better accuracy. Code for Calculating the Nuclide Compositions
The y-ray exposure for the duration of initial burst and Characteristics of Nuclear Materials," Nucl.contributed by neutron-induced reactions, such as fis- Technol., 62, 335 1983).sion and neutron capture, was also re-evaluated using 8) J. Katakura, T. Yoshida, K. Oyamatsu, et al.,the JENDL-3.3 nuclear data library. The re-evaluation JENDL P Decay Data File 2000, JAERI 1343,indicated that there is little difference in the exposures Japan Atomic Energy Research Institute 200 1).by the neutron-photon combined transport calculations 9) J. Katakura, H. Yanagisawa, Photon and Decaybetween the JENDL-3.3 and JENDL-3.2 libraries. Data Libraries for ORIGEN2 Code Based onThere is also found to be not significant difference in JENDL P Decay Data File 2000, JAERI-the exposures between the static and prompt-neutron Data/Code 2002-021, Japan Atomic Energy Re-dynamic eigen-value calculations. search Institute 2002).
10) K. Shibata, T. Kawano, T. Nakagawa, et al.,
Acknowledgernents "Japanese Evaluated Nuclear Data Library Ver-sion 3 Revision-3: JENDL-3.3, J Nucl. Sci.
The authors would like to acknowledge Dr. Y. Technol., 39[11], 1125 2002).Suzuki, Dept of Safety Research Technical Support, 11) J. F. Briesmeister ed., MCNPT" -A GeneralJAERI, for his encouragement to the present work. Monte Carlo N-Parlicle Transport Code VersionThanks are also due to Dr. T. Fukahori, Nuclear Data 4C, LA-13709-M, Los Alamos National Labo-Center, JAERI, for his support to the MCNP calcula- ratory, 2000).tions using the JENDL-3.3 library. 12) Japanese Standards Association, JIS (Japanese
Industrial Standards) Handbook, 1997), [inJapanese].
References 13) S. Sakurai, S. Tachimori, "Density Equation ofAqueous Solution Containing Plutonium (IV),
1) H. Yanagisawa, K. Nakajima, K. Ogawa, et al., Uranium (VI) and Nitric Acid," J. Nucl. Sci."Experiments on Transient Behavior of a Technot., 33[2], 187, 1996).Low-Enriched Uranyl Nitrate Solution System 14) H. Yanagisawa, A. Ohno, K. Ogawa, et al.,with TRACY to Study Hypothetical Criticality "Time Delay of Thermal Neutron DetectionAccidents in Reprocessing Plants," Proc. Intl. During Power Burst in TRACY," J Nucl. ScL
- 80 -

JAERI-Conf 2003-019
Technol., 38[8], 591 2001).15) J. H. Hubbell, S. M. Seltzer, Tables ofX-Ray
Mass Attenuation Coefficients and Mass En-ergy-Absorption Coefficients rom leV to2OMeV for Elements =I to 92 and 48 Addi-tional Substances ofDosimetric Interest, NISTIR5632, National Institute of Standards and Tech-nology 1996).
16) H. Hirayama, "Concepts of Dose for Photons andRelations between Conversion Factor to Effec-tive Dose At the Enforcement of the RegulationBased on 1990 ICRP Recommendation," J. At.Energy Soc. Jpn., 43[51, 427, 2001) [in Japa-nese].
17) K. Tasaka, J. Katakura, H. hara, et al., JNDCNuclear Data Library of Fission Products-Second Version-, JAERI 1320, Japan AtomicEnergy Research Institute 1990).
18) T. Nakagawa, K. Shibata, S. Chiba, et al.,"Japanese Evaluated Nuclear Data Library Ver-sion 3 Revisio.n-2: ENDL-3.2, J Nucl. Sci.Technol., 32 12], 1259, 1995).
19) J. F. Briesmeister ed, MCNPm -A GeneralMonte Carlo N-Particle Transport Code Version4B, LA-12625-M, Los Alamos National Labora-tory, 1997).
- 802 -
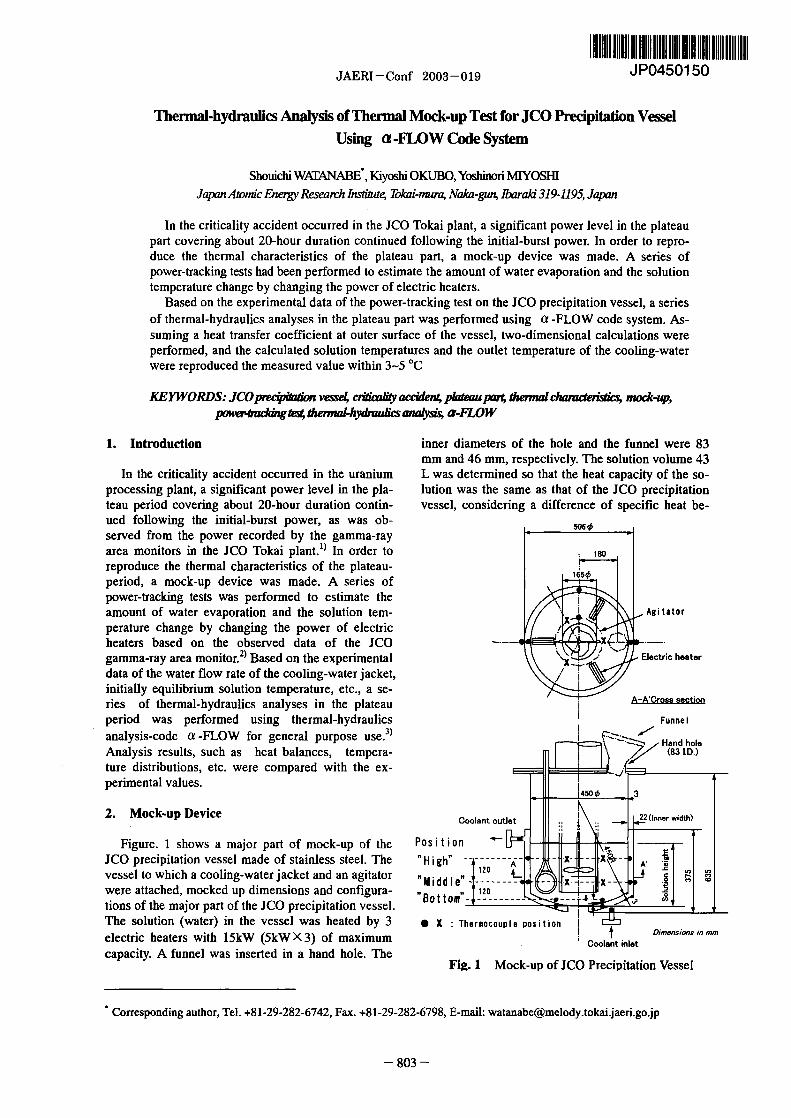
JAERI-Conf 2003-019 JP0450150
IMermal-hydraulics Analysis of Thermal Mock up Test for JCO Precipitation Vessel
Using a -FLOW Code System
Shouichi WATANABE', Fjyoshi OKUBO, Ymhinori M[YOSIUJapan A wnuc iterV Resea rch Inowe, Taka i-nutra, Naka -ffl� M rak 31 9-11 95 Japan
In the criticality accident occurred in the JCO Tokai plant, a significant power level in the plateaupart covering about 20-hour duration continued following the initial-burst power. In order to repro-duce the thermal characteristics of the plateau part, a mock-up device was made. A series ofpower-tracking tests had been performed to estimate the amount of water evaporation and the solutiontemperature change by changing the power of electric heaters.
Based on the experimental data of the power-tracking test on the JCO precipitation vessel, a seriesof thermal-hydraulics analyses in the plateau part was performed using a -FLOW code system. As-suming a beat transfer coefficient at outer surface of te vessel, two-dimensional calculations wereperformed, and the calculated solution temperatures and the outlet temperature of the cooling-waterwere reproduced the measured value within 35 C
KEYWORDS: JCOprecpdoon ves* cnbcaldyawden4 platt=paA thennalchamdensfts, mook up,pmvv4addng AA dwmw1-hy&mdics analysis, -FLOW
1. Introduction inner diameters of the hole and the funnel were 83mm and 46 mm, respectively. The solution volume 43
In the criticality accident occurred in the uranium L was determined so that the heat capacity of the so-processing plant, a significant power level in the pla- lution was the same as that of the JCO precipitationteau period covering about 20-hour duration contin- vessel, considering a difference of specific heat be-ued following the initial-burst power, as was ob-served from the power recorded by the gamma-rayarea monitors in the JCO Tokai plant!) In order to 180reproduce the thermal characteristics of the plateau-period, a mock-up device was made. A series of 450power-tracking tests was performed to estimate theamount of water evaporation and the solution tem- Agitator
Xperature change by changing the power of electricheaters based on the observed data of the JCO Xi..gamma-ray area monitor.2) Based on the experimental Electric heaterdata of the water flow rate of the cooling-water jacket,initially equilibrium solution temperature, etc., a se-ries of thermal-hydraulics analyses in the plateau A-A'Cross sectionperiod was performed using thermal-hydraulics Funnel
3)analysis-code a-FLOW for general purpose use. Hand holeAnalysis results, such as heat balances, tempera- (83 LD.)ture distributions, etc. were compared with the ex-perimental values. 450 b 3
2. Mock-up Device Coolant outlet 22(innerwift)
Figure. I shows a major part of mock-up of the Posi tion
JCO precipitation vessel made of stainless steel. The 'High - ----------- X-vessel to which a cooling-water jacket and an agitator 4-,Middle ------- 4 X.were attached, mocked up dimensions and configura- . 120tions of the major part of the JCO precipitation vessel. Bottom - --------- LA--E AI T IFThe solution (water) in the vessel was heated by 3 X Thermocouple position , U,
i Dimensions mmelectric heaters with l5kW (5kW X 3 of maximum Coolant inlet
capacity. A funnel was inserted in a hand hole. The Fig. I Mock-up of JCO Precipitation Vessel
Corresponding author, Tel. 81-29-282-6742, Fax. 81-29-282-6798, E-mail: watanabe�melody.tokaijaeri.gojp
- 803 -

JAERI-Conf 2003--019
tween water and uranyl-nitrate solution. The solution 2 kW and the solution temperature 90 was as-dimensions were 45cm in diameter and 31 cm in sumed to be in equilibrium which corresponded toheight. Typical thermocouple positions in the solution initial reactivity, and following test was performed:and the cooling- water were as follows: as shown in (1) The initial condition of the test was made. Thethe figure, thermocouples located vertically at "high", solution was heated at a stretch by maximum,'middle" and 'bottom" positions, and the three for heater power from room-temperature to the targeteach vertical position were arranged to measure the solution temperature, then the heater power wassolution temperatures. Two thermocouples located at set to be 2 kW, and the steady state was attained by"middle" position to measure the outer surface tem- adjusting the flow rate in which 45 hours wereperatures of the vessel. spent.
The heater power was controlled by a personal (2) Starting from the above condition (1) and usingcomputer. so as to reproduce the observed power pro- the power profile of the JCO gamma-ray areafile. Both solution temperature and solution height monitor, a power-tracking test in the plateau partwhich was reduced by water evaporation flowing out was performed for 17 hours in order to measurethrough the hand hole were measured continuously. the amount of water evaporation and the solutionFlow rate and inlet temperature of the cooling-water temperature change. Then, te test was continuedwere fixed at constant values. The agitator was not for additional 3 hours after the cooling-wateroperated in the experiment reported in this paper. circulation was stopped.
3. Power TracMng Test 3.3 Experimental ResultFigure 2 shows temperature changes with time for
3.1 Experimental Condition all the measurement positions in te solution and theThe experiment was performed based on following cooling-water. As shown in Fig. 1, three thermocou-
observed data by the JCO gamma-ray area monitor: ples were arranged for each vertical position. Tm-beginning of the plateau part at 11:00 on September perature discrepancy among the three was found to30, 1999, stop of the cooling water circulation at 330 be -0.5'C for the solution, and -0.2'C for the cool-on the next day, and cease of the accident at 615 on ing-water. It was regarded that the temperaturethe next day.') Based on the observed power profile change in circumferential direction of the vessel wasand other information of the accident, following ex- small, and two-dimensional geometry (R-Z) was ap-perimental conditions were set up: plied in the analysis calculation mentioned later.
(1) The burst of the observed power became stable at 100Water flow rate 024 Umin :OL/min11:00, and the power level was estimated to be
about 2kW. Therefore, equilibrium solution tem- 90 Solution at "High"
perature and the same power were assumed as ini- Solution at Middle-80 Cooling water at "Hio"
tial condition of the experiment. Cooling water at"Middle"
(2) Although piping of the cooling-water system of , 70the JCO precipitation vessel was fractured in orderto cease criticality at 330 on the next day, the a- 60
ter in the cooling-water jacket was not drained be-E 50cause the piping had risen on the way. Therefore,
the cooling-water circulation was stopped without 40 - Solution at "Bottom"
draining water in the experiment Cooling water at"Bottom
(3) The condition of the cooling-water of the JCO 30
precipitation vessel was unknown. Therefore, thecooling-water flow rate was determined paramet- 20 . . . . . . . ... .
0 2 4 6 8 10 12 14 16 18 20rically and the inlet temperature was assumed to be Elapsed time in plateau part (hr)
about 25 T in the experiment. Fig. 2 Temperatures for each measurement point
3.2 Expeirimental Method Figure 3 shows the solution temperature changesA series of simulation tests of thermal characteris- with time at the high, the middle and the bottom po-
tic bad been performed covering the plateau part by sitions and that of the outlet position of te cool-changing electric-heater power based on one-point ing-water. Both the initial temperatures at the high
2)approximation of nuclear kinetics equation It was and the middle position were 90 C, and reduced toestimated that the initial reactivity of the precipitation -57 just before the cooling-water flow stopped.vessel was about 25 dollars, which corresponded to On the other hand, the temperature at the bot-the cooling-water flow rate of 024 L/min. Based on tom-position in the plateau part was kept at about 28the result, the power-tracking test was performed for 'C. The amount of the water evaporation was aboutthe case of 25 dollars with the cooling-water flow 2.3 L.rate. As an initial condition, power level was set to be
804 -

JAERI - Conf 2003- 019
100 5.0 vessel, Toom: room temperature(K), S: heat transfer0.24 L/min OL/min (M).
area90 Soluton temp. at High- 4.5Solution temp. at Middle! As for the value of S, the outer-surface area of the
80 Coolin"ater temp. 4.0 2 side wall 046 was used because the amount ofoutlet70 3.5 heat transfer of the side wall was assumed to be much
60 3.0 greater than that of the bottom part. The heat transfer
50 2.5 coefficient H was given as time-dependent input forthe calculation mentioned later.
Hester power40 2.0 Zo The temperature T, the heat removal by the room
30 Solution tem at Bottom 1.5 air circulation and the heat transfer coefficient H with
20 1.0 time are shown in Fig. 5. H value ranged from 25 to(W/M2/y13
10 0.5100 4.0
0 _J 0.0 0.24 min L/min -
0 2 4 6 8 10 12 14 f6 t8 20 90 3.5Elapsed time in plateau part(hr)
80 emp. at outer
Fig. 3 Mmffed Thre e and Heater Power iddle'pos. 3.07
E Heat balance for the tracking test was estimated. 2.5S 60
The total heater power was balanced with heat50 2.0
removals by the cooling-water, the room air circula- E
tion at outer surface of the vessel and the water .3 40 Heat transfer oef. 1.5
evaporation. he removal heat by the cooling water 30 Heat removal at outer
and the evaporation were estimated directly. As surface of 1.0
shown in Fig. 3 the heat removal at the surface was 20
significant due to the small flow rate of the cooling 10 0.5
water 0.24 Umin). In the beginning of plateau part, 0 . . . . . . . .... J 0.0the percentages of the amounts of the heat removals 0 246810121416 1 20
Elapsed time in plateu part(hr)
by the cooling-water, the room air circulation and theevaporation are estimated to be about 53, 35 and Fig 5 Heat trarider Coefficient at Outer Sur&ce of Vessel
2.5 Water flow rate 024 Umin 0 Umin 4. Thermal-hydraulics Analysis
2.0 A series of thermal-hydraulics analyses in the pla-I (Electric heater)teau part was performed using thermal-hydraulics
analysis-code a -FLOW in which the incompressi-1.5 ble-fluid analysis module coupled with the
heat-conduction analysis module of the code system0 oo ng water was applied. Analysis results, such as heat balances,0-1.0
temperature distributions, etc. were compared withthe experimental values.
omarcrcuat n0.5
orat o 4.1 Analytical ModelThe geometry for the analytical calculation is
0.00 2 4 6 8 10 12 14 16 18 20 shown in Fig.6, and had following features:Elapsed time in plateau part (hr) (1) A two-dimensional (R-Z) cylinder coordinate
Fig. 4 Measured Heat Balance system was considered, while one mesh for 030deg. sector in the circumferential direction. The
12 for the total heater power, respectively. The mesh division numbers were 63 for radial directionevaporation also continued at lower temperature, al- and 59 for axial direction.though the amount was very small. (2) The cooling-water jacket, heaters and the solution
part of the precipitation vessel were considered in
It was assumed that the heat transferred the geometry. The inlet position of the cool-
quasi-static in the plateau part. As typical value, fol-lowing beat transfer coefficient H (W/M2 /K) at the
outer surface of the vessel was defined: Concerning the temperature difference between upper
H=(Qh- Q�- Qdl(T..,- T.)IS (1) and iddle part of the vessel surface, the uncertaintywhere, Qh: heater power (W), Qc: heat removal by of the H value was estimated to be - ±10%, whichcooling-water (W), Q,: heat removal by evaporation corresponded to the 12 'IC of the solution tempera-(W) T, temperature (K) at the outer surface of the ture change.
- 80 -

JAERI - Conf 2003 - 019
ing-water was set to be at the bottom of the vessel input data. Te beat removal by the cooling-waterfor simplification. was evaluated from the inlet- and outlet- tempera-
(3) A ring-shaped heat source located at the heater tures, ad the flow rate of the cooling-water. Theposition. The heat generation rate was determined heat removal at the outer surface of the vessel wasso as to balance with the total beater power. derived from the heat balance.
(4) The heat transfer coefficient at outer surface of The calculated heat removal by the cool-the vessel was used in the model. ing-water was about 7 15 % smaller than te
(5) The heat removal by the water evaporation was measured at the beginning and the end of theconsidered at the upper surface of the solution, andthe solution eight was kept constant. 2.5
Water flow rate 024 L/min 0 Urnin
2 2 2
k . .. . .. . ...... 2 .03 B. 9 T a I Electric heater)
112 I K 11 i WaterouI et
Heat removal byevaporation �i 1.5
3 3 9
...... ----- - oo ng water0
.0
--- ---- Solu ion (waterHeat n
conduction 0.51111 I IIIIH
eater---0.0
Heat 0 2 4 6 8 10 12 14 16 18 20removal Elapsed time in plateau part (hr)
at outerI HIM ---- surface Fig. 7 Comparison of Calculated
and Measured Heat Balance
plateau part. Similarly, the calculated heat removal9.
by the room air circulation was about 10-20 larger than the measured at the beginning and theend of the plateau part. On the other hand, the cal-
3 9 culated heat removals by the cooling-water and bythe room air circulation reproduced the measuredLEIvalues at the middle of the plateau part.
Va t a r n I a t UnIt: co (2) Temperature changes with time
Fig. 6 Two-Dimensional Calculation Model Temperature changes of the solution at the high,
1000.24 L/min DL/min
4.2 Calculation method and condition 90 Solution at "High" (calc)
The initial condition of the plateau part was made Solution at -Middle" (�alc)
after steady state calculation with constant inlet tem- 80
perature, heater power and cooling-water flow. Cal-culation conditions of the plateau part are summa- 70
rized as follows:Inlet temperature of cooling water; 23.5 C, 20 60 Cooling water a
01 (Ca1c.)ECooling-water flow rate; 0.24 L/min, 0
Room temperature; 21.5 C, l- 50
Initial heater power; 2.0 kW. 40
Solution at "Bottom" (calc.): AZ
Inputs of the heater power and the heat removal by 30
water evaporation were given as time dependent val-ues based on the measurement. 20
0 2 4 6 8 1 0 2 14 16 1 20
4.3 Analytical result Elapsed time in plateau part (hr)
(1) Heat balance Fig. Comparison of Calculated andThe heat generation and the amounts of the heat Measured Temperatureremovals with time are shown in Fig. 7 Both the the middle and the bottom position and that of themeasured data of the heater power and the heat outlet position of the cooling-water are shown in Fig.removal by the water evaporation were given as 8. The calculated temperatures of the high and the
- 806 -

JAERI-Conf 2003-019
F_CC)
95.00
90.00
'OS0,00
8 00
75.00
70.00HI ....... �'-65 00
460.00
55.00
45.00
40JO0
35.00iZ
- O&W i"012 0 MOO
t= 0.0 hour, 2 kW t 16.4 hour, 0.8 kW t= 183 hour, 028 kWsolution temperature: solution temperature: solution temperature: 0.1m/s
Max.; 90.8 C Max.; 56.2 C Max;. 52-5 CAverage, 86.5 C Average, 53.6 C Average; 513'C
Fig. 9 Temperature and Flow-Velocity Distribution
middle position reproduced the measured values at mal-hydraulics analyses in the plateau part was per-the beginning and the end of the plateau part, while formed using Ce -FLOW code. Calculated tempera-they were 'larger about 3 T by the maximum than tures by the two-dimensional analysis of the test al-that of the measured at the middle of the plateau part. most agreed with the measured value, and are sum-The calculated solution temperature of the bottom marized as follows:position reproduced the measured values. On the (1) The calculated solution temperature and the outletother hand, the calculated outlet-temperature of the temperature of the cooling-water were reproducedcooling water was smaller about by the the measured value within 3'C and 5C, respec-maximum at the beginning and the end of the plateau tively.part, while it was almost the same as the measured at (2) The calculated temperatures changed with timethe middle of the plateau part. more gradually compared with the measured tem-
As a whole, the tendency was shown that the cal- peratures.culated temperatures changed with time more gradu-ally than the measured values. Further analysis is advanced on the basis of the(3) Tmperature and flow-velocity distribution analytical result, considering the typical value of the
Figure. 9 shows the temperature and flow-velocity heat transfer coefficient at the surface of the vesseldistributions at the beginning of the plateau part, and and a three-dimensional calculation model.before- and after- the cooling-water flow stop. Thelow-temperature solution stagnated and caused the References
temperature stratosphere in the bottom region of the 1) K.Tonoike, T.Nakamura, YYamane, YMiyoshivessel, while the solution temperature was almost "Power Profile Evaluation of the JCO Precipita-constant in the high and the middle region. The flow tion Vessel based on Record of the Gamma-raywhich served as the down flow near the side wall Monitor" Nuclear Technology, 143, 364 (2003).inverted the flow direction in the boundary between 2) S.Watanabe, Y.Miyoshi, Y.Yamane," Simulationthe middle and bottom region, then went up. On the tests for Thermal Caracteristics of JCO Pre-other hand, the low-temperature solution in the bot- cipitation Vessel Using a Mock-up Device"tom region produced almost no flow. After the cool- JAERI-Tech 2002-043 (2002).ing-water flow stopped, the temperature distribution 3) N.Suzuki, ed., "Fluid Analysis System forbecame more gradual in the bottom region. General Purpose FUJI-RIC/ a -FLOW -" Fuji
S. Summary Research Institute Corp. (1993).
Based on the power-tracking test for the mock-upof the JCO precipitation vessel, a series of ther-
- 807 -

JAERI-Conf 2003-019 JP0450151
Comparative Neutron and Gamma-ray Dosimetry ofJCO and SAROV Accidents Using FETCH
A. K Ziver, C. C Pain, M. D. Eaton, A. Umpleby, C. R. E. de Oliveira, A. J. H. Goddard and D. N. Simister+Imperial College ofScience, Technology and Medicine, Computational Physics and Geophysics,
Earth Science and Engineering, Prince Consort Road, London, United Kingdom.Health and Safety Executive, Nuclear Safety Directorate, St. Peter House,
Balliol Road, Bootle, Merseyside, L20 3LZ United Kingdom.
This research is aimed to assist UK's Health and Safety Executive (HSE) in interpreting the principles of radio-logical protection for practical situations through the application of the transient criticality code FETCH. Twoparticular 'measures' were taken for investigation, namely the neutron/gamma ray dose ratio in any resultingfield, and the impact of such a ratio on post-accident dosimetry (in particular the sensitivity of Na whole bodyaverage activation to neutron/gamma ratio) - with corresponding yields from criticality accidents. These meas-ures have been investigated with the aid of two criticality accidents; the JCO accident in which criticality wasachieved in a thermalised system, and the SAROV accident which represents criticality occurring in a fast sys-tem, dominated by high energy neutrons. Modeling of both criticality accidents has been carried out using thefinite element deterministic models to represent the geometrical arrangements, which demonstrate the use ofnovel numerical techniques to tackle this type of complex problems. The deterministic methods used are basedon the time-dependent solution of the particle transport equation coupled with the ray tracing method, which areimplemented in FETCH suite of codes in order to provide a rapid tool to calculate exposure rates. The couplingof FETCH has been established with the European Activation Code System (EASY), FISPACT. Results from ourcalculations are presented with comparisons against other work in order to highlight similarities and differencesin the framework of dosimetry data and methods used.
KEYWORDS. Transient Criticality Dosimetry, JCO and SARO VA ccidents, DeterministicMethods, Neutron Activation Calculations
1. Introduction pletely different neutron spectra: the JCO having awell moderated (thermalised) system, and the SAROV
Imperial College has obtained encouraging consis- having a fast spectrum dominated by high-energytency between worker dosimetry and doses inferred neutrons.from FETCH modeling in association with ICRU flu- We have modeled both accidents using the fiteence to dose data' for the jCO2 accident. The purpose element transport theory code FETCH and carried outof the present paper is to compare and extend our pre- calculations to determine both neutron and gammavious findings to those obtained against the SAROV ray doses. Post-accident dosimetry calculations haveaccidene. 4SE has supported this work in order to been performed to determine activations inside theassist employers in developing their contingency plans body of workers due to neutron-induced reactionsin the event of radiation accident, in particular this using the FISPACT code. These are 24 Na in blood andwork provides guidance on estimating total fission 32p in urine. Additionally, gold and indiurn activationsyield and likely doses from workplace measurements arising from (ngamma) reaction have been calculated.based upon activation of personal samples. Both neu- We have compared our results to those measured andtron and gamma-ray dosimetry have been calculated calculated using other methods.together with neutron-induced post-accident acti- Two particular 'indicators' are proposed for inves-vations. The latter has been perfori-ned using the tigation, namely the neutron/gamma ray ratio inFISPACT 4 code with the neutron spectra obtained any resulting field, and the impact of such a ratio onfrom the FETCH code representing various part of the I? st-accident dosimetry (in particular the sensitivity ofbody. The numerical modeling was performed using Na whole body average activation to neutron/gammafinite element grids in R-Z geometry. ratio) - with corresponding yields from criticality ac-
The JCO criticality accident occurred in 1999 in cidents. These are investigated with the aid of the twoJapan, and the SAROV incident in Russia in 1997. criticality accidents, which can be used as bench-Both accidents were due to violations of safety provi- marks.sions by workers. The first took place in a fuel proc- In the remainder of this paper, we give an overviewessing plant and the second was at an experimental of the radiation transport and activation calculationsfacility. We have chosen these two incidents to model performed followed by results and conclusions.as they represent critical configurations having corn-
Corresponding author, Tel. 44-20-7594-932 1, Fax. 44-20-7594-934 1, E-mail: a.k.ziver�imperial.ac.uk
- 80 -

JAERI-Conf 2003-019
2. Fluence Calculation Method it governs the reaction rate at r. The net neutron cur-
2.1 Theoretical Background rent in the direction n and at r is 2 fQ.n �- (rQEt)dQ.
The numerical methods used to model the critical-5 In calculating doses at the time of the criticality
ity accidents are based on the EVENT module of the event, steady-state neutron sources are used in theFETCH code, which solves the coupled neutron and coupled neutron and gamma-ray formulation, whichgamma ray radiation transport problem using the finite can be defined when Kff equals to unity and the neu-element formulation based on the second order tron flux is time-independent. The fission spectrum iseven-parity form of the Boltzmann transport equation. used to present the energy dependence of neutrons inNeutron interactions 6 were represented using the the criticality incidents. Interested reader should refermulti-group BUGLE cross section library in a 47 to reference (5) for a detailed description of the for-neutron and 20 gamma-ray energy groups in which mulation of the neutron transport equation imple-neutron scattering were represented in P5 spherical mented in EVENT.harmonics approximation.
In the numerical models representing the critical 2.1.2 Calculation of Gamma-ray Fluxesconfigurations used in FETCH, the neutron and The gamma-ray fluxes are calculated using thegamma-ray fluxes have been approximated with a P5 same formulation of the transport equation formulatedangular (spherical harmonics) expansion. The spatial for neutrons but, replacing neutron interactions withdiscretisation is based on four-node quadrilateral ele- those of gamma-rays. The sources are due to promptments. In order to calculate radiation levels around the and secondary gamma-rays. The foriner are thosemodels (at workers positions), we have applied the which are emitted simultaneously during the fission
7'Ray Tracing' technique ,which is implemented as a process and have been extensively studied for the ura-separate module in EVENT. The pixels representing nium systems. For the purposes of this study, an em-the position of various parts of the human body have pirical formula for the prompt gamma-ray spectrumbeen modeled to calculate doses to various organs. In has been employed. The midpoint of the energysummary, the steps below outline the basic work per- bounds for the gamma-ray cross-sections (taken fromformed: the BUGLE library) was used to calculate the prompt- Determine neutron fluxes by solving gamma spectrum. The empirical formula is given be-
time-dependent transport equation for the two low:
over-critical systems representing the criticality 6.6 gamma-rays/fission-MeV O.I<E<0.6 MeVaccidents over a time interval. 2.0 exp(-1.78E) 0.6<E<1.5 MeV
- Determine gamma-ray fluxes arising from prompt 7.2 exp(-1.09E) 1.5<E<10.5 MeVgammas (fission gamma-rays) and the secondary Contributions from secondary gamma rays are in-gamma rays by performing transport calculations cluded by introducing an additional source term tousing a fixed source. take into account contributions arising from
- Use ray-tracing technique to determine neutron (ngamma) reactions. With this source term,and gamma-ray fluxes at the pixels representing gamma-ray transport equations for each energy groupthe various organs in the body. form a coupled system of equations, which are solved
- Convert the energy integrated fluxes to neutron using FETCH to determine fluxes at each finite ele-and gamma-ray doses using the flux-to-dose con- ment grid points.version factors.
2.1.1 Calculation of Neutron Fluxes 2.2 Dose Calculations Using the Ray TracingThe neutron and gamma-ray fluences are calcu-
The time-dependent Bolzmann transport equation lated starting from an eigenvalue calculation repre-for neutron angular flux T(r,.QEt) is determined from senting an over-critical system followed by a fixedthe canonical or parity form of the Boltzmann trans- source calculation. In the latter, contributions from theport equation equations, which consists of the coupled secondary gamma-rays are included, which provide apair of first-order even and odd parity equations pre- framework for the coupled neutron/gamma calcula-sented below. tions. About 2 excess reactivity is used in our models
I a4 + C S+- 0. W- of criticality accidents. To calculate exposures at theV t- (1) positions of interest (Hands, Head, Upper torso,
-VO +GY =--Q.vy+ Lower torso, Upper legs and Lower legs) using the rayv T- tracing method, each position is represented as a pixel
where y = WQ ± Q)]/2 , S± = S(Q ± for each part of the organ. For the purposes of present
S(-Q)]/2 and C and G are the even and odd-parity calculations pixels were filled with air. The ray tracingcomponents of the angular flux, the distributed source ' method is applied in the void surrounding the assem-collision and leakage operators respectively. The neu- blies to determine the mean group flux values at each
tron scalar flux at position r is f y(rQEt) d12 and of the pixels. The flux values were divided by the totalfission rate at each position. This provided calibration
- 809 -

JAEW-Conf 2003-019
of the results to match the fission rate F(t) of the acci- In order to show the physics differences in models,dent. The scalar fluxes at position P and at a given we present firstly calculated neutron and gamma raytime t into the transient is given by: spectra at two pixels (hands and lower torso) in Figs. 3
(DI(P) and 4 which show a thermalised (a soft) and not(D(tP) = F(t) -. (2) thermalised (a hard) spectra neutrons. This property of
F neutron spectra is very important, which affects dosewhere, and activation levels. The gamma-ray spectra pre-
sented in Figs and 6 also show differences betweenF fdE fdP a f O P) - fdP CT f (p)(P (P) the two incidents the JCO had more high-energy
E P P 9 gmma-,ays compared to SAROV.In this way, the time variation of neutron fluxes at In the JCO accident neutrons are moderated due toeach pixel position P can be calculated. The flux val- the presence of the water jacket of the tank and in theues are finally integrated over time to calculate the uranyl nitrate fissile solution itself inside the tank.fluence at each point. The fluence at the start of acci- Fig.3 shows that neutrons seen by the lower torso aredent up to time T is thus calculated from: of lower energies than for the hands. This is due to the
T presence of the water jacket. The calculated neutron( P f D ( t, 11 ) dt (3) and gamma-ray spectra are similar to that shown in
0 reference 3).The mthod of calibrating te time-dependent
fluxes is widely used as described in Hetricks. Con- 101,version factors CF were used to calculate the physicaldose D in Grays (=J/kg) to various organs in the re- 10,�gion of the pixels from these points using:
D fCF(DdE (4)E 10'
---- h.1d.The above equation is used doses from neutrons andgammas using the conversion factors from ICRU 57. 107
Predictions have been made using the burst of4.OE+ 16 for JCO and 2.OE+ 6 fissions for SAROV. lo, lo, 10, 10, lo,
E-gy (eV)
3. Results Fig. 3 The Neutron Spectra for the JCO at hands and
3.1 Neutron and Gamma-ray Spectra lower torso calculated using FETCH.
We present the principal results from dose and ac-tivation calculations for JCO and SAROV accidents.The finite element geometrical modeling of incidentsis shown in Figs. I and 2.
lo-
10'1- tm
----hwids
:e
0
o01
lo- 10 le lo' lo' W
E-rgy (V)
Fig. 4 The Neutron Spectra for the SAROV at handsand lower torso calculated using FETCH.
3.2 Neutron and Gamma-ray Dose PredictionsThe dose predictions have been performed for the
Fig.]. Schematic of JCO Fig.2. Schematic of six pixels namely hands, head, upper body, lower body,showing the vessel mod- Sarov experimental as- upper legs, and lower legs. Tables I and 2 give neu-
eled using FETCH (R-Z sembly showing FETCH tron and gamma-ray doses in Grays for JCO and
Geometry Model) finite element model SAROV respectively. In the case of JCO neutrondoses are an order of magnitude smaller than those
calculated for SAROV. This is due to the spectral ef-
fects presented previously. In JCO less biological
- 810
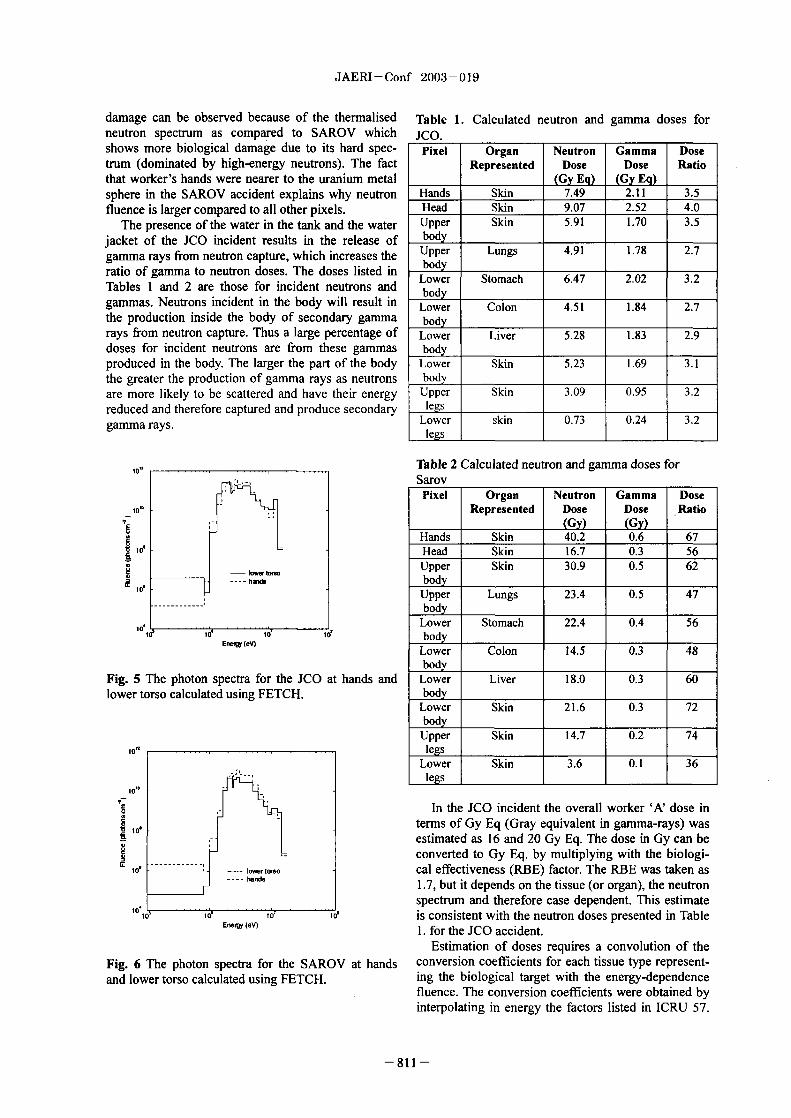
JAERI-Conf 2003-019
damage can be observed because of the thermalised Table 1. Calculated neutron and gamma doses forneutron spectrum as compared to SAROV which jC0.shows more biological damage due to its hard spec- Pixel Organ Neutron Gamma Dosetrum (dominated by high-energy neutrons). The fact Represented Dose Dose Ratiothat worker's hands were nearer to the uranium metal (Gy E) (Gy E)sphere in the SAROV accident explains why neutron Hands Skin 7.49 2.11 3.5fluence is larger compared to all other pixels. Head Skin 9.07 2.52 4.0
The presence of the water in the tank and the water Upper Skin 5.91 1.70 3.5jacket of the JCO incident results in the release of bodygamma rays from neutron capture, which increases the Upper Lungs 4.91 1.78 2.7
ratio of gamma to neutron doses. The doses listed in bodyTables I and 2 are those for incident neutrons and Lower Stomach 6.47 2.02 3.2
bodygammas. Neutrons incident in the body will result in Lower Colon 4.51 1.84 2.7the production inside the body of secondary gamma bodyrays from neutron capture. Thus a large percentage of Lower Liver 5.28 1.83 2.9doses for incident neutrons are from these gammas bodyproduced in the body. The larger the part of the body Lower Skin 5.23 1.69 3.1the greater the production of gamma rays as neutrons bodyare more likely to be scattered and have their energy Upper Skin 3.09 0.95 3.2reduced and therefore captured and produce secondary egsgamma rays. Lower skin 0.73 0.24 3.2
legs I
101, Table 2 Calculated neutron and gamma doses forSarov
Pixel Organ Neutron Gamma Dose101. Represented Dose Dose Ratio
(Gy) (Gy)Hands Skin 40.2 0.6 67Head Skin 16.7 0.3 56Upper Skin 30.9 0.5 62
kmer t�
2 lo' ---- halft bodyUpper Lungs 23.4 0.5 47body
le Lower Stomach 22.4 0.4 56EmW (eV) ; 0, -1 body
Lower Colon 14.5 0.3 48body
Fig. The photon spectra for the JCO at hands and Lower Liver 18.0 0.3 60lower torso calculated using FETCH. body
Lower Skin 21.6 0.3 72bodyUpper Skin 14.7 0.2 74
10. legs
Lower Skin 3.6 0.1 3 6legs
101.
E In the JCO incident the overall worker 'N dose ini terms of Gy Eq (Gray equivalent in gamma-rays) was115EL estimated as 16 and 20 Gy Eq. The dose in Gy can be
converted to Gy Eq. by multiplying with the biologi-lo' ------------ 1�rlomo cal effectiveness (RBE) factor. The RBE was taken as
---- harKis 1.7, but it depends on the tissue (or organ), the neutron
spectrum and therefore case dependent. This estimate
I 0� ;01 EneW(eV) lo' le is consistent with the neutron doses presented in Table1. for the JCO accident.
Estimation of doses requires a convolution of theFig. 6 The photon spectra for the SAROV at hands conversion coefficients for each tissue type represent-and lower torso calculated using FETCH. ing the biological target with the energy-dependence
fluence. The conversion coefficients were obtained byinterpolating in energy the factors listed in ICRU 57.
81 -

JAERI-Conf 2003-019
Figures 7 and present skin doses for neutrons for activities have been measured and being used to esti-both accidents. Dose profile for the SAROV incident mate neutron exposure levels to the workers. Table 3is expected to peak nearest to the uranium sphere at gives Bq/Gy for 23Na(ngamma)24Na reaction. hethe upper torso and decrease roughly with the square mass of tissue iadiated was I kg with FISPACT code.of the distance from the center. However, doses from 32 i generated by thermal neutron activation of3lp inthe JCO accident show the highest peak in the head the 3P(ngamma) 32 P reaction and also by fast neutronregion as this position is not selded from the activation 32S in the 32S(nP)32 P reaction in urine. Anhigh-energy neutrons by the water jacket. attempt has been made to calculate 32p by irradiating p
using FISPACT. Results from these calculations to-Fether with 197Au(ngamma)'"Au and
10.0! 1'In(ngarnm,)116In are presented in Table 4 and .The half-lives of 32p, '"Au and In are 14.3 27, and14.2 seconds respectively.
6.0. Table 3 Ratio of induced activity of 24Na to lung dose
4.0 (Grays in tissue). The activity in Bq is the number of24Na disintegrations per second just after the workersirradiated.
2.0
(Bq/Gy) SAROV JCOOA - .. .. .. ......MA -100.0 _50.0 OA 50.0 Activity
Dld�kmz -(on) "Na in Neutron 8.2E+5 1.6E+7
Blood Gamma-raysFig. 7 The neutron skin doses for the JCO accident 'Na in Neutron 1.7E+5 1.613+7calculated using FETCH. Blood
OA Table 4 A comparison of measured 9o and calculated(FETCH/FISPACT route) of Na activities in blood,
OA and 32 P activity in urine of the JCO accident. Note that32p ativity i from 11p(n, ganuna�2 P reaction at the
0.3 time of the accident
02 Cm Measurements Cakabdons Meneremeaft CalculationsStody Rk^a/g 1115NAk "*P In Urine "P In Urine
NA] 'Nal (1141014 (13q/wo0.1 Worker 8.2413+04 1.62E+04 202 42
AWorker 434E+04 12.2 -
MI 0.0 -10" :to 0.0 MA BDi�Wmkm,- (cm) Worker 1.2313+04 3.3
C
Fig. 8 The neutron skin doses for the SAROV acci-
dent calculated using FETCH. Table 5. Thermal neutron induced activities calculated
33 Neutron-induced activations using FISPACT imediately after the incidents.
Neutron-induced activation calculations can be Neutron-induced SAROV JC0used to determine doses received by various organs. In Reactions (Bq/kg) (Bq/kg)order to calculate activations arising in a body a com- 3 P(n, gamma) 3:zP 1 I E+05 1.213+06plex calculational route should be used, sarting from 1V7AAu(n, gamma) 1"Au 9.013+06 3.313+09particle transport calculations to determine the spectrafollowed by activity calculations. We have used the "-'In(n, gamma) "'In 1.3E+10 I 8.7E+ 12 _JFISPACT code package from UKAEA Culham Labo-ratory, which has been developed as part of the fusionreactor (JET) research programme. The code is part of 3-4 Comparisons against measurementsthe EASY (European Activation System) which in- and uncertaintiescorporates all the necessary nuclear data libraries to be In this section an attempt has been made to identifyapplied to various systems. major uncertainties associated in our calculations in
The neutron-induced activities such as Na in the prediction of exposure rates. It is not however,blood and "P activity in urine have been calculated intended to assess the full set of uncertainties in cal-for both accidents and are presented in Table 3 These culations or measurements. The dominating uncertain-
- 812 -

JAERI-Conf 2003-019
ties are due to the exact positions of workers with re- This work has demonstrated that a calculationalspect to the critical assemblies and the total fissions route has been established and validated to estimatethat actually occurred during accidents. The calculated possible worker doses from biological samples fol-exposure rates predicted are very sensitive to these lowing a criticality accident. The results from FETCHtwo effects. This can be noticed in the case of SAROV and FETCH/FISPACT can be compared againstthat the hand neutron doses are well below the meas- measurements to highlight areas (or fields of study)ured value (calculated 4OGyEq and measured that need especial attention.170OGyEq), which indicates that positioning of handsshould be closer to the experimental configuration Acknowledgementsthan what has been modelled using FETCH. The av-erage dose rate however, to the upper part of the body We would like to thank Alan Edwards and Davidfor SAROV was calculated as 3GyEq, which com- Lloyd of the National Radiological Protection Board,pare well with the measured value of 4GyEq. The Chilton, UK, for providing invaluable advice duringgamma-ray doses however, do not compare well this work and HSE for funding this work.2.5GyEq measured and 045 GyEq calculated. This The views expressed in this paper are those of thedifference may arise from gamma-ray source term authors and not necessarily the views of the Healthuncertainties (total source strength and spectrum). We and Safety Executive.have to point out that in our FETCH models we havenot included the fission product gamma rays. References
In the case of the JCO incident, the measured dose 1) W. S. Snyder, et a., Report of the Task Group onrates for the worker 'A7 are 5.7GyEq for neutrons and Reference Manual," ICRU Report 57, Pergamon8.9 GyEq for gamma rays. FETCH predictions are in Press, 1998).the range of 1.0 - 90 GyEq depending the part of the 2) K. Sumita, "Overview of Tokai-mura accident,body from neutrons and 1.0 - 20 GyEq from gamma Inter. Symp. On the Criticality Accident in To-rays. Again a large discrepancy in gamma-ray doses is kai-mura - Medical Aspects of radiation Emer-observed. gency, Chiba, Japan, 2000).
3) IAEA, "The Criticality Accident in SAROV, "4. Conclusions IAEA, Vienna, Feb. 2000).
4) R. A. Forrest, "FISPACT-2001: User Manual, We have developed and applied a deterministic UKAEA FUS 450, 200 1).
method embraced in the transient criticality code 5) C. R. E. de Oliveira, "An arbitrary geometry finiteFETCH to recent criticality accidents, namely the JCO element method for multi-group neutron transportin Japan and SAROV in Russia. equation, Prog. Nucl. Energy, 18, 227, 1986).
In order to estimate exposure to workers immedi- 6) J. E. White et al., "BUGLE-96 A Revised Multi-ately after the accidents, we have developed and ap- group Cross Section Library for WR Applica-plied a numerical technique based on the ray tracing tions Based on ENDF/B-VI Release 3 " RSIC,method. Doses to organs have been then estimated and ORNL, 1996).presented. The spectral characteristics of neutrons 7) C. R. E. de Oliveira et al., "Finite element spheri-and gamma-ray doses were found to differ signifi- cal harmonics solutions of the 3D Kobayashicantly (as expected) between the two accidents and benchmarks with ray-tracing void treatment, hence the biological damage that workers experienced. Prog. Nucl. Energy, 39, 243 2001).Comparisons of neutron doses against measurements 8) D. L. Hetrick, "Dynamics of Nuclear Reactors, were generally satisfactory. La, Grange Park, Illinois, USA, ANS, 1993).
In order to estimate activation levels inside the 9) N. Ishigure, et al. "Dose Reconstruction forbody as a result of neutron irradiation, we have per- Heavily Exposed Patients for the Criticality Ac-formed a number of calculations to determine 24 Na in cident in Tokai-mura, " Medical Aspects of Ra-blood and 32p in urine. These calculations are ongoing diation Emergency, Chiba, Japan 2000).and being prepared against available measurements. 10) Y. Nishimura et al., "Determination of 32p in urineWe have presented initial results in this paper. for early estimation of the neutron exposure level
for three victims of the JCO criticality accident,J. Radiol, Prot., 22, 25-29 2002).
- 813 -

This is a blank page.

JAERI-Conf 2003-019
TOPIC 9
EMERGENCY RESPONSE ANDTRAINING

This is a blank page.

JAERI-Conf 2003-019 JP0450152
Remote Disassembly of an Abnormal Multiplication System
Valerii F. BASMANOV, Sergei V. VORONTSOV, Igor V. ZIfUKOV 'Vladimir.l. IL'YTN,Mikhail 1. KUVSHINOV, Valerii T. PUNIN, Igor G. SMIRNOV, Elena.Yu. TARASOVA,
Vladimir.l. YUFEREV, Vladislav N. YANOVSKYRussian Federal Nuclear Center - All-Russian Scientific Research Institute of Experimental Physics
(RFNC-VNIIEF), Sarov, Nizhny Novgorod region, Russia
The method of abnormal multiplying systems remote disassembling is described. This methodwas worked through in actual operations as response to the nuclear accident at the RFNC-VNIIEFcriticality test facility FKBN-2M on 17 June 1997. The abnormal assembly was a sphere of 235u
(90%), surrounded by a copper reflector. The detailed information on the multiplying systemdisassembly operations could be of use to the experts at other institutions when they developemergency response plans.
1. IntroductionIt is impossible in handling of multiplication an emergency signal goes and the table with the
systems (MS) totally to eliminate the likelihood of lower MS piece on it is dropped into the downabnormal environments that involve self-sustained position.chain reaction (SCR).')
There may be cases where personnel cannotcome up close to abnormal MS because of the high 6radiation level around there or because of the 7probability of repeated SCR bursts. 1) That is why an 2important problem today is looking for the ways of 2remotely operating on the abnormal MS to reduce 3its reactivity.
There is one such method developed at RFNC- 4 CC 8VNIIEF. It allows remote disassembly of anabnormal MS made up of individual parts. Thismethod was worked through in actual operations asresponse to the nuclear accident at the RFNC-VNIIEF criticality test facility FKBN-2M on 17June 1997 1.2)
FKBN-2M is a testbench to investigate into thenuclear physics of simple critical assemblies. 1,2,I)
The facility is located in an experimental area of12xlOx8m size. Schematically, it is shown in fig.l. VA test assembly is made up by two pieces. Thelower MS piece is assembled on a table that is Fig. . Scheme of FKBN-2M testbenchmovable vertically up and down. The upper MS 1. Lower MS piece. 2 Support. 3 Pipe. 4 Tablepiece is assembled on a carriage that can be moved (lifting of lower MS piece). 5. Cart. 6 Upper MShorizontally and into the position over the lower piece. 7 Ring. 8. Lower support. 9 CarriageMS piece on the table. 'Me assembly process (moving of upper MS piece)includes consecutive stacking of the hemisphericalshells of different materials into each other, as with The accident occurred during manual assembly44 matryoshka" stacking doll. For various kinds of of a MS, which was a sphere of HEU with copperexperiments, there are sets of hemispheres using reflector. Detailed discussion of the accident isdifferent fissile (uranium, plutonium) and inert provided in reports. 1,2) The lower MS piece hadmaterials (steel, copper, polyethylene, etc.), whose been assembled on the testbench table anddimensions are standardized. happened to be above-critical (reactivity p- 1.50ef,
Closing in of the upper and lower MS pieces see table 1). After the fission burst, the MS went(by moving the carriage in and the table up) is into steady-state power condition at about 480W.operated remotely from a control room behind theshielding wall (-3m reinforced concrete). When theleakage neutron flux exceeds some specified value,
- 817 -

JAERI-Conf 2003-019
The abnormal MS (fig.2) was a sphere of 21U onto the inside of a concrete plug to close up(90%) having 167mm outer diameter 9 shells of 2 entrance into the room).hemispheres each), surrounded by a copper There was a task force of technical experts thatreflector whose outer diameter below was 258mm developed and discussed dozens of solution options(4 hemispheres) and above - 183mm (I to the problem. These options involved a variety ofhemisphere). Also, the carriage at the time of approaches to operating on the assembly remotelyaccident had been in the position over the table. (mechanical, chemical, precision explosiveAnd there was on the carriage itself a support ring technology, gas and plasma arc cutting, etc.). Thusfor positioning the upper MS piece. the most promising of them were selected to start
their laboratory scale testing immediately. Intandem with these efforts, computations were madeto simulate contribution of any operation to the
2 3 system's criticality. They also included predictionsof neutron and thermal behaviors for differentscenarios of operating on the MS.
7 The experts eventually picked out "vacuumcup" method. The operating tool in this method wasvacuum gripper ("suction cup"), and its vehiclewould be the overhead crane available in theexperimental room. To put the vacuum gripper in
10 place, a robotic device was used that had been
4 1 1 developed at the Bauman Technical University inMoscow and brought in to VNIIEF by a team of theMinistry for Emergency Management of Russia.
Thus, it was proposed to use this vacuum cup
Fig.2. Scheme of the failure assembly to remove the upper hemisphere of copper from the1. Neutron source. 2 Core (HEU) 3 Reflector MS. This would change the assembly over to(copper). 4 Support. 5. Ring. 6 MS. 7 Pipe. subcritical status at Kff--0.987 (see table 1) By
8. Lower support. 9 Table. IO. Carriage. I . Cart. moving the crane, the thin vacuum cup was put onthe top of the copper hemisphere. However, the
The total dose rate for neutrons and gammas at hemisphere was attached too tightly to the uraniumIm distance from the MS was 15000rad/hr and sphere. As a consequence, with the lifting operationabout 1 10rad/hr on the wall surface in the that was attempted the cup slipped off the vacuum
hose to remain on the MS. There was disturbance inexperimental room. reactivity then that caused about fourfold increase
Thus, what had to be done in this environment of the MS neutron flux and thermal power.was searching out a way to terminate the SCR and Examination of the video record found out adisassemble the MS into the known to be subcritical slight turning motion of the whole MS in the lowerparts. copper hemisphere. Therefore it was decided to
make another attempt to separate the MS. At that2. SCR Termination point, the next cup was better secured to the
From engineering standpoint, the goal was any vacuum line. Again, a robot was used in theway remotely to withdraw some material of the operation to mount the vacuum gripper onto theassembly or change its geometry. Moreover, the crane. In addition, the robot put up a supplementaryfollowing circumstances had to be considered: support for the MS.
-access of personnel to the facility area was This other attempt was successful with thedisallowed (due to high ionizing dose rate); vacuum gripper separating the major piece of the
-acting on the MS with the testbench's standard MS from the lower shell of copper reflector (fig.3)controls was impossible; and removed to a support urther to be mentioned
-any item approaching the abnormal assembly as support 1) provided in the facility room (fig.4).would immediately add to its reactivity (specifics of In this way, the SCR was discontinued around 120a metal MS with thin reflector); a.m. on 24 June 1997.
-reactivity change of the MS being handled However, the neutron multiplication factormust be predicted and controlled. (Kff) remained near I (see table 1), so that further
For the operations, it was only available to the MS operations were still hazardous.experts an overhead crane that could be remotelyoperated from the control room. Visualobservations could be conducted with a periscopeand a video camera (it was managed to fix the latter
- 81 -

JAERI-Conf 2003-019
-the MS reflector in its lower part is made up3. Further MS Disassembly to Safety Status by three hemispheres whose dimensions
(inner/outer diameter) are: 167/183mm,3.1 Examination of the Experimental Room 183/205mm, 205/230mm;
On 15 July 1997, video films and photos were -the MS reflector shells of (205/230)mm andmade of the abnormal MS, and radiological survey (183/205)mm dimensions have pole plugs ofwas performed for the experimental area. 070mm dropped out (they have been separatedMaximum gamma dose rate at about 2m distance together with the lower copper hemispherefrom the MS (limit of no-access zone in terms of (230/258) and stayed on the testbench;nuclear safety) was 35mR/hr. The analysis showed I -an aluminum part of the vacuum cup remainsthere were no radioactive aerosols in the air. on the MS;Radioactive contamination of the room was not -the MS has steel support ring on w ic wasobserved either. put on the MS at removing it from the testbench);
The MS had effective neutron multiplicationfactor estimated to be Kff-0.995 (see table 1) in4
apply ��,k other words the MS was near critical. In order to
ensure safe operations, it had to be handled as acritical system (see table 1).
The following considerations are essential fordeveloping subsequent operation steps:
-the MS disassembly operations must beperfortned remotely (no people present in theexperimental room);
-preoperational procedures may be carried outin the room at a safe distance from the MS;
-reliable monitoring of the MS status must beprovided (after the MS was removed to the support,no reliable monitoring was any longer possibleusing the FKBN-2M standard detecting systems).
Fig. 3 The instant of SCR termination (the main For the purpose of continuing operationsMS piece moving off the lower shell of copper around the MS, two "all-wave" detectors werereflector). placed about 2.5m off this, their axes directed at the
MS center. The detectors were precalibrated Anadditional TV camera was also provided in theexperimental room that allowed total coverage ofthe performed operations. For primary operatingtool, it was decided to use an overhead- crane, andvacuum cup approach remained the primary method.
Support I was set up on corrugated steel sheetsthat covered the cable duct. Before starting theoperations, protection was made around the MS inthe manner of metal barriers, to prevent the MSrolling out to the solid concrete floor if itunexpectedly fell down.
3.2 Taking aluminum part of the vacuum cup offthe MS
Fig.4. View of the abnormal MS after removal from This part was removed remotely using a ftameFKBN-2M testbench. suspended from the crane hook. Thus, the crane
moving, the frame impacted the cup's aluminumThe following observations were made from part and caused it to fall off the MS (fig.5).
inspection of the MS and components around the
testbench (fig.4): of 235 3.3 Removing Steel Ring from the MS-the abnormal MS is a sphere U 90%) For removing steel ring from the MS, an
having outer diameter of 167mm, surrounded by a additional support was provided near support Ireflector of copper whose outer diameter below is (further mentioned as support 2 Support 2 had a230mm 3 hemispheres) and above - 83mm (I structure mounted on it of the dimensions not to lethemisphere); the steel ring slip through. With the vacuum cup,
the MS was remotely carried from support I over to
- 819 -

JAERI-Conf 2003-019
support 2 with the steel ring remaining on the into a specific recovery unit, while the hemispherestructure (fig.5). Afterwards, the steel ring was itself was no longer held by the vacuum cup (thegripped by the vacuum cup withdrawing from the hemisphere had a hole of -070mm at te pole) andMS and moved away. fell onto the recovery unit atop. Ten, the copper
hemisphere 183/205 was withdrawn and the MSwas moved over to support I (fig.8).
The above-described operations were allperformed remotely without people present in theroom, and as they proceeded the operations werechecked using a TV camera available in theexperimental area.
3.5 Separating the MS into Two Halves
Fig.5. View of the MS after the steel support ringand copper reflector 205/230mm were withdrawn(MS is on support 2 with a mount fixed onto it,copper hemisphere 205/230mm remains on support1, and on the floor is aluminum cup knocked downfrom the MS).
Support 2 in the same way as support I wasplaced on the steel sheets covering the cable duct.Support 2 was secured onto a pallet that prevented
the MS rolling out to the solid concrete floor if it Fig.6. Turning the MS over with a specificfell down unexpectedly. arrangement (vacuum gripper keeping the MS on
3.4 Removing Lower Copper Hemispheres from the the turning platform. The platform is moved byhooked frame from the overhead crane.
MSThe hemisphere 205/230mm got separated
from the main MS by the steel ring removaloperation. When the vacuum cup was lifting theMS to carry it over to support 2 the outer copperhemisphere would come off to remain on support I(fig.5). This hemisphere was remotely taken awayfrom the support using a suitable attachment thecrane was provided with.
For separating the hemisphere 183/205, it wasintended to turn the MS by 180' and try to make thecentral part (uranium+ single copper reflector) fallout either using a dropping weight or dropping theMS itself from a small height on to the support.Thus, a suitable device was designed and fabricated,which was fixed on support 2 Using a vacuum cup,the MS was placed on turning platform of this Fig.7. Separating the MS central part from thedevice, and operation began to tam it over remotely. turning platform.The movement was performed by a frame verticallysuspended from the crane hook and hitched on Operations for separating the MS into twohooks of the turning platform (fig.6). The MS was halves were performed by a crew of personnel inprevented from premature drop using a vacuum cup the experimental room. This was accomplished onat the bottom of the turning platform. The system I I August 1997 using a specific expanding device -having turned by over 90', the MS central part "tongs" (fig.9). The device was suspended from the(uranium+ single copper reflector) went separate crane hook. Its jaws were put into side port of thefrom the outer copper hemisphere (fig.7) and down copper reflector before they were pulled apart with
- 820 -

JAERI-Conf 2003-019
an expanding screw, thereby making the MS gamma level has decreased substantially, i.e. by anseparate in the equatorial plane. The separating order, due to decay of the fission products.device was removed and then a vacuum cup wasused to lift the upper MS piece (fig. IO) and put itinto plastic bag and onto the pallet of support 2.The remaining MS piece on support I was alsocovered by plastic.
Fig. IO. Separating one MS half from the other withvacuum cup.
Fig.8. The MS on support I after removal of copperhemisphere 183/205min from it.
Fig. I 1. Outside view of the MS parts with damageof protective coating (a neutron source is in thecentral hollow).
Fig.9. Separating the MS into two parts us aspecial device ("tongs"). 4. Review of the Efforts
The primary objective of the accident response
Upon separation of the MS, a neutron source operations was to disassemble the MS intowas found out inside it (in the central hollow) individual components and units that would pose no(fig.11). Visual inspection was done to see no threat in terms of potential SCR. The operationsdamage of the source structure. The abnormal continued from 17 June through I I November 1997.fission burst and long-term power operation have The operations were of long duration becauseresulted in damage of the copper-nickel coating of disassembly of the multiplication system wasthe parts (fig. II), as well as considerable gamma conducted remotely with tailored tooling. For eachradiation due to fission fragments (-5R/hr closely operation step, a procedure was developed togetherto the equatorial plane). with the work specifications detailing each3.6 Packaging the MS Pieces. operation used. These operations were supported by
On I I November 1997, operations on the computation of the MS properties, which were toabnormal MS at FKBN-2M test facility were justify safe performance of the operations. The MScompleted. The abnormal MS parts were packaged parameters (Kff and reactivity) are given in table .using nuclear safety containers with additional From table 1, the abnormal MS has Kff� 095gamma shielding. The containers were placed into until it is separated into two hemispheres, This isstorage, where their holding was required until much in excess over the limit, KffmAx= 0.85 as
established for the manual operations on metal MS
- 821 -

JAERI-Conf 2003-019
out of a specialized testbench. Moreover, if a hydric MS could not be approached at nearer than 2m.reflector happened to surround the abnormal MS That is just why the expanding device ("tongs")(such as with a man falling down on the assembly), was suspended from a crane hook (fig.9), whichthis would change it into above-critical state. It is helped the personnel keep at the required distance.just for this reason every disassembly operation was Based on computations, the abnormal assemblyremote, with the personnel being in control room pieces (hemispheres) have effective neutronbehind the shielding. multiplication of Kfr= 072. Surrounding such
The management authorized a team of experts hemisphere by infinite water reflector makes thisto be present in the experimental area but during effective neutron multiplication equal to Keff� 0904.performance of the final operation - separating the This allows for personnel to ftirther operate on theMS into two pieces hemispheres). Yet, safety MS components directly without remotelydistance requirement was strictly observed, that the controlled tools.
Table - characterization of the abnormal MS
MS components Keff p, Peff Note Presence of 20cmthick water reflector
I MS at FKBN -2M (U-235 1.01070 -+1,51 Accident on 17 June 1997 K�ff p, Peff28/167 (sphere) +copper167/183 (upper) and 167/258(lower)
2 MS as I without upper 0.98668 -+1.93 SCR shutdown attempt 21copper hemisphere June 1997 (if successful)
3 MS on support I (U-235 0.99540 -466 SCR terminated28/167 (sphere) copper 24. June 1997167/183 (upper) and 167/230(lower) without pole plugs aluminum cup steel ring)
4 MS as 3 without aluminum 0.99381 -489 Cup removalcup 1
5 MS as 4 without steel ring 0.99103 -- l.29 Steel ring removal 1.0730 +9.726 MS: U-235 28/167 (sphere) 0.97379 -3.85 Removal of copper 1.0796 +10.54
copper 167/183 (upper) and hemisphere (205/230mm) -167/205 (lower) without pole 24.July 1997
I plug 17 MS: U-235 28/167 (sphere) 095183 -- 7.23 Removal of copper 1.0941 +12.29
copper 167/183 (upper) and hemisphere (I 83/205mm) -167/183 (lower) 3 I.July 1997
8 Hemisphere of uranium 0.71788 -56.1 Separation of MS into two 0.904 -15.1728/167 copper 167/183 parts - I I ugust 1997
5. Conclusion ReferencesThe paper has described a procedure for remote
disassembly of abnormal multiplication system. The 1. T.P. McLaughlin, S.P. Monahan, N.L. Pruvost,method was worked through in actual operations V.V. Frolov, B.G. Ryazanov, V.I. Sviridov "Aduring response to the nuclear accident at the RFNC- Review of Criticality Accidents. 2000VNIIEF criticality testbench FKBN-2M of 17 June Revision," LA-13638 2000).1997. 2. A.M. Voinov, S.V. Vorontsov, V.T. Punin, I.G.
The 1999 accident in Tokai-mural) demonstrated Smirnov. "Criticality accidents at VNIIEF,"again the potential hazards of fissile material Proc. Int. Conf. on Nuclear Criticality Safety,operations. Therefore, the detailed information on MS ICNC'99. Sept.20-24, 1999. Versafilles, France.disassembly operations described in this paper could 11, 874 1999).be of use to the experts at other institutions when they 3. M.I.Kuvshinov, A.M.Voinov and V.G.Zagrafov.develop emergency response plans. "The History of Works on Nuclear Criticality
Safety in RENC-VNIIEF", Proc. Int. Conf. onNuclear Criticality Safety, ICNC'95. Sept.] 7-22,1995. Albuquerque, New Mexico, US. P12(1995)
- 822 -
JAERI-Conf 2003-019 JP0450153
The Organisation of Criticality Hazard Prevention at the CEA
Dominique Mijuin% H&ne Carros and Bernard SevestreCommissariat & VEnergie Atomique
Direction de la Sfiretj Nucliaire et de la Qualitg, Mission de Sfiretj Nucleaire, CEAlSaclay,91191 Gif-sur-Yvette Cedex, France
This paper deals with the organisation of criticality hazard prevention at the FrenchAtomic Energy Commission (CEA)
1. Introduction organised partly on a local "center" basis, and partlyon a global CEA basis.
In the middle of 1999, the French Atomic Energy As far as the field of criticality hazard prevention isCommission (CEA) had decided to review its own concerned, the operational lines are fitted withOrganisation in regards of criticality hazard prevention. criticality experts, so that This review leaded, in 2000, to the definition of an carry out the safety assessments and define theimproved Organisation [11 whose running and criticality calculations needed for statements ofprinciples are described in the following paragraphs. criticality-safety when new installations are set up
or existing installations are modified create clear2. Organisation of criticality hazard prevention and comprehensible operator orders and procedures
derived from the above, ensuring that theThe guide line for this improved organization was requirements regarding criticality-safety have been
to apply in the field of criticality hazard preventions appropriately translated,the same principles that were already in place for ensure that the installations are being operated inother aspects of safety the responsibilities are based line with the orders and procedures regardingaround the operational line, the control line and the criticality hazard prevention and check that changessupports resources. in the installations and in their operating procedures
The operational line is in charge of designing, do not jeopardize their safety with respect tooperating and dismantling the nuclear research criticality hazard,
facilities this includes the managing of many safety re-examine, on a regular basis, the safetyrelated activities, and the technical checking of these assessments and check that the hypotheses,activities.
The control line is in charge of reviewing the incorporated in the criticality-safety cases, areprocedures and practices of the operational line, to appropriated taking account of experience feedbackensure that all activities and technical checking are when applicable, including analyzing incidents andperformed in accordance with the safety and quality every evolution of the research area in theprocedures this includes statistical checking of the laboratory,results of these activities. organize and supervise the training of operators and
The support resources offer high level expertise to their supervisors with regard to criticality hazardboth lines, following the additional rule that an expert prevention.who has contributed to the study or activity presentlycontrolled can not be consulted 2.2 Control function
The control function involves checking the respect,2.1 Operational line the adequacy and efficiency of the measures taken by
Each stage of the operational line, by authority operational line managers and experts and theirfrom the stage above, is responsible for the nuclear technical checks, in the light of nuclear safetysafety of the activities, installations and materials objectives. These operations are carried out by aunder its supervision. Each executive organises Safety Structure, named the "safety team",technical measures and control of these activities- independent of the operational line, reporting to eachThese actions are reported to the CEA Center Director, CEA Center Director.following the official channel. The operational and The safety team includes one individual withcontrol lines meet only at two levels in the CEA criticality expertise. For criticality hazard prevention,Organisation the CEA Center Director and the CEA the expert in the Center Safety Structures has theGeneral Administrator. The support resources are following responsibilities
Corresponding author, Tel. 33 69 08 79 03, Fax. 33 69 08 79 13, E-mail: rnijuin�aquilon.cea.fr
- 823 -

JAERT-Conf 2003-019
• checking that the installations are being operated in Organisation in order to list all the skills required andline with the regulatory authorizations, with orders set up adapted training courses and nominationand with procedures, by inspecting safety procedures.documents, visiting installations, carrying outtechnical and quality audits, This "profession study" is now completed, and the
• implementing lessons learrit from significant events results are synthesised in a profession file" for eachwith regard to criticality-safety occurring in of the criticality expert occupation as described above.installations inside or outside the Center, and Each file provides advising the Center Manager in the event of any 0 a precise reference of all activities relevant to theabnormal situations arising in an installation which occupation considered,jeopardize criticality hazard prevention, 0 identification of all skills useful, necessary or
• checking before they are approved the internal essential to correctly perform these activities,procedures and the safety studies performed by the including scientific or technical skills on oneoperational lines, hand, organisational and relationship skills on
• for important items, the authorization procedure the other,includes consulting a formal multidisciplinary safety a definition of the "nomination procedure" tocommission chaired by the Center Director. choose, form and assign a criticality expert.
On the bases of these files, training courses have2.3 Support resources been designed or improved.
At the Center lever, a high level expert (the Center 4. Providing adapted tools for the CEA nuclearCriticality Expert) provides technical support as managersregards criticality hazard expertise (advice andassistance with analysis, with the definition of The CEA criticality skill tearn is providing toolscriticality-safety requirements, operating orders, to help CEA nuclear managers and local criticalitytraining, etc.) for the criticality qualified individuals experts to manage with their analyses and decisions.within operational lines. This engineer ensures that Those tools, which are partly in use and partly underknowledge of the installations is accumulated and that development, consist of criticality hazard prevention is correctly addressed 0 recommendations designed to help safetythroughout the center, by the mean of an active role in managers to discuss with criticality experts,technical checking of procedures, and of a regular 0 safety guides designed to help criticality expertssupport of the "criticality experts" of the operational in their job line. a "criticality guide files" collection summarizes
At CEA level, a criticality skill team provides the main notions and principals of criticality• methodological and analytical assistance in safety (including neutronics rudiments,
drawing up the general principles of criticality controls, interpretation of thecriticality-safety and guidance documents, to help "fundamental safety rule" edited by the safetythe operational lines with criticality-safety analysis, authority, etc),to build upon the full extent of knowledge a guide to define the hole technical processconcerning criticality and experience feedback it including criticality safety analyses, criticalityis also in charge of defining and supervising calculations, criticality safety assessment,training, criticality operational conditions,
• carrying out criticality calculations and producing a guide to correctly specify criticalitypreliminary criticality studies or, in the case of calculations,subcontracted operations, in developing conditions a guide to correctly elaborate an improveof contract and specifications, and supervising, operator procedures,selecting and assessing contractors given the task of and so on, including elaboration of a guidecarrying out criticality calculations. about criticality accidents 2],There is a strong operational connection between pedagogical tools including animation kits to
the support mechanisms at General Management level help the center criticality expert to heightenand those at Center Management level. operational managers awareness of criticality
safety and to help the criticality experts of the3. Defining the training process for criticality operational line to do the sme at the operatorsprofessionals level,
computer tools includingAt the same time, the CEA is involved in a study of - a database allowing a fast and reliable link to
the different professions defiried by the new all activity data concerning control of
- 824 -

JAERI-Conf 2003-019
criticality hazards, named CALICE 3],- calculation tools (most of which developed by
the CEA or the IRSN),- an intranet CEA web site, dedicated to safety
and including a criticality chapter givingaccess to all above cited tools.
5. Criticality qualified individuals networkThe performance of safety organization is partly
dependent on the efficiency and vitality of safetynetworks.
As concerns criticality experts, these networks areorganized at two levels • at CEA level, one person in the "criticality skill
team" is in charge of organizing periodicmeetings of all CEA "center criticality experts"and a few non CEA experts. This meeting is usedto organize peer exchanges about criticalitysafety experience (incidents, good practices and
- so on), to promote top down and bottom upinformation, and to discuss the objectives andthe projects of the above quoted tools, etc.,
• at each CEA center level, the "center criticalityexpert" is in charge of organizing the same typeof meetings between the criticality experts of theoperational line.
6. ConclusionsThis new organization has been experimented since
the end of year 2000. During the first semester of year2002, the CEA nuclear inspection team, who is incharge of the control function at the CEA generaladministration level, has performed an inquiry tocheck the effectiveness of the new organization. Theconclusions of this inquiry are very positive a fewrecommendations are now taken in to account toftirther improve the efficiency of this organization.
AcknowledgementsThe authors wish to thank M. Michel Laverie
("Directeur de la sOretd nucidaire et de la qualitd") forthe rigor and clearness of the organization principalsthat he posed as guidelines for improvement of thecriticality organization as described above.
ReferencesI Internal CEA documentation (some of which
available through the authors).2) Francis Barbry, P. Fouillaud, L. Reverdy and D.
Mijuin "Criticality Accident Studies andMethodology Implemented at the CEA," Proc.Int. Conf. on Nuclear Criticality Safety, ICNC'03,Tokai-Mura, Japan, Oct. 20-24, 2003
3) E. Guillou, H. Toubon, D. Mijuin, L. Aguiar E.Gagnier, "CALICE a data base software forsearching criticality parameters" Proc. Int. Conf.on Nuclear Criticality Safety, ICNC'03,Tokai-Mura, Japan, Oct. 20-24, 2003
- 825 -

JAERI - Conf 2003 - 019 JP0450154
The Protection of On-site Personnel in the Event of a Radiological Accident
Mrs M Morrey, National Radiological Protection Board, Chilton, Oxon, UK, OX I I OQR
Dr D N Simister, Health and Safety Executive, St Peter's House, Balliol Road, Bootle, Merseyside, UK,L20 3LZ.
workers involved in taking mitigating actionsto reduce the exposures of others, both on and
ABSTRACT off-site [Ref I]. However, advice has not yetbeen provided on the protection of those on-
The National Radiological Protection Board site personnel who are not involved in(NPRB) is responsible in the UK for advising mitigating actions (who would be likely toGovernment and other responsible bodies on comprise the majority of those on-site). Suchthe principles for responding to radiological people could include direct employees of theemergencies. NRPB has published appropriate site operator, contractors and/or visitors to the
advice on the off-site protection of the public site.and on the protection of workers involved intaking mitigating actions to reduce the A: PROTECTION PRINCIPLESexposure of others.
Dose-Response RelationshipThis paper puts forward a suggested
framework for the protection of on-site There are two key exposure bands relevant topersonnel in the event of a radiological emergency response plans, namely thoseemergency which might include a criticality where the doses and dose rates are sufficientlyaccident. This famework both dovetails with high to lead directly to serious deterministicexisting planning for the protection of injuries, and those (lower) doses and dose ratesmembers of the public off-site, and also takes where serious deterministic harin will notaccount of specific differences between the result, but the individual will have an increasedsituations on and off-site. risk of developing some health problems, in
particular of developing cancer (stochasticINTRODUCTION health effects).
The Health and Safety Executive (HSE), the For exposure in the lower band, it is generallyUK regulatory agency for controlling risks assumed that the size of the increase infrom work activities, has asked NRPB to (stochastic) radiation risk is directlydevelop principles and guidance for the proportional to the size of the dose, and thatprotection of on-site personnel in the event of a there is no threshold dose below which there isradiation accident. The purpose of these no risk [Ref 2]. This means that for wholeprinciples is to bring all emergency planning body doses below about I Sv delivered duringwithin a common framework and to enable the first few days following an accident it islicensees employers and others to plan to a not possible to identify a safe/unsafe boundarycommon standard. This paper describes a of dose on which to base decisions onsuggested framework, which both dovetails countermeasures. It is recommended thatwith existing planning for the protection of decisions on protective measures for reducingother groups, and also takes account of specific these exposures should be based on andifferences between the situations on and off- evaluation of the relative levels of benefits andsite. harms expected to result from different courses
of action. [Ref I]
The National Radiological Protection Board(NRPB) is responsible for advising UK Emergency Planning Thresholds for SeriousGovernment and other responsible bodies on Deterministic Injuriesthe principles for responding to nuclear orradiological emergencies involving ionising Unlike stochastic effects, serious deterministicradiation. Such situations could include the injuries may be prevented entirely byconsequences of a criticality accident. In 1990, preventing doses from exceeding the relevantNRPB published specific principles for the thresholds for these injuries. In order toprotection of the public, off-site, and also develop plans that address the prevention ofbroad recommendations for the protection of such exposures, it is necessary to detennine
- 826 -
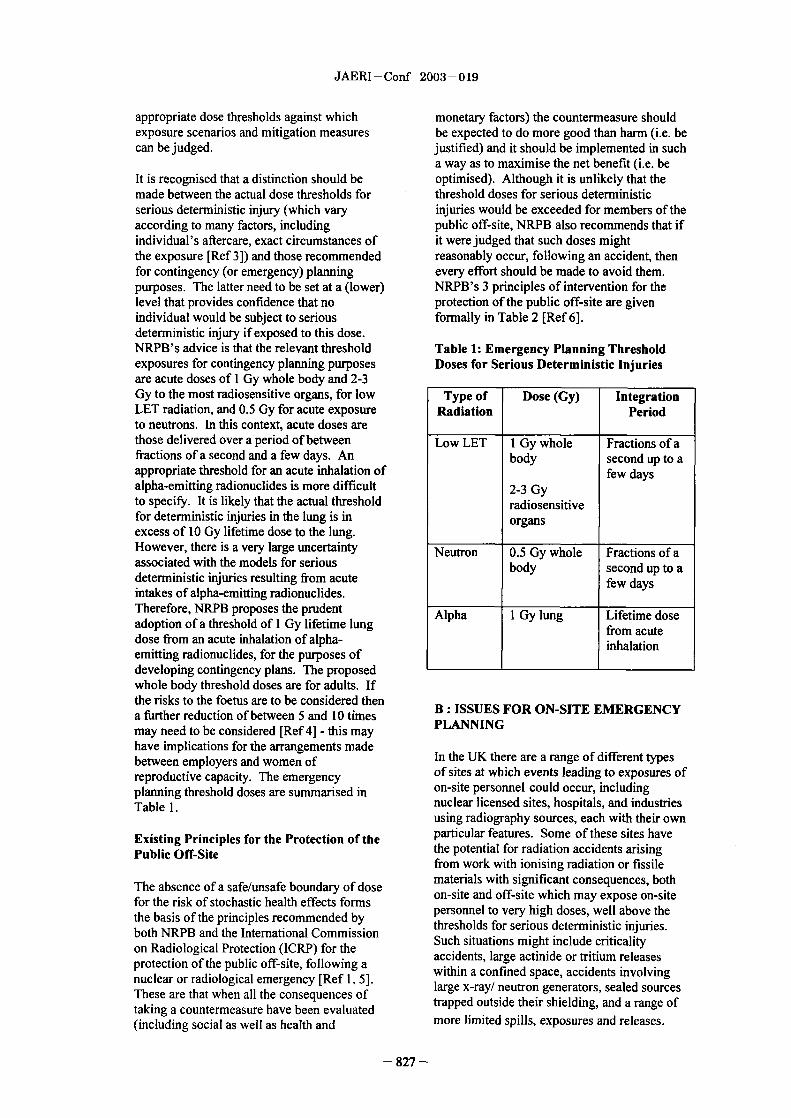
JAERI-Conf 2003-019
appropriate dose thresholds against which monetary factors) the countenneasure shouldexposure scenarios and mitigation measures be expected to do more good than harm (i.e. becan be judged. justified) and it should be implemented in such
a way as to maximise the net benefit (i.e. beIt is recognised that a distinction should be optimised). Although it is unlikely that themade between the actual dose thresholds for threshold doses for serious deterministicserious deterministic injury (which vary injuries would be exceeded for members of theaccording to many factors, including public off-site, NRPB also recommends that ifindividual's aftercare, exact circumstances of it were judged that such doses mightthe exposure [Ref 3) and those recommended reasonably occur, following an accident, thenfor contingency (or emergency) planning every effort should be made to avoid them.purposes. The latter need to be set at a (lower) NRPB's 3 principles of intervention for thelevel that provides confidence that no protection of the public off-site are givenindividual would be subject to serious formally in Table 2 Ref 6].deterministic injury if exposed to this dose.NRPB's advice is that the relevant threshold Table 1 Emergency Planning Thresholdexposures for contingency planning purposes Doses for Serious Deterministic Injuriesare acute doses of I Gy whole body and 23Gy to the most radiosensitive organs, for low Type of Dose (Gy) IntegrationLET radiation, and 0.5 Gy for acute exposure Radiation Periodto neutrons. In this context, acute doses are
those delivered over a period of between Low LET I Gy whole Fractions of afractions of a second and a few days. An body second up to aappropriate threshold for an acute inhalation of few daysalpha-emitting radionuclides is more difficult 2-3 Gyto specify. It is likely that the actual threshold radiosensitivefor deterministic injuries in the lung is in organsexcess of 10 Gy lifetime dose to the lung.
However, there is a very large uncertainty Neutron 0.5 Gy whole Fractions of aassociated with the models for serious body second up to adeterministic injuries resulting from acute few daysintakes of alpha-emitting radionuclides.
Therefore, NRPB proposes the prudent Alpha I Gy lung Lifetime doseadoption of a threshold of I Gy lifetime lung from acutedose from an acute inhalation of alpha- inhalationemitting radionuclides, for the purposes ofdeveloping contingency plans. The proposedwhole body threshold doses are for adults. If
the risks to the foetus are to be considered then B: ISSUES FOR ON-SITE EMERGENCYa further reduction of between and IO times PLANNINGmay need to be considered [Ref 4 - this may
have iplications for the arrangements made In the UK there are a range of different typesbetween employers and women of of sites at which events leading to exposures ofreproductive capacity. he emergency on-site personnel could occur, includingplanning threshold doses are summwised in nuclear licensed sites, hospitals, and industriesTable .
using radiography sources, each with their own
Existing Principles for the Protection of the particular features. Some of these sites havePublic Off-Site the potential for radiation accidents arising
from work with ionising radiation or fissile
The absence of a safe/unsafe boundary of dose materials with significant consequences, bothfor the risk of stochastic health effects forms on-site and off-site which may expose on-sitethe basis of the principles recommended by personnel to very high doses, well above theboth NRPB and the International Commission thresholds for serious deterministic injuries.on Radiological Protection (ICRP) for the Such situations might include criticalityprotection of the public off-site, following a accidents, large actinide or tritium releasesnuclear or radiological emergency [Ref 1, 51. within a confined space, accidents involvingThese are that when all the consequences of large x-ray/ neutron generators, sealed sourcestaking a countermeasure have been evaluated trapped outside their shielding, and a range of(including social as well as health and more limited spills, exposures and releases.
- 827 -

JAERI-Conf 2003-019
Table 2 NRPB Existing Principles for considered and can only be eliminated fi-omIntervention for the Protection of the Public consideration on the basis of a specific caseOff-Site demonstrating that the measure is not justified
on grounds of reasonable practicability.
Justification Countermeasures should beintroduced if they are One clear basis for a measure not beingexpected to achieve more justified would be where the severe risk ofgood than harm. injury to those implementing the measure
(whether 'on the day' or in advance) was evenOptimisation The quantitative criteria used greater than that being protected against. A
for the introduction and second reason could be that implementing thewithdrawal of protective measure caused serious disruptioncountermeasures should be to the routine operation of the business (e.g.such that the protection of the carrying out frequent, routine operations inpublic is optimised. fully airtight protective clothing might well be
considered impracticably disruptive). AAvoidance of Serious deterministic injuries further reason that might be put forward is theserious should be avoided by very low likelihood of a radiation accidentdeterministic introducing countermeasures occurring. However, it is important to noteinjuries to keep doses to individuals that, in general, the probability of a radiation
below the thresholds for these accident occurring is more relevant to theinjuries. decision on whether or not to develop a
contingency plan for that event than todecisions on the justification of measures toavoid serious deterministic injuries.
Principles for the protection of on-sitepersonnel It is recognised that the balance of benefits and
harms required for justification of a measure
NRPB recommends that the principles may be substantially different between an 'atdeveloped for the protection of the public off- time' measure and a prior measure requiringsite are adopted for the protection of on-site substantial investment before the radiationpersonnel. There are obvious advantages in accident. The implementation of an 'at-time'the adoption of a common set of principles for dose mitigation measure results in most of thethe protection of individuals both off-site and benefits and the harms being realised at theon-site, and the reasoning underpinning their same time, i.e. after the event has occurred. Indevelopment for the off-site situation applies considering the justification and reasonableequally to the on-site situation. practicability of such measures, therefore, the
likelihood of the radiation accident occurring
A ma .or difference between the potential is not an important factor. For measures that9 require substantial prior investment, most of
consequences of radiation accidents on-site the costs will be borne in advance of aand off-site is the much increased potential for radiation accident happening, whilst most ofserious deterministic injury to result on-site the expected benefits would not be realisedfrom such events. In order to develop a unless the event actually occurred. For priorframework for planning for the protection of measures that involve very significant 'upon-site personnel in the event of a nuclear or front' cost it may sometimes be appropriate toradiological emergency, it is therefore helpful take some account of the likelihood of theto explore the application of NRPB's third event occurring when considering whether orprinciple in more depth. not the measure is justified. In situations
The Avoidance of Serious Deterministic where much of the cost of implementing theInjuries measure is only incurred at the time of the
radiation accident, then the presumption of
Whilst NRPB's third principle implies a justification is stronger than in situationsgeneral presumption in favour of any measure where most of the cost is borne in advance ofthat has the potential to reduce exposure to any such event occurring.
levels where serious deterministic injuries will As well, ALARP demands that account benot occur, it is clear that there must be taken of good practice as applied to arestrictions on this 'general presumption'. The particular situation and hence a deterministicoperation of the third principle is therefore to standard may require certain precautions.require that all options are explicitly
828 -

JAERI-Conf 2003-019
Additionally, consideration of the societal whose potential exposure would result solelyimpact of a criticality accident may lead to in an increased stochastic risk. This would bemore rigorous design safeguards. done by balancing the expected benefits and
harms to exposed groups, with considerationAnnual Dose Limits of both individual and collective consequences.
It would be expected that greater resource
The annual dose limits recommended by ICRP would be expended on measures to mitigate[Ref 7 and endorsed by NRPB [Ref 8] were the exposures of those potentially exposed atdeveloped on the basis of continuing exposure higher levels (i.e. who would be at higherover a lifetime (or working lifetime). They do stochastic risk). Any planning of exposurenot consider the balance of harm and benefits mitigation measures for those not expected toresulting from a one-off exposure resulting receive serious deterministic injuries should befrom a radiation accident. All employers are reviewed to ensure that it did not reduce therequired to comply with specified statutory effectiveness of the measures planned to avoiddose limits in the event of an accident. The serious deterministic injuries. Although theadvice based upon the numerical values given optimum strategy for mitigating exposures thatin Table I is intended to assist employers with would result only in an increase of stochasticthe preparation and implementation of risk would almost certainly include somecontingency plans. expenditure of resource on prior support
measures, it is likely that most resource
FRAMEWORK FOR THE PROTECTION expenditure would not occur unless a radiationOF ON-SITE PERSONNEL accident occurred. Table 3 summarises this
framework in the context of the range of
NRPB's principles for protection, taken measures likely to be justified for differenttogether with the discussion about their expected levels of risk.
application, suggests that contingencyplanning for the protection of on-site personnel Conclusionshould be undertaken as a 2-stage process:planning measures to protect those whose A framework for the protection of on-sitepotential exposure in the event of an personnel following a radiation accident hasunplanned release of radioactivity might result been prepared which compliments the existingin serious deterministic injury; and, panning principles established for off-site emergencies.measures to protect those whose potential These principles are likely to assist licensees,exposure would solely result in increased employers and others in developing emergencystochastic risk. Priority should be afforded to arrangements on-site.the development of those aspects of the planthat aim to protect individuals from serious The views expressed in this paper are those ofdeterministic injury. This requires: first, the authors and not necessarily the Health andidentification of those individuals at risk of Safety Executive or the National Radiologicalsuch injury; second, identification of the range Protection Board.of measures which have the potential to reduceexposures below NRPB's emergency planning Referencesthresholds (Table 2; third, determination ifthere is a case for demonstrating that some of 1. NRPB. Principles for the Protection of thethe planning measures are not justified; and Public and Workers in the Event of Accidentalfourth, development of the response strategy to Releases of Radioactive Materials into thebe implemented. This strategy will almost Environment and other Radiologicalcertainly comprise both prior support measures Emergencies. Doc NRPB 14) 1990 (Chilton).and 'at-time' measures, with the 'at-time'measures comprising reactive actions by the 2. NRPB. Risk of radiation-induced cancer atindividuals themselves and measures taken on low doses and low dose rates for radiationtheir behalf by others. The focus of this protection purposes. Doc NRPB 6(l) 1995planning is to reduce individual doses to levels (Chilton).below the thresholds for serious deterministicinjuries. 3. NRPB. Risk from deterministic effects of
ionising radiation. Doc NRPB 73) 1996The second phase, to be initiated after planning (Chilton).the response strategy for those at risk ofserious deterministic injury, is planning formeasures to mitigate the exposures of those
_ 829 -

JAtRI - Conf 2003 - 019
4. NRPB. Diagnostic medical exposures: Table 3 Framework for identifyingexposure to ionising radiation of pregnant Justified Measures for the Protection of On-women. Doe NRPB 44) 1993 Chilton). Site Personnel
5. ICRP. Principles for intervention for Justified Measuresprotection of the public in a radiological
emergency. ICRP Publication 63. 22(4) 1991 Consequence Planned Planned(Pergamon Press). that planned responses responses for
6. NRPB. Intervention for recovery after response is requiring which most ofaccidents. Doc NRPB 8(l) 1997 (Chilton). protecting substantial the cost is
against investment borne after a
7. ICRP. 1990 Recommendations of the ICRP. prior to a radiationICRP Publication 60, Annals of the ICRP radiation accident21(1-3) 1991 (Pergamon Press). accident occurs
occurring
8. NRPB. Board statement on the 1990 Serious Most measures All measuresrecommendations of ICRP. Doc NRPB 4(l) deterministic1993 (Chilton). injury (prior costs
andprobability ofaccidentoccurring mayexcludemeasures)
Exposure Some Mostresulting in measures measureshigh individualrisk of (prior costs (protection ofstochastic and those at risk ofhealth effects probability of serious
accident deterministicoccurring are injury remainsimportant first priority)factors injustification)
Exposure Measures Someresulting in unlikely to be measuresmoderate/low j ustifiedindividual risk (protection ofof stochastic higher riskhealth effects groupsis
priority;averagingharms/benefits acrosspopulation
groupsappropriate)
830 -

JAERI - Conf 2003 - 019 JP0450155
Process Criticality Accident Likelihoods, Magnitudes andEmergency Planning - A Focus on Solution Accidents
Thomas P. McLaughlinLos Alamos National Laboratory, Los Alamos, NM 87544, USA
tpm�lanl.gov or tpm�pobox.com
ABSTRACT
This paper presents analyses and applications of data from reactor and critical experimentresearch on the dynamics of nuclear excursions in solution media. Available criticalityaccident information is also discussed and shown to provide strong evidence of theoverwhelming likelihood of accidents in liquid media over other forms and to support themeasured data. These analyses are shown to provide valuable insights into key parametersimportant to understanding solution excursion dynamics in general and in evaluatingpractical upper bounds on criticality accident magnitudes. This understanding and theseupper bounds are directly applicable to the evaluation of the consequences of postulatedcriticality accidents. These bounds are also essential in order to comply with national andinternational consensus standards and regulatory requirements for emergency planning.
1. Introduction the realistic bounds on the magnitudes and timedurations, i.e., power histories, of potential
Evaluation of criticality accident risks in criticality accidents.the processing of significant quantities of fissile Past experimental series, KEWB andmaterials is both complex and subjective. It can only CRAC,3,4) and ongoing excursion studies, SILENE,be properly accomplished by criticality specialists TRACY, and SHEBA' 6,7) provide a wealth ofworking closely with operations staff to thoroughly information directly applicable to estimatingunderstand and then evaluate both the normal and accident power histories (i.e., source terms) andthe spectrum of credible off-normal or upset consequences from site-specific liquid processconditions. With the recent publishing of previously operations. The data cover broad ranges of keyunreported process criticality accidents,') evidence is parameters such as solution volume, reactivitybecoming overwhelming that process criticality insertion rate, and solution concentration. Togetheraccidents are much more likely in solutions and these data also provide insights into physicalother liquid media (such as slurries) than in any dry phenomena that bound the practical upper limits offorms. the specific fission yield in the first spike.
A previously reported article on the general Emergency planning considerations maytheme of this paper discussed a broad range of fissile also be founded on these data, as required ormaterials and media. 2) This prior article argued that recommended by both national and internationalcriticality accidents in process operations with non- consensus standards. 8,9,10,11,12) Estimation of a lowersolution media were relatively easily preventable limit of the expected first spike yield is essential toand that monies would generally be better spent in the judicious placement of criticality alarmaccident prevention rather than on criticality dosimetry as part of a CAS. In this regard, several ofaccident alarms (CAS) and on emergency plans and the Russian process criticality accidents did notprocedures. The recently released accident reach prompt critical and had very slow timeinformation supports this contention. Thus this paper responses and thus very low peak fission rates. Infocuses on solution media, providing greater depth spite of these characteristics, CAS detector headsof coverage in this regime than the previous article. were activated at large distances with typical
Much excursion data from past and on- threshold settings.1)going reactor and critical experiment research with Conversely, an estimation of the uppersolution media is available, and still being reported. bound on the magnitude of possible continuingThis information is valuable for the criticality safety fission generation is valuable for selectingspecialist, safety analysts, facility management, and evacuation routes and initial muster locations as wellregulatory personnel as they attempt to understand as for estimating possible doses to the public and
- 831-

JAERI-Conf 2003-019
environment from airborne radioactivity. This latter 3. Magnitudes of Solution Criticality Accidentsexcursion characteristic may be directly estimatedbased on the available data from these experimental It has been common in the US to resort toseries. regulatory handbooks and guides for obtaining the
magnitudes of postulated process criticality2. Likelihoods of Solution Criticality Accidents accidents for emergency planning purposes. 14,15) The
fission yields in these reports largely stemmed fromRisk is a combination of likelihood and the original work of Woodcock and are discussed in
consequence, with the former being much more some detail in Reference 2.difficult to estimate and bound than the latter for An exception in both of these twosolution media, as will be shown. It is noted that of regulatory documents is a description of a solutionthe 22 reported process criticality accidents, 21 were accident power history involving an initial spike ofin solution environments. References and 2 1.0x10'8 fissions followed by 47 bursts Of 1XI017
provide discussions and insights as to the reasons for at 10-minute intervals for a total fission yield ofthis disparity. A historical took at the time evolution 1.0x10¹⁹. This accident sequence was described inof these accidents shows that there was roughly one early Nuclear Regulatory Commission Guides (thataccident per year, for several years, in each of the are no longer officially endorsed by the NRC), buttwo countries with very large-scale fissile material appears to not have a reported technical basis. 16,17)
production and handling operations. This accident Indeed, this scenario is inconsistent with all reportedfrequency began in the 1950s and lasted about a accidents and all data from the reported excursiondecade. studies discussed and referenced herein. However,
At his time, the mid-1960s, the accident this anomalous power history is still recommendedfrequency dropped precipitously to about one in the regulatory handbook and guide.accident per decade or less and has remained there A recent US National Consensus Standard,or possibly decreased even further. This drop is ANSI/ANS-8.23, speaks to the issue of accidentattributed to the recognition that large capacity, i.e., magnitudes and provides guidance for emergencyunfavorable geometry, process vessels should be plans and procedures.10) In particular it states:avoided in areas where significant quantities of richfissile materials in liquid form are processed. Further 4.2 "Technical Staff Responsibilitiesrefining the current accident rate is impossible dueto the lack of data. Clearly these meager accident 4.2.1 Planning. The technical staff shall:statistics only highlight the obvious - criticality (1) Identify potential criticality accidentaccident likelihoods with fissile solutions have been locations.reduced to an extremely low level and ones (2) Evaluate and characterize potentialinvolving non-solution forms such as dry powders criticality accidents, with this work toand metals are even much less likely. include prediction of radiological dose.
Probabilistic methods have been recognizedas a possible avenue to estimate accident likelihoods. Following these two requirements, an estimate of aThey have recognized drawbacks, notably in reasonable upper limit of the excursion power"hands-on" and one-of-a-kind operations where history must be determined. This determination isfailure rate data are very uncertain. Additionally, it readily facilitated by the reported excursion data, asis argued that the large sums that would be spent (an discussed below.estimate for the Los Alamos Plutonium Facility There is a relatively large volume ofseveral years back was a few million dollars) could available excursion data relevant to understandingbe better used on prevention measures such as more the magnitudes of potential or hypothetical processcriticality safety staff presence on the process criticality accidents. In particular, the CRACfloor 13)- The author finds it noteworthy in this regard experimental series covered a wide range of thethat: 1) criticality specialists worldwide are in most important parameters that influence thegeneral agreement that results of probabilistic dynamics of a solution criticality accident. The twoanalyses are likely to be misleading as to actual most important are the solution volume and theaccident frequencies and 2 in one of the reported reactivity insertion rate, with even the latter beingaccidents (Windscale) experts were unable to relatively unimportant for estimating the first spikeascertain the accident mechanism (prior to physical yield of excursions that exceed prompt critical. Theinspection and chemical analysis) even after it was KEWB data support the CRAC data for first-spikedetermined in which vessel the accident had specific fission yields in spite of the fissile solutionoccurred. being a different chemistry.
- 832 -

JAERI - Conf 2003-019
The parameter ranges in the CRAC In addition, the specific yields of theexperiments included: solution volumes from 20 to reported solution criticality accidents, whenover 200 liters; uranium concentrations from 20 to available, support the information in Figure 1. The360 grams per liter; reactivity insertions up to reported estimate of the first spike yield of the mostseveral dollars above prompt critical. In contrast to recent accident, that in Japan in 1999, was not athese experiments where the fissile material was in measured value. It was generated from strongnitric acid and in unreflected cylindrical geometries, circumstantial evidence pointing to a prompt criticalthe KEWB series involved uranyl sulfate solution in excursion (Reference 1) combined with thea reflected, 11.5-liter spherical geometry. information in Figure and the solution volume
Figure shows the variation in the specific involved in the accident.yield of the first spike for prompt critical excursions SILENE data show that for eursions
in both CRAC and KEWB experiments. Clearly for much slower than I-second periods that the specificall but very rapid excursions the specific fission fission yield will drop below 1xlO'5 fissions peryield is about 1.0X10¹⁵ fissions per liter even for liter in the first power rise and fall, but it would berelatively slow excursions. The very short period inappropriate to call such a power history a spike.excursions result from very fast insertion rates that The available Russian accident experience alsomay be unattainable accidentally. indicates this effect. These very slow excursions are
The basis for stating that excursions so ones that do not even approach prompt critical.rapid that the specific yield exceeds a nominal1.0x1015 "may be unattainable accidentally" is 4. Emergency Planning for Solution Criticalitysimply that upon analyzing a postulated, process- Accidentsspecific, accident sequence, the rate at which actualevents happen, e.g., gravity fall; movement of It would be rare that the specific yield ofhands; rate of flow of solution through pipes; will the first spike of a postulated, bounding solutiongenerally result in neutronic periods in the accident would be significantly less than thehorizontal part of the curve in Figure 1, or even less. 1.OxlO'5 value. Thus, this value, multiplied by the
. ... .............. .. 11110 10
ACRACData9 9
8 8__�Inftial Conditions are 1.0
X 7 Atmosphere and 20'C. 7
6 _T_ 6
5 - ----- 5
LL 4 4L 4
3 3
2 Ak 2A,
A AA
01 ODO 100 10
Period (ndiliseconds)
Fig. 1. Specific fissions in first spike as a function of reactor period.
- 833 -

JAERT-Conf 2003-019
involved volume, would be the source term for fact that most evacuations lead first to a hallway andestimating doses to workers from direct neutrons not circuitously through laboratories and amongand gamma rays, assuming that there is only one equipment.spike, or that the alarm triggers the usual prompt Fourth, the dose rate at the muster locationevacuation and significant doses are limited largely would be reasonably constant, and, withto a single spike. conservative analysis and muster location placement,
The characterization of a postulated, likely a low value, but still easily measurable. Thisprocess-specific accident, as required by the would enable decisions about possible relocation ofANSI/ANS-8.23 standard, may lead to the workers to proceed in an orderly manner. Fifth,conclusion that the accident is most likely to be airborne radioactivity could be determined andterminated after the first spike. If this is not the case, decisions made as to possible actions involving thethen the fission Tate subsequent to the first spike public. Sixth, and related to the fifth point, decisionsmay be estimated from the CRAC data. Figure 2 could be made as to actions to terminate theshows both total fission and fission rate histories for excursion. Generally it would seem thatone of the CRAC experiments, number 19. expeditiously draining the accident vessel or
For this prompt critical excursion, several poisoning the solution, but in a manner that did notimportant points are observed. First, the oscillations put workers at any undue risk, would be the desiredextend only a few minutes; at that time steady-state courses of action. Expeditiously is stated due to theboiling sets in. This time delay is obviously political sensitivity of airborne radiation, even ifdependent on the initial conditions at the time of the levels are deemed negligible from a health andaccident. That is, the CRAC experiments were environment viewpoint.initiated at about 20'C. Second, the time between the The quasi-steady-state fission rate is neededfirst and second spike is several seconds, sufficient to estimate direct dose rates as well as airborne dosetime for those who were near the accident location at rates at potential muster locations. In addition, thesethe time of the accident to remove themselves from data permit the estimation of dose rates to the offsitesignificant additional doses. This is the benefit of a public from airborne radionuclides. All of these doseCAS. Third, subsequent spikes diminish in rates would, in fact, be experimentally determinedmagnitude. Thus those evacuating, who happen to were an actual criticality accident to occur. As statedbe at a lesser distance from the accident at the time previously, the CRAC series of experimentsof a subsequent spike, are very unlikely to receive a investigated broad parameter ranges, which are oflife-threatening dose. This conclusion is based not great value in this regard.only of the lesser magnitude spike but also on the
1018
1017 INTEGRATED ENERGYRELEASE - fissions
1016
1015
1014 - END OFSOLUTIONADDITION
1013 -
1012 -
loll
10100 25 50 75 100 125 150 175 200 225 250
TIME -sec
Fig. 2 Power and energy histories for experiment CRAC 19.
- 834 -
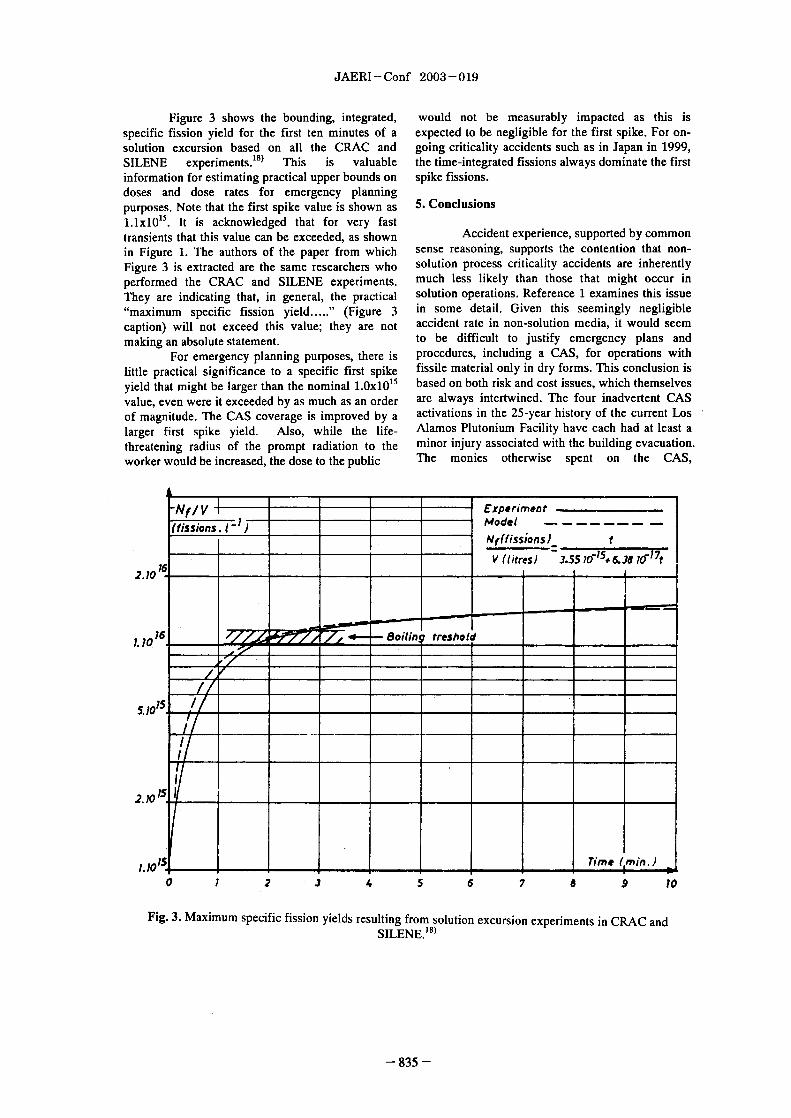
JAERI-Conf 2003-019
Figure 3 shows the bounding, integrated, would not be measurably impacted as this isspecific fission yield for the first ten minutes of a expected to be negligible for the first spike. For on-solution excursion based on all the CRAC and going criticality accidents such as in Japan in 1999,SILENE experiments. 18) This is valuable the time-integrated fissions always dominate the firstinformation for estimating practical upper bounds on spike fissions.doses and dose rates for emergency planningpurposes. Note that the first spike value is shown as S Cnclusions1.1X1015. It is acknowledged that for very fasttransients that this value can b exceeded, as shown Accident experience, supported by commonin Figure 1. The authors of the paper from which sense reasoning, supports the contention that non-Figure 3 is extracted are the same researchers who solution process criticality accidents are inherentlyper-formed the CRAC and SILENE experiments. much less likely than those that might occur inThey are indicating that, in general, the practical solution operations. Reference examines this issue"maximum specific fission yield....." (Figure 3 in some detail. Given this seemingly negligiblecaption) will not exceed this value; they are not accident rate in non-solution media, it would seemmaking an absolute statement. to be difficult to justify emergency plans and
For emergency planning purposes, there is procedures, including a CAS, for operations withlittle practical significance to a specific first spike fissile material only in dry forms. This conclusion isyield that might be larger than the nominal 1OxIO11 based on both risk and cost issues, which themselvesvalue, even were it exceeded by as much as an order are always intertwined. The four inadvertent CASof magnitude. The CAS coverage is improved by a activations in the 25-year history of the current Loslarger first spike yield. Also, while the life- Alamos Plutonium Facility have each had at least athreatening radius of the prompt radiation to the minor injury associated with the building evacuation.worker would be increased, the dose to the public The monies otherwise spent on the CAS,
-Nf / V Experiment
ffissions I ModelN(Vissions I
V I'litres) 3.55 76"5*6.38 70-17t2.10 16
16 7=1.10 4 Boiling treshol.
?SS. 10
2.)O
1. 10 Is Time '4 min.
0 1 2 J 4 5 7 a 9 to
Fig. 3 Maximum specific fission yields resulting from solution excursion experiments in CRAC andSILENE.")
835 -

JAERI-Conf 2003-019
its maintenance, and other emergency plans and men t," JAERI-Data/Code 2002-005, Japanpreparations might well be better spent on additional Atomic Energy Research Institute 2002).accident prevention measures. 7) Charlene C. Cappiello, Ken B. Butterfield, Rene
For operations with significant quantities of G. Sanchez, John A. Bounds, Robert H.fissile materials in solution form, there are Kimpland, Robert P. Damjanovich, Peter J.significant reported experimental data, and more Jaegers, "Solution High-Energy Burst Assemblybeing generated. Practically all site- and process- (SHEBA) Results from Subprompt Criticalspecific criticality accident characterizations and Experiments with Uranyl Fluoride Fuel", LA-evaluations should be able to be performed by the 13373-MS, Los Alamos National Laboratory,direct use of these data. The absence of computer (1997).codes and software models of physical processes 8) "American National Standard for Nuclearsuch as bubble generation does not appear to be an Criticality Safety in Operations with Fissionableimpediment to the implementation of well-founded Materials Outside Reactors," ANSI/ANS-8.1-emergency plans and procedures. On the contrary, it 1998, American Nuclear Society, 1998).is always preferable to solve issues with directly 9) "American National Standard Criticalityapplicable experimental data, and such data appear Accident Alarm System," ANSI/ANS-8.3-1997.to be largely available for solution criticality American Nuclear Society, 1997).accidents. 10) "Nuclear Criticality Accident Emergency
In summary, the criticality safety Planning and Response," ANSI/ANS-8.23-1997,practitioner is in the desirable position of having American Nuclear Society, 1997).directly applicable data, supported further by 21 11) "Nuclear energy - Fissile materials - Principlesreported solution accidents, that collectively enable of criticality safety in storing, handling anda very wide range of postulated, site- and processing," ISO 1709, 2nd ed., 1995).facility- specific accident scenarios to be analyzed 12) International Organization for Standardization,for the fission source term over time periods of "Nuclear energy - Performance and testinginterest. requirements for criticality detection and alarm
References systems," ISO 7753, lst ed., 1987).1) Thomas P. McLaughlin, Shean P. Monahan 13) Thomas P. McLaughlin, "Applications of PRA
in Nuclear Criticality Safety". Proc. TopicalNorman L. Pruvost, Vladimir V. Frolov, Boris Meeting on Risk Management - ExpandingG. Ryazanov, Victor 1. Sviridov, "A Review of Horizons, June 710, 1992, 1992).Criticality Accidents 2000 Revision)", -A- 14) "Nuclear Fuel Cycle Facility Accident Analysis13638, Los Alamos National Laboratory, 2000). Handbook," NUREG/CR-6410, Science
2) T. P. McLaughlin, "Process Criticality Accident Applications International Corporation, 1998).Likelihoods, Consequences and Emergency 15) "Airborne Release Fractions/Rates andPlanning," Nucl. Energy 31, No. 2 143 1992). Respirable Fractions for Nonreactor Nuclear
3) M. E. Remley, J. W. Flora, D. L. Hetrick, D. R. Facilities, Vol. - Analysis of ExperimentalMuller, E. L. Gardner, R. E. Wimmer, R. K. Data," DOE-HDBK-3010-YR, US DepartmentStitt and D. P. Gamble, "Experimental Studies of Energy, 1994).
on the Kinetic Behavior of Water Boiler Type 16) "Assumptions used for evaluating the potentialReactors", Proc. Second UN Int. Conf. on the radiological consequences of accidental nuclearPeaceful Uses of Atomic Energy, Geneva, criticality in a uranium fuel fabrication plant,"Switzerland, Sept. 113, 1958, 11, 1079 1958). USNRC Regulatory Guide 334, Rev. 1 US
4) Pierre Lecorche and Robert L. Seale, "A Nuclear Regulatory Commission, 1979).Review of the Experiments Performed to 17) "Assumptions used for evaluating the potentialDetermine The Radiological Consequences of a radiological consequences of accidental nuclearCriticality Accident," Y-CDC-12, Oak Ridge Y- criticality in a plutonium processing and fuel12 Plant, 1973). fabrication plant," USNRC Regulatory Guide
5) Francis Barbry, "SILENE Reactor Results of 3.35 Rev. 1, US Nuclear RegulatorySelected Typical Experiment," SRSC No. 223, Commission, 1979).CEA Institut de Protection et de Surete 18) Francis Barbry, "Model to Estimate the Maxi-Nucleaire 1994). mum Fission Yield in Accidental Solution Ex-
6) Ken Nakajima, Yuichi Yamane, Kazuhiko cursions," Trans. of Am. Nucl. Soc. 1987Ogawa, Eiju Aizawa, Hiroshi Yanagisawa and Winter Mtg., November 15-19,1987, TANSAOYoshinori Miyoshi, "Tracy Transient Experi- 55, 142, 1987).ment Databook 1) Pulse Withdrawal Experi-
- 836 -

JAERI-Conf 2003-019 JP0450156
Development of a Multimedia Training PlatformFor Nuclear Criticality Safety
E. GUILLOU, J. DEMEESTERE, C. LOYCOGEMA LA HAGUE
50444 Beaumont Hague CedexFrance
eguilloualcogema. , idemeestereacop-ema. , cloyacogema.fr
L. CLOUET, E. CHTOURBINEMILLENNIUM
2, rue du pont Colbert78000 Versailles
Francelaurent.clouet�millennium.fr, eric.chtourbineamillennium.fr
1. Introduction 2. Technical specificationsThe presence of a large quantity of fissile materials The tool was developed using the Internet
in the recycling facilities of COGEMA La Hague technologies: HTML and Flash. It is well suited to theUP2 800 and UP3, requires in-depth knowledge of need for an "easy-to-deploy" software while offeringnuclear criticality safety. This is obtained by the an additional set of advantages:development of specific processes concerning theconception of the installations, the definition of the 0 an intuitive way to navigate between differentexploitation rules, the rganisation of the exploitation pages by using hyperlink or interactiveand the training of the staff. summaries,
0 the possibility to develop a multi-level trainingThe feedback of the foreign criticality accidents with facultative stages enabling to fit to the
which have occurred in the purification and treatment audience,plants of nuclear fuel showed that this can have a interactivity through questions and answers,serious consequences for people located near the a a quick access to any relevant documentation:accident. safety documents, unit diagrams and photos,
To control this risk, COGEMA La Hague based its 0 a coloured and pleasant interface throughefforts on a rigorous safety-criticality method, from interactive pictures and animations.
conception to exploitation, requiring the participation The tool is the main but not the only part of theof the whole of its personnel. formation. The speech of the instructor must avoid
any redundancy with what is shown but must be aSince 2002, the department of quality, safety and natural extent of it. Therefore a document intended to
environment (DQSSE) of COGEMA La Hague the instructor helps him building his speech in such aundertook to develop an interactive platform for the way.training of their executive staff and their operating
staff to consolidate the training knowledge in the field The tool is being kept perennial by a periodicof the criticality risk gained throughout the years. This updating mainly consisting on taking into account theplatform included: changes of the underlying documentation.
• a module intended for the executive staff Of 3. Common contentCOGEMA La Hague, having for objective to The criticality risk is one among other risks whichkeep their competences in nuclear criticality exists in nuclear facilities. Generally speaking, thissafety, risk is introduced in the wider context of the nuclear
safety, therefore the first notion introduced are the in-• a whole set of modules intended for the depth safety strategy and the nuclear safety, such as
operators of every installation, each having the presented in the following figure:objective of teaching them the importance ofgood practice and the greatest respect for thewritten instructions and operating proceduresthey follow during their daily work.
- 837 -

JAERI-Conf 2003-019
73. Ou'am co quit la dfense an profondout
Q�firrition The same kind of table has been added for theLa d6fenso an profarideur consiste Ai pronidre en compte de I#syst6mo6que, las "faillancos tchniques, hurniaines ou organisirficinnell diagrams:et s'en W04 munir per des
W 0- . ...... .. ...... i'll,Lon
A 3210 Extr�tio 2 cycle PlutDniurn
4240 Concov*04oh et rocupdm6on dacide non 1006 A>.14 Fi�;!
5410 Traiternent des euux mores axaliques..... ............5120 Comorsion PuO,
5GO5 Venflation apparail W TIA
5Wl Ptoduttion de Wooto waneux.. ...... ........5M Mont& actirs........... ... .... .
Reniplissage
6220 .. . ..... ............ .. ....6260 et 260 Use en 6hii et conteneur
6270(BST ) et5720 ext. 8ST ) Enktopot'sge dot. comanovts
.... ............... ..
531 D et COMP*rtago des 0chatsFig. 1: In-depth safety strategy I I I �1-lo-,"t ,
Fig. 4 Tables of diagrams
Each training platform includes a part devoted to thephysical phenomena underlying the criticality risk, A "quiz" is a way to check which notion has beenthough it's more widely detailed when the targeted fully understood and which one should be recalled:
audience is the executive staff than for operators:
La fls" Oo bprp6oa " noutmos pot to nuifi6tor' Un isque Orodiaton W itent*r Vn Asqua 0 nvApkation noottordqvo iKer*616
a6p9ngU. Examples de fractions de ifission
PH + PF2 + +
=Pu + � PFt + PF2 + + E 'tout nouttan absorbs. no paut dom plus fiszioTmr.L'absorption des reutmos tend par ons6querft 6 Witter le
��`Pu + � � PFt + PF2 + + E risque de cribcItCLe risque d'irradiation tr*s intonse sous fionne de et deneutrchs ast una coft6quonco de 1ajtcidvnt d cftith ow6s
Produit de NFOort Won est pas uneRayonnerner? Le risque de citicibi so diiihnit commme une population
noubvnique fts ropidernerd croisserft et incontr6loWs Coph6nombrie e&t rendu possible du M de In multipficati des
Newons noubrons tars de le dacton de fission de corlains isotopss.
Neutron Alorne cibloincident (,-'!Pu) 1%
0*0
Produft de fission Fig. 5: Example of quizz
Fig. 2 Criticality principles A specific note is joined with the platform which
A table gathers every document quoted in the provides the instructor a set of explanation, keywords,software and enables them to be opened directly: and timing for each frame of the training platform. An
example gives an idea to the instructor of the way tobuild up a speech accordingly to what is shown:"WOOS
Rb&s Gdniirales crEwploikAon
tonsiVes de cikRd
Ponsigmer. de verrouillage
Consignes d'exploilAon en voie humide
tonsignes cl'exploWorr enwie s6che
Consignes d'expivitation uOtel.. r6arlib et eMuents
Prac6dwo FEWDAM
ProcdckEro do transfert de solutions activer erdre R2 at R4
Con&Ae A e&
.tOhduR tt o c%; d'incondio
.�CohdAe WO an cos do d4tection de fuiles
Actmns A of1rictuer encm; de d6clonchement d�uno Warme crlbc�o
Fig. 3 Documents related the criticality risks
_ 838 -

JAERI - Conf 2003 -019
IZ I '.,..
......... ... ............. ...... .4 W ......... ... .... .. ..... .. ..
................ ...... ..... ..... ... ................. --------- ......OA
_V L�iKkl
PW..............
WWI.............. -----------------
Fig. 8: Example of installation at COGEMALa Hague
A chapter presents each criticality-relatedinstruction sorted by manufacturing unit and by risk.
Fig. 6 Example of document intended to help the The main purpose being to help the operator makinginstructor in building up his speech the link between an instruction and a likely
consequence.4. Specific content of the training platform
intended for the operators 1.3. LIAM 4240. canceRration at icup6ranan tracide non tire
A list of risks which might lead to criticality Wduk par ftyaporatkn dam un 6q*ennentaccidents is summarized in a specific chapter. For La concentnNion an p&mWm des cancertrats done
each of these risks a short description, several r&aponoba 40-2000 at In euva 4240-300D &A Ov
examples, an animation and a link towards the inrtneura a2w m9y .Is tansfen �fts cancemsts de la cum 424040M van PanNmanufacturing units where this risk exists, is presented. 4120 ea ownr A Wafiseaon de to sll* de wndat derewwr R2,
FA cas de d6tafton tufte 6n*4%ft swubvniowwwwWornant 61aw" done to two 4240-1000, pmvenkk"M""Mnl to Cher Crinswahm *U to tap4santent.
ED0 > D admissible Fig. 9 Instructions to be followed by any operator
when a criticality risk is being detected
Instructions mainly consist on the measurement of aset of physical parameters, they are carefully writteninto a specific document which is directly availableunder the training platform:
........ ........ ........ ......... . ........Fig. 7 Example FLASH animation .. ..... .............. . ..... ...... ..... .. ...
.. .... ... .... ..... _ 4 _1__. - _' ' -:,- .. .... ........ .Each manufacturing unit is briefly introduced ....... ....... ... . ... ... .... .. ....through its purpose, its mode of control, several ...... .... .. ......... L...... ... ..... ...
. ... ......
diagrams and photos.-9. All A 4 ..... .. ...
..... ..... .... ..... ... ....... ..... ..... .... ..... ...... .... .... ... ..
..... ..........
Fig. 10: document to be filled by operators
839 -

JAERI Conf 2003-019
For each workshop, a criticality accident has beenchosen up to be illustrated. This accident should haveoccurred in a more or less similar facility or at leasthaving involved the same kind of fissile materials.
Fig. 11: FLASH illustration of a potential criticalityaccident
5. ConclusionThe training platform is thus an intuitive, user
friendly, effective tool which can be used to reinforcethe training knowledge in the field of the iticalityrisk for both the executive staff and the operators.
,It is also, within a single interface, a quick access toany relevant document formerly stored in differentlocations.
It meets the need for an on-going learning tool,which could be available on any terminal inside thefacility,
840 -
JAERI-Conf 2003-019 JP0450157
Criticality Incident Detection Assessment Methodology
Richard M. HALEY, Dr Simon J. WARBURTON, Russell L. BOWDENNuclear Technologies p1c, Chadwick House, Birchwood, Warrington WA3 6AE,
United KingdomTel 44 1925 855422
richard halevp_nuclear co. uk
In the United Kingdom, all nuclear facilities that handle, treat or storefissile material require a Criticality Incident Detection and Alarm System(CIDAS) to be installed, unless a case is made for the omission of such asystem. Where it is concluded that a CIDAS is required, the primary objectiveis the reliable detection of criticality and the initiation of prompt evacuation ofplant workers from the vicinity of the incident.
This paper will examine and compare various methods that can be used todemonstrate that a CIDAS will satisfy the detection criterion. The paper willfocus on fit-for-purpose and cost-effective methods for the assessment ofgamma-based systems. In the experience of the authors this is particularlyuseful in demonstrating the efficacy of existing systems in operational plant.
KEYWORDS. Criticality Incident, Detection, CIDAS, Dose
1. Introduction function to reduce dose rates to acceptable levels.This could be substantiated using direct dose
Given the potential consequences of a rate measurements, dose records or calculation.criticality incident, the accepted design However, for a CIDAS, where the safetystandards for CIDAS within the UK are high. In function would be "to satisfy the criticalitymany cases, assessing the optimum location for incident detection criterion", direct measurementthe detectors, or providing engineering to demonstrate this safety fnction (i.e. to detectsubstantiation of existing systems can require a a criticality incident) is not realistically feasible.rigorous assessment methodology. Hence, it is usual to provide a rigorous and
robust series of calculations to substantiate theIn new plant designs, the bulk of the cost CIDAS. This paper discusses appropriate
from the provision of a CIDAS stems from the methodology for gamma based criticalitydecision to provide the system and the cost of detectors, which are the most commonly used inadditional detectors represents only a small the UK, although the basic principle would alsofraction of the total system cost. However, for apply to neutron based detectors.existing plants, the costs associated withmodifying a CIDAS in order to meet modem 2. Detection criteriaaccepted safety standards may be significant,
possibly including the movement or addition of The UK CIDAS detection criteria are baseddetectors and prolonged operational downtime. upon the requirement to detect the minimumIn this case, there is often a considerable benefit incident of concern as follows:in adopting a more rigorous assessment of theCIDAS integrity. * For unshielded/lightly shielded systems the
minimum incident of concern is 1014 fissions
The methodology used in the UK nuclear for close working < 2m) or 1015 fissions forindustry to produce safety cases has recently non close working > 2m).
undergone significant changes. One of these * For heavily shielded systems (i.e. where anchanges is the introduction of formal incident of 1015 fissions would not beEngineering Substantiation. This involves detected) the minimum incident of concer isproviding a rigorous demonstration that any that which could result in an operatorstructure, system or component (SSC) that receiving the maximum acceptableprovides a safety function will per-form the emergency dose.safety function with the required reliability. Forexample: a shield wall may have a safety
- 841 -

JAERI-Conf 2003-019
These detection criteria are discussed in For more heavily shielded plants, where themore detail by Delafield and Clifton'), which simple range as a function of shield thicknessalso includes recommended values of incident method is inappropriate, it is often necessary todurations for various types of fissile systems. perform secondary gamma calculations as the
The maximum acceptable emergency dose secondary gamma component at the detectorcurrently assumed in the UK is mSv. may dominate. It is also often the case forHowever, following a recent emergency heavily shielded plants that the second detectionplanning review it is likely to change to criterion outlined above i.e. the maximum5OOmGy, which re resents the threshold for acceptable emergency dose to an operator, must
CtS3 be adopted. In this case, the estimated dose todeterministic effe & the operator must include all the significant
3. Radiation Characteristics of Criticality contributions, i.e. neutron, primary gammasecondary gamma and fission product gamma.
Following a criticality incident, there are four A dose profile may be produced from whichsources of radiation of interest in CIDAS the maximum spacing of the detectors would beassessments: derived. Clearly this would apply to an idealised
plant in which shielding was uniform but• Prompt fission gamma - instantaneous nevertheless would be useful for scoping out
gamma emission following fission. potential detector positions. A detailed model• Secondary gamma - arising from neutron taking in to account perturbations in the
interactions with shield materials. shielding, e.g. steel plugs and lead glass• Prompt neutron - arising from the fission windows, would be required to finalise the
process. detector positions and confirm the detection• Fission product decay gamma - arising from integrity-
the radioactive decay of fission productsformed as a result of fission. 4.2 Existing Plants
The gamma dose as a result of activation of For existing nuclear facilities beingmaterials due to neutron capture is not usually subjected to the Engineering Substantiationconsidered, since the dose from this source is process, it is prudent to consider the followinggenerally insignificant compared to the four options as part of the CIDAS substantiation insources listed above. order to ensure that the most cost-effective and
fit-for-purpose solution is achieved.4. Assessment Methodologies
Review the needfor the CDAS and
4.1 New Plants prepare a CIDAS omission argument.
For new plants, the cost of the provision of a The accepted criterion used to determineCIDAS mainly stems from the decision to whether a CIDAS is required in a UK plantprovide a system. In this case, the assessment of handling fissile material is that proposed byoptimum detector positions need not be Aspinall and Daniels') as follows:
particularly refined assuming te detection "Criticality detection and alarm systemscriterion is satisfied. Here, for lightly shielded shall be provided at all places where fissilefacilities a method based on detector ranges as a material may be used or stored, unless it isfunction of shield thickness can be used. confident judged that in the event of theHowever, careful consideration of the yattenuation provided by the intervening failure of any or all of those criticality controlsshielding between the detector and incident that rely on human agency or on mechanical orposition must be taken so as not to electrical devices, criticality would not beunderestimate the effect of the shielding and reasonably expected having regard to the naturesubsequently overestimate the efficacy of the of the particular operations and facility".
detection system. However, in older facilities that handle
In broad terins, this involves ensuring that fissile material, it was often the case that athe thicknesses, densities and compositions of CIDAS was installed even without a formalmaterials assumed in the calculations are chosen assessment determining the need for it. Ato minimise the gamma doses at the detector detailed review of the nature of the process andpositions. the criticality controls in place, and any
modifications that have been made during the
- 842 -

JAERI-Conf 2003-019
operational lifetime of the plant, may show that It should be noted that the method ofa CIDAS is not actually required. revising the neutron component of the total dose
to the worker will be examined in particularIt should be noted that the use of this detail, as this is this where the largest refinement
approach would not be used to draw the is likely to be seen.conclusion that a functioning CIDAS should beswitched off, since this would be inconsistent As mentioned before, the value of thewith the requirements of the ALARP principle. maximum acceptable emergency dose is likely(Although not strictly required, the CIDAS may to change from mSv to OmGy in future.provide some benefit). However, the assessment This change is likely to have a significantwould demonstrate that no modifications are impact for heavily shielded facilties. (Evenrequired to the existing system and that it need when the dose due to a criticality incident isnot be replaced when it reaches the end of its gamma dominated, this represents a five-foldoperational lifetime. improvement in detection efficiency).
Adventist,,,,Install additional detectors gvX M ,J
Another approach could be to install Processadditional detectors to ensure that adequate Fissile C Orri dorCIDAS coverage is provided. In principle, this cell INI'Mffl,
Nmay seem to be a relative simple option.However, it may have a significant impact on 6,vplant performance due to operational down time,increased testing and maintenance requirementsfor the augmented CIDAS and dose uptakeimplications incurred during installation. aided,, �p
wg
if this approach is adopted, detailedcalculations would be required to ensure that the M
minimum number of additional detectors isidentified.
Remove pessimisms/refline calculation Fig.1 Typical elevation of plant geometry for ashielded facility handling fissile material
In instances in which the CIDAS assessment Maximum acceptable emergency doseidentifies shortfalls in the detection integrity for
a particular working area of a plant, a review of It is usual that the calculated worker dosesthe basic modelling assumptions used in the are "operational quantities", i.e. ambient doseassessment may suggest that the CIDAS does in equivalent, denoted H*(d), where d is the tissuefact meet the criterion without requiring any depth assumed in the calculations. The use ofmodifications to the system. This is more likely this quantity generally ensures pessimism into be the case in situations where the criterion is design and dose estimation since it tends tobased on the maximum acceptable emergency overestimate the appropriate "protectiondose rather than the detectable number offissions. quantity", i.e. the true effective dose, denoted E.
For example, consider a scenario based upon For whole-body doses, a tissue depth ofthe plant geometry shown in Figure 1 A l0mm. is usually chosen to estimate te dose tooperator is sielded from a fissile cell by a the internal organs. Hence, the whole-bodyconcrete wall and a lead glass window. As this ambient dose equivalent is denoted H*(10).
is a heavily shielded situation, the detection Figure 2 shows the ratio of the protectioncriterion would probably be based on the quantity, effective dose, E, with the operationalmaximum acceptable emergency dose. quantity W(10). The most probable energy of
Possible refinements might include the neutrons emitted during fission is around 2MeV.adoption of more realistic (but still pessimistic) Hence, it can be seen that H*(10) overestimatesmaterial compositions, incident locations and E over the majority of the neutron energy range
operator positions based on operational of interest.experience, rather than the absolute worst cases.
843 -

JAERI-Conf 2003-019
In addition, flux to dose conversion factors operator due to a criticality incident are unlikelyused to estimate H*(10) are based on simple to result in large savings. Hence, this approachanthropomorphic phantoms, e.g. the ICRU is only likely to be of benefit when the detectionsphere. Calculating the H*(10) dose in front of criterion is breached by a relatively smallthe lead glass windows will be pessimistic in margin.comparison with the true dose, i.e. the primarylimit quantity of effective dose, E. 0 Justification of an alternative incident
detection criterionThis is because the radiation flux distribution
across the body will vary and will result in a In a CIDAS integrity assessment, inlower whole body dose, due to the variation in addition to choosing an appropriate incident size,flux at sensitive organs such as the gonads, and it is also necessary to choose an appropriatethe differing shielding effects of concrete and incident duration. The incident duration dependslead glass. on the type of fissile system, and is significantly
longer for a solution type incident than for a2�, metal type incident'). Since gamma based
E/h-(l0h(lCRP60) CIDAS detectors tfigger at a certain dose rate
19 threshold, this implies that solution typeincidents are more difficult to detect than metaltype incidents.
Historically, a CIDAS assessment may have0.5 assumed a solution type incident in order to
ensure that the efficacy of the CIDAS is not
01 . . . overestimated. However, a more detailed review104 le le 1 lo, lo, 10 1 le lo, lo,Neutron enerU (MeV) of the plant operations may show that a robust
case can be made for the assumption of a metal
Fig.2 Ratio of protection quantity and operation type incident in some or all plant areas.
quantity against neutron energy In such cases, it may then be possible to
By calculating the dose to different organs, demonstrate that the extant CIDAS does in factgiven that they may well be shielded by meet the incident detection criterion withoutdifferent materials, in this case concrete and lead requiring any modifications.glass, and summing over all organs to give thewhole body total dose, will provide a better 9 Review alarm triggering logic
estimate than calculating the absorbed dose infront of the lead glass window alone. The In the UK, a typical CIDAS system mayvariation of the absorbed dose for the various consist of three independent circuits of detectors.organs is shown in Figure 3 The incident detection logic is configured such
that, to trigger the alarm system, at least onedetector from any two of the three circuits is
lop breast required to satisfy the detection criterion. This........... lungs
colon two-out-of-three logic approach is adopted tored bon, rnAnro,1�rl testes minimise the number of spurious alarms.
E skinlo,
For pessimism, CIDAS integrityassessments usually aim to demonstrate that at
id, least one detector from all three circuits wouldsatisfy the detection criterion.
. . . . . . . . . . . .. However, it may be possible, based on alo-, to-' te to-' la' to-1 e twl o-' to-' id' o to'
Neutron energy (MeV) very detailed assessment, to justify an approachbased on demonstrating that (at east) one
Fig.3 Organ absorbed dose conversion (AP detector from any two of the three circuitsirradiation geometry) coefficients for would satisfy the detection criterion.
selected organs as a function of neutron Again, it may then be possible toenergy demonstrate that the extant CIDAS is in fact
In reality, these refinements in the method adequate without the need for any modifications.
used to calculate the dose received by an Use of a portable CIDAS
- 844 -
JAERI - Corif 2003 - 019
As mentioned earlier, the installation of aCIDAS represents a significant capital cost,even for a new plant. For a plant that has beenoperational for several years, this cost is likelyto be greatly increased.
Another option, which is particularlyrelevant for a plant that is undergoingdecommissioning, is the introduction of aportable CIDAS. The advantage of this approachis that a full system covering the entire plantneed not be provided. Rather, a smaller mobilesystem can be introduced and moved around theplant as the various active areas aredecommissioned.
5. Conclusion
The standard CIDAS detection criteria usedin the UK have been described and the varioussources of radiation produced as a result of acriticality incident have been outlined.
The demonstration of CIDAS integrity isthen discussed in some detail, both for plants atthe design stage and for operational plants.
For plants that are still at the design stage,the ma or cost associated with a CIDAS is theprovision of a system. Additional detectors areonly a relatively minor additional cost. In thesecases, the assessment of detector positioningneed not be particularly refined and assessmentscan be relatively simple.
However, for existing plants, modificationsare Rely to be dose intensive and timeconsuming. Hence, it is prudent to carry outmuch more detailed assessments. Severaloptions are discussed, which should be pursuedin order to ensure that the most cost-effectiveand fit-for-purpose solution is achieved.
References
I H. J. Dellafield, J. J. Clifton, "DesignCriteria and Principles for CriticalityDetection and Alarm Systems", SRD R309(1984).
2. K. J. Aspinall, J. T. Daniels, "Review ofUKAEA Criticality Detection and AlarmSystems 1963/64 Part 1: Provisions andDesign Principles" 1965).
3. lCRP Publication 60, 111990Recommendations of the InternationalCommission on Radiological Protection",1991.
- 845 -I
JAERI - Conf 2003 - 019 JP0450158
Use of a Web-Site to Enhance Criticality Safety Training
Song T. Huang" and James A. Morman 2]Lawrence Livermore National Laboratory, Livermore, CA, USA
2Argonne National Laboratory, Argonne, IL, USA
1. Introduction site that can be used to assist the training ofnewcomers to this important safety discipline.
Currently, a website dedicated to enhancingcommunication and dissemination of criticality safety 2. Main Features of the Websiteinformation is sponsored by the U.S. Department ofEnergy (DOE) Nuclear Criticality Safety Program Before venturing into a discussion of various(NCSP). This website was developed as part of the training ideas, it is beneficial to summarize the mainDOE response to the Defense Nuclear Facilities features of the website and the experience we haveSafety Board (DNFSB) Recommendation 97-2, which learned during the last few years regarding thereflected the need to make criticality safety training module development and the needs of theinformation available to a wide audience. The criticality safety community. The current website iswebsite is the focal point for DOE nuclear criticality built upon a frame-based navigational scheme. Thesafety (NCS) activities, resources and references, website contents were organized under sixteen menuincluding hyperlinks to other sites actively involved in buttons for ease of navigation. The data werethe collection and dissemination of criticality safety structured into several categories: general websiteinformation. The website is maintained by the information (i.e., home page, website mission, DOELawrence Livermore National Laboratory (LLNL) NCSP plan, and registration); general guidance forunder auspices of the NCSP management. new users (i.e., basic NCS information, DOE Orders
and Regulations); technical information (i.e., trainingOne area of the website contains a series of and conferences, databases and references, NCS codes
Nuclear Criticality Safety Engineer Training and data, NCSET, and website archives); major(NCSET) modules. During the past few years, many stakeholders and organizations (i.e., DOE NCS groups,users worldwide have accessed the NCSET section of DNFSB Actions, other resources, and high levelthe NCSP website and have downloaded the training links); and the user feedback page (i.e., a messagemodules as an aid for their training programs. This board). The website provides a "one-stop" centertrend was remarkable in that it points out a continuing where a user can also link to other key NCS websites.need of the criticality safety community across the This approach offers several advantages includingglobe. unnecessary duplication of infonnation and allowing a
user to access up-to-date information from variousIt has long been recognized that training of websites.
criticality safety professionals is a continuing processinvolving both knowledge-based training and Among the features included in the NCSPexperience-based operations floor training. As more website are general help for new criticality safetyof the experienced criticality safety professionals practitioners, a discussion of computational methodsreach retirement age, the opportunities for mentoring and resources, a collection of bibliographic references,programs are reduced. It is essential tat some and a collection of various technical andmethod be provided to assist the training of young organizational information to help newcomers in thiscriticality safety professionals to replenish this limited field. This website has been online since 1998.human expert resource to support on-going and future Currently, the website provides two bibliographicnuclear operations. databases (i.e., the LLNL database and the Hanford
database) with a data search engine to facilitateThe main objective of this paper is to present the utilization of the databases. The two databases in
features of the NCSP website, including its mission, combination have more than 10,000 bibliographicalcontents, and most importantly its use for the references including brief abstracts of journal articles,dissemination of training modules to the criticality technical reports, criticality experiments, and othersafety community. We will discuss lessons learned relevant criticality safety information from the lastand several ideas for future development in the area of forty years.web-based training for criticality safety professionals.Our effort is intended to stimulate a discussion ofideas and solicit participation in the development ofthe next generation of a web-based criticality training
Corresponding author, Tel. 925-422-6516, Fax. 925423-2854, E-mail: huang3a,1ril. v
- 846 -

JAERI-Conf 2003-019
3. A Web-based Training Program The first eleven modules are similar in form tochapters of a textbook and many have exercises with
Early in the development of the website, it was answers included. Recognizing te trend towardsrecognized that, in addition to enhancing interacti ve web-based training, Module 1 2communication and information dissemination, (Development of NCS Evaluations) was written in thetraining should be a major emphasis to help the form of a web page that can be viewed through anynewcomers to criticality safety. New graduates from internet browser. The tutorial parts of the moduleuniversities generally need substantial mentoring to contain internal links that take the reader to specificgain insights into the subtleties of the field and to sections of an actual NCS evaluation to demonstrateacquire job-Telated experience. This is particularly how the pinciples are put into practice. Afterevident in te field of criticality safety, partially due reading the appropriate section of the example,to the academic orientation of nuclear engineering another link returns the reader to the point fi7om whichcurricula at most universities. the tutorial section was left. Figure I shows an
example that contains the description of the facilityDuring the last few years, substantial effort was being evaluated and the link that returns the reader to
spent towards development of the NCSET modules. the training section of the module.The modules currently available, or to be posted soon,are listed below: We expect that future modules will continue to
use this form, and incorporate even more interactiveModule 1: Introductory Nuclear Criticality features that take advantage of the developments in
Physics computer training technology.Module 2 Neutron InteractionsModule 3 The Fission Chain Reaction 4. The Next Stage of DevelopmentModule 4 Neutron Scattering and ModerationModule 5: Criticality Safety Limits With the rapid progress of the internetModule 6 Introduction to Diffusion Theory information age, a web-based training option offersModule 7 Introduction to the Monte Carlo many advantages. It will allow new criticality safety
Method engineers to train at their own pace, and provideModule 8: Hand Calculation Methods-Part I refresher courses for more experienced people.Module 9 Hand Calculation Methods-Part 2 When such a training program is made available on an
(coming soon) easily accessible website that integrates the featuresModule 10: Criticality Safety in Material described above, it can also provide a forum for
Processing Operations-Part I criticality safety professionals to share theirModule I : Criticality Safety in Material experiences and suggest improvements. Use of such
Processing Operations-Part 2 an interactive site offers a great opportunity forModule 12: Development of Nuclear Criticality cooperation among the diverse organizations
Safety Evaluations interested in criticality safety, both domestically andinternationally.
Development of these training modules was a result ofthe effort of many members of the NCS community. As we assessed the status of available NCSSome of the training modules were developed from training aterials and the need to offer moreexisting training materials used at various DOE sites "operations-based" support training, it was quitethat deal with handling of fissionable materials. obvious that text-based training modules, althoughGenerally speaking, the training modules are aimed at easy to write and implement on the web site, havethe practical application of neutron physics with the their limitations. First of all, a text-based traininggoal of developing the necessary skills required to module is not the best approach to train people new tosupport facility design and nuclear facility operations the area of criticality safety. A user needs to readin the area of criticality safety. through the text just like reading a textbook without
the benefit of a teacher. Because of this, the NCSETAs mentioned earlier, the response from the section of the web site notes that the modules are
criticality safety community to the NCSP website is generally intended to be used as part of a trainingtruly remarkable. The training module section and program conducted by the appropriate training staff.the bibliographic database section are the mostfrequently accessed sections of the website by users Furthermore, completely text-based trainingworldwide. Furthermore, there have been and materials are more suitable for teaching basic theorycontinue to be substantial downloads of the NCSET and rule-based methodologies. Without pictures ormodules. This activity is beyond our initial diagrams, it is harder for a student to comprehend theexpectations and truly represents the need of relevant information related to a real work situationindividual NCS practitioners to obtain training such as a workstation, process equipment, or a storagematerials for their use. array. Most of the NCSET modules contain
- 847 -
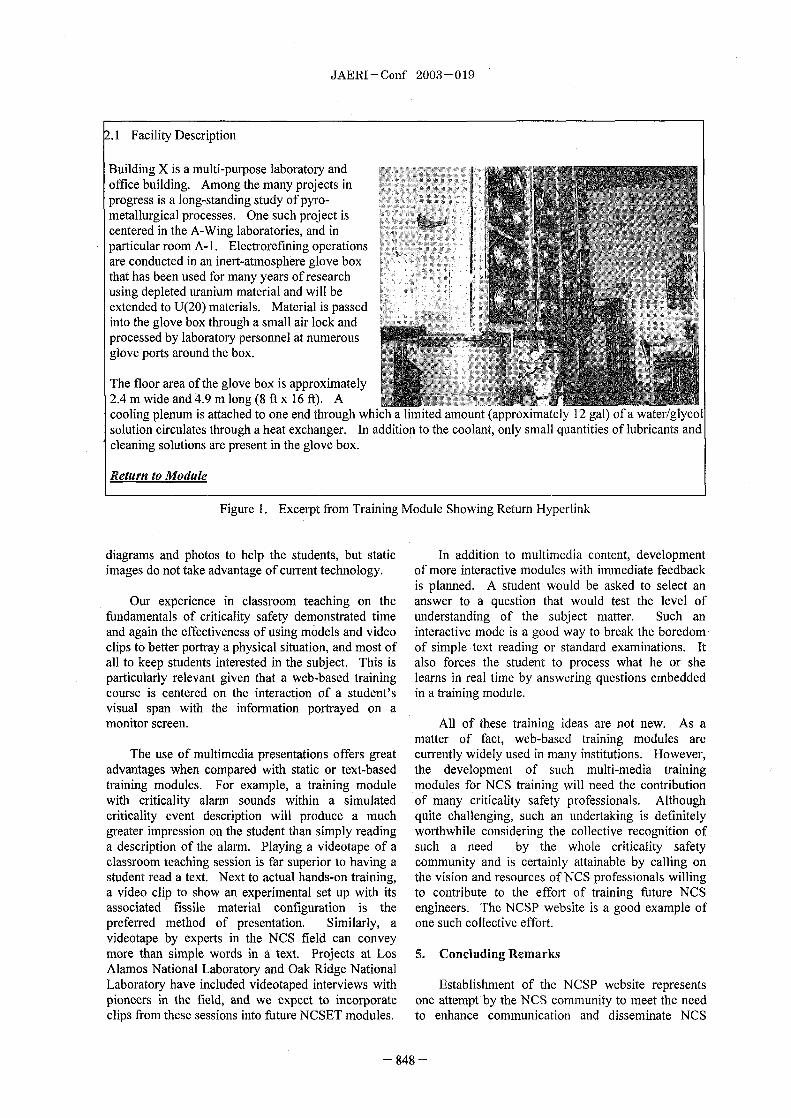
JAERI-Conf 2003-019
2.1 Facility Description
Building X is a multi-purpose laborato dfill
office building. Among the many pr e inprogress is a long-standing study of pmetallurgical processes. One such project iscentered in the A-Wing laboratories, and inparticular room A-1. Electrorefining operations tare conducted in an inert-atmosphere glove boxthat has been used for many years of researchusing depleted uranium material and will beextended to U(20) materials. Material is passedinto the glove box through a small air lock andprocessed by laboratory personnel at numerousglove ports around the box.
VUi
The floor area of the glove box is approximately2.4 rn wide and 49 in long (8 ft x 16 ft) Acooling plenum is attached to one end through which a limited amount (approximately 12 gal) of a water/glycolsolution circulates through a heat exchanger. In addition to the coolant, only small quantities of lubricants andcleaning solutions are present in the glove box.
Return to Module
Figure 1. Excerpt from Training Module Showing Return Hyperlink
diagrams and photos to help the students, but static In addition to multimedia content, developmentimages do not take advantage of current technology. of more interactive modules with immediate feedback
is planned. A student would be asked to select anOur experience in classroom teaching on the answer to a question that would test the level of
fundamentals of criticality safety demonstrated time understanding of the subject matter. Such anand again the effectiveness of using models and video interactive mode is a good way to break the boredomclips to better portray a physical situation, and most of of simple text reading or standard examinations. Itall to keep students interested in the subject. This is also forces the student to process what he or sheparticularly relevant given that a web-based training learns in real time by answering questions embeddedcourse is centered on the interaction of a student's in a training module.visual span with the inforination portrayed on amonitor screen. All of these training ideas are not new. As a
matter of fact, web-based training modules areThe use of multimedia presentations offers great currently widely used in many institutions. However,
advantages when compared with static or text-based the development of such multi-media trainingtraining modules. For example, a training module modules for NCS training will need the contributionwith criticality alann sounds within a simulated of many criticality safety professionals. Althoughcriticality event description will produce a much quite challenging, such an undertaking is definitelygreater impression on the student than simply reading worthwhile considering the collective recognition ofa description of the alarm. Playing a videotape of a such a need by the whole criticality safetyclassroom teaching session is far superior to having a community and is certainly attainable by calling onstudent read a text. Next to actual hands-on training, the vision and resources of NCS professionals willinga video clip to show an experimental set up with its to contribute to the effort of training ftiture NCSassociated fissile material configuration is the engineers. The NCSP website is a good example ofpreferred method of presentation. Similarly, a one such collective effort.videotape by experts in the NCS field can conveymore than simple words in a text. Projects at Los 5. Concluding RemarksAlamos National Laboratory and Oak Ridge NationalLaboratory have included videotaped interviews with Establishment of the NCSP website representspioneers in the field, and we expect to incorporate one attempt by the NCS community to meet the needclips from these sessions into future NCSET modules. to enhance communication and disseminate NCS
848 -

JAERI - Conf 2003-019
information to a wider audience. With the aging safety could easily be incorporated into trainingwork force in this important technical field, there is a modules. Obviously, the development of such acommon recognition of the need to capture the program depends largely upon the need andcorporate knowledge of these people and provide an participation of experts who share the same vision andeasily accessible, web-based training opportunity to enthusiasm of training the next generation ofthose people just entering the field of criticality safety. criticality safety engineers.
A multimedia-based site can provide a wide The NCSP website is just one example of therange of possibilities for criticality safety training. potential benefits that web-based training can offer.Training modules could range from simple text-based You are encouraged to browse the NCSP website atmaterial, similar to the NCSET modules, to interactive http://ncsp.llnl.gov. We solicit your ideas in theweb-based training classes, to video lecture series. training of future NCS engineers and welcome yourFor example, the Los Alamos National Laboratory participation with us in developing future multimediavideo series of interviews with pioneers of criticality training modules.
849 -

JAERI-Conf 2003-019 JP0450159
To Stay or to Go? Balancing the Risk of Reprocessing Plant Control RoomEvacuation Following a Criticality Alarm
Suzanne LOVE", David McCRINDLE1, Neil HARRIS', Justin HAWORTH2'British Nuclear Fuels p1c, Safety and Environmental Risk Management, Research and Technology,
Sellafield Seascale, Cumbria CA20 IPG, United Kingdom'British Nuclear Fuels p1c, Criticality Dose Shielding Assessment, Research and Technology,
Risley, Warrington, Cheshire, W43 6AS, United Kingdom
Following a criticality alarin within the Magnox Separation Plant at Sellafield, there is aconflict of interest between the risks associated with complete evacuation versus continuedmanning of the control room. The historic emergency response policy would be tocompletely evacuate the control room upon a criticality alarm. If, however, the alarm wasfound to be false, the inevitable loss in control over the plant could have environmental,operational and radiological release consequences. Maintaining control room manningfollowing a genuine alarm might, however, result in an avoidable high dose to an operator.Based upon the estimated dose equivalent to a control room operator for a range of criticalityincident morphologies a risk analysis was undertaken. The results indicate that thedifferential risk between an operator who evacuates immediately and an operator who remainsfor a short time to complete diagnostic checks is very small. As a consequence a newemergency policy was therefore developed on plant which results in a relatively low risk tocontrol room operators, but still allows control over the plant to be retained following a falsecriticality alarm.
KEYWORDS. Criticality Incident Detection and Alarm System, CIDAS, Operator Dose,Control Room Evacuation, Balancing Risk, Emergency Procedure
1. Introduction The options of re-siting the control room,installing additional bulk shielding to the control
The Magnox Separation Plant (MSP) at room or constructing an additional remote controlSellafield reprocesses Magnox fuel using a room have been dismissed due to the risks andsolvent extraction process. It is a relatively old the cost-benefit associated with such majorplant and relies heavily on operator intervention modifications and the limited remaining lifetimeto control the process. Although the plant is of the plant. Therefore a detailed reassessment ofintrinsically stable and not susceptible to rapid the operator response to a CIDAS alarm wasfluctuations from normal conditions, the risk of a carried out based on estimated dose equivalentcriticality is such that it warrants the installation following a criticality incident. The analysis wasof a Criticality Incident Detection and Alarm aimed at achieving an optimised response thatSystem (CIDAS). properly balances the risks between the different
The purpose of this system is to alert operator responses.operators to a criticality incident and to initiate arapid evacuation of the affected area. The plant 2. Magnox Separation Plantcontrol room is located within the area that wouldbe affected by a criticality incident. Historically, Following dissolution of the Magnox fuel,the control room has remained manned following within the MSP, plutonium (Pu) and uranium (U)alarms. If the plant is left unattended there could are chemically separated from the fissionbe a risk of an arborne release which would have products via a solvent extraction process withinthe potential for a dose to the public, or there mixer settler vessels. Both the U stream andcould be the risk of a criticality (either the first fission products are forward fed to differentgenuine incident if it had been a false alarm, or a plants for further purification, however, the Pufurther incident) or the risk of a contained stream is purified and finally concentrated byincident which could require a clean up and evaporation within the MSP.subsequent plant outage. These risks must be Criticality safety is principally maintained byconsidered against the review of the plant's controlling the fissile concentration of the liquorsemergency procedures which highlighted that and by the use of geometrically safe vessels.continued manning of the control room may be Operators continually monitor the plant both inexposing operators to undue risk. the control room and on the plant, hence there is a
wealth of operational experience, which has
*Corresponding author, Tel. 44-19467-79146, Fax. 44-19467-79007, E-mail:suzanne-love�bnfl.com
- 850-

JAERI-Conf 2003-019
shown that the plant is intrinsically stable and not The analysis therefore considered the riskssusceptible to rapid fluctuations from non-nal associated with the following operator responses:conditions. Indeed there have been very fewtransients which could be regarded as precursors (1) All control room operators evacuateto a criticality incident. immediately; or
The main process vessels in the plant are (2) Most senior person remains to carry outlocated within shielded cells. The control room is quick confirmatory checks on whether theremote from, and shielded from, most of the incident was genuine; orpotential criticality sites. However, the shielding (3) No evacuation of control room.was not designed for criticality shielding, butrather was designed as a shield against gamma 4. Criticality Incident Morphologiesemissions from fission products and actinides.
The first part of this analysis was therefore to Based on a review of historical incidents,calculate the dose equivalent to an operator three different types of criticality incidentwithin the control room following a criticality morphology are examined. Single spike,incident. The dose was an estimation (taking into continuous and repeated spike incidents haveaccount the shielding present) following a previously been reported in criticalitycriticality incident in the following cells: incidents/experiments which involve thermal
liquid systems (i.e. those systems expected in theLow Active (LA) Cell MSP). Based on a review of historic criticalityMedium Active (MA) Cell incidents, it is assumed that the criticalityHighly Active (HA) Cell incident will have one of the following broadDissolver Cell characteristics, which are represented
schematically in Figures I to 4.
The other cell areas within the MSP wereconsidered to give a negligible dose equivalent tocontrol room operators due to their shieldingand/or proximity from the control room or had arelatively low potential for criticality.
3. Operator Response to a CIDAS Alarm
The control room in the Magnox SeparationPlant is equipped with instnimentation whichallows continual monitoring of the plant. In theevent of a CIDAS alarm some systems wouldalso permit a rapid indication of whether a Fig. I Schematic of dose equivalent and fissioncriticality truly had occurred or whether the alarm yield for a plateau type criticality incidentwas false. with the fissions occurring over a period of
To minimise the potential dose to control I hour at a constant rate (type I incident).room operators, complete evacuation of thecontrol room would be necessary. However, suchan evacuation of the control room following afalse alarm would result in a loss in control over Yi.1d ...........
the plant. This may have environmental, D..c
operational and radiological release consequences.On the other hand if the alarm was genuine andoperators remained in the control room, this ..........might result in an avoidable high dose to theoperator.
A possible compromise could be for just oneoperator to remain in the control room for a short
period of time to carry out diagnostic check. If Fig. 2 Schematic of dose equivalent and fissionthe alarm was confirmed to be genuine indicating yield for a twin spike type criticalitya criticality incident had indeed occurred in the incident with half the fissions occurringplant they would then evacuate, If the alarm was immediately and half the fissions occurringfound to be false, they would remain and carry one hour later (Type 2 incident)out the normal supervisory checks while awaitingreturning support.
- 85 -

JAERI-Conf 2003-019
yie dose in a Type 2 3 or 4 incident, the second-Dow spike dose of a Type 3 incident and
minutes of Type .0 Staff who remain in the control room to
monitor the plant will receive the entire dosefrom all 4 incidents (i.e. the dose due to the10'8 fissions regardless of the nature of theevent).
Ti.. 5. Estimation of Dose Equivalent to B205
Fig. 3 Schematic of dose and fission yield for a Control Room Operatorstwin spike type criticality incident with halfthe fissions occurring immediately and half Based on a fission yield, the cellthe fissions occurring five minutes later shielding and the distance of the cell from the(Type 3 incident). control room, a estimate of the possible
approximate dose equivalent to operators withinthe control room following a criticality within
32 either of the four cell areas was obtained. This.2 ---------------------->- data is summarised in Table ..2
Table I Estimate of Dose Equivalent to a ControlRoom Operator following a Criticality
.e Yield incident of 1018 Fissions in Various Cells ofD the Magnox Separation Plant
LU 7-10!�-J
0
Dose Equivalent to aTime Cell Control Room Operator
(mSv)Fig. 4 Schematic of dose equivalent and fission Low Active 58
yield for a single spike criticality incident Medium Active 23with the vast majority of the fissions High Active 4occurring before any action can be taken Dissolver 4(Type 4 incident).
The dose equivalents to the control roomIt is likely that any real incident will exhibit operator were then specifically calculated for
more complex behaviour, however, these each type of criticality incident type. Given allcharacteristics are believed to be reasonably four types of incident are considered to berepresentative and they permit discrimination equally probable, the mean dose equivalent to thebetween the various evacuation strategies. operator was then determined. This data is
Given that a criticality would be expected to summarised in Table 2 and the estimated dosearise as a result of an 'unpredicted' fault there is equivalents for each type of criticality scenariono reason to assume that criticality incidents are are plotted for each type of operator response.more likely in one area. The probability Of This is shown schematically in Figures 5 to 7.criticality incidents in the MSP is split betweenthe LA, MA, HA and dissolver cells. It is also 60
assumed that any criticality will result in a totalof 1018 fissions. Considering the four types of 50 - LA Cell 13 MA Cell
incident and the three operator responses, the 0 HA Cell40
following assumptions are made:30
• Staff who evacuate the control roomLU
immediately will be out of range of the 4, 20
incident within 5 minutes. They will receivethe initial spike dose in a Type 2, 3 or 4 10incident and 5 minutes worth of the 0 7=
continuous Type I incident dose. Type 1 TWe 2 Type 3 Type 4
• Staff who evacuate the control room Fig. 5 Schematic of the dose equivalent to afollowing a quick diagnostic check will be control room operator following aout of range of the incident within 10 prompt evacuation for each type ofminutes. They will receive the initial spike criticality incident
- 852 -

JAERI-Conf 2003-019
Table 2 Dose Equivalent to a Control Room Operator following each Type of Criticality Incident andOverall Mean Dose Equivalent for all Incident Types
Dose Equivalent to Dose Equivalent to Dose Equivalent to
Cell Operator who operator who remains operator who remainsevacuates quickly for diagnostic checks
(MSV) then evacuates (mSv) In control room (mSv)
Type I (Plateau) Criticality IncidentLow Active 5 10 58
Medium Active 2 4 23Highly Active 0.3 0.6 4
Dissolver 0.3 0.6 4Mean 2 4 22.2
Type 2 (Second Spike after an Hour)Low Active 29 29 58
Medium Active 12 12 23Highly Active 2 2 4
Dissolver 2 2 4Mean 11.1 11.1 22.2
Type 3 (Second Spike after minutes)Low Active 29 58 58
Medium Active 12 23 23Highly Active 2 4 4
Dissolver 2 4 4Mean 11.1 22.2 22.2
Type 4 (Single Spike)Low Active 58 58 58
Medium Active 23 23 23Highly Active 4 4 4
Dissolver 4 4 4Mean 22.2 22.2 22.2
Overall Mean for all 4 11.6 14.9 22.2types of incident
60 60
M LA Cell50 M NA Cell so 0 LA Cell
U) El HA Cell 0) El MA CellE40 40
ID Dissolvers El HA Cell
(030 - 30 UM Dissolvers2 >Cr
LU U1a)20 a) 2000
1 0 1 0
0 01Type Type 2 Type 3 Type 4 Type I Type 2 Type 3 Type 4
Fig. 6 Schematic of the dose equivalent to a Fig. 7 Schematic of the dose equivalent to acontrol room operator following a delayed control room operator following noevacuation for each type of criticality evacuation after each type of criticalityincident incident
853 -

JAERI-Conf 2003-019
6. Discussion and Conclusions reveals the incident to be genuine, then the areashould be completely evacuated.
Subject to the assumptions of the analysis, it Balancing control room risks is complex andis apparent from Table 2 that the average therefore this analysis has taken a pragmatic anddetriment to an operator who remains in the simplified approach. With the assumptionscontrol room to carry out diagnostic checks already discussed, the results indicate that thefollowing a criticality event (Operator differential risk between Operator Responses (1)Response2) is 3.3mSv when compared to an and 2) is very small. As the detriment associatedoperator who evacuates immediately (Operator with abandoning the control room is genuine, thisResponse 1). This is a relatively small dose allowed a new policy to be adopted whereby:equivalent and carries a stochastic risk of1.7 x 0-4 per criticality using a dose risk factor of * All but the most senior person present should0.05Sv.') Given the expected low frequency of evacuate the control room immediately uponcriticality incidents compared with false CIDAS hearing the CIDAS alarm.alarms, this low risk supports a recommendation * The remaining person carries outthat a minimum level of staff remain in the predetermined confirmatory checks. If thesecontrol room following an alarm to carry out a indicate definitely that the CIDAS alarm isquick deterministic check, provided there is a false, he/she remains in the control room tobenefit in them doing so (see below) and carry out normal supervisory tasks.provided the relevant staff are informed and give If it is not obvious from the confirmatoryconsent to the risk. checks that the alarm is false, then the
Subject to the assumptions of the analysis, it remaining person also evacuates the controlis also apparent from Table 2 that the average room.detriment to an operator who remains in thecontrol room indefinitely following a criticality This policy has now been incorporated intoincident (Operator Response 3 is I mSv emergency procedure adopted in the Magnoxcompared to an operator who evacuates Separation Plant to be used in the event of aimmediately (Operator Response 1). This is a CIDAS alarm.more significant dose equivalent (although stillrecognised as being small under emergency Acknowledgernentsconditions) and carries a stochastic risk of The authors wish to thank the Magnox5.5 x 10-4 per criticality, using a dose factor of Separation Plant control room operators for their0.05/Sv. ) valuable discussions and feedback following the
Before any additional risk can be sanctioned, criticality emergency exercise which initiated thisit is necessary to demonstrate that there is a analysis.benefit to be gained from doing so (under the 'AsLow As is Reasonably Practicable' or ALARP Referencesprinciple). In this case the benefit to be gained 1) PW Ball and EJ Polmear, "Radiologicalfrom not evacuating the control room, is that Accident Risk Criteria for Sellafieldshould the alarm prove to be false, control over Reprocessing Divisions and Drigg." BNFLthe plant will have been retained. Loss of control SSNSC 93) 09 1993).may have other detriments associated with it suchas potential environmental releases, increasedrisk of maloperations etc. Thus the competingissues of possible radioactive release into thepubic domain versus potential operator doseequivalent from a criticality incident must beconsidered. It should be noted that the majorityof CIDAS alarm occurrences prove to be false.
Under BNFL policy it is considered that asthe most rigorous precautions are taken to preventa criticality incident, even an excursion of thesize of the minimum incident of concer issymptomatic of a situation so abnormal andunpredictable that lives ought not to be stakedagainst the chance that a sizeable incident willnot follow. Thus in keeping with the existingstandard emergency response, if the CIDASalarm sounds and a quick diagnostic check
- 854 -

JAERI-Conf 2003-019 JP0450160
Present Status of Monte Carlo Seminar for Sub-criticality Safety Analysisin Japan
Kiyoshi SAKURAI*' and Ichiro NOJIRI2'Japan Atomic Energv Research Institute, Tokai-mura, Naka-gun, Ibaraki 39-1195, Japan
2Tokai Works, Japan Nuclear Cycle Development Institute, Tokai-mura, Naka-gun, Ibaraki 39-1194, Japan
This paper provides overview of the methods and results of a series of sub-criticalitysafety analysis seminars for nuclear fuel cycle facility with the Monte Carlo method held inJapan from July 2000 to July 2003. In these seminars, MCNP4C2 system (MS-DOSversion) was installed in note-type personal computers for participants. Fundamentaltheory of reactor physics and Monte Carlo simulation as well as the contents of the MCNPmanual were lectured. Effective neutron multiplication factors and neutron spectra werecalculated for some examples such as JCO deposit tank, JNC uranium solution storage tank,JNC plutonium solution storage tank and JAERI TCA core. Management for safety ofnuclear fuel cycle facilities was discussed in order to prevent criticality accidents in someof the seminars.
KEYWORDS. Monte Carlo, seminar, sub-criticality, nuclearfuel cyclefacility,MCNP-4C2, personal computer, JCO deposit tank, JNC uranium solution storage tank,JNCplutonlum solution storage tank, AERI TCA core
1. Introduction 2. Provision prior to Monte Carlo simulation
To promote the radiation transport calculation with 2.1 Basic theory for the Monte Carlo calculationthe Monte Carlo method in the field of the nuclear Before starting the Monte Carlo calculation,energy research, Monte Carlo seminars') have been following contents were lectured as a basic theory held since July 2000 at the Japan Atomic Energy (1) continuous energy Monte Carlo codes, 2) nuclearResearch Institute (JAERI). They are (1) data files, 3 point-wise neutron cross sectionfundamental theory seminars, 2) sub-criticality safety compilation systems, 4 multi-purpose point-wiseanalysis seminars for nuclear fuel cycle facilities, 3) neutron cross section libraries, (5) Monte Carloshielding safety analysis seminars, 4 neutron and simulation method, (6) evaluation for calculationphoton streaming safety analysis seminars and (5) results, 7 forward and adjoint integral emergenthigh energy shielding safety analysis seminars. In particle density equations, (8) pseudorandom number,each seminar, the maximum number of participants is (9) random walk, (10) variance reduction technique,limited to five aiming at man-to-man discussion, and (I 1) weight window method, 12) weight windowthe total lecture time is six hours. Participants to generator, 13) estimators, 14) MCNP4C inputthese seminars are engineers and researchers from manual, (15) calculation exsamples in the researchuniversities, research institutes and enterprises. field of criticality, shielding, reactor, exposure, fusion,
This paper provides overview of the methods and high energy and space.results of a series of sub-criticality safety analysisseminars for nuclear fuel cycle facility with the Monte 2.2 Installation of MCNP-4C2 system in each PCCarlo method held from July 2001 to July 2003. The dominant factor limiting the utilization of the
The objective of these seminars was a presentation Monte Carlo codes is complex installation procedure.of a reliable analysis method with the Monte Carlo To solve this problem, the following simplemethod for beginners by using note-type personal installation method was prepared for these seminars:computers (PCs). The MCNP4C2 MS-DOS version system was
As a continuous energy Monte Carlo code, the installed to each PC by using an auto-installer for theMCNP-4C2') MS-DOS version was used. Wl-NDOW'S-95,-98,-ME,-2000 and -XP.
Since the JCO criticality accident occurred in 30 The system consists of (1) compiled MCNP4C2Sept. 1999 at Tokai-mura in Japan, management for program, 2 cross section directory, 3 340 nucleisafety of nuclear fuel cycle facilities was discussed neutron cross section library edited from JENDL-3.2among the lecturer and participants in the seminars at 293K (:52OMeV) 4 thermal neutron scatteringin order to prevent criticality accident. table S( , 8 2), (5) photon interaction cross section
library (lkeV-l00GeV)2), (6) electron interactioncross section library (l0keV-100GeV)2), (7) MCNP
ConrTonding author, E-mail: sakumi�me1odytokaiJaeri.goJp sample inputs.
85 -

JAERI-Conf 2003-019
Data of 2) and 7) are card image, but other data 12.5cm, height 50cm and thickness 2.5mm, the kffare binary. As a result, the installed total memory was calculated. It is about 0.80, because the neutronsize is below 28OMbytes. This size is not large on leakage is increased on the model. This is a generalpresent PCs. Speeds of the used PC were fi7om idea of geometry management for sub-criticality in15OMHz to 2.3GHz. This speed is enough for nuclear fuel cycle facility. In these seminars, thesub-criticality safety analysis. condition for sub-criticality was considered in detail.
3. Sample calculation of kff and neutron spectrum 3.3 JNC uranium solution storage tank3.1 Sphere model The uranium solution storage tank at JNC Tokai
As a first step, the most simple calculation model reprocessing plant was modeled by SUS304L cylindersuitable for Monte Carlo beginners was provied. It is geometry with outer radius 115cm, height 120cm anda sphere with uranium and hydrogen mixture located wall thickness 5mm. The calculation condition isat coordinate XYZ origin. The radius is R Cm. The same as the JCO deposit tank. The kff and (D.,(E)density of the mixture is 18.7 g/CM3 . The atomic were calculated with solution surface levels from zerofraction is 0 I for hydrogen 0 I for uranium-23 5 and to 120cm. As a final step, when the tank was0.8 for uranium-238. Ctrum2) immersed for conservative evaluation, the kfr was
The point source with Watt-type neutron spe calculated.was set at coordinate XYZ origin. The neutron For all calculation conditions, the kfr is below 061.importance is I and -1 for the inside and outside of
the sphere, respectively. The a, of fight water 3.4 JNC plutonium solution storage tankwfth3OOK2)wasused. Theneutronnumberpercycleis The plutonium solution storage tank at NC Tokai1000 and the total cycle number is 110. But, 10 reprocessing plant was modeled by SUS304 hollowcycles were skipped for the eigenvalue calculation circle ring cylinder geometry with the fst wall outer(effective neutron multiplication factor kF) with the radius 245.5cm, the second wall outer radius 235cm,covariance-weighted combined estimator that height 240cm and wall thickness 5mm. The outsideconsisted of collision estimators, absorption of No.2 wall is covered with cadmium plate withestimators and track-length estimator(TLE)2). thickness Imm. The calculation condition is same as
Then, the critical radius R, was calculated, and the the JCO deposit tank except for the parameter of
average neutron spectrum(D.,(E) of the inside of the Watt-type neutron spectnim. The kff and (D.ve(E)sphere was also calculated with the TLE. were calculated with solution surface levels from zero
There were calculated with the different atomic to 240cm. As a final step, when the tank wasfraction of hydrogen, and the each (D ... (E) was immersed for conservative evaluation, the kff wascompared with Watt-type neutron spectrum. calculated.
The R, and ) ,e(E) were also calculated on For all calculation conditions, the kff is below 082.
condition with beryllium reflector of thickness 5cm.Then, Sa,3) of beryllium metal with 30OK2) was also 3,5 JAERI TCA benchmark experiment coreused. JAERI TCA is a light water critical assembly with
light water ftiel rod array4). Fuel rod pitch is
3.2 JCO deposit tank 1.956cm. In this seminar, the information of 18 X18The JCO deposit tank was modeled by SUS304L square array core was used. The MCNP input is
cylinder geometry with outer radius 25cm, height not here, because of very complex description. It is50cm and wall thickness 2.5mm shown in Ref.5. The volume source with Watt-type
The volume source with Watt-type neutron neutron spectrum was set in all ftiel pellets. ThespectruM2) was set in uranium solution. The neutron critical water level is 75.Ocm. The keff wereimportance is I and -1 for the inside and outside of calculated with water levels from zero to 75.Ocm.
the tank, respectively. The a, of light water with The(D.,(E) in the pellet, cladding and water were300K 2) was used The neutron number per cycle is also calculated at the different core positions.
1000 and the total cycle number is I 0. But, 10 4. Discussion
cycles are skipped for the kff. 4.113iscussion on credibility of Monte Carlo cal.As well as the above sphere model, the kff was Recently, PCs have been used in many scientific
calculated, and the 4) ... (E) in the uranium solution and fields. The WINDOW'S is an excellent operationtank wall was also calculated with TLE. There were software. PCs with the WNDOW'S are suitable forcalculated on the condition with different solution the Monte Carlo calculation because of simplesurface levels from zero to critical solution level. operation by using the WINDOW'S, high speed
As a final step, water jacket was modeled for strict (2GHz) and large memory capacity(IOGbytes). Ifcalculation. installation of MCNP system is simple and easy by
When the uranium solution with critical condition use of an auto-installer and CD package, the Montewas put in SUS304L cylinder tank with outer radius Carlo method come into wide use in nuclear energy
- 856 -

JAERT-Conf 2003-019
research. For the seminars, one-touch installation 4.2 Discussion to prevent citicality accidentsmethod within one minute is prepared by using simple The criticality accident occurs by many flictors.program, CD package and an auto-installer for Representative tors are the ethics of the management policyWfNDOW'S-95,-98 -ME, 2000, -XP. the ethics of the employees, the engineering aity of
The CPU time is shorter than five minutes with engineers and the knowledge and aftention of workers in the100,000 histories for the sphere model, the JOC plant Engineers and workers of the enterprise will not do todeposit tank, the INC uranium solution storage tank mistake such as the estimation of the sub-criticality at least, ifand the NC plutonium solution storage tank, and they are able to carry out freely the Monte Carloabout 30 minutes for JAERI TCA. Benchmark calculation wh the note-type PC. We believe that it wasexperiment core. able to prevent the JCO criticality acident, if these serninars
The kff ± Akff of the JAERI TCA benchmark were carried Ott for the persons concerned of the nuclear fuelexperiment core with a critical condition is 100238 cycle facilities fi-orn before ofthe JCO criticality ccident
± 0.00088 by using the pointwise neutron crosssection library edited from JENDL-3.2. The Referencesaccuracy and precision are acceptable enough. - 1) A. Sakurai, et al., "Contribution to the Monte
For JAERI TCA cores, sub-criticality evaluated Carlo Seminars," Trans. At. Energy Soc. Japan, 2,with the exponential experiment and the Monte Carlo 196 (2003)(in Japanese).calculation was compared for range from 063 to just 2) F-Briesmeister, Ed., MCNP-A General Monteunder critical ity6). The C/E's are 0985 for Carlo N-Particle Transport Code Version 4C,"sub-criticality 063 andl.004 forjust under criticality. LA-12645(2000).
However, for the uranium solution and the 3) H.G.Hughes, et al., "Status of the MCNPTm/plutonium solution, deep sub-criticality data from 065 LCSTM Merger Project, LA-UR-98-559(1998).to 090 with the some experimental method did not 4) H-Tsuruta, et al., "Critical Sizes of Light-Waterexist. Therefore, the accuracy evaluation method of Moderated U02 and PuO2-UO2 Lattices,"the deep sub-criticality with the Monte Carlo method JAERI 1254(1977).for the JCO deposit tank, JNC uranium solution 5) K.Sakurai, et al., Estimation of Sub-criticalitystorage tank and the JNC plutonium solution storage with the Computed Values II JAERI I -Res.tank is not established in the world yet. But, the 96-008(1996)(in Japanese).realistic estimation is possible on comparison with the 6) K.Sakurai and T.Yamamoto, "Comparison ofJAERI TCA results 6). Sub-criticality Evaluated with Exponential
For this reason, the result of the Monte Carlo Experiment and Monte Carlo Calculation,"calculation is reliable. The Monte Carlo Method is J.At.Enegy Soc. Japan, 4 304(1998)(in Japanese).applicable with high reliability to sub-criticality safetyanalysis of nuclear fuel cycle facility.
857 -

JAERI - Conf 2003 - 019 JP0450161
Study on the Detection of the Criticality Accident Alarm Systemsand Area Monitors
Yoshio SHIMIZU*, Tsutomu OKA
Tokai works, Japan Nuclear Cycle Development Institute JNQ, Tokai-mura, Naka-gun, Ibaraki, 319-1194, JAPAN
Criticality Accident Alarm Systems (CASs) are important for the rapid evacuation and the reductionof the operators' exposure. Though some methods shown in ANSI/ANS-8.3 etc., the relation btweenfissions and dose were evaluated for some source materials and shields under criticality accident. Theconnection of the criticality calculation for the decision of the source spectrum and the shieldingcalculation for the evaluation of the dose at the detectors were executed. MCNP4C and ENDF/B-VIcross-section library were used for criticality calculation and ANISN and DLC-23E cross-section librarywere used for shielding calculation. As the sources of the criticality accident, the uranyl nitrate solution,plutonium nitrate solution, and PU02 powder were considered. The concrete and iron were considered forthe shielding material of the facilities. The distance from the accident points to the detectors of CAS wasconstant for simplification. The possibility of the detection of the CAS and area monitors was studiednumerically. The effectiveness of area monitors for the detection of the slow excursion was alsoevaluated numerically.
KEYWORDS: CriticaftlyAccident, Criticality AccidentAlarm System (CAS), Area MonitorDetection, MCNP4, A NISN
1. Introduction appears many times on normal operation.On the other hand, DOE Order 420. 1 A (4) said "To
Criticality Accident Alarm Systems (CAS) are aid in protecting workers against the consequences ofimportant for the rapid evacuation and the reduction slow criticality accidents in facilities where analysisof the operators' exposure. The examples of the has shown that slow criticality accidents are credible,detector placement are shown in ANSI/ANS-8.3(') CASs should be supplemented by warning devicesAppendix and the closely handling cases (ex. glove such as audible personnel dosimeters (e.g., pocketbox etc.) were considered. When the nuclear materials chirpers/flashers, or their equivalents), area radiationare treated in the cell, it is also necessary to consider monitors, area dosimeters, or integrating CASs."the placement of CAS for the facilities design. The There are usually many area monitors in thesimple equations, which were originated by the nuclear facilities and the possibility of the detection ofcriticality accidents or experiments, have been used the slow delayed criticality accident is likely. Thefor the decision of the placement. The detection of the supports of the neutron or gamma-ray area monitorsCAS, however, depends on the neutron/gamma-ray were also considered about its effectiveness for(n/y) ratio, the energy spectrum etc. It is also related to detection of the slow excursion.the physical and chemical conditions of the nuclear In this report, the effectiveness of area monitorsmaterials and the shielding material of the facility. for the detection of the slow excursion was studied
ICRP recommendation (2) says that dose limit for numerically.the workers, should be 2mSv/year (averaged by year) for radiation protection. The detection of a 2. Purposeprompt criticality accident is generally easier than a
slow excursion by CAS. When a slow excursion The purpose of this study were as follows;occurs, operators may expose more than 2mSv (1) The possibility of the detecton by CASs forbefore the CAS have detected it. various condition was studied numerially, without
The report 3) indicated that the accident, which large radiation exposure. The detection absorbedintegrated doses may excess to OmGy at 2m from dose for the directly operation was OmGy at mthe source, may not be detected by criticality accident from source according to ANSFANS-8.3 and thealarm detectors. If the detection level is set lower, dose with shield was 20 rnSv at the outside surfaceCAS will be able to detect the slow excursion. It is of the shield.problem that single failure caused b (2) The effectiveness of the detection by area monitor
*CorrespondingauthorTel. 81-29-282-1111, Fax. ;+81-29-282-96i9, E-maii: shimizu�tokaijnc.gojp
- 85 -

JAERI-Conf 2003-019
for slow excursion was studied numerically. The For the evaluation of the detection of the CAS anddetection dose for slow excursion was mSv at Area monitor, the only prompt neutron and gamma,2m from source or at the outside surface of the which were obtained by criticality calculation, wereshield. considered. The evaluation of the radiation exposure,
prompt neutron, prompt gamma, and the gamma from3. Evaluation Method short-lived fission products (10) were considered.
The connection of the criticality calculation for the 3.2 Shielding Calculationdecision of the leakage spectrum and the ratio, and the The calculation model is one dimensional sphereshielding calculation for the evaluation of the dose at model and the outside of the shield 5m. from sourcethe detectors were executed. MCNP4C(5) and center. The source was set in the small void region.ENDF/B-VI cross-section library were used for The cross section libraries are DLC23E.criticality calculation and ANISN (6) and DLC-23E (7)
cross-section library were used for shielding 3.2.1 Shielding Materialscalculation. Calculation flow is shown in Fig. . The concrete (25cm, 50cm, 100cm and 150 cm)
This evaluation method was compared with the and iron (10cm, 20cin and 30cm) were considered forNuclear Criticality Slide Rule(g) about prompt neutron the shielding material of the facilities. Concreteand gamma-ray and the results were corresponded(9). density was 23 g/CM3 and iron's was 787 g/CM3 11).
ri cality Calculatio 3.2.2 Dose Conversion Factors
- MCNP4C-ENDF/B-VI Three conversion factors were considered as- keff is about I without reflector follows;- Leakage spectrum and ratio from source materials- Fission rate, Mean v (1) The dose for average soft tissue of adult in ICRU
CShielding Calculatio 33 (12),(13) was applied to the detector of CAS and
-ANLSN-DLC23E radiation dose when rapid fission spike.- Sphere model, Small void volume source (2) The effective dose, AP (Anterior-Posterior)-Concete: 25, 50, 100, 150crn direction to the Anthropomorphic Phantom in- Iron: 10, 20, 30 cm ICRP pub.74( 14) was applied to the dose for
Fig.1 Calculation Flow personnel for slow excursion and outside of
shields. This conversion factor has been adopted3.1 Criticality Calculation for Source Spectrum by the Japanese law.
and Strength (3) The lcm depth equivalent dose (15) was applied toAs the sources of the criticality accident, the the area monitor because of its response fariction.
uranyl nitrate solution (enrichment: 4, WOOL,
54O.OgU/L), 30L plutonium nitrate solution [1] ('"Pu: 4. Results and Precondition for the Study24Op = 95: 5, 40.OgPu/L), 300L plutonium nitrate
solution 2 239pU: 24OpU = 95: 5, 1 .OgPu/L) and The evaluation results are shown in Table 3 to PU02 powder (I 146 g/CM3 , 28.2 kgPu, 0.0 water (unmodereted system) and 6 to 9 (solution systems),content) were considered. kff of each case is about I under the precondition as below;without reflector.
In MCNP criticality calculation, tallies were (1) The position of CAS was 10 in from the sourcenormalized by one fission neutron. Mean v of each center and its detection level was set in 20 mGy/h.source was evaluated in Table 1. The source strength In this report the gamma rate meter was onlyfor I fission was given as follows; considered.
(2) The positions of area monitor were 10 and 20 nSource Strength for fission=F1 Tally value Mean from source center and the alarm set to trip 0V pSv/h.
(3) About the radiation exposure for personnel, tissueTable I Mean v for Each Source dose was 200 mGy at the 2m from source center.
Criticality s urce System Mean v The effective dose was 20 mSv for the outsideUranyl Nitrate Solution 2.44 surface of the shield (at 5m) for fission spike of a
Pu Nitrate Solution 1] 2.88 criticality accident or a slow excursion.Pu Nitrate Solution 2] 2.87 (4) the shielding condition of CAS, area monitor and
PU02 Powder 3.13 radiation exposure were same.(5) The dose evaluation point for the directly
- 859 -

JAERI --Conf 2003 - 019
operation was 2m from source center. The doseevaluation point with shield was at 5m from 4.3 Slow Excursion for moderated Systemsource center, ie. the outside surface of the As a slow excursion, doubling time was 18 [s] and
(16)shielding materials. fission rate became 10 times for 60 seconds . the(6) Minimum dose for detection considered in this integral of the fissions from t to t60 [s] was 09 times
report shown in Table 2 the fissions of the detection dose for the considerationof exposure before t [s]. The example for the 1.5E+15
Table 2 Minimum dose for detection fissions was shown in Fig. 2.Fission Spike Slow Excursion If this agnitude were equivalent 200 Gy,
Without With Without Wi th 5.7E+12 fissions/sec at I [s] should be detected forShield" Shield" Shield*' Shield*' reducing the personnels radiation exposure.
Unmoderated 200 mGy 20 mSv Slow excursion was considered for only moderatedSystem systems.
Moderated 200 mGy 20 mSv 20 mSv 20 mSvSystem I I [fissions/see]
*I at m *2 At 5m, the outside surface of shield � L
(7) In this report, three solution source were 5.7 E13 ........................
considered, for the effect of self-shielding ofsource materials and mean v, the dose of 30 Lplutonium nitrate solution 1] systems were thelargest and 1000L uranyl nitrate solution systemswere the smallest. In this study, the 30L plutoniumnitrate solution [1] resutls applied to the fissionsestimation for the dose, and 1000L uranyl nitrate 15solution results applied to the fission rateestimation for the detection CASs and area 5.7 E12 t+ time [s]
monitors. Fig. 2 Relation of the total fission and fissions rate
for the slow excursion (example)
4.1 Fission Spike for Unmoderated System 5. ConclusionThe evaluation results are sown in Table 3 to 5.1 Unmoderated System
(unniodereted system). The unmoderated system of the condition in thisFor urnmoderated System, it is assumed the fission report was P02 powder. From Table 3 to 5, CAS was
spike was within 0.5 [S](16). able to detect criticality accident for every case.
4.2 Fission Spike for moderated system 5.2 Moderated Sysyem for Fission SpikeThe evaluation results are shown in Table 6,to 9 From Table 6 and 9 CAS was able to detect
(solution systems). criticality accident for no shield and concrete sield.The spike peak power was estimated by the For iron shield, in Table 9 was difficult to detect as
equation of report ( 7 fr mo 'derated system. expected.There were the relation between F [fissions] and P
[fissions/sec] as follows; 5.3 Moderated Sysyem for Slow Excursion
From table 7 to 9 CAS was not able to detect((o/2) F [fissions]=P[fissions/sec] criticality accident at I [s] and area monitors are
effective. Both neutron and garnma area monitors foro) was Inverse Period. F [fissions] was the no shield or concrete shield were effective. The
magnitute of minimum criticality accident for effectiveness of neutron area monitors for iron shielddetection by the dose evaluation. The was 0.1 as were evaluated numerically. After the alarm of areaconservative value referred to CRAC experiments monitor turn on, personnel evacuated within I minute,In addition, mnimum fission rates of 30L plutonium they have less than 20 rSv radiation exposure.nitrate solution estimated from Nomura's formula was
estimated 2.46E+14 [fissions/sec] for co = 0. 1. These considerations will be able to be applied toOn the other hand, in Table 3 the spike peak the design of nuclear fuel cycle facilities although
power for 200 rnGy at 2m and - 01 was 7.7E+13 actual facilities' conditions (the distance from the[fissions/sec]. Therefore, the spike peak power was accident points to the detectors, shielding thicknessconservative. etc.) arc more complex, ad expect to more rational
- 860 -

JAERl-Conf 2003-019
design. (I 1) K. Koyama, Y. Okumura, K. Furuta and S.REFERENCE Miyasaka, "Multi-Group Cross Section Sets for(1) ANSI/ANS-8.3, "Criticality Accident Alarm Shield Materials -100 Neutron Groups and 20
System," 1997) Gamma-ray Groups in P5 Approximation(2) ICRP Publication 60 1990 Recommendation of JAERI-M 6928 1977) (in Japanese)
the International Commission on Radiological (12) "Photon, Electron, Proton and NeutronProtection,"AnnalsoftheICRP 21,No.1-3 Interaction Data for Body Tissues," ICRU Report
(3) F. Y. Barbry, "Exposure Risks and Intervention 46 1992)Possibilities in Solution Criticality Accidents," (13) Hubbell, J. H., "Photon Mass Attenuation andTrans. A. N. S. 63 199 1) Energy-Absorption Coefficients from I keV to 20
(4) DOE 0 42OAA, "FACILITY SAFETY," MeV" Int. J. Appl. Radiat. Isot. 33, 269-1290.(Approved: 05-20-02) (1982)
(5) Judith F. Briesmeister, Ed., "MCNP -A General (14) ICRP Publication 74,"Conversion CoefficientsMonte Carlo N-Particle Transport Code, Version for use in Radiological Protection against External4C," LA-13709-M(2000) Radiation," Annals of the ICRP, 26, No.3/4
(6) W. A. Engle Jr. "A User's Manual for ANSN A (1996)One-Dimensional Discrete Ordinate Transport (15) 1CRP Publication 51,"Data for Use in ProtectionCode with Anisotropic Scattering," K1693 1967) Against External Radiation," Annals of the ICRP,
(7) "CASK 40 Group Coupled Neutron and 17, No.2/3 1987)Gamma-Ray Cross Section Data," (16) H. J. Delafield and J. J. Clifton, "Design CriteriaORNLIDLC-23E (I 973) and Principles for Criticality Detection and Alarm
(8) B. L. Broadhead, et al., "An Updated Nuclear Systems," SRD R 309 1984)Criticality Slide Rule," NUREGICR-6504 1997) (I 7 Y. Nomura, "Theoretical Derivation of Simplified
(9) Y. Shimizu and T. Oka "Comparison of the Dose Evaluation Models for the First Peak of aEvaluation Methods for Criticality Accident," Criticality Accident in Nuclear Fuel Solution,"Proceeding of the 2nd iTRS International Nucl. Tech. Vol. 131, 12-21 (2600)Symposium On Radiation Safety and Detection (I 8) P. Lecorche and R. Seale, "A Review of theTechnology (ISORD-2) on July 24 25 2003 Experiments Performed to Determine the
(IO) E.P.Blizard Ed., "Reactor Handbook 2nd Edition, Radiological Consequences of a CriticalityVolume III Part B Shielding," John Wiley Sons Accident," YCDC-12 1973)New York 1962)
Table 3 Unnioderated Sy em (1102) Without Shield2OOmGy at m 2rnGy, 0.5 Is] Detectable.1
Detectable! fissions/sec by Detectable fissions/sec byfrom source Spike Peak fissions/sec by Area Monitor at I Om'2 Area Monitor at 2M'2
center Power CAS at 10mIfNeutron Gamma-ray Neutron Gamma-ray
[fissions] [fissions/seci [fissions/see] Issions/sec I [fissions/secl fissions/secl [fissions/
No shield 1.6E+15 3.1E+15 -F 1.9E+12 2.5E+08 4.5E+10 9.6E+08 1.8E+11
*I Detection level 20 mGy/h, 2 the values of area monitor for reference
Table 4 Unmod rated Syste (PuO2) with Concrete Shield
Concrete 2OmSv at 5m'l 20rnSv, 0.5 s] Detectable'2 Detectable fissions/sec by Detectable fissions/sec byThickness from source Spike Peak fissions/see by Area Monitor at I Orn" Area Monitor at 20m'3
center Power CAS at 10m
[cm] [fissions] [fissions/secl [fissions/seci Neutron Gamma-ray Neutron Gamma-ray[fissions/sec] [fissions/secl [fissions/secl
25.0 3.OE+14 6.IE+14 1.8E+12 1.2E+09 4.3E+10 4.8E+09 1.8E+1 1
50.0 2.OE+15 4.IE+15 3.lE+12 8.6E+09 7.6E+10 3.5E+10 3.2E I I
100.0 8.5E+16 1.7E+17 3.6E+13 4.7E+ I I 8.8E+ I I 1.9E+12 3.6E 1 2
150.0 3.IE+18 6.lE+18 6.8E+14 2.7E+13 I 1.7E+13 LIE+14 I 6.9E+ 1 3
*1 Theoutsidesurfaccoftheshield,*2Detectionlevel:2.OmGy/h,*3thevaluesofareamonitorforreference
- 861 -

JAERI-Conf 2003-019
Table5 Unm deratedSystem(PU02)withlronShield2OmSv at 5m" 2OmSv, 0.5 [s] Detectable '2Iron Detectable fissions/sec by Detectable fissions/sec by
Thickness from source Spike Peak fissions/sec by Area Monitor at IOM'3 Area Monitor at 20m'3center Power CAS at 10m
Neutron Gamma-ray Neutron Gamma-ray[cm] [fissions] [fissions/sec] [fissions/see] [fissions/sec] [fissions/secl [fissions/secl [fissions/secl
10.0 I.OE+14 2.OE+14 6.2E+12 3.4E+08 I.5E+ I I 1.4E+09 6.2E I
20.0 1.8E+14 3.5E+14 I.IE+13 5.8E+08 2.713+11 2.3E+09 LIE+12
30.0 3.313+14 6.5E+14 1.6E+13 I.OE+09 4.OE I 4. 1 E+09 1.7E+12
*I The outside surface of the shield, 2 Detection level: 20 mGy/h, 3 the values of area monitor for reference
Table 6 Moderated Sys em without Shield, for Fission Spike
2OOmGy at 2OOmGy, co=O 2OmSv, for slow De.tectable" Detectable fissions/see by Detectable fissions/sec By2m from .1 Spike Peak excursion at t . Uions/sec by Area Monitor at I Om Area Monitor at 20m
source center" Power" CAS at I.Om
[fissions] Ifissions/secl [fissions/sec) [fissions/sec] Neutron Gamma-ray Neutron Gamma-ray_ _ELs�ns/sccl [fissions/se [fissions/secl
No shield I 1.5E+15 I 7.7E+13 1.6E+12 I 4.6E+09 3.8E+10 I 3.8E I 0*1 The minimum number of fission during the first peak power of 30 [L] was estimated 4.92E+15[fissions], and minimumfission rates fbrco=O.I was estimated 2.46E+14 [fissions/sl with theNomura's formula.*2 t was shown in Fig 4 1, 3 Detection level 20 mGy/h
Table 7 Moderated Syst m without Shield, for Slow Excursion
2OmSv, at m 2OmSv, 0=O I 20mSv, for so DejeCjabje'2 Detectable fissions/sec Detectable flssions/secfrom source Spike Peak excursion at t 7, fissionsIsec by by Area Monitor at 10m by Area Monitor at 20m
center Power CAS at OM
[fissions] [fissions/sec] [ssions/sec] LOssionsIseel Neutron Gamma-ray Neutron Gamma-rayIfissions/secl Ifissions/seel rissions/seel ifissions/secl
No shield 3.4E 3 I.3E+11 I 1.6E+12 4.6E+09 3.8E+10 I 1.8E+10 1.5E+11*I t was shown in Fig4. 1, 2 Detection level: 20 mGy/h
Table 8 Moderat System with Concrete Shield
Concrete 2OmSv, at 2OmSv, to=0.1 20mSv, for slow Detectable" Detectable fissions/sec Detectable fissions/secThickness 5m" from Spike Peak excursion at t *2 fissions/sec by byAreaMonitoratlOm byAreaMonitoratUmi
source center Power CASatlOmNeutron Gamma-ray Neutron Gamma-ray
[cm] [fissions] Ifissions/seel [fissions/secl Ifissions/sec] [fissions/seci Ifissions/seel fissions/secl
25.0 ,7.2E+14 3.6E+13 2.7E+ 2 6.8E+12 2.1E+1O 1.6E+11 8.5E+10 6.71E+1150.0 4.6E 1 5 2.3E+14 1.8E+13 2.6E+13 1.5E+11 6.3E+11 6.0E+11 2.6E+12100.0 1.9E 7 1.9E+15 7.IE+14 4.6E+14 7.8E+ 2 LIE+13 3.2E+13 4.6E+13150.0 6.5E+18 3.3E+17 2.5E+16 9.2E+15 4.3E+14 2.2E+14 1.7E+15 9.3E+14
*I The outside surface of the shield, 2 t was shown in Fig4. 1, 3 Detection level: 20 mGy/h
Table 9 Moderated System ith Iron Shield
Iron 2OmSv, at 2OmSv, o=O.l 2OmSv, for slow Detectable" Detectable fissions/sec Detectable fissions/secThickness 5m" from Spike Peak excursion at 2 S/sec by byAreaMonitoratlOm byAreaMonitorat2Om
source center Power t 1 Om
[cm] [fissions] [fissions/secl [fissions/sec] [fissions/see] Neutron Gamma-ray Neutron Gamma-ray1fissions/secl 1fissions/seel [rissions/secl Ifissions/seel
10.0 2.7E+14 1.3E+13 LOE+12 1.5E+13 6.4E+09 3.6E+ll 2.6E+10 1.5E+120.0 4.9E 4 2.4E+13 1.9E+12 9.3E+ 1 3 LIE+10 2.2E+12 4.4E+10 9.4E+1230.0 9.OE+14 4.5E+13 3.4E+12 2.4E+14 2.OE+10 5.9E+12 7.9E+10 2.5E+13
I The outside surface of the shield, 2 t was shown in Fig4. 1, 3 Detection level: 20 mGy/h
- 862 -

JAERI - Conf 2003 - 019
SPECIAL SESSION
POST IRRADIATION EXAMINATION

This is a blank page.

JAERI-Conf 2003-019 JP0450162
The French Post Irradiation Examination Databasefor the validation of depletion calculation tools
I36n6dicte ROQUE", Pierre MARIMBEAU', Philippe BIOUX2, Hervd TOUBON 3 and Lucien DAUDIN4'CEAIDENIDERISPRC, CE Cadarache F13108 St Paul-Lez-Durance Cedex, France
2ED, R&D, 1, avenue du General de Gaulle, B.P. 408, 92141 Clamart, France3AREVAICOGEMA, 2 rue Paul Dautier, BP4, -78141 Velizy Cedex, France
4FRAMATOME-ANP, Tour Framatome, F-92084 Paris La De/ense Cedex 16, France
This paper presents the experimental programmes conducted in France by the Commissariat � I'EnergieAtornique (CEA) in order to validate spent fuel inventory calculations fr core studies as well as fuel cyclestudies. This large experimental programme was obtained in collaboration with our French partners, Electricit6de France (EDF), FRAMATOME-ANP and COGEMA. The experimental data are based on chemical analysismeasurements from fuel rod cuts irradiated in French reactors for PWR-UOx and Mx fuels, then dissolved inCEA laboratories, and from full assembly dissolutions at the COGEMA/La Hague reprocessing plants for UOxfuels. This enables us to cover a large range of UOx fuels with various enrichments in 231 U 31% to 45%,associated with burnups from 10 GWd/t to 60 GWd/t. Recently, Mx fuels have also been investigated, with aninitial Pu amount in the central zone of 56 and a maximum burnup of 45 GWd/t. Uranium, Plutonium,Americium, Curium isotopes and some fission products were analysed. Furthermore, Fission Products involvedin Burn up Credit studies were measured.
The experimental database contains also data for Boiling Water Reactor (BWR) with irradiated samples ofBWR 9X9 and full BWR assemblies dissolutions. Furthermore some data exist for Fast Breeder Reactor (FBR)with small samples irradiated in the PHENIX reactor.
An overview of ongoing programmes is also presented.
KEYWORDS: Experimental database, PIE, spentfuel, UOx, MOx, PWR, BWg BR
1. Introduction We describe here the experimental programmes
In order to validate French neutronic codes for fuel carried out on irradiated UOX and Mx PWR fuelsinventory calculations, a large experimental and used currently for code system validation.programme based on spent fuel chemical analysis has The experimental information can be classifiedbeen caff ied out in France since 1993. into two groups
Uranium, plutonium, neptunium, americium and - small fuel pin samples, irradiated in Frenchcurium isotopes as well as some caesium and reactors, with positions in the assembly wellneodyinium isotopes have been analysed in PWR and characterized. The analysed samples are obtainedBWR samples. Furthermore the 15 fission products from cuts of extracted pins. In order to investigateused in Burnup Credit (BUC) criticality calculations the local irradiation effect, various axial locations ofhave been measured for this two types of reactor. The cuts are selected with always a sample cut in theavailable experimental information consists of middle of the pin (height = 1900 mm). These time-chemical assays from fuel rod cuts irradiated in consuming and expensive experiments provide veryreactors and of solution samples derived from full accurate results for a limited number of samples.assembly dissolutions at the COGEMA/La Hague - dissolution aliquots of entire assembly setsreprocessing plants. obtained from reprocessing plant (COGEMA/La
For Fast Breeder Reactor the database contains Hague). A lot of these measurements have beenalso the results of measurements of actinide samples performed. However the irradiation histories of thetransmutation made in the PROFIL and TRAPU assemblies are not very well known and the fact thatirradiation programme in the PHENIX reactor. dissolutions are performed over batches of several
assemblies limits the usefulness of these data for
This paper describes this large experimental code validation. This type of data is neverthelessdatabase, provides some comments on chemical used to extend the validation range in a statisticalprocess and an overview of ongoing programmes. sense.
2.1 The UOx fuels experimental database
2. The experimental database of irradiated PWR Four main programmes related to UOx fuelfuels samples are used for the experimental validation of
Benedicte ROQUE, Tl.33-4-42-25-36-48, Fax. 33-4-42-25-79-79, E-mail: benedicte.roque�cea.fr
- 865 -

JAERI-Conf 2003-019
actinides and fission products inventory " 1,1,4) . They The initial U02 fuel enrichment is 45%.are named: BUGEY3, FESSENHEIM 11, This experimental programme on a 900 MWeGRAVELINES, and CRUAS. PWR is the most important being carried out in France
up to now.The experimental programme derived from the Two assemblies named FF06E2BV and
BUGEY3 reactor was the first representative of the FF06E3BV containing each 20 removable fuel pinsFrench nuclear power reactors. It involves standard were irradiated for 4 cycles in the Gravelines 3 reactorPWR fuel, the assembly consists of 17X17 pins clad then in the Gravelines 2 reactor for the fifth cycle. Onin zircaloy 4 The programme covers two assemblies these twenty pins, for the FF06E2BV assembly, 2 pinswith removable pins. One assembly, with 21% initial were extracted at the end of te second cycle of theenrichment was irradiated for the start cycle, the other reactor, one pin at the end of the 3rd cycle and twowith 31% enrichment was irradiated for 3 cycles. The pins at the end at the fourth cycle but only one wasmaximum burnup in this programme is 40 GWd/t. analysed. For the FF06E3BV, two fuel rods have been
The FESSENHEIM 11 programme 4 and cycle extracted after fourth cycles, one was analysed, then 4irradiations) allows the study of UOx fuel with higher pins were extracted after the fifth cycle, three were
burnup than in BUGEY3. Using an U02 fuel with an analysed.enrichment of 3 1% 235U, samples with burnup in the Figures and 2 show that we have prioritised the45 GWd/t to 60 GWd/t range were analysed. Among choice of pins located at the corner of a guide tubethe extracted fuel pins, the following ones have been (filled with water the most part of the irradiation),selected four pins from the FEC57 assembly after position more representative of an "asymptotic" pin four cycles of irradiation and one pin from the FEC52 however a fuel pin with irradiation cycles wasassembly after cycles selected facing a guide tube.
The programme performed with the fuel The CRUAS programme is devoted to theoriginating from the GRAVELINES reactor is validation of the URE (Reprocessed Uranium) fuel,
ing reprocessed then enriched uranium. It permitsdevoted to the validation of the calculation schemes us e 236Uvalidation of th capture cross-section. This
for high burnup fuel and high cycle length operation. programme is characterized by a 3.5 % 235U
enrichment with an initial amount of 12% of 26U.
777M
3
2 5
5
EM 5- - -----------
2 4- 777
limit- - -
Fig.1 Extracted rods in the FF06E2BV assemblyafter 2 3 and 4 irradiation cycles Fig.2 Extracted rods in the FF06E3BV assembly
after 5 irradiation cycles
From full assembly dissolutions at COGEMA/La assemblies, therefore we must select sets with veryHague reprocessing plants, we get uranium and close irradiation histories and burnups.plutonium chemical analyses. The involvedassemblies are 900 MWe 17X17 PWR with 31%,3.25% or 345% enrichments and with burnupsbetween 25 to 45 GWd/t. One can notice that thedissolution process involves batches of several
- 866 -

JAERI-Conf 2003-019
2.2 The MOx fuels experimental database zone is characterized by a high Pu content 5.6%) andCurrently, in France, twenty-four 900 MWe PWRs the peripheral zone by a small Pu content 2.9%).
are devoted to the Pu recycling in 30% mixed core Two Mx fuel assemblies were selected for theloading. This increase of French MOX fuel cycle SLB1 programme. The extracted and analysed Mxemphasizes the need for enlarge the experimental rods were irradiated for 1 2 and 3 cycles, withdatabase to plutonium-fuclled assemblies. burnups ranging from about 10 GWd/t to 45 GWd/t.
The experimental PIE programme devoted to MOxfuels is described hereafter. Figure 3 shows the position of the rods extracted
from the Mx assembly. The associated numberThe first French reactor using Mx assemblies is indicates the irradiation cycle length (the rods
the so-called SAINT-LAURENT reactor. The PIE extracted after I cycle comes from another assemblyanalyses are carried out on fuel cuts coming from this but for simplification we put them on the same figure).reactor 45). On this figure, we represent the Mx surrounded by
UOx assemblies, in order to point out that in theThe standard Mx assemblies, used in Saint- neutronic calculation this environment must be
Laurent 131 include three zones with different modelized to represent the thermal neutron currentplutonium enrichments to flatten the within assembly from the UOx toward the Mx assembly.power distribution and to attenuate fission ratediscontinuities at the MOx-UOX interface. The central
9N"
M
2
34
5
6
7
8
9
10
1
1 213 21",
16
1 7
0 P 0 N M L K J I H G F E D C A
MOX rods small Pu content
MOX rods intermediate Pu content
MOX rods high Pu content
U02 fuel rods (3.25w/o U-235/1.1 Enrichment)
Fig. 3 Position of the rods extracted from the Mx assembly (SLB1 programme)
The extraction and analysis of Mx pins fom te validation for the first fuel pins irradiated for 4 cycles.reactor GRAVELINES 4 enables us to have a We dispose of analyses for two fuel rods extracted
- 867 -

JAERI-Conf 2003-019
after 3 et 4 cycles in two different assemblies. The
central zone is characterized by a high Pu content of NUA = Major Actinides : 234 U, 235 U, 236u, 238PU, 239pU,
6.0% and the peripheral zone by a Pu content of 3.1%- 24OpU, 241PU, 242PU
MA = Minor Actinides 237 Np, 241AM, 242M Am,Table 1 summarises the various programmes for 243,4jn, 243CM, 244cM, 245cM, 246CM, 247CM
PWR UOx and Mx fuel all these programmes are BUC = B-nup Credit 147sM, 149sru, 150sM, 151SM,
completed. The chemical analyses performed for each 152SM, 95Mo, 99Tc, 101 Ru, 03 Rh, 153 Eu, 19Ag, 155Gdprogramme are also indicated. Uranium, plutonium, (plus 155 Eu, 154 Eu and 114 Gd to check 155 Gd build up)americium and curium nuclides are always analysed. Nd : neodymium isotopes :143 Nd, 144 Nd, 145Nd, 146 Nd,Additionally for a few experiments (BUGEY, 148Nd, 15ONdGRAVELINES and Saint Laurent 131) fission product Cs caesium isotopes : '33cS, 134cS, 135cS, 137cS
chemical analyses (elements Sm, Rh, Nd, Cs, Mo, E, y spectrometry: 154 Eu/ 137CS' 'Ru/ 137cS, 134cS/1 ",Cs,
Gd, Ag, Ru), have been performed to measure their 144Ce/ 137cSto 23 composition relative U, as well as their absolute
isotopic composition. These fission products areinvolved in French Burnup Credit studies 67).
In this table 1, the following abbreviations are usedand the corresponding analysed isotopes are listed
Table The experimental database for PWR-UOx and MOx fuels
PROGRAMME Fuel Enrichment Burnup range Experimental dataname I I
Bugey 3 REP 17x17 2.10% MjA, MA, Nd, Cs,1 to 3 cycles UOX 3.10% 19 to 38 GWd/t BUC
Fessenheirn. 2 REP 17x17 MjA MA, Nd2 cycles UOX 2.60% 27 to 30 GWd/t
Fessenheim 2 REP 17x17 MjA, MA, Nd, Cs,4 & cycles UOx 3.10% 45 to 60 GWdA
Gravelines 32 REP 17x17 MjA, MA, Nd, Cs, BUC,2 to cycles UOX 4.50% 25 to 62 GWd/t Y pectro
Cruas 4 URE REP 17x17 3.61% 1 1 to 34 GWd/t MjA, MA, Nd1 to 3 cycles UOx coming from U6 / = 12%
URT
Saint Laurent BI REP 17x17 U app 022% MjA MA, Nd CsI to 3 cycles Mox Pu 4.5% 10 to 45 GWd/t BUC
3 zones 3 Pu content U + PU
Gravelines 4 REP 17x17 U app 022%
3 4 cycles Mox Pu 4.5% 40 to 50 GWd/t MjA, Ndcentral zone U + PU
intermediate zone I
La Hague REP 17X17 3. 1 % 325 3.45 % 25 to 45 GWd/t MiA
Fuel dissolution UOx
3. The experimental database of irradiated BWR enrichments and burnups ranging between 20000 tofuels 40000 MWd/t. The amounts of depleted U and Pu
The experimental database for BWR contains are only available.chemical analysis results coming from samples An important experimental programme wasirradiated in reactor then dissolved, and from full launched concerning chemical analyses of samplesdissolution of various assemblies. of fuel rods irradiated in the GUNDREMMINGENIn the full assembly dissolutions at COGEMA/La reactor. Table 2 summarises the chemical analysesHague reprocessing plants, the involved assemblies performed in this programme.are 7X7, 8X8 and 9X9 BWR with various
_ 868 -

JAERI-Conf 2003-019
Table 2 Summa of analys s for the BWR GUNDREMMINGEN jaramme
Sample Estimate Estimated y SpectroFuel position Analysesrod /bottom of d Burnup Void and Other
fraction neutronfurl emission analyses
(mm (GWd/t) M -UTPul Nd Am Cm Np .. (Jabs
A 200 26.5 1.5 X X X X X X
600 45.4 15.9 X. X X X X X
845 47.2 1 24.2 X X X X X X
B 200 26.3 1.5 X. X X X X X X X
600 45.0 15.9 X X X X X X X X
685 46.0 18.7 Z X X Cs
F815 46.9 23.2 X X X X X X X X BUC
B 1170 46.3 34.5 X X X X X X X X
1440 46.3 42.0 X X X X X X X X
1680 45.0 47.2 X X Cs
1815 45.0 50.1 X X X X X X X X BUC
2300 43.8 57.9 X X X X X X X X
B 2780 41.9 63.3 X X X X X X X X
3290 35.4 67.3 X X
j 3420 j 32.0 j 68.2 j X j X j X j X j X j X j X j X j
*BUC = Bumup Credit isotopes (see page 4)
4 The experimental database for Fast Breeder In the PROFIL-1 experiment, the irradiatedReactors isotopes were : 235,238U, 38,239,240,241,242pU, 241,6,m.
: 232 233,234,235,238u, 237Two types of irradiation experiments have been In PROFIL-2 they were Th , Np,carried out in the French PHENIX reactor� : fuel rod 231,239,240,241,242pu, 241,243 Am, 244 Cm.
irradiations (the TRAPU experiment) and irradiationsof pure isotopic samples (the PROFIL and 2 5 Some comments on chemical analysesexperiments). After irradiations, chemical analyses are After being cut in the CEA/CADARACHE/LECAcarried out for cuts of fuel rods and for the irradiations laboratory, the samples of irradiated fuel rods aresamples. The irradiation of pure samples is more dissolved in nitric acid by the CEA in the COMIR ordevoted to giving information concerning capture and ATLANTE aboratories. The dissolved solutions are(n,2n) cross-sections. sent to CEA/SACLAY in order to be analysed.
The TRAPU experiment was a six-cycle Uranium and plutonium are first separated with anirradiation of mixed oxide fuel pins containing ion exchange resin and are then ready for isotopicplutonium of three different isotopic compositions. characterization by mass spectrometry. The remainingThese compositions are detailed in Table 3 TRAPU1 fraction of the solution is used in order to separate byand TRAPU2 are quite similar in isotopic liquid chromatography the minor actinides Americiumcomposition, TRAPU3 contains a higher Proportion of and Curium (interaction between masses 242 and240pti . The chemical analyses focused on Uranium and 243), the Nodymium, Cerium, Promethium andPlutonium isotopes. Sainarium (interaction between masses 142, 144, 147,
148 and 150) and Caesium and Barium (interactionTable 3 Pit is topic composit on of the T U pins between masses 134,135 and 137).
238PU 239PU 24GpU 241pit 241pit The isotopic content of the various fractions and
TRAPU-1 0.1 73.3 21.9 4.0 0.7 their amounts are then measured by isotopic dilutionTRAPU-2 0.8 71.4 18.5 7.4 1.9 mass-spectrometry using a thermo-ionization-typeTRAPU-3 0.2 34.0 49.4 10.0 6.4 mass spectrometer (TIMS). For Am, Cm and Cs
isotopes a specific method of 'total consumption' inTIMS has been developed and give very accurate
- 869 -

JAERI-Conf 2003-019
results. The isotopic dilution uses double or triple ICPMS (Inductively Coupled Plasma Massisotopic spikes such as 242PU/233u/145Nd, 133CS/233U, Spectrometry) and the 242 Cm by alpha spectrometry.243 Am/ 233 U, 241CM/233U (used for the determination of Some percentage uncertainties of the analyticalCm/U ratios). The 23'N P/23'U ratio is measured by value, depending on the nuclides, are given in
maximum values in the Table 4.
Table 4 Uncertai ties of analytical values for some actinides and FPs234u, 236u 2!!� �P 239,240,241,242 Pu Np Am Cm(243 t. 246) Nd Cs
Uncert I - 1% < 02% < % < 04% <4% <3% < 2 0.5% < %
6 Ongoing programmes 7 ConclusionFour main programmes are currently in progress. The French PIE experimental database presented
in this paper offers valuable data with very lowFor metallic BUC fission products such as 95 Mo, experimental uncertainties. These data are currently
99Tc, 1Ru, 103 Rh and 19Ag the chemical dissolution used in the validation of nuclear data and Frenchprocess in the COMIR laboratory is not yet optimised depletion calculation tools.and our first calculation-experiment comparisons have In order to take up new nuclear challenges theshown inconsistency due to the experimental results. experimental database is always in progress.In fact, for these metallic fission products, thedissolution is not total and non-soluble deposits yieldto inaccurate analyses. New results should be obtained Referencesat the end of 2003 with a new process of dissolution, 1) C. Chabert et a, "Experimental validation ofperformed in ATALANTE laboratory, for both Mx UOx and Mx spent fuel isotopics predictions"and UOx fuels. Vol. 2 Proc. PHYSOR'96, Mito, Japan 1996)
2) P. Marimbeau and al., "The DARWIN Fuel CycleThe P.I.E. database is currently being extended to Package. Procedures for Material Balance
higher burnups for PWR-UOX and Mx fuels. Fuel Calculation and Qualification", ENC'98, Nice,rod cuts extracted from French reactors after 5 6 and France 1998)7 irradiation cycles, up to 80 GWd/t for UOx fuels and 3) C. Chabert et al., "Qualification of the APOLL02after 4 and cycle, up to 60 GWd/t, for Mx fuels. assembly code using PWR-UO2 isotopic assays.This experimental programme, called HTC (for Hauts The importance of irradiation history and thermo-Taux de Combustion, Higher Burnups), will be mechanics on fuel inventory prediction",completed in 2005. In this programme, new PHYSOR'00, Pittsburgh, USA 2000)experimental results such as 232U, 236pu and ... Cm will 4) B. Roque et al. "Experimental validation of thebe obtained. code system DARWIN for spent fuel isotopic
predictions in fuel cycle applications"Another programme, entitled PRECC19), deals with PHYSOR'02, Seoul, South Korea 2002)
the long-term evolution of spent nuclear fuel in all 5) C. Chabert, A. Santamarina, P. Bioux,types of scenarios for the back-end of fuel cycle. It is "Elaboration and experimental validation of thetherefore necessary to extend the experimental APOLL02 depletion transport route for PWR Pudatabase to the most significant isotopes involved in recycling", PHYSOR 2000, Pittsburgh, USA,long term studies. The selected isotopes, long life (2000)fission products and activation products, are the 6) A. Santamarina, N. Thiollay, and al. "The Frenchfollowing 1291, 126 Sri, 9OSr, 93ZT, 107 Pd, 79 Se, 14C, 36CI, Experimental Programme on Burnup Credit",
59 Ni, 63 Ni, 93MO, 94 Nb. This programme implies also Top. Meet. on Criticality-Safety Challenges in thethe research and development of accurate chemical Next Decade, Chelan, USA 1997)analysis methods. Some of them are completed and 7) N. Thiollay, and al. "Burnup Credit for fissionfirst experimental results will be available in 2004. Products Nuclides in PWR (UOx Spent Fuels"",
Proc. Int.Conf. ICNC'99, Versailles, France
The CEA is also involved in an international (1999)programme, MALIBU (radiochemical analysis of 8) R. Soule, E. Fort "Contribution to the validationMox And Uox wr fuels Irradiated to high Burn up), of JEF2 actinide nuclear data Analysis of fuelconducted par BELGONUCLEAIRE. The aim is to and sample irradiation experiments in PHENIX",perform radiochemical measurements on fuel samples Proc. GLOBAL'97, Yokohama, Japan 1997)which have reached about 75 GWd/t. The studied fuel 9) C. Poinssot, P. Toulhoat, J.M. Gras, P. Vitorge,is coming from a PWR 15XI5 reactor. UOx and Mx "Long term evolution of spent fuel in long termfuel samples will be analysed in different chemical storage and geological disposal. Status of thelaboratories. The CEA will participate in chemical French research program PRECCI", Actinidesanalyses. 2001, Japan 2001)
- 870 -

JAERI-Conf 2003-019 JP0450163
Recent Activity on the Post-irradiation Analyses of Nuclear Fuels and ActinideSamples at JAERI
Nobuo SHINOHARA', Yoshinori NAKAHARA, Nobuaki KOHNO and Kazufumi TSUJIMOTOJapan Atomic Energy Research Institute, Tokai-mura, Naka-gun, lbaraki 319-1195, Japan
Radiochernical analyses of spent fuels have been carried out at JAERI for contributing tothe development of nuclear technologies, where several samples from research reactors andnuclear power plants were analyzed to obtain isotopic compositions and burnups. Thehistory and procedures of the radiochemical analyses are depicted and some recent resultsare given in this paper.
KEYWORDS: Post-irradiation Experiment, Spent Fuel, Radiochemical Analysis, Burnup,FIMA, Nd-148 method, Actinides, ORIGEN Depletion Code, Nuclear Data
1. Introduction the burnup value obtained finally.Later, spent fuels of nuclear power reactors,
Post-irradiation experiments (PIE) of spent fuel Pressurized Water Reactor (PWR) and Boiling Waterassemblies unloaded from several research reactor Reactor (BWR), have been analyzed as PIE tofacilities and nuclear power plants have been carried determine their burnups in view of safety andout at Japan Atomic Energy Research Institute economy to know the characteristics of nuclear fuel(JAERI). In the PIE, gamma-ray scanning burning. Several fission products like 37 Cs andmeasurements on the fuel rods were performed and neodymium isotopes, uranium and other actinidessome fuel samples were cut from the rods for produced by the neutron capture reactions have beenradiochernical analysis (destructive analysis). One of analyzed to obtain the precise burnup values, insteadthe objectives of the radiochernical analyses is to of the use of the estimated a5 values.measure isotopic composition and burnup, in order totest the fuel reliability and obtain a set of data to be 2.2 Measurement of Isotopic Ratio and Burnupused for evaluating the accuracy of nuclear code From 1970 to 1985, 328 samples were analyzed atcalculation. JAERI to determine their bunup values as PIE.') On
The history of PIE at JAERT, the procedures of the June of 1972, precise measurements were carried outradiochernical analysis and recent PIE experiments are by means of chemical analysis and gammadepicted in this paper, where reliability of the spectrometry on spent fuel of the Japan Powermeasured values is emphasized for the purpose of Demonstration Reactor (JPDR-1), which was autilizing the PIE data for development of nuclear BWR.') A non-destructive gamma spectrometrytechnologies. technique was also applied to 72 spent fuel assemblies
discharged from the JPDR-1. The assemblies were2. PIE at JAERI dissolved at the Tokai Reprocessing Plant, and 19
batch-samples taken out of the dissolver vessels were2.1 History subjected to detailed chemical analySiS.4) The
During the 60s, JAERI started the analyses of spent depletion and production of uranium, plutonium,fuels from the Japan Research Reactors (JRR-1, transplutonium isotopes and fission products in aJRR-2 and JRR-3). In the case of the Japan's first BWR was evaluated using the measured values for thenuclear reactor JRR-1 which utilized 20%-enriched JPDR-I fuel 5)
uranium solution as fuel, radiochernical analysis was The PWR spent fuels (Genkai, Miliarria, Ohi,performed by measuring the isotopic compositions of Takahama and Tsuruga), the BWR spent fuelmolybdenum and neodymium as fission 1� roduct (Fukushima) and the fuels of the research reactorsmonitors and uranium as fuel material.' In (JMTR, NSRR and ATR) were the specimens for PIE
6-1 0)determining the burnup value, contribution of fission up to date. As an example of the PlEs, Fig. Of 239pU produced by the neutron capture of 238U was shows a flow diagram for analysis of WR spentneglected because of its low bunup value. Estimated fuel.") A sample of sliced pellet was dissolved in(x5 value which is the ratio of thermal-neutron capture nitric acid solution. After addition of spikes (15ONd,cross section cc to fission cross section (yf On 235 U was 213 U and 244pU) into the solution for isotopic dilutionused for calculating the burnup value and the analyses (IDA) by mass spectrometry and alphauncertainty of the estimated CC5 value affected that of spectrometry, ion exchanges were performed to
Corresponding author, Tel. 81-29-284-3794, Fax. 81-29-282-5545, E-mail: shino�popsvrtokaijaeri.goJp
- 871 -

JAERI-Conf 2003-019
separate neodymiurn, uranium, neptunium, plutonium, values for neodymiurn, uranium and plutoniumamericium and curium.'2) Gamma spectrometry was isotopes are estimated from the uncertaintiesalso carried out to measure the amounts of some propagated through the statistical uncertainties of thefission products. Amounts of these isotopes seen in activities and mass-spectrometric measurements andFig. were measured by IDA as regards their ratios to the systematic uncertainty of the standard materialsuranium in the sample. used as spikes. For the analysis of 232 U by alpha
The burnup in Fission per Initial Metallic Atom spectrometry, the uncertainties are large 2%) because(FIMA) was.evaluated by the "'Nd method.") The the activity is weak. The uncertainty of 234 U (1% is
FIMA in percent (%FIMA) is derived from the due to its small abundance. The amounts Of 236pU
following equation: and 238pU could not be determined readily by massNF x 100 spectrometry; the former because the yield Of 136pU
Burnup Pu Np Am Cm low and the latter because of interference from 238u.
1+-+-+- +- +NF The uncertainties are therefore 3 for 236pU and %and U U U U for 238pU.
148 Nd 1 Table Measured isotopic compositions ofNF =- x- (1) actinides and their analytical uncertainties in a
U Y148
where 148 Nd/U, NpjU, Pu/U, Am/U and Cm/U are te PWR spent fuel 3.06 %FIMA)measured atom ratios and Y148 the effective fission Isotope Isotopic Analyticalyield of 14'Nd. composition uncertainty
(atoms/IMA) M
Sliced pellet -"U 1.81 x 10⁻⁹ 2234u 7.6 x 10-' 1
Mixed spikes 0" Dissolution 235u 3.69 x 10⁻³ <0.5Nd-150 U233 Aliquoting 236u 10-3
and Pu-242 2.25 x <0.5Sample solutio 238u 0.9523 <0.1
1 237 Np 2.8 x 10⁻⁴ 5iSpiked sample Non-spiked sample 236 Pu 7.2 x IWO 3
231PU 1.213 x 10⁻⁴ 1
231PU 5.48 x 10⁻³ <0.5Chemical separation 240 Pu 2.58 x 10⁻³ <0.5
241PU 1.528 x 10⁻³ <0.5242pU 10-4
m 7.44 x <0.5241 Am 3.6 x 10⁻⁵ 8.5
spectrometry a spectrometry Gammaspectromety� 242mAM 7.9 x 10⁻⁷ 1.5243,4,M 1.44 x 10⁻⁴ 1
242CMNon spiked Spiked Np: 237 Cs-134, Cs-] 37, 1.96 x 10-' 1Nd: 142 - 50 148/150 Pu: 238, 239+240 Ce- 44, Eu- 52, 243 Cm 4.8 x 10⁻⁷ 20U: 234 - 238 238/233 Am: 241, 243 etc. 2442 Cm 5.56 x 10 <1Pu 238 -242 239/242 Cmi 24 -244 1 245 10-6Am: 241 - 243 Cm 2.80 x 1Cm: 242 -247 246cM 3.55 x 10⁻⁷ 1
f 1 247 Cm 4.7 x 10 20Amounts of the isotopes in terms of atoms/U-atorn
Fig.1 Flow diagram for analysis of spent fuel sample The uncertainties of the observed data onat JAERI.') neptunium, americium and curium isotopes measured
2.3 Reliability of Measured Data by alpha spectrometry depend on (i) statisticaluncertainties, (ii) tailing corrections in alpha spectra,
Our analytical techniques are based on the and (iii) uncertainties in the nuclear data for half livesmeasurements of the isotopic compositions relative to and alpha emission probabilities. Estimatedthe amount of uranium by IDA as explained in Eq. (1)and the 148Nd method as a measure of burnup. These uncertainties are 5%, 1-8.5% and 120% for themethods depend on relative determination which has neptunium, americium and curium isotopes,advantage to obtain Mre precise results than absolute respectively, as given in Table 1. These analyticaldetermination. The uncertainties of the data data and their uncertainties can be used as benchmark
measured by our methods, therefore, became more information
traceable: measured isotopic compositions of actinides 2.4 Application of Burnup Credit for Spent LWRand their analytical uncertainties in a PWR spent fuel Fuels
(3.06 %FIMA) are given in Table 1. Technical development on burnup credit for spentMaximum uncertainties <0.5%) of the measured Light Water Reactor (LWR) fuel has been performed
- 872 -

JAERT-Conf 2003-019
at JAERI since 1990.9,10) Main purpose of this work Oak Ridge National Laboratory (ORNL) wereis to obtain the experimental data on criticality encapsulated in a high-purity vanadium material.properties and isotopic compositions of spent WR These capsules were then placed in four fuel pins. Infuels and to verify burnup and criticality calculation this paper, we will discuss the results for one of thecodes. The 16 samples from three kinds of PWR four fuel pins 35 capsules consisting 9 dosimeterfuel rods and the 18 samples from two BWR fuel rods samples and 26 actinide physics samples). Thewere examined for measuring more than 40 isotopes ordering of the samples and dosimeters is shown inof actinides and fission products and burnup. Fig. 3 At final discharge, the cumulative total
A result is shown in Fig. 2 where the relation irradiation for the fuel pin amounted to 492 EFPD.between the burnup and the yield Of 37CS in the spent The total exposure and the total fluence were 295,483LWR fuels is drawn. The burnup correlates well MWd and 2 x 10²³ n/cM2 , respectively.with the 137CS yield and the result can be useful forevaluating the axial profiles on burnup in spent WRfuel rods. The obtained data in this work as wel asthe related iadiation condition data are very much I Do& (U-235. U-238)useful as a complete benchmark data set. 9 Elm Pu-239, Np-237)
3 Do& (Cu. Co)PWR4.1%U-235 4 Cm-2"
W02) a CM-2A6PWR-2.6%U-235 8 Cm-2487 WW
35 (UOTGd2O3) a CM-2"PVrR4.1% U-235 2 CM-2"
30 (UO2) la CWfl-MBWR-3-90/U-235 11 U-238
(UO2) 12 Anv.24325 BVrR-3.4% U-23 13 Arn-PA3(UO2-Gd2O3) 14 Am-241
20 15 Ano-ftl Cam WW
0" 16 Pm-24215 17 Oa& (UMS, U
V 18 DaL Pu-230. Np-237)is DM. (Cu, CO)10 20 Pu444
5 0. 62879x Rm 9965 21 Pu-W22 Pu-M23 PUMP
0 24 PU-24i0 10 20 30 40 50 2a Th-232
Bu--p (GWd/t) 28 U-236
Fig.2 Yields Of 37CS in the spent LWR fuels as a 27 LJ-234 0
function of burnup. 20 U-235 890 Pa-23130 PU"
3. Analysis of Actinide Samples Irradiated in the 31 Th-0032 U-M3
Dounreay Prototype Fast Reactor 33 Dw. (U433, U-230)
34 Om. u.=. Np-237)
Enriched isotopes of thorium, protactinium, 35 0go. (CU, CO)
uranium, neptunium, plutonium, americium and
curium were irradiated for 492 effective full power
days (EFPD) in the 600-MW Dounreay Prototype Fast Fig.3 Sample locations for actinide samples and
Reactor (PFR) in Scotland. 14) These samples were dosimeters (Dos.) in fuel pin irradiated in PFR.
analyzed using the techniques mentioned in Sec. 22 to
compare the validated data with calculations based on 3.2 Isotopic Composition and Burnup
evaluated data files. This information is valuable in As an example, analyzed isotopic compositions of
clarifying several features of the nuclear transmutation the americium samples irradiated in PFR are listed in
of minor actinides and in verifying the reliability Of Table 2 where atoms/IMA are tabulated together with
burnup calculation codes. The detailed compositions the total numbers of actinide atoms after irradiation
of the irradiated samples were determined by alpha and the values of burnup (%FIMA) determined by the
measurements, gamma-ray measurements and mass 148 Nd ethod. Other data are reported in Ref. 15.
spectrometry. From the measured yields of the We compare the ORNL and JAERI values for the
fission products, we can estimate the burnup of the amount of primary actinide present in each
sample. post-irradiated sample to assess the overall reliability
of the data. The ORNL results are based on direct
3.1 Actinide Samples and Irradiation weight measurements while the JAERI results ae
The actinide samples and dosimeters prepared b based on the 148Nd method. The two sets of data are
- 873 -

JAERI-Conf 2003-019
consistent with each other at the level of about 7. suggest that the JAERI and ORNL data sets areThis level of agreement persists concerning all consistent with an accuracy of t14%. The agreementactinides because the isotopic results obtained at was better ±7%) while dealing with the actinides.ORNL and JAERI are virtually te same for allanalyzed samples. Conversely, the good agreement 3.3 Burnup Calculationsbetween the ORNL and JAERI data sets implies that We used the ORIGEN depletion code") for thethe 148Nd method is reliable also for the americium calculational analysis of the irradiated samples. Theand curium isotopes. nuclear data were supplied by the JENDL-3.2
library.'8) The power history, cross sections andTable 2 Analyzed isotopic compositions of the neutron fluxes used in this calculation are presented in
americium samples irradiated in PFR a separate paper in details.'9)Principal 241,,%M 243,AM In Table 3, we present the calculated-to-
isotope experimental C/E) values on %FIMA for 17 actinideIsotope Post-irradiation atorns/FIMA samples. As an indicator of te agreement between142 Nd 1.67, X 10-4 1.43, X 10-4 theory and experiment, the C/E values for the burned143 Nd 3.89, x 10-3 2.21 x 10 amount of each principal actinide is more significant144 Nd 3.65 x 10⁻³ 2.12 x 10⁻³ than the C/E value for the amount of the residual145 Nd 2.85, x 10 1.65, X 10-3 principal actinide itself Therefore, in addition to the146 Nd 2.63, X 10-3 1.57, x 10 FIMA results, we present more detailed results148 Nd 1.68, x 10 1.06, x 10-' concerning the changes in the composition of15ONd 1.12, x 10-' 7.38, x 10-4 principal isotopes in each actinide sample in Table 3.Nd (total) 1.60, X 1-2 9.48, x 1 O' These changes are expressed in terms of the loss of
material divided by the number of initial metallic238PUa 2.05 x 10⁻¹ atoms. In Fig. 4 the C/E values for FIMA fr
239PUa 1.22, X 1-2 1.34, x 10-3 percent change of the primary nuclide with mass24GpUa 9-993 X 10-4 1.11 x lo-, number A and for the percent change of the AI241PUa 10-4 nuclide are presented for each sample. In the case of3.212 X 10 5.453 X 24242PUa 10-2 the 'Am sample, for example, the primary nuclide is4.972 X 7.334 X 10 24
Pu (total) 2.68, x 10-' 1.13, x 10-' 99.95%-enriched 'Am before irradiation. Thenuclides of the primary nuclide + one nucleon are
241AMa 6.026 X 10⁻¹ 5.255 x 10⁻⁴ 242m Am as a result of the neutron capture Of 241AM,
242m,,�.a 3.15, x 10-2 1.972 X 10-' 238p u as a result of the P- decay of 2429Am (produced243Ana 4.144 X 10 6.56, x 10-1 also by the neutron capture of 241 Am) to 242 Cm and the
Am(total) 6.386 X O_' 6.57, x 10-' subsequent alpha decay, and 242 Pu as a result of theelectron-capture decay of 2429Am to 242pU.
242cMa 7.19, x I0_'
243cma 3.82, x 10-' 2.162 X I0_' Table 3 Results on the calculations for %FIMA and244cMa 4.885 X 10 1.612 X 10-' the percent changes for principal isotopes245cMa 3.113 X 10⁻⁵ 1.762 X 10⁻² Sample %FIMA Percent change246cMa 8.839 x 10-' 5.576 X 10⁻⁴ Exp. C/E Ca1c.' C/E247cMa
1.26, x 0 -"U 45.26 0.95 -49.55 0.95248cma 5.035 X 10⁻⁷ 234U 8.63138 1-00 -19.25 0.91
Cm(total) 4.41 4 X IO 1. 802 X IO-' 235U 32.22 1.00 -42.43 0.97236U 5.4443 1.05 -7.5640 1.06
Actinides 9-106 X 10-1 9.49, x 10-' 238U 1.99, 0.93 -7.4130 0.89(total) 237 Np 8.0769 1.16 -33.620 0.9817Kff M 1.867219 2.065330 231PU 16.333 1.28 -39.513 1-11
of 14'Nd 231PU 30.52 1.02 -40.424 0.98
%FIMA 8.991, 5.1282 241PU 9.6115 1.07 -18.42 1.06aDate of the measurements was April 15, 2000. 241 Pu 25.17 1.09 -81-17 1.00
242 Pu 5.70,0 1.03 -13.13 1.14The measured data for the fission product 241 Am 8-99144 1-09 -39.4, 0.90
concentration of neodymium measured in this study 243,AM 5.1282 1.04 -34.4, 0.93and those Of 137CS obtained at ORNL are also 243cM 26.234 1.13 -37.812 0.95compared to verify the measured data. According to 244cM 8.75158 1.26 -52.39 0.98Ref. 16, the expected average value of Nd/117CS fm 246cM 6.81102 1.17 -8.7061 0.92fission is 298±0.38. Our experimental value for the 248 Cm 5.681o8 1.28 -9.4181 1.05same quantity is 288±0.39. The agreement is A negative value indicates burnup.excellent. The fluctuations in the Nd/ 137Cs ratios
- 874 -

JAERI-Conf 2003-019
We showed in Sec. 32 that the ORNL and JAERI ADresults for the weights of the principal actinides agree .- (a) FEMAto within ±7%. This level of agreement is also whatwe would expect given the difficulties of theexperiment and the proven performance of themethods employed. At present, there are three majornuclear data libraries (JENDL-3.2, ENDF/B-VI andJEF-2.2) containing actinide data and several less 0.0 ............. ...
I...... ...................extensive evaluations.20) There are considerable
differences among these libraries concerning the 0.70cross-section values recommended for reactions ofinterest in this work. For the purpose of validating . . . . . . . . . . . . . .the JENDL-3.2 file, the calculated values wereconsidered exactly. We then set the acceptable range 2 Q 0
of the C/E values at -1-7%(la). We show this range(gray bands in the figures) and the limits (brokenlines) in Fig. 4 (b) PdmKy mzH&
We find that we can obtain reliable FIMA values im by using the 148Nd method except that theuncertainties in the FIMA values are large for 234U,
238pu, Am isotopes and Cm isotopes because the 148Nd T
yields are known poorly for these isotopes and areprobably overestimated. For these isotopes,measurements to improve te fission-yield data areneeded. We also find that, in general, the (L70
JENDL-3.2 nuclear data for the minor actinides are OJOadequate for the conceptual design study oftransmutation systems. But, tere are some isotopes(especially 238pu and 242pU) for which new
measurements are needed particularly if the minor IMactinides constitute a major part of the nuclear fuel. W pd=7 ncilde + one wJem
1.30 -
4. Conclusion--- -------------
Several types of spent fuels from research reactor 1.10and nuclear power plants ave been analyzed at 9
OJO -JAERI by radiochernical m ethods to measure the ------- .. .............................. . ....................... .. ........... ....... .... .. ......I
isotopic compositions of the fission products (Mo, Zr,and Nd isotopes) and of the actinides (U, Np, Pu, Am 0.70 Cm, and Cf isotopes). In this paper, procedures usedfor the chemical analyses and the analyzed data werepresented. Recent results on actinide samplesirradiated in the Dounreay Prototype Fast Reactor for492 effective full power days were also given here. Fig.4 Summary of CIE value for (a) FIMA, (b)It was found that these analytical results could serve primary nuclide and (c) primary nuclide + oneas a benchmark for future calculations and validation nucleon.of nuclear data libraries.
Acknowledgements ReferencesThe authors wish to express our deep sympathy for 1) T. Komori, S. Tamura, H. Yoshida, K. Gunji and
the late Dr. Subramanian Raman who helped us for K. Tamura, "Mass Spectrometric Determination ofour researches in many ways. We dedicate this paper Burnup," J. At. Energy Soc. Japan 13, 688 1971).to our friend Rarnan-san. Tese works given in this 2) M. Hoshi, Private communication 2002).paper have been performed by many staffs of JAERI 3) H. Natsume, H. Okashita, H. Umezawa S.for a long time. Okazaki, T. Suzuki, M. Ohnuki, T. Sonobe Y.
Nakahara, S. Ichikawa, S. Usuda, S. Matsuura, H.Tsuruta, T. Suzaki, T. Komori, S. Tamura, K.Gunji and K. Tamura, "Gamma-ray Spectrometryand Chemical Analysis Data of JPDR-I Spent
- 875 -

JAERI-Conf 2003-019
Fuel," J. Nucl. Sci. Technol. 14, 745 1977). 13)"Standard Test Method for Atom Percent Fission4) T. Suzaki, S. Okazaki, H. Okashita, 1. Kobayashi, in Uranium and Plutonium Fuel (Neodymium-148
T. Suzuki, N. Kohno, M. Ohnuki, N. Shinohara, T. Method)," Annual Book of ASTM Standards,Sonobe, A. Ohno, K. Murakarni, H. Urnezawa, H. E321-79, Vol. 12.02, p.156, American Society forTsUTuta, S. Matsuura, Y. Asakura, S. Araya and T. Testing and Materials 1985).Yarnanouchi, "Non-destructive and Destructive 14)S. Raman, B. D. Murphy, C. W. Nestor, Jr., C. C.Measurements on Burnup Characteristics of Japan Foreman, W. S. Fraser and T. D. Newton,Power Demonstration Reactor-I Full-core Fuel "Dounreay PFR Irradiation History for the JointAssemblies," J. Nucl. Sci. Technol. 23, 53 1986). USIUK Actinide Sample Exposure,"
5) H. Ezure, "Evaluation of Depletion and Produ ction ORNL/TM-12984, Oak Ridge National Laboratoryof Uranium, Plutonium, Transplutonium Nuclides, (1995).and Fission Products in JPDR-I Fuel," Nucl. 15)N. Shinohara, N. Kohno, Y. Nakahara K.Technol. 91, 311 1990). Tsujimoto, T. Sakurai, T. Mukaiyarna and S.
6) Y. Nakahara, T. Suzuki, K. Gunji, N. Kohno, H. Raman, "Validation of Minor Actinide CrossTakano, Z. Yoshida and T. Adachi "Amount of Sections by Studying Samples Irradiated for 492Nuclides Constituting PWR Spent Fuels, Days at the Dounreay Prototype Fast Reactor-LComparison of Observed with Calculated Values," Radiocbernical Analysis," Nucl. Sci. Eng. 144,Radiochim. Acta 50, 141 1990). 115 2003).
7) Y. Naito, M. Kurosawa and T. Kaneko, "Databook 16)T. R. England and B. F. Rider, "Evaluation andof the Isotopic Composition of Spent Fuel in Light Compilation of Fission Poduct Yields,"Water Reactors," JAERI-M 93-061 1993). LA-UR-94-3106 (ENDF-349), Los Alamos
8) T. Adachi, Y. Nakahara, N. Kohno, K. Gunji, T. National Laboratory 1994).Suzuki, T. Sonobe, M. Onuki, K. Kato, E. 17)A. G. Croff, "ORIGEN2 A Versatile ComputerTachikawa, S. Inoue, M. Takayasu, M. Yoshikuni, Code for Calculating the Nuclide CompositionsS. Kobayashi, Z. Teruya, T. Kawarnoto and M. and Characteristics of Nuclear Materials," Nucl.Kawamura, "Comparison of Calculated Values Technol. 62, 335 1983).with Measured Values on the Amount of TRU and 18)T. Nakagawa, K. Shibata, S. Chiba, T. Fukabori Y.FP Nuclides Accumulated in Gadolinium Bearing Nakajima, Y. Kikuchi, T. Kawano, Y. Kanda T.PWR Spent Fuels," J. Nucl. Sci. Technol. 31, 1119 Ohsawa, H. Matsunobu, M. Kawai, A. Zukeran T.(1994). Watanabe, S. Igarasi, K. Kosako and T. Asarni,
9) Y. Nakahara, K. Suyarna and T. Suzaki (Eds.), "Japanese Evaluated Nuclear Data Library"Technical Development on Burn-up Credit for Version-3 Revision-2: JENDL-3.2," J. Nucl. Sci.Spent WR Fuels," JAERI-Tech 2000-071 2000). and Technol. 32, 1259 1995).
10)Y. Nakahara, K. Suyama, J. Inagawa, R. Nagaishi, 19)K. Tsujimoto, N. Kohno, N. Shinohara, T. Sakurai,S. Kurosawa, N. Kohno, M. Onuki and H. Y. Nakahara, T. Mukaiyarna and S. Raman,Mochizuki, "Nuclear Composition Benchmark "Validation of Minor Actinide Cross Sections byData Set for Verifying Burnup Codes on Spent Studying Samples Irradiated for 492 Days at theLight Water Reactor Fuels," Nucl. Technol. 137, Dounreay Prototype Fast Reactor-II: BurnupIll 2002). Calculations," Nucl. Sci. Eng. 144, 129 2003).
11)Y. Nakahara, Private communication 1995). 20)T. Nakagawa, H. Takano and A. Hasegawa,12)S. Usuda and N. Kohno "Anion-exchange "Present Status of Minor Actinide Data,"
Separation of Nd and the Transplutonium NEA/WPEC-8, Organization for EconomicElements in Spent Nuclear Fuels for Burn-up Cooperation and Development Nuclear EnergyDetermination," Sep. Sci. Technol. 23, 1119 Agency 1999).(1988).
- 876 -

JAERI-Conf 2003-019 JP0450164
Current Status of PIE Activities in 0-arai Engineering Center of JNC onFBR MOX Fuel
Shin-ichi KOYAMA', Masahiko OSAKA, Takashi NAMEKAWA and Masahiko ITOHJapan Nuclear Cycle Development Institute, 0-arai, Ibaraki 311-1393, Japan
Japan Nuclear Cycle Development Institute (JNQ is now totally promoting thedevelopment of commercialized fast reactors to realize stable supply of energy in future.One of the important items is to develop high-performance fuel. For this purpose, it isessential to carry out post-irradiation examinations (PIE) for evaluation of irradiated fuelperformance and also to establish the PIE technology. This paper describes the current statusof PIE results including its technology in O-arai Engineering Center of JNC. The facilitieshave been operating safely and successfully since the 1960's. Obtained PIE data werereflected to the design and operation of the experimental fast reactor JOYO, the prototypefast reactor MONJU and future fast reactors. The core modification from the breeding core(MK-1) to the irradiation core (MK-11) of JOYO was performed in 1982. Irradiation tests offuels and materials in MK-11 core started in 1982. At PIE facilities in OEC, 65 of driverfuels, fuel irradiation test rigs, material irradiation test rigs and several other componentswere examined related to JOYO MK-11 core operation, and thus a lot of aspects wereaccumulated for irradiated uel behaviors. As topical activities of these PIE techniques,bumup measurement and analytical technique for Minor Actinides (MA, such as neptuniumand americium were described here.
KEYWORDS: mxed oxide fuel, PIE, experimental fast reactor, JOYO, burnupmeasurement, ion exchange, neptunium, americium, MAGI, ESPRITV
1. Introduction subassemblies have been irradiated in all. The MK-11core operation was completed at June 2000. Until
In fast reactors, core components are used in severe now, 65 of driver fuels, fuel irradiation test rigs,environment, compared with thermal reactors. material irradiation test rigs and several otherTherefore, it is required to further the development of components were examined. In addition, anotherfuels and materials relating to core components, irradiated fuel components from overseas reactor,checking their irradiation performances. Since the PFR, Rapsodie, Phenix and FFTF have been examinedinauguration 1968) of Power Reactor and Nuclear especially as a high bumup fuel and materials.TheFuel Development Corporation (past of JNQ, total number of subassemblies examined in the PIEirradiation experiments on core components have been facilities of OEC is amounted to 214. Maximumperformed in oversea reactors and Japan material bumup achieved is 143.9 GWd/t.testing reactor (JMTR), while the construction of post After MK-II core operation was completed, JOYOirradiation examination (PIE) facilities in O-arai has been modified to improve the irradiationEngineering Center (OEQ had also been promoted. capability, and the operation of modified core (MK-111
The Alpha-Gamma Facility (AGF)') for fuel core) will be expected in 2004. The prototype fastdestructive examinations, the Material Monitoring breeder reactor "MONJU" achieved its fast cticalityFacility (MMF)2) for material testing and the Fuel in 1994. In INC, it has been planned to develop theMonitoring Facility (FMF)3-6) for non-destructive Advanced Nuclear Fuel Recycle System, which aimsexaminations of core components irradiated in the to reduce the burden of radioactive waste disposal byexperimental fast reactor JOYO were constructed and separating long-life radioactive nuclides such asstarted the operation in 1971, 1973 and 1978, neptunium, americium and curiurn, which are calledrespectively. The core modification from the breeding Minor Actinides (MA) in spent fuel and burning themcore (MK-1) to the irradiation core (MK-11) was in fast reactors. MA containing fuel has highperformed in 1982. Irradiation tests of fuels and radioactivity, therefore it is necessary to fabricate itmaterials in MK-11 core started in 1983. For the remotely. In order to realize remote fuel fabrication, itirradiation, special test rigs, which could be loaded was planned to install the fael fabrication apparatus in
7) -11 core, 362 the hot cells of AGF.again, were developed In JOYO MKdriver fels (core fuel subassemblies) with mixed This paper presents the current status of PIEoxide (MOX) fuel and 69 irradiation test activities. One of topical activities is analytical result
Corresponding author, Tel. 81-29-267-414 1, Fax. 81-29-266-3714, E-mail: koyamas�oecjnc.gojp
- 877 -

JAERI-Conf 2003-019
on burnup measurement that has been obtained for thefuel pins irradiated in JOYO MK-11 core. In addition,experimentally analytical results of MA were alsodescribed about applying a new isolation technique.
2. Overview of PIE Results concerning fuelcomponent
Since the first criticality of JOYO, the examinationof irradiated fuels and materials have been performedmainly in the hot cell complex of three PIE facilities. 93%TD* Fuel Density 92%TDSchematic flow-sheet at the core of it-radiated fuel 65 GWd/t Bumup 144 GWd/tbetween JOYO and the PIE facilities ae shown in 39 kW/m LHR 38 kW/mFigure 1. *TD: Theoretical Density
Fuel subassembly Fig.2 Dependence of burnup by compaareing twoVisual inspection MOX fuels.Plofflometry
st cl in 3. Burnup measurement and related actinidesug MMF analysis
nC. C. 3.1 Objective of burnup measurement and
.moaa c Melt ng po nt treatment actinides analysis
Weighing Thermal In order to improve the economy of fast reactors, itX-ray readiography ectumin conductivity needs indispensably to develop long life fuel. A
crucial factor in achieving this end is to correctlyestimate neutron distribution in a reactor core and tomake use of the result in the design, operation andmaintenance of reactors as well as in fuel
Fig. I Schematic flow-sheet of PIE for ftiel. management. The estimation is normally made from
Firstly non-destructive examinations of fuel calculations using the neutron diffusion equationsubassembly were carried out in FMF. After solved under prescribed conditions.
Correctness of such calculations on neutrondisassembling to each fuel pin, detailed destructive distribution can be verified by comparison betweenexamination was also carried out in FMF. At the same calculated and measured values of fuel burnup derivedtime, sectioning fuel pin was transferred to AGF for using the neutron distribution data. The measurementthe measurement of physical properties and chemical of butnup is performed by isotope dilution analysis foranalysis. determining the isotopic compositions of neodymium,
After the components from JOYO are transferred to uranium and plutonium. This analysis is based on theFMF, at first, sodium attached to the components s ASTM E-321 standard method for monitoringremoved to carry out non-destructive examinations neodymium9). The importance of measured bumupfollowing it. data for verifying the validity of neutron distribution
After non-destructive examinations, the calculations increased with progress of burnup beyondsubassembly is dismantled and the fuel elements are the nominal level of 75 GWd/t, since in this range ofsectioned to small segments for transferring to other bumup, fission products accumulated thickly in thePIE facilities. The results of PIE were contributed to fuel to disturb the neutron distribution.the fuel design and operation of JOYO, MONJU and On the other hand, NC is now promoting thefuture fast reactor concepts evaluated in the feasibility development of low decontamination factor (DF)study. Evaluation for the restructuring and pellet- MOX fuel including minor actinides as well as fissioncladding interaction of high burnup MOX fuel pellet products for the purpose of contribution to lowwas performed by optical microscope, EMPA and environmental impact by fuel recycling and to moreSEM, and sometimes by Ion micro analyzer (IMA). economical operation. The experimental study as well
The large central void, equi-axis region and as- as the development of analytical method on thefabricated grain structure are observed in typical transmutation of actinides, especially neptunium,ceramograph of fuel pellet irradiated up to 144 GWd/t americium and curiurn, is now in progress.relative to the fuel irradiated to 65 GWd/t shown inFigure 2 Pu re-distribution was observed in both 3.2 Burnup measurement and the results offuels. analyzed isotopic composition
3.2.1 Experimental
- 878 -

JAERI-Conf 2003-019
The JOYO MK-11 core comprises 69 fuel The data indicate agreement within betweensubassemblies and 6 control rods, surrounded by 240 averaged values of calculated and measured data,stainless steel reflectors. The positions radially placed which would appear to be excellent, but furtherbeyond the 4h row are in the reflector region. detailed insight of relevant data would appear to call
The driver fuels and irradiation test subassemblies for some qualification. Shown in Figure 3 are the datawere distributed in the core according to pre- presented separately for different original locations indetermined conditions in the core region. The basic reactor core of the fuel pins. The plots for pins in theplutonium content and uranium enrichment of the 41h row - outermost fuel close to the reflector region -drover fuel were around 30 wt% and until 18 wt%, indicate calculated data falling as much as 15 % belowrespectively. calculation.
Runs at nominal 100 MWt output of MK-11 corewas performed in cycles of 70 days. At full power, the 10.0maximum fast neutron flux and maximum total flux 9.0
were 3.6x10¹⁵ n/(c M2 -sec) and 4.9xIO15 n/(CM2.SeC), 8 O
7.0 0 Centerrespectively. 6.0
In the first step, uranium and plutonium were5.0 06Mindividually separated from the solution by anion 2nd m4.0exchange chromatography. The second step of anion Et 3,dw3.0
exchange separated pure neodymium from An(III)2 0 0 4th,-
i.e. trivalent actinides- and other fission products. I,0Finally the isotopic compositions of the three elements 0.0 -thus separated were measured by mass-spectrometric 0.0 2.0 4.0 6.0 8.0 10.0
analysis. C.I.I.ted bunup (/.FIMA)
Detailed conditions, such as specification ofanalytical devices, spike solution, the way of bumup Fig.3 Loading position dependence fordetermination and the specified several nuclear data calculated/measured value in the core.are cited in reference 9.3.2.2 Results of burnup measurement and theestimation by calculation codes The above discrepancy is explainable from the
Experimental error, not exceeding 4 %, as been effect of neutron spectrum softening by the presenceattained in bumup measurements undertaken on 75 of stainless steel in the adjacent reflector region, butspecimens of fuel pins from driver fuels and on 54 this is not reflected in the calculation with MAGI andfrom iadiation test subassemblies. The measured ESPRIT-J, which are based on neutron diffusionvalues of burnup extended in range from 0003 to theory assuming hexagonal-Z geometry, and would13.28 %FIMA. not account for the modification of neutron flux in the
Errors could arise for instance from inaccuracies in transitional region of fuel close to reflector.spike solution weighing and in the values adopted for To evaluate the discrepancy, the advanced codefission cross-section and fission yield. It is estimated MCNP-4A 12) was adopted to account for thethat the aggregate experimental error will have modification of neutron spectrum and the resultingreached about 4 %. effect on bumup distribution in the transitional region.
The measured bumup derived above is compared This advanced code applies Monte Carlo treatment,with the results of calculation by 3-dimensional and calculates neutron distribution in 3 dimensionsneutron diff-usion code, MAGI"'). The MAGI code has using the continuous neutron energy cross-sectionbeen developed for the purposes of core and ftiel library.managements in JOYO MK-11 core, which can The MCNP-4A was applied to calculate the neutroncalculate the core characteristics by coupling the spectrum in the specimen from any subassemblyneutronic and thermo-hydraulic properties. surrounded on three sides by stainless steel reflectors.
The neutron flux and the burnup of each fuel pin The calculation was performed in fixed neutron sourceare then obtained by ESPRIT411) code. In ESPRIT-J mode. For properly evaluating the neutron fluxcode, the neutron flux distribution within the distribution within the subassembly, its internalsubassembly is calculated using the diffusion theory structure was simulated in 3-dimensionalwith one neutron energy group. The diffusion equation configuration. The FSXLIB-J3R2 cross-section
3) -3.2, wasis solved analytically using the Green function. The library' which was processed from JENDLone group neutron flux at the boundary of hexagonal- used. The resulting neutron flux was non-nalized usingZ calculation mesh is obtained by the MAGI the number of neutron sources at full reactor power, ascalculation result, and is used as the boundary calculated by MAGI code.condition of diffusion equation. The neutron flux thus calculated served as basis for
The calculated and measured bumup data obtained determining the fission rates of individual fissileon driver fuels are presented graphically in Figure 3 materials at each position in the subassembly. In the
- 879 -

JAERI-Conf 2003-019
case of low burnuip fel, the changes of fuel were corrected, compared with the evolution when thecomposition during irradiation were considered to reactor was shut down. In order to adjust a total fissilehave been negligible, and the number of fission content, higher 235U content fuel has a low 239pU. Inreactions of each nuclide was derived by integrating addition, a small amount Of 241pU was included inthe fission rate through the duration of irradiation. MOX fuel as a fissile material, and the tendency of
The burnup was calculated applying the equation. both plutonium nuclides is almost the same as 131U
BU(%FIMA = (NF) / NDBOL (1) case.whereND13OL: Density of heavy metal atoms at BOL 4. Analysis of minor actinides in MOX fuelsNF : Number of fission reactions of heavy metals irradiated in JOVOduring irradiation
The calculated burnup values were compared with Above mentioned, the low DF fuel is initiallymeasurement data on three fuel pins irradiated in including fission products that are somewhat similarJOYO. The MCNP-4A code proves to be better suited to irradiated one. In addition, the existence of MAthan MAGI and ESPRIT-J for calculating the neutron (minor actinides) is not negligible. To evaluate theflux spectrum in the transition region close to design feasibility and perfon-nance of the fuelreflector. As a result, the Monte Carlo calculation including MA, many aspects of irradiation behaviorshowed the validity of measured bumup distribution at are required, however, there are not so many data tothe 4h row of fuel subassembly. cover such kind of requirements.3.2.3 Isotopic composition of uranium and plutonium The isotopic composition of MA is essentialbased on the measurement of fuel burnup information to evaluate the transmutation behavior. In
It is necessary to establish a technology of order to achieve such experimental analysis, ourgeological storage including safety and criticality research group is concerned with a development ofdesign of facility for high bumup U02 and MOX analytical methods for MA contained in MOX fuelspent fuels that were expected to accumulate in the irradiated in the experimental fast reactor JOYO.future. In particular, a concept was discussed to Therefore it is necessary to develop the isolationrationalize the design by considering degradation of method of each element for isotopic analysis.fuel reactivity according to iadiation, namely bumupcredit. herefore verified estimation tools as well as 4.1 Experimentalexperimental data of spent fuel were required to For neptunium analysis, MOX fuels with 29.97introduce the burnup credit successfully. wt% plutonium (231pU : 3pU 2pU 2pU : 242p =
As described above, the isotopic composition of 0. 15 76.04 20.01 319 06 1) in 83 or 12.1 wt%uranium, plutonium and neodymium for irradiated enriched uranium were prepared. These fuels wereMOX fuel in a fast reactor were analyzed on the fabricated in fuel pins at the Tokai Works of NC, andprocess of burnup measurement. It is expected that the irradiated up to 120 GWd/t in the 2nd and 3rd row ofdata will be attributed to the evaluation for the sake of JOYO MK-H core. For the MOX fuels beforebumup credit. irradiation, it was confirmed to contain no 237 Np by
In the case of driver fuels, three types of fuel currently developed analytical method.specification were irradiated by mainly difference of The bumup was calculated by using computer code235 U enrichment, 12.5 %, 13.6 and 18.5 %, ESPRIT-J and the calculated burnup was confin-ned byrespectively. The ... U content (231U/lj+pU) of fuel measuring the isotopic ratio of neodymium. Thewas linearly decreased with burnup shown in Figure 4 burnup and the isotopic ratio of uranium and
plutonium of each piece are shown in Table 1. Theal U 2 - - data for samples from No.6 to No.10 include- 15.0 0 Initi - 35: 12.5 %
calculated value.E 14.0- A Initial U-235: 13.6 %2 1 Next, for isolation of americium, MOX fels with013.0 a Initial U-235: 18.5 % 29.97 wt% plutonium ... Pu : 29pU 241pU : 241PU
Z 2.0 242pU = 087 58.13 22.05 583 312) in 21.5 wt%+ 11.0 -- - enriched uranium were prepared. These fuels were
10.0 also fabricated in fuel pins at the Tokai Works of NC,9.0 and irradiated up to 26 GWd/t in the 3rd row of theC�a JOYO MARK-11 core. These MOX fuels contained7.0 0.9 Wt% 24 'Am before irradiation.
0.0 2.0 4.0 6.0 8.0 10.0 4. 1.1 Neptunium separation methodBumup The flow sheet for neptunium separation processes
Fig.4 Content of U-235 as a function of bumup. is cited in reference 14.The decontamination factor for plutonium from the
It is assumed that the extent of degradation is neptunium fraction was much higher than 106 . The useproportional to initial content. These analytical data of 239Np as a yield tracer made b 243Am standard
- 880 -

JAERI-Conf 2003-019
sample is essential to know accurate content of 237 Np precipitate trivalent curium. After the filtration, thein each sample solution of MOX fuel. Thirty to eighty precipitates, Cm-fraction, were washed with a 40 mlpercent of the initial neptunium was mounted as an of fresh water and the precipitates were dissolved inalpha counting sample. 15 ml of 0.5 M HN03. The filtrates and the washing4.1.2 Mutual separation method between americium water were taken as Am-fraction.and curium
The flow sheet of mutual separation procedures 4.2 Analytical results of 237 Np in MOX Fuelsbetween americium and curium is cited in reference The results of isotopic composition based on the15. As the first step, americium, curiurn and FP's were analysis of Np-fraction are shown in Table .separated from uranium, plutonium and neptunium by According to a result of alpha spectrometry, the alphameans of the same method as neptunium separation. peaks of plutonium, much smaller than those of 237 Np,
was observed even in the neptunium fraction obtained.
Table Isotopic compositions of uranium, The recovery of neptuniurn is about 30 wt% as anplutonium and neptunium-237 content. overall chemical yield. MOX fuels analyzed in thisSpec work did not contain neptunium before irradiation.
This means that we succeeded in detecting between I imen Burnup U isotopic ratio (at%) Np-237 (wt%) and I 00 PPM Of 237 Np in irradiated MOX fuels. The
No. GWd/t U-234U-235 U-236 U-238 measured technique developed in the present study is applicable1 119 0.1 5.45** 0.7 93.8 0.066 +0.0176 to the future analysis of MOX fuels that will be2 113 0.1 5.56** 0.7 93.7 0.06 ±0.0039 impregnated with neptunium.
The results of neptunium analysis are shown in3 105 0.1 5.7** 0.7 93.6 0.059 +0.0297 Figure 5. The 23 7Np content slightly increased with4 82.4 0.1 5.96** 0.6 93.3 0.041 +0.0096 burnup. The contents of neptunium are plotted as a5 66.4 0.1 6.56** 0.5 92.9 0.008 ±0.0022 function of burnup and compared with the calculation6* 45 0.1 7.12** 0.3 92.5 0.002 ±0.0013 by ORIGEN-2. The calculation was performed by7* 34 0.1 7.34** 0.3 92.3 0.003 ±0.0014 taking the initial content of 237 Np(Npo:wt%) as a8* 35 0.1 I 1 I ** 03 88.5 0.015 +0.0080 parameter. The nuclear data for these calculations
were taken from the standard ORIGEN-2 data set for9* 28.1 0.1 11.3** 03 88.4 0.018 ±0.0033 Liquid Metal Fast Breeder Reactor 16).
10* 16.7 0.1 11.6** 02 88.2 0.016 ±0.0037 The observed values of the contents of neptuniumI I 0 0 12.1 *** 0 87.9 agreed well with the calculation at Np0=0. No markedSpec the accumulation of neptunium in the MOX fuels isimen Burnup Pu isotopic ratio (at%) observed as shown in Table I and in Figure 5. The
content of neptuniurn does not exceed 0.08 wt% in 30No. GWd/t Pu-238 Pu-239 Pu-240 Pu-241 Pu-242 wt% MOX fuels, which were fabricated by using 831 119 0.3 69.3 26.8 2.6 0.9 wt% enriched uranium and were irradiated up to about
2 113 0.3 69.6 26.6 2.6 0.9 120 GWd/t in a fast reactor. The content is comparable3 105 0.3 69.9 26.3 2.6 0.9 to that estimated for light water commercial reactor4 82.4 0.3 70.1 26.1 2.6 0.9 fuel of 33 GWd/t"). This conclusion is clearly5 66.4 0.3 72.4 24.3 2.3 0.8 underscored by this experiment and confirmed with
prototype model calculation. Thus, we have proved6* 45 0.2 73.7 22.6 2.8 0.7 through the experimental analysis that the fast reactor7* 34 0.1 73.4 22 2.9 0.7 is much more suitable as a burner of MOX fuels with8* 35 0.2 73.9 22.5 2.7 0.8 respect to the accumulation of highly radiotoxic 237 Np.9* 28.1 0.2 74.1 22.1 2.8 0.7 The accumulation of 237 Np is not so sensitive to the
enrichment of uranium while it shows a small second10* 16.7 0.1 74.5 21.6 3 0.7 order dependency to burnup, which indicates theI I 0 0.1 75.2 20.6 3.3 0.7 contribution of double neutron capture from 21 'U, as is
calculated value ** initial U enrichment 83% shown in Figure 5. The calculation assuming the (n,initial U enrichment 12.1 2n) cross-section of 238U to be zero shows to
reproduce 23-3/4 of the observed fori-nation of 237 Npat about 100-12OGWd/t. Thus, we have to say that
Ten mg of sodium bismuthate (NaBiO3) was added formation of 237 Np from 238U is not so small ininto the Arn-Cm-F!'-fraction as the oxidizing reagent comparison with that from 235U . The calculationfor americium. The solution was mixed with solid shows that the consumption of 23"Np will be expectedNaBiO3 by stirring for 50 min. at 'C. Then, 10 ml for the MOX fuels of Npo>0.25 and that the(80 mg/ml) of disodium hydrogen-phosphate production and transmutation of 237 Np are roughly(Na2HP04) was added into the solution to form the balanced at about Npo�0.25. This information willprecipitates of BiPO4, which was expected to co- give a guideline when a fast reactor will be utilized as
- 88 -

JAERI-Conf 2003-019
a burner of23'Np. 241, 242, and 243 were observed clearly but no peakswere observed at 239, 240 and 244.
4.3 Isotopic analysis of americium in irradiated The bumup of the presently analyzed specimensMOX fuel were below about 27 GWd/t. Thus, isotopic ratio of
Regardless of incomplete oxidation, the chemical 242'Am was less than 062 at% and that of 243 Am waspurity of isolated americium was good enough to less than 082 at%. In these low burnup region, themake mass spectroscopic analysis for determining contents of 242mAm and 243 Am increased almostisotopic composition by using the isolated Am- linearly with bumup, as is shown in Figure. 6.fraction. In all mass spectra observed, mass peaks at
100.0NP mcatnt
p =tmt (,M%) 99.0 00 %Xb
0.6 0* Ob-d 0(initial U-235: 8.3m%) 98.0 ( 2Am
13 Ob.-.d In. 97.00.4 MitialNlicwt-t (initia U235: I .1 WI.)
1. 0.50.1% 1.52. 0.25m% op-Y.b.]:
014%------------------------- tp.,bt(..Mili..fpi.
0.2 7Z Ck.ltd by ORIGEN-2 Emiti.113-235:8.3m%
mitt.]U-233:12.1,�ft 0.5
0 50 100 150
Bum-up GWd/t 0.00.0 10.0 20.0 30.0
Bump GWd/t
Fig. 5 Np-237 content as a function of bum-up. Fig. 6 Am isotopic composition change with bumup.
It is not proper to say about the transmutation program and the contribution to feasibility study onbehavior from 24 'Am on the basis of the JNC.information presently obtained. However at leastwe can say that the content of 243 Am is larger than Referencesthat of 242"'Arn. This implies that the formation of243 Am from 142pU that was contained in initial MOX 1) K.Uematsu, Y. Ishida, S. Kobayashi and J.ftiels exceeded the formation from 242mAm(ny) Komatsu, "Operating Experience of thereaction. ALPHA-GAMMA Facility(AGF)," Poc. 22nd
Conf on Remote Systems Technology,5. Conclusion Washington D.C., U.S.A., Oct. 28, 1974 3
(1974) .Current status of Post-irradiation examinations 2) K. Uematsu, Y. Ishida, K. Suzuki and S.
as well as the PIE facilities in OEC is described. Yamanouchi, "Materials Monitoring FacilityThese facilities have been operating safely and (MMF) for Fast Reactor Materials Testing,"successfully. Proc. 22nd Conf. on Remote Systems
Up to now, the bumup measurement has been Technology, Washington D.C., U.S.A., Oct. 28,carrying out, and the total numbers of examined 1974,11(1974).specimen are mounted to 129 at the range from 3) K. Uematsu Y Ishida, S. Seki and T. Hayashi,0.003 to 13.28 %FIMA in te JOYO MK-11 core. "Fuel Monitoring Facility (FMF) for FastSome calculation tools were verified by comparing Reactor Fuel Subassembly Examinations,"with the measured value, the accuracy for Proc. 22nd Conf, on Remote Systemsestimation is highly reliable. Technology, Washington D.C., U.S.A., Oct. 28,
On the other hand, analytical technique for MA, 1974, 20(1974).such as neptunium and americium, was described in 4) T. Itaki, T. Shimada and H. Tachi, "Presentthis paper. It is expected that the importance of Status of the Fuel Monitoring Facility at the -these analytical data will be raised to evaluate Arai Engineering Center," Proc. 30th Conf ontransmutation behavior and the effect for Remote Systems Technology, Washington,radioactive waste management. D.C., U.S.A., Nov. 15, 1982 216 1982).
These data and the technique will be become a 5) S. wanaga Y Nakamura, T. Nagamine and A.key technology to be progress JOYO MK-111 Koizumi, "Robotic Manipurator System in
- 882 -

JAERI-Conf 2003-019
FMF-extention", Proc. Int. Conf. on Fuel 11) A. Arii, T. Aoyama and S. Suzuki, "Core andManagement and Handling, Edingurgh, UK, Fuel Management Experience of the JOYOMar. 1, 1995, 20(1995). Irradiation Core (the MK-11 Core), Nihon-
6) T. Itaki, J. Komatsu, S. Yamanouchi and Y. Genshiryoku-Gakkai Shi (J. Al. Energy Soc.Enokido, "Present Status of the Metallography Japan), 39, 315(1997)[in Japanese].Cell at the -Arai Engineering Center", Proc. 12) J. F. Briesmeister, Ed., "MCNP - A General30th Conf. on Remote Systems Technology, Monte Carlo N-Particle Transport Code, Ver.Washington, D.C., U.S.A., Nov. 15, 1982, 24 4A," LA- 2625(1993).(1982). 13) K. Kosako, "A Continuous Energy Cross
7) K. Maeda, T. Nagarnine, Y. Nakamura, T. Section Library for MCNP Based on JENDL-Mitsugi and S. Matsumoto, "Reassembling 3.2," JAERI-Data/Code-94-20 1994).Technique for Irradiation Vehicle d at Fuel 14) S. Koyama, Y. Otsuka, M. Osaka, K.Monitoring Facility (FMF)," Proc 3 JAERI- Morozumi, K. Konno, M. Kajitani and T.KAERI Joint seminar, Japan Atomic Energy Mitsugashira, "Analysis of Minor Actinides inResearch Institute, Oarai, Japan, March 25-26, Mixed Oxide'Fuel Irradiated in Fast Reactor,1999, 173(1999). (I) Determination of Neptunium-237", J. Nucl.
8) N.C. Furcola, "Standard Test Method for Atom Sci. Technol., 35, 406(1998).Percent Fission in Uranium and Plutonium 15) S. Koyama, M. Osaka, K. Konno, M. Kajitani,Fuel (Neodymium-148 Method)," 1996 Annual T. Mitsugashira, "Analysis of Americium inBooks of ASTM Standards, 12.02, E321-96 Irradiated MOX Fuels by Applying a New(1996). Isolation Technique Based on Americium
9) S. Koyama, M. Osaka, T. Sekine, K. Oxidation," GLOBAL'97, Yokohama, Japan,Morozumi, T. Namekawa and M. Itoh, Oct. 5-10, 1997, 1512(1997)."Measurement of Bumup in FBR MOX Fuel 16) A. G. Croff, "A User's Manual for theIrradiated to High Bumup," J. Nucl. Sci. ORIGEN2 Computer Code," ORNL/TM-7175Technol., [to be submitted] (1980).
10) S. Maeda, T. Sekine and T. Aoyama, "Fast 17) M. Benedict, T. H. Pigford and H. W. Lebi,Reactor Core Management in Japan Twenty "Nuclear Chemical Engineering SecondYears of Evolution at JOYO," Trans. Int. Edition", 3 387, McGraw-Hill Book Company,Meeting of RRFM2001, Aachen, Germany, New York, U.S.A. (I 98 1).Apr. 13, 2001, 56(2001).
- 883 -

JAERI-Conf 2003-019 JP0450165
Characterization of Spent Nuclear Fuels by an Online Combination ofChromatographic and Mass Spectrometric Techniques
Ines GONTHER-LEOPOLD', Beat WERNLI and Zlatko KOPAJTICLaboratory for Materials Behavior, Paul Scherrer Institute, 5232 Villigen PSI, Switzerland
The determination of the burn-up is one of the essential parts in post-irradiationexaminations on nuclear fuel samples. In the frame of national and international researchprograms the analysis of the isotopic vectors of uranium, plutonium, neodymiurn and someother fission products and actinides was carried out in the Hot lab of the Paul ScherrerInstitute in the last years by using high-performance liquid chromatography coupled onlinewith an inductively coupled plasma quadrupole mass spectrometer. In the meantime amulticollector ICP-MS, suitable for igh precision isotope ratio measurements, was installedwithin the Hot lab and has been used now in combination with a chromatographic separationsystem for the first time for burn-up determinations of nuclear fuel samples. The results ofthese investigations, a comparison of both methods with the classical technique for burn-upanalyses (thermal ionization mass spectrometry), the advantages and limitations of themethods and the accuracy and precision of this type of analyses are presented in the paper.
KEYWORDS: nuclearfuels, burn-up, HPLC, ICP-MS, isotopic vectors, isotope dilution
1. Introduction Therefore, the experimental determination of theburn-up in an irradiated nuclear fuel is carried out by
The objective of different international programs analyzing the number of U and Pu atoms and thedealing with post-irradiation examinations (PIE) of number of one fission product that can be used asnuclear fuels is to im rove the knowledge of the burn-up monitor. The accepted and mostly usedp 148inventories of actinides, fission and neutron activation method for bum-up determination is based on Nd asproducts in MOX and/or U02 spent fuel elements. The burn-up monitor since Nd has several advantagesprediction of the source term of these nuclides is of compared with other fission products.major importance in numerous nuclear fields, such as 0 Nd is not volatile and does not move in the fuel rod.• definition of basic licensing data for U02 and Therefore, local burn-up determinations are
MOX fuel possible.• increase of fuel enrichment for power reactors 0 Nd is not a component of the non-irradiated fuel
with a possible reevaluation of iticality licenses material.• improvement of waste source term codes for high 148Nd is not radioactive. Consequently, the method
burn-up fuel conditions and for MOX fuel is not influenced by a decay time.recycling scenarios. The fission yield of 148 Nd is nearly independent
The mass spectrometric determination of trace from the neutron energy and from the fissionableamounts of actinides, activation and fission products in isotope.spent fuel provides a relevant data base f the Consequently, the characterization of the burn-up ofvalidation of the theoretical models and represents an a nuclear fuel includes the mass spectrometric analysisexperimental basis for the minimization of the of the isotopic vectors of U, Pu and Nd and theuncertainty in the prediction models. determination of the concentration of these elements.
The burn-up of a nuclear fuel as one of the important The quantification is normally carried out by isotopeparameters that has to be determined for PIE is dilution, which is known as the most preciseproportional to the quotient of the number of fissions quantification method for mass spectrometric analyses.NF and the number of heavy metal atoms Nom (uranium Since numerous isobaric overlaps restrict the directand plutonium) which were present in the fuel before determination of most actinides and fission products byirradiation. The burn-up is given in FIMA (fissions mass spectrometry, conventional methods for burn-upper initial metal atoms) determination require a careful and often time-
consuming chemical separation of the analytes. U and
NF Pu show isobaric interferences with each other and01bFIM4 100 (1) with other actinides (e g. 238U/231lpU, 241PU/24IAnl),
N Om whereas Nd is interfered by other lanthanides (142 Ce,
CamTmdingautlu�Tel. +41-56-310-M6,FwL.+41-56-3104438,E4ral-gxdha(�
- 884 -

JAERI - Conf 2003 - 019
147PM, 147Sm, 148SM, 11OSM). For the characterization of U, Pu and Nd the
In order to combine the chemical separation with the following standard materials were used:mass spectrometric detection into one analytical step a 0 IRMM-073, NBS-UO10 and NBS-UlOOhigh-performance liquid chromatographic system uranium standards(HPLC) was online connected to an inductively 0 NBS948 plutonium sulfatecoupled plasma quadrupole mass spectrometer 0 Nd La Jolla reference material(Q-ICP-MS) within the Hot lab of the Paul ScherrerInstitute (PSI). This hyphenated technique was used 2.3 Instrumentationwithin the last years routinely for bum-UP 2.3.1 HPLCdeterminations of MOX and U02 fuel samples in our A DX300 HPLC system (Dionex, Switzerland)lab. equipped with an lonPac CG5 or CG10 4 mm x
However, the analytical figures of merit of a 50 mm) as guard and IonPac CS5 resp. CS10 4 mm xquadrupole based mass spectrometer measuring the 250 mm) as analytical column was used in combinationdifferent isotopes sequentially were shown to be not with te Q-ICP-MS. The flow rate of this HPLC is Icomparable to the perforinance of the classical ml/min and the injection valve is equipped with a I mltechnique (thermal ionization mass spectrometry, sample loop.TIMS). Therefore, end of 2001 a multicollector ICP For online coupling to the MC-ICP-MS a modernmass spectrometer MC-ICP-MS) measuring up to nine DX-600 GS50 HPLC system (Dionex, Switzerland)isotopes simultaneously was installed within our lab equipped with a CG5A 2 mm x 50 mm) as guard and aand has been used in combination with a HPLC CS5A 2 mm x 250 mm) as analytical column wasseparation system for first bum-up determinations. The installed. Because of the smaller column dimensionsgeneral advantages and limitations of both techniques the flow rate of this system is restricted to 025 nil/minas well as first comparative results will be discussed. and the injection valve has a sample loop of only 0025
ml.2. Experimental The chromatographic separations of U, Pu and Nd
were performed according to the methods described2.1 Sample Preparation earlier'). U was eluted with M HCI, Pu with 04 M
Irradiated MOX and U02 fuel samples from light HNO, and Nd was separated from other lanthanideswater reactors were dissolved using a HN03/HF with a linear gradient of a-hydroxyisobutyric acid(Merck, Suprapur) mixture in a high pressure digestion (HIBA).equipment at 150 'C for three hours. Mother solutions The coupling of the HPLC systems to thewere prepared by dilution with M HN03 up to a corresponding ICP-MS is achieved by passing theconcentration of about 0.5 mg fuel per ml solution. effluent of the chromatographic column to a 4-way
For isotope dilution aliquots of the mother solutions valve. All sample components separated on thewere mixed with enriched isotopic spike standards chromatographic column can be either sent directly to(... U (IRMM-040a), "Pu (IRMM-049c) or 244pU the ICP-MS for analysis or to waste in order to keep the(IRMM-042a), "Nd (ORNL)) and diluted with sample loading into the mass spectrometer to a1 % HN03 A further set of aliquots was directly minimum.diluted with I HN03 without spike addition. Pu can 2.3.2 ICPMSbe found in fuel solutions in different oxidation stages, Inductively coupled plasmas are used since moreof which the most stable is pU41 . Because the than 25 years as excitation source for the opticalchromatographic separation of Pu and U is based on emission spectrometry. Te possibility to analyse thePU02 2+ HC104 was added to all aliquots in order to ions that are produced in an argon plasma by a mass
2+oxidise the PU t P02 spectrometric detector was first described in the
Aliquots of the spiked and unspiked sample eightie 2.
solutions were injected three to five times into the In a Q-ICP-MS the ions entering the massHPLC-ICP-MS (quadrupole or multicollector) systems spectrometer are separated according to theirfor the determination of the isotopic composition of the mass-to-charge ratio in a quadrupole mass filter and thedifferent elements. detection of the ions is carried out with an electron
multiplier in a fast but sequential mode. Since the2.2 Correction of Mass Bias Effects entire mass range can be measured with a QICP-MS in
Mass discrimination represents a limitation to the less than one second, these instruments are suitable foraccuracy of isotope ratio measurements in all mass multielemental analyses. However, the precision ofspectrometric methods. Ions entering the ICP-MS isotope ratio measurements is not comparable to theexperience so called mass bias effects, and this bias classical TIMS technique, because of the sequentialfavors the transmission of the heavier isotope into the detection mode.mass spectrometer. In order to correct for these effects In a MC-ICP-MS the ions are normally separated instandard materials with a known isotopic composition a magnetic sector field and the detection is carried outwere analyzed together with the samples. by a set of 9 to 12 Faraday cups that allow the
- 88 -

JAERI-Conf 2003-019
simultaneous detection of different isotopes over a from the separation column with 04 M HN03-
restricted mass range of about 15 %. Therefore, isotope Afterwards M HO is used as mobile phase in order toratio measurements of MC-ICP-MS can provide elute U. This separation is efficient enough on bothprecision as low as 0002 RSD for different chromatographic systems 2 nun and 4 mm columnelementS34). These results are in the range of or even diameter) to prevent any isobaric interference betweensuperior to TIMS, which has been the preferred method 2311pu, which is present at trace concentrations and 238 Uso far for highly precise isotope ratio measurements for as the main component of U02 and MOX fuel.elements with relatively low first ionization potentials, In principle, both elements could be determined insuch as U, Pu and Nd. one chromatographic run. However, the concentration
The Hot lab of the PSI is equipped with a PQ2+ of U is much igher than the Pu concentration i fuelQ-ICP-MS (ThermoElemental, UK) and a Neptune samples. Therefore, two different dilutions of theMC-ICP-MS (hennoFinnigaii, Germany) with nine samples have to be analysed: a higher concentrated fuelFaraday cups. solution for the Pu determination and a more duted
For handling and analyzing highly toxic radioactive sample for U. Furthermore, using MC-ICP-MS it is notnuclear fuel samples pails of the respective HPLC ssible to analyze the entire mass range from 233 to
system as well as the sample introduction part of the 40 Pu r even 244pU within one single measurementICP mass spectrometers are encapsulated within procedure. Two different Faraday cup configurationsglove-boxes. have to be determined: one from mass 233 to 239 for
the U measurements and one from mass 238 to 242 or3. Results and Discussion 244 for Pu analyses.
Figure I shows the chromatographic separation of U3.1 Determination of U and Pu and Pu in an unspiked UO, fuel sample. he
Due 'to isobaric overlaps between U and Pu a measurements were performed on theseparation of these two elements is necessary for BPLC-MC-ICP-MS system.bum-up determinations. Pu can be eluted. as PU02 2-1
1.2 -
PU U
1.0
0.8---*--238
>1 --9-239'Ri 0.6 - 240
241
0.4 242
0.2
0.0
0 2 4 6 8 10
Time (min)
Fig. I Separation of Pu and U in an U02 fuel sample (I s integration time of the MC-ICP-MS, HPLC injectionvolume: 25 RI, concentration of the analyzed solution: 15 Rg fuel/rnI solution)
3.2 Determination of Nd However, the selectivity of the separation can beIn aqueous solutions, the group of lanthanides is increased with the use of appropriate chelating
present as strongly hydrated trivalent cations. agents such as HIBA or oxalic acid. Lanthanides thatBecause their ionic properties are very similar, they form the most stable complexes with HIBA, such ascannot be separated easily by cation exchange. lutetium. will elute first from the separationcoluinn.
- 886 -

JAERI-Conf 2003-019
U and Pu as the main matrix elements can be eluted Figure 2 shows a typical chromatographicwith HO resp. HN03 before the separation of the separation of Nd and the interfering element Sm inlanthanides. This is very important because the high an unspiked MOX fuel sample. These measurementsconcentration of these elements may decrease the were performed on the BPLC-Q-ICP-MS system.sensitivity of ICP-MS for trace elements like Nd.
400000
300000 ------- -- o- 42
--9-- 143
Nd 6 144
200000 145L Sm0C )K 146B
--6-148
100000 --+--150
026 27 28 29 30 31
Time (min)
Fig. 2 Separation of Sm and Nd in a MOX fiiel sample (10 ms dwell time per mass of te Q-ICP-MS, BPLC
injection volume: I l, concentration of the analyzed solution: 20 �tg fhel/ml solution)
3.3 Precision and Accuracy of the Isotope Ratio The data in Table 2 clearly indicate the high
Measurements accuracy for MC-ICP-MS and even for the online
Typical relative standard deviations (RSD, in %) coupled I-IPLC-MC4CP-MS where the deviation
for the determination of isotopic vectors for the from the corresponding reference value for U and
investigated elements U, Pu and Nd are listed in Nd is only slightly higher.
Table I for both techniques.
Table 2 Accuracy of isotope ratio measurements for
Table I Precision of isotope ratio measurements for Nd (aJolla) and U (NBS-U500) reference
BPLC-Q-ICP-MS and BPLC-MC-ICP-MS materials (the number in brackets corresponds to
determined for U, Pu and Nd the absolute standard deviation (I s)- the accuracy
is calculated as te deviation from the reference
Isotope HPLC- HPLC- value)
abundance Q-ICP-MS MC-ICP-MS
(At. %) Ratio Reference MC-lCP- ffi�L--C-M
< 0.1 2 - 0 % RSD about I RSD value Ms C-
0. I 2-5%RSD < I RSD -ICP-MS
I 10 1-2%RSD <0. % 143 Nd/ 144Nd 0.511858(4) 0.511844(9) 0.511921(38)
> 10 < I RSD < 0.05 % RSD accuracy -0003 % 0.012 %
234u/23gu 0.010422(4) 0.010443(2) 0.010462(66)
In order to evaluate the accuracy of an analytical I accuracy + 02 + 04
method it is necessary to measure certified reference
standards with the same procedure as te samples
and to compare the results with the published 3.4 Comparison with TIMS
reference values. The comparison between the A general advantage of t classical TMS
reference values for isotope ratios of U and Nd and technique compared to plasina based methods is the
the measured results for MC-ICP-MS and very stable ionization process leading to minor
HPLC-MC-ICP-MS is shown in Table 2 instabilities of the signal. Since TIMS is
- 887 -

JAERI-Conf 2003-019
characterized by bad ionization efficiency for can be developed. Online coupled HPLC-ICP-MSelements with a higher ionization potential, the systems have a further benefit: the separation of themethod is restricted in its applications to only a few sample matrix from the analyte elements.elements of the periodic table. Mass bias effects are Particularly for the determination of trace elementsapproximately an order of magnitude larger in in a high concentrated matrix, the online separationICP-MS systems than the mass discrimination of matrix elements may lead to significantly lowerobserved during TIMS measuremeniss). However, detection limits, because signal suppression due tosince these effects can be properly corrected by high concentrated matrix elements is avoided.using reference materials this is not a drawback ofICP-MS methods. Appendix: Review about PIE activities at PSI
Major advantages of online coupledHPLC-ICP-MS techniques are the simplified sample Finally, Table 3 summarizes the PIE activities ofpreparation procedure, which is very important the Paul Scherrer Institute. End of 1999 theespecially for radioactive samples with a high dose international ARIANE program (organized byrate, the speed of the analysis and the better Belgonucl�aire) was finished, where ITU (Karlsruhe,ionization efficiency for elements with high D), SCK (Mol, B) and PSI took part as referenceionization potentials. At least the quadrupole and laboratories. Further ongoing and future projects forsectorfield ICP-MS systems are real multielemental PIE and the corresponding fuel characteristics aretechniques compared to TIMS (or MC-ICP-MS) also included in the table.were only a restricted mass range can be detected The aim of the ARIANE poject was to providesimultaneously. improved knowledge of the inventories of actinides
The precision and accuracy demonstrated for the and fission products in U02 and MOX fuelsMC-ICP-MS technique so far is absolutely irradiated at various bum-up levels for both PWRscomparable to the classical TIMS method. However, and BWRS7). The ARIANE project has beenmost of these data are based on measurements using launched end of 1994 with the participation of 5steady-state signals of several minutes or even organizations and was focused on two objectives:longer. Since the online combination of a 0 provide a large experimental data set regardingchromatographic separation system like HPLC with fuel selection for examination and the numberan ICP-MS leads to transient signals with a signal of measured isotopes, some of them in very lowlength of only about 30 to 60 seconds, the precision concentrations,of the isotope ratio measurements is slightly reduced 0 emphasize the accuracy of measurements byby less than one order of magnitude 6) . However, the using various methods of analysis and byanalytical performance of an online coupled exchanging aliquots between laboratories forHPLC-MC-ICP-MS system is still comparable with cross-checking.the classical TIMS technique. PROTEUS is a zero-power research reactor
operated at PSI in the Laboratory of Reactor Physics4. Conclusion and Systems Behavior. The PROTEUS program is a
joint effort by PSI and the Swiss Nuclear utilitiesWith the online combination of a HPLC and an with particular phases receiving additional support
ICP-MS system it is possible to separate interfering from other partners. The ongoing second phase ofelements and to determine the isotopic composition the WR-PROTEUS experimental program isof tese elements in a single analytical procedure. dedicated to the reactor physics investigation of well
The comparison of the results from QICP-MS characterized highly burnt fuel samples from Swissand MC-ICP-MS after HPLC separation shows a nuclear power plants by means of reactivitysignificant improvement in the analytical precision measurements and chemical assays. The chemicalof the transient data with multicollector detection. assays define the nuclide compositions of the
Whereas the analytical performance of a samples and the measurements in the PROTEUSHPLC-Q-ICP-MS system is reduced for isotope reactor provide information on the reactivityratio measurements because of the sequential reduction with the fuel burn-up. The results will bedetection mode, the HPLC-MC-ICP-MS allows the used to validate theoretical methods for predictingsimultaneous composition and reactivity of fuel with bum-up,detection of up to nine isotopes and provides with special emphasis on the validation of high
8)therefore highly precise isotope ratio data. bum-up physics modelingDue to the high diversity of chromatographic
resins and eluents of the HPLC (inorganic acids,organic solvents and chelating agents) a separationmethod for most of the elements of the periodic table
888 -

JAERI-Conf 2003-019
Table 3 PIE activities at PSI
Prqgmn PNpwn Fbd Burn-up h*W*610SI narne Orwhokadan type (GWdt) Readw enricinnent*mdhW M
MM 40-60 Bez=4CH 59(PWR)
IHPLC-Q- ARLANE B*mui6pie LJO2 32-60 G6sgm�Gi 3.4-4.1
ICPMS NM Do&waa4NL
U02 33-56 (13WR) 6.4
NM 20-80 GdsgpnCH 33-5.5 ]HPLCMC- PROTELJS, PSI LJO, (PWR)1CF-MS Omen MOX 50-75 Letx4a*CH 4.7 %
FuWir NM 70 CASgA cli 43-55%M (PWR)
IHPW�MC, MALIBU Belg� MOXICPLMS i 75 3.75-55%
U02 AD(BWR)*hifolmidm-otin%ddmedas""'UAJforUOfi4Ptt4J+PuforMOX
The planned 4,LIBU project (also organized by determination of trace elements", Anal. Chem.Belgonucl6aire) is an extension to the ARIANE 52, 2283 1980).program with a burn-up level of the U02 and MOX 3) S. Ehrlich, Z. Karpas, L. Ben-Dor, L. Halicz,fuel samples of about 75 GWd/tM from BWRs and "High precision lead isotope ratioPWRs. Because of a shorter cooling time compared measurements by multicollector-ICP-MS into the ARIANE program the accuracies for the variable matrices", J Anal. At. Spectrom. 16,measurement of short lived isotopes should be 975 2001).improved). Supplementary to the ARIANE program 4) J.S. Becker, H.J. Dietze, "Precise and accuratea fourth reference laboratory (CEA, France) will isotope ratio measurements by ICP-MS",take part in the MALIBU project. Fresenius J. Anal. Chem. 368, 23 2000).
During the ARIANE program the 5) M. Rehkdmper, M. Sch6nbachler, C.H. Stirling,HPLC-Q-ICP-MS method was used for burn-up "Multiple Collector ICP-MS: Introduction tocharacterization within the Hot lab of PSI, whereas instrumentation, measurement techniques andfor te ongoing PROTEUS and future projects the analytical capabilities", Geostandardsnew HPLC-MC-ICP-MS technique is applied for Newsletter 25, 23 2001).PIE measurements. This will allow a direct 6) 1. Giinther-Leopold, B. Werrili, Z. Kopajtic D.comparison of the accuracy of the data on real fuel Giinther, ,Measurement of isotope ratios onsamples for both techniques with the results of the transient signals by MC-ICP-MS", Anal.classical TIMS technique that is used in other Bioanal. Chem. (submitted 2003).reference labs. 7) D. Boulanger, M. Lippens,,,ARIANE
International Programme, Final Report",References Report AR 2000/15, BN Ref. 0000253/221
(confidential), Belgonucl6aire 2000).1) S. R11in, Z. Kopajtic, B. Wernli, B. Magyar, 8) PROTEUS homepage,
"Determination of lanthanides and actinides in http://proteus.web.psi.churanium materials by high-performance liquid 9) D. Marloye, ,MALIBU Program, Minutes ofchromatography with inductively coupled the Introductory Meeting", Report MA 2002/03,plasma mass spectrometric detection", J. BN Ref. 0201886/221 (confidential),Chromatogr A 739, 139 1996). Belgonucidaire 2002).
2) R.S. Houk, V.A. Fassel, G.D. Flesch, H.J. Svec,A.L. Gray, C.E. Taylor, "Inductively coupledplasma as an ion source for mass spectrometric
889 -

JAERI-Conf 2003-019 JP0450166
Improvements to SFCOMPO - a Database onIsotopic Composition of Spent Nuclear Fuel
Kenya SUYAMA", Ali NOURI , Hirold MOCHIZUK, 2 and Yasushi NOMURA 3OECDINEA, Le Seine St-Germain, 12, Boulevard des iles, 92130, Issy-les-Moulineaux, France
2The Japan Research Institute, Limited, 14-17 Misaki-cho, Chiyoda-ku, Tokyo 101-0061, Japan3Japan Atomic Energy Research Institute, Tokai-mura, Naka-gun, Ibaraki 39-1195, Japan
Isotopic composition is one of the most relevant data to be used in the calculation ofburnup of irradiated nuclear fuel. Since autumn 2002, the Organisation for EconomicCo-operation and Development/Nuclear Energy Agency (OECD/NEA) has operated adatabase of isotopic composition - SFCOMPO, initially developed in Japan Atomic Energyresearch Institute. This paper describes the latest version of SFCOMPO and the futuredevelopment plan in OECD/NEA.
KEYWORDS: SFCOMP0, JAERI, NF,4, Post Irradiation Examination, IsotopicComposition, Database
1. Introduction EGBUC treats issues related to burnup credit. From thebeginning of development of SFCOMPO in JAERI,
Isotopic composition of spent nuclear fuel (SNF), there was a general consensus in EGBUC to supportobtained in post irradiation experiments (PIE) is one of SFCOMPO project.the important components required in the validation of Considering the requirement to gather new PIE databurnup credit methodologies. This led the Japan from many countries and input them into the database,Atomic Energy Research Institute (JAERI) in 1993 to it seems natural to operate SFCOMPO in anstart developing, SFCOMPO a database for isotopic international organization such as the NEA.composition of SNF. 1,2) Data were collected from the Based on this idea, the transfer was done in the firstopen literature and at first compiled on a database half of 2001. The transfer of the database from JAERImanagement system on a personal computer. to NEA was straightforward, as SFCOMPO had been
In the mid-1990's, the World Wide Web started to developed using common software. Since autumn 2002,be widely used by the scientific community and SFCOMPO is being operated on the NEA web site, andinterfaces between Web-based services and relational the database can be freely accessed at the URL:databases became available. SFCOMPO was then http:Hwww.nea.fr/html/science/wpncs/sfcompo/.upgraded to use this new technology for the collectionand display of data, using the freely available relational 2.2 Status of SFCOMPO
3,4) 2.2.1 Outlinedatabase system PostgreSQL .In order to provide an international framework for Table 15) summarizes the current status of the
the collection, dissemination and further development database. It contains measured isotopic compositionof the database, SFCOMPO was migrated from JAERI data from 14 reactors 7 PWRs and 7 BWRs) in 4to the NEA Web server in autumn 2002. countries. Data from 246 samples are available,
In this paper, the outline of the SFCOMPO database including 30 samples from fuels using burnableas operated on the web site of the Organisation for absorbers (UO2-Gd2O3). The database provides theEconomic Co-operation and Development/Nuclear composition for U, Pu, Am, Cm and several fissionEnergy Agency (OECD/NEA), will be presented and products (Nd, Cs, Sr). Since not only measured datathe plans for its future development will be discussed. but also ratios of the measured data are included, more
than 10,000 data points are registered.
2. Current Status of SFCOMPO 2.2.2 General Description of PIE dataThe latest version of SFCOMPO provides general
2.1 Operation of SFCOMPO in NEA information on all PIE data in HTML format.') TheThe Expert Group on Burnup Credit Criticality position of the sample in fuel assemblies and within the
Safety (EGBUC) is a technical group of the Workin fuel rods are also given as clickable maps whenever9 4Party on Nuclear Criticality Safety (WPNCS) under this data are available. ) Some PIE data contain theNuclear Science Committee of OECD/NEA. The history of fuel assembly shuffling and reactor operation.
Current affiliation: Department of Fuel Cycle Safety Research, Japan Atomic Energy Research Institute,Tokai-mura, Naka-gun, lbaraki-ken, 319-1195, Japan. Tel. 81-29-282-5834, Fax. 81-29-282-6479,E-mail: kenya�cyclone.tokaijaeri.gojp
- 890 -

JAERI-Conf 2003-019
These data are important both for understanding and is because it was not possible to perform isotopefor conducting the analysis of PIE. dependent decay corrections. To reflect this situation,
the database table was extended to input the coolingtime for each measured data point. The cooling time is
Table List of data in current SFCOMpO5) shown in the table of retrieved data and in the
Reactor Country Type Fuel NB1 viewgraph in Figure .Type U-235
Obrigheim Germany P 14x14 23 4
Gundre-mini Germany B 4 6x6 12ngen 35 -
Trino Italy P 15x15 39VercelleseJPDR Japan B 6x6 30 30
Tsuruga-1 Japan B 7x7 10aFukushima- 36 25 -
Japan B 8x8 (10)2Daiichi-3 IFukushirna- 18
Japan B M �M 20 - 7Daini-2 (10) a',
Mihama-3 Japan p 15x15 9
Genkai-1 Japan P 14x14 2 Vs
Takahama-3 Japan P 17x17 16(5)
Cooper USA B 7x7 6 10 XMonticello USA B M 30(5)
NCalvert USA P 14x14 9 5-Cliffs-1
H.B. USA P 1 5 x �15�[� 0 LRobinson 2 1 1 .1 "O is 20 25 30 35 40 45 50
1- Total Number of Sample, 2- Numbers in are number of 8urnup[GWDfTlHM1
U02-Gd2O3 fuel sample, 3 - MR 4 - BWR -_Cololl�n after S:S.28: years . 2� Coo after 0: years-
Gundrernmingen_ Cool fter 0: years Calvert-Cliffs I -Cooling after 67:5.08:6.5 yanr
Genkal-1 -Cooling after years aH.B.Robinson-2 -Cooling after 4.86:9.9: years
2.3 New Function of SFCOMPO Mlhama-3 -Cooling after 5: years 0brighelm -Cooling after 0: years
At the occasion of transferring SFCOMPO, we TrZakaharna-3 -Cooling after 0: years 0 Vercellese Coolln a
added several functions for further utilization of data.2.3.1 Preparation of figures Fig.1 An example of viewgraph generated by
One of the useful functions of SFCOMPO is to SFCOMPO - 23'U weight (kg/initial heavy metal)generate viewgraph displaying the variation of selectedcomposition data against measured bum-up. In the 3. Further developmentcurrent version, the format of the figures was changed
from GIF to PNG, since we found that some versions of Recent technical development has made it possiblethe plotting tool, used in SFCOMPO, cannot produce to provide direct access to the SFCOMPO databaseGIF formatted files because of copyright problems. through the Internet.Besides, SFCOMPO can also produce PostScript To further develop the usefulness of SFCOMPO itformatted files, providing a higher quality than PNG is required to add new data into the database. Asfiles, and thus more suitable for inclusion in a initially intended, it is hoped that, using the frameworkdocument. Figure is an example. of OECD/NEA, would facilitate the collection of new2.3.2 Numerical data in text file data from international community, even though
Numerical data used for generating the viewgraphs several PIE data are commercially restricted.can be obtained in text format. SFCOMPO also makes If other, already published, PIE data are found in thetables of numerical data in HTML formatted files. open literature, they should also be included. ForHowever, this format is not suitable for further data example, PIE data measured in JAERI had not beentreatment and it is therefore recommended to use the included in the SFCOMPO since the name of reactorsimple text formatted files for further treatment of the had not been revealed in the report. 6 It is thusnumerical data. necessary to receive information and feedback from2.3.3 Expansion of data table users in international community to point out if there
In previous versions of SFCOMPO, the cooling time are open PIE data, which are not included inwas fixed for each PIE data set. However, for some PIE SFCOMPO.samples, each isotope has a different cooling time. This In addition, there are more resources needed to
- 891 -
JAERI-Conf 2003-019
compile data from opened reports regarding the Energy Research Institute 1993) (in Japanese).description of PIE and possibly regarding the 2) M. Kurosawa, Y. Naito, H. Sakamoto, and T.evaluation of PIE data. Kaneko, "The Isotopic Compositions Database
In order to improve and facilitate the management of System on Spent Fuels in Light Water Reactorsthe SFCOMPO database, the NEA will develop a too] (SFCOMPO)," JAERI-Data/Code 96-036, Japanto edit the data through web browser. Atomic Energy Research Institute (1997)(in
Japanese).4. Conclusion 3) K. Suyama, "Spent Fuel Isotopic Composition Data
Base System on WWW -SFCOMPO on W3 -,
The SFCOMPO database is successfully operating JAERI-Data/Code 97-045, Japan Atomic Energyon the NEA web server. This is the only freely Research Institute (1997)(in Japanese).accessible database on PIE data. Input of new data will 4) H. Mochizuki, K. Suyama, Y. Nomura, and H.be performed under the international framework of Okuno, "Spent Fuel Composition Database SystemOECD/NEA. on WWW - SFCOMPO on WWW Ver.2 -,"
JAERI-Data/Code 2001-020, Japan Atomic Energy
Acknowledgernents Research Institute 2001) (in Japanese).The authors wish to thank Claes Nordborg and 5) K. Suyama, A. Nouri, H. Mochizuki, Y. Nomura,"
Pierre Nagel (OECD/NEA) for their support to SFCOMPO a database for Isotopic Composition ofintroduce SFCOMPO in NEA. We also would like to Nuclear Spent Fuel; Current status and futuretake this opportunity to express gratitude to Hiroshi development," International Conference on StorageOkuno and Toshiyuki Kaneko for their useful of Spent Fuel from Power Reactors, Vienna,comments on the transfer of SFCMPO from JAERI to Austria, June 26, 2003 (to be published).NEA. Finally we wish to thank Yoshitaka Naito and 6) T- Adachi, Y. Nakahara, N. Kohno, K. Gunji T.Masayoshi Kurosawa for their effort to start Suzuki, T. Sonobe, M. Onuki, K. Kato and E.SFCOMPO project in JAERI. Tachikawa, "Comparison of Calculated Values
with Measured Values on the Amount of TRU and
References FP Nuclides Accumulated in Gadolinium Bearing1) Y. Naito, M. Kurosawa and T. Kaneko, "Data Book PWR Spent Fuels," J. Nucl. Sci. Technol.,
of the Isotopic Composition of Spent Fuel in Light 31,1119(1994).Water Reactors," JAERI-M 93-061, Japan Atomic
892 -

JAERI - Conf 2003- 019
AUTHORINDEX
A Cossenet, A gn�s ........................................... 1.5 516A guiar L .................................................... 3.10, 5.18 Coulaud A lexandre ............................................... 7.3A hn, Joon G i ....................................................... 7.10 Courtois, G drard .................................... 5.19 13, 5.5A izaw a, Eiju ....................................................... 8.13 Cousinou, Patrick ............................. plenary, 21 57A ndo, Yoshihira .................................................. 5.10 Cowan, P . .............................................................. 3.9A nno, Jacques ........................ 1.3 113 114 56 78 Croft, . ................................................................. 3.9A o A . ................................................................. 2.12 Czifrus, Szabolcs ................................................. 5.21
Arm ishaw , M alcolm ............................... 3.2 49 53 b
B Danker, W . J . .................................................. plenaryBaeten, Peter ................................................ 2.19 74 D arby, Sam ............................................................ 4.6Barbry, Francis ....................................... 4.4 21, 8.5 D audin, Lucien .................................................... 10.1Barnes, Andrew .................................................. 1.12 D ean, C . ................................................................. 1.1Barreau A nne ....................................... 7.1 713 78 D ehart, M ark D ...................................................... 5.2Bars, Igor LE ........................................................ 8.8 D em eestere, J ......................................................... 9.5Barton, N . ............................................................. 1.1 D errien, Herve ....................................................... 6.1Basm anov, V alerii F . ............................................ 9.1 Devita A . .............................................................. 4.4Basselier, Jacques ........................................ 2.19 74 D'hondt, Pierre .............................................. 2.19 74Batifol M ............................................................ 7.17 D ias, H ernanth ....................................................... 6.5Battiston, J. T ........................................................ 4.4 D iop, Cheikh .......................................................... 5.7Baum ann, Roland ................................................. 4.8 D oi, H . ................................................................. 2.12Bay, X avier ......................................................... 5.25 D oucet, M ichel ...................... 4.4 410 414 71 86Bilodid, Y evgen .................................. 7.7 714 718 D uham el, Isabelle ......................... 1.14 21, 5.8 516Bindel, Laurent ................................................... 5.13 D uuc, M atthieu ................................................... 1.14B ioux, Philippe ................................... 7.1 713, 10.1 D unn, M ichael E .................................................... 5.1
Blom quist, Roger N . ....................... plenary, 32, 5.11Bogdanov V ladim ir N ................................. 2.16, 8.9 EBordy, J. M . .......................................................... 4.4 Eaton, M . D . ................................................. 8.2 816Bourva, L. C-A . .................................................... 3.9 Edge, Jane A . ................................................ 4.3 715Bow den, Russell L ........................ 1.20, 1.12 87 96 Egorov, V iktor P .................................................. 2.16Bower, D avid ...................................................... 1.15 Elam , K arla R . ....................................................... 1.7Bowm an, Stephen M . .................................. 5.2 514 Endo, Tom ohiro ................................................... 2.17Briggs, J. Blair ........................................ plenary, 31Bulanenko, Valeriy I ........................... 1.6, 1.16 117Burlakov, Evgeni ................................................ 2.18 FButterfield, K enneth B ........................................ 2.14 Farafontov, G enadiy G . ....................................... 6.3
Feher, Sandor ....................................................... 5.21C Fernex, F ..................................................... 5.17 519Cam ous, Bernard ................................................ 5.26 Ferris, M . ............................................................... 3.9Caplin, G r6gory .................................................... 7.3 Formishkin, Edw ard F .......................................... 2.16Cappiello, Charlene C ......................................... 2.14 Fouillaud, Patrick .................................... 2.1 78, 8.5Carros, H& ne ...................................................... 9.2 Frolov V ladim ir V . ............................. 1.6 116 412Chang, Jonghwa .................................................... 3.7 Fukahori, Tokio ..................................................... 6.2Chazelle, G . ........................................................ 5.18 Futarnata, H . ........................................................ 2.12Chiba, Satoshi ....................................................... 6.2Chtourbine, E ............................................... 5.18 95 G
Clayton, Angela .................................................... 6.5 G agnier, E ............................................................ 3.10Clem ent, Steven D . ............................................. 2.14 G arness, Andrd .................................................... 5.13C lem son, P. D . ...................................................... 7.2 G antenbein, Frangoise ........................................... 5.7Clouet L . ..................................................... 5.18 95 G auld, Ian C ........................................................... 5.2Com te, N ............................................................. 4.10 G elbard, Ely M . ................................................... 5.11Connolly, Sim on ................................................. 5.15 G il, Choong-Sup .................................................... 3.7Cooper, Andrew .................................................... 5.3
- 893 -

JAERI - Conf 2003- 019
G inisty, C .............................................................. 4.4 Jaegers, Peter J ..................................................... 2.14G irault Em m anuel ......................................... 2.1 78 Jasserand, Frdddric .............................................. 5.13G m al, Bernhard ..................................................... 4.7 Jean, F .................................................................... 1.1G oddard, A . J. H .......................................... 8.2 816 Jitarev, Valeri ...................................................... 2.18G oluoglu, Sedat .................................... 1.7 52 520 Joudon A lain ....................................................... 4.14G ornes, J. L. M . A ................................................. 8.2G om it, Jean-M ichel .............................. 5.7, 5.8 519 KGorelov V ladim ir P ..................................... 2.16 63 Kachanov V ladim ir ............................................. 2.18Gracey, J . ............................................................ 7.15 Kam eyam a, Takanori .................................. 5.22 523G rado, Guy Fernandez de ..................................... 5.7 Karni, Y ............................................................... 5.20Grebennikov, Andrei N ......................................... 6.3 Katakura, Jun-ichi ................................ 3.14 64 814Greene, N . M aurice ............................................... 5.1 Kato, Y . ............................................................... 2.12Greenspan, E ....................................................... 5.20 Khoruzhi V . Kh . ................................................. 8.10G rimm , Peter ........................................................ 4.1 K ikuchi, Tsukasa ................................................. 7.16G rim stone, M alcolm ........................................... 5.15 K ilger, Robert ........................................................ 4.7G rolleau, E ............................................................ 1.4 Kim , D o H eon ....................................................... 3.7G rouiller, Jean-Paul .............................................. 5.7 K im , G il-Soo ....................................................... 2.11Guillou, Eric ......................................... 5.18 71 95 Kim , Ho-Dong ..................................................... 2.11G uliford, Jim ............................................... 4.3 715 Kim , Jung-Do ........................................................ 3.7G finther-Leopold, Ines ........................................ 10.4 K im pland, Robert H . ........................................... 2.14G urin, Victor N .............................................. 2.3 27 K indleben, Gerd .................................................... 4.8
Kirkwood, D avid ............................................ 4.5 46
H Kitarnura, Yasunori .................................... 2.17 226H aley, Richard M ......................................... 1.20 96 Klenov, Pavel ................................................. 1.4 73H arris, N eil .................................................. 7.15 98 Knernp X avier ...................................................... 8.8H aworth, Justin ..................................................... 9.8 Kobayashi, K eiji .................................................... 2.4Hayashi, Yarnato ................................................... 8.1 Kohno N obuaki .................................................. 10.2Hayes, David K ................................................... 2.14 Kolesov, Vladim ir F . .................................... 8.9, 8.10Hende, Paul Van Den ......................................... 2.19 Kopajtic, Zlatko ................................................... 10.4H eulers L . .......................................................... 5.19 Kophazi, Jozsef ................................................... 5.21H irose, H ideyuki ................................................... 2.8 Korotchenkov A lexander V ................................ 2.16H ollard, Jean-M arc ............................................... 4.1 Kovbasenko, Yuriy .............................. 7.7 714 718H ollenbach, Daniel F . ........................................... 5.2 Koyam a, Shin-ichi ............................................... 10.3Hopper, Calvin M . ....................................... 5.20 17 Krut'ko, N icolai A . ................................................ 6.3Hord6sy, Gdbor ..................................................... 7.6 Kuntoro, Im an ...................................................... 4.13H or-wedel, Jam es E . ............................................ 5.14 Kuroishi, Takeshi ....................................... 5.12 524Huang, Song T ...................................................... 9.7 Kuvshinov, M ikhail I ...................... 2.16,4.2 89,9.1Hudelot, Jean Pascal ............................................. 7.8 Kuzm in, A lexandr ............................................... 2.18Hum bert, Philippe ...................................... 2.15 311 Kyncl, Jan ............................................................ 3.13
Hum m elsheim , K lem ens ....................................... 4.7 LH wang, Hae Ryong ............................................. 7.10 Lance, Benoit ................................................ 2.19 74Hwang, Yong-Hwa ............................................. 2.11 Landrieu, M . ........................................................ 4.10
Laporte, Sdbastien ............................................... 5.13Larson, N ancy M . .................................................. 6.1
Ichihara, Chihiro ................................................... 2.4 Lavarenne, Caroline ........................ 1.1, 1.5 114 71Ida, T ................................................................... 2.12 Leal, Luiz C ........................................................... 6.1Il'in, Vladim ir I . .............................. 2.16 63 89 91 Leclaire N icolas .................................... 1.3 15,1.13Ito, Dai-ichiro ..................................................... 7.16 LeeSeong Hee .................................................... 7.10Itoh M asahiko .................................................... 10.3 Lee, Y i-Kang ......................................... 3.4,3.10,5.8Ivanova, Tatiana .......................................... 3.3 312 Leege, Piet F. A . de .................................... 2.13 521Iwam oto, Osam u ................................................... 6.2 Lein, M . ................................................................. 1.4Izawa, Kazuhiko .......................................... 2.8 224 Lejeune, E ............................................................ 5.18
Leka, Georges ................................................. 1.4 71
J Letang, Eric ....................................... 5.16 517 519Jacquet O livier ............................... 3.2, 5.5 56 525 Liern, Peng Hong ......................... ....................... 4.13
- 894 -
JAERI - Conf 2003-019
Livke A lexander V . ........................................... 2.16 N euber, Jens-Christian .................................... 1.8 79Loaiza, David J . .................................... 2.6 214 35 N ikitin, 1 A ............................................................ 4.2Love, Suzanne ....................................................... 9.8 N ikolaev M .................................................. 3.3 312Loy, C . .................................................................. 9.5 Nojiri, Ichiro .......................................................... 9.9
N om ura, Y asushi ................ plenary, 1. 1 8 512 524,
M 7.12, 10.5M aYdou, B . ............................................................ 1.4 N ouri A li ................................. plenary, 31 32, 10.5
M akarenkov, Yury D . ........................................... 2.2M anturov, G .......................................................... 3.3 0M arc, Andrd ................................................... 4.4 57 Ogawa, Kazuhiko ................................................ 8.13M arim beau, Pierre ..................................... 7.13, 10.1 Oka, Tsutom u ...................................................... 9.10M arkova, Ludm ila ................................................ 7.5 Okam oto, H . ...................................................... 2.12M arloye, Daniel ........................................... 2.19 74 Okubo, Kiyoshi .................................. 2.24 315, 8.15M aslov, Georgii N . ............................................. 2.16 Okuno H iroshi ............................................. 1.18,5.9M asse, V . .............................................................. 4.4 O liveira, C. R. E. de ........................ plenary, 82 816M atsum oto, Tadakuni ......................................... 1.10 Onodera, Seiji ...................................................... 2.24M atsum ura, Tetsuo ............................................. 5.22 Osaka, M asahiko ................................................. 10.3M attera C ........................................................... 4.11M attingly, John K . .............................................. 2.10 P
M ccrindle, David .................................................. 9.8 Pain, C. C ...................................................... 8.2 816M cLaughlin, Thom as P ................................ 4.12 94 Panin A lexander V .............................................. 2.16M 6chitoua, Boukhm es ...................... 2.15 311, 8.11 Paratte, Jean-M arie ................................................ 4.1M edioni R . ........................................................... 4.4 Parks, Cecil V ........................................................ 1.7M eer, K laas Van der ........................................... 2.19 Pelletier, . .......................................................... 7.17M engelle, St6phane ............................................. 5.26 Peshekhonov, D m itrii P ....................................... 2.16M ennerdahl, Dennis ....................................... 1.1, .2 Pe§id, M ilan P ........................................................ 3.6M ijuin, D om inique .................. 4.4, 5.18 57, 8.5 92 Petrie, Lester M . ........................................... 5.1 520M isawa, Tsuyoshi ................................. 2.4 29 226 Plum m er, Sim on .................................................. 1.15M iss, Joachim ................................................ 5.5 56 Polevoy, Vjacheslav B ......................................... 1.17M itake, Susum u .................................................... 8.1 Porte, R .................................................................. 8.6M itsuhashi, Ishi .......................................... 5.10,7.16 Poullot G illes ........................................ 1.3 21 516M iyoshi, Yoshinori ...................... 1.18 25,2.8,2.20, Pruvost N orm an L . ............................................. 4.122.21 223 224 32 38 315 314 54 527, 83, Punin, Valery T . ...................................... 4.2 89 918.12 813, 8.15 Pyeon, Cheol-Ho ................................................... 2.4M ochalov, M . R . ................................................... 4.2M ohizuki, H iroki ........................................ 5.9, 10.5 PI
M oerenhout, Jdrdm ie .......................................... 2.19 Raap, M . Brady ............................................... plenaryM orm an, Jam es A ................................................. 9.7 Raby, Jdr6m ......................................................... 7.1M orrey M ............................................................. 9.3 Rannou, Julien ....................................................... 8.8M oser, Eberhard F . ............................................... 4.7 Raskach, Kirill .............................................. 3.3 312M outon, J . ............................................................. 8.6 Rearden, Bradley T ......................................... 1.7 52M ozhayeva, Lubov I ........................................... 1.19 Regev, D . ............................................................. 5.20M urazaki, M inoru ........................................ 2.21 54 Reiche, Ingo ........................................................... 1.9M urin V . N . ......................................................... 4.2 Reitsm a, F ............................................................ 2.13M yers, W illiam L ................................................ 2.14 Renard, A lfred ....................................................... 7.4
Reverdy, Ludovic ........................................... 4.4, 8.5N Richet, Y ann ............................................... 5.17 525N aito, Yoshitaka .......................................... 3.2 316 Riffard, Cdcile .............................................. 7.1 717N akahara, Yoshinori ........................................... 10.2 Ro, Seung-Gy ...................................................... 2.11N akajim a, Ken ................................ 3.8 83 84,8.13 Roque, Bdnddicte ................................. 7.1 713, 0.1N akam ura, Hiroshi ................................................ 2.4 Rouyer, Vdronique ........... 1. 1 13 113 21 44, 8.8N akam ura, Takerni ............................. 2.8 220 812 Rozhikhin E . ......................................................... 3.3N akam ura, Y u ..................................................... 7.16 Rozhikhin, Yevgeniy ........................................... 3.12N am ekawa, Takashi ............................................ 10.3 Ryazanov, Boris G .................. 1.6 119,2.2 23 27,N atsum e, T .......................................................... 2.12 4.12 415N auchi, Yasushi .................................................. 5.23 Ryufuku, Susum u ................................................ 1.18
- 895 -

JAERI - Conf 2003- 019
VSaito, Shinzo .................................................. plenary Valentine, Tim othy E . ................................ 2.10 225Sakai, M ikio .......................................................... 5.4 Valko, J ................................................................ 2.13Sakurada, Koichi ................................................. 5.10 Vasilev, Yury Y u ................................................. 1.19Sakurai, Kiyoshi .......................................... 8.12 99 Vedrenne, N ......................................................... 3.10Sakurai, Shungo ........................................... 5.10, 8.1 Venard, Christophe .............................. 5.8 526 713Sanchez, Rene G . .................................. 2.6 214 35 Venner, Jack ........................................ 1.12 120 87Sannen, Leo .......................................................... 7.4 Vnukov V ictor .......................................... 2.2 415Sazhnov V ladim ir V . ........................................... 8.9 Volnistov V ladim ir V . .......................................... 2.3Scott, Lori ............................................................. 3.1 Vorontsov, Sergei V . .................................... 2.16 91Sem biring , Tagor M alem ................................... 4.13 Vyachin V ladim ir N . .......................................... 2.16Sert G ................................................................... 1.1Sevestre, Bernard .................................................. 9.2 WShapsha, Valery F . ................................................ 2.2 W agner, John C . .................................................. 7.11Shim izu, Yoshio ................................................. 9.10 W arburton, Sim on J ............................................... 9.6Shin, Heesung ..................................................... 2.11 W atanabe, Shouichi ............. 2.5 28 220 223, 8.15Shinohara, N obuo ............................................... 10.2 W eber, Christelle ................................................... 8.8Shiroya, Seiji ........................................................ 2.4 W eber, W olf ............................................ plenary, 12Shuttleworth, Edm und .......................................... 4.9 W ernli, Beat ......................................................... 10.4Shvedov, M axim 0 . ............................................ 4.12Sichkaruk, Olga V . ............................................... 2.2 ySim ister D . N . ...................................... 7.2 816 93 Yam am oto Toshihiro ........... 2.5 28 220 223 32,Skripka G . M . ...................................................... 4.2 3.15 54, �.27 83Sm irnov, Igor G ............................................. 8.9 91 Yam ane, Yoshihiro ............................ 1.10 217 226Sm ith, N igel ................................................... 4.9 53 Yam ane, Yuichi ..................................... 2.5 83 813Sono, H iroki ................................................. 3.8 814 Yam auchi, H ideto ................................................ 2.26Sorokin, S. V . ....................................................... 4.2 Yanagisawa, H iroshi ............................ 3.8 813 814Sum ita, Kenji ................................................. plenary Yang, Jinan ........................................................... 3.16Sutton, Laurence ................................................. 1.15 Yanovsky, V ladislav N .......................................... 9.1Suyam a, Kenya ................................... 1.18 59, 10.5 Yerem enko M axim ............................. 7.7 714 718Sviridov V ictor I ............ 1.6 119 22 23 27 412 Yoshioka, K enichi ............................................... 5.10Szieberth M ate ................................................... 5.21 Yoshiyam a H iroshi ............................................. 3.14
T Yuferev V ladim ir I . .............................................. 9.1
Takada, Tom oyuki .............................................. 3.14 ZTalanov, Vladim ir V . ............................................ 1.6 Zapol'ski, Anatolii E . ........................................... 2.16Tancock N igel ...................................................... 6.5 Zheng, S ........................................................ 4.10 86Tarasova, Elena Yu ............................................... 9.1 Zhukov, Igor V . ..................................................... 9.1Thiel, J6rg ............................................................. 4.7 Zhukov, J. V . ......................................................... 4.2Thievenaz, Bdatrice ............................................ 4.14 Zim in, Sergei ....................................................... 1.11Thorne, Peter R ............................................ 1.12 87 Ziver A . K .................................................... 8.2 816Tocheny, Lev V . ................................................. 2.22 Zuhair . ................................................................. 4.13Tonoike, Kotaro .......................... 1.18,2.5,2.23 224Toubon, Herv6 ...................... 5.7, 5.18 526 71 73,7.8 713 717, 10.1Trutnev, Yury A .................................................... 8.9Tsiboulia, Anatoli ........................................ 3.3 312Tsujim oto, Kazufum i .......................................... 10.2Tsuzuki, Y . ......................................................... 2.12
UUm pleby A . P . ............................................ 8.2 816Unesaki, Hironobu ................................ 2.4 29 226Uno, Yuichi ........................................................ 2.21U stinenko, Vasily A .............................................. 8.9
- 896-