WDP-49 - World Bank Documents & Reports
100
WDP-49 4 J E World Bank Discussion Papers Improving Nutnrtion in India Policies and Programs and Their Impact K. Subbarao ,'A Public Disclosure Authorized Public Disclosure Authorized Public Disclosure Authorized Public Disclosure Authorized Public Disclosure Authorized Public Disclosure Authorized Public Disclosure Authorized Public Disclosure Authorized
-
Upload
khangminh22 -
Category
Documents
-
view
3 -
download
0
Transcript of WDP-49 - World Bank Documents & Reports

WDP-49
4 J E World Bank Discussion Papers
Improving Nutnrtionin India
Policies and Programsand Their Impact
K. Subbarao
,'A
Pub
lic D
iscl
osur
e A
utho
rized
Pub
lic D
iscl
osur
e A
utho
rized
Pub
lic D
iscl
osur
e A
utho
rized
Pub
lic D
iscl
osur
e A
utho
rized
Pub
lic D
iscl
osur
e A
utho
rized
Pub
lic D
iscl
osur
e A
utho
rized
Pub
lic D
iscl
osur
e A
utho
rized
Pub
lic D
iscl
osur
e A
utho
rized
RECENT WORLD BANK DISCUSSION PAPERS
No. 1. Public Enterprises in Sub-Saharan Africa. John R. Nellis
No. 2. Raising School Quality in Developing Countries: What Investments Boost Learning? Bruce Filler
No. 3. A System for Eva'luatinq the Performance of Government-Invested Enterprises in the Republic ofKorea. Young C. Park
No. 4. Country Commitment to Development Projects. Richard Heaver and Arturo Israel
No. 5. Public Expenditure in Latin America: Effects on Poverty. Guy P. Pfeffermann
No. 6. Community Participation in Development Projects: The World Bank Experience. Samuel Paul
No. 7. International Financial Flows to Brazil since the Late 1960s: An Analysis of Debt Expansionand Payments Problems. Paulo Nogueira Batista, Jr.
No. 8. Macroeconomic Policies, Debt Accumulation, and Adjustment in Brazil, 1965-84. Celso L. Martone
No. 9. The Safe Motherhcood Initiative: Proposals for Action. Barbara Herz and Anthony R. MeasharnTAlso available in French (9F) and Spanish (9S)I
No. 10. Improving Urban Employment and Labor Productivity. Friedrich Kahnerl:
No. 11. Divestiture in Developing Countries. Elliot Berg and Mary M. Shirley
No. 12. Economic Growth and the Returns to Investment. Dennis Anderson
No. 13. Institutional Development and Technical Assistance in Macroeconomic FPolicy Formulat:ion: A CaseStudy of Toqo. Sven B. Kjelistrom and Ayite-Fily d'Almeida
No. 14. Managing Economic Policy Change: Institutional Dimensions. Geoffrey Lamb
No. 15. Dairy Development and Milk Cooperatives: The Effects of a Dairy Project in India. GeorgeMergos and Roger Slade
No. 16. Macroeconomic Policies and Adjustment in Yugoslavia: Some Counterfactual Simulations.Fahrettin Yagci and Steven Kamin
No. 17. Private Enterprise in Africa: Creating a Better Environment. Keith Marsden and Tferese Belot
No. 18. Rural Water Sup1 and Sanitation: Time for a Change. Anthony A. Churchill, with theassistance ot David de Ferranti, Robert Roche, Carolyn Tager,Alan A. Walters, and Anthony Yazer
No. 19. The Public Revenue and Economic Policy in African Countries: An Overview of IssLes and PolicyOptions. Dennis Anderson
No. 22. Demographic Trends in China from 1950 to 1982. Kenneth Hill
No. 23. Food Import Dependence in Somalia: Magnitude, Causes, and Policy Options. Y. Hc;sein Farzin
No. 24. The Relationship of External Debt and Growth: Sudan's Experience, 1975-1984. Y. HDssein1Farzin
No. 25. The Poor and the Floorest: Some Interim Findings. Michael Lipton
No. 26. Road Transport Taxation in Developing Countries: The Design of User Charges and "aKes forTunisia. David Newbery, Gordon Hughes, William D.O. Paterson, and Esra Bennathan
No. 27. Trade and Industrial Policies in the Developing Countries of East Asiai. Amarendri 13hattacharyaand Johannes F. Linn
No. 28. Agricultural Trade! Protectionism in Japan: A Survey. Delbert A. Fitchett
No. 29. Multisector Framework for Analysis of Stabilization and Structural Adjustment Polcies: TheCase of Morocco. Abel M. Mateus and others
No. 30. Improving the Quality of Textbooks in China. Barbara W. Searle and Michael Mertaigh withAnthony Read and Philip Cohen
(Continued cn the insidl back covE .
-49K z World Bank Discussion Papers
Improving Nutritionin Idia
Policies and Programsand Their Impact
K. Subbarao
The World BankWashington, D.C.
Copyright C( 1989The World Bank1818 H Street, N.W.Washington, D.C. 2043:3, U.S.A.
All riglhts reservedManufactured in the United States of AmericaSecondl printing May 1990
Discussion Papers are not formal publications of the World Bank. They present preliminaryand unrpolished results of country analysis or research that is circulated to encourage discussionand comment; citation and the use of such a paper should take account of its provisionalcharacter. The findings, interpretations, and conclusions expressed in this paper are entirelythose of the author(s) and should not be attributed in any manner to the World Bank, to itsaffiliated organizations, or to members of its Board of Executive Directors or the countriesthey represent. Any maps that accompany the text have been prepared solely for theconvenience of readers; the designations and presentation of material in them do not implythe expression of any opinion whatsoever on the part of the World Bank, its affiliates, or itsBoard or member courntries concerning the legal status of any country, territory, city, or areaor of the authorities thereof or concerning the delimitation of its boundaries or its nationalaffiliation.
Because of the inforrmality and to present the results of research with the least possibledelay, the typescript has not been prepared in accordance with the procedures appropriate toformal printed texts, and the World Bank accepts no responsibility for errors.
The material in this publication is copyrighted. Requests for permission to reproduceportions of it should be sent to Director, Publications Department at the address shown inthe copyright notice above. The World Bank encourages dissemination of its work and willnormailly give permission promptly and, when the reproduction is for noncommercialpurposes, without askinLg a fee. Permission to photocopy portions for classroom use is notrequired, though notification of such use having been made will be appreciated.
The complete backlist of publications from the World Bank is shown in the annual Indexof Publications, which contains an alphabetical title list and indexes of subjects, authors, andcountries and regions; it is of value principally to libraries and institutional purchasers. Thelatest edition of each of these is available free of charge from Publications Sales Unit,Department F, The World Bank, 1818 H Street, N.W., Washington, D.C. 20433, U.S.A., orfrom Plablications, The World Bank, 66, avenue d'Iena, 75116 Paris, France.
K. Subbarao, a professor of economics at the Institute of Economic Growth in New Delhi,is a consultant to the World Bank.
Library of Congress Cataloging-in-Publication Data
Subbarao, K.IMproving nutrition in India.
(W:rld Bank discussion papers ; 49)Bibliography: p.1. Nutrition--Government policy--India. 2. Malnutri-
tion--India. I. Title. II. Series.TX360.I4S83 1989 363.8'0954 89-5556ISBN 0-8213-1192-1
iii
ABSTRACT
This paper attempts a disaggregated analysis of existing data setspertaining to nutrition in India and identifies the priority geographical areas,social and age groups for possible nutrition interventions; analyzes theeffectiveness of public responses to the nutrition problem as reflected in thedistribution of expenditures, and the impact of one major direct and one indirectnutrition intervention; and discusses the outstanding nutritional issues. Thebroad conclusions are that there is substantial empirical evidence to suggestwide variations in the distribution of malnutrition across regions, age andsocial groups and by gender; that the direct nutrition expenditures remainedmodest in the past, and that the distribution of even the modest expenditureshas not at all been sensitive to the observed variations in the intensity ofmalnutrition; and that there appears to be considerable scope for improving theproductivity of expenditures by strengthening and reorienting the existingprograms and also lby reducing the prevailing mismatch between expenditures andwhat we know about the distribution of need. Overall, the paper argues the needfor striking a proper balance between needs, potential demand and availableresources.
This paper was written as a background paper for the 1989 Country EconomicMemorandum for India, when the author was working in the Country OperationsDivision of the Bank at their Resident Mission in New Delhi.

ACKNOWLEDGEMENT
I wish to thank Sajitha Bashir for painstaking assistance andunfailing intellectual involvement in this research project. During the early'stages of this study, I have benefitted from discussions with C. Gopalan, N.Prahlad Rao, R. Radhakrishna, G. Sastry and Urmil Sharma. For manyconstructive comments and suggestions on earlier drafts, I am indebted tc BelaBelassa, Alan Berg, Pe?ter Berman, Nat Colletta, David Greene, James Hanscn,Sawon Hong, Richard He!aver, Samuel Lieberman, Michael Lipton, Dan Ritchic andRichard Skolnik. Successive drafts of this paper were cheerfully andcompetenitly typed by J'asvir Bhasin. I am solely responsible for the viesWsexpressed in this paper.
Table of Contents
Page No.
I Introduction 1
II Distribution of Malnutrition by Region, SocialStatus, Age and Sex ............................ 3
a) Household-level average nutrient intakeby region and social status .................... 3
b) Incidence of malnutrition among childrenin different regions and social groups ......... 12
c) Distribution of Malnutrition by Sex ............ 21
III Public Policy .................................. 24
a) Size and Distribution of Direct NutritionExpenditures ................................... 26
b) Expenditures and Sustainability of interven-tions: A case study of Andhra Pradesh .......... 34
IV The Effectiveness of Major Direct and IndirectNutrition Interventions ........................ 38
a) Integrated Child Development Services (ICDS). 38
b) Public Distribution System ..................... 66
V ConcLusions and Implications for Policy ........ 74
ReferencesAppendices
List of Tables
Table No. :?ave Hlo.
1. State-vise calorie intake (Kcal/cu) 1975-80Average (Ruiral) by Social Class 4
2. Calorie Consumption of the ultra-poor and theAverage: Mean and Growth rate 1975-80 7
3. Summary Nutritional Status of Households inRural Bihar by Social Class (% Distribution).... 9
4. Intake of E:nergy as % of RDA in ICRISATvillages (Lean and Surplus Seasons, 1976-77).... 10
5. Mean Energy Intakes in Rural and Urban India,1987 (per Cu per day) .12
6. Nutritional Status of Children (1-5 years) inthe selected states by weight-for-age (%) 13
7. Summary Nutritional Status by Age (%Distribution) in Bihar Villages 15
8. Percentage of Malnourished (Gr. III + IV)children in IC'DS Projects by Caste Status, 1981. 16
9. Percentage of Malnourished (Gr. III + IV)children (0-36) months of Scheduled Castes andTribes in ICDS Projects of location, 1981 17
10. Regional Profile of Malnutrition among Children 19
11. Calorie Inadequacy among Adult Males and Females(Percent of Population) .23
12. State-vise D)istribution of Nutrition Expendi-tures ............................................ 28
13. Outlay and Expenditure - Seventh Plan - 1985-90Nutrition .30
14. Statevise Distribution of Children fed undervarious feeding programs.......................
15. Percentage of Severely Malnourished childrenin ICDS Project Areas (Base line) in 1984 andcorresponding State averages (1982) .. 2
16. State-vise Position of ICDS 1986-87 ............ 43
17. Impact of ICDS on Nutritional Status Childrenin grades III & IV malnutrition 47
18. Distribution of ICDS Project Areas by changes inthe StaLtUS of malnourished (Gr. III + IV) children:1979-80/80-81 over 1984-85 .48
19. Characteristics of some ICDS Project AreasDeterioration .50
20. Supplementary feeding under ICDS by SocialClass, 1981 ......... : ........................ 52
21. Staff Position - Paramedical Functionaries inICDS PHCs reported as on 31st March, 1987 54
22. Staff Position - Health Functionaries - MedicalOfficers ICDS PHCs reported as on 31st March, 1987 55
22. ICDS: Recruitment & Training of Personnel inCentral Sector Projects: 1987 57
23. PDS Supplies and Population below Poverty line. 70

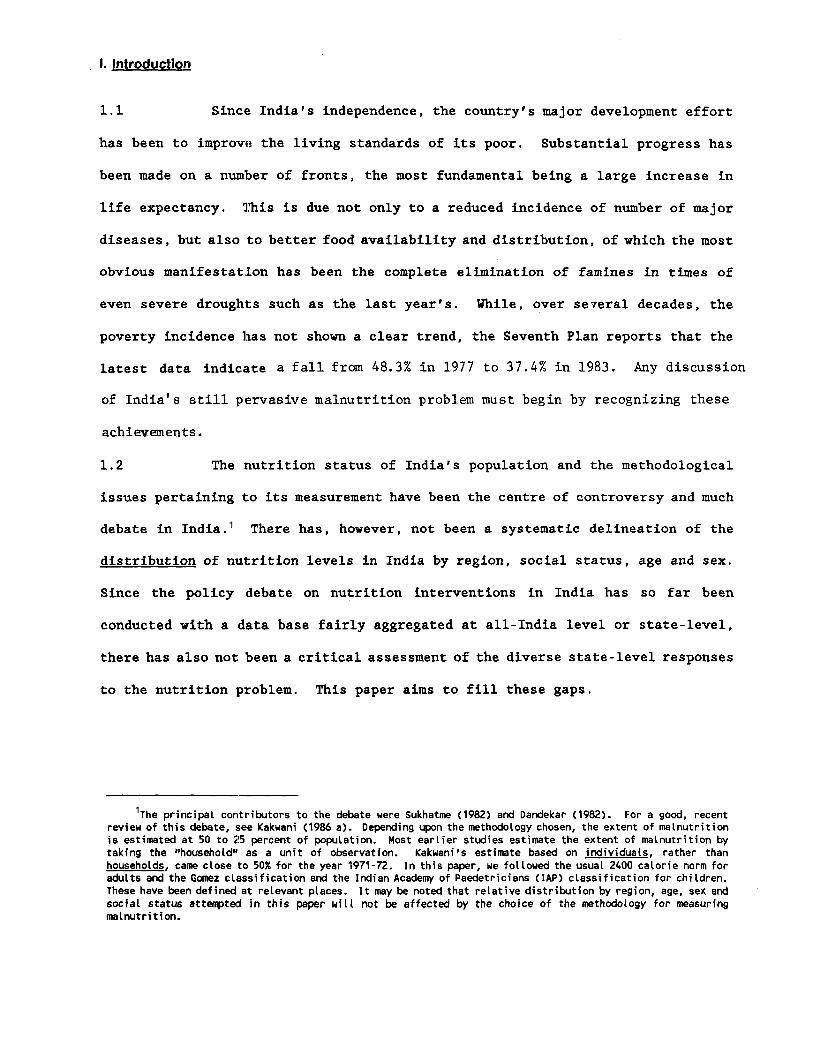
I. Introduction
1.1 Since India's independence, the country's major development effort
has been to improve the living standards of its poor. Substantial progress has
been made on a number of fronts, the most fundamental being a large increase in
life expectancy. This is due not only to a reduced incidence of number of major
diseases, but also to better food availability and distribution, of which the most
obvious manifestation has been the complete elimination of famines in times of
even severe droughts such as the last year's. While, over several decades, the
poverty incidence has not shown a clear trend, the Seventh Plan reports that the
latest data indicate a fall from 48.3% in 1977 to 37.4% in 1983. Any discussion
of India's still pervasive malnutrition problem must begin by recognizing these
achievements.
1.2 The nutrition status of India's population and the methodological
issues pertaining to its measurement have been the centre of controversy and much
debate in India.1 There has, however, not been a systematic delineation of the
distribution of nutrition levels in India by region, social status, age and sex.
Since the policy debate on nutrition interventions in India has so far been
conducted with a data base fairly aggregated at all-India level or state-level,
there has also not been a critical assessment of the diverse state-level responses
to the nutrition problem. This paper aims to fill these gaps.
tThe principaL contributors to the debate were Sukhatme (1982) and Dandekar (1982). For a good, recentreview of this debate, see Kakwani (1986 a). Depending upon the methodology chosen, the extent of malnutritionis estimated at 50 to 25 percent of population. Most earlier studies estimate the extent of malnutrition bytaking the "household" as a unit of observation. Kakwani's estimate based on individuals, rather thanhouseholds, came close to 50% for the year 1971-72. In this paper, we followed the usual 2400 calorie norm foradults and the Gomez classification and the Indian Academy of Paedetricians (IAP) classification for children.These have been defined at relevant places. It may be noted that relative distribution by region, age, sex andsocial status attempted in this paper will not be affected by the choice of the methodology for measuringmalnutrition.
2
The paper begins with a review of diverse data sets. The
disaggregated analysis identifies the priority geographical areas and social
groups for nutrition interventions (Part II). This is followed by an ara:.ysis
of the various public responses to the nutrition problem, done on the basis o:. th(e
following criteria: ( a) whether or not the distribution of expenditures
corresponded to needs, and whether or not the interventions are slustainable :in the
long run; (Part III); and (b) whether or not the major interventions in operation
for a sufficiently long time have been successful in reaching the identified
malnourished groups/regions (Part IV). Most of the analysis concentrates OnL two
programs: the Integrated Child Development Services (ICDS), by far the most
extensive dlirect nutrit:ion intervention attempted in India since Independence; 2
and the Pufblic Distribution System (PDS), an indirect approach for impr:cving
nutrition that involves large Central and state budget expenditures and whose
importance in policy clebates has grown following the drought of 1987. PooI-
reliability of existing data base makes it difficult to assess fully the
expenditure effectiveness of these programs in terms of physical performlance.
Hence, physical performance data are suitably supplemented by a qualit:ative
assessment of the chosen interventions. The last section contains a summolry of
the main findings, and a discussion of the outstanding nutritional issues What
need to be resolved in the near future.
21 am aware that ICDS has objectives other than nutrition such as pre-schoot, and my description of theprogram as a "mntrition intervention" is an approximation. A more detailed description of the program is givenin Section IV.
3
I. Distribution of Nutritional status by Region. Social Status. Aae andSex.
To know that malnutrition is widespread and severe in India hardly
requires a detailed analysis of data. But to know the appropriate means for
reducing it, and to know where and when the means will be effective, requires a
disaggregated analysis of the data. This section attempts such an analysis.
(a)Household-level average nutrient intake, by region and social status
2.1 The data generated by NNMB, after due correction so as to render
them comparable over time and across regions,3 are very useful for estimating the
mean intakes of nutrients for various classes of households in different parts of
rural India. One problem with NNMB data is they are somewhat dated - the last
published survey is for 1982; the disaggregated data are available only up to
1980-81.4 The results of the combined NSS-NNMB survey of 1983 have not yet been
released. We used the disaggregated NNMB data sets for the years 1975-1980. Of
the ten states for which NNMB data are available, Tamil Nadu experimented with a
number of direct nutrition interventions, the most important being the Chief
Minister's Nutritious Meal Program (CMNMP) for school children, since 1982, and
Tamil Nadu Integrated Nutrition Project for pregnant and lactating women and
children of 6-36 months age in 9 districts since 1982-84. In 1983, Andhra Pradesh
introduced a major indirect intervention (i.e., Rs. 2 a kilo rice scheme). The
3The representativeness of the NNMB Sample is ensured by a rigorous multistage sampling procedure evolvedby Dr. C. R. Rao, the then Director of the Indian Statistical Institute. The major criticism of NNMB data hasbeen that it has suddenly switched from Harvard scale of normalcy to the Hyderabad (Indian) scale of normalcysince 1976. The data examined in this paper are derived using the some scale of normalcy over the entire period1975-80. For an excellent summary of the sampling procedure, and the particular merits of this data sourcefor drawing inferences regarding the regional distribution of malnutrition, see Srikantia (1988).
4It must be noted that most other data in India are also dated.
* Nationat Nutrition Monitoring Bureau
4
relative nutrition situation among the remaining states may not have changed much
since 1980. The drought of 1987 probably worsened the nutrition situation of the
ultra poor (the bottom two deciles) - but this cannot be empirically demonstrated
at this time, given the time lags in the release of nutrition data. We used NNMB
data because they are still very relevant: not only not much has changed in many
states but also the social-class disaggregation is rich enough. to desel:vi art
analysis.
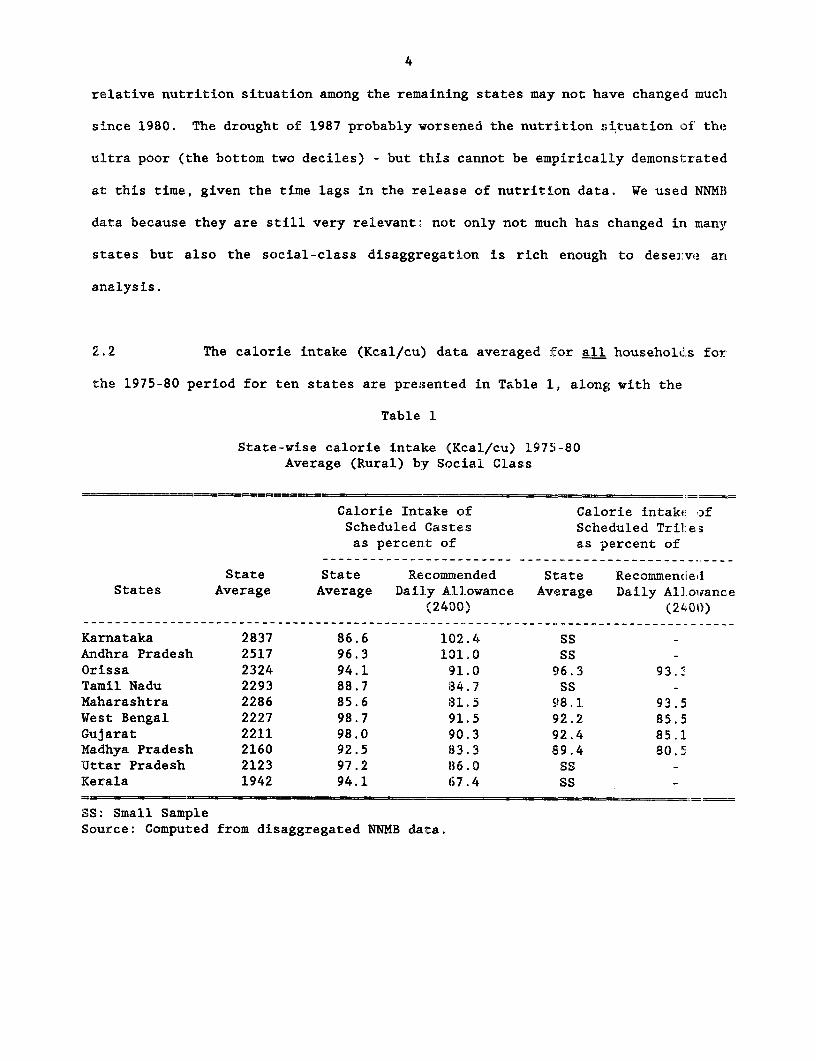
2.2 The calorie intake (Kcal/cu) data averaged for all households for
the 1975-80 period for ten states are presented in Table 1, along with the
Table 1
State-wise calorie intake (Kcal/cu) 1975-80Average (Rural) by Social Class
Calorie Intake of Calorie intake ofScheduled Castes Scheduled Tril:e3as percent of as percent of
State State Recommended State RecommendledStates Average Average Daily Allowance Average Daily All.owance
(2400) (2L01))
Karnataka 2837 86.6 102.4 SSAndhra Pradesh 2517 96.3 101.0 SS -Orissa 2324 94.1 91.0 96.3 93.3Tamil Nadu 2293 88.7 84.7 SS -Maharashtra 2286 85.6 31.5 98.1 93.5West Bengal 2227 98.7 91.5 92.2 85.5Gujarat 2211 98.0 90.3 92.4 85.1Madhya Pradesh 2160 92.5 83.3 89.4 80.5Uttar Pradesh 2123 97.2 86.0 SS -Kerala 1942 94.1 67.4 SS
SS: Small SamjpleSource: Computed from disaggregated NNMB data.
5
averages for the scheduled castes and tribes.5 Communities belonging to these
castes and tribes (so called because these castes and tribes were listed in a
Schedule of the Indian Constitution) have historically suffered from social
and economic deprivation. Prior to Independence, some of these castes were
regarded as "untouchables". Although untouchability has long since been
abolished, these castes and tribes continue to be at the bottom of the social
hierarchy in India, and as such, deserve a separate treatment from a nutritional
perspective. Two points deserve to be stressed. First, the average calorie
intake was lower than the recommended allowance of 2,400 Kcal/cu in all states
except Karnataka and Andhra Pradesh. Second, the average Kcal/cu conceals the
fact that in all the states the Kcal/cu of the scheduled castes and tribes was
lower than the state average which itself was lower than the recommended
allowance. In particular, the intakes of scheduled castes in Kerala,
Maharashtra, Tami'L Nadu, Madhya Pradesh and Uttar Pradesh, and tribes in
Madhya Pradesh, Gujarat and West Bengal, were alarmingly low. Considering that
the decline in the poverty ratio was the lowest among these social groups
(see C.H.H. Rao), their nutrition probably has not improved much since 1980/81.
2.3 The relatively high average intake for Karnataka, which has a
high poverty ratio, and a substantial area in India's arid (dry) zone, remains
a puzzle. The very low calorie average for Kerala shown in the NNMB data
will remain a puzzle especially because the infant mortality rate and the
death rate are the lowest in this state. Recent evidence, however, suggests the
5In this paper, we did not analyse the time trends averaged for all-Indiaor for states, since our focus is on a disaggregated analysis. These time trendsaveraged for all sample households within each state, and for all ten statestogether, have been analysed by NNMB themselves, who noted a steady decli-e inthe incidence of malnutrition between 1974 and 1982. Their findings, althoughdisputed by many, are still in concordance with the poverty incidence data fromthe 1977 and 1983 National Sample Surveys.
6
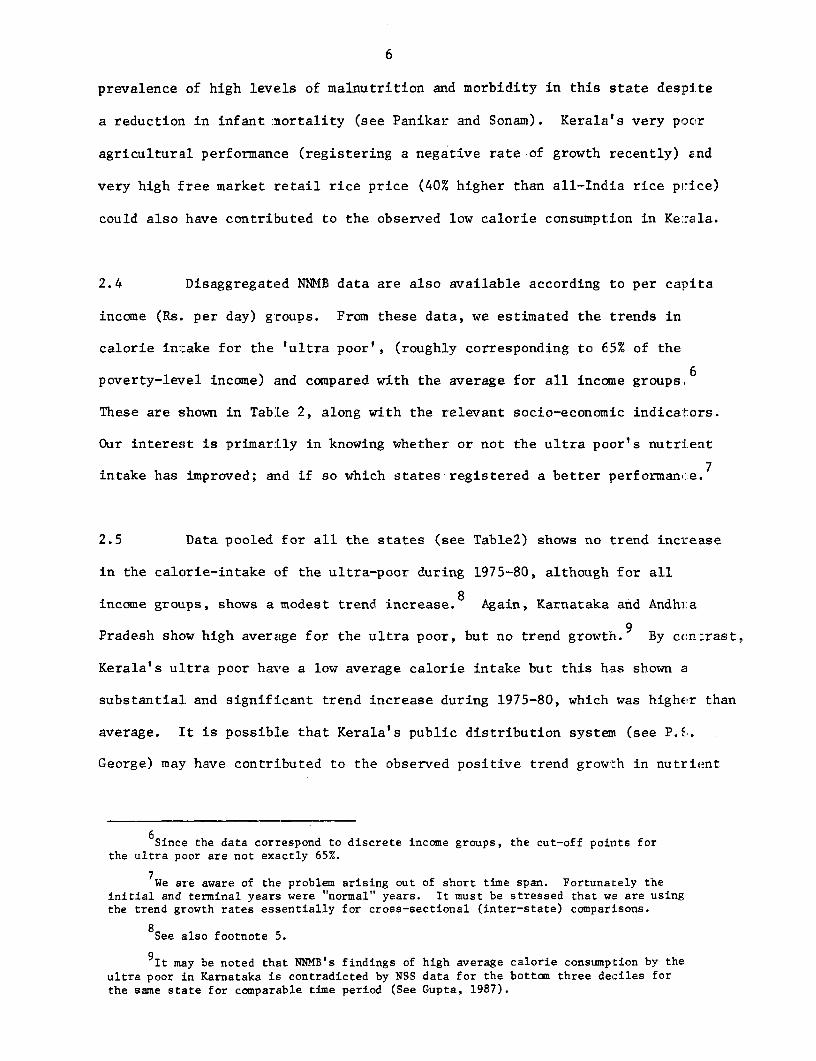
prevalence of high levels of malnutrition and morbidity in this state despite
a reduction in infantinortality (see Panikar and Sonam). Kerala's very pocr
agricultural performance (registering a negative rate of growth recently) and
very high Eree market retail rice price (40% higher than all-India rice pi-Ice)
could also have contri'buted to the observed low calorie consumption in Ke:-ala.
2.4 Disaggregated NNMB data are also available according to per capita
income (Rs. per day) groups. From these data, we estimated the trends in
calorie initake for the 'ultra poor', (roughly corresponding to 65% of the
poverty-level income) and compared with the average for all income groups. 6
These are shown in TabLe 2, along with the relevant socio-economic indicators.
Our interest is primarlly in knowing whether or not the ultra poor's nutr:i.ent
intake has improved; and if so which states registered a better performance. 7
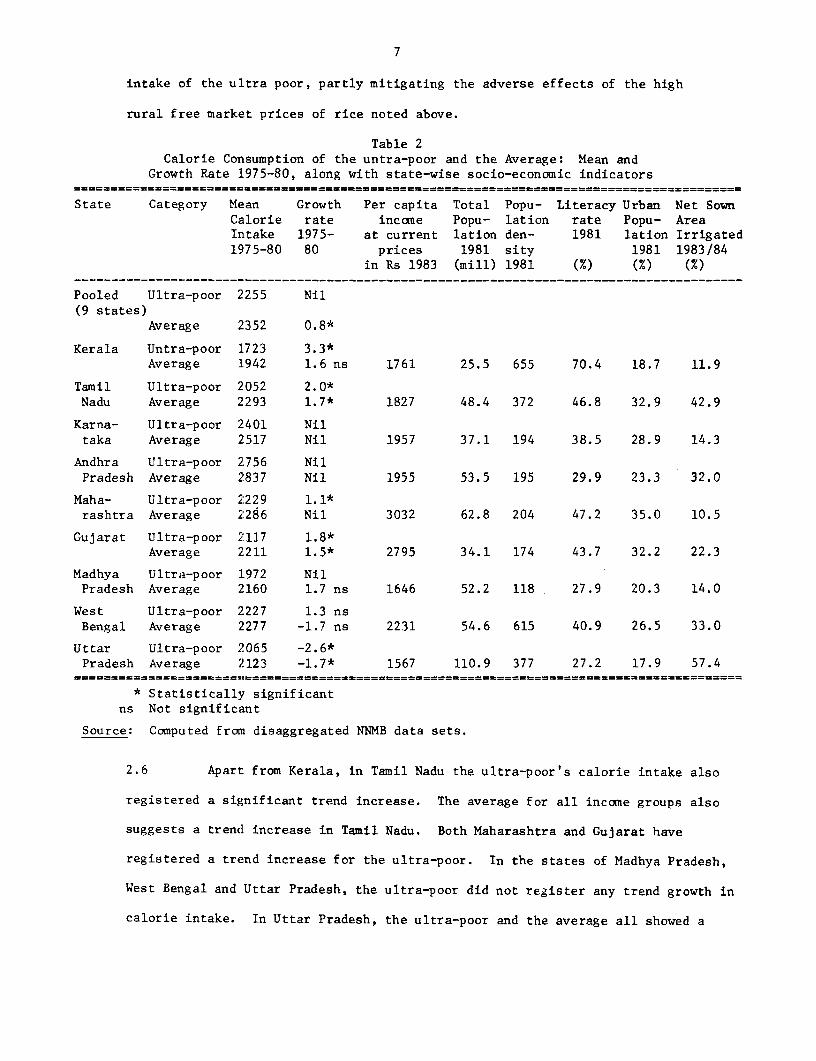
2.5 Data pooled for all the states (see Table2) shows no trend increase
in the calorie-intake of the ultra-poor during 1975-80, although for all
income groups, shows a modest trend increase.8 Again, Karnataka and Andhira
Pradesh show high average for the ultra poor, but no trend growth.9 By ccn:rast,
Kerala's ultra poor have a low average calorie intake but this has shown cl
substantial and significant trend increase during 1975-80, which was higher than
average. It is possible that Kerala's public distribution systen (see P.1S.
George) may have contributed to the observed positive trend growth in nutient
6Since the data correspond to discrete income groups, the cut-off points forthe ultra poor are not exactly 65%.
7We are aware of the problem arising out of short time span. Fortunately theinitial and terminal years were "normal" years. It must be stressed that we are usingthe trend growth rates essentially for cross-sectional (inter-state) comparisons.
8See also footnote 5.
9It may be noted that NNMB's findings of high average calorie consumption by theultra poor in Karnataka is contradicted by NSS data for the bottom three deciles forthe same state for comparable time period (See Gupta, 1987).
7
intake of the ultra poor, partly mitigating the adverse effects of the high
rural free market prices of rice noted above.
Table 2Calorie Consumption of the untra-poor and the Average: Mean and
Growth Rate 1975-80, along with state-wise socio-economic indicators
State Category Mean Growth Per capita Total Popu- Literacy Urban Net SownCalorie rate income Popu- lation rate Popu- AreaIntake 1975- at current lation den- 1981 lation Irrigated1975-80 80 prices 1981 sity 1981 1983/84
in Rs 1983 (mill) 1981 (M) (M) (%)
Pooled Ultra-poor 2255 Nil(9 states)
Average 2352 0.8*
Kerala Untra-poor 1723 3.3*Average 1942 1.6 ns 1761 25.5 655 70.4 18.7 11.9
Tamil Ultra-poor 2052 2.0*Nadu Average 2293 1.7* 1827 48.4 372 46.8 32.9 42.9
Karna- Ultra-poor 2401 Niltaka Average 2517 Nil 1957 37.1 194 38.5 28.9 14.3
Andhra Ultra-poor 2756 NilPradesh Average 2837 Nil 1955 53.5 195 29.9 23.3 32.0
Maha- Ultra-poor 2229 1.1*rashtra Average 2286 Nil 3032 62.8 204 47.2 35.0 10.5
Gujarat Ultra-poor 2117 1.8*Average 2211 1.5* 2795 34.1 174 43.7 32.2 22.3
Madhya Ultra-poor 1972 NilPradesh Average 2160 1.7 ns 1646 52.2 118 27.9 20.3 14.0
West Ultra-poor 2227 1.3 nsBengal Average 2277 -1.7 ns 2231 54.6 615 40.9 26.5 33.0
Uttar Ultra-poor 2065 -2.6*Pradesh Average 2123 -1.7* 1567 110.9 377 27.2 17.9 57.4
* Statistically significantns Not significant
Source: Computed from disaggregated NNMB data sets.
2.6 Apart from Kerala, in Tamil Nadu the ultra-poor's calorie intake also
registered a significant trend increase. The average for all income groups also
suggests a trend increase in Tamil Nadu. Both Maharashtra and Gujarat have
registered a trend increase for the ultra-poor. In the states of Madhya Pradesh,
West Bengal and Uttar Pradesh, the ultra-poor did not register any trend growth in
calorie intake. In Uttar Pradesh, the ultra-poor and the average all showed a
8
statistically significant negative growth over the period 1975-80.
2.7 The differences in calorie intake across the states reflect differences
in such factors as food lprice levels, the extent of access to publicly distributed
food, differences in foocd habits and quality of food consumed, the general ec:onomic
performance of the state, etc. Quite clearly there appear to be forces op-rating
in the states of Kerala, Tamil Nadu, Maharashtra and Gujarat contributing so an
improvement in the calorie intake of the ultra poor, although their level is 1bwest imn
Kerala. The present stat:e of knowledge does not enable one to systematical:Ly analys,e
the factors contributing to the improvement of nutritional status of the ultra poor Iln
these states. 10 One can only hazard a guess. The first two states are wel;l known for
their twin programs of noon meals and an effective public distribution system;
Maharashtra for her food--wage linked Employment Guarantee Scheme, and Gujarat for
her more than average economic performance.
2.8 Recent studies have shown that rural poverty is heavily concentrated in
the arid zone and in the eastern states and among the scheduled castes.(C.H.E. Rao,
2R. cit.) An assessment of the nutrition situation in Bihar can be done wit'i data
on a sample of rural Bihar households in twelve villages spread over all the six
regions of thLe state for the year 1981 drawn from recent Working Papers oF1 ILO,
While there were inter-v:lllage differences in average calorie intakes, the study
noted that there was little evidence of higher intakes in the more advanced viliages,
10At the Level of aggregation of states, the number of observations are too small for statistical anal isis.ALso, some of the states (e.g., Uttar Pradesh) are very large, with considerable intra-state varia:i)n.District-wise calorie-intakes for the ultra poor and average are available for 1980-81, a normal year. Anattempt was made to explain intetr-district variation in the calorie-intake (Appendix A). The uLtra-p,)o-'scalorie consumption was positively correlated with the per capita food production of the district, and the eielof development of the district. Data for more districts and overtime are needed for more reliable analysiis ofinter-district variation in caloi-ie intakes.
9
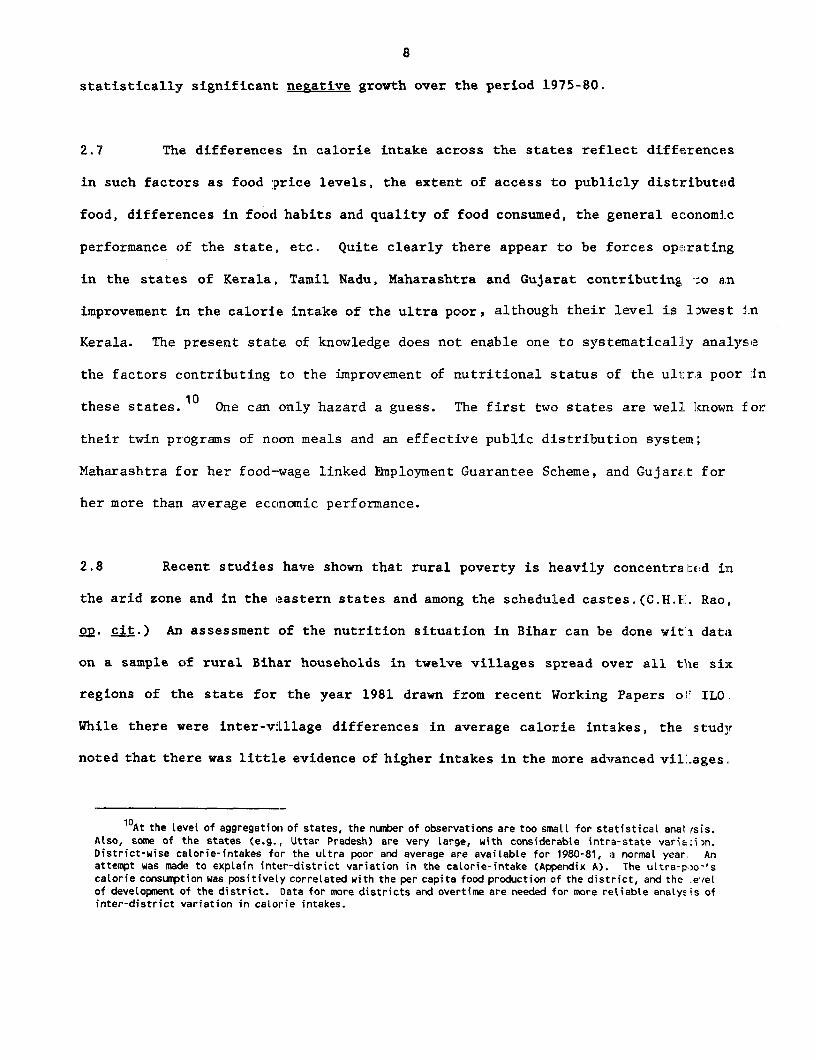
Social-class differences in calorie intakes appeared more prominent than either
regional or seasonal differences. According to this source, nearly a half of the
landless agricultural labour households, the majority of whom belong to the scheduled
castes, suffered from varying degrees of malnutrition. (See Table 3). The sharp
decline in the percentage of acutely malnourished between the landless labor
Table 3Summary Nutritional Status of Households in Rural
Bihar by Social Class (% Distribution) *
Class Normal Wasted Stunted Acute N
Agricultural Labor 43.7 31.0 15.1 10.2 270Agricultural Labor tied 45.6 28.6 14.5 11.3 103Poor-Middle peasant 57.6 27.9 9.3 5.2 73Middle peasant 75.4 17.1 4.9 2.0 90Big peasant 57.3 31.1 8.3 3.3 243Landlord 70.6 20.6 8.4 0.3 164Non-Agricultural/No Activity 45.2 31.4 11.8 11.6 49All 53.5 28.4 11.3 6.8 992
* The norms used by the authors for defining "normal" "stunted", etc are as follows:
Height for age Weight for ageover 85% over 85% "normal"less than 85% over 85% "stunted"over 85% less than 85% "wasted"less than 85% less than 85% "acute"
Source: P. H. Prasad. et al, "The Pattern of Poverty in Bihar" (WorldEmployment Programme Research), Working Paper No. 152.
class and small peasant class suggests the vulnerability of the former class to
malnutrition. The substantial variations in calorie intake between socio-economic
groups suggest that these are not be due to mere statistical fluctuations, but
reflect differences in the groups' command over resources.
10
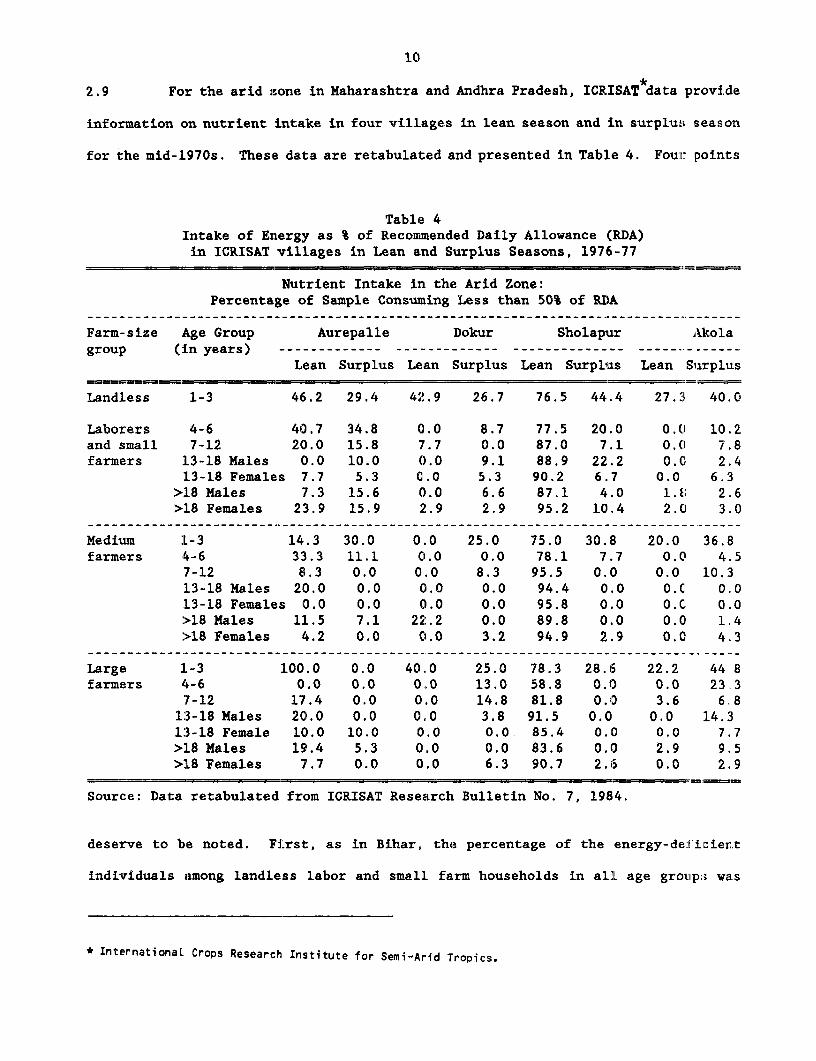
2.9 For the arid zone in Maharashtra and Andhra Pradesh, ICRISAT data provide
information on nutrient intake in four villages in lean season and in surplu;s season
for the mid-1970s. Thes(e data are retabulated and presented in Table 4. Four points
Table 4Intake of Energy as % of Recommended Daily Allowance (RDA)in ICRISAT villages in Lean and Surplus Seasons, 1976-77
Nutrient Intake in the Arid Zone:Percentage of Sample Consuming Less than 50% of RDA
Farm-size Age Group Aurepalle Dokur Sholapur Akolagroup (in years) ------------- ------------- -------------- ----- -------
Lean Surplus Lean Surplus Lean Surplus Lean Suirplus
Landless 1-3 46.2 29.4 42.9 26.7 76.5 44.4 27.'1 40.0
Laborers 4-6 40.7 34.8 0.0 8.7 77.5 20.0 0.0 10.2and small 7-12 20.0 15.8 7.7 0.0 87.0 7.1 0.0 7.8farmers 13-18 Males 0.0 10.0 0.0 9.1 88.9 22.2 0.0 2.4
13-18 Females 7.7 5.3 0.0 5.3 90.2 6.7 0.0 6.3>18 Males 7.3 15.6 0.0 6.6 87.1 4.0 1.61 2.6>18 Females 23.9 15.9 2.9 2.9 95.2 10.4 2.0 3.0
Medium 1L-3 14.3 30.0 0.0 25.0 75.0 30.8 20.0 36.Bfarmers 4-6 33.3 11.1 0.0 0.0 78.1 7.7 0. C 4.5
7-12 8.3 0.0 0.0 8.3 95.5 0.0 0.0 10.313-18 Males 20.0 0.0 0.0 0.0 94.4 0.0 O.C 0.013-18 Females 0.0 0.0 0.0 0.0 95.8 0.0 O.C 0.0>18 Males 11.5 7.1 22.2 0.0 89.8 0.0 o.C 1.4>18 Females 4.2 0.0 0.0 3.2 94.9 2.9 0.0C 4.3
Large 1-3 100.0 0.0 40.0 25.0 78.3 28.6 22.2 44.8farmers 4-6 0.0 0.0 0.0 13.0 58.8 0.0 0.0 23.3
7-12 17.4 0.0 0.0 14.8 81.8 0.10 3.6 6.81:3-18 Males 20.0 0.0 0.0 3.8 91.5 0.0 0.0 14.313-18 Female 10.0 10.0 0.0 0.0 85.4 0.0 0.0 7.7>L8 Males 19.4 5.3 0.0 0.0 83.6 0.0l 2.9 9.5>18 Females 7.7 0.0 0.0 6.3 90.7 2.6 0.0 2.9
Source: Data retabulated from ICRISAT Research Bulletin No. 7, 1984.
deserve to be noted. First, as in Bihar, the percentage of the energy-de:lizient
individuals among landless labor and small farm households in all age groatp;; was
* International Crops Research Institute for Semi-Arid Tropics.
11
quite high. Second, the proportion of energy-deficient persons varied across
villages as it did in Bihar (the highest being in Sholapur, Maharashtra), and across
age groups, with a high proportion among children in the age group 1-3 of landless
labour households in all the villages. Third, the percentage of energy-deficient
people was lower in the surplus season. Fourth, a high proportion (ranging from 25
to 45 percent) of children in 1-3 age group in all villages and among all social
groups, rich as well as poor, and in both lean and surplus seasons, were having
energy intakes of less than 50% of recommended daily allowance."1 The last aspect
is discussed further in the next section, which focuses on malnutrition among
children.
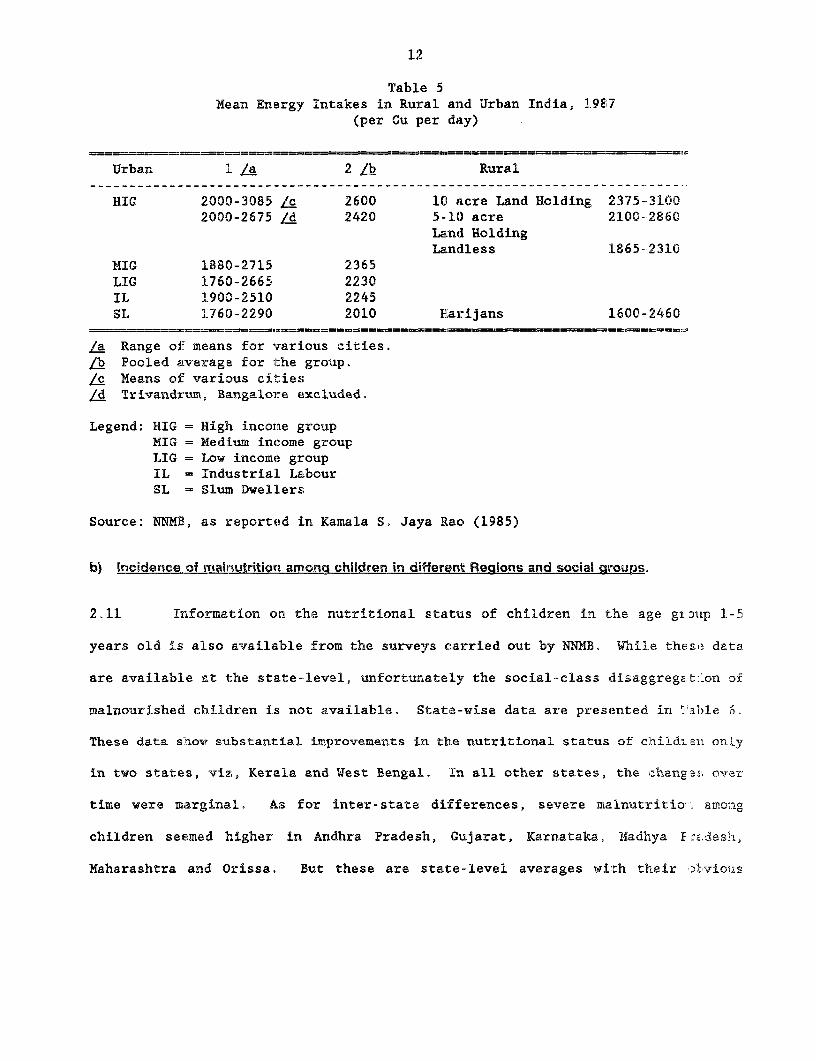
2.10 We have so far examined the location of malnutrition among the rural
households. It would be useful to compare these with the nutritional status of
social groups in urban India. A summary position of rural and urban India is
presented in Table 5. Three points deserve to be noted. First, the urban groups
in general were no better off than rural groups. Second, the energy intakes of urban
slum dwellers were no better than those of rural landless and Harijans. Third, the
rural rich (10 acres and above) appeared to have higher intakes than the urban high
income groups. There could be many reasons for this difference: the easier
accessibility of food to the rural rich, higher calorie-consciousness of the urban
rich, etc.
t1 The very high numbers for the Lean season in Sholapur and for 1-3 age children of large farmers in Aurepalleare very puzzling, and as such undoubtedly raise questions regarding reliability of this datasource - the only source available for the arid zone.
12
Table 5Mean Energy Intakes in Rural and Urban India, 1987
(per Cu per day)
Urban 1 /a 2 /b Rural
HIG 2000-3085 /c 2600 10 acre Land Holding 2375-31002000-2675 /d 2420 5-10 acre 2100-2860
Land HoldingLandless 1865-2310
MIG 1880-2715 2365LIG 1760-2665 2230IL 1900-2510 2245SL 1760-2290 2010 E'arijans 1600-2460
======-- -- --- - -= = _ _ ==_= = _ = = = = _ = __ _= = === = = :-
/a Range oi- means for various cities./b Pooled average for the group.Zc Means of: various cities/d Trivandrum, Bangalore excluded.
Legend: HIG = High incorme groupMIG = Medium income groupLIG = Low income groupIL = IndustriaL LabourSL = Slum DwelLers
Source: NNMP, as reported in Kamala S. Jaya Rao (1985)
b) Incidence of malnutrition among children in different Regions and social groups.
2.11 Information on the nutritional status of children in the age giD2ip 1-5
years old is also available from the surveys carried out by NNMB. While thcsie data
are available at the state-level, unfortunately the social--class disaggreget:on of
malnourished children is not available. State-wise data are presented in Table 6^
These data show substantial improvements in the nutritional status of childrea onLy
in two states, viz, Kerala and West Bengal. In all other states, the ahana2>t over
time were marginal. As for inter-state differences, severe malnutritio>: amoag
children seemed higher in Andhra Pradesh, Gujarat, Karnataka, Madhya PE^z.deslh,
Maharashtra and Orissa. But these are state-level averages with their )liviou s
13
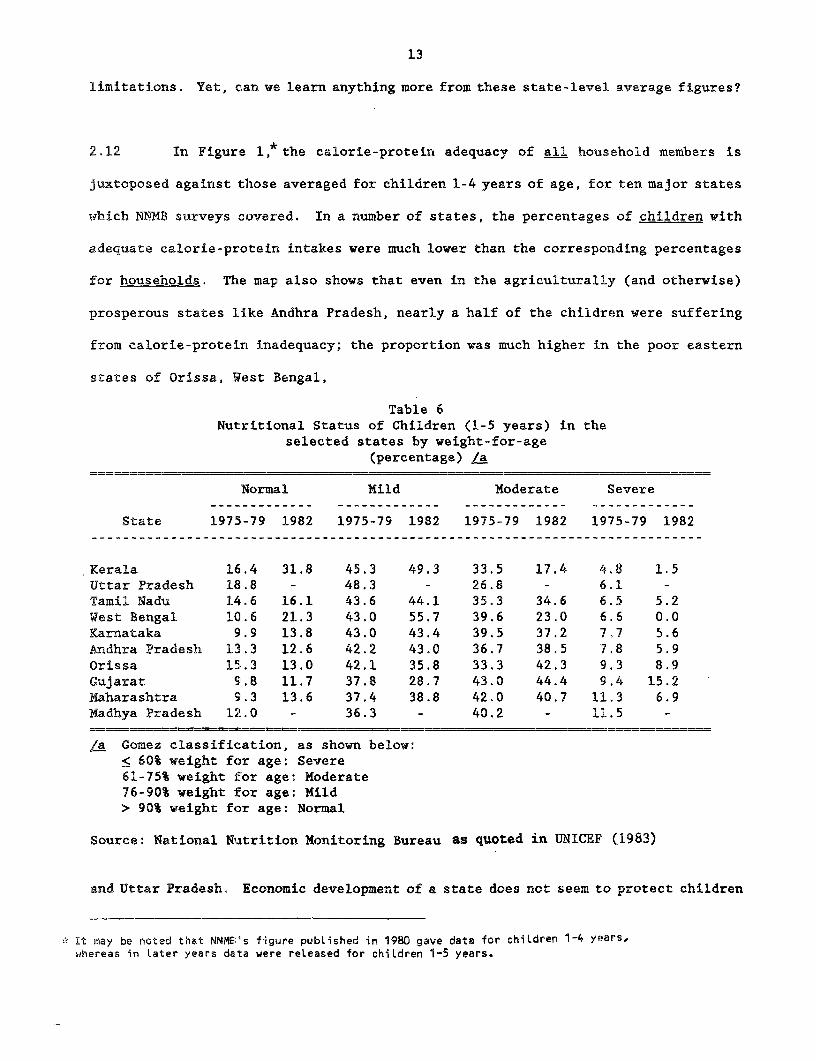
limitations. Yet, can we learn anything more from these state-level average figures?
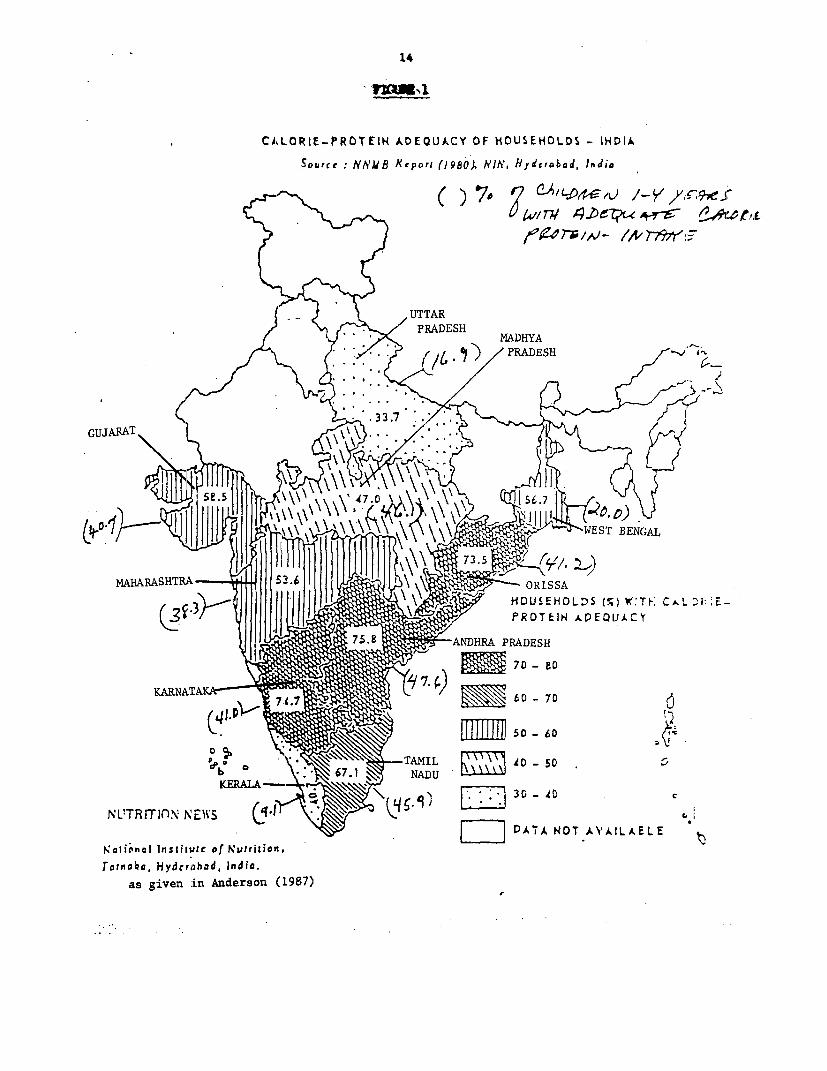
2.12 In Figure 1,* the calorie-protein adequacy of all household members is
juxtoposed against those averaged for children 1-4 years of age, for ten major states
which NNMB surveys covered. In a number of states, the percentages of children with
adequate calorie-protein intakes were much lower than the corresponding percentages
for households. The map also shows that even in the agriculturally (and otherwise)
prosperous states like Andhra Pradesh, nearly a half of the children were suffering
from calorie-protein inadequacy; the proportion was much higher in the poor eastern
states of Orissa, West Bengal,
Table 6Nutritional Status of Children (1-5 years) in the
selected states by weight-for-age(percentage) La
Normal Mild Moderate Severe
State 1975-79 1982 1975-79 1982 1975-79 1982 1975-79 1982
Kerala 16.4 31.8 45.3 49.3 33.5 17.4 4.8 1.5Uttar Pradesh 18.8 - 48.3 - 26.8 - 6.1 -Tamil Nadu 14.6 16.1 43.6 44.1 35.3 34.6 6.5 5.2West Bengal 10.6 21.3 43.0 55.7 39.6 23.0 6.6 0.0Karnataka 9.9 13.8 43.0 43.4 39.5 37.2 7,7 5.6Andhra Pradesh 13.3 12.6 42.2 43.0 36.7 38.5 7.8 5.9Orissa 15.3 13.0 42.1 35.8 33.3 42.3 9.3 8.9Gujarat 9.8 11.7 37.8 28.7 43.0 44.4 9.4 15.2Maharashtra 9.3 13.6 37.4 38.8 42.0 40.7 11.3 6.9Madhya Pradesh 12.0 - 36.3 - 40.2 - 11.5 -
,a Gomez classification, as shown below:< 60% weight for age: Severe61-75% weight for age: Moderate76-90% weight iEor age: Mild> 90% weight for age: Normal
Source: National Nuatrition Monitoring Bureau as quoted in UNICEF (1983)
and Uttar Pradesh. Economic development of a state does not seem to protect children
It may be noted that NNMEB's figure pubLished in 1980 gave data for chiLdren 1-4 years,whereas in later years data were released for children 1-5 years.
14
CA,LORIE-PROTEIH ADEQUACY OF HOUSEHOLDS - INDIASource: UNNB Reporl (19801 Hlh', iydefabod, India
(~~~~~~ ) NoE7 QzDL;buL /-yV/iX297eJ-
UTTARI) S/TAPRADESH
f U '9zw ~~~~MADHYAF t * / <PRADESH PEJ.
GJARNAT m60
RSE. 47 > TAMIL X0 -50 .
-3ATA PR OT AEIJkLAELECY16Ii'ncli ic nsliiirto of Nutritior..TaTriobo7 HyderdDH PE, Indio.
as given zin Anderson (1987)
15
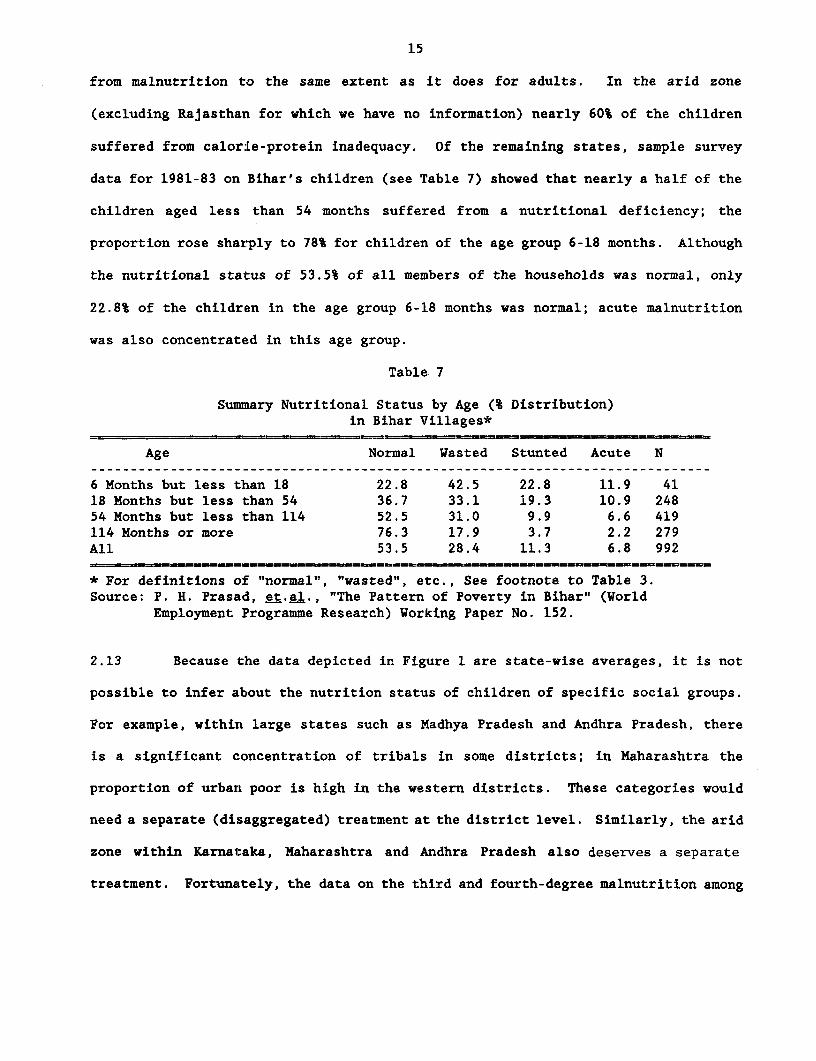
from malnutrition to the same extent as it does for adults. In the arid zone
(excluding Rajasthan for which we have no information) nearly 60% of the children
suffered from calorie-protein inadequacy. Of the remaining states, sample survey
data for 1981-83 on Bihar's children (see Table 7) showed that nearly a half of the
children aged less than 54 months suffered from a nutritional deficiency; the
proportion rose sharply to 78% for children of the age group 6-18 months. Although
the nutritional status of 53.5% of all members of the households was normal, only
22.8% of the children in the age group 6-18 months was normal; acute malnutrition
was also concentrated in this age group.
Table 7
Summary Nutritional Status by Age (% Distribution)in Bihar Villages*
Age Normal Wasted Stunted Acute N
6 Months but less than 18 22.8 42.5 22.8 11.9 4118 Months but less than 54 36.7 33.1 19.3 10.9 24854 Months but less than 114 52.5 31.0 9.9 6.6 419114 Months or more 76.3 17.9 3.7 2.2 279All 53.5 28.4 11.3 6.8 992
* For definitions of "normal", "wasted", etc., See footnote to Table 3.Source: P. H. Prasad, et.al., "The Pattern of Poverty in Bihar" (World
Employment Programme Research) Working Paper No. 152.
2.13 Because the data depicted in Figure 1 are state-wise averages, it is not
possible to infer about the nutrition status of children of specific social groups.
For example, within large states such as Madhya Pradesh and Andhra Pradesh, there
is a significant concentration of tribals in some districts; in Maharashtra the
proportion of urban poor is high in the western districts. These categories would
need a separate (disaggregated) treatment at the district level. Similarly, the arid
zone within Karnataka, Maharashtra and Andhra Pradesh also deserves a separate
treatment. Fortunately, the data on the third and fourth-degree malnutrition among
16
children collected by the ICDS monitoring authorities and the data on ICRISAT
villages reported earlier (Table 2) can be used for this purpose.
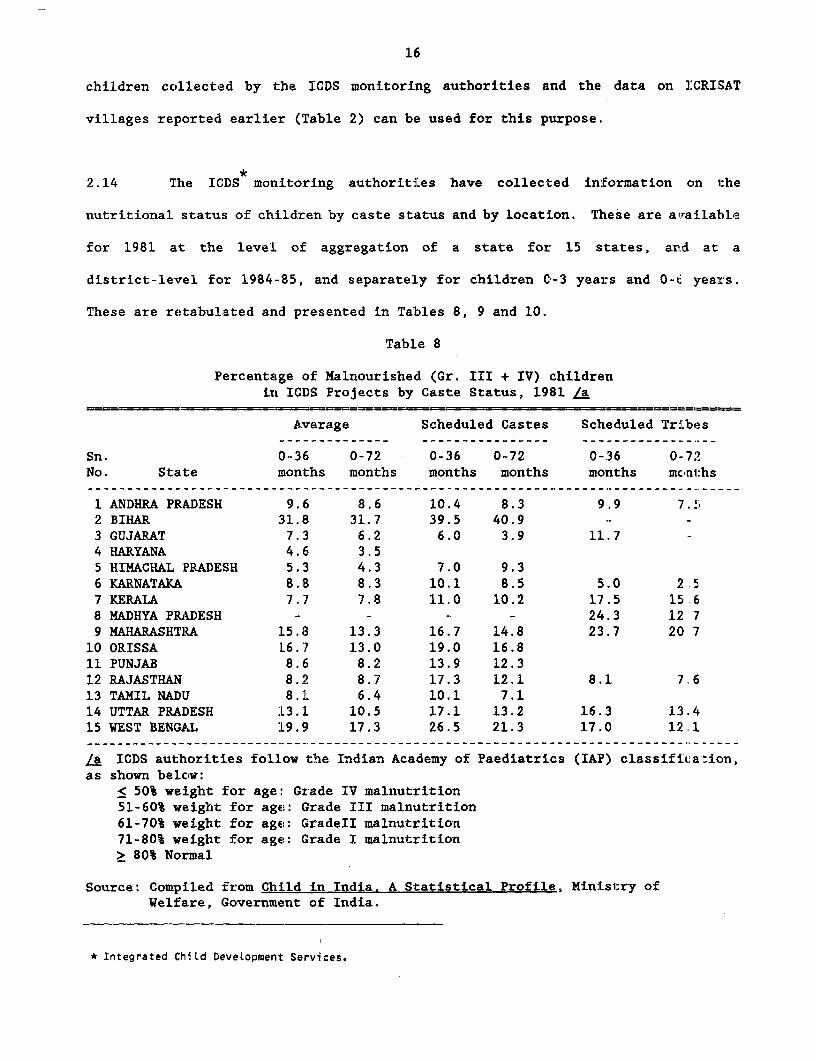
2.14 The ICDS monitoring authorities have collected information on the
nutritional status of children by caste status and by location. These are available
for 1981 at the leve:L of aggregation of a state for 15 states, ard at a
district-levrel for 1984-85, and separately for children 0-3 years and 0-l. years.
These are retabulated and presented in Tables 8, 9 and 10.
Table 8
Percentage of Malnourished (Gr. III + IV) childrenin ICDS Projects by Caste Status, 1981 La
Average Scheduled Castes Scheduled Tribes
Sn. 0-36 0-72 0-36 0-72 0-36 0-72No. State months months months months moniths monl:hs
1 ANDHRA PRADESH 9.6 8.6 10.4 8.3 9.9 7.52 BIHAR 31.8 31.7 39.5 40.9 -- -
3 GUJARAT 7.3 6.2 6.0 3.9 11.7 -4 HARYANA 4.6 3.55 HIMACHAL PRADESH 5.3 4.3 7.0 9.36 KARNATAKA 8.8 8.3 10,1 8.5 5.0 2.57 KERALA 7.7 7.8 11.0 10.2 17.5 15 68 MADHYA PRADESH - - - - 24.3 12 79 MAHARASHTR.A 15.8 13.3 16.7 14.8 23.7 20 710 ORISSA 16.7 13.0 19.0 16.811 PUNJAB 8.6 8.2 13.9 12.312 RAJASTHAN 8.2 8.7 17.3 12.1 8.1 7.613 TAMIL NADIJ 8.1 6.4 10.1 7.114 UTTAR PRADESH :L3.1 10.5 17.1 13.2 16.3 13.415 WEST BENGAL :L9.9 17.3 26.5 21.3 17.0 12.1
la ICDS authorities follow the Indian Academy of Paediatrics (IAP) classific:aAion,as shown below:
< 50% weight for age: Grade IV malnutrition51-60% weight for age: Grade III malnutrition61-70% weight for age: GradeII malnutrition71-80% weight for age: Grade I malnutrition> 80% Normal
Source: Compiled from Child in India. A Statistical Profile, Ministry ofWelfare, Government of India.
* Integrated ChiLd DeveLopment Services.
17
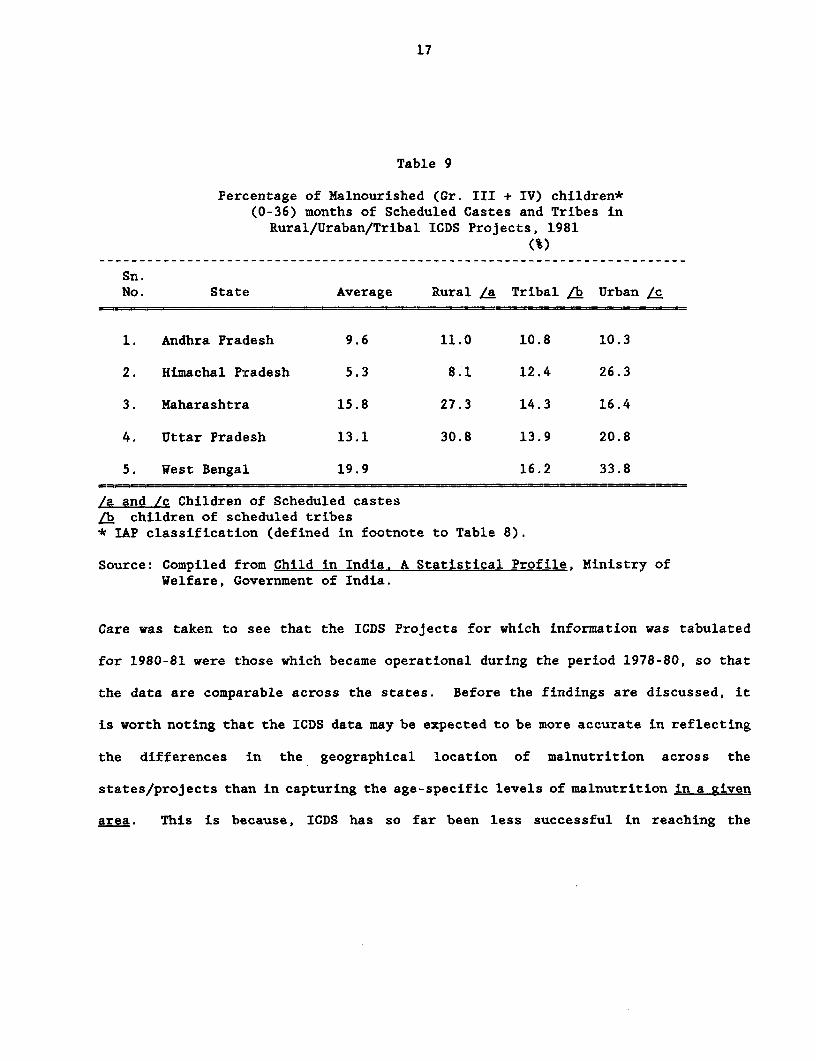
Table 9
Percentage of Malnourished (Gr. III + IV) children*(0-36) months of Scheduled Castes and Tribes in
Rural/Uraban/Tribal ICDS Projects, 1981(%)
Sn.No. State Average Rural La Tribal ab Urban /c
1. Andhra Pradesh 9.6 11.0 10.8 10.3
2. Himachal Pradesh 5.3 8.1 12.4 26.3
3. Maharashtra 15.8 27.3 14.3 16.4
4. Uttar Pradesh 13.1 30.8 13.9 20.8
5. West Bengal 19.9 16.2 33.8
/a and /c Children of Scheduled castesLb children of scheduled tribes* IAP classification (defined in footnote to Table 8).
Source: Compiled from Child in India. A Statistical Profile, Ministry ofWelfare, Government of India.
Care was taken to see that the ICDS Projects for which information was tabulated
for 1980-81 were those which became operational during the period 1978-80, so that
the data are comparable across the states. Before the findings are discussed, it
is worth noting that the ICDS data may be expected to be more accurate in reflecting
the differences in the geographical location of malnutrition across the
states/projects than in capturing the age-specific levels of malnutrition in a given
area. This is because, ICDS has so far been less successful in reaching the
18
under-threes than three-to-six-year-olds,12 so that the levels for the former may have
been under-estimated. Bearing this in mind the following findings ara worth
stressing. First, the proportion of malnourished children among the scheduleti ^astes
and scheduled tribes was higher than the average in most places (see Tabl.e 8).
Second, a comparison of the data for 0-36 months and 0-72 months shows that Niith few
exceptions the percentages of malnourished children were higher for the grcup 0-36
months even among the scheduled castes and tribes. Third, the location - riral or
urban or tri'bal - does not seem to significantly alter the above finding, as can 'be
seen from Table 9 wherein the break up is presented for the five states fo:- which
data are available. For example, the children of scheduled caste's and tr:ites in
all locations have either equal to, or higher than average percentage of c1lildren
malnourished. Fourth, in terms of percentage of malnourished children of I:ribals
in Andhra Pradesh, Kerala, Uttar Pradesh, West Bengal and Madhya Pradesh an,d those
of scheduled castes in Bihar, Orissa, Rajasthan, West Bengal and Uttar :'.radesh
suffered fromi very high levels of severe (third and fourth degree) malnutri:ion.
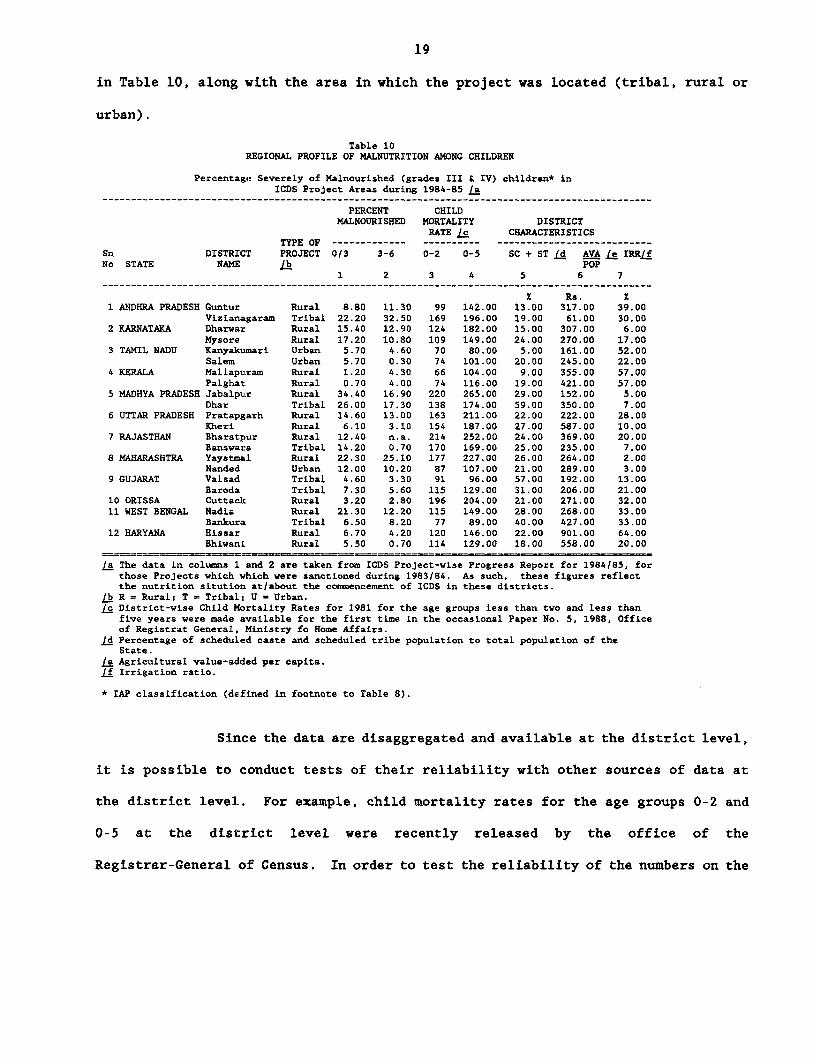
2.15 More recent data for 1984 (see Table 10) only confirm the above
findings. For this year, we have tabulated the percentage of malnolurished ctildreni
for those ICDS project/district areas which became operational 10-12 months 'DEfore
the date of data collection, so that these numbers could well serve as control group
depicting the nutritional status of children in these districts/areas for the period
1983-84. A basic limitation of this data, however, is that further disaggre;,,ation
for scheduled castes is not available, but the tribal situation can be guessel from
the location of the projects. The disaggregated project-wise information is s~iown
12See Part IV of this paper for a discussion on this aspect.
19
in Table 10, along with the area in which the project was located (tribal, rural or
urban).
Table 10REGIONAL PROFILE OF MALNUTRITION AMONG CHILDREN
Percentage Severely of Malnourished (grades III & IV) children* inICDS Project Areas during 1984-85 /a
PERCENT CHILDMALNOURISHED MORTALITY DISTRICT
RATE /c CHARACTERISTICSTYPE OF ------------- ---------- ---------------------------
Sn DISTRICT PROJECT 0/3 3-6 0-2 0-5 SC + ST Id AVA le IRR/fNo STATE NAME lb POP
1 2 3 4 5 6 7------------------------------------------------------------------------- __--__-----------------
X Rs. X1 ANDHRA PRADESH Guntur Rural 8.80 11.30 99 142.00 13.00 317.00 39.00
Vizianagaram Tribal 22.20 32.50 169 196.00 19.00 61.00 30.002 KARNATAKA Dharwar Rural 15.40 12.90 124 182.00 15.00 307.00 6.00
Mysore Rural 17.20 10.80 109 149.00 24.00 270.00 17.003 TAMIL NADU Ranyakumari Urban 5.70 4.60 70 80.00 5.00 161.00 52.00
Salem Urban 5.70 0.30 74 101.00 20.00 245.00 22.004 KERALA Mallapuram Rural 1.20 4.30 66 104.00 9.00 355.00 57.00
Palghat Rural 0.70 4.00 74 116.00 19.00 421.00 57.005 MADHYA PRADESH Jabalpur Rural 34.40 16.90 220 265.00 29.00 152.00 5.00
Dhar Tribal 26.00 17.30 138 174.00 59.00 350.00 7.006 UTTAR PRADESH Pratapgarh Rural 14.60 13.00 163 211.00 22.00 222.00 28.00
Kheri Rural 6.10 3.10 154 187.00 27.00 587.00 10.007 RAJASTHAN Bharatpur Rural 12.40 n.a. 214 252.00 24.00 369.00 20.00
Banswara Tribal 14.20 0.70 170 169.00 25.00 235.00 7.008 MAHARASHTRA YaystMal Rural 22.30 25.10 177 227.00 26.00 264.00 2.00
Nanded Urban 12.00 10.20 87 107.00 21.00 289.00 3.009 GUJARAT Valsad Tribal 4.60 3.30 91 96.00 57.00 192.00 13.00
Baroda Tribal 7.30 5.60 115 129.00 31.00 206.00 21.0010 ORISSA Cuttack Rural 3.20 2.80 196 204.00 21.00 271.00 32.0011 WEST BENGAL Nadia Rural 21.30 12.20 115 149.00 28.00 268.00 33.00
Bankura Tribal 6.50 8.20 77 89.00 40.00 427.00 33.0012 HARYANA Hissar Rural 6.70 4.20 120 146.00 22.00 901.00 64.00
Bhivani Rural 5.50 0.70 114 129.00 18.00 558.00 20.00
/a The data in columns 1 and 2 are taken from ICDS Project-wise Progress Report for 1984185, forthose Projects which which were sanctioned during 1983/84. As such, these figures reflectthe nutrition sitution atiabout the commencement of ICDS in these districts.
lb R = Rural; T = Tribal; U = Urban.to District-wise Child Mortality Rates for 1981 for the age groups less than two and less than
five years were made available for the first time in the occasional Paper No. 5, 1988, Officeof Registrat General, Ministry fo Home Affairs.
£d Percentage of scheduled caste and scheduled tribe population to total population of theState.
e4 Agricultural value-added per capita.If Irrigation ratio.
* IAP classification (defined in footnote to Table 8).
Since the data are disaggregated and available at the district level,
it is possible to conduct tests of their reliability with other sources of data at
the district level.. For example, child mortality rates for the age groups 0-2 and
0-5 at the district level were recently released by the office of the
Registrar-General of Census. In order to test the reliability of the numbers on the

20
percentage of children severely malnourished collected by the ICDS monitoring
authroities, we estimated the correlation between these and the ch:ild mortalil:y
rates for the corresponding 23 districts. A statistically significant pcsitive
correlation of 0.57 between columns 1 and 3 suggests that the ICDS base line c.ata
can be relied upon for assessing geographical v7ariations in malnutrition.
2.16 What can we infer from these data? The percentage of children s verely
malnourished are indeed very high for triba:L Andhra Pradesh, Bihar, Rajastha[1 and
Madhya Pradesh, and also in rural Karnataka, Madhya Pradesh, Uttar Pradesh,
Maharashtra and West Bengal. Many factors may have contributed to the observed
inter-project variation in the incidence of malnutrition. It is tempting to examine
whether the variation across the project/districts is at all related to the level
of development across the 23 districts in which the projects were located, as: one
would expect. Although no data are available on the districts' income, a receIt
study found that the irrigation ratio serves as an excellent proxy for the general
development of a district (See C.H.H. Rao, S.K. Ray and K. Subbarao). The following
regression equation with t:he percentage of malnourished children as the deper.dent
variable (Y), and irrigation ratio (IR) as the :independent variable, confirmEd the
expected negative relationship between the level of malnutrition and developmzr.t with 2.
high level of statistical significance:
* ~~~~2Y = 18.29 - 0.25 IR R = C1.29
(- 2.96)
* Significant at 1 percent level.
The above finding reinforces the general impression that the project/district; withl
a preponderancea of malnourished scheduled caste and tribal children are also :Ile
districts that are less developed.
13 StatisticaLLy significant at 1X LeveL.
21
2.17 The ICRISAT data for the extremely backward arid zone (for 1976), though
dated, also confirms the incidence of severe malnutrition among children in the age
group 1-3 among all classes, (see table 4).t4 In general, the incidence of energy
deficiency was higher among the children of landless labourers and small farmers.
In addition to this finding, the ICRISAT data are also useful in segregating the
effects of season on malnutrition. As one moves from lean to surplus season, the
percentage of sample individuals consuming less than 50% of recommended energy
intakes falls in almost all age groups, but the extent of decline was smallest for
children, whose proportions, though lower in surplus than in the lean season, still
continue to be very high in an absolute sense even in the surplus season.
(c) Distribution of Malnutrition by Sex
2.18 It is well-known that in traditional, poor households in rural India food
is first served to male members, and children and women eat last. This has given
rise to the notion that male members get the lion's share of family's food
allocation, and the women get the crumbs. Systematic evidence on gender
discrimination in food and nutrient intake is hard to come by. There are serious
data limitations. The common method of testing for discrimination would be to
compare the food intakes of males and females after adjusting for their requirements.
This procedure involves several conceptural and practical difficulties. An
alternative method would be to observe certain anthropometric measurements by
gender.' 5 While there is some evidence of sex bias in intrafamily distribution of
14See also footnote 11 on page 16, for probLems with this data base.
1 Sen puts greater emphasis on this. He argues that it is more important to Look at the consequences ofdisparity in food intake rather than in comparing food intake itself.
22
food, the evidence is by no means conclusive. The NXMB have calculated the calor:e
adequacy status in each age-sex group. It has also collected anthropometr:Lc
measurements on these individuals. The NNMB data 1975-82 showed consistent:y that
both sexes suffer to the same extent from calorie inadequacy (calorie irtake 2
standard dev:Lations or more below the average), although the figures were .n fact
slightly less for females (see Table 11). The NNMB data (not presented here) also
suggest that even in the pre-school age group, where the incidence of severe p;rotein
- energy-malnutrition is definitely higher among the girls, calorie intake is nct
comparatively lower among the girls. According to NNMB, the greater incid.nce of
PEM in girls is obviously not due to lower food intakes, but probably due to g;enera.l
neglect of the health of girl children. 16 However, in some cases, adequate caloric
intakes may be accompanied by excessively low protein intakes.
2.19 Sen and Sengupt:a measured malnutrition of children in two villages i.n West
Bengal by comparing their actual weights with expected weights in relation to age.
They noted systematic sex bias against girl children which was reflected both in
greater undernourishment of various degrees, and also in the lower growth dynamics
of girls vis--a-vis boys. In times of famines or general food shortage, the very
young and old of both sexes were allowed to go with inadequate food. Kakwani (>986-
b) later developed an alternative statistical procedure which allows for mea.suring
the statistical significance in the observed bias against girl children. Kalvani's
results confirm Sen-Sengupta findings only in one of the two villaLges, but RI not
support their other conclusions relating intervillage differences in the se. bias.
Kakwani also examined sex bias by age groups on data collected during an econon.ically
distressed year (floods in West Bengal during 1979), and showed the prevale:ice of
16Kakwani (1986-b) conducts a series of statistical tests on NNMB data and arrives at simiLar concLuAicns.
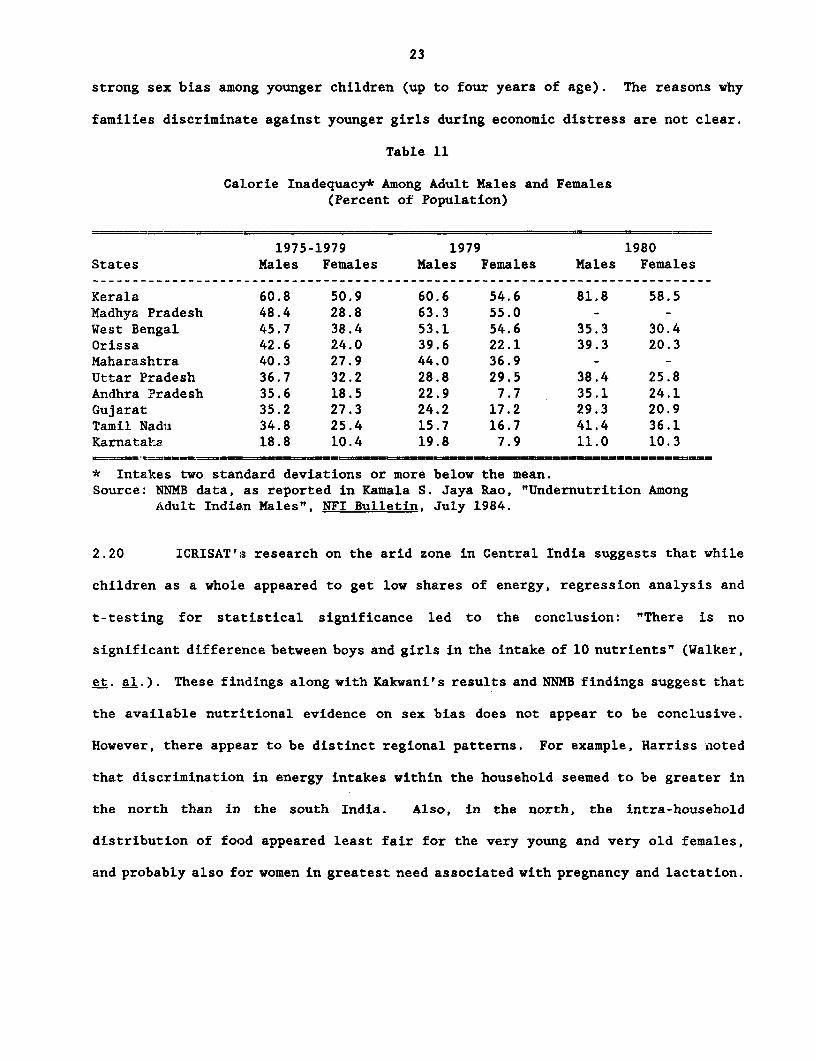
23
strong sex bias among younger children (up to four years of age). The reasons why
families discriminate against younger girls during economic distress are not clear.
Table 11
Calorie Inadequacy* Among Adult Males and Females(Percent of Population)
1975-1979 1979 1980States Males Females Males Females Males Females
Kerala 60.8 50.9 60.6 54.6 81.8 58.5Madhya Pradesh 48.4 28.8 63.3 55.0 - -West Bengal 45.7 38.4 53.1 54.6 35.3 30.4Orissa 42.6 24.0 39.6 22.1 39.3 20.3Maharashtra 40.3 27.9 44.0 36.9 - -Uttar Pradesh 36.7 32.2 28.8 29.5 38.4 25.8Andhra Pradesh 35.6 18.5 22.9 7.7 35.1 24.1Gujarat 35.2 27.3 24.2 17.2 29.3 20.9Tamil Nadu 34.8 25.4 15.7 16.7 41.4 36.1Karnataka 18.8 10.4 19.8 7.9 11.0 10.3
* Intakes two standard deviations or more below the mean.Source: NNMB data, as reported in Kamala S. Jaya Rao, "Undernutrition Among
Adult Indian Males", NFI Bulletin, July 1984.
2.20 ICRISAT's research on the arid zone in Central India suggests that while
children as a whole appeared to get low shares of energy, regression analysis and
t-testing for statistical significance led to the conclusion: "There is no
significant difference between boys and girls in the intake of 10 nutrients" (Walker,
et. al.). These findings along with Kakwani's results and NNMB findings suggest that
the available nutritional evidence on sex bias does not appear to be conclusive.
However, there appear to be distinct regional patterns. For example, Harriss ,noted
that discrimination in energy intakes within the household seemed to be greater in
the north than in the south India. Also, in the north, the intra-household
distribution of food appeared least fair for the very young and very old females,
and probably also for women in greatest need associated with pregnancy and lactation.

24
2.21 SummarY:
Thus, the NNMB data alongside the ICDS and other data sources,
examined at a disagregated level, are helpful in delineating the location of severe
malnutrition across regions, age and social groups more thoroughly than state-LeveL
averages. In terms of households' average nutritional status, severe malnutritioni
is more prevalent in the! eastern states, and Uttar Pradesh, Madhya Pradeb;h and
Kerala. In terms of social groups, the nutritional status of scheduled castes and
tribes was substantially Lower than the recommended minimum in most states. As for
age groups, the incidence of acute malnutrition is definitely high among children
especially in the age group 0-3 in almost all states; this was even higher .in the
tribal tracts. This last finding is important, given the Bank's experier'ce in
reducing the incidence of severe malnutrition among young children. While the
evidence on gender discrimination is not conclusive, regional figures suggest some
discriminatiotn in north India, especially against very young girls.
III Public Policy: Expenditure Levels and Sustainability
3.1 Broadly speaking state and central governments have been following two
approaches to fill nutrit:Lon gaps. The first approach is direct feeding prc,grams
for children and women. The second approach is aimed at providing food security at
the household level by supplying a portion of their foodgrain needs at lower t:han
market prices through a network of fair price shops.
3.2 The first approach dominated public policy during the 1950's and 1960's

25
when supplementary feeding programs of various kinds were introduced. In 1959 the
Applied Nutrition Program was initiated for pre-school children and pregnant women.
This was followed by school lunch programs for improving school attendance as well
as child nutrition. These school lunch programs were most popular in Andhra Pradesh,
Tamil Nadu and Kerala. A modicum of geographical targetting was introduced under
the Special Nutrition Program in 1970-71 which aimed at providing food to children
below six years, and to expectant and nursing mothers living in urban slums, tribal
and backward areas. The Integrated Child Development Services (ICDS) introduced in
1975 reflects the culmination of various health and nutrition action programs
focussed on vulnerable groups. (See section IV for a full description.) During the
mid 1970s, in addition to nutrition interventions, health-related interventions such
as prophylaxis against Vitamin A deficiency, nutritional anemia and endemic goitre
were also introduced.
3.3 The second approach - indirect intervention via, a Public Distribution
System (PDS) to improve the households' access to food - has occupied a central place
in public policy since mid-1970's. Initially the role of PDS was largely confined
to providing cheap food to major cities. The progress in extending PDS to the
vulnerable households especially in the rural areas was slow. Kerala was the first
state to cover the entire state with easily accessible public distribution outlets
for staple foodgrains. The entire vulnerable population of Tamil Nadu and Gujarat
(rural and urban) has been covered by the PDS network effectively since 1980. Andhra
Pradesh and Karnataka have extended PDS in 1983 and 1986 respectively. In the
remaining states, PDS has continued to be confined largely to the urban areas, so
that industrial workers and marginals in urban conglommerates such as Bombay and
Calcutta were effectively served by PDS outlets over the last two decades. But the
26
rural poor in these states by and large remained outside the purview of PDS.1;
3.4 The purpose of this section and the next is to assess t'he effectiveness
of these public responses; to the malnutrition problem. This is done with reflerence
to three criteria: (a) w'hether or not public expenditures were in conformit:y with
regional and social class nutritional needs identified in the previous sectioris; (b)
whether or not the various programs introduced were based on considerations of
long-run sustainability, without which no improvement in nutritional status can be
expected; and tc) whether or not the impact studies confirm realisation of the
objectives of the programts. It may be noted that
these norms are to some extent inter-related. For example, if expenditures do not
conform to the needs, the overall impact is bound to be disappointing. 'ret we
treated these three aspects separately because it is empirically convenient t:o do
so. This part deals with the first and the second aspects; the impact studies; are
given a detailed treatment in Part IV. The issues arising from all the four Farts
of the paper are woven together in Part V.
(a) Size and Distribution of Direct Nutrition Expenditures
3.5 Direct expenditure on nutrition support for children is incurred on three. major
items: (a) mid-day meals, (b) special nutrition program, and (c) ICDS. Durlng l986,'87,
the states spenit about Rs. 3110 million on the first two, while the Centre spent about
Rs. 1150 million on ICDS. It is worth noting that the Central Government's cx?enditur.e
during 1986/87, the first year of the Seventh Plan, is substantially higher th,.n the
17Unfortunatety the data base does not permit computation of precise numbers of population covercd byLocation (ruraL/urban) and by state.

27
Sixth Plan average. Total expenditures incurred by the States and the Centre on
direct nutrition support amounted to 1.86 and 0.5% of State and Central Plan outlays
respectively, even after accounting for the increased allocations for ICDS.
Together, the scale of expenditure during 1986/87 amounted to no more than 1.09% of
plan outlays of the Centre and the States, or 0.16% the nation's GDP. While
commitment of additional resources during the Seventh Plan is undoubtedly a
significant welcome development, the resources spent on nutrition continue to be
rather modest. The main concern of this section is: how have these modest
expenditures been distributed across the states and how productive this spending has
been in alleviating malnutrition.
3.6 It was shown in the foregoing sections that children of scheduled castes
and tribes in Madhya Pradesh, Rajasthan, Andhra Pradesh, Orissa, Bihar, West Bengal
and Uttar Pradesh suffer more heavily from malnutrition. Let us now examine how far
the allocation of resources responded to the observed regional variations in needs.
We compute the state-wise real expenditure per child during the Sixth Plan and the
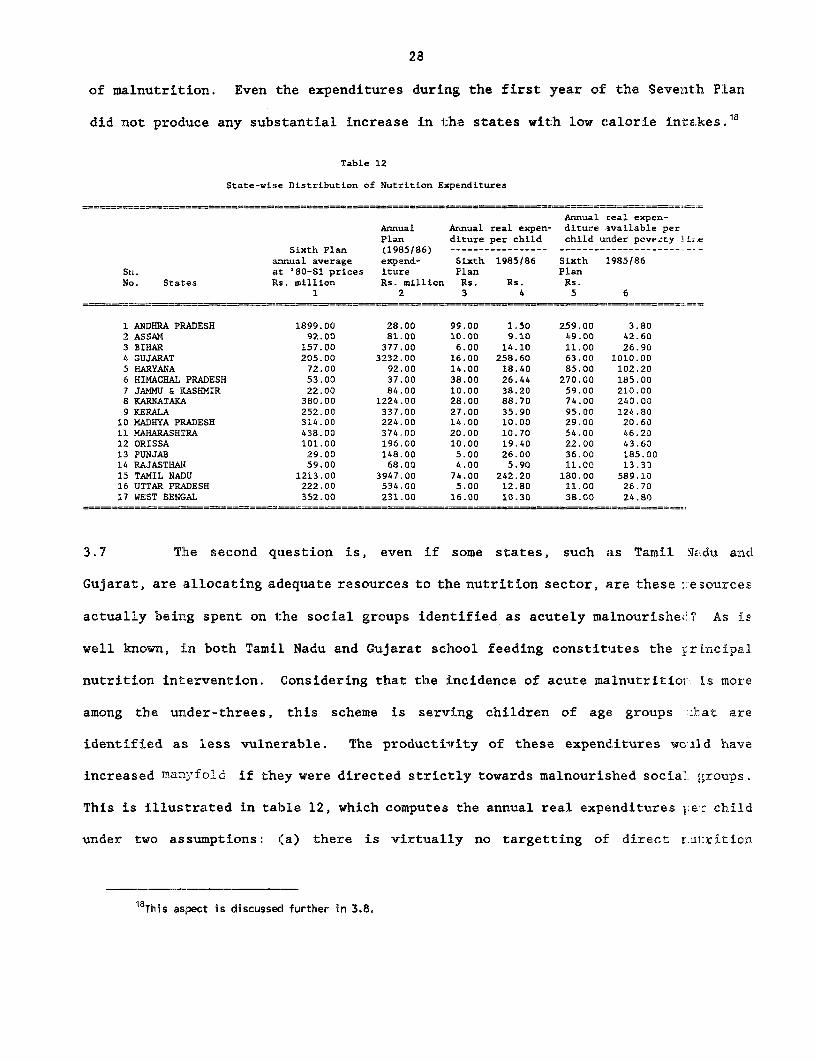
first year of the Seventh Plan (see table 12). Direct nutrition expenditures
per child in all the above mentioned states are extremely small - almost nil as in
Andhra Pradesh and Rajasthan. By contrast the expenditures on direct nutrition
programs (supplementary feeding) have been high in the three southern states (Tamil
Nadu, Kerala, Karnataka) and Gujarat. In these states, the need as measured by
calorie intakes is not arguably the greatest. It is possible that high expenditures
in the past may have led to high calorie intakes (lower needs), although it is
difficult to test this hypothesis owing to lack of state-wise, time series data on
levels of malnutrition with appropriate control groups. Nonetheless, there appears
to be no recent significant change in expenditures in the states with high levels
28
of malnutrition. Even the expenditures during the first year of the Sevenlth FPLan
did not produce any substantial increase in the states with low calorie intakes.16
Table 12
State-wise Distribution of Nutrition Expenditures
Annual real expen-Annual Annual real expen- diture asvailable perPlan diture per child child uader pove.ty lir.e
Sixth Plan (1985/86) ----------------- -----------_________._-annual average expend- Sixth 1985186 Sixth 1985186
Sn. at '80-81 prices iture Plan PlanNo. States Its. million Rs. million Rs. Rs. Rs.
1 2 3 4 5 6
1 ANDHRA P:RADESH 1899.00 28.00 99.00 1.50 259.00 3.802 ASSAM 92.00 81.00 10.00 9.10 49.00 42.603 BIHAR 157.00 377.00 6.00 14.10 11.00 26.904 GUJARAT 205.00 3232.00 16.00 258.60 63.00 1010.005 HARYANA 72.00 92.00 14.00 18.40 85.00 102.206 HIMACHAL PRADESH 53.00 37.00 38.00 26.44 270.00 185.007 JAMMU & KASHMIR 22.00 84.00 10.00 38.20 59.00 210.008 KARNATAKi 380.00 1224.00 28.00 88.70 74.00 240.009 KERALA 252.00 337.00 27.00 35.90 95.00 124.8010 MADHYA PRADESH 314.00 224.00 14.00 10.00 29.00 20.6011 MAHARASHTRA 438.00 374.00 20.00 10.70 54.00 46.2012 ORISSA 101.00 196.00 10.00 19.40 22.00 43.6013 PUNJAB 29.00 148.00 5.00 26.00 36.00 185.0014 RAJASTHAN 59.00 68.00 4.00 5.90 11.00 13.3015 TAMIL NADU 1213.00 3947.00 74.00 242.20 180.00 589.1016 UTTAR PRADESH 222.00 534.00 5.00 12.80 11.00 26.7017 WEST BENGAL 352.00 231.00 16.00 10.30 38.00 24.80
3.7 The second question is, even if some states, such as Tamil 4..du anc
Gujarat, are allocating a,dequiate resources to the nutrition sector, are these 1:esources
actually beirg spent on 1:he social groups identified as acutely malnourisheO? As is
well known, in both Tamil Nadu and Gujarat school feeding constituates the :rincipal
nutrition intervention. Considering that the incidence of acute malnutritio:. Ls more
among the under-threes, this scheme is serving children of age groups :hat are
identified as less vulnerable. The productivrity of these expenditures wciLd have
increased many-fold if they were directed strictly towards malnourished social groups.
This is illustrated in table 12, which computes the annual real expenditures I;er: child
under two assumptions: i(a) there is virtually no targetting of direct r.ul:rition
18This asiect is discussed further in 3.8.
29
expenditures (which is by and large the case in most states), (cols. 3 and 4) anrd (b)
these expenditures are confined at least towards children under the poverty line,
though not strictly towards malnourished children (cols. 5 and 6). Since all children
are covered under the programs in Tamil Nadu and Gujarat, these two states spent about
Rs. 250/- per annum per child during the first year of the Seventh Plan. If efforts
were made to even modestly orient these programs towards children of families under
the poverty line, (col. 5 and 6), a substantially higher nutrition support per poor
child would be poss:Lble; alternatively more needy children could be covered. For
example, if nutrition support were strictly confined to poor children, in eight states
(Gujarat, Himachal Pradesh, Haryana, Jammu and Kashmir, Karnataka, Kerala, Punjab and
Tamil Nadu), a nutrition support of more than Rs. 100 per child per annum could have
been effected. But in reality feeding programs in some states resorted to coverage
of all children, so that their impact on nutrition continued to be small, thus lowering
the productivity of even modest expenditures.
3.8 The third question is: are there any visible signs of change in the Seventh
Plan as compared to the Sixth Plan. If so, which states are attempting to change their
efforts? And in which direction? The state-wise distribution of state's expenditures
on nutrition for the Seventh Plan for 17 major states is presented in table 13,
alongside planned outlays and actual expenditures for 1985/86, the first year of the
Seventh Plan. Actual direct expenditure on nutrition as a percent of plan outlays
ranged from 11% in Andhra Pradesh to 183% in Himachal Pradesh. One of the reasons for
the observed wide disparity between intentions (planned outlays) and actual
expenditures is that some state governments such as Orissa and Himachal Pradesh found
their initial allocations insufficient for the needs. But for most state governments,
actual expenditures; fell short of outlays largely because of paucity of resources.
30
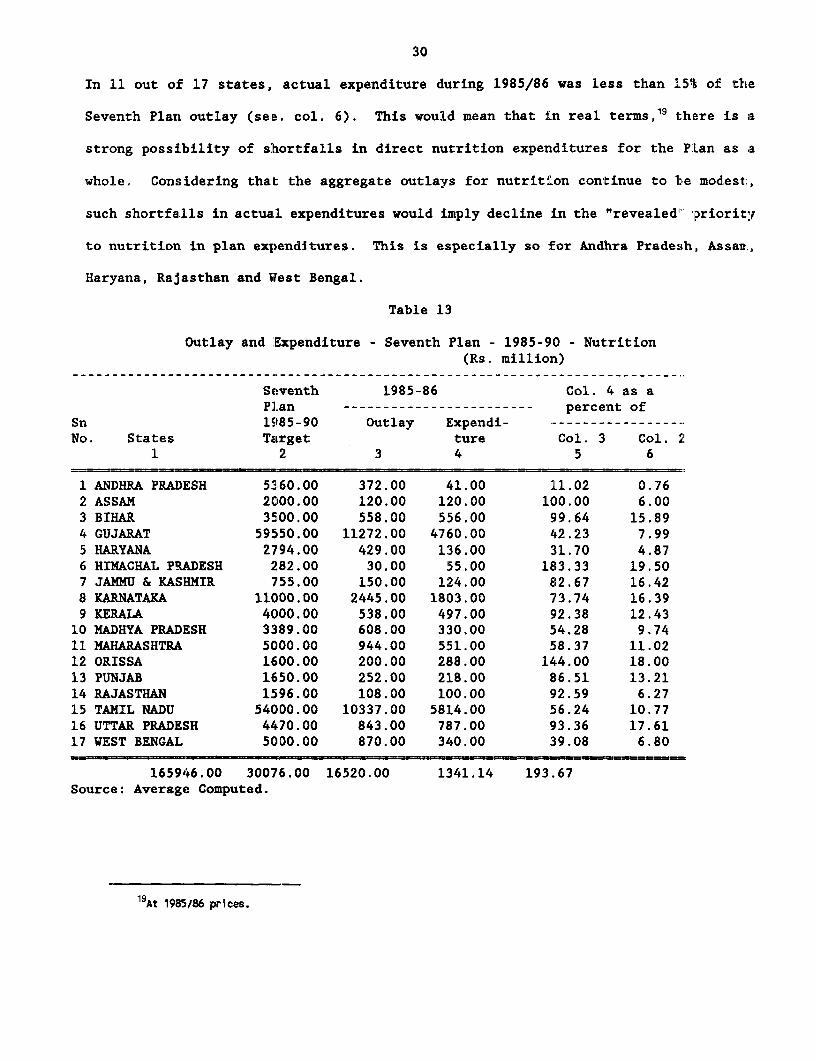
In 11 out o:f 17 states, actual expenditure during 1985/86 was less than 15% of the
Seventh Plan outlay (se,e. col. 6). This would mean that in real terms,19 there is a
strong possibility of shortfalls in direct nutrition expenditures for the PLan as a
whole. Considering that the aggregate outlays for nutrition continue to 1te modest,
such shortfa.lls in actual expenditures would imply decline in the "revealed" Priority
to nutrition in plan expenditures. This is especially so for Andhra Pradesh, Assani.,
Haryana, Rajasthan and Wfest Bengal.
Table 13
Outlay and 'Expenditure - Seventh Plan - 1985-90 - Nutrition(Rs. million)
Seventh 1985-86 Col. 4 as aPlan ----------------------- percent of
Sn 1985-90 Outlay Expendi- -----------------No. States Target ture Col. 3 Col. .
1 2 3 4 5 6
1 ANDHRA PRADESH 5360.00 372.00 41.00 11.02 0.762 ASSAM 2000.00 120.00 120.00 100.00 6.003 BIHAR 3500.00 558.00 556.00 99.64 15.894 GUJARAT 59550.00 11272.00 4760.00 42.23 7.995 HARYANA 2794.00 429.00 136.00 31.70 4.876 HIMACHAL PRADESH 282.00 30.00 55.00 183.33 19.507 JAMMU & KASHMIR 755.00 150.00 124.00 82.67 16.428 KARNATAKA 11000.00 2445.00 1803.00 73.74 16.399 KERALA 4000.00 538.00 497.00 92.38 12.4310 MADHYA PRADESH 3389.00 608.00 330.00 54.28 9.7411 MAHARASHTRA 5000.00 944.00 551.00 58.37 11.0212 ORISSA 1600.00 200.00 288.00 144.00 18.0013 PUNJAB 1650.00 252.00 218.00 86.51 13.2114 RAJASTHAN 1596.00 108.00 100.00 92.59 6.2715 TAMIL NADU 54000.00 10337.00 5814.00 56.24 10.7716 UTTAR PRADESH 4470.00 843.00 787.00 93.36 17.6117 WEST BENGAL 5000.00 870.00 340.00 39.08 6.80
165946.00 3007,6.00 16520.00 1341.14 193.67Source: Average Computed.
19At 1985/86 prices.
31
3.9 Across the states, there are also interesting sharp "turn-abouts" from the
Sixth Plan to the firsit year of the Seventh Plan. A classic case of such a sharp change
is that of Andhra Pradesh, where direct nutrition expenditure per annum fell from Rs. 1899
million to Rs. 28 million (see cols. 1 and 2, Table 12). Gujarat, Karnataka, and Tamil
Nadu represent the opposite extreme: a sharp rise in direct nutrition expenditures per
annum owing essentially to introduction and/or expansion of school feeding programs. While
resource-deficient states such as Bihar were unable to introduce direct nutrition support
programs despite their acute need, states that are relatively better-off, such as Gujarat,
did not hesitate to introduce massive feeding programs.
3.10 The mismatch between regional needs (incidence of malnutrition) and
expenditures noted above is reflected in physical performance. For example, regional
asymmetry in the coverage of feeding programs is clearly evident from Table 14. Different
state governments are running different types of feeding programs, often many types in the
same state. An effort has been made to arrive at an aggregate figure of total number of
children fed (avoiding double-counting), for each of the 17 large states. This is shown
in column 4. It is instructive to compare this column with the next four columns showing
the number of all children (column 5); poor children in the age group 0-9 (column 6);
moderately and severe:Ly malnourished children (Col. 7) and severely malnourished children
(Col. 8).20 For each state column 9 gives total children fed as a percent of all children
in the age group (i.e. assuming zero targetting); column 10 gives total children fed as
a percent of children of families below the poverty line (i.e. assuming some targetting
towards the poor though not strictly towards the malnourished); column 11 presents the
percentage if the feeding were confined to all the "moderately and severely" malnourished
2OWe used the NNME estimates for the malnourished children for the ten states for which data are availablefor 1982.
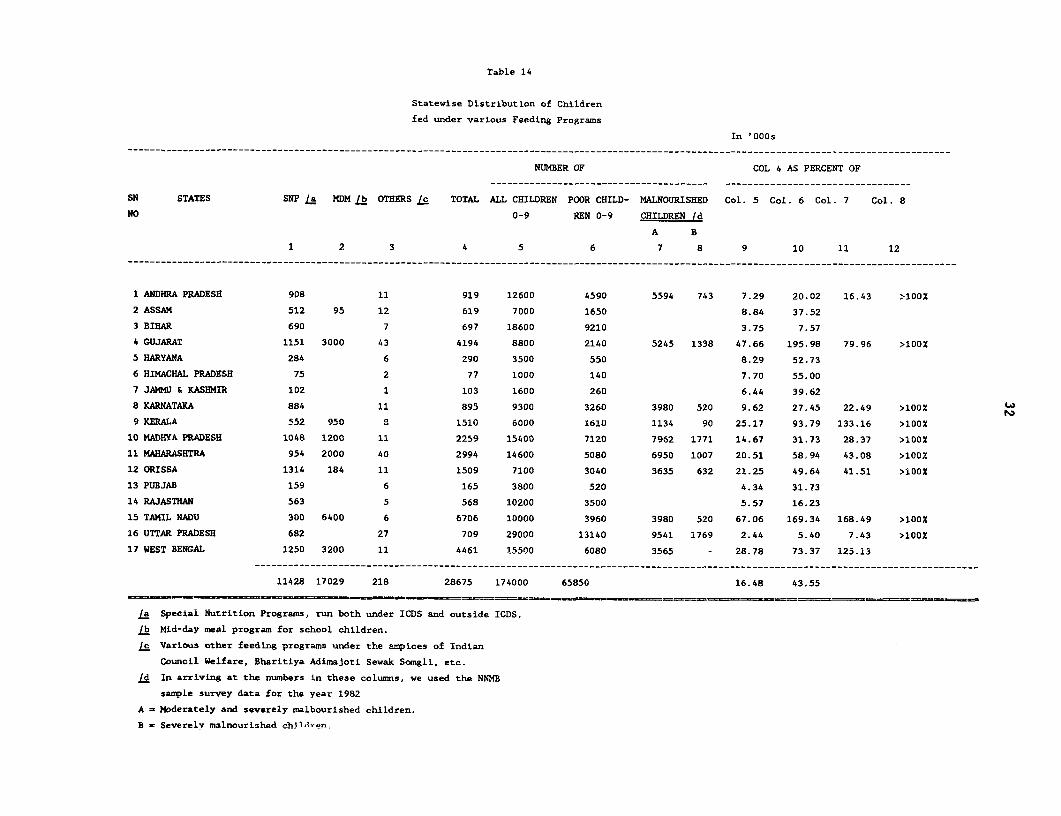
Table 14
Statevise Distribution of Children
fed under various Feeding Programs
In '000s___________________________________________________________________________________________________________________________________________________
NUMBER OF COL 4 AS PERCENT OF
SN STATES SNP /a MDM /b OTHERS /c TOTAL ALL CHILDREN POOR CHILD- MALNOURISHED Col. 5 Col. 6 Col. 7 Col. 8
NO 0-9 REN 0-9 CHILDREN /d
A B
1 2 3 4 5 6 7 8 9 10 11 12
…__ _ - - - - -_ _ _ _ _ _ _ _ _ _ _ _ _ _ _ _ _ _ _ _ _ _ _ _ _ _ _ _ _ _ _ _ _ _ _ _ _ _ _ _ _ _ _ _ _ _ _ _ _ _ _ _ _ _ _ _ _ _ _ _ _ _ _ _ _ _ _ _ _ _ _ _ _ _ _ _ _ _ _ _ _ _ _ _ _ _ _ _ _ _ _ _ _ _ _ _ _ _ _ _ _ _ _ _ _ _ _ _ _ _ _ _ _ _ _ _ _ _ _ _
1 ANDHRA PRADESH 908 11 919 12600 4590 5594 743 7.29 20,02 16.43 >100O
2 ASSAM 512 95 12 619 7000 1650 8.84 37.52
3 BIHAR 690 7 697 18600 9210 3.75 7.57
4 GUJARAT 1151 3000 43 4194 8800 2140 5245 1338 47.66 195.98 79.96 >100%
5 HARYANA 284 6 290 3500 550 8.29 52.73
6 HIMACHAL PRADESH 75 2 77 1000 140 7.70 55.00
7 JAMMU & KASHMIR 102 1 103 1600 260 6.44 39.62
8 KARNATAKA 884 11 895 9300 3260 3980 520 9.62 27.45 22.49 >100%
9 KERALA 552 950 8 1510 6000 1610 1134 90 25.17 93.79 133.16 >100O
10 MADHYA PRADESH 1048 1200 11 2259 15400 7120 7962 1771 14.67 31.73 28.37 >100%
11 MAHARASHTRA 954 2000 40 2994 14600 5080 6950 1007 20.51 58,94 43.08 >100%
12 ORISSA 1314 184 11 1509 7100 3040 3635 632 21.25 49.64 41.51 >100%
13 PUBJAB 159 6 165 3800 520 4.34 31.73
14 RAJASTHAN 563 5 568 10200 3500 5.57 16.23
15 TAMIL NADU 300 6400 6 6706 10000 3960 3980 520 67.06 169.34 168.49 >100%
16 UTTAR PRADESH 682 27 709 29000 13140 9541 1769 2.44 5.40 7.43 >10OX
17 WEST BENGAL 1250 3200 11 4461 15500 6080 3565 - 28.78 73.37 125.13---------------------------------------------------------------- __-----------__--------------------------------------------------
11428 17029 218 28675 174000 65850 16.48 43.55
La Special Nutrition Programs, run both under ICDS and outside ICDS.
/b Mid-day meal program for school children.
Ic Various other feeding programs under the ampices of Indian
Council Welfare, Bharitiya Adimajoti Sewak Somgli, etc.
Ld In arriving at the numbers in these columns, we used the NNMB
sample survey data for the year 1982
A - Moderately and severely malbourished children.
B - Severely malnourished ehildren
33
children; and column 12 if the feeding were confined only for the severely malnourished
children.
3.11 Even assuming targetting to poor children (col. 10), which is by and large
not the case in reality, the coverage was extremely poor in states with the greatest need
such as Andhra Pradesh, Bihar, Rajasthan, Uttar Pradesh.21 However, if the feeding were
to be strictly confined to all the moderately and severely malnourished children, then the
prevailing scale of the program is reasonably adequate in Gujarat, and is more than
adequate in Kerala, Tamil Nadu and West Bengal (col. 11). In other words, in these four
states the nutrition expenditures currently being incurred are adequate for combating
malnutrition if only these were directed only at the malnourished children. If the feeding
were to be directed only to "severely malnourished" children, the existing resources would
appear to provide complete coverage, except for Uttar Pradesh (col. 12) and probably
Bihar.
3.12 These considerations suggest the potential benefits from reform in
supplementary feeding programs currently being administered. As at present, regional
asymmetry in the coverage is striking: four states in which only 26% of the poor children
of the country are located (Gujarat, Maharashtra, Tamil Nadu and West Bengal) accounted
for as much as 64% of the country's children fed under the various feeding programs
(including ICDS) .22
21The data on state-wise number of poor and malnourished children reflecting "needs" belong to early 1980s,so that they represent the position after netting out the influence of other interventions such as EGS inMaharashtra.
22More or less similar regional asymmetry prevails with respect to the Public Distribution System, whichis discussed later.
34
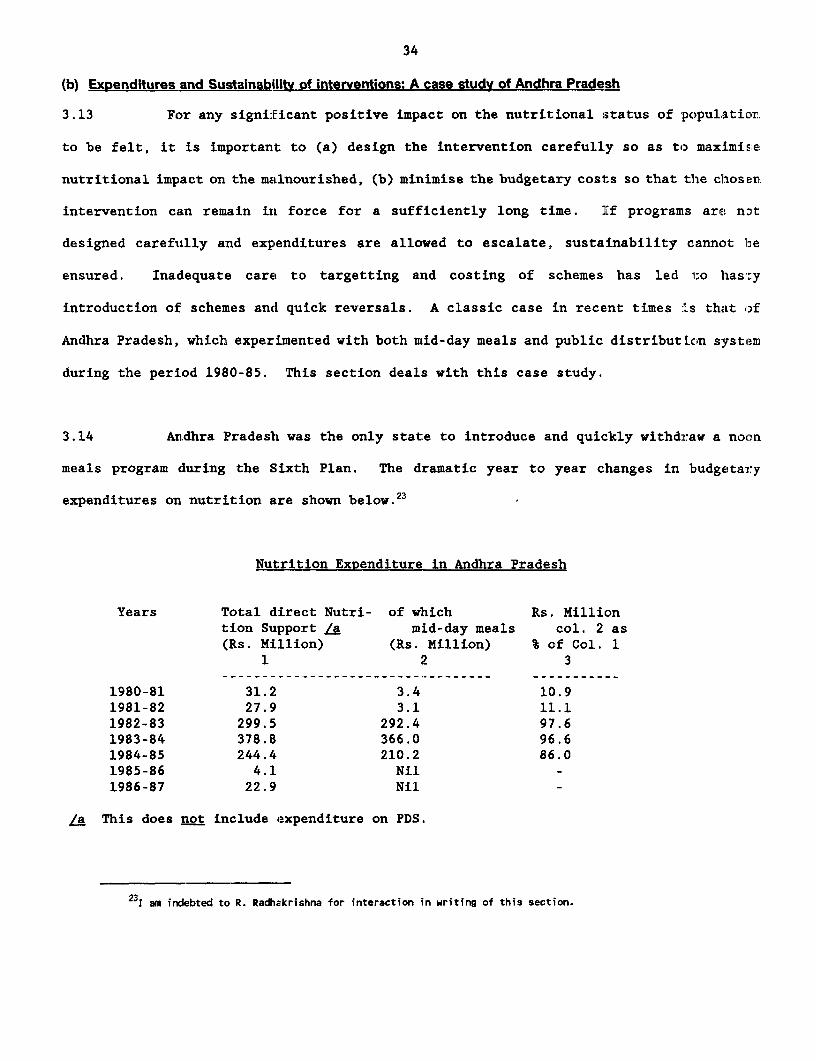
(b) Expenditures and Sustainabilitv of interventions: A case study of Andhra Pradesh
3.13 For any significant positive impact on the nutritional status of populaticon
to be felt, it is important to (a) design the intervention carefully so as to maximis:e
nutritional impact on the nmalnourished, (b) minimise the budgetary costs so that the cthosen
intervention can remain in force for a sufficiently long time. If programs are nont
designed carefutlly and expenditures are allowed to escalate, sustainability cannot be
ensured. Inadequate care to targetting and costing of schemes has led 1;0 hasty
introduction of schemes and quick reversals. A classic case in recent times :Ls that of
Andhra Pradesh, which experimented with both mid-day meals and public distributLcon system
during the period 1980-85. This section deals with this case study.
3.14 An,dhra Pradesh was the only state to introduce and quickly withdraw a noon
meals program during the Sixth Plan. The dramatic year to year changes in budgetary
expenditures on nutrition are shown below.23
Nutrition Expenditure in Andhra Pradesh
Years Total direct Nutri- of which Rs. Milliontion Support /a mid-day meals col. 2 as(Rs. Million) (Rs. Million) % of Col. 1
1 2 3
1980-81 31.2 3.4 10.91981-82 27.9 3.1 11.11982-83 299.5 292.4 97.61983-84 378.8 366.0 96.61984-85 244.4 210.2 86.01985-86 4.1 Nil1986-87 22.9 Nil
La This does not include expenditure on PDS.
231 am indebted to R. Radhakrishna for interaction in writing of this section.
35
During 1980-81 and 1981-82, the government was feeding Ready to Eat (RTE) food at the
rate of 60 grams per child as a mid-day meal to 535,000 school children of grates I to
V (primary classes) in five backward districts. During the same period, CARE food was
supplied at 13,495 centres benefitting 1.36 million children mainly belonging to the
weaker sections, incurring an expenditure of Rs. 11.5 million. During 1982-83, the
program of noon-meal (outside CARE purview) was extended to all school children in the
grades I to V in all the 23 districts throughout the state, so that the expenditure
rose from Rs 3.1 million in 1981-82 to Rs. 292.4 million in 1983. This was done by
the new government (Telugu Desam) which came into power at this time. During the
following year the scheme was further extended to children in classes VI and VII;
the CARE food was suitably supplemented to bring it to the level of food supplied under
the noon-meal program; the education department became the nodal agency for monitoring
and a senior officer of Indian Administrative Service was placed in charge of the
scheme exclusively. Expenditure further rose to Rs. 366.0 million during 1983-84 -
roughly 5% of the annual plan outlay of the state and 97% of the total direct
nutrition expenditure. After a detailed review of the scheme, efforts were made towards
targetting, and the beneficiaries were confined to children of scheduled castes, tribes
and backward classes, and children of parents whose annual income did not exceed Rs. 3000.
Government supplied noon-meals was now entirely withdrawn in the five CARE districts.
These measures brought down the annual expenditures to Rs. 210.2 million during 1984/85.
Noon-meal program was totally given up during the Seventh Plan. Indeed, expenditure on
all direct nutrition support (including ICDS) fell sharply to Rs. 22.9 million during
1986/87.
3.14 The new government also wanted to honour the electoral promise of providing
rice to the vulnerable population at Rs. 2 a kilo. This is a scheme aimed at improving
the poor households' overall access to foodgrains. Subsidy cost of this scheme, which was
36
untargetted, rose sharply pari Rassu with the subsidy on noon-meal scheme. During :L983-84,
both programs together exceeded 12% of the annual plan outlay. Clearly the gouerl:rent could
not sustain two welfare programs when each accounted for substantial budgetary explenditure,
The government withdrew the noon-meal scheme, but continued with the subsid:sed food
distribution scheme.24 The rationale for preferring one scheme over: the othir is not:
entirely clear, although one reason given was that noon meals scheme couli not, be
administered eff.iciently owlng to lack of advance preparation.
3.15 What lessons can one draw from the Andhra Pradesh experience? First,
noon-meal scheme was introduced without a prior careful analysis of its t).dge1:arSj
implications and administrative feasibility for ensuring its long-run sustainabil::ty. I
such an analysis had been done, then the budgetary implications might have provicietl a pushil
to more careful. targetting. Second, Andhra Pradesh experience also suggesi:s tha-1:
targetting (e.g. restricting access to vulnerable groups) is difficult: where children o:i
the poor and the near-poor are numerous in certain locations. Third, the suddeu rise iln
expenditure on this scheme during the Sixth Plan must have brought about adjustmen.s (cuts:
in Plan allocations on other schemes, and must have depleted the resources nl.eied for
long-term development, the consequences of which are difficult to assess. Thou~:,h beyonca
the scope of thisi paper, it is important to consider the macro-economic: impacts i:cf sudder.
swings in plan allocations following the introduction of an expensive we'Lfare sche:nE. This
is because policy simulation models using all-India data do suggest that the nust impact
of such untargetted and expensive welfare schemes on the poor could as well be re!ressive,
both because of the inflationary potential of such. schemes, and also because of adverse
24This schene is discussed further in Part IV.
37
effects on employment/incomes consequent upon cut backs in development
expenditure. (de Janvry and Subbarao 1987).
3.16 The foregoing suggests that noon-meal schemes may not be the right answer
to the problem of malnutrition in India, whatever be their other advantages such
as improvement in school attendance.25 Such schemes are usually addressed to
older children wh.ile malnutrition is more serious among the age group 0-3; even
for the older children they often substitute rather than supplement a meal.
The relevance of noon meals scheme appears particularly dubious for Andhra
Pradesh. We have already seen that except for tribal blocks, the average
nutrition level in Andhra Pradesh is better than in other states, so that a
scheme such as a well-targetted PDS would have pushed the average up, while
effective outreach of ICDS would have improved nutrition in tribal areas. To
this extent, the choice of PDS (Rs. 2 a kilo scheme) could be justified on a
Eriori grounds, even if its wide coverage is unjustified. The Andhra Pradesh
experience also suggests how important it is to pay attention to nuts and bolts
issues such as alternative means of restricting access to the malnourished
groups, appropriate costing of alternatives, etc. Only a careful analysis can
determine the right mix of welfare interventions that are sustainable in the
long run.
25Past experience suggests that while attendance improved with school feeding, the programs by and largefailed to attract youncg girls belonging to bottom deciles (especially of landless labor) who have to fetchwater, fodder for the cattle, and look after their younger brothers and sisters, while their parents are outin the fields.
38
IV Public Policy: The Effectiveness of ICDS and PDS
4.1 In the following sections, the public response to the malnutrition problem
is futher assessed with reference to the effectiveness of one direct interveiit ion
- the ICDS - and one major indirect intervention, viz., the Public Distribution
System.
(a) Integrated Child DeveloRment Services (ICDS)
4.2 Program DescriRtLon: ICDS is a country-wide program for child development.
It adopts a holistic approach to improve both pre-natal and post-natal
environmenit of the child. As such, mothers are also included in the program's
outreach. The program aims to achieve four objectives: (i) to improve, the
nutritional status of children 0-6 years via supplementary feeding to "sele:ted"
beneficiaries; (ii) Ito encourage school enrollment via early pre-s':bool
stimulation program for children 3-6 years old; (iii) to enhance the mothler's
awareness via health arLd nutrition education, and (iv) to coordinate with hi-alth
departments to ensure delivery of the required health inputs inclnding
immunisation to children and mothers, so that both morbidity and mortality 7ates
decline over time. A package of six services are thus delivered through Iu,ES:
- health check-up- immuaisation- referral services- suppLementary nutrition- non-formal education- nutrition and health education to mothers
4.3 This program is Centrally-sponsored but administered by the ,tate
39
governments. The responsibility for financing ICDS is shared between the
Government of India and the States. The Government of India provides support
for the establishment and maintenance of infrastructure including (a) salaries
of all ICDS staff (b) basic equipment for Anganwadi centres,26 (c) indoor play
materials for children, (d) petrol and oil expenses (e) Anganwadi centre rent,
where applicable; and (f) medicine and medical kits. The state government meets
the expenses for supplementary food for all Anganwadi Centres. Some state
govenments also have started some ICDS Anganwadis on their own, for which they
meet the expenses for all the inputs including establishment and infrastructure
maintenance. There are 167 state-sponsored anganwadi projects in operation as
of 1985/86.
4.4 The Government of India intends to extend the program to cover 50 % of
all poor children below the age six years (approximately 23.7 million by the end
of the Seventh Plan (1985-90). The estimated cost of expansion is approximately
US$ 1000 million (at September 1985 exchange rate), of which US$ 400 million will
be provided by the Government of India, and the rest by the State governments.
These figures do not include the cost of health inputs - staff, drugs, referral
services - which are provided to ICDS through the Primary Health Care System.
4.5 The expansion of ICDS is basically a sound policy response because (a) it
is aimed at children and women among whom malnutrition is heavily concentrated;
and (b) the projects have been set up generally in areas of acute malnutrition
(such as tribal areas). During the Seventh Plan period, all tribal areas, and
26"Anganwadi" is a community centre where children and mothers assemble to receive the services of ICDSoutlined above.

40
rural areas with a concentration of scheduled caste population, and urban slums
are expected to receive priority in the selection of projects. ICDS thus adcpts
both "program" targetting inasmuch as the beneficiaries for supplementary feiading
are expected to be chosen on the criterion of need, and "area" targetting to the
extent the projects are located in regions of acute need.
4.6 Once an ICDS project is made operational, the Anganwadi_ Centre (AWC)
becomes the focal point for the delivery of services. The responsibilitils of
the Anganwadi Worker (AWW) include non-formal pre-school education for the older
children, organisatiorL of supplementary feeding after identifying eliL;ible
children and mothers, imparting health and nutrition education to wl:>men;
educating parents by home visits; eliciting community support and participal:ion;
primary health care for children and mothers and referring the neiedy to mer.ical
personnel (under the health department); liasing with local organizations like
Mahila Majdals;27 and finally maintaining records and furnishing pro,,;ress
reports. AWW receives supervision and guidance from a Supervisor who norliLally
looks after 20 AWWs. A full time Child Development Project Officer is in clLarge
of each ICDS proj3ect. The health infrastructure in ICDS areas is providld by
one Auxiliary Nurse Mid-wife (ANM), one Lady Health visitor (to supervisc the
work of four ANMs) and one doctor per block. All these health services arv the
responsibility of the Health Department. ICDS is thus a multi-departmintal
endeavour, and its success critically hinges on coordination between the two
departments; at the AWW level. Its success also depends to a great extent on the
content and quality of training imparted to various functionaries iin the prov!ram.
27"Mahila Mandals" is a local women's organization.

41
4.7 Finally, a mechanism for monitoring is built into the ICDS program. A
regular flow of information on the services delivered is ensured via progress
reports which are consolidated at a Central Cell at the All India Institute ofror
Medical Sciences, New Delhi. The monitoring system has/understandable reasons,
addressed itself only to those services which can be quantified, and not to the
other qualitative aspects such as nutrition education of mothers etc. which are
also important components of the program.
*
4.8 Program Coverage: Once a Block is selected for ICDS, theoretically all
villages in that Block become eligible for services at a ratio of one AWC per
1000 people in rural and urban areas, and 700 in tribal areas. Although
conceptually the program is targetted towards the severely malnourished, inasmuch
as the selection of beneficiaries for supplementary feeding is (theoretically)
to be done after nutritional screening, in practice this is rarely done.28 This
objective of reaching the malnourished is sought to be achieved by judicious
location of projects. In other words, there is less of "program targetting" in
practice, but more of "area targetting". Let us consider whether the latter is
being done efficiently. In order to do so, we have compared the base-line data
on the percent of severely malnourished children reported in some specific ICDS
proijects, with the state-level estimates of malnourished children reported in
NNMB surveys (see table 15).
28See Gopalan (1988), p. 66.
* A Block is an administrative unit smalLer than a district. There are 5,143 BLocks inIndia contained within 432 districts.
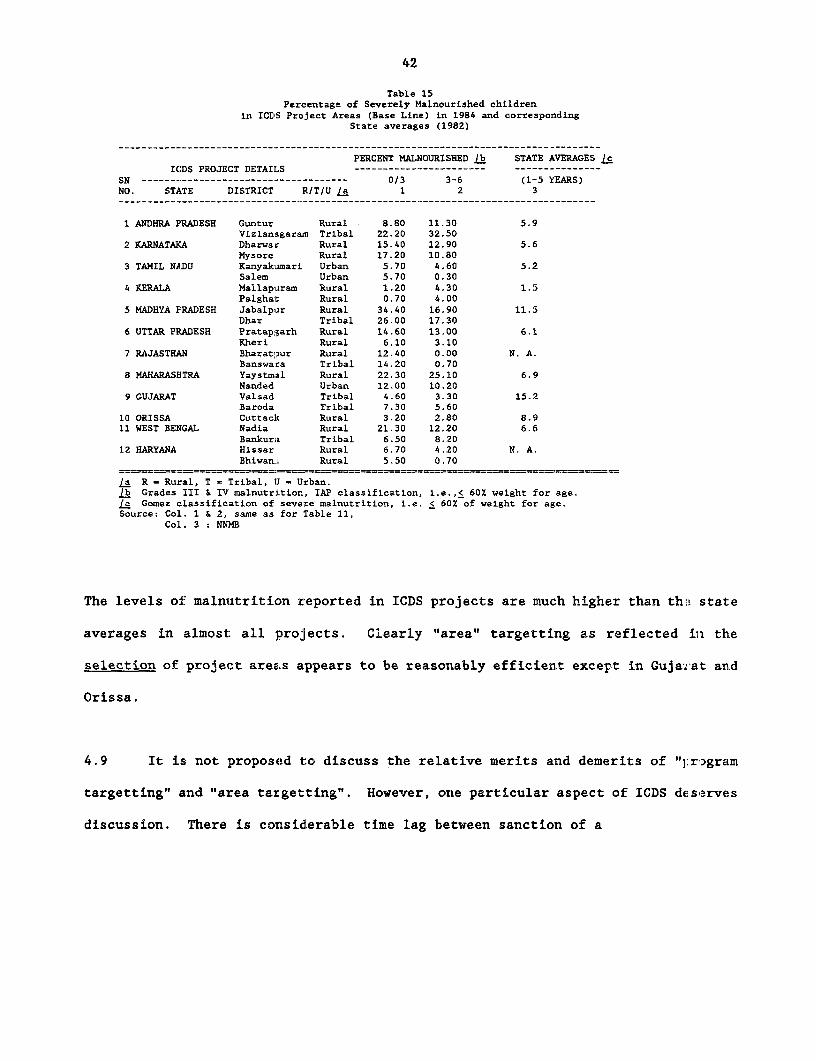
42
Table 15Percentage of Severely Malnourished children
in ICriS Project Areas (Base Line) in 1984 and correspondingState averages (1982)
PERCENT MAlNOURISHED /b STATE AVERAGES cICDS PROJECT DETAILS ----------------------- ---------------
SN ------------------------------------ 0/3 3-6 (1-5 YEARS)NO. STATE DISTRICT R/T/U la 1 2 3
1 ANDHRA PRADESH Guntur Rural 8.80 11.30 5.9Vizianagaram Tribal 22.20 32.50
2 KARNATAFA Dharwar Rural 15.40 12.90 5.6Mysore Rural 17.20 10.80
3 TAMIL NADU Kanyakamari Urban 5.70 4.60 5.2Salem Urban 5.70 0.30
4 KERALA Mallapiram Rural 1.20 4.30 1.5Palghat Rural 0.70 4.00
5 MADHYA PRADESH Jabalplir Rural 34.40 16.90 11.5Dhar Tribal 26.00 17.30
6 UTTAR PRADESH Pratapgarh Rural 14.60 13.00 6.1Kheri Rural 6.10 3.10
7 RAJASTHAN Bharatpur Rural 12.40 0.00 N. A.Banswara Tribal 14.20 0.70
8 MAHARASHTRA Yaystmal Rural 22.30 25.10 6.9Nanded Urban 12.00 10.20
9 GUJARAT Valsad Tribal 4.60 3.30 15.2Baroda Tribal 7.30 5.60
10 ORISSA Cuttac]c Rural 3.20 2.80 8.911 WEST BENGAL Nadia Rural 21.30 12.20 6.6
Bankura Tribal 6.50 8.2012 HARYANA Hissar Rural 6.70 4.20 N. A.
Bhiwan:L Rural 5.50 0.70
/a R = Rural, T = Tribal, U = Urban./b Grades III & IV malnutr:Ltion, IAP classification, i.e.,< 60% weight for age.le Gomez classification of severe malnutrition, i.e. < 60% of weight for age.Source: Col. 1 & 2, same as for Table 11,
Col. 3 : NNM3
The levels of: malnutrition reported in ICDS projects are much higher than th:! stat:e
averages in almost all projects. Clearly "area" targetting as reflected in the
selection of project areas appears to be reasonably efficient except in Guja:S>at and
Orissa.
4.9 It is; not proposed to discuss the relative merits and demerits of "1:rogram
targetting" and "area targetting". However, one particular aspect of ICDS deserves
discussion. There is considerable time lag between sanction of a
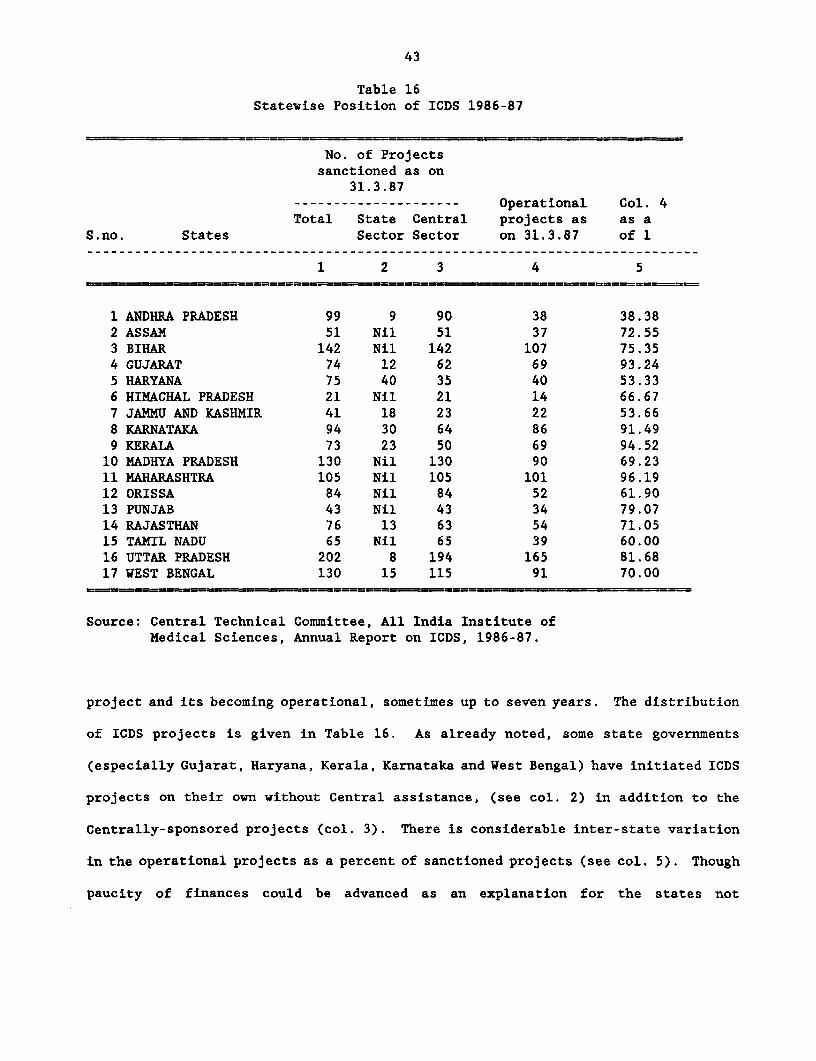
43
Table 16Statewise Position of ICDS 1986-87
No. of Projectssanctioned as on
31.3.87--------------------- Operational Col. 4Total State Central projects as as a
S.no. States Sector Sector on 31.3.87 of 1
1 2 3 4 5
1 ANDHRA PRADESH 99 9 90 38 38.382 ASSAM 51 Nil 51 37 72.553 BIHAR 142 Nil 142 107 75.354 GUJARAT 74 12 62 69 93.245 HARYANA 75 40 35 40 53.336 HIMACHAL PRADESH 21 Nil 21 14 66.677 JANMU AND KASHMIR 41 18 23 22 53.668 KARNATAKA 94 30 64 86 91.499 KERALA 73 23 50 69 94.5210 MADHYA PRADESH 130 Nil 130 90 69.2311 MAHARASHTRA 105 Nil 105 101 96.1912 ORISSA 84 Nil 84 52 61.9013 PUNJAB 43 Nil 43 34 79.0714 RAJASTHAN 76 13 63 54 71.0515 TAMIL NADU 65 Nil 65 39 60.0016 UTTAR PRADESH 202 8 194 165 81.6817 WEST BENGAL 130 15 115 91 70.00
Source: Central Teclnical Committee, All India Institute ofMedical Sciences, Annual Report on ICDS, 1986-87.
project and its becoming operational, sometimes up to seven years. The distribution
of ICDS projects is given in Table 16. As already noted, some state governments
(especially Gujarat, Haryana, Kerala, Karnataka and West Bengal) have initiated ICDS
projects on their own without Central assistance, (see col. 2) in addition to the
Centrally-sponsored projects (col. 3). There is considerable inter-state variation
in the operational projects as a percent of sanctioned projects (see col. 5). Though
paucity of finances could be advanced as an explanation for the states not
44
operationalising sancticned projects, it does not appear to be the main facto-r. This
is because, as already noted, international agencies (WFP and CARE) hare been
supplying food thereby partly mitigating the resource constraint problem of the
states. For example, nearly 100% of the beneficiaries in ICDS projects in CUJarat,
Madhya Pradesh, Orissa, Kerala and Rajasthan received either CARE or WFP food; in
the remaining states the proportion varied between 55 to 75 percent of benefic iaries.
Therefore, the reasons for the states' reluctance to make sanctioned projects
operational are not entirely clear. One reason could be that some states may l3.ready
be operating other direct or indirect nutrition support programs. For examrl.e, n
the southern states, whiLe Karnataka and Kerala made almost all sanctioned p-cjec1ts
operational, Tamil Nadu and Andhra Pradesh did so to a much lesser extent, pre3t.mably
because in thiese two states mid-day-meals and Rs. 2 a kilo scheme already erere in
operation, accounting for a substantial share of the budget,, We have already noted
that there is a mismatch between the regional distribution of children fed under all
programs and the distribution of severely malnourished chi:Ldren. This is Further
accenltuated by the long delays in some states in operationalising sanctionied ICEIS
projects .
4.10 ProLam Impact Studies: The number of studies of ICDS - largely ado: :tLng a
"before and after" approach - is indeed impressive. In fact, ICDS has been claimed
as an "over-researched" program. Some 800 surveys and several post-gradust4 and
doctoral dissertations are reported to have studied various aspects of ICDS, Most
of the surveys were conducted by All-India Institute of Medical Sciences (AIIM',) in
collaboration with other medical teaching institutions in the country. Abs tracts
of nearly 203 of such studies have recently been put together by the N t_..ona1
Institute of Public Cooperation and Child Development. (NIPCCD, uindated). These
45
studies contribute to our understanding of the working of the program and also help
in identifying the major deficiencies and gaps. Yet a common problem of all these
micro-studies is, as pointed out by Sharma, (1987), that they are "limited to small
geographical areas and cultural regions, making generalizations difficult. Besides,
many methodological limitations were also observed in these studies. The samples,
by and large, were small and not representative. The conceptual understanding of
researchers varied a great deal with respect to different components of ICDS. The
same component, therefore, was tackled differently depending on their background and
experience". These studies provided piece-meal information on individual components
of the program and have not attempted a systematic analysis of the stock of inputs
vis-a-vis the outputs. In brief, "the integrated package has been studied in a
disintegrated manner." (Sharma, op. cit.) In some studies the provision of inputs
and coverage is confused with output or qualitative changes in the beneficiary group.
It is hardly surprising that the findings of different studies are often conflicting.
4.11 In addition to the individual studies by medical researchers mentioned above,
*AIIMS, which is the monitoring cell for ICDS, also brings out Annual Surveys giving
project-wise data on ICDS.29 These are available for the years 1978, 1979, 1982-84,
and 1984-85. An important limitation of this data base is that it is unclear whether
the population base in the pre-intervention period is comparable with that of the
post-intervention year. This is because the nutritional status is assessed only for
the children/women who reported at the AWCs, and not for those who did not.
Consequently, if the base for the pre-intervention year came from a different
population than that of the post intervention year, the derived percentages would
These are the basis for the findings reported in the two oft-quoted papers by Tandon (1983 and 1i984).
* ALL India Institute of Medical Sciences.
46
not be comparable. (Scr:Lmshaw). So far AIIMS has not conducted longitudinal studies
on the nutritional status of beneficiaries and non-beneficiaries inl the same project
area. Definitive conclulsions regarding the impact of ICDS can be drawn onily when
control groups of reasonable sample size in different regions are used for
comparison.
4.11 The specific limitations of the data base used by ICDS researchers have been
stressed at length, not with a view to questioning the utility of the program but
to underscore the point that the physical performance data on ICDS are nct yet
reliable enough to attempt a full cost effectiveness analysis. Further, prscisely
because of the weaknesses of the data base, an overall assessment of ICDS based on
physical periFormance alone is not adequate; it must be supplemented by a qualitative
assessment as well. This has not been attempted before; so it is hoped that th:Ls
modest attempt in this direction will be helpful at least in raising the right set
of questions on ICDS, though not in providing definitive answers.
4.12 Maior Findings of Evaluations The most striking aspect of the r*.searc.h
findings is the wide var:Lation in the impact of ICDS by component, region, ;.ge an.d
caste status of households. For example, many of the studies show a sign:lficant
improvement in the nutritional and immunisation status and a progressive dec:ine in
*"IMR.- But other studies for other areas indicate that there has been no sign:i.fLcant
or only marginal improvement. Also, even within a district, the extent of impact
has varied significantly. No systematic attempts have been made to explain
variations in impact across regions, age groups and social groups, in compariscn with
0The most recent study is that of NFI (1988).
* Infant mortality rate.
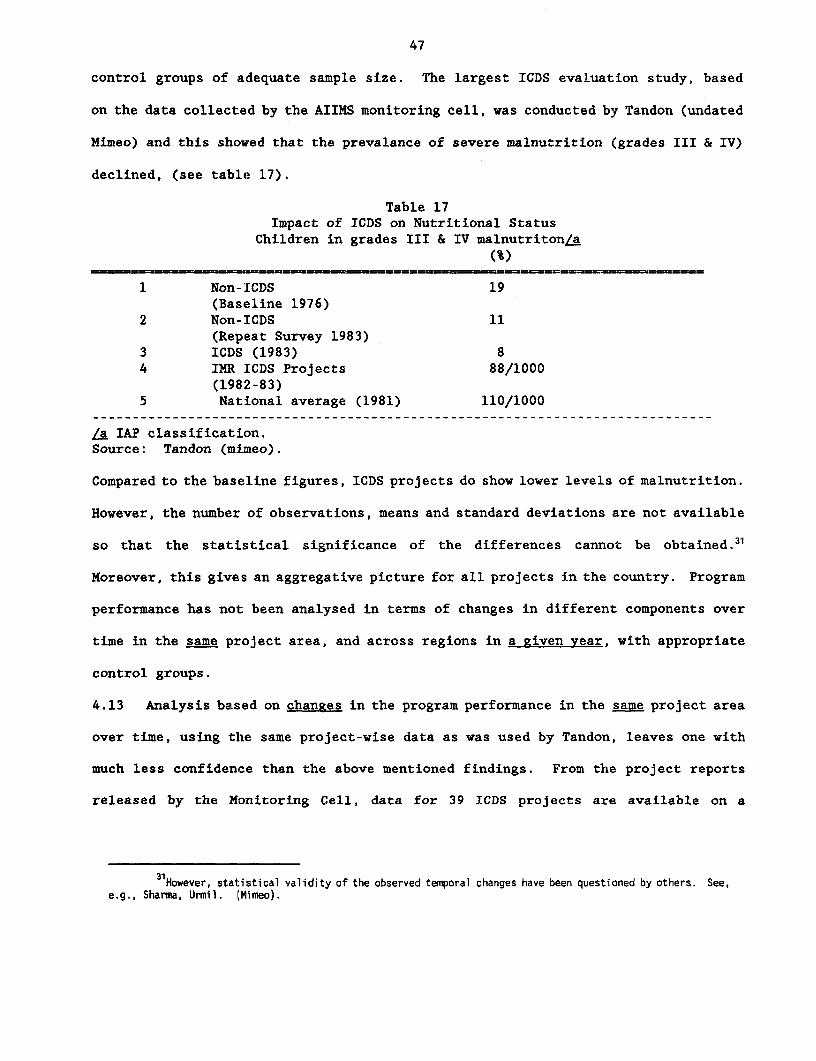
47
control groups of adequate sample size. The largest ICDS evaluation study, based
on the data collected by the AIIMS monitoring cell, was conducted by Tandon (undated
Mimeo) and this showed that the prevalance of severe malnutrition (grades III & IV)
declined, (see table 17).
Table 17Impact of ICDS on Nutritional Status
Children in grades III & IV malnutriton/a(%)
1 Non-ICDS 19(Baseline 1976)
2 Non-ICDS 11(Repeat Survey 1983)
3 ICDS (1983) 84 IMR ICDS Projects 88/1000
(1982-83)5 National average (1981) 110/1000
La IAP classification.Source: Tandon (mimeo).
Compared to the baseline figures, ICDS projects do show lower levels of malnutrition.
However, the number of observations, means and standard deviations are not available
so that the statistical significance of the differences cannot be obtained.3'
Moreover, this gives an aggregative picture for all projects in the country. Program
performance has not been analysed in terms of changes in different components over
time in the same project area, and across regions in a given year, with appropriate
control groups.
4.13 Analysis based on changes in the program performance in the same project area
over time, using the same project-wise data as was used by Tandon, leaves one with
much less confidence than the above mentioned findings. From the project reports
released by the Monitoring Cell, data for 39 ICDS projects are available on a
31However, statistical validity of the observed temporal changes have been questioned by others. See,e.g., Sharma, Urmil. I,Mimeo).
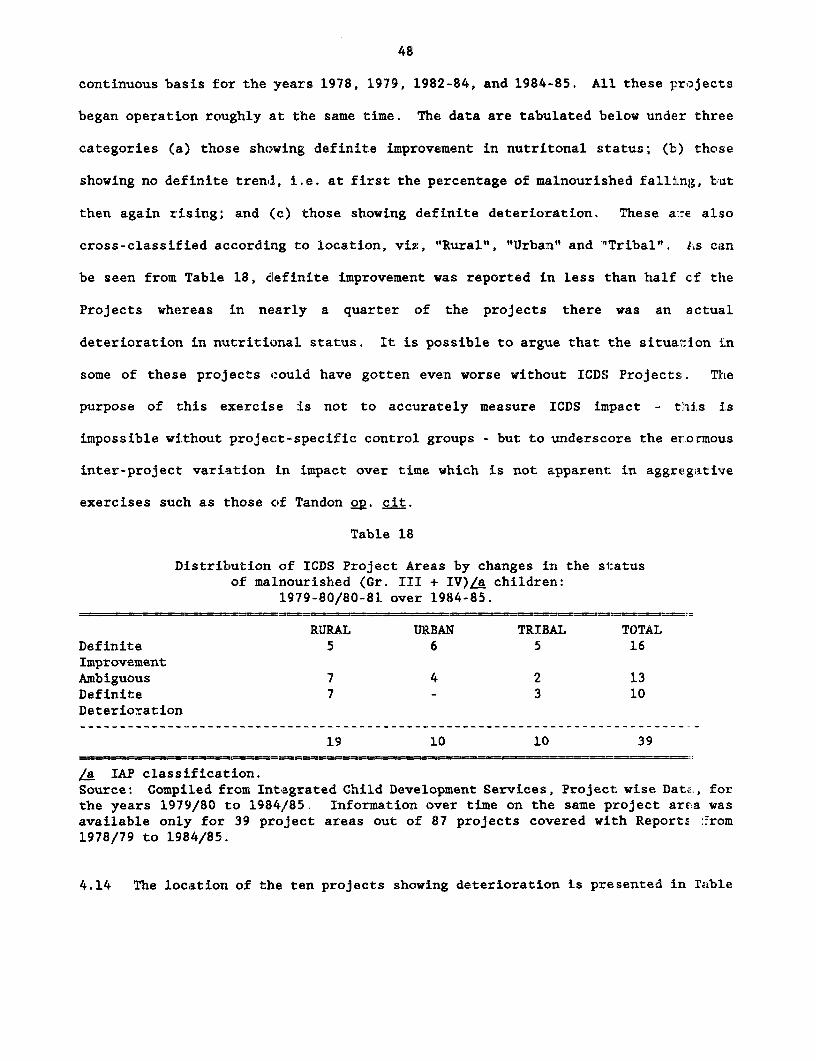
48
continuous basis for the years 1978, 1979, 1982-84, and 1984-85. All these projects
began operation roughly at the same time. The data are tabulated below under three
categories (a) those showing definite improvement in nutritonal status; (b) those
showing no definite tren,l, i.e. at first the percentage of malnourished falling, but
then again rising; and (c) those showing definite deterioration. These a:-e also
cross-classified according to location, viz, "Rural", "Urban" and "Tribal". I's can
be seen from Table 18, clefinite improvement was reported in less than half cf the
Projects whereas in nearly a quarter of the projects there was an actual
deterioration in nutritional status. It is possible to argue that the situation in
some of these projects could have gotten even worse without ICDS Projects. The
purpose of this exercise is not to accurately measure ICDS impact - t,'is is
impossible without project-specific control groups - but to underscore the erormous
inter-project variation in impact over time which is not apparent in aggregative
exercises such as those of Tandon 2p. cit.
Table 18
Distribution of ICDS Project Areas by changes in the statusof malnourished (Gr. III + IV)/a children:
1979-80/80-81 over 1984-85.
RURAL URBAN TRIBAL TOTALDefinite 5 6 5 16ImprovementAmbiguous 7 4 2 13Definite 7 - 3 10Deterioration
19 10 10 39
/a IAP classi.fication.Source: Compiled from Integrated Child Development Services, Project wise Data:., forthe years 1979/80 to 1984/85.. Information over time on the same project area wasavailable only for 39 project areas out of 87 projects covered with Reports :.rom1978/79 to 1984/85.
4.14 The location of the ten projects showing deterioration is presented in Table
49
19 alongside other characteristics. The three tribal districts are extremely
backward, with an .Lrrigation ratio less than 10%, very low levels of overall
development as reflected in CMIE indices, and a high proportion of SC & ST
population. Of the 7 rural projects, 4 are located in relatively backward districts.
It is interesting that 3 rural projects show deterioration despite being located in
relatively developed districts. Fortunately, we have independent information on one
of the three projects, viz. Jawan, Aligarh. The dismal performance of this project
was confirmed by S. N. Sinha et. al who also noted that high morbidity in this highly
irrigated district was due to the incidence of malaria. We do not have clues on the
poor performance of the remaining two projects located in developed regions.
4.15 The above finding of poor nutritional impact in a significant number of
projects based on indirect evidence is confirmed by a recent study done at NIPPCD32
based on direct evidence collected from 26 projects spread over ten states. For
example, this study pointed out significant inter-project variation in the number
of feeding days ranging from 30 to 300 across projects. Clearly no improvement in
nutritional status could be expected if the feeding component were neglected. The
precise numbers of projects showing no improvement and the reasons for poor
performance will become clearer only when the monitoring cell collects longitudinal
information on the nutritional status of children (both beneficiaries and eligible
non-beneficiaries) in the same project areas, along with the socio-economic
backgrounds of the households. It would then be possible to assess the performance
of different components in the same project (abstracting from regional effects), and
that of each component across the regions. Till such data base becomes available,
32NIPCCO, (1988) Status of Nutrition Component of ICDS, Mimeo.
* National Institute for Public Cooperation in Child Development.
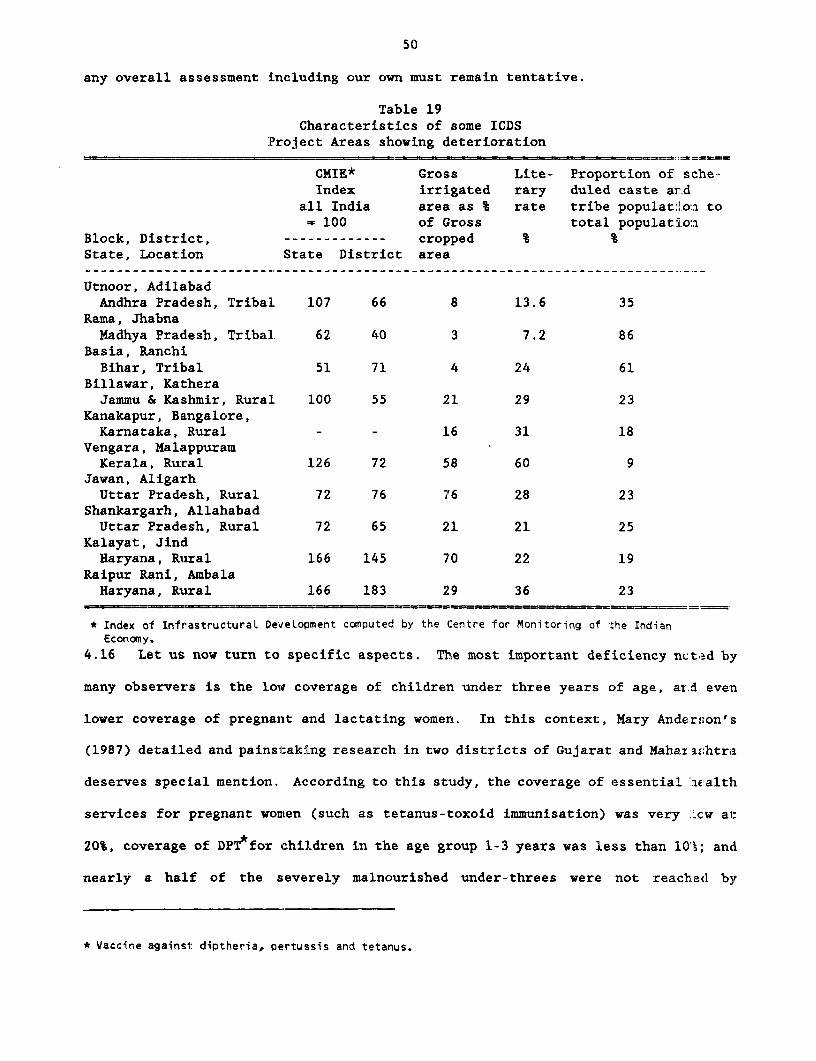
50
any overall assessment including our own must remain tentative.
Table 19Characteristics of some ICDS
:Project Areas showing deterioration
CMIE* Gross Lite- Proportion of sche-Index irrigated rary duled caste ar.d
all India area as % rate tribe populati.on to= 100 of Gross total populatio:a
Block, District, ------------- cropped % %State, Location State District area
Utnoor, AdilabadAndhra Pradesh, Tribal. 107 66 8 13.6 35
Rama, JhabnaMadhya Pradesh, Tribal. 62 40 3 7.2 86
Basia, RanchiBihar, Tribal 51 71 4 24 61
Billawar, KatheraJammu & Kashmir, Rural 100 55 21 29 23
Kanakapur, B.angalore,Karnataka, Rural - - 16 31 18
Vengara, Mal,appuramKerala, Rural 126 72 58 60 9
Jawan, AligarhUttar Pradesh, Rural 72 76 76 28 23
Shankargarh, AllahabadUttar Pradesh, Rural 72 65 21 21 25
Kalayat, JindHaryana, Ruiral 166 145 70 22 19
Raipur Rani, AmbalaHaryana, Rutral 166 183 29 36 23
* Index of Infrastructural Development computed by the Centre for Monitoring of the IndianEconomy.
4.16 Let us now turn to specific aspects. The most important deficiency ncted by
many observers is the low coverage of children under three years of age, ar.d even
lower coverage of pregnant and lactating women. In this context, Mary AndErson's
(1987) detailed and painstaking research in two districts of Gujarat and Maharzahtra
deserves special mention. According to this study, the coverage of essential w.alth
services for pregnant women (such as tetanus-toxoid immunisation) was very 'Lcw al:
20%, coverage of DPT for children in the age group 1-3 years was less than 101; and
nearly a half of the severely malnourished under-threes were not reached by
* Vaccine against diptheria, pertussis and tetanus.
51
supplementary nutrition. In brief, this study showed that both health and nutrition
coverage of women and children under three was far from satisfactory. Considering
that the incidence of malnutrition is highest among them, reaching them inadequately
is a major shortcoming of ICDS.33
4.17 Such coverage problems mean that ICDS fails to prevent many preventable child
deaths, as illustrated by an interesting study of deaths in 8 AWs in Medak District,
Andhra Pradesh. (Reddy and Reddy, 1986). This year-long study was conducted in
1985. The study recorded that there were 47 child deaths; nearly 1/3 of the deaths
took place before the first birthday. The study showed that nearly 25 out of 47
deaths were preventable via immunisation and/or ORT* Clearly, if ORT and
immnunisation were systematically practiced in the Anganwadis, the mortality rate
could have fallen.
4.18 As for supplementary feeding, two points are of interest. First, most studies
pointed out that proportionately much higher percentage of 3-6 years old are covered
under suppplementary nutrition than 0-3 year olds. Sharma (2p. cit.) noted that the
difference in coverage across age groups could be attributed to the inability of the
0-3s to come to AWs on their own. The need for someone to accompany them imposes
a constraint on their coverage. Second, almost all the Schedule Caste and Schedule
Tribes attending A;Ts seem to be receiving supplementary nutrition, as can be seen
from Table 20. To this extent, the "area targetting" implicit in the program is
33The failure to reach pregnant women and children below three years of age was noted by scholars nostsympathetic to the ICDS program. See, for example NFI (1988) p. 43.
* Oral Rehydration Therapy.
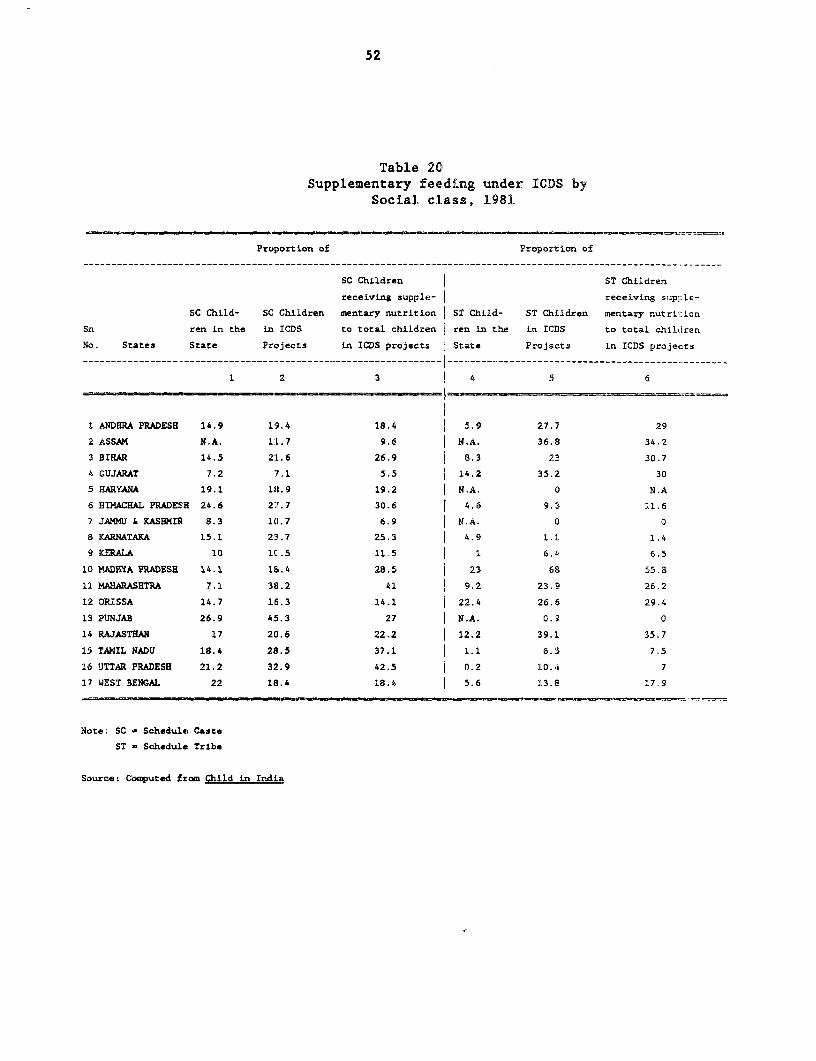
52
Table 20Supplementary feeding under ICDS by
Social class, 1981
Proportion of Proportion of--------------------------------------------------------------- __------------__---------------------------.------..
SC Children ST Children
receiving supple- receiving supjlAe-
SC Child- SC Children mentary nutrition ST Child- ST Clhildren mentary nutri icn
Sn ren in the in ICDS to total children ren in the in ICDS to total children
No. States State Projects in ICDS projects State Projects in ICDS projects
1 2 3 I 4 S 6
1 ANDHRA PRADESH 14.9 19.4 18.4 5.9 27.7 29
2 ASSAM N.A. 11.7 9.6 |N.A. 36.8 34.2
3 BIHAR 14.5 21L.6 26.9 9 8.3 23 30.7
4 GUJARAT 7.2 .1 5.5 14.2 35.2 30
HARYANA 19.1 18.9 19.2 N.A. 0 N.A
6 HIMACHAL PRADESH 24.6 27.7 30.6 4.6 9.3 11.6
7 JAM4U & KASHMIR 8.3 10.7 6.9 N.A. 0 0
8 KARNATAKA 15.1 25S.7 25.3 4.9 1.1 1.4
9 KERAIA 10 lC.5 11.5 1 6.4 6.5
10 MADHYA PRADESE 14.1 18.4 28.5 23 68 55.8
11 MAHARASHTRA 7.1 38.2 41 9.2 23.9 26.2
12 ORISSA 14.7 16.3 14.1 22.4 26.6 29.4
13 PUNJAB 26.9 45.3 27 N.A. 0.9 0
14 RAJASTHAN 17 20.6 22.2 12.2 39.1 35.7
1S TAMIL NADU 18.4 28.5 37.1 1.1 6.3 7.5
16 UTTAR PRADESH 21.2 32.9 42.5 0.2 10.4 7
17 WEST BENGAL 22 18.4 18.4 5.6 13.8 17.9
Note: SC - Schedule Caste
ST - Schedule Tribe
Source: Comuted from Child in Indis
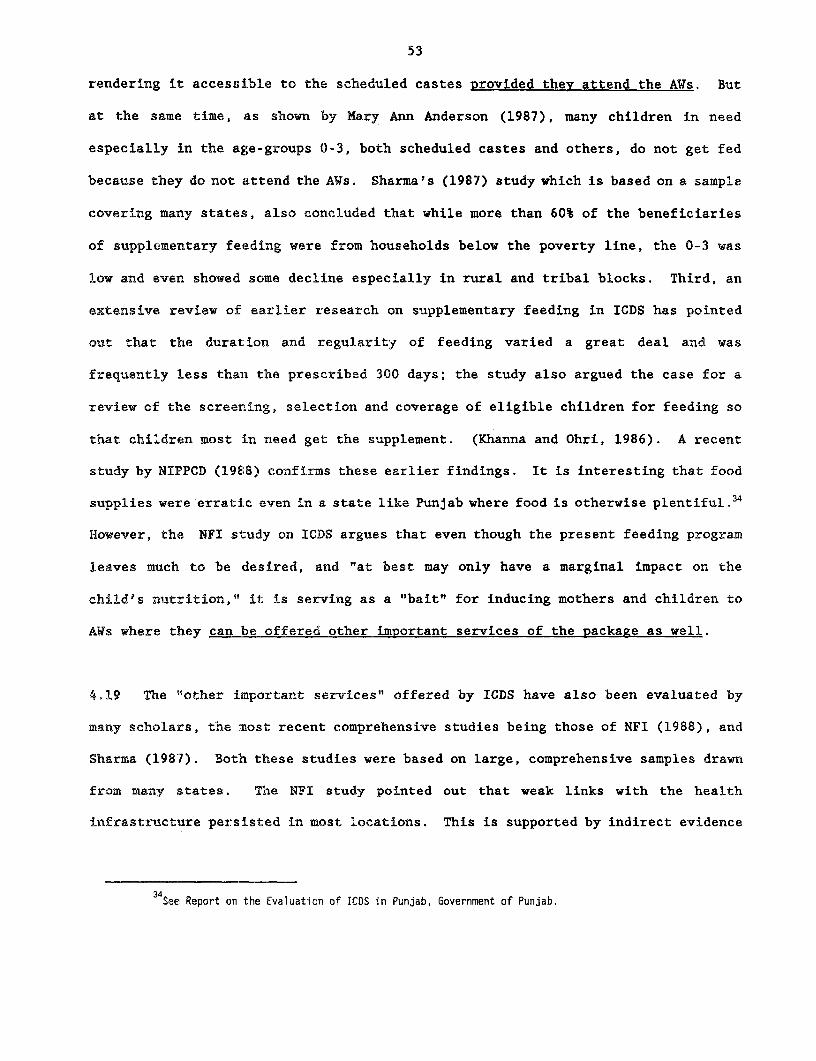
53
rendering it accessible to the scheduled castes provided they attend the AWs. But
at the same time, as shown by Mary Ann Anderson (1987), many children in need
especially in the age-groups 0-3, both scheduled castes and others, do not get fed
because they do not attend the AWs. Sharma's (1987) study which is based on a sample
covering many states, also concluded that while more than 60% of the beneficiaries
of supplementary feeding were from households below the poverty line, the 0-3 was
low and even showed some decline especially in rural and tribal blocks. Third, an
extensive review of earlier research on supplementary feeding in ICDS has pointed
out that the duration and regularity of feeding varied a great deal and was
frequently less than the prescribed 300 days; the study also argued the case for a
review of the screening, selection and coverage of eligible children for feeding so
that children most in need get the supplement. (Khanna and Ohri, 1986). A recent
study by NIPPCD (1988) confirms these earlier findings. It is interesting that food
supplies were erratic even in a state like Punjab where food is otherwise plentiful.34
However, the NFI study on ICDS argues that even though the present feeding program
leaves much to be desired, and "at best may only have a marginal impact on the
child's nutrition," it is serving as a "bait" for inducing mothers and children to
AWs where they can be offered other imRortant services of the package as well.
4.19 The "other important services" offered by ICDS have also been evaluated by
many scholars, the most recent comprehensive studies being those of NFI (1988), and
Sharma (1987). Both these studies were based on large, comprehensive samples drawn
from many states. The NFI study pointed out that weak links with the health
infrastructure persisted in most locations. This is supported by indirect evidence
34See Report on the Evaluation of ICOS in Punjab, Government of Punjab.
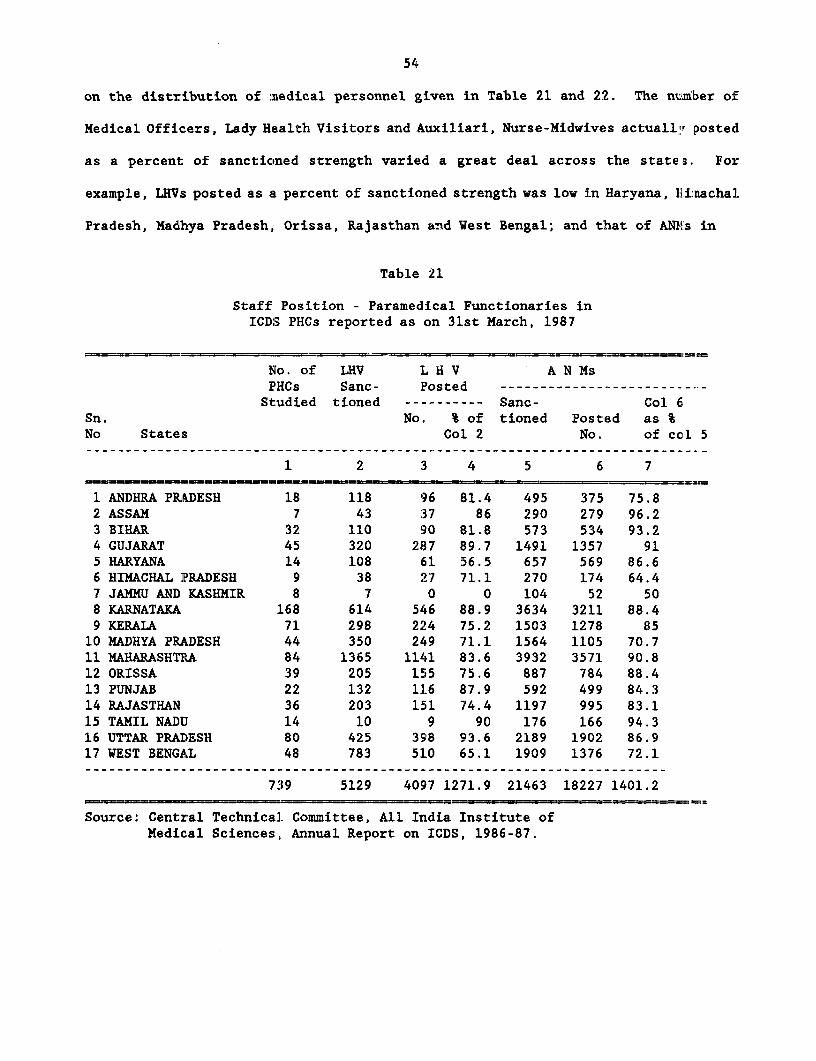
54
on the distribution of medical personnel given in Table 21 and 22. The ni:mber of
Medical Officers, Lady Health Visitors and Auxiliari, Nurse-Midwives actualltr posted
as a percent of sanctioned strength varied a great deal across the states. For
example, LHVs posted as a percent of sanctioned strength was low in Haryana, flirnachal
Pradesh, Madhya Pradesh, Orissa, Rajasthan and West Bengal; and that of ANT's in
Table 21
Staff Position - Paramedical Functionaries inICDS PHCs reported as on 31st March, 1987
No. of LHV L H V A N MsFHCs Sanc- Posted --------------------------Studied tioned ---------- Sanc- Col 6
Sn. No. % of tioned Posted as %No States Col 2 No. of ccl 5
1 2 3 4 5 6 7
1 ANDHRA PRADESH 18 118 96 81.4 495 375 75.82 ASSAM 7 43 37 86 290 279 96.23 BIHAR 32 110 90 81.8 573 534 93.24 GUJARAT 45 320 287 89.7 1491 1357 915 HARYANA 14 108 61 56.5 657 569 86.66 HIMACHAL PRADESH 9 38 27 71.1 270 174 64.47 JAMMU AND KASHMIR 8 7 0 0 104 52 508 KARNATAKA 168 614 546 88.9 3634 3211 88.49 KERALA 71 298 224 75.2 1503 1278 85
10 MADHYA PRADESH 44 350 249 71.1 1564 1105 70.711 MAHARASHTRA 84 1365 1141 83.6 3932 3571 90.812 ORISSA 39 205 155 75.6 887 784 88.413 PUNJAB 22 132 116 87.9 592 499 84.314 RAJASTHAN 36 203 151 74.4 1197 995 83.115 TAMIL NADIJ 14 10 9 90 176 166 94.316 UTTAR PRADESH 80 425 398 93.6 2189 1902 86.917 WEST BENGAiL 48 783 510 65.1 1909 1376 72.1
739 5129 4097 1271.9 21463 18227 1401.2
Source: Central Technical Committee, All India Institute ofMedical Sciences, Annual Report on ICDS, 1986-87.
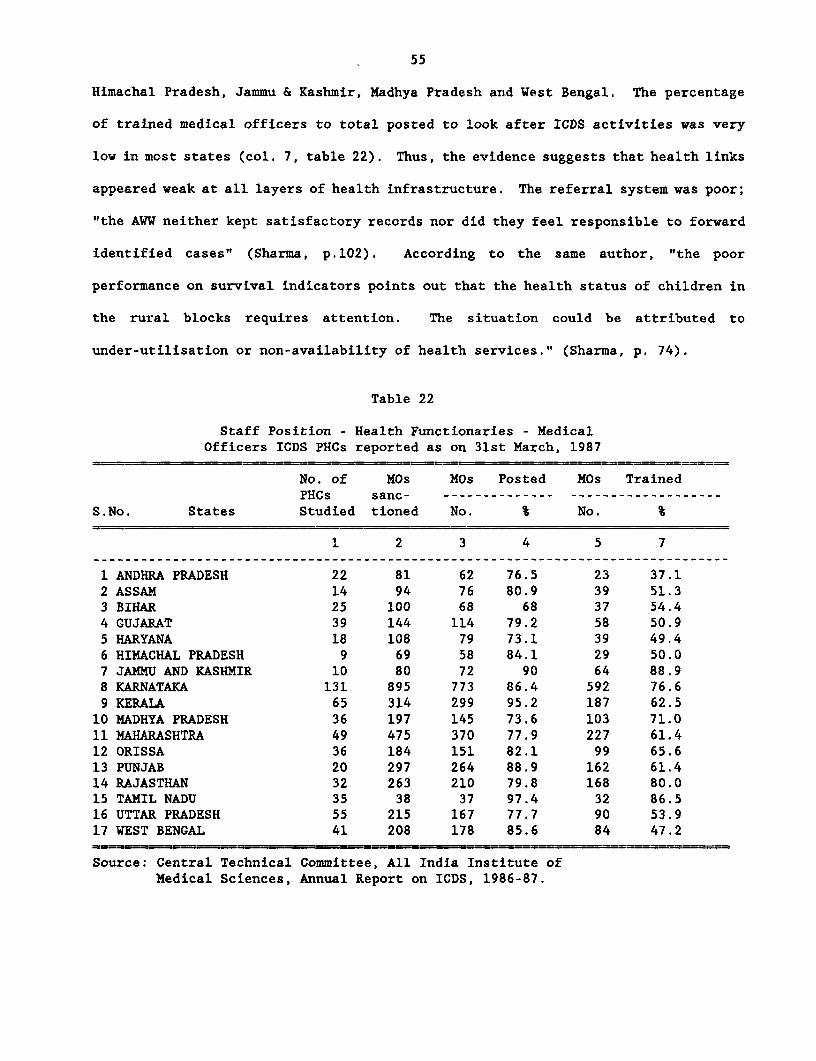
55
Himachal Pradesh, Jammu & Kashmir, Madhya Pradesh and West Bengal. The percentage
of trained medical officers to total posted to look after ICDS activities was very
low in most states (col. 7, table 22). Thus, the evidence suggests that health links
appeared weak at all layers of health infrastructure. The referral system was poor;
"the AWW neither kept satisfactory records nor did they feel responsible to forward
identified cases" (Sharma, p.102). According to the same author, "the poor
performance on survival indicators points out that the health status of children in
the rural blocks requires attention. The situation could be attributed to
under-utilisation or non-availability of health services." (Sharma, p. 74).
Table 22
Staff Position - Health Functionaries - MedicalOfficers ICDS PHCs reported as on 31st March, 1987
No. of MOs MOs Posted MOs TrainedPHCs sanc- -------------- -------------------
S.No. States Studied tioned No. % No. %
1 2 3 4 5 7
1 ANDHRA PRADESH 22 81 62 76.5 23 37.12 ASSAM 14 94 76 80.9 39 51.33 BIHAR 25 100 68 68 37 54.44 GUJARAT 39 144 114 79.2 58 50.95 HARYANA 18 108 79 73.1 39 49.46 HIMACHAL PRADESH 9 69 58 84.1 29 50.07 JAMMU AND KASHMIR 10 80 72 90 64 88.98 KARNATAKA 131 895 773 86.4 592 76.69 KERALA 65 314 299 95.2 187 62.510 MADHYA PRADESH 36 197 145 73.6 103 71.011 MAHARASHTRA 49 475 370 77.9 227 61.412 ORISSA 36 184 151 82.1 99 65.613 PUNJAB 20 297 264 88.9 162 61.414 RAJASTHAN 32 263 210 79.8 168 80.015 TAMIL NADU 35 38 37 97.4 32 86.516 UTTAR PRADESH 55 215 167 77.7 90 53.917 WEST BENGAL 41 208 178 85.6 84 47.2
Source: Central Technical Committee, All India Institute ofMedical Sciences, Annual Report on ICDS, 1986-87.
56
Mothers' pressence at AWs was not exploited for imparting nutrition education.
4.20 Child-related nutrition schemes are both person-intensive and
resource-initensive. The responsibility of the functionaries is to see that their
tasks matchL the needs of children and their mothers. Since young :hildren
(especially below three years of age) are in the fold of their mothers, inter;rentions
aimed at them simply cannot succeed unless there is total identity cf the
functionaries with the mothers. This is possible only when AWWs are able to elicit
community participation, This usually implies (a) involvement of the commlxnity in
achieving ICDS goals via participation in decision-making at regular workir.g group
meetings of women and ATWs; (b) contribution of the community in cash, kind, irta-.:power
and organisational help; (c) involvement of the community in assessment of Le:aefits
from the program and most important of all, (d) regular home visits by AWs to
achieve (a) to (c) above. ICDS evaluations are unanimous on one point: the p:^ogram
failed to elicit community participation as described above in most locatiol,s. The
most recent evaluation by Sharma (op. cit.) pointed out that since hea>th and
nutrition activities were rarely conducted in women's working groups, thnie wias
hardly any c:hance for mothers' involvement. As noted by NFI study, the ::ask of
eliciting community participation is admittedly difficult in villages stratifLed by
social barriers and economic status. This is because there is no rallying cr nodal
point in the villages where communities, especially of the deprived sections, can
be effectively reached. So far these communities have regarded ICDS as a govi!ynment
service to be used in emergency, and not as their own program. Special effo:-ts are
clearly needed for converting the prevailing status of ICDS as a "government :-entre"
into that of a "community centre".
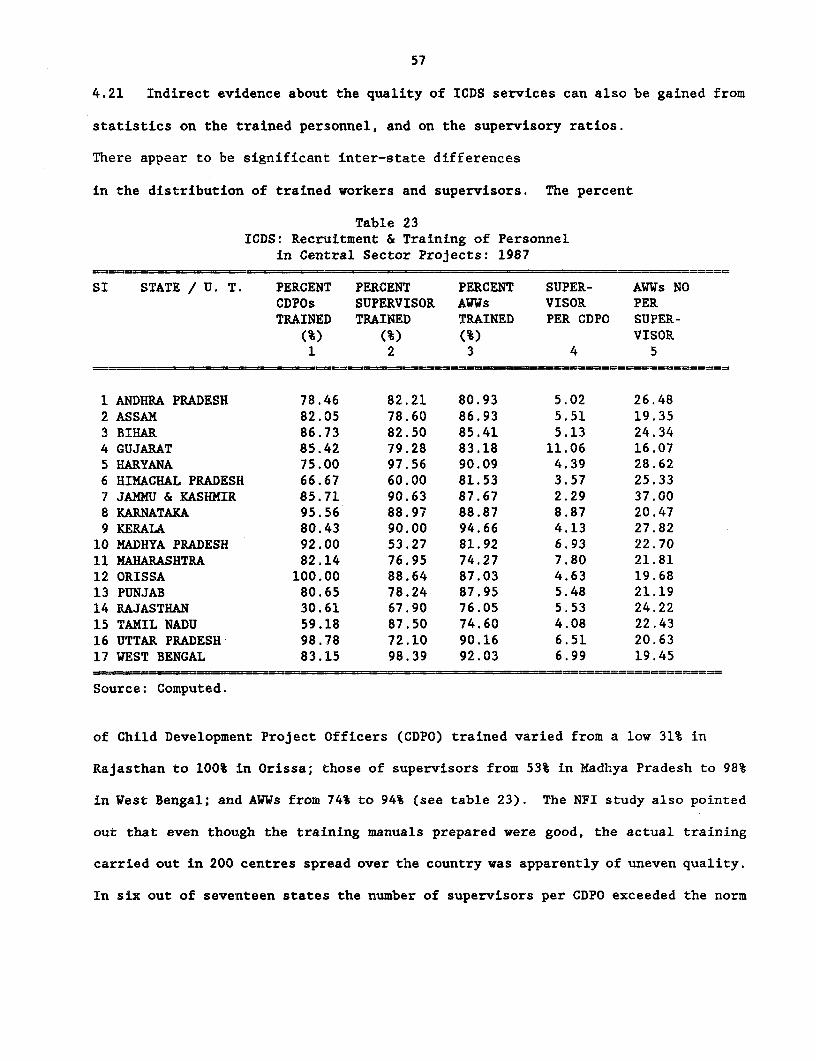
57
4.21 Indirect evidence about the quality of ICDS services can also be gained from
statistics on the trained personnel, and on the supervisory ratios.
There appear to be significant inter-state differences
in the distribution of trained workers and supervisors. The percent
Table 23ICDS: Recruitment & Training of Personnel
in Central Sector Projects: 1987
SI STATE / U. T. PERCENT PERCENT PERCENT SUPER- AWWs NOCDPOs SUPERVISOR AWWs VISOR PERTRAINED TRAINED TRAINED PER CDPO SUPER-
(%) (%) (%) VISOR1 2 3 4 5
1 ANDHRA PRADESH 78.46 82.21 80.93 5.02 26.482 ASSAM 82.05 78.60 86.93 5.51 19.353 BIHAR 86.73 82.50 85.41 5.13 24.344 GUJARAT 85.42 79.28 83.18 11.06 16.075 HARYANA 75.00 97.56 90.09 4.39 28.626 HIMACHAL PRADESH. 66.67 60.00 81.53 3.57 25.337 JAMMU & KASHMIR 85.71 90.63 87.67 2.29 37.008 KARNATAXA 95.56 88.97 88.87 8.87 20.479 KERALA 80.43 90.00 94.66 4.13 27.8210 MADHYA PRADESH 92.00 53.27 81.92 6.93 22.7011 MAHARASHTRA 82.14 76.95 74.27 7.80 21.8112 ORISSA 100.00 88.64 87.03 4.63 19.6813 PUNJAB 80.65 78.24 87.95 5.48 21.1914 RAJASTHAN 30.61 67.90 76.05 5.53 24.2215 TAMIL NADU 59.18 87.50 74.60 4.08 22.4316 UTTAR PRADESH 98.78 72.10 90.16 6.51 20.6317 WEST BENGAL 83.15 98.39 92.03 6.99 19.45
Source: Computed.
of Child Development Project Officers (CDPO) trained varied from a low 31% in
Rajasthan to 100% in Orissa; those of supervisors from 53% in Madhya Pradesh to 98%
in West Bengal; and AWUs from 74% to 94% (see table 23). The NFI study also pointed
out that even though the training manuals prepared were good, the actual training
carried out in 200 centres spread over the country was apparently of uneven quality.
In six out of seventeen states the number of supervisors per CDPO exceeded the norm
58
of about 5 anid in 9 the number of AWWs per supervisor exceeded the norm of about 210.
The NFI stud,y M. cit. noted that the supervisor's visits to tribal areas were more
infrequent than to other areas which was particularily unfortunate, because the AWWls
in tribal areas were found to be much less competent and hence needed intensive
supervision.35
4.22 The government and the donor agencies supporting ICDS now recognize the need
to take a fresh look at training needs and capacity. In particular, four
shortcomings have been Ldentified. First, the existing capacity is inadequlate t.o
meet the demands of the system and as a result the backlog of trainees has been
growing. Second, the training syllabus and materials are much too standaritsed and
do not allow for variations to suit tribal, rural and urban areas. There have
practically been no attempts to create awareness among the trainees aboat the
location-specific disease patterns which is possible only when the traLning
infrastructure is sufficiently decentralised and taken to the bloclk-level. Tlird,
most evaluations have shown that the training of middle-level personnel (supervis;ors)
has been the weakest.36 Fourth, the existing provision is totally inadequa:e for
retraining of all types of functionaries. On the whole, lack of supervisory Ltput'i
and rigidity in training syllabus and materials may also have contributed I:c the
observed inter-project differences in the impact of the program.
35The problem of training and supervision are not peculiar to ICOS. It is encountered in other pctetyalleviation programs as well. Therefore, there appears to be a case for training a cadre of workers to idesitfypoverty groups ztnd get through l:hem, and sensitize them to their problems. In this context, it is wo-thnoting that much of the success of tenancy reform in West Bengal (Operation Barga) could be traced t: ;heorientation camps of beaurocrats with beneficiaries.
36For example, the WFP report concluded that the supervisors on the whole did not seem to be ir aposition to help their AWWs. Similiar views were expressed by CARE officials in informal discussions. Te IlFIstudy OD. cit. noted that the Supervisors themselves were not receivinq adequate support from Child DevelcpmantProject officers. Similar findings were noted by Sharma OD. cit.
59
4.23 To sum up, though on the aggregate ICDS impact on nutritional status was
shown to be "satisfactory" by the monitoring cell, there appear to be significant
inter-project differences in its impact. While systematic analysis of the factors
accounting for these inter-project differences must await project-wise longitudinal
data on beneficiaries and eligible non-beneficiaries, rural and tribal projects seem
to be performing much worse than urban projects. Health linkages, referral services,
mother-counselling and nutrition education, coverage of under-threes, and community
participation appear to be unsatisfactory in most projects. This raises the issue
whether the observed infirmities of ICDS are only a passing phase, likely to
disappear with more effective implementation, or whether there are any deficiencies
in the program design that are limiting its effectiveness even in the
administratively better-endowed states. The NFI study op. cit. noted that the
Supervisors themselves were not receiving adequate support from Child Development
Project officers. Similar findings were noted by Sharma op. cit.
4.24 The most popular view best articulated in the NFI study is that ICDS is a
well-conceived program reflecting a bold and innovative approach; many of its
observed ills can be removed by effective implementation; and the observed failure
in eliciting community participation is not peculiar to ICDS, but evident in other
welfare programs such as IRDP. Probably, meaningful lessons in areas such as
community participation and mother counselling can be learnt, not by comparing ICDS
with dissimilar welfare programs like IRDP, but with similar nutrition and health
interventions such as the Tamil Nadu Integrated Nutrition Project (TINP). It must
be stressed that the two programs differ in their objectives as well as coverage and
as such a comparison of the two programs' inputs and outputs is problematic. I am
* Integrated Rural Development Program.
60
not attempting this. Instead, a comparison of some of the qualitative components
of the two programs and the job description of the principal worker is attempted,
so that the factors underlying the observed differences in such aspects as cormunuity
participation can be better understood.
4.25 TINP covers 9000 villages in rural Tamil Nadu with a population of over ten
million. Each Community Nutrition Centre is staffed with a Community Nut.rit:Lon
Worker (CNW) and a helper. The services provided include weighing of all children
under three years, public health interventions for both mothers and 6-36 morth old
children that are similar to those in ICDS, and a carefully targetted supplfmentary
feeding for those children under three years of age who are severely malno:urished
or are not gaining weight. Nutrition education of mothers is an important compDnent,
but there is no pre-scbool activity. A limited number of pregnant ant l.ctating
mothers also receive supplementary feeding. The project was designed with a heavy
monitoring a1nd evaluation component including base line, mid-term and te=minal
Surveys. Mid-term evaluations showed that severe malnutrition rates of 15 1:o 20%
fell to 8 to 9% over a four-year period range. In the project areias the dec.l:ne in
severe malnutrition ranged 32 to 50% compared to 12% in the control block;. The
category of normal children rose.by 20% in the project areas compared to 5% i.n the
control blocks. Unlike in ICDS, progressive reduction in the incidence of severe
malnutrition was noted in every project area. The findings of the final evaLtation
are consistent with the mid-term review; the project is effective in cont::clling
malnutrition in the post-weaning period and in improving the nutritional st.tus of
pre-school children.
4.26 The three qualitative differences between the ICDS and TINP relate to (a)
61
the coverage of beneficiaries and consequential job description of the principal
workers, (b) involvement of mothers and the general levels of community
participation; and (c) recruitment and supervision of workers. These are discussed
below with a view to gaining insights into differences in the productivity of the
two programs.
4.27 As already noted, ICDS is aimed at all children 0-6 years of age, and pregnant
and lactating women, whereas TINP serves only children 6-36 months of age, and
mothers. This difference manifests itself in the job description of AWWs under ICDS
and CNWs under TINP, The responsibilities of the former are manifold: non-formal
preschool for the older children; supplementary feeding; imparting health and
nutrition education to mothers; home visits for ensuring health care for infants and
pregnant women; referral services for the needy children and liason with para-medical
and medical personnel and other local organisations like Mahila Mandals; eliciting
community participation; and maintaining records. According to a recent study,
nearly five hours are spent by a majority of AWWs under ICDS on three activities:
pre-school, feeding and record-keeping. By contrast a CNW's activities are limited:
she first conducts a survey of the entire village, weights all children 6-36 months
of age, and identifies children of the target group. For these children growth
charts are plotted (one is retained with the mother and one at the Centre). Needy
children are given supplementary feeding by CNW, and each child's progress is
watched. Besides weighing and feeding, CNW's other job include ORT, administering
vitamin A, organising mother's working groups and eliciting community participation
in all projects activities such as weighting of children, feeding growth-chart
maintenance, etc. Thus the whole job description of CNW is centred around pregnant
women, mothers and children of 6-36 months age. She is not burdened with preschool

62
activity, and older children (3 + age) are not covered under the program.
4.28 The basic purpose of the above comparison of the two programs is to E.ddrass
the question: how can the observed deficiencies of ICDS - the relative fa:Llure to
reach 0-3s and pregnant and lactating women, the poor health and nutrition edlucation,
and the neglect of home visits and community participation - be improved in :lhe near
future? One of the factors contributing to unsatisfactory performance oE ICDS
appears to be the overloaded job description of AWWs. The bias towarcDs older
children seems to be a natural consequence of its broader objectives - nob: simply
a problem of management or implementation or lack of supervision, although these
problems do seem to plague the program especially in tribal and rural areas. AWWs
preference for the easier job of handling 3-6 year old children, and neglect of
under-threes, is probably rational under the circumstances. This is not to miinimise
the significant service of pre-school being offered by ICDS. Pre-school offers
sizable benefits to the children, their parents and communities as a whol.e. It
provides child care, preparation for formal schooling especially fo) the
disadvantaged, and girl children among them; and has linkages into the formal school
system that encourage school attendance. It also attracts long-term partic;Lation
of all mothers with the anganwadi, as they receive a real benefit everyday (unlilce
TINP, where only those in "need" receive such a benefit). Thus pre-schoo. is eLn
important service under ]CDS. The issue that merits a debate is: can a AWW p>erform
efficiently all the nutrition-health related functions of all children unde:c six
years of age and mothers, and also run a pre-school, especially in regions wLth a
high proportion of program clients to child population.
4.29 If the broader objectives of ICDS are to be maintained intact, it appears
63
desirable to recruit; two AWUs, one for pre-school, feeding, and health referrals
for the older children, and another to look after under-threes, pregnant and
lactating women, nutrition education and home visits. This of course is likely to
raise the unit costs of the program. Therefore, to begin with it appears desirable
to experiment with two-AWW model at least in those projects where the percentage of
malnourished children (i.e. program clients) are likely to be higher than the average
for all AWWs. Assuming that this is the case in atleast 25% of the Projects, how
much does 2-AWW model cost the exchequer?
4.30 It may be useful to recall that the total direct expenditure on nutrition
support by both Central and State Governments amounted to only Rs. 4262.5 million37
during 1986-87. Of this, the state governments met Rs. 3220 million, or 75% of the
total expenditure. The amount budgeted for 1987-88 is Rs. 4950 million. It is also
worth noting that state governemnts' expenditures on direct nutrition support
amounted to 1.86% of the state plan budgets during 1986/87, while the Central
government's expenditure amounted to only 0.5% of the central budget. Thus, as of
now, direct expenditure on nutrition support especially by the Centre, appears to
be rather modest, notwithstanding the improved allocation for ICDS during the Seventh
Plan.
4.31 At present, the average annual expenditure per AW works out to Rs. 7000. A
non-matriculate Air is paid Rs. 200 a month, and a matriculate Rs. 250 a month.
Assuming an average of Rs 225 per month, an additional AWW would cost Rs. 2700 per
annum. With a second worker, the coverage of children under three and mothers may
37This includes Central and State expenditures on Special Nutrition Program, Mid-day-meals, and ICDS.
64
be expected to improve, so that expenditure on nutrition supplementation may also
go up. Assuming an addiLtional Rs. 1000 per annum on nutrition supplementation due
to better coverage, the two AWW model may cost about Rs. 10,700 per annum, or Rs.
11,000 per annum allowing for possible rise in overall costs in the recent period.
The incremental cost per AW would thus work out to Rs. 4,000 per annum. Lssuming
that at least 40,000 centres (out of 160000 AWs in operation) would need an add'itional
worker, the total annual incremental cost would be Rs. 160 million. This is likely
to increase Centre's ICES annual outlay by Rs. 120 million, i.e. from the ,tirrent
level of Rs. 1470 million (as indicated in the Annual Plan, 1987-88), to R!;. 15iL0
million, or by about 9%. The states share of expenditure will increase by Rs. 40
million, assusming no further contribution of free food by the donors. It needs to
be stressed that the total direct expenditure on nutrition support by the Centre,
as a per cent of total Central plan outlay, would still be modest at: less than ).6%.
Besides, there are ways of further minimising costs. For instance, adolescent g~irls
in villages, who are also malnourished, can be enrolled into the program for
assisting AWWs. In return she could receive supplementary food and certain esselitial
mothering skills. (Gopalan). In this context, it would be interesting to learn from
Tamil Nadu where two AWW system has just been introduced in some districts.
4.32 Quite apart from strengthening selected Centres, there also appears to be
significant scope for improving the productivity of AWs throughout the countr7y via
better training and supervision. In this context, TINP's experience is worth
mentioning. TINP's supervision and training systems and retraining of peripheral
workers helped to produce a highly motivated and skilled work force. While the
training components of ICDS have been researched and found to be gen!rally
unsatisfactory, (NFI, 1988), the factors that contributed to successful supervi;i,ion
65
and training in TINP deserve to be studied further, so that these can be replicated
elsewhere. However, particular qualitative differences relating to selection and
training of CNWs under TINP may be noted, since this not only endured their stake
in the village environment but also contributed to the relative ease with which
community participation could be elicited. A CNW under TINP had to be a married
woman settled in the village with two healthy children, educated up to VII grade,
preferably belonging to the scheduled caste community. Efforts were made to locate
one such woman in each village, acceptable to the village community. Such women were
then persuaded to volunteer for CNW jobs which carried very low wages. A CNW first
gets training at the block level for 60 days. The training includes creating of an
awareness in location-specific child disease and treatment procedures. In TINP
blocks, there are hardly any CNWs who do not belong to the village. In fact most
of them have deep roots in the village. This facilitated social mobilisation and
raised the level of knowledge and awareness of entire villages on issues such as child
and maternal health, community hygiene, etc. It is possible that for AWW under ICDS
the recruitment procedures may have been similar in principle. But in practice the
recruitment procedures for AWWs under ICDS appear to be much less stringent, and the
training inputs less rigorous and location-specific. According to Sharma, nearly a
half of AWWs under ICDS did not belong to the local village; this proportion was
nearly 75% in tribal blocks (Sharma, p. 24). The same study also confirmed that nearly
3880% of AWWs in the sample AWs belonged to upper castes especially in rural blocks. Both
3See Sharma, 9p. cit. One reason could be that the renumeration for AWW was set at a higher level thanfor TINP workers, including the upper caste women to corner the jobs. Sharma also noted that there was nostatistically significant association between "caste status" and community participation. This finding issomewhat questionable, because the extent of community particiaption in general in all spheres of ICDS was foundto be dismal in the sample villages. Moreover, caste status of AWWs seemed to affect the intake of clients intothe program. Thus in rural blocks where the AWWs recruitment was dominated by upper casted, only 24% of thebeneficiary households belonged to scheduled castes. Given the Indian cultural context, it is somewhat naiveto expect women of upper castes in the villages to look after the welfare of the children of the scheudledcastes.
66
in recruitment and training of AWWs there appears to be considerable si:cpe for
improvement .39
4.33 Finally, one of TINP's great merits has been successful community-based
growth monitoring using mother-retained growth charts and supported by itmediate
real interventions for needy children. The basic purpose of growth-monitoring in
TINP has been for early detection of growth faltering, backed by immediate referral
services. At the same t:ime, mother-retained growth charts also resulted in great:er
involvement of mothers in the program, and in their nutrition education. 0
4.34 To sum up, ICDS is an important watershed in the evolution of public ;'olicy
towards child and maternal malnutrition in India. With the inclusion of welfare of
women and children in the government's 20-point program, ICDS has come to st:ay as
a model for future integrated child development activities. An objiective assessment
of the various impact studies and social components of the program suggest thLat the
program as it is now in operation is tilted in favour of older children at the
expense of under-threes among whom the incidence of malnutrition is highest:. The
coverage of pregnant women also appears to be unsatisfactory. Accurate assinssmerLt
is handicapped because ol the absence of project-specific control groups in ]:ost of
the studies. The available studies suggest that the impact on nutritional status
varies a great deal across projects, rural and tribal projects faring much wor,n e than
39That all is not well with AWW recuitment is also clear from recent press reports. See for ex.:mple,Indian Express, (1988).
40Growth-monitoring has been attacked by nutritionists in India as a "waste of time" (Gopalan). We donot wish to enter into the debate, except to say that it would indeed by a waste of time if used on y forscreening children for supplementary feeding. However, under TINP, contrary to popular misconceptions. qrcwthmonitoring via mother-retained charts is used primarily for early detection of faltering, for mot:hers'involvement and cooperation, anc for their education. TINP Community Nutrition Workers have been trained touse charts as one of the important vehicles for imparting health and nutrition education to mothers. Evencasual visitors to TINP blocks cannot fail to notice the enthusiasm with which mothers respond to the use ofcharts which are carefully preserved by them.

67
others. The program as it is now in operation seems to suffer from weaknesses with
respect to recruitment, training and supervision of the core workers. However, the
concept of providing an integrated package cf health and nutrition services
exemplified in the ICDS has undoubtedly immense potential for reducing malnutrition
in India. If appropriate changes in the program design are effected, and the
recruitment, training and supervision procedures of the core workers are overhauled,
some of the observed shortcomings of ICDS can be removed, and its productivity
improved. The program can also benefit from incorporation of some aspects of the
TINP approach such as training and supervision, mother counselling and nutrition
education, communilty participation, etc. In some projects with high percentage of
program clients, t:wo-worker model appears to offer potential for improving ICDS
performance. This is likely to enhance costs, but it must be stressed that the
overall direct nutrition support expenditure amounted to only 1.1% of total plan
outlay of the Centre and the States during 1986-87.
(b) Public Distribution System
4.35 It is now recognized that despite the improvement in the national food supply
position, poor households especially in the less developed states are unable to
improve their per capita foodgrain consumption levels essentially due to lack of
purchasing power.41 The existing distribution of income and wealth and the regional
concentration of production activity may be such as to leave large segments of
society without the necessary purchasing power to buy staple foods in quantities that
4 For example, the per capita monthly foodgrain consumtion (at 1970-71 prices) for the lowest threedeciles in Bihar 1983/84 ws (Rs. 15.58) less than half of that of Punjab. It was lso low in Andhra Pradesh,Madhya Pradesh, Karnataka, Kerala, Orissa, Maharashtra and Tamil Nadu (i.e. less than Rs. 18). In general,per capita food consumption of the lowest three deciles was low in the agriculturally lagging states, and inthe chronically food-deficit states. (See Gupta, 1987).
68
are deemed necessary from a nutritional point of view. In the medium run, P:S has
been envisaged as an important instrument to ensure access of essential coml:o5lities
like foodgrains to vulnerable households especially in rural areas where tehe poor
have to contend with low incomes as well as high weather-induced variability of
incomes. In the long-run, the solution to this problem would be an improveunnt in
the income/employment situation of these households and, interventions ouch as
food-for-works have been developed to improve their income/employment sitiation.
*Such interventions to improve and stabilise income/employment leveils (e.g., EGS ln
Maharashtra), those aimed directly at vulnerable individuals within vulnierable
households (child and maternal nutrition programs) and those aimed at vulterabl.e
households as a whole (PDS) should be regarded as complementary to each other, rather
than as alternatives.
4.36 Theoretically, PDS, by providing foodgrains at lower than market pri:e to
the vulnerable households, can play a significant role in the medium-run in
maintaining, if not in improving, the nutritiorLal levels of these households, as is
demonstrated by the experience of Kerala and Gujarat. 4 2 The central role of ID; has
come to be recognised even more following the drought of 1987. The state gover:mntents
were quick at expanding food-for-works programs in the affected regions, and ir. those
areas where a well-established and properly supervised distribution system esisted
to carry foodgrains to the work sites, the effectiveness of the employment pr:)grams
increased. Clearly, a more widespread rural coverage of PDS to targetted popui.ation
would enhance the outreach and effectiveness of income-generating wrorks pro,.;rams.
Other advantages of PDS have also been recently recognised. In an extremely del:ailed
42The experience of Kerala and Gujarat are well documented by George (1985).
* EmpLoyment Guarantee Scheme.
69
study of PDS in Andhra Pradesh, Venugopal noted that the newly introduced Rs. 2 a
kilo scheme, by ensuring access to grain in the offseason at a low price, reduced
the dependence of labourers on landlords for grain loans. As a consequence, the
institution of "attached labourers" - an onerous contractual arrangement in existence
for over a century - is on the decline. Moreover, the labourers are also taking
advantages of seasonal hike in the wage rate during the peak season and demanding
cash wages. Clearly, an effective PDS appears to generate other favourable
spin-offs.
4.37 Recognising the above-mentioned advantages, serious attempts to develop PDS
as an effective instrument for providing nutrition support to poor households have
been proposed in the Seventh Plan. However, like other nutrition interventions, PDS
coverage and extension to rural areas depended upon the state's own initiative and
resources. This is because the distribution of food supplies from the Centre is not
adequate to maintain PDS round the year. Therefore, states interested in improving
the coverage must purchase additional grains within the state, thereby invariably
incurring a subsidy expenditure. Further, the distribution of Central supplies have
not always been in correspondence with state-wise needs. In actual practice, barring
the states of Kerala, Andhra Pradesh, Tamil Nadu and Gujarat, PDS coverage of rural
areas is reported to be weak. State-wise distribution of total PDS supplies is shown
in table 24. An important limitation of this data is that rural/urban breakup of
quantities distributed is not available. Further, these data show only the Centre's

70
Tabie 24PDS Supplies and Population Below Poverty Line
(Thousand Tonnes)
Distribution ofPDS Supplies to Percent Distribution ofState Govt. and PDS Supplies to StateDirect to Falr Govt. and Direct SalesPrice Shops to Fair Price Shops X Diatribtuion----------------------- ------------------------ of PopulationRice Wheat Total Rice Wheat Total below Poverty
States Foodgrains Foodgralns line
Andhra Pradesh 991 103 1094 16.70 3.23 11.99 7.6Assam 221 141 362 3.72 4.42 3.97 1.5Bihar 84 271 355 1.42 8.49 3.89 13.5Gujarat 92 18 110 1.55 0.56 1.21 3.2Haryana 9 53 68 0 .15 1.66 0.75 0.8Himachal Pradesh 31 23 54 0.52 0.72 0.59 0.2Jammu & Kashmir 121 77 198 0.04 2.41 2.17 0.4Karnataka 232 74 306 3.91 2.32 3.36 5.1Kerala 1332 146 1468 22.28 4.58 16.09 2.6Madhya Pradesh 167 46 213 2.81 1.44 2.33 9.4Maharashtra 271 314 585 4.57 9.84 6.41 8.6Orissa 43 146 189 0.7. 4.58 2.07 4.4Punjab 1 15 116 0.02 0.47 0.18 0.9Rajasthan 5 10 15 0.08 0.31 0.16 4.7Tamil Nadu 271 95 366 4.57 2.98 4.01 7.4Uttar Pradesh 168 138 306 2.81 4.33 3.35 19.6West Bengal 731 669 1400 12.32 20.97 15.34 8.3Other States aadUnion TerritorLes 1174 852 2026 19.78 26.70 22.20 1.6All India 5934 3191 9125 100.0 100.0 100.0 100.0
Note: PDS data belongs to the year 1984: distribution of people below poverty line isfor the year 1983/184.
Sources: Bulletin of Food Statistics, 1985-86: and the Planning Commiasion.
direct contribution to the states, but do not include the state's own procLrement
efforts - alithough the onily major state effort is in Andhra Pradesh. From the tabLe
it is clear that states that account for a substantial share of all-India ?cverl:y
population like Bihar, Uttar Pradesh, Madhya Pradesh and Rajasthan account for on2Ly
a small share of the PDS supplies. A substantial share of supplies is going to the
big cities. For example, Union Territories (Delhi in particular) accounted for 22%
of the supplies, but their share in the poverty population was only 1.6% TIiat the
regional distribution of PDS supplies is in general unrelated to the incid!nze of
both rural and urban poverty is much too obvious to need futher analysis The
pattern of mismatch between supplies and needs under PDS is much the same as ii'or the
direct programs. Considered along with ICDS, the broad conclusion is gross iriequity

71
in the allocation of resources for nutrition.
4.38 PDS as it has operated so far in India is also expensive because wherever it
was introduced recently, no serious efforts were made to limit its access to the
vulnerable groups. Not only have costs increased, but effectiveness has been
reduced. For example, in Andhra Pradesh, where the coverage is set wide, PDS met
only 34% of the minimum requirements of rice and 31% of oil for the poorest segments
(green card holders).43 Recent reports on the functioning of the scheme suggest that
the government could ensure a supply of only 1.7 million tonnes. If the entire
ration quota to only green card holders were to be supplied, 2.5 million tonnes would
be required. Most green card holders could not obtain even a small share of their
quota of ration. Clearly the government is experiencing difficulties in ensuring
supplies; restricting its access to green card holders would substantially ease
supply problem while serving the poor better. As at present, it is reported that
the free market price of rice (where the poor now buy more than two-thirds of their
requirements) rose sharply in the recent period. Thus, the scheme is becoming
ineffective in serving the poor.
4.39 As of today, the Central government has been incurring a subsidy cost of Rs.
7500 million per annum on PDS. Yet vulnerable groups in many states do not have any
access to PDS supplies, while the poor as well as the non-poor have access to it
especially in the urban areas. The role of PDS during normal times and in drought
years as a cost-effective instrument of food supply can be realised only if its
43This is based on the assumption that a poor household's (with a family size of 5) consumption ofstaple foodgrains approximate to 60 kg/per month. Given that a poor family's household size may be expectedto be larger than 5, this estimate must be regarded as a lower bound. For an overall assessment of the scheme,see Venugopal (1987), and Radhakrishna and Indrakant (1987).
72
access is restricted to the hard-core poor. Assuming this can be done in princilple,
how much would it cost the government?
4.40 We begin by assuming that a household with five members would require a
minimum of 65 kg of rice per month to maintain bare minimum nlutritional Level,"
Following NSS 1977, average expenditure of the poor per annum per household works
out to Rs. 3578 at 1987 prices. According to the same NSS data, 60% of this
expenditure was on foodgrains. A poor household would be spending about R3. 245C
per annum on foodgrains or buying 58 Kg per month assuming rice price at Rs 3.50/kg
which was the prevailing retail rice price during 1987.45 This leaves a shortfall
of 7 kg per month, or Ps. 294 shortfall in income/expenditure to reach the desired
level of 65 kg. per month.
4.41 Assuming a minimum annual income support of Rs. 100/per household vi.l pubLic
works programs (NREP and RLEGP), PDS would still have to effect a net income 1.1ansfer
of Rs. 200/- per annum per household if the observed nutritional gap is to be filled.
For inducing poor households to avail of PDS, we consider that a minimum diffl:rential
of Rs. 1 between the market price and the issue price under PDS; or an isst.e price
30% lower than the former which ruled at Rs. 3.50 during 1987, would be esse2ltial.
In other words, PDS would have to supply 200 kg per annum per household for effecting
an annual income transfer of Rs. 200. For 58 million poor households in the colmtry,
the annual ioodgrain requirements would thus work out to be 11.6 million tonnes.
44The estimates contained in this para are drawn from C.H.H. Rao, S. K. Ray and K. Subbarao (.968).
45We are using rice only for illustrated purposes. Other grains (millets) could be used. Su:ip yinginterior grains which figure prominently in the budget of the poor has been advocated for ensuring a .rertainamount of self-targetting, but this suggestion has so far not been put into practice.
73
At present the government is distributing 10 million tonnes and incurring a subsidy
cost of Rs. 7500 million or Rs. 750 per tonne. Assuming such perfect targeting the
scheme would cost onily an extra Rs. 1200 million and an additional 1.6 million
tonnes.
4.42 The above exercise is intended to show that with roughly the same expenditure
as is being incurred now, it would be possible to ensure food security to all
critically vulnerable households, provided the access of PDS is limited to them.
Experience gained so far indicates that perfect targetting of food subsidy is
operationally difficult especially in areas where the poor and the near-poor are too
numerous, although in some states the coverage may have been set wide deliberately.
There is undoubtedly a need for experimenting with self-targetting methods such as
supply of inferior goods. The huge subsidy cost for a PDS with unlimited access has
no economic justification whatever. In this context, the experience with a more
targetted PDS in Kerala, Gujarat and Tamil Nadu is very important.
4.43 Kerala introduced PDS in rural and urban areas as early as 1964. Because
Kerala is a chronically food deficit state, the PDS also serves the non-poor, but
their access is very limited to 10 to 15% of requirements, whereas nearly two-thirds
of the total grain requirements of the poor are met from PDS. Eiigibility to ration
is determined on the basis of multiple criteria, one of which is land holding size.
The evidence is that the distribution has favoured lower income groups (George,
Kumar). The near-universal coverage led to the population developing a stake in the
efficient functioning of the system and reduced leakages. The fact that private
trade was never abolished, and a dual market always enabled the rich to buy from the
open market, eased the pressure on resources for running the scheme. It needs to
74
be stressed that the Kerala Government has been able to recover part of the
operating costs of the scheme from its consumers by charging higher prices from
non-poor consumers. George (1985) noted substantial positive nutritional impact
owing to a well-managed and targetted PDS in both Kerala and Gujarat. In ihe recent
past in Gujarat, PDS coverage is reported to have been further restricted tovards
the bottom two deciles f'or whom the ration price was further reduced. In Tamil
Nadu, of the 11.8 million ration cards in operation, 8.6 million belonged to poor
families with less than Rs. 500/- monthly income (Annadurai). Thuis, Kerala,
Gujarat and Tamil Nadu represent relatively successful cases of eifective targetting.
By contrast, in Andhra Pradesh, although the coverage was extended to the rural
areas, nearly all rural households were covered. Gradually the scheme's coverage
was tightened, yet nearly the bottom 70% of the population is covered under the
46scheme now, so that the critically poor are able to get a small share of :ation
quota as serious supply bottlenecks have emerged. An analytical study base:L on a
dual market in rice showed that the policy improved the welfare levels of the poor
(Radhakrishna and Indraknmt). However, the same study also pointed out thai if the
coverage had been restricted to the bottom 40% of the population, the welfal:e gain
to the poor would have sutbstantially increased, and the supply situjation wotld have
become more manageable, ensuring the scheme's long run sustainability in a
cost-effective manner.
4.44 The experience of the above states suggests that it is possible to re!;trict:
access of PDS to the poor; that it is probably easier to administer the sch(.me if
the coverage is restricted when the scheme is introduced, rather than Later that
innovative methods for self-targetting do exist; that restricting access cE the
46It is reported that the government is now attempting to restrict the access to the population l:elowthe poverty line.
75
scheme to the poor is absolutely essential since costs are directly related to
coverage, as well as the ration quota and the ration price; and that a well-managed
PDS does result in im,provement in the nutritional status of vulnerable households.
The available knowledge of PDS in states limiting access to the poor could be
usefully collated so as to help reorient PDS to serve the poor in the other states,
especially in the rural areas in the eastern and central states. PDS would then
become an important national indirect nutrition support program. Unless such
restructuring of PDS towards the poor is attempted, which seems feasible with
existing resources and foodgrains, the present food subsidy cost would continue to
be largely unproductive.
V. Conclusions and ImDlications for Policy
5.1 A clear empirical data base on various facets of malnutrition is
essential for the evolution of a sound nutrition policy in India. Such knowledge
is also needed for the Bank and other donors for supporting future nutrition
interventions. This paper contains a detailed and disaggregated analysis of the
existing data base on malnutrition in India and thus provides a firmer empirical
basis for the evolution of nutrition strategics and policies. It also offers a
general assessement of policy responses - of both Central and state governments -
which is further supplemented by a detailed assessment of the effectiveness of major
nutrition interventions tried in different states. This section summarises the main
findings, and concludes with a few implications for nutrition policy planning in
India.
5.2 There is substantial empirical evidence to suggest wide variations
76
in the intensity of malnutrition across regions, age and social groups and by gender.
In terms of average levels of nutrient intake, severe malnutrition is prevalent in
Bihar, Uttar Pradesh, Madhya Pradesh, Kerala, West Bengal, Orissa and Ra-a,than.
The nutrient intake of the ultra-poor seems to be improving in Gujarat, Kerala,
Maharashtra, Tamil Nadu and West Bengal. However, the levels of nutrient :ntak,es 0,,f
scheduled castes and tribes are invariably lower than the average for all groups,
and are way below the recommended levels in all states and locations - rural as, well
as urban. The incidence of malnutrition is particularly severe amiong the t:vibals.
A much higher percentage of children in the age group 0-3 years stuffer from severe
malnutrition than others, in all locations, both developed and undeveloped. I'eneral
economic development, and favourable seasonal changes and better cro0p conditicals seem
to protect c.hildren fromi malnutrition to a far lesser extent than adults. While
evidence on gender discrimination in food intake is not conclusive, regional p;..tterr.s
do suggest the prevalence of discrimination in north India, especially againi:t very
young female children.
5,3 Direct expenditure on nutrition support as a per cent o:f GDP
remained modest at 0.16% during 1986/87. Even as a percent of Central and stat:e plan
outlays, nutrition claimeBd only 1.09% of resources, the states sharing a li.gher
burden than thLe Centre. An improved allocation of resources by the Centre fcc ICDS
during the Serenth Plan unidoubtedly constitutes the most significant: developn r!t in
the recent past, but the overall resources committed to nutrition still ::emaini
modest.
5,4 The distribution of even the modest resources allocate.l for
nutrltion has not at all been sensitive to the observed regional variations in the.

77
incidence of malnutrition in India. Regrettably direct nutrition expenditures per
child were pitifully low precisely in the very states that account for a larger share
of the nation's severely malnourished children. There appears to be considerable
scope for improving the productivity of even these weagre expbysditi rs by' (-t
such expenditures to the critically malnourished age and social groups. Because
nutrition is a state subject, the states have the major responsibility, the Centre
playing only a subsidiary role. With the launching of ICDS, the Centre's role has
expanded, but regional asymmetry persists nevertheless. While the Centre's financial
support for initial overheads, staff and training is enabling the expansion of ICDS
projects rapidly, the duration of feeding in the operationalised projects which has
a direct bearing on improving the nutritional status of children and women, and for
which resources have to come from the states, is unsatisfactory especially in the
states with the greatest need such as Bihar. Interestingly, the mismatch between
regional allocations and program effectiveness persisted not only in direct nutrition
support programs but. also in the public distribution system (PDS) - India's largest
indirect nutrition support program. This mismatch in resource allocation found its
reflection in physical performance, to the extent children fed under various feeding
programs did not correspond with the regional location of number of severely
malnourished children. Nor did PDS supplies match with th, distribution of
population under the poverty line. On the whole, the broad conclulsion is that the
existing resources and programs for nutrition support are poorly matched with what
we know about the distribution of need and, therefore, there is an) urgent need to
strike a proper balance between needs, potential demand ard available resources.
5.5 Presumably disappointed by the inadequate support from the Centre,
78
some of the states have allocated substantial resources to school. feeding schemes.
But even among the states that have allocated sizable resource for nutrition, ithe
outreach of programs was extended to age/social groups not necessarily identifLed
as acutely malnourished, while excluding or poorly touching some of the critically
malnourished age groups. In other words, in some states current expenditur.es might
be adequate for major impact on the problem if they were allocated exclusi%7ely for
the malnouriLshed children and women. In other states, the resources allocated to
the nutrition sector as a whole are so inadequate that there is every poss.i.ility
of shortfalls occurring in the Seventh Plan outlays.
5.6 The two major nutrition support programs have had only Limited
impact in combating malnutrition, despite good intentions. On balance, the rBelised
results appeared to be far below the programs' potential. Various Eactors
contributed to the poor performance of ICDS. Deficiencies have been nctBd .in
practically every component of the program. The program as it is now in opiration
is tilted in favour of older children at the expense of under-threes, amor.g whcom
malnutrition is greatest. The nutritional impact varied a great deal across
projects, with tribal andl rural locations faring much worse than others. Pei:vasive
weaknesses also persistetd in recruitment, training and supervision of worlcers.
Similarly, the full potential of PDS as an important Indirect nutrition support
program is yet to be realised despite allocation of substantial resources -c the
scheme. The experience of some states does underscore the potential of a
well-managed and targetted PDS for improving the nutritional status of vulnerable
households. For realising this potential cost-effectively, self-targetting
approaches (such as supplying inferior grains/tapioca, etc.) must be i:xied,
Effective PDS coverage can also contribute to improving the outreach of foott-for-

79
works (NREP, EGS) programs. As it is in operation in the country as a whole today,
PDS is far from becoming an active indirect nutrition support program. However, with
appropriate restructuring, it seems feasible to render PDS as an effective nutrition
support program with existing resources and foodgrains.
5.7 What basic issues arise from the above findings? First, substantial
progress has been made towards evolution of a nutrition policy in India, as embodied
in programs like ICDS which has been drawn into the fold of the 20-point program.
There is continuing emphasis on supplementary rehabilitative feeding, linked to
health and other services. Notwithstanding these policy gains, there are still a
few planning issues that need to be squarely addressed. These are: determining the
quantity of needed resources to be raised; how these are to be used; and what
sequencing of nutrition investments (priorities) is to be followed. An overall
review of adequacy of current resources and its allocation across competing needs
and regions may have to be combined with further analytical and empirical research
on how to make the existing programs more cost-effective. In other words, there is
an urgent need for integrating macro planning (resource allocation) issues with
micro-level (program design) issues with the overall. objective of ensuring adequacy
and efficient use of resources allocated to nutrition. Such an exercise is necessary
because the experience reviewed in this paper suggests that in the past governments
have often put into effect programs without providing for necessary organisational
inputs which resulted in considerable waste of resources. The need for relative
weighing of costs of alternative programs in relation to benefits, the
organisational, administrative and training inputs needed for ea^h of the components
of the programs, etc. - the nuts and bolts issues - can hardly be overemphasized.
80
5.8 Given the social-class and regional distribution of malnutrition in
India, and given paucity of resources, another issue that arises is the need for
adoption of a regional approach to nutrition planning, combining it with overall
development policy framework. This is because the geographical areas where a sizable
proportion of the country's malnourished social groups are located also hcppen to
be extremely backward and slow-growing regions. For these social groups, nutr:ition
planning and intervention alone may not be adequate; these must be intertwined with
programs of general development, primary health care, and infrastructural impro'rement
of these regions. The twro major interventions - the ICDS and PDS - though bas.cally
good responses, do not yet add upto such an overall nutrition planming poll y.
5.9 A third issue, which follows from the second, is that sich a
regional approach would also enable flexibility in program design according to the
needs of different regions. At present, a common package of services i being
uniformly sulpplied by ICDS throughout the country. This approach is based on the
assumption that the demands of the populations of dissimilar states; like Kerala and
Bihar are the same. Kerala has a much higher level of female literacy and health
infrastructure, and may not need health and nutrition education to the same e:ttent
as the population of Bihar or Uttar Pradesh. Presumably ICDS program dcB3S not
inhibit such flexibility,; yet in practice the program is not being moulded al: the
project level to accommodate such regional differences. As a conseiquence, I(DS has
not yet become a truly demand-based program. A pre-requisite for such a demand -based
nutrition planning is decentralisation in decision-making, and active involcment
of the beneficiaries in program design, in the day-to-day operation of the prEl,ram,
and also in the assessement of its impact.
81
5.10 Finally, the prerequisites for improving the nutrition situation in the
country appear to be (a) an appropriate institutional back-up, and (b) measures to
improve the data base on nutrition. Most of the problems identified in this paper
(e.g. overall resource inadequacy and inefficient use of existing resources, program
designing issues and cost effectiveness, the asymmetry between needs and resources,
etc.) have emerged essentially because of a lack of a rallying point for advancing
nutrition interests,, and for periodically reviewing existing policies and programs.
The building up of such an institutional front is inevitably a slow process, for
there are no immediate tangible gains either to society, policy makers or
politicians.47 It is not, therefore, surprising that except in a few states,
nutrition has not received the enthusiastic support from the politicians that other
programs received. As such, it is all the more necessary for building such an
institutional capacity especially at the local (village community and district)
levels to mobilise and manage resources for nutrition efficiently. The government
should take the lead in this process, and aupplement the efforts of voluntary
institutions. Strengthening the data base on the nutrition situation (which is now
eight years' old and poor) is a key step for not only designing interventions
appropriately moulded to accommodate for regional variations, but also for keeping
track of the quality of implementation of programs, and for assessing other program
impacts.
47By contrast, witness the quick building up of pressure groups and institutional lobbying for advancingthe farming interests in recent times.

REFERENCES
Anderson, Mary "Reaching the Unreached: Why is it imperative?"Ann (1987) USAID. Mimeo.
Annadurai, C "The Public Distribution System in Tamil Nadu: AnInterim Assessment" Bulletin Madras DevelopmentSeminar series, XVIII (1).
Berg, A. "Nutrition Planning Is Alive and Well, Thank You",(1987) Food Policy, Vol. 12 (4).
Malnutrition: What can be done?, Bathmore, The Johns(1987) Hopkins University Press.
Dandekar, V. M."On Measurement of Undernutrition", Economic and(1982) Political Weekly, Vol. 17 (6) February 6. pp.203-212.
de Janvry, Agricultural Price Policy and Income DistributionK. Subbarao(1986) in India, Oxford University Press, Delhi.
Evenson, R. E. "Food Consumption, Nutrient Intake and Agricultural(1986) Production in India", USAID (Delhi) Occassional Paper
No. 3
George, P. S. "Some Aspects of Procurement and Distribution of(1985) Foodgrains in India," IFFRI, Washington, Working Paper on Food
Subsidies no. 1.
Gopalan, C. (ed) Combating Undernutrition: Basic Issues and Practical(1988) Approaches, Nutrition Foundation of India, Special Publication
Series 3.
=____=___=__ Nutrition, Problems and Programmes in South Asia, (1987)WHO.
Govt. of Punjab Report on ICDS in Punjab.(undated)
Gupta, Saroj "Inter-State Variations in Food Consumption(1987) Nutritional Adequacy and Levels of Poverty",
USAID, Delhi, Occassional Paper No. 4.
Harriss, B (1986) "The Intra-family Distribution of Hunger in SouthMimeo. Asia", London School of Hygiene and Tropical
Medicine.
Indian Express "Anganvadi Centres: Cesspools of Corruption", July 8,(1988) Delhi.
Kakwani, Nanak "On Measuring Undernutrition", WIDER Working Paper 8,(1986 a) Helsinki.
Kumar Shubh K. Impact of Subsidised Rice on Food Consumption and(1987) Nutrition in Kerala IFFRI, Research No. 5, Washington
D. C.
__________ "Is Sex Bias Significant? ', EIDER 'Torki>-g PEaper 9,(1986 b) Helsinki.
Khanna, R. and "Review of Research in Supplementary Nutrition inOhri, P. (1986) India", Paper presented at a Conference on ICDS, NIPCCD, Delhi,
Lipton, M. (1983) "Poverty, Undernutrition and Hunger", World BankStaf.f Working Paper No. 597.
_______ "Landi Assets and Rural Poverty", World Bank StaffWorking Paper no. 744.
National Institute Abstracts of 200 Papers on ICDS. Mimeo.for Public Coopera-tion in Chi ldDevelopment.,(undated)
"Impact of Therapeutic Nutrition on Rehabilitation of(1987) the Severely Malnourished Children in ICDS", Mimeo.
_"Status of Nutrition Component of IODS, Mimeo.
(1988)National Nutrition Monitoring Bureau, Annual Reports 1979 to 1986.
Nutrition Foundation "]:ntegrated Child Development Services. A Study ofof India (1988) Some Aspects of the System" Scientific Report No. 7.
Panikar, P. G. K. Health Status of Kerala Centre for Devel-opmentand Soman, C. R. Studies, Trivandrum.(1984)
Prasad, P. H. "The Pattern of Poverty in Bihar", I.L.C). Populationet. al (1986) and labour Policies Programme Working Paper No,. 152.
Radhakrishna, R "Effects of Rice Market Interventions Policies inIndrekant, S India: The Case of Andhra Pradesh", Centre for(1987) Economic and Social Studies, Hyderabad.
Rao, Kamala S.Jaya "Urban Nutrition in India, I & II", in Copalan, (1988)(1985) op. cit.
Rao, C.H.H. "Changes in Rural Poverty in India", Dr. Rajendra(1985) Pradad Memorial Lecture,, Akola.

Rao, C.H.H., Unstable Agriculture and Droughts: Implications forRay, S.K. and Policy, Delhi: Vikas.eSubbarao, K.(1988)
Rao, N. Prahlad "Evaluation of Nutrition Programs" Nutrition News,(1983) Volume 4 (4), July.
Rao, N. Prahlad, "Health and Nutritional Status of Rural Communitieset. al. (1987) in Jammu and Kashmir", National Institute of
Nutrition, Mimeo.
Rao, N. P. and "Nutrition Profile in India over a Decade", Mimeo,Sastry, J. G. NIN,(1985)
Reddy, J and Birth and Death Study in ICDS Blocks in AndhraReddy B (1986) Pradesh (Paper presented at NIPPCD Seminar on ICDS).
Scrimshaw, N. S. "Some Observations on ICDS of India", M.I.T., Mimeo.
Sen, A. K. "Family and Food: Sex Bias in Poverty" pp. 346-368 in(1984) Resources, Values and Develo2ment, Blackwell, London.
Sen, A. K. (1987) "Hunger and Entitlements" WIDER, Helsinki.
Sen, A. K. and "Malnutrition of Rural children and the Sex Bias"Sengupta, (1983) Economic & Political Weekly, Annual Number, May.
Sharma, Adarsh Social ComDonents of ICDS, NIPPCD.(1987)
Sharma, Urmil "An Evaluative Study of Nutritional Status in ICDS in(undated) India". Mimeo
Sinha,S.N. et.al "Morbidity Pattern in 0-6 year children in Aligarh"(undated) abstracted in NIPPCD, (undated Mimeo).
Srikantia, S. G. "The National Nutrition Monitoring Bureau", NFI(1988) Bulletin, Vol. 9 (2) April.
Srinivasan, T. N. "Malnutrition: Some Measurement and Policy Issues"(1981) World Bank Staff Working Paper 373.
Subbarao, K. "Interventions to Fill Nutrition Gaps at the(1987) Household-level: A Review of India's Experience",
Paper presented at a Workshop on "Poverty in India:Research and Policy" at Oxford University, QueenElizabeth House.
Sukhatme (1982) "Measurement of Undernourishment" Economic andPolitical Weekly, December 11.
Tandon, B. N. "A Coordinated Approach to Children's Health in(1983) India: Progress Report After Five Years", Lancet.
_______ "Management of Severely Malnourished Children by(1984) Village Workers in ICDS in India", Journal of
Troipical Pediatrics, October.
_ "The Impact of ICDS in India", Mimeo.(undated)UNICEF (1983) ICDSz An AssessmentVenugopal, K. R. "The Implication of a Public Distribution System for(1987) Poverty" Centre For Policy Research, New Delhi.
Walker T. et.al "Nutrition and Health", ICRISAT Mimeo.(1987)
World Food Program "Interim Evaluation of iFP Assisted ICDS Projects".(1987)
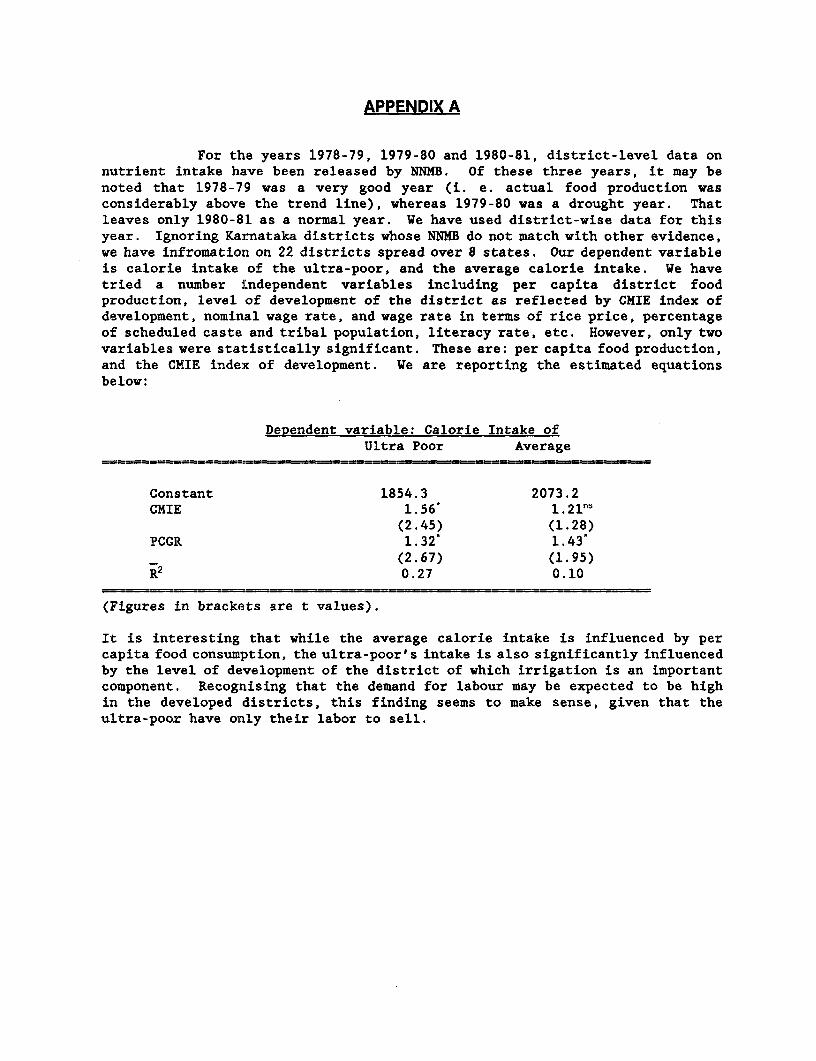
APPENDIX A
For the years 1978-79, 1979-80 and 1980-81, district-level data onnutrient intake have been released by NNMB. Of these three years, it may benoted that 1978-79 was a very good year (i. e. actual food production wasconsiderably above the trend line), whereas 1979-80 was a drought year. Thatleaves only 1980-81 as a normal year. We have used district-wise data for thisyear. Ignoring Karnataka districts whose NNMB do not match with other evidence,we have infromation on 22 districts spread over 8 states. Our dependent variableis calorie intake of the ultra-poor, and the average calorie intake. We havetried a number independent variables including per capita district foodproduction, level of development of the district as reflected by CMIE index ofdevelopment, nominal wage rate, and wage rate in terms of rice price, percentageof scheduled caste and tribal population, literacy rate, etc. However, only twovariables were statistically significant. These are: per capita food production,and the CMIE index of development. We are reporting the estimated equationsbelow:
Dependent variable: Calorie Intake ofUltra Poor Average
Constant 1854.3 2073.2CMIE 1.56' 1.21n5
(2.45) (1.28)PCGR 1.32* 1.43
(2.67) (1.95)R2 0.27 0.10
(Figures in brackets are t values).
It is interesting that while the average calorie intake is influenced by percapita food consumption, the ultra-poor's intake is also significantly influencedby the level of development of the district of which irrigation is an importantcomponent. Recognising that the demand for labour may be expected to be highin the developed districts, this finding seems to make sense, given that theultra-poor have only their labor to sell.
DISTRIBUTORS OF WORLD BANK PUBLICATIONS
ARGENTINA FINLAND KOREA, REPUBLIC OF SPAINCarlos Hirsch, SRL Akateeminen Kirjakauppa Pan Korea Book Corporation Mundi-l'rensa Libros. S.A.Galeria Guernes P.O. 3Sx 125 P. O. Box 101, Kwangwhamun Castello 37Florida 165. 4th Floor-Ofc. 453/465 SF-00101 Seoul 2B001 Madnd1333 Buenos Aires Helsijki 10 KUWAIT SlRi LANKA AND THE MALDIVESAUSTRALIA, PAPUA NEWV GUINEA, FIJI, FRANCE MEMRB Lake House BookshopSOLOMON ISLANDS, VANUATU, AND Woricl Bank Pubhcations P.O. Box 5465 P.O Box 244WESTERN SAMOA 66, aventue d'lena MALAYSIA 100, Sir Chittampalam A. Gardiner %law,, thaInfo-Line 75116 Paris University of Malaya Cooperative Bookshop, Colombo 2Overseas Document Delivery GERMIANY, FEDERAL REPUBLIC OF Limited SWEDENBox 506, GPO UNO-Verlag P. 0. Box 1127, Jalan Pantai Baru Fritzes Fackboksforetaj!.?tSvdney, NSW 2001 Poppelsdorfer Allee 55 Kuala Lumpur Regenngsgatan 12. Bo, 16:56
AUSTRIA D-530) Bonn I MEXICO S-103 27 StockhotmGerold and Co. GREECE INFOTEC SWITZERLANDA-1011 Wien KEMi Apartado Postal 22-86 Libraine PavotGraben 31 24, Ipoodamou Street Col. PE/A Pobre 6, rue GrenusBAHRAIN Athens-11t,35 14060 Tlalpan, Mexico D.F. Case postal 381MEMRB Information Services GUATEMALA MOROCCO Cli 1211 Geneva 11P.O. Box 2750 Libreras Piedra Santa Societe d'Etudes Marketing Marocaine TANZANIANManama Town 317 Centro Cultural Piedra Santa 2 Rue Moliere, Bd. d'Anfa OCford Universitv Pres'BANGLADESH 11 calle 6-50 zona I Casablanca P. O. Box 5299Micro Industries Development Assistance Guatemala City NETHERLANDS Dar es Salaam
Society (MIDAS) HONG KONG, MACAO InOr-Publikaties b.v. fnIAlLANDHouse 56, Road 7A Asia 2300 Ltd. P.O. Box 14 Central Department Stv eDhanmondi RIArea 6 Fl., 146 Prince Edward Road, W, 7240 BA Lochem 306 Silom RoadDhaka 1209 Kowloon NEW ZEALAND BangkokBELGIUM Hong Kong Hills Library and Information Service TRINIDAD & TOBAG I), ANnTiGLIA,Publications des Nations Unies HUNGARY Private Bag BARBUDA, BARBADCS., DONEINICA,Av. du Roi 202 Kultura New Market GRENADA, GUYANA, JAMAICA,1060 Brussels P.O. Box 139 Auckland MONTSERRAT, ST. KITTS A.ND) NEVR.,BRAZIL 1389 Budapest 62 NIGERIA ST. LUCIA, ST. VINCi N1 &Publicacoes Tecnicas Intemacionais Ltda. INDIA. University Press Limited GRENADINESRua Peixoto Gomide, 209 Alied Publishers Private Ltd. Three Crowns Building Jericho Systematics Studies U.01409 Sao Paulo. SP 751 Mount Road Private Mail Bag 5095 55 Eastem Main Road
CANADA Madrami - 600 002 Ibadan CurepeLe Diffuseur Bran-h offices: NORWAY Trinidad. West IndiesC.P. 85, 1501 Ampere Street 15 j. Heredia Marg Narvesen Information Center TURKEYBoucherville, Quebec Ballard Estate Bertrand Narvesens vei 2 Haset Kitapevi, A S.J4B 5E6 Bom bay - 400 038 P.O. Box 6125 Davutpasa Caddesi
CHINA 13/14 Asaf All Road N-0602 Oslo 6 Sergekale Sokak 113China Financial & Economic Publishing New Delhi - 110 002 OMAN Topkapi
House MEMRB Information Services Istinbul8. Da Fo Si Dong Jie 17 Ciittaranjan Avenue P O. Box 1613, Seeb Airport UGANDABeijing Calcuitta - 700 072 Muscat Uganda BookshopCOLOMBIA Jayacleva Hostel Building PAKISTAN P.O. Box 7145Enlace Ltda. 5th Main Road Gandhinagar Mirza Book Agency KampalaCarera 6 No. 51-21 Bangalore -560009 65, Shahrah-e-Quaid-t-Azam UNITED ARAB EMIRATE1Bogota D.E. 3-5-1129 Kachiguda Cross Road P.O. Box No. 729 IEMRB Gulf Co,Apartado Aereo 4430 HydE!rabad - 500 027 Lahore 3 P 0. Box 6097Cai., Valle PTarthana Flats, 2nd Floor PERU Sha0 ah
COSTA RICA Near Thakore Baug, Navrangpura Editorial Desarrollo SA UNITED KJNGDOMLibreria Trejos Ahmedabad - 380009 Apartado 3824 Microinfo Ltd.CaGle 11-13 Patiala House irima P. (. Box 3Av. Fernandez Guell 16-A Ashok Marg PHILIPPINES Alton, Hampshire GU34 IP;San Jose Lucdkuow - 226 001 National Book Store England
COTE D'IVOIRE INDONESIA 701 Rizal Avenue URUGUAYCentre d'Edition et de Diffus:ion Africaines Pt. Indira Limited Metro Manila Instituto Nacional del Li: rc
(CEDA) ll. Sam Ratulangi 37 l?OLAND San lose 111604 B.P. 541 Jakarta Pusat ORPAiN MonitevideoAbidjan 04 Plateau P.O. Box 181 Palac Kultury i Nauki VENiEZUELA
CYPRUS IRELAND 00-001 Warszawa libreria del EsteMEMRB Information Services TDC Publishers PORTUGAL Aptdo. 60.337P.O. Box 2098 12 Nort.h Frederick Street Livraria Portugal Caracas 1063-ANicosia Dublin I Rua Do Carmo 70-74 YUGOSLAVIADENMARK ISRAEL 1200 Lisbon Jugcslovenska KniigaSamtundsLitteratur The Jemisalem Post SAUDI ARABIA, QATAR YU-11000 Belgrade Trg RipustikeRosenoerns Alle 11 The Jermsalem Post Building janr Book Store ZIMBABWEDK-1970 Fredenksberg C. P.O. Box 81 P. 0. Box 3196 Longman Zimbabwe
DOMINICAN REPUBLIC Romenri Jeeusalem 91000 Riyadh 11471 P.O box ST 125, SoutheronEditora Taller, C. por A. ITALY SINGAPORE, TAIWAN, BURMA, BRUNEI HarareRestauracuon Licosa Commissionaria Sansoni SPA Information PublicationsApdo. postal 2190 Via Lamarmora 45 Private, Ltd.Santo Domingo Casella Postale 552 02Pi6 st Fl., Pei-Fu Industrial
EGYPT, ARAB REPUBLIC OF 50121 Florence Bldg., 24 New Industrial RoadAl Ahram JAPAN SingaporeAl Galaa Street Eastern Book Service SOUTH AFRICACairo 37-3, Hango 3-Chome. Bunkyo-ku 113 (Oford University Press Southern AfricaThe Middle East Observer Tokyo P.O. Box 11418 Chawarbi StreetCairo JORDAN Cape Town 8000
Jordan Center for Marketing ResearchEL SALVADOR P.O. Box. 3143FusadcesJalAm nEdifico La Centro Americana fo. Piso Jabal AmmanApartado Postal 01-278 KENYASan Salvador 011I Africa Boiok Service (E.A.) Ltd.
P. 0. BOX 45245Nairobi
Prices and credit terms vary from country to country. Consult your local distributor before placing an order.
RECENT WORLD BANK DISCUSSION PAPERS (continued)
No. 31. Small Farmers in South Asia: Their Characteristics, Productivity, and Efficiency. Inderjit1ingh
No. 32. Tenancy in South Asia. Inderjit Singh
No. 33. Land and Labor in South Asia. Inderjit Singh
No. 34. The World Bank's Lending for Adjustment: An Interim Report. Peter Nicholas
No. 35. Global Trends in Real Exchange Rates. Adrian Wood
No. 36. Income Distribution and Economic Development in Malawi: Some Historical Perspectives.Frederic L. Pryor
No. 37. Income Distribution and Economic Development in Madagascar: Some Historical Perspectives.Frederic L. Pryor
No. 38. Quality Controls of Traded Commodities and Services in Developing Countries. Simon Rottenbergan ruce an e
No. 39. Livestock Production in North Africa and the Middle East: Problems and Perspectives. John C.Glenn LAlso available in French (39F)J
No. 40. Nongovernmental Organizations and Local Development. Michael M. Cernea
No. 41. Patterns of Development: 1950 to 1983. Moises Syrquin and Hollis Chenery
No. 42. Voluntary Debt-Reduction Operations: Bolivia, Mexico, and Beyond... Ruben Lamdany
No. 44. Adjustment Programs and Social Welfare. Elaine Zuckerman
No. 45. Primary School Teachers' Salaries in Sub-Saharan Africa. Manuel Zymelman and Joseph DeStefano
No. 46. Education and Its Relation to Economic Growth, Poverty, and Income Distribution: Past Evidenceand Further Analysis. Jandhyala B.G. Tilak
No. 47. International Macroeconomic Adjustment, 1987-1992. Robert E. King and Helena Tang
No. 48. Contract Plans and Public Enterprise Performance. John Nellis [Also available in French (48F)]
No. 49. Improving Nutrition in India: Policies and Programs and Their Impact. K. Subbarao
The World Bank
Headquarters European Office Tokyo Office1818 H Street, N.W. 66, avenue d'1ena Kokusai BuildingWashington, D.C. 20433, U.S.A. 75116 Paris, France 1-1 Marunouchi 3-chomeTelephone: (202) 477-1234 Telephone: (1) 40.69.30.00 Chiyoda-ku, Tokyo 100,JapanFacsimile: (202) 477-6391 Facsimile: (1) 47.20.19.66 Telephone: (3) 214-5001Telex: WUI 64145 WORLDBANK Telex: 842-620628 Facsimile: (3) 214-3657
RCA 248423 WORLDBK Telex: 781-26838Cable Address: INTBAFRAD
WASHINGTONDC
ISSN 0259-210X / ISBN 0-8213-1192-1 / DP0049