49-inf02text-of-main-report.pdf - UNECE
47
i CONTENTS EXECUTIVE SUMMARY...................................................................................................... iii 1. INTRODUCTION.................................................................................................................. 1 1.1 BACKGROUND .............................................................................................................. 2 2. TEST AND EVALUATION PROCEDURES....................................................................... 3 2.1 VEHICLE DESCRIPTION .............................................................................................. 3 2.1.1 Brake Linings ............................................................................................................. 3 2.1.2 Instrumentation........................................................................................................... 3 2.1.3 Threshold pressure adjustment ................................................................................... 4 2.2 BEDDING IN ................................................................................................................... 4 2.3 THRESHOLD PRESSURE SET-UPS ............................................................................. 5 2.4 ROAD TESTS .................................................................................................................. 6 2.5 ROLLER BRAKE TESTS ............................................................................................... 6 2.6 TRACK TESTS (dynamic performance) ......................................................................... 7 2.6.1 Snub Tests .................................................................................................................. 7 2.6.2 Work done vs temperature tests ................................................................................. 7 2.6.3 Predominance ............................................................................................................. 8 2.6.4 Stability tests .............................................................................................................. 8 2.6.5 Type approval tests..................................................................................................... 8 3. RESULTS ............................................................................................................................ 10 3.1 GENERAL...................................................................................................................... 10 3.2 BRAKE DEMAND DURING ROAD TRIALS............................................................. 10 3.3 COUPLING HEAD PRESSURES AND DECELERATION RATES .......................... 11 3.4 BRAKE TEMPERATURES AND WORK DONE ....................................................... 12 3.4.1 Track tests ................................................................................................................ 12 3.4.2 Road trials ................................................................................................................ 13 3.5 WEAR RATES ............................................................................................................... 14 3.6 FIFTH WHEEL FORCES .............................................................................................. 16 3.7 ROLLER BRAKE TESTS ............................................................................................. 17 3.8 EFFECTS OF PREDOMINANCE ................................................................................. 19 3.9 STABILITY TESTS ....................................................................................................... 20 3.9.1 Purpose and Method ................................................................................................. 20 3.9.2 Results ...................................................................................................................... 21 3.10 TYPE APPROVAL ...................................................................................................... 24
-
Upload
khangminh22 -
Category
Documents
-
view
2 -
download
0
Transcript of 49-inf02text-of-main-report.pdf - UNECE

i
CONTENTS
EXECUTIVE SUMMARY...................................................................................................... iii
1. INTRODUCTION..................................................................................................................1
1.1 BACKGROUND ..............................................................................................................2
2. TEST AND EVALUATION PROCEDURES.......................................................................3
2.1 VEHICLE DESCRIPTION ..............................................................................................3
2.1.1 Brake Linings .............................................................................................................3
2.1.2 Instrumentation...........................................................................................................3
2.1.3 Threshold pressure adjustment...................................................................................4
2.2 BEDDING IN ...................................................................................................................4
2.3 THRESHOLD PRESSURE SET-UPS.............................................................................5
2.4 ROAD TESTS ..................................................................................................................6
2.5 ROLLER BRAKE TESTS ...............................................................................................6
2.6 TRACK TESTS (dynamic performance) .........................................................................7
2.6.1 Snub Tests ..................................................................................................................7
2.6.2 Work done vs temperature tests .................................................................................7
2.6.3 Predominance .............................................................................................................8
2.6.4 Stability tests ..............................................................................................................8
2.6.5 Type approval tests.....................................................................................................8
3. RESULTS ............................................................................................................................10
3.1 GENERAL......................................................................................................................10
3.2 BRAKE DEMAND DURING ROAD TRIALS.............................................................10
3.3 COUPLING HEAD PRESSURES AND DECELERATION RATES ..........................11
3.4 BRAKE TEMPERATURES AND WORK DONE .......................................................12
3.4.1 Track tests ................................................................................................................12
3.4.2 Road trials ................................................................................................................13
3.5 WEAR RATES...............................................................................................................14
3.6 FIFTH WHEEL FORCES ..............................................................................................16
3.7 ROLLER BRAKE TESTS .............................................................................................17
3.8 EFFECTS OF PREDOMINANCE.................................................................................19
3.9 STABILITY TESTS .......................................................................................................20
3.9.1 Purpose and Method.................................................................................................20
3.9.2 Results ......................................................................................................................21
3.10 TYPE APPROVAL ......................................................................................................24
ii
4. DISCUSSION ......................................................................................................................29
4.1 REVIEW OF OTHER STANDARDS / CODES OF PRACTICE.................................29
4.2 WEAR RATE.................................................................................................................29
4.3 WORK DONE................................................................................................................29
4.4 STABILITY AND FIFTH WHEEL FORCE .................................................................29
4.5 EFFECT OF COMPATIBILITY CORRIDORS DURING EMERGENCY BRAKING..............................................................................................................................................30
4.6 ABS BENEFITS.............................................................................................................32
4.7 PREDOMINANCE.........................................................................................................33
4.8 TYPE APPROVAL ........................................................................................................33
4.9 SUMMARY OF DISCUSSION .....................................................................................33
5. CONCLUSIONS..................................................................................................................35
6. RECOMMENDATIONS.....................................................................................................37
7. REFERENCES ....................................................................................................................41
ANNEX A - GRAPHICAL PRESENTATION OF DATA SET-UP 1 ...................................42
ANNEX B - GRAPHICAL PRESENTATION OF DATA SET-UP 2 ...................................49
ANNEX C - GRAPHICAL PRESENTATION OF DATA SET-UP 3 ...................................56
ANNEX D - GRAPHICAL PRESENTATION OF DATA SET-UP 4 ...................................63
ANNEX E - GRAPHICAL PRESENTATION OF DATA SET-UP 5....................................70
ANNEX F - GRAPHICAL PRESENTATION OF DATA SET-UP 6....................................77
ANNEX G - GRAPHICAL PRESENTATION OF DATA SET-UP 7 ...................................82
ANNEX H - GRAPHICAL PRESENTATION OF DATA SET-UP 8 ...................................87
ANNEX I - PREDOMINANCE GRAPHS..............................................................................92
ANNEX J - STABILITY GRAPHS ........................................................................................95
ANNEX K - TYPE APPROVAL GRAPHS..........................................................................104
ANNEX L - GRAPHICAL REPRESENTATION OF RECOMMENDED CHANGES TOR13.........................................................................................................................................111
ANNEX M - SUMMARY GRAPHS ....................................................................................114

iii
EXECUTIVE SUMMARY
Articulated vehicles registered in the UK are required to meet European braking legislation asspecified in EU Directive 71/320/EEC or UNECE Regulation 13. This legislation requires thebrakes on each part of a vehicle combination to perform within a compatibility corridor.Graphical plots of brake performance against applied pressure define these corridors. This isintended to ensure balanced and stable braking when any one towing vehicle is connected toany trailer or semi-trailer, particularly at high (emergency) decelerations. Concern has beenexpressed, however, that the legislation does not adequately consider what happens at lowdecelerations, which are much more likely to be used in normal driving. At low decelerations,threshold pressures (pressure in brake system at which brakes just start to apply) are animportant determinant of brake balance, lining wear, stability and performance.
The objectives were to study vehicles over a range of threshold pressures permitted by thecompatibility corridors of the ECE Regulation 13 (R.13) and develop proven proposals thatwould enhance braking performance and stability and reduce maintenance costs to theoperating industry. The basic methodology was to use an articulated vehicle with variablebrake threshold pressures and assess the dynamic and static braking performance and liningwear characteristics over the range of braking system threshold pressures permitted by R.13.The tests included a roller brake tester, dynamic performance tests on the TRL test track, androad trials involving high mileage travelling around a pre-determined test route.
Road trials were a substantial part of the assessment of each set-up. The route was 180km inlength and comprised of a mixture of road types. For the first five set-ups the vehicle wasdriven over this route for either 11,000km or until a predetermined reduction in the brakeefficiency was observed on the roller brake tester. The method employed on the roller braketester was to measure the brake force at each wheel across the full range of coupling headpressure. The brake efficiency (brake force divided by gross vehicle mass) was related tocoupling head pressure and the results from each test were compared with those fromprevious tests to ascertain if any appreciable degradation of braking performance was evident.All roller brake testing was carried out with the vehicle loaded to maximum laden weight.
The dynamic braking performance of the vehicle combination was established at thebeginning of each threshold pressure set-up using snub tests, at a range of coupling headpressures, with the tests being repeated at the conclusion of each road trial. The towingvehicle was fitted with a brake pressure regulating device that allowed brake applications tobe made at constant, pre-set pressures.
Track tests were conducted to quantify the relationship between the work done by each axleon the vehicle and the temperature rise of the brakes on that axle. By disabling the brakes onall but the particular axle(s) under investigation, the temperature profile for each axle couldbe directly compared to that recorded for the other axles after the same sequence of snubs.
Further track tests to simulate the operators use of the predominance valves were conducted.The tractor was set to the normal operating threshold pressure (0.4 bar) and the thresholdpressure for the trailer was increased by the use of return springs. By adjusting the
iv
predominance in the trailer control valves, the threshold pressure difference was negated andthe performance assessed.
A number of track tests were undertaken to investigate the effect of stability of the HGVunder braking conditions. The vehicle was set with differing threshold pressures, and thebrakes were applied from velocities that were incremented by 10km/h. Three types of teststook place, braking on the full combination, or the tractor unit only, or the semi-trailer only.
Type approval tests were conducted at the Vehicle Certification Agency test centre (VTAC)and comprised of eight series of tests. For type approval, the tractor and trailer are testedindependently and must comply with Annex 10 of R.13.
A towing vehicle with manufacturer supplied asbestos free linings, and a trailer withRegulation 13 Type III linings were used to determine the effect of varying threshold pressurewithin the range currently permitted by R.13. When the threshold pressures were set to 0.4 &0.8 bar, which was somewhat within the permitted range, the trailer linings glazed and within5,000km the trailer brake efficiency deteriorated to below that permitted by the UK annualvehicle inspection.
In order to ensure effective brake distribution, the braking effort on each axle should beapproximately proportional to the static load on each axle. The axle load distribution was15%, 25% and 20% for the steer axle, drive axle and each semi-trailer axle respectively.Work done was calculated upon the basis of brake temperature and showed that thresholdpressures of 0.6 & 0.4 (difference -0.2) gave an efficiency distribution (10.5%, 23.1% and22.1%) which was closest to the ideal. The brake distribution deviated from these values suchthat, the greater the threshold pressure difference, the greater the deviation.
The wear rate of the brake lining provided a good indication of the compatibility of thevehicle combination. With a threshold pressure difference of +0.4 (threshold pressures 0.4 &0.8) the drive axle wear was approximately five times that of a trailer axle. The tractor liningswould need to be replaced five times more frequently as the trailer. The combination closestto the ideal for efficiency distribution produced a wear rate ratio of 2:1 for the tractor driveaxle to trailer.
Regulation 13 Type III brake linings have shown an improvement over Type II and theresearch has shown that threshold differences of 0.4 bar or more will start to produce glazingand vehicle brake performance degradation. Therefore, keeping the threshold pressuredifference to within the range of ±0.2 bar would improve lining wear, vehicle brakingperformance and vehicle stability.
The 0.4 & 1.2 bar set-up provided poor dynamic braking in terms of Mean Fully DevelopedDeceleration (MFDD). However, when the predominance was set to +0.8 bar, thus providingeffective zero threshold pressure difference, the performance was similar to that of a 0.4 &0.4 bar threshold set-up. The +0.8 bar predominance could be achieved with either of the twocontrol valves, one located on the tractor unit and one located on the semi-trailer.

v
The instrumented fifth wheel enabled the measurement of the forces acting during brakingmanoeuvres. For both longitudinal and vertical forces the trend was toward a common valuethat is indicative of the limiting conditions, which were when the wheels locked. This wasinfrequent at the lower speeds and lower pressures and became more frequent as the pressureand speed increased. Since jack-knife and trailer swing did not occur, the lateral forces didnot show an overall trend.
For type approval tests, the braking performance of the tractor unit conformed to the typeapproval compatibility corridor over the range of coupling head pressures that were used. Thesemi-trailer met the type approval requirements when laden. However, when the tests wererepeated with the semi-trailer unladen, the brake performance did not conform to thecompatibility corridor. The brake efficiency was found to be lower than the requiredtheoretical braking rate, thus an unladen semi-trailer would be under-braked.
The report recommends that the compatibility corridors for type approval should benarrowed, both at the check braking range (less than 2 bar coupling head pressure) to improvethe wear rate of the brake linings, and also narrowed all the way up to 4.5 bar coupling headpressure to improve vehicle stability. The corridors for both tractor units and semi-trailershould be narrowed. Furthermore, if close compatibility were achieved then a relay valve withadjustable predominance would be unnecessary. Therefore, phasing out of predominancevalves is recommended.
1
COMPATIBILITY OF HEAVY VEHICLECOMBINATIONS
1. INTRODUCTION
Articulated vehicles registered in the UK are required to meet European braking legislation asspecified in EU Directive 71/320/EEC or UNECE Regulation 13 (R.13). This legislationrequires the brakes on each part of a vehicle combination to perform within a compatibilitycorridor. Graphical plots of brake performance against applied pressure define thesecorridors. This is intended to ensure balanced and stable braking when any one towingvehicle is connected to any trailer or semi-trailer, particularly at high (emergency)decelerations. Concern has been expressed, however, that the legislation does not adequatelyconsider what happens at low decelerations, which are much more likely to be used in normaldriving. At low decelerations, threshold pressures (pressure in the brake system at whichbrakes just begin to operate) are an important determinant of brake balance, lining wear,stability and performance.
Previous research for VSE4 (S042C/VD) showed that there is a wide variation in thresholdpressures amongst vehicles in the UK. More recent research (S290B/VD) showed that evensmall differences in threshold pressures between towing and towed vehicles, that are wellwithin limits currently set by legislation, can cause rapid lining wear, poor balance andperformance degradation.
The prior interim report (S291B/VD) discussed the preliminary tests conducted at a numberof varying threshold pressures to provide a preview of anticipated results. This report relatesto an expansion of the project to evaluate the earlier conclusions when applied to a vehiclecombination using a semi-trailer with brakes built to the most recent legislative standards (09series of amendments to UNECE Regulation 13). The results in this report are a morecomprehensive study.
Specifically, this project has the following objectives:
• Compare the findings of earlier work on this subject with the results of comparativetesting of a vehicle combination whose trailer is engineered to satisfy the latest UNECEbraking standards (Regulation 13.09); these standards will be mirrored by the EUDirective.
• Examine the stability of the combination under the range of achievable decelerations overa range of vehicle speeds.
• Deliver data concerning the magnitude and direction of the forces developed at the towingvehicle/trailer coupling.
2
1.1 BACKGROUND
Concerns about the apparent difficulties faced by heavy vehicle operators in maintaining theperformance of trailer brakes, together with widespread criticism of vehicle compatibilityamongst vehicle operators, caused the UK Department of the Environment, Transport and theRegions (DETR) to conduct a survey of brake threshold pressures in the UK. The survey,conducted by the Transport Research Laboratory (TRL), involved some 236 vehicles andconcluded that over 50% of the vehicle combinations had a threshold pressure range of 0.5bar or more and 18% had a range greater than 0.8 bar which is the maximum permitted byR.13 (Robinson, 1994). The report also indicated that this variation was predictable byvehicle make thus indicating that it was a function of design and not maintenance.
This data supported the concern that certain vehicle combinations were effectivelyincompatible, because during normal driving only one part of the combination was doing anywork; they are also consistent with the reported in-service problems of glazed brake liningsand the subsequent low braking performance.

3
2. TEST AND EVALUATION PROCEDURES
2.1 VEHICLE DESCRIPTION
The vehicle used was a 1990 Volvo FL10 (4X2) tractor unit and a 1988 Montracon air-suspended tri-axle semi-trailer, as used for the previous trials (S290B/VD). The Volvo FL10had S-cam drum brakes on the steer and drive axles with automatic slack adjusters. The semi-trailer had S-cam brakes with manual slack adjusters. Both units had braking systems thatcomplied with ECE Regulation 13.06 (EC Directive 85/647). The vehicle was operated closeto the maximum permitted laden weight and Table 1 shows the mass of the vehicle whilststatic.
Table 1. Mass of test vehicleAxle
numberGross laden
weight(kg)
Partiallyladen(kg)
Test weight,near fully
laden(kg)
Steer axle (drum brakes) 1 6700 5220 5660Drive axle (drum brakes) 2 10500 7260 9520Towing vehicle 17000 12480 15180Trailer 1 (drum brakes) 3 8000 4230 7160Trailer 2 4 8000 4250 7080Trailer 3 5 8000 4310 7150Semi-trailer (Montracon tri-axle) 24000 12790 21390Vehicle combination 38000 25270 36570
2.1.1 Brake Linings
The vehicle combination was fitted with new brake linings for this project. The Volvo FL10steer axle was fitted with 410 x 175 mm brake linings and the drive axle was fitted with 410 x200 mm. All the linings were supplied from Volvo and were from the same production batch.
Rubery Owen axles were fitted to the semi-trailer. All of the linings for the trailer were 420 x175 mm and supplied by Rubery Owen Rockwell, also from the same batch.
2.1.2 Instrumentation
The data acquisition hardware was supplied by National Instruments and the software waswritten in-house by TRL. Rubbing K-type thermocouples, on the inside of the brake drum,were used to measure the temperature for each drum. The velocity was recorded by the use ofa calibrated tooth wheel attached to the vehicle propshaft. In addition, the brake line pressureswere measured at the following six points, coupling head, tractor load sensing valve, steeraxle brake chamber, drive axle brake chamber, trailer load sensing valve and one trailer brakechamber on the rear axle.
In addition, an instrumented fifth wheel was fitted to the tractor unit. The fifth wheel wascapable of measuring the forces in three directions, longitudinal, lateral and vertical.

4
The data was recorded in real time using a laptop PC. The data collection format andprogramme allowed on line processing to be undertaken, with the main analysis being carriedout remotely.
The data was stored as text files to the PC, and three types of files were recorded. The firstfile continually recorded data at 0.1Hz and included elapsed time (of the run), overall distancetravelled, brake drum temperature, and whether the brakes were being actuated at thatmoment in time. The second file was recorded whenever the brakes were applied, recordingthe data at 20Hz and included the elapsed time, vehicle speed, distance travelled duringbraking, the six pressures and the fifth wheel forces. The third type was a summary file thatrecorded the collated information from the brake application. It included the brake applicationnumber, elapsed time over the application, initial and final speed of vehicle, the brake drumtemperatures at the start and end of the application, the mean pressures and the maximumpressure, as well as the mean and maximum forces on the fifth wheel.
2.1.3 Threshold pressure adjustment
The method used to alter the threshold adjustment on the semi-trailer has been retained fromthe previous tests, by the use of tension springs fitted between the chassis of the trailer andthe brake-actuating arm. However, a greater number of tension springs were added to theactuating arm to increase the threshold pressure required to actuate the brakes. During theprevious tests, springs were used on the tractor unit in the same way as on the trailer, but itwas found that the springs became coil bound thus restricting the maximum attainable brakeforce. TRL judged that an improved system could offer easier adjustment and more reliableresults to be obtained. An air actuator mechanism was developed and fitted prior to the testsdescribed in this report.
To measure the threshold pressure, the vehicle axle was raised and a pressure gauge attachedto the test point at the brake chamber. The wheel was turned by hand whilst a second operatordepressed the brake pedal. The brake chamber pressure needed to prevent the wheel and tyrebeing turned by hand was then noted. If necessary, the tension springs or air actuatormechanism was adjusted and the procedure was repeated until the correct threshold pressurewas obtained.
2.2 BEDDING IN
Normally, when new brake linings were fitted to an HGV, the drivers were advised to brakecarefully and lightly for the first 200km. However, for the purposes of this research it wasnecessary to ensure that the linings were correctly and consistently bedded.
When new linings were fitted, the vehicle was operated for 2,000km partially laden andsubjected to a roller brake test every 500km. The route encompassed motorway and A-roadsections requiring a number of brake applications, with the threshold pressures set to 0.4 bar,to minimise the likelihood of glazing of the linings. After this initial 2,000km, the vehiclewas then run at maximum test weight for a minimum of 500km until results from the rollerbrake tester became consistent; the axle weights are given in Table 1 above. The brake liningswere also inspected to ensure an adequate contact area. A similar procedure was followedbefore each new series of tests for which the linings were abraded to remove imperfections

5
and then bedded before the new series began. New linings were fitted only when there wasinsufficient lining thickness to be sure of completing a test series.
It should be noted that the linings used for this research took longer to bed than was necessaryfor the previous research with asbestos linings.
2.3 THRESHOLD PRESSURE SET-UPS
For the trials there were five different threshold pressure set-ups that were tested fully, bothon the road routes and with snub tests. A further three set-ups with more extreme pressuredifferences, were tested less extensively; Table 2 below shows the threshold pressuresevaluated. It should be noted that for this project the first set-up tested had a zero thresholdpressure difference between the towing vehicle and semi-trailer. The difference was graduallyincreased as the project progressed. This differed from the previous project (S290B/VD) thatbegan with a large difference that was gradually decreased before being increased in theopposite sense.
Furthermore, thorough servicing of the vehicles allowed a minimum threshold pressure of 0.4bar to be used (more typical of commercial practice), whereas previously this had been 0.5bar. The predominance was set to zero for all of the set-ups.
Threshold pressure difference will be referred to throughout this report. This is defined as thedifference between the semi-trailer and the towing vehicle threshold pressure. A positivedifference indicates that the semi-trailer threshold pressure is greater than that of the tractorthus for a low application pressure the tractor will be contributing most of the braking. Theconverse is true for a negative difference. A negative difference indicates that the semi-trailerthreshold pressure is lower than that of the tractor, so for a low application pressure the trailerwill be contributing most of the braking.
Table 2. Threshold Pressure Settings
Towing vehiclethreshold pressure (bar)
Semi-trailerThreshold pressure (bar)
Threshold pressure difference[semi-trailer minus towing
vehicle] (bar)Set-up 1 0.4 0.4 0.0Set-up 2 0.4 0.6 +0.2Set-up 3 0.4 0.8 +0.4Set-up 4 0.6 0.4 -0.2Set-up 5 0.8 0.4 -0.4Set-up 6 0.4 1.0 +0.6Set-up 7 1.0 0.4 -0.6Set-up 8 0.4 1.2 +0.8
The research has evaluated a range of threshold pressure combinations, as indicated in Table2 above, and chosen to lie within the boundaries as permitted by Regulation 13 (R.13);predominance was set to zero for all the tests. However, for the 8th set-up a semi-trailerthreshold pressure of 1.2 bar was used. This is outside the permitted corridor but wasnecessary, because it was not practical to reduce the towing vehicle threshold pressures below

6
their inherent 0.4 bar. The difference in threshold pressure between towing vehicle and semi-trailer for the 8th set-up (+0.8 bar) was, therefore, within the permitted range of 0.2 & 1.0 bar.
2.4 ROAD TESTS
These tests were a substantial part of the assessment of each set-up. The route was 180km inlength and comprised of a mixture of normal road types as follows: approximately 70kilometres of rural, single carriageway A-road, 50 kilometres of dual carriageway A-road, 30kilometres of motorway and 30 kilometres of urban road. For the first five set-ups the vehiclewas driven over this route for either approximately 11,000km or until a predeterminedreduction in the brake efficiency was observed on the roller brake tester.
The vehicle typically completed two laps a day and was in use five days a week. The first lapof each day started at about 08:00 and the second lap was finished by about 18:30. Each laptook approximately 3 and three-quarter hours to complete, corresponding to an average speedof approximately 48 km/h, and both laps included a mixture of rush hour and normal traffic.
During the road trials, two experienced, professional drivers provided most of the driving.The data (speed, deceleration, etc.) was inspected to ensure consistency between drivingstyles.
During the road trials it was necessary to change the route slightly through Aylesbury due toweight restrictions being introduced onto a number of bridges. However, it did not effect theoverall distance travelled on each road run.
2.5 ROLLER BRAKE TESTS
As well as carrying out basic performance tests on the vehicle during the bedding-in process,roller brake testers were also used during the road trial assessment of each threshold pressuresetting. The method employed was to measure the brake force at each wheel across the fullrange of coupling head pressure. Graphs were then drawn of brake efficiency (brake forcedivided by gross vehicle mass) against coupling head pressure. The results from each testwere compared with those from previous tests to ascertain if any appreciable degradation ofbraking performance was evident. All roller brake testing was carried out with the vehiclefully loaded.
Performance was monitored during the road trials by means of static brake tests on apurposely installed roller brake tester. As in the track tests the performance was measuredover a range of coupling head pressures to establish a vehicle reference; the mid trial valueswere then compared with this signature to indicate possible performance change that was thenconfirmed by dynamic testing at TRL.
7
2.6 TRACK TESTS (DYNAMIC PERFORMANCE)
2.6.1 Snub Tests
The dynamic braking performance of the vehicle combination was established at thebeginning of each threshold pressure set-up using snub tests, with the tests being repeated atthe conclusion of each road trial. Each snub is the application of the brakes, at a set pressure,to decelerate the vehicle from one known speed to another known speed. These snubscomprised of four brake applications per set to slow the vehicle as follows: 50-10km/h, 30-10km/h, 50-10km/h and 80-50km/h. This set of four snubs was repeated five times, giving atotal of twenty snubs for each threshold set-up.
The brakes were cold (below 75oC) prior to each test. Each cycle of snubs was repeatedprecisely, that is the brakes were applied at the same point on the (circular) test track. In thisway the times and distances between brake applications were standardised so as to minimiseany variation in the amount of cooling the brakes experienced between snubs. At theconclusion of the road trials of each particular threshold setting the combination wassubjected to five repetitions of the four-snub cycle indicated above.
Each series of snub tests were repeated for a range of coupling head pressures: 1 bar, 2 bar, 3bar, 4.5 bar and 5 bar, a total of 100 tests. A brake pressure-regulating device allowed thebrakes to be applied at the constant, pre-set pressure. During each series the braketemperatures were recorded.
The Mean Fully Developed Deceleration (MFDD) was also calculated during the snub tests.The expression used to determine the MFDD was derived from that defined in ECERegulation 13.08 but modified for the snub tests for which the final velocity was greater thanzero, as follows:
MFDD = (0.8V0)2 - (V1 + 0.1V0)2
-------------------------------------------------------
2Swhere:V0 = Initial velocity (at application of brakes, km/h).V1 = Final velocity (at release of brakes, km/h).S = Distance travelled whilst reducing speed from 80% of V0 to 10% of
V0 above V1 (m).
2.6.2 Work done vs temperature tests
As with the previous project, S290B/VD, a series of track tests were conducted to quantifythe relationship between the work done by each axle on the vehicle and the temperature riseon that axle. To achieve this, the brakes on all but the particular axles under investigationwere disabled and a series of snub tests were conducted with a set application pressure of twobar.

8
Testing was halted after the cycle of twenty snubs had been completed or sooner if the brakesreached 300oC. By using this method, the temperature profile for each axle could be directlycompared to that recorded for the other axles after the same sequence of snubs.
2.6.3 Predominance
Operators, in general, understand that it is desirable to have a balanced threshold mix betweenthe tractor unit and the semi-trailer to enable good braking. If an operator considers that avehicle has a poor threshold mix, they will adjust the predominance in the trailer controlvalves. The valve can provide a positive pressure, for example 0.6 bar in and 0.75 bar out, toovercome losses in the system and thus can enable a vehicle with a poor thresholdcombination to be a balanced system.
To simulate this, the tractor was set at its normal operating threshold pressure (0.4 bar) andthe threshold pressure for the trailer was increased to each of 0.6, 0.8 and 1.2 bar (thresholdpressure difference of +0.2, +0.4 and +0.8 bar respectively), by the use of return springs. Byadjusting the predominance in the trailer control valves, with either the one fitted to thetractor or the one fitted to the trailer but not at the same time, this threshold pressuredifference was negated and the performance was assessed.
2.6.4 Stability tests
A number of tests were undertaken to investigate the effect of stability of the HGV underbraking conditions. The vehicle was set with threshold pressures of 0.8 & 0.4 followed by 0.4& 0.8, and was driven in increments of 10km/h up to 80km/h or, for safety reasons, until axlelocking occurred. The vehicle was tested in three conditions, braking on full combination,braking on the tractor unit only and braking on the semi-trailer only.
The stability of the vehicle was evaluated over two different surfaces. The first was dry rolledasphalt, a high friction surface, with a coefficient of 0.82. The second surface was a wetmastic asphalt surface with a coefficient of 0.56.
By using the pre-set device as described in section 2.6.1, application pressures of 1, 2, 3 and4.5 bar were used. An independent observer recorded which axles were locking on each test.For safety reasons, an anti-jack-knife cable was fitted between the tractor and trailer.
2.6.5 Type approval tests
The type approval tests were conducted at the Vehicle Certification Agency test centre(VTAC) and comprised of eight series of tests. For type approval, the tractor and trailer aretested independently. The tractor unit was fitted with a load frame and laden to its maximumpermitted weight. The trailer was coupled to VTAC's tractor that has a pre-set device fitted;similar to that fitted to the TRL vehicle. The trailer was laden in the configuration asdescribed in section 2.1.
The tests conformed to Regulation 13 type 0 dynamic test with the gearbox in neutral. Inorder to comply, the results should fall in the compatibility corridors with a minimum

9
threshold of 0.2 bar and a maximum threshold of 1.0 bar. However, the recommendations setout in the previous project suggested that the corridors should be restricted to a maximumthreshold difference of 0.3 bar (Robinson, 1997). It was acknowledged that this may beimpractical and, therefore, limits of either 0.4 - 0.8 or 0.5 - 0.9 bar were proposed.
Given that the majority of braking takes place at less than 1.8 bar, also known as the checkbraking area, it was agreed to keep the threshold levels as low as possible and the 0.4 - 0.8 barrange was used. Four tests were conducted on each of the units. First the vehicles were testedladen at thresholds of 0.4 and then 0.8 bar; these were repeated with the vehicles unladen. Thevehicles initially were set to a braking pipe pressure of 0.5 bar and this was increased withincrements of 0.5 bar up to 2.0 bar. Thereafter, increments of 1 bar until 8 bar or a brakepedal force of 700N was achieved. For Type 0 tests the brakes must be cold, therefore, allbrake applications were made when the temperatures of the brake drums were less than 50oC.

10
3. RESULTS
3.1 GENERAL
A graphical summary of the results from the snub tests and the road trials is provided inAnnexes A to H with one Annex assigned to each set-up. The following graphs are included:
1. brake temperature time history during the road trials,
2. change in brake temperature during the snub tests, both before and after the road trials,
3. frequency of brake demand during the road trials related both to coupling head pressuresand to acceleration rates,
4. MFDD for the track tests and the fifth wheel forces during the first road run,
5. RBT assessment of the brake efficiency of the towing vehicle, semi-trailer and overallcombination.
The results are presented here in order of threshold pressure difference rather than inchronological order of testing.
3.2 BRAKE DEMAND DURING ROAD TRIALS
The frequency of brake demand, in terms of coupling head pressure, during the road trials wascollated for all eight of the different threshold pressures. The results are given in Figure 1below.
Figure 1: Average coupling head pressure for all road runs (sample size = 95452)
0 .6 3 0 .8 4 1 .1 5 1 .3 5
3 .0 1
4 .6 2
1 0 .2 6
1 1 .2 0
1 6 .0 3
1 3 .1 51 3 .4 9
8 .1 2
6 .5 9
3 .2 82 .4 3
1 .2 6 0 .9 30 .4 9 0 .3 4 0 .2 0 0 .1 6 0 .0 9 0 .0 9 0 .0 4 0 .1 70 .0 4 0 .0 2
0 .0 0
2 .0 0
4 .0 0
6 .0 0
8 .0 0
1 0 .0 0
1 2 .0 0
1 4 .0 0
1 6 .0 0
1 8 .0 0
2 0 .0 0
0 0 .1 0 .2 0 .3 0 .4 0 .5 0 .6 0 .7 0 .8 0 .9 1 1 .1 1 .2 1 .3 1 .4 1 .5 1 .6 1 .7 1 .8 1 .9 2 2 .1 2 .2 2 .3 2 .4 2 .5 > 2 .6C o u p lin g h e a d p re s s u re (b a r )
Dem
and
frequ
ency
(%)
9 5 th P e rc e n t i le = 1 .4 b a rA v e ra g e o v e ra ll c o u p lin g h e a d p re s s u re = 0 .8 7 6 b a r

11
The overall average coupling head pressure was 0.876 bar for all of the eight set-ups. Figure 1shows that the brake-demand closely follows a normal distribution. For all of the brakeapplications over all of the set-ups (95452 applications) the 95th percentile value showed thata majority of brake applications were at less than 1.4 bar. This was slightly less than forprevious research conducted by TRL during which 95% of brake applications were less than1.8 bar (Robinson, 1997). However, both results are consistent with other research (Fura,1993) and confirm that the test route provided typical brake use.
3.3 COUPLING HEAD PRESSURES AND DECELERATION RATES
The data presented in Table 3, below, shows both the average coupling head pressure and theaverage vehicle deceleration. For both pressure and deceleration, the mean and 95th percentilevalues are provided; the average effective pressure is also provided. The effective pressure isequal to the mean coupling head pressure minus the threshold pressure. A higher effectivepressure indicates a greater proportion of braking effort on that axle or group of axles.
It can be seen that, as the threshold pressure difference increases, the average coupling headpressure increases accordingly. This indicates that a greater line pressure was required toachieve the same braking effort across the combination. However, even for the individual set-ups the 95th percentile value (Table 3) shows that the majority of brake applications were atless than 1.8 bar.
Table 3. Pressure demand and vehicle deceleration
Threshold pressures (bar)Coupling headpressure (bar)
Effective appliedpressure (bar)
CalculatedDeceleration (g)
Set-up
Towingvehicle
Semi-trailer
Thresholdpressure
Difference
Average 95th
PercentileTowingvehicle
Semi-trailer
Average 95th
Percentile
8 0.4 1.2 +0.8* 1.19 1.72 0.79 0.00 0.063 0.1196 0.4 1.0 +0.6* 1.03 1.57 0.63 0.03 0.056 0.1093 0.4 0.8 +0.4 0.93 1.36 0.53 0.13 0.063 0.1082 0.4 0.6 +0.2 0.89 1.32 0.49 0.29 0.057 0.1021 0.4 0.4 +0.0 0.79 1.24 0.39 0.39 0.059 0.1124 0.6 0.4 -0.2 0.82 1.28 0.22 0.42 0.056 0.1145 0.8 0.4 -0.4 0.95 1.58 0.15 0.55 0.053 0.1177 1.0 0.4 -0.6* 1.01 1.50 0.01 0.61 0.061 0.120
* Indicates a shorter series of road trials (900km).
There was little variation in deceleration between set-ups for both average and 95th percentile.However, it was found that a threshold pressure difference of +0.2bar offered the mostefficient braking when related to deceleration for a given threshold pressure difference. Thatis, the coupling head pressure is close to the minimum values obtained for both the averageand 95th percentile, whilst the average deceleration is also low and the 95th percentile is at itslowest value.

12
Figure 2: Deceleration of vehicle for five threshold pressure combinations
It can be seen from Figure 2 above, a negative threshold pressure difference, which indicatesgreater braking effort from the trailer particularly at low application pressures, gave a loweraverage deceleration but a higher 95th percentile value. However, the trend is for the two linesto begin converging at the positive pressure difference.
It is entirely possible that this trend may have been due to a variation in traffic conditions.However, a more likely explanation is the difference in brake performance. The driver mayperceive that with a negative difference (where the trailer is doing more braking which hecannot 'feel' because he is more 'remote' from the trailer than the tractor unit) that the vehicleis braking at a deceleration lower than the measured value. This loss of 'confidence' in thebraking would mean earlier braking at junctions leading to lower average deceleration.However, it would also mean there would be a tendency to over brake when the situationdemands a shorter stopping distance leading to a higher 95% value.
3.4 BRAKE TEMPERATURES AND WORK DONE
3.4.1 Track tests
To achieve optimum braking, in terms of work done, the distribution of work done by eachaxle should be closely proportional to the weight distribution (Robinson, 1997). As indicatedin Table 1, the axle loads of the test vehicle were 5660kg on the steer axle, 9520kg on thedrive axle and 7160kg, 7080kg and 7150kg on the semi-trailer. Approximately 15% on thesteer axle, 25% on the drive axle and 20% on each semi-trailer axle.
As part of the track tests, three series of snubs were conducted at different coupling headpressures. The vehicle was braked, using only the drive axle, only the steering axle and onlythe trailer brakes. The brake temperatures were recorded throughout the tests. The work doneduring each snub was calculated and this was plotted against temperature for each of the steer
0
0.02
0.04
0.06
0.08
0.1
0.12
0.14
-0.5 -0.4 -0.3 -0.2 -0.1 0 0.1 0.2 0.3 0.4 0.5Threshold pressure difference
Dec
eler
atio
n (g
)Average decel
95th Percentile decel

13
axle, drive axle and the trailer bogie. Thus graphs were obtained that correlated work doneagainst brake temperature.
These results were used as the basis for calculating the work done during the road trials fromthe temperatures recorded and, in turn, for calculating the efficiency of the tractor axles andtrailer bogie. Results for the snub tests are given in Table 4 below.
Table 4. Temperature rise during work done vs temperature correlation snub tests
Rise in temperatureNumberof snubs
Velocity changes(km/h)
Cumulative change inKinetic Energy (KJ)
Steer(oC)
Drive(oC)
Trailer(oC)
2 50 to 10, 30 to 10 4556 63 55 204 50 to 10, 80 to 50 13525 157 154 696 50 to 10, 30 to 10 18081 157 158 898 50 to 10, 80 to 50 27050 213 224 12410 50 to 10, 30 to 10 31606 208 227 13312 50 to 10, 80 to 50 40575 250 278 15514 50 to 10, 30 to 10 45131 235 269 16216 50 to 10, 80 to 50 54100 285 303 18018 50 to 10, 30 to 10 58656 >300 >300 18220 50 to 10, 80 to 50 67625 >300 >300 na
It is well known that lining wear rates are proportional to brake temperature. Some work hasbeen published which suggested that brake systems are adjusted, in-service using thepredominance valve, to provide equal operating temperatures for each brake. This is allegedto provide a more even wear rate across the vehicle brakes and thus reduce maintenance costs.
However, a vehicle with brakes set to provide balanced operating temperatures does notnecessarily have optimum braking efficiency. The work done by a brake is a function of brakedesign and the line pressure, which, in turn, is a function of the load sensing valve. Therefore,the operating temperature of the brakes is a function of the distribution of the load on eachaxle. Thus, if the predominance is set to give the same operating temperature then it is highlyunlikely that this setting will give the optimum efficiency for each axle.
3.4.2 Road trials
The average rise in brake temperature (above ambient) was measured during the road trialsfor both set-ups and the results are shown in Table 5. The calculated work done by each axleis also provided. The work done by the tractor brakes was found to increase as the semi-trailerthreshold pressure was increased. This is because increasing the semi-trailer thresholdpressure results in a greater proportion of the braking effort being effected by the tractorbrakes.
It must be noted that effects, such as cooling efficiency, have not been considered whencalculating the work done by each axle. For example, in wet conditions it has been found that

14
the drum temperature on the offside of the vehicle remains higher than that for the nearside.This may be because the nearside brakes are cooled by water-spray.
Table 5. Temperature rise and distribution of work done during road trials
Threshold pressure(bar)
Average temperature rise*(oC)
Work done(%)
Set-up
Tractor Semi-trailer
Thresholdpressure
difference
Steeraxle
Driveaxle
Semi-trailer
Steeraxle
Driveaxle
Semi-trailer(Each)
8 0.4 1.2 +0.8 158.6 179.8 56.2 37.8 43.5 6.26 0.4 1.0 +0.6 150.2 153.4 35.4 44.3 42.9 4.33 0.4 ** 0.8 +0.4 108.7 113.7 40.7 36.6 39.7 7.92 0.4 0.6 +0.2 89.4 115.1 44.9 27.0 43.3 9.91 0.4 0.4 +0.0 78.1 110.5 60.3 20.0 37.9 14.14 0.6 0.4 -0.2 74.7 113.5 114.1 10.5 23.1 22.15 0.8 0.4 -0.4 62.1 120.7 142.5 5.8 20.1 24.77 1.0 0.4 -0.6 32.4 63.7 113.5 3.0 11.8 28.4
* average temperature rise from ambient.
** severe glazing was noted on trailer linings.
The axle load distribution was 15% steer-axle, 25% drive-axle and 20% for each of the threesemi-trailer axles (60% total). It can be seen that set-up 4, with a threshold pressure differenceof -0.2 bar, provided a work done distribution which most closely matched the axle loaddistribution. However, 0.4 & 0.4 bar, set-up 1, shows more work done by the steer and driveaxles, but less on the semi-trailer axles. This may be due to the load transfer effect movingapproximately 2 tonnes from the semi-trailer to the tractor unit. Therefore the acceptablerange, either side of the static load distribution, is -0.2 and 0.0 bar threshold difference.
The least efficient balance (farthest from the ideal) was measured with a threshold pressuredifference of -0.6 and +0.6, set-ups 7 and 6 respectively.
However, it is interesting to note that the trailer linings suffered severe glazing during theroad runs when the difference was +0.4 and consequently the trial was terminated part waythrough the planned distance of 11,000km. The road trial distance for the three thresholdpressure differences of +0.8, +0.6 and -0.6 (set-ups 8, 6 and 7 respectively) was restricted to1,000km and glazing was not evident. However, it is highly likely that glazing would haveoccurred if the vehicle had covered a greater distance.
3.5 WEAR RATES
The wear rate was calculated by measuring the thickness of both the brake lining and brakeshoe together at specific points on the brakes. The location of measurement was behind eachof the rivets that held the lining to the shoe.
By measuring the thickness just before and just after road trials, it was possible to calculatethe wear rate for each set-up. Two symptoms of poor compatibility, commonly experienced
15
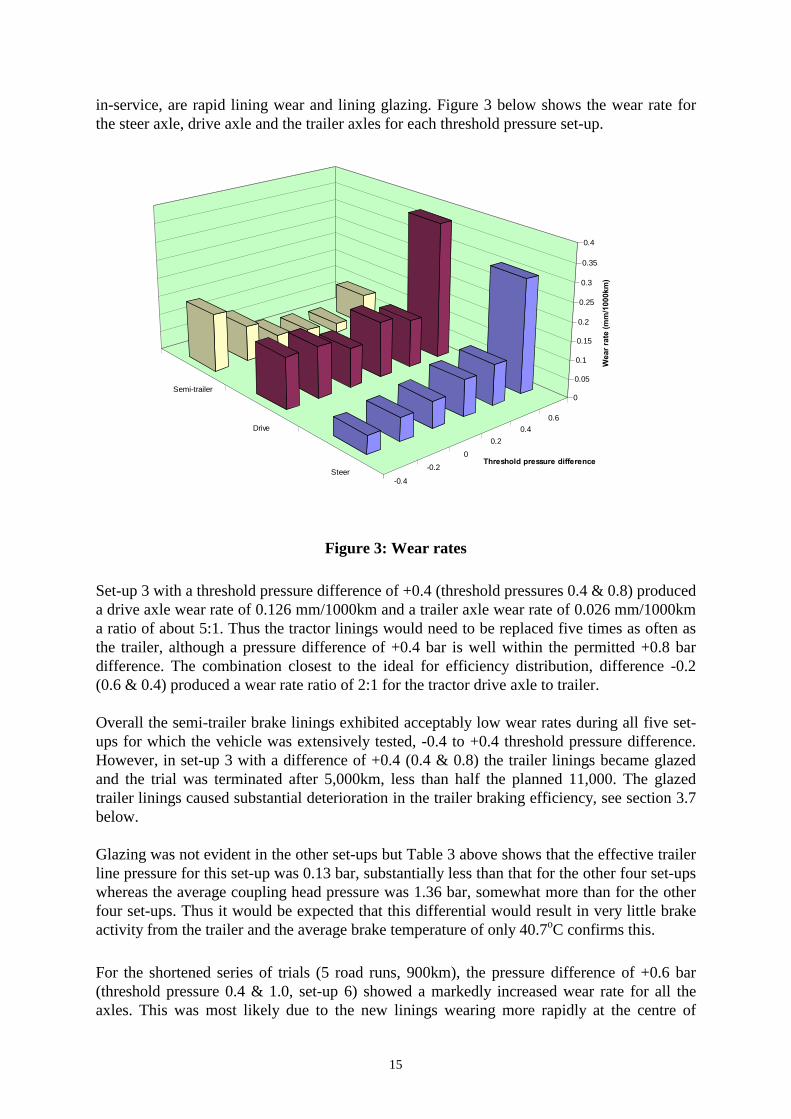
in-service, are rapid lining wear and lining glazing. Figure 3 below shows the wear rate forthe steer axle, drive axle and the trailer axles for each threshold pressure set-up.
-0.4
-0.20
0.20.4
0.6
Steer
Drive
Semi-trailer0
0.05
0.1
0.15
0.2
0.25
0.3
0.35
0.4
Wea
r rat
e (m
m/1
000k
m)
Threshold pressure difference
Figure 3: Wear rates
Set-up 3 with a threshold pressure difference of +0.4 (threshold pressures 0.4 & 0.8) produceda drive axle wear rate of 0.126 mm/1000km and a trailer axle wear rate of 0.026 mm/1000kma ratio of about 5:1. Thus the tractor linings would need to be replaced five times as often asthe trailer, although a pressure difference of +0.4 bar is well within the permitted +0.8 bardifference. The combination closest to the ideal for efficiency distribution, difference -0.2(0.6 & 0.4) produced a wear rate ratio of 2:1 for the tractor drive axle to trailer.
Overall the semi-trailer brake linings exhibited acceptably low wear rates during all five set-ups for which the vehicle was extensively tested, -0.4 to +0.4 threshold pressure difference.However, in set-up 3 with a difference of +0.4 (0.4 & 0.8) the trailer linings became glazedand the trial was terminated after 5,000km, less than half the planned 11,000. The glazedtrailer linings caused substantial deterioration in the trailer braking efficiency, see section 3.7below.
Glazing was not evident in the other set-ups but Table 3 above shows that the effective trailerline pressure for this set-up was 0.13 bar, substantially less than that for the other four set-upswhereas the average coupling head pressure was 1.36 bar, somewhat more than for the otherfour set-ups. Thus it would be expected that this differential would result in very little brakeactivity from the trailer and the average brake temperature of only 40.7oC confirms this.
For the shortened series of trials (5 road runs, 900km), the pressure difference of +0.6 bar(threshold pressure 0.4 & 1.0, set-up 6) showed a markedly increased wear rate for all theaxles. This was most likely due to the new linings wearing more rapidly at the centre of
16
pressure than at the brake lining extremities. However, it must be noted that the ratio of wearrate for the drive to semi-trailer axles is 4.4:1, which is very similar to that for a pressuredifference of +0.4bar.
3.6 FIFTH WHEEL FORCES
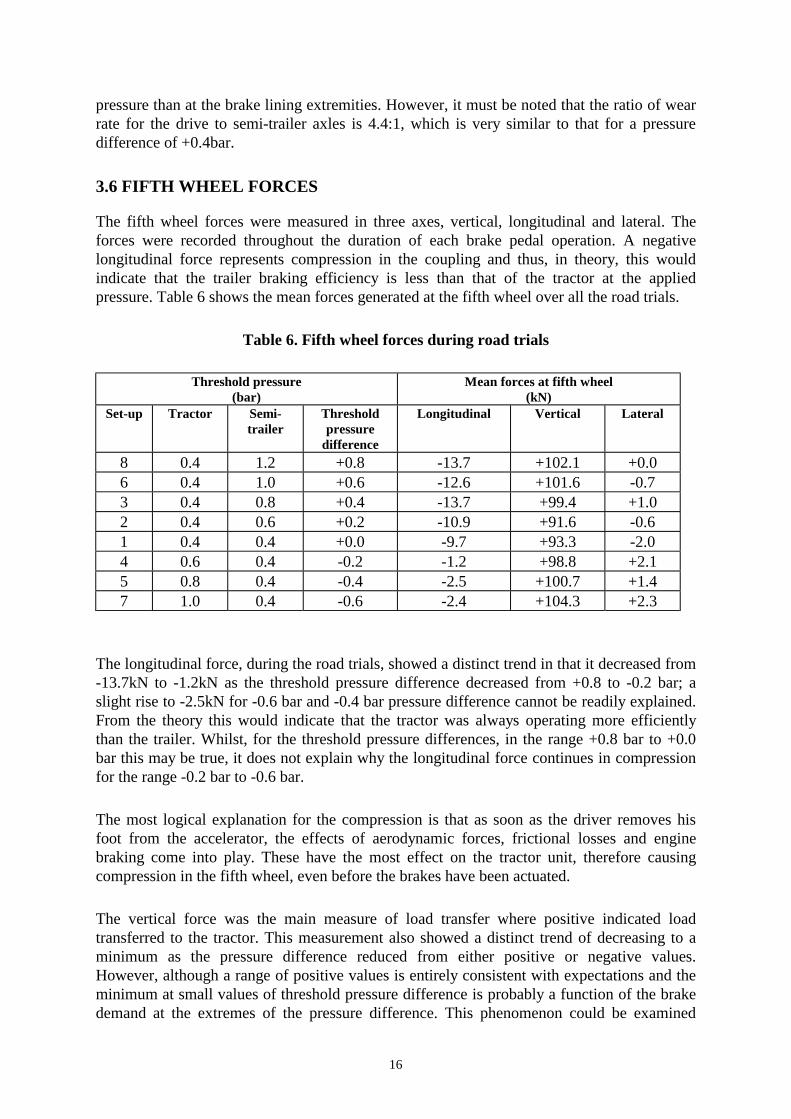
The fifth wheel forces were measured in three axes, vertical, longitudinal and lateral. Theforces were recorded throughout the duration of each brake pedal operation. A negativelongitudinal force represents compression in the coupling and thus, in theory, this wouldindicate that the trailer braking efficiency is less than that of the tractor at the appliedpressure. Table 6 shows the mean forces generated at the fifth wheel over all the road trials.
Table 6. Fifth wheel forces during road trials
Threshold pressure(bar)
Mean forces at fifth wheel(kN)
Set-up Tractor Semi-trailer
Thresholdpressure
difference
Longitudinal Vertical Lateral
8 0.4 1.2 +0.8 -13.7 +102.1 +0.06 0.4 1.0 +0.6 -12.6 +101.6 -0.73 0.4 0.8 +0.4 -13.7 +99.4 +1.02 0.4 0.6 +0.2 -10.9 +91.6 -0.61 0.4 0.4 +0.0 -9.7 +93.3 -2.04 0.6 0.4 -0.2 -1.2 +98.8 +2.15 0.8 0.4 -0.4 -2.5 +100.7 +1.47 1.0 0.4 -0.6 -2.4 +104.3 +2.3
The longitudinal force, during the road trials, showed a distinct trend in that it decreased from-13.7kN to -1.2kN as the threshold pressure difference decreased from +0.8 to -0.2 bar; aslight rise to -2.5kN for -0.6 bar and -0.4 bar pressure difference cannot be readily explained.From the theory this would indicate that the tractor was always operating more efficientlythan the trailer. Whilst, for the threshold pressure differences, in the range +0.8 bar to +0.0bar this may be true, it does not explain why the longitudinal force continues in compressionfor the range -0.2 bar to -0.6 bar.
The most logical explanation for the compression is that as soon as the driver removes hisfoot from the accelerator, the effects of aerodynamic forces, frictional losses and enginebraking come into play. These have the most effect on the tractor unit, therefore causingcompression in the fifth wheel, even before the brakes have been actuated.
The vertical force was the main measure of load transfer where positive indicated loadtransferred to the tractor. This measurement also showed a distinct trend of decreasing to aminimum as the pressure difference reduced from either positive or negative values.However, although a range of positive values is entirely consistent with expectations and theminimum at small values of threshold pressure difference is probably a function of the brakedemand at the extremes of the pressure difference. This phenomenon could be examined
17
more fully in a work programme for which the full range of braking conditions wascontrolled.
3.7 ROLLER BRAKE TESTS
Roller brake tests (RBT) were conducted at the beginning and end of each set-up. These wereconducted using the same pressures as for the snub tests, namely 1, 2, 3, 4.5 and 5 bar, usingthe preset device. The results obtained showed any deterioration in braking performance overthe trials. The graphs are presented in annexes (Annex A through to H) under the assignedset-up.
A limitation of the roller brake tester is that the wheels may lock under the higher pressureapplications and hence the available brake force could be higher than that measured. Thuslocking can produce a large disparity between the true brake force and that measured. For thisreason the lower pressure applications provided a better insight into the relative performancebetween tractor and trailer, and furthermore, represent where the majority of braking actuallyoccurs. The MFDD from the dynamic tests (snub tests) is presented in Table 7 forcomparison.
It can be seen that the 'after' performance of the tractor unit remained within three percent ofthe 'before' performance for all the set-ups. This may have been because the automatic slackadjusters in the brakes kept the performance relatively constant.
The 'after' performance of the semi-trailer tended to reduce by several percent, except for thetest involving the +0.0 threshold pressure difference, set-up 1, which increased substantially.This cannot be readily explained. The overall combination brake efficiency showed the sametrend and confirmed that, in general, the brakes deteriorated during the trials. Maximum brakeforce cannot be attained at a brake line pressure of 2.0 bar, nevertheless performance at thispressure is a good indicator of brake efficiency.
The MFDD also shows the change in performance, however, given the limits of space andtest equipment, the RBT remains the overall better measure of brake performance on the road.

Table 7. Vehicle braking efficiency - before and after road trials
Threshold pressures (bar)Towing vehicle
efficiency (rollerbrake output) at 2.0
bar (%)
Semi-trailerefficiency (roller
brake output) at 2.0bar (%)
Combinationefficiency (roller
brake output) at 2.0bar (%)
MFDD (g)at 2.0 bar
Set-up
Towingvehicle
Semi-trailer
Thresholdpressure
difference
Before After(diff)
Before After(diff)
Before After(diff)
Before After %change
8 0.4 1.2 +0.8* - - - - - - 0.138 0.126 -96 0.4 1.0 +0.6* - - - - - - 0.147 0.152 +33 0.4 0.8 +0.4 32 32 (0) 17 14 (-3) 23 21 (-2) 0.207 0.171 -172 0.4 0.6 +0.2 27 24 (-3) 22 18 (-4) 24 20 (-4) 0.190 0.166 -131 0.4 0.4 +0.0 29 27 (-2) 14 22 (8) 20 24 (4) 0.217 0.190 -124 0.6 0.4 -0.2 26 28 (2) 29 24 (-5) 28 25 (-3) 0.215 0.183 -155 0.8 0.4 -0.4 21 22 (1) 25 18 (-7) 23 20 (-3) 0.176 0.174 -17 1.0 0.4 -0.6* - - - - - - 0.181 0.194 +7
*Indicates a shorter series of road trials (900km).

18
19
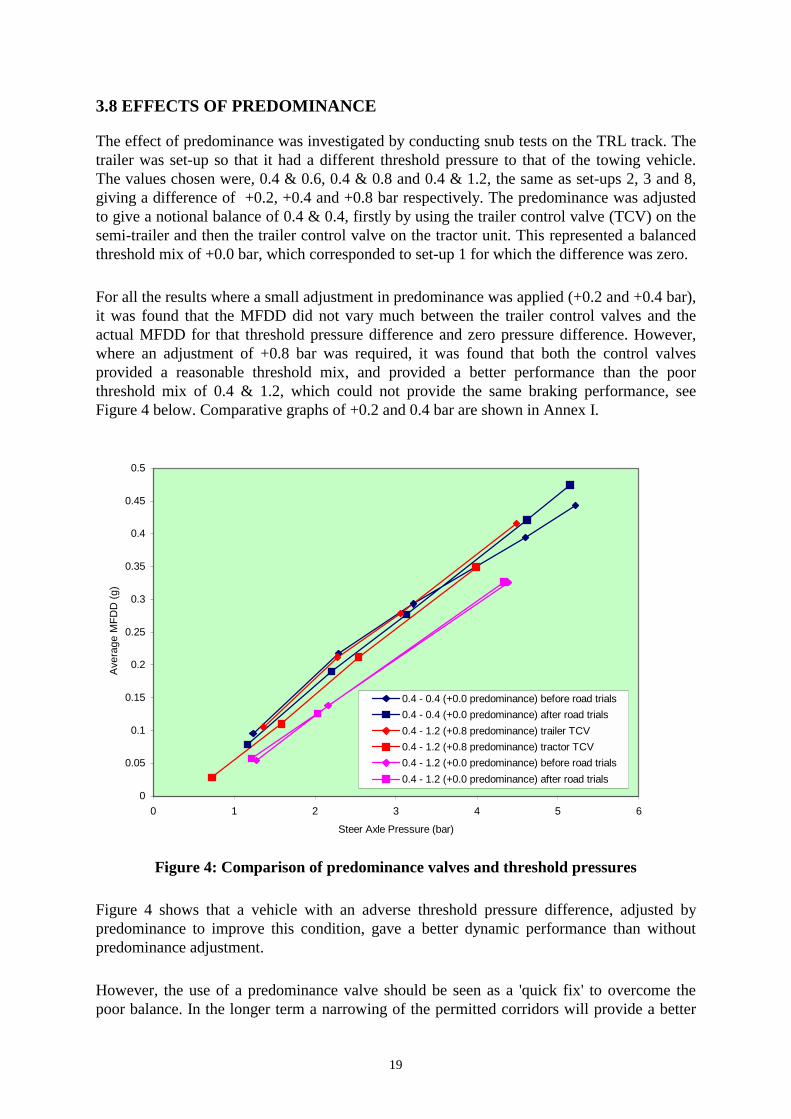
3.8 EFFECTS OF PREDOMINANCE
The effect of predominance was investigated by conducting snub tests on the TRL track. Thetrailer was set-up so that it had a different threshold pressure to that of the towing vehicle.The values chosen were, 0.4 & 0.6, 0.4 & 0.8 and 0.4 & 1.2, the same as set-ups 2, 3 and 8,giving a difference of +0.2, +0.4 and +0.8 bar respectively. The predominance was adjustedto give a notional balance of 0.4 & 0.4, firstly by using the trailer control valve (TCV) on thesemi-trailer and then the trailer control valve on the tractor unit. This represented a balancedthreshold mix of +0.0 bar, which corresponded to set-up 1 for which the difference was zero.
For all the results where a small adjustment in predominance was applied (+0.2 and +0.4 bar),it was found that the MFDD did not vary much between the trailer control valves and theactual MFDD for that threshold pressure difference and zero pressure difference. However,where an adjustment of +0.8 bar was required, it was found that both the control valvesprovided a reasonable threshold mix, and provided a better performance than the poorthreshold mix of 0.4 & 1.2, which could not provide the same braking performance, seeFigure 4 below. Comparative graphs of +0.2 and 0.4 bar are shown in Annex I.
Figure 4: Comparison of predominance valves and threshold pressures
Figure 4 shows that a vehicle with an adverse threshold pressure difference, adjusted bypredominance to improve this condition, gave a better dynamic performance than withoutpredominance adjustment.
However, the use of a predominance valve should be seen as a 'quick fix' to overcome thepoor balance. In the longer term a narrowing of the permitted corridors will provide a better
0
0.05
0.1
0.15
0.2
0.25
0.3
0.35
0.4
0.45
0.5
0 1 2 3 4 5 6
Steer Axle Pressure (bar)
Aver
age
MFD
D (g
)
0.4 - 0.4 (+0.0 predominance) before road trials0.4 - 0.4 (+0.0 predominance) after road trials0.4 - 1.2 (+0.8 predominance) trailer TCV0.4 - 1.2 (+0.8 predominance) tractor TCV0.4 - 1.2 (+0.0 predominance) before road trials0.4 - 1.2 (+0.0 predominance) after road trials

20
overall threshold balance between the tractor and trailer, which will reduce the need for apredominance valve. It should be remembered that the predominance valve is of little value ifthe tractor has a high threshold when compared with that of the trailer, for example if thebalance is 1.0 & 0.2 bar, as the predominance can only be adjusted to provide a positivedifference.
3.9 STABILITY TESTS
3.9.1 Purpose and Method
The purpose of the stability tests was twofold: first to investigate the stability of the vehicleover the range of threshold pressure differences permitted by Regulation 13 and second toinvestigate the forces generated at the fifth wheel during these tests. It is known that jack-knife and other types of instability still occur on the roads in the UK in spite of therequirement that all new vehicles manufactured after 1992 be fitted with anti-lock brakingsystems. It is believed that the wide range of threshold pressure difference permitted byRegulation 13 may be leading to instability under certain conditions and these tests weredesigned to investigate this possibility.
As vehicle braking systems become more sophisticated, it may be possible to detectimpending instability and adjust braking effort accordingly. A perfectly balanced brakingsystem will, theoretically, result in minimal longitudinal force at the fifth wheel and loadtransfer will induce a vertical force proportional to the deceleration of the vehicle. It is alsopossible that rotation of the tractor relative to the trailer, or vice versa, will induce a lateralforce that is proportional to factors that may indicate an impending jack-knife or trailer swing.Fifth wheel forces, longitudinal, vertical and lateral (turning) were thus measured andrecorded to examine how they varied under controlled conditions. This was intended to be abrief feasibility study as a prelude for a more detailed investigation.
Two surfaces were used for the tests, a high coefficient of friction fine textured rolled asphalt,which was tested whilst dry, and a low coefficient of friction mastic asphalt, which was testedwhen wet. The vehicle was tested at different threshold pressure combinations and brakedfrom different speeds at different applied pressures. The vehicle was also tested with thetractor brakes only and the trailer brakes only. Table 8 below gives the range of testconditions.
Table 8: Range of test conditions
Braking combinationSet-up Thresholdpressure
differenceCoefficient of
frictionFull combination Tractor only Trailer only
3 0.4 & 0.8 (+0.4) Low ! ! !Low ! ! !1 0.4 & 0.4 (0.0)High ! ! !
5 0.8 & 0.4 (-0.4) Low ! ! !

21
3.9.2 Results
An example of the output from the fifth wheel measuring device is given in Figure 5 below.This shows each of the forces against time for a test on the low coefficient surface when thevehicle was braked from 20km/h to rest at an applied pressure of 2 bar. As was expected theforces were transient during the test, particularly the longitudinal force at the onset of brakingand at the end of the stop when the vehicle "juddered". For the purposes of analysis, a meanforce was calculated by using the same principle as that for calculating the MFDD. That is, byusing the range of values between 80% and 10% of the initial velocity. For example, whenbraking from 20km/h to 0km/h, as in Figure 5, the range of values used to calculate the meanforces would be from 16km/h to 2km/h, thus eliminating the initial drop at the onset ofbraking and the judder at the end stop. This method was used to calculate all the mean forcesin the results given below.
Figure 5: Effect of braking on fifth wheel forces
The TRL vehicle is not fitted with anti-lock braking (ABS) and thus the potential exists forthe wheels to lock under excessive braking for differing surfaces. For the high coefficient offriction surface, no locking at the axles occurred. However, the results of the tests on the lowcoefficient surface produced a number of wheel locks, an example of which is shown in Table9. An observer stood on the edge of the track and recorded the order of wheel locking.Whenever the tractor unit was involved in the brake application, the steer axle would lockfirst as designed, see Table 9 overleaf, irrespective of the threshold pressure thus preventingjack-knife or trailer swing.
-40
-20
0
20
40
60
80
100
120
0 2 4 6 8 10 12 14
Time (sec)
Forc
e (k
N)
LongitudinalVerticalTurning

22
Table 9. Order of axle locking
Coupling Head pressureThresholdpressure
difference
Surfacecoefficient
Type ofvehiclebraking
Speed1 bar 2 bar 3 bar 4.5 bar
10 1 1 1, 2, 420 1 1, 4 1, 2, 430 1, 4 1, 4, 2
Fullcombination
40 1, 4, 210 1 1 1 1, 220 1 1 1,2
tractor
30 1 1, 210 No locks 4 4 420 No locks 4 4 3, 430 No locks 4 3, 4 all
0.4 & 0.8
(+0.4)
Low
trailer
40 No locks10 No locks 1 120 No locks 1 130 1 1 1, 2
Fullcombination
40 1 1, 210 No locks 1 120 No locks 1 1
tractor
30 No locks10 No locks No locks No locks20 No locks No locks Trailer30 No locks Trailer40 No locks Trailer
Low
trailer
50 Trailer10 to 70 No locks occurred over this range of speedsFull
combination 80 No locks No locks No locks10 to 70 No locks occurred over this range of speedstractor
80 No locks No locks No locks10 to 70 No locks occurred over this range of speeds
0.4 & 0.4
(0.0)
High
trailer80 No locks10 No locks 1 1 120 No locks 1, 4, 5 1 1, 4, 230 No locks 1, 4 1, 4, 2
Fullcombination
40 No locks 1, 4, 210 No locks 1 1 120 No locks 1 1 1, 2
tractor
30 1 1, 2 1, 2 1, 210 No locks No locks 4 420 No locks 4 4 4, 330 No locks 4 4, 3 all
0.8 & 0.4
(-0.4)
Low
Trailer
40 41 = steer axle, 2 =drive axle, 3 =front axle on trailer, 4 = middle axle on trailer, 5 = rear axleon trailer, all = all three axles on trailer, Trailer = trailer axle lock unknown order or number
= test not attempted for safety

23
Figure 6 shows the variation in fifth wheel longitudinal force (mean) for a range of brakingstops from different speeds at different application pressures for a threshold pressurecombination of 0.8 & 0.4 (set-up 5). All other graphs for the various combinations of brakeapplications are shown in Annex J. Also included for comparison are the series of graphswhen only the tractor and only the trailer brakes were used. A negative value indicates thatthe fifth wheel was in compression and a positive value shows that the fifth wheel was intension.
As can be seen, for the braking applications at a given pressure, the trend is toward a commonpoint on the graph as the speed increases. This occurred because the coefficient of friction,between the tyre and the wet road surface, reduces as the speed increases (Robinson, 1997)and thus the available brake force and hence the longitudinal force decreased in these tests.The stability tests were conducted at a range of velocities (10, 20, 30 and 40km/h). During thetests at 10km/h, the available grip between the tyre and road was significantly greater thanduring the tests at 30 and 40km/h. Therefore, the compressive load in the fifth wheel was alsogreater during the tests at lower velocities for combination and tractor only braking. Thelongitudinal and vertical forces tended towards a minimum value as the velocity increased.This was indicative of the limiting condition, which were when the wheels locked on the wetsurface. Maximum adhesion, and hence maximum brake effort occurs just before a wheellocks and this reduces during wheel locking at which point an increase in brake pressureceases to give an increase in brake effort.
Figure 6: Straight line braking on low coefficient of friction surface (longitudinal)
It can be seen that at 1 bar the brake effort, and hence the longitudinal force, remained nearlyconstant for all conditions. An increase in brake application pressure provided a greatermagnitude of longitudinal force at lower speeds where little or no wheel locking occurred.When more wheel locking occurred the longitudinal force dropped considerably. Forexample, on the full combination at 4.5 bar application pressure, only the steer axle lockedand produced a longitudinal force of -36.3kN at 10km/h, but produced a force of -20.5kN at20km/h when 3 axles locked. This difference (16.2kN) is substantial and could indicate whena mis-match in tractor and trailer braking is occurring. Furthermore, the overall trend was forthe magnitude of the longitudinal force generated at the fifth wheel to be greatest when only
Longitudinal forces
-50
-40
-30
-20
-10
0
10
20
0 10 20 30 40 50
speed (kph)
Forc
e (k
N)
Full 1 barFull 2 barFull 3 barFull 4.5 barTrailer 1 barTrailer 2 barTrailer 3 barTrailer 4.5 barTractor 1 barTractor 2 barTractor 3 barTractor 4.5 bar

24
the tractor or only the trailer brakes were used. Moreover, the force was compressive whenonly the tractor was braked and tensile when only the trailer was braked. These findingsagree with theory and give confidence that the measurements may potentially be used asindicators of brake balance.
With regard to the vertical forces, shown in Figure 7, this is a good indication of the loadtransfer from the trailer to the tractor. It was found that the forces generated at 1 and 2 barbrake pressure were similar for both full combination and trailer only braking. However, at 3bar and above it was found that although the trends were similar, there was more of adisparity in the results, and at 30km/h the vertical force was less than that for a 2 bar brakepressure. The tractor unit was different in that the vertical force remained close to 2 kNregardless of speed or brake pressure.
Figure 7: Straight line braking on low coefficient of friction surface (vertical)
The lateral force provided a greater scatter but the maximum force exerted was 11kN, seeAnnex J4. Potentially this is the best indicator of instability, however, the onset of jack-knifeor trailer swing were not reached because of safety implications. Furthermore, it is morelikely that these results will differ from those reported when the vehicle is braking on a bendrather than in a straight line. It is recommended that such events could be investigated usingfull safety precautions as part of a more extensive research program.
It would be advisable to take smaller increments of brake line pressure, possibly as low as 0.2bar, whilst also varying the threshold pressures between tractor and trailer, and conductingtests on a varying radius curve as well as straight line braking.
3.10 TYPE APPROVAL
The type approval tests were conducted at the Vehicle Certification Agency - Vehicle TypeApproval Centre (VTAC) as described in section 2.6.5. Threshold pressures of 0.4 bar and0.8 bar were used, with the line pressure increasing with increments of 0.5 bar until 2.0 bar,and, thereafter in 1 bar increments up to a maximum of 7 bar. Tests were concluded when themaximum pedal force of 700N was achieved or when wheel lock occurred.
Vertical forces
0
2
4
6
8
10
12
14
16
18
0 10 20 30 40 50speed (kph)
Forc
e (k
N)
Full 1 barFull 2 barFull 3 barFull 4.5 barTrailer 1 barTrailer 2 barTrailer 3 barTrailer 4.5 barTractor 1 barTractor 2 barTractor 3 barTractor 4.5 bar

25
The type approval requirements, which must be met, are set out in Annex 10 of Regulation13. Results should be presented in accordance with Diagram 3 and Diagram 4A, as shown inAnnex 10 of Regulation 13. Diagram 3 refers to tractor units for semi-trailers in the laden andunladen condition, as shown in Figure 8 below. The results must fall within the definedcorridors, and a further consideration is that to pass type approval the tractor unit must becapable of achieving a deceleration of 5m/s2, within the prescribed stopping distance.
The stopping distance is calculated from the equation: -
S ≤ 0.15V + (V2 ÷ 130)
Where S = stopping distance (m)V = initial velocity (km/h)
Thus for a starting velocity of 60km/h the maximum permitted stopping distance is 36.69metres.
Figure 8: Diagram 3, Tractors for semi-trailers, from Regulation 13, Annex 10
The results from VTAC are provided in Annex K of this report. The results for the tractorunit, when laden with a load frame and set with a threshold pressure of 0.4 bar, showed thatthe unit was comfortably within the corridors for coupling head pressures of up to 3 bar.However, at the higher pressures the unit began to approach the lower limit of the corridor.Setting the tractor unit to a threshold pressure of 0.8 bar gave similar results, but a smallnumber of runs fell just outside the lower limit of the corridors. As the normal operating
0
0.1
0.2
0.3
0.4
0.5
0.6
0.7
0.8
0 1 2 3 4 5 6 7 8
Pm (bar)
TM/P
M
R13 Pm (bar) upper LadenR13 Pm (bar) lower LadenR13 Pm (bar) upper UnladenR13 Pm (bar) lower Unladen
0.2 4.5 6.5 7.5
0.35
0.575

26
threshold pressure was 0.4 and the vehicle would have originally been set up to pass typeapproval with this threshold it is not surprising that a few results from the 0.8 bar tests wereoutside of the corridor. It must be noted, however, that for both 0.4 bar and 0.8 bar thresholdthe vehicle achieved both the stopping distance, and the 5m/s2 deceleration within thecorridor necessary to pass type approval.
Further tests for the tractor unit were conducted unladen with threshold pressures of 0.4 and0.8 bar. The vehicle easily passed the type approval, for both threshold pressures, althoughthe results for the 0.4 bar threshold came close to the upper limit of the corridor.
Diagram 4A of Regulation 13, Annex 10, shows the graphs for semi-trailers, see figure 9below. It should be noted that the corridors are modified to take account of variousparameters as described below. The mass of the semi-trailer and centre of gravity height areused to generate values for the correction factors of Kc (laden) and Kv (unladen), which arethen used to multiply the values defining the compatibility corridor. There are two separatecorridors one for the laden condition and one for the unladen condition, which rotate eithertoward or away from the y axis depending upon the values of Kc and Kv.
Figure 9: Diagram 4A, Semi-trailers, from Regulation 13, Annex 10
Type approval requirements for the semi-trailers are different to those for the tractor units. Inthis case the laden and unladen semi-trailer has to pass the criteria of a minimum of 4.5m/s2
deceleration at a maximum service line pressure of 6.5 bar.
For the semi-trailer tests, the semi-trailer was coupled to VTAC's dedicated tractor unit. In thetests for the laden condition the load met the same configuration as for the road trials.
0
0.1
0.2
0.3
0.4
0.5
0.6
0.7
0.8
0 1 2 3 4 5 6 7 8
Pm (bar)
TR/P
R
R13 Pm (bar) upperR13 Pm (bar) lower
0.2 4.5 7.5
0.29
0.41
0.45
0.65

27
Although the semi-trailer was coupled to a tractor unit, only the brakes on the trailer wereengaged which meant that the trailer was braking the combined vehicle mass. In Annex 4 ofR.13, there is a corrective equation, which takes account of the mass of the tractor unit.
(zR+M - R)(PM + PR)zR = --------------------------- + R
PM
Where R = rolling resistance, value = 0.01zR = braking rate of trailerzR+M = braking rate of the towing vehicle plus the trailerPR = total normal static reaction between road surface and wheels of trailerPM = total normal static reaction between road surface and wheels of towing
vehicle
When the corrective equation had been applied the results for the laden semi-trailer showedthat, for a natural threshold pressure of 0.4 bar, the results fell within the corridor, see figure10 below. However, as for the tractor unit, when the threshold pressure was increased to 0.8bar, there were a small number of runs that fell below the lower limit of the corridor. Themost likely explanation for this is that the trailer was designed to have a threshold of 0.4 butsetting the threshold pressure to a higher value, in this case by the use of return springs,decreased the braking rate slightly.
Figure 10: Dynamic test result and theoretical result for laden semi-trailers
After calculating the value of Kv, the unladen correction factor, it was found that the corridorsincreased in gradient significantly. Following normal type approval practice, the theoreticalbraking rate was calculated for the unladen semi-trailer, see figure 11, and this fell within thespecified corridor. However, the braking rates, zR, for the dynamic test results were outsidethe lower limit of the compatibility corridor.
0
0.1
0.2
0.3
0.4
0.5
0.6
0.7
0.8
0 1 2 3 4 5 6 7 8
Coupling head Pm (bar)
TR/P
R
R13 Pm (bar) upperR13 Pm (bar) lowerTrailer laden 0.4Trailer laden 0.8theoretical braking rate
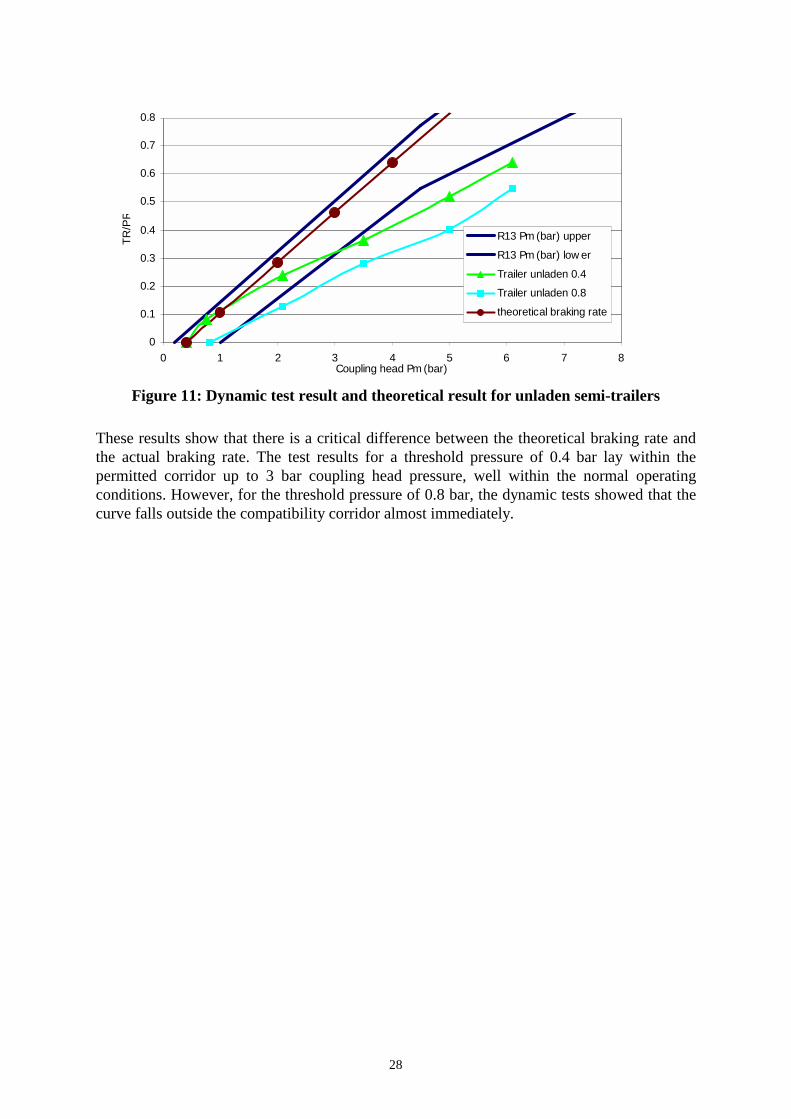
28
Figure 11: Dynamic test result and theoretical result for unladen semi-trailers
These results show that there is a critical difference between the theoretical braking rate andthe actual braking rate. The test results for a threshold pressure of 0.4 bar lay within thepermitted corridor up to 3 bar coupling head pressure, well within the normal operatingconditions. However, for the threshold pressure of 0.8 bar, the dynamic tests showed that thecurve falls outside the compatibility corridor almost immediately.
0
0.1
0.2
0.3
0.4
0.5
0.6
0.7
0.8
0 1 2 3 4 5 6 7 8Coupling head Pm (bar)
TR/P
R
R13 Pm (bar) upper
R13 Pm (bar) low er
Trailer unladen 0.4
Trailer unladen 0.8
theoretical braking rate

29
4. DISCUSSION
The discussion is based upon results from the research that show a need for a change in theway the compatibility corridors are formulated. An investigation into the compatibilitybetween tractor units and semi-trailers has been conducted by an extensive programme ofroad, track and roller brake test work. During the test work, threshold pressure difference(trailer threshold pressure minus tractor threshold pressure) was varied between -0.6 bar up to+0.8 bar, which is the maximum permitted difference allowed by R13, and the performanceof the braking system was analysed.
4.1 REVIEW OF OTHER STANDARDS / CODES OF PRACTICE
A number of other 'standards' exist which prescribe differing practices. The Institute of RoadTransport Engineers IRTE code of practice recommends a difference of between 0.6 and 0.9bar threshold for both tractors and semi-trailers (IRTE, 1994). The Swedish code of practicerecommends a threshold pressure range of 0.5 to 0.7, a maximum permitted difference of 0.2bar (Robinson, 1994). From the same report the New Zealand code of practice suggests aneven smaller difference of 0.125 for each vehicle but 0.25 overall. The tractor should be keptin the range 0.675 to 0.8 bar and the semi-trailer in the range 0.55 to 0.675 bar. There is noinformation regarding the effectiveness of this code of practice, but there are obviousreservations of having the trailer brake before the tractor unit, due to the danger of trailerswing. However, it is unclear whether the practice is intended to have a lower thresholdpressure for the semi-trailer to take into account pressure losses across any of the valves.
4.2 WEAR RATE
The results of the road trials have shown that the vast majority of brake applications werecheck braking with a coupling head pressure less than 2 bar. This is consistent with previouswork (Robinson, 1997) and other work. The wear rate of the brake lining was recorded (seesection 3.5) and compared for the range of threshold pressure differences. Figure 3 shows thatas the threshold pressure difference approaches zero, the wear rate reaches an optimum overall axles. The acceptable range for wear rate was -0.2 to +0.2 bar threshold pressuredifference.
4.3 WORK DONE
The appropriate range for the work done is represented by the values that are the closest to theload distribution, based upon static considerations. Based on the road trials, it was found thatthe threshold pressure difference, which achieved this (see section 3.4.2), was -0.2 bar. Zerobar threshold pressure difference showed slightly more work done on the tractor unit withreference to static considerations. However, when the threshold pressure difference was +0.2bar or greater, the work done by the tractor unit was found to be unacceptably high. Theacceptable range for work done was -0.2 to 0.0 bar threshold pressure difference.
4.4 STABILITY AND FIFTH WHEEL FORCE
Results of the stability tests (section 3.9) show the order of wheel lock (table 9), and that at athreshold pressure difference of +0.4 bar, there were wheel locks at a coupling head pressure

30
as low as 1 bar. However, with a threshold pressure difference of -0.4 and 0.0 bar the vehiclewas stable and the wheels did not lock under check braking (<2 bar) conditions. Therefore,the recommended threshold pressure difference range for the check braking would be from -0.4 to 0.0 bar.
Analysis of the results from the stability tests showed that for an increase in coupling headpressure there was a corresponding increase in the longitudinal force at the fifth wheel whenbraking in a straight line (Annex J5 to J8). During emergency braking, particularly on a bend,the compressive load at the fifth wheel will have a vector component lateral to the tractorwhich may cause a jack-knife under certain circumstances. A jack-knife can be virtuallyinstantaneous giving the driver no warning and is an ever present potential hazard with anarticulated vehicle.
During the road trials the mean vertical and longitudinal forces were calculated (table 6). Therange of threshold pressures that gave a minimum, but compressive, longitudinal force, thusproviding efficient brake distribution and good vehicle stability, was -0.6 to +0.2 bar.
4.5 EFFECT OF COMPATIBILITY CORRIDORS DURING EMERGENCYBRAKING
Vehicle stability is an important issue as described above. Narrowing of the compatibilitycorridors to a coupling head pressure of, for example, 2 bar would ensure better compatibilityin the check braking area, and improve the wear rate. The question of tractor and semi-trailercompatibility at emergency braking, that is higher than 2 bar pressure at the coupling head, isa separate consideration.
Figure 12: Unladen compatibility corridors for the TRL tractor unitand the TRL semi-trailer
Overlaying the compatibility corridors for the tested vehicles shows that they correlate well.In fact, for the lower boundary of the semi-trailer to match the lower boundary of the laden
0
0.1
0.2
0.3
0.4
0.5
0.6
0.7
0.8
0 1 2 3 4 5 6 7 8
Coupling head Pm (bar)
TM/P
M ,
TR/P
R
Tractive units R13 Pm (bar) upper Unladen
Tractive units R13 Pm (bar) lower Unladen
Semi-trailers R13 Pm (bar) upper
Semi-trailers R13 Pm (bar) lower
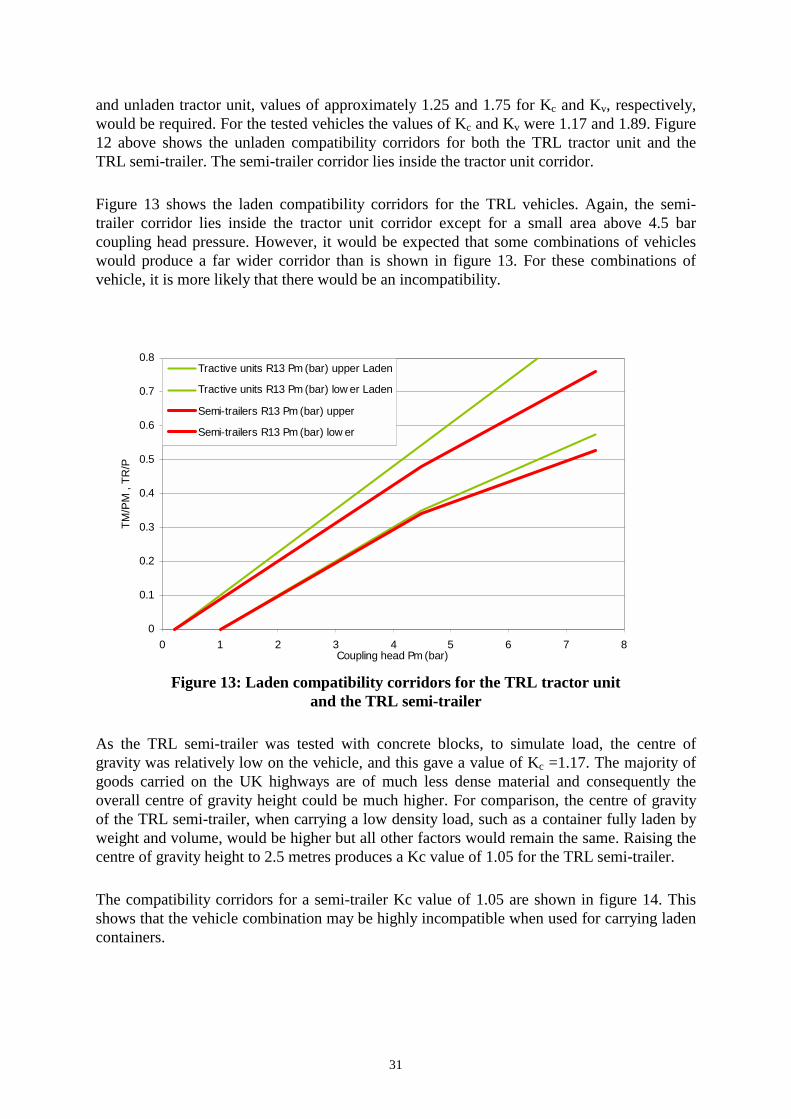
31
and unladen tractor unit, values of approximately 1.25 and 1.75 for Kc and Kv, respectively,would be required. For the tested vehicles the values of Kc and Kv were 1.17 and 1.89. Figure12 above shows the unladen compatibility corridors for both the TRL tractor unit and theTRL semi-trailer. The semi-trailer corridor lies inside the tractor unit corridor.
Figure 13 shows the laden compatibility corridors for the TRL vehicles. Again, the semi-trailer corridor lies inside the tractor unit corridor except for a small area above 4.5 barcoupling head pressure. However, it would be expected that some combinations of vehicleswould produce a far wider corridor than is shown in figure 13. For these combinations ofvehicle, it is more likely that there would be an incompatibility.
Figure 13: Laden compatibility corridors for the TRL tractor unitand the TRL semi-trailer
As the TRL semi-trailer was tested with concrete blocks, to simulate load, the centre ofgravity was relatively low on the vehicle, and this gave a value of Kc =1.17. The majority ofgoods carried on the UK highways are of much less dense material and consequently theoverall centre of gravity height could be much higher. For comparison, the centre of gravityof the TRL semi-trailer, when carrying a low density load, such as a container fully laden byweight and volume, would be higher but all other factors would remain the same. Raising thecentre of gravity height to 2.5 metres produces a Kc value of 1.05 for the TRL semi-trailer.
The compatibility corridors for a semi-trailer Kc value of 1.05 are shown in figure 14. Thisshows that the vehicle combination may be highly incompatible when used for carrying ladencontainers.
0
0.1
0.2
0.3
0.4
0.5
0.6
0.7
0.8
0 1 2 3 4 5 6 7 8Coupling head Pm (bar)
TM/P
M ,
TR/P
R
Tractive units R13 Pm (bar) upper Laden
Tractive units R13 Pm (bar) low er Laden
Semi-trailers R13 Pm (bar) upper
Semi-trailers R13 Pm (bar) low er

32
TRL believes that narrowing the whole length of the corridor is the most progressive solution.For vehicles with corridors that diverge at the higher pressure ranges then the braking systemcould be inefficient under emergency braking. For example, when one vehicle operated at thelower end of the corridor, and the other vehicle operated at the high end of its corridor, seefigure 14. In this example, at a coupling head pressure of 3 bar, the semi-trailer has the lowerbraking rate, z=0.174, and the tractor has a high braking rate, z=0.356, indicating a brakeforce of more than double that of the semi-trailer, which, even allowing for load transfer,would result in an under-braked semi-trailer.
Figure 14: Laden compatibility corridors with potential incompatibility
With this tractor-trailer combination it is possible that on some road surfaces the wheels ofthe tractor unit will lock well before those of the semi-trailer leading to instability. Althoughthe vehicle ABS may compensate in part for this imbalance, a TRL database has shown thatfailures of the ABS system have contributed to fatal and serious injury accidents. Therefore, itis essential that semi-trailer and tractor are compatible at high coupling head pressures toensure instability is avoided. This could be achieved by keeping the threshold pressuredifference to ±0.4 bar and/or specifying that the values of Kc and Kv, during type approvaltests, should be approximately 1.25 and 1.75, respectively, with a tolerance to be determined.
4.6 ABS BENEFITS
For a number of years, the Transport Research Laboratory (TRL) has been conductingresearch into accidents that have involved Heavy Goods Vehicles (HGVs). Much of this workfocuses on fatal accident data with the aim of assessing design changes in terms of costbenefit. This has proved useful in identifying cost-effective design improvements that mayreduce the injury toll on British roads.
0.356
0.174
0
0.1
0.2
0.3
0.4
0.5
0.6
0.7
0.8
0 1 2 3 4 5 6 7 8Coupling head Pm (bar)
TR/P
R
Tractive units R13 Pm (bar) upperLadenTractive units R13 Pm (bar) low erLadenSemi-trailers R13 Pm (bar) upper
Semi-trailers R13 Pm (bar) low er
Note: Kc = 1.05

33
A specific database stores information on fatal HGV accidents which occurred during theperiod 1994 to 1996, and approximately half of the fatal accidents involving an HGV in theUK are recorded in this database. Investigation into this database revealed that there were twocases of trailer swing causing a fatality. One where only the tractor was fitted with ABS, andthe second where the trailer ABS failed to function. ABS may have helped to reduceaccidents, however, in the event of a failure, stability of the combination must be retained,and this may be best achieved with balanced braking that, in turn, can be guaranteed onlywith changes to the existing compatibility corridors.
4.7 PREDOMINANCE
It was found that adjustment to the predominance valve could, to some extent, compensate fora threshold pressure difference arising when the semi-trailer threshold pressure was somewhatgreater than that for the tractor. However, experimental tests have shown that if one of thetwo tractor brake circuits were to fail, then predominance becomes zero and the brake systemreturns to a state of imbalance. In such circumstances a semi-trailer will be under-braked andthe potential for jack-knife greatly increased. In addition tractor lining wear rate wouldincrease and the trailer brakes may become glazed.
4.8 TYPE APPROVAL
The tests at VTAC (the type approval authority) have shown that it is possible for a vehicle topass type approval but still fall outside the acceptable performance, particularly at a couplinghead pressure of 4.5 bar, which is at the 'elbow' of the corridor; as was found with the ladentractor unit, with the threshold pressure set to 0.8 bar. It is essential that the vehicleperformance should not fall outside the corridor at any coupling head pressure. This could beachieved by measuring the brake efficiency over a range of coupling head pressures. It is alsoessential that the methods used to approve a given vehicle should be representative of howthat type of vehicle will be loaded in practice.
4.9 SUMMARY OF DISCUSSION
The discussion has identified findings upon which recommendations may be based. Inparticular there is evidence that the compatibility corridors need to be rationalised so that, fora given condition, laden or unladen, the tractor and trailer corridors are coincident or verynearly so. However, the corridors are generated on the basis of threshold pressure, x axisintercepts, and the gradient. The threshold pressure difference, tractor to semi-trailer, affectsthe performance of the vehicle in the check braking range, typically 0 bar to 2 bar and thusaffects the lining wear rate and the ease with which the vehicle can be driven. The results forthe road trials show that a vehicle with balanced brakes tends to achieve a lower averagedeceleration than one with considerable out of balance. In addition it was shown that on a lowcoefficient surface, wheel locking occurred at 1 bar and thus, in adverse road conditions, iceand snow for example, stability can be affected within the range 0 bar to 2 bar. It should alsobe noted that when motorway surfaces become worn the coefficient can fall to values as lowas 0.2 at high speed (Roe et al, 1998).
Applied coupling head pressures of greater than 2 bar tend to indicate an emergency and thewidth of the corridor above this pressure is, therefore, related to safety for which stability is

34
the main concern. Table 10 below indicates the threshold pressure difference, x axisintercepts, and the compatibility corridor range above 2.0 bar that are recommended from theresults of this research.
Based upon safety under normal road conditions, the compatibility range above 2 bar shouldbe limited to a difference of ±0.4 bar. When, the lining wear rate, work done and stability inadverse conditions are taken into account then the threshold pressure difference should belimited to -0.2 bar to +0.2 bar and remain no greater than this up to 2.0 bar. These conclusionsare the basis of the recommendations for changes to the permitted compatibility corridors thatare discussed in section 5 below.
Table 10: Recommendation based on technical results and analysis
Range of thresholdpressure difference
(≤ 2 bar)
Emergency brakingcompatibility range
(>2 bar)Wear rate -0.2 to +0.2 bar
Work Done -0.2 to 0.0 bar
Stability -0.4 to 0.0 bar -0.4 to +0.4 bar
5th Wheel forces -0.6 to +0.2 bar -0.4 to +0.4 bar
Recommendation -0.2 to +0.2 bar -0.4 to +0.4 bar
35
5. CONCLUSIONS
1. A tractor unit with manufacturer supplied asbestos free linings and a semi-trailer withRegulation 13 Type III linings were evaluated to determine the effect of varying thresholdpressure within the range currently permitted by Regulation 13.
2. During the road trials, the coupling head pressure, for 95% of brake applications, was1.72 bar for a threshold pressure difference of +0.8 and 1.24 bar for a threshold pressuredifference of zero. The average coupling head pressure ranged from 1.19 bar at +0.8difference to 0.79 bar at zero difference. This was comparable with previous research atTRL (Robinson, 1997) during which 95% of applications were made at less than 1.8 barand the corresponding average pressures were slightly greater. These results were alsoconsistent with other research (Fura, 1993) and confirm that the chosen test routeprovided typical brake usage.
3. It was found that the linings on the semi-trailer glazed when the threshold pressures wereset to 0.4 & 0.8 bar, difference +0.4 bar, and the trailer brake efficiency deteriorated tobelow that permitted by the UK after only some 5,000km of the planned 11,000km weretravelled. It should be noted that the pressure difference of +0.4 bar was well within thepermitted range of ±0.8 bar.
4. By measuring brake temperature, it was possible to calculate the work done by each axleand hence calculate the distribution of brake force. The static axle load distribution was15%, 25% and 20% for the steer axle, drive axle and each semi-trailer axle respectivelyand thus the ideal brake force distribution would correspond to this distribution. It wasfound that threshold pressures of 0.6 & 0.4 (difference -0.2 bar) gave the closest to idealefficiency distribution (10.5%, 23.1% and 22.1%). As the difference in threshold pressureincreased, the brake distribution was found to deviate from this closest to idealperformance. The extreme work done distributions were, 44.3%, 42.9% and 4.3% fordifference +0.6 bar, and 3.0%, 11.8% and 28.4% for difference -0.6 bar.
5. The wear rate of the brake lining was found to provide a good indication of thecompatibility of the vehicle combination. It was found that a poor tractor-trailer wear ratioof 5:1 was achieved with a threshold pressure difference of +0.4 (threshold pressures 0.4& 0.8) which was the worst wear rate ratio. The tractor linings would need to be replacedfive times as often as the trailer, despite the set-up being well within the permitted 0.8 bardifference. The combination closest to the ideal efficiency distribution, difference -0.2(0.6 & 0.4) produced a wear rate ratio of only 2:1 for the tractor drive axle to trailer.
6. Regulation 13 Type III brake linings have shown an improvement over Type II in terms ofwear rate and glazing. Nevertheless, the research has shown that threshold differences of0.4 bar or more will start to produce glazing and vehicle brake performance degradation,even with Regulation 13 Type III linings. Therefore, keeping the threshold pressuredifference within the range of ±0.4 bar would improve lining wear, vehicle brakingperformance and vehicle stability.
36
7. When the predominance valve was used to adjust the threshold pressure to give a notionalbalanced braking system the braking performance was substantially superior to that of apoor threshold mix with no predominance. In the worst case, where an adjustment of +0.8bar predominance was required, it was found that both the control valves provided areasonable threshold mix, and provided a better dynamic braking performance than theunmodified poor threshold mix of 0.4 & 1.2 without predominance. It should be notedthat failure of one of the two tractor brake circuits will cause the predominance to returnto zero, when adjusted using the tractor sited relay valve.
8. The instrumented fifth wheel gave a measurement of the forces acting during braking. Thecoefficient of friction between the tyre and the wet road surface significantly decreases asthe velocity increases. The stability tests were conducted at a range of velocities (10, 20,30 and 40km/h). During the tests at 10km/h, the available grip between the tyre and roadwas significantly greater than during the tests at 30 and 40km/h. Therefore, thecompressive load in the fifth wheel was also greater during the tests at lower velocities forcombination and tractor only braking. The longitudinal and vertical forces tended towardsa minimum value as the velocity increased. This was indicative of the limiting condition,which was when the wheels locked on the wet surface. Since jack-knife and trailer swingdid not occur, the lateral forces did not show an overall trend.
9. For type approval tests, the braking performance of the tractor unit conformed to the typeapproval compatibility corridor over the range of coupling head pressures that were used.The semi-trailer met the type approval requirements when laden. However, when the testswere repeated with the semi-trailer unladen, the brake performance did not conform to thecompatibility corridor. The brake efficiency was found to be lower than the requiredtheoretical braking rate, thus under braking on the semi-trailer would be the result.
10. The current compatibility corridors, as indicated in Regulation 13, Annex 10, need to benarrowed to improve lining wear rate, as well as to prevent brake lining glazing, and thusto improve the safety of HGV articulated vehicles.

37
6. RECOMMENDATIONS
1. Small changes in the threshold pressure, and particularly between the tractor and trailer,can have serious consequences. Therefore, it is recommended that the compatibilitycorridors for type approval should be narrowed. Ideally, from this research, to a differenceof ±0.2 bar for coupling head pressures below 2 bar and to ±0.4 bar above a coupling headpressure of 2 bar. Figure 15, below, sets out the "ideal" corridors (based upon thisresearch) for the laden and unladen tractor unit.
Figure 15: "Ideal" compatibility corridors for tractor units
2. It is recognised that meeting the criteria set by the "ideal" compatibility corridors, asshown in figure 15, may be difficult. Readily achievable compatibility corridors, that offersome improvement and which are based upon the current corridors set out in Regulation13 Annex 10, have been generated, and are given below in figures 16 and 17. Thecompatibility corridors have been narrowed at the check braking range to improve thewear rate of the brake linings and to prevent glazing of the linings, and also narrowed upto 4.5 bar coupling head pressure to improve vehicle stability. The lower boundary of thecorridor beyond 4.5 bar has remained unchanged. However, it should be noted that thesecorridors will not bring about the improvements to the same extent as those given infigure 15 above.
For the tractor unit, the unladen corridor, shown in figure 16 below, has been calculatedby moving the x axis intercept, for the upper boundary, from 0.2 bar to 0.4 bar. Thegradient has altered slightly because a brake efficiency of 0.8 at 4.5 bar coupling headpressure has remained the same. This has ensured that there will be no perceived loss inbrake efficiency, because this rate can be achieved by current vehicle designs. The lowerboundary has been moved from an intercept, on the x axis, of 1.0 bar coupling headpressure to 0.6 bar. The gradient for the first part of the lower boundary (between 0.6 bar
0
0.1
0.2
0.3
0.4
0.5
0.6
0.7
0.8
0 1 2 3 4 5 6 7 8Pm (bar)
Laden "Ideal" Pm (bar)upperLaden "Ideal" Pm (bar)lowerUnladen "Ideal" Pm (bar)upperUnladen "Ideal" Pm (bar)lower
2.2
0.4 6.50.6
0.18
0.27
4.9 6.9
4.5

38
and 4.5 bar) has changed, but the second part (above 4.5 bar) has remained the same. Thisis due to using the current R13 co-ordinate (4.5 , 0.575) which will mean a comprehensivenarrowing of the corridors at coupling head pressures below 4.5 bar. The overallnarrowing of the compatibility corridor has altered the pressure difference at 2 bar and 4.5bar coupling head pressures. Based upon the lower boundary and moving horizontally, thedifference is 0.68 bar and 1.54 bar respectively. The current Annex 10 of Regulation 13permits 1.03 bar and 1.66 bar for coupling head pressures of 2 and 4.5 bar.
The laden tractor unit corridors were calculated in the same manner as those for theunladen. Regulation 13 allows a pressure difference of 1 bar and 1.5 bar for coupling headpressures of 2 bar and 4.5 bar. The recommended corridors have a pressure difference of0.64 and 1.43 for coupling head pressures of 2 and 4.5 bar.
The recommended corridors are shown in figure 16 below.
Figure 16: Recommended compatibility corridor for tractor units
The recommended corridors for the semi-trailer were also calculated in the same manner.For the boundary before the elbow the gradients were changed, whereas the gradients afterthe elbow (after 4.5 bar coupling head pressure) were kept the same as in Regulation 13.The upper boundary was moved from an intercept, on the x axis, of 0.2 bar to a newintercept 0.4 bar. The lower boundary was moved to 0.6 bar. In an unmodified state,where Kc =1.00, the pressure difference for 2 bar coupling head pressure is 0.56 bar,whereas in Regulation 13 it is 0.93 bar. At 4.5 bar coupling head pressure, therecommended corridors have a pressure difference of 1.20 bar which compares to apressure difference of 1.26 bar currently permitted by Regulation 13.
0
0.1
0.2
0.3
0.4
0.5
0.6
0.7
0.8
0 1 2 3 4 5 6 7 8Pm (bar)
TM/P
M
Laden Recommended Pm (bar) upper
Laden Recommended Pm (bar) lower
Unladen Recommended Pm (bar) upper
Unladen Recommended Pm (bar) lower
0.4 4.5 6.5
0.575
0.35
0.6
0.50
7.5

39
To ensure compatibility between the tractor unit and semi-trailer, it is furtherrecommended that the values of Kc and Kv should be limited and a tolerance established.This would provide a more representative test procedure in that the vehicle would betested with its end use in mind, and also ensure that the corridors are coincident with eachother in either the laden or unladen states. The unmodified recommended corridors forsemi-trailers are shown in figure 17 below. Although these corridors are not as stringentas the "ideal", it is believed, based upon this research, that this represents the minimumdesirable changes to the corridors.
Figure 17: Recommended compatibility corridor for semi-trailers
3. Narrowing of the compatibility corridors means, from the outset, that tractor units andsemi-trailers will have normal operating threshold pressures that are initially very close.With this in mind, it would mean that adjustment to a relay valve, by a vehicle operator,would be unnecessary. Therefore, phasing out of predominance valves is recommended.A relay valve would still be required, but it should be designed such that it is'tamperproof'. Furthermore, the phasing out of predominance valves with large adjustmentcapabilities will eliminate the hazard of a trailer control valve that has significantpredominance reverting to zero predominance, leading to unbalanced braking betweentractor and semi-trailer, if one of the two tractor brake circuits fail.
4. The work done profiles show that balancing temperature across all axles does notnecessarily produce balanced braking. Balanced braking is achieved by sharing work doneby the equivalent ratio of the static load with an allowance for load transfer under severebraking. Manufacturers of vehicles, semi-trailers and/or axles could produce simple tablesindicating to vehicle operators the correct temperature distribution applicable to eachloading condition, thereby improving the lining wear and vehicle downtime.
0
0.1
0.2
0.3
0.4
0.5
0.6
0.7
0.8
0 1 2 3 4 5 6 7 8Pm (bar)
TR/P
R
Recommended Pm (bar) upper
Recommended Pm (bar) low er
4.5 7.5
0.29
0.41
0.45
0.65
0.60.4

40
5. Although the theoretical braking rate for unladen semi-trailers is based on soundmathematics, there is a need to verify that the vehicle can match the predicted braking ratelater in the vehicle life, for example ten years after vehicle manufacture. Goodmaintenance is essential to ensure that optimum braking is sustained. Evidence should beprovided to show that the theoretically derived regulatory requirements are met inpractice.

41
7. REFERENCES
1. Fura B, Brake Compatibility, Paper No. C444/020/93, Institute of MechanicalEngineers Braking of Road Vehicles Conference, 1993.
2. IRTE. Braking Compatibility of Combinations - An IRTE Code of Practice, TheInstitute of Road Transport Engineers, 1994.
3. Robinson B J, Threshold pressures of articulated heavy goods vehicle brakingsystems, TRL Project report PR/VE/73/93. 1994.
4. Robinson B J, CV Tractor/trailer pressure control. TRL Project reportPR/SE/205/96. January 1997.
5. Robinson B J, Commercial vehicle tyre adhesion, TRL Report 237, 1997.
6. Roe P G, Parry A R and Viner H E, High and low speed skidding resistance: theinfluence of texture depth, TRL Report 367, 1998.