Wavelet ridges for musical instrument classification
16
J Intell Inf Syst DOI 10.1007/s10844-011-0152-9 Wavelet ridges for musical instrument classification M. Erdal Özbek · Nalan Özkurt · F. Acar Savacı Received: 13 September 2010 / Revised: 25 January 2011 / Accepted: 25 January 2011 © Springer Science+Business Media, LLC 2011 Abstract The time-varying frequency structure of musical signals have been an- alyzed using wavelets by either extracting the instantaneous frequency of signals or building features from the energies of sub-band coefficients. We propose to benefit from a combination of these two approaches and use the time-frequency domain energy localization curves, called as wavelet ridges, in order to build features for classification of musical instrument sounds. We evaluated the representative capability of our feature in different musical instrument classification problems using support vector machine classifiers. The comparison with the features based on parameterizing the wavelet sub-band energies confirmed the effectiveness of the proposed feature. Keywords Wavelet ridge · Musical instrument classification · Support vector machine 1 Introduction The classification of musical instruments is one of the main issues in the automatic transcription of music. There have been many features offered to represent musical signals which also targeted to reveal the differences of musical instrument sounds M. Erdal Özbek (B ) · F. Acar Savacı Dept. of Electrical and Electronics Engineering, ˙ Izmir Institute of Technology, Urla, 35430, ˙ Izmir, Turkey e-mail: [email protected] N. Özkurt Dept. of Electrical and Electronics Engineering, Dokuz Eylül University, Buca, 35160, ˙ Izmir, Turkey
Transcript of Wavelet ridges for musical instrument classification

J Intell Inf SystDOI 10.1007/s10844-011-0152-9
Wavelet ridges for musical instrument classification
M. Erdal Özbek · Nalan Özkurt · F. Acar Savacı
Received: 13 September 2010 / Revised: 25 January 2011 / Accepted: 25 January 2011© Springer Science+Business Media, LLC 2011
Abstract The time-varying frequency structure of musical signals have been an-alyzed using wavelets by either extracting the instantaneous frequency of signalsor building features from the energies of sub-band coefficients. We propose tobenefit from a combination of these two approaches and use the time-frequencydomain energy localization curves, called as wavelet ridges, in order to build featuresfor classification of musical instrument sounds. We evaluated the representativecapability of our feature in different musical instrument classification problemsusing support vector machine classifiers. The comparison with the features basedon parameterizing the wavelet sub-band energies confirmed the effectiveness of theproposed feature.
Keywords Wavelet ridge · Musical instrument classification ·Support vector machine
1 Introduction
The classification of musical instruments is one of the main issues in the automatictranscription of music. There have been many features offered to represent musicalsignals which also targeted to reveal the differences of musical instrument sounds
M. Erdal Özbek (B) · F. Acar SavacıDept. of Electrical and Electronics Engineering,Izmir Institute of Technology, Urla, 35430, Izmir, Turkeye-mail: [email protected]
N. ÖzkurtDept. of Electrical and Electronics Engineering,Dokuz Eylül University, Buca, 35160, Izmir, Turkey

J Intell Inf Syst
(Herrera-Boyer et al. 2003, 2006; Deng et al. 2008; Essid et al. 2006; Klapuri and Davy2006). While the temporal evolution of the signal is characterized by the time-basedfeatures, the spectral features are extracted based on the short-time spectrum usingtime-frequency transformations such as short-time Fourier transform, constant-Qtransform, and wavelets (Alm and Walker 2002; Pielemeier et al. 1996). Apparently,representing musical signals with time-frequency features are effective due to thenature of musical signals where the frequency varies with time.
The wavelet analysis is a very popular time-frequency analysis technique and it iswidely used for the non-stationary signals in which the statistical properties vary withtime (Mallat 2009). As musical signals are inherently non-stationary, wavelets arefrequently used to analyze their properties and build representative features fromthem. The time-varying frequency structure of the signals is observed in a time-frequency plane with the continuous wavelet analysis, while the signal is divided intoits sub-bands via the discrete wavelet transform (DWT) leading to wavelet packetanalysis, which can also be interpreted with the multi-resolution concept (Vetterliand Kovacevic 1995).
Accordingly, the use of wavelets in musical signals may be separated into twocases based on the following representations. In one representation, the emphasis isgiven to the extraction of instantaneous frequency (IF) (Boashash 1992) for analysisand re-synthesis purposes built upon sinusoidal modeling (Pielemeier et al. 1996;Beauchamp 2007; Goodwin and Vetterli 1996; Kronland-Martinet 1988). The IFof a signal can be extracted using wavelet analysis (Delprat et al. 1992) based onthe time-frequency energy localization (see Sejdic et al. 2009; Shafi et al. 2009,for recent overviews). As the energy is concentrated in frequency about the IF(Boashash 1992), the required information can be extracted using the curves atthe time-frequency plane along where the energy is locally maximum, namely thewavelet ridges (Mallat 2009; Delprat et al. 1992; Carmona et al. 1997; Todorovska2001). These trajectories allow to characterize the frequency modulation law of thesignals. Moreover, the wavelet transform coefficients along the ridges are called asthe skeleton of the wavelet transform (Delprat et al. 1992), which can be used tode-noise and reconstruct a signal (Carmona et al. 1999; Lin 2006; Özkurt and Savacı2006). The ridges can be computed using many techniques (Mallat 2009; Delpratet al. 1992; Carmona et al. 1997; Todorovska 2001; Guillemain and Kronland-Martinet 1996), where some examples for IF and ridge extraction can be found inDai et al. (2008), Özkurt and Savacı (2005), Shuai and Yuan (2006) and Tse and Lai(2007), including musical rhythm detection (Smith and Honing 2008). Although thediagram of ridges associated with the musical instrument sounds has been presentedin Delprat (1997), the features representing musical instrument sounds based onwavelet ridges have not been considered for the classification of instruments.
The other wavelet representation involves with the sub-band coefficients, theirenergy, and the distribution of the amplitude or energies of the coefficients. Thefirst attempts for this case are focused on finding a suitable wavelet function torepresent musical signals, such as harmonic and musical wavelets (Newland 1994),and log-Morlet wavelet function (Olmo et al. 1999). Later, the amplitude envelopesof the wavelet coefficients have been used rather than the raw wavelet coefficientsor the sub-band energies (Hacıhabiboglu and Canagarajah 2002). The employment
J Intell Inf Syst
of DWT has been investigated in Tzanetakis et al. (2001), preceding to the usageof sub-band wavelet coefficients and wavelet packets for musical instrument soundclassification (Pruysers et al. 2005). The sub-band power and pitch frequency fea-tures have been extracted for audio including musical instrument sounds in Linet al. (2005). Furthermore, the musical instrument sounds have been classified byparameterizing the energy of each sub-band in the remarkable works of Kostek andCzyzewski (2001), Kostek (2004, 2005) and Wieczorkowska (2001, 2010). The obser-vation stated in Kostek (2004) reveals that the distribution pattern of energy valueswithin the sub-bands is similar for the wind instruments whereas the same parametricrepresentation for the string instruments is different from the wind instruments.This is consistent with the assumption of Do and Vetterli (2002), declaring that theenergy distribution in frequency domain identifies a texture, whereas the marginaldensities of wavelet sub-band coefficients have been modeled with a GeneralizedGaussian Density (GGD). This GGD modeling has been used for musical genre(Tzagkarakis et al. 2006) and then for musical instrument classification in Özbekand Savacı (2007). Following the same idea, histograms computed from the waveletcoefficients at different frequency sub-bands have been efficiently used for musicinformation retrieval (Li and Ogihara 2006).
The presented paper proposes to benefit from a combination of these two repre-sentations. Using the sub-band energies is likely to result with an acceptable recog-nition rate, but certainly loses the temporal dimension of timbre which is essentialin discriminating musical instruments. That explains the intention of offering a time-related parameter in Kostek (2004), in addition to the wavelet sub-band energies.As the energy is concentrated around the IF, wavelet ridges can be used to buildfeatures similar to the ones that has been built upon the spread of energies in waveletsub-bands. Besides, wavelet ridges carry the time domain information which can beexhibited in the feature vector. By using the ridges, we offer to build a representationof musical signals reflecting their time-varying frequency components, mainly com-posed of the fundamental and harmonic frequencies, where the energy is localized.Although, the main purpose is to classify instruments, meanwhile, the note of themusical instrument may be determined based on the distribution of energy to thefrequencies in those sub-bands.
The representative capability of our wavelet ridge based feature is evaluated indifferent musical instrument classification problems using support vector machine(SVM) classifiers (Cristianini and Shawe-Taylor 2000; Vapnik 1998) which haveproven to demonstrate successful classification rates for audio and musical instru-ment classification (Deng et al. 2008; Essid et al. 2006; Lin et al. 2005; Wieczorkowskaand Kubera 2009). As the study is focused on wavelet representations, the impor-tance is given to the comparison results with different wavelet mother functions.Therefore, only the SVM classifiers are used for evaluation rather than comparingthe results of different classifiers.
The organization of the paper is as follows: Section 2 reviews the wavelet trans-form and the method of obtaining the wavelet ridges of a signal. The experimen-tal study performed for different musical instrument groups will be explained inSection 3. Finally, the corresponding performance results using SVMs and conclu-sions will be presented.

J Intell Inf Syst
2 A review of wavelet transform and wavelet ridges
In continuous wavelet transform (CWT), the signal s(t) is projected on a zero-meanfamily of functions called wavelets,
Ws(a, b ; ψ) =∫ ∞
−∞s(t)ψ∗
a,b (t)dt , (1)
with translations and scaling of a mother wavelet function, where a and b are thescaling and translation coefficients, respectively. The ψ(·) is the mother waveletfunction, the ∗ denotes the complex conjugate, the scaled and translated wavelet isgiven by
ψa,b (t) = 1√aψ
(t − b
a
). (2)
The local time-frequency energy density named as scalogram is defined in Delpratet al. (1992) and Mallat (2009) as
Ps(a, b ; ψ) � |Ws(a, b ; ψ)|2 . (3)
For numerical computations, the DWT is obtained by regularly sampling CWTat discrete time and scale positions, hence defining the scaled and translated wave-lets as
ψm,n(t) = a−m/2ψ(a−mt − bn
)m, n ∈ Z, (4)
then the scalogram matrix for discrete case can be defined as
Ps = |Ws(am, b n;ψm,n)|2 , (5)
which are simply the local time-frequency domain energy densities evaluated at thediscrete dilations am and the translations b n.
A way of showing the time-frequency information is to define the ridges of thesignal. There are several ridge detection methods including stationary phase methodwhich calculates the ridges using stationary point theorem (Delprat et al. 1992;Todorovska 2001; Guillemain and Kronland-Martinet 1996), and the simple methodwhich directly finds the local maxima of the scalogram (Mallat 2009; Carmona et al.1997; Todorovska 2001).
The interpretation of the IF using the analytic function representation indicatesthat the derivative of the phase of a signal provides a measure of frequency(Boashash 1992; Delprat et al. 1992). Hence, the signals can be modeled using afrequency-modulated signal fitted to the change of the main frequency. For a multi-component signal s(t) with L components, the instantaneous amplitudes Al(t) andthe instantaneous phases φl(t) can be described by
s(t) =L∑
l=1
Al(t)e jφl(t). (6)

J Intell Inf Syst
Fig. 1 Three level waveletdecomposition S
A1
A2
A3 D3
D2
D1 S = A1 + D1
S = A2 + D2 + D1
S = A3 + D3 + D2 + D1
Then the wavelet transform of the signal can be written as (Delprat et al. 1992;Carmona et al. 1997; Todorovska 2001)
Ws(a, b ; ψ) = 1
2
L∑l=1
Al(b)e jφl(b)ψ∗(aφ′l(b)) + r(a, b) , (7)
with r(a, b) ∼ O(|A′l|, |φ′′
l |) indicating higher orders where the primes denote thederivatives. Therefore, if the Fourier transform of the mother wavelet function ψ(ω)
is localized near a certain frequency ω = ω0, the scalogram is localized around Lcurves
al = al(b) = ω0
φ′l (b)
, l = 1, . . . , L (8)
which are named as the ridges of the wavelet transform or simply wavelet ridges(Delprat et al. 1992; Carmona et al. 1997; Todorovska 2001).
On the other hand, by selecting the variables a = 2 and b = 1 in (4), we obtainthe dyadic grid which leads to the orthonormal bases with the special choices ofthe mother wavelet function ψ . Accordingly, the signal s(t) can be written as alinear combination of the dyadic wavelet coefficients whereas reconstruction of thesignal from those coefficients is possible. By interpreting this dyadic grid with veryefficient and low complexity filter-bank structures based on the multi-resolutionconcept, which states that a given signal can be represented by the sum of a coarseapproximation and details, the signal can be decomposed into many detail andapproximation sub-band coefficients (Vetterli and Kovacevic 1995). Figure 1 displaysthe decomposition where the signal S is decomposed to three level detail (D) andapproximation (A) sub-band coefficients.
3 Experimental study
3.1 Instrument sound samples
In this study, we mainly used the University of Iowa Electronic Music Studios musicalinstrument samples (Fritts 1997). The samples were recorded in an anechoic chamberin mono channel, having 16 bit dynamic range and sampled at 44.1 kHz. The soundfiles with groups of note samples in the library have been separated note by note,

J Intell Inf Syst
Fig. 2 Normalized energyvalues for 10 sub-bands ofsome musical instruments
1 2 3 4 5 6 7 8 9 100
0.5
1Alto Saxophone
Sub–band
En
1 2 3 4 5 6 7 8 9 100
0.5
1Bassoon
Sub–band
En
1 2 3 4 5 6 7 8 9 100
0.5
1Cello
Sub–band
En
1 2 3 4 5 6 7 8 9 100
0.5
1Oboe
Sub–band
En
1 2 3 4 5 6 7 8 9 100
0.5
1Viola
Sub–band
En
1 2 3 4 5 6 7 8 9 100
0.5
1Violin
Sub–band
En
and labeled accordingly in Özbek et al. (2007). Each of the samples is in one of thethree dynamic ranges: fortissimo (ff), mezzo forte (mf), and pianissimo (pp). Thewind instruments recordings include samples with and without vibrato whereas weexcluded the string samples played by plucking (pizzicato).
It is accepted that the starting transients are the most important part of thesignal for the recognition of musical sounds (Kostek 2005). Therefore, a framelength consisting of 2,048 samples were selected from the attack part of the musicalinstrument sounds.
3.2 Wavelet sub-band energy based feature
The energy related parameters for each of the instrument note samples werecomputed by decomposing the signals into 10 sub-bands as
En = Ei
10∑i=1
Ei
i = 1, . . . , 10 (9)
where En denotes the partial energy parameter normalized with respect to theoverall energies of the each sub-band energy parameterized by Ei. Figure 2 displaysthe energy-based feature (En) for some of the chosen musical instruments. For eachbar group in the sub-bands, each micro-bar corresponds to the different note sampleof that instrument. The ranges of the instruments can be seen from the distributionof the energies to the sub-bands.
Although the second order Daubechies wavelet (db2) was preferred as a motherwavelet function because of its lower computational load than the others as ac-knowledged in Kostek (2004), we also computed the energy parameters using theDaubechies db8 wavelets as in Li and Ogihara (2006), as well as bi-orthogonal(bior4.4) wavelets in order to compare the efficiency. Furthermore, the first threemoments, i.e., the mean, the variance, and the skewness values of the energyparameters for each sub-band were computed.

J Intell Inf Syst
3.3 Wavelet ridge based feature
In order to determine the ridges, we applied the technique proposed in Özkurtand Savacı (2005) which uses singular value decomposition (SVD) to factorize thescalogram matrix given in (3). By selecting only the dominant components associatedwith the signal, an approximated scalogram matrix was obtained. Then, by selectingthe localized energy points in the scalogram, the wavelet ridges were labeled. Thecomplex Morlet wavelet
ψ(t) = 1√2π
e jω0te−t2/2 , (10)
was selected as the mother wavelet function because the magnitude and phase of thewavelet coefficients can be easily separated due to the fact that it is described by ananalytic function (Todorovska 2001). Moreover, the Gaussian shape of this motherwavelet function provides a smooth energy distribution, thus the resulting waveletridges effectively display this distribution over the time-frequency plane. Figure 3shows an example of a Flute A4 note sample, its scalogram calculated using CWT,and the corresponding wavelet ridges marked by employing the SVD-based ridgedetermination procedure.
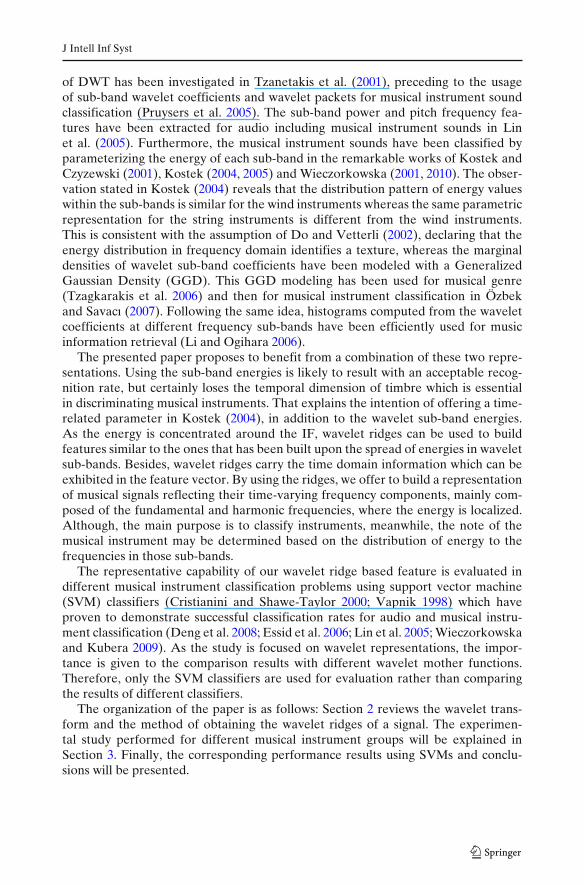
The values of the ridges are displayed using a gray level image in which darkerpoints represent higher energy of the hills of the scalogram similar to the spectro-gram. Apparently, the ridges denote the energies which are concentrated around thefundamental frequency and the corresponding harmonic frequencies of the samplesignal as shown in the hills of the scalogram in (b) of Fig. 3. Due to the multi-resolution capability of wavelets, the scalogram can be referred as a high resolutionspectrum. Another interpretation can be displayed based on the ridge energies foreach frequency. Figure 4 shows the A4 note samples of Soprano Saxophone andViolin, their spectrograms, and the energy values of their ridges. While both of theinstrument samples have the same note signal, the energies of the partials differwith respect to the instrument. Therefore, as in the case of the energy of the binsin the Fourier transform (shown in the spectrograms) or of the sub-bands of thewavelet transform, the energy of the ridges is likely to reveal the differences of theinstruments.
Furthermore, while the wavelet ridges include the time evolution of the frequency,we eliminated the redundant information in time by downsampling. We selectedthe values of only the 8 time instants for a feasible feature vector length whichdirectly effected the classification performance. Similarly, the frequency content wascompacted in sub-bands. Thus, as in the energy based parameters of the sub-bands,we built features by summing the energy values of the ridges for 10 sub-bands,having 80 values. We included the mean, variance, and skewness values of the energyparameters and labeled the corresponding features with ’mvs’.
3.4 SVM classification
The SVM classifiers have been developed based on statistical learning theory(Vapnik 1998). They are widely used because of their generalization ability.

J Intell Inf Syst
Fig. 3 a A Flute A4 notesample, b its scalogram,c and the correspondingwavelet ridges 200 400 600 800 1000 1200 1400 1600 1800 2000
–0.50
0.5
Samples
Am
plitu
de
(a)
(b)
Samples
Fre
quen
cy (
Hz)
200 400 600 800 1000 1200 1400 1600 1800 20000
200
400
600
800
1000
1200
1400
1600
1800
2000
(c)
Although they were originally designed for solving two-class classification prob-lems, multi-class classifications can be performed using the two common methods:one-vs-all and one-vs-one. While the choice of the method depends on the problem,one-vs-all method often produces acceptable results (Schölkopf and Smola 2002).Therefore, we chose to implement SVM classifiers using one-vs-all method (Westonet al. 2003). Each classifier was implemented using the radial basis function (RBF)kernel. The feature vectors were normalized before introducing to the SVM clas-sifiers. Half of the samples were used for training while the remaining half of the
J Intell Inf Syst
Fig. 4 The SopranoSaxophone and Violin A4 notesamples, their spectrograms,and corresponding ridgeenergy values
500 1000 1500 2000– 1
0
1
Samples
Am
plitu
de
Soprano Saxophone
Frame indexF
requ
ency
bin
20 40 60 80 100 120
50100150200250
500 1000 1500 20000
0.02
0.04
Frequency (Hz)
Mag
nitu
de
500 1000 1500 2000
–0.5
0
0.5
Samples
Am
plitu
de
Violin
Frame index
Fre
quen
cy b
in
20 40 60 80 100 120
50100150200250
500 1000 1500 20000
0.02
0.04
Frequency (Hz)
Mag
nitu
desamples were left for testing. The presented results were obtained after a 10-foldstratified cross-validation scheme with kernel parameter σ = 1.
4 Results
We present the classification performance results in three different groups: stringinstruments, wind instruments, and both string and wind instruments. For the stringinstruments, we used the samples of Bass (289), Cello (352), Viola (271), and Violin(283), while for the wind instruments we selected Alto Saxophone (192), Flute (227),Oboe (104), and Trumpet (212) with the number samples given in parentheses. Ineach case, eight different feature vectors were evaluated, i.e., R, Db2, Db8, Bior44,Rmvs, Db2mvs, Db8mvs, Bior44mvs. Here, R denotes the feature of the waveletridges, where Db2, Db8, and Bior44 denote the energy parameters calculated withDWT using the respective mother wavelet function. The labels including mvs denotethat the mean, variance, and skewness values of the features were included in thefeature vector. The numbers printed as boldface in the tables denote the highestvalue of the corresponding result while all numbers are given in percentage.
For the string instruments, the confusion matrices obtained using the Db2 and Rfeatures are displayed in the Table 1. An increase in the classification scores of Violaand Violin was observed with the proposed wavelet ridge-based feature. Bass had thehighest performance which is mainly due to the frequency range of the instrument.Viola was found to have the lowest performance and it was confused mostly withCello in both cases, while the confusion of Violin with Cello was decreased in theproposed feature case.
We observed similar results for the wind instruments, where the confusion matrixfor the wavelet ridge based feature is given in the Table 2. As similar but lower rateswere observed for other features, only the results obtained by the wavelet ridgebased feature will be presented afterwards. The Trumpet was found to have thehighest performance while Flute had the lowest score with similar misclassification

J Intell Inf Syst
Table 1 Confusion matrices for the string instruments using Db2 and R features
Instrument Db2 R
Classified as Classified as
Bass Cello Viola Violin Bass Cello Viola Violin
Bass 94.1 4.6 0.0 1.3 94.5 2.3 1.7 1.5Cello 4.1 85.6 8.2 2.1 1.1 85.5 11.0 2.4Viola 1.7 39.8 45.4 13.1 2.5 26.8 57.4 13.3Violin 0.7 25.6 9.2 64.5 0.1 8.7 12.4 78.8
rates with the other three instruments. Afterwards, the string and wind instrumentswere combined and a new classification was performed for eight instruments. Theconfusion matrix for the wavelet ridge based feature is given in the Table 3.
Parallel to the observations from the string and wind instruments classificationperformance results, Bass and Trumpet had higher performance scores whereasFlute and Viola displayed lower classification rates. While the afore presentedconfusion matrices have denoted the performance of the wavelet ridge based featurefor the classification of instruments, Table 4 displays the average accuracies for eachof the string, wind, and all of the instruments computed using each of the feature set.
In all of the cases, the proposed wavelet ridge based feature outperforms thewavelet sub-band energy based feature sets. In most of the cases, adding the mean,variance, and the skewness values to the features resulted with better classificationperformance, however it was found to be the opposite when using the wavelet ridgebased feature. This can be explained with the localization of energy around theridges. By concentrating the highest energy in the frequencies of a sub-band,the variation of the energy within the sub-band mostly depends on the energy ofthe ridges. Therefore, adding the mean, variance, and skewness values to the featuremay not supply extra information to be used in classification. Besides, by enlargingthe length of the feature vector it may cause a decrease in the classification rates.
An advantage of the method is in the gathered information related to thefrequency content. While the instruments are being classified, the extracted waveletridges may aid in identification of the notes of the instruments. For the notes in theC4-C5 octave range, based on the maximum energy value of the ridge, the notes ofthe isolated sample were correctly (within a semitone) identified with ratios of 95%for Alto Saxophone and 85% for Flute, whereas lower for the rest such as around50% for Viola and Violin. The misclassifications were mainly due to the one frameanalysis in the attack part of the signal. By using more frames in the wavelet analysisor by analyzing the sustain part of the notes where the frequency and correspondinglythe spectral energy of the signal is stable, more precise identification of notes may be
Table 2 Confusion matrix for the wind instruments using R feature
Instrument Classified as
Alto Saxophone Flute Oboe Trumpet
Alto Saxophone 73.6 16.4 10.0 0.0Flute 10.8 69.2 9.4 10.6Oboe 4.6 7.9 86.5 1.0Trumpet 0.7 7.6 0.4 91.3

J Intell Inf Syst
Table 3 Confusion matrix for the string and wind instruments using R feature
Instrument Classified as
Alto Saxophone Bass Cello Flute Oboe Trumpet Viola Violin
Alto Saxophone 66.8 5.3 1.8 11.1 8.2 0.0 3.9 2.9Bass 0.0 93.3 2.6 0.2 0.0 0.0 1.9 2.0Cello 0.0 0.4 81.8 1.0 0.0 2.3 9.3 5.2Flute 3.4 14.6 2.5 55.9 4.1 7.6 7.3 4.6Oboe 7.1 1.0 0.0 10.5 75.0 4.9 0.4 1.1Trumpet 0.1 0.0 0.9 5.6 1.8 89.7 1.3 0.6Viola 1.7 3.7 26.5 2.4 0.0 2.8 49.3 13.6Violin 2.9 0.7 7.7 0.1 0.0 0.4 13.7 74.5
performed. Besides, the frequency of the note may not always be the frequency withthe highest energy as illustrated in the Fig. 4. Therefore, a proper identification ofnotes from tracking of harmonic frequency positions would be required as in Everyand Szymanski (2006).
Although the proposed feature has better classification performance than thewavelet sub-band energy based feature sets, and some of the state-of-the-art features,it has not yet outperformed the mel frequency cepstral coefficients (MFCCs) whichrecently been shown as the best feature for many musical instruments (Wiec-zorkowska and Kubik-Komar 2010). In order to build a baseline for comparisonpurposes, the classification rates for the standard 13-length MFCC feature havebeen obtained as 91.8, 90.4 and 85.5% for the string, wind, and all of the instru-ments case, respectively. Similar with the MFCCs, the wavelet ridges display thespectral envelope of the signal. However, the MFCCs lack to display the temporalinformation which were included in the wavelet ridges representing the temporalevolution of the spectral variation. Therefore, we aimed to use this additional timedomain information extracted from the attack part of the signals for the recognitionof musical sounds. While the state-of-the-art features like MFCCs may result withbetter performance and therefore are widely used, some of the features may havebetter representations for some certain instruments. Moreover, improvements ofMFCCs yield slightly better results which reflect that there is not much room tobenefit further from MFCCs. As explained above, by using wavelet ridges, it maybe possible to determine and follow the individual partials (notes) which may existand possibly overlapping in a polyphonic music or in a mixture of musical instrument
Table 4 Performance resultsfor the string, wind, and allcases for all feature sets
Feature Performance (%)
String Wind All
R 79.7 79.9 73.9Db2 69.9 66.2 64.6Db8 73.1 61.7 62.7Bior44 72.6 65.3 62.8Rmvs 76.4 72.7 70.2Db2mvs 76.1 71.2 67.1Db8mvs 70.3 66.6 65.5Bior44mvs 72.3 71.0 66.1

J Intell Inf Syst
Table 5 Confusion matrixwith the ridge based featurefor the CD samples
Instrument Classified as
Cello Oboe Piano Violin
Cello 70.7 17.1 8.9 3.3Oboe 0.3 64.7 9.0 26.0Piano 16.6 14.3 43.3 25.8Violin 18.9 22.6 1.6 56.9
sounds. This is similar to the use of the pitch frequency cepstral coefficients whichintends to extract the frequency content with timbre information.
The benefit of using wavelet ridges is to reveal the information hidden in the time-frequency domain by following the energy paths. As the energy paths can be investi-gated in higher resolution, information for the discrimination of the instruments canbe obtained accordingly. Although obtaining a unique representation for a musicalinstrument is still far, the skeleton information represented in the wavelet ridge basedfeatures is found efficient and can be used to build better representations.
We further evaluated our proposed feature using the solo excerpts of musicalCDs obtained from personal collections and the library of Turkish Radio andTelevision Corporation. The collection was composed of 69 different tracks fromfour instruments, i.e., Cello, Oboe, Piano, and Violin. Only the left channel ofthe stereo tracks were used. The analyzed samples were extracted using an energythreshold in order to discard the silence. The same analysis frame length and SVMarchitecture were kept. The number of total samples for each instrument was notless than 1,400 which half of them were used for training and the rest was kept fortesting. No test sample was selected from the recordings of the training sample. Theconfusion matrix with the wavelet ridge based feature is presented in Table 5.
The results display that the Cello was mostly confused with Oboe, while Oboe andPiano were mostly confused with Violin. Piano had the lowest performance due tothe misclassifications with all three instruments. The performance results of the CDexcerpts for all feature sets are displayed in Table 6.
Repeatedly, the wavelet ridge based feature set had the highest performancecompared to the other feature sets. The lower performance results obtained for allof the instruments are mainly due to the selection of the analysis frame which maynot be in accordance with the attack part as in the isolated note samples. Whilefor the isolated note samples it was relatively easy to detect the attack part of thesignal, there were no preprocessing for the frames excerpted from the CD recordings.Besides, all of the 10 sub-bands were used unlike Li and Ogihara (2006) where the
Table 6 Performance resultsof the CD excerpts for allfeature sets
Feature Performance (%)
R 59.9Db2 48.3Db8 52.4Bior44 50.5Rmvs 63.9Db2mvs 43.7Db8mvs 54.7Bior44mvs 52.0

J Intell Inf Syst
Table 7 Confusion matrices with the wavelet ridge based feature with trained/tested with isolatednote samples/CD excerpts using R feature
Instrument Trained with isolated note samples Trained with CD excerpts
Classified as Classified as
Cello Oboe Violin Cello Oboe Violin
Cello 54.8 39.8 5.4 6.9 73.9 19.2Oboe 48.4 26.7 24.9 0.0 100.0 0.0Violin 14.9 31.8 53.3 0.7 37.5 61.8
features have been built by selecting the most efficient sub-bands. Obviously, a pre-selection of the sub-bands according to the instrument would be helpful in increasingthe performance ratios.
The final experiments were made for the wavelet ridge based feature set using theisolated note samples as training data and the CD excerpts for testing data, and viceversa. Note that there are only three instruments in common, i.e., Cello, Oboe, andViolin, and Table 7 displays the confusion matrices obtained for both cases.
Because of the limited number of Oboe note samples, the performance was lowerwhen trained with the isolated note samples. On the contrary, when trained with theCD excerpts, all Oboe samples were correctly classified. Therefore, for Oboe, theisolated note samples seem to lack a fully representation of the instrument. However,it is not the case for the Cello, which is mostly confused with Oboe when trainedwith the CD excerpts. This may be due to the CD recordings which possibly couldnot present all the note samples of the corresponding musical instrument. Resultsalso demonstrated that the wavelet ridge based feature performs better for stringinstruments than the wind instruments, independent from the collection of sounds.This is in accordance with the previous results which demonstrates its ability to catchthe variations in time and frequency of string instruments compared to the morestable sounds of wind instruments.
5 Conclusions
This paper offers wavelet ridges in order to build features for representing musicalsignals. The features based on parameterizing the wavelet sub-band energies havebeen found efficient but they lack the time domain information. By displaying theenergy of the time-varying frequency content of the signal, the features based onwavelet ridges were found to have better classification rates than the wavelet sub-band energy based features, computed using different mother wavelet functions in acomparative study for some sample musical instrument classification problems.
Although the frequency content were summed in sub-bands in order to make faircomparisons with the sub-band based feature sets, the extraction of ridges can beperformed at different scales or time resolutions according to a pre-defined precision.For example, making a finer analysis by adjusting the scales to the semitonesof musical note frequencies will result with the determination of the exact notefrequency while a classification of instruments is ongoing. Thus, it seems possibleto fuse this information to solve the identification of note and instrument at thesame time which will be helpful for musical information retrieval. However, our

J Intell Inf Syst
observations justified that necessary caution should be taken when increasing thedetail in time or frequency. Otherwise, increasing the length of the feature withredundant information is likely to result with a decrease in the classification accuracy.
The wavelet ridges offer a way of determining a unique identifier (skeleton) ofeach musical instrument by considering both time and frequency domain informa-tion. Therefore, similar/alternative features based on wavelet ridges can be used toexploit possible discrimination directions. However, as the ridge extraction methoduses continuous wavelet transform, the necessity of high computation time is stillcumbersome. An option may be to use the dual-tree complex wavelet transform(Selesnick et al. 2005) which also combines the advantages of both the continuousand discrete time wavelet analysis.
Acknowledgements The authors would like to thank anonymous reviewers for their comments andsuggestions in improving the quality of the manuscript.
References
Alm, J. F., & Walker, J. S. (2002). Time-frequency analysis of musical instruments. SIAM Review,44(3), 457–476.
Beauchamp, J. W. (ed) (2007). Analysis, synthesis, and perception of musical sounds. Springer.Boashash, B. (1992). Estimating and interpreting the instantaneous frequency of a signal - Part I:
Fundamentals. Proceedings of the IEEE, 80(4), 520–538.Carmona, R. A., Hwang, W. L., & Torrésani, B. (1997). Characterization of signals by the ridges of
their wavelet transforms. IEEE Transactions on Signal Processing, 45(10), 2586–2590.Carmona, R. A., Hwang, W. L., & Torrésani, B. (1999). Multiridge detection and time-frequency
reconstruction. IEEE Transactions on Signal Processing, 47(2), 480–492.Cristianini, N., & Shawe-Taylor, J. (2000). An introduction to support vector machines. Cambridge
University Press.Dai, Y., Ma, Q., & Tang, W. (2008). Efficient wavelet ridge extraction method for asymptotic signal
analysis. Review of Scientific Instruments, 79, 124703. doi:10.1063/1.3036984.Delprat, N. (1997). Global frequency modulation laws extraction from the Gabor transform of a
signal: A first study of the interacting components case. IEEE Transactions on Speech and AudioProcessing, 5(1), 64–71.
Delprat, N., Escudié, B., Guillemain, P., Kronland-Martinet, R., Tchamitchian, P., & Torrésani, B.(1992). Asymptotic wavelet and Gabor analysis: Extraction of instantaneous frequencies. IEEETransactions on Information Theory, 38(2), 644–664.
Deng, J. D., Simmermacher, C., & Cranefield, S. (2008). A study on feature analysis for musicalinstrument classification. IEEE Transactions on Systems, Man and Cybernetics - Part B: Cyber-netics, 38(2), 429–438.
Do, M. N., & Vetterli, M. (2002). Wavelet-based texture retrieval using generalized Gaussian densityand Kullback-Leibler distance. IEEE Transactions on Image Processing, 11, 146–158.
Essid, S., Richard, G., & David, B. (2006). Instrument recognition in polyphonic music based onautomatic taxonomies. IEEE Transactions on Audio, Speech, and Language Processing, 14(1),68–80.
Every, M. R., & Szymanski, J. E. (2006). Separation of synchronous pitched notes by special filteringof harmonics. IEEE Transactions on Audio, Speech, and Language Processing, 14(5), 1845–1856.
Fritts, L. (1997). The University of Iowa electronic music studios musical instrument samples.http://theremin.music.uiowa.edu.
Goodwin, M., & Vetterli, M. (1996). Time-frequency signal models for music analysis, transforma-tion, and synthesis. In Proc. of the IEEE-SP international symposium on time-frequency andtime-scale analysis (pp 133–136).
Guillemain, P., & Kronland-Martinet, R. (1996). Characterization of acoustic signals through contin-uous linear time-frequency representations. Proceedings of the IEEE, 84(4), 561–585.
Hacıhabiboglu, H., & Canagarajah, C. N. (2002). Musical instrument recognition with wavelet en-velopes. In Proc. forum acusticum Sevilla. Sevilla, Spain.

J Intell Inf Syst
Herrera-Boyer, P., Peeters, G., & Dubnov, S. (2003). Automatic classification of musical instrumentsounds. Journal of New Music Research, 32(1), 3–21.
Herrera-Boyer, P., Klapuri, A., & Davy, M. (2006). Automatic classification of pitched musicalinstrument sounds. In Signal processing methods for music transcription (pp. 163–200). Springer.
Klapuri, A., & Davy, M. (eds) (2006). Signal processing methods for music transcription. Springer.Kostek, B. (2004). Musical instrument classification and duet analysis employing music information
retrieval techniques. Proceedings of the IEEE, 92(4), 712–729.Kostek, B. (2005). Perception-based data processing in acoustics. Springer.Kostek, B., & Czyzewski, A. (2001). Representing musical instrument sounds for their automatic
classification. Journal of Audio Engineering Society, 49(9), 768–785.Kronland-Martinet, R. (1988). The wavelet transform for analysis, synthesis, and processing of
speech and music sounds. Computer Music Journal, 12(4), 11–20.Li, T., & Ogihara, M. (2006). Toward intelligent music information retrieval. IEEE Transactions on
Multimedia, 8(3), 564–574.Lin, C. C., Chen, S. H., Truong, T. K., & Chang, Y. (2005). Audio classification and categoriza-
tion based on wavelets and support vector machine. IEEE Transactions on Speech and AudioProcessing, 13(5), 644–651.
Lin, J. (2006). Ridges reconstruction based on inverse wavelet transform. Journal of Sound andVibration, 294, 916–926.
Mallat, S. G. (2009). A wavelet tour of signal processing: The sparse way (3rd edn). Academic Press.Newland, D. E. (1994). Harmonic and musical wavelets. Proceedings: Mathematical and Physical
Sciences, 444(1922), 605–620.Olmo, G., Dovis, F., Benotto, P., Calosso, C., & Passaro, P. (1999). Instrument-independent analysis
of music by means of the continuous wavelet transform. In Proc. of the SPIE wavelet applicationsin signal and image processing VII (Vol. 3813, pp. 716–726). Denver, USA.
Özbek, M. E., & Savacı F. A. (2007). Music instrument classification using generalized Gaussiandensity modeling. In IEEE 15th signal processing and communications applications conference.Eskisehir, Turkey.
Özbek, M. E., Delpha, C., & Duhamel, P. (2007). Musical note and instrument classification withlikelihood-frequency-time analysis and support vector machines. In European signal processingconference (pp. 941–945). Poznan, Poland.
Özkurt, N., & Savacı, F. A. (2005). Determination of wavelet ridges of nonstationary signals bysingular value decomposition. IEEE Transactions on Circuits and Systems-II: Express Briefs,52(8), 480–485.
Özkurt, N., & Savacı, F. A. (2006). Reconstruction of nonstationary signals along the wavelet ridges.International Journal of Bifurcation and Chaos, 16(1), 191–198.
Pielemeier, W. J., Wakefield, G. H., & Simoni, M. H. (1996). Time-frequency analysis of musicalsignals. Proceedings of the IEEE, 84(9), 1216–1230.
Pruysers, C., Schnapp, J., & Kaminskyj, I. (2005). Wavelet analysis in musical instrument soundclassification. In Proc. of the 8th international symposium on signal processing and its applications(Vol. 1, pp. 1–4).
Schölkopf, B., & Smola, A. J. (2002). Learning with Kernels. MIT Press.Sejdic, E., Djurovic, I., & Jiang, J. (2009). Time-frequency feature representation using energy
concentration: An overview of recent advances. Digital Signal Processing, 19, 153–183.Selesnick, I. W., Baraniuk, R. G., & Kingsbury, N. G. (2005). The dual-tree complex wavelet
transform. IEEE Signal Processing Magazine, 22(6), 123–151.Shafi, I., Ahmad, J., Shah, S. I., & Kashif, F. M. (2009). Techniques to obtain good resolution and
concentrated time-frequency distributions: A review. EURASIP Journal on Advances in SignalProcessing, 2009(673539), 43. doi:10.1155/2009/673539.
Shuai, X. F., & Yuan, X. (2006). Instantaneous frequency extraction via wavelet ridge. In IEEEinternational conference on communications, circuits and systems proceedings (Vol. 1, pp. 253–257).
Smith, L. M., & Honing, H. (2008). Time-frequency representation of musical rhythm by continuouswavelets. Journal of Mathematics and Music, 2(2), 81–97.
Todorovska, M. I. (2001). Estimation of instantaneous frequency of signals using the continuouswavelet transform. Tech. Rep. CE 01-07. University of Southern California, Los Angeles,California.
Tse, N. C. F., & Lai, L. L. (2007). Wavelet-based algorithm for signal analysis. EURASIP Journal onAdvances in Signal Processing, 2007(38916). doi:10.1155/2007/38916.
J Intell Inf Syst
Tzagkarakis, C., Mouchtaris, A., & Tsakalides, P. (2006). Musical genre classification via generalizedGaussian and alpha-stable modeling. In IEEE international conference on acoustics, speech, andsignal processing (Vol. 5, pp. 217–220). Toulouse, France.
Tzanetakis, G., Essl, G., & Cook, P. (2001). Audio analysis using the discrete wavelet transform. InWSES international conference on acoustics and music: Theory and applications. Koukounaries,Greece.
Vapnik, V. N. (1998). Statistical learning theory. John Wiley and Sons.Vetterli, M., & Kovacevic, J. (1995). Wavelets and subband coding. Prentice Hall.Weston, J., Elisseeff, A., Bakır, G., & Sinz, F. (2003). Spider: Object-orientated machine learning
library. http://www.kyb.tuebingen.mpg.de/bs/people/spider.Wieczorkowska, A. (2001). Musical sound classification based on wavelet analysis. Fundamenta
Informaticae, 47, 175–188.Wieczorkowska, A. A. (2010). Towards musical data classification via wavelet analysis. Lecture Notes
in Computer Science, 1932, 147–165.Wieczorkowska, A. A., & Kubera, E. (2009). Identification of a dominating instrument in poly-
timbral same-pitch mixes using SVM classifiers with non-linear kernel. Journal of IntelligentInformation Systems, doi:10.1007/s10844-009-0098-3.
Wieczorkowska, A., & Kubik-Komar, A. (2010). Application of analysis of variance and post hoccomparisons to studying the discriminative power of sound parameters in distinguishing betweenmusical instruments. Journal of Intelligent Information Systems. doi:10.1007/s10844-010-0140-5.