Wave drag due to generation of capillary-gravity surface waves
13
Wave drag due to generation of capillary-gravity surface waves Teodor Burghelea and Victor Steinberg Department of Physics of Complex Systems, The Weizmann Institute of Science, Rehovot 76100, Israel ~Received 25 November 2001; revised manuscript received 3 September 2002; published 20 November 2002! The onset of the wave resistance via the generation of capillary-gravity waves by a small object moving with a velocity V is investigated experimentally. Due to the existence of a minimum phase velocity V c for surface waves, the problem is similar to the generation of rotons in superfluid helium near their minimum. In both cases, waves or rotons are produced at V .V c due to Cherenkov radiation. We find that the transition to the wave drag state is continuous: in the vicinity of the bifurcation the wave resistance force is proportional to A V 2V c for various fluids. This observation contradicts the theory of Raphae ¨l and de Gennes. We also find that the reduced wave drag force for different fluids and different ball size may be scaled in such a way that all the data collapse on a single curve. The capillary-gravity wave pattern and the shape of the wave-generating region are investigated both experimentally and theoretically. Good agreement between the theory and the experimen- tal data is found in this case. DOI: 10.1103/PhysRevE.66.051204 PACS number~s!: 47.35.1i, 68.03.2g I. INTRODUCTION An object, partially submerged in a fluid and moving uni- formly on a free fluid surface, is subjected to a drag force that can be of different physical nature. The most common one is a viscous drag, which at low Reynolds numbers, Re <1, is the Stokes drag, R f 53 p h dV , that is proportional to the object velocity V. ~Here d is the sphere diameter and h is the viscosity.! At higher Re, there is another contribution to the drag, which originates from either laminar or turbulent wakes, called the eddy resistance R e @1#. However, there ex- ists another contribution to the drag force, R w , due to the generation of surface capillary-gravity waves by the uni- formly moving object. These waves remove momentum from the object into infinity, and in this way produces the wave resistance force, acting on the object @2#. The problem of the wave resistance for long wavelength gravity waves is rather old one. It was an active subject of research for many years from the end of 19th century in relation to ship navigation and naval architecture. Since the viscosity of water is small, R f and R e contributions associ- ated with the viscosity are small compared with the wave resistance exerted on a ship. Thus, in the case of a large object generating the gravity waves, the total drag consists mainly of the wave resistance. Kelvin was the first to introduce a theoretical model to calculate the wave resistance @4#. Instead of solving a full hydrodynamic problem of a flow past a body of arbitrary shape, he suggested to consider a moving pressure point ap- plied along the body course to a free fluid surface. Later, Kelvin’s model was modified into a moving pressure area @5#. So the wave resistance was calculated for a given pres- sure distribution. Further development brought more sophis- ticated linear and nonlinear models, which provide a numeri- cal solution of the problem and describe main features of the phenomenon @6#. On the other hand, it seems to be surpris- ing, but, hitherto, nobody noticed that the wave resistance appears due to a bifurcation similar to many other nonequi- librium threshold phenomena, such as Rayleigh-Benard con- vection, Couette-Taylor flow, etc. In the case of the gravity waves, Shliomis and Steinberg @7# showed recently that there is a critical velocity V c such that for V ,V c one finds R w 50. This critical velocity is defined by the characteristic size of the object, L ~e.g., by the ship length!, so V c 5A gL /2p . Above the threshold the wave drag increases continuously with the velocity. Such continu- ous imperfect ~smoothed! bifurcation was indeed observed in the careful experiments with specially designed ship models by Taylor about a century ago @8#. The critical velocity ob- tained from the fit of the experimental data agrees rather well with the theoretically predicted value @7#. The dispersion relation for the capillary-gravity waves, on the other hand, exhibits a minimum in the phase velocity V c at the wave number, which is called the capillary wave num- ber k . Below V c the surface waves cannot be emitted, so no wave resistance force acts on the object. Thus, in this case the bifurcation from a no-wave to the wave-generating state is an intrinsic property of the dispersion law and is not re- lated to the size of the perturbing object. The dispersion re- lation for the surface waves is @1# v 2 5gk 1s k 3 / r , ~1! where v is the circular frequency, k is the wave number, r is the fluid density, g is the gravity acceleration, and s is the surface tension. According to Eq. ~1!, a phase velocity of the waves c p 5v / k has a minimum V c 5(4 g s / r ) 1/4 at the cap- illary wave number k 5A r g / s ~see Fig. 1!. The stationarity condition of the wave pattern in the frame moving with the object leads to @2# v 5kV cos u , ~2! where u is the angle between V and k. Eliminating v from Eqs. ~1! and ~2!, one finds cos u ~ k ! 5c ~ k ! / V . ~3! This equation has evidently no solutions for V ,V c and de- scribes the opening of the Cherenkov radiation cone at V .V c @9#. Generation of surface waves is analogous to the PHYSICAL REVIEW E 66, 051204 ~2002! 1063-651X/2002/66~5!/051204~13!/$20.00 ©2002 The American Physical Society 66 051204-1
-
Upload
independent -
Category
Documents
-
view
0 -
download
0
Transcript of Wave drag due to generation of capillary-gravity surface waves
PHYSICAL REVIEW E 66, 051204 ~2002!
Wave drag due to generation of capillary-gravity surface waves
Teodor Burghelea and Victor SteinbergDepartment of Physics of Complex Systems, The Weizmann Institute of Science, Rehovot 76100, Israel
~Received 25 November 2001; revised manuscript received 3 September 2002; published 20 November 2002!
The onset of thewave resistancevia the generation of capillary-gravity waves by a small object moving witha velocityV is investigated experimentally. Due to the existence of a minimum phase velocityVc for surfacewaves, the problem is similar to the generation of rotons in superfluid helium near their minimum. In bothcases, waves or rotons are produced atV.Vc due toCherenkov radiation. We find that the transition to thewave drag state is continuous: in the vicinity of the bifurcation the wave resistance force is proportional toAV2Vc for various fluids. This observation contradicts the theory of Raphae¨l and de Gennes. We also find thatthe reduced wave drag force for different fluids and different ball size may be scaled in such a way that all thedata collapse on a single curve. The capillary-gravity wave pattern and the shape of the wave-generating regionare investigated both experimentally and theoretically. Good agreement between the theory and the experimen-tal data is found in this case.
DOI: 10.1103/PhysRevE.66.051204 PACS number~s!: 47.35.1i, 68.03.2g
i-rcoR
ton
niomve
gtt o
ith
varis
to
rytteerehierthisncuo
erg
enu-nels
ell
on
m-noaseatere-re-
he
tthe
I. INTRODUCTION
An object, partially submerged in a fluid and moving unformly on a free fluid surface, is subjected to a drag fothat can be of different physical nature. The most commone is a viscous drag, which at low Reynolds numbers,<1, is the Stokes drag,Rf53phdV, that is proportional tothe object velocityV. ~Hered is the sphere diameter andh isthe viscosity.! At higher Re, there is another contributionthe drag, which originates from either laminar or turbulewakes, called the eddy resistanceRe @1#. However, there ex-ists another contribution to the drag force,Rw , due to thegeneration of surface capillary-gravity waves by the uformly moving object. These waves remove momentum frthe object into infinity, and in this way produces the waresistance force, acting on the object@2#.
The problem of the wave resistance for long wavelengravity waves is rather old one. It was an active subjecresearch for many years from the end of 19th centuryrelation to ship navigation and naval architecture. Sinceviscosity of water is small,Rf and Re contributions associ-ated with the viscosity are small compared with the waresistance exerted on a ship. Thus, in the case of a lobject generating the gravity waves, the total drag consmainly of the wave resistance.
Kelvin was the first to introduce a theoretical modelcalculate the wave resistance@4#. Instead of solving a fullhydrodynamic problem of a flow past a body of arbitrashape, he suggested to consider a moving pressure poinplied along the body course to a free fluid surface. LaKelvin’s model was modified into a moving pressure ar@5#. So the wave resistance was calculated for a given psure distribution. Further development brought more sopticated linear and nonlinear models, which provide a numcal solution of the problem and describe main features ofphenomenon@6#. On the other hand, it seems to be surpring, but, hitherto, nobody noticed that the wave resistaappears due to a bifurcation similar to many other noneqlibrium threshold phenomena, such as Rayleigh-Benard cvection, Couette-Taylor flow, etc.
1063-651X/2002/66~5!/051204~13!/$20.00 66 0512
ene
t
-
hfne
egets
ap-r,as-s-i-e-ei-n-
In the case of the gravity waves, Shliomis and Steinb@7# showed recently that there is a critical velocityVc suchthat for V,Vc one findsRw50. This critical velocity isdefined by the characteristic size of the object,L ~e.g., by theship length!, soVc5AgL/2p. Above the threshold the wavdrag increases continuously with the velocity. Such contious imperfect~smoothed! bifurcation was indeed observed ithe careful experiments with specially designed ship modby Taylor about a century ago@8#. The critical velocity ob-tained from the fit of the experimental data agrees rather wwith the theoretically predicted value@7#.
The dispersion relation for the capillary-gravity waves,the other hand, exhibits a minimum in the phase velocityVcat the wave number, which is called the capillary wave nuberk. Below Vc the surface waves cannot be emitted, sowave resistance force acts on the object. Thus, in this cthe bifurcation from a no-wave to the wave-generating stis an intrinsic property of the dispersion law and is notlated to the size of the perturbing object. The dispersionlation for the surface waves is@1#
v25gk1sk3/r, ~1!
wherev is the circular frequency,k is the wave number,r isthe fluid density,g is the gravity acceleration, ands is thesurface tension. According to Eq.~1!, a phase velocity of thewavescp5v/k has a minimumVc5(4gs/r)1/4 at the cap-illary wave numberk5Arg/s ~see Fig. 1!. The stationaritycondition of the wave pattern in the frame moving with tobject leads to@2#
v5kV cosu, ~2!
whereu is the angle betweenV andk.Eliminating v from Eqs.~1! and ~2!, one finds
cosu~k!5c~k!/V. ~3!
This equation has evidently no solutions forV,Vc and de-scribes the opening of the Cherenkov radiation cone aV.Vc @9#. Generation of surface waves is analogous to
©2002 The American Physical Society04-1

rg.
tiob
veth
aetianio
ofgisthse
linar
qs
itye
o
ofe--on
itola
s
thees
by an
forperersla-is-
ver
e atthe
sion
wesion-
atn
ns
ef.tet-re-
T. BURGHELEA AND V. STEINBERG PHYSICAL REVIEW E66, 051204 ~2002!
Cherenkov emission of electromagnetic waves by a chamoving uniformly with a superluminal velocity in a mediumDue to the linear dispersion relation, the Cherenkov radiaof the electromagnetic waves occurs at every wave numinto a cone with an openingu defined by Eq.~3! at c inde-pendent ofk. Thus, for the linear dispersion, the no-waregion is separated from the wave-generating zone byCherenkov cone for electromagnetic waves@9# and by theMach cone for sound waves@2#.
In the case of the nonlinear dispersion law the wave ptern is much more intricate. The pattern of water waves gerated by a ship or a body moving over the surface of swater is one of the most common observable phenomenNature. The wave pattern follows the moving body uchanged in form, and the waves are confined to a regbehind the body that has a V-shaped form in the caseship. This wedge-shaped region is called the Kelvin wed@2#. The dispersive property of the capillary-gravity wavesalso responsible for the complicated wave pattern andshape of the wave-generating region, which will be discusin this paper later on.
Another difference between waves with linear and nonear dispersion laws appears in the range of excited wnumbers. In the case of the capillary-gravity waves, fogivenV>Vc, the system of Eqs.~1! and~2! has solutions inthe range 0<u,x, where the anglex is defined by cosx5Vc /V. This range ofu corresponds to the intervalkg,k,kc of wave numbers resulting from the intersection of E~1! with a straight line of slopeV ~see Fig. 1!. Therefore,unlike the electromagnetic waves, the capillary-gravwaves are radiated within a finite range of the wave numbDk5kc2kg . It tends to zero asDk54kAe, when V ap-proachesVc from above, wheree5(V2Vc)/Vc .
The presence of the minimum on the dispersion curvethe capillary-gravity waves@Eq. ~1!# results in a gap in thespectrumv(k), similar to the gap in the energy spectruma superfluid@10#. The existence of the minimum phase vlocity for the dispersion curve~1! is analogous to the existence of the Landau critical velocity for the phonon-rotenergy spectrum in a superfluid helium@10#. The problem ofthe drag onset at the Landau critical velocityV0 due to theradiation of rotons was recently considered theoreticallyRef. @11#. Pomeau and Rica observed the onset of the rogeneration at a certain critical velocity in numerical simutions of the generalized nonlinear Shro¨dinger equation, andpointed out but without proof, that the roton drag force clo
FIG. 1. Dispersion curves for capillary-gravity waves:~a! v(k)and ~b! wave number dependence of the phase velocitycp(k) andthe group velocitycg(k).
05120
e
ner
e
t-n-llin
-nae
ed
-vea
.
rs
f
nn
-
e
to the onset depends on the control parametere5(V2V0)/V0 as Ae in three dimensions~3D! and as loge in~2D!.
The onset of the wave resistance and its behavior insupercritical region for the capillary-gravity surface wavwas theoretically considered in recent papers@12,13#. Boththese papers have studied the wave resistance createdexternal pressure distribution that moves with speedV. Thedifference is that in the first paper both 2D and 3D casesan inviscid fluid were considered. While in the second paa 2D case for a low viscous fluid was treated. Both papused the same Kelvin model. The main result of the calcutions for the 3D waves with the point localized pressure dtribution (d-pressure distribution! in Ref. @12# is the predic-tion of a discontinuous transition to the nonzero waresistance state atV5Vc , if the object size is equal to osmaller than the capillary wavelengthlc52p/k @12#. It waspredicted that the value of the jump in the wave resistancthe transition strongly depends on the surface tension:jump increases with the decreasing of the surface ten@12#.
In order to elaborate further on the theoretical model,conducted numerical calculations based on the expres~2.33! in Ref. @12# using the following axisymmetric pressure distributionP(r ,b)5b2p/2p(11b2r 2)3/2, which is oneof the presentations of thed function, p is the total verticalapplied force used in Ref.@12#, andb21 is the width of thedistribution. Indeed, it is easy to be convinced thlimb→1`P(r ,b)5pd(r )/pr , and this pressure distributiois identical to thed-pressure distribution chosen in Ref.@12#.The Fourier transform of the pressure distributionP(r ,b) isG(k,b)5pg(k,b), where g(k,b)5exp(2k/b). Then thewave resistance can be expressed in the following form:
R~x!5kp2
psx2f ~x,b!, ~4!
where
f ~x,b!5E0
arccos(1/x)
~g~kc!2@cosu22Acosu42x24#2
1g~kg!2@cosu21Acosu42x24#2!
3cosu
2Acosu42x24du. ~5!
Here x5V/Vc>1 is used. From the above expressioone can see that atb→` P(r )5pd(r ), G(k)5p, g(k)51, and
f ~x!5E0
arccos(1/x)
cosu2 cosu42x24
Acosu42x24du,
i.e., one comes back to the function presented in R@12# for the d-pressure distribution. So one can wrilimb→1` f (x,b)5 f (x). Our numerical simulations show thawith b being fixed at about 106 or greater, one cannot distinguish, with the accuracy of the calculations, between the
4-2

ur
e
nce
-
t
0es
ofthe
er.-
canve
pa-re-the
lue
sizenge
en-ore
oksis-n
sesthere
ob-on
ofpa-
t of
ach
nf
-f
WAVE DRAG DUE TO GENERATION OF CAPILLARY- . . . PHYSICAL REVIEW E 66, 051204 ~2002!
sult of Ref. @12# and the calculation based on our pressdistribution with f (x,`)x→15p/2A2. Then the jump in thewave resistance at the transition is defined by limx→1R(x)5kp2/2A2s as in Ref.@12#. Thus the difference between thd-pressure distribution, used in Ref.@12#, and the finite-sizepressure distribution taken by us shows up just in the futional dependence off (x,b) on the reduced velocity and thdistribution widthb21.
In Figs. 2–4 we present the dependencef (x,b/k) at fixedvalues ofb/k in the wide range of variation of this parameter. One can find in Fig. 2 that atb/k→` one recovers theresult of Ref.@12# ~curve 4 on the main plot and in the inse!.At the values ofb/k525,17,10~Fig. 2! the wave resistancejump at the transition reduces, so that it reduces about 2at b/k510 ~curve 1 in the inset!, and the wave resistancdependence onV/Vc becomes much weaker than in the caof the d-pressure distribution. Actually atb/k510 it satu-rates atV/Vc.1.8. By the way, the value ofb/k517 ~curve2! corresponds to the object sized5b2150.2 mm, if oneconsiders the capillary length for water (k52p/lc53.696 cm21).
FIG. 2. Dependence off (x,b/k) on the reduced velocityx forthree values ofb/k: ~1! 10, ~2! 17, ~3! 25; curve~4! shows theresult from Ref.@12# for comparison. The inset shows the depedence ofx2f (x,b/k) on the reduced velocityx at the same values ob/k as on the main plot. Curve~4! shows the result from Ref.@12#.
FIG. 3. f (x,b/k) vs x at b/k50.89 @curve ~1!#, b/k51.19@curve~2!#, andb/k51.78 @curve~3!#. The inset shows the dependence ofx2f (x,b/k) on the reduced velocityx at the same values ob/k as on the main plot.
05120
e
-
%
e
In Fig. 3 we present the calculations for three valuesb/k51.78, 1.19, 0.89 that correspond to three values ofobject size d51.57, 2.35, 3.14 mm, respectively~at k53.696 cm21) used in the experiment reported in the papIn Fig. 4 the dependencef (x) at b/k51 is presented separately.
From the calculations presented in Figs. 3 and 4 oneconclude that the overall functional behavior of the waresistance~see the insets in Figs. 3 and 4! contradicts thatfound experimentally in the experiments reported in theper. The jump in the wave resistance at the transitionmains, though reduced down to about 11% of its value attransition for thed-pressure distribution case~see the inset inFig. 3, the curve 1, which corresponds to the smallest vaof b/k used!. Moreover, at small values ofb/k (b/k below10 that corresponds tod.0.53 mm atk53.696 cm21) thewave resistance is a decreasing function ofV/Vc , and thisfact also contradicts the common sense. Thus, the finite-pressure distribution used in the calculations does not chathe type of the transition but makes the functional depdence of the wave resistance above transition even mquestionable.
Theoretical predictions for a two-dimensional case loeven more problematic. The calculations of the wave retance for an inviscid fluid with the pressure distributioalong a line lead to a singular solution atx→1 @12#. Whilemore recent calculations@13# showed that including viscosityremoves the singularity: the wave resistance increasteeply at the transition but remains bounded. Abovetransition R(x) is a decreasing function that once momakes these predictions doubtful.
A very recent paper by Sun and Keller@14# deals with thewave resistance dependence on the velocity of a movingject far away from the bifurcation. It is basically an extensiof the theory presented in Ref.@12# to the region of thevelocities far away from the bifurcation. So, a comparisonthe predictions of this paper is beyond the scope of ourper.
Recently the results of two experiments on the onsethe capillary-gravity wave resistance were reported@15,16#.The conclusions of these two experiments contradict eother. While the authors of Ref.@15# claim that the experi-
-
FIG. 4. f (x,b/k) vs x at b/k51 corresponding to the capillarylength. The inset shows the dependence ofx2f (x,b/k) on the re-duced velocityx at the same value ofb/k as on the main plot.
4-3

ta
th
tho
idtraon
om
exutaidrthvaavc.
nsthlia
gaofllehaa
tiodloc
iait
inher
.
th
eact
anire
ro-
al
x-theusm-
nlysi-n isomave
me-
r-elfnsi-
it
rtal-dy
ure
Aen-
all
ch aall
thenackouspen-hirdrstiesm-
he
T. BURGHELEA AND V. STEINBERG PHYSICAL REVIEW E66, 051204 ~2002!
ment shows a discontinuous transition to the wave drag sin agreement with the theory@12#, the conclusion of Ref.@16#, which is a short version of the current paper, is thattransition is continuous~smooth!. This discrepancy and acomparison with the results of the experiment by others@15#will be discussed in this paper.
In this paper we investigate the dependence of bothwave drag force and the capillary-gravity wave patternthe object velocityV in the vicinity of the transition for vari-ous fluids and object sizes on the air-fluid and fluid-fluinterfaces. The results of the experiments clearly demonsthat the transition to the wave drag state is a continuousin contradiction to the theoretical prediction@12#, as well asthe behavior of the wave resistance as a function of theject velocity above the threshold is drastically different frothe predicted one@12,13#.
The paper is organized as follows. The details of theperimental setup of calibration and experimental procedare given in Sec. II. Section III presents the experimenresults on the wave drag for both air-fluid and fluid-fluinterfaces. Then the experimental results on the wave dare discussed and compared with the theory and withexperiment by others in Sec. IV. The experimental obsertions and the results of theoretical calculations of the wpattern and the shape of the wave wedge are given in SeFinally, the conclusions are presented in Sec. VI.
II. EXPERIMENTAL SETUP AND EXPERIMENTALPROCEDURE
A. Experimental setup
Experiments were conducted in a circular rotating chanof 12.4 cm outer radius and 3.6 cm gap, made of plexiglawith a stainless steel ball, as an object, suspended on atungsten wire, which is glued to a thin elastic made of acrypolymer fiber. For visualization, we used also a larger gchannel with outer radius 17.5 cm and 15 cm gap. Thesize of the channel was chosen to ensure visualizationwave pattern from above as well as from below. A smagap could lead to wave reflection from the channel walls tcould complicate pattern interpretation. The channel wdriven by a stepping motor via a belt transmission with ra0.138 and with a velocity controlled better than 0.02%. Abrushless motor with an optical encoder for feedback veity control as another option was also used to compareperformance with the stepping motor. The main concern winsufficient smoothness of the stepping motor drive andinfluence on the experimental data, particularly in the vicity of the critical velocity. The comparison showed that tstepping motor drive does not affect the data. Balls of vaous diametersd ~1.57, 2.35, and 3.14 mm! and a tungstenwire and a fiber made of acrylic polymer~0.3 and 0.7 mmdiameter, respectively! half-immersed into a fluid, were usedEach of them is smaller thanlc for any fluid used in theexperiments.
The main idea of the setup is to measure the force onball without allowing it to move from the initial~zero veloc-ity! position by using an appropriate feedback loop. The rson for this is the following: if the ball moves, the conta
05120
te
e
en
tee,
b-
-rel
age-eV.
els,in
cppa
rts
c-
tsss-
i-
e
-
curve between the fluid and the ball’s surface tilts withangle approximately equal to the deviation angle of the w~Fig. 5!. Thus, the capillary force~which, in this case, isnormal to the contact line’s plane, and its magnitude is pportional to the length of the contact line! will make a non-zero angle with the vertical direction providing an additionforce component on the direction of the flow (y direction!.The magnitude of this component is not negligible. For eample, in the case of water and a 3.14-mm-diameter ball,capillary force is almost 200 times larger than the viscodrag. So the tilted contact line can smear out almost copletely the transition to the wave drag state@16#. This non-negligible contribution to the measured force is not the oreason for holding the ball in the same initial vertical potion during the force measurements. The second reasothat the capillary force is hysteretic and leads to randdiscontinuous variations in the force measurements. We hobserved this effect in the experiments conducted with atallic wire and a fiber immersed into a fluid~see below!.Thus, hysteretic behavior of the capillary force would intefere with the drag force variations due to the transition itsand would complicate a decision on the nature of the tration to the wave-generating state. As we will show belowis the case in the experiment described in Ref.@15#.
Our way to hold the ball in the initial position was to exea magnetic force applied to the ball via the proportionintegral feedback loop. The latter was activated via edcurrent commercial displacement gauge~EMD 1050 ElectroCorporation!, used as a position sensitive detector to measa deviation of a brass cylinder~2 mm diameter!, mounted onthe same wire as the object itself, from its initial position.signal from the displacement detector drives via instrumtational amplifier and power amplifier~PS! two electromag-netic coils, which provide the magnetic force to hold the bin the initial position@see Fig. 6~b!#. A current supplied to thecoils is calibrated as a force. The coils are designed in suway that the magnetic force experienced by the metallic bis proportional and always opposite to the deviation ofwire from the initial vertical position. One should mentiothat in our setup it was impossible to activate the feedbwith a ball of less than 1.5 mm diameter. Indeed, the viscdrag reduce with a radius between linear and square dedence but the stabilizing magnetic forces reduces in a tpower@see further Eq.~8!#. It means that for the parameteof the coils used for the feedback, and the object velociobserved in the experiment, one is limited by the ball dia
FIG. 5. The capillary contribution to the measured force in tcase of wetting. The ball is allowed to move.
4-4
el-t-
WAVE DRAG DUE TO GENERATION OF CAPILLARY- . . . PHYSICAL REVIEW E 66, 051204 ~2002!
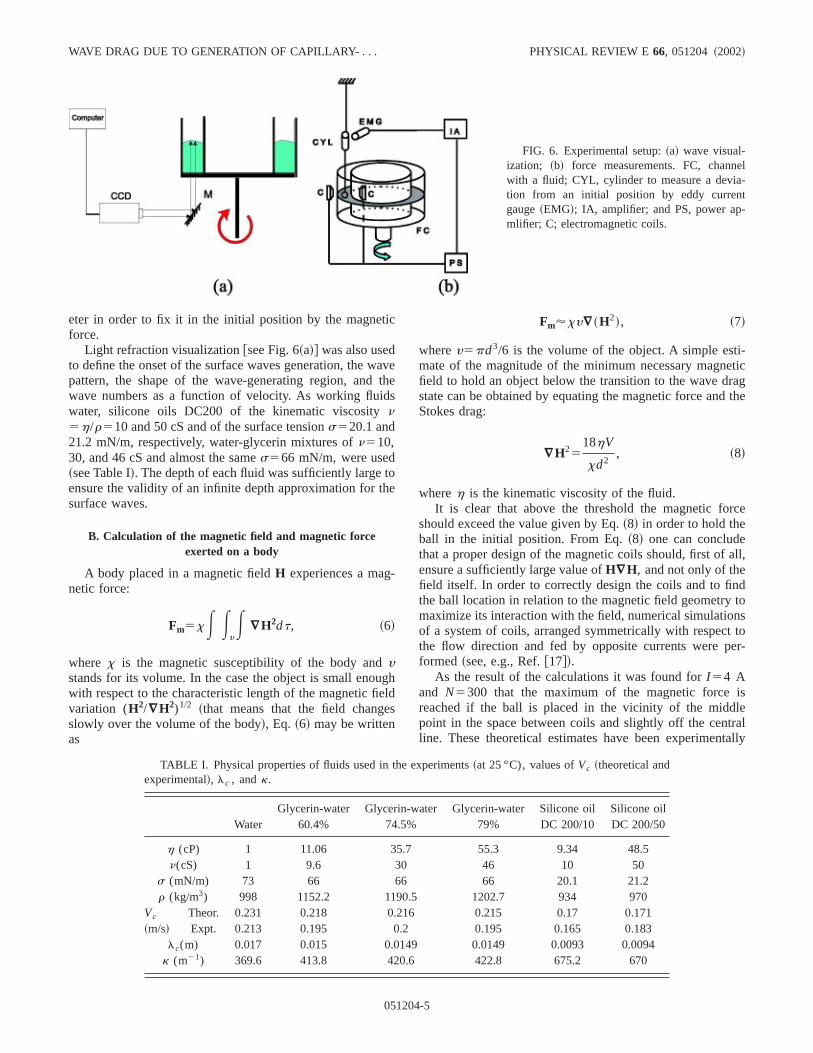
FIG. 6. Experimental setup:~a! wave visual-ization; ~b! force measurements. FC, channwith a fluid; CYL, cylinder to measure a deviation from an initial position by eddy currengauge~EMG!; IA, amplifier; and PS, power apmlifier; C; electromagnetic coils.
ic
at
ds
tohe
-
ugeles
i-eticagthe
rce
all,
dto
nsto
er-
isletraltally
eter in order to fix it in the initial position by the magnetforce.
Light refraction visualization@see Fig. 6~a!# was also usedto define the onset of the surface waves generation, the wpattern, the shape of the wave-generating region, andwave numbers as a function of velocity. As working fluiwater, silicone oils DC200 of the kinematic viscosityn5h/r510 and 50 cS and of the surface tensions520.1 and21.2 mN/m, respectively, water-glycerin mixtures ofn510,30, and 46 cS and almost the sames566 mN/m, were used~see Table I!. The depth of each fluid was sufficiently largeensure the validity of an infinite depth approximation for tsurface waves.
B. Calculation of the magnetic field and magnetic forceexerted on a body
A body placed in a magnetic fieldH experiences a magnetic force:
Fm5xE EyE “H2dt, ~6!
where x is the magnetic susceptibility of the body andystands for its volume. In the case the object is small enowith respect to the characteristic length of the magnetic fivariation (H2/“H2)1/2 ~that means that the field changslowly over the volume of the body!, Eq. ~6! may be writtenas
05120
vehe
hd
Fm'xy“~H2!, ~7!
wherey5pd3/6 is the volume of the object. A simple estmate of the magnitude of the minimum necessary magnfield to hold an object below the transition to the wave drstate can be obtained by equating the magnetic force andStokes drag:
“H2518hV
xd2, ~8!
whereh is the kinematic viscosity of the fluid.It is clear that above the threshold the magnetic fo
should exceed the value given by Eq.~8! in order to hold theball in the initial position. From Eq.~8! one can concludethat a proper design of the magnetic coils should, first ofensure a sufficiently large value ofH“H, and not only of thefield itself. In order to correctly design the coils and to finthe ball location in relation to the magnetic field geometrymaximize its interaction with the field, numerical simulatioof a system of coils, arranged symmetrically with respectthe flow direction and fed by opposite currents were pformed ~see, e.g., Ref.@17#!.
As the result of the calculations it was found forI 54 Aand N5300 that the maximum of the magnetic forcereached if the ball is placed in the vicinity of the middpoint in the space between coils and slightly off the cenline. These theoretical estimates have been experimen
il0
TABLE I. Physical properties of fluids used in the experiments~at 25 °C), values ofVc ~theoretical andexperimental!, lc , andk.
Glycerin-water Glycerin-water Glycerin-water Silicone oil Silicone oWater 60.4% 74.5% 79% DC 200/10 DC 200/5
h (cP) 1 11.06 35.7 55.3 9.34 48.5n(cS) 1 9.6 30 46 10 50
s (mN/m) 73 66 66 66 20.1 21.2r (kg/m3) 998 1152.2 1190.5 1202.7 934 970
Vc Theor. 0.231 0.218 0.216 0.215 0.17 0.171~m/s! Expt. 0.213 0.195 0.2 0.195 0.165 0.183
lc(m) 0.017 0.015 0.0149 0.0149 0.0093 0.0094k (m21) 369.6 413.8 420.6 422.8 675.2 670
4-5

he
hea
fi
asse
tr
urreoai
to
em
ftr
th.tuath
eal
or-or-theoal
hisi-
he
on-du-nt
nits
by
elythe
th-
isticu-all
T. BURGHELEA AND V. STEINBERG PHYSICAL REVIEW E66, 051204 ~2002!
verified by measuring the field at different locations in tspace between coils with a Hall effect magnetometer~Oxford5200!.
C. The design of the magnetic coils
Space limitation particularly for the inner coil imposes tmain restrictions on the coil design. It first of all concernscooling system: air cooling can be only used instead owater-cooling system. The design of the coils is shownFig. 7. The optimization of the design~selection of the wirediametera and one of the characteristic sizes of the coil,Ly ,at the fixed value of another size,Lx524 mm) is a compro-mise between the maximum possible magnitude of the mnetic field and the minimum possible heat dissipation. Aresult the optimal value of the dissipated power at thelected wirea51.3 mm and the number of turnsN5300 isabout 90 W. Since each run lasts for a rather long timeaverage the current data, significant heating of the coilsquires at least air cooling. In spite of this the coil temperatis raising with time, and one should correct the measuvalues of the current for the temperature variation of the cresistance. So, for this reason, a thermistor in a coil winstalled, and the coil temperature was recorded along wthe current. Then on each time stepj of the sampling, themeasured value of the current was corrected according
I j ,c5I j
12a~Tj2Tinit !Rinit /Rj, ~9!
where I j ,c is the corrected value of the current at the timstep j , I j is the measured value of the current at the tistep j , a is the thermal coefficient of the coil resistance,TjandTinit are the coil temperatures at the time stepj and at theinitial moment~ at the ambient temperature!, Rj andRinit arethe coil resistances at the time stepj and at the beginning othe experiment. From Eq.~9! it is rather clear that the effecof the coil heating leads to a suppression of the measucurrent and even its saturation at a certain velocity ofobject if the temperature variation is rather substantialmeans that during the experiment, when the coil temperachanges with time, the measured value of the current on estep depends not only on the object velocity, but also oncoil temperature at each step, i.e.,I j5I (Vj ,Tj ). Thus, the
FIG. 7. Magnetic coil design.
05120
an
g-a-
oe-edils
th
e
edeItreche
thermal corrections are of crucial importance to obtain rvalues of the force exerted on the object.
D. Force calibration and parameter selection of thefeedback loop
Since the magnetic field generated by a coil is proptional to the current applied, the magnetic force is proptional to the square of the current if the field changes oncharacteristic length much larger than the ball size. The gof the calibration procedure is to find the coefficientKm inrelation between the force and the current,Fm5KmI 2. As thefirst step, the position sensitive sensor was calibrated. Twas done by moving a metallic object mounted on a mcrometer. Measuring the voltage output of the sensor,Us ,versus the distance of the object from the sensor,Dx, pro-vides the calibration curve. The result of the linear fit of tcalibration curve givesUs5nDx1m, where n50.011 1260.000 04 V/mm andm52.30360.0050 V.
As the next step, the magnetic force calibration was cducted by suspending in still air, between two coils a penlum shown in Fig. 8. Then, for each value of the currefeeding the coils, the signal of the sensor, calibrated in uof distance, was recorded. The deviationDx5O1M1 ~Fig. 8!of the pendulum can be related to the forces applied to it,writing the torque balance condition~the restoring elasticforce of the thin fiber was neglected as being extremsmall!. As a result the sensor signal can be related tomeasured parameters of the system and the coefficientKm bythe following expression:
Us5nDx01m1cL2KmI 2
Ag2~mbL2 /L11mcyl!21Km
2 I 4~L2 /L1!2,
~10!
where g59.81 m/sec2, mb50.14 g, mcyl50.2 g, L153.5 cm, L252.5 cm. The calibration data together withe nonlinear fit by Eq.~10!, is shown in Fig. 9. The corresponding parameters of the fit were found to beDx0520060.05mm andKm52.9933102765310210 N/A2.
Another issue that deserves attention is the charactertime of the proportional-integral feedback loop. During reglation of the object location via the feedback loop the b
FIG. 8. The forces acting on the pendulum:Fm is the magneticforce; Fel is the restoring force of the thin fiberF.
4-6
cebaheua
thilrad.oe
taarre
toldsare
g
ly-
ins
i-
al
les,allthedif-
ve
ter
ig.izethe
-esracy
erthe
ilthois
cityoil
in-lots
WAVE DRAG DUE TO GENERATION OF CAPILLARY- . . . PHYSICAL REVIEW E 66, 051204 ~2002!
oscillates around an equilibrium position. A correct formeasurement by this technique assumes that the feedoscillations do not interfere with the flow. It means that tcharacteristic time and the amplitude of the current flucttions should be much smaller than the characteristic timethe flow and the average current values, respectively. Incase of the resonant feedback regulation, the current osction amplitude can reach as large as about 6% of the avecurrent value. So the resonance regime should be avoidean overdamped regime of the feedback loop, which wastained by tuning the integration time and the gain, the currfluctuations are remained as small as 0.5%.
III. EXPERIMENTAL RESULTS
A. Wave drag force as a function of the object velocity forvarious air-fluid interfaces
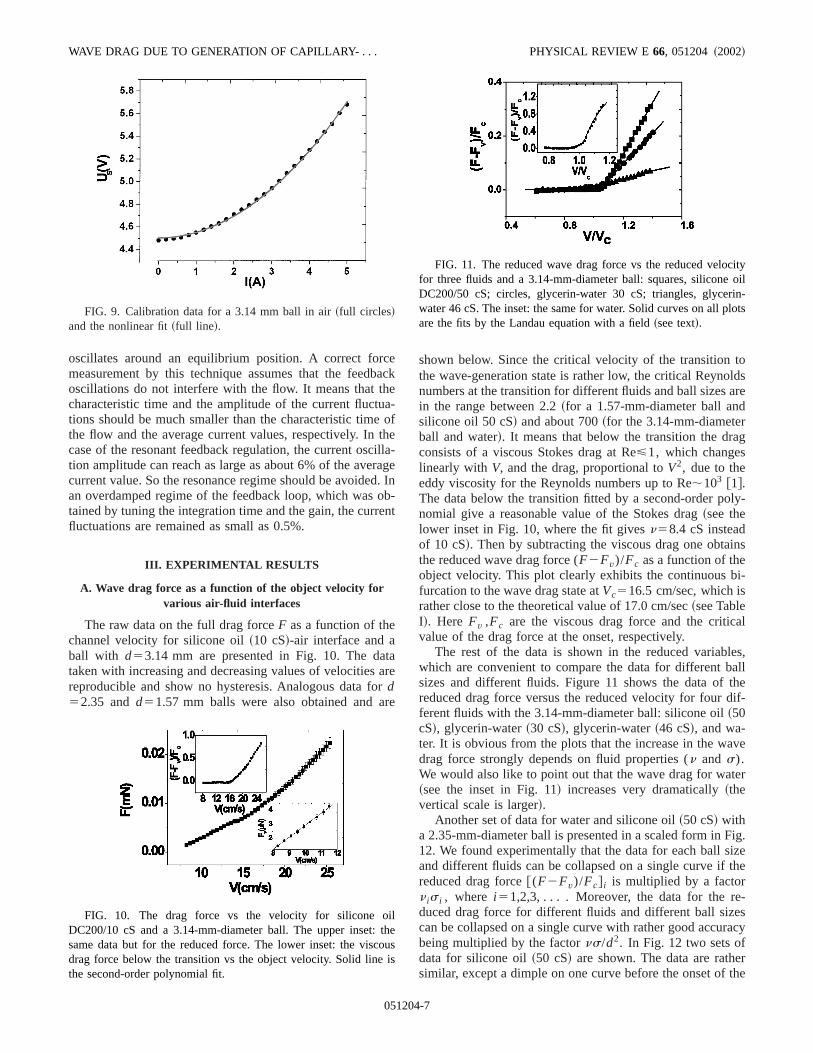
The raw data on the full drag forceF as a function of thechannel velocity for silicone oil~10 cS!-air interface and aball with d53.14 mm are presented in Fig. 10. The dataken with increasing and decreasing values of velocitiesreproducible and show no hysteresis. Analogous data fod52.35 andd51.57 mm balls were also obtained and a
FIG. 9. Calibration data for a 3.14 mm ball in air~full circles!and the nonlinear fit~full line!.
FIG. 10. The drag force vs the velocity for silicone oDC200/10 cS and a 3.14-mm-diameter ball. The upper inset:same data but for the reduced force. The lower inset: the viscdrag force below the transition vs the object velocity. Solid linethe second-order polynomial fit.
05120
ck
-ofe
la-geIn
b-nt
re
shown below. Since the critical velocity of the transitionthe wave-generation state is rather low, the critical Reynonumbers at the transition for different fluids and ball sizesin the range between 2.2~for a 1.57-mm-diameter ball andsilicone oil 50 cS! and about 700~for the 3.14-mm-diameterball and water!. It means that below the transition the draconsists of a viscous Stokes drag at Re<1, which changeslinearly with V, and the drag, proportional toV2, due to theeddy viscosity for the Reynolds numbers up to Re;103 @1#.The data below the transition fitted by a second-order ponomial give a reasonable value of the Stokes drag~see thelower inset in Fig. 10, where the fit givesn58.4 cS insteadof 10 cS!. Then by subtracting the viscous drag one obtathe reduced wave drag force (F2Fv)/Fc as a function of theobject velocity. This plot clearly exhibits the continuous bfurcation to the wave drag state atVc516.5 cm/sec, which israther close to the theoretical value of 17.0 cm/sec~see TableI!. Here Fv ,Fc are the viscous drag force and the criticvalue of the drag force at the onset, respectively.
The rest of the data is shown in the reduced variabwhich are convenient to compare the data for different bsizes and different fluids. Figure 11 shows the data ofreduced drag force versus the reduced velocity for fourferent fluids with the 3.14-mm-diameter ball: silicone oil~50cS!, glycerin-water~30 cS!, glycerin-water~46 cS!, and wa-ter. It is obvious from the plots that the increase in the wadrag force strongly depends on fluid properties (n and s).We would also like to point out that the wave drag for wa~see the inset in Fig. 11! increases very dramatically~thevertical scale is larger!.
Another set of data for water and silicone oil~50 cS! witha 2.35-mm-diameter ball is presented in a scaled form in F12. We found experimentally that the data for each ball sand different fluids can be collapsed on a single curve ifreduced drag force@(F2Fv)/Fc# i is multiplied by a factorn is i , where i 51,2,3, . . . . Moreover, the data for the reduced drag force for different fluids and different ball sizcan be collapsed on a single curve with rather good accubeing multiplied by the factorns/d2. In Fig. 12 two sets ofdata for silicone oil~50 cS! are shown. The data are rathsimilar, except a dimple on one curve before the onset of
eus
FIG. 11. The reduced wave drag force vs the reduced velofor three fluids and a 3.14-mm-diameter ball: squares, siliconeDC200/50 cS; circles, glycerin-water 30 cS; triangles, glycerwater 46 cS. The inset: the same for water. Solid curves on all pare the fits by the Landau equation with a field~see text!.
4-7

dnoeusose
ec-onice
rvdhen
m
5nasiliin
ni
site
theca-is
ddi-e-tion.
toackwnrage torcenran-the
h aea
theall
ex-
ce
hew
ata-e
ionr-
le
ili-les
aull
T. BURGHELEA AND V. STEINBERG PHYSICAL REVIEW E66, 051204 ~2002!
wave generation. Such a dimple was sometimes observeall sizes of balls but more pronounced for smaller sizes icase, when silicone oil was used as a fluid. Silicone oil dnot wet the ball surface, and as a result a convex meniscformed. The observed dimple results from a meniscus ption instability, which depends on the initial location of thmeniscus, on properties of the ball surface, and pressurdistribution over the ball surface with increasing fluid veloity. The dimple depth strongly depends on the initial locatiof the meniscus and cleanliness of the ball surface, whboth were not well controlled. The latter results in rathrandom values of the dimple depth observed. The obsedecrease in the value of the reduced drag force is causethe interface instability, which leads to a relocation of tmeniscus position down and the corresponding reductiothe drag force.
Finally the last set of the data for the ball size of 1.57 mdiameter and four different fluids~glycerin-water with threevalues of viscosity 10, 30, and 46 cS, and silicone oil ofcS! is presented also in the scaled form in Fig. 13. As ocan mention the data for glycerin-water 10 cS exhibit a webump and the data for silicone oil show a slight dimple jubefore the transition. Glycerin-water solution wets and scone oil does not wet the ball. So the possible interfacestability in these two cases leads to relocation of the me
FIG. 12. The reduced scaled wave drag forcejsc vs the reducedvelocity for two fluids and a 2.35-mm ball: squares, water; circand open hexagons, silicone oil DC200/50 cS~see text for defini-tion!.
FIG. 13. The reduced scaled wave drag forcejsc vs the reducedvelocity for four fluids and a 1.57-mm-diameter ball: circles, scone oil DC200/50 cS; stars, glycerin-water 10 cS; triangglycerin-water 30 cS; diamonds, glycerin-water 46 cS.
05120
forasisi-
re-
hredby
in
0ekt--
s-
cus in opposite directions and to correspondingly oppocontributions into the drag force.
Thus, all the data demonstrate that the transition towave drag state is continuous, and the quality of the bifurtion is about the same for all ball sizes and all fluids. Itrather surprising that such strong perturbation as an ational interface instability before the bifurcation into wavgenerating state does not change the type of the bifurca
To emphasize the role of the contact line relocation duethe ball displacement, two sets of data, one with the feedbon as in Fig. 10, and another with the feedback off are shoin Fig. 14. Since the capillary force exceeds the wave dforce near the onset, the relocation of the contact line duthe ball displacement and the variation in the capillary foin this way diminish partially or completely the contributioof the wave drag into the force measurements. So, the tsition is almost smeared out in the measurements withoutfeedback.
B. Wave drag force as a function of the object velocity forvarious fluid-fluid interfaces
We also conducted experiments on the wave drag witball located on the interface between two fluids. The idwas to reach a small critical velocity due to a reduction ofsurface tension on the fluid-fluid interface and due to a smdifference in fluids densities. Indeed, the correspondingpressions for the critical velocity
Vc5@gs~r12r2!#1/4A2/~r11r2! ~11!
and the capillary wave length
lc52pAs/g~r12r2! ~12!
are modified in this case compared with an air-fluid interfa@3#.
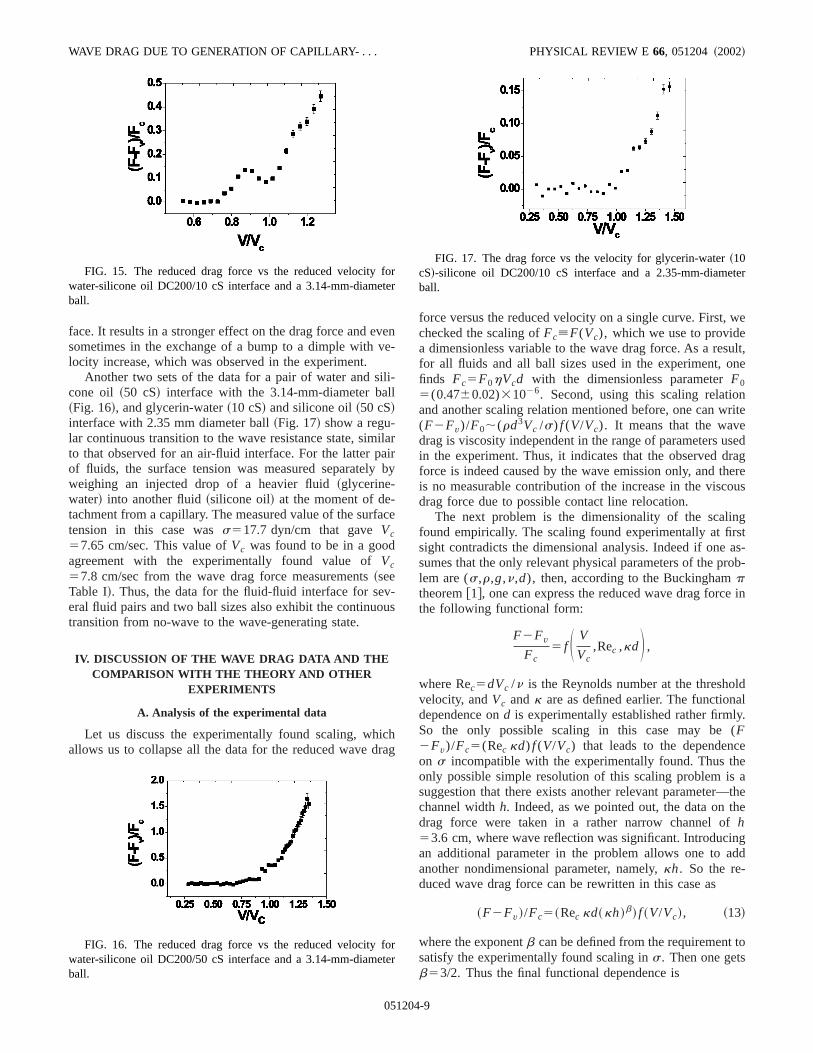
As the experiments show, the critical velocity e.g., for twater-silicone oil~10 cS! interface, was indeed found as loas Vc'4 cm/sec~see Fig. 15!. It corresponds to rather lowsurface tension ofs53.7 dyn/cm. The data clearly exhibitpretransitional bump, which is related to the interface insbility discussed above. For a fluid-fluid interface with onwetting and another nonwetting fluid, the meniscus positis more susceptible to the instability than an air-fluid inte
s
,
FIG. 14. The reduced wave drag force vs the velocity forsilicone oil DC200/50 cS and a 3.14-mm-diameter ball: fsquares, with feedback, open squares, without feedback.
4-8
veve
ilill
ila
a
v-u
icra
we
ult,ne
nrite
sedragere
ous
ngstas-rob-
e in
ldaly.(eeathe
he
ngdd
to
terfote
fote
WAVE DRAG DUE TO GENERATION OF CAPILLARY- . . . PHYSICAL REVIEW E 66, 051204 ~2002!
face. It results in a stronger effect on the drag force and esometimes in the exchange of a bump to a dimple withlocity increase, which was observed in the experiment.
Another two sets of the data for a pair of water and scone oil ~50 cS! interface with the 3.14-mm-diameter ba~Fig. 16!, and glycerin-water~10 cS! and silicone oil~50 cS!interface with 2.35 mm diameter ball~Fig. 17! show a regu-lar continuous transition to the wave resistance state, simto that observed for an air-fluid interface. For the latter pof fluids, the surface tension was measured separatelyweighing an injected drop of a heavier fluid~glycerine-water! into another fluid~silicone oil! at the moment of de-tachment from a capillary. The measured value of the surftension in this case wass517.7 dyn/cm that gaveVc57.65 cm/sec. This value ofVc was found to be in a goodagreement with the experimentally found value ofVc57.8 cm/sec from the wave drag force measurements~seeTable I!. Thus, the data for the fluid-fluid interface for seeral fluid pairs and two ball sizes also exhibit the continuotransition from no-wave to the wave-generating state.
IV. DISCUSSION OF THE WAVE DRAG DATA AND THECOMPARISON WITH THE THEORY AND OTHER
EXPERIMENTS
A. Analysis of the experimental data
Let us discuss the experimentally found scaling, whallows us to collapse all the data for the reduced wave d
FIG. 15. The reduced drag force vs the reduced velocitywater-silicone oil DC200/10 cS interface and a 3.14-mm-diameball.
FIG. 16. The reduced drag force vs the reduced velocitywater-silicone oil DC200/50 cS interface and a 3.14-mm-diameball.
05120
n-
-
arirby
ce
s
hg
force versus the reduced velocity on a single curve. First,checked the scaling ofFc[F(Vc), which we use to providea dimensionless variable to the wave drag force. As a resfor all fluids and all ball sizes used in the experiment, ofinds Fc5F0hVcd with the dimensionless parameterF05(0.4760.02)31026. Second, using this scaling relatioand another scaling relation mentioned before, one can w(F2Fv)/F0;(rd3Vc /s) f (V/Vc). It means that the wavedrag is viscosity independent in the range of parameters uin the experiment. Thus, it indicates that the observed dforce is indeed caused by the wave emission only, and this no measurable contribution of the increase in the viscdrag force due to possible contact line relocation.
The next problem is the dimensionality of the scalifound empirically. The scaling found experimentally at firsight contradicts the dimensional analysis. Indeed if onesumes that the only relevant physical parameters of the plem are (s,r,g,n,d), then, according to the Buckinghamptheorem@1#, one can express the reduced wave drag forcthe following functional form:
F2Fv
Fc5 f S V
Vc,Rec ,kdD ,
where Rec5dVc /n is the Reynolds number at the threshovelocity, andVc andk are as defined earlier. The functiondependence ond is experimentally established rather firmlSo the only possible scaling in this case may beF2Fv)/Fc5(Rec kd) f (V/Vc) that leads to the dependencon s incompatible with the experimentally found. Thus thonly possible simple resolution of this scaling problem issuggestion that there exists another relevant parameter—channel widthh. Indeed, as we pointed out, the data on tdrag force were taken in a rather narrow channel ofh53.6 cm, where wave reflection was significant. Introducian additional parameter in the problem allows one to aanother nondimensional parameter, namely,kh. So the re-duced wave drag force can be rewritten in this case as
~F2Fv!/Fc5~Rec kd~kh!b! f ~V/Vc!, ~13!
where the exponentb can be defined from the requirementsatisfy the experimentally found scaling ins. Then one getsb53/2. Thus the final functional dependence is
FIG. 17. The drag force vs the velocity for glycerin-water~10cS!-silicone oil DC200/10 cS interface and a 2.35-mm-diameball.rr
rr
4-9
to
nsea
thowth
o
tsea
the
g
da
th
us,
uslyous
ry-p-wa
ng-
The
g-
theyallererthees-ob-of
therityenent
rt-
entb-
ri-ex-
sof
ityt
titherthef thee atye-
nt
en
tedspe
T. BURGHELEA AND V. STEINBERG PHYSICAL REVIEW E66, 051204 ~2002!
F2Fv
Fc5A fS V
VcD , ~14!
where the nondimensional parameter is
A5Rec kd~kh!3/25A2d2
ns~gh!3/2r, ~15!
i.e., we can recover the experimentally found scaling facd2/ns compatible with the dimensional considerations@18#.
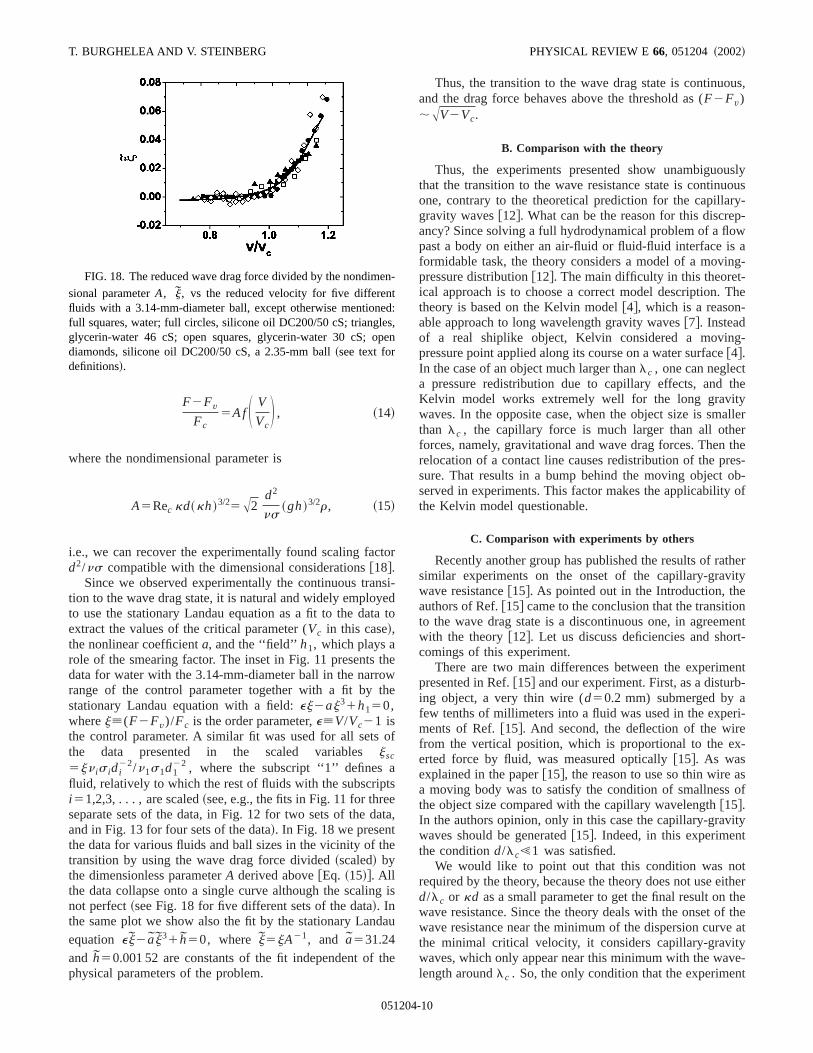
Since we observed experimentally the continuous tration to the wave drag state, it is natural and widely employto use the stationary Landau equation as a fit to the datextract the values of the critical parameter (Vc in this case!,the nonlinear coefficienta, and the ‘‘field’’ h1, which plays arole of the smearing factor. The inset in Fig. 11 presentsdata for water with the 3.14-mm-diameter ball in the narrrange of the control parameter together with a fit bystationary Landau equation with a field:ej2aj31h150,wherej[(F2Fv)/Fc is the order parameter,e[V/Vc21 isthe control parameter. A similar fit was used for all setsthe data presented in the scaled variablesjsc
5jn is idi22/n1s1d1
22 , where the subscript ‘‘1’’ defines afluid, relatively to which the rest of fluids with the subscripi 51,2,3, . . . , arescaled~see, e.g., the fits in Fig. 11 for threseparate sets of the data, in Fig. 12 for two sets of the dand in Fig. 13 for four sets of the data!. In Fig. 18 we presenthe data for various fluids and ball sizes in the vicinity of ttransition by using the wave drag force divided~scaled! bythe dimensionless parameterA derived above@Eq. ~15!#. Allthe data collapse onto a single curve although the scalinnot perfect~see Fig. 18 for five different sets of the data!. Inthe same plot we show also the fit by the stationary Lanequation ej2aj31h50, where j5jA21, and a531.24and h50.001 52 are constants of the fit independent ofphysical parameters of the problem.
FIG. 18. The reduced wave drag force divided by the nondim
sional parameterA, j, vs the reduced velocity for five differenfluids with a 3.14-mm-diameter ball, except otherwise mentionfull squares, water; full circles, silicone oil DC200/50 cS; triangleglycerin-water 46 cS; open squares, glycerin-water 30 cS; odiamonds, silicone oil DC200/50 cS, a 2.35-mm ball~see text fordefinitions!.
05120
r
i-dto
e
e
f
ta,
is
u
e
Thus, the transition to the wave drag state is continuoand the drag force behaves above the threshold as (F2Fv);AV2Vc.
B. Comparison with the theory
Thus, the experiments presented show unambiguothat the transition to the wave resistance state is continuone, contrary to the theoretical prediction for the capillagravity waves@12#. What can be the reason for this discreancy? Since solving a full hydrodynamical problem of a flopast a body on either an air-fluid or fluid-fluid interface isformidable task, the theory considers a model of a movipressure distribution@12#. The main difficulty in this theoret-ical approach is to choose a correct model description.theory is based on the Kelvin model@4#, which is a reason-able approach to long wavelength gravity waves@7#. Insteadof a real shiplike object, Kelvin considered a movinpressure point applied along its course on a water surface@4#.In the case of an object much larger thanlc , one can neglecta pressure redistribution due to capillary effects, andKelvin model works extremely well for the long gravitwaves. In the opposite case, when the object size is smthan lc , the capillary force is much larger than all othforces, namely, gravitational and wave drag forces. Thenrelocation of a contact line causes redistribution of the prsure. That results in a bump behind the moving objectserved in experiments. This factor makes the applicabilitythe Kelvin model questionable.
C. Comparison with experiments by others
Recently another group has published the results of rasimilar experiments on the onset of the capillary-gravwave resistance@15#. As pointed out in the Introduction, thauthors of Ref.@15# came to the conclusion that the transitioto the wave drag state is a discontinuous one, in agreemwith the theory@12#. Let us discuss deficiencies and shocomings of this experiment.
There are two main differences between the experimpresented in Ref.@15# and our experiment. First, as a disturing object, a very thin wire (d50.2 mm) submerged by afew tenths of millimeters into a fluid was used in the expements of Ref.@15#. And second, the deflection of the wirfrom the vertical position, which is proportional to the eerted force by fluid, was measured optically@15#. As wasexplained in the paper@15#, the reason to use so thin wire aa moving body was to satisfy the condition of smallnessthe object size compared with the capillary wavelength@15#.In the authors opinion, only in this case the capillary-gravwaves should be generated@15#. Indeed, in this experimenthe conditiond/lc!1 was satisfied.
We would like to point out that this condition was norequired by the theory, because the theory does not use ed/lc or kd as a small parameter to get the final result onwave resistance. Since the theory deals with the onset owave resistance near the minimum of the dispersion curvthe minimal critical velocity, it considers capillary-gravitwaves, which only appear near this minimum with the wavlength aroundlc . So, the only condition that the experime
-
:,n
4-10

g
ravt,t oeeed
loe
noo
of
adg
heeourroarthkeoe
thnonna
th,
oft
s, asand
olekherthevet inof
nd
er.ea-hys-ty
isex-dn-
ofbe
are
.3elo
.7ity;
.7at
WAVE DRAG DUE TO GENERATION OF CAPILLARY- . . . PHYSICAL REVIEW E 66, 051204 ~2002!
should satisfy is to excite just these waves but not of a larwavelength, that an object of a sized,lc can probably gen-erate. Thus, the conditiond/lc!1 is not necessary in ordeto ensure the generation of the surface waves with the wlength of aboutlc . As was shown, e.g., in our experimenthe capillary-gravity waves can be produced by an objeca size just comparable withlc . The most important evidencof the correctness of this statement is the measured valuthe critical velocity and the wavelength of the surface wavgenerated at the onset. We further discuss this issue stuin our experiment by using a visualization technique.
Another possible reason~not mentioned in Ref.@15#! touse a very thin wire as a disturbing object in Ref.@15# is thed-pressure distribution used in Ref.@12# to get the analyticalfunctional dependence of the wave drag on the object veity. However, as our calculations based on the theory of R@15# show, the finite size pressure distribution doeschange the nature of the transition, which remains a disctinuous one. Thus this reason does not justify the usevery thin wire as a disturbing object.
On the other hand, using a thin wire and its deflectiona measure of the force creates an experimental problemto the increasing contribution of the capillarity and wettinThe data presented in Fig. 1 of Ref.@15# are very scarce andof poor quality to make a particular conclusion about ttransition. It is particularly apparent in the vicinity of thtransition, which the authors interpreted as a discontinuone. As one can be easily convinced by the plot, the ebars at the transition are of the same order as the force vtions. Unfortunately, the authors did not mention what isreproducibility of the data if the measurements are tawith the velocity increase and then on the way back. Dthe hysteresis exist?
Thus, the statement made by the authors of Ref.@15# thatthe experimental results are in a good agreement withtheory, is based, first, on their interpretation of the stroscatter of the data at the transition as the discontinuousand second, on the assumption that the pressure, used itheory, is defined through the capillary force. It is justsuggestion that is not tested by the experiment, and oassumptions can be considered as equally probable. Sosuggest that the quantitative agreement claimed in Ref.@15#
FIG. 19. Drag force as a function of velocity for a wire of 0mm diameter in water: squares, the data taken at increasing vity; circles, on the way back.
05120
er
e-
f
ofs,ied
c-f.tn-a
sue.
sr
ia-ens
ege,the
erwe
is a pure accident. Moreover, much more robust predictionthe theory ford or very small width pressure distribution thathe wave drag above the transition should increase asV2
contradicts strongly their data. The data of Ref.@15# showdecrease of the wave drag force above the threshold. Thuwe can judge, there is no agreement between their datathe theory even in functional dependence.
We already clearly demonstrated experimentally the rof the capillarity and wetting by switching off the feedbaccontrol, as we discussed above. Moreover, in order to furtclarify this issue and to drastically increase the role ofcapillary force in a force balance with the viscous and wadrag forces, we used a thin wire as an object. We presenFigs. 19–21 the data on the wave resistance in the vicinitythe transition for a fiber of 0.7 mm diameter in water asilicone oil ~10 cS! and for a wire of 0.3 mm diameter inwater with an immersion depth of the order of its diametNo feedback was applied. Different symbols mark the msurements due to velocity increase and decrease. Hugeteresis and scatter particularly for silicone oil in the viciniof the transition are clearly observed.
As we already pointed out above, when the feedbackoff, the position of the meniscus is changed during theperiment due to wire~or fiber! bending under the viscous anwave drag forces, and particularly in the vicinity of the trasition to the wave drag state. So the fiber~or wire! bendingredistributes and alters the capillary force, which is ordersmagnitude larger than the force due to the wave drag tomeasured. Moreover, wetting and the capillary force
c-
FIG. 20. Drag force as a function of velocity for a fiber of 0mm diameter in water: circles, the data taken at increasing veloctriangles, on the way back.
FIG. 21. Drag force as a function of velocity for a fiber of 0mm diameter in silicone oil DC200/10 cS: circles, the data takenincreasing velocity; squares, on the way back.
4-11
peinteat
av
isyist
th
ec
am
diheg
thn-sss
t i
nth
the
re-
vena-m-be
veigi-
et-pat-a
ta-
perthe
teelid
T. BURGHELEA AND V. STEINBERG PHYSICAL REVIEW E66, 051204 ~2002!
strongly hysteretic, particularly on surfaces, to which a scific cleaning treatment procedure was not applied. The pning and stick-slip motion of the meniscus on a contaminasurface can cause strong force fluctuations and large scExactly this effect leads the authors of Ref.@15# to an erro-neous conclusion about the type of the transition to the wdrag state.
V. WAVE PATTERN AND WAVE NUMBER SELECTION ASA FUNCTION OF THE OBJECT VELOCITY:
EXPERIMENT AND CALCULATIONS
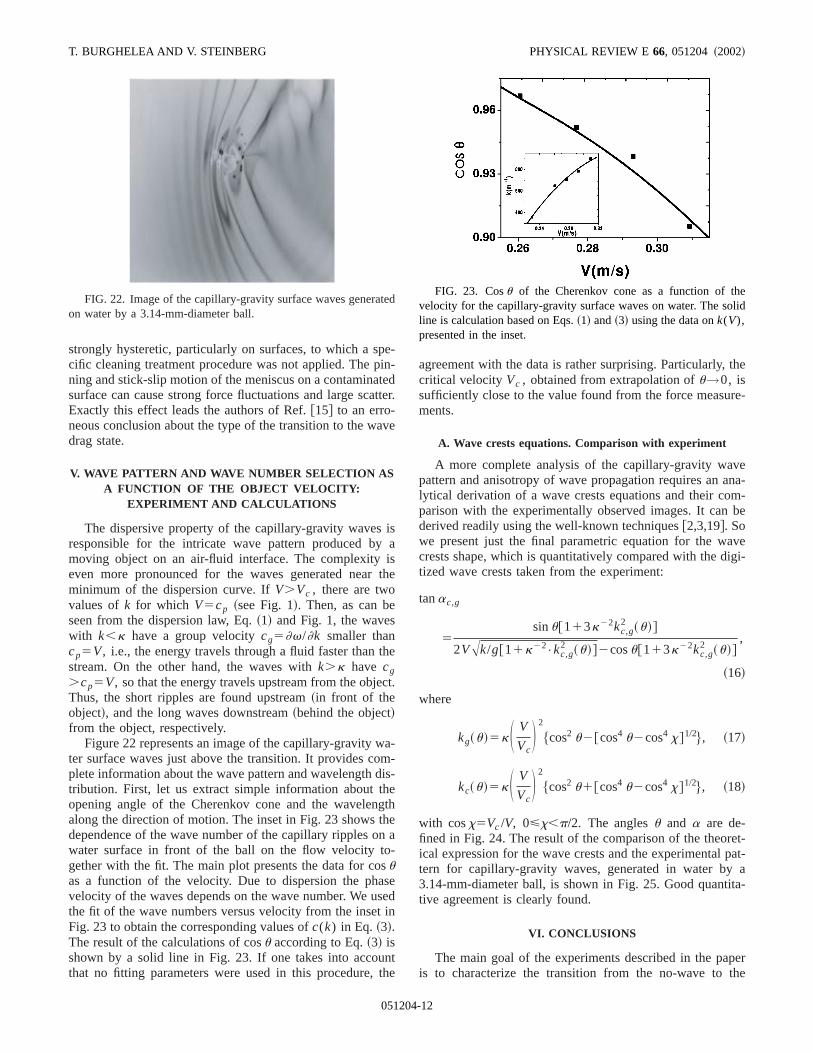
The dispersive property of the capillary-gravity wavesresponsible for the intricate wave pattern produced bmoving object on an air-fluid interface. The complexityeven more pronounced for the waves generated nearminimum of the dispersion curve. IfV.Vc , there are twovalues ofk for which V5cp ~see Fig. 1!. Then, as can beseen from the dispersion law, Eq.~1! and Fig. 1, the waveswith k,k have a group velocitycg5]v/]k smaller thancp5V, i.e., the energy travels through a fluid faster thanstream. On the other hand, the waves withk.k have cg.cp5V, so that the energy travels upstream from the objThus, the short ripples are found upstream~in front of theobject!, and the long waves downstream~behind the object!from the object, respectively.
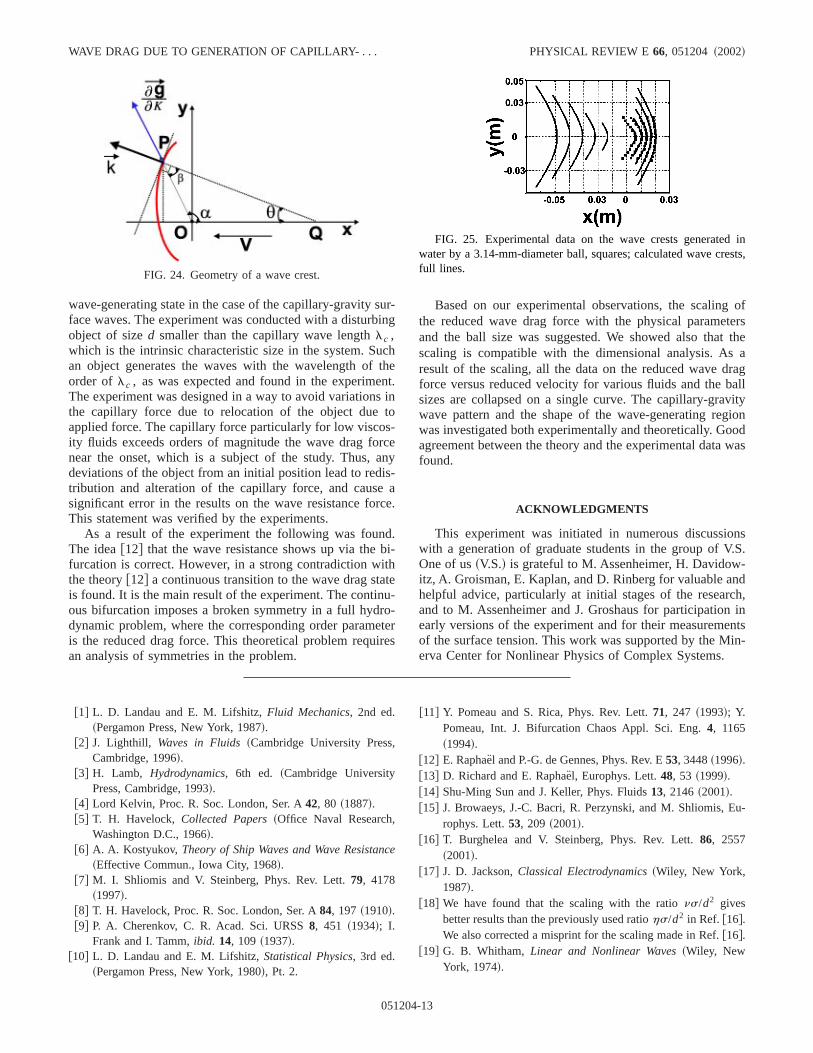
Figure 22 represents an image of the capillary-gravity wter surface waves just above the transition. It provides coplete information about the wave pattern and wavelengthtribution. First, let us extract simple information about topening angle of the Cherenkov cone and the wavelenalong the direction of motion. The inset in Fig. 23 showsdependence of the wave number of the capillary ripples owater surface in front of the ball on the flow velocity together with the fit. The main plot presents the data for couas a function of the velocity. Due to dispersion the phavelocity of the waves depends on the wave number. We uthe fit of the wave numbers versus velocity from the inseFig. 23 to obtain the corresponding values ofc(k) in Eq. ~3!.The result of the calculations of cosu according to Eq.~3! isshown by a solid line in Fig. 23. If one takes into accouthat no fitting parameters were used in this procedure,
FIG. 22. Image of the capillary-gravity surface waves generaon water by a 3.14-mm-diameter ball.
05120
--dter.
e
a
he
e
t.
--
s-
thea
eedn
te
agreement with the data is rather surprising. Particularly,critical velocityVc , obtained from extrapolation ofu→0, issufficiently close to the value found from the force measuments.
A. Wave crests equations. Comparison with experiment
A more complete analysis of the capillary-gravity wapattern and anisotropy of wave propagation requires an alytical derivation of a wave crests equations and their coparison with the experimentally observed images. It canderived readily using the well-known techniques@2,3,19#. Sowe present just the final parametric equation for the wacrests shape, which is quantitatively compared with the dtized wave crests taken from the experiment:
tanac,g
5sinu@113k22kc,g
2 ~u!#
2VAk/g@11k22•kc,g
2 ~u!#2cosu@113k22kc,g2 ~u!#
,
~16!
where
kg~u!5kS V
VcD 2
$cos2 u2@cos4 u2cos4 x#1/2%, ~17!
kc~u!5kS V
VcD 2
$cos2 u1@cos4 u2cos4 x#1/2%, ~18!
with cosx5Vc /V, 0<x,p/2. The anglesu and a are de-fined in Fig. 24. The result of the comparison of the theorical expression for the wave crests and the experimentaltern for capillary-gravity waves, generated in water by3.14-mm-diameter ball, is shown in Fig. 25. Good quantitive agreement is clearly found.
VI. CONCLUSIONS
The main goal of the experiments described in the pais to characterize the transition from the no-wave to
dFIG. 23. Cosu of the Cherenkov cone as a function of th
velocity for the capillary-gravity surface waves on water. The soline is calculation based on Eqs.~1! and~3! using the data onk(V),presented in the inset.
4-12
suin
cthn
sto
s-rcanis
rc
dbiithteu
roetire
ofters
thea
ragall
vitygionodwas
ns.S.-ndch,
inntsin-
,
,
nc
u-
d inests,
WAVE DRAG DUE TO GENERATION OF CAPILLARY- . . . PHYSICAL REVIEW E 66, 051204 ~2002!
wave-generating state in the case of the capillary-gravityface waves. The experiment was conducted with a disturbobject of sized smaller than the capillary wave lengthlc ,which is the intrinsic characteristic size in the system. Suan object generates the waves with the wavelength oforder of lc , as was expected and found in the experimeThe experiment was designed in a way to avoid variationthe capillary force due to relocation of the object dueapplied force. The capillary force particularly for low viscoity fluids exceeds orders of magnitude the wave drag fonear the onset, which is a subject of the study. Thus,deviations of the object from an initial position lead to redtribution and alteration of the capillary force, and causesignificant error in the results on the wave resistance foThis statement was verified by the experiments.
As a result of the experiment the following was founThe idea@12# that the wave resistance shows up via thefurcation is correct. However, in a strong contradiction wthe theory@12# a continuous transition to the wave drag stais found. It is the main result of the experiment. The continous bifurcation imposes a broken symmetry in a full hyddynamic problem, where the corresponding order paramis the reduced drag force. This theoretical problem requan analysis of symmetries in the problem.
@1# L. D. Landau and E. M. Lifshitz,Fluid Mechanics, 2nd ed.~Pergamon Press, New York, 1987!.
@2# J. Lighthill, Waves in Fluids~Cambridge University PressCambridge, 1996!.
@3# H. Lamb, Hydrodynamics, 6th ed. ~Cambridge UniversityPress, Cambridge, 1993!.
@4# Lord Kelvin, Proc. R. Soc. London, Ser. A42, 80 ~1887!.@5# T. H. Havelock, Collected Papers~Office Naval Research
Washington D.C., 1966!.@6# A. A. Kostyukov, Theory of Ship Waves and Wave Resista
~Effective Commun., Iowa City, 1968!.@7# M. I. Shliomis and V. Steinberg, Phys. Rev. Lett.79, 4178
~1997!.@8# T. H. Havelock, Proc. R. Soc. London, Ser. A84, 197 ~1910!.@9# P. A. Cherenkov, C. R. Acad. Sci. URSS8, 451 ~1934!; I.
Frank and I. Tamm,ibid. 14, 109 ~1937!.@10# L. D. Landau and E. M. Lifshitz,Statistical Physics, 3rd ed.
~Pergamon Press, New York, 1980!, Pt. 2.
FIG. 24. Geometry of a wave crest.
05120
r-g
he
t.in
ey
-ae.
.-
--ers
Based on our experimental observations, the scalingthe reduced wave drag force with the physical parameand the ball size was suggested. We showed also thatscaling is compatible with the dimensional analysis. Asresult of the scaling, all the data on the reduced wave dforce versus reduced velocity for various fluids and the bsizes are collapsed on a single curve. The capillary-grawave pattern and the shape of the wave-generating rewas investigated both experimentally and theoretically. Goagreement between the theory and the experimental datafound.
ACKNOWLEDGMENTS
This experiment was initiated in numerous discussiowith a generation of graduate students in the group of VOne of us~V.S.! is grateful to M. Assenheimer, H. Davidowitz, A. Groisman, E. Kaplan, and D. Rinberg for valuable ahelpful advice, particularly at initial stages of the researand to M. Assenheimer and J. Groshaus for participationearly versions of the experiment and for their measuremeof the surface tension. This work was supported by the Merva Center for Nonlinear Physics of Complex Systems.
e
@11# Y. Pomeau and S. Rica, Phys. Rev. Lett.71, 247 ~1993!; Y.Pomeau, Int. J. Bifurcation Chaos Appl. Sci. Eng.4, 1165~1994!.
@12# E. Raphae¨l and P.-G. de Gennes, Phys. Rev. E53, 3448~1996!.@13# D. Richard and E. Raphae¨l, Europhys. Lett.48, 53 ~1999!.@14# Shu-Ming Sun and J. Keller, Phys. Fluids13, 2146~2001!.@15# J. Browaeys, J.-C. Bacri, R. Perzynski, and M. Shliomis, E
rophys. Lett.53, 209 ~2001!.@16# T. Burghelea and V. Steinberg, Phys. Rev. Lett.86, 2557
~2001!.@17# J. D. Jackson,Classical Electrodynamics~Wiley, New York,
1987!.@18# We have found that the scaling with the rations/d2 gives
better results than the previously used ratiohs/d2 in Ref. @16#.We also corrected a misprint for the scaling made in Ref.@16#.
@19# G. B. Whitham,Linear and Nonlinear Waves~Wiley, NewYork, 1974!.
FIG. 25. Experimental data on the wave crests generatewater by a 3.14-mm-diameter ball, squares; calculated wave crfull lines.
4-13