Water Use and Related Costs at Households in Western and Northern Parts of India
9
Volume 4 • Issue 3 • 1000158 Hydrol Current Res ISSN: 2157-7587 HYCR, an open access journal Open Access Research Article Hydrology Current Research Plappally et al., Hydrol Current Res 2013, 4:3 http://dx.doi.org/10.4172/2157-7587.1000158 Water Use and Related Costs at Households in Western and Northern Parts of India Anand Krishnan Plappally 1 *, Ankur Hasija 1 , Jonathan Kusins 2 , Malini Jhaver 2 , Allen Chee 2 , Anirudha Panditrao 2 , Niket Kumar Singh 1 , Nitesh Kumar 1 , Kuldeep Singh 1 , Nishant Kumar 1 , Nitin Katiyar 1 , Yogesh Kumar 1 , Chetram Meena 1 , Prateek Jawalkar 1 , Ganduri Rahul Goutham 1 , Pura Ram 1 , Shravan Mishra 1 , Aman Doharey 1 , Anil Kumar Alwaria 1 , Aditya Budaraju 1 , Aditya Ranjan 1 , Harshit Kumar Pancholi 1 , Jagmohan Shreerao 1 , Atul Kumar 1 , George Kodimattam Joseph 1 and Rahul Singhal 1 1 Indian Institute of Technology Jodhpur, Rajasthan 342011, India 2 Western University, Ontario, N6A 3K7, Canada, USA *Corresponding author: Anand Krishnan Plappally, Indian Institute of Technology Jodhpur, Old Residency Road, Ratanada, Jodhpur-342 011, Rajasthan, India, E-mail: [email protected] Received August 13, 2013; Accepted November 15, 2013; Published November 25, 2013 Citation: Plappally AK, Hasija A, Kusins J, Jhaver M, Chee A, et al. (2013) Water Use and Related Costs at Households in Western and Northern Parts of India. Hydrol Current Res 4: 158. doi:10.4172/2157-7587.1000158 Copyright: © 2013 Plappally AK, et al. This is an open-access article distributed under the terms of the Creative Commons Attribution License, which permits unrestricted use, distribution, and reproduction in any medium, provided the original author and source are credited. Abstract This article elaborates a survey on water use events and activities in households. The survey inquires socio- economic aspects, technology, processes and devices which may play an important role in these water use events. Processes like washing clothes and utensils, cooking refrigeration and heating are discussed. Devices like water purifiers, air-coolers, and toilets are qualitatively analyzed. Water use events such as bathing and brushing teeth are studied. The survey in online format and printed version was randomly responded by one hundred sixty people including fifty three family heads within city of Jodhpur, India. More than hundred respondents answered the online questionnaire from Mandi in north India, Delhi, the national capital territory and Jodhpur in west India. More than ninety per cent of the respondents were males. Climate of the regions mentioned above played a decisive role in water consumption. The general public was very much unaware of the policies of the government towards water conservation and management. Advertisements by vendors were found to misguide consumers providing importance to aesthetic features rather than technical specification. The implications of this study helps in becoming environmentally aware of how human actions affect the management of water and related energy use at households. Keywords: India; Water; End use; Environmental; Awareness; Cost; Life cycle Introduction ere is an ancient belief in Indian Subcontinent that Earth can sustain any pain and is considered “Mother” [1]. e countries in this subcontinent are water competent due to their high developmental rates or urbanization and population increase depending on their water resources [1]. It is predicted that India can suffer from severe water scarcity in the near future [2]. Another question that can be posed is that can India ease the risk that its water and energy scarcity pose to security? India has its hands tied due to the climatic variations over its geography. Summers in northwest India last from April to July. Under the Koppen Climate categorization, Mandi, a city in North India represents climate of a subtropical highland weather. Lying 800m above sea level Mandi is in the lower Himalayas and therefore the temperatures take a dip with height [3]. e capital state of India, Delhi lies towards the south at latitude 28°23ʹ17ʹʹ North-28°53ʹ37ʹʹ North and longitude 76°50ʹ24ʹʹ East -77°20ʹ37ʹʹ East and at the Yamuna River plain. Spanning 1483 km 2 , Delhi’s residential sector uses 45-55% of this area. North Western India has pre-monsoon climate conditions and temperatures range from 32-45°C. It should be noted that vast part of north-west India is geographically a desert. In this regions dust raising from the alluvial soils of the ar desert as well as Gangetic plains due to localized convective cells or storms named “ Andhi” and synoptic scale dust transport is common [4]. e rainfall, R (mm), in Jodhpur area can be expressed as [5], R= -196.29 ln (P)+1078.2 1 In Eq. 1, R represents precipitation in mm, and P is the probability of rainfall [5]. Even with a high probability of rainfall, rainfall is scanty in this area [5]. In the East, approximately 300-400 inches of precipitation is experienced [1]. But economic water scarcity looms large in these parts with cost of water reaching `2.50 per liter [1,6]. Most of the water infrastructure in India is aging and plagued with maintenance issues. Seventy three per cent of all the water management projects in India are incomplete till date [7]. Example for this mismanagement is Jawaharlal Nehru National Urban Mission for urban sanitation and water which started off in 2005 and extends beyond 2013 [7]. According to the ground water department at Jodhpur many areas of Jodhpur has a ground water level of less than five metres. Improper drainage, leaking pipe lines, and geographical factors are cited as reasons for this ground water level increase [8]. CSE quoted that poor planning and exclusion of peri-urban areas for water management was a major shortcoming. Another major nagging feature of India’s water projects were that they have been unable to provide service even aſter completion of projects [7]. Some aspects that should be managed are problems such as 40% of India’s water supply is lost due to leakages [9]. e Gates foundation also states a water loss of 30-50% due to leaks [10]. is corroborates the zilch planning and maintenance of water projects and municipal services across India. Implementation of policies on water management and conservation can help in this context. Steps must be taken to optimize resource allocation and for giving better incentives for those adopting water and energy efficient devices and policies [9]. Optimized water resource allocation requires an urgent augmentation of storage. But
-
Upload
independent -
Category
Documents
-
view
1 -
download
0
Transcript of Water Use and Related Costs at Households in Western and Northern Parts of India
Volume 4 • Issue 3 • 1000158Hydrol Current ResISSN: 2157-7587 HYCR, an open access journal
Open AccessResearch Article
HydrologyCurrent Research
Plappally et al., Hydrol Current Res 2013, 4:3http://dx.doi.org/10.4172/2157-7587.1000158
Water Use and Related Costs at Households in Western and Northern Parts of IndiaAnand Krishnan Plappally1*, Ankur Hasija1, Jonathan Kusins2, Malini Jhaver2, Allen Chee2, Anirudha Panditrao2, Niket Kumar Singh1, Nitesh Kumar1, Kuldeep Singh1, Nishant Kumar1, Nitin Katiyar1, Yogesh Kumar1, Chetram Meena1, Prateek Jawalkar1, Ganduri Rahul Goutham1, Pura Ram1, Shravan Mishra1, Aman Doharey1, Anil Kumar Alwaria1, Aditya Budaraju1, Aditya Ranjan1, Harshit Kumar Pancholi1, Jagmohan Shreerao1, Atul Kumar1, George Kodimattam Joseph1 and Rahul Singhal1
1Indian Institute of Technology Jodhpur, Rajasthan 342011, India 2Western University, Ontario, N6A 3K7, Canada, USA
*Corresponding author: Anand Krishnan Plappally, Indian Institute of Technology Jodhpur, Old Residency Road, Ratanada, Jodhpur-342 011, Rajasthan, India, E-mail: [email protected]
Received August 13, 2013; Accepted November 15, 2013; Published November 25, 2013
Citation: Plappally AK, Hasija A, Kusins J, Jhaver M, Chee A, et al. (2013) Water Use and Related Costs at Households in Western and Northern Parts of India. Hydrol Current Res 4: 158. doi:10.4172/2157-7587.1000158
Copyright: © 2013 Plappally AK, et al. This is an open-access article distributed under the terms of the Creative Commons Attribution License, which permits unrestricted use, distribution, and reproduction in any medium, provided the original author and source are credited.
AbstractThis article elaborates a survey on water use events and activities in households. The survey inquires socio-
economic aspects, technology, processes and devices which may play an important role in these water use events. Processes like washing clothes and utensils, cooking refrigeration and heating are discussed. Devices like water purifiers, air-coolers, and toilets are qualitatively analyzed. Water use events such as bathing and brushing teeth are studied. The survey in online format and printed version was randomly responded by one hundred sixty people including fifty three family heads within city of Jodhpur, India. More than hundred respondents answered the online questionnaire from Mandi in north India, Delhi, the national capital territory and Jodhpur in west India. More than ninety per cent of the respondents were males. Climate of the regions mentioned above played a decisive role in water consumption. The general public was very much unaware of the policies of the government towards water conservation and management. Advertisements by vendors were found to misguide consumers providing importance to aesthetic features rather than technical specification. The implications of this study helps in becoming environmentally aware of how human actions affect the management of water and related energy use at households.
Keywords: India; Water; End use; Environmental; Awareness; Cost; Life cycle
IntroductionThere is an ancient belief in Indian Subcontinent that Earth can
sustain any pain and is considered “Mother” [1]. The countries in this subcontinent are water competent due to their high developmental rates or urbanization and population increase depending on their water resources [1]. It is predicted that India can suffer from severe water scarcity in the near future [2]. Another question that can be posed is that can India ease the risk that its water and energy scarcity pose to security? India has its hands tied due to the climatic variations over its geography. Summers in northwest
India last from April to July. Under the Koppen Climate categorization, Mandi, a city in North India represents climate of a subtropical highland weather. Lying 800m above sea level Mandi is in the lower Himalayas and therefore the temperatures take a dip with height [3]. The capital state of India, Delhi lies towards the south at latitude 28°23ʹ17ʹʹ North-28°53ʹ37ʹʹ North and longitude 76°50ʹ24ʹʹ East -77°20ʹ37ʹʹ East and at the Yamuna River plain. Spanning 1483 km2, Delhi’s residential sector uses 45-55% of this area. North Western India has pre-monsoon climate conditions and temperatures range from 32-45°C. It should be noted that vast part of north-west India is geographically a desert. In this regions dust raising from the alluvial soils of the Thar desert as well as Gangetic plains due to localized convective cells or storms named “ Andhi” and synoptic scale dust transport is common [4]. The rainfall, R (mm), in Jodhpur area can be expressed as [5], R= -196.29 ln (P)+1078.2 1 In Eq. 1, R represents precipitation in mm, and P is the probability of rainfall [5]. Even with a high probability of rainfall, rainfall is scanty in this area [5]. In the East, approximately 300-400 inches of precipitation is experienced [1]. But economic water scarcity looms large in these parts with cost of water reaching `2.50 per liter [1,6]. Most of the water infrastructure in India
is aging and plagued with maintenance issues. Seventy three per cent of all the water management projects in India are incomplete till date [7]. Example for this mismanagement is Jawaharlal Nehru National Urban Mission for urban sanitation and water which started off in 2005 and extends beyond 2013 [7]. According to the ground water department at Jodhpur many areas of Jodhpur has a ground water level of less than five metres. Improper drainage, leaking pipe lines, and geographical factors are cited as reasons for this ground water level increase [8].CSE quoted that poor planning and exclusion of peri-urban areas for water management was a major shortcoming. Another major nagging feature of India’s water projects were that they have been unable to provide service even after completion of projects [7]. Some aspects that should be managed are problems such as 40% of India’s water supply is lost due to leakages [9]. The Gates foundation also states a water loss of 30-50% due to leaks [10]. This corroborates the zilch planning and maintenance of water projects and municipal services across India. Implementation of policies on water management and conservation can help in this context. Steps must be taken to optimize resource allocation and for giving better incentives for those adopting water and energy efficient devices and policies [9]. Optimized water resource allocation requires an urgent augmentation of storage. But
Citation: Plappally AK, Hasija A, Kusins J, Jhaver M, Chee A, et al. (2013) Water Use and Related Costs at Households in Western and Northern Parts of India. Hydrol Current Res 4: 158. doi:10.4172/2157-7587.1000158
Page 2 of 9
Volume 4 • Issue 3 • 1000158Hydrol Current ResISSN: 2157-7587 HYCR, an open access journal
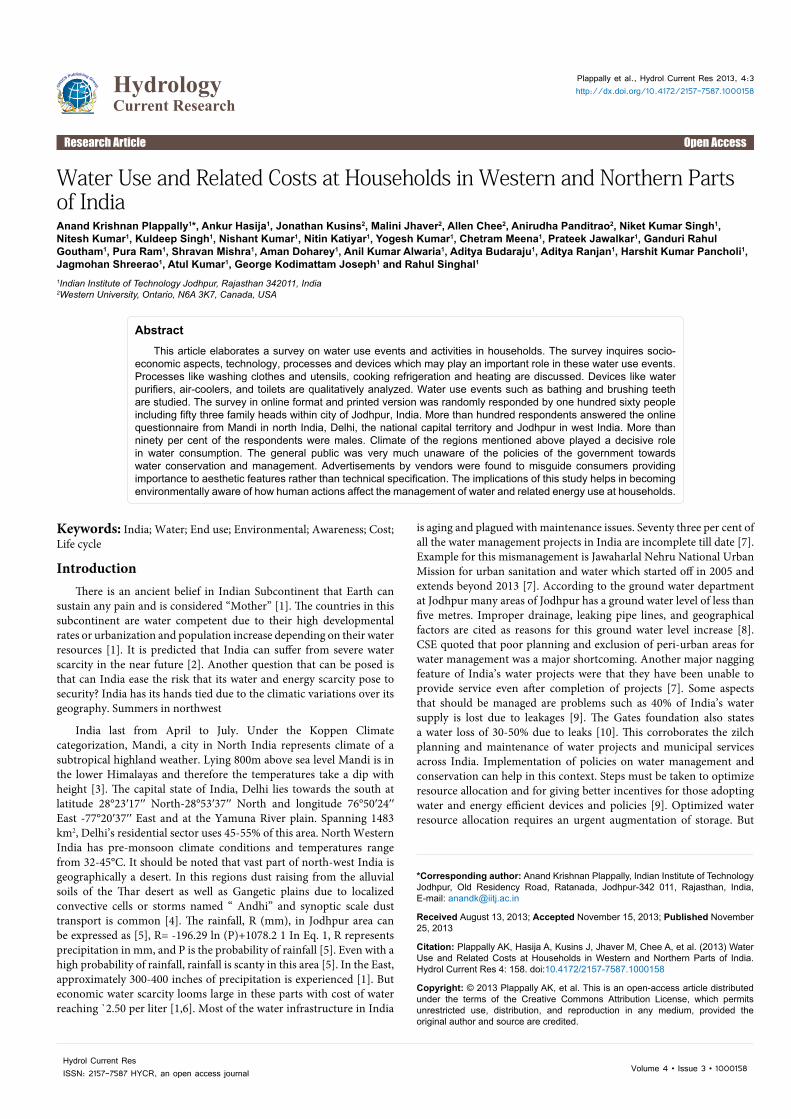
this option was denied to be feasible due to unavailability of land to construct these storage spaces following rampant urbanization of India [7]. Another policy suggestion is the reduction of subsidies that discourage overconsumption. Secondly this will promote judicious end use of water and encourage implementing waste water reuse strategies [7]. CSE also pointed out the Indian government’s plans to implement strategies to convert cities to “smart cities” (carbon neutral and energy efficient) to combat water and energy scarcity. Further, the government of India has recently promulgated laws on water conservation, harvesting and management. For example, Jodhpur has a statute which imposes water harvesting as a responsibility of a resident of Jodhpur. If people do not abide by this law they are subjected to pay a fine of approximately $470.00 or a month of prison [7]. Similar ordinance was passed by Tamil Nadu in 2003 according to which all old and new buildings are asked to make water harvesting facilties [11]. Kumar, further said that community initiative and proper implementation of this ordinance helped in saving and storing 42% of the run-off of Tamil Nadu. Recently Karnataka took a step according to which water harvesting was made compulsory at all municipal and corporation levels [11]. India should look back into history for its requirements of water Figure 1 illustrates a life cycle of water [12,13]. End use is the most energy intensive stage in the life cycle depicted in Figure 1 [12]. The hot water consumption increases with demand and their patterns vary with climate. For example, Plappally and Lienhard [12] cited that Europe consumed more energy to heat water for washing clothes than Japanese. This enumerates effect of location specific water consumption also is found to be a major influencing factor. The above discussion provides with a major support to investigate water consumption patterns as is investigated in this article. Human behavior also contributes to increased water consumption [12]. Boiling water for cooking is the most expensive [6]. They also illustrated that greatest potential for savings is associated with water consumption at the end use stage of the water life cycle [6]. In Figure 1, the reuse and recycle has been given separate importance and contributes to water used in the end use. India has no specific guidelines for water reuse till date. In India, 80% of the water used in the households falls into the sewage [7]. Only 18% of India’s rural households have potable water, sanitation and electricity [14]. Indian government bodies dealing with city waste do not have accounts for waste water discharges in to sewages [7]. According to Bill and Melinda Gates Foundation research more than 80% of the Indian cities do not have a sewage treatment or network [10]. This supports the fact that only 10% of waste water generated by India gets treated [15]. In the name of development, new unauthorized urban spaces have sprung up with little water supply, sewage treatment and sanitation [16]. The reuse is a major aspect of water management which is to be introduced in a major way in India. This can help in reducing the cost expended on water at households [6]. This is also confirmed from research by the Bill and Melinda Gates Foundation which said that due to lack of reuse of water will compel the increase of the present average distance of supplying water in India of 119km to estimated 400km [10]. Water end use survey performed at Mandi in Himachal Pradesh at the North, New Delhi, the capital of India and Jodhpur on the West in Rajasthan, India is analyzed in this article. Similar studies have been performed elsewhere around the world [12].
Survey
An online survey was conducted at different parts in Western India taking Indian Institute of Technology at Mandi, New Delhi and Jodhpur as example location nodes. It is very important to know the climate of these locations before surveying since climate influences
human health and quantity of water used or consumed [17]. The case study elaborated in this article was conducted in the summer of 2012-2013. (Typically Indian Summers fall between May and June). Survey integrated questions on individual behavior and family characteristics, economics, cultural and social values of people at these locations. Individual respondents were requested to answer a segment which included personal information such as age group, gender, location, economic status, size of family, and highest level of education within a family. Another segment in the questionnaire is on personal hygiene which includes events of brushing, hand washing, bathing, washing clothes, domestic cleaning, flushing, and their corresponding frequencies. This also included questions that investigated influence of personal behavior on water consumption at these events. Refrigerating water, its volumetric capacity, the technology, its energy ratings, and water use formed another aspect to investigate. Human dimension is added to this with personal choice to drink cold, lukewarm or hot water. Fourth cooking is a distinct aspect that requires investigation. Some of the questions related to the type of fuel used in cooking, etc. The type of diet intake of household occupants also influences the water use. According to climate, the diet of the people within India is demarcated clearly with major wheat based food consumption in the North whereas rice based food is commonly taken in Southern India. Wheat based food processing is less water intensive than that of rice based foods. Water is also used in gardening and vehicle washing too. The survey also asks the water usage numbers for gardening to get a feel of the requirement of the water by the plant in an arid water scarce location.
Setting
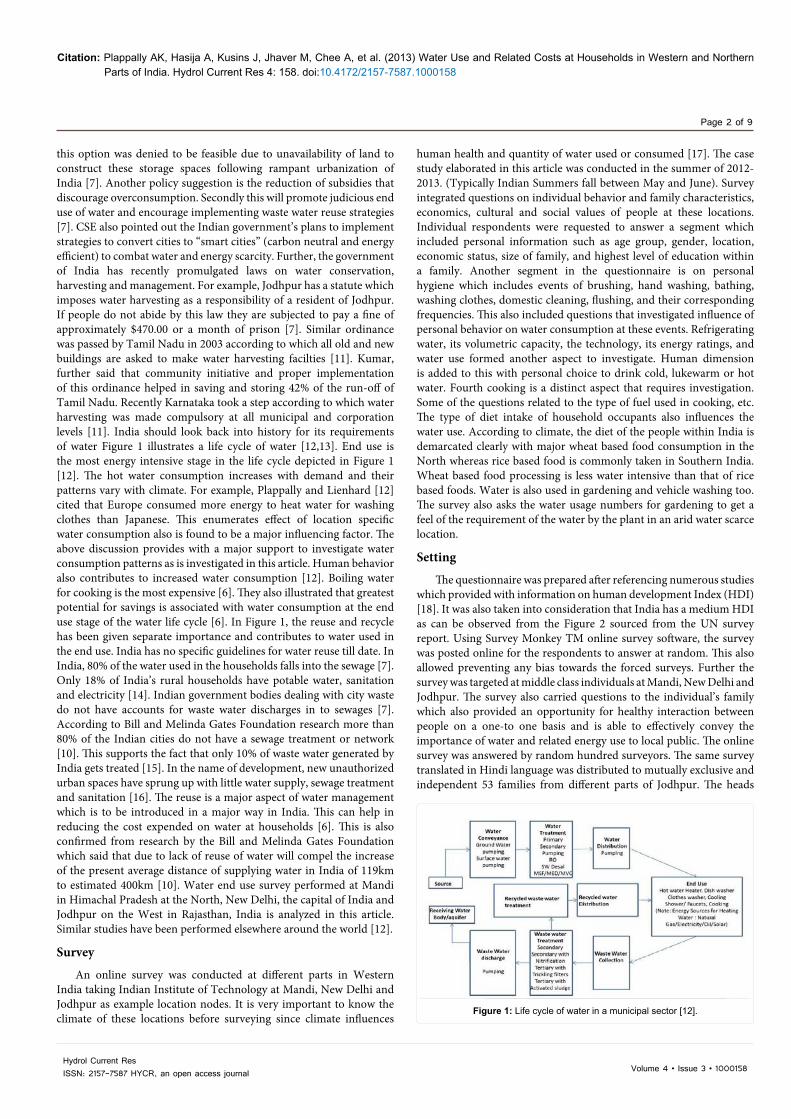
The questionnaire was prepared after referencing numerous studies which provided with information on human development Index (HDI) [18]. It was also taken into consideration that India has a medium HDI as can be observed from the Figure 2 sourced from the UN survey report. Using Survey Monkey TM online survey software, the survey was posted online for the respondents to answer at random. This also allowed preventing any bias towards the forced surveys. Further the survey was targeted at middle class individuals at Mandi, New Delhi and Jodhpur. The survey also carried questions to the individual’s family which also provided an opportunity for healthy interaction between people on a one-to one basis and is able to effectively convey the importance of water and related energy use to local public. The online survey was answered by random hundred surveyors. The same survey translated in Hindi language was distributed to mutually exclusive and independent 53 families from different parts of Jodhpur. The heads
Figure 1: Life cycle of water in a municipal sector [12].
Citation: Plappally AK, Hasija A, Kusins J, Jhaver M, Chee A, et al. (2013) Water Use and Related Costs at Households in Western and Northern Parts of India. Hydrol Current Res 4: 158. doi:10.4172/2157-7587.1000158
Page 3 of 9
Volume 4 • Issue 3 • 1000158Hydrol Current ResISSN: 2157-7587 HYCR, an open access journal
of the families took the survey. This interaction also provided for an opportunity to provide feedback and help people become aware of their woes and views related to water use. The questionnaire is multiple selection type.
Results and DiscussionThe survey was able to reach 160 random respondents at different
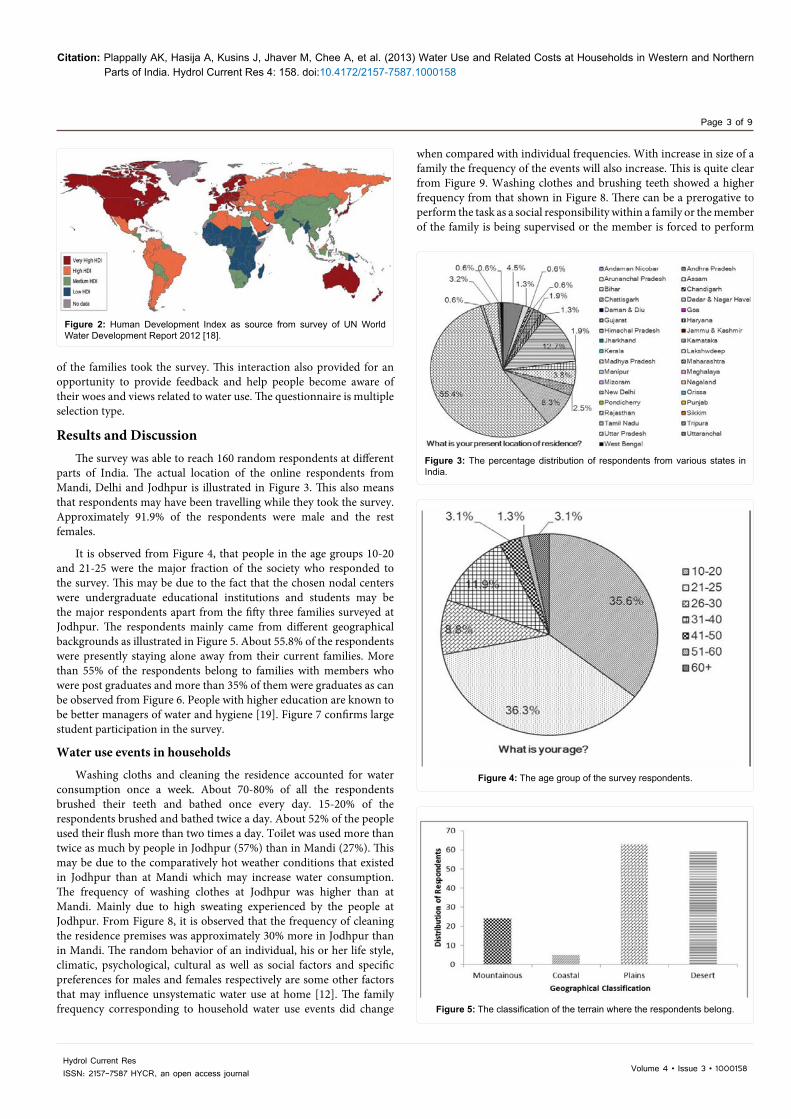
parts of India. The actual location of the online respondents from Mandi, Delhi and Jodhpur is illustrated in Figure 3. This also means that respondents may have been travelling while they took the survey. Approximately 91.9% of the respondents were male and the rest females.
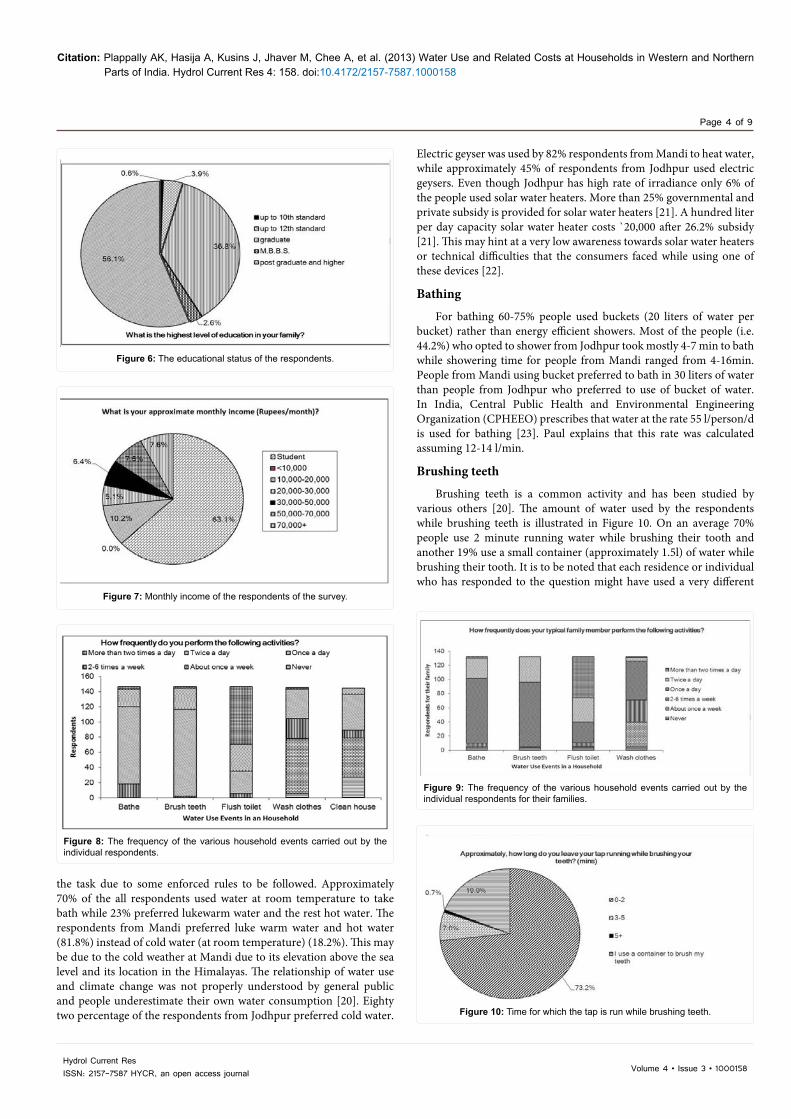
It is observed from Figure 4, that people in the age groups 10-20 and 21-25 were the major fraction of the society who responded to the survey. This may be due to the fact that the chosen nodal centers were undergraduate educational institutions and students may be the major respondents apart from the fifty three families surveyed at Jodhpur. The respondents mainly came from different geographical backgrounds as illustrated in Figure 5. About 55.8% of the respondents were presently staying alone away from their current families. More than 55% of the respondents belong to families with members who were post graduates and more than 35% of them were graduates as can be observed from Figure 6. People with higher education are known to be better managers of water and hygiene [19]. Figure 7 confirms large student participation in the survey.
Water use events in households
Washing cloths and cleaning the residence accounted for water consumption once a week. About 70-80% of all the respondents brushed their teeth and bathed once every day. 15-20% of the respondents brushed and bathed twice a day. About 52% of the people used their flush more than two times a day. Toilet was used more than twice as much by people in Jodhpur (57%) than in Mandi (27%). This may be due to the comparatively hot weather conditions that existed in Jodhpur than at Mandi which may increase water consumption. The frequency of washing clothes at Jodhpur was higher than at Mandi. Mainly due to high sweating experienced by the people at Jodhpur. From Figure 8, it is observed that the frequency of cleaning the residence premises was approximately 30% more in Jodhpur than in Mandi. The random behavior of an individual, his or her life style, climatic, psychological, cultural as well as social factors and specific preferences for males and females respectively are some other factors that may influence unsystematic water use at home [12]. The family frequency corresponding to household water use events did change
when compared with individual frequencies. With increase in size of a family the frequency of the events will also increase. This is quite clear from Figure 9. Washing clothes and brushing teeth showed a higher frequency from that shown in Figure 8. There can be a prerogative to perform the task as a social responsibility within a family or the member of the family is being supervised or the member is forced to perform
Figure 2: Human Development Index as source from survey of UN World Water Development Report 2012 [18].
Figure 3: The percentage distribution of respondents from various states in India.
Figure 4: The age group of the survey respondents.
Figure 5: The classification of the terrain where the respondents belong.
Citation: Plappally AK, Hasija A, Kusins J, Jhaver M, Chee A, et al. (2013) Water Use and Related Costs at Households in Western and Northern Parts of India. Hydrol Current Res 4: 158. doi:10.4172/2157-7587.1000158
Page 4 of 9
Volume 4 • Issue 3 • 1000158Hydrol Current ResISSN: 2157-7587 HYCR, an open access journal
the task due to some enforced rules to be followed. Approximately 70% of the all respondents used water at room temperature to take bath while 23% preferred lukewarm water and the rest hot water. The respondents from Mandi preferred luke warm water and hot water (81.8%) instead of cold water (at room temperature) (18.2%). This may be due to the cold weather at Mandi due to its elevation above the sea level and its location in the Himalayas. The relationship of water use and climate change was not properly understood by general public and people underestimate their own water consumption [20]. Eighty two percentage of the respondents from Jodhpur preferred cold water.
Electric geyser was used by 82% respondents from Mandi to heat water, while approximately 45% of respondents from Jodhpur used electric geysers. Even though Jodhpur has high rate of irradiance only 6% of the people used solar water heaters. More than 25% governmental and private subsidy is provided for solar water heaters [21]. A hundred liter per day capacity solar water heater costs `20,000 after 26.2% subsidy [21]. This may hint at a very low awareness towards solar water heaters or technical difficulties that the consumers faced while using one of these devices [22].
Bathing
For bathing 60-75% people used buckets (20 liters of water per bucket) rather than energy efficient showers. Most of the people (i.e. 44.2%) who opted to shower from Jodhpur took mostly 4-7 min to bath while showering time for people from Mandi ranged from 4-16min. People from Mandi using bucket preferred to bath in 30 liters of water than people from Jodhpur who preferred to use of bucket of water. In India, Central Public Health and Environmental Engineering Organization (CPHEEO) prescribes that water at the rate 55 l/person/d is used for bathing [23]. Paul explains that this rate was calculated assuming 12-14 l/min.
Brushing teeth
Brushing teeth is a common activity and has been studied by various others [20]. The amount of water used by the respondents while brushing teeth is illustrated in Figure 10. On an average 70% people use 2 minute running water while brushing their tooth and another 19% use a small container (approximately 1.5l) of water while brushing their tooth. It is to be noted that each residence or individual who has responded to the question might have used a very different
Figure 6: The educational status of the respondents.
Figure 7: Monthly income of the respondents of the survey.
Figure 8: The frequency of the various household events carried out by the individual respondents.
Figure 9: The frequency of the various household events carried out by the individual respondents for their families.
Figure 10: Time for which the tap is run while brushing teeth.
Citation: Plappally AK, Hasija A, Kusins J, Jhaver M, Chee A, et al. (2013) Water Use and Related Costs at Households in Western and Northern Parts of India. Hydrol Current Res 4: 158. doi:10.4172/2157-7587.1000158
Page 5 of 9
Volume 4 • Issue 3 • 1000158Hydrol Current ResISSN: 2157-7587 HYCR, an open access journal
faucets in terms of its size, shape, type, make, flow rate etc. For better analysis of the amount of water used while brushing a study of the flow rates of the fully open faucets also was conducted at Indian institute of Technology, Jodhpur. An average time of 0.0174 seconds for a milliliter was calculated from 25 different faucets chosen at random. If this value is used as a model value, then for collecting 1.5l it will take 26.1 seconds in a fully open condition. Similarly if faucet is open for 2 minutes then approximately 6.87 l. Prior studies enumerated that the energy expended in running a faucet is 0.04 kWh/m3 [12]. From the above calculations, it is clear that using a container for brushing teeth would conserve water.
Toilets
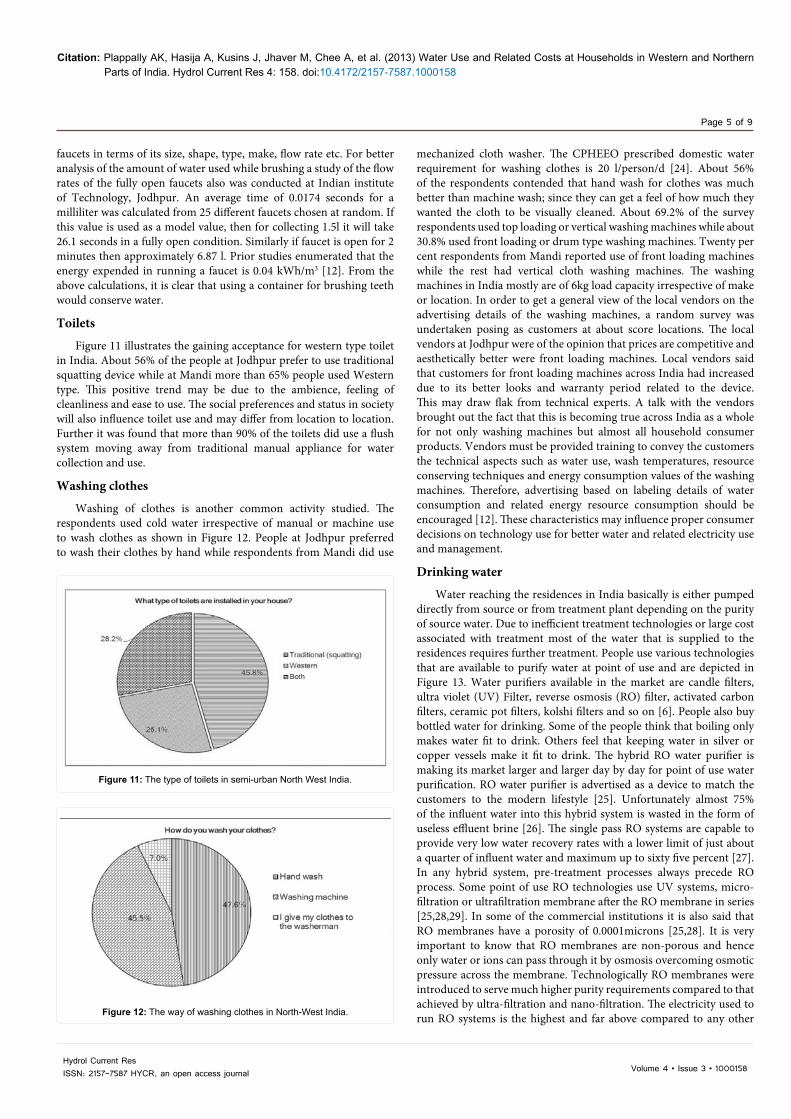
Figure 11 illustrates the gaining acceptance for western type toilet in India. About 56% of the people at Jodhpur prefer to use traditional squatting device while at Mandi more than 65% people used Western type. This positive trend may be due to the ambience, feeling of cleanliness and ease to use. The social preferences and status in society will also influence toilet use and may differ from location to location. Further it was found that more than 90% of the toilets did use a flush system moving away from traditional manual appliance for water collection and use.
Washing clothes
Washing of clothes is another common activity studied. The respondents used cold water irrespective of manual or machine use to wash clothes as shown in Figure 12. People at Jodhpur preferred to wash their clothes by hand while respondents from Mandi did use
mechanized cloth washer. The CPHEEO prescribed domestic water requirement for washing clothes is 20 l/person/d [24]. About 56% of the respondents contended that hand wash for clothes was much better than machine wash; since they can get a feel of how much they wanted the cloth to be visually cleaned. About 69.2% of the survey respondents used top loading or vertical washing machines while about 30.8% used front loading or drum type washing machines. Twenty per cent respondents from Mandi reported use of front loading machines while the rest had vertical cloth washing machines. The washing machines in India mostly are of 6kg load capacity irrespective of make or location. In order to get a general view of the local vendors on the advertising details of the washing machines, a random survey was undertaken posing as customers at about score locations. The local vendors at Jodhpur were of the opinion that prices are competitive and aesthetically better were front loading machines. Local vendors said that customers for front loading machines across India had increased due to its better looks and warranty period related to the device. This may draw flak from technical experts. A talk with the vendors brought out the fact that this is becoming true across India as a whole for not only washing machines but almost all household consumer products. Vendors must be provided training to convey the customers the technical aspects such as water use, wash temperatures, resource conserving techniques and energy consumption values of the washing machines. Therefore, advertising based on labeling details of water consumption and related energy resource consumption should be encouraged [12]. These characteristics may influence proper consumer decisions on technology use for better water and related electricity use and management.
Drinking water
Water reaching the residences in India basically is either pumped directly from source or from treatment plant depending on the purity of source water. Due to inefficient treatment technologies or large cost associated with treatment most of the water that is supplied to the residences requires further treatment. People use various technologies that are available to purify water at point of use and are depicted in Figure 13. Water purifiers available in the market are candle filters, ultra violet (UV) Filter, reverse osmosis (RO) filter, activated carbon filters, ceramic pot filters, kolshi filters and so on [6]. People also buy bottled water for drinking. Some of the people think that boiling only makes water fit to drink. Others feel that keeping water in silver or copper vessels make it fit to drink. The hybrid RO water purifier is making its market larger and larger day by day for point of use water purification. RO water purifier is advertised as a device to match the customers to the modern lifestyle [25]. Unfortunately almost 75% of the influent water into this hybrid system is wasted in the form of useless effluent brine [26]. The single pass RO systems are capable to provide very low water recovery rates with a lower limit of just about a quarter of influent water and maximum up to sixty five percent [27]. In any hybrid system, pre-treatment processes always precede RO process. Some point of use RO technologies use UV systems, micro-filtration or ultrafiltration membrane after the RO membrane in series [25,28,29]. In some of the commercial institutions it is also said that RO membranes have a porosity of 0.0001microns [25,28]. It is very important to know that RO membranes are non-porous and hence only water or ions can pass through it by osmosis overcoming osmotic pressure across the membrane. Technologically RO membranes were introduced to serve much higher purity requirements compared to that achieved by ultra-filtration and nano-filtration. The electricity used to run RO systems is the highest and far above compared to any other
Figure 11: The type of toilets in semi-urban North West India.
Figure 12: The way of washing clothes in North-West India.
Citation: Plappally AK, Hasija A, Kusins J, Jhaver M, Chee A, et al. (2013) Water Use and Related Costs at Households in Western and Northern Parts of India. Hydrol Current Res 4: 158. doi:10.4172/2157-7587.1000158
Page 6 of 9
Volume 4 • Issue 3 • 1000158Hydrol Current ResISSN: 2157-7587 HYCR, an open access journal
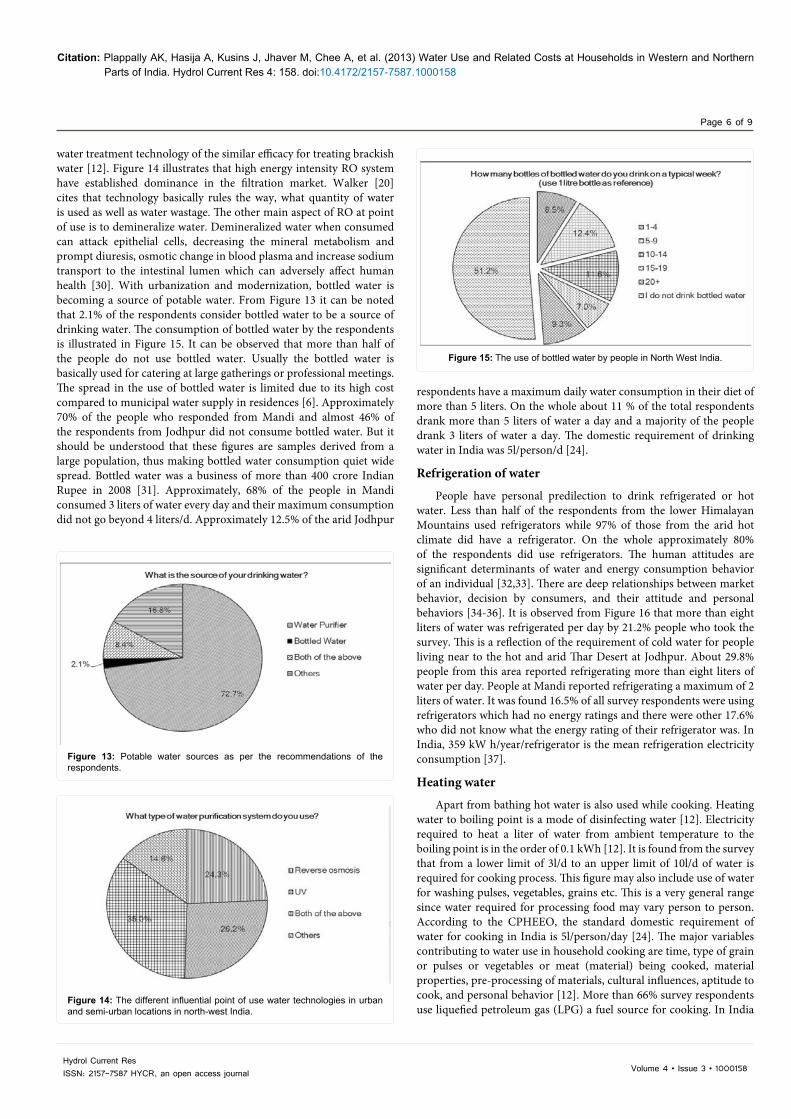
water treatment technology of the similar efficacy for treating brackish water [12]. Figure 14 illustrates that high energy intensity RO system have established dominance in the filtration market. Walker [20] cites that technology basically rules the way, what quantity of water is used as well as water wastage. The other main aspect of RO at point of use is to demineralize water. Demineralized water when consumed can attack epithelial cells, decreasing the mineral metabolism and prompt diuresis, osmotic change in blood plasma and increase sodium transport to the intestinal lumen which can adversely affect human health [30]. With urbanization and modernization, bottled water is becoming a source of potable water. From Figure 13 it can be noted that 2.1% of the respondents consider bottled water to be a source of drinking water. The consumption of bottled water by the respondents is illustrated in Figure 15. It can be observed that more than half of the people do not use bottled water. Usually the bottled water is basically used for catering at large gatherings or professional meetings. The spread in the use of bottled water is limited due to its high cost compared to municipal water supply in residences [6]. Approximately 70% of the people who responded from Mandi and almost 46% of the respondents from Jodhpur did not consume bottled water. But it should be understood that these figures are samples derived from a large population, thus making bottled water consumption quiet wide spread. Bottled water was a business of more than 400 crore Indian Rupee in 2008 [31]. Approximately, 68% of the people in Mandi consumed 3 liters of water every day and their maximum consumption did not go beyond 4 liters/d. Approximately 12.5% of the arid Jodhpur
respondents have a maximum daily water consumption in their diet of more than 5 liters. On the whole about 11 % of the total respondents drank more than 5 liters of water a day and a majority of the people drank 3 liters of water a day. The domestic requirement of drinking water in India was 5l/person/d [24].
Refrigeration of water
People have personal predilection to drink refrigerated or hot water. Less than half of the respondents from the lower Himalayan Mountains used refrigerators while 97% of those from the arid hot climate did have a refrigerator. On the whole approximately 80% of the respondents did use refrigerators. The human attitudes are significant determinants of water and energy consumption behavior of an individual [32,33]. There are deep relationships between market behavior, decision by consumers, and their attitude and personal behaviors [34-36]. It is observed from Figure 16 that more than eight liters of water was refrigerated per day by 21.2% people who took the survey. This is a reflection of the requirement of cold water for people living near to the hot and arid Thar Desert at Jodhpur. About 29.8% people from this area reported refrigerating more than eight liters of water per day. People at Mandi reported refrigerating a maximum of 2 liters of water. It was found 16.5% of all survey respondents were using refrigerators which had no energy ratings and there were other 17.6% who did not know what the energy rating of their refrigerator was. In India, 359 kW h/year/refrigerator is the mean refrigeration electricity consumption [37].
Heating water
Apart from bathing hot water is also used while cooking. Heating water to boiling point is a mode of disinfecting water [12]. Electricity required to heat a liter of water from ambient temperature to the boiling point is in the order of 0.1 kWh [12]. It is found from the survey that from a lower limit of 3l/d to an upper limit of 10l/d of water is required for cooking process. This figure may also include use of water for washing pulses, vegetables, grains etc. This is a very general range since water required for processing food may vary person to person. According to the CPHEEO, the standard domestic requirement of water for cooking in India is 5l/person/day [24]. The major variables contributing to water use in household cooking are time, type of grain or pulses or vegetables or meat (material) being cooked, material properties, pre-processing of materials, cultural influences, aptitude to cook, and personal behavior [12]. More than 66% survey respondents use liquefied petroleum gas (LPG) a fuel source for cooking. In India
Figure 13: Potable water sources as per the recommendations of the respondents.
Figure 14: The different influential point of use water technologies in urban and semi-urban locations in north-west India.
Figure 15: The use of bottled water by people in North West India.
Citation: Plappally AK, Hasija A, Kusins J, Jhaver M, Chee A, et al. (2013) Water Use and Related Costs at Households in Western and Northern Parts of India. Hydrol Current Res 4: 158. doi:10.4172/2157-7587.1000158
Page 7 of 9
Volume 4 • Issue 3 • 1000158Hydrol Current ResISSN: 2157-7587 HYCR, an open access journal
LPG is supplied in standard cylinders of 14.2kg net weight and it holds 15-18kg of LPG. Almost 33% of all the respondents were of the opinion that a cylinder of gas may last a maximum of 31-45 days while at least 29.3% said that the gas will last for 16-30 days and another 18.3% said a cylinder may last 46-60 day. This may change with usage load, time, and occasion.
Washing utensils
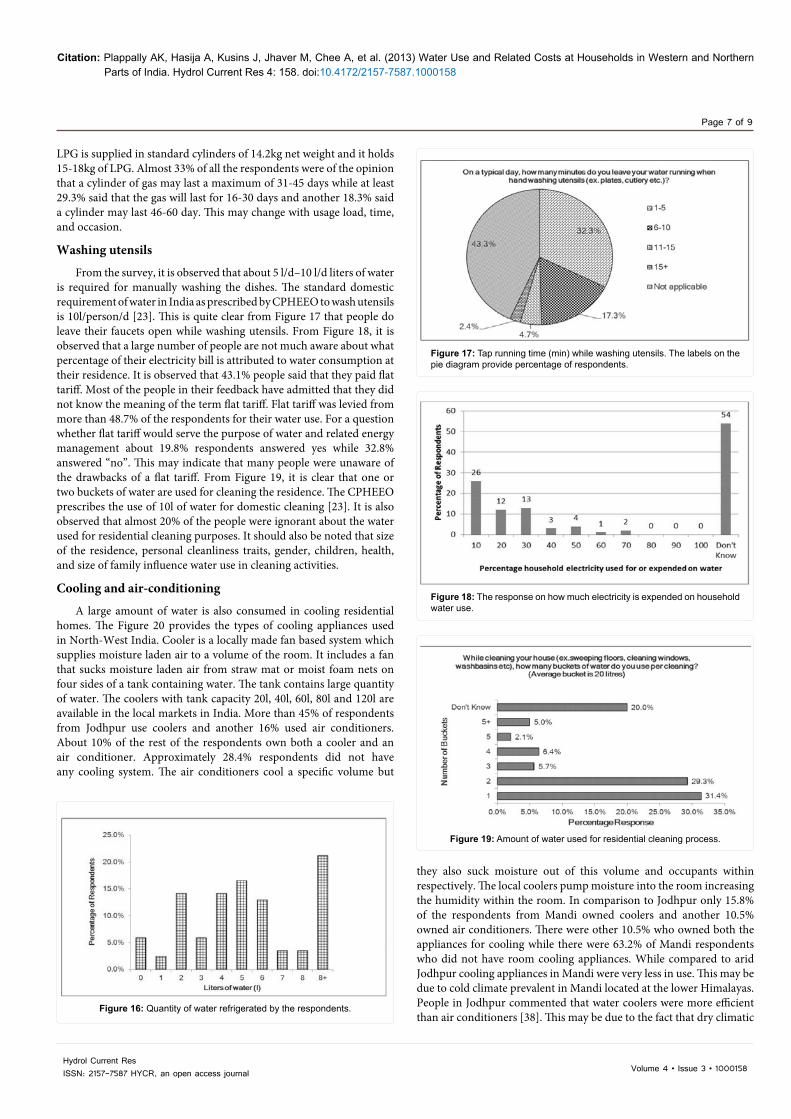
From the survey, it is observed that about 5 l/d–10 l/d liters of water is required for manually washing the dishes. The standard domestic requirement of water in India as prescribed by CPHEEO to wash utensils is 10l/person/d [23]. This is quite clear from Figure 17 that people do leave their faucets open while washing utensils. From Figure 18, it is observed that a large number of people are not much aware about what percentage of their electricity bill is attributed to water consumption at their residence. It is observed that 43.1% people said that they paid flat tariff. Most of the people in their feedback have admitted that they did not know the meaning of the term flat tariff. Flat tariff was levied from more than 48.7% of the respondents for their water use. For a question whether flat tariff would serve the purpose of water and related energy management about 19.8% respondents answered yes while 32.8% answered “no”. This may indicate that many people were unaware of the drawbacks of a flat tariff. From Figure 19, it is clear that one or two buckets of water are used for cleaning the residence. The CPHEEO prescribes the use of 10l of water for domestic cleaning [23]. It is also observed that almost 20% of the people were ignorant about the water used for residential cleaning purposes. It should also be noted that size of the residence, personal cleanliness traits, gender, children, health, and size of family influence water use in cleaning activities.
Cooling and air-conditioning
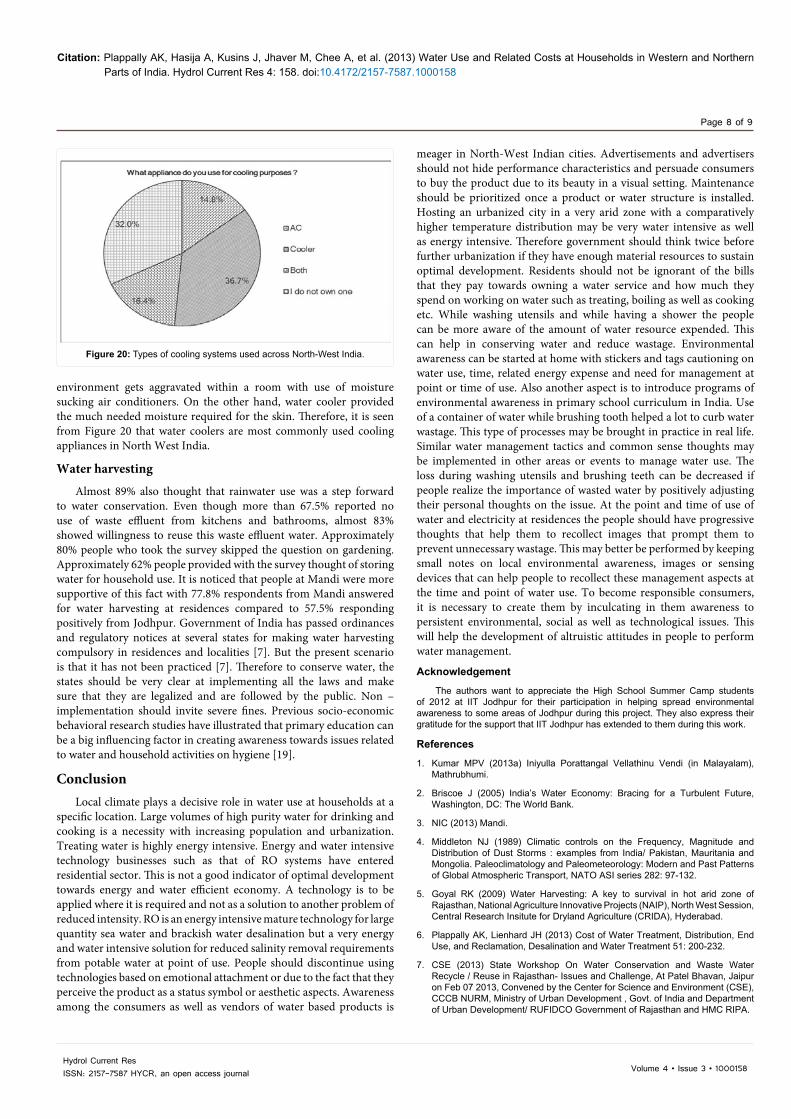
A large amount of water is also consumed in cooling residential homes. The Figure 20 provides the types of cooling appliances used in North-West India. Cooler is a locally made fan based system which supplies moisture laden air to a volume of the room. It includes a fan that sucks moisture laden air from straw mat or moist foam nets on four sides of a tank containing water. The tank contains large quantity of water. The coolers with tank capacity 20l, 40l, 60l, 80l and 120l are available in the local markets in India. More than 45% of respondents from Jodhpur use coolers and another 16% used air conditioners. About 10% of the rest of the respondents own both a cooler and an air conditioner. Approximately 28.4% respondents did not have any cooling system. The air conditioners cool a specific volume but
they also suck moisture out of this volume and occupants within respectively. The local coolers pump moisture into the room increasing the humidity within the room. In comparison to Jodhpur only 15.8% of the respondents from Mandi owned coolers and another 10.5% owned air conditioners. There were other 10.5% who owned both the appliances for cooling while there were 63.2% of Mandi respondents who did not have room cooling appliances. While compared to arid Jodhpur cooling appliances in Mandi were very less in use. This may be due to cold climate prevalent in Mandi located at the lower Himalayas. People in Jodhpur commented that water coolers were more efficient than air conditioners [38]. This may be due to the fact that dry climatic
Figure 16: Quantity of water refrigerated by the respondents.
Figure 17: Tap running time (min) while washing utensils. The labels on the pie diagram provide percentage of respondents.
Figure 18: The response on how much electricity is expended on household water use.
Figure 19: Amount of water used for residential cleaning process.
Citation: Plappally AK, Hasija A, Kusins J, Jhaver M, Chee A, et al. (2013) Water Use and Related Costs at Households in Western and Northern Parts of India. Hydrol Current Res 4: 158. doi:10.4172/2157-7587.1000158
Page 8 of 9
Volume 4 • Issue 3 • 1000158Hydrol Current ResISSN: 2157-7587 HYCR, an open access journal
Figure 20: Types of cooling systems used across North-West India.
environment gets aggravated within a room with use of moisture sucking air conditioners. On the other hand, water cooler provided the much needed moisture required for the skin. Therefore, it is seen from Figure 20 that water coolers are most commonly used cooling appliances in North West India.
Water harvesting
Almost 89% also thought that rainwater use was a step forward to water conservation. Even though more than 67.5% reported no use of waste effluent from kitchens and bathrooms, almost 83% showed willingness to reuse this waste effluent water. Approximately 80% people who took the survey skipped the question on gardening. Approximately 62% people provided with the survey thought of storing water for household use. It is noticed that people at Mandi were more supportive of this fact with 77.8% respondents from Mandi answered for water harvesting at residences compared to 57.5% responding positively from Jodhpur. Government of India has passed ordinances and regulatory notices at several states for making water harvesting compulsory in residences and localities [7]. But the present scenario is that it has not been practiced [7]. Therefore to conserve water, the states should be very clear at implementing all the laws and make sure that they are legalized and are followed by the public. Non –implementation should invite severe fines. Previous socio-economic behavioral research studies have illustrated that primary education can be a big influencing factor in creating awareness towards issues related to water and household activities on hygiene [19].
ConclusionLocal climate plays a decisive role in water use at households at a
specific location. Large volumes of high purity water for drinking and cooking is a necessity with increasing population and urbanization. Treating water is highly energy intensive. Energy and water intensive technology businesses such as that of RO systems have entered residential sector. This is not a good indicator of optimal development towards energy and water efficient economy. A technology is to be applied where it is required and not as a solution to another problem of reduced intensity. RO is an energy intensive mature technology for large quantity sea water and brackish water desalination but a very energy and water intensive solution for reduced salinity removal requirements from potable water at point of use. People should discontinue using technologies based on emotional attachment or due to the fact that they perceive the product as a status symbol or aesthetic aspects. Awareness among the consumers as well as vendors of water based products is
meager in North-West Indian cities. Advertisements and advertisers should not hide performance characteristics and persuade consumers to buy the product due to its beauty in a visual setting. Maintenance should be prioritized once a product or water structure is installed. Hosting an urbanized city in a very arid zone with a comparatively higher temperature distribution may be very water intensive as well as energy intensive. Therefore government should think twice before further urbanization if they have enough material resources to sustain optimal development. Residents should not be ignorant of the bills that they pay towards owning a water service and how much they spend on working on water such as treating, boiling as well as cooking etc. While washing utensils and while having a shower the people can be more aware of the amount of water resource expended. This can help in conserving water and reduce wastage. Environmental awareness can be started at home with stickers and tags cautioning on water use, time, related energy expense and need for management at point or time of use. Also another aspect is to introduce programs of environmental awareness in primary school curriculum in India. Use of a container of water while brushing tooth helped a lot to curb water wastage. This type of processes may be brought in practice in real life. Similar water management tactics and common sense thoughts may be implemented in other areas or events to manage water use. The loss during washing utensils and brushing teeth can be decreased if people realize the importance of wasted water by positively adjusting their personal thoughts on the issue. At the point and time of use of water and electricity at residences the people should have progressive thoughts that help them to recollect images that prompt them to prevent unnecessary wastage. This may better be performed by keeping small notes on local environmental awareness, images or sensing devices that can help people to recollect these management aspects at the time and point of water use. To become responsible consumers, it is necessary to create them by inculcating in them awareness to persistent environmental, social as well as technological issues. This will help the development of altruistic attitudes in people to perform water management.
Acknowledgement
The authors want to appreciate the High School Summer Camp students of 2012 at IIT Jodhpur for their participation in helping spread environmental awareness to some areas of Jodhpur during this project. They also express their gratitude for the support that IIT Jodhpur has extended to them during this work.
References
1. Kumar MPV (2013a) Iniyulla Porattangal Vellathinu Vendi (in Malayalam), Mathrubhumi.
2. Briscoe J (2005) India’s Water Economy: Bracing for a Turbulent Future, Washington, DC: The World Bank.
3. NIC (2013) Mandi.
4. Middleton NJ (1989) Climatic controls on the Frequency, Magnitude and Distribution of Dust Storms : examples from India/ Pakistan, Mauritania and Mongolia. Paleoclimatology and Paleometeorology: Modern and Past Patterns of Global Atmospheric Transport, NATO ASI series 282: 97-132.
5. Goyal RK (2009) Water Harvesting: A key to survival in hot arid zone of Rajasthan, National Agriculture Innovative Projects (NAIP), North West Session, Central Research Insitute for Dryland Agriculture (CRIDA), Hyderabad.
6. Plappally AK, Lienhard JH (2013) Cost of Water Treatment, Distribution, End Use, and Reclamation, Desalination and Water Treatment 51: 200-232.
7. CSE (2013) State Workshop On Water Conservation and Waste Water Recycle / Reuse in Rajasthan- Issues and Challenge, At Patel Bhavan, Jaipur on Feb 07 2013, Convened by the Center for Science and Environment (CSE), CCCB NURM, Ministry of Urban Development , Govt. of India and Department of Urban Development/ RUFIDCO Government of Rajasthan and HMC RIPA.
Citation: Plappally AK, Hasija A, Kusins J, Jhaver M, Chee A, et al. (2013) Water Use and Related Costs at Households in Western and Northern Parts of India. Hydrol Current Res 4: 158. doi:10.4172/2157-7587.1000158
Page 9 of 9
Volume 4 • Issue 3 • 1000158Hydrol Current ResISSN: 2157-7587 HYCR, an open access journal
8. CGWB (2008) Ground Water Scenario- Jodhpur District, Central Ground Water Board, Ministry of Natural Resources, Government of India.
9. Kugelman M (2013) India’s nexus between resources, climate change - and stability, NATO Review magazine.
10. DASRA (2012) Squatting rights: Access to Toilets in Urban India, Report by DASRA, Omidyar Network and Forbes Marshall.
11. Kumar MPV (2013b) Palatulli Peruvellam (in Malayalam), Mathrubhumi.
12. Plappally AK, Lienhard JH (2012) Energy Requirements for Water Production, Treatment, End Use, Reclamation, and Discharge, Renewable and Sustainable Energy Reviews. 16: 4818-4848.
13. Wilkinson RC (2000) Methodology for Analysis of The Energy Intensity of California’s Water Systems, and an Assessment of Multiple Potential Benefits through Integrated Water-Energy Efficiency Measures. A River Network.
14. TOI (2013) No drinking water, electricity and sanitation in 20% rural houses. The Times of India, Jaipur.
15. HT (2013) Only 10% of India’s dirty water is treated, Hindustan Times, New Delhi.
16. Sharma JP (2013) Nightmare in paradise for 5000 Ghaziabad residents. HT estates, Hindustan Times, Saturday, March 16, New Delhi.
17. Namboodiri VCN (2013) Sheetam Lakwamritopam- Vellam (in Malayalam), Mathrubhumi.
18. UN Water (2012) Survey of UN water publications with specific attention to the future of the world water development report process- Report on survey findings, UN Water.
19. Plappally A, Chen H, Ayinde W, Alayande S, Usoro A, et al, (2011) A Field Study on the Use of Clay Ceramic Water Filters and Influences on the General Health in Nigeria. Journal of Health Behavior and Public Health 1: 1-14.
20. Walker G (2008) Waterwise/MORI survey report: Water efficiency in England, Scotland and Wales. Preliminary report Prepared by Waterwise in conjunction with Ariel.
21. VS (2013) Domestic Solar Water Heaters. Vijaya Solar System.
22. MNRE (2013) Solar / Green Cities. Government of India, Ministry of New and renewable energy.
23. Dasgupta SC (2013) State level workshop on Water conservation and wastewater recycle/ reuse in Rajasthan-Issues and Challenges, at Jaipur Rajasthan. CSE Web net.
24. Paul VK (2013) Sustainable water use in Buildings, at the Proceedings of CSE Regional workshop on Sustainable Water and Sanitation: Energy and Resource Efficiency in Urban Water Management.
25. Kent (2013a) Kent gold UF membrane storage water purifier-Instruction Handbook for Installation, Operation and Maintanence.
26. Linx (2012) Insane water waste-reverse osmosis truth.
27. Lienhard JH, Plappally AK, O’Sullivan F (2014) Energy in Water Systems, Water in the Energy Industry, BP (in press).
28. Kent (2013b) Kent pearl Instruction Handbook for Installation, Operation and Maintenance.
29. Livpure (2013) Our Technology, RO+UV+UF.
30. Kozisek F (2004) Health risks from drinking demineralized water, Rolling revision of the WHO guidelines for drinking water quality, WHO, Geneva.
31. Hari AR (2008) Water- A Miracle Therapy, Pushtak Mahal, Delhi.
32. Homer PM, Kahle LR (1988) A structural equation test of the value attitude behaviour hierarchy. Journal of Personality and Social Psychology 54: 638-646.
33. Pinto DC, Nique WM, Anana ES, Herter MM (2011) Green consumer values: how do personal values influence environmentally responsible water consumption? International Journal of Consumer Studies 35: 122-131.
34. Rokeach M (1973) The Nature of Human Values. Free Press, New York.
35. Kamakura WA, Mazzon JA (1991) Value segmentation: a model for the measurement of values and value systems. Journal of Consumer Research 18: 208-218.
36. Kamakura WA & Novak TP (1992) Value-system segmentation: exploring the meaning of LOV. Journal of Consumer Research 19: 119-132.
37. McNeil M, Iyer M, Meyers S, Letschert V, McMahon JE (2005) Potential benefits from improved energy efficiency of key electrical products: the case of India. Energy Policy 36: 3467-3476
38. Puraram A, Chee A, Panditrao JS, Rao S, Mishra A, et al, (2013) Assessment of Household Water Use Based on Personal Values, Social Influence and Daily Routines of People at Jodhpur near Thar Desert in India, Watech-2013: OMICS International Exhibition and Conference on Water Technologies, Water Resource and Conservation: Water Short Regions and Drought, Bombay Exhibition Centre, Mumbai, India.
Submit your next manuscript and get advantages of OMICS Group submissionsUnique features:
• Userfriendly/feasiblewebsite-translationofyourpaperto50world’sleadinglanguages• AudioVersionofpublishedpaper• Digitalarticlestoshareandexplore
Special features:
• 300OpenAccessJournals• 25,000editorialteam• 21daysrapidreviewprocess• Qualityandquickeditorial,reviewandpublicationprocessing• IndexingatPubMed(partial),Scopus,EBSCO,IndexCopernicusandGoogleScholaretc• SharingOption:SocialNetworkingEnabled• Authors,ReviewersandEditorsrewardedwithonlineScientificCredits• Betterdiscountforyoursubsequentarticles
Submityourmanuscriptat:http://www.omicsonline.org/submission
Citation: Plappally AK, Hasija A, Kusins J, Jhaver M, Chee A, et al. (2013) Water Use and Related Costs at Households in Western and Northern Parts of India. Hydrol Current Res 4: 158. doi:10.4172/2157-7587.1000158