Sand Deposition and Poverty among Farm Households
38
Farm Productivity Loss due to Flood-Induced Sand Deposition: A Study in Dhemaji, India Kalyan Das Working Paper, No 73–12
Transcript of Sand Deposition and Poverty among Farm Households
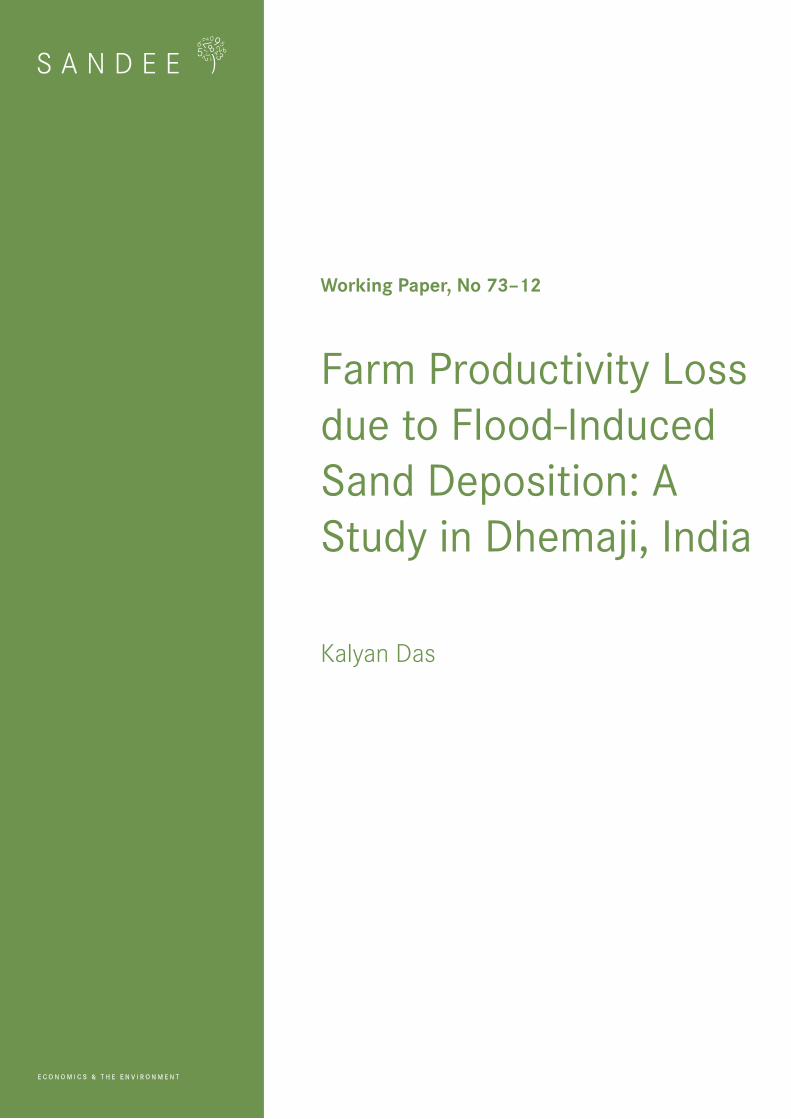
Farm Productivity Loss due to Flood-Induced Sand Deposition: A Study in Dhemaji, India
Kalyan Das
Working Paper, No 73–12

Published by the South Asian Network for Development and Environmental Economics (SANDEE)PO Box 8975, EPC 1056, Kathmandu, Nepal.Tel: 977-1-5003222 Fax: 977-1-5003299
SANDEE research reports are the output of research projects supported by the SouthAsian Network for Development and Environmental Economics. The reports have beenpeer reviewed and edited. A summary of the findings of SANDEE reports are alsoavailable as SANDEE Policy Briefs.
National Library of Nepal Catalogue Service:
Kalyan Das
Farm Productivity Loss due to Flood-Induced Sand Deposition: A Study in Dhemaji, India
(SANDEE Working Papers, ISSN 1893-1891; WP 73–12)
ISBN: 978-9937-596-02-2
Key words: Valuation
Production function
Sand deposits
Soil quality
Floods
India
SANDEE Working Paper No. 73–12

Farm Productivity Loss due to Flood-Induced Sand Deposition: A Study in Dhemaji, India
Kalyan DasOKD Institute of Social Change and DevelopmentGuwahati, India
October 2012
South Asian Network for Development and Environmental Economics (SANDEE) PO Box 8975, EPC 1056, Kathmandu, Nepal
SANDEE Working Paper No. 73–12

The South Asian Network for Development and Environmental Economics
The South Asian Network for Development and Environmental Economics (SANDEE) is a regional network that brings together analysts from different countries in South Asia to address environment-development problems. SANDEE’s activities include research support, training, and information dissemination. Please see www.sandeeonline.org for further information about SANDEE.
SANDEE is financially supported by the International Development Research Center (IDRC), The Swedish International Development Cooperation Agency (SIDA), the World Bank and the Norwegian Agency for Development Cooperation (NORAD). The opinions expressed in this paper are the author’s and do not necessarily represent those of SANDEE’s donors.
The Working Paper series is based on research funded by SANDEE and supported with technical assistance from network members, SANDEE staff and advisors.
AdvisorE Somanathan
Technical EditorPranab Mukhopadhyay
English EditorCarmen Wickramagamage
Comments should be sent to Kalyan Das
OKD Institute of Social Change and Development
Guwahati, India
Email: [email protected]

Contents
Abstract
1. Introduction 1
2. Valuing Environmental Damage 2
3. Study Area and Data 3
3.1 Soil Characteristics 3 3.2 Data Collection Strategy 4 3.3 Descriptive Statistics 5
3.3.1 Economic Background of the Families 5 3.3.2 State Support for Coping 6
4. Soil Analysis of Agricultural Plots 6
5. Data Analysis 7
5.1 Estimating a Production Function 7 5.2 Examining intra- and inter-district variation 9 5.3 Estimating Damage Cost 9
6. Conclusions and Policy Implications 10
Acknowledgements 11
References 12
TablesTable 1: Summary Statistics of 1,059 Households 14Table 2: Average Monthly Household Income from Agriculture in Rupees 14Table 3: Yield of Paddy per hectare (in kg) in Self-Owned Plots 15Table 4: Soil Characteristics of the Sampled Paddy Plot 15Table 5: Sand Magnitude (%) in the study Villages 15Table 6: Summary Statistics of Variables Used in Regression 16Table 7: Regression Results of Determinants of Paddy Yield 17Table 8: Estimates of losses per hectare from increased sand intensity 17
List Figures
Figure 1: Map of Dhemaji 18Figure 2: Sand deposited area of Dhemaji district 19Figure 3: Sand deposited villages of Jiadhal Basin Area, Dhemaji district 19Figure 4: Trend of yield of Rice in Dhemaji district and State of Assam (1990-91 to 2009-10) 20Figure 5: Sand as a determinant of paddy yield (all paddy plots) 20Figure 6: Sand as a determinant of paddy yield (paddy plots using HYV seeds) 21Figure 7: Study area-land plots and embankment breaching points 2009 22
Appendix Tables 23
Table A1: Nutrition Availability in Differently Textured Soil 23Table A 2: Correlations Coefficients (only significant values reported) at 95% Confidence Level 23
Annextures
Annexure-I: Household Survey Schedule for Listing (stage- I) 24Annexure-II: Household Schedule for Detailed Survey 25

South Asian Network for Development and Environmental Economics6
Abstract
It is widely believed that the decline in agricultural productivity in
the Dhemaji district of Assam, India, is due to flood-induced sand
depositions in paddy fields. Increased sand content reduces the water
retaining capacity of soils and reduces crop productivity. Soil tests in
346 agricultural plots in the Jiadhal basin of the Dhemaji district show
high concentrations of coarse sand, low pH, low organic carbon and
nutrients. Some 39% of the plots tested had sand concentrations greater
than 70%. An analysis of the effect of sand on productivity suggests
that sand deposits have a significant effect on paddy yields. The annual
damage costs from sand deposition in the study area are estimated to
range from INR 690 to 1845 (US$ 13 to 35) per hectare. This study
underscores the need for further research to identify other factors that
may also be responsible for the decline in paddy productivity in the
region, while proposing interventions to improve paddy productivity.
Key Words: Valuation, Production function, Sand deposits, Soil quality,
Floods, India.

1
Farm Productivity Loss due to Flood-Induced Sand Deposition: A Study in Dhemaji, India
Farm Productivity Loss due to Flood-Induced Sand Deposition: A Study in Dhemaji, India
1. Introduction
Studies have established soil quality to be an important factor in explaining farm productivity (Jaenicke and Lengnick, 1999; Andrews and Carroll, 2001). Although farm size1, labour and other inputs such as fertilizer and mechanization are important factors to be considered in any explanation of variability in farm productivity, soil quality is indubitably the most significant (Bhalla and Roy, 1988). Soil quality is also understood to play a role in ensuring the quality of groundwater and surface water (Doran and Parkin, 1994)).
In floodplains across the world, farmers have been using floods as a traditional mechanism to upgrade soil quality because they enable silt deposition (D’Souza 2006, Mishra 2001, Dixit 2009). Although floods are known to cause substantial damage through destruction of standing crops, property, human life and livestock, among the positive impacts of floods is the deposition of alluvium (or silt) which replenishes the productivity of soil. However, the deposition of a sandy layer, which can have long term impacts on soil and soil fertility and may even be irreversible2, is a less talked about phenomenon associated with floods. Since the damage caused by the deposition of a sandy layer is not a widespread issue (Reddy, 2003), it receives little space in discussions on floods and policy responses to floods in the state of Assam.
Dhemaji district (see Figure1), once the rice bowl of Assam, is now transformed into a virtual desert due to sand deposition as a result of flooding from the Himalayan tributaries of the Brahmaputra River (Figures 2 & 3). Satellite imagery from 1999 reveals that over 11,247 hectares have been rendered unproductive by sand deposition in the district (National Resource Management Foundation, 2006). Further, between 1992 and 2004-5, the net sown area in the district decreased by about 11% (7,689 hectares) and fallow and uncultivated land increased by 35% (8013 hectares) (GoA, 1996 and 2008).
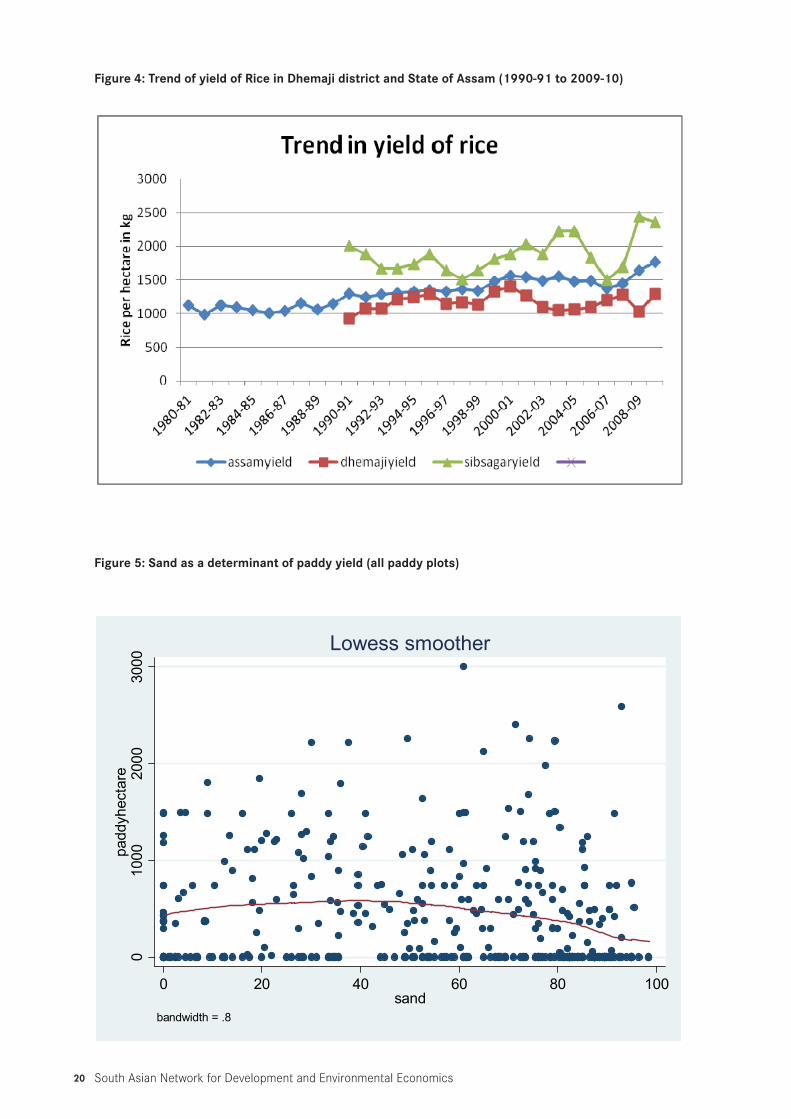
A Report by ICAR (1980) indicates that the average productivity of paddy in Dhemaji was the same as the state average in 1980-81 (about 1210kg/ ha). However, as show in Figure 4, average paddy productivity in the Dhemaji district is now much lower (1,290kg/ha according to 2009-10 data) relative to the state average (1,765 kg/ha). In our study area, information derived from a near-complete enumeration3 of 1,059 households in 15 sample villages, reveals that nearly 83% of the total paddy acreage (1,510 hectares), faces sand deposition. In addition to the productivity losses, there is concern about possible biodiversity losses. Dhemaji district produces numerous indigenous varieties of paddy that may disappear as paddy yield declines. In the 15 villages covered under this study, we recorded 13 indigenous varieties of paddy.
Sediments transported by rivers are of two types: (a) the bed sediment load of coarser particles, and (b) the wash loads of finer particles (or micro-nutrients). Generally, in high flow conditions, only the finer particles carried by the wash load get deposited in fields (Weibe, 2006). In contrast, floods now carry relatively heavy bed sediments
1 Since the 1960s, studies have established a strong inverse relationship between farm size and land productivity Sen, 1962; Mazumdar, 1965). Bhalla and Roy (1988) argue that once proper account is made of the exogenous land quality variable, the inverse relationship is observed to weaken and, in many cases, even to disappear.
2 This statement is based on our observations of the massive piling up of sand in paddy fields in the Jiadhal basin area of upper Brahmaputra valley during a visit in 2004. In subsequent years, however, the deposition of finer silts over the sandy layers has helped to reclaim land to a certain extent and to obtain some returns on paddy in some villages. The shifting of the river relative to the paddy fields and the distance between the paddy fields and the river bank are also determinants influencing the yield.
3 The Census of India (2001) shows there were altogether 1113 households in the 15 study villages.

South Asian Network for Development and Environmental Economics2
(sand)4 in the Dhemaji district. Goswami and Das (2003) have identified shifting cultivation, rampant tree felling for commercial purposes, and the extraction of boulders in the upstream mountain valleys as the reasons for the accelerated rate of sedimentation.5 The damage caused by sand deposition is not as high in other valleys in the north bank of Assam, although they too are inundated by floods.
An important question to ask is what the impact is of these sand deposits and what the resulting costs are. There are three dimensions to the assessment of the cost of damages in such situations: (1) the cost incurred due to depleting housing stocks and standing crops; (2) the cost of damage to land which to a large extent is irreversible; and (3) the cost incurred in the mitigation plans and relief operations of the state and the coping and adaptive strategies adopted by the affected people. However, policy papers, prescriptions and valuations of flood damages generally miss the second dimension, thus failing to arrive at a comprehensive estimation of flood damages.
Studies from other parts of the world have established a link between a decline in paddy productivity and anthropogenic-induced sand deposition (Caldwell et al., 2002). While studies on river flooding and erosion in north-east India address the link between sedimentation and the corresponding rise in river beds, channel shifting and erosion, the damage caused by sand deposition in paddy fields has attracted little attention (Weibe, 2006). The present study addresses this gap. We attempt in our study to value the damages to cultivable land and the loss of productivity due to flood-induced sand deposition.
The rest of the paper is as follows. Section II provides a brief overview of existing methods to value environmental damage. Section III describes the study area and the sampling frame. Section IV discusses soil quality in the flood-affected paddy plots. Section V identifies the factors influencing the productivity of paddy and estimates the damage due to sand deposition using an econometric model. Section VI concludes with a discussion of policy options and adaptation issues.
2. Valuing Environmental Damage
Two approaches are popular in the valuation of environmental damages: the Production Function Approach and the Ricardian Approach. The Production Function Approach takes the environment as an input in the production of a marketable good (Vincent, 2011) and estimates its potential positive or adverse effects (Kumar and Parikh, 1998). However, the traditional production function approach is known to have inherent biases with regard to damage valuation because it overvalues the damage since it omits the diverse adaptations that farmers customarily make in response to changing economic and environmental conditions.
Production function studies often do not consider the introduction of a new crop in response to the changing physical conditions of the land, technological changes, and changes in land use. Critics feel that this bias can be corrected by the Ricardian Approach, which accounts for farmers’ responses to various climatic or environmental conditions for the purpose of profit-maximization. On the other hand, the Ricardian Approach assumes that, under competitive conditions, the value of land or the land rent will be equal to the net yield of the highest and best use of land. In agriculture, land rent tends to be a large fraction of the total costs, which can be estimated with reasonable precision (Mendelsohn et al., 1994). We may capture land value through net revenue (Kumar and Parikh, 1998), through farmers’ own perceptions regarding the value of the land (Maddison et al., 2007), or through the actual sale value of the land.
Researchers have, however, expressed reservations regarding the use of sale price in the Ricardian Approach because it requires the incorporation of several supportive parameters which could influence the value of land (Koundouri and Pashardes, 2003). The availability of water, for one, could revise the value of land upwards despite other adverse environmental conditions (Mendelsohn and Dinar, 2003). Furthermore, in any given year only a very
4 In the study area, we observed massive sand deposition in the villages, where the embankments have been breached in recent times (see Figures 3 & 7). This may open up the debate on the need for effective embankments. However, in recent times, there have been few studies advocating embankments except for a study by Myaux et al. (1997) that argues, in a different context, that river embankments contribute to the health status of children in flood-prone areas.
5 Our study did not attempt to have a measure of these activities due to unavailability of secondary data.

3
Farm Productivity Loss due to Flood-Induced Sand Deposition: A Study in Dhemaji, India
small fraction of farmland is likely to be put on the market making the sample small and unrepresentative.6 Keeping these methodological challenges in mind, we now proceed to a description of the study area. As we discuss later, given limited land transactions in our study area, we use the production function approach to estimate damage costs borne by farmers from sand depositions.
3. Study Area and Data
Dhemaji, which is a narrow valley district that is 2,637sq.km in area and approximately 30 km in width located in northeastern Assam, is squeezed by the steep slope of the Arunachal Himalaya from the north and the east, and by the Brahmaputra River in the south (See Figure 1). Its catchments receive the heaviest rainfall (on average 3,500 mm annually) while the 19 tributaries of the Brahmaputra carry heavy loads of sediment (Goswami, 1998).
The district is home to 1,140 villages and a population of 688,000. Floods in the year 2000 affected at least 333,000 people in 810 villages, damaging 11,331 hectares of standing crops. As reported by the state disaster management authority, the flood in 2011 had affected a population of 154,500 and an area of 28,295 hectares in 261 villages of the district.
The Government of Assam spends millions of rupees annually in disaster avoidance, primarily for the construction of embankments, relief operations and mitigation activities. To date, 40 embankments and dykes have been constructed in the district while another six have been sanctioned costing INR 1,016.38 million (DRDA, 2009).
3.1 Soil Characteristics
Although detailed historical records on the condition of the soil in the study area are not available,7 there are indications that not so long ago the soil of this flood-affected area was conducive to high rice productivity.
The soil of the district is mainly alluvial with a mixture of sand and clay in varying proportions. The soil is deep and well drained with a varying texture that ranges from coarse loamy to fine loamy. The district has large expanses of low-lying land with heavy clayish soil and a high percentage of nitrogen, which is conducive to rice cultivation. The new alluvial soil of the study area was subject to recurrent floods carrying annually large loads of silt (ICAR, 1980). The soil is rich in organic content and, consequently, high in nitrogen, which is a typical feature of soil in this area.
The National Bureau of Soil Survey provides information on soils for three areas of Dhemaji: two areas of Bordoloni and one area of Maralgaon (NBSS, 1994). According to available data, the soil texture of the Bordoloni area was sandy with alluvial as parent materials. The land capability is classified as III ws, which means wet cultivable land with rooting zone limitation.8 The texture of soil at other points of the Bordoloni area shows itself to be coarse silty with alluvial as parent material. The area is severely flood-prone with land capability classified as III w. The texture of soil at Maralgaon shows itself on the other hand to be coarse loamy alluvial with land capability level identified as III ws with a soil depth of more than 100 cm. This suggests that the area requires the management of excess water while crops must be selected that are adapted to the wet conditions. The pH value of soil in all these areas found to be in the ideal range of 6.5 to 7.0 (NBSS, 1994). The areas covered in the NBSS samples include some sample villages included in this study (see Figure 7).
The issue of severe flood damage and land degradation in the study area came into focus only in the late 1990s. A study commissioned by the State Land Use Board, Assam, indicates that 14,261 hectares of paddy in 575 villages were damaged by floods in 2003 (NRMF 2006). In the following year, the paddy area that was damaged was approximately 21,388 hectares in 465 villages. The study used remote sensing data which indicated three distinct 6 Expectation of future development could be a reason for holding back the land. In our study area however the reason is that very few
value the sand deposited degraded land, the damage which is considered as irreversible. 7 The reason for this is because government labouratories in the State of Assam test the texture of the soil by the feel and touch method,
which cannot correctly indicate the exact proportion of sand, silt or clay in the soil. In our study, the soil tests were conducted in a private labouratory.
8 The land capability classification of the US Department of Agriculture allocates land suitable for cultivation to classes I to IV; grazing to classes V-VI; forestry to class VII; and wildlife and recreation to class VIII. These classes are divided into sub-classes of erosion risk (e), wetness (w), rooting zone limitation (s), and climatic limitation (c) (Dent and Young, 1981).

South Asian Network for Development and Environmental Economics4
clusters of sand deposits in the district by the three tributaries of Brahmaputra: Jiadhal, Gainadi and Simen rivers (see Figure 2).
The shift in the course of the river Jiadhal and the construction of embankments have given the farmers some respite from the destruction caused by numerous floods. In some villages, embankments have prevented the entry of coarse sand carried by the first waves of the flood to the paddy fields although subsequent flood waves, which overflowed the embankments, deposited silt that enriched the degraded fields.
Soil scientists have shown that paddy cultivation is possible on silted land, even where there is a high proportion of sand at the base, if water supply is assured throughout the growing period. In the case of Dhemaji, although the coarse texture of the soil reduces the water- and nutrient-retaining capacity of land, farmers have the advantage of the relatively long monsoon period from June to October to overcome the lack of irrigation. Moreover, rice varieties which have a shorter ripening period enable farmers to get a reasonable return. But the soil texture9 influences transmission and storage of water, the flow of air in the soil, and the soil’s capacity to supply nutrients. Because fine textured soils are in general more fertile than coarse textured soil (i.e., sandy) primarily due to the higher clay content and organic matter, soils of fine and medium texture are commonly in use in rice cultivation (See De Datta, 1981). A higher content of sand, on the other hand, leads to lower productivity of the soil.
3.2 Data Collection Strategy
We selected for our study the area between the twin rivers of Kumotia and Jiadhal in five flood-affected Gram Panchayats of Dhemaji district (see Figure 7). Satellite imagery data indicate this area to be one of the major sand-deposited areas (see Figure 5). We selected 15 villages randomly from the 93 villages in the five Gram Panchayats.
We collected the data in two stages. In Stage I, we administered a one-page questionnaire to almost all the households (1,059 households in all) of the 15 selected villages. We collected information on the possession of agricultural land, agricultural land affected by sand deposition, land leased for cultivations and the terms of the lease, the quality of the land leased, and land purchased and sold in recent times for the purpose of understanding land value in a degraded environment, the total production of paddy, conversion of agricultural land for other economic activities, and out-migration from the households. We estimated the average plot size at 1.4 hectares per household. The data showed sand deposition in 84% of the total paddy growing area. The leasing of land for cultivation purposes and out-migration of family members in search of jobs from the households, which are indicators of distress (Nair and Ramanathan, 2007), have become significant phenomena in the study area (Table 1). We found land transactions to be virtually absent in nine of the 15 sample villages, indicating that people do not value degraded land.10
In Stage II, we randomly selected 10 households from each village for the purpose of obtaining more detailed information on household characteristics, agricultural operations including input levels of mechanization, land improvement measures, access to credit, migration, and extent of state support.
In addition, we collected soil samples from every agricultural plot (346 in all) of the 148 sampled households. We measured the texture of the soil, pH factor, organic carbon, and the nutritional contents of the selected categories of texture in order to assess the quality of the soil for the purpose of relating it to the returns from agricultural operations.
We collected soils up to 15 inches in depth because paddy roots supposedly penetrate at least 15 inches into the soil.11 For each plot, we collected soil samples from a minimum 4 to a maximum 16 grid points depending on the
9 Texture refers to the size of the soil particles. Texture is the relative proportion of sand, silt and clay in each soil. Texture classes are: i) coarse texture sands, loamy sand and sandy loams with less than 18% clay, and more than 65% sand; ii) medium texture sandy loams, loams, sandy clay loams, silt loams with less than 35% clay and less than 65% sand. The sand fractions may be as high as 82% if a minimum of 18% clay is present. For more details, one may refer to the soil texture triangle followed by the US Department of Agriculture which is available in standard textbooks like Ashman and Puri (2002).
10 Possible compensation from the state for degraded land is minimum. The revenue department of the state has provision to allot INR 6000/ per bigha or INR 45,000 per hectare for removal of sand from the paddy plot. Considering the magnitude of sand deposition the amount is considered to be insufficient.
11 Rice roots do not penetrate very deep in rain-fed lowland conditions. Depending on the soil conditions, roots may penetrate between 15 and 25cm in depth in rain-fed areas (Jamson, 2011).
5
Farm Productivity Loss due to Flood-Induced Sand Deposition: A Study in Dhemaji, India
size and uniformity of the plots, after making certain subjective assessments. We mixed up soils collected from different grid points of a plot to make the sample representative.
We measured the texture of the soils, the pH factor, and the organic content of all 346 sampled soil plots.12 The pH range of 6.3 to 6.8 is considered ideal for paddy cultivation. The high organic content of the soil reflects the availability of nitrogen in the soil. The texture, pH value and organic content would reflect the status and suitability of the soil for paddy.
3.3 Descriptive Statistics
3.3.1 Economic Background of the Families
The data showed the average land holding to be 1.4 hectare per family although their mean monthly return from agriculture was estimated to be only INR 305. Since little of the output is sold in the market, we multiplied the annual production by the average wholesale market price in order to obtain the annual agricultural income. This return is distressingly low (see Table 2) and production is not adequate to ensure even the 30kg of rice required for a family of five per month.13 The returns from agriculture, however, are relatively better in a few villages that have a locational advantage. Two villages in our study area, Tekjuli and Tingharia, which are located on the upper course of the river, enjoyed slightly better returns.
We found low agricultural incomes to be pushing people to seek certain non-farm jobs. Agricultural income now constitutes less than 30% of the total household income in more than 90% of the sampled households. Although some households had salaried jobs, most relied on income from casual labour, road construction (made available by the Public Works Department of the state and the General Reserve Engineering Force [GREF]), jobs in the transport sector, livestock rearing (mostly piggery), and weaving (in the case of women). The National Rural Employment Guarantee Scheme (NREGA) and remittances from family members working outside the district were an additional source of income. Salaried jobs included school teaching, defense and para-military jobs as well as petty employment in private sector services. Those with regular government jobs enjoyed higher incomes compared to the others.
This decline in agricultural income has triggered large scale migration of residents to distant places such as the plywood and rubber factories of Kerala and private security service jobs in Tamil Nadu. In fact, most out-migrations in the sample were either to destinations outside the district (26%) or to those outside the state (55%). The incidence of out-migration reported by households was more than 20% of the total 1059 listed households. The proportion of out-migrants is significantly higher in this area compared to the rest of the country, where out-migration on average is about 9% (GoI, 2010).14 The average remittance from migrants was INR 2,198 per month in the 33 households in our sample which reported out-migration.
There is some effort to reclaim land for agriculture in the area with roughly one fifth of the households in the 15 villages leasing land for agricultural purposes. Although the returns, as mentioned earlier, were low, the opportunity cost of not planting paddy is high in the poorly diversified economy of the area. The survey data reveals that the yield of paddy in leased plots is 503 kg per hectare. Although this is marginally greater than the reported productivity on one’s own land (at 354 kg/ha), it is not significantly different (see Table 3). Moreover, these numbers are much lower than the average for the state as a whole which stands at approximately 1,635 kg per hectare (GoA, 2010).
12 The pH is a measure to test how acidic or basic a substance is. The pH scale ranges from 0 to 14 where a scale of 7 is neutral, a value less than seven is acidic, and a value greater than 7 is basic alkali.
13 Rice is the staple food in the region and constitutes all three meals of the day. According to the Ministry of Agriculture, Government of India, the per capita consumption of rice stood at 208 grams per capita per day in 2001. The rice requirement for an average family of five therefore comes to approximately 31.2kg of rice per month.
14 The relationship between sand deposit and outmigration is found to be significantly negative in our sample. This paradoxical result can be explained by the fact that there are several reasons for out-migration including push factors such as overall flood damage and pull factors such as higher wages in areas to which the migrants go.

South Asian Network for Development and Environmental Economics6
3.3.2 State Support for Coping
The affected villages have been able to secure some livelihood support under the flagship programs of the Government of India such as the Indira Awash Yojona (IAY, the housing program for the poor) and NREGA to name a couple. According to reports, the district administration tries to link the flagship programs to the flood relief support program. Therefore, we found the support received from the state in the form of food grain supplies in the flood-affected villages to be meager. The average estimated value of food grain received by each affected household averaged just INR 1,326 for the entire year, Dihingia being the village to receive the highest, at INR 5,047, because it is located close to the national highways. Considering that the market price of rice is INR 15 per kg and that of lentils is INR 60 per kg, the support received may suffice for rations for just two months for the average Assamese household of five.
The average number of workdays that people were granted under NREGA was just 14 days in the sampled villages, the maximum being 39 days per household in the Samarajan village as opposed to the stipulated provision of 100 days per year. The type of support available from the state is therefore evidently inadequate. Still 74 households out of the 148 in the sample have able to get some work under NREGA. Supplementing their income from NREGA, 29 households were able to push themselves above the poverty line. Leaving aside income from NREGA, 108 households had monthly income of less than the estimated poverty-line income of INR 4,298.15
4. Soil Analysis of Agricultural Plots
As the discussion above shows, the average productivity in the sampled plots was low (at 467 kg/ha). However, there was a significant variation in paddy productivity as indicated by the standard deviation of 232.
Field visits did not find farmers adopting any type of land improvement measures, including application of chemical fertilizers.16 One explanation for this might be poverty; most farmers of the area being poor, they may not have resources other than manpower and bullocks for investment in agriculture. The other explanation might be that there is little motivation on the part of farmers to invest in the poorly textured, flood-ravaged areas. However, some households (approximately 50% of the sample), have started using tractors to till land.
Soils in the study area are poorly textured with a significant presence of sand and silt, which is acidic in nature having a poor organic content (Table 4). A pH level below 6 inhibits the process of nitrification while low organic carbon indicates low nitrogen content in the soil. However, there is significant variation in sand deposits and sand content, suggesting that paddy plots are not uniformly affected (see Table 5).
We can classify the plots into 9 categories according to the soil types (see Table A 1 in Appendix). The first three categories of soil--sandy, loamy sand and sandy loam--comprise more than 60% of the sampled plots indicating low nutrient content. We tested for the availability of Nitrogen, Phosphorus and Potassium for five dominant categories of soil (sandy, loamy sand, sandy loam, loam and silt loam) in 81 sampled plots in the study area. The tests reveal that all five categories of soil, irrespective of the dominance of sand or silt in the soil, show poor nutritional content (see Table A 1).17 The deposition of fine silt during floods has failed to ensure the nutritional content in the soil.
Forty-three percent of the sample plots record zero returns. In fact, in the year 2009, 76 out of the 346 sampled plots were not tilled by the farmers. They have cited floods as the reason for zero returns in 36 of these plots and sand as the reason in the case of the other 112 plots. Both floods and sand destroy the standing crops leading to low returns. Farmers claim that tilling was not possible in sandy plots. While flooding is temporary, sand deposition has a long term impact.
15 Planning Commission of India estimates poverty line of India based on INR. 28.65 per capita per day. Considering the average size of family at 5 the amount comes to INR 4298 a month.
16 Data for Dhemaji district show fertilizer application of 4.2 kg per hectare for the Kharif season during 2009-10 relative to the figure for Assam state as a whole, which is 36.9 kg/ha (Government of Assam, 2010).
17 The availability of Nitrogen in the soil is considered poor if the Nitrogen availability is less than 272kg/ha of land. For Phosphorus it is considered low if it is below 22.5kg/ha while for Potassium the limit is 136kg/ha. The Organic Carbon content in the soil is considered low if it is less than 0.5 (VanLoon et al. 2005).

7
Farm Productivity Loss due to Flood-Induced Sand Deposition: A Study in Dhemaji, India
5. Data Analysis
5.1 Estimating a Production Function
It is common to study agricultural output variability with the help of a production function that links output with various inputs such as labour, capital, fertilizer, pesticide, irrigation, etc. It is now common also to include soil quality as an explanatory variable (Ekbom and Sterner, 2008). While soil quality would be an environmental factor, the rest would be physical factors. Our main interest here is to examine the impact of sand deposition on productivity. Our underlying understanding is that productivity is a function of environmental and physical factors and farmer effort.
To examine the impacts of sand deposits on productivity, we measured paddy yield in weight and expressed it as the kilogram return per hectare. We measured sand concentration as a proportion18 while measuring distance in meters (see summary statistics in Table 6). We hypothesized that a plot’s distance from the river would be an important variable in explaining variation in paddy yield. We expected the use of HYV seeds (dummy variable) to be advantageous to paddy production due to two reasons: HYV technology boosts productivity while having a short gestation period, which helps where humidity retention by the soil is low. We also expected paddy yield to be negatively associated with soil characteristics, particularly the deviation in soil pH factor from the normal range (See Table A 2 in Appendix).
The usual factors of production such as labour and fertilizer are likely to be endogenously determined and would give biased coefficients (Vincent, 2011). Endogeneity emerges from the fact that farmers in sand deposited plots may either put extra labour to clear the sand and do the ploughing or use less labour because they think it is not worth the effort. Thus, labour effort is correlated with sand deposits.19 We note further that, except manpower, other inputs in agriculture are not used in the study area. The uncertainty introduced by floods may compel farmers to refrain from using inputs such as capital and fertilizers.
The impact of different inputs on paddy output is modeled as
Y = f (Sand, Ph, Distance, HYV, Plotsize)
Where
Y = Paddy output per hectare in kilograms
Sand = Proportion of sand in the paddy plots
Ph = Deviation of pH factor from the ideal value of 7
Distance = Distance of paddy plot from the river in meters
HYV = Adoption of HYV seeds (dummy variable)
Plotsize = Size of paddy plots in hectare
We attempt three different econometric specifications to test for the validity of the impact:
a) Linear version
Yi = b0 + b1 Xi + error
b) Log-Log function in Cobb Douglas form
Ln (Yi) = b0 + b1 Ln (Xi) + b2 Zi + error
c) Tobit Model: In the 346 sampled plots, we recorded 148 plots with zero output in 2009. In order to ensure the validity of our OLS results, we also tested a Tobit model with left censoring at 0. The standard Tobit model assumes that
18 Soil samples collected from paddy plots were tested in labouratory to determine the sand proportion as well as other soil characteristics.
19 Our field data show significant negative correlation (-0.15 at 1% level of significance) between labour hours used in paddy plots and sand deposit level in the plots.

South Asian Network for Development and Environmental Economics8
Let,
Yi * = b0 + b1Xi + error
y = 0 if y * < 0
y = y* if y * > 0
We present the regression results in Table 7. Models 1-4 refer to OLS estimations, while models 5-8 are Tobit estimations. The estimates presented here are tested for significance with robust standard errors in order to avoid problems of heteroskedasticity. For the Tobit results, we present only the marginal effects for comparison with the OLS results.
We present results from multiple models in order to assess the robustness of our estimates to changes in specifications. Models 1 and 5, in which sand is regressed on paddy yields, establish the strong negative relationship between the presence of sand and productivity. Models 2 and 6 estimate the impact of sand on productivity but add additional previously-discussed variables that may independently affect productivity. These include plot size, soil quality, distance from river (or flood potential) and use of HYV seeds.
The linear and log-linear models in Table 7 show that sand has a significant negative impact on paddy yield (paddyhectare). In the linear OLS models (1-2) and Tobit models (5-6), we find that for every unit increase in sand concentration, production in paddy per hectare decreases by 2.36 kg to 6.39 kgs. While the signs of coefficients of the Tobit models (5-6) remain the same as in the OLS, the co-efficient for sand is higher in the Tobit estimations relative to the OLS estimations.
As previously discussed, labour is likely to be an endogenous variable. However, to better understand the effect of labour, we ran two additional regressions, (model 3 and 7 in table 7) with labour as an input (log of total labour hours used in paddy plots). The regression results corroborate the possibility of endogeneity. When labour is included in the production function, the coefficients for sand (-1.94 in model 3 and -2.21in model 7) are smaller relative to the rest of the models when labour is not included. Thus, sand appears to have a direct effect on productivity and an indirect effect via labour. Further, the coefficients associated with labour are insignificant. Since, our primary interest is the overall effect of sand, we use the coefficient of sand without labour to value damage costs.
Models 4 and 8 regress the log of paddy per hectare on independent variables. Here, the coefficient of (log) sand concentration is not significant. This indicates that the elasticity of productivity with respect to sand concentration is not different from zero. This is possibly an indicator of such high sand concentrations that a relatively small change in sand concentration is not good enough to lead any change in output.
The hypothesized effects of different independent variables on paddy yield are as expected. Distance between the plot and river (Distriver) showed a positive correlation with the paddy yield. The further the plot was from the river side, the higher the productivity. It is possible that plots nearer to the river get repeated deposition of sand while those further away have better chances of increasing organic concentration over time and recover soil productivity. These may also be closer to human habitations and so people spend more time in the soil recovery processes.
All the regression models show that the size of the plot in hectares (plotsize) has a consistent negative effect, implying that a large plot size leads to lower yield. As discussed earlier, farmers in the study area use largely family labour. Hence, in cases of larger plots, family labour may not be adequate for intensive tillage of the entire land. Our results also show that use of HYV seeds (HYVdummy) contributes to higher yield.
We undertook some non-parametric analysis (i.e., Lowess smoothing), to further examine the relationship between sand and the decline in paddy productivity.20 This analysis, shown in Figure 5, suggests that this relationship is not very strong. We were able to arrive at a somewhat clearer picture of the impact of sand on yield when we smooth the data by taking into account only the 71 plots that had adopted the HYV seeds of paddy (see Figure 6). Some households are now switching to HYV variety of paddy, which has a short gestation period (of 80-110 days) as part
20 LOWESS is a data analysis technique for producing a “smooth” set of values from either a noisy time series or from a scatter plot with a ‘noisy’ relationship between the 2 variables.

9
Farm Productivity Loss due to Flood-Induced Sand Deposition: A Study in Dhemaji, India
of an adaptation strategy. This may be because traditional varieties of paddy require longer gestation periods (of 120-150 days), which sandy soil cannot sustain once the monsoon rain withdraws.
5.2 Examining intra- and inter-district variation
While the regression analysis in most of the specifications shows sand as significantly impacting on productivity, the variation in output due to sand is insufficient to explain the intra and inter-district variation in output.21 It is noteworthy that the average yield of rice in the state is 1,433 kg per hectare (which is the average during the two decades of 1990-91 to 2009-10) (GoA, Statistical Handbooks). In comparison, the average yield in the Dhemaji district is 1,165 kg rice.22 In the sand-deposited study villages of Dhemaji district, however, the average yield is 315 kg of rice per hectare.23 In contrast, the flood ravaged Dhubri district in lower Assam has an average yield of 1,304 kg of rice per hectare.24
Time series data of yield for Dhemaji district and for Assam state as a whole show that the gap between the average yield of rice between the state and Dhemaji district has increased over the years (Figure 4). Average productivity of rice during the 10 years period 1990-91 to 1999-2000 was 1,157 kg/ha in Dhemaji district and 1,174 kg/ha in the state as a whole. The gap has increased considerably during 2000-01 to 2009-10 showing average productivity of rice at 1,334 kg/ha for Dhemaji and 1,532 kg/ha for Assam as a whole.
Overall it can be concluded that sand has a significant effect on yield in Dhemaji district. However, our data does not allow us to rule out or examine other factors that may be contributing to the difference in productivity between the study villages and other areas of the state. Local people, however, consider sand as the main determinant of the poor condition of the soil. As previously noted, 50% of the farmers in our sample indicated that sand deposits as the main reason for low yields in their farm plots.
5.3 Estimating Damage Cost
We now proceed to estimate the cost of sand deposition. As mentioned earlier, historical data on soil characteristics in the study area is not available. However, ICAR (1980) provides data on the soil texture of the agro-ecological zone of the middle plain of the north bank of Brahmaputra River. According to this data, the coarse sand composition of soil in the Rangapara (located in same agro-ecological zone of foothill Himalayas as Dhemaji and in the district that neighbors Dhemaji) shows 15.7% sand in the loamy textured soil. Thus, for valuing sand damages, we consider that the normal proportion of sand in soils to be 15.7%.
In our study sample plots, average sand proportions were 54.2% of the soil. Further, soil test shows that 39% paddy plots have more than 70% sand concentration. Regression models 2 and 5 (Table 7) show productivity loss for a one unit increase in sand concentration to be in the range 2.36 to 6.39 kg. If the soils were returned to their normal proportion of sand (15.7%), this would mean a decrease in soil concentration by 38.5%.
In order to obtain damage costs, we predict paddy yields (based on our regression estimation) for sand equal to 15.7% and 54.2% of soil, holding all other variables at their sample mean values. Table 8 shows the predicted paddy yields for these levels of sand for regression models 2 and 5. The decline in paddy as a result of sand deposits is given by the difference between yields. Given the two models, the decline in yield as a result of sand deposits is calculated to fall within the range of 92 kg to 246 kg of paddy per hectare per year.
21 We have tested this considering the average sand proportion in the paddy field of affected villages and average proportion of sand in non-affected villages and putting the sand figures in the regression models. The difference in yield is not much compared to what the figure 4 shows. See section 5.1 for more on this.
22 Although average paddy productivity is low in the Dhemaji district, data for recent years indicate an upward trend (see Figure 4). This may be attributable to the recent rise in paddy cultivation areas (from 19,005 ha in 2004-05 to 40,869 ha in 2008-09) using HYV seeds. Dhemaji district was created in 1987 and we did not get yield data prior to the year 1990. GoA, statistical handbooks of specified years for detail.
23 Paddy production is converted to rice. Field data was collected on the basis of paddy production per hectare. Processing of 1,000 kg paddy yield about 675 kgs rice.
24 In the flood-prone district of Dhubri, many farmers have adopted a risk-averse strategy by an appropriate combination of crops and seasons taking advantage of shallow tube well irrigation. Consequently, there has been an upward trend in paddy yield in the district in recent times (Mandal, 2010). The District however is not affected by sand deposition during floods.

South Asian Network for Development and Environmental Economics10
Considering the average price of paddy at INR 750 per quintal at the wholesale market, paddy loss is estimated at INR 690 per hectare (estimate I) and INR 1,845 per hectare (estimate II) (see Table 8). Based on available evidence, we assume that approximately 11,331 hectares in the district have been affected by sand (NRMF, 2006). Thus, annual damage costs for the entire district range from an estimated at INR 7.82 million (US$ 146,138) to INR 20.91 million (US$ 390,760).25
Until the late 1990s, as reported during the field visits farmers in the flood affected area, Dhemaji district produced on average 2,400 to 3,000 kg of paddy per hectare. Considering the present return of 467 kg of paddy per hectare in our sample households, this suggests that yield has declined by 1,933 to 2,533 kg of paddy per hectare in the current period relative to the late 1990s. In monetary terms, this falls between INR 14,498 (US$ 271) (Table 8) to INR 18,998 (US $355) per hectare. Thus, if we compare current average yields to yields based on recall data from our field survey in the 1990s, the loss to farmers in the district is significantly higher than if we use our regression coefficients. However, our estimations based on regression results show the effect of sand alone, other things being held constant, while model III estimations are based on average yields. Thus, while the recall data suggests significantly larger losses, we need to be cautious. These estimates could be subject to recall bias. Further, with model II estimations we are comparing differences in average productivity and factors other than sand may also be responsible for these productivity changes.
GoA (2009) estimated the flood damage in the Dhemaji district to be INR 14,590 per hectare during the year 2007-08. In another study, Weibe (2006) estimates flood damage at INR 6,521 per hectare during the 1999-2005 period. While our valuation numbers focus on sand deposit damages alone and not flood damages, it is still useful to see if they are in line with flood damage estimates. We find that it is appropriate that our estimates of sand deposit damage are smaller than the overall flood damage estimates given above.
6. Conclusions and Policy Implications
The results of the study reflect overall the crisis in livelihood caused by sand induced land degradation in the agrarian economy. It is evident that the near irreversible damage to the paddy fields and poor agricultural outcomes from the partially degraded lands is forcing people to look for other income and livelihood alternatives.
Our regression models show productivity losses range between 92 and 246 kg of paddy per hectare with an average presence of 54% sand in the soil samples. Considering that one kg of paddy costs INR 7.5 and approximately 11,331 hectares in the district have been affected by sand, total annual losses are estimated to lie between INR 8 to 21 million (approximately US$ 150-400,000) in the district of Dhemaji.
Our survey indicates that some households in the District have shifted from paddy to mulberry plantations and pisciculture as an adaptation strategy. However, pisciculture is generally not profitable with acidic soils. Thus, farmers may need to apply significant amounts of lime in order to culture fish and it is not clear how remunerative this practice may be.
Conditions in the Dhemaji area put into stark relief the need to strengthen the social security of the poor. More effective implementation of rural development and employment programs by the government might be one way to ameliorate the rural distress in this region. The state expenditure on the construction and reinforcement of embankments, which has been its main strategy to control floods, has not been as beneficial because of frequent breaches in embankments. Any attempts to improve water management would be helpful to farmers. Sandy soil cannot retain water and assurance of water would improve yields.
Since sand deposition is only a partial explanation for the decline in paddy productivity in the region, our study points to the need for further research to identify other factors that are also responsible for this decline. In addition, it would be extremely useful to understand how better management of upstream areas may result in lower sand deposits in paddy fields.
25 The exchange rate used is 1 US$ to INR 53.5.

11
Farm Productivity Loss due to Flood-Induced Sand Deposition: A Study in Dhemaji, India
Acknowledgements
This study received financial support from the South Asian Network for Development and Environmental Economics (SANDEE), Kathmandu. I am grateful to E. Somanathan for research advice and Jean Marie Baland, Pranab Mukhopadhyay, Mani Nepal, and Priya Shyamsundar for valuable feedback. D. N. Chakrovarty was most helpful in clarifying the issues relating to soil samples. I am grateful to the Assam Science Technology and Environmental Council for sharing maps and NBSS data. Special thanks are due to Monjit Barthakur for preparing the GIS map and to Dadul Chutia and Mrinal Baruah for excellent field support. I wish to record my appreciation of the logistical support provided by Anuradha Kafle and Krisha Shrestha of the SANDEE Secretariat.
South Asian Network for Development and Environmental Economics12
ReferencesAndrews, SS; Carroll, CR (2001) ‘Designing a soil quality assessment tool for sustainable agro ecosystem
management’. Ecological Applications 11(6): 1573-1585
Ashman, M; Puri, G (2002) Essential Soil Science: A Clear and Concise Introduction to Soil Science. Wiley Blackwell: Oxford
Bhalla, SS; Roy, P (1988) ‘Mis-specification in farm productivity analysis: the role of land quality’. Oxford Economic Papers 40 (1): 55-73
Caldwell, JS; Sukchan, S; Ogura, C (2002) ‘Challenges for farmer- researchers partnerships for sandy soil in North East Frontier of Thailand’. mimeo. Available at: www.fao.org/docrep/ [Accessed on 30th April, 2009]
De Datta, SK (1981) Principles and Production of Rice Production. New York: John Willy and Sons
Dent, D; Young, A (1981) Soil Survey and Land Evaluation. London: George Allen & Unwin
Dixit, A (2009) ‘Kosi embankment breach in Nepal: need for a paradigm shift in responding to flood’. Economic and Political Weekly 44 (6): 70-78
Doran, JW; Parkin, TB (1994) ‘Defining and assessing soil quality.’ In Doran, JW; Coleman, DC; Bezdicek, DF; Stewart, BA (eds.) Defining Soil Quality for Sustainable Development. Madison: Soil Sciences Society of America Special Publication No. 35, pp. 3-21
DRDA (2009) ‘RTI response from office of project director, District Rural Development Agency’. Dhemaji, Dated 12th August, 2009, under Right to Information Act, 2005, Government of India
D’Souza, R (2006) Drowned and Dammed--Colonial Capitalism and Flood Control in Eastern India. New Delhi: Oxford University Press
Ekbom, A; Sterner, T (2008) ‘Production function analysis of soil properties and soil conservation investments in tropical agriculture’. Discussion Paper Series 08-20, June, Environment for Development, Kenya
Goswami, DC (1998) ‘Fluvial regime and flood hydrology of the Brahmaputra River, Assam’. In Kale, VS (ed.) Flood Studies in India. Geological Society of India, Vol. 41, Bangalore, pp 53-76
Goswami, DC; Das, PJ (2003) ‘The Brahmaputra River’. Ecologist Asia Vol. 11 (1):9-14
Government of Assam (1996) Statistical Handbook of Assam Directorate of Economics and Statistics, Guwahati
Government of Assam (2008) Statistical Handbook of Assam. Directorate of Economics and Statistics, Guwahati
Government of Assam (2009) ‘Report on damage of flood released by the Dhemaji district administration for the year 2007-08; website of Dhemaji district administration, dhemaji.nic.in- extracted on 25/6/2009)
Government of Assam (2010) Statistical Handbook of Assam. Directorate of Economics and Statistics, Guwahati
Government of India (2010) Migration in India- 2007-08. Ministry of Statistics and Programme Implementation, June, New Delhi
ICAR (1980) Report of ICAR Research Review Committee for Assam Agriculture University, National Agriculture Research Project, Indian Council of Agriculture Research, New Delhi
Jaenicke, EC; Lengnick, LL (1999) ‘A soil quality index and institutional relationship to efficiency and productivity growth measure: two decompositions’. American Journal of Agriculture Economics 81(4): 881-893
Jamson, BK (2011) ‘Rice root growth function in rain-fed lowlands- implications for rice in uplands’. Drought Frontier Project, International Rice Research Institute, Manila, mimeo
Koundouri, P; Pashardes, P (2003) ‘Hedonic price analysis and selectivity bias’. Environmental and Resource Economics 26(1): 45-56
Kumar, KSK; Parikh, J (1998) ‘Climate change impacts on Indian agriculture: the Ricardian approach’. in A. Dinar et al. (eds.) Measuring the Impacts of Climate Change on Indian Agriculture. Washington, D.C.: World Bank, 140-184
Maddison, D; Manley, M; Kurukulasuria, P (2007) ‘The impact of climate change on African agriculture’. World Bank Policy Research Working Paper, No. 4306, World Bank, Washington, DC
Mandal, R (2010) ‘Cropping pattern and risks management in the flood plain of Assam’. Economic and Political Weekly 45 (33): 78-81

13
Farm Productivity Loss due to Flood-Induced Sand Deposition: A Study in Dhemaji, India
Mazumdar, D (1965) ‘Size of farm and productivity: a problem of Indian peasant agriculture’. Economica 32 (126): 161-173
Mendelshon, R; Nordhaus, WD; Daigee Shaw (1994) ‘The impact of global warming on agriculture: a Ricardian analysis’. The American Economic Review 84 (4): 753-771
Mendelsohn, R; Diner, A (2003) ‘Climate, Water and Agriculture.’ Land Economics 79 (3): 328-341
Mendelsohn, R; Dinar, A (2003) ‘Climate, water and agriculture’. Land Economics 79 (3): 328-341
Mishra, DK (2001) ‘Living with floods: people’s perspectives’. Economic and Political Weekly 36 (29): 2756-2761
Myaux, JA; Ali, M; Chakraborty, J; de Francisco, A (1997) ‘Flood control embankments contribute to the improvement of the health status of children in rural Bangladesh’. Bulletin of World Health Organization 75 (6): 533-539
Nair, KN; Ramakumar, R (2007) ‘Agrarian distress and rural livelihoods - a study in Upputhara Panchayat, Idukki District, Kerala’. Working Paper No. 392, Centre for Development Studies, Trivandrum
NBSS (1994) Soils of Assam for Land Use Planning. National Bureau of Soil Survey & Land Use Planning, Nagpur
NRMF (2006) ‘Study of siltation of rivers, its nature, extent and magnitude of problems and their remedial measures in upper catchment of Brahmaputra River in Assam’. Unpublished Report, National Resource Management Foundation, Guwahati
Reddy, VR (2003) ‘Land degradation in India: extent, costs and determinants’. Economic and Political Weekly 38 (44): 4700-4713
Sen, AK (1962) ‘An aspect of Indian agriculture’. The Economic Weekly 14 (4-6): 243-246
Umamaheswari, L; Hattab, KO; Nasurudeen, P; Selvaraj, P (2011) ‘Should shrimp Farmers pay Paddy Farmers? The Challenges of Examining Salinisation Externalities in South India.’ In Haque, AKM; Murthy, MN; Shyamsunder, P (eds) Environmental Valuation in South Asia. Delhi: Cambridge University Press.
VanLoon, GW; Patil, SG; Hugar, LB (2005) Agricultural Sustainability: Strategies for Assessment. New Delhi: Sage
Vincent, JR (2011) ‘Valuing the Environment as a Production Input.’ In Haque, AKM; Murthy, MN; Shyamsunder, P (eds) Environmental Valuation in South Asia. Delhi: Cambridge University Press
Weibe, H (2006) ‘River flooding and erosion in North East India: exploratory consideration of key issues’. mimeo, North West Hydraulic Consultants, Alberta, Canada

South Asian Network for Development and Environmental Economics14
Tables
Table 1: Summary Statistics of 1059 Households (15 villages) in Stage I (Primary Survey)
Villages HH Listed Total Agri. Land in the HH, in
hectare
Average Size of Possession in
hectare
% of Agri Land with Sand Deposition
HH Leasing Land for
Cultivation
OutMigration from
the HH
No 1. Tekjuli 42 38.73 0.92 44.6 9 0
Tingharia 71 171.30 2.41 54.5 19 16
Dhiri Chapori 80 234.72 2.92 94.7 15 6
Samarajan 71 82.64 1.16 95.4 20 17
Panitola 29 28.41 0.98 99.5 8 15
Garubandha 94 95.02 1.01 99.1 26 23
Nepalikhuti 20 34.40 1.72 100.0 3 5
Kechukhana 42 89.31 2.13 99.1 10 14
Ratua Bali 87 57.95 0.67 97.9 6 16
Dihingia 153 151.15 0.99 80.2 18 19
Maralchuk 42 59.08 1.41 69.5 3 5
Gohaingaon 73 125.78 1.72 58.2 10 28
Pehiyati 89 91.46 1.03 92.5 13 20
Bhakatgaon 83 98.66 1.19 97.9 11 17
Bahkathika 83 150.95 1.82 78.6 9 12
Average 100.63 1.42 84.1 12 14
Source: Primary Survey (2009-10)
Table 2: Average Monthly Household Income from Agriculture in Rupees (15 villages in Stage II -Sample Survey)
Villages Mean Max Min SD N
No 1. Tekjuli 907.5 2,187.5 400 655.4 10
Tingharia 598.1 , 187.5 687.8 10
Dhiri Chapori 59.4 375 0 120.1 10
Samarajan 153.8 337.5 0 119.6 10
Panitola 714.7 2,062.5 162.5 616.4 10
Garubandha 500 781.3 62.5 223.9 9
Nepalikhuti 17.9 125 0 47.2 7
Ratuabali 128.5 512.5 0 161.9 10
Kechukhana 338.1 606.3 0 185.9 10
Dihingia 150.6 375 0 141.6 10
Maralchuk 97.5 375 0 124.3 10
Gohaingaon 76.3 250 0 90.4 10
Pehiyati 97.4 468.8 0 165.2 12
Bhakatgaon 236.3 500 0 203.8 10
Bahkathika 490.7 875 62.5 281.9 10
All Villages 304.5 2,500 0 148
Source: Primary Survey (2010)

15
Farm Productivity Loss due to Flood-Induced Sand Deposition: A Study in Dhemaji, India
Table 3: Yield of Paddy per hectare (in kg) in Self-Owned Plots
Villages Mean Max Min SD N –plots
No 1. Tekjuli 741 1,498 41 452 16
Tingharia 722 1,486 0 510 16
Dhiri Chapori 130 2213 0 537 17
Samarajan 424 1,797 0 492 16
Panitola 1087 2,246 0 544 24
Garubandha 1027 2,582 0 842 17
Nepalikhuti 0 0 0 0 10
Ratuabali 120 743 0 229 18
Kechukhana 321 1,977 0 532 25
Dihingia 179 741 0 258 22
Maralchuk 148 741 0 219 17
Gohaingaon 89 738 0 188 20
Pehiyati 255 1,844 0 552 15
Bhakatgaon 365 2213 0 642 15
Bahkathika 507 1,485 0 475 22
All Villages 425 2,582 0 576 270
Source: Primary Survey (2010)
Table 4: Soil Characteristics of the Sampled Paddy Plot (N= 346 sampled plots)
Mean Max Min
Ph scale 5.7 7.6 0.25
Organic Carbon % 0.54 2.5 0
Sand in % 54.2 98.5 0
Silt in % 35.7 84.9 0.5
Clay in % 10.1 52.1 0.25
Source: Primary Survey (2010)
Table 5: Sand Magnitude (%) in the study Villages (N= 346 sampled plots)
Villages Sand Average in % Max Min N-plots
No 1. Tekjuli 66.8 89.0 9 22
Tingharia 46.7 86.5 4.5 18
Dhiri Chapori 74.7 98.9 25 23
Samarajan 57.5 88.5 2.5 25
Panitola 49.8 85 13.5 28
Garubandha 59.6 95.5 1.5 26
Nepalikhuti 81.4 91.9 50.5 12
Ratuabali 60.0 98.8 12 24
Kechukhana 67.6 95 12.5 31
Dihingia 54.6 93 6.5 27
Maralchuk 51.0 96.5 0 18
Gohaingaon 40.4 95 1 22
Pehiyati 62.7 90.5 5.5 21
Bhakatgaon 45.5 92 10 22
Bahkathika 4.7 46 0 25
Source: Primary Survey (2010)

South Asian Network for Development and Environmental Economics16
* Defined as days with temperature deviation more than 5°C above the normal.
Table 6: Summary Statistics of Variables Used in Regression (N=346)
Variables Mean Std. Dev. Min Max
Paddy Yield per Hectare 467 586 0 2995
Sand Proportion in Paddy Plots 54.2 29.9 0 98.5
Deviation of pH from Normal Range of 7 -1.25 0.82 -6.75 0.61
Distance of Paddy Plots from River in mt 816 624.5 0 2525.3
HYV Dummy 0.21 0.40 0 1
Plot Size in Hectare 0.67 0.53 0.13 4.12
Labour hour used 306.7 298.0 0 1708
Log of Paddy yield per Hectare 2.80 0.37 0 3.47
Log of Sand Proportion 1.66 0.36 0 1.99
Log of distance of paddy plots from river 2.75 0.45 0 3.40
Log of plot size in hectares -0.28 0.30 -0.87 0.61

17
Farm Productivity Loss due to Flood-Induced Sand Deposition: A Study in Dhemaji, India
Table 7: Regression Results of Determinants of Paddy Yield
Variables OLS Tobit
Model 1 Model 2 Model 3 Model 4 Model5 Model6 Model 7 Model 8
Paddyhectare
Paddyhectare
Paddyhectare
Paddy hectare_ln
Paddyhectare
Paddyhectare
Paddy hectare
Paddy hectare_ln
Sand Proportion in Paddy Plots
-2.64**(1.05)
-2.36** (0.95)
-1.94*(1.18)
-5.14***(1.71)
-6.39***(1.50)
-2.21(1.56)
Deviation of pH from Normal Range of 7
92.90** (37.41)
41.30(45.34)
1.19*** (0.20)
94.53*(57.65)
1.83*** (0.39)
Distance of Paddy Plots from River in mt
0.29*** (0.05)
0.28 ***(0.05)
0.54***(0.07)
0.38***(0.07)
HYV dummy use of hyv seeds
420.89***(67.60)
312.12***(76.02)
2.56***(0.36)
720.59***(93.64)
414.21***(92.18)
3.86***(0.48)
Plot Size in Hectare -152.87***(50.77)
-207.28***(75.70)
-296.83***(101.37)
-382.07***(137.98)
Log of labour hour used
45.99(83.42)
164.32(170.00)
Log of Sand Proportion
-0.092 (0.12)
-0.25(0.22)
Log of distance of paddy plots from river
0.69***(0.12)
1.70***(0.28)
Log of plot size in hectares
-0.20 (0.21)
-0.35(0.36)
Constant 609.85***(64.69)
257.28*** (94.43) 330.84
(205.63)*
-2.48***(0.85)
451.93***(105.23)
135.24(142.3) -131.63
(396.66)
-10.98***(1.93)
Sigma 907.67***(53.10))
744.45***(51.28)
644.27(45.72)
4.14***(0.20)
Observations 346 346346
346 346 346346
346
R-squared 0.02 0.290.21
0.35 0.00 0.040.02
0.10
Robust Standard Errors; *** p<0.01, ** p<0.05, * p<0.1R-squared for Tobit models (5-7) should be read as pseudo R-squared in Table 7. Figures in brackets are standard errors.
Table 8: Estimates of losses per hectare from increased sand intensity
Estimate Per hectare paddy production
(Sand average 15.7 % in paddy plots)
Per hectare paddy production
(Sand average 54.2 % in paddy plots)
Loss of paddy per hectare in kg
Loss per hectare in INR
Model I 680 588 92 690
Model II 428 182 246 1845
Model III. 2400# 467* 1933 14498
Note: Estimates I is based on OLS model 2 and II is based on Tobit model 6 (see Table 7 and Umamaheshawari (2011)). Estimate III is based on recall information revealed by farmers during field visit. # Recall based reports of yield in the late 1990s prior to land degradation, * actual yield recorded from the field survey.

South Asian Network for Development and Environmental Economics18
Figures
Figure 1: Map of Dhemaji

19
Farm Productivity Loss due to Flood-Induced Sand Deposition: A Study in Dhemaji, India
IRS-1D-LIII, 14 TH FEB,2002IRS-1D,L-III 14 February 2002
Figure 2: Sand deposited area of Dhemaji district (courtesy, ASTEC, Guwahati)
Figure 3: Sand deposited villages of Jiadhal Basin Area, Dhemaji district (courtesy, ASTEC, Guwahati)
IRS-1D,L-III14 FEB,05
IRS-1D,L-III 14 February 2005
Sand Deposited Villages of Jidhol River
South Asian Network for Development and Environmental Economics20
3
Figure 4: Trend of yield of Rice in Dhemaji district and State of Assam (1990-91 to 2009-10)
Figure 5: Sand as a determinant of paddy yield (all paddy plots)
010
0020
0030
00pa
ddyh
ecta
re
0 20 40 60 80 100sand
bandwidth = .8
Lowess smoother
3
Figure 4: Trend of yield of Rice in Dhemaji district and State of Assam (1990-91 to 2009-10)
Figure 5: Sand as a determinant of paddy yield (all paddy plots)
010
0020
0030
00pa
ddyh
ecta
re
0 20 40 60 80 100sand
bandwidth = .8
Lowess smoother
Figure 4: Trend of yield of Rice in Dhemaji district and State of Assam (1990-91 to 2009-10)
Figure 5: Sand as a determinant of paddy yield (all paddy plots)

21
Farm Productivity Loss due to Flood-Induced Sand Deposition: A Study in Dhemaji, India
4
Figure 6: Sand as a determinant of paddy yield (paddy plots using HYV seeds)
050
010
0015
0020
0025
00pa
ddyh
ecta
re
0 20 40 60 80 100sand
bandwidth = .8
Lowess smoother
Figure 6: Sand as a determinant of paddy yield (paddy plots using HYV seeds)

South Asian Network for Development and Environmental Economics225
Figure 7: Study area- land plots and embankment breaching points 2009
Figure 7: Study area-land plots and embankment breaching points 2009

23
Farm Productivity Loss due to Flood-Induced Sand Deposition: A Study in Dhemaji, India
Table A 2: Correlations Coefficients (only significant values reported) at 95% Confidence Level
Variables PaddyYield
Sand Silt OC Clay pH dev7 distriver HYV dummay
plotsize
Paddy yield per hectare 1.00
Sand proportion in paddy plots
-0.14 1.00
Silt proportion in paddy plots
-0.81 1.00
Organic carbon -0.48 0.54 1.00
Clay -0.81 1.00 0.54 1.00
Deviation of pH from Normal Range of 7
-0.26 -0.29 0.26 0.32 0.26 1.00
Distance of Paddy Plots from River in mt
0.40 0.26 1.00
HYV Dummy-use of HYV seeds
0.31 0.13 -0.15 -0.14 -0.15 0.12 1.00
Plot Size in hectare -0.19 -0.12 -0.14 1.00
Appendix Tables
Table A1: Nutrition Availability in Differently Textured Soil
Soil Type Number of Plots
NPK Tested Plot Average N kg/ha Average P kg/ha Average K kg/ha
Sandy 44 11 138.8 (Max 389.3; Min 19.9)
19.9 (Max 42.5; Min 6.4)
120.8 (Max 228.5; Min 53.8)
Loamy Sand 91 22 129.0 (Max- 415.9, Min-6.5
30.9 (Max- 61.6, Min-6.4)
132.6 (Max- 288.9; Min-67.2)
Sandy Loam 74 20 140.6 (Max 419.2; Min 13.3)
21.4 (Max 35.9; Min 6.4)
140.9 (Max 288.9; Min 65.9)
Loam 19 9 155.3 (Max 519.9; Min 6.7
35.6 (Max 53.9; Min 24.3)
140.4 (Max 241.9; Min 67.2)
Silt Loam 73 19 216.6 (Max 469.2; Min 33.4)
30.7 (Max 61.6; Min 13.5)
169.9 (Max 295.7; Min 67.2)
Clay Loam 6 0 - - -
Silty Clay Loam 18 0 - - -
Silt 2 0 - - -
Silty Clay 19 0 - - -
Total 346 81 - - -

South Asian Network for Development and Environmental Economics24
1 Possession of Agriculture land, in bigha (1 hectare= 7.5 bigha approx.)
2 Agriculture land affected by flood, in bigha
3 Agriculture land affected by sand deposition, in bigha
4a Agriculture land leased in for cultivation, in bigha
4b Terms and conditions of leasing in
4c Quality of leased in land- sandy-1, flood prone-2,both-3
4d Leased in, within the village-1, Outside the village-2
5a Agriculture land leased out, in bigha
5b Quality of leased in land- sandy-1, flood prone-2,both-3
6a Land purchased in recent times, in bigha
6b Purpose of purchase of land
6c Buying price of land per bigha
6d Land bought within the village- 1, Outside the village-2
6e Quality of bought land- sandy-1, flood prone-2,both-3
7a Agriculture land sold, in bigha
7b Sell price of land per bigha
7c Quality of land sold- sandy-1, flood prone-2,both-3
8a Mortgage in land, if yes, quantity in bigha and price paid
8b Mortgage out land, if yes quantity in bigha and price got
9a Total land under paddy- own and leased in, in bigha
9b Total production of paddy
10 Agriculture land converted for other use/mention types
11a HH members migrated out for job, if yes, where
11b Type of job presently engaged
Annexure-I: Household Survey Schedule for Listing (stage- I)
SANDEE sponsored study on
Valuing Damages of Flood Induced Sand Deposition in Dhemaji, India
Village: Block:
Head of the household:

25
Farm Productivity Loss due to Flood-Induced Sand Deposition: A Study in Dhemaji, India
Annexure-II: Household Schedule for Detailed Survey SANDEE sponsored study on
Valuing Damages of Flood Induced Sand Deposition in Dhemaji, India
Information on the VillageName of the Respondent: 2. Village: 3. Block
A. Information on the Household
S. No
Relation with head of the HH
Sex Age Educational Attainment level#
Occupation and Income
Primary*(engaged during larger part of the year)
Place of work$
Commute@ Income per month^^
Secondary* Place of work $
Income per month ^^
1 Head
2
3
4
5
6
# Illiterate- 1, literate- 2, completed primary-3, completed middle school-4, completed high school-5, completed higher secondary-6, technical and profession diploma- 7 (specify), general graduate-8, technical graduate-9, medical graduate- 10, law graduate- 11, management graduate- 12, post-graduate and above-13, others (specify) -99
* Cultivation - 1, agriculture labour-2, livestock rearing-3, poultry- 4, fishing- 5, forestry/logging- 6, mining (sand etc)-7, manufacturing agriculture based-8, manufacturing non-agriculture based-9, construction work, road/buildings- 10, trade/shop/restaurants etc.- 11, transport, communication etc-12, finance, insurances and business services -13, community and social services-(clerical and managerial jobs in administration, jobs in education and health sector; community development, security services)-14 personal services (laundry, tailoring, hair cutting etc. specify)-15, student- 16, unemployed- 17, too old/too young to work- 18, rentiers, pensioners, remittances etc- 19, others- specify -99. Note- specify each type of job along with the code
$ Within the village-1, outside the village but within the block -2, outside the block but within the district-3, outside the district but within the state-4, outside the state- 5
Note- capture and name of the place of work outside the block@ Commute from home-1, stay outside- 2^^ Calculate gross yearly income for agriculture; other incomes are in month

South Asian Network for Development and Environmental Economics26
B. L
and,
Pro
duct
ion
and
Retu
rn fr
om A
gric
ultu
re C
omm
oditi
es
Land
hol
ding
and
exp
endi
ture
in a
gric
ultu
re o
pera
tions
:
Ow
ned
land
(in
bigh
a, 3
big
ha =
one
acr
e)__
____
_; L
ease
d ou
t lan
d___
____
__; M
ortg
aged
land
___
____
__; L
and
sold
in la
st th
ree
year
s __
____
___;
Lea
sed
in la
nd
____
___
Type
of
poss
essi
on
(exc
lude
le
ased
out
and
m
ortg
aged
pl
ots)
Area
in
Bigh
a C
rop
culti
vate
d-se
ason
1-
sum
mer
Crop
cu
ltiva
ted
Seas
on
2-w
inte
r
Net
Irr
igat
edAr
ea in
bi
gha
Tilli
ng
met
hods
: pl
ough
-1/
trac
tor-2
, bo
th-3
Dies
el
used
in
tillin
g an
d irr
igat
ion-
in li
ters
Fert
ilise
r use
d in
kg
in
each
sea
son
Hire
d la
bour
us
ed in
nu
mbe
rs
Cost
on
la
bour
Appr
ox S
and
Dept
h,
perc
eive
d by
th
e fa
rmer
(in
inch
es)
Prod
uctio
n in
Qui
ntal
Pr
ocur
emen
t of p
addy
fr
om m
arke
t in
case
hom
e pr
oduc
tions
do
not s
uffice
(in
quin
tal)
Seas
on 1
Seas
on 2
Seas
on 1
Seas
on 2
Ow
n La
nd-
Plot
s
Hom
est
ead
Plot
1
Plot
2
Plot
3
Plot
4
Tota
l
Leas
ed
in
Plot
1
Plot
2
Plot
3
Tota
l

27
Farm Productivity Loss due to Flood-Induced Sand Deposition: A Study in Dhemaji, India
B. L
and,
Pro
duct
ion
and
Retu
rn fr
om A
gric
ultu
re C
omm
oditi
es
Land
hol
ding
and
exp
endi
ture
in a
gric
ultu
re o
pera
tions
:
Ow
ned
land
(in
bigh
a, 3
big
ha =
one
acr
e)__
____
_; L
ease
d ou
t lan
d___
____
__; M
ortg
aged
land
___
____
__; L
and
sold
in la
st th
ree
year
s __
____
___;
Lea
sed
in la
nd
____
___
Type
of
poss
essi
on
(exc
lude
le
ased
out
and
m
ortg
aged
pl
ots)
Area
in
Bigh
a C
rop
culti
vate
d-se
ason
1-
sum
mer
Crop
cu
ltiva
ted
Seas
on
2-w
inte
r
Net
Irr
igat
edAr
ea in
bi
gha
Tilli
ng
met
hods
: pl
ough
-1/
trac
tor-2
, bo
th-3
Dies
el
used
in
tillin
g an
d irr
igat
ion-
in li
ters
Fert
ilise
r use
d in
kg
in
each
sea
son
Hire
d la
bour
us
ed in
nu
mbe
rs
Cost
on
la
bour
Appr
ox S
and
Dept
h,
perc
eive
d by
th
e fa
rmer
(in
inch
es)
Prod
uctio
n in
Qui
ntal
Pr
ocur
emen
t of p
addy
fr
om m
arke
t in
case
hom
e pr
oduc
tions
do
not s
uffice
(in
quin
tal)
Seas
on 1
Seas
on 2
Seas
on 1
Seas
on 2
Ow
n La
nd-
Plot
s
Hom
est
ead
Plot
1
Plot
2
Plot
3
Plot
4
Tota
l
Leas
ed
in
Plot
1
Plot
2
Plot
3
Tota
l
B. L
and,
Pro
duct
ion
and
Retu
rn fr
om A
gric
ultu
re C
omm
oditi
es (c
ontin
ued)
Type
of p
osse
ssio
nCo
st o
f Irr
igat
ion-
die
sel,
pum
p se
t hi
ring
etc
in R
s.
Cost
of h
iring
pow
er
tille
r in
Rs.
Cost
on
Fert
ilize
rs
in R
s.
Cost
of H
YV S
eeds
in
Rs.
C
ost o
f oth
er s
eeds
in
Rs.
O
ther
cos
ts in
any
in R
s.
Ow
n La
nd-P
lots
H
ome
stea
d
Plot
1
Plot
2
Plot
3
Plot
4
Tota
l
Leas
ed in
Pl
ot 1
Plot
2
Plot
3
Tota
l

South Asian Network for Development and Environmental Economics28
Mea
sure
take
n fo
r lan
d im
prov
emen
t and
exp
endi
ture
incu
rred
Type
of p
osse
ssio
nM
easu
res
for
prot
ectio
n;
emba
nkm
ent e
tc
Mea
sure
s fo
r rem
oval
of
sand
y la
yers
M
easu
res
for
irrig
atio
n U
se o
f mor
e do
ses
of fe
rtili
zers
Co
nver
sion
of l
and
for a
ltern
ativ
e us
e/
fishe
ry, n
on-fa
rm u
se,
plan
tatio
n et
c
Oth
er m
easu
res
(spe
cify
)To
tal l
abou
r in
volv
ed in
land
im
prov
emen
t m
easu
res
Tota
l exp
endi
ture
in
curr
ed
Yes-
1,N
o-2
Exp.
In
Rs.
Yes-
1,N
o-2
Exp.
In R
s.
Yes-
1,N
o-2
Exp.
In
Rs.
Yes-
1,N
o-2
Exp.
In
Rs.
Yes-
1,N
o-2
Exp.
In R
s.
Yes-
1,N
o-2
Exp.
In R
s.
0wn
Hire
d
Ow
n La
nd-
Plot
s H
ome
stea
d
Plot
1
Plot
2
Plot
3
Plot
4
Tota
l
Leas
ed in
Pl
ot 1
Plot
2
Plot
3
Tota
l
29
Farm Productivity Loss due to Flood-Induced Sand Deposition: A Study in Dhemaji, India
D.
Mob
ilisa
tion
of C
redi
t
Loan
Am
ount
of l
oan
take
n in
Rs.
Pu
rpos
e of
loan
#So
urce
W
hen
the
loan
was
ta
ken
Term
s of
the
loan
Inte
rest
rate
per
mon
th/
year
Amou
nt re
paid
Bala
nce
1 2 * So
urce
s- B
anks
, Coo
p so
ciet
y, M
oney
lend
ers,
Frie
nds
and
Rela
tives
#
Land
con
serv
atio
n- 1
, inv
estm
ent i
n ag
ricul
ture
inpu
ts-2
, cle
arin
g on
san
d de
posi
tion-
3, h
ouse
hold
con
sum
er n
eeds
-4, m
edic
al tr
eatm
ents
nee
d- 5
, edu
catio
nal n
eeds
-5, o
ther
s (s
peci
fy) 9
E. M
igra
tion
and
Rem
ittan
ces
HH
mem
bers
- mig
rate
d ou
tCo
de (f
rom
HH
ta
ble)
Reas
ons
for d
ecis
ion
on m
igra
tion
(rec
ord
mul
tiple
resp
onse
s) *
Ti
me
sinc
e ou
t mig
rate
d Pl
ace
of w
ork
–spe
cify
M
onth
ly e
arni
ng in
Rs.
Re
mitt
ance
in a
mon
th, i
n Rs
.
1 2 3 * Re
turn
from
agr
icul
ture
doe
s no
t suffi
ce -1
, low
/ins
uffici
ent r
etur
ns fr
om n
on-a
gric
ultu
re jo
bs a
vaila
ble
loca
lly-2
, lac
k of
fina
ncia
l res
ourc
es to
inve
st in
sel
f-em
ploy
men
t ini
tiativ
es-3
, int
eres
ted
in s
ervi
ce s
ecto
r job
s - 4
, in
tere
sted
in jo
bs in
urb
an a
reas
- 5,
othe
rs (s
peci
fy)-
9

South Asian Network for Development and Environmental Economics30
F. H
H a
vaili
ng b
enefi
ts u
nder
flag
ship
pro
gram
mes
of g
over
nmen
t
Sche
mes
Spec
ify th
e ty
pes
of b
enefi
ts
Estim
ated
mon
etar
y ga
in/r
etur
n fr
om th
e co
ntin
uing
act
iviti
es in
dur
ing
the
last
yea
r; fo
r one
tim
e gr
ant r
ecor
d th
e on
e tim
e be
nefit
s re
ceiv
ed
Empl
oym
ent g
uara
ntee
sch
eme-
NRE
GA
Hou
sing
- IAY
Tota
l San
itatio
n Ca
mpa
ign
Hea
lth- N
RHM
Child
dev
elop
men
t Ser
vice
s- IC
DS
Sarv
a Si
ksha
- Uni
vers
al E
duca
tiona
l Pro
gram
me
Mid
Day
Mea
l Sch
eme
for S
choo
l Chi
ldre
n
Soci
al A
ssis
tanc
e Pr
ogra
mm
e- O
ld a
ge p
ensi
ons,
sub
sidi
zed
ratio
ns e
tc.
Rura
l ele
ctric
ity
Floo
d da
mag
e re
late
d as
sist
ance
Oth
ers
(spe
cify
)

31
Farm Productivity Loss due to Flood-Induced Sand Deposition: A Study in Dhemaji, India

SANDEEP.O. Box 8975, E.P.C 1056, Lalitpur, Nepal
Street address: c/o ICIMOD, Khumaltar, Lalitpur, Nepal
Tel: 977 1 5003222, Fax: 977 1 5003299, Email: [email protected] Web: www.sandeeonline.org
SANDEE Sponsors