Which households use consumer credit in Europe
27
Questioni di Economia e Finanza (Occasional Papers) Which households use consumer credit in Europe? by Silvia Magri, Raffaella Pico and Cristiana Rampazzi Number 100 July 2011
-
Upload
independent -
Category
Documents
-
view
2 -
download
0
Transcript of Which households use consumer credit in Europe

Questioni di Economia e Finanza(Occasional Papers)
Which households use consumer credit in Europe?
by Silvia Magri, Raffaella Pico and Cristiana Rampazzi
Num
ber 100Ju
ly 2
011


Questioni di Economia e Finanza(Occasional papers)
Number 100 – July 2011
Which households use consumer credit in Europe?
by Silvia Magri, Raffaella Pico and Cristiana Rampazzi

The series Occasional Papers presents studies and documents on issues pertaining to the
institutional tasks of the Bank of Italy and the Eurosystem. The Occasional Papers appear alongside
the Working Papers series which are specifically aimed at providing original contributions to economic
research.
The Occasional Papers include studies conducted within the Bank of Italy, sometimes in
cooperation with the Eurosystem or other institutions. The views expressed in the studies are those of the
authors and do not involve the responsibility of the institutions to which they belong.
The series is available online at www.bancaditalia.it.

WHICH HOUSEHOLDS USE CONSUMER CREDIT IN EUROPE?
by Silvia Magri*, Raffaella Pico* and Cristiana Rampazzi *
Abstract
Which households use consumer credit? This paper addresses the question using harmonized data from Eurostat’s EU-SILC survey for nine European countries in the period 2005-08. There is wide heterogeneity in participation in the consumer credit market, ranging from 15 to 46 per cent across countries. Most households relying on consumer credit are those whose head is young and well educated; they are large in size, revealing more pronounced consumption needs. According to life cycle theory, they use credit to increase their welfare by consumption smoothing. Moreover, they frequently have a current medium-high income as lenders prefer to grant loans to less risky borrowers. Nonetheless, a not negligible portion of those using credit, ranging between 8 and 16 per cent across countries, are poor. Consumer credit can also help in improving their welfare. However, poor households are more frequently delinquent. In 2008, between 2 and 11 per cent of all borrowers were in arrears; the same percentage among the poor is much higher, ranging from 7 to 25 per cent.
JEL Classification: D12, D91. Keywords: consumer credit, repayment arrears, consumption smoothing.
Contents 1. Introduction ..........................................................................................................................5 2. Which households are more likely to rely on consumer credit? ..........................................7 3. The frequency of delinquencies in repaying consumer credit ……………………… ......10 4. Concluding remarks ………………………. .....................................................................13 References……………………………...................................................................................16 Tables and figures…………………………….......................................................................18
* Bank of Italy, Structural Economic Analysis Department, Financial Structure and Intermediaries Division, Via Nazionale 91, 00184 Rome, Italy.


5
1. Introduction1
Which households make most frequent use of consumer credit? We aim at answering
this question by studying selected European countries. According to life cycle theory, people
rely on consumer credit in order to smooth consumption over their life, mainly when they are
young, have expectations of improving their future income due to a good level of education
and have large expenditure needs for durable goods connected with household formation
(Deaton, 1992; Attanasio, 1999; Bertola, Disney and Grant, 2006). Essentially we want to
verify whether data referring to the main European countries speak accordingly.
Loans for house purchases make up the largest share of households’ debt from banks
and financial companies, around two thirds at the euro area level and in the UK (Figure 1).
The empirical literature has therefore dealt mainly with mortgage debt. One of the main
findings, based on national sample surveys, is that most of the mortgages are granted to high-
income households (European Central Bank, 2009). Consumer credit has received much less
attention despite its considerable expansion in recent years in some European countries,
namely Italy and Spain. At the end of 2010 the share of consumer credit on disposable
income is similar in the main euro area countries, around 11 per cent (Figure 2). Consumer
credit accounts for a bit less than 15 per cent of household debt.2
Empirical studies on household data analyzing the participation and distribution of
consumer credit among different categories of households have focused mainly on the United
Kingdom and the United States, where this type of loan is most widespread. For the United
Kingdom, data for the early part of the last decade (British Household Panel Survey, 2000)
show that consumer credit was used mainly by households whose head is young, as predicted
by life cycle theory; moreover, the surge in consumer credit amount was widely distributed
and not concentrated in specific groups that can be considered riskier, such as low-income
households (Del Rio and Young, 2006). However, data based on the 2003 NMG survey3
show an increase in the share of unsecured debt accounted for by those who consider it a
heavy burden (Tudela and Young, 2003). Furthermore, NMG surveys referring to the second
half of the last decade show that the percentage of those who consider a burden (somewhat or
1 The views expressed in this article are those of the authors and do not necessarily reflect those of the Bank of Italy. We would like to thank Giorgio Gobbi and Roberto Rinaldi for their useful comments. 2 Other types of household loans are overdrafts (in some euro area countries), leasing, factoring and mortgages with purposes different from house purchases. 3 This is a household survey that has been carried out every year since 2003 by the NMG Research on behalf of the Bank of England.

6
heavy) the loan repayment of unsecured debt has been increasing over time (Bank of
England, 2010). In France, recent annual surveys, run by an observatory on loans to
households, whose results are published on the French Banking Association website
(Observatoire des crédits aux ménages, 2008 and 2009), illustrate the emergence of a group
of households that rely on consumer credit and overdrafts partly to meet ordinary living
expenses because their current income falls short. Recent developments among the older age-
groups, who exhibit an increase use of consumer credit, mainly fit this pattern: for these
households the amount of loans can easily exceed repayment capacity.
As for Italy, an analysis published in the Osservatorio sul credito al dettaglio (2009a)
by Assofin, Crif and Prometeia4, based on a survey of more than 1,000 households, concludes
that Italian borrowers take out consumer credit for reasons such as to purchase essential
goods, pay medical bills or face contingencies like accidents and repairs. The use of
consumer credit appears to be correlated mainly with the size of the household and with the
number of income recipients. The service of debt seldom overcomes the 30 per cent of
income; roughly 90 per cent of households using consumer credit expect that their future
income will be stable or increase. Overall, the evidence is that life cycle explanations are at
work in explaining the participation to consumer credit market. Different findings are drawn
by Cavalletti, Lagazio and Vandone (2008). Using the wave for the year 2004 of the Survey
on Household Income and Wealth, run every two years by the Bank of Italy on a sample of
roughly 8,000 households, they show that the traditional determinants of the permanent
income hypothesis appear to explain only to some extent the participation to consumer credit
market; education is not significant at all. The authors conclude that the probability of
consumer credit is relatively uncorrelated with life cycle explanations and more sensitive to
factors such as households’ negative financial situations and economic conditions.
Most of the empirical studies on this subject are limited to a single country; when the
study covers more than one country, data are not easily comparable. The contribution of our
paper is that we rely on the harmonized data of Eurostat’s EU-SILC survey (EU Statistics on
Income and Living Conditions; Clemenceau and Museux, 2007) to carry out a comparative
analysis of the participation in the consumer credit market in selected European countries.5 In
4 Assofin is the Association that represents the most qualified banks and financial companies specialized in consumer lending and mortgage credit. Crif is a company specialized on credit and business information, offering to financial intermediaries and firms a qualified service for risk management. Prometeia is a group for consulting and research in economics and finance. 5 Gomez-Salvador, Lojschova and Westermann (2011) use the same data for a more general analysis of household borrowing in the euro area.

7
Section 2, using these data, we identify which households rely more frequently on consumer
credit in order to verify whether they are consistent with those suggested by life cycle theory.
We also explore the frequency of arrears on consumer credit repayment which are an
indicator of borrower risk. A recent European Commission study (2008) bases the definition
of over-indebted household specifically on the ability to meet repayment commitments. In
Section 3 we therefore look at the frequency of households that are behind on their consumer
credit repayment in the European countries studied, calculated on the basis of the EU-SILC
survey. These data, not extensively analyzed up to now, provide an indication of the
difficulties that households face in repaying consumer credit and therefore of the risk of this
market.
We discuss the whole evidence in the final session of the paper.
2. Which households are more likely to rely on consumer credit?
The EU-SILC survey, coordinated by Eurostat, allows us to compare household
participation in the consumer credit market in the main European countries. The survey
indirectly identifies households with consumer credit by asking them whether they are behind
in repaying a loan of this type or by assessing the burden of loan repayment. Those without
consumer credit do not answer these questions.6
Table 1 reports data on the nine European countries for which households that
borrowed in this form can be identified with sufficient accuracy. Roughly 100,000
households are considered; data are from the 2008 survey.7 We generally comment only
changes over time or differences across countries that are statistically significant. The lowest
frequencies of households using consumer credit are in Italy and in the Netherlands (15 per
cent). In Portugal and Germany the shares are slightly higher, around 20 per cent, while in
Spain and France are respectively 27 and 35 per cent. In Finland, Ireland and the United
Kingdom just under half of all households rely on consumer credit (Table 1, first row).8 For
most of these countries the participation in the consumer credit market has not changed
substantially compared with 2005, though there are some exceptions: a sharp increase in
6 For more details on the way we calculate the percentages of households with consumer credit in the different European countries see note 1 in the Methodological notes. 7 For France, the figures for 2008 are not available; we use the figures for the year 2007. 8 For more details on the comparison between aggregate and survey data on consumer credit see note 2 in the Methodological notes.

8
Finland and smaller, but statistically significant, decreases in Ireland and the UK (Figure 3,
left panel).9
The evidence about households that most frequently rely on consumer credit is more
homogenous across the different countries. First, participation is not limited to households
with the youngest heads. In fact, it is quite similar for the first three age-groups (<35, 35-44,
45-54); the frequency decreases markedly only when the head of household is over 65.
Secondly, the use of consumer credit is greater among well-educated households (head of
household is a high-school or university graduate), who are more likely to have rising income
expectations. Third, the frequency of consumer credit is higher among larger households.
Finally, the participation in the consumer credit market generally increases with current
equivalent income10; however, in most countries it is fairly even across the top two income
quartiles. The percentage of households with consumer credit is undeniably much smaller in
the lowest income quartile, where nonetheless it still ranges between 12 (Italy) and 34 per
cent (UK).
These findings are broadly confirmed in a multivariate analysis. In Table 2 results
from probit estimations are reported. Models 1 and 2 show the evidence for a specification
that contains all household characteristics considered in Table 1, but the variable referring to
the type of contract for employees, which is considered in models 3 and 4.11 Model 1 (3) is
for an estimation that includes observations for the whole period (2005-2008), while model 2
(4) for an estimation only for the year 2008 for a more direct comparison with descriptive
statistics in Table 1. Specifically in model 2 for the year 2008, the coefficients of the
dummies for the age of the household head are decreasing with age; the percentage of
households with consumer credit for the youngest class (<35) is more than 3 percentage
points higher than that for the age class 45-54. Therefore controlling for other characteristics,
households with the youngest head are the ones with the highest participation to consumer
credit market as suggested by life cycle theory. The coefficient of the dummies for higher
education (high school) is positive and significant; when the head is more educated the
probability of consumer loans is 2 percentage points higher compared with that of households
9 EU-SILC data are available since 2004. However, we start our analysis from 2005 because for the year 2004 data are available only for a subgroup of countries. 10 See note 3 in the Methodological notes for the definition of equivalent income. 11 Estimations in models 3 and 4 with the type of contract for employees are based on slightly fewer observations due to some missing values on the type of contract.

9
with low-educated head.12 The multivariate analysis also confirms that the probability of
consumer credit increases with household size and with income.13
This evidence shows that the most important household characteristics in determining
the participation in the consumer credit market are age and education of the head and
household size, which matter in the decision to anticipate future expected income through
credit to smooth consumption. Life cycle theory seems therefore at work. Income is also
important because of supply reasons, i.e. due to lenders’ preferences to grant loans to less
risky borrowers.
Estimation’s results confirm other evidence from descriptive statistics in Table 1. The
frequency of use of consumer credit is higher among households living in rented homes, for
single-parents and for those that have great difficulties in making ends meet.14 Consumer
credit is also fairly widespread among households whose head has a fixed-term contract:
ceteris paribus, they have the same probability of consumer credit than households whose
head has a permanent contract (models 3 and 4 in Table 2).15
This scattered evidence could be interpreted by arguing that consumer credit is also
used by people that face difficulties in living only with their current income: they might use
credit in order to face pressing needs of daily life. These motivations could be entirely
consistent with a life cycle explanation, based on the idea of isolating consumption from
current income variability, as long as these households have solid expectations of improving
income in their future. In order to obtain a synthetic measure of households that rely on
consumer credit to cope with a very low level of income, we focus on those that can be
defined as poor on the basis of their income. According to the European Commission’s
definition these are households with an equivalent income below 60 per cent of the national
median income. Poor-income households account for a not negligible share of total
households with consumer credit: close to 15 per cent in Italy, the Netherlands, Spain, and the
United Kingdom, 12-13 per cent in Finland, Germany, Ireland and Portugal, and 8 per cent in
12 In Table 2, in the estimation of model 5 we include the dummy income poor and we exclude income quartiles, a variable that is correlated with college education. In this specification education is more powerful. The dummy for college education (university) is also significant; the effect is such that among educated people (high school or university) the frequency of consumer credit is 2-3 percentage points higher than among low-educated households. Education is more important in some European countries than in others. 13 In these estimations, the reference group is head older than 65, with middle school or less, and household income in the low income quartile. 14 These are the reference categories in the estimations reported in Table 2 and the dummies for all the other categories (tenure of house, household type and for making ends meet), when significant, have negative coefficients, signaling a lower probability of consumer credit.

10
France (Table 1 third row).16 The percentage of poor households among those that use
consumer credit held more or less steady in the countries under review between 2005 and
2008.17
The frequency of consumer credit among poor-income households is actually lower
than in the whole sample by around one third: 20 per cent compared with 28 per cent (Figure
3). In Finland, Ireland and the United Kingdom, about one third of the households defined as
poor rely on consumer credit; in Germany, Italy and Portugal the portion is much lower, less
than 15 per cent, while the other countries are in the middle. When controlling for other
household characteristics, in the estimation reported in model 5 of Table 2, the evidence is
confirmed: the probability that a poor-income household has consumer credit is 7 percentage
points lower than for households that are not poor (by around one third of the average
estimated probability to have consumer credit in the whole sample, equal to 23 per cent).18
In summary, this section shows that the households that are most likely to rely on
consumer credit are those whose head is young and with a good level of education, which
may be a sign of rising income expectations; they are large in size. These are households that,
according to life cycle model, we should find using consumer credit to increase their welfare
through consumption smoothing. They are also more frequently in the medium-high income
brackets. Nonetheless, poor-income households make up a not negligible portion of those that
use consumer credit, between 8 and 16 per cent across the European countries analyzed. This
group of poor households also try to improve their welfare with credit given the very low
level of current resources. However, their future income expectations could be frequently too
optimistic. As a consequence, they might often find themselves subsequently unable to repay
their loans. This is the topic of the next section.
3. The frequency of delinquencies in repaying consumer credit
In this section we examine the frequency of households who are delinquent in
repaying consumer credit, an indicator of household financial distress, and, from lenders’
15 We also run unreported estimations for each country and the main results generally hold. 16 As a way of comparison, the share of poor among households with mortgages is roughly 8 per cent across the countries analyzed, compared to an average of 13 per cent for consumer credit. 17 The only statistically significant change was in Ireland, where it declined in the context of an overall decrease in the frequency of use for the total sample of households. 18 The coefficient of the dummy poor does not change over the different years under analysis.

11
perspective, of borrower risk. The EU-SILC survey allows us to calculate the percentage of
households that have been in arrears in the previous twelve months. The survey question does
not quantify the length of the delay.19 This means that even households that are less than 90
days late – the traditional threshold used by financial intermediaries in reporting delinquency
– give a positive answer to the question on the arrears.
The percentage of households that are delinquent on consumer credit varies
considerably from country to country. It is the lowest in the United Kingdom (2.3 per cent)
and the highest in Italy (10.5 per cent; Table 3, first row).20 In the other countries covered in
this study, it ranges from 5 to 8 per cent. In many countries this proportion was quite stable
between 2005 and 2008; in Germany, Italy and the UK it declined (Figure 4, left panel).
Problems in repaying consumer credit are decreasing with income: they are often
much more common for households in the lowest income quartile or whose income is under
the median value (Table 3). These results are confirmed in the multivariate analysis
performed in Table 4, where the estimations have the same specifications as those reported in
Table 2. 21
Nearly half of households in arrears are classified as income poor in the United
Kingdom, less than 20 per cent in France, and a percentage between 23 and 36 per cent in the
rest of the countries surveyed (Table 3, third row). These percentages are higher than those
observed in Table 1, referring to the frequency of use of consumer credit: poor-income
people are over-represented in the sample of delinquent households.22 This happens because
poor-income households are more than twice more likely to be delinquent than the whole
sample of households with consumer credit: 14 per cent compared with 6 per cent
considering all countries pooled together (Figure 4). The percentage of household in arrears
among those that are poor and rely on consumer credit ranges between 7 per cent in the
United Kingdom and 25 per cent in Germany (Table 3, second row).
In the estimation reported in model 5 of Table 4 the evidence is that, after controlling
for other relevant household characteristics and excluding income, the probability that a poor-
19 The respondent is simply asked whether the household has been behind in the repayment of consumer credit in the twelve months preceding the interview. 20 Italy is the country where households are most likely to be delinquent on consumer credit; when only payments more than 90 days overdue are considered the share of arrears in Italy decreases to 4.1 per cent. See note 4 in the Methodological notes for details. 21 We also run unreported estimations for each country and the main results generally hold. 22 As for trend, the proportion of delinquent households classified as poor is generally unchanged between 2005

12
income household is delinquent is roughly 2 percentage points higher than that for
households who are not poor, more than half of the estimated probability of delinquencies
referring to the whole sample (3.8 per cent).23 Therefore, even after controlling for other
relevant household characteristics, the increase in the frequency of arrears for poor-income
households, though reduced in magnitude, is still remarkable. Poor households that take out
consumer credit are hence particularly vulnerable to external shocks, such as an unexpected
decline in their low current income or an unexpected increase in their expenditures. These
shocks often make them unable to meet repayment deadlines.
There are other households features that are positively correlated with delinquencies.
Descriptive statistics show and multivariate analyses confirm that repayment arrears are more
common among households whose head is younger or less educated (Tables 3 and 4).
Tenants get behind considerably more frequently than homeowners. Another important
reason of delinquencies is the loss of the household head’s job: the share of households in
arrears is especially high among the unemployed. Unsurprisingly, among the employees,
income uncertainty results in less frequent arrears rates among the households whose head
has a permanent contract versus a fixed-term contract (Table 4, models 3 and 4).
In summary, a fraction of households using consumer credit later run into at least
temporary repayment difficulties. There is wide heterogeneity in the delinquency rates on
consumer credit, ranging across countries from 2 to 11 per cent; these shares are higher
compared to those reported on mortgages.24 The frequencies of delinquencies are much higher
among the income poor, between 7 and 25 per cent; even after controlling for other
household characteristics income poor are much more likely to be delinquent. This evidence
supports the idea that there is a group of very low income households that rely on consumer
credit while having overly optimistic income expectation for the future.
and 2008, though it rose significantly in the United Kingdom and fell sharply in Ireland. 23 The estimated probability of being delinquent, calculated at the mean value of regressors, is equal to 3.8 per cent, lower than the observed frequency of delinquencies in the whole sample, around 6 per cent. 24 On the basis of the EU-SILC data for the period 2005-2008, arrears frequencies on consumer credit are between 1.3 and 2.4 times as high as those on mortgages in many countries, about 3 times as high in Finland, and sharply higher in Germany (5 times) and in the Netherlands (7 times).

13
4. Concluding remarks
Consistently with economic theory, most households in the European countries
analyzed rely on consumer credit in order to exploit in the present economic resources that
they expect to obtain in the future. They have a young head, with a good level of education
and are quite large in size. Consumer credit thus enhances the economic welfare of these
households, who would otherwise be constrained to defer the purchase of some goods and
services.
Most of these households have medium-high level of current income, probably
because lenders prefer to grant loans to less risky households. Nonetheless, a portion of
households using consumer credit – ranging from 8 to 16 per cent across the countries
analyzed – are poor on the basis of their income. Many of them are also classified as fixed-
term or part-time workers, unemployed, old people or single parents, groups that have much
higher-than-average poverty rates. These shares are not negligible after taking into accounts
that, across the countries analyzed, the percentage of poor-income households on the whole
population is around or below 20 per cent. Compared to the whole population there is
therefore under-representation of poor in the group of households with consumer credit
because they are risky borrowers for lenders, though this under-representation is not too
large.
Poor households take out consumer credit in order to cover pressing needs of daily
life, possibly not taking into a full account the high cost of these loans and the incidence on
their low income of servicing debt (Lusardi, 2011).25 For these households, this kind of
borrowing could be sometime a sign of their financial vulnerability and specifically of their
lack of saving or other financial assets that could be sold to cover unexpected expenses
(Brandolini, Magri and Smeeding, 2010; Lusardi, Schneider and Tufano 2011). Even these
households are trying to improve their welfare using credit to attempt to cope with severe
current income difficulties, while expecting an improvement of their income conditions in the
25 Lusardi (2011) shows that many households in the US do not seem informed about the terms of borrowing; shopping for credit cards and auto loans is particularly infrequent among low-income households. As for Italy, from the Survey of Household Income and Wealth, we know that in 2008 only about a bit more than one third of households choose the lender offering consumer credit, hence the credit contract, on the basis of the best financial terms offered (against 70 per cent in the case of mortgages). This percentage is lower among poor income households that most frequently (two thirds of the answers) choose the unique bank or financial company that granted consumer credit or the first intermediary approached, therefore not taking in great care of

14
future. However, future income expectations are likely to be over-optimistic for a not
negligible group of them; this translates into a higher frequency of delinquencies.
In this paper we observe that poor-income people are more than twice more likely to
be delinquent on their consumer credit than the whole sample of households that rely on these
loans. The difference, though reduced in magnitude, stands out even after controlling for
other household features. Therefore, poor households are more often subsequently unable to
discharge their obligations. In fact, a large share of those that are in arrears on their consumer
credit repayments - anywhere between 18 and 45 per cent across countries - can be classed as
income-poor. For most consumer credit different from car loans, if the consumer fails to
repay, the amounts are often too small for a lender to try to recover them through a legal
procedure, although ex-court practices are often used. The punishment for people who do not
repay entirely the loan takes frequently the form of deteriorating credit score and limitation to
further access to credit.
On the whole, we do not reckon that the use of consumer credit by poorer groups
could have serious consequences on the business or the stability of financial intermediaries as
the amount of this form of credit is still quite modest. Consumer credit accounts for about 5
per cent of total bank lending in the euro area.26
Nonetheless, the large share of delinquencies among poor-income households -
between 7 and 25 per cent across countries - is an indicator that should be considered by
policy makers. First, we argue that there is probably scope for a more comprehensive role of
the welfare state to deal with unexpected economic shocks that can negatively affect poor-
income households in order to avoid that - to deal with these shocks - they rely on debt that
they are subsequently unable to repay. Secondly, supervisory authorities need to pay great
attention to the cost of consumer credit. The simplicity of the credit contract is extremely
important in order to help households in making better financial choices and avoiding to take
out loans whose conditions are not perfectly clear. On this issue, significant results are
expected from the 2008 EU Consumer Credit Directive, which should increase the
transparency of the terms of the contract and the possibility of comparison for customers.
the interest rate or of other non financial terms of the contract. 26 The figure is 3 per cent for Italy; for Italian financial companies the share is higher, around a quarter. The EU-SILC dataset, on which the present work is based, does not have data on the amount of consumer credit. In Italy, the Survey of Household Income and Wealth does provide this information: the portion of outstanding consumer credit held by poor households is limited, less than 15 per cent of the total. Analysis of the amount of consumer credit in other countries on the basis of harmonized data will be possible starting at the end of 2011, when the Household Finance and Consumption Survey, coordinated by the European Central Bank, becomes available.

15
Another linked topic is financial education that is crucial to help households, specifically
low-income households, in taking sound financial decisions (Campbell, 2006; Lusardi and
Mitchell, 2011).27
27 Campbell (2006) finds that that poorer and less educated households are more likely to make mistakes than wealthier and better educated households.

16
References
Attanasio, O.P. (2009), “Consumption” in Handbook of Macroeconomics, J.B. Taylor and M. Woodford editors, vol. 1, Elsevier Science B.V, Amsterdam
Banque de France (2005), Bullettin de la Banque de France, No.144
Bank of England (2010), Quarterly Bulletin, The Financial Position of British Households: Evidence from the 2010 NMG Consulting Survey, 50(4), 333-345
Bertola G., Disney R. and C. Grant, (2006), “The economics of Consumer Credit Demand and Supply” in The Economics of Consumer Credit, G. Bertola, R, Disney and C. Grant editors, The MIT Press Cambridge, Massachusetts, London, England
Brandolini A., Magri S. and T. Smeeding (2010), “Asset-Based Measurement of Poverty”, Journal of Policy Analysis and Management, 29(2), 267-284
Campbell, J. (2006), “Households Finance”, Journal of Finance, 61(4), 1553-1604
Cavalletti, B. C. Lagazio and D. Vandone (2008), “Il Credito al Consumo in Italia: Benessere Economico o Fragilità Finanziaria”, Università degli Studi di Milano, Working Paper No. 2008-24
Clemenceau, A., and J.-M. Museux (2007), “EU-SILC (community statistics on income and living conditions: general presentation of the instrument)”, in Comparative EU statistics on Income and Living Conditions: Issues and Challenges – Proceedings of the EU-SILC conference (Helsinki, 6-8 November 2006), pp. 13-36. Luxembourg: Office for Official Publications of the European Communities
Deaton, A. (1992), Understanding Consumption, Oxford University Press, Oxford
Del-Rio, A. and G. Young (2006), “The Determinants of Unsecured Borrowing: Evidence form the British Household Panel Survey”, Applied Financial Economics, 16, 1119-1144
European Central Bank (2009), “Housing Finance in the Euro Area”, Occasional Paper Series, No.101
European Commission (2008), “Towards a Common Operational European Definition of Over-Indebtedness”, Luxembourg, Office for Official Publications of the European Communities
Gomez-Salvador R., A. Lojschova and T. Westermann (2011) “Household Sector Borrowing in the Euro Area: a Micro Data Perspective”, ECB, Occasional paper series 125
Lusardi, A. (2011) “Americans’ Financial Capabilities”, NBER Working Paper 17103
Lusardi A., D.J. Schneider, and P. Tufano (2011) “Financially Fragile Households: Evidence and Implications”, NBER Working Paper 17072

17
Lusardi A., and O.S. Mitchell (2011) “The Outlook for Financial Literacy”, NBER Working Paper 17077
Observatoire des crédits aux ménages (2008 and 2009), Annual Report 21st and 22nd
Osservatorio sul Credito al Dettaglio (2009a), “Il Ricorso al Credito al Consumo: Caratteristiche Socio-Economiche e Comportamentali delle Famiglie Italiane”, Assofin, Crif and Prometeia, No.26
Osservatorio sul Credito al Dettaglio (2009b), “Recuperare i crediti in tempo di crisi”, Assofin, Crif and Prometeia, No.27
Tudela, M. and Young, G. (2003) “The Distribution of Unsecured Debt in the United Kingdom: Survey Evidence” Bank of England Quarterly Bulletin, 43(4), 417-427

Tables and Figures
19
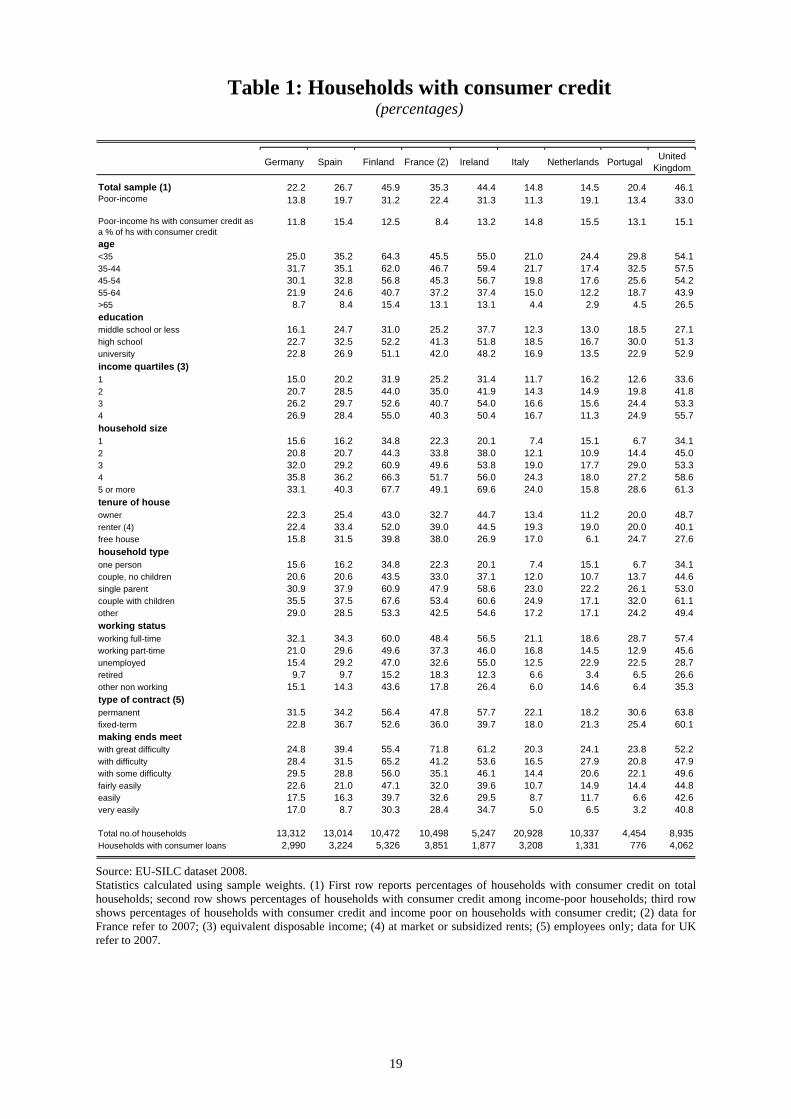
Table 1: Households with consumer credit (percentages)
Total sample (1) 22.2 26.7 45.9 35.3 44.4 14.8 14.5 20.4 46.113.8 19.7 31.2 22.4 31.3 11.3 19.1 13.4 33.0
11.8 15.4 12.5 8.4 13.2 14.8 15.5 13.1 15.1
age<35 25.0 35.2 64.3 45.5 55.0 21.0 24.4 29.8 54.135-44 31.7 35.1 62.0 46.7 59.4 21.7 17.4 32.5 57.545-54 30.1 32.8 56.8 45.3 56.7 19.8 17.6 25.6 54.255-64 21.9 24.6 40.7 37.2 37.4 15.0 12.2 18.7 43.9>65 8.7 8.4 15.4 13.1 13.1 4.4 2.9 4.5 26.5educationmiddle school or less 16.1 24.7 31.0 25.2 37.7 12.3 13.0 18.5 27.1high school 22.7 32.5 52.2 41.3 51.8 18.5 16.7 30.0 51.3university 22.8 26.9 51.1 42.0 48.2 16.9 13.5 22.9 52.9income quartiles (3)1 15.0 20.2 31.9 25.2 31.4 11.7 16.2 12.6 33.62 20.7 28.5 44.0 35.0 41.9 14.3 14.9 19.8 41.83 26.2 29.7 52.6 40.7 54.0 16.6 15.6 24.4 53.34 26.9 28.4 55.0 40.3 50.4 16.7 11.3 24.9 55.7household size1 15.6 16.2 34.8 22.3 20.1 7.4 15.1 6.7 34.12 20.8 20.7 44.3 33.8 38.0 12.1 10.9 14.4 45.03 32.0 29.2 60.9 49.6 53.8 19.0 17.7 29.0 53.34 35.8 36.2 66.3 51.7 56.0 24.3 18.0 27.2 58.65 or more 33.1 40.3 67.7 49.1 69.6 24.0 15.8 28.6 61.3tenure of house owner 22.3 25.4 43.0 32.7 44.7 13.4 11.2 20.0 48.7renter (4) 22.4 33.4 52.0 39.0 44.5 19.3 19.0 20.0 40.1free house 15.8 31.5 39.8 38.0 26.9 17.0 6.1 24.7 27.6household typeone person 15.6 16.2 34.8 22.3 20.1 7.4 15.1 6.7 34.1couple, no children 20.6 20.6 43.5 33.0 37.1 12.0 10.7 13.7 44.6single parent 30.9 37.9 60.9 47.9 58.6 23.0 22.2 26.1 53.0couple with children 35.5 37.5 67.6 53.4 60.6 24.9 17.1 32.0 61.1other 29.0 28.5 53.3 42.5 54.6 17.2 17.1 24.2 49.4working statusworking full-time 32.1 34.3 60.0 48.4 56.5 21.1 18.6 28.7 57.4working part-time 21.0 29.6 49.6 37.3 46.0 16.8 14.5 12.9 45.6unemployed 15.4 29.2 47.0 32.6 55.0 12.5 22.9 22.5 28.7retired 9.7 9.7 15.2 18.3 12.3 6.6 3.4 6.5 26.6other non working 15.1 14.3 43.6 17.8 26.4 6.0 14.6 6.4 35.3type of contract (5)permanent 31.5 34.2 56.4 47.8 57.7 22.1 18.2 30.6 63.8fixed-term 22.8 36.7 52.6 36.0 39.7 18.0 21.3 25.4 60.1making ends meetwith great difficulty 24.8 39.4 55.4 71.8 61.2 20.3 24.1 23.8 52.2with difficulty 28.4 31.5 65.2 41.2 53.6 16.5 27.9 20.8 47.9with some difficulty 29.5 28.8 56.0 35.1 46.1 14.4 20.6 22.1 49.6fairly easily 22.6 21.0 47.1 32.0 39.6 10.7 14.9 14.4 44.8easily 17.5 16.3 39.7 32.6 29.5 8.7 11.7 6.6 42.6very easily 17.0 8.7 30.3 28.4 34.7 5.0 6.5 3.2 40.8
Total no.of households 13,312 13,014 10,472 10,498 5,247 20,928 10,337 4,454 8,935Households with consumer loans 2,990 3,224 5,326 3,851 1,877 3,208 1,331 776 4,062
Spain Finland Ireland
Poor-income hs with consumer credit as a % of hs with consumer credit
France (2)United
Kingdom
Poor-income
Italy Netherlands PortugalGermany
Source: EU-SILC dataset 2008. Statistics calculated using sample weights. (1) First row reports percentages of households with consumer credit on total households; second row shows percentages of households with consumer credit among income-poor households; third row shows percentages of households with consumer credit and income poor on households with consumer credit; (2) data for France refer to 2007; (3) equivalent disposable income; (4) at market or subsidized rents; (5) employees only; data for UK refer to 2007.

20
Table 2: Probability of consumer loans (Probit estimations - marginal effects)
age<35 0.210 (***) 0.206 (***) 0.208 (***) 0.210 (***) 0.212 (***)
(0.023) (0.020) (0.023) (0.020) (0.023)35-44 0.184 (***) 0.183 (***) 0.182 (***) 0.186 (***) 0.189 (***)
(0.017) (0.016) (0.017) (0.016) (0.017)45-54 0.174 (***) 0.172 (***) 0.172 (***) 0.177 (***) 0.180 (***)
(0.016) (0.016) (0.017) (0.015) (0.017)55-64 0.137 (***) 0.140 (***) 0.136 (***) 0.142 (***) 0.145 (***)
(0.016) (0.017) (0.016) (0.017) (0.016)
educationhigh school 0.023 (***) 0.021 (**) 0.024 (***) 0.020 (**) 0.029 (***)
(0.007) (0.010) (0.007) (0.009) (0.008)university 0.004 0.005 0.005 0.002 0.020 (*)
(0.010) (0.014) (0.009) (0.012) (0.010)
income quartiles dummy income-poor*year2 0.051 (***) 0.053 (***) 0.051 (***) 0.060 (***) year 2005 -0.066 (***)
(0.005) (0.008) (0.005) (0.006) (0.006)3 0.091 (***) 0.093 (***) 0.092 (***) 0.102 (***) year 2006 -0.070 (***)
(0.006) (0.008) (0.007) (0.009) (0.008)4 0.115 (***) 0.116 (***) 0.116 (***) 0.125 (***) year 2007 -0.071 (***)
(0.011) (0.013) (0.011) (0.012) (0.009) year 2008 -0.070 (***)
(0.006)
household size 0.016 (***) 0.018 (***) 0.016 (***) 0.019 (***) 0.014 (***)
(0.003) (0.004) (0.002) (0.004) (0.003)
tenure of house owner -0.053 (***) -0.049 (**) -0.050 (***) -0.045 (***) -0.045 (**)
(0.019) (0.018) (0.016) (0.016) (0.018)free house -0.021 -0.014 -0.019 -0.010 -0.020
(0.015) (0.014) (0.014) (0.015) (0.015)
household typeone person -0.065 (***) -0.073 (***) -0.065 (***) -0.071 (***) -0.062 (***)
(0.016) (0.017) (0.016) (0.018) (0.017)couple, no children -0.016 -0.028 (*) -0.018 -0.025 -0.008
(0.015) (0.014) (0.015) (0.015) (0.016)couple with children 0.009 -0.003 0.009 -0.003 0.013
(0.008) (0.012) (0.007) (0.011) (0.008)other -0.020 -0.028 (*) -0.021 (*) -0.029 (*) -0.012
(0.012) (0.014) (0.012) (0.014) (0.013)
working statusworking full-time 0.041 (***) 0.047 (***) 0.050 (***)
(0.008) (0.008) (0.010)unemployed -0.051 (***) -0.047 (***) -0.048 (***) -0.042 (***) -0.049 (***)
(0.010) (0.013) (0.008) (0.013) (0.011)retired -0.038 (***) -0.025 (**) -0.034 (***) -0.023 (*) -0.040 (***)
(0.010) (0.013) (0.010) (0.013) (0.011)other non working -0.049 (***) -0.053 (***) -0.046 (***) -0.042 (***) -0.049 (***)
(0.010) (0.013) (0.012) (0.010) (0.009)
type of contract self-employed 0.068 (***) 0.079 (***)
(0.027) (0.023)permanent 0.042 (***) 0.053 (***)
(0.009) (0.010)fixed-term 0.034 (**) 0.043 (***)
(0.008) (0.013)
making ends meetwith difficulty or some difficulty -0.078 (***) -0.082 (***) -0.080 (***) -0.090 (***) -0.075 (***)
(0.015) (0.016) (0.014) (0.013) (0.015)from fairly to very easily -0.191 (***) -0.195 (***) -0.191 (***) -0.203 (***) -0.177 (***)
(0.015) (0.017) (0.013) (0.011) (0.014)
No. of observations 377,396 95,998 350,004 90,685 377,396Period of analysis 2005-2008 2008 2005-2008 2008 2005-2008Estimated probability 0.233 0.232 0.224 0.231 0.233Pseudo R^2 0.1606 0.1611 0.1595 0.1679 0.1585
Model 3 Model 4 Model 5Model 1 Model 2
Country dummies are included. Standard errors robust to heteroskedasticity and clustered at country level are in brackets. (***) coefficient is significantly different from zero at 1% (**) 5% and (*) 10%. In models 1 and 2 the same household characteristics than in Table 1 are considered, excluding the type of contract. In models 3 and 4 the type of contract is also included: the dummy working full time is split between full-time self-employed and full-time employees with fixed-term or permanent contract. In models 2 and 4 we consider year 2007 for France; in model 4 year 2007 for the Uk. The reference household, i.e. the excluding categories, is a household whose head is >65, with middle school or less, in the low-income quartile, renter, single parent, working part-time, with great difficulties in making ends meets. Household size is included as a continuous variables. In model 5, the specification used in model 1 is estimated with a dummy for poor-income household, while dummies for income quartiles are excluded. If in the same category of households two significant coefficients are shadowed, this means their difference is not statistically significant at least at 10%.

21
Table 3: Households in arrears on consumer credit repayments (percentages on households with consumer credit)
Total sample (1) 7.8 8.4 8.2 5.9 5.3 10.5 6.8 7.8 2.324.9 13.5 15.7 12.8 13.4 20.5 10.1 16.8 6.9
36.0 23.3 23.9 18.2 33.4 28.9 23.1 27.7 45.1
age<35 11.0 13.2 11.3 9.4 9.0 10.9 8.3 7.9 4.335-44 8.6 8.5 8.3 5.4 3.7 11.2 7.3 11.5 2.445-54 7.5 5.5 7.6 4.1 4.0 8.8 6.0 5.6 2.155-64 4.5 7.2 5.4 4.8 4.7 10.2 5.4 5.2 1.3>65 5.7 2.4 4.2 4.0 0.7 12.7 1.5 2.5 0.4educationmiddle school or less 13.5 9.3 9.3 7.6 8.2 13.2 7.0 10.2 3.0high school 9.5 9.7 9.8 6.8 4.8 9.0 7.4 4.3 3.3university 5.6 5.9 4.8 2.9 2.7 6.7 5.5 0.4 1.3income quartiles (3)1 20.9 12.8 14.3 10.5 13.1 18.7 8.3 17.8 6.32 8.8 10.3 10.8 7.2 5.5 14.5 9.1 7.9 2.83 5.2 7.8 7.8 5.8 4.9 8.6 5.1 6.1 1.34 2.4 4.1 2.9 2.1 0.6 3.3 3.9 4.4 0.6household size1 9.4 11.9 11.1 8.9 7.1 17.4 7.7 3.5 2.52 7.5 6.6 6.0 4.7 5.7 5.9 5.1 6.5 1.63 7.7 7.7 8.8 4.4 5.6 9.8 8.5 9.6 2.84 5.3 7.3 6.5 5.9 3.7 9.4 4.3 6.1 2.15 or more 9.6 16.5 7.7 6.3 5.4 16.2 9.9 10.3 3.7tenure of house owner 3.6 6.1 4.7 3.2 2.8 7.8 5.0 4.8 1.0renter (4) 11.7 20.1 14.2 9.1 13.7 16.9 8.2 17.1 6.5free house 0.0 12.5 3.9 9.0 12.6 12.0 0.0 11.9 2.2household typeone person 9.4 11.9 11.1 8.9 7.1 17.4 7.7 3.5 2.5couple, no children 6.1 6.3 5.6 4.0 5.9 5.4 4.8 6.4 1.0single parent 14.6 28.4 12.2 7.9 7.9 16.4 3.0 14.9 4.1couple with children 6.8 7.9 7.7 5.6 2.5 11.1 5.7 7.9 2.3other 8.2 7.7 6.7 5.5 8.1 8.6 11.9 8.3 4.1working statusworking full-time 6.1 8.5 7.1 5.6 2.3 9.6 5.5 7.9 1.6working part-time 9.9 2.9 10.1 4.8 7.0 12.7 11.4 10.1 2.3unemployed 26.9 16.3 17.6 19.2 20.3 33.0 14.9 16.2 4.1retired 5.3 2.3 4.0 3.9 1.2 10.0 2.0 2.5 0.4other non working 23.4 11.3 14.1 11.3 16.3 16.0 7.7 9.0 15.8type of contract (5)permanent 6.0 5.7 6.7 5.2 2.5 8.5 6.7 7.1 2.5fixed-term 12.6 15.6 13.3 10.4 12.5 11.5 8.8 7.9 1.5making ends meetwith great difficulty 39.0 24.0 35.9 33.7 23.6 24.6 24.0 18.5 12.0with difficulty 21.4 10.9 21.0 14.7 9.2 10.6 11.6 4.9 5.7with some difficulty 14.8 4.4 12.7 4.1 2.2 4.9 9.9 3.9 2.4fairly easily 4.6 1.9 4.8 1.3 0.0 2.4 5.3 0.0 0.5easily 0.6 0.7 1.8 0.3 0.8 4.5 2.1 5.1 0.0very easily 2.3 0.0 0.5 0.0 0.0 0.0 0.0 0.0 0.0
Total no.of households 13,312 13,014 10,472 10,498 5,247 20,928 10,337 4,454 8,935Households with consumer loans 2,990 3,224 5,326 3,851 1,877 3,208 1,331 776 4,062
178 230 354 190 91 322 77 48 84
Poor-income
Poor-income hs in arrears as a % of hs in arrears
Households in arrears with consumer loans
Germany PortugalUnited
KingdomFrance (2) Ireland Italy NetherlandsFinlandSpain
Source: EU-SILC dataset 2008. Statistics calculated using sample weights. (1) First row reports percentages of households in arrears on consumer credit on total households; second row shows percentages of households in arrears among income poor; third row shows percentages of households in arrears and income poor on households with arrears; (2) data for France refer to 2007; (3) equivalent disposable income; (4) at market or subsidized rents; (5) employees only; data for UK refer to 2007.

22
Table 4: Probability of delinquencies on consumer loans (Probit estimations - marginal effects)
age<35 0.024 (**) 0.037 (***) 0.028 (**) 0.044 (***) 0.024 (**)
(0.012) (0.013) (0.012) (0.015) (0.012)35-44 0.018 (**) 0.026 (**) 0.021 (**) 0.031 (***) 0.017 (**)
(0.009) (0.011) (0.010) (0.013) (0.009)45-54 0.014 (*) 0.019 (**) 0.017 (**) 0.024 (**) 0.013
(0.008) (0.010) (0.009) (0.013) (0.008)55-64 0.007 0.014 (*) 0.008 0.017 (*) 0.005
(0.006) (0.009 (0.006) (0.011) (0.006)
educationhigh school -0.005 (***) -0.001 -0.006 (***) -0.003 (*) -0.006 (***)
(0.001) (0.003) (0.001) (0.002) (0.001) university -0.010 (***) -0.006 (**) -0.011 (***) -0.005 (**) -0.013 (***)
(0.002) (0.003) (0.002) (0.002) (0.002)
income quartiles dummy income-poor*year2 -0.010 (***) -0.006 (**) -0.009 (***) -0.007 (**) year 2005 0.023 (**)
(0.003) (0.003) (0.003) (0.003) (0.011)3 -0.019 (***) -0.013 (***) -0.019 (***) -0.013 (***) year 2006 0.021 (***)
(0.004) (0.005) (0.004) (0.005) (0.007)4 -0.024 (***) -0.020 (***) -0.024 (***) -0.022 (***) year 2007 0.026 (***)
(0.003) (0.005) (0.004) (0.005) (0.007) year 2008 0.017 (***)
(0.007)
household size 0.004 (***) 0.003 0.003 (***) 0.003 0.004 (***)
(0.001) (0.002) (0.001) (0.002) (0.001)
tenure of house owner -0.026 (***) -0.027 (***) -0.028 (***) -0.031 (***) -0.029 (***)
(0.004) 0.004 (0.004) (0.006) (0.004)free house -0.009 (***) -0.007 -0.010 (***) -0.007 -0.009 (***)
(0.003) (0.005) (0.003) (0.006) (0.003)
household typeone person 0.002 0.004 0.001 0.003 0.001
(0.004) (0.008) (0.004) (0.007) (0.004)couple, no children -0.009 (***) -0.009 (*) -0.010 (***) -0.009 (*) -0.012 (***)
(0.002) (0.005) (0.003) (0.005) (0.002)couple with children -0.010 (***) -0.007 -0.012 (***) -0.010 (*) -0.011 (***)
(0.004) (0.005) (0.004) (0.005) (0.004)other -0.003 -0.004 -0.004 -0.006 -0.005 (*)
(0.003) (0.005) (0.003) (0.005) (0.003)
working statusworking full-time -0.007 (***) -0.003 -0.009 (***)
(0.003) (0.005) (0.003) unemployed 0.018 (***) 0.023 (***) 0.018 (***) 0.024 (***) 0.017 (***)
(0.003) (0.007) (0.003) (0.008) (0.003) retired -0.009 (**) 0.003 -0.010 (**) 0.002 -0.008 (**)
(0.004) (0.006) (0.004) (0.005) (0.004)other non working 0.002 0.006 0.002 0.004 0.002
(0.008) (0.011) (0.008) (0.009) (0.007)
type of contract self-employed 0.006 (*) 0.010
(0.003) (0.007)permanent -0.013 (***) -0.011 (***)
(0.002) (0.004)fixed-term 0.002 0.001
(0.003) (0.008)
making ends meetwith difficulty or some difficulty -0.054 (***) -0.050 (***) -0.058 (***) -0.050 (***) -0.056 (***)
(0.003) (0.003) (0.003) (0.004) (0.003)from fairly to very easily -0.128 (***) -0.118 (***) -0.126 (***) -0.112 (***) -0.135 (***)
(0.008) (0.007) (0.007) (0.008) (0.007)
No. of observations 97,358 24,826 87,123 23,563 97,358Period of analysis 2005-2008 2008 2005-2008 2008 2005-2008Estimated probability 0.038 0.034 0.040 0.036 0.038Pseudo R^2 0.1873 0.1762 0.1872 0.1779 0.1857
Model 3 Model 4 Model 5Model 1 Model 2
See footnotes in Table 2. Estimations are only on households with consumer credit.

23
Figure 1: Household debt (as a percentage of household disposable income; end-of-period data)
0
20
40
60
80
100
120
140
160
2003 2010 2003 2010 2003 2010 2003 2010 2003 2010 2003 2010 2003 2010
other financial debts (1)loans for house purchases
ITALY
FRANCE
GERMANY
SPAIN
EURO AREA
UNITED KINGDOM
UNITED STATES
Figure 2: Consumer credit (2) (as a percentage of household disposable income; end-of-period data)
0
5
10
15
20
25
30
2003 2010 2003 2010 2003 2010 2003 2010 2003 2010 2003 2010 2003 2010
granted by financial companies
granted by banks
ITALY
FRANCEGERMANY
SPAIN EURO AREA
UNITED KINGDOM
UNITED STATES
Sources: For Italy, Banca d’Italia and Istat; for France, Banque de France and INSEE; for Germany, Deutsche Bundesbank; for Spain, Banco de España; for the euro area, Eurostat and ECB; for the United Kingdom, Central Statistical Office, United Kingdom National Accounts (The Blue Book) and Bank of England; for the United States, Federal Reserve System – Board of Governors, Flow of Funds Accounts of the United States, and Bureau of Economic Analysis. For comparability with the euro area, the data refer to consumer and producer households and include bad debts; for the US, consumer households only. (1) Other financial debts include consumer credit and other loans, such as current accounts, overdrafts and mortgages not for house purchases. (2) For the United States, the share granted by banks includes the amount pertaining to ABS issuers. Data on consumer credit granted by financial companies are available for Italy, the United Kingdom and the United States. Financial companies account for a tiny share of the consumer credit market in other main euro area countries such that France, Germany and Spain.

24
Figure 3: Households with consumer credit (percentages)
Total sample Poor-income
0
10
20
30
40
50
60
DE ES FI FR IE IT NL PT UK ALL
2005 2008
0
10
20
30
40
50
60
DE ES FI FR IE IT NL PT UK ALL
2005 2008
Figure 4: Households in arrears on consumer credit repayments (percentages on households with consumer credit)
Total sample Poor-income
0
5
10
15
20
25
30
35
40
DE ES FI FR IE IT NL PT UK ALL
2005 2008
0
5
10
15
20
25
30
35
40
DE ES FI FR IE IT NL PT UK ALL
2005 2008
Source: EU-SILC dataset 2005 and 2008. In Figure 3, the right panel shows the percentage of households with consumer credit among income-poor; in Figure 4, the right panel shows the percentage of households in arrears on consumer credit among income-poor.

25
Methodological notes
[1] The percentage of borrowing households that we obtain by using the two questions is very similar in Spain, Finland, Italy, the Netherlands and the United Kingdom. For most of these countries, this percentage is also analogous to that reported in publications based on other national household surveys. For the remaining countries (France, Germany, Ireland and Portugal), to identify households with consumer loans we use the question about the burden of consumer credit repayment, since in this case the percentages of households with consumer credit are closer to those reported in studies based on other national household surveys.
[2] The percentage of households with consumer credit is low in Italy when compared with Spain and
France, countries where the ratios of aggregate consumer credit to disposable income are about the same (Figure 2). Using data for the year 2008 and considering France, whose gap with Italy is particularly large in the participation in the consumer credit market (about 20 percentage points, Table 1), this difference would imply that in Italy average consumer debt per indebted household is almost twice the amount for the French indebted household and average income is about 10 per cent lower compared with France. Two additional remarks are relevant. First, a Banque de France study (2005) reports survey results for the first half of the previous decade. It shows that the percentage of French households with consumer credit is much higher than in Italy for loans of less than 2,500 euro, but similar to or lower than the Italian percentages for all other size classes of debt. It is therefore possible that in Italy there is underreporting of consumer credit by those that have loans of small amount; this entails a reduction in the whole percentage of households with consumer credit. Second, on the basis of the Survey of Households Income and Wealth, run every two years by the Bank of Italy, from which the share of household with consumer credit is very similar to that in the EU-SILC for Italy, we know that the amount of consumer credit reported in the survey, adequately weighted to be representative of the universe, accounts for less than 30 per cent compared with data reported by banks and financial companies used in Figure 2. Survey Italian data are therefore characterized by relevant under-reporting.
[3] Equivalent income takes account of household size and composition; unlike per capita income, it
allows for the presence of economies of scale in larger households. The household income is therefore divided by a household size which assigns a value 1 to the first adult, 0.5 to any other household member aged 14 and over, and 0.3 to any other household member younger than 14.
[4] The 2008 Bank of Italy Survey of Household Income and Wealth was the first with a specific
question on arrears in loan repayments. For consistency with financial intermediaries’ delinquency reports, respondents were asked to indicate only payments that were more than 90 days overdue. On this basis, the frequency of arrears in consumer debt repayment in Italy is considerably reduced, to 4.1 per cent, less than half the figure obtained when using the EU-SILC dataset for the year 2008. For consumer credit, the time threshold for defining delinquencies may be very important. A study on credit collection published in the Osservatorio sul credito al dettaglio (2009b) by Assofin, Crif and Prometeia finds that in recent years there has been a drastic change in the approach taken by Italian borrowers who face moderate difficulties. They have realized that they can miss payments for a short time without serious consequences, so that they deal with payments of loan installments, utility bills and other expenditures, deciding where not to pay for a while (the frequency of arrears on utility bills is also much higher in Italy than in other countries). Therefore, credit collection agents more and more commonly find themselves facing debtors who negotiate their positions and can remain insolvent for some months before settling up. Consequently, the EU-SILC data may reflect arrears that are at least in part temporary, nonetheless indicating that lenders should bear high costs to eliminate or to reduce them by out-of-court procedures; by contrast, the Bank of Italy’s survey allows us to calculate an indicator of effective and protracted delinquencies that are more likely to translate into defaults.