Prone Farm Dependent Bait Households in Punjab, Pakistan
48
Flood Hazards and Livelihood Vulnerability of Flood- Prone Farm Dependent Bait Households in Punjab, Pakistan Dilshad Ahmad ( [email protected] ) COMSATS University Islamabad, Vehari Campus Pakistan https://orcid.org/0000-0002-3991-805X Muhammad Afzal Preston University Islamabad Pakistan Research Article Keywords: Flood disasters, Exposure, Bait communities, Livelihood vulnerability index, Punjab Posted Date: June 23rd, 2021 DOI: https://doi.org/10.21203/rs.3.rs-327153/v1 License: This work is licensed under a Creative Commons Attribution 4.0 International License. Read Full License Version of Record: A version of this preprint was published at Environmental Science and Pollution Research on September 18th, 2021. See the published version at https://doi.org/10.1007/s11356-021- 16443-4.
-
Upload
khangminh22 -
Category
Documents
-
view
1 -
download
0
Transcript of Prone Farm Dependent Bait Households in Punjab, Pakistan

Flood Hazards and Livelihood Vulnerability of Flood-Prone Farm Dependent Bait Households in Punjab,PakistanDilshad Ahmad ( [email protected] )
COMSATS University Islamabad, Vehari Campus Pakistan https://orcid.org/0000-0002-3991-805XMuhammad Afzal
Preston University Islamabad Pakistan
Research Article
Keywords: Flood disasters, Exposure, Bait communities, Livelihood vulnerability index, Punjab
Posted Date: June 23rd, 2021
DOI: https://doi.org/10.21203/rs.3.rs-327153/v1
License: This work is licensed under a Creative Commons Attribution 4.0 International License. Read Full License
Version of Record: A version of this preprint was published at Environmental Science and PollutionResearch on September 18th, 2021. See the published version at https://doi.org/10.1007/s11356-021-16443-4.

1
Flood Hazards and Livelihood Vulnerability of Flood-Prone Farm Dependent Bait Households in Punjab, Pakistan 1
2
3
4
5
6
Dilshad Ahmad 7
Department of Management Sciences 8
COMSATS University Islamabad, Vehari Campus Pakistan 9
Corresponding author: [email protected] 10
https://orcid.org/0000-0002-3991-805X 11
12
13
Muhammad Afzal 14
Department of Economics 15
Preston University Islamabad, Pakistan 16
18
19
20
21
22
2
23
24
25
26
27
28
29
Flood hazards and livelihood vulnerability of flood-prone farm dependent Bait households in Punjab, Pakistan 30
31
Abstract 32
Pakistan is one of the most climate change and natural disasters affected country of the world where livelihood and lives of inhabitants 33
are often affected due to these disasters. In the scenario of various disasters and risks, flood disasters are the most recurrent hazards 34
that causes Bait households livelihood more vulnerable. Hence this research work has focused to investigate livelihood vulnerability 35
of flood-prone Bait households in southern Punjab of Pakistan. This study used multistage sampling technique for collection the cross 36
sectional data of 398 flood disasters vulnerable Bait household’s respondents from three high risks flood-prone districts Muzaffargarh, 37
Rajanpur and Rahim Yar Khan. Face to face interview procedure and well developed pre-tested questionnaire was used for data 38
collection in this research work. This study applied vulnerability framework of LVI-IPCC and LVI in the direction of comparing the 39
level of vulnerabilities in preferred three Bait district households. Empirical estimates of LVI major components and framework of 40
IPCC vulnerability have indicated Bait households of Muzaffargarh more vulnerable owing to higher exposure and sensitivity and 41
3
lower adaptive capacity rather than other districts. In contrast to other districts Muzaffargarh households have investigated more 42
vulnerable to flood disasters more particularly in LVI sub-components such as health (0.460), water (0.360) and food (0.515) access. 43
These research findings will helpful to policymakers to work out and put into practice effectual programs and strategies such as 44
constructing more water reserves, developing overhead infrastructure, easy access of institutional loans and generating off-farm 45
income sources. These local based feasible measures will helpful for native inhabitants to reducing frequency of floods in the direction 46
of lessen vulnerability and increase resilience via recovering generally the livelihood of vulnerable Bait households in Punjab Pakistan 47
and particularly the district Muzaffargarh. 48
Keywords; Flood disasters, Exposure, Bait communities, Livelihood vulnerability index, Punjab 49
50
51
1. Introduction 52
Floods, earthquakes, landslides, cyclones and droughts are some significant natural hazards owing to greater than before incidence of 53
excessive climate change (Toe et al., 2018; Eckstein et al., 2019; Ahmad et al., 2019; Elahi et al., 2021). In current global scenario, 54
floods are considered the most consecutive and more destructive rather than other hazards (Toe et al., 2018; Ahmad et al., 2019; Al 55
Baky et al., 2020; Hoq et al., 2021) the reason of considerable involvement to social risk, economic losses and human fatalities as 56
mainly exposed by human (Abbas et al., 2017; Huong et al., 2019; Ahmad and Afzal, 2021). These natural disasters affected more 57
than 96 million peoples throughout the world in 2017 in which majority population 60% was affected from flood hazards (World 58
Bank, 2013; Emergency Event Database (EEDAT), 2017; Eckstein et al., 2019). In the current couple of decades, rising recurrence 59
and severity of floods have estimated more particularly in South Asian and South East Asian countries (Krausmann and Mushtaq, 60
2008; Hirabayashi et al., 2013; Toe et al., 2018; Hussin et al., 2019) where some Asian countries India, China, Bangladesh and 61
4
Pakistan are indicated as supermarkets of flood disasters (James, 2008; Abid et al., 2016; Ahmad et al., 2019). Scare resources, 62
inadequate infrastructure and limited flood adaptive mitigation measures are significant factors of increasing flood vulnerability 63
(Daniell et al., 2016;Abbas et al., 2017) mostly for rural community in developing countries (Zhang et al., 2011; Abid et al., 2016). 64
More particularly in developing countries, anthropogenic factors such as human encroachment in rivers coupled with environmental 65
and climatic change have played major role to increasing flood hazards (Gaurav et al., 2011; Toe et al., 2018). 66
In the global scenario, Pakistan indicated as world 5th most natural hazards affected country (Eckstein et al., 2019) due to specifically 67
located in hazards prone region and facing frequent floods (Abbas et al., 2017; Ahmad and Afzal, 2021). Glacier melting, erratic rains 68
and expanding cycle of monsoon rainfalls are significant factors correlated to consecutive floods in interlined rivers concerning 69
upstream or downstream rivers (Teo et al., 2018; Ahmad et al., 2020). In scenario of natural hazards as more specifically the flood 70
hazards, Pakistan faced the worst flood disaster of history in 2010, which caused cumulative economic cost of 10 billion US dollars, 71
destroy cropped area of two million hectares and twenty-four million peoples were adversely affected (Rafique and Blaschke, 2012; 72
United Nations, 2011; Khan, 2011; Abid et al., 2016). 73
In the last couple of decades, inhabitants of Punjab province of Pakistan pragmatic climate based drastic changes including the more 74
significant and affecting factors such as evident precipitation, grain production changes, weather pattern alteration, droughts, floods 75
and weather pattern shifting (BOS Punjab, 2017). In Punjab, climate vulnerability mostly contributed by various sectors such as 76
urbanization, industrialization, agriculture, transportation, waste and energy which directly rises the Green House Gases emission 77
(Hussain et al., 2019). An increasing scenario of atmospheric pollution in Punjab is the reason of incompetency and inconsistencies 78
about the understanding the geography, climate and production factors (Qayyum et al., 2016; Hussain et al., 2019). In the last, three 79
decades, mean temperature of climate warning trend observed in the range of 0.78 °C to 1.5 °C which is predictable to increase 2 °C to 80
4 °C (Rasul et al., 2012; IPCC, 2014; Abbas et al., 2017; Bokhari et al., 2018) and such dramatic rise in temperature severely affect 81
agricultural production of Punjab province (Abbas et al., 2017; Amin et al., 2018; Tariq et al., 2018). Events of extreme temperature, 82

5
droughts and floods are some significant climate related risks which negatively affects farming system and livelihood through water 83
shortage and crop yield losses (Gorst et al., 2018; Ahmad and Afzal, 2020). More specifically in current few years climate change 84
caused severe losses of staple crops such as wheat production declined 2.26% in 2017, 4.4% in 2018 and in early quarter of 2019 85
unexpected weather conditions as hailstorms, windstorms and heavy rains caused significant losses to standing wheat crop. Punjab 86
province area consists of fertile lands, categorized as arid land in southern region whereas semi arid in central region and precipitation 87
occurs in monsoon season from month of July to August (Mehmood et al., 2016; Abbas et al., 2017). 88
Punjab is officially recognized the land of five rivers Chenab, Jehlum, Ravi, Indus and Sutlej (Pakistan Bureau of Statistics (PBS), 89
2019). Chenab and Indus are major rivers of Pakistan (Ahmad et al., 2021) more prominently causes severe floods destructions 90
specifically in summer season (UNDP, 2019). In flowing process, these rivers naturally dispersed in different temporary channels 91
when passing through various areas as temporary islands are usually generated within the area of river. In the region of southern 92
Punjab, these temporary islands within the rivers in local language Saraiki are formally known as Bait1, areas. Local community 93
particularly inhabited in the neighbouring of these rivers usually settle and performs their farming practices in these islands and mostly 94
cultivate such Bait areas. In flooding season, these Bait areas are in a straight line under fire by rivers. In floods and rainy season these 95
communities have to undergo severe losses of livestock, crops, human fatalities, damages of infrastructure and destruction of houses. 96
Southern Punjab region in Punjab province is higher vulnerable of flooding due to side by side flowing of Chenab and Indus rivers 97
(PDMA, 2017). Livelihood status of Bait farming community adversely affected due to consecutive occurrence of floods rather than 98
farming community from rest of the region, province or country. Southern Punjab Bait household inhabitants of Pakistan are higher 99
vulnerable to flood hazards due to using inadequate measure of mitigation to overcoming these natural disasters risks. Inadequate 100
communication and awareness sources, limited role of disaster institutions, and lack of resources allocation to hazards mitigation 101
measures major factors to increasing vulnerabilities of Bait inhabitants (Singh and Sagar, 2012; Ahmad and Afzal, 2021). 102
1 Temporary islands are usually generated within the area of river in local language Saraiki are formally known as Bait

6
In literature, some studies of developed and developing countries specifically considered the aspect of flood risks adaptation (Birkholz 103
et al., 2014; Lopez-Marrero and Yarnal, 2010), constraints and choice of mitigation of floods (Paul and Routray, 2010; Wisner et al., 104
2004), flood risk management (Wilby and Keenan, 2012; Osberghaus, 2015) and livelihood vulnerability to flood hazards (Hoq et al., 105
2021). In Pakistan for the most part of flood hazards literature determined the aspect of flood hazards management and assessment 106
(Hashmi et al., 2012; Bahadar et al., 2015; Tariq and Van De Giesen, 2012), flood hazards perception and adaptation strategies 107
(Ahmad and Afzal, 2020; Ahmad et al., 2020), floods causes, consequence and protection measures (Yaqub et al., 2015; Khan, 2011), 108
riverbank erosion and inundation of hazards zone (Khan et al., 2017; Ali and De Boer, 2010), riverbank erosion and protection work 109
(Ashraf and Shakir, 2018; Khan and Ali, 2003), some studies focused the aspect of adaptation level and local mitigation measures 110
about affects of post floods (Abbas et al., 2017; Abid et al., 2016). In Pakistan, limited research specifically firmed the aspect of flood 111
hazards affect of food security and poverty (Ali and Rahut, 2020; Ashraf and Shakir, 2018), flood hazards resilience (Ahmad et al., 112
2019), flood persuaded vulnerability and risks of health (Shah et al., 2020), and gender based aspect of flood hazards adaptation 113
strategies (Ahmad et al., 2021). 114
In the above mentioned available literature, the aspect of flood hazards, livelihood vulnerability of flood-prone farm dependent 115
household’s poorly addressed in global scenario whereas according the best knowledge of author this aspect not appropriately 116
addressed in developing countries particularly to Pakistan where agriculture sector is badly affected due to severe natural disasters like 117
floods. To address such research gap in specific scenario of Pakistan this study focused to highlight the flood hazards, livelihood 118
vulnerability of flood-prone farm dependent households Bait communities in Punjab, Pakistan. Objective of this research work is to 119
examine the flood hazards and livelihood vulnerability of flood-prone farm dependent households Bait communities in Punjab, 120
Pakistan. There is some significance of this study in scenario of Pakistan, firstly no research work in this area tried to explore the 121
aspect of Bait community flood hazards livelihood vulnerability in literature as this study tried to focus this aspect. Secondly, no study 122
in Pakistan has used Livelihood Vulnerability Index (LVI) all indicators for vulnerability estimation as this research work carried out 123
to explore the vulnerability of Bait community household through all indicator of LVI also through LVI and IPCC components. This 124

7
research is classified in to five sections, introduction elaborated in first section, data and methodology explained in second section and 125
third section highlighted the empirical results of the study. In section four discussions is indicated whereas last section of the study 126
illustrated conclusion and suggestion. 127
2. Data and methodology 128
2.1 Rationalization of study area selection 129
In four provinces of Pakistan, Punjab was selected for this study owing to few significant reasons. Firstly, Punjab shares 52.95% 130
population, 26% area and supply 53% agricultural GDP of the country (PBS, 2017). Secondly, Punjab among four provinces is higher 131
vulnerable of floods hazards due to consecutive flowing of five rivers throughout the fertile lands of province (PDMA, Punjab 2017). 132
Thirdly, southern Punjab region more particularly selected for study the reason of located both sides of Pakistan’s largest river Indus 133
and consecutively facing flood disasters (BOS, 2017; NDMA, 2018). Fourthly, in region of southern Punjab Bait communities 134
inhabited in the temporary island due to riverine distributor channels of Indus River and engaged farming practices, more vulnerable 135
of flood hazards specifically focused for this study. Lastly, based on mostly flood risk seven districts Bait communities of Punjab, 136
higher flood risk disasters vulnerable three district Muzaffargarh, Rajanpur and Rahim Yar Khan Bait communities were (PDMA, 137
Punjab 2014) more preferably selected for the study. 138
[Figure 1] 139
2.2 Study area geographical feathers 140
Muzaffargarh district consists four tehsils (sub-district in district area) Kot addu, Jatoi, Alipur, Muzaffargarh and 93 union councils 141
(Pakistan fifth administrative unit and local government second tire) (Government of Pakistan (GOP), 2020) with area of 8249 km2 142
and population of 4,322, 009 (PBS, 2017). Muzaffargarh district consider higher vulnerable to consecutive flood disaster owing to 143
located in critical geographical scenario surrounded by two major rivers as Indus flows western side while Chenab flows eastern side 144

8
of district (Bureau of Statistics (BOS) Punjab, 2019). Mild winter and hot summer, average rainfall of 127mm with highest 54°C 145
(129°F) and lowest 1°C (30°F) temperature are some significant feathers of this area (Pakistan Metrological Department (PMD), 146
2019). In the couple of decades, this district faced erratic rainfall and frequent floods those caused foremost losses of infrastructure, 147
crops, livestock and human fatalities (PDMA Punjab, 2014) and due to lowest social progress index and cultural, social and economic 148
dimensions indicated as lower socioeconomic status district (BOS Punjab, 2019). 149
[Figure 2] 150
Rahim Yar Khan district administratively divided in to four tehsils (sub-district in district area) Khanpur, Liaqatpur, Sadiqabad and 151
Rahim Yar Khan (GOP, 2020) by area of 11,880 km2 and population of 4,814, 006 (PBS, 2017) higher vulnerable due to extreme 152
flood disasters as located on eastern bank of river Indus (PDMA Punjab, 2014). In scenario of long and extreme summer Rahim Yar 153
Khan regarded as hot region with average temperature 26.2°C in this area (PMD, 2019). Majority population (65%) of district 154
affiliated with agriculture (BOS Punjab, 2019) whereas during the current couple of decades because of climate change having sever 155
issues of excessive flood hazards and confronted with losses of infrastructure, livestock, crops and human fatalities (PDMA, 2014). 156
District Rajanpur covers the area of 12,318 km2 and consists population of 1,995,958 and administratively divided in to three tehsils 157
(sub-district in district area) Jampur, Rojhan and Rajanpur (BOS Punjab, 2019). Long and extreme summer in district Rajanpur 158
indicated region hot weather which frequently stuck strongly excessive flooding with major destruction of infrastructure, crops and 159
human fatalities due to situated on the western bank of Indus River (PBS, 2017). 160
These three districts share some diverse and common demographic and socioeconomic feathers which play significant role on 161
livelihood vulnerability of flood-prone farm dependent Bait households in Punjab, Pakistan. In these three districts some minor 162
variation in family average size was indicated from 9 to 11 members (PBS, 2017) whereas some significant variation regarding land 163
holding average size among these study districts indicated as lower land holding average size in Muzaffargarh (4.4 acres) as compared 164
to Rahim Yar Khan (6.4 acres) and Rajanpur (5.4 acres) (PBS, 2010; BOS Punjab, 2017) Some variation in agricultural income 165

9
significance in total income was estimated among three districts as higher importance of agricultural income was in Rahim Yar Khan 166
(85%) rather than Rajanpur (74%) and Muzaffargarh (69%) (Nazli et al,. 2012: Abid et el., 2016; BOS, Punjab 2018). 167
2.3 Sampling technique and data collection 168
Multistage sampling technique was used in this study for data collection, firstly based on higher vulnerability of floods destruction 169
Punjab among four provinces preferred for this study (PDMA, 2014). Secondly, Bait communities of southern Punjab region because 170
of higher vulnerability and consecutive flooding specifically focused for this study. Thirdly, out of seven riverine Bait communities’ 171
districts of province, three higher risk flood hazards vulnerable districts Rajanpur, Rahim Yar Khan and Muzaffargarh (PDMA 172
Punjab, 2017; National Disaster Management Authority (NDMA), 2018) Bait communities were particularly selected for the study. 173
Fourthly, two tehsils from each district and two union councils each tehsil were purposively chosen on the basis of flood vulnerability 174
according to list provided from District Disaster Management Authority (DDMA), local land record officer (patwari) and agriculture 175
officer. Lastly, two Bait community villages from each union council were selected based on higher flood destruction and 176
vulnerability and sixteen farmer’s respondents from each village were randomly selected and were interviewed. 177
In data collection households indicated basic unit and head of household (female/male) considered major respondents of this study 178
area. For attaining sample size minimum level, this study employed Cochran (1977) sampling method as elaborated in equation 1. 179
Household heads were specifically targeted for data collection of 398 respondents and population of 5% indicated sufficient (Kotrlik 180
and Higgins, 2001). In equation (1) sample size indicated as SS, confidence level elaborated as Z (± 1.96 at 95%) for picking points 181
percentage choices as p, as decimal explained (0.5 employed required sample size) and value of precision was indicated as e(0.07 = ± 182
7). 183
������ ���� = ��(�)(1 − �)�� (1) 184

10
Direct respondent’s interaction and well developed questionnaire was used for data collection from February to May 2019. In finding 185
adequacy and accuracy of information moreover avoiding ambiguity, questionnaire was used for pilot study and pre-tested through 20 186
respondents prior to proper survey. Five trained enumerators and author himself corrected as well as clarified all relevant issues 187
regarding questionnaire prior starting survey in the study area. In data collection, all respondents were clearly informed about the 188
purpose and use of data and those respondents hesitated to sharing their information was replaced to others. 189
2.4 Analytical technique 190
2.4.1 Vulnerability understanding 191
In research scenario, IPCC2 definition standard structure is measured more influential methodical tool for assessment of vulnerability 192
(IPCC, 2001). Numerous scholars in their research studies (Shah et al., 2013; Can et al., 2013; Panthi et al., 2016; Tewari and 193
Bhowmick, 2014; Tjoe, 2016) particularly used the framework of ‘indicator based assessment of vulnerability’ in different 194
perspectives developed by Hahn et al., (2009). In all major and sub-components based composite index of LVI3 was developed by 195
Hahn et al., (2009) whereas the vulnerability index of IPCC (LVI-IPCC) altogether major components in the three causative factors 196
adaptive capacity, sensitivity and exposure (IPCC, 2001; Hoq et al., 2021). LVI-IPCC and LVI indicators are useful for local policy 197
makers and development organizations to recognize social, demographic and other associated factors so as to put in vulnerability of 198
climate change at regional or community levels. Some studies indicated the less significance the scenario of how extreme events in 199
future alter human systems of adaptive capacity and sensitivity whereas more properly focused the factors of extreme events that 200
increases vulnerability to climate events and extreme weather (Adger, 2006; IPCC, 2014). In accessing the vulnerability this study 201
2 Intergovernmental Panel on Climate Change
3 Livelihood vulnerability index

11
used two analysis sets firstly employing the method of balance weight average for LVI calculation, secondly using framework of 202
IPCC (LVI-IPCC) accessing LVI calculation. 203
2.4.2 Method of balance weight average for LVI calculation 204
In calculating vulnerability level in Bait areas of Punjab this research work applied the methodology of Shah et al., (2013), Hahn et al., 205
(2009) and Hoq et al., (2021). In adopting according to the scenario of the study area some method modifications were made (Huong 206
et al., 2019; Hoq et al., 2021). In analysis procedure, along with to seven components of LVI developed indices (Hahn et al., 2009) 207
two more important components production and housing means (Huong et al., 2019; Sarker et al., 2019) were integrated. In the 208
approach of Hahn et al., (2009) climate variability and natural disasters considered single major components whereas this research 209
work considered it as two major components one by one in consistency with Sarker et al., (2019). In this study for computing in LVI, 210
fifty-one sub-components and nine major components as indicators for livelihood were employed as indicated in table 1. Each major 211
component contribution is diverse sub-component indicators in this approach and each major or sub component contributing equally 212
in overall LVI (Sullivan et al., 2002; Hoq et al., 2021). Livelihood strategies (LS), socio-demographic profile (SD), water (W), foods 213
(F), health (H), social network (SN), natural disasters (ND), production and housing means (PHM), climate variability (CV) indicated 214
major components of this study. In calculate index of life expectancy that is difference ratio in actual and pre-selected minimum life 215
expectancy and predetermined range of minimum and maximum life expectancy Human Development Index (HDI) formally 216
employed as indicated in equation (2) (United Nation Development Programme (UNDP), 2007). The each sub-component index was 217
expressed in equation 2 as given below 218
�������� =��� − ����� ����� − �����
(2) 219
The each sub-component or indicator standardized value indicated as IndexSCd, district (d) sub-component actual or original value 220
highlighted as scd, as each sub-component maximum value scmax and minimum vale scmin as elaborated in equation 2. In particular, 221

12
measuring variable frequencies like household percentage, coverage enquiry about community based water resources conflicts as 222
given maximum value 100 and minimum 0. Following the logic minimum and maximum values were transformed and these sub-223
components were standardized in equation 2. Subsequently to each sub-component standardization calculation of every major 224
component was made through n number of sub-component averaging by employing equation 3. 225
��� =∑ ���������
���� � (3) 226
In nine major components, one indicated as MCd and d as district, sub-component index as Indexscdi, n and i indicate sub-component 227
numbers in every major component. In equation 4, each district all major component values were calculated as LVI district level taken 228
by averaging all major components in every district. 229
���� =∑ �����
���� ���� ∑ ����� ���� (4) 230
The notion of LVId, was indicated as LVI for the d district, and equivalent to nine major components average weighted. WMCdi 231
explained as each major component weight as calculated through sub-components numbers and incorporated to make sure that 232
contribution of all sub-components equivalently on the whole LVI (Sullivan et al., 2002) as equation 4 expressed and indicated in 233
equation 5, such in which LVI scaled most vulnerable as 0.5 and least vulnerable as 0. 234
���� =������ + ������ + ������ + ���� + ���� + ���� + �������� + ������ + ������ ��� + ��� + ��� + �� + �� + �� + ���� + ��� + ��� (5) 235
2.4.3 LVI calculation based on framework of IPCC (LVI-IPCC) 236
Vulnerability consider the function based on sensitivity, adaptive capacity and exposure about hazards according to IPCC, (2007) as 237
explained below 238

13
Vulnerability = f (exposure, sensitivity, adaptive capacity) 239
Such investigation related to vulnerability theories indicating as due to low adaptive capacity households are specifically vulnerable 240
(Adger, 2006; IPCC, 2007;Hoq et al., 2021). Exposure reports, specific location or environment of people influenced harmfully via 241
physical events as in this manner focus to possible future damages, harm or loss (Gasper, 2010). Sensitivity mentions degree to that 242
system is affected due to exposure whereas system’s capacity to recover from exposure indicated as adaptive capacity (Ebi et al., 243
2006). There are various indicators composes to exposure, sensitivity and adaptive capacity. In the current era, numerous studies in 244
world scenario employed index based method for vulnerability measurement (Shah et al., 2013; Gasper, 2010; Hahn et al., 2009; 245
Toufique and Islam, 2014; Aryal et al., 2014). On the basis of equation 6, IPCC three factors adaptive capacity, exposure and 246
sensitivity were deliberated. 247
��� =∑ �����
���� ���� ∑ ����� ���� (6) 248
Adaptive capacity, exposure and sensitivity as three contributing factors of IPCC indicated as CFd, whereas d explains district, district 249
d major component elaborated as MCdi, while major components weights explained as wMCdi, and each contributors factors of major 250
component numbers shown as n. In equation 7, exposure index was expressed with relevant two contributing factors as climate 251
variability (CV) and natural disaster (ND) 252
�����(���)� =������� + ����� ������� + �����
(7) 253
In equation 7, district based exposure index indicated as Index (Exp)d, whereas major components climate variability and natural 254
disasters weights were expressed such as Wexp2, Wexp1. Water (W), health (H), food (F) and production and housing means (PHM) 255
indicated major contributing factors of sensitivity for d districts as sensitivity index was expressed in equation 8. 256

14
�����(���)� =������ + ����� � + ����� � + ����� �������� + ����� + ����� + �����
(8) 257
Major components of production and housing means, water, health and foods weights were reported as Wsen1, Wsen2, Wsen3 and Wsen4 258
as highlighted in equation 8. In equation 9, socio-demographic factors (SD), livelihood strategies (LS) and social network (SN) were 259
elaborated contributing factors of adaptive strategies index. 260
�����(�����)� =��������� + ������� �� + ������� ��������� + ������� + �������
(9) 261
These major components livelihood strategies, social network and socio-demographic are three contributing factors weights were 262
expressed as such Wsen1, Wsen2 and Wsen3. Subsequently once calculating these three livelihood strategies, social network and socio-263
demographic contributing factors these were combined in equation 10. 264
��� − ����� = [�����(���)� – �����(����)� ] ∗ ����� (exp )� (10) 265
In using vulnerability framework of IPCC the LVI-IPCC was reported for LVI and district denoted for d, exposure calculated score for 266
district d as Index (exp)d, sensitivity for district d calculated score as Index(sen)d, and adaptive capacity for district d calculated score 267
as Index(adpt)d. In LVI-IPCC were reported as scaled for most vulnerable +1 and least vulnerable -1. 268
3. Empirical results 269
In LVI contributing factors of IPCC (sensitivity, exposure, adaptive capacity), major components (climate variability, natural 270
disasters, food, water, health, production and housing means, livelihood strategies, social demographic factors, social network) and 271
subcomponents, explanation, citation and expected association as indicated in table1. 272
[Table 1] 273

15
Three districts livelihood vulnerability unit measurement, maximum, minimum and actual values of subcomponents elaborated in 274
table 2 whereas normalized sub-components and major components livelihood vulnerability indices of three districts explained in table 275
3. Contributing factors of IPCC and values of major factors are indicated in table 4 while major components indicated in spider figure 276
3 and LVI contributing factors triangle of three districts also highlighted in figure 4. 277
3.1 Influences of sub-components and major components on overall LVI of the Bait household among the districts 278
Three districts each sub-component livelihood vulnerability indices minimum, maximum and actual values are illustrated in table 2. 279
Muzaffargarh Bait community have to travel (178.91 min) average time which is more than Rajanpur (169.87 min) and Rahim Yar 280
Khan (154.01 min) Bait communities for health access as indicated in table 2. Access of latrine indicated significant sub-component of 281
health as highlighting Bait communities’ socioeconomic conditions as limited number of household in Rahim Yar Khan (31%) 282
Rajanpur (39%) and Muzaffargarh (43%) have access of sanitary latrine showing vulnerable scenario as elaborated in table 2. 283
Muzaffargarh Bait community (3.4 month) have to struggle more for access sufficient food rather than Rajanpur (3.1 month) and 284
Rahim Yar Khan (2.3 month) indicating higher vulnerable scenario of sufficient food access. Majority community in Muzaffargarh 285
(89%) worried about sufficient food rather than Rajanpur (83%) and Rahim Yar Khan (78%) whereas average index of diversifying 286
crop (0.48) similar in three districts explained in table 2. 287
[Table 2] 288
In Muzaffargarh (27%) Bait community having higher conflicts of water in community rather than Rajanpur (24%) and Rahim Yar 289
Khan (19%). Higher proportion of Muzaffargarh (31%) community use unsafe water rather than Rajanpur (28%) and Rahim Yar Khan 290
(23%) and have to travel 5.7 minutes, 4.9 minutes and 3.8 minutes to access safe water as indicated in table 2. Majority of Bait 291
communities in Muzaffargarh (68%), Rajanpur (67%) and Rahim Yar Khan (66%) have access of own tubewell for water. 292
3.2 Overall inter-districts households sub-components and major components Livelihood Vulnerability indices (LVI) 293
16
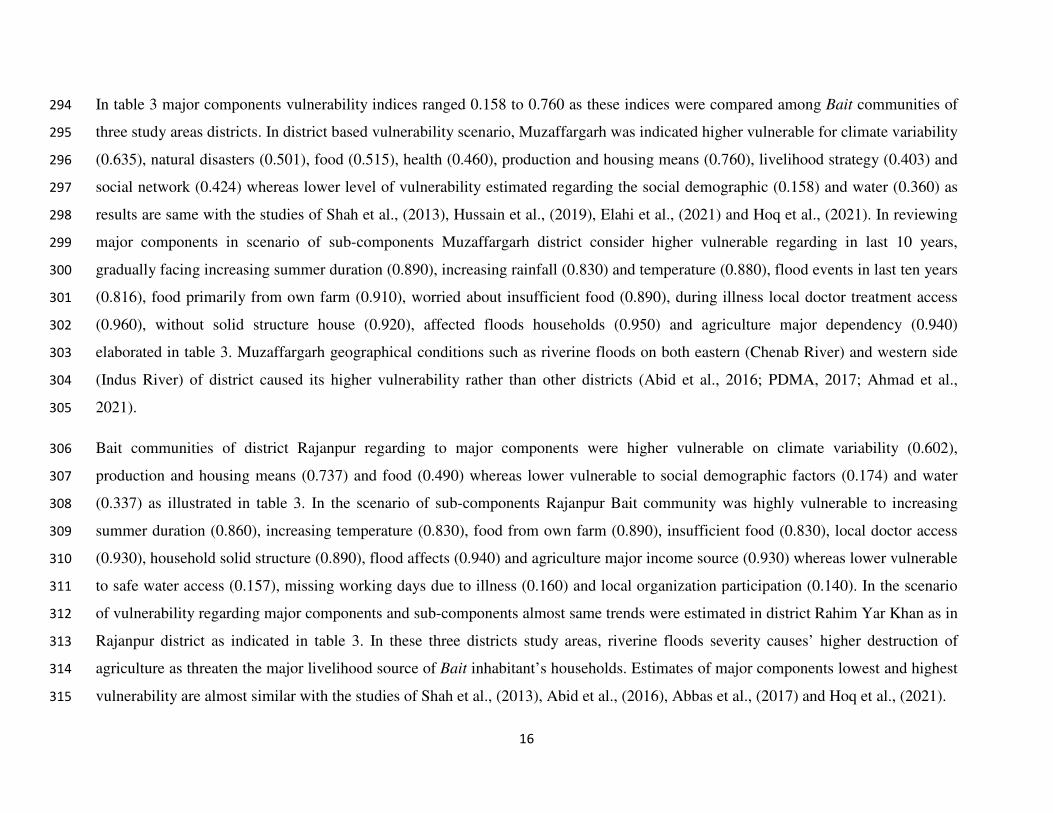
In table 3 major components vulnerability indices ranged 0.158 to 0.760 as these indices were compared among Bait communities of 294
three study areas districts. In district based vulnerability scenario, Muzaffargarh was indicated higher vulnerable for climate variability 295
(0.635), natural disasters (0.501), food (0.515), health (0.460), production and housing means (0.760), livelihood strategy (0.403) and 296
social network (0.424) whereas lower level of vulnerability estimated regarding the social demographic (0.158) and water (0.360) as 297
results are same with the studies of Shah et al., (2013), Hussain et al., (2019), Elahi et al., (2021) and Hoq et al., (2021). In reviewing 298
major components in scenario of sub-components Muzaffargarh district consider higher vulnerable regarding in last 10 years, 299
gradually facing increasing summer duration (0.890), increasing rainfall (0.830) and temperature (0.880), flood events in last ten years 300
(0.816), food primarily from own farm (0.910), worried about insufficient food (0.890), during illness local doctor treatment access 301
(0.960), without solid structure house (0.920), affected floods households (0.950) and agriculture major dependency (0.940) 302
elaborated in table 3. Muzaffargarh geographical conditions such as riverine floods on both eastern (Chenab River) and western side 303
(Indus River) of district caused its higher vulnerability rather than other districts (Abid et al., 2016; PDMA, 2017; Ahmad et al., 304
2021). 305
Bait communities of district Rajanpur regarding to major components were higher vulnerable on climate variability (0.602), 306
production and housing means (0.737) and food (0.490) whereas lower vulnerable to social demographic factors (0.174) and water 307
(0.337) as illustrated in table 3. In the scenario of sub-components Rajanpur Bait community was highly vulnerable to increasing 308
summer duration (0.860), increasing temperature (0.830), food from own farm (0.890), insufficient food (0.830), local doctor access 309
(0.930), household solid structure (0.890), flood affects (0.940) and agriculture major income source (0.930) whereas lower vulnerable 310
to safe water access (0.157), missing working days due to illness (0.160) and local organization participation (0.140). In the scenario 311
of vulnerability regarding major components and sub-components almost same trends were estimated in district Rahim Yar Khan as in 312
Rajanpur district as indicated in table 3. In these three districts study areas, riverine floods severity causes’ higher destruction of 313
agriculture as threaten the major livelihood source of Bait inhabitant’s households. Estimates of major components lowest and highest 314
vulnerability are almost similar with the studies of Shah et al., (2013), Abid et al., (2016), Abbas et al., (2017) and Hoq et al., (2021). 315

17
[Table 3] 316
Livelihood Vulnerability Index nine major components aggregate weighted scores indicated as flood hazards caused Muzaffargarh 317
(0.471) most vulnerable rather than Rahim Yar Khan (0.430) and Rajanpur (0.452) districts. In the scenario of socio-demographic 318
factors Rahim Yar Khan (0.176) is higher vulnerable rather than Muzaffargarh (0.158) and Rajanpur (0.174) as indicated in table 3. In 319
livelihood strategy major components, Rahim Yar Khan (0.419) and Rajanpur (0.427) communities were higher vulnerable than 320
Muzaffargarh Bait inhabitants (0.403). In major component of health, Muzaffargarh (0.460) and Rajanpur (0.414) Bait communities 321
were higher vulnerable than Rahim Yar Khan (0.365) Bait community as these findings are in line with the studies of Hussain et al., 322
(2019) and Ahmad and Afzal, (2020). 323
In table 3, higher score of food vulnerability subsequent to combining food sub-components was estimated in Muzaffargarh (0.515) 324
rather than Rahim Yar Khan (0.438) and Rajanpur (0.490). In Muzaffargarh (0.360) higher vulnerability regarding water was 325
estimated in contrast to Rajanpur (0.337) and Rahim Yar Khan (0.303). In the scenario of production and housing means and flood 326
hazards regarding major components as combination of sub-components Muzaffargarh (0.760) (0.501) and Rajanpur (0.737) (0.444) 327
districts are higher vulnerable rather than Rahim Yar Khan (0.650) (0.386) as indicated in table 3. Bait communities of these three 328
districts more vulnerable to natural disaster specifically riverine floods no access of disasters warning, faced consecutive death and 329
injuries and water logging till many months as elaborated in table 3 as these finding are alike to studies of Ahmad et al., (2019), 330
Hussain et al., (2019), Ahmad and Afzal, (2020) and Hoq et al., (2021). Climate variability major components scores were higher 331
among these three districts while Muzaffargarh (0.635) indicated higher vulnerable rather than Rajanpur (0.602) and Rahim Yar Khan 332
(0.595). Major components combined LVI scores estimates are reported in figure 3 spider diagram 333
[Figure 3] 334
In figure 3, spider diagram scale ranges 0.7 as more vulnerable while from 0 to less vulnerable scenario. Muzaffargarh district Bait 335
community higher vulnerable in climate variability, natural disasters, food, health, production and housing means and water, Rajanpur 336

18
districts more vulnerable in livelihood strategy whereas Rahim Yar Khan districts higher vulnerable in social networks and socio 337
demographic factors as illustrated in figure 3. 338
3.3 Vulnerability assessment through LVI-IPCC approach 339
The IPCC weighted score of contributing factors sensitivity, exposure, and adaptive capacity and overall LVI-IPCC are illustrated in 340
table 4. Vulnerability estimates indicated district Muzaffargarh (0.087) and Rajanpur (0.079) communities higher vulnerable rather 341
than Rahim Yar Khan (0.038). Economic activates and geographical hazards prone locations are significant factors to increasing 342
adaptive capacity and exposure of community. The lower adaptive capacity of Muzaffargarh (0.328) and Rajanpur (0.343) rather than 343
Rahim Yar Khan (0.362) is major cause of higher vulnerability in these both districts as these findings are similar with the studies of 344
Abbas et al., (2017), Hussain et al., (2019), Ahmad and Afzal, (2020) and Hoq et al., (2021). Bait community of district Muzaffargarh 345
higher exposure (0.568) of flood hazards and more sensitive (0.524) rather than other two districts more vulnerable among three 346
districts. District Rahim Yar Khan lower exposure (0.491), sensitivity (0.439) and relatively higher adaptive capacity (0.362) made it 347
less vulnerable rather than two districts. Rajanpur district due to higher intensity based on exposure (0.523), sensitivity (0.495) and 348
lower adaptive capacity (0.343) higher vulnerable rather than Rahim Yar Khan district as indicated table 4 as these findings are similar 349
with the studies of Ahmad and Afzal., (2020) and Elahi et al., (2021). 350
[Table 4] 351
IPCC scores of contributing factors sensitivity, exposure and adaptive capacity illustrated in triangle figure 4 as ranging to higher 352
contributing factors 0.5 and lower contributing factors 0. Bait households of district Muzaffargarh more sensitive (0.524) and exposed 353
(0.568) to climate variability, climate change and floods disasters as lower adaptive capacity caused higher vulnerable rather than 354
other two districts as elaborated in triangle figure 4. 355
[Figure 4] 356

19
4. Discussion 357
In measuring Bait households vulnerabilities about climate change, climate driven natural hazards and flood disasters, this research 358
work used major components, related indicators of LVI and contributing factors (adaptive capacity, sensitivity, exposure) of IPCC. 359
For proper understanding the influence of these indicators and components about livelihood vulnerability is crucial (Tran et al., 2020; 360
Hahn et al., 2009) for applying adaptation strategies, coping climate variability and future research for developing countries more 361
specific like Pakistan (Ahmad et al., 2021). Estimates of the study indicated some minimal similarities and some significant 362
vulnerability difference among these three Bait community districts study areas have specifically highlighted. 363
Some significant vulnerability differences among districts are indicated as firstly according to estimates of both LVI-IPCC and overall 364
LVI, Muzaffargarh rather than other two districts indicated most vulnerable district due to facing consecutive riverine floods from 365
western side Indus river and eastern side Chenab river. These both neighbouring rivers causes to increase vulnerability of this area as 366
major destruction of agriculture crops specifically cotton crop, losses of livestock and available infrastructure as communities’ 367
livelihood becomes more vulnerable as similar liking indicated in literature studies Sujakhu et al., (2019) and Ahmad et al., (2021). 368
Secondly vulnerability difference among districts is health services access indicated as significant indicator about livelihood 369
vulnerability whereas Muzaffargarh and Rajanpur districts are higher vulnerable due to limited health services access as illustrated 370
with consistent trends of literature (Alam et al., 2017). The reason is that Bait communities of Muzaffargarh and Rajanpur districts 371
have limited access of treatment from certified doctors due far areas from main city whereas Rahim Yar Khan Bait community higher 372
access to certified doctors treatment due to located neighbouring of main city so location advantage causes the access of health 373
services as findings shows same trends regarding literature Hussain et al., (2019) and Elahi et al., (2021). Thirdly, Bait community of 374
district Muzaffargarh in contrast to other districts more involved in chronic diseases and illness and have to leave their work in last 375
two weeks the reason of inadequate advanced health treatment facilities. These results illustrated the same development alike with 376
literature Etwire et al., (2013), Ahmad and Afzal, (2020), and Hoq et al., (2021). Lastly, in contrast to other districts, higher food 377
20
vulnerability indicated in Muzaffargarh Bait community to find food, inhabitants have to struggles almost 3.4 month causes worry to 378
sufficient food as these results illustrated the similar leaning regarding the literature Panthi et al., (2016), Abid et al., (2016) and 379
Hussain et al., (2019). 380
Estimates of the study indicated some significant similarities among three districts firstly higher vulnerable scenario among three 381
districts was indicated regarding component of social network. The reason is of limited access and participation to community based 382
and social organizations such as political or farmers’ organizations as these trends are related to literature Abid et al., (2016), Abbas et 383
al., (2017) and Ahmad et al., (2019). Active participation in social structure is prerequisite to minimize vulnerability and boost up 384
adaptive capacity of farming community (Agrawal, 2010). Secondly, among these districts is low literacy rate which causes to less 385
awareness; limited information and limited earning due to inadequate education consider major factors of higher vulnerability in these 386
communities (Ahmad et al., 2021). Thirdly, in these three districts Bait communities almost 67% households have no sanitary toilets 387
as causes to increase health vulnerability that is because of river erosion, floods, land scarcity, inadequate roads networks and standing 388
water bodies as findings have same tendency with literature Sujakhu et al., (2019). Fourthly, these three districts have same crop 389
diversity index as apparent from food components thus limited number of Bait households engaged homestead, gardening, seed 390
storage and food management practice which causes to increase vulnerability among Bait communities’ households as estimates same 391
liking with literature Ahmad et al., (2019) and Elahi et al., (2021). Lastly, among districts majority of Bait households due to lack of 392
money and inadequate building material higher vulnerable to flood hazards and monsoon rain as their houses become fully or partially 393
damage which causes to poor shelter and overall lower living. Bait households also reported as during couple of decades, due to 394
consecutive flood hazards and erratic monsoon badly destructed their farming and fishery as these findings showed similar liking with 395
literature Hussain et al., (2019), Ahmad and Afzal, (2020) and Elahi et al., (2021). 396
Households those engaged in off-farm activities moving outside Bait areas for earning and generating external income sources 397
becomes less vulnerable to these hazards as these inclination similar with the literature Nhacolo et al., (2006), Islam et al., (2011), 398

21
Sujakhu et al., (2019) and Hoq et al., (2021). In some limited measures of water storages from Pakistan’s government caused at some 399
extent decrease vulnerability of Bait communities as they become less vulnerable to flood disasters as compared to previous decades 400
of these three districts. In summarizing the all major components Muzaffargarh reported as most vulnerable rather than Rahim Yar 401
Khan and Rajanpur as these trends supported in literature by PDMA, (2014) and Ahmad et al., (2021). 402
5. Conclusion and suggestions 403
Bait communities of southern Punjab Pakistan are higher vulnerable due to their low lying geographical scenario in this region. In Bait 404
areas, agricultural land consecutively remains under affect of flood hazards and erratic rains which causes to crop losses and 405
infrastructural destructions such severe affects causes’ household livelihood more vulnerable. This study focused to investigate Bait 406
household’s vulnerability of flood hazards owing to effect of change in worldwide temperature by using the LVI. Major components 407
computed on the whole LVI illustrates as Bait community of Muzaffargarh (0.471) indicated more susceptible to flood disaster rather 408
than Rajanpur (0.452) and Rahim Yar Khan (0.430). The index of LVI-IPCC also explained as Muzaffargarh (0.087) Bait community 409
farming households were most vulnerable of flood disasters rather than Rajanpur (0.079) and Rahim Yar Khan (0.038). 410
In the scenario of study findings some significant suggestions are recommended to cope from flood disasters damages to Bait flood-411
prone areas. Firstly, government needs to construct more water reserves specifically on major rivers as almost in 74 years history of 412
country two major dams Terbela (1984) and Mangla (1967) were constructed. Increasing water reserves will multiple benefits with 413
reducing floods consistency in flood prone areas, additional land available for cultivation, more access of irrigation water for 414
agriculture and increasing hydropower generation. Secondly, on State basis there is need adopt proper strategies through streamlining 415
related institutions such as local based disaster management authority, agriculture and weather department in advance get ready 416
farmers to put into practice appropriate strategically measures to avoid flood induced vulnerabilities. Proper guidance, inspiration and 417
anti disaster services need to provide farmers for adaptation of pro-active measures and improving farmers resilience from flood 418
hazards. Thirdly, State based proper policy measures for development of overhead infrastructure and more opportunities for 419

22
generating off farm income sources such as roads and fast communication which would facilitate flood prone Bait farmers for easy 420
access to neighbouring towns and quick escape from riverine area to safe places during flood disasters emergency. Fourthly, 421
developed communication access and social links among society through social organization participation facilitates farmers to fast 422
livelihood recoveries of health, education, sanitation and livelihood activities. Fifthly, disaster concerned authorities need to focus on 423
preparedness plan of community and early warning system that may helpful these flood-prone areas to improving and increasing 424
services access of Bait communities regarding extreme weather preparation with purpose to reducing ecological variations 425
vulnerabilities. Lastly while more significant as Government must specifically introduce some suitable policy measures for minimum 426
interest based loans for technical and financial assistance to flood prone Bait household farmers for facilitating in flood disasters 427
adaptation measures. In this scenario such expectations can generated as LVI components will supportive to policy marker in 428
evaluating the livelihood vulnerability to climate change impacts and develop programmes and strengthen the vulnerable sectors of 429
Bait communities of southern Punjab of Pakistan. 430
Declarations 431
Ethical Approval 432
Ethical approval taken from the COMSATS University Vehari campus, ethical approval committee 433
Consent to Participate 434
Not applicable 435
Consent to Publish 436
Not applicable 437
Authors Contributions 438
DA analyzed data, methodology, results and discussion, conclusion and suggestions and manuscript write up whereas both DA and 439
MA finalized and proof read the manuscript and both authors read and approved the final manuscript. 440

23
Funding 441
This study has no funding from any institution or any donor agency. 442
Competing Interests 443
The authors declare that they have no competing interest. 444
445
Availability of data and materials 446
The datasets used and/or analyzed during the current study are available from the corresponding author on reasonable request. 447
448
References 449
Abbas, G., Ahmad, S., Ahmad, A., Nasim, W., Fatima, Z., Hussain, S., ... & Hoogenboom, G. (2017). Quantification the impacts of 450
climate change and crop management on phenology of maize-based cropping system in Punjab, Pakistan. Agricultural and 451
Forest Meteorology, 247, 42-55. 452
Abid, M., Schilling, J., Scheffran, J., & Zulfiqar, F. (2016). Climate change vulnerability, adaptation and risk perceptions at farm level 453
in Punjab, Pakistan. Science of the Total Environment, 547, 447-460. 454
Adger, W. N. (2006). Vulnerability. Global environmental change, 16(3), 268-281. 455
Agrawal, A. (2010). Local institutions and adaptation to climate change. Social dimensions of climate change: Equity and 456
vulnerability in a warming world, 2, 173-178. 457
Ahmad, D., & Afzal, M. (2020). Flood hazards and factors influencing household flood perception and mitigation strategies in 458
Pakistan. Environmental Science and Pollution Research, 1-13. 459
Ahmad, D., & Afzal, M. (2020). Flood hazards, human displacement and food insecurity in rural riverine areas of Punjab, Pakistan: 460
policy implications. Environmental Science and Pollution Research, 1-15. 461
Ahmad, D., & Afzal, M. (2021). Impact of climate change on pastoralists’ resilience and sustainable mitigation in Punjab, 462
Pakistan. Environment, Development and Sustainability, 1-21. 463

24
Ahmad, D., Afzal, M., & Rauf, A. (2019). Analysis of wheat farmers’ risk perceptions and attitudes: evidence from Punjab, 464
Pakistan. Natural Hazards, 95(3), 845-861. 465
Ahmad, D., Afzal, M., & Rauf, A. (2021). Flood hazards adaptation strategies: a gender-based disaggregated analysis of farm-466
dependent Bait community in Punjab, Pakistan. Environment, Development and Sustainability, 23(1), 865-886. 467
Ahmad, S., Abbas, G., Ahmed, M., Fatima, Z., Anjum, M. A., Rasul, G., ... & Hoogenboom, G. (2019). Climate warming and 468
management impact on the change of phenology of the rice-wheat cropping system in Punjab, Pakistan. Field crops 469
research, 230, 46-61. 470
Al Baky, M. A., Islam, M., & Paul, S. (2020). Flood hazard, vulnerability and risk assessment for different land use classes using a 471
flow model. Earth Systems and Environment, 4(1), 225-244. 472
Alam, G. M., Alam, K., & Mushtaq, S. (2017). Climate change perceptions and local adaptation strategies of hazard-prone rural 473
households in Bangladesh. Climate Risk Management, 17, 52-63. 474
Ali, A., & Rahut, D. B. (2020). Localized floods, poverty and food security: empirical evidence from rural Pakistan. Hydrology, 7(1), 475
2. 476
Ali, K. F., & De Boer, D. H. (2010). Spatially distributed erosion and sediment yield modeling in the upper Indus River basin. Water 477
Resources Research, 46(8). 478
Amin, A., Nasim, W., Mubeen, M., Sarwar, S., Urich, P., Ahmad, A., ... & Ali, Q. S. (2018). Regional climate assessment of 479
precipitation and temperature in Southern Punjab (Pakistan) using SimCLIM climate model for different temporal 480
scales. Theoretical and Applied climatology, 131(1), 121-131. 481
Aryal, S., Cockfield, G., & Maraseni, T. N. (2014). Vulnerability of Himalayan transhumant communities to climate change. Climatic 482
Change, 125(2), 193-208. 483
Ashraf, M., & Shakir, A. S. (2018). Prediction of river bank erosion and protection works in a reach of Chenab River, 484
Pakistan. Arabian Journal of Geosciences, 11(7), 1-11. 485

25
Bahadar, I., Shafique, M., Khan, T., Tabassum, I., & Ali, M. Z. (2015). Flood hazard assessment using hydro-dynamic model and 486
GIS/RS tools: A case study of Babuzai-Kabal tehsil Swat Basin, Pakistan. Journal of Himalayan Earth Science, 48(2). 487
Birkholz, S., Muro, M., Jeffrey, P., & Smith, H. M. (2014). Rethinking the relationship between flood risk perception and flood 488
management. Science of the Total Environment, 478, 12-20. 489
Board of Statistics (BOS) Punjab (2017) Agriculture Information Marketing Services (AIMS) Lahore, Punjab, Pakistan 490
Board of Statistics (BOS) Punjab (2018) Agriculture Information Marketing Services (AIMS) Lahore, Punjab, Pakistan 491
Board of Statistics (BOS) Punjab (2019). Punjab statistics 2019, Statistical Division Punjab Government of Punjab, Lahore, Punjab, 492
Pakistan 493
Bokhari, S. A. A., Ahmad, B., Ali, J., Ahmad, S., Mushtaq, H., & Rasul, G. (2018). Future climate change projections of the Kabul 494
River Basin using a multi-model ensemble of high-resolution statistically downscaled data. Earth Systems and 495
Environment, 2(3), 477-497. 496
Can, N. D., Tu, V. H., & Hoanh, C. T. (2013). Application of livelihood vulnerability index to assess risks from flood vulnerability 497
and climate variability-A case study in the Mekong Delta of Vietnam. Journal of Environmental Science and Engineering. 498
A, 2(8A), 476. 499
Cochran WG (1977) Double sampling. In: Cochran WG (ed) Sampling techniques, 3rd edn. Wiley, New York, pp 327–358 500
Daniell, H., Lin, C. S., Yu, M., & Chang, W. J. (2016). Chloroplast genomes: diversity, evolution, and applications in genetic 501
engineering. Genome biology, 17(1), 1-29. 502
Ebi, K. L., Kovats, R. S., & Menne, B. (2006). An approach for assessing human health vulnerability and public health interventions 503
to adapt to climate change. Environmental health perspectives, 114(12), 1930-1934. 504
Eckstein, D., Künzel, V., Schäfer, L., & Winges, M. (2019). Global climate risk index 2020. Bonn: Germanwatch. 505

26
Elahi, E., Khalid, Z., Tauni, M. Z., Zhang, H., & Lirong, X. (2021). Extreme weather events risk to crop-production and the adaptation 506
of innovative management strategies to mitigate the risk: A retrospective survey of rural Punjab, Pakistan. Technovation, 507
102255. 508
Emergency Event Database (2017) The International Disaster Database, Emergency Event Database (EE-DAT), 2017 509
Etwire, P. M., Al-Hassan, R. M., Kuwornu, J. K., & Osei-Owusu, Y. (2013). Application of livelihood vulnerability index in assessing 510
vulnerability to climate change and variability in Northern Ghana. Journal of Environment and Earth Science, 3(2), 157-170. 511
Gasper, D. (2010). The idea of human security. 512
Gaurav, K., Sinha, R., & Panda, P. K. (2011). The Indus flood of 2010 in Pakistan: a perspective analysis using remote sensing 513
data. Natural hazards, 59(3), 1815-1826. 514
GOP (2020) Economic Survey of Pakistan 2019-20, Pakistan Bureau of Statistics, Ministry of Finance Government of Pakistan. 515
http://www.finance.gov.pk/survey_1920.html 516
Gorst, A., Dehlavi, A., & Groom, B. (2018). Crop productivity and adaptation to climate change in Pakistan. Environment and 517
development economics, 23(6), 679-701. 518
Hahn, M. B., Riederer, A. M., & Foster, S. O. (2009). The Livelihood Vulnerability Index: A pragmatic approach to assessing risks 519
from climate variability and change—A case study in Mozambique. Global environmental change, 19(1), 74-88. 520
Hashmi, H. N., Siddiqui, Q. T. M., Ghumman, A. R., & Kamal, M. A. (2012). A critical analysis of 2010 floods in Pakistan. African 521
Journal of Agricultural Research, 7(7), 1054-1067. 522
Hirabayashi, Y., Mahendran, R., Koirala, S., Konoshima, L., Yamazaki, D., Watanabe, S., ... & Kanae, S. (2013). Global flood risk 523
under climate change. Nature Climate Change, 3(9), 816-821. 524
Hoq, M. S., Raha, S. K., & Hossain, M. I. (2021). Livelihood vulnerability to flood hazard: understanding from the flood-prone Haor 525
Ecosystem of Bangladesh. Environmental management, 1-21. 526
27
Huong, N. T. L., Yao, S., & Fahad, S. (2019). Assessing household livelihood vulnerability to climate change: The case of Northwest 527
Vietnam. Human and Ecological Risk Assessment: An International Journal, 25(5), 1157-1175. 528
Hussain, M., Butt, A. R., Uzma, F., Ahmed, R., Rehman, A., Ali, M. U., ... & Yousaf, B. (2019). Divisional disparities on climate 529
change adaptation and mitigation in Punjab, Pakistan: local perceptions, vulnerabilities, and policy 530
implications. Environmental Science and Pollution Research, 26(30), 31491-31507. 531
IPCC (2001) Climate change 2001: impacts, adaptation, and vulnerability. Contribution of Working Group II to the Third Assessment 532
Report. Intergovernmental Panel on Climate Change (IPCC). Cambridge University Press, Cambridge, UK. p 1055- 533
IPCC (2014) Climate change 2014: synthesis report. Contribution of Working Groups I, II and III to the Fifth Assessment Report. 534
Intergovernmental Panel on Climate Change (IPCC). Cambridge University Press, Cambridge, UK. p 1055 535
IPCC, (2007). climate change 2007: impacts, adaptation and vulnerability. Contribution of working group II to the fourth assessment 536
report of the intergovernmental panel on climate change. Cambridge Uni-versity Press, Cambridge, UK. 537
Islam, S., Uddin, M. T., Rahman, M., & Haque, M. A. (2011). Profitability of alternate farming systems in Dingapota haor area of 538
Netrokona district. Progressive Agriculture, 22(1-2), 223-239. 539
James, E. (2008). Getting ahead of the next disaster: recent preparedness efforts in Indonesia. Development in Practice, 18(3), 424-540
429. 541
Khan, A. A., & Ali, S. B. (2003). Effects of erosion on Indus River bio-diversity in Pakistan. Pakistan Journal of Biological 542
Sciences, 6(12), 1035-1040. 543
Khan, A. N. (2011). Analysis of flood causes and associated socio-economic damages in the Hindukush region. Natural 544
hazards, 59(3), 1239. 545
Khan, A. N. (2013). Analysis of 2010-flood causes, nature and magnitude in the Khyber Pakhtunkhwa, Pakistan. Natural 546
hazards, 66(2), 887-904. 547

28
Khan, H. U. A., Khalil, S. F. A., Kazmi, S. J. H., Umar, M., Shahzad, A., & Farhan, S. B. (2017). IDENTIFICATION OF RIVER 548
BANK EROSION AND INUNDATION HAZARD ZONES USING GEOSPATIAL TECHNIQUES–A CASE STUDY OF 549
INDUS RIVER NEAR LAYYAH DISTRICT, PUNJAB, PAKISTAN. Geoplan J Geomat Plan, 4, 121-130. 550
Kotrlik, J. W. K. J. W., & Higgins, C. C. H. C. C. (2001). Organizational research: Determining appropriate sample size in survey 551
research appropriate sample size in survey research. Information technology, learning, and performance journal, 19(1), 43. 552
Krausmann, E., & Mushtaq, F. (2008). A qualitative Natech damage scale for the impact of floods on selected industrial 553
facilities. Natural Hazards, 46(2), 179-197. 554
Leichenko, R. M., & Wescoat Jr, J. L. (1993). Environmental impacts of climate change and water development in the Indus delta 555
region. International Journal of Water Resources Development, 9(3), 247-261. 556
López-Marrero, T., & Yarnal, B. (2010). Putting adaptive capacity into the context of people’s lives: a case study of two flood-prone 557
communities in Puerto Rico. Natural hazards, 52(2), 277-297. 558
Mahmood, R., Jia, S., & Babel, M. S. (2016). Potential impacts of climate change on water resources in the Kunhar River Basin, 559
Pakistan. Water, 8(1), 23. 560
Nazli, H., Orden, D., Sarker, R., & Meilke, K. D. (2012). Bt cotton adoption and wellbeing of farmers in Pakistan (No. 1007-2016-561
79742). 562
NDMA, Pakistan (2018) Annual Report 2018, National Disaster Management Authority Pakistan. http://www.ndma.gov.pk/ 563
Nhacolo, A. Q., Nhalungo, D. A., Sacoor, C. N., Aponte, J. J., Thompson, R., & Alonso, P. (2006). Levels and trends of demographic 564
indices in southern rural Mozambique: evidence from demographic surveillance in Manhica district. BMC public health, 6(1), 565
1-13. 566
Osberghaus, D. (2015). The determinants of private flood mitigation measures in Germany—Evidence from a nationwide 567
survey. Ecological Economics, 110, 36-50. 568

29
Panthi, J., Aryal, S., Dahal, P., Bhandari, P., Krakauer, N. Y., & Pandey, V. P. (2016). Livelihood vulnerability approach to assessing 569
climate change impacts on mixed agro-livestock smallholders around the Gandaki River Basin in Nepal. Regional 570
Environmental Change, 16(4), 1121-1132. 571
Paul, S. K., & Routray, J. K. (2010). Flood proneness and coping strategies: the experiences of two villages in 572
Bangladesh. Disasters, 34(2), 489-508. 573
PBS (2010). Agricultural Census 2010, Pakistan Bureau of Statistics, Ministry of Finance Statistical Division, Government of Pakistan 574
https://www.pbs.gov.pk/agriculture-census-publications 575
PBS (2017) 6TH Population and Housing Census (2017) Pakistan Bureau of Statistics, Ministry of Finance, Government of Pakistan 576
PBS (2019). Economic Survey of Pakistan 2018-2019 Pakistan Bureau of Statistics, Ministry of Finance Statistical Division, 577
Government of Pakistan 578
PDMA Punjab (2017) Annual Report 2017, Provincial Disaster Management Authority Punjab Pakistan. https://pdma.punjab.gov 579
PDMA, Punjab (2014) Monsoon Contingency Plan Punjab 2014, Punjab Provincial Disaster Management Authority (PDMA) 580
Government of Punjab, Pakistan. 581
pk/system/files/Annual%20Report%202017_0.pdf#overlay-context=node/438 582
PMD, (2019). Monthly weather report, 2019. National weather forecasting centre pakistan meteorologcal department (PMD) 583
Islamabad, Government of Pakistan. http://nwfc.pmd.gov.pk/new/asset s/month ly-weath er-repor ts/2019-08.pdf 584
publications/Annual%20Report%202018.pdf 585
Qayyum, A., Khan, J. A., Hussain, R., Avais, M., Ahmed, N., Khan, A., & Khan, M. S. (2016). Prevalence and Association of 586
Possible Risk Factors with Sub-Clinical Mastitis in Cholistani Cattle. Pakistan Journal of Zoology, 48(2). 587
Rafiq, L., & Blaschke, T. (2012). Disaster risk and vulnerability in Pakistan at a district level. Geomatics, Natural Hazards and 588
Risk, 3(4), 324-341. 589

30
Rasul, G., Mahmood, A., Sadiq, A., & Khan, S. I. (2012). Vulnerability of the Indus delta to climate change in Pakistan. Pakistan 590
journal of meteorology, 8(16). 591
Sarker, M. N. I., Wu, M., Alam, G. M., & Shouse, R. C. (2019). Livelihood vulnerability of riverine-island dwellers in the face of 592
natural disasters in Bangladesh. Sustainability, 11(6), 1623. 593
Shah, A. A., Ye, J., Shaw, R., Ullah, R., & Ali, M. (2020). Factors affecting flood-induced household vulnerability and health risks in 594
Pakistan: the case of Khyber Pakhtunkhwa (KP) Province. International Journal of Disaster Risk Reduction, 42, 101341. 595
Shah, K. U., Dulal, H. B., Johnson, C., & Baptiste, A. (2013). Understanding livelihood vulnerability to climate change: Applying the 596
livelihood vulnerability index in Trinidad and Tobago. Geoforum, 47, 125-137. 597
Singla S.and Sagar M. (2012): Integrated Risk Management in Agriculture: An Inductive Research. The Journal of Risk Finance, 598
13(3), 199-214. doi:10.1108/15265941211229235 599
Sujakhu, N. M., Ranjitkar, S., He, J., Schmidt-Vogt, D., Su, Y., & Xu, J. (2019). Assessing the livelihood vulnerability of rural 600
indigenous households to climate changes in Central Nepal, Himalaya. Sustainability, 11(10), 2977. 601
Sullivan, C. A., Meigh, J. R., & Fediw, T. S. (2002). Derivation and testing of the water poverty index phase 1. Final report may 2002. 602
Tariq, M. A. U. R., & Van De Giesen, N. (2012). Floods and flood management in Pakistan. Physics and Chemistry of the Earth, 603
Parts A/B/C, 47, 11-20. 604
Tariq, M., Ahmad, S., Fahad, S., Abbas, G., Hussain, S., Fatima, Z., ... & Hoogenboom, G. (2018). The impact of climate warming 605
and crop management on phenology of sunflower-based cropping systems in Punjab, Pakistan. Agricultural and Forest 606
Meteorology, 256, 270-282. 607
Teo, M., Goonetilleke, A., Ahankoob, A., Deilami, K., & Lawie, M. (2018). Disaster awareness and information seeking behaviour 608
among residents from low socio-economic backgrounds. International journal of disaster risk reduction, 31, 1121-1131. 609
Tewari, H. R., & Bhowmick, P. K. (2014). Livelihood vulnerability index analysis: An approach to study vulnerability in the context 610
of Bihar. 611

31
Tjoe, Y. (2016). Measuring the livelihood vulnerability index of a dry region in Indonesia. World Journal of Science, Technology and 612
Sustainable Development. 613
Toufique, K. A., & Islam, A. (2014). Assessing risks from climate variability and change for disaster-prone zones in 614
Bangladesh. International Journal of Disaster Risk Reduction, 10, 236-249. 615
Tran, D. D., Quang, C. N. X., Tien, P. D., Tran, P. G., Kim Long, P., Van Hoa, H., ... & Le Ha, T. T. (2020). Livelihood Vulnerability 616
and Adaptation Capacity of Rice Farmers under Climate Change and Environmental Pressure on the Vietnam Mekong Delta 617
Floodplains. Water, 12(11), 3282. 618
UNDP (2007) Human development reports. http://hdr.undp.org/en/Accessed 25 Dec 2007 619
UNDP (2019) United Nations Development Programme in Pakistan Annual Report 2018. 620
file:///C:/Users/ACS/Downloads/UNDPPakistan-AnnualReport2018.pdf 621
United Nations (2011) Pakistan floods: one year on 2011. A Report by the United Nations–Pakistan, Islamabad. 622
http://unportal.un.org.pk/sites/unpakistan/pages/default.aspx. Accessed 7 Aug 2013 623
Wilby, R. L., & Keenan, R. (2012). Adapting to flood risk under climate change. Progress in physical geography, 36(3), 348-378. 624
Wisner, B., Blaikie, P., Blaikie, P. M., Cannon, T., & Davis, I. (2004). At risk: natural hazards, people's vulnerability and disasters. 625
Psychology Press. 626
World Bank. (2013). Turn down the heat: Climate extremes, regional impacts, and the case for resilience. 627
Yaqub, M., Beytullah, E. R. E. N., & Doğan, E. (2015). Flood causes, consequences and protection measures in Pakistan. Disaster 628
Science and Engineering, 1(1), 8-16. 629
Zhang, S., Hua, D., Meng, X., & Zhang, Y. (2011). Climate change and its driving effect on the runoff in the “Three-River 630
Headwaters” region. Journal of Geographical Sciences, 21(6), 963-978. 631
632
633

32
Table 1 Livelihood vulnerability index making up through construction of sub-components and major components 634
Contributing
factors of IPCC
Study
major
compone
nts
Study sub-components Sub-components explanation with
citation
Expected associations
Adaptive
capacity
Liveliho
od
strategy
Dependency on
agriculture as major
income source
Household percentage that having
depend on agriculture as main
income source (Alam, 2017)
Vulnerability increases with single dependency
Non-farm activates of
households affected by
natural disasters as floods
Household percentage indicated as
non-farm activities were affected by
other hazards or floods (Alam,
2017)
Vulnerability increases as non-farm activates affected by floods
Household percentage
those member or head
having opportunity of
training to cope of other
or flood disasters
Household percentage those
member or head having training to
cope of other hazards or flood
disasters (Alam, 2017)
Vulnerability decreases with access of training
Average agricultural
livelihood diversification
index [as range (0.20-1)]
Inverse of agricultural numbers
livelihood activities +1 indicated by
households as households that farm
raises livestock and having off-farm
activities will having livelihood
diversification index =1/(3+1)=0.25
(Huong et al., 2018)
Higher the vulnerability as higher the agricultural diversification
index
Household percentage as
their member working in
various communities
Household percentage indicating as
one of family member who
participate outside community
(Alam, 2017)
Vulnerability decreases as working in various communities increases
Household percentage
have job opportunities in
flood season
Household percentage indicated
having job opportunities in flood
season
Vulnerability increases as unemployment increases
Household percentage
those fished in flood
season
Household percentage having
opportunities to engaging in fishing
in flood season (Alam, 2017)
Household vulnerability decreases as fishing increases
Social
demogra
phic
factors
Dependency ratio Population ratio less than 15 and
more than 65 years (Shah et al.,
2013)
Vulnerability increases as dependency decreases
Household average family
number members
In household family member
average number (Alam, 2017)
Vulnerability increases as higher number family members
Female headed percentage Household percentage headed by Vulnerability increases as female head scenario increases

33
female whether male away from
house almost 6 month as female
headed the household activities
(Hahn et al., 2009)
Household head
percentage those not
attended schooling
Household percentage those
indicated as no schooling (Adu et
al., 2018)
Vulnerability decreases as schooling increases
Literacy rate of
households
In household peoples percentage
those can write and read, dividing
literate members in total
membership households and
multiply 100 (Zuroec et al., 2017)
Vulnerability increases as higher household family members
Social
networks
Borrowing average ,
lending money ratio range
of (0.20-1)
Household money borrowing ratio
to household money lending in
previous month, if household
borrow money while no lend is
ration 2:1, or 2 whereas if not
borrow while lend money ratio 1:2
as 0.5 (Shah et al., 2013)
Vulnerability decreases as higher ratio
Households percentage
those focus govt
institutions for assistance
in last twelve months
Household percentage indicated as
they acquired local govt institutions
for assistance in last twelve months
(Hahn et al., 2009)
Vulnerability decreases as govt assistance to population increases
Household percentage
concerned organizations
of farmers
Household percentage indicated as
they concerned to organizations of
farmers (Alam et al., 2017)
Vulnerability decreases as increase farmers participation in farmers
organizations
Household percentage
concerned in political
organization scenario
Household percentage indicated as
concerned in political organization
(Alam et al., 2017)
Vulnerability decreases as participation of political organization
increases
Household percentage
concerned to social
organization scenario
Household percentage indicated
connected with social organization
(Alam et al., 2017)
Vulnerability decreases as household participation in social
organization increase
Sensitivity Food Insufficient food with
number of average month
in range (0-12)
Households struggle to find food
number of average month (Sujakhu
et al., 2019)
Higher vulnerability as higher number of month
Household percentage
acquire food primarily
from own farm
Household number get food from
their own farm (Shah et al., 2013)
Higher vulnerability as higher number of month
Index of diversifying
average crop range (0-1)
Household grown inverse number of
crops +1 as those household grow
Higher vulnerability as higher index

34
cassava, pumpkin, maize diversify
index =1/(3+1)-0.25 Alam, (2017)
In last three month
worried about insufficient
food
In last three month household
percentage worried about sufficient
food (Sarker et al., 2019)
Higher vulnerability higher percentage indices
Household percentage not
saving seed
Household percentage not saving
their own seed from every years
(Haha etal.,2009)
Higher vulnerability as higher the percentage
Household percentage
that not custom of house
stead gardening
Household percentage not practices
home stead gardening (Alam 2017)
Higher vulnerability as higher the percentage
Health Household percentage
access of treatment to
MBBS doctor
Household percentage generally
access of treatment to MBBS doctor
(Sujakhu et al., 2019)
Vulnerability decreases as qualified doctor treatment
Health facility access in
average (minute)
Household time in access health
facility to nearest hospital (Hahn et
al., 2009)
Vulnerability increases as time increases
Household percentage
those family members
having chronic illness
Household percentage those family
members having chronic illness
(Sarker et al., 2019)
Vulnerability increases in chronic disease issues
Household percentage
during illness access of
local doctor treatment
Household percentage during illness
access of local doctor treatment
(Sarker et al., 2019)
Vulnerability increase as local doctor treatment
Household percentage
sanitary latrine access
Household percentage having
sanitary latrine (Sujakhu er al.,
2019)
Vulnerability decreases as usage of sanitary latrine increases
Household percentage
with family members
those missed their work in
last two weeks due to
illness
Household percentage which
reported at least one family
members those missed their work in
last two weeks due to illness (Hahan
et al., 2009)
Vulnerability increases due to illness as work missed
Producti
on and
housing
means
Households percentage
without solid structure
houses
Percentage of households that do
not have solid structure houses
(Sarker et al., 2019)
Vulnerability increases as houses without solid structure
Household percentage
affected by floods
Household percentage indicated as
their houses affected due to flood
(Sarker et al., 2019)
Vulnerability increases as houses affected due to flood
Household percentage
without production means
Household percentage indicated as
no access to production means
(Sarker et al., 2019)
Vulnerability increases as household having no production means

35
Water Household percentage
indicating community
based water conflicts
Household percentage that
indicating having related
community based water conflicts
(Alam, 2017)
Higher vulnerability as higher conflicts in community
Household percentage
using unsafe or natural
water source
Household percentage indicated as
lake and water ponds as basic
sources of water access (Hahn et al.,
2009)
Higher vulnerability as drinking unsafe water
Average time in minutes
to access safe useable
water from sources
Household require time to access
water from primary source (Alam,
2017)
Vulnerability increases as time to access water increases
Household percentage
access easily water from
tubewell
Household percentage having their
own water sources (Sarker et al.,
2019)
Vulnerability decreases as own water sources increases
Exposure Climate
variabilit
y
In last 10 years, gradually
facing increasing summer
duration
Households percentage reported
increasing duration of summer in 10
years (Sarker et al., 2019)
Facing increasing vulnerability due to increasing duration in summer
In last 10 years, gradually
facing increasing winter
duration
Households percentage reported
increasing duration of winter in 10
years (Sarker et al., 2019)
Facing increasing vulnerability due to increasing duration in winter
In last 10 years, gradually
facing increasing winter
season rainfall
Households percentage reported
increasing winter season rainfall in
10 years (Sarker et al., 2019)
Facing increasing vulnerability due to increasing winter season
rainfall
In last 10 years, gradually
facing increasing
monsoon rainfall
Households percentage reported
increasing monsoon rainfall in 10
years (Sarker et al., 2019)
Facing increasing vulnerability due to increasing monsoon rainfall
In last 10 years, gradually
facing increasing rainfall
Households percentage reported
increasing rainfall in last 10 years
(Sarker et al., 2019)
Facing increasing vulnerability due to increasing heavy rainfall
In last 10 years, gradually
facing increasing
occurrence of hailstorm
Households percentage reported
increasing occurrence of hailstorm
in last 10 years (new)
Facing increasing vulnerability due to increasing occurrence of
hailstorm
In last 10 years, gradually
facing increasing
occurrence of riverbank
erosion
Households percentage reported
increasing occurrence of riverbank
erosion in last 10 years (Alam,
2017)
Facing increasing vulnerability due to increasing occurrence of
riverbank erosion
In last 10 years, gradually
facing increasing
temperature
Households percentage reported
increasing temperature in last 10
years (Alam, 2017)
Facing increasing vulnerability due to increasing temperature
In last 10 years, gradually Households percentage reported Facing increasing vulnerability due to increasing floodwater

36
facing increasing
floodwater
increasing floodwater in last 10
years (Alam, 2017)
Natural
disasters
In last 10 years, flood
events average number
Households reported total number
of floods (Alam,2017)
Higher flood numbers increased vulnerability
In last 10 years, drought
events average number
Households reported total drought
numbers (Alam, 2017)
Higher vulnerability due to higher drought
In last 10 years,
household respondents
percentage death and
injured due to flood
hazards
In last 10 years households reported
death or injuries due to flood
hazards (riverbank erosion,
hailstorms, floods, thunderstorms)
(Alam, 2017)
Households as higher as higher percentage of injuries
In last 10 years average
numbers embankment
was breached
In last 10 years households reported
number of riverbank embankment
was breached
Higher vulnerability as higher number embankment was breached
Household percentage
that not received warning
of natural disasters
(embankment breach,
hailstorms, flash floods)
Household reported the percentage
not received warning before hazards
(Alam, 2017)
Households higher the vulnerable the number of times not receiving
warning prior to hazards
The month average
number waterlogged land
Households reported number of
month land as water logged
Higher the vulnerability as higher number of month
635
636
637
638
639
640
641
642
643
644
645
646
647
648

37
Table 2 Three districts each sub-component livelihood vulnerability indices minimum, maximum and actual values 649
LVI major
components
LVI sub-components Measurem
ent unit
Muzaffargarh
district
Rahim Yar
Khan
district
Rajanpur
district
All districts
maximum
value
All districts
minimum
value
Adaptive capacity
Livelihood
strategy
Dependency on agriculture as major income source % 94 78 93 100 0
Non-farm activates of households affected by natural
disasters as floods
% 77 69 75 100 0
Household percentage those member or head having
opportunity of training to cope of other or flood
disasters
% 8 13 9 100 0
Agricultural livelihood average diversification index
as range (0.20-1)
1/liveliho
od
0.37 0.37 0.37 1 0.20
Household percentage as their member working in
various communities
% 32 28 31 100 0
Household percentage have job opportunities in flood
season
% 27 43 28 100 0
Household percentage those fishing in flood season % 39 37 38 100 0
Social
demographic
factors
Dependency ratio Ratio 0.59 0.34 0.58 3 0
Household average family number members Count 7.8 6.3 7.2 26 0
Female headed percentage % 9 5 7 100 0
Household head percentage those not attended
schooling
% 89 78 86 100 0
Literacy rate of households % 29.6 34.1 30.04 100 0
Social
networks
Borrowing average , lending money ratio range of
(0.5-2)
Ratio 1..43 1.51 1.45 2 0.50
Households percentage those focus govt institutions
for assistance in last twelve months
% 67 59 63 100 0
Household percentage concerned organizations of
farmers
% 27 36 28 100 0
Household percentage concerned in political
organization scenario
% 34 47 35 100 0
Household percentage concerned to social
organization scenario
% 13 25 14 100 0
Sensitivity
Food Insufficient food with number of average month in
range (0-12)
Months 3.4 2.3 3.1 12 0
Household percentage acquire food primarily from
own farm
% 91 83 89 100 0

38
Index of diversifying average crop range (0-1) 1/crops 0.48 0.48 0.48 1 0
In last three month worried about insufficient food % 89 78 83 100 0
Household percentage not saving seed % 28 19 27 100 0
Household percentage that not custom of house stead
gardening
% 25 16 21 100 0
Health Household percentage access of treatment to MBBS
doctor
% 57 49 44 100 0
Health facility access in average (minute) Minutes 178.91 154.01 169.87 450 0
Household percentage those family members having
chronic illness
% 21 12 19 100 0
Household percentage during illness access of local
doctor treatment
% 96 81 93 100 0
Household percentage sanitary latrine access % 43 31 39 100 0
Household percentage with family members those
missed their work in last two weeks due to illness
% 19 12 16 100 0
Production
and housing
means
Households percentage without solid structure houses % 92 76 89 100 0
Household percentage affected by floods % 95 87 94 100 0
Household percentage without production means % 41 32 38 100 0
Water Household percentage indicating community based
water conflicts
% 27 19 24 100 0
Household percentage using unsafe or natural water
source
% 31 23 28 100 0
Average time in minutes to access safe useable water
from sources
Minutes 5.7 3.8 4.9 18 0
Household percentage access easily water from
tubewell
% 68 66 67 100 0
Exposure
Climate
variability
In last 10 years, gradually facing increasing summer
duration
% 89 84 86 100 0
In last 10 years, gradually facing increasing winter
duration
% 5 6 7 100 0
In last 10 years, gradually facing increasing winter
season rainfall
% 43 38 37 100 0
In last 10 years, gradually facing increasing monsoon
rainfall
% 71 68 69 100 0
In last 10 years, gradually facing increasing rainfall % 83 76 77 100 0
In last 10 years, gradually facing increasing
occurrence of hailstorm
% 47 43 40 100 0
In last 10 years, gradually facing increasing % 68 65 66 100 0

39
occurrence of riverbank erosion
In last 10 years, gradually facing increasing
temperature
% 88 81 83 100 0
In last 10 years, gradually facing increasing
floodwater
% 78 75 77 100 0
Natural
disasters
In last 10 years, flood events average number Count 4.9 4.7 4.6 6 0
In last 10 years, drought events average number Count 1.2 1 1.1 2 0
In last 10 years, household respondents percentage
death and injured due to flood hazards
% 13 8 11 100 0
In last 10 years average numbers embankment was
breached
Count 3.2 2.1 2.7 5 0
Household percentage that not received warning of
natural disasters (embankment breach, hailstorms,
flash floods)
% 37 19 29 100 0
The month average number waterlogged land Months 5.4 4.1 4.9 12 0
650
651
652
653
654
655
656
657
658
659
660
661

40
Table 3 Normalized sub-components and major components Livelihood Vulnerability indices (LVI) 662
Major
components
Muzaffargar
h district
Rahim
Yar Khan
district
Rajanpur
district Sub-components Muzaffa
rgarh
district
Rahim
Yar Khan
district
Rajanpur
district
Adaptive
capacity
Livelihood
strategy
0.403 0.419 0.427 Dependency on agriculture as major income source 0.940 0.780 0.930
Non-farm activates of households affected by natural disasters
as floods
0.770 0.690 0.750
Household percentage those member or head having
opportunity of training to cope of other or flood disasters
0.080 0.130 0.090
Agricultural livelihood average diversification index as range
(0.20-1)
0.254 0.254 0.252
Household percentage as their member working in various
communities
0.320 0.280 0.310
Household percentage have job opportunities in flood season 0.270 0.430 0.280
Household percentage those fishing in flood season 0.190 0.370 0.380
Social
demographic
factors
0.158 0.176 0.174 Dependency ratio 0.196 0.113 0.193
Household average family number members 0.198 0.154 0.167
Female headed percentage 0.090 0.050 0.070
Household head percentage those not attended schooling 0.110 0.220 0.140
Literacy rate of households 0.196 0.341 0.300
Social networks 0.424 0.491 0.429 Borrowing average , lending money ratio range of (0.5-2) 0.712 0.789 0.745
Households percentage those focus govt institutions for
assistance in last twelve months
0.670 0.590 0.630
Household percentage concerned organizations of farmers 0.270 0.360 0.280
Household percentage concerned in political organization
scenario
0.340 0.470 0.350
Household percentage concerned to social organization
scenario
0.130 0.250 0.140
Sensitivity Food 0.515 0.438 0.490 Insufficient food with number of average month in range (0-
12)
0.283 0.191 0.258
Household percentage acquire food primarily from own farm 0.910 0.830 0.890
Index of diversifying average crop range (0-1) 0.480 0.480 0.480
In last three month worried about insufficient food 0.890 0.780 0.830
Household percentage not saving seed 0.280 0.190 0.270
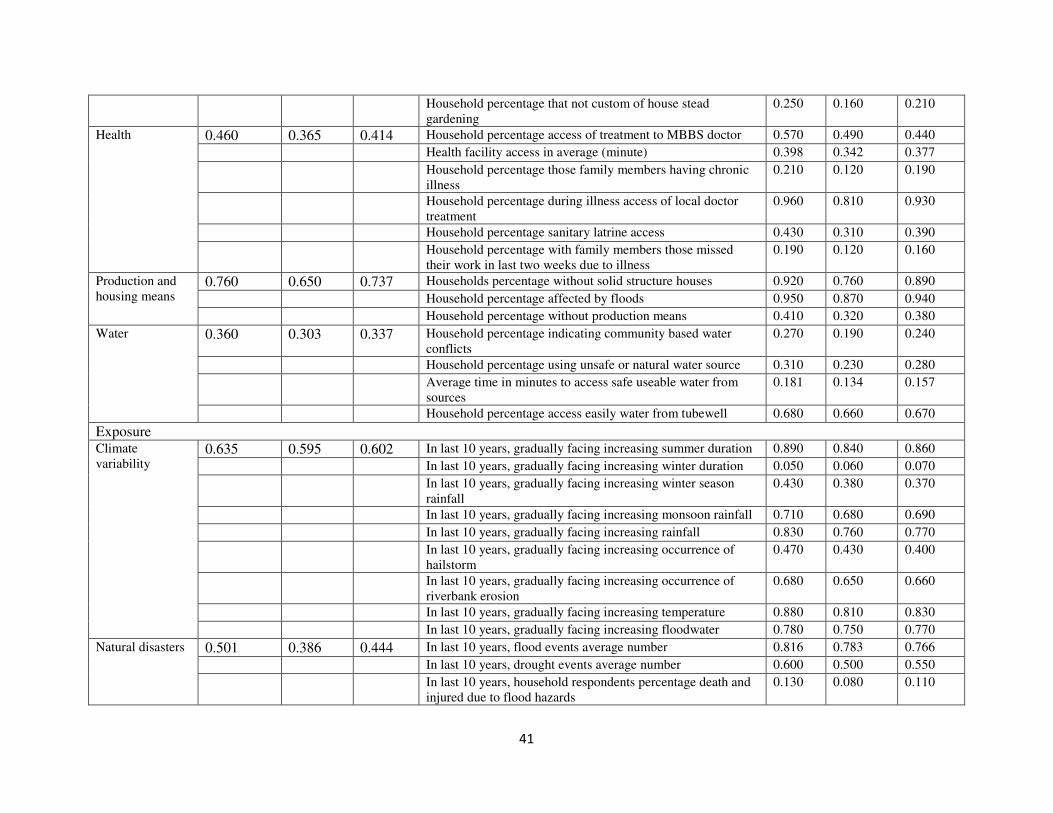
41
Household percentage that not custom of house stead
gardening
0.250 0.160 0.210
Health 0.460 0.365 0.414 Household percentage access of treatment to MBBS doctor 0.570 0.490 0.440
Health facility access in average (minute) 0.398 0.342 0.377
Household percentage those family members having chronic
illness
0.210 0.120 0.190
Household percentage during illness access of local doctor
treatment
0.960 0.810 0.930
Household percentage sanitary latrine access 0.430 0.310 0.390
Household percentage with family members those missed
their work in last two weeks due to illness
0.190 0.120 0.160
Production and
housing means 0.760 0.650 0.737 Households percentage without solid structure houses 0.920 0.760 0.890
Household percentage affected by floods 0.950 0.870 0.940
Household percentage without production means 0.410 0.320 0.380
Water 0.360 0.303 0.337 Household percentage indicating community based water
conflicts
0.270 0.190 0.240
Household percentage using unsafe or natural water source 0.310 0.230 0.280
Average time in minutes to access safe useable water from
sources
0.181 0.134 0.157
Household percentage access easily water from tubewell 0.680 0.660 0.670
Exposure
Climate
variability 0.635 0.595 0.602 In last 10 years, gradually facing increasing summer duration 0.890 0.840 0.860
In last 10 years, gradually facing increasing winter duration 0.050 0.060 0.070
In last 10 years, gradually facing increasing winter season
rainfall
0.430 0.380 0.370
In last 10 years, gradually facing increasing monsoon rainfall 0.710 0.680 0.690
In last 10 years, gradually facing increasing rainfall 0.830 0.760 0.770
In last 10 years, gradually facing increasing occurrence of
hailstorm
0.470 0.430 0.400
In last 10 years, gradually facing increasing occurrence of
riverbank erosion
0.680 0.650 0.660
In last 10 years, gradually facing increasing temperature 0.880 0.810 0.830
In last 10 years, gradually facing increasing floodwater 0.780 0.750 0.770
Natural disasters 0.501 0.386 0.444 In last 10 years, flood events average number 0.816 0.783 0.766
In last 10 years, drought events average number 0.600 0.500 0.550
In last 10 years, household respondents percentage death and
injured due to flood hazards
0.130 0.080 0.110
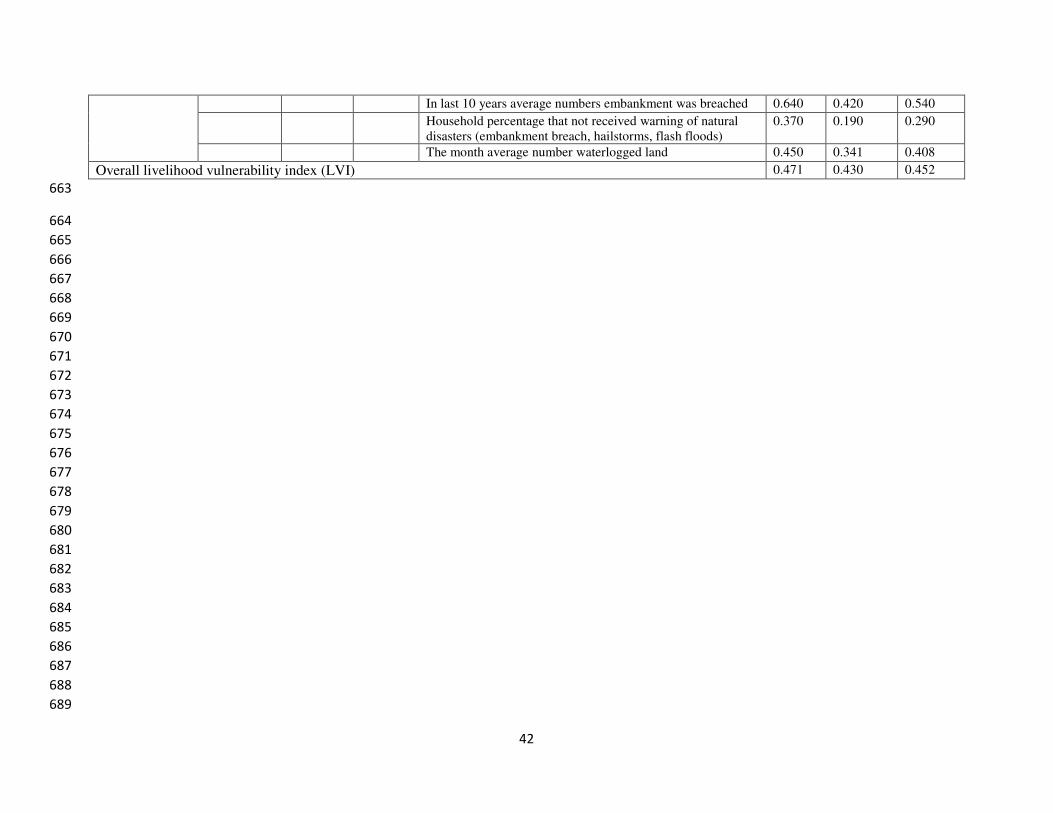
42
In last 10 years average numbers embankment was breached 0.640 0.420 0.540
Household percentage that not received warning of natural
disasters (embankment breach, hailstorms, flash floods)
0.370 0.190 0.290
The month average number waterlogged land 0.450 0.341 0.408
Overall livelihood vulnerability index (LVI) 0.471 0.430 0.452
663
664
665
666
667
668
669
670
671
672
673
674
675
676
677
678
679
680
681
682
683
684
685
686
687
688
689

43
Table 4 Livelihood vulnerability index with contributing IPCC factors 690
Contributing
factors of IPCC
Values of contributing factors IPCC Major
components
Values of major components
Muzaffargarh
district
Rahim Yar Khan
district
Rajanpur district Muzaffargarh
district
Rahim Yar Khan
district
Rajanpur district
Adaptive
capacity
0.328 0.362 0.343 Livelihood
strategy
0.403 0.419 0.427
Social
demographic
factors
0.158 0.176 0.174
Social networks 0.424 0.491 0.429
Sensitivity 0.524 0.439 0.495 Food 0.515 0.438 0.490
Health 0.460 0.365 0.414
Production and
housing means
0.760 0.650 0.737
Water 0.360 0.303 0.337
Exposure 0.568 0.491 0.523 Climate
variability
0.635 0.595 0.602
Natural disasters 0.501 0.386 0.444
Livelihood vulnerability index of IPCC (LVI-IPCC) 0.087 0.038 0.079
691
692
693
694
695
696
697
698
699
700
701
702
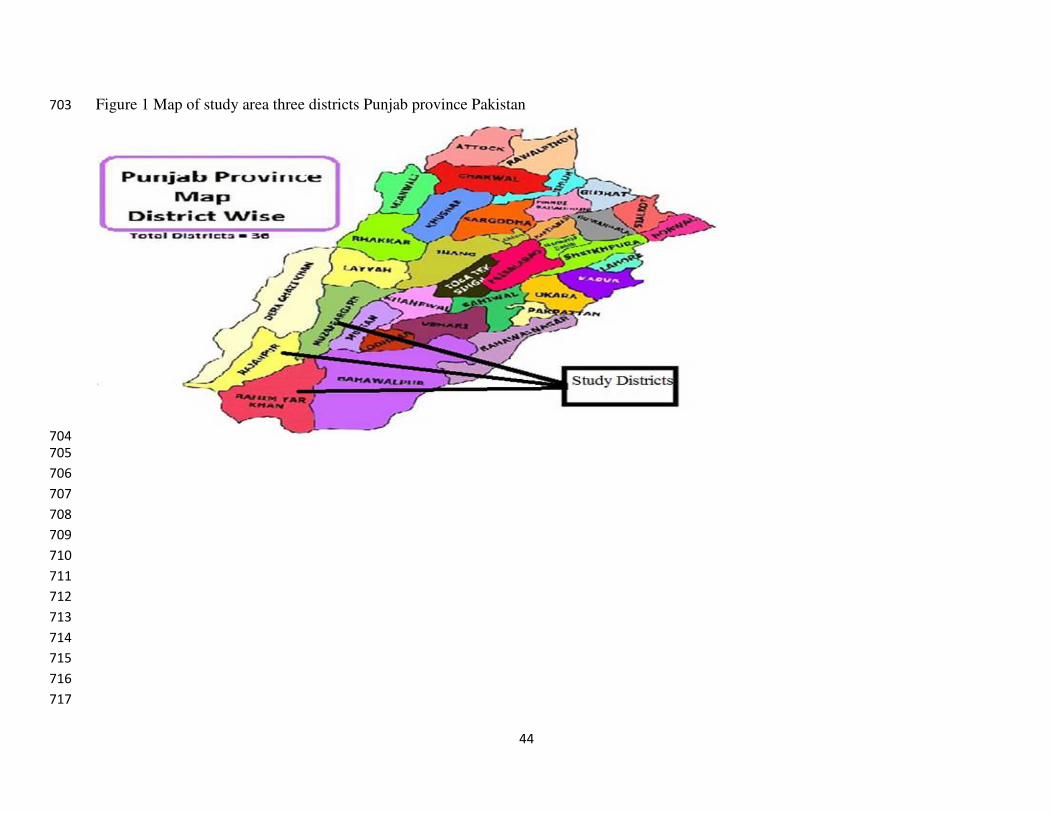
44
Figure 1 Map of study area three districts Punjab province Pakistan 703
704
705
706
707
708
709
710
711
712
713
714
715
716
717

45
Figure 2 Map of three study districts Muzaffargarh, Rahim Yar Khan and Rajanpur showing surrounding rivers 718
719
720
721
722
723
724
725
726
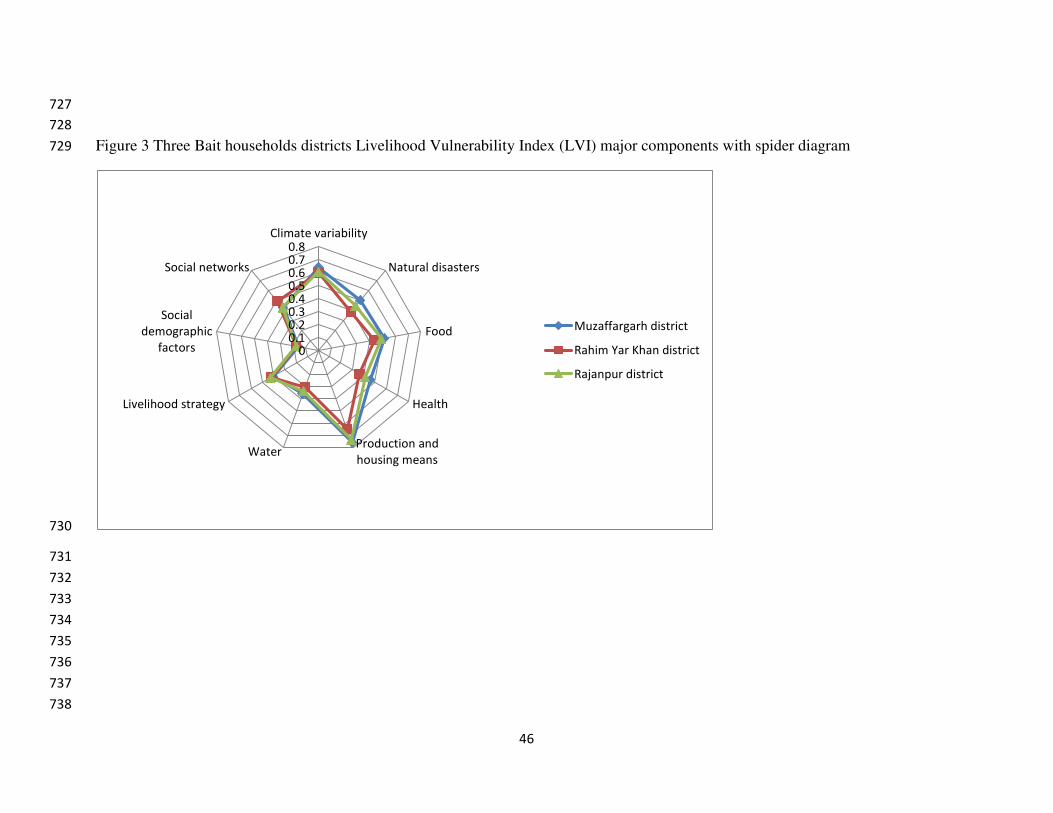
46
727
728
Figure 3 Three Bait households districts Livelihood Vulnerability Index (LVI) major components with spider diagram 729
730
731
732
733
734
735
736
737
738
00.10.20.30.40.50.60.70.8
Climate variability
Natural disasters
Food
Health
Production and
housing meansWater
Livelihood strategy
Social
demographic
factors
Social networks
Muzaffargarh district
Rahim Yar Khan district
Rajanpur district

47
739
740
Figure 4 Three districts Bait community vulnerability LVI-IPCC scores in triangle diagram 741
742
743
744
0
0.1
0.2
0.3
0.4
0.5
0.6Exposure
SensitivityAdaptive capacity
Muzaffargarh district
Rahim Yar Khan district
Rajanpur district