Water Quality Assessment and Pollution Source Identification ...
15
sustainability Article Water Quality Assessment and Pollution Source Identification of the Eastern Poyang Lake Basin Using Multivariate Statistical Methods Weili Duan 1, *, Bin He 1, *, Daniel Nover 2 , Guishan Yang 1 , Wen Chen 1 , Huifang Meng 1 , Shan Zou 3 and Chuanming Liu 4 1 Key Laboratory of Watershed Geographic Sciences, Nanjing Institute of Geography and Limnology, Chinese Academy of Sciences, Nanjing 210008, China; [email protected] (G.Y.); [email protected] (W.C.); [email protected] (H.M.) 2 AAAS Science and Technology Policy Fellow, U.S. Agency for International Development, Accra, Ghana; [email protected] 3 Institute of Agricultural Economics and Development, The Chinese Academy of Agricultural Sciences, Beijing 100081, China; [email protected] 4 Jiangsu Collaborative Innovation Center of Regional Modern Agriculture & Environmental Protection, Huaiyin Normal University, Huai’an 223300, China; [email protected] * Correspondence: [email protected] (W.D.); [email protected] (B.H.); Tel.: +86-25-8688-2173 (W.D.) Academic Editor: Vincenzo Torretta Received: 2 November 2015; Accepted: 19 January 2016; Published: 30 January 2016 Abstract: Multivariate statistical methods including cluster analysis (CA), discriminant analysis (DA) and component analysis/factor analysis (PCA/FA), were applied to explore the surface water quality datasets including 14 parameters at 28 sites of the Eastern Poyang Lake Basin, Jiangxi Province of China, from January 2012 to April 2015, characterize spatiotemporal variation in pollution and identify potential pollution sources. The 28 sampling stations were divided into two periods (wet season and dry season) and two regions (low pollution and high pollution), respectively, using hierarchical CA method. Four parameters (temperature, pH, ammonia-nitrogen (NH 4 -N), and total nitrogen (TN)) were identified using DA to distinguish temporal groups with close to 97.86% correct assignations. Again using DA, five parameters (pH, chemical oxygen demand (COD), TN, Fluoride (F), and Sulphide (S)) led to 93.75% correct assignations for distinguishing spatial groups. Five potential pollution sources including nutrients pollution, oxygen consuming organic pollution, fluorine chemical pollution, heavy metals pollution and natural pollution, were identified using PCA/FA techniques for both the low pollution region and the high pollution region. Heavy metals (Cuprum (Cu), chromium (Cr) and Zinc (Zn)), fluoride and sulfide are of particular concern in the study region because of many open-pit copper mines such as Dexing Copper Mine. Results obtained from this study offer a reasonable classification scheme for low-cost monitoring networks. The results also inform understanding of spatio-temporal variation in water quality as these topics relate to water resources management. Keywords: water pollution; spatio-temporal variation; pollution source identification; Eastern Poyang Lake Basin 1. Introduction Water scarcity is a growing threat to economic and social development and widespread water pollution in recent decades further complicates the threat, especially in developing countries [1–3]. Water pollution caused both by anthropogenic activities such as urbanization [4], industrial accidents [5–7], dam construction [8], and natural phenomena like soil erosion [9] and climate Sustainability 2016, 8, 133; doi:10.3390/su8020133 www.mdpi.com/journal/sustainability
-
Upload
khangminh22 -
Category
Documents
-
view
1 -
download
0
Transcript of Water Quality Assessment and Pollution Source Identification ...
sustainability
Article
Water Quality Assessment and Pollution SourceIdentification of the Eastern Poyang Lake BasinUsing Multivariate Statistical Methods
Weili Duan 1,*, Bin He 1,*, Daniel Nover 2, Guishan Yang 1, Wen Chen 1, Huifang Meng 1,Shan Zou 3 and Chuanming Liu 4
1 Key Laboratory of Watershed Geographic Sciences, Nanjing Institute of Geography and Limnology,Chinese Academy of Sciences, Nanjing 210008, China; [email protected] (G.Y.);[email protected] (W.C.); [email protected] (H.M.)
2 AAAS Science and Technology Policy Fellow, U.S. Agency for International Development, Accra, Ghana;[email protected]
3 Institute of Agricultural Economics and Development, The Chinese Academy of Agricultural Sciences,Beijing 100081, China; [email protected]
4 Jiangsu Collaborative Innovation Center of Regional Modern Agriculture & Environmental Protection,Huaiyin Normal University, Huai’an 223300, China; [email protected]
* Correspondence: [email protected] (W.D.); [email protected] (B.H.); Tel.: +86-25-8688-2173 (W.D.)
Academic Editor: Vincenzo TorrettaReceived: 2 November 2015; Accepted: 19 January 2016; Published: 30 January 2016
Abstract: Multivariate statistical methods including cluster analysis (CA), discriminant analysis (DA)and component analysis/factor analysis (PCA/FA), were applied to explore the surface water qualitydatasets including 14 parameters at 28 sites of the Eastern Poyang Lake Basin, Jiangxi Provinceof China, from January 2012 to April 2015, characterize spatiotemporal variation in pollution andidentify potential pollution sources. The 28 sampling stations were divided into two periods (wetseason and dry season) and two regions (low pollution and high pollution), respectively, usinghierarchical CA method. Four parameters (temperature, pH, ammonia-nitrogen (NH4-N), andtotal nitrogen (TN)) were identified using DA to distinguish temporal groups with close to 97.86%correct assignations. Again using DA, five parameters (pH, chemical oxygen demand (COD), TN,Fluoride (F), and Sulphide (S)) led to 93.75% correct assignations for distinguishing spatial groups.Five potential pollution sources including nutrients pollution, oxygen consuming organic pollution,fluorine chemical pollution, heavy metals pollution and natural pollution, were identified usingPCA/FA techniques for both the low pollution region and the high pollution region. Heavy metals(Cuprum (Cu), chromium (Cr) and Zinc (Zn)), fluoride and sulfide are of particular concern in thestudy region because of many open-pit copper mines such as Dexing Copper Mine. Results obtainedfrom this study offer a reasonable classification scheme for low-cost monitoring networks. The resultsalso inform understanding of spatio-temporal variation in water quality as these topics relate to waterresources management.
Keywords: water pollution; spatio-temporal variation; pollution source identification; EasternPoyang Lake Basin
1. Introduction
Water scarcity is a growing threat to economic and social development and widespread waterpollution in recent decades further complicates the threat, especially in developing countries [1–3].Water pollution caused both by anthropogenic activities such as urbanization [4], industrialaccidents [5–7], dam construction [8], and natural phenomena like soil erosion [9] and climate
Sustainability 2016, 8, 133; doi:10.3390/su8020133 www.mdpi.com/journal/sustainability
Sustainability 2016, 8, 133 2 of 15
change [10], is a global issue that increases pressures on freshwater resources. Declining waterquality is the result of spatio-temporal changes in sedimentation, temperature, pH, nutrients, heavymetals, toxic organic compounds and pesticides, and so on[11]. In order to safeguard water qualityand alleviate the pressures on water resources, it is necessary to elaborate spatial-temporal changes inregional water quality and identify the potential pollution sources.
A series of monitoring programs and protocols have been developed to enable a reliablequantification of nutrient transport in the aquatic environment (e.g., the National Land withWater Information in Japan [12,13], the National Monitoring and Assessment Program (NOVA) inDenmark [14,15], the Harmonized Monitoring Scheme (HMS) in Britain [16,17], and the NationalWater-Quality Assessment (NAWQA) in the United States [18,19]) to generate a more comprehensivepicture of water quality conditions and trends. Meanwhile, sophisticated data-driven analyticalapproaches (e.g., the projection pursuit technique [20] and neural networks [21,22]), multivariatestatistical techniques [23] (e.g., discriminant analysis (DA), cluster analysis (CA) and principalcomponent analysis/factor analysis (PCA/FA)), fuzzy theory[24] and hydrological models [11,25–27]have substantially improved water quality assessments. Among these methods, multivariate statisticaltechniques including CA, PCA/FA, and DA can be applied to easily extract important informationin large water quality datasets and are therefore used widely to evaluate water quality and identifypotential pollution sources [28].
In some regions in China, water quality impairment is severe, with important consequences forhuman health as well as sustainable economic and social development [29]. From 2004, the StateMinistry of Environmental Protection started to focus on surface water quality monitoring systems inthe main river basins, including the Yellow River Basin, the Yangtze River Basin, the Pearl River Basin,the Lake Taihu Basin, the Songhua River Basin, and the Southeastern Coastal Rivers. Meanwhile, localenvironmental administrations including national, provincial, prefectural (city), and local have beenestablished to monitor and report on local surface water quality in recent years. As a consequence,a huge monitoring database, including nutrients, sediment, physical and chemical properties, toxicorganic compounds and pesticides, heavy metals, etc. has been built for regional water resourcesmanagement. However, lake water environment is still deteriorating. For example, Poyang Lake, thelargest freshwater lake (3050 km2) in China, is polluted and most pollutants originated from five riversincluding the Gan River, the Fu River, the Xin River, the Rao River, and the Xiu River. Therefore, it isnecessary to investigate current situation of water pollution and identify pollution sources in riversaround the Poyang Lake. Moreover, the application of CA and PCA/FA in the Poyang Lake Basinis rare.
Therefore, several multivariate statistical approaches (DA, CA and PCA/FA) are applied to (1)illuminate temporal and spatial variations of water quality; and (2) identify the potential influencingfactors that explain changes in water quality parameters of the Eastern Poyang Lake Basin. All resultsobtained from this study will can offer a reasonable classification scheme for low-cost monitoringnetworks and also inform understanding of spatio-temporal variation in water quality as these topicsrelate to water resources research and management.
2. Materials and Methods
2.1. Study Area
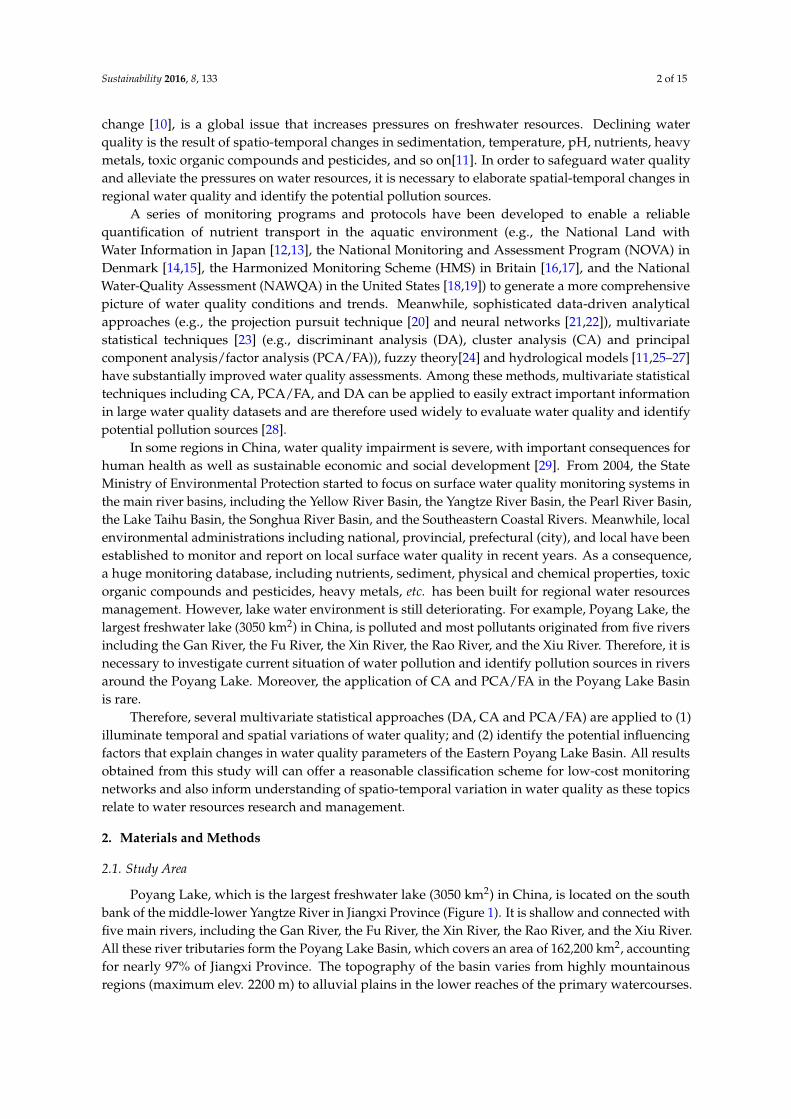
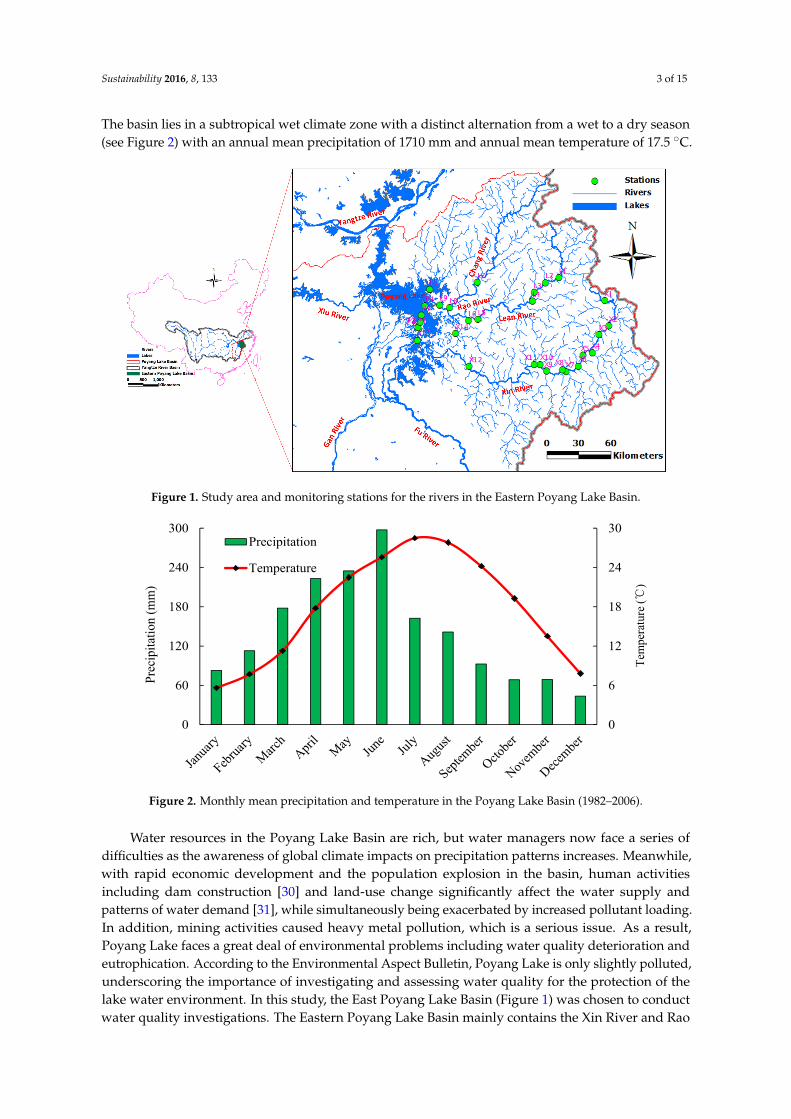
Poyang Lake, which is the largest freshwater lake (3050 km2) in China, is located on the southbank of the middle-lower Yangtze River in Jiangxi Province (Figure 1). It is shallow and connected withfive main rivers, including the Gan River, the Fu River, the Xin River, the Rao River, and the Xiu River.All these river tributaries form the Poyang Lake Basin, which covers an area of 162,200 km2, accountingfor nearly 97% of Jiangxi Province. The topography of the basin varies from highly mountainousregions (maximum elev. 2200 m) to alluvial plains in the lower reaches of the primary watercourses.
Sustainability 2016, 8, 133 3 of 15
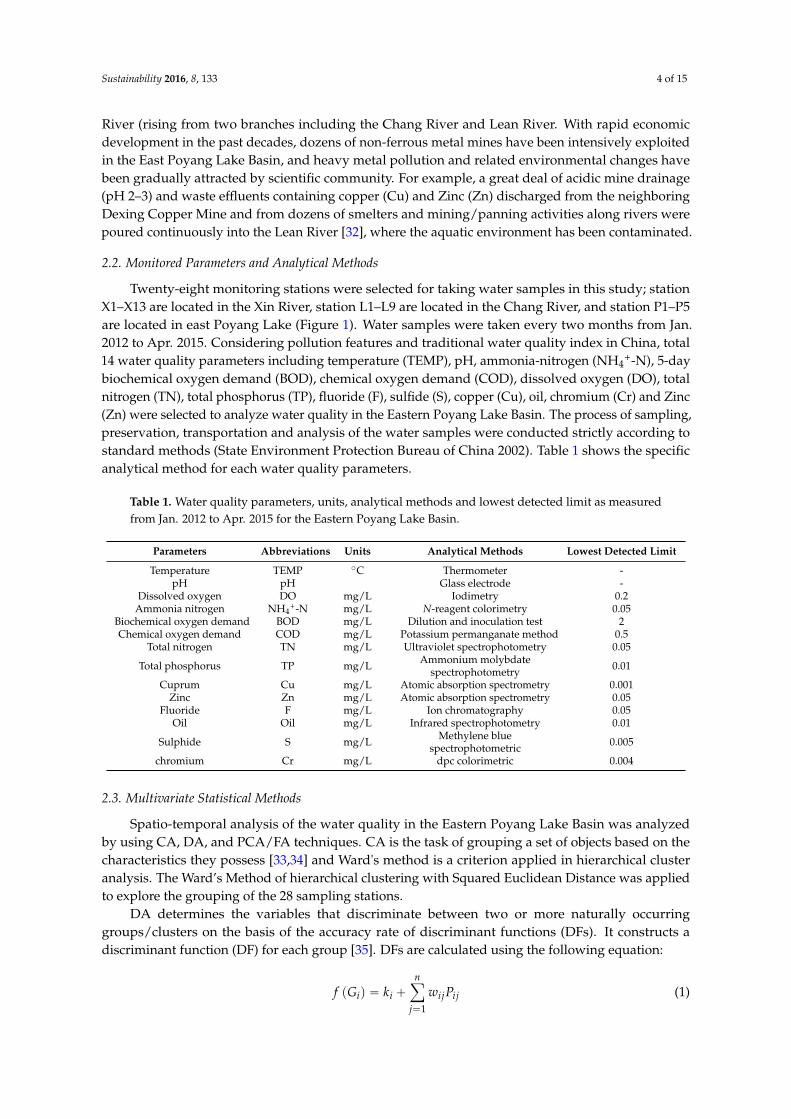
The basin lies in a subtropical wet climate zone with a distinct alternation from a wet to a dry season(see Figure 2) with an annual mean precipitation of 1710 mm and annual mean temperature of 17.5 ˝C.Sustainability 2016, 8, 133 3 of 15
Figure 1. Study area and monitoring stations for the rivers in the Eastern Poyang Lake Basin.
Figure 2. Monthly mean precipitation and temperature in the Poyang Lake Basin (1982–2006).
Water resources in the Poyang Lake Basin are rich, but water managers now face a series of
difficulties as the awareness of global climate impacts on precipitation patterns increases. Meanwhile,
with rapid economic development and the population explosion in the basin, human activities
including dam construction [30] and land‐use change significantly affect the water supply and
patterns of water demand [31], while simultaneously being exacerbated by increased pollutant
loading. In addition, mining activities caused heavy metal pollution, which is a serious issue. As a
result, Poyang Lake faces a great deal of environmental problems including water quality deterioration
and eutrophication. According to the Environmental Aspect Bulletin, Poyang Lake is only slightly
polluted, underscoring the importance of investigating and assessing water quality for the protection
of the lake water environment. In this study, the East Poyang Lake Basin (Figure 1) was chosen to
conduct water quality investigations. The Eastern Poyang Lake Basin mainly contains the Xin River
and Rao River (rising from two branches including the Chang River and Lean River. With rapid
economic development in the past decades, dozens of non‐ferrous metal mines have been intensively
exploited in the East Poyang Lake Basin, and heavy metal pollution and related environmental
0
6
12
18
24
30
0
60
120
180
240
300
Tem
pera
ture
(℃)
Prec
ipita
tion
(mm
)
Precipitation
Temperature
Figure 1. Study area and monitoring stations for the rivers in the Eastern Poyang Lake Basin.
Sustainability 2016, 8, 133 3 of 15
Figure 1. Study area and monitoring stations for the rivers in the Eastern Poyang Lake Basin.
Figure 2. Monthly mean precipitation and temperature in the Poyang Lake Basin (1982–2006).
Water resources in the Poyang Lake Basin are rich, but water managers now face a series of
difficulties as the awareness of global climate impacts on precipitation patterns increases. Meanwhile,
with rapid economic development and the population explosion in the basin, human activities
including dam construction [30] and land‐use change significantly affect the water supply and
patterns of water demand [31], while simultaneously being exacerbated by increased pollutant
loading. In addition, mining activities caused heavy metal pollution, which is a serious issue. As a
result, Poyang Lake faces a great deal of environmental problems including water quality deterioration
and eutrophication. According to the Environmental Aspect Bulletin, Poyang Lake is only slightly
polluted, underscoring the importance of investigating and assessing water quality for the protection
of the lake water environment. In this study, the East Poyang Lake Basin (Figure 1) was chosen to
conduct water quality investigations. The Eastern Poyang Lake Basin mainly contains the Xin River
and Rao River (rising from two branches including the Chang River and Lean River. With rapid
economic development in the past decades, dozens of non‐ferrous metal mines have been intensively
exploited in the East Poyang Lake Basin, and heavy metal pollution and related environmental
0
6
12
18
24
30
0
60
120
180
240
300
Tem
pera
ture
(℃)
Prec
ipita
tion
(mm
)
Precipitation
Temperature
Figure 2. Monthly mean precipitation and temperature in the Poyang Lake Basin (1982–2006).
Water resources in the Poyang Lake Basin are rich, but water managers now face a series ofdifficulties as the awareness of global climate impacts on precipitation patterns increases. Meanwhile,with rapid economic development and the population explosion in the basin, human activitiesincluding dam construction [30] and land-use change significantly affect the water supply andpatterns of water demand [31], while simultaneously being exacerbated by increased pollutant loading.In addition, mining activities caused heavy metal pollution, which is a serious issue. As a result,Poyang Lake faces a great deal of environmental problems including water quality deterioration andeutrophication. According to the Environmental Aspect Bulletin, Poyang Lake is only slightly polluted,underscoring the importance of investigating and assessing water quality for the protection of thelake water environment. In this study, the East Poyang Lake Basin (Figure 1) was chosen to conductwater quality investigations. The Eastern Poyang Lake Basin mainly contains the Xin River and Rao
Sustainability 2016, 8, 133 4 of 15
River (rising from two branches including the Chang River and Lean River. With rapid economicdevelopment in the past decades, dozens of non-ferrous metal mines have been intensively exploitedin the East Poyang Lake Basin, and heavy metal pollution and related environmental changes havebeen gradually attracted by scientific community. For example, a great deal of acidic mine drainage(pH 2–3) and waste effluents containing copper (Cu) and Zinc (Zn) discharged from the neighboringDexing Copper Mine and from dozens of smelters and mining/panning activities along rivers werepoured continuously into the Lean River [32], where the aquatic environment has been contaminated.
2.2. Monitored Parameters and Analytical Methods
Twenty-eight monitoring stations were selected for taking water samples in this study; stationX1–X13 are located in the Xin River, station L1–L9 are located in the Chang River, and station P1–P5are located in east Poyang Lake (Figure 1). Water samples were taken every two months from Jan.2012 to Apr. 2015. Considering pollution features and traditional water quality index in China, total14 water quality parameters including temperature (TEMP), pH, ammonia-nitrogen (NH4
+-N), 5-daybiochemical oxygen demand (BOD), chemical oxygen demand (COD), dissolved oxygen (DO), totalnitrogen (TN), total phosphorus (TP), fluoride (F), sulfide (S), copper (Cu), oil, chromium (Cr) and Zinc(Zn) were selected to analyze water quality in the Eastern Poyang Lake Basin. The process of sampling,preservation, transportation and analysis of the water samples were conducted strictly according tostandard methods (State Environment Protection Bureau of China 2002). Table 1 shows the specificanalytical method for each water quality parameters.
Table 1. Water quality parameters, units, analytical methods and lowest detected limit as measuredfrom Jan. 2012 to Apr. 2015 for the Eastern Poyang Lake Basin.
Parameters Abbreviations Units Analytical Methods Lowest Detected Limit
Temperature TEMP ˝C Thermometer -pH pH Glass electrode -
Dissolved oxygen DO mg/L Iodimetry 0.2Ammonia nitrogen NH4
+-N mg/L N-reagent colorimetry 0.05Biochemical oxygen demand BOD mg/L Dilution and inoculation test 2Chemical oxygen demand COD mg/L Potassium permanganate method 0.5
Total nitrogen TN mg/L Ultraviolet spectrophotometry 0.05
Total phosphorus TP mg/L Ammonium molybdatespectrophotometry 0.01
Cuprum Cu mg/L Atomic absorption spectrometry 0.001Zinc Zn mg/L Atomic absorption spectrometry 0.05
Fluoride F mg/L Ion chromatography 0.05Oil Oil mg/L Infrared spectrophotometry 0.01
Sulphide S mg/L Methylene bluespectrophotometric 0.005
chromium Cr mg/L dpc colorimetric 0.004
2.3. Multivariate Statistical Methods
Spatio-temporal analysis of the water quality in the Eastern Poyang Lake Basin was analyzedby using CA, DA, and PCA/FA techniques. CA is the task of grouping a set of objects based on thecharacteristics they possess [33,34] and Ward's method is a criterion applied in hierarchical clusteranalysis. The Ward’s Method of hierarchical clustering with Squared Euclidean Distance was appliedto explore the grouping of the 28 sampling stations.
DA determines the variables that discriminate between two or more naturally occurringgroups/clusters on the basis of the accuracy rate of discriminant functions (DFs). It constructs adiscriminant function (DF) for each group [35]. DFs are calculated using the following equation:
f pGiq “ ki `
nÿ
j“1
wijPij (1)
Sustainability 2016, 8, 133 5 of 15
where i represents the number of groups pGq, ki represents the constant inherent to each group,n represents the number of parameters, and wij represents the weight coefficient assigned by DFanalysis (DFA) to a given parameter (Pij).
DA was employed to calculate the mean of a variable to predict group membership. The standard,forward stepwise, and backward stepwise modes of DA were used to calculate DFs in two groupsgenerated from CA to describe spatial variations in river water quality.
PCA is a dimensionality reduction technique that helps to simplify the data and make it easierto visualize by finding a set of principal components (PCs) [36,37]. PCs are orthogonal variablescalculated by multiplying the original correlated variables with a list of coefficients, which can bedescribed as
zij “ ai1x1j ` ai2x2j ` . . .` aimxmj (2)
where z represents the component score, a represents the component loading, x represents the measuredvalue of the variable, i represents the component number, j represents the sample number, and mrepresents the total number of variables.
FA was used to extract a lower dimensional linear structure from a set of data and thenfore providea powerful means for detecting similarities among samples [38]. FA can reduce the contribution of lesssignificant variables obtained from PCA and the new group of variables known as varifactors (VFs) isextracted through rotating the axis defined by PCA. The basic concept of FA is described as
zij “ a f 1 f1j ` a f 2 f21 ` . . .` a f m fmi ` e f i (3)
where z represents the measured value of a variable, a represents the factor loading, f representsthe factor score, e represents the residual term accounting for errors or other sources of variation,i represents the number of sample, j represents the number of variable, and m represents the totalnumber of factors.
Here, PCA/FA was applied to the normalized log-transformed data sets (14 variables) separatelyfor the two different spatial regions (low pollution region and high pollution region) as delineated bythe CA technique.
3. Results and Discussion
3.1. Temporal/Spatial Similarity and Grouping
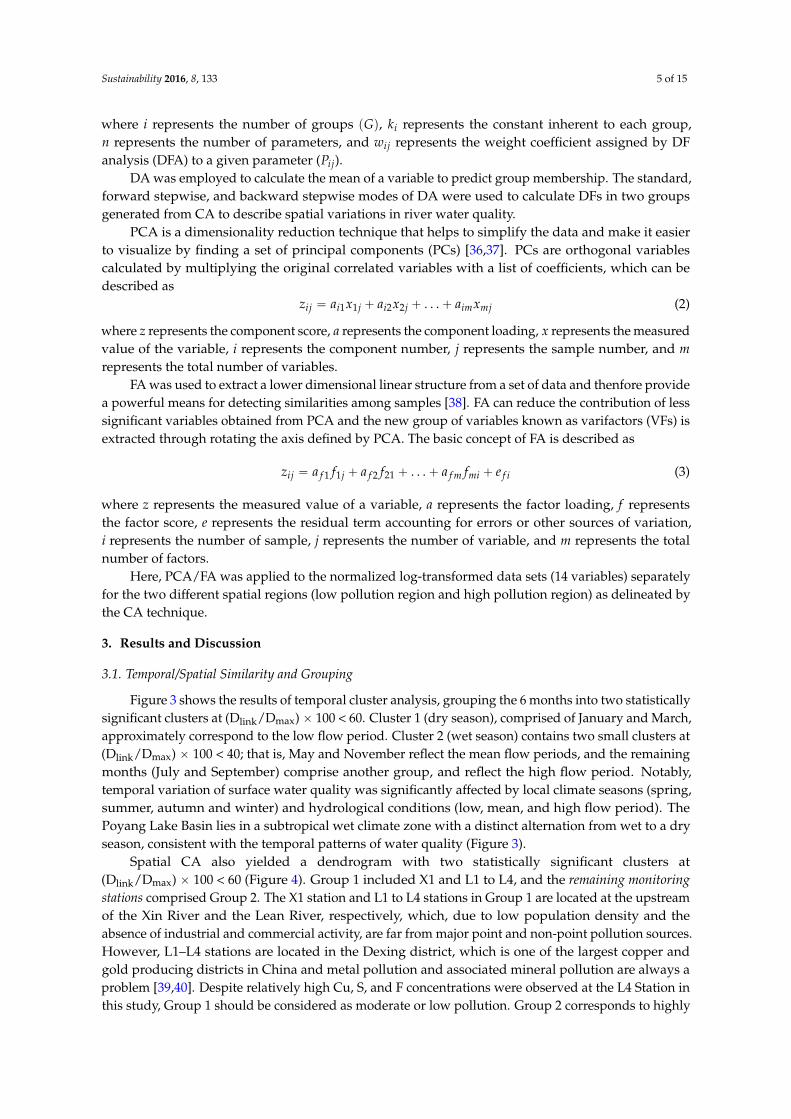
Figure 3 shows the results of temporal cluster analysis, grouping the 6 months into two statisticallysignificant clusters at (Dlink/Dmax)ˆ 100 < 60. Cluster 1 (dry season), comprised of January and March,approximately correspond to the low flow period. Cluster 2 (wet season) contains two small clusters at(Dlink/Dmax) ˆ 100 < 40; that is, May and November reflect the mean flow periods, and the remainingmonths (July and September) comprise another group, and reflect the high flow period. Notably,temporal variation of surface water quality was significantly affected by local climate seasons (spring,summer, autumn and winter) and hydrological conditions (low, mean, and high flow period). ThePoyang Lake Basin lies in a subtropical wet climate zone with a distinct alternation from wet to a dryseason, consistent with the temporal patterns of water quality (Figure 3).
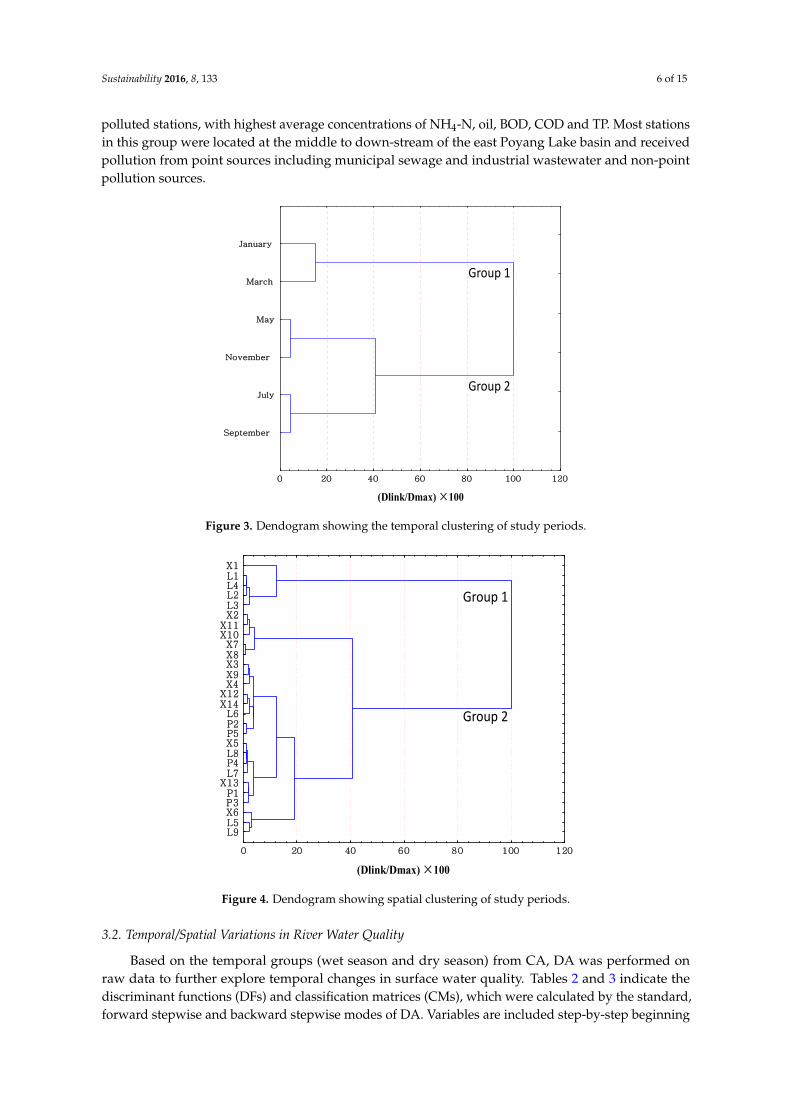
Spatial CA also yielded a dendrogram with two statistically significant clusters at(Dlink/Dmax) ˆ 100 < 60 (Figure 4). Group 1 included X1 and L1 to L4, and the remaining monitoringstations comprised Group 2. The X1 station and L1 to L4 stations in Group 1 are located at the upstreamof the Xin River and the Lean River, respectively, which, due to low population density and theabsence of industrial and commercial activity, are far from major point and non-point pollution sources.However, L1–L4 stations are located in the Dexing district, which is one of the largest copper andgold producing districts in China and metal pollution and associated mineral pollution are always aproblem [39,40]. Despite relatively high Cu, S, and F concentrations were observed at the L4 Station inthis study, Group 1 should be considered as moderate or low pollution. Group 2 corresponds to highly
Sustainability 2016, 8, 133 6 of 15
polluted stations, with highest average concentrations of NH4-N, oil, BOD, COD and TP. Most stationsin this group were located at the middle to down-stream of the east Poyang Lake basin and receivedpollution from point sources including municipal sewage and industrial wastewater and non-pointpollution sources.
Sustainability 2016, 8, 133 6 of 15
BOD, COD and TP. Most stations in this group were located at the middle to down‐stream of the east
Poyang Lake basin and received pollution from point sources including municipal sewage and
industrial wastewater and non‐point pollution sources.
Figure 3. Dendogram showing the temporal clustering of study periods.
Figure 4. Dendogram showing spatial clustering of study periods.
3.2. Temporal/Spatial Variations in River Water Quality
Based on the temporal groups (wet season and dry season) from CA, DA was performed on raw
data to further explore temporal changes in surface water quality. Tables 2 and 3 indicate the
discriminant functions (DFs) and classification matrices (CMs), which were calculated by the
0 20 40 60 80 100 120
September
July
November
May
March
January
Group 2
Group 1
(Dlink/Dmax) ×100
0 20 40 60 80 100 120
L9L5X6P3P1
X13L7P4L8X5P5P2L6
X14X12
X4X9X3X8X7
X10X11
X2L3L2L4L1X1
Group 2
Group 1
(Dlink/Dmax) ×100
Figure 3. Dendogram showing the temporal clustering of study periods.
Sustainability 2016, 8, 133 6 of 15
BOD, COD and TP. Most stations in this group were located at the middle to down‐stream of the east
Poyang Lake basin and received pollution from point sources including municipal sewage and
industrial wastewater and non‐point pollution sources.
Figure 3. Dendogram showing the temporal clustering of study periods.
Figure 4. Dendogram showing spatial clustering of study periods.
3.2. Temporal/Spatial Variations in River Water Quality
Based on the temporal groups (wet season and dry season) from CA, DA was performed on raw
data to further explore temporal changes in surface water quality. Tables 2 and 3 indicate the
discriminant functions (DFs) and classification matrices (CMs), which were calculated by the
0 20 40 60 80 100 120
September
July
November
May
March
January
Group 2
Group 1
(Dlink/Dmax) ×100
0 20 40 60 80 100 120
L9L5X6P3P1
X13L7P4L8X5P5P2L6
X14X12
X4X9X3X8X7
X10X11
X2L3L2L4L1X1
Group 2
Group 1
(Dlink/Dmax) ×100
Figure 4. Dendogram showing spatial clustering of study periods.
3.2. Temporal/Spatial Variations in River Water Quality
Based on the temporal groups (wet season and dry season) from CA, DA was performed onraw data to further explore temporal changes in surface water quality. Tables 2 and 3 indicate thediscriminant functions (DFs) and classification matrices (CMs), which were calculated by the standard,forward stepwise and backward stepwise modes of DA. Variables are included step-by-step beginning
Sustainability 2016, 8, 133 7 of 15
with the more significant until no significant changes in the forward stepwise mode, but are removedstep-by-step beginning with the less significant in the backward stepwise mode. Both the standardand forward stepwise mode DFs using 14 and 7 discriminant variables, respectively, produced thecorresponding CMs assigning 96.43% of the cases correctly. In the backward stepwise mode, however,DA yielded a CM with approximately 97.86% correct assignations using only four discriminantparameters, showing that TEMP, pH, NH4-N, and TN. Thus, the temporal DA indicated that TEMP,pH, NH4-N, and TN were the most significant parameters to discriminate differences between the wetseason and dry season, revealing that these four parameters could be used to account for the expectedtemporal changes in surface water quality in the Eastern Poyang Lake Basin.
Table 2. Classification functions coefficients for DA of temporal changes.
ParametersStandard Mode Forward Stepwise Mode Backward Stepwise Mode
Wet Season Dry Season Wet Season Dry Season Wet Season Dry Season
TEMP 1.989 3.033 3.241 2.207 2.613 1.577pH 82.847 84.585 59.995 58.095 56.048 54.185
NH4-N 21.105 24.167 28.602 25.452 27.846 25.129BOD 9.934 10.125COD ´1.194 ´1.189DO 10.981 10.727 12.409 12.687TN ´5.506 ´7.395 ´9.417 ´7.549 ´12.533 ´10.631TP 7.996 6.712 ´3.095 ´1.832F 46.734 46.243S 631.996 634.440
Cu ´255.025 ´250.116Oil ´148.788 ´206.928 20.532 75.009Cr 374.404 403.601Zn 53.327 52.592
Constant ´378.134 ´403.979 ´302.864 ´276.639 ´235.610 ´206.896
Table 3. Classification matrix for DA of temporal changes.
Monitoring Periods Percent CorrectTemporal Groups
Wet Season Dry Season
Standard modeWet Season 95.536 321 15Dry Season 100 0 224
Total 97.321 321 239
Forward stepwise modeWet Season 95.536 321 15Dry Season 100 0 224
Total 97.321 321 239
Backward stepwise modeWet Season 96.429 324 12Dry Season 100 0 224
Total 97.857 324 236
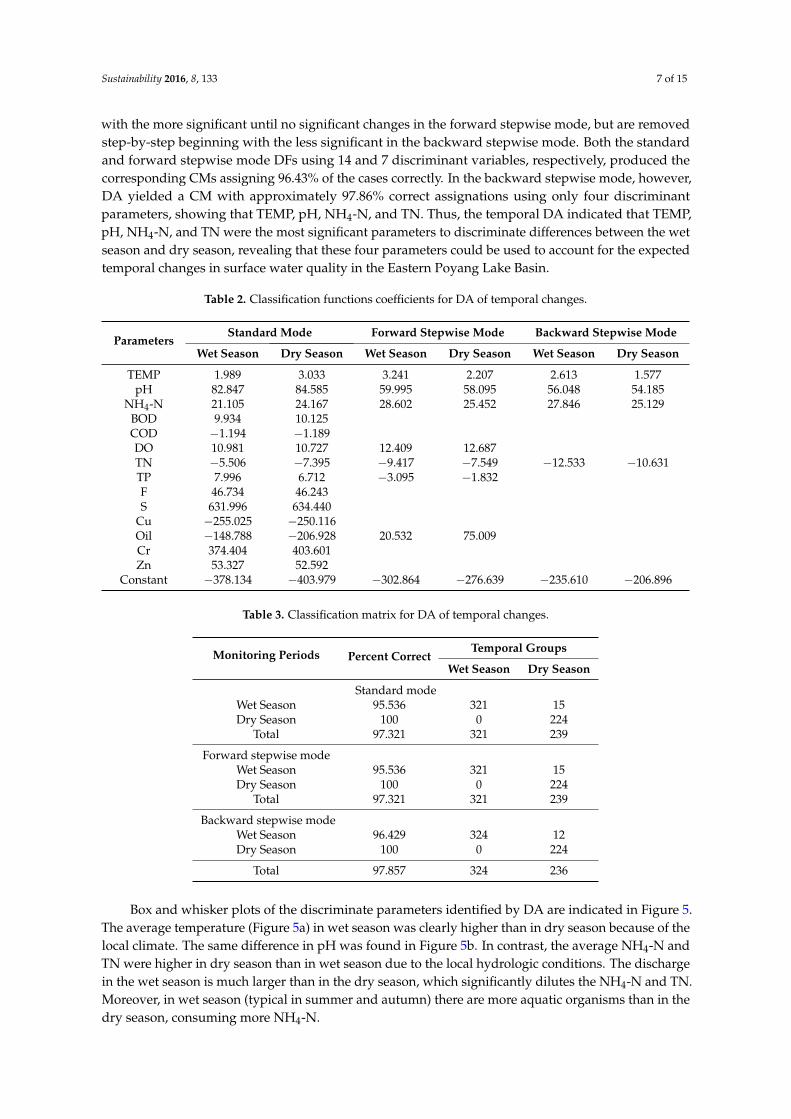
Box and whisker plots of the discriminate parameters identified by DA are indicated in Figure 5.The average temperature (Figure 5a) in wet season was clearly higher than in dry season because of thelocal climate. The same difference in pH was found in Figure 5b. In contrast, the average NH4-N andTN were higher in dry season than in wet season due to the local hydrologic conditions. The dischargein the wet season is much larger than in the dry season, which significantly dilutes the NH4-N and TN.Moreover, in wet season (typical in summer and autumn) there are more aquatic organisms than in thedry season, consuming more NH4-N.
Sustainability 2016, 8, 133 8 of 15Sustainability 2016, 8, 133 8 of 15
Figure 5. Temporal changes: (a) temperature; (b) pH; (c) NH4‐N; and (d) TN in east Poyang Lake basin.
Table 4. Classification functions coefficients for DA of spatial changes.
Parameters
Standard Mode Forward Stepwise Mode Backward Stepwise Mode
Low
Pollution
High
Pollution
Low
Pollution
High
Pollution
Low
Pollution
High
Pollution
TEMP 1.028 1.07 1.214 1.260
pH 87.554 91.925 79.992 84.230 72.662 77.108
NH4‐N 15.389 13.534 16.827 15.151
BOD 10.175 10.467
COD −0.833 −0.584 −0.409 −0.146 −0.376 −0.146
DO 10.645 10.246 10.144 9.730
TN −1.196 0.484 −0.140 1.573 3.971 5.296
TP 10.63 11.57
F 41.529 37.651 42.883 38.954 59.009 54.412
S 518.07 441.985 479.059 401.226 416.961 330.412
Cu −244.929 −234.766 −205.655 −195.490
Oil −63.009 −43.309 77.283 100.383
Cr 435.253 496.253 588.508 653.149
Zn 54.778 55.278
Constant −384.511 −413.498 −349.255 −376.823 −273.306 −303.391
Just like temporal DA, the DFs and CMs for spatial DA were obtained from the standard,
forward stepwise and backward stepwise modes on the basis of spatial groups (low pollution stations
and high pollution stations), which are shown in Tables 4 and 5. Both the standard and forward
stepwise mode DFs using 14 and 11 discriminant variables, respectively, yielded the corresponding
CMs assigning 95% of the cases correctly, whereas the backward stepwise DA gave CMs with about
93.75% correct assignations using only five discriminant parameters (Tables 4 and 5). Backward
Dry Season Wet Season0.4
0.8
1.2
1.6
2.0
2.4
2.8
TN (m
g/L
)
Dry Season Wet Season
8
12
16
20
24
28TE
MP(
℃)
Mean Mean±SE Mean±SD
Dry Season Wet Season6.8
7.0
7.2
7.4
7.6
7.8
8.0
pH
Dry Season Wet Season0.0
0.2
0.4
0.6
0.8
1.0
NH
4-N
(mg/
L)
(a) (b)
(c) (d)
Figure 5. Temporal changes: (a) temperature; (b) pH; (c) NH4-N; and (d) TN in east Poyang Lake basin.
Table 4. Classification functions coefficients for DA of spatial changes.
ParametersStandard Mode Forward Stepwise Mode Backward Stepwise Mode
LowPollution
HighPollution
LowPollution
HighPollution
LowPollution
HighPollution
TEMP 1.028 1.07 1.214 1.260pH 87.554 91.925 79.992 84.230 72.662 77.108
NH4-N 15.389 13.534 16.827 15.151BOD 10.175 10.467COD ´0.833 ´0.584 ´0.409 ´0.146 ´0.376 ´0.146DO 10.645 10.246 10.144 9.730TN ´1.196 0.484 ´0.140 1.573 3.971 5.296TP 10.63 11.57F 41.529 37.651 42.883 38.954 59.009 54.412S 518.07 441.985 479.059 401.226 416.961 330.412
Cu ´244.929 ´234.766 ´205.655 ´195.490Oil ´63.009 ´43.309 77.283 100.383Cr 435.253 496.253 588.508 653.149Zn 54.778 55.278
Constant ´384.511 ´413.498 ´349.255 ´376.823 ´273.306 ´303.391
Just like temporal DA, the DFs and CMs for spatial DA were obtained from the standard, forwardstepwise and backward stepwise modes on the basis of spatial groups (low pollution stations and highpollution stations), which are shown in Tables 4 and 5. Both the standard and forward stepwise modeDFs using 14 and 11 discriminant variables, respectively, yielded the corresponding CMs assigning95% of the cases correctly, whereas the backward stepwise DA gave CMs with about 93.75% correctassignations using only five discriminant parameters (Tables 4 and 5). Backward stepwise DA showed
Sustainability 2016, 8, 133 9 of 15
that pH, COD, TN, F, and S were the most significant parameters to discriminate differences betweenthe low pollution stations and high pollution stations.
Table 5. Classification matrix for discriminant analysis of spatial changes.
Monitoring Stations Percent CorrectSpatial Groups
Low Pollution High Pollution
Standard modeLow pollution 72.000 72 28High pollution 100.000 0 460
Total 95.000 72 28
Forward stepwise modeLow pollution 72.000 72 28High pollution 100.000 0 460
Total 95.000 72 488
Backward stepwise modeLow pollution 69.000 69 31High pollution 99.130 4 456
Total 93.750 73 487
Table 6. Loadings of experimental variables (14) on significant VFs for low pollution and high pollution.
ParametersLow Pollution (Six Significant Principal Components) High Pollution (four Significant
Principal Components)
VF1 VF2 VF3 VF4 VF5 VF6 VF1 VF2 VF3 VF4
TEMP 0.015 0.026 0.042 0.874 0.211 0.107 0.206 ´0.362 ´0.623 ´0.017pH 0.730 0.230 0.201 ´0.068 ´0.243 ´0.169 ´0.657 ´0.149 ´0.114 ´0.081
NH4-N ´0.144 ´0.078 ´0.032 0.084 0.934 0.058 ´0.069 0.861 0.022 0.038BOD ´0.013 ´0.834 0.036 0.167 ´0.040 0.249 0.103 ´0.054 ´0.365 0.701COD 0.607 ´0.418 0.362 ´0.307 0.263 ´0.014 0.050 0.562 0.234 0.318DO ´0.172 0.197 ´0.214 ´0.745 0.138 0.165 ´0.165 ´0.107 0.794 ´0.012TN 0.721 0.283 ´0.127 0.186 0.443 ´0.124 0.219 0.651 ´0.003 0.091TP 0.149 0.355 0.758 0.097 ´0.040 ´0.091 0.466 0.413 0.157 0.179F ´0.597 ´0.440 ´0.121 ´0.253 0.387 0.261 0.330 0.113 0.646 0.065S ´0.779 0.139 0.067 ´0.152 0.155 ´0.052 ´0.664 0.364 ´0.095 ´0.178
Cu 0.094 0.741 0.156 ´0.023 ´0.109 0.334 ´0.831 ´0.079 0.224 ´0.055Oil 0.420 0.021 0.611 0.165 ´0.253 ´0.126 0.131 0.202 0.026 0.626Cr ´0.188 ´0.154 0.887 0.075 0.065 0.117 0.073 0.129 0.266 0.639Zn ´0.123 ´0.011 ´0.026 ´0.017 0.061 0.931 0.835 0.098 ´0.169 0.073
Eigenvalue 3.553 2.000 1.709 1.469 1.302 1.007 3.205 2.364 1.426 1.094%Total variance 25.382 14.287 12.208 10.491 9.303 7.190 22.890 16.883 10.189 7.817
Cumulative%variance 25.382 39.668 51.876 62.367 71.671 78.861 22.890 39.773 49.962 57.779
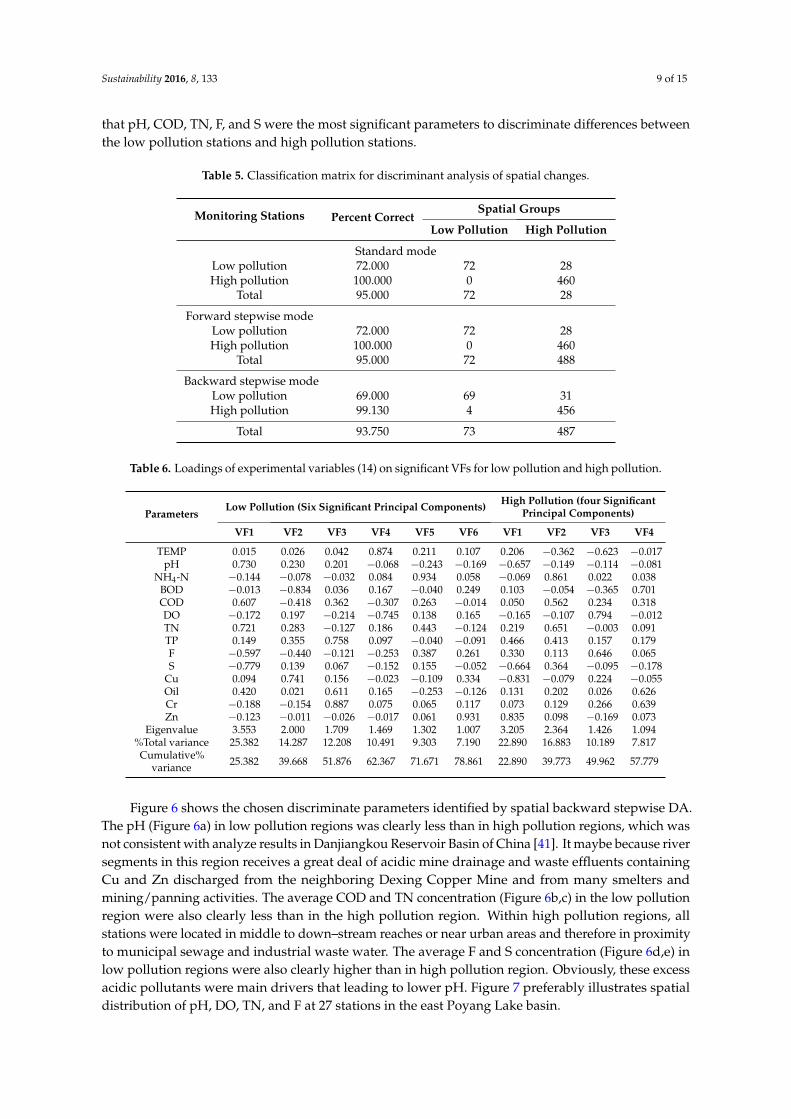
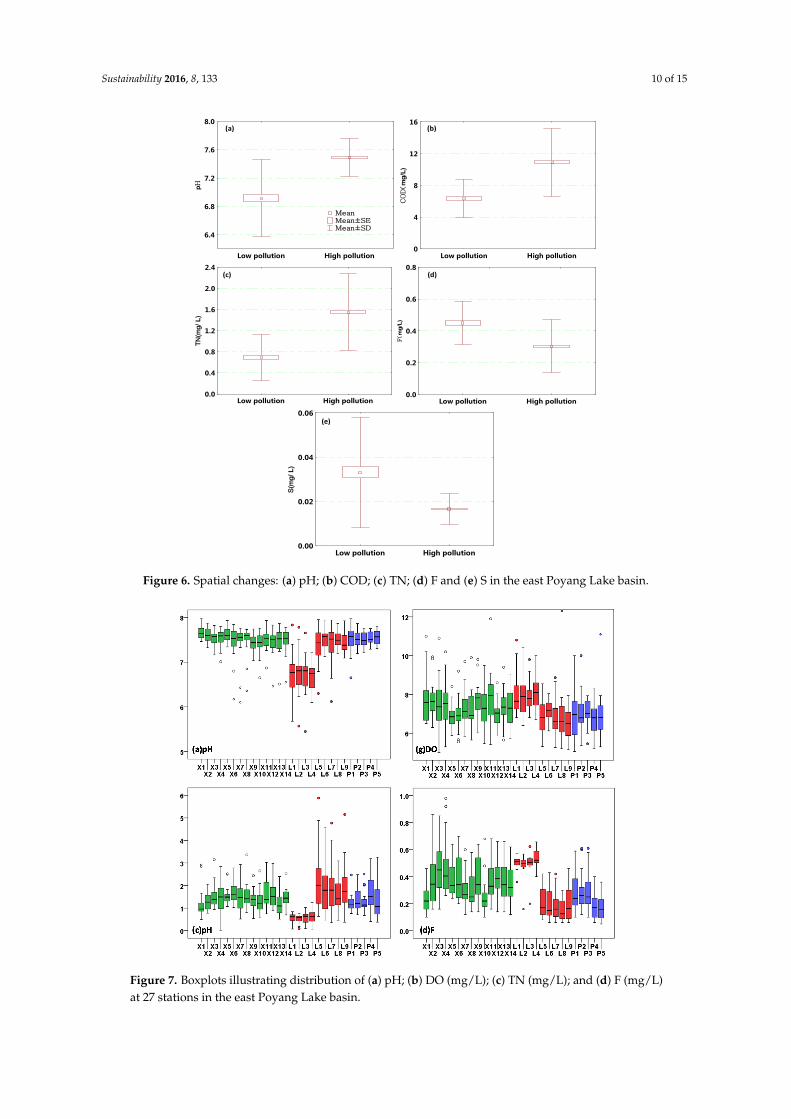
Figure 6 shows the chosen discriminate parameters identified by spatial backward stepwise DA.The pH (Figure 6a) in low pollution regions was clearly less than in high pollution regions, which wasnot consistent with analyze results in Danjiangkou Reservoir Basin of China [41]. It maybe because riversegments in this region receives a great deal of acidic mine drainage and waste effluents containingCu and Zn discharged from the neighboring Dexing Copper Mine and from many smelters andmining/panning activities. The average COD and TN concentration (Figure 6b,c) in the low pollutionregion were also clearly less than in the high pollution region. Within high pollution regions, allstations were located in middle to down–stream reaches or near urban areas and therefore in proximityto municipal sewage and industrial waste water. The average F and S concentration (Figure 6d,e) inlow pollution regions were also clearly higher than in high pollution region. Obviously, these excessacidic pollutants were main drivers that leading to lower pH. Figure 7 preferably illustrates spatialdistribution of pH, DO, TN, and F at 27 stations in the east Poyang Lake basin.
Sustainability 2016, 8, 133 10 of 15Sustainability 2016, 8, 133 10 of 15
Figure 6. Spatial changes: (a) pH; (b) COD; (c) TN; (d) F and (e) S in the east Poyang Lake basin.
Figure 7. Boxplots illustrating distribution of (a) pH; (b) DO (mg/L); (c) TN (mg/L); and (d) F (mg/L)
at 27 stations in the east Poyang Lake basin.
Low pollution High pollution0.0
0.4
0.8
1.2
1.6
2.0
2.4
TN(m
g/L
)
Low pollution High pollution0.00
0.02
0.04
0.06
S(m
g/L
)
(a) (b)
(c) (d)
(e)
Low pollution High pollution
6.4
6.8
7.2
7.6
8.0
pH
Mean Mean±SE Mean±SD
Low pollution High pollution0
4
8
12
16
CO
D(m
g/L
)Low pollution High pollution
0.0
0.2
0.4
0.6
0.8
F(m
g/L
)
Figure 6. Spatial changes: (a) pH; (b) COD; (c) TN; (d) F and (e) S in the east Poyang Lake basin.
Sustainability 2016, 8, 133 10 of 15
Figure 6. Spatial changes: (a) pH; (b) COD; (c) TN; (d) F and (e) S in the east Poyang Lake basin.
Figure 7. Boxplots illustrating distribution of (a) pH; (b) DO (mg/L); (c) TN (mg/L); and (d) F (mg/L)
at 27 stations in the east Poyang Lake basin.
Low pollution High pollution0.0
0.4
0.8
1.2
1.6
2.0
2.4
TN(m
g/L
)
Low pollution High pollution0.00
0.02
0.04
0.06
S(m
g/L
)
(a) (b)
(c) (d)
(e)
Low pollution High pollution
6.4
6.8
7.2
7.6
8.0
pH
Mean Mean±SE Mean±SD
Low pollution High pollution0
4
8
12
16
CO
D(m
g/L
)Low pollution High pollution
0.0
0.2
0.4
0.6
0.8
F(m
g/L
)
Figure 7. Boxplots illustrating distribution of (a) pH; (b) DO (mg/L); (c) TN (mg/L); and (d) F (mg/L)at 27 stations in the east Poyang Lake basin.
Sustainability 2016, 8, 133 11 of 15
3.3. Data Structure Determination and Source Identification
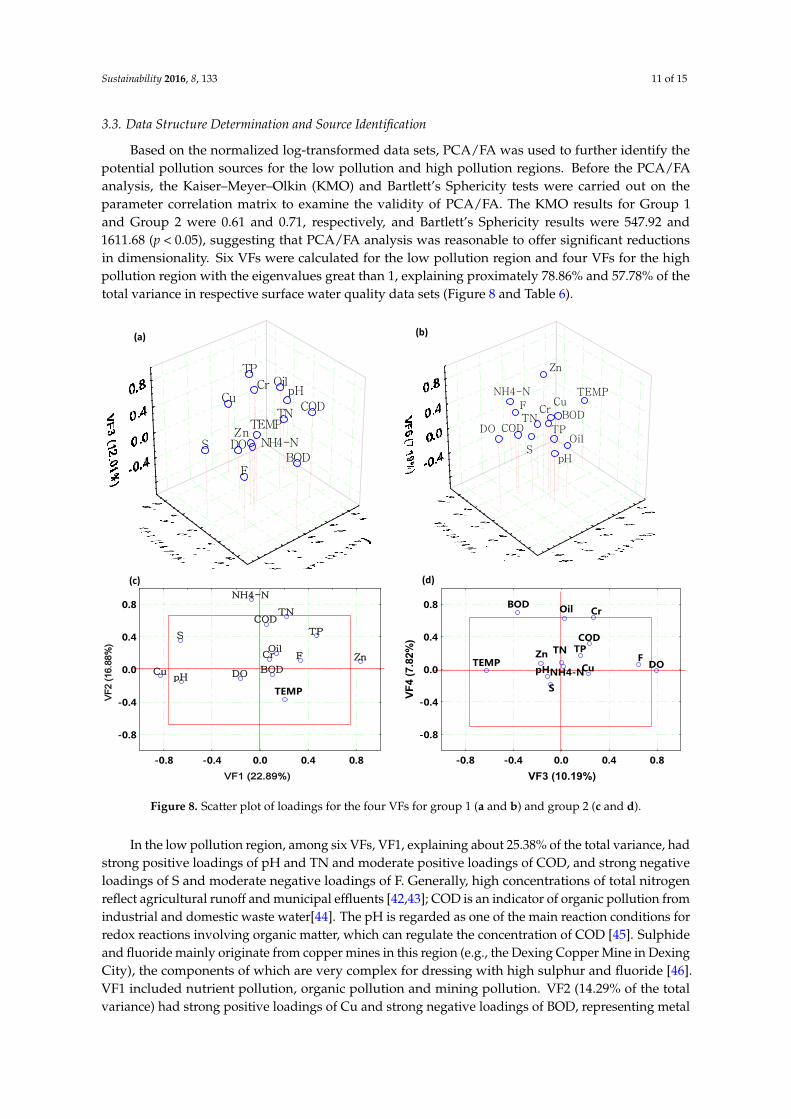
Based on the normalized log-transformed data sets, PCA/FA was used to further identify thepotential pollution sources for the low pollution and high pollution regions. Before the PCA/FAanalysis, the Kaiser–Meyer–Olkin (KMO) and Bartlett’s Sphericity tests were carried out on theparameter correlation matrix to examine the validity of PCA/FA. The KMO results for Group 1and Group 2 were 0.61 and 0.71, respectively, and Bartlett’s Sphericity results were 547.92 and1611.68 (p < 0.05), suggesting that PCA/FA analysis was reasonable to offer significant reductionsin dimensionality. Six VFs were calculated for the low pollution region and four VFs for the highpollution region with the eigenvalues great than 1, explaining proximately 78.86% and 57.78% of thetotal variance in respective surface water quality data sets (Figure 8 and Table 6).
Sustainability 2016, 8, 133 11 of 15
3.3. Data Structure Determination and Source Identification
Based on the normalized log‐transformed data sets, PCA/FA was used to further identify the
potential pollution sources for the low pollution and high pollution regions. Before the PCA/FA
analysis, the Kaiser–Meyer–Olkin (KMO) and Bartlett’s Sphericity tests were carried out on the
parameter correlation matrix to examine the validity of PCA/FA. The KMO results for Group 1 and
Group 2 were 0.61 and 0.71, respectively, and Bartlett’s Sphericity results were 547.92 and 1611.68
(p < 0.05), suggesting that PCA/FA analysis was reasonable to offer significant reductions in
dimensionality. Six VFs were calculated for the low pollution region and four VFs for the high
pollution region with the eigenvalues great than 1, explaining proximately 78.86% and 57.78% of the
total variance in respective surface water quality data sets (Figure 8 and Table 6).
Figure 8. Scatter plot of loadings for the four VFs for group 1 (a and b) and group 2 (c and d).
In the low pollution region, among six VFs, VF1, explaining about 25.38% of the total variance,
had strong positive loadings of pH and TN and moderate positive loadings of COD, and strong
negative loadings of S and moderate negative loadings of F. Generally, high concentrations of total
nitrogen reflect agricultural runoff and municipal effluents [42,43]; COD is an indicator of organic
pollution from industrial and domestic waste water[44]. The pH is regarded as one of the main
reaction conditions for redox reactions involving organic matter, which can regulate the
concentration of COD [45]. Sulphide and fluoride mainly originate from copper mines in this region
(e.g., the Dexing Copper Mine in Dexing City), the components of which are very complex for
dressing with high sulphur and fluoride [46]. VF1 included nutrient pollution, organic pollution and
mining pollution. VF2 (14.29% of the total variance) had strong positive loadings of Cu and strong
negative loadings of BOD, representing metal pollution. VF3, explaining 12.21% of the total variance,
had strong positive loadings of Cr and TP and moderate positive loadings of Oil. This factor can be
explained as representing influences from point sources, such as copper mines, industrial effluents and
(a) (b)
(c) (d)
pH
NH4-N
BOD
COD
DO
TN
TP
F
S
Cu
OilCr Zn
-0.8 -0.4 0.0 0.4 0.8
VF1 (22.89%)
-0.8
-0.4
0.0
0.4
0.8
VF2
(16.
88%
)
TEMP
COD
DO
TP
Cu
-0.8 -0.4 0.0 0.4 0.8
VF3 (10.19%)
-0.8
-0.4
0.0
0.4
0.8
VF
4 (7
.82%
)
TEMPpHNH4-N
BOD
TNF
S
Oil Cr
Zn
TNCOD
Oil
Cu
TP
BODDO
F
S
pH
TEMPZn
NH4-N
CrTEMP
TN BOD
Oil
NH4-N
Cr
TP
Zn
Cu
SpH
F
CODDO
Figure 8. Scatter plot of loadings for the four VFs for group 1 (a and b) and group 2 (c and d).
In the low pollution region, among six VFs, VF1, explaining about 25.38% of the total variance, hadstrong positive loadings of pH and TN and moderate positive loadings of COD, and strong negativeloadings of S and moderate negative loadings of F. Generally, high concentrations of total nitrogenreflect agricultural runoff and municipal effluents [42,43]; COD is an indicator of organic pollution fromindustrial and domestic waste water[44]. The pH is regarded as one of the main reaction conditions forredox reactions involving organic matter, which can regulate the concentration of COD [45]. Sulphideand fluoride mainly originate from copper mines in this region (e.g., the Dexing Copper Mine in DexingCity), the components of which are very complex for dressing with high sulphur and fluoride [46].VF1 included nutrient pollution, organic pollution and mining pollution. VF2 (14.29% of the totalvariance) had strong positive loadings of Cu and strong negative loadings of BOD, representing metal
Sustainability 2016, 8, 133 12 of 15
pollution. VF3, explaining 12.21% of the total variance, had strong positive loadings of Cr and TPand moderate positive loadings of Oil. This factor can be explained as representing influences frompoint sources, such as copper mines, industrial effluents and domestic wastewater. VF4, accounting for10.49% of the total variance, had strong positive loadings of temperature and strong negative loadingsof dissolved oxygen. The concentration of DO is controlled by temperature and therefore has botha seasonal and a daily cycle [47]. Therefore, the DO concentration is high in winter and early springbecause of low temperature, and is low in summer and fall because of high temperature. VF5 (9.30%)had strong positive loadings on NH4-N representing non-point source pollution related to agriculturalactivities. VF6 (7.19%) had strong positive loadings of Zn indicating the metal pollution.
With respect to the data set pertaining to the high pollution region, among four VFs, VF1,explaining about 22.89% of the total variance, had strong positive loadings on Cu and moderatenegative loadings on pH and S, basically representing metal pollution from the upstream. VF2 (16.88%of the total variance) had strong positive loadings of NH4-N and moderate positive loading of TNand COD. This factor can be explained as one typical kind of mixed pollution, which consists ofpoint source pollution (e.g., industrial and domestic waste water) and non-point source pollutionassociated with agricultural activities and atmospheric deposition. VF3, explaining 10.19% of thetotal variance, had strong positive loadings of DO and moderate positive loadings of F and moderatenegative loadings of TEMP. Generally, fluoride is from cement plants, fluorine chemical factories, andcopper smelters in this region. The relationship between DO and temperature is explained in the sameway as the explanation of VF4 in the low pollution region. VF4 (7.82%) had strong positive loadingsof BOD and moderate positive loadings of Oil and Cr. The high concentration of BOD and Oil couldrepresent organic pollution and oil pollution, and Cr is likely from cement plants and copper smeltersin this region.
Based on the above analysis, five latent pollutants including nutrients, organics, chemicals, heavymetals and natural pollutants were identified in the study area. Firstly, nutrient pollution (ammonianitrogen and total nitrogen) was mainly from non-point sources related to agricultural activitiesand atmospheric deposition and point sources including municipal effluents and fertilizer plantwastewater. In addition, organic pollution (BOD and COD) was usually from point sources (e.g.,industrial and domestic waste water). Thirdly, chemical pollution was mainly from the petroleumindustry (oil pollution) and copper mines and plating (S and F pollution). Fourthly, heavy metalpollution (Cu, Cr and Zn) was mainly from copper mines and plating. Finally, natural pollution wasbadly affected by meteorological variations such as the variation of water temperature and dissolvedoxygen. Considering the types of pollution in the two regions (Table 6 and Figure 6), heavy metals(Cu, Cr and Zn), fluoride and sulfide stood out. Field investigations showed there are many coppermines in the Eastern Poyang Lake Basin, such as the Dexing Copper Mine, which are associated withmineral effluents including fluoride and sulfide.
4. Conclusions and Future Work
Different multivariate statistical techniques were applied to evaluate spatio-temporal variationsin surface water quality of the Eastern Poyang Lake Basin in this study. Hierarchical CA grouped 6months into two periods and 28 sampling stations into two groups on the basis of their similar waterquality characteristics, which can provide a reasonable and useful classification for optimizing thefuture spatial monitoring network with lower cost. Based on the results obtained from hierarchical CA,spatial and temporal changes in surface water quality were analyzed through achieving discriminantfunctions and classification matrices using DA. For temporal changes, the temporal DA used onlyfour discriminant parameters including TEMP, pH, NH4-N, and TN, with approximately 97.86%correct assignations. The spatial DA gave CMs with about 93.75% correct assignations using only fivediscriminant parameters (pH, COD, TN, F, and S). Thus, temporal and spatial DA analysis could beused to optimize future water quality monitoring programs by reducing the number of monitoringstations, monitoring parameters, and monitoring frequency. The results from PCA/FA analysis
Sustainability 2016, 8, 133 13 of 15
identified there were five latent pollutions including nutrients, organics, chemicals, heavy metals andnatural pollution. Heavy metals (Cu, Cr and Zn), fluoride and sulfide were serious problems in thestudy region. In low pollution region, heavy metal and sulfide pollution were mainly from coppermines such as the Dexing Copper Mine, but from copper mines and plating in the high pollution region.
Although all results obtained from this study illustrate the utility of multivariate statisticaltechniques for extracting characteristics from large water quality data sets and identifying pollutionsources to fully understand spatiotemporal variations in water quality, further study should be carriedout in the future. First, some water quality parameters including TEMP, pH, NH4-N, COD, TN, F, and Sshould be further monitored more accuracy and controlled. In addition, it is necessary to quantitativelyevaluate pollution sources to obtain contribution of different pollutants. Finally, further investigationof heavy metal pollution should be implemented, especially for Cu pollution.
Acknowledgments: This study was sponsored by the National Natural Science Foundation of China(No. 41471460, 41501552, and 41130750) and “One Hundred Talents Program” of the Chinese Academy ofSciences. The authors are grateful to some staff members of Shangrao Environmental Protection and ShangraoDevelopment and Reform Commission for their helpful information for this study.
Author Contributions: Weili Duan had the original idea for the study and, with all co-authors carried out thedesign. Weili Duan drafted the manuscript, which was revised by all authors. All authors read and approved thefinal manuscript.
Conflicts of Interest: The authors declare no conflict of interest.
References
1. Vörösmarty, C.J.; Green, P.; Salisbury, J.; Lammers, R.B. Global water resources: Vulnerability from climatechange and population growth. Science 2000, 289, 284–288. [CrossRef] [PubMed]
2. Schwarzenbach, R.P.; Egli, T.; Hofstetter, T.B.; von Gunten, U.; Wehrli, B. Global water pollution and humanhealth. Ann. Rev. Environ. Resour. 2010, 35, 109–136. [CrossRef]
3. Hoekstra, A.Y.; Mekonnen, M.M. The water footprint of humanity. Proc. Natl. Acad. Sci. 2012, 109, 3232–3237.[CrossRef] [PubMed]
4. Tu, J. Spatial variations in the relationships between land use and water quality across an urbanizationgradient in the watersheds of northern Georgia, USA. Environ Manag. 2013, 51, 1–17. [CrossRef] [PubMed]
5. Duan, W.; Chen, G.; Ye, Q.; Chen, Q. The situation of hazardous chemical accidents in China between 2000and 2006. J. Hazard Mater. 2011, 186, 1489–1494. [CrossRef] [PubMed]
6. Duan, W.; He, B.; Takara, K.; Luo, P.; Nover, D.; Sahu, N.; Yamashiki, Y. Spatiotemporal evaluation of waterquality incidents in Japan between 1996 and 2007. Chemosphere 2013, 93, 946–953. [CrossRef] [PubMed]
7. Duan, W.; He, B. Emergency response system for pollution accidents in chemical industrial parks, China.Int. J. Environ. Res. Public Health 2015, 12, 7868–7885. [CrossRef] [PubMed]
8. Zhao, Q.; Liu, S.; Deng, L.; Yang, Z.; Dong, S.; Wang, C.; Zhang, Z. Spatio-temporal variation of heavy metalsin fresh water after dam construction: A case study of the Manwan Reservoir, Lancang River. Environ. Monit.Assess. 2012, 184, 4253–4266. [CrossRef] [PubMed]
9. Shi, H.; Shao, M. Soil and water loss from the Loess Plateau in China. J. Arid Environ. 2000, 45, 9–20.[CrossRef]
10. Delpla, I.; Jung, A.; Baures, E.; Clement, M.; Thomas, O. Impacts of climate change on surface water qualityin relation to drinking water production. Environ. Int. 2009, 35, 1225–1233. [CrossRef] [PubMed]
11. Carr, G.M.; Neary, J.P. Water Quality for Ecosystem and Human Health; UNEP/Earthprint: Stevenage, UK, 2008.12. Duan, W.; Takara, K.; He, B.; Luo, P.; Nover, D.; Yamashiki, Y. Spatial and temporal trends in estimates of
nutrient and suspended sediment loads in the Ishikari River, Japan, 1985 to 2010. Sci. Total Environ. 2013,461, 499–508. [CrossRef] [PubMed]
13. Luo, P.; He, B.; Takara, K.; Razafindrabe, B.H.; Nover, D.; Yamashiki, Y. Spatiotemporal trend analysis ofrecent river water quality conditions in Japan. J. Environ. Monitor. 2011, 13, 2819–2829. [CrossRef] [PubMed]
14. Kronvang, B.; Jeppesen, E.; Conley, D.J.; Søndergaard, M.; Larsen, S.E.; Ovesen, N.B.; Carstensen, J. Nutrientpressures and ecological responses to nutrient loading reductions in Danish streams, lakes and coastalwaters. J. Hydrol. 2005, 304, 274–288. [CrossRef]
Sustainability 2016, 8, 133 14 of 15
15. Conley, D.J.; Markager, S.; Andersen, J.; Ellermann, T.; Svendsen, L.M. Coastal eutrophication and the Danishnational aquatic monitoring and assessment program. Estuar. Coasts 2002, 25, 848–861. [CrossRef]
16. Morvan, X.; Saby, N.; Arrouays, D.; Le Bas, C.; Jones, R.; Verheijen, F.; Bellamy, P.H.; Stephens, M.;Kibblewhite, M.G. Soil monitoring in Europe: A review of existing systems and requirements forharmonisation. Sci. Total Environ. 2008, 391, 1–12. [CrossRef] [PubMed]
17. Hurley, M.A.; Currie, J.E.; Gough, J.; Butterwick, C. A framework for the analysis of harmonised monitoringscheme data for England and Wales. Environmetrics 1996, 7, 379–390. [CrossRef]
18. Gilliom, R.J.; Alley, W.M.; Gurtz, M.E. Design of National Water-Quality Assessment Program; United StatesGovernment Printing Office: Washington, DC, USA, 1995.
19. Rosen, M.R.; Lapham, W.W. Introduction to the US Geological Survey National Water-Quality Assessment(NAWQA) of ground-water quality trends and comparison to other national programs. J. Environ. Qual.2008, 37, 190.
20. Zhang, C.; Sihui, D. A new water quality assessment model based on projection pursuit technique. J. Environ. Sci.2009, 21, S154–S157. [CrossRef]
21. He, B.; Oki, T.; Sun, F.; Komori, D.; Kanae, S.; Wang, Y.; Kim, H.; Yamazaki, D. Estimating monthly totalnitrogen concentration in streams by using artificial neural network. J. Environ. Manag. 2011, 92, 172–177.[CrossRef] [PubMed]
22. Wu, C.L.; Chau, K.W.; Li, Y.S. Methods to improve neural network performance in daily flows prediction.J. Hydrol. 2009, 372, 80–93. [CrossRef]
23. Singh, K.P.; Malik, A.; Mohan, D.; Sinha, S. Multivariate statistical techniques for the evaluation of spatialand temporal variations in water quality of Gomti River (India)-a case study. Water Res. 2004, 38, 3980–3992.[CrossRef] [PubMed]
24. Wang, W.; Xu, D.; Chau, K.; Lei, G. Assessment of river water quality based on theory of variable fuzzy setsand fuzzy binary comparison method. Water Resour. Manag. 2014, 28, 4183–4200. [CrossRef]
25. Moriasi, D.N.; Wilson, B.N.; Douglas-Mankin, K.R.; Arnold, J.G.; Gowda, P.H. Hydrologic and water qualitymodels: Use, calibration, and validation. Trans. ASABE 2012, 55, 1241–1247. [CrossRef]
26. He, B.; Kanae, S.; Oki, T.; Hirabayashi, Y.; Yamashiki, Y.; Takara, K. Assessment of global nitrogen pollution inrivers using an integrated biogeochemical modeling framework. Water Res. 2011, 45, 2573–2586. [CrossRef][PubMed]
27. Chau, K.; Wu, C. A hybrid model coupled with singular spectrum analysis for daily rainfall prediction.J. Hydroinform. 2010, 12, 458–473. [CrossRef]
28. Wang, Y.; Wang, P.; Bai, Y.; Tian, Z.; Li, J.; Shao, X.; Mustavich, L.F.; Li, B. Assessment of surface waterquality via multivariate statistical techniques: A case study of the Songhua River Harbin region, China.J. Hydro-Environ. Res. 2013, 7, 30–40. [CrossRef]
29. He, G.; Lu, Y.; Mol, A.P.; Beckers, T. Changes and challenges: China1s environmental management intransition. Environ. Dev. 2012, 3, 25–38. [CrossRef]
30. Zhang, Q.; Li, L.; Wang, Y.G.; Werner, A.D.; Xin, P.; Jiang, T.; Barry, D.A. Has the Three-Gorges Dam madethe Poyang Lake wetlands wetter and drier? Geophys. Res. Lett. 2012, 39, L20402. [CrossRef]
31. Ye, X.; Zhang, Q.; Liu, J.; Li, X.; Xu, C. Distinguishing the relative impacts of climate change and humanactivities on variation of streamflow in the Poyang Lake catchment, China. J. Hydrol. 2013, 494, 83–95.[CrossRef]
32. Liu, W.X.; Coveney, R.M.; Chen, J.L. Environmental quality assessment on a river system polluted by miningactivities. Appl. Geochem. 2003, 18, 749–764. [CrossRef]
33. Mckenna, J.E. An enhanced cluster analysis program with bootstrap significance testing for ecologicalcommunity analysis. Environ. Model. Softw. 2003, 18, 205–220. [CrossRef]
34. Shrestha, S.; Kazama, F. Assessment of surface water quality using multivariate statistical techniques: A casestudy of the Fuji river basin, Japan. Environ. Model. Softw. 2007, 22, 464–475. [CrossRef]
35. Johnson, R.A.; Wichern, D.W. Applied Multivariate Statistical Analysis; Prentice hall: Englewood Cliffs, NJ,USA, 1992.
36. Jolliffe, I. Principal Component Analysis; John Wiley & Sons Inc.: Charlottesville, VA, USA, 2002.37. Yidana, S.M.; Ophori, D.; Banoeng-Yakubo, B. A multivariate statistical analysis of surface water chemistry
data-The Ankobra Basin, Ghana. J. Environ. Manag. 2008, 86, 80–87. [CrossRef] [PubMed]
Sustainability 2016, 8, 133 15 of 15
38. Reghunath, R.; Murthy, T.S.; Raghavan, B.R. The utility of multivariate statistical techniques inhydrogeochemical studies: An example from Karnataka, India. Water Res. 2002, 36, 2437–2442. [CrossRef]
39. Xiao, X.; Wang, Y.; Zhang, H.; Yu, X. Effects of primary productivity and ecosystem size on food-chain lengthin Raohe River, China. Acta Ecol. Sin. 2015, 35, 29–34. [CrossRef]
40. Chen, H.; Teng, Y.; Lu, S.; Wang, Y.; Wang, J. Contamination features and health risk of soil heavy metals inChina. Sci. Total Environ. 2015, 512, 143–153. [CrossRef] [PubMed]
41. Chen, P.; Li, L.; Zhang, H. Spatio-Temporal Variations and Source Apportionment of Water Pollution inDanjiangkou Reservoir Basin, Central China. Water 2015, 7, 2591–2611. [CrossRef]
42. Yang, Y.; Zhou, F.; Guo, H.; Sheng, H.; Liu, H.; Dao, X.; He, C. Analysis of spatial and temporal waterpollution patterns in Lake Dianchi using multivariate statistical methods. Environ. Monit. Assess. 2010, 170,407–416. [CrossRef] [PubMed]
43. Alexander, R.B.; Smith, R.A.; Schwarz, G.E. Effect of stream channel size on the delivery of nitrogen to theGulf of Mexico. Nature 2000, 403, 758–761. [CrossRef] [PubMed]
44. Singh, K.P.; Malik, A.; Sinha, S. Water quality assessment and apportionment of pollution sources of Gomtiriver (India) using multivariate statistical techniques-a case study. Anal. Chim. Acta 2005, 538, 355–374.[CrossRef]
45. Juahir, H.; Zain, S.M.; Yusoff, M.K.; Hanidza, T.T.; Armi, A.M.; Toriman, M.E.; Mokhtar, M. Spatial waterquality assessment of Langat River Basin (Malaysia) using environmetric techniques. Environ. Monit. Assess.2011, 173, 625–641. [CrossRef] [PubMed]
46. He, M.; Wang, Z.; Tang, H. Spatial and temporal patterns of acidity and heavy metals in predicting thepotential for ecological impact on the Le An river polluted by acid mine drainage. Sci. Total Environ. 1997,206, 67–77. [CrossRef]
47. Ringler, N.H.; Hall, J.D. Effects of logging on water temperature, and dissolved oxygen in spawning Beds.Trans. Am. Fish Soc. 1975, 104, 111–121. [CrossRef]
© 2016 by the authors; licensee MDPI, Basel, Switzerland. This article is an open accessarticle distributed under the terms and conditions of the Creative Commons by Attribution(CC-BY) license (http://creativecommons.org/licenses/by/4.0/).