Water masses in Kangerlussuaq, a large fjord in West Greenland: the processes of formation and the...
17
Water masses in Kangerlussuaq, a large fjord in West Greenland: the processes of formation and the associated foraminiferal faunaMorten Holtegaard Nielsen, 1 Dorthe Reng Erbs-Hansen 2 & Karen Luise Knudsen 2 1 Arctic Technology Centre, Department of Civil Engineering, Technical University of Denmark, Building 204, Kemitorvet, DK-2800 Kgs. Lyngby, Denmark 2 Department of Earth Sciences, University of Aarhus, Høegh-Guldbergs Gade 2, DK-8000 Århus C, Denmark Abstract The water masses in Kangerlussuaq (Søndre Strømfjord) in West Greenland were studied during both a summer and a winter field survey. In order to obtain an improved understanding of the relationship between the physical oceanography and modern foraminiferal assemblage distributions, conductivity–temperature–density measurements were carried out in connec- tion with sediment surface sampling along a transect through the 180 km long fjord. The exchange between the inner part of Kangerlussuaq (275 m deep) and the ocean is restricted by an almost 100 km long outer, shallow part. Our study shows that the water mass in this inner part is almost decoupled from the open ocean, and that in winter the inner part of the fjord is ice covered and convection occurs as a result of brine release. These processes are reflected in the foraminiferal assemblage, which consists of a sparse agglutinated fauna, indicative of carbonate dissolution. A monospe- cific, calcareous assemblage (Elphidium excavatum forma clavata) occurs in the innermost, shallow part, which is strongly influenced by sediment-loaded meltwater during the summer. The outer, shallow part of the fjord is domi- nated by strong tidal mixing, and in summer the density of the incoming water does not exceed the bottom water density in the inner fjord. The foraminiferal assemblage here reflects high bottom water current velocity and an influence of water with relatively high salinity. Kangerlussuaq can be regarded as a modern analogue for ice-proximal environments in the Quaternary, with a strong seasonal forcing caused by freshwater run-off and sea-ice formation. Keywords Arctic fjord; dense water formation; foraminiferal distribution; mixing; water masses. Correspondence Morten Holtegaard Nielsen, Arctic Technology Centre, Department of Civil Engineering, Technical University of Denmark, Building 204, Kemitorvet, DK-2800 Kgs. Lyngby, Denmark. E-mail: [email protected] doi:10.1111/j.1751-8369.2010.00147.x Generally, there is a close relationship between the water- mass characteristics at the sea floor and the distribution of different species and species groups of benthic foramin- ifera (e.g., Murray 1991, 2006). As foraminiferal tests are usually well preserved in fossil sedimentary records, they are extremely useful in palaeoenvironmental studies. The aim of this paper is to present for the first time new data coupling water-mass characteristics, measured with a conductivity–temperature–density (CTD) probe in Kangerlussuaq (Søndre Strømfjord), West Greenland (Fig. 1), with the distribution of recent foraminifera in the area. This is the basis for an improved understanding of the dynamics of a large fjord, which is strongly influ- enced by both meltwater and tide water, in relation to the characteristics of the modern foraminiferal community. In addition, the results from Kangerlussuaq will contrib- ute to future palaeoceanographic and climatic studies in the same area, as well as to Quaternary palaeoenviron- mental studies in general. A number of investigations of modern foraminiferal distributions in the Arctic have been carried out in shelf and fjord areas, for instance, in the eastern Canadian Arctic (e.g., Vilks 1969, 1989; Scott et al. 1980; Mudie et al. 1983) and in the northern North Atlantic, as well as in the Russian Arctic (e.g., Hansen & Knudsen 1992, 1995; Hald et al. 1994; Hald & Steinsund 1996). Mostly, Polar Research 29 2010 159–175 © 2010 the authors, journal compilation © 2010 Blackwell Publishing Ltd 159
-
Upload
independent -
Category
Documents
-
view
5 -
download
0
Transcript of Water masses in Kangerlussuaq, a large fjord in West Greenland: the processes of formation and the...
Water masses in Kangerlussuaq, a large fjord in WestGreenland: the processes of formation and the associatedforaminiferal faunapor_147 159..175
Morten Holtegaard Nielsen,1 Dorthe Reng Erbs-Hansen2 & Karen Luise Knudsen2
1 Arctic Technology Centre, Department of Civil Engineering, Technical University of Denmark, Building 204, Kemitorvet, DK-2800 Kgs. Lyngby,
Denmark
2 Department of Earth Sciences, University of Aarhus, Høegh-Guldbergs Gade 2, DK-8000 Århus C, Denmark
Abstract
The water masses in Kangerlussuaq (Søndre Strømfjord) in West Greenlandwere studied during both a summer and a winter field survey. In orderto obtain an improved understanding of the relationship between thephysical oceanography and modern foraminiferal assemblage distributions,conductivity–temperature–density measurements were carried out in connec-tion with sediment surface sampling along a transect through the 180 kmlong fjord. The exchange between the inner part of Kangerlussuaq (275 mdeep) and the ocean is restricted by an almost 100 km long outer, shallowpart. Our study shows that the water mass in this inner part is almostdecoupled from the open ocean, and that in winter the inner part of thefjord is ice covered and convection occurs as a result of brine release. Theseprocesses are reflected in the foraminiferal assemblage, which consists of asparse agglutinated fauna, indicative of carbonate dissolution. A monospe-cific, calcareous assemblage (Elphidium excavatum forma clavata) occurs in theinnermost, shallow part, which is strongly influenced by sediment-loadedmeltwater during the summer. The outer, shallow part of the fjord is domi-nated by strong tidal mixing, and in summer the density of the incomingwater does not exceed the bottom water density in the inner fjord. Theforaminiferal assemblage here reflects high bottom water current velocityand an influence of water with relatively high salinity. Kangerlussuaq can beregarded as a modern analogue for ice-proximal environments in theQuaternary, with a strong seasonal forcing caused by freshwater run-off andsea-ice formation.
KeywordsArctic fjord; dense water formation;
foraminiferal distribution; mixing; water
masses.
CorrespondenceMorten Holtegaard Nielsen, Arctic
Technology Centre, Department of Civil
Engineering, Technical University of Denmark,
Building 204, Kemitorvet, DK-2800 Kgs.
Lyngby, Denmark. E-mail: [email protected]
doi:10.1111/j.1751-8369.2010.00147.x
Generally, there is a close relationship between the water-mass characteristics at the sea floor and the distribution ofdifferent species and species groups of benthic foramin-ifera (e.g., Murray 1991, 2006). As foraminiferal tests areusually well preserved in fossil sedimentary records, theyare extremely useful in palaeoenvironmental studies.
The aim of this paper is to present for the first time newdata coupling water-mass characteristics, measured witha conductivity–temperature–density (CTD) probe inKangerlussuaq (Søndre Strømfjord), West Greenland(Fig. 1), with the distribution of recent foraminifera inthe area. This is the basis for an improved understandingof the dynamics of a large fjord, which is strongly influ-
enced by both meltwater and tide water, in relation to thecharacteristics of the modern foraminiferal community.In addition, the results from Kangerlussuaq will contrib-ute to future palaeoceanographic and climatic studies inthe same area, as well as to Quaternary palaeoenviron-mental studies in general.
A number of investigations of modern foraminiferaldistributions in the Arctic have been carried out in shelfand fjord areas, for instance, in the eastern CanadianArctic (e.g., Vilks 1969, 1989; Scott et al. 1980; Mudieet al. 1983) and in the northern North Atlantic, as well asin the Russian Arctic (e.g., Hansen & Knudsen 1992,1995; Hald et al. 1994; Hald & Steinsund 1996). Mostly,
Polar Research 29 2010 159–175 © 2010 the authors, journal compilation © 2010 Blackwell Publishing Ltd 159
(a) (b)
(c1)
(c2)
(c3)
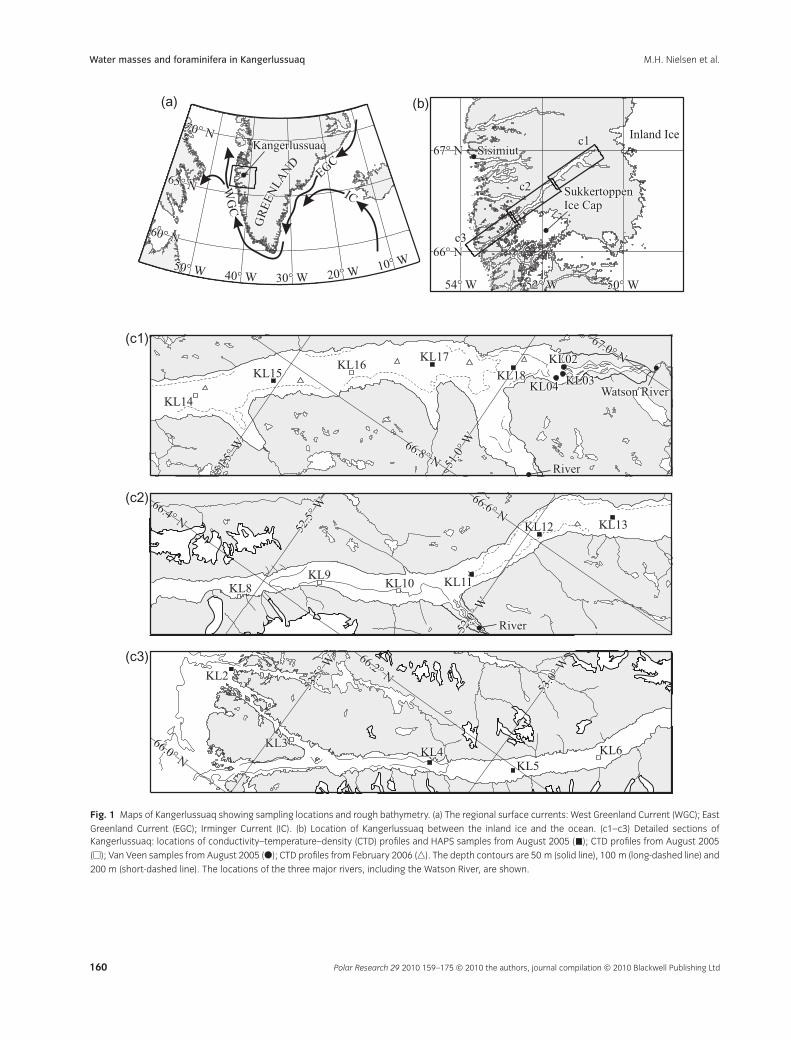
Fig. 1 Maps of Kangerlussuaq showing sampling locations and rough bathymetry. (a) The regional surface currents: West Greenland Current (WGC); East
Greenland Current (EGC); Irminger Current (IC). (b) Location of Kangerlussuaq between the inland ice and the ocean. (c1–c3) Detailed sections ofKangerlussuaq: locations of conductivity–temperature–density (CTD) profiles and HAPS samples from August 2005 ( ); CTD profiles from August 2005
(�); Van Veen samples from August 2005 (�); CTD profiles from February 2006 (�). The depth contours are 50 m (solid line), 100 m (long-dashed line) and
200 m (short-dashed line). The locations of the three major rivers, including the Watson River, are shown.
Water masses and foraminifera in Kangerlussuaq M.H. Nielsen et al.
Polar Research 29 2010 159–175 © 2010 the authors, journal compilation © 2010 Blackwell Publishing Ltd160
these studies refer to previously published oceanographicdata, which may, as also stated by Polyak et al. (2002),lead to inaccurate results, particularly near strong hori-zontal or vertical gradients in the properties of the watermasses.
A few studies of modern foraminiferal distributionshave been carried out in direct connection with measure-ments of water-mass properties in Spitsbergen andnorthern Norway (e.g., Hald & Korsun 1997; Korsun &Hald 1998, 2000; Husum & Hald 2004) or even with CTDmeasurements, as in Greenland fjord and shelf areas(Jennings & Helgadóttir 1994; Madsen & Knudsen 1994;Lloyd 2006a). There is a need for an expansion of thiskind of study in Greenland in order to establish animproved basis for the understanding of palaeoclimaticchanges in the area. Greenland has potentially a numberof modern analogue areas for the specific marine envi-ronments that prevailed in larger parts of the NorthernHemisphere during the Quaternary glacial periods. Par-ticularly important are the many fjords with directcontact to calving glaciers and estuaries with large quan-tities of meltwater entering from the inland ice.
Examples of palaeoenvironmental studies based onfossil benthic foraminiferal assemblages from West andEast Greenland shelf and fjord areas are described byJennings & Weiner (1996), Dowdeswell et al. (2000),Lassen et al. (2004), Lloyd et al. (2005), Lloyd (2006b)and Møller et al. (2006). Palaeoclimatic interpretations ofglacial and interglacial records from onshore sites inNorth, West and East Greenland have been presented by,e.g., Feyling-Hanssen (1990), Feyling-Hanssen & Funder(1990), Bennike et al. (1994), Vosgerau et al. (1994) andKelly et al. (1999).
Physical and hydrographical setting
Kangerlussuaq is a large fjord in West Greenland,located some 100 km to the south-east of Sisimiut (seeFig. 1). It is 180 km long and consists roughly of twoparts: an inner part, which is relatively wide (about4 km) and deep (up to about 275 m), and an outer part,which is relatively narrow (about 1 km) and shallow(25–100 m). The outer, narrow and shallow part occu-pies approximately half of the fjord (ca. 100 km), andbecause of its length, does not resemble a typical sill asfound in many other Arctic fjords (e.g., Hald & Korsun1997; Korsun & Hald 2000; Møller et al. 2006). Thesediment cover is thin, if present, in the outer shallowpart because of strong currents (see below).
The transition between the inner and outer part of thefjord is characterized by a steep slope, rising 230 m over adistance of 20 km. This morphology presumably resultsfrom the hard Archadian bedrock complex, which is
unaffected by later folding phases, occupying the outerpart of the fjord (Henriksen et al. 2000). The inner part,however, was created during the Nagssugtoqidian foldingphase, during which it was metamorphosed and foldedinto the older bedrock, which softened the bedrock some-what, and made it less resistant to erosion (Henriksenet al. 2000). The inner fjord resembles a U-shaped basin:a gorge cut into the bedrock and filled with fine-grainedsediments (observed on the echo sounder).
The oceanographic setting along the West Greenlandcoast (Fig. 1) is governed by the West GreenlandCurrent (WGC), which is a mixture of the East Green-land Current (EGC) and the Irminger Current (IC) (e.g.,Buch 2002). The EGC originates in the Arctic Ocean: itis cold and of relatively low salinity. The IC is a branchof the North Atlantic Current, which is relatively warmand of relatively high salinity. They join at Kap Farveland continue towards north as the WGC (Andersen1981). The EGC component of the WGC dominates thecoastal and upper part of the water column along theWest Greenland coast, until it turns westward around65–66°N, whereas the IC component dominates belowthe EGC component of the WGC and further westwards(Andersen 1981; Buch 2000, 2002). Mixing betweenthe two components (EGC and IC) takes place, and, asthe WGC continues northwards from 65 to 66°N, itconsists mainly of Atlantic Water, which is further trans-formed by mixing with meltwater run-off and icebergcalving along the West Greenland coast.
The fjord is subject to tides with a range of 2–4 m.The tides generate flow speeds of up to several metresper second through the narrow, shallow outer part ofthe fjord. In the summertime, the fjord receives largequantities of freshwater from mainly three rivers thatdrain meltwater from the inland ice and the smallerSukkertoppen Ice Cap, located to the south of the fjord(Fig. 1). Watson River, the larger of these rivers, flowsinto Kangerlussuaq at the innermost point of the fjord(Fig. 1). The freshwater input to the fjord is much influ-enced by the meteorological conditions, and it usuallypeaks in late July or early August. In 2005, the peakflow in Watson River exceeded 1000 m3 s-1 (Hasholt,pers. comm.). From late October to early May the flowin Watson River is close to zero (Tinghuus, pers.comm.).
Additionally, the rivers carry large quantities of fine-grained sediment, which leads to high sedimentationrates in the fjord (data not shown). At the beginning ofNovember, sea ice starts to form in the inner part of thefjord, eventually reaching a thickness of about 1 m. In theouter, shallow part the tidal currents are too strong for iceto form. In the middle of June the ice cover breaks up(Tinghuus, pers. comm.).
Water masses and foraminifera in KangerlussuaqM.H. Nielsen et al.
Polar Research 29 2010 159–175 © 2010 the authors, journal compilation © 2010 Blackwell Publishing Ltd 161
Materials and methods
Two surveys were carried out on Kangerlussuaq, on 3–5August 2005 and 26–27 February 2006. The first wascarried out from a small ship, whereas the second tookplace using a snowmobile on the ice-covered, inner partof the fjord.
A total of 16 stations were visited on the August cruise(Fig. 1). At each station, we made vertical profiles of insitu conductivity and temperature using a 19plus SEACATProfiler (Sea-Bird Electronics, Bellevue, WA, USA). Datawere recorded at 4 Hz, the instrument was lowered at aspeed of up to 0.5 m s-1 and the profiles were continueduntil the instrument touched the bottom. From the obser-vations of conductivity, temperature and pressure,standard software was used to calculate salinity, potentialtemperature and potential density (all dimensionless;UNESCO 1981) (Figs. 2–5). Only data from the down-casts were used.
On this cruise, we also attempted to obtain bottomsediment samples using a HAPS corer (KC DenmarkResearch Equipment, Silkeborg, Denmark), with a totalweight of about 140 kg, and a core length and diameter of30 and 14 cm, respectively. This procedure was only suc-cessful at 12 out of the 16 stations because of the presence
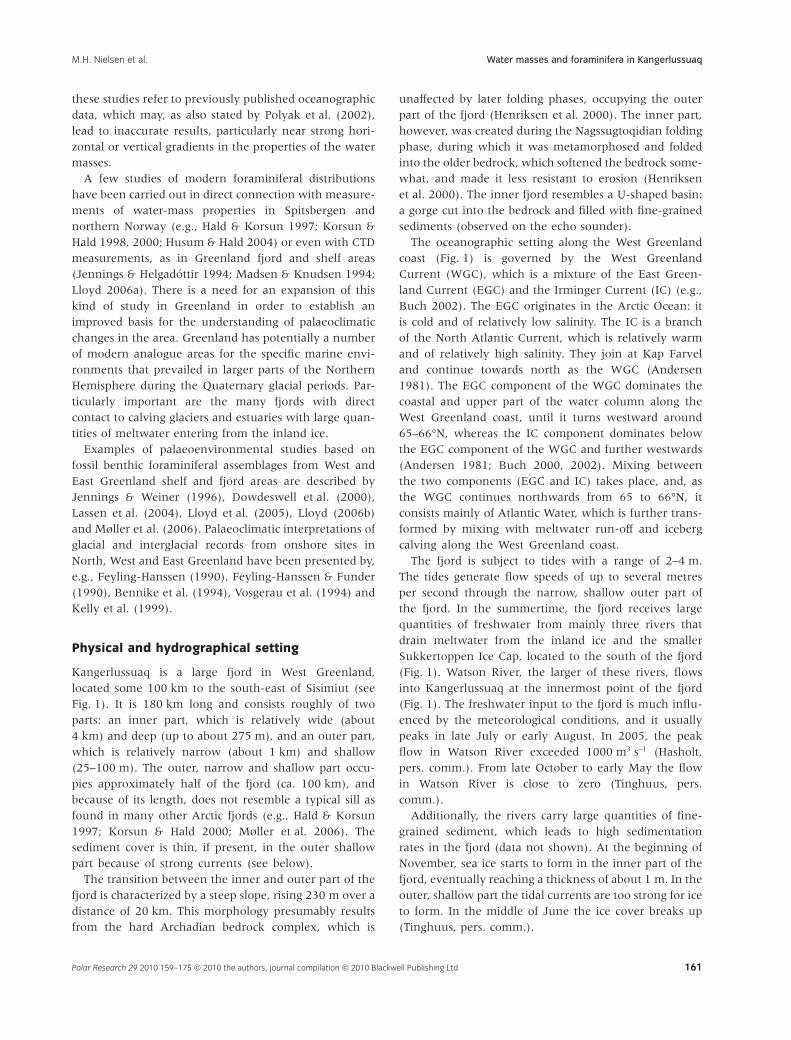
Fig. 2 Along-fjord distribution of (a) potential
temperature and (b) salinity, measured on 3
and 4 August 2005 (1 db = ca. 1 m). The values
at the isolines are as indicated. The locations of
the sampling sites are shown and marked as in
Fig. 1. Note the direction of the plot (from
north-east to south-west).
(a)
(b)
0 5 10 15 20 25 30 35
–2
0
2
4
6
8
10
Salinity (–)
)C°(
erutarepme tlaitn eto
P
00 22 44 66 88 1010 1212 1414 1616 1818 20202222 2424 2626 2828
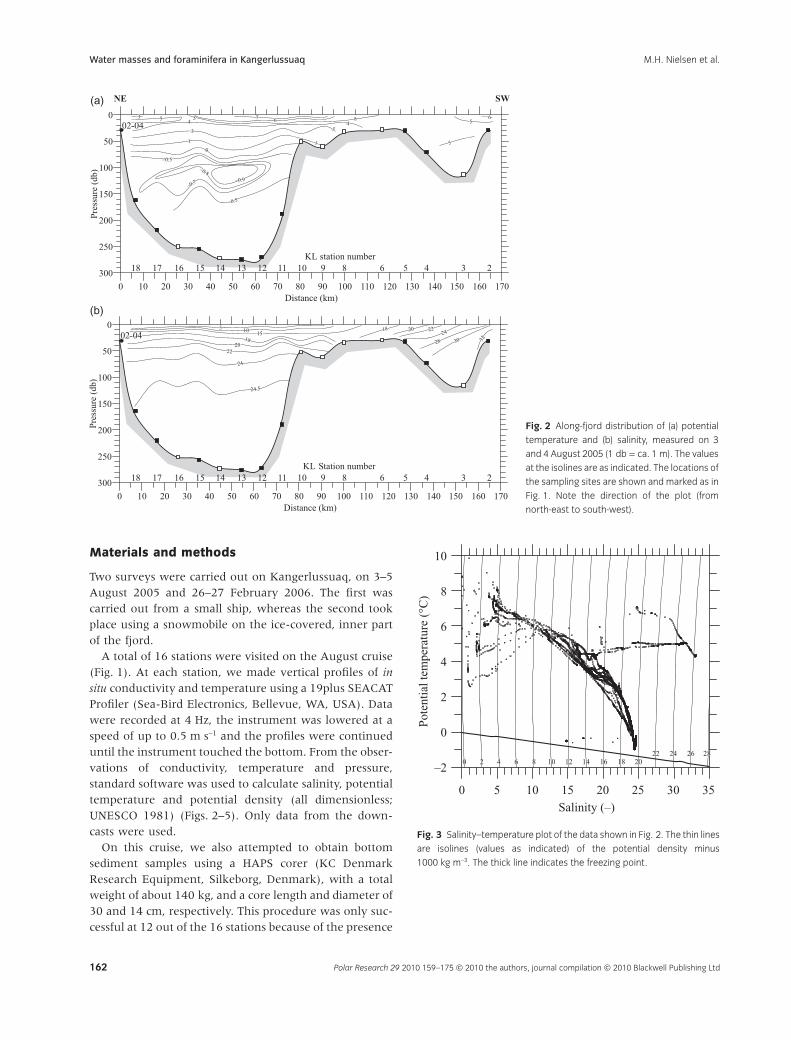
Fig. 3 Salinity–temperature plot of the data shown in Fig. 2. The thin lines
are isolines (values as indicated) of the potential density minus
1000 kg m-3. The thick line indicates the freezing point.
Water masses and foraminifera in Kangerlussuaq M.H. Nielsen et al.
Polar Research 29 2010 159–175 © 2010 the authors, journal compilation © 2010 Blackwell Publishing Ltd162

of coarse bottom sediments at some of the sites. Becauseof the difficulty in handling the HAPS corer in strongcurrents, the stations in the outer, narrow part of the fjordwere visited around slack tide. Additionally, bottom sedi-ment samples were obtained at a few shallow stations inthe innermost part of the fjord using a small Van Veengrab (KC Denmark Research Equipment). In order to beable to study the quantity of living foraminifera comparedwith the number of empty tests, only the top layer (downto a maximum of 5 cm) of the sediment was sampled andused for foraminiferal analysis. Most of the living fora-minifera would occur in the top few centimetres of thesediment.
All the samples for foraminiferal analysis were imme-diately preserved in 60% ethanol (no buffer was added),and were subsequently stained with Rose Bengal onarrival at the Department of Earth Sciences, University ofAarhus, Denmark. The samples were processed a fewweeks after collection. The reliability of the Rose Bengalstaining technique to distinguish live from dead foramin-ifera has been reviewed by Murray & Bowser (2000). Asthe majority of foraminifera die from predation or repro-duction, most of the tests are left empty. Such shellswould not occur as false “positives” in stained samples. In
Fig. 4 Along-fjord distributions of (a) potential
temperature and (b) salinity, measured on 26
and 27 February 2006 (1 db = ca. 1 m). The
values at the isolines are as indicated. The loca-
tions of the sampling sites are shown and
marked as in Fig. 1. Note the direction of the
plot (from north-east to south-west).
(a)
(b)
18.518.5 1919 19.519.5 20201818
22 23 24 25
–1.5
–1
–0.5
0
Salinity (–)
)C°(
erutarepmetlaitneto
P
Fig. 5 Salinity–temperature plot of the data shown in Fig. 4. The thin lines
are isolines (values as indicated) of the potential density minus
1000 kg m-3. The thick line indicates the freezing point.
Water masses and foraminifera in KangerlussuaqM.H. Nielsen et al.
Polar Research 29 2010 159–175 © 2010 the authors, journal compilation © 2010 Blackwell Publishing Ltd 163
anoxic or hypoxic environments, dead individuals aremore likely to be found containing protoplasm because ofless, or maybe even absent, predation, and a relativelyslow decay rate. As the sediments in Kangerlussuaq donot show any sign of anoxia or hypoxia, we regard theRose Bengal technique as reliable for our study.
The samples for foraminiferal analysis were processedin accordance with the standard method described byFeyling-Hanssen et al. (1971) and Knudsen (1998). Thevolume of each sediment sample preserved in alcohol wasmeasured before it was washed through sieves with meshdiameters of 0.063, 0.1 and 1.0 mm. The different sizefractions were subsequently dried at ca. 50°C, and theforaminifera in the 0.1–1.0-mm fraction were concen-trated using tetrachlorethylen (C2Cl4) with a specificgravity of 1.62 g cm-3.
The foraminiferal assemblages were analysed in the0.1–1.0-mm fraction by counting at least 300 specimensof each of the four following benthic groups, wherepossible: calcareous stained, calcareous unstained, agglu-tinated stained and agglutinated unstained tests. This,however, was only possible for two samples. All the avail-able sediment material has been processed and analysedfor each of the remaining samples (Tables 1, 2). A speci-men was defined as living when at least one chamber wasevenly stained.
Our preparation method differs from that of, e.g., Lloyd(2006a, b), who counted the 63-mm fraction of his fora-miniferal assemblages from wet samples in order to avoiddestroying the fragile agglutinated tests. Our sampleswere not dried before washing either, whereas the frac-tion 0.1–1.0 mm was dried before counting. There is,however, no indication of any disintegration or loss ofagglutinated tests in our samples. The differences inpreparation methods could cause minor dissimilarities inthe abundance of particularly the small and/or fragileagglutinated taxa, but we assume these to be insignificantfor our qualitative comparisons.
A brief overview of the foraminiferal distribution wasobtained, even though the counted number of foramin-ifera was generally low, and the uncertainty wasaccordingly high. A total of 53 taxa were identified: 29calcareous and 21 agglutinated (Tables 1, 2). Because ofthe low numbers of foraminifera in most of the samples,only a limited statistical treatment of the data has beenapplied. For the specimen-rich samples, the percentage ofeach species (stained + unstained) is calculated in relationto the total assemblage (TA: calcareous stained andunstained as well as agglutinated stained and unstainedtests), and is presented as histograms for selected speciesin Fig. 6, together with the percentage of stained (living)tests of each species (stained + unstained). For the per-centage calculations, a minimum of 30 specimens
(stained + unstained) were used. The number of speci-mens per 100 ml of sediment is also indicated (Fig. 6,Table 2). The total counts of all the observed taxaare shown in Tables 1 and 2. The samples have beendivided into four assemblage zones based on speciescompositions.
The February survey took place on the ice-covered partof the fjord, which includes only the inner, deep part. Atsix stations, distributed almost evenly throughout thisarea, holes were cut in the ice cover (up to 80 cm thick),and CTD profiles were made using the same instrumentas described above. As a result of the cold air, part of thepump and hose system of the CTD froze between deploy-ments, and was thawed using hot water. No bottomsamples were obtained during the February survey.
Results
Physical oceanography
The temperature and salinity data from the August cruiseare shown in Fig. 2, presented as contour plots based onthe 16 vertical CTD profiles. The contour lines weredrawn by hand to avoid problems with large differencesbetween the horizontal and vertical resolution. The innerpart of the fjord appears to be strongly stratified, with thesalinity increasing from close to zero at the surface toabout 24 at the bottom, and with the temperaturedecreasing from above 7°C at the surface to -0.9°C atintermediate depths. Through the outer part of the fjord,the salinity and temperature change gradually toward thevalues found in the coastal water masses, i.e., a salinity ofabout 32 and a temperature of about 5°C. As oneapproaches the wide and deep inner part of the fjord, thetidal currents decrease and stratification develops.
Data from the August cruise are also illustrated in asalinity–temperature diagram (Fig. 3), together with linesof constant density and the freezing point. The density ofthe profile data used in Fig. 3 is roughly one observationper metre. In the present case, the water masses includeprimarily the coastal water (high salinity, intermediatetemperature), the brackish surface layer (low salinity,intermediate to high temperature) and the deep layer inthe inner part of the fjord (salinity around 24.5, lowtemperature). Notably, the large number of data pointsassociated with the deep layer are located in a small areaof the plot, with the salinity ranging from 24.2 to 24.7and the temperature ranging from -0.9 to -0.5°C. Thiscorresponds to an extremely narrow range of density,indicating that the deep layer is almost homogeneousbelow 80 m.
Temperature and salinity observations from the Febru-ary survey are shown in Fig. 4 (also see description for
Water masses and foraminifera in Kangerlussuaq M.H. Nielsen et al.
Polar Research 29 2010 159–175 © 2010 the authors, journal compilation © 2010 Blackwell Publishing Ltd164
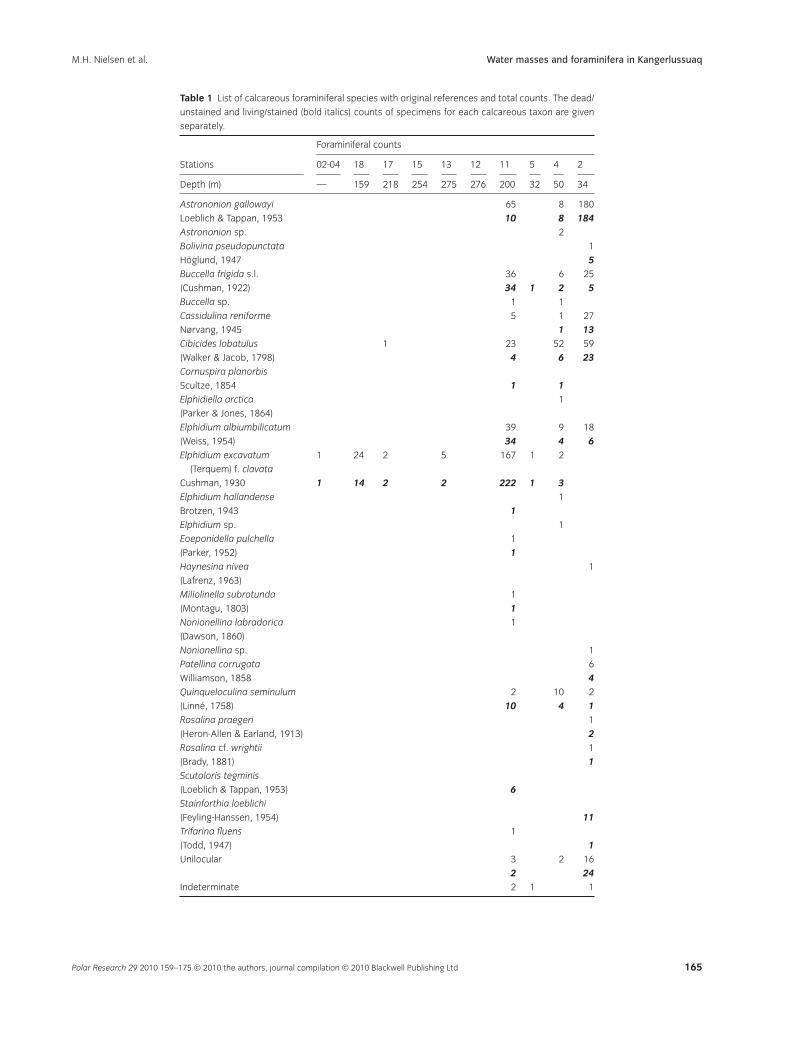
Table 1 List of calcareous foraminiferal species with original references and total counts. The dead/
unstained and living/stained (bold italics) counts of specimens for each calcareous taxon are given
separately.
Foraminiferal counts
Stations 02-04 18 17 15 13 12 11 5 4 2
Depth (m) — 159 218 254 275 276 200 32 50 34
Astrononion gallowayi 65 8 180
Loeblich & Tappan, 1953 10 8 184Astrononion sp. 2
Bolivina pseudopunctata 1
Höglund, 1947 5Buccella frigida s.l. 36 6 25
(Cushman, 1922) 34 1 2 5Buccella sp. 1 1
Cassidulina reniforme 5 1 27
Nørvang, 1945 1 13Cibicides lobatulus 1 23 52 59
(Walker & Jacob, 1798) 4 6 23Cornuspira planorbis
Scultze, 1854 1 1Elphidiella arctica 1
(Parker & Jones, 1864)
Elphidium albiumbilicatum 39 9 18
(Weiss, 1954) 34 4 6Elphidium excavatum
(Terquem) f. clavata
1 24 2 5 167 1 2
Cushman, 1930 1 14 2 2 222 1 3Elphidium hallandense 1
Brotzen, 1943 1Elphidium sp. 1
Eoeponidella pulchella 1
(Parker, 1952) 1Haynesina nivea 1
(Lafrenz, 1963)
Miliolinella subrotunda 1
(Montagu, 1803) 1Nonionellina labradorica 1
(Dawson, 1860)
Nonionellina sp. 1
Patellina corrugata 6
Williamson, 1858 4Quinqueloculina seminulum 2 10 2
(Linné, 1758) 10 4 1Rosalina praegeri 1
(Heron-Allen & Earland, 1913) 2Rosalina cf. wrightii 1
(Brady, 1881) 1Scutoloris tegminis
(Loeblich & Tappan, 1953) 6Stainforthia loeblichi
(Feyling-Hanssen, 1954) 11Trifarina fluens 1
(Todd, 1947) 1Unilocular 3 2 16
2 24Indeterminate 2 1 1
Water masses and foraminifera in KangerlussuaqM.H. Nielsen et al.
Polar Research 29 2010 159–175 © 2010 the authors, journal compilation © 2010 Blackwell Publishing Ltd 165
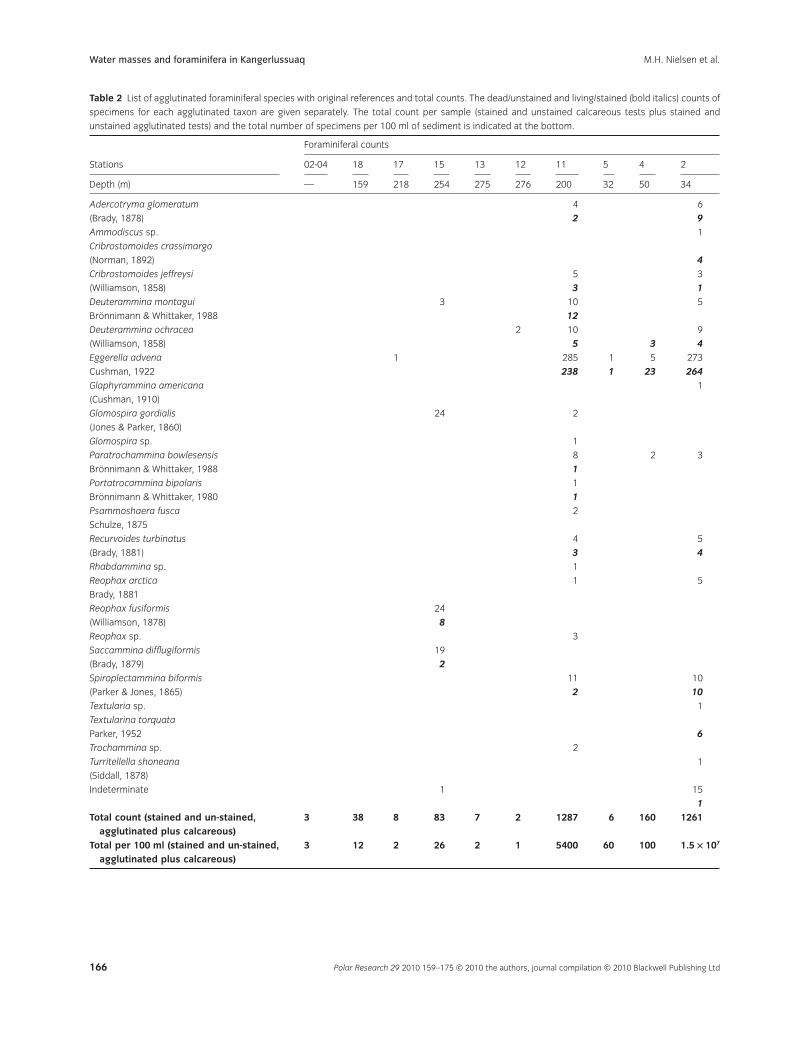
Table 2 List of agglutinated foraminiferal species with original references and total counts. The dead/unstained and living/stained (bold italics) counts of
specimens for each agglutinated taxon are given separately. The total count per sample (stained and unstained calcareous tests plus stained and
unstained agglutinated tests) and the total number of specimens per 100 ml of sediment is indicated at the bottom.
Foraminiferal counts
Stations 02-04 18 17 15 13 12 11 5 4 2
Depth (m) — 159 218 254 275 276 200 32 50 34
Adercotryma glomeratum 4 6
(Brady, 1878) 2 9Ammodiscus sp. 1
Cribrostomoides crassimargo
(Norman, 1892) 4Cribrostomoides jeffreysi 5 3
(Williamson, 1858) 3 1Deuterammina montagui 3 10 5
Brönnimann & Whittaker, 1988 12Deuterammina ochracea 2 10 9
(Williamson, 1858) 5 3 4Eggerella advena 1 285 1 5 273
Cushman, 1922 238 1 23 264Glaphyrammina americana 1
(Cushman, 1910)
Glomospira gordialis 24 2
(Jones & Parker, 1860)
Glomospira sp. 1
Paratrochammina bowlesensis 8 2 3
Brönnimann & Whittaker, 1988 1Portatrocammina bipolaris 1
Brönnimann & Whittaker, 1980 1Psammoshaera fusca 2
Schulze, 1875
Recurvoides turbinatus 4 5
(Brady, 1881) 3 4Rhabdammina sp. 1
Reophax arctica 1 5
Brady, 1881
Reophax fusiformis 24
(Williamson, 1878) 8Reophax sp. 3
Saccammina difflugiformis 19
(Brady, 1879) 2Spiroplectammina biformis 11 10
(Parker & Jones, 1865) 2 10Textularia sp. 1
Textularina torquata
Parker, 1952 6Trochammina sp. 2
Turritellella shoneana 1
(Siddall, 1878)
Indeterminate 1 15
1Total count (stained and un-stained,
agglutinated plus calcareous)3 38 8 83 7 2 1287 6 160 1261
Total per 100 ml (stained and un-stained,agglutinated plus calcareous)
3 12 2 26 2 1 5400 60 100 1.5 ¥ 107
Water masses and foraminifera in Kangerlussuaq M.H. Nielsen et al.
Polar Research 29 2010 159–175 © 2010 the authors, journal compilation © 2010 Blackwell Publishing Ltd166
Fig. 2). The contour plots are based on vertical CTD pro-files obtained at six locations on the ice-covered part ofthe fjord. At that time, the ice cover reached roughly thelocation of station KL11, from where the tidal currentsapparently became too strong for ice to form. Contrary tothe summer situation, the temperature and salinity showmuch smaller vertical gradients, with the temperaturebeing low and the salinity being relatively high through-out the inner, deep part of the fjord. When plotted in asalinity–temperature diagram (Fig. 5; also see descriptionfor Fig. 3), the subtle differences between the watermasses become apparent. Below a depth of roughly125 m, the fjord is occupied by a water mass of relativelyhigh salinity (24.0–24.4) and relatively high temperature(from -0.3 to -0.6°C). This is the densest water in thefjord (Fig. 5). Above this, reaching up to a depth of about30 m, is a water mass that is extremely cold, with thetemperature ranging from -1.0 to -1.25°C, and with asalinity from about 23.4 to 24.0, which is close to thefreezing point. More structure in the water masses is seenin the uppermost part of the water column. Betweenroughly 10 and 20 m, there is a thin layer with a tem-perature from -0.5 to -0.7°C and a salinity of 23.0–23.3,which is well above the freezing point. Just below the ice,the conditions are close to freezing, with the temperaturebeing about -1.2°C and the salinity ranging from22.3 to 23.0. This water is only slightly lighter than theunderlying layer.
Foraminifera
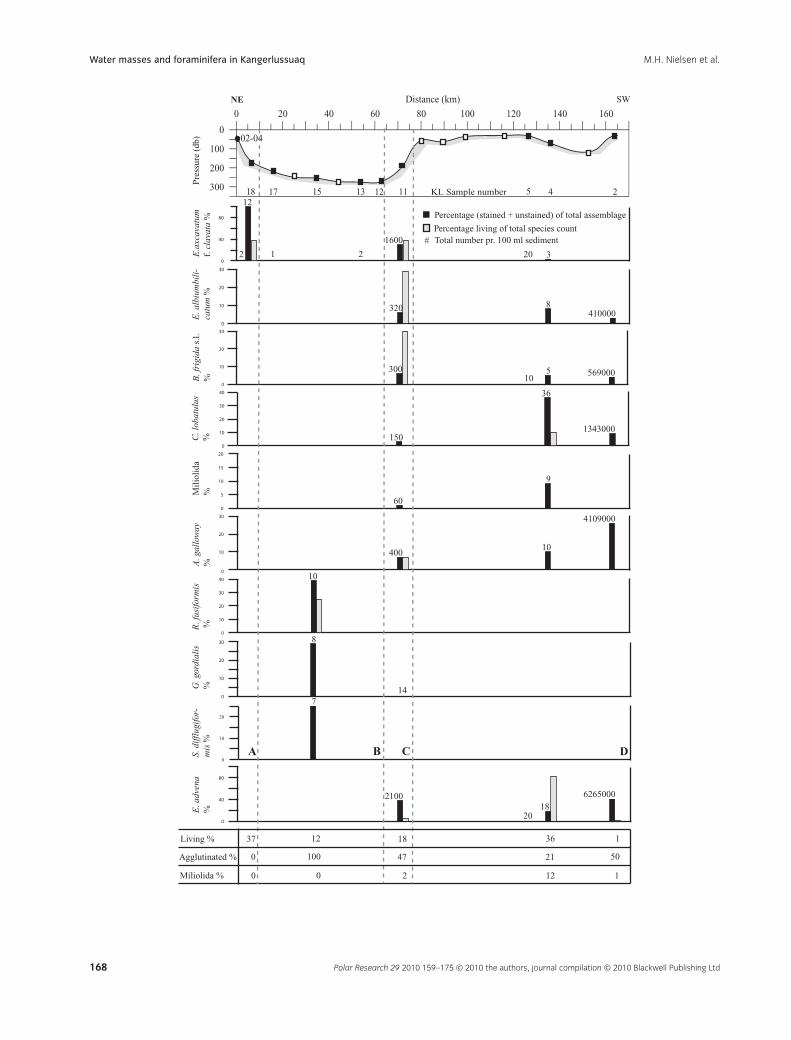
The samples from Kangerlussuaq have been divided intofour assemblage zones (zones A–D) based on the foramin-iferal contents (Fig. 6).
Zone A (samples KL02–04 and KL18) from the innerpart of the fjord (Fig. 6) is largely affected by the meltwa-ter from the inland ice. The samples are characterized bysparse foraminiferal contents. A monospecific calcareousassemblage of Elphidium excavatum forma clavata, with ahigh percentage of living specimens, occurs close to theWatson River outlet.
Most of the samples from zone B (KL17–12; Fig. 6)contain sparse assemblages, with only one being rich inforaminifera. Agglutinated species are totally dominant inthis deepest part of the fjord (275 m depth). The mostcommon species are Reophax fusiformis together with Glo-mospira gordialis and Saccammina difflugiformis, but only R.fusiformis and S. difflugiformis were observed to be living(Table 2). Among the few calcareous foraminifera found,a relatively large number were observed to be alive.
Sample KL11 (zone C; Fig. 6) differs from the otherinner fjord samples in that it has a much higher abun-dance of foraminifera. The sample derived from the
transitional slope between the inner, deep part and theouter, shallow part of the fjord, at a water depth of 204 m.The fauna has a slight dominance of calcareous species. Inthe calcareous portion of the fauna, the dominant taxonis E. excavatum f. clavata, followed by Astrononion gallowayi,Bucella frigida s.l. (mainly B. frigida forma calida Cushman& Cole, 1930), Elphidium albiumbilicatum and Cibicideslobatulus. A high proportion of living specimens of E.excavatum f. clavata, B. frigida s.l. and E. albiumbilicatumwas observed. The agglutinated part of the fauna is domi-nated by Eggerella advena, with Deuterammina ochracea,Deuterammina montagui and Spiroplectammina biformis asassociated species. Few living specimens were found inthe agglutinated fauna (Fig. 6).
Samples KL5, KL4 and KL2 are grouped in zone D,which is here extended to the edge of the slope (Fig. 6).Only a few samples were retrieved from this outer,shallow part of the fjord because of difficulties with sam-pling in coarse sediment and strong currents. The fauna isdominated by calcareous foraminifera with C. lobatulus, A.gallowayi and Quinqueloculina seminulum (Miliolida; Fig. 6)as the most abundant species. Three agglutinated speciesare observed, with E. advena being dominant. A total of82% of E. advena were found to be alive at the time ofsampling.
In order to obtain an indication of the faunal compo-sition in an area dominated by coastal water, one of thesamples was retrieved just outside the fjord outlet (KL2).This sample contains a mixed fauna with an equal domi-nance of the agglutinated and calcareous species groups,and with high species diversity and density. In the calcar-eous part of the fauna, A. gallowayi is dominant, followedby C. lobatulus, E. albiumbilicatum and B. frigida s.l. Amongagglutinated species, E. advena is dominant, followed byS. biformis, D. montagui/ochracea and several others. Thepercentage of living specimens is low in this sample, atonly 1% (Fig. 6).
Environmental interpretation
Physical oceanography
In the inner, deep part of Kangerlussuaq, two watermasses clearly stand out in the summer observations.These are the freshwater-influenced layer, occupying theupper 50–75 m of the water column, and the cold andrelatively saline layer, occurring at depths below about75 m (Fig. 2). The former is closely connected with theseasonal input of meltwater from the ice caps. On theother hand, the properties of the deep-lying water mass,i.e., a temperature from -0.9 to -0.5°C and a salinity ofabout 24.5, which is close to the freezing point at surfacepressure, suggest that this was formed in the wintertime,
Water masses and foraminifera in KangerlussuaqM.H. Nielsen et al.
Polar Research 29 2010 159–175 © 2010 the authors, journal compilation © 2010 Blackwell Publishing Ltd 167
0 20 40 60 80 100 120 140 160
Distance (km)
0
100
200
300
02-04
18 17 15 13 12 11 5 4 2KL Sample numberA
. gal
low
ay
%P
ress
ure
(db)
B. f
rigi
da s
.l.
%C
. lob
atul
us%
E.a
xcav
atum
f. c
lava
ta %
Mil
ioli
da%
E. a
lbiu
mbi
li-
catu
m %
Percentage (stained + unstained) of total assemblage
Percentage living of total species count# Total number pr. 100 ml sediment
0
40
80
0
10
20
30
0
10
20
30
0
10
20
30
40
0
5
10
15
20
0
10
20
30
0
10
20
30
40
R. f
usifo
rmis
%
0
10
20
30
G. g
ordi
alis
%
0
40
80
E. a
dven
a %
Living %
0
10
20
S. d
iffl
ugifo
r-m
is %
Miliolida %
Agglutinated %
2
12
1 2
1600
20 3
320 8410000
30010
5 569000
150
36
1343000
60
9
40010
4109000
10
8
147
2100
2018
6265000
A B C D
37 12 18 36 1
100 47 21 50
2 12 1
NE SW
0
00
Water masses and foraminifera in Kangerlussuaq M.H. Nielsen et al.
Polar Research 29 2010 159–175 © 2010 the authors, journal compilation © 2010 Blackwell Publishing Ltd168
in connection with strong cooling and the formation ofice. The latter process is associated with brine release andfree convection, which may explain why the deep-lyingwater mass is almost homogeneous. We therefore assumethat cooling and ice formation play a prominent role inshaping the physical oceanographic conditions in thefjord.
The gradual change of the density throughout theupper 50–75 m indicates that this layer is not subject toparticularly strong wind mixing, and that the large, deep-lying volume of cold, saline water is effectively shelteredfrom mixing from above. Additionally, in the presentsituation, the water masses that enter from the outer partof the fjord are actually less dense than the deep-lyingwater mass in the fjord, because of a strong, tidally drivenmixing in the outer, shallow part. Large horizontal gra-dients and small vertical gradients, as found in the outerpart of the fjord, are typical features of an estuary that issubject to intense mixing, in this case because of tidalflows (Fischer et al. 1979). The water mass along thecoast of West Greenland, which has a summer tempera-ture of about 5°C and a salinity of 33, and is thereforerelatively dense, is thus being considerably modifiedbefore it reaches the inner part of the fjord (see Fig. 3).From the situation shown in Fig. 2, we speculate that thedeep-lying layer in the inner part of the fjord is hardlysubject to any renewal during the summer, and that newwater masses can only be added during the period ofcooling and ice formation in the wintertime. We furthernote that in the depth range from about 20 to 75 m, thereis a large body of water with salinity ranging from 15 to24, with a temperature ranging from 4 to 0°C, which isless dense than the deep-lying water, but which is muchdenser than the surface water. It may be that this inter-mediate water was created earlier in the summer, whenthe outflow of freshwater was smaller.
The winter survey was carried out in order to investi-gate whether the deep-lying water mass in the inner partof the fjord was created during the wintertime, and,if so, to study the resulting environmental conditions.Throughout the entire water column, we found watermasses of properties close to the surface freezing point(Figs. 4, 5). This observation shows that cooling and iceformation are indeed the primary physical processes inwintertime. Furthermore, the subtle differences that are
apparent from Fig. 5 shed some light on the conditionsunder the ice, suggesting that the different water masseshave been created by different processes. The twoextremely cold water masses, located just below the iceand at depths between 125 and 30 m, seem to be a directresult of ice formation. On the other hand, the two watermasses with temperatures somewhat above the freezingpoint, one of which is occupying the large volume belowa depth of 125 m, could have been formed by convectivemixing as a result of brine release.
It is notable that the vertical gradients seem to besmaller at either end of the inner, deep part of the fjord(Figs. 2, 4). In Fig. 5 these observations appear as a cloudof data points of temperatures from -0.6 to -0.8°C, andsalinities between 23.4 and 23.8. A possible explanationis mixing caused by the propagation and breaking ofinternal waves, which could be created by the strong tidalcurrents in the outer, narrow part of the fjord (e.g.,Arneborg & Liljebladh 2001; Allen & Simpson 2002). Theundulations of the isolines seen in Fig. 2 at the transitionbetween the two parts of the fjord support thishypothesis.
Foraminifera
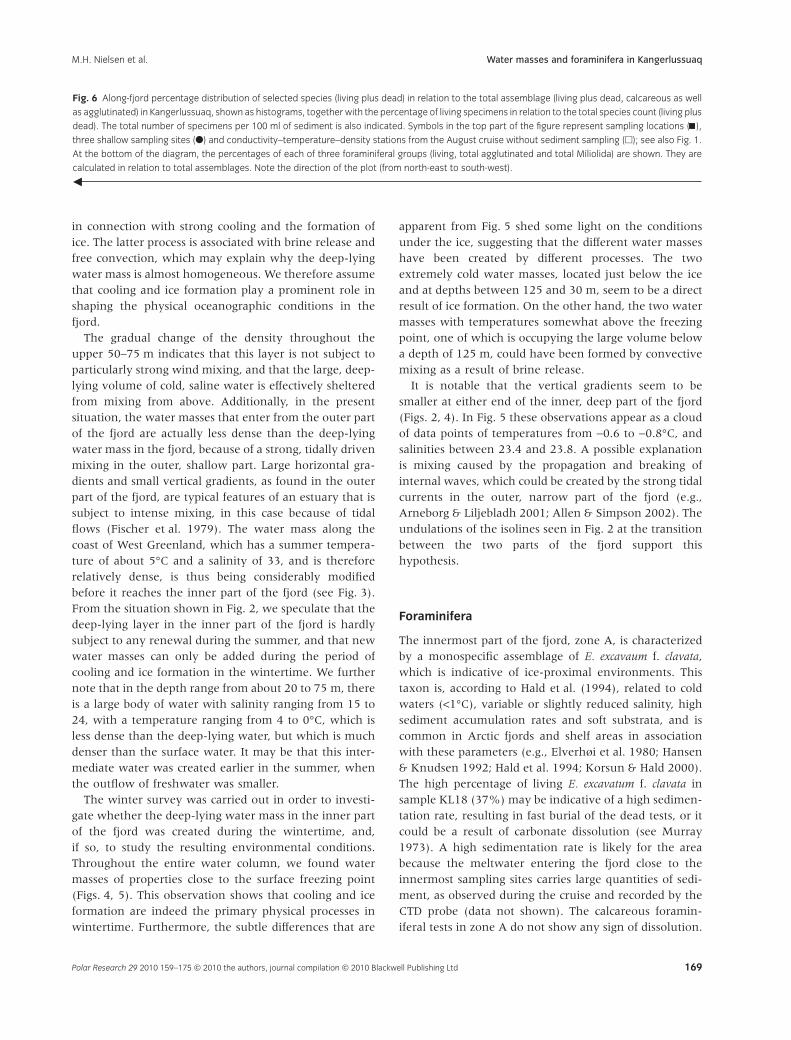
The innermost part of the fjord, zone A, is characterizedby a monospecific assemblage of E. excavaum f. clavata,which is indicative of ice-proximal environments. Thistaxon is, according to Hald et al. (1994), related to coldwaters (<1°C), variable or slightly reduced salinity, highsediment accumulation rates and soft substrata, and iscommon in Arctic fjords and shelf areas in associationwith these parameters (e.g., Elverhøi et al. 1980; Hansen& Knudsen 1992; Hald et al. 1994; Korsun & Hald 2000).The high percentage of living E. excavatum f. clavata insample KL18 (37%) may be indicative of a high sedimen-tation rate, resulting in fast burial of the dead tests, or itcould be a result of carbonate dissolution (see Murray1973). A high sedimentation rate is likely for the areabecause the meltwater entering the fjord close to theinnermost sampling sites carries large quantities of sedi-ment, as observed during the cruise and recorded by theCTD probe (data not shown). The calcareous foramin-iferal tests in zone A do not show any sign of dissolution.
Fig. 6 Along-fjord percentage distribution of selected species (living plus dead) in relation to the total assemblage (living plus dead, calcareous as well
as agglutinated) in Kangerlussuaq, shown as histograms, together with the percentage of living specimens in relation to the total species count (living plus
dead). The total number of specimens per 100 ml of sediment is also indicated. Symbols in the top part of the figure represent sampling locations ( ),
three shallow sampling sites (�) and conductivity–temperature–density stations from the August cruise without sediment sampling (�); see also Fig. 1.
At the bottom of the diagram, the percentages of each of three foraminiferal groups (living, total agglutinated and total Miliolida) are shown. They are
calculated in relation to total assemblages. Note the direction of the plot (from north-east to south-west).
�
Water masses and foraminifera in KangerlussuaqM.H. Nielsen et al.
Polar Research 29 2010 159–175 © 2010 the authors, journal compilation © 2010 Blackwell Publishing Ltd 169
The sparse agglutinated assemblages in the deepest partof the fjord, zone B, indicate an unfavourable environ-ment for foraminifera, particularly for a calcareous fauna.The dominant species, R. fusiformis, is typical for relativelyshallow areas in Arctic environments (Vilks 1969, 1989)as well as Atlantic-sourced environments (Vilks 1969,1989; Lloyd 2006a). Vilks & Deonarine (1988) found R.fusiformis within a wide range of salinity and tempera-tures (30–35 and 0–4°C) on the Labrador Shelf, whereasLloyd (2006a) regards R. fusiformis as an indicator ofAtlantic Water. Jennings & Helgadóttir (1994) recordedthis species (as R. subfusiformis Earland, 1933) togetherwith S. difflugiformis in three fjords and adjoining shelfareas in East Greenland, related to both Atlantic Inter-mediate Water (warm, high salinity) and Polar Water(cold, low salinity). The other common species, G. gordialis,was found together with S. difflugiformis in agglutinatedassemblages dominated by the genus Reophax in ScoresbySund Fjord (Madsen & Knudsen 1994). In that area, thesetaxa were found at a much shallower water depth than inKangerlussuaq, and were associated with Polar Water.Thus, it seems that R. fusiformis and S. difflugiformis are notonly associated with Atlantic waters, as suggested byLloyd (2006a), but they also occur in cold, low-salinitywaters.
The assemblage characteristics in the deep part ofKangerlussuaq (zone B) indicate a hostile environment,possibly with carbonate dissolution. Agglutinated assem-blages are often associated with Polar Water, and arerelated to permanent/semi-permanent ice cover (e.g.,Wollenburg & Mackensen 1998; Wollenburg et al. 2004)or to strong brine formation in enclosed basins (Seiden-krantz et al. 2007), where CO2 is brought to the sea flooras a result of freezing processes (Steinsund & Hald 1994;Hald & Steinsund 1996). Schröder-Adams et al. (1990)also reported that assemblages characterized by aggluti-nated foraminifera reflected increased sea-ice coverduring periods of intensified atmospheric and surface-water cooling.
The water mass in Kangerlussuaq has characteristicssimilar to Polar Water, i.e., low temperature and reducedsalinity, and the CTD measurements indicate that thebottom waters in the inner, deep part of the fjord arealmost decoupled from the ocean, and that renewal of thebottom water occurs as a consequence of brine releaseduring winter, when the fjord is ice covered. Steinsund &Hald (1994) found that the mixing of Arctic and Atlanticwaters, combined with seasonal ice cover, produces densebottom water that is very cold and saline, and highlyoxygenated. In Kangerlussuaq, however, the bottomwater salinity is only 24.5, which is relatively high com-pared with the rest of the fjord, but is low compared withthe open ocean. The oxygen level has not been measured,
but the sediment consists of grey clay/silt without anyindications of low oxygen content. Steinsund & Hald(1994) found that dissolution of calcareous tests occurs atthe sediment–water interface, when the decay of organicmatter produces high concentrations of CO2. Thus, thecalcareous component of the assemblages in the inner,deep part of Kangerlussuaq has possibly been exposed tocarbonate dissolution, and assemblage zone B representsa residual assemblage of agglutinated foraminifera.
The calcareous part of the fauna in zone C, from thetransitional slope between the inner, deep and the outer,shallow parts, is typical for relatively stable salinity areasin Arctic marine environments. This is particularly indi-cated by the presence of A. gallowayi and B. frigida s.l. (cf.Haynes 1973; Hald & Korsun 1997). The dominance of E.excavatum f. clavata, however, would indicate some influ-ence of low-salinity waters in the area. The dominantagglutinated species, E. advena, is typical in Arctic waters,and is often associated with shallow water depth (Lloyd2006a). This species is also tolerant to high contents oforganic material and/or low oxygen concentrations, forexample, in eutrophic areas (Barmawidjaja et al. 1995;Alve 1999; Tsujimoto et al. 2008). The agglutinatedspecies D. montagui, D. ochracea and S. biformis are cold-water species (Brönnimann & Whittaker 1988; Hald &Korsun 1997), whereas Recurvoides turbinatus and Adercot-ryma glomeratum have been found to be associated withtransformed Atlantic Water (Hald & Korsun 1997; Lloyd2006a).
The shift from an extremely sparse agglutinated assem-blage in zone B to a specimen-rich and diverse fauna,slightly dominated by calcareous taxa, in zone C, suggeststhat the environmental conditions are different. The CTDmeasurements (Fig. 2), however, do not show any impor-tant difference between these sampling areas. Thetemperature and the salinity are similar in the two areas.This would indicate that other environmental param-eters, e.g., the nutrient supply, are determining the faunaldifferences. As KL11 is a shallower site with lower pres-sure, the water might be less corrosive to carbonate thanin the deepest part of the fjord, even though the domi-nance of living calcareous foraminifera in KL11 mayindicate an under-representation of carbonate in the totalassemblage at that site.
Additionally, station KL11 is located where the fjordwidens significantly, which causes the current speed ofthe incoming water to be reduced, as indicated by thechange from coarse sediments in the outer, shallow partto clay sedimentation on the slope (zone C) and in theinner, deep part of the fjord (zone B). It is also indicatedby the change in the isolines, from diagonal to horizontal,as the incoming water becomes the surface layer in theinner, deep part of the fjord (Fig. 2). The abrupt reduction
Water masses and foraminifera in Kangerlussuaq M.H. Nielsen et al.
Polar Research 29 2010 159–175 © 2010 the authors, journal compilation © 2010 Blackwell Publishing Ltd170
in current speed at the transition to the inner, deep part ofthe fjord would allow organic material to settle on theslope and create the basis for a rich foraminiferal com-munity of species related to high organic contents, asevidenced by the dominance of E. advena, and by theincreased density of foraminifera (5400 individuals per100 ml). Large quantities of organic material, such asremnants of seaweed, as well as diatoms, ostracods andother crustaceans, were observed in the sample, but nomeasurements of organic contents are available. The fora-miniferal faunal composition in zone C is typical for anArctic environment influenced by meltwater (e.g., Vilks &Deonarine 1988; Jennings & Helgadóttir 1994; Hald &Korsun 1997; Lloyd 2006a).
The assemblage found in the outer, shallow part of thefjord, zone D, is typical for areas with relatively strongbottom water currents. The dominant species, C. lobatulus,is related to areas with high current velocities and coarsesubstrata, where it lives as an attached form on sand,pebbles or seaweed in normal marine or slightly reducedsalinity (Haynes 1973; Jennings & Helgadóttir 1994; Hald& Korsun 1997). The low percentage of living C. lobatulusis probably a result of the habitat of this species, ratherthan an actual measure of the number of living specimensat the locality. Hald & Korsun (1997) found a positivecorrelation between a low number of living C. lobatulusand a low sedimentation rate, which allows the accumu-lation of dead tests on the surface over several years. Thisinterpretation is in accordance with the fact that the seafloor of the outer, shallow part of Kangerlussuaq isexposed to strong tidal currents, and that the sedimentsamples consist of sand and pebbles.
The high percentage of living E. advena in sample KL4does not, however, fit with the indication of a low sedi-mentation rate, as interpreted from the low number ofliving C. lobatulus. A high post-mortem disintegration ofthe agglutinated tests because of the strong energy envi-ronment might explain this relatively high percentage ofliving specimens of E. advena. Sample KL4 is the onlysample in the data set that contains a notable percentageof Miliolida, mainly Q. seminulum (12%). Q. seminulum isa cosmopolitan species, which is most common inshallow waters with salinities around 33 (Murray 1991).Its presence in KL11 indicates an influence from the openocean into the outer, shallow part of the fjord, which iswell supported by the hydrological data.
The general composition of the fauna outside of thefjord (KL2) is close to that found in zone C. However, E.excavatum f. clavata is not present in KL2, the percentageof A. gallowayi is significantly higher, and the speciesdiversity is higher than in zone C. This indicates that theenvironment is more like the normal marine environ-ment, and less influenced by meltwater, outside the fjord
than on the slope, as is also supported by the CTD data.The salinity at the mouth of the fjord is around 32, but isonly 24.5 at the slope. The fauna at station KL2 alsoshows some similarity to faunal assemblage zone 6(FAZ6) in Disko Bugt (Lloyd 2006a), which is character-ized by shallow, relatively low-salinity waters(temperature 4.0°C, salinity 33.27). The Disko Bugtassemblage has almost the same species distribution assample KL2, but with the latter containing a relativelyhigher percentage of calcareous species.
The dominance of A. gallowayi and C. lobatulus, togetherwith high numbers of Cassidulina reniforme, B. frigida s.l.,Stainforthia loeblichi and unilocular species, in the calcar-eous fauna at KL2 (Table 1) indicates a relatively stablearctic marine environment (Hald & Korsun 1997), andthe influence of an oceanic component. The EGCcomponent of WGC has a salinity around 32–33, corre-sponding to the measured salinity at station KL2. Thetemperature at KL2 is, however, significantly higher than“normal” EGC water (see Buch 2002). This might be aresult of either mixing of the EGC component with therelatively warmer IC component of WGC water, or maybeseasonal surface water heating of the EGC component ofthe WGC.
Discussion and future prospects
Kangerlussuaq appears to be subjected to the typicalexternal forcing of polar regions, which are characterizedby large seasonal variations, i.e., strong cooling in thewintertime and large freshwater run-off in the summer-time. For both winter and summer, this creates watermasses in the fjord that are much different from thosefound along the coast, resulting in an exchange flowbetween the fjord and the ocean. In typical Arctic (orAntarctic) fjords, the connection to the ocean is con-stricted by a short, shallow sill, which allows for arelatively easy and fast exchange between the deep fjordbasins and the ocean. Thus, cold and saline water massescreated in a fjord in the wintertime, as a result of coolingand ice formation, may be replaced on a seasonal timescale, or often faster, as the coastal waters become denserand overflow the sill. Examples are given by Matthews(1981), Jennings & Helgadóttir (1994), Niebauer et al.(1994), Madsen & Knudsen (1994) and Skogseth et al.(2005).
However, in Kangerlussuaq the shallow and narrowouter part of the fjord is long (ca. 100 km) compared withthe tidal excursion (ca. 20 km), and the tidal currents arestrong, resulting in well-mixed conditions and weak gra-dients of the water-mass properties in both time andspace. These circumstances cause a strongly dampenedexchange between the water masses in the fjord and
Water masses and foraminifera in KangerlussuaqM.H. Nielsen et al.
Polar Research 29 2010 159–175 © 2010 the authors, journal compilation © 2010 Blackwell Publishing Ltd 171
those along the coast. This condition is approaching thesolution that Hogg et al. (2001) called the viscous advec-tive diffusive, in which the transport of the water massesin opposite directions is determined by friction and thedegree of vertical mixing. Given the magnitude of theseasonal forcing, we speculate that the large, deep-lyinglayer in the inner part of the fjord is subject to no orextremely slow renewal by coastal waters. Furthermore,the presence of the ice cover in the wintertime and thethick freshwater-influenced upper layer in the summer-time effectively shelters the deep layer from upwards-directed entrainment caused by turbulence created bywind stress, which would normally enhance estuarineexchange (e.g., Nielsen et al. 2005).
Our findings in Kangerlussuaq show a strong connec-tion between the physical oceanographic conditions andthe distribution of foraminifera. For instance, the deeppart of the fjord (below about 200 m) is typically inhab-ited by sparse agglutinated assemblages. On the otherhand, the innermost, shallow part of the fjord is char-acterized by the high dominance of only one species,i.e., E. excavatum f. clavata, and a high proportion ofliving specimens. This fjord head is an area where fine-grained sediment settles quickly, and according to localsources, sedimentation rates are up to several centime-tres per year slightly north of sample KL18, possiblyaccounting for most of the sediment carried by WatsonRiver.
The diversity of the foraminiferal assemblage on thetransitional slope between the inner, deep part and theouter, shallow part of the fjord, reflects an influence ofcold, low-salinity waters from the deep, homogeneouslayer in the fjord, and the diversity and concentration ofthe foraminifera indicate that living conditions are gen-erally favourable in this area, presumably because of thedeposition of organic matter advected from the outer,shallow part and settling as the depth increases.
The foraminiferal assemblage in the outer, shallow partof the fjord is characterized by the dominance of theindicator species for strong bottom currents, C. lobatulus,as well as the relatively high-salinity species Q. seminulum.This is in accordance with the observation of pronouncedtidal mixing and strong currents in this part of thefjord.
Off the mouth of Kangerlussuaq, we find a diverseforaminiferal assemblage related to the relatively stableArctic conditions in the EGC component of the WGC. Thewater is, however, slightly warmer than the typical EGC,either because of mixing with the IC component of WGCwaters or because of seasonal surface water heating. Thisarea is also subject to moderate currents, as the tidalwaves propagate northwards along the coast. The envi-ronment is typically inhabited by both calcareous and
agglutinated species associated with Polar and AtlanticWater components of the WGC.
The present investigation leaves a number of questionsopen for future research. One question concerns theproblem of the chemical conditions in the deep-lyingwater masses in the inner part of the fjord. Ice formationand brine release are associated with the downwardstransport of oxygen and carbon dioxide (e.g., Steinsund &Hald 1994; Rysgaard et al. 2007), and at increasing depthand decreasing temperature this may lead to carbonatedissolution and poor preservation of calcareous foramin-ifera. One way of assessing the impact of this processwould be dense sampling of the surface sediments, com-bined with measurements of physical properties on theslope between the inner and the outer part of the fjord,and along the shoaling sides of the inner part of the fjord.At best, the chemical properties should also be measureddirectly.
Another question concerns the biological production inthe fjord and the timing of the productivity. Sustainedwater-column stratification normally has a strong effecton the primary productivity, as would be expected to bethe case here, by confining the upper part of the watermasses to the photic zone, and by limiting the access toinorganic nutrients. However, the meltwater also carrieslarge quantities of fine-grained sediment, and in suspen-sion this may significantly constrict the availability oflight. According to the physical forcing, we expect to finda strong seasonal variation in the fjord, and it may be thatthe primary production is limited to ice-free periods (seeRysgaard et al. 2003).
Finally, it is interesting that, because of the strongtidal mixing in the outer, shallow part of the fjord, theinner, deep part is largely decoupled from the oceanicconditions. Furthermore, the cooling and ice formationin the wintertime and the meltwater run-off in thesummertime, which determine the conditions in thedeep-lying water masses, are both direct results of thelocal meteorological conditions. We therefore expectthat both the sediments and the foraminiferal contentsin sedimentary records from the inner, deep part ofKangerlussuaq would hold unique information on theclimate of West Greenland and its variations, at leastthrough the Holocene. In addition, the well-definedwater-mass properties in the fjord suggest that model-ling of the physical oceanographic conditions may bestraightforward, by employing the methods of, forexample, Hogg et al. (2001) and Haarpaintner et al.(2001). For the study of climatic changes, modelling ofvariations in cooling and ice production in the winter-time and meltwater run-off in the summertime couldbecome a valuable supplement to data from sedimentcores.
Water masses and foraminifera in Kangerlussuaq M.H. Nielsen et al.
Polar Research 29 2010 159–175 © 2010 the authors, journal compilation © 2010 Blackwell Publishing Ltd172
Conclusions
The study of a series of CTD profiles combined withanalysis of the modern foraminiferal distribution inKangerlussuaq (Søndre Strømfjord) shows that theoccurrence of different foraminiferal species and speciesgroups are related to physical water-mass characteristicsat the sea floor as well as the availability of nutrients.
The physical oceanographic conditions in the fjord aremuch influenced by the strong seasonal forcing pertinentto the polar regions. For instance, in the summertimelarge quantities of meltwater run-off cause strong strati-fication, and in the wintertime cooling and ice formationlead to brine release and dense water formation. Impor-tantly, because of the strong tidal mixing in the outer,shallow part of the fjord, the water mass of the inner,deep part of the fjord is almost decoupled from theoceanic conditions of the coastal waters. This implies thatthe conditions in the inner, deep part are determinedprimarily by cooling and ice formation in the wintertime,and by the meltwater run-off in the summertime, bothdirect results of local meteorological conditions.
Foraminiferal assemblages in the deep part of the innerbasin are characterized by the sparse contents of aggluti-nated species, presumably determined by carbonatedissolution combined with the availability of nutrients.The innermost, shallow part, however, is inhabited by aglaciomarine assemblage dominated by the opportunisticform E. excavatum f. clavata, which tolerates sediment-loaded waters close to meltwater run-off from glaciers.
The foraminiferal assemblage found on the transitionalslope between the outer, shallow part of the fjord and theinner, deep part indicates an Arctic environment withreduced salinity, as also recorded by the CTD measure-ments, and the relatively high foraminiferal density andspecies diversity may be a result of a steady supply oforganic matter from the incoming waters to the slope.
The conditions in the outer, shallow part of the fjord arecharacterized by strong tidal mixing. The indicator speciesof strong bottom currents, C. lobatulus, and the relativelyhigh-salinity group, Miliolida, are connected to this envi-ronment, which is under the influence of water withincreased salinity from the more oceanic coastal area.
The association between the foraminiferal distributionin Kangerlussuaq and the water-mass characteristics,which are again coupled with the meteorological condi-tions, is promising for our future study of climate changein the area.
Acknowledgements
We thank the captain and crew of MS Suulut for theirassistance on the August 2005 cruise, and Mr Bjarke
Tinghuus for his assistance on the survey on the ice inFebruary 2006.
References
Allen G.L. & Simpson J.H. 2002. The response of a stronglystratified fjord to energetic tidal forcing. Estuarine, Coastaland Shelf Science 55, 629–644.
Alve E. 1999. Colonization of new habitats by benthicforaminifera: a review. Earth-Science Reviews 46, 167–185.
Andersen O.G.N. 1981. The annual cycle of temperature, salinity,currents and water masses in Disko Bugt and adjacent waters,West Greenland. Meddelelser om Grønland, Bioscience 5.Copenhagen: Commission for Scientific Research inGreenland.
Arneborg L. & Liljebladh B. 2001. The internal seiches inGullmar Fjord. Part II: contribution to basin water mixing.Journal of Physical Oceanography 31, 2567–2574.
Barmawidjaja D.M., van der Zwaan G.J., Jorissen F.J. &Puskaric S. 1995. 150 years of eutrophication in thenorthern Adriatic Sea: evidence from a benthicforaminiferal record. Marine Geology 122, 367–384.
Bennike O., Hansen K.B., Knudsen K.L., Penney D.N. &Rasmussen K.L. 1994. Quaternary marine stratigraphy andgeochronology in central West Greenland. Boreas 23,194–215.
Brönnimann P. & Whittaker J.E. 1988. The Trochammina ofthe Discovery reports. London: British Museum (NaturalHistory).
Buch E. 2000. Air–sea-ice conditions off southwestGreenland, 1981–1997. Journal of the Northwest AtlanticFisheries Sciences 26, 123–136.
Buch E. 2002. Present oceanographic conditions in Greenlandwaters. Danish Meteorological Institute Scientific Report 02-02.Copenhagen: Danish Meterological Institute.
Dowdeswell J.A., Whittington R.J., Jennings A.E., AndrewsJ.T., Mackensen A. & Marienfeld P. 2000. An origin forlaminated glacimarine sediments through sea-ice build-upand suppressed iceberg rafting. Sedimentology 47, 557–576.
Elverhøi A., Liestøl O. & Nagy J. 1980. Glacial erosion,sedimentation and microfauna in the inner part ofKongsfjord, Spitsbergen. Norsk Polarinstitutt Skrifter 172,33–61.
Feyling-Hanssen R.W. 1990. Foraminiferal stratigraphy in thePlio-Pleistocene Kap København Formation, North Greenland.Meddelelser om Grønland, Geoscience 24. Copenhagen:Commission for Scientific Research in Greenland.
Feyling-Hanssen R.W. & Funder S. 1990. Fauna and flora. InS. Funder (ed.): Late Quaternary stratigraphy and glaciology inthe Thule area, Northwest Greenland. Meddelelser om Grønland,Geoscience 22, 19–32.
Feyling-Hanssen R.W., Jørgensen J.A., Knudsen K.L. &Lykke-Andersen A.-L. 1971. Late Quaternary foraminiferafrom Vendsyssel, Denmark and Sandnes, Norway. Bulletinof the Geological Society of Denmark 21, 67–367.
Fischer H.B., List E.J., Koh R.C.Y., Imberger J. & Brooks N.H.1979. Mixing in inland and coastal waters. New York:Academic Press.
Water masses and foraminifera in KangerlussuaqM.H. Nielsen et al.
Polar Research 29 2010 159–175 © 2010 the authors, journal compilation © 2010 Blackwell Publishing Ltd 173
Haarpaintner J., Gascard J.-C. & Haugan P.M. 2001. Iceproduction and brine formation in Storfjorden, Svalbard.Journal of Geophysical Research—Oceans 106,14 001–14 013.
Hald M. & Korsun S. 1997. Distribution of modern benthicforaminifera from fjords of Svalbard, European Arctic.Journal of Foraminiferal Research 27, 101–122.
Hald M. & Steinsund P.I. 1996. Benthic foraminifera andcarbonat dissolution in the surface sediments of theBarents and Kara seas. In R. Stein et al. (eds.):Surface-sediment composition and sedimentary processes in thecentral Arctic Ocean and along the Eurasian Continental Margin.Berichte zur Polarforschung 212, 285–307.
Hald M., Steinsund P.I., Dokken T., Korsun S., Polyak L. &Aspeli R. 1994. Recent and late Quarternary distributionof Elphidium excavatum f. clavata in Arctic seas. CushmanFoundation Special Publication 32, 141–153.
Hansen A. & Knudsen K.L. 1992. Recent foraminifera inFreemansundet, eastern Svalbard. Lundqua Report 35,177–189.
Hansen A. & Knudsen K.L. 1995. Recent foraminiferaldistribution in Freemansundet and Early Holocenestratigraphy on Edgeøya, Svalbard. Polar Research 14,215–238.
Haynes J.R. 1973. Cardigan Bay recent foraminifera. Bulletin ofthe British Museum (Natural History) Zoology, Supplement 4.London: British Museum (Natural History).
Henriksen N., Higgins A.K., Kalsbeek F. & Pulvertaft T.C.R.2000. Greenland from Archaean to Quaternary. Descriptive textto the Geological map of Greenland, 1 : 2 500 000. Geology ofGreenland Survey Bulletin 185. Copenhagen: GeologicalSurvey of Denmark and Greenland.
Hogg A.M., Ivey G.N. & Winters K.B. 2001. Hydraulics andmixing in controlled exchange flows. Journal of GeophysicalResearch—Oceans 106, 959–972.
Husum K. & Hald M. 2004. Modern foraminiferaldistribution in the subarctic Malangen fjord and adjoiningshelf, northern Norway. Journal of Foraminiferal Research 34,34–48.
Jennings A.E. & Helgadóttir G. 1994. Foraminiferalassemblages from the fjords and shelf of easternGreenland. Journal of Foraminiferal Research 24,123–144.
Jennings A.E. & Weiner N.J. 1996. Environmental change ineastern Greenland during the last 1300 years: evidencefrom foraminifera and lithofacies in Nansen Fjord, 68°N.The Holocene 6, 179–191.
Kelly M., Funder S., Houmark-Nielsen M., Knudsen K.L.,Kronborg C., Landvik J. & Sorby L. 1999. Quaternaryglacial and marine environmental history of northwestGreenland: a review and reappraisal. Quaternary ScienceReviews 18, 373–392.
Knudsen K.L. 1998. Foraminiferer i Kvartær stratigrafi:laboratorie og fremstillingsteknik samt udvalgte eksempler.(Foraminifera in Quaternary stratigraphy: laboratorytechniques and presentation as well as selected examples.)Geologisk Tidsskrift 3, 1–25.
Korsun S. & Hald M. 1998. Modern benthic foraminifera offNovaya Zemlya tidewater glaciers, Russian Arctic. Arcticand Alpine Research 30, 61–77.
Korsun S. & Hald M. 2000. Seasonal dynamics of benthicforaminifera in a glacially fed fjord of Svalbard, EuropeanArctic. Journal of Foraminiferal Research 30, 251–271.
Lassen S.J., Kuijpers A., Kunzendorf H., Hoffmann-Wieck G.,Mikkelsen N. & Konradi P. 2004. Late-Holocene Atlanticbottom-water variability in Igaliku Fjord, south Greenland,reconstructed from foraminifera faunas. The Holocene 14,165–171.
Lloyd J.M. 2006a. Modern distribution of benthicforaminifera from Disko Bugt, west Greenland. Journal ofForaminiferal Research 36, 315–331.
Lloyd J.M. 2006b. Late Holocene environmental changes inDisko Bugt, West Greenland: interaction between climate,ocean circulation and Jakobshavn Isbrae. Boreas 35, 35–49.
Lloyd J.M., Park L.A., Kuijpers A. & Moros M. 2005. EarlyHolocene palaeoceanography and deglacial chronology ofDisko Bugt, West Greenland. Quaternary Science Reviews 24,1741–1755.
Madsen H.B. & Knudsen K.L. 1994. Recent foraminifera inshelf sediments of the Scoresby Sund fjord, EastGreenland. Boreas 23, 495–504.
Matthews J.B. 1981. The seasonal circulation of the GlacierBay, Alaska fjord system. Estuarine, Coastal and Shelf Science12, 679–700.
Møller H.S., Jensen K.G., Kuijpers A., Aagaard-Sørensen S.,Seidenkrantz M.-S., Prins M., Endler R. & Mikkelsen N.2006. Late-Holocene environment and climatic changes inAmeralik Fjord, southwest Greenland: evidence from thesedimentary record. The Holocene 16, 685–695.
Mudie P.J., Keen C.E., Hardy I.A. & Vilks G. 1983.Multivariate analysis and quantitative paleocology ofbenthic foraminifera in surface and Late Quaternary shelfsediments, northern Canada. Marine Micropaleontology 8,283–313.
Murray J.W. 1973. Distribution and ecology of living benthicforaminiferids. London: Heinemann.
Murray J.W. 1991. Ecology and palaeoecology of benthicforaminifera. Harlow: Longman Scientific and Technical.
Murray J.W. 2006. Ecology and application of benthicforaminifera. Cambridge: Cambridge University Press.
Murray J.W. & Bowser S.S. 2000. Mortality, protoplasmdecay rate and reliability of staining technique torecognize “living foraminifera”: a review. Journal ofForaminiferal Research 30, 66–70.
Niebauer H.J., Royer T.C. & Weingartner T.J. 1994.Circulation of Prince William Sound, Alaska. Journal ofGeophysical Research—Oceans 99, 14 113–14 126.
Nielsen M.H., Rasmussen B. & Gertz F., 2005. A simplemodel for water level and stratification in RingkøbingFjord, a shallow, artificial estuary. Estuarine, Coastal andShelf Science 63, 235–248.
Polyak L., Korsun S., Febo L.A., Stanovoy V., Khusid T., HaldM., Paulsen B.E. & Lubinski D.J. 2002. Benthicforaminiferal assemblages from the southern Kara Sea, a
Water masses and foraminifera in Kangerlussuaq M.H. Nielsen et al.
Polar Research 29 2010 159–175 © 2010 the authors, journal compilation © 2010 Blackwell Publishing Ltd174
river-influenced Arctic marine environment. Journal ofForaminiferal Research 32, 252–273.
Rysgaard S., Glud R.N., Sejr M.K., Bendtsen J. & ChristensenP.B. 2007. Inorganic carbon transport during sea icegrowth and decay: a carbon pump in polar seas. Journal ofGeophysical Research—Oceans 112, C03016, doi: 10.1029/2006JC003572.
Rysgaard S., Vang T., Stjernholm M., Rasmussen B.,Windelin A. & Kiilsholm S. 2003. Physical conditions,carbon transport, and climate change impacts in anortheast Greenland Fjord. Arctic, Antarctic, and AlpineResearch 35, 301–312.
Schröder-Adams C.J., Cole F.E., Medioli F.S., Mudie P.J.,Scott, D.B. & Dobbin L. 1990. Recent Arctic shelfforaminifera: seasonally ice covered vs. perennially icecovered areas. Journal of Foraminiferal Research 20, 8–36.
Scott D.B., Schafer C.T. & Medioli F.S. 1980. EasternCanadian estuarine foraminifera: a framework forcomparison. Journal of Foraminiferal Research 10, 205–234.
Seidenkrantz M.-S., Aagaard-Sørensen S., Møller H.S.,Kuijpers A., Jensen K.G. & Kunzendorf H. 2007:Hydrography and climate change during the last 4,400years in Ameralik Fjord, SW Greenland—implications forLabrador Sea palaeoceanography. The Holocene 17, 1–15.
Skogseth R., Haugan P.M. & Jakobsson M. 2005. Watermasstransformations in Storfjorden. Continental Shelf Research 25,667–695.
Steinsund P.I. & Hald M. 1994. Recent calcium carbonatedissolution in the Barents Sea: paleoceanographicapplications. Marine Geology 117, 303–316.
Tsujimoto A., Yasuhara M., Nomura R., Yamazaki H., SampeiY. Hirose K. & Yoshokawa S. 2008. Development of
modern benthic ecosystems in eutrophic coastal oceans:the foraminiferal record over the last 200 years, OsakaBay, Japan. Marine Micropaleontology 69, 225–239.
UNESCO (United Nations Educational, Scientific andCultural Organization) 1981. International oceanographictables. Vol. 3. UNESCO Technical Papers in Marine Science 39.Paris: UNESCO.
Vilks G. 1969. Recent foraminifera in the Canadian Arctic.Micropaleontology 15, 35–60.
Vilks G. 1989. Ecology of recent foraminifera on theCanadian continental shelf of the Arctic Ocean. In Y.Herman (ed.): The Arctic seas, climatology, oceanography,geology, and biology. Pp. 497–569. New York: Van NostrandReinhold Company.
Vilks G. & Deonarine B. 1988. Labrador shelf benthicforaminifera and stable oxygen isotopes of Cibicideslobatulus related to the Labrador Current. Canadian Journalof Earth Sciences 25, 1240–1255.
Vosgerau H., Funder S., Kelly M., Knudsen K.L., KronborgC., Madsen H.B. & Sejrup H.-P. 1994: Palaeoenvironmentand changes in the relative sea level during the lastinterglacial, Langelandselv area, Jameson Land, EastGreenland. Boreas 23, 398–411.
Wollenburg J.E., Knies J. & Mackensen A. 2004.High-resolution paleoproductivity fluctuations during thepast 24 kyr as indicated by benthic foraminifera in themarginal Arctic Ocean. Palaeogeography, Palaeoclimatology,Palaeoecology 204, 209–238.
Wollenburg J.E. & Mackensen A. 1998. Living benthicforaminifera from the central Arctic Ocean: faunalcomposition, standing stock and diversity. MarineMicropaleontology 34, 153–185.
Water masses and foraminifera in KangerlussuaqM.H. Nielsen et al.
Polar Research 29 2010 159–175 © 2010 the authors, journal compilation © 2010 Blackwell Publishing Ltd 175