Distribution of Sulfate-Reducing Bacteria in a Stratified Fjord
11
APPLIED AND ENVIRONMENTAL MICROBIOLOGY, Apr. 1996, p. 1405–1415 Vol. 62, No. 4 0099-2240/96/$04.0010 Copyright q 1996, American Society for Microbiology Distribution of Sulfate-Reducing Bacteria in a Stratified Fjord (Mariager Fjord, Denmark) as Evaluated by Most-Probable- Number Counts and Denaturing Gradient Gel Electrophoresis of PCR-Amplified Ribosomal DNA Fragments ANDREAS TESKE,* CATHRIN WAWER, GERARD MUYZER, AND NIELS B. RAMSING² Molecular Ecology Group, Max Planck Institute for Marine Microbiology, Bremen, Germany Received 22 August 1995/Accepted 29 January 1996 The sulfate-reducing bacterial populations of a stratified marine water column, Mariager Fjord, Denmark, were investigated by molecular and culture-dependent approaches in parallel. Denaturing gradient gel elec- trophoresis (DGGE) of PCR-amplified 16S rRNA and DNA encoding rRNA (rDNA) isolated from the water column indicated specific bacterial populations in different water column layers and revealed a highly differ- entiated pattern of rRNA- and rDNA-derived PCR amplificates, probably reflecting active and resting bacterial populations. Hybridization of DGGE patterns with rRNA probes indicated the increased presence and activity (by at least 1 order of magnitude) of sulfate-reducing bacteria within and below the chemocline. Parallel to this molecular approach, an approach involving most-probable-number (MPN) counts was used, and it found a similar distribution of cultivable sulfate-reducing bacteria in the water column of Mariager Fjord, Approxi- mately 25 cells and 250 cells per ml above and below the chemocline, respectively, were found. Desulfovibrio- and Desulfobulbus-related strains occurred in the oxic zone. DGGE bands from MPN cultures were sequenced and compared with those obtained from nucleic acids extracted from water column samples. The MPN isolates were phylogenetically affiliated with sulfate-reducing delta subdivision proteobacteria (members of the genera Desulfovibrio, Desulfobulbus, and Desulfobacter), whereas the molecular isolates constituted an independent lineage of the delta subdivision proteobacteria. DGGE of PCR-amplified nucleic acids with general eubacterial PCR primers conceptually revealed the general bacterial population, whereas the use of culture media allowed cultivable sulfate-reducing bacteria to be selected. A parallel study of Mariager Fjord biogeochemistry, bacterial activity, and bacterial counts complementing this investigation has been presented elsewhere (N. B. Ramsing, H. Fossing, T. G. Ferdelman, F. Andersen, and B. Thamdrup, Appl. Environ. Microbiol. 62:1391– 1404, 1996). Oxygen-deficient marine basins show characteristic chemical zones because of the gradual depletion of oxygen and other oxidized chemical species in the water column (10). The redox gradient in the water column is mirrored by different modes of bacterial respiration, from oxic respiration through denitrifica- tion, manganese and iron reduction, sulfate reduction, and methanogenesis (22). According to the classic picture, oxida- tive processes occur in the oxygenated water above the che- mocline and reductive processes, i.e., denitrification and sulfate reduction, are confined to the anoxic zone. The con- finement of sulfate reduction to anoxic water layers has, however, been questioned. Sulfate reduction in the presence of oxygen was observed in and above the chemocline of the Cariaco trench (18). Particle-associated methanogenic and sulfate-reducing bacteria were enriched from oxic surface water as well as from the pycnocline and bottom water of the Chesapeake Bay (48). Mariager Fjord (Denmark) is an especially suitable marine environment to investigate the potential overlap of aerobic and anaerobic bacterial populations and their metabolic processes in a stratified water column (33). This fjord is connected to the sea by a long, narrow channel with a maximum depth of 4 m but widens and deepens in its inland part to a depth of 25 to 30 m. The narrow channel limits the exchange of oxygenated water and leaves the inland basin of the fjord anoxic from a depth of approximately 14 m to the bottom (33). This polyphasic study of the distribution of sulfate-reducing bacteria in Mariager Fjord used cultivation-dependent and molecular approaches in parallel to investigate the bacterial ecosystem as well as the strengths and biases inherent in the methods. A geochemical evaluation of Mariager Fjord and direct bacterial counts by fluorescent in situ hybridization were performed in parallel to this study at the same location and time with the same samples as a framework for and comple- ment to this investigation (42). Denaturing gradient gel elec- trophoresis (DGGE) of enzymatically amplified 16S DNA en- coding rRNA (rDNA) was used as a molecular approach for the analysis of the microbial community of Mariager Fjord. PCR products that have the same lengths can be separated by DGGE on the basis of melting domain structure and nucleo- tide composition (13, 38, 52). This technique has recently been introduced into molecular microbial ecology to determine the genetic diversity of natural microbial communities (35) and to identify dominant community members whose phylogenetic affiliations were subsequently determined by sequencing the DGGE fragments (34, 37). Bacterial DNA and total RNA were extracted from water column samples; rRNA was tran- scribed into ribosomal cDNA (rcDNA) and subsequently am- plified by PCR. Since metabolically active cells contain more rRNA than resting or dormant cells (29, 41, 45), the DGGE * Corresponding author. Present address: Department of Biology, Woods Hole Oceanographic Institution, Woods Hole, MA 02543. Phone: (508) 457-2000. Fax: (508) 457-2169. ² Present address: Department of Microbial Ecology, Institute of Biological Sciences, Aarhus University, Aarhus, Denmark. 1405 on November 5, 2019 at MAX-PLANCK-INSTITUT FUR http://aem.asm.org/ Downloaded from
-
Upload
khangminh22 -
Category
Documents
-
view
4 -
download
0
Transcript of Distribution of Sulfate-Reducing Bacteria in a Stratified Fjord

APPLIED AND ENVIRONMENTAL MICROBIOLOGY, Apr. 1996, p. 1405–1415 Vol. 62, No. 40099-2240/96/$04.0010Copyright q 1996, American Society for Microbiology
Distribution of Sulfate-Reducing Bacteria in a Stratified Fjord(Mariager Fjord, Denmark) as Evaluated by Most-Probable-Number Counts and Denaturing Gradient Gel Electrophoresis
of PCR-Amplified Ribosomal DNA FragmentsANDREAS TESKE,* CATHRIN WAWER, GERARD MUYZER, AND NIELS B. RAMSING†
Molecular Ecology Group, Max Planck Institute for Marine Microbiology, Bremen, Germany
Received 22 August 1995/Accepted 29 January 1996
The sulfate-reducing bacterial populations of a stratified marine water column, Mariager Fjord, Denmark,were investigated by molecular and culture-dependent approaches in parallel. Denaturing gradient gel elec-trophoresis (DGGE) of PCR-amplified 16S rRNA and DNA encoding rRNA (rDNA) isolated from the watercolumn indicated specific bacterial populations in different water column layers and revealed a highly differ-entiated pattern of rRNA- and rDNA-derived PCR amplificates, probably reflecting active and resting bacterialpopulations. Hybridization of DGGE patterns with rRNA probes indicated the increased presence and activity(by at least 1 order of magnitude) of sulfate-reducing bacteria within and below the chemocline. Parallel to thismolecular approach, an approach involving most-probable-number (MPN) counts was used, and it found asimilar distribution of cultivable sulfate-reducing bacteria in the water column of Mariager Fjord, Approxi-mately 25 cells and 250 cells per ml above and below the chemocline, respectively, were found. Desulfovibrio-and Desulfobulbus-related strains occurred in the oxic zone. DGGE bands from MPN cultures were sequencedand compared with those obtained from nucleic acids extracted from water column samples. The MPN isolateswere phylogenetically affiliated with sulfate-reducing delta subdivision proteobacteria (members of the generaDesulfovibrio, Desulfobulbus, and Desulfobacter), whereas the molecular isolates constituted an independentlineage of the delta subdivision proteobacteria. DGGE of PCR-amplified nucleic acids with general eubacterialPCR primers conceptually revealed the general bacterial population, whereas the use of culture media allowedcultivable sulfate-reducing bacteria to be selected. A parallel study of Mariager Fjord biogeochemistry,bacterial activity, and bacterial counts complementing this investigation has been presented elsewhere (N. B.Ramsing, H. Fossing, T. G. Ferdelman, F. Andersen, and B. Thamdrup, Appl. Environ. Microbiol. 62:1391–1404, 1996).
Oxygen-deficient marine basins show characteristic chemicalzones because of the gradual depletion of oxygen and otheroxidized chemical species in the water column (10). The redoxgradient in the water column is mirrored by different modes ofbacterial respiration, from oxic respiration through denitrifica-tion, manganese and iron reduction, sulfate reduction, andmethanogenesis (22). According to the classic picture, oxida-tive processes occur in the oxygenated water above the che-mocline and reductive processes, i.e., denitrification andsulfate reduction, are confined to the anoxic zone. The con-finement of sulfate reduction to anoxic water layers has,however, been questioned. Sulfate reduction in the presenceof oxygen was observed in and above the chemocline of theCariaco trench (18). Particle-associated methanogenic andsulfate-reducing bacteria were enriched from oxic surfacewater as well as from the pycnocline and bottom water of theChesapeake Bay (48).Mariager Fjord (Denmark) is an especially suitable marine
environment to investigate the potential overlap of aerobic andanaerobic bacterial populations and their metabolic processesin a stratified water column (33). This fjord is connected to thesea by a long, narrow channel with a maximum depth of 4 m
but widens and deepens in its inland part to a depth of 25 to 30m. The narrow channel limits the exchange of oxygenatedwater and leaves the inland basin of the fjord anoxic from adepth of approximately 14 m to the bottom (33).This polyphasic study of the distribution of sulfate-reducing
bacteria in Mariager Fjord used cultivation-dependent andmolecular approaches in parallel to investigate the bacterialecosystem as well as the strengths and biases inherent in themethods. A geochemical evaluation of Mariager Fjord anddirect bacterial counts by fluorescent in situ hybridization wereperformed in parallel to this study at the same location andtime with the same samples as a framework for and comple-ment to this investigation (42). Denaturing gradient gel elec-trophoresis (DGGE) of enzymatically amplified 16S DNA en-coding rRNA (rDNA) was used as a molecular approach forthe analysis of the microbial community of Mariager Fjord.PCR products that have the same lengths can be separated byDGGE on the basis of melting domain structure and nucleo-tide composition (13, 38, 52). This technique has recently beenintroduced into molecular microbial ecology to determine thegenetic diversity of natural microbial communities (35) and toidentify dominant community members whose phylogeneticaffiliations were subsequently determined by sequencing theDGGE fragments (34, 37). Bacterial DNA and total RNAwere extracted from water column samples; rRNA was tran-scribed into ribosomal cDNA (rcDNA) and subsequently am-plified by PCR. Since metabolically active cells contain morerRNA than resting or dormant cells (29, 41, 45), the DGGE
* Corresponding author. Present address: Department of Biology,Woods Hole Oceanographic Institution, Woods Hole, MA 02543.Phone: (508) 457-2000. Fax: (508) 457-2169.† Present address: Department of Microbial Ecology, Institute of
Biological Sciences, Aarhus University, Aarhus, Denmark.
1405
on Novem
ber 5, 2019 at MA
X-P
LAN
CK
-INS
TIT
UT
FU
Rhttp://aem
.asm.org/
Dow
nloaded from

patterns of PCR-amplified rRNA conceptually represent themetabolically active, rRNA-rich bacterial populations. TheDGGE patterns derived after amplification of the ribosomalgenes represent the presence of bacterial populations but donot take metabolic activity into account. These two types ofDGGE patterns differ significantly. In addition, they revealhow the composition of the bacterial community changesthroughout the water column. DGGE gels were analyzed byblotting and by the reamplification and sequencing of individ-ual DGGE bands. The resulting picture was evaluated withreference to the physical parameters of the water column, totalbacterial counts, and counts of sulfate-reducing bacteria in amost-probable-number (MPN) series.We performed MPN counts of sulfate-reducing bacteria in
the water column to assess the congruence of the classicalmicrobiological and molecular, rRNA-related approaches inthe detection and quantification of sulfate-reducing bacterialpopulations. Special attention was paid to the enumerationand identification of sulfate-reducing bacteria from the oxicpart of the water column. MPN cultures of sulfate-reducingbacteria from the oxic part of the water column were analyzedphylogenetically to evaluate the existence of a possible distinctgroup of oxygen-tolerant, sulfate-reducing bacteria.
MATERIALS AND METHODS
Sampling of bacteria. Water samples were taken from Station Dybet M3,approximately 1 km north of the harbor of Mariager (568399660N, 098589560E),on 19 and 20 August 1993. The position of the chemocline was determined witha conductivity-temperature-depth sensor, measuring pressure, temperature, con-ductivity, oxygen (two independent sensors), incident light, and fluorescence.The sampling scheme was devised to obtain water samples from the upper oxicwater layer, from the chemocline, and from the anoxic bottom water. Thechemocline was distinguished by the simultaneous presence of both O2 and H2Sin micromolar concentrations (see Fig. 3A in reference 42). Water samples fornucleic acid extraction and MPN counts were taken from the oxic water layer (8m deep), from the upper, central, and lower chemocline (13, 14.5, and 16 mdeep), and from the anoxic water layer (20 m deep). Sediment samples weretaken at a depth of 24.3 m. For nucleic acid extraction, bacteria were collectedfrom 200 ml of seawater and from 20 ml of bottom sediment. Water andsediment samples were filtered through Durapore filters (pore size, 0.22 mm;filter diameter, 25 mm; Millipore) with a syringe filtration device to capturebacteria and biomass on the filter for subsequent nucleic acid extraction. Thevery soft sediment samples were concentrated from 20 ml to a total volume of 2ml by filtration. Filters with captured bacteria and biomass were frozen imme-diately and stored in liquid nitrogen until nucleic acid extraction.MPN counts of sulfate-reducing bacteria. Numbers of viable sulfate-reducing
bacteria were estimated with MPN dilutions in liquid medium (2). The multi-purpose medium of Widdel and Bak (55) for sulfate-reducing bacteria was usedwith nonchelated trace element mixture no. 1 and seawater. MPN counts wereperformed on lactate (20 mM), acetate (20 mM), and H2 plus 2 mM acetate asthe carbon source. The medium was prepared anaerobically in a pressure-proofmodified Erlenmeyer flask (55) and dispensed into culture vials (Kimex). Afterthe medium was dispensed, each MPN vial was immediately gassed with a gassingsyringe according to the Hungate technique and sealed with a butyl stopper.Lactate and acetate MPN vials were gassed with a mixture of 90% (vol/vol) N2and 10% (vol/vol) CO2. The headspaces of the hydrogen MPN vials were gassedanoxically with a mixture of 90% (vol/vol) H2 and 10% (vol/vol) CO2.Sulfate reducers from 8-, 13-, 14.5-, 16-, and 20-m-deep and bottom sediment
samples were counted in a threefold MPN dilution series. The MPN dilutionseries was carried out with 1-ml water or sediment samples that were subse-quently diluted in eight 1:10 dilution steps.Nucleic acid extraction. Nucleic acids were extracted from the filters by the
method of Oelmuller et al. (39) adapted as follows. The filters were thawed andwashed twice with 1 ml of ice-cold AE buffer (20 mM sodium acetate [pH 5.5],1 mM EDTA). Each filter and buffer were added to 6 ml of hot Tris-EDTA(TE)-buffered phenol-chloroform-isoamylalcohol (25:24:1, pH 8) and 60 ml of25% (wt/vol) sodium dodecyl sulfate (SDS). After 5 min of incubation at 608C,the solution was cooled on ice and then centrifuged for 5 min at 4,000 3 g. A250-ml portion of 2 M sodium acetate, pH 5.2, was added to the aqueous phase.Proteins and lipids were removed by repeated extraction of the aqueous phasewith 5 ml of TE-buffered phenol-chloroform-isoamylalcohol (25:24:1, pH 8).Nucleic acids were precipitated with 2.5 volumes of 96% (vol/vol) ethanol for 3h at 2208C, and the precipitation was followed by 60 min of centrifugation at4,000 3 g. The pellet was washed with 75% (vol/vol) ethanol, dried for 20 minunder a vacuum, and redissolved in 50 ml of diethyl pyrocarbonate-treated water.
Nucleic acid preparations including rRNA were tested in 2% (wt/vol) agarosegels with MOPS (morpholine propanesulfonic acid) buffer (46). The totalamounts of nucleic acids extracted from the 200-ml water column samples werebetween 5 and 10 mg. Several different protocols for nucleic acid extraction wereevaluated in test experiments with Mariager Fjord sediment and water samples.However, only the protocol described above proved successful in isolating rRNA.The DNA yield by this method was equivalent to yields by methods optimized forDNA extraction (15). We therefore used only a single nucleic acid procedure toobtain both RNA and DNA. The DNA and rRNA bands of the gel picture (seeFig. 1) were scanned to quantify DNA and rRNA separately, and the ethidiumbromide staining intensities were integrated with the software program Photo-shop 3.0 (Adobe). The nucleic acid extracts were used for the amplification ofrDNA. A 1-ml portion of each water column extract diluted 1:10 and 1 ml of thesediment extract diluted 1:100 to account for the higher concentration were usedfor PCR amplification (10 to 20 ng of DNA input).DNA was extracted from MPN cultures (0.5-ml sample volume) by a protein-
ase K-SDS digestion step followed by phenol extraction and ethanol precipita-tion (46).Preparation of rcDNA. The undiluted nucleic acid extract described above (17
ml) was mixed with 2 ml of 103DNase buffer (400 mM Tris-HCl [pH 7.5], 60 mMMgCl2, 20 mM CaCl2) and 1 ml of DNase (10 U/ml; Boehringer, Mannheim,Germany) and incubated for 30 min at 378C. The DNase was removed byphenol-chloroform extraction. After ethanol precipitation and centrifugation,the resulting RNA pellet was dissolved in 20 ml of water. Four microliters of eachRNA preparation containing rRNA and mRNA was checked on a MOPS aga-rose gel for contamination with genomic DNA. The RNA preparations weresubsequently transcribed into cDNA. Transcription was carried out with 10 ml ofRNA solution. The solution was denatured at 708C for 10 min. Subsequently, 1ml of hexanucleotides (Boehringer Mannheim) in a 103 concentration diluted1:50, 2 ml of 103 PCR buffer, 2 ml of 0.1 M dithiothreitol, and 4 ml of de-oxynucleoside triphosphates (dNTP) (2.5 mM each) were added. The mixturewas incubated for 2 min at 378C before 1 ml of SuperscriptTM reverse tran-scriptase (200 U/ml; Gibco BRL Life Technologies Inc.) was added. The sampleswere incubated at 378C for 1 h and subsequently heated to 958C for 5 min to stopthe reaction. The cDNA preparations were diluted 1:1,000 with water. Of thesediluted preparations, 1 ml was used in the PCR (50-ml volume). Random primingof rcDNA synthesis with a hexanucleotide mix prevents the premature termina-tion of 16S rcDNA synthesis because of modified nucleotides, such as those atpositions 966 and 967 of the 16S rRNA (54). Random hexamers are consistentlymore efficient for cDNA synthesis than target site-directed primers, as was shownby cDNA PCR (26).PCR amplification of rDNA fragments. The 16S rRNA genes from mixed
bacterial DNA or cDNA were amplified by PCR. The primer combinationGM5F-GC clamp and DS907R amplified a 550-bp fragment of the 16S rRNAsuitable for subsequent DGGE analysis, membrane hybridization, and sequenc-ing (Table 1). This PCR amplificate yields sufficient sequence information forphylogenetic analysis (37). PCR amplifications were performed with a TechnePHC-3 temperature cycler (Techne, Cambridge, United Kingdom) as follows.Target DNA (10 to 20 ng) or 1 ml of cDNA diluted 1:1,000 was mixed with 25pmol of each of the appropriate primers, 5 ml of 103 PCR buffer (i.e., 100 mMTris-HCl [pH 9], 15 mMMgCl2, 500 mM KCl, 0.1% [wt/vol] gelatin, 1% [vol/vol]Triton X-100), 4 ml of 2.5 mM deoxyribonucleoside triphosphate solution, andsterile water in a final volume of 50 ml and was overlaid with 2 drops of mineraloil (Sigma Chemicals Co. Ltd.) in a 0.5-ml vial. To minimize the nonspecificannealing of the primers to nontarget DNA, 0.5 U of SuperTaq DNA polymer-ase (HT Biotechnology Ltd.) at a temperature of 808C was added to the reactionmixture after the initial denaturing step (948C for 5 min). In addition, to increasethe specificity of the amplification and to reduce the formation of spuriousby-products, a ‘‘touchdown’’ PCR (9) in which the annealing temperature was setto 658C, which is 108C above the expected annealing temperature, and decreasedby 18C every second cycle until a touchdown of 558C, at which temperature 10additional cycles were carried out, was performed. The annealing temperature,Tm (in degrees centigrade), was estimated as 81.5 1 16.6(log10[cat1]) 1 0.41 (%G1C) 2 (600/N) (46). Denaturation was carried out at 958C for 1 min, theannealing time was 1 min, and primer extension was carried out at 728C for 3min. The ramp times were set to the fastest mode of the PHC3 Thermocycler.Aliquots (5 ml) of the amplification products were analyzed by electrophoresis in2% (wt/vol) Nusieve agarose gels (FMC) containing 0.5 mg of ethidium bromideper ml.DGGE analysis. PCR products obtained with primer combination GM5F-GC
clamp and DS907R were analyzed by DGGE. DGGE was performed with aBio-Rad Protean II system as described previously (35, 36). PCR products wereprepared as follows. PCR product (300 ml) was precipitated with 30 ml of 5 MNaCl and 750 ml of ethanol at 2808C for 1 h. After centrifugation, the pellet waswashed with 70% (vol/vol) ethanol, dried under a vacuum, dissolved in 15 ml ofwater, and applied to the DGGE gel.DGGE was performed with 6% (wt/vol) polyacrylamide gels in 0.53 TAE (20
mM Tris-acetate [pH 7.4], 10 mM acetate, 0.5 mM Na2 EDTA) with denaturinggradients ranging from 20 to 70% denaturant (100% denaturant corresponds to7 M urea and 40% [vol/vol] formamide deionized with AG501-X8 mixed bedresin [Bio-Rad Laboratories, Inc.]). Gels were made with 6% (wt/vol) acrylamidestock solutions (5.694 g of acrylamide and 0.306 g of bis-acryloylcistamine [20:1]
1406 TESKE ET AL. APPL. ENVIRON. MICROBIOL.
on Novem
ber 5, 2019 at MA
X-P
LAN
CK
-INS
TIT
UT
FU
Rhttp://aem
.asm.org/
Dow
nloaded from
per 100 ml of solution) of 20 and 70% denaturant with a Bio-Rad Econo pumpand Bio-Rad model 385 gradient former. DGGE gels were allowed to polymerizefor at least 12 h. Electrophoresis was performed for 4 h at a constant 200 V anda temperature of 608C. After electrophoresis, the gels were incubated for 15 minin Milli-Q water containing ethidium bromide (0.5 mg/liter), rinsed for 10 min inMilli-Q water, and photographed on a UV transillumination table (302 nm) witha Cybertech CS1 digital camera (Cybertech, Berlin, Germany).Small pieces of selected DGGE bands were punched from the DGGE gel
before the blotting procedure. The PCR products of the cutouts were eluted andreamplified as described previously (36). The cutout positions are indicated inaccompanying figures (see Fig. 2 and 5).Blotting and hybridization analysis of DGGE gels. DGGE-separated PCR
products were analyzed by blotting with rRNA-targeted probes (35, 36). The gelswere equilibrated in 0.53 TBE (45 mM Tris-borate [pH 8], 45 mM boric acid, 1mM Na2 EDTA) for 15 min. The DGGE-separated PCR products were trans-ferred to a nylon membrane (Hybond-N1; Amersham, Amersham, United King-dom) with a Trans-Blot SD semidry transfer cell (Bio-Rad Laboratories, Inc.).Electrotransfer was performed for about 1 h at a constant 400 mA. The mem-brane was incubated for 15 min in 0.4 M NaOH–0.6 mM NaCl solution todenature the DNA, subsequently neutralized by two rinses in a large volume of2.53 SSC (13 SSC is 0.15 M NaCl plus 0.015 M sodium citrate), and exposed for45 s to 302-nm UV light to cross-link the DNA fragments to the membrane.The 16S rRNA region amplified by primers GM5F and DS907R includes
several target sites for general and genus-specific oligonucleotide probes forsulfate-reducing bacteria. Three such probes (Table 1) were used to analyze theDGGE patterns for 16S rRNA amplificates of sulfate-reducing bacteria. Probeswere labeled with digoxigenin with the digoxigenin oligonucleotide labeling kitand protocols from the manufacturer, Boehringer, Mannheim, Germany. Digoxi-genin-labeled probes were detected by an antibody coupled with alkaline phos-phatase, which gives a chemiluminescent reaction with CSPD (Tropix, Bedford,Mass.). Hybridization was performed as described by Muyzer et al. (36). Forprobe 385, a hybridization and washing temperature of 508C was used (35).Under these hybridization conditions, probe 385 did not discriminate amongdifferent sulfate-reducing populations on the basis of a possible single G/Amismatch in position 395 of the 16S rRNA sequence. (Members of the generaDesulfovibrio and Desulfobulbus have a G at this position, whereas members ofthe genera Desulfomicrobium and Desulfobacter have an A.) The probe wastherefore targeted at the general delta subdivision of the sulfate-reducing pop-ulation. Discrimination against two mismatches was, however, confirmed by testblots with appropriate reference strains. Probe 804 was hybridized at 408C andwashed at 458C (7). Probe 687 was hybridized at 408C and washed at 458C (7).The probes were removed from the membrane for rehybridization as describedby Muyzer et al. (36).The holes punched out of the DGGE gel served as position markers for the
alignment of the DGGE ethidium bromide and hybridization pictures. Aligningthe ethidium bromide-stained and blotted DGGE patterns requires these posi-tion markers, since the blotting process distorts the proportions of the gel. Thepositions of the holes are marked in accompanying figures (see Fig. 2 and 5). Thealignment was done with the software program Photoshop 3.0 (Adobe).Sequencing of PCR products. Reamplified PCR products obtained from the
excised DGGE bands were gel purified as follows. A small well was cut into theagarose gel in front of the selected PCR product. Electrophoresis was continueduntil the PCR product migrated into the buffer-filled well, where it was taken upwith a pipette and transferred into an Eppendorf vial and subjected to ethanolprecipitation. The purified PCR products were sequenced directly: 10 to 100 ngof purified PCR product was mixed with 2 ml of 53 concentrated sequencingbuffer (200 mM Tris-HCl [pH 7.5], 100 mM MgCl2, 250 mM NaCl), 1 ml of 5%Nonidet P-40 (Sigma) aqueous solution, 2 pmol of primer, and double-distilledwater in a final volume of 10 ml. The double-stranded PCR product was dena-
tured by heating the 10-ml volume to 958C for two 5-min periods, with a shortcentrifugation in between to recollect the 10-ml volume. The sequencing reactionwas started by adding 1.0 ml of 0.1 M dithiothreitol, 2.0 ml of dNTP solution (200nM [each] dGTP, dATP, and dTTP), 0.5 ml of [a-33P]dCTP (10 mCi/ml; 3,000Ci/mmol), and 2 ml (1 U) of Sequenase 2.0 (U.S. Biochemicals). After a shortcentrifugation to collect and mix the sample volume (15.5 ml), the sample wasincubated for 5 min at 378C.The sample volume was then divided into four 3.5-ml portions, and each
portion was added to dideoxynucleotide termination solutions (2.5 ml each, witheach containing 80 mM dGTP, dATP, dTTP, and dCTP and 8 mM dideoxynucle-otide). After a 5-min incubation at 378C, the reaction was terminated by adding4 ml of a solution of 96% (vol/vol) formamide and 20 mM EDTA. The sampleswere heated for 5 min at 958C, and 2.5 ml of the samples was loaded onto a 0.25-to 0.40-mm wedge sequencing gel (6% [vol/vol] acryl-bisacrylamide [30:1] and 7M urea). After electrophoresis at a constant 60 W for 4 h, the gel was fixed, dried,and exposed with an X-ray film (Kodak XAR5).Sequence alignment and phylogenetic tree inference. The 16S rRNA se-
quences were aligned with those of other bacteria obtained from the RibosomalDatabase Project (RDP) (31). The SIMILARITY_RANK tool of the RDP wasused to search for close evolutionary relatives. Sequence alignments were pre-pared with the sequence alignment editor SEQAPP (17). Distance matrixes werecalculated with DNADIST as implemented with the software package PHYLIP(version 3.5) developed by Felsenstein (11), with the Jukes-Cantor model, whichassumes independent change at all sites with equal probability, being used (24).Phylogenetic trees were constructed from evolutionary distances calculated withthe algorithm of Fitch and Margoliash as implemented in the program FITCHwith the software package PHYLIP (version 3.5).Nucleotide sequence accession numbers. The sequences obtained in this study
are available from GenBank under accession numbers L40767, L40783, L40789,L40784, L40785, L40786, and L40787.
RESULTS
Extracted nucleic acids. Genomic DNA and rRNA wereisolated from different water layers of Mariager Fjord, andequal volumes (5 ml) of the isolated nucleic acids (dissolved in50 ml) were analyzed on an ethidium bromide-stained agarosegel (Fig. 1). Genomic DNA, in the upper positions on the gel,and rRNAs, appearing as two distinct double bands, are thepredominant nucleic acids visible in the agarose gel. Large-subunit rRNAs, eukaryotic 28S rRNA and prokaryotic 23SrRNA, form the upper double band. Small-subunit rRNAs,eukaryotic 18S rRNA and prokaryotic 16S rRNA, appear asthe lower double band. Eukaryotic 28S rRNA and 18S rRNAare found only in fully or partially oxygenated water layersabove and in the chemocline to a depth of 14.5 m, whereasprokaryotic 23S rRNA and 16S rRNA are found in both oxicand anoxic water layers.Total DNA, 16S rRNA, and 18S rRNA were quantified by
scanning and integrating the staining intensities of the DNAand rRNA bands. The 18S rRNA disappeared below the che-mocline. 16S rRNA showed a maximum abundance in thechemocline at a depth of 14.5 m where the concentration was
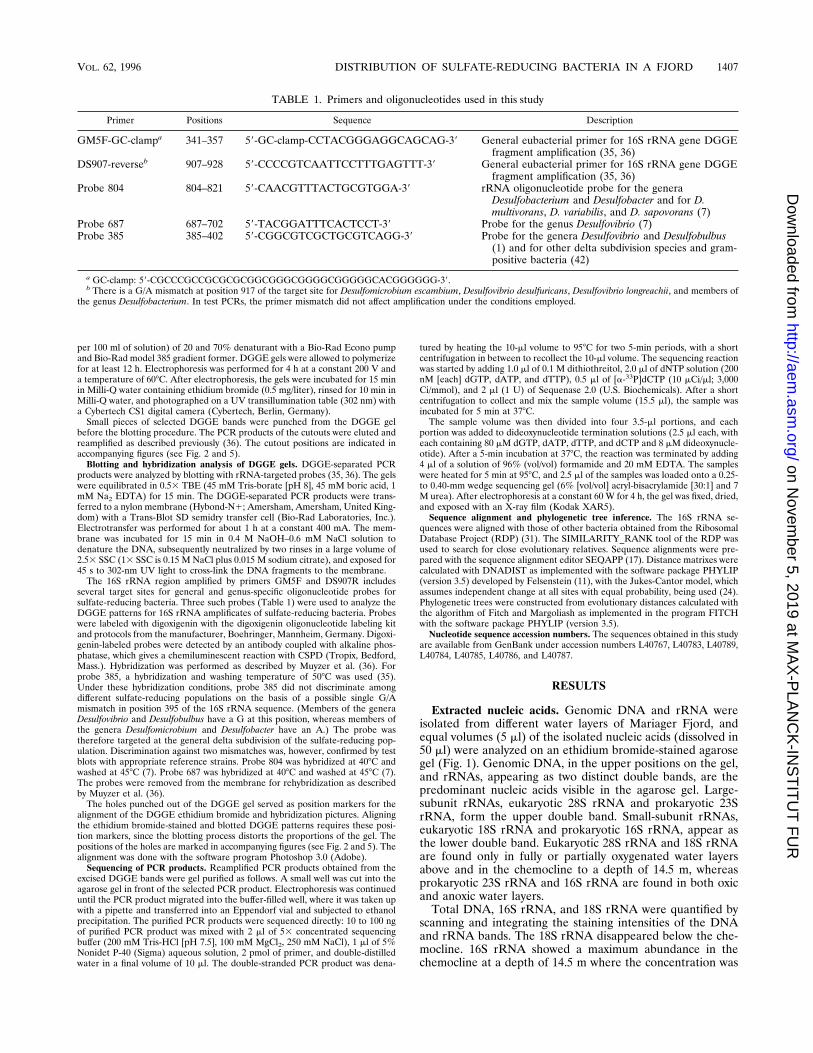
TABLE 1. Primers and oligonucleotides used in this study
Primer Positions Sequence Description
GM5F-GC-clampa 341–357 59-GC-clamp-CCTACGGGAGGCAGCAG-39 General eubacterial primer for 16S rRNA gene DGGEfragment amplification (35, 36)
DS907-reverseb 907–928 59-CCCCGTCAATTCCTTTGAGTTT-39 General eubacterial primer for 16S rRNA gene DGGEfragment amplification (35, 36)
Probe 804 804–821 59-CAACGTTTACTGCGTGGA-39 rRNA oligonucleotide probe for the generaDesulfobacterium and Desulfobacter and for D.multivorans, D. variabilis, and D. sapovorans (7)
Probe 687 687–702 59-TACGGATTTCACTCCT-39 Probe for the genus Desulfovibrio (7)Probe 385 385–402 59-CGGCGTCGCTGCGTCAGG-39 Probe for the genera Desulfovibrio and Desulfobulbus
(1) and for other delta subdivision species and gram-positive bacteria (42)
a GC-clamp: 59-CGCCCGCCGCGCGCGGCGGGCGGGGCGGGGGCACGGGGGG-39.b There is a G/A mismatch at position 917 of the target site for Desulfomicrobium escambium, Desulfovibrio desulfuricans, Desulfovibrio longreachii, and members of
the genus Desulfobacterium. In test PCRs, the primer mismatch did not affect amplification under the conditions employed.
VOL. 62, 1996 DISTRIBUTION OF SULFATE-REDUCING BACTERIA IN A FJORD 1407
on Novem
ber 5, 2019 at MA
X-P
LAN
CK
-INS
TIT
UT
FU
Rhttp://aem
.asm.org/
Dow
nloaded from

increased by approximately a factor of four compared with thatof other layers of the water column (see Fig. 3A). The in-creased 16S rRNA content of cells in the chemocline was alsoevident from the in situ fluorescence hybridization intensities,which were determined with a general eubacterial 16S rRNAprobe (see Fig. 6D of the accompanying paper [42]). The DNAconcentrations remained almost constant in all water layers ofMariager Fjord, with a slight increase in the chemocline. Theequal DNA concentrations correspond to uniform bacterialnumbers obtained by general nucleic acid stains (see Fig. 6A ofreference 42). Fluorescent in situ hybridizations and nucleicacid extractions were performed with bacteria sampled at thesame time and location (42).DGGE analysis of PCR-amplified rDNA fragments. 16S
rDNA fragments, obtained after enzymatic amplification ofnucleic acids fromMariager Fjord water column samples, wereanalyzed by DGGE. The resulting pattern of bands was visu-alized by ethidium bromide staining (Fig. 2A). Different bandsof the DGGE profile correspond to different PCR-amplified16S rRNA fragments obtained from different bacterial speciesor strains. The complex pattern of DGGE fragments is thusderived from the bacterial populations and their nucleic acids.Very small differences in the sequences of amplified 16S rRNAfragments, ranging from 1 to 10 nucleotides, are usually suffi-cient to separate similar PCR products (52), although posi-tional overlap of bands from two different species cannot beexcluded. Aware of this caveat, we view the DGGE band pat-tern as an approximate representation of the bacterial speciesand strain diversity in the water column of Mariager Fjord. TheDGGE pattern can be interpreted in two different ways. First,specific bands emerge and disappear in different water layers(Fig. 2A). Some bands in the DGGE profile occur in all layersof the water column (Fig. 2A, band 1); others are found in theoxic water layer only (band 2), in the anoxic deeper waterlayers (band 3), or specifically in the chemocline (band 4).Supposing a constant PCR amplification bias for (or against) aspecific bacterial rDNA or rcDNA sequence, the appearanceand disappearance of a DGGE band reflect the increase anddecrease of the corresponding bacterial population. Intensitiesof different DGGE bands, derived from different bacterialspecies, do not allow quantitative conclusions about the abun-dance of the different bacteria, because of a possible unknownPCR bias in the amplification of different templates.
The second way to interpret the DGGE pattern is to com-pare DGGE bands which were derived from reverse-tran-scribed 16S rRNA with those from the corresponding genes,16S rDNA. Since metabolically active cells are generally pre-sumed to have a higher rRNA content and rRNA/DNA ratiothan inactive, dormant cells (29, 41, 45), rRNA-derived DGGEbands could conceptually correspond to the metabolically ac-tive bacterial populations of Mariager Fjord while rDNA-derived DGGE bands could reflect the numerically domi-nant populations. Limiting such comparisons to rcDNA-and rDNA-derived PCR products with identical mobilities(presumably from the same bacterial species) to rule out PCRbias due to different template sequences, it is likely that suchpatterns point to actual differences between the presence andexpression of a particular 16S rRNA gene. DGGE patterns ofPCR-amplified bacterial 16S rRNA genes differ markedly fromthose of reverse-transcribed, PCR-amplified 16S rRNA (Fig.2A). Chemocline bands a and b appear dominant in theDGGE pattern obtained from transcribed rRNA but are onlyfaintly visible in the DGGE pattern of amplified 16S rRNAgenes (Fig. 2A). All clearly defined DGGE bands were excisedas shown in Fig. 2A. However, only bands which hybridizedwith probes for sulfate-reducing bacteria in subsequent blot-ting experiments were reamplified and sequenced.Hybridization analysis of DGGE patterns. To identify bands
of the DGGE patterns which are possibly derived from sulfate-reducing bacteria, the DGGE patterns were blotted onto anylon membrane and hybridized with digoxygenin-labeled 16SrRNA probe 385 or with probe 804 (Table 1). Probe 385 wasdesigned for gram-negative sulfate-reducing bacteria of thedelta subdivision of the proteobacteria (1). Several gram-pos-itive non-sulfate-reducing bacteria also carry the target se-quence of the probe (42). Acetate-oxidizing sulfate-reducingbacteria were monitored with probe 804, which is specific forthe acetate-oxidizing sulfate-reducing genera Desulfobacterand Desulfobacterium and for Desulfosarcina variabilis, Desul-fococcus multivorans, and Desulfobotulus sapovorans (7). Probe687, specific for members of the genus Desulfovibrio, was alsoapplied. In DGGE blotting and hybridization experiments,probe 687 gave only very weak hybridization signals withDGGE fragments from 16- and 20-m-deep and sediment sam-ples. In repeated membrane hybridization experiments withprobe 687, unusually low hybridization signals were also ob-tained in part with positive controls, and therefore the probewas not used further.The results of consecutive hybridization of the DGGE pat-
tern with probes 804 and 385 are shown in Fig. 2B and C.Probe 385 hybridized only weakly with bands of rRNA-derivedamplificates from oxic water at depths of 8 and 13 m but gavean intense hybridization signal with two rRNA-derived bandsfrom samples from the chemocline at depths of 14.5 and 16 m.Both bands, labeled a and b, show identical positions in theDGGE pattern (Fig. 2). The anoxic water sample from a depthof 20 m and the sediment sample from a depth of 26 m gave astrong but diffuse hybridization signal with probe 385 whichwas probably derived from a multitude of different organismswhich are not properly resolved in the DGGE pattern. Asimilarly diffuse hybridization signal with probe 385 was foundfor rDNA-derived amplificates from anoxic water and sedi-ment. The strong chemocline bands a and b are only faintlyvisible in the rDNA-derived DGGE pattern and give a lowhybridization signal with probe 385 (Fig. 2B). This result mightindicate that this chemocline bacterium is far more significantbecause of its activity than because of its numerical presence.Hybridization signals with probe 804 were found only with
samples from below the chemocline, with which it gave hybrid-
FIG. 1. Agarose gel of nucleic acids extracted from Mariager Fjord watersamples obtained from depths of 8, 13, 14.5, 16, and 20 m. Nucleic acids (0.5 to1.0 mg) of each sample were loaded on the gel. RNA (1 mg) of Desulfovibriobaculatus DSM 2555 was run as the standard in lane R. The amounts of totalextracted nucleic acids were in the range of 5 to 10 mg per sample. lsu, largesubunit; ssu, small subunit.
1408 TESKE ET AL. APPL. ENVIRON. MICROBIOL.
on Novem
ber 5, 2019 at MA
X-P
LAN
CK
-INS
TIT
UT
FU
Rhttp://aem
.asm.org/
Dow
nloaded from

ization signals in both the rRNA- and the rDNA-derivedDGGE patterns (Fig. 2C). Hybridization intensities of probes385 and 804 were integrated for both rRNA- and rDNA-de-rived DGGE patterns. The integrated hybridization intensitiesof probes 385 and 804 for different water layers are given inFig. 3B. The hybridization intensity of probe 385 generallyincreased with depth. In the rRNA-derived DGGE pattern, itreached a local maximum with amplificates from the chemo-cline at 16 m because of the high intensity of band a/b (Fig. 2).The hybridization intensity of probe 804 also increased withdepth for both rDNA- and rRNA-derived DGGE patterns(Fig. 3B).Interestingly, these results obtained by a qualitative method,
PCR, reflect a trend which is defined by conceptually different,quantitative approaches. MPN counts indicate an increase ofthe sulfate-reducing bacterial population at the chemocline bya factor of approximately 10 (Fig. 3C). The integrated fluores-cent hybridization intensities of whole cells obtained by directhybridization of 16S rRNA with probe 385 and without PCRamplification also increased by 1 order of magnitude (see Fig.7A of reference 42). These population shifts took place againsta background of almost constant bacterial cell density (see Fig.6A of reference 42) and nucleic acid concentration (Fig. 3A) inthe water column.Sequencing and identification of DGGE bands a and b.
rRNA chemocline bands a and b (Fig. 2) were reamplified andsequenced. The sequences were compared with each other andanalyzed for their phylogenetic affiliations with known sulfate-reducing and delta subdivision bacteria. Hybridization withprobe 385 did not provide enough phylogenetic resolution, asit allowed a cross-reaction with the marine nitrifier Nitrospinagracilis, for instance. When the probe sequence was comparedwith the 16S rRNA reference sequences of the RDP (31), thesequence of probe 385 matched those of at least six knownnon-sulfate-reducing delta subdivision bacteria, Bdellovibriobacteriovorans, four myxobacteria (Angiococcus disciformis,Archangium gephyra, Cystobacter fuscus, and Corallococcus cor-alloides), and N. gracilis (50). Myxobacteria, typical soil bacte-ria, are unlikely organisms in marine habitats. However, N.gracilis is a marine nitrifier which could occur in the Maria-gerfjord chemocline and could cross-react with probe 385; fur-thermore, nitrate and nitrite concentrations were highest in theupper chemocline (see Fig. 3D of reference 42). The gel po-sitions of the N. gracilis-derived DGGE fragment and of thedominant rRNA bands a and b (Fig. 2) were compared inseparate DGGE experiments and found to be different (resultsnot shown).Bands a and b (Fig. 2) had identical sequences, consistent
with their identical positions in the gel. The complete sequenceof the DGGE fragment was determined and, by using thesimilarity check facilities of the RDP (31), identified as a deltasubdivision sequence. This result was substantiated by check-ing the sequence for the signature nucleotides of the deltasubdivision (58). The sequence was compared with sequencesof sulfate-reducing and non-sulfate-reducing bacteria of thedelta subdivision obtained from GenBank and the RDP, but itcould not be assigned to a known phylogenetic branch of thedelta subdivision, including recent molecular isolates (6, 8, 25),and was not related to sequences obtained fromMPN cultures.
FIG. 2. (A) Ethidium bromide-stained DGGE pattern of PCR products de-rived from rDNA and rRNA extracted from the Mariager Fjord water columnand sediment samples. rRNA-derived DGGE bands for water column samplesfrom depths of 8, 13, 14.5, 16, and 20 m and for sediment samples (S) from adepth of 24.3 m are shown. rDNA-derived DGGE bands for the same samplesare also shown. The small circles indicate gel portions that were excised forreamplification and sequencing. Numbers 1 to 4 refer to DGGE bands discussedin Results (‘‘DGGE analysis of PCR-amplified rDNA fragments’’). DGGEbands a and b are also discussed in Results (‘‘Hybridization analysis of DGGEpatterns’’). (B) The same DGGE gel was membrane blotted and hybridized withrRNA probe 385 (1). The small circles indicate gel portions that were excised forreamplification and sequencing, which allowed a correlation to bands in theethidium bromide-stained DGGE gel in panel A to be made. Bands a and b weresequenced. S, sediment sample. (C) The same DGGE gel was membrane blottedand hybridized with rRNA probe 804 specific for Desulfobacter spp., Desulfobac-
terium spp., D. variabilis, D. multivorans, and D. sapovorans (7). The small circlesindicate gel portions that were excised for reamplification and sequencing, whichallowed a correlation with bands in the ethidium bromide-stained DGGE gel inpanel A to be made. S, sediment sample.
VOL. 62, 1996 DISTRIBUTION OF SULFATE-REDUCING BACTERIA IN A FJORD 1409
on Novem
ber 5, 2019 at MA
X-P
LAN
CK
-INS
TIT
UT
FU
Rhttp://aem
.asm.org/
Dow
nloaded from

Instead, it appeared to be a new, distinct phylogenetic lineagewithin the delta subdivision. This sequence positions this bac-terium between the incompletely and the completely oxidizingsulfate-reducing bacteria and in relative proximity to non-sul-fate-reducing members of the delta subdivision, such as N.gracilis, Geobacter metallireducens, Syntrophobacter wolinii, andmembers of the genera Pelobacter, Desulfuromusa, and Desul-furomonas (Fig. 4). The chemical conditions of the chemocline,especially the peak concentrations of elemental sulfur, oxi-dized iron and manganese, and nitrate (see Fig. 3 of reference42), allow several possible metabolic modes, i.e., iron and man-ganese reduction (G. metallireducens and members of the gen-era Pelobacter and Desulfuromonas), fermentation of organiccompounds (members of the genus Pelobacter), sulfur reduc-tion (members of the genera Desulfuromusa and Desulfuromo-nas), nitrification (member of the genus Nitrospina), sulfurdisproportionation, and sulfate reduction (delta subdivisionsulfate reducers). A definite answer would require isolation ofthis bacterium in pure culture.MPN counts of sulfate-reducing bacteria. Cultivable sulfate-
reducing bacteria in the Mariager Fjord water column werecounted by MPN serial dilution. Lactate, acetate, and hydro-gen were used as substrates (Fig. 3C). Acetate-utilizing bacte-ria were found in low numbers (10 to 30 cells per ml) in anoxicwater at depths of 16 and 20 m. Even in the sediment, we foundonly low numbers (103 to 104 cells per ml). This result might bethe consequence of cell clumping, as is often observed fornonmotile, marine, acetate-oxidizing sulfate reducers, i.e.,members of the genera Desulfobacter and Desulfosarcina (56,57). MPN counts with lactate gave significantly higher num-bers. Approximately 25 cultivable cells of sulfate-reducing bac-teria per ml were counted in oxic water layers above the che-mocline. Cell numbers below the chemocline increased toapproximately 250 cells in the anoxic water layer at a depth of20 m and to 105 to 106 cells per ml in the bottom sediment. Asimilar trend was found when hydrogen was used as the sub-strate.
MPN cultures from high dilutions were PCR amplified andanalyzed by DGGE. The DGGE patterns were blotted andhybridized with probes 385 and 804. As an example, Fig. 5Ashows the ethidium bromide-stained DGGE pattern of se-lected positive MPN dilutions which used lactate as the sub-strate. The hybridization of this DGGE gel with probe 385 isshown in Fig. 5B. After hybridization with probe 385, theDGGE pattern of the MPN cultures was compared with theDGGE patterns of 16S rDNA fragments obtained from theextracted nucleic acids, i.e., DNA and rRNA, to identify bandswith equal or similar gel positions and hybridization signals.Such identical or similar DGGE bands found in both DGGEpatterns could represent bacteria which were recovered bothas molecular isolates and as MPN cultures. Whenever appro-priate, similar MPN bands and water column bands were runon DGGE gels side by side to facilitate comparison beforebeing reamplified and sequenced. Upon this closer examina-tion, the investigated MPN bands and water column molecularisolates differed from each other.Sulfate-reducing bacteria in the oxic layer of the water col-
umn. The existence of a specific physiological and phylogeneticgroup of oxygen-tolerant sulfate-reducing bacteria was consid-ered, since high sulfate reduction rates and high counts ofsulfate-reducing bacteria have repeatedly been reported foroxic marine sediments and microbial mats (4, 14, 21, 23, 43).To test this assumption, sulfate-reducing bacteria growing inMPN cultures inoculated with oxic water samples from depthsof 8 and 13 m were identified by partial 16S rRNA sequences.Four DGGE bands of the lactate MPN series which wereobtained in the dilution corresponding to 10 cells per ml andwhich hybridized with probe 385 were sequenced: band c from8 m, band d from 13 m, band e from 20 m, and band f from 13m (Fig. 5B). Band e was obtained from a MPN sample fromthe anoxic zone at a depth of 20 m but was included in thesequencing, since its position in the DGGE gel was similar tothose of bands c and d (Fig. 5B). DGGE bands c, d, and e (Fig.5B) turned out to be Desulfovibrio sequences that were most
FIG. 3. (A) Integrated ethidium bromide staining intensities of extracted rRNAs (prokaryotic 16S rRNA and eukaryotic 18S rRNA) and total extracted DNA fromwater column samples from depths of 8, 13, 14.5, 16, and 20 m, plotted as percentages of the total integrated ethidium bromide staining intensity. (B) Integratedhybridization intensities of rRNA- and rDNA-derived DGGE bands with probes 385 and 804 for water column samples from depths of 8, 13, 14.5, 16, and 20 m, plottedas percentages of total integrated hybridization intensity. (C) MPN counts of cultivable sulfate-reducing bacteria (cells per milliliter) for water column samples fromdepths of 8, 13, 14.5, 16, and 20 m. The bars around the datum points indicate 95% confidence intervals (2).
1410 TESKE ET AL. APPL. ENVIRON. MICROBIOL.
on Novem
ber 5, 2019 at MA
X-P
LAN
CK
-INS
TIT
UT
FU
Rhttp://aem
.asm.org/
Dow
nloaded from

closely related to that of the marine, salt-requiring speciesDesulfovibrio salexigens (Fig. 4). Sequence f (Fig. 5B) was dis-tantly related to those of members of the genus Desulfobulbus.Another Desulfobulbus-related sequence, g, was obtained froma depth of 8 m in the first dilution step of the hydrogen MPNseries. Sequences f (Fig. 5B) and g clustered with four molec-ular isolates obtained from Florida marine sediments, A1, A30,A33, and A36 (8), indicating a coherent, Desulfobulbus-relatedphylogenetic group of presumably sulfate-reducing bacteria.Sequence g closely resembled the sequence of a psychrotro-phic, vacuolated, sulfate-reducing bacterium recently isolatedfrom sediments from Kysing Fjord in Denmark (19a). A De-sulfobacter-Desulfobacula-like sequence h was obtained from adepth of 14.5 m, the central chemocline, in the second dilutionstep of the hydrogen MPN series corresponding to 10 cells perml. This sequence did not form a coherent phylogenetic groupwith related molecular isolates. Two of the Florida molecular
isolates, A34 and A55 (8), and an uncultivable magnetotacticmulticelled prokaryote (6) belonged to the Desulfococcus-De-sulfosarcina-Desulfobotulus group (Fig. 4).The investigated sulfate-reducing bacteria obtained by MPN
series from the oxic water layers of Mariager Fjord are phylo-genetically affiliated with known sulfate-reducing bacteria.Desulfovibrio spp. and Desulfobulbus-related strains are feasi-ble inhabitants of the oxic water layers of Mariager Fjord, sinceseveral species of these genera are capable of respiring varioussubstrates aerobically. Desulfovibrio strains respire a wide va-riety of substrates: H2, lactate, pyruvate, formate, ethanol,SO3
22, S2O322, and H2S (5). Desulfobulbus propionicus re-
spires propionate, SO322, and H2S (5). Interestingly, the De-
sulfovibrio sequences from Mariager Fjord were phylogeneti-cally most closely related to that of the marine species D.salexigens, which showed almost no aerobic respiration at allwith the substrates tested (5), and to that of a recently isolated
FIG. 4. This 16S rRNA distance tree for delta subdivision bacteria and sulfate reducers functions as an identification scheme and overview for MPN isolates c, d,e, f, g, and h from oxic waters and rRNA amplificate a/b from the chemocline of Mariager Fjord. The tree is based on 16S rRNA sequence positions 341 to 907(Escherichia coli numbering). The scale bar corresponds to 0.1 substitutions per nucleotide position. The tree was rooted with the gram-positive sulfate reducerDesulfotomaculum nigrificans serving as the outgroup. Multifurcations indicate lines of descent for which the relative branching order cannot be unambiguouslydetermined, considering the different treeing methods and the limited amount of sequence information in a DGGE fragment. The sequences used to prepare this figurewere derived from the RDP with the anonymous ftp server at the University of Illinois in Urbana, Ill. The RDP was updated on 19 June 1994 (31). The new sequencesfrom the Mariager Fjord samples as determined by DGGE and MPN analysis are available from GenBank under accession numbers L40767, L40783, L40789, L40784,L40785, L40786, and L40787 (sequences a/b, c, d, e, f, g, and h, respectively). Relevant molecular isolates from other sources include A1, A30, A33, A34, A36, and A52(8), env.MMP91 (6), and PT-2 (25). Dbc, Desulfobacula; Peb, Pelobacter; Dss, Desulfuromusa; Dsm, Desulfuromonas; Dmo, Desulfomonile; dac, Desulfoarculus.
VOL. 62, 1996 DISTRIBUTION OF SULFATE-REDUCING BACTERIA IN A FJORD 1411
on Novem
ber 5, 2019 at MA
X-P
LAN
CK
-INS
TIT
UT
FU
Rhttp://aem
.asm.org/
Dow
nloaded from

marine Desulfovibrio sp. from Solar Lake (Egypt), which re-spired aerobically with various substrates (28a). The MariagerFjord molecular isolates were not related to a cultured Desul-fovibrio molecular isolate, PT-2, from an anaerobic, sulfido-genic bioreactor (25). Aerobic growth of oxygen-respiring sul-fate-reducing bacteria, defined as more than one doubling ofprotein, has not been observed so far (32). It therefore seemsunlikely that sulfate-reducing bacteria from Mariager Fjordactually grow as free-living aerobes in the oxic water column;rather they are more likely to persevere in this environment byparticle association or as components of marine snow (16, 48).
DISCUSSION
Integration of molecular, microbiological, and biogeochemi-cal approaches. Different approaches in the investigation ofthe Mariager Fjord bacterial ecosystem, such as fluorescent insitu hybridization and chemical analysis, DGGE analysis ofPCR-amplified 16S rDNA fragments, hybridization analysiswith specific probes, DNA sequencing, and MPN counts, resultin different data sets which have to be cross-checked and re-evaluated for a valid description of the bacterial populationswithin their natural habitat.We have used DGGE analysis of PCR-amplified 16S rDNA
fragments to infer an overall picture of the bacterial popula-tions in different water layers of Mariager Fjord. DGGE anal-ysis of DNA fragments obtained by amplification of rDNA andreverse-transcribed rRNA visualized the different patterns ofbacterial activity and bacterial presence in the water column.DGGE patterns are of a qualitative nature and importance andthus have to be treated with caution when quantitative conclu-sions are desired.The PCR, which predates the DGGE analysis, may selec-
tively amplify specific members of a given nucleic acid popu-lation, resulting in a quantitatively distorted representation ofthe natural bacterial populations (35). Comparisons of rDNA-and rcDNA-derived DGGE bands with identical mobilitiesand the ensuing qualitative conclusions about rRNA contentand possibly metabolic activity of the corresponding bacterialpopulation rely on three assumptions. First, rcRNA yield byreverse transcription increases with rRNA content. Second,PCR amplifications of genomic DNA sequences and the cor-responding reverse-transcribed hexanucleotide-primed cDNAsare roughly equally efficient. Third, the amplification of a par-ticular template should be largely unaffected by the presence ofother templates. These assumptions are implied when the che-mocline bacterium with rcDNA-derived DGGE band a/b isreferred to as highly active. Supporting evidence is provided bypure culture and coculture studies. PCR amplifications of De-sulfovibrio [Ni Fe]-hydrogenase cDNA give the highest yield inthe early logarithmic growth phase of bacterial cultures (53a).PCR amplification of hexanucleotide-primed 16S rcDNA andgenomic 16S rDNA sequences of a defined Desulfovibrio-Mari-nobacter coculture yielded the same DGGE patterns and pre-sumably the same set of 16S rRNA sequences (33a) withoutchimeric artifacts. PCR amplification of genomic DNA se-quences and corresponding cDNAs thus did not miss a mem-ber of the model community.The use of universal PCR primers in the amplification step
combined with the effective separation of different PCR prod-ucts enables DGGE to resolve a wide range of microbial di-versity in a given microbial ecosystem without the constraintsof specific media or the laborious sequencing of clone libraries.The novel, highly active chemocline organism representing anew phylogenetic lineage within the delta proteobacterial sub-division would probably not have been identified by any other
molecular method. Cloning of PCR products could haveyielded the bare sequence but would have given little informa-tion about the high activity of this organism in the chemocline.Although we have discussed DGGE of rDNA fragments as
a predominantly qualitative method to describe the structureof microbial populations, it reflects quantitative trends to somedegree and is, in this investigation, congruent with explicitlyquantitative methods. The DGGE pattern of the delta subdi-vision of sulfate-reducing bacteria, as obtained from mem-brane hybridizations with probes 385 and 804 (Fig. 2B and C),is congruent with the MPN counts of sulfate-reducing bacteria(Fig. 3C). Both approaches indicate that the most sulfate-reducing bacteria can be found in the anoxic water layer and in
FIG. 5. (A) Ethidium bromide-stained DGGE pattern of PCR products de-rived from MPN cultures using lactate as the substrate. MPN counts were donein triplicate. Each depth is represented by three samples, numbered consecu-tively, from high-positive MPN dilutions. Lanes 1 to 3, MPN cultures from theoxic zone at a depth of 8 m (dilutions of 100, 1021, and 1021); lanes 4 to 6: MPNcultures from the upper chemocline at a depth of 13 m (dilutions of 100, 1021,and 1021); lanes 7 to 9, MPN cultures from the central chemocline at a depth of14.5 m (dilutions of 1021, 1021, and 1021); lanes 10 to 12, MPN cultures from thelower chemocline at a depth of 16 m (dilutions of 100, 1021, and 1021); lanes 13to 15, MPN cultures from the anoxic water layer at a depth of 20 m (dilutions of1022, 1022, and 1021); lanes 16 to 18, MPN cultures from anoxic sedimentsamples (S) at a depth of 24.3 m (dilutions of 1022, 1025, and 1023); lane 19,DGGE bands derived from extracted rRNA from a sample from the centralchemocline at a depth of 14.5 m, with DGGE band a (cf. Fig. 2B) so that thispredominant chemocline band can be compared with the MPN bands. The smallcircles indicate portions of the gel at DGGE bands c, d, e, and f which werepunched out, reamplified, and sequenced. (B) Blotted DGGE pattern frompanel A hybridized with rRNA probe 385. The small circles indicate portions ofthe gel at DGGE bands c, d, e, and f which were punched out, reamplified, andsequenced. All other information is as for panel A. The box in lane 7 shows theonly positive hybridization signal with probe 804.
1412 TESKE ET AL. APPL. ENVIRON. MICROBIOL.
on Novem
ber 5, 2019 at MA
X-P
LAN
CK
-INS
TIT
UT
FU
Rhttp://aem
.asm.org/
Dow
nloaded from

the bottom sediment of Mariager Fjord. MPN counts indicatean increase in the numbers of sulfate-reducing bacteria fromabove to below the chemocline by approximately a factor of 10.The integrated intensity of the DGGE blot hybridization sig-nals of probes 385 and 804, as shown in Fig. 3B, shows a similarincrease of at least 1 order of magnitude. Interestingly, thesame trend is reflected by whole-cell fluorescent hybridizationintensities, as shown in Fig. 7D of the accompanying study(42), although the methods differ considerably. In situ hybrid-ization of 16S rRNA with fluorophor-labeled oligonucleotidesdoes not involve a PCR amplification step, which is a prereq-uisite of DGGE, and thus does not involve the possible am-plification bias of the PCR.In principle, MPN counts give a more stringent quantitative
picture of the distribution of sulfate-reducing bacteria in thewater column, since they count only viable, cultivable, actuallysulfate-reducing cells, no matter how small this populationmight be in comparison with other bacterial populations. Theconcentration of cultivable sulfate-reducing bacteria in the wa-ter column of Mariager Fjord, as determined by MPN counts,remained below 1,300 cells per ml, which was the upper limit ofthe 95% confidence interval for the highest MPN count (lac-tate, 20-m depth) (Fig. 3C). This selectivity of MPN counts isreflected by the finding that MPN isolates did not match majorbands of the DGGE pattern. The DGGE pattern of PCR-amplified nucleic acids conceptually represented the generalbacterial population, since the PCR primers chosen for thereamplification step were targeted to universally conservedsites of the 16S rRNA sequence. The physiological selectivityof MPN counts is often regarded as an obstacle to the com-plete analysis of a microbial community but should be viewedas a specific advantage and an important complement forrRNA-based molecular methods, which can, by their nature,give no direct information on the physiological capabilities ofbacterial populations. This information can sometimes be in-ferred from the 16S rRNA sequence if a molecular isolate fallsinto a well-known, phylogenetically and physiologically coher-ent bacterial group. On the other hand, molecular isolateswithout clear affinities to known bacterial genera remain, atbest, ecophysiologically ambiguous. The sequencing and phy-logenetic placement of DGGE bands a and b derived from anuncultured chemocline bacterium thus gave no clear indicationof the potential physiological capabilities of the organism.Direct cell counts reveal other specific limitations of culture-
dependent approaches. Cultivable sulfate-reducing bacteria inthe water column, estimated by MPN counts as 2 3 101 to 3 3102 cells per ml, represent only a minor fraction of the totalbacterial number (Fig. 3C). Ethidium bromide staining indi-cated 2 3 106 to 4 3 106 cells per ml and fluorescent in situhybridization with a general eubacterial probe resulted in 1 3106 to 2 3 106 cells per ml, as shown in Fig. 6A and B of theaccompanying study (42). Fluorescent in situ hybridizationcounts with probe 385 indicated cell numbers in the range of104 to 105 cells per ml, 3 orders of magnitude higher than theMPN counts of cultivable sulfate-reducing bacteria, as shownin Fig. 7A and B of the accompanying study (42). This discrep-ancy between total and cultivable cell numbers, the ‘‘GreatPlate Count Anomaly’’ (49), is particularly severe in marinehabitats. In oligotrophic and mesotrophic marine habitats, only0.1% or less of the general bacterial population is generallyrecovered by cultivation-dependent approaches (12, 20, 27, 28,49), which contrasts with the higher values, (5 to 15%) foundin such extremely eutrophic environments as activated sludge(53). This discrepancy is usually attributed to the inadequacy ofthe media used in cultivation-based approaches but may alsohave other, more profound reasons. Populations of viable but
nonculturable cells account for much of the total bacterialpopulation and activity in situ (19, 40). Such cells could still beviable in a given medium but do not grow beyond a few celldivisions and are therefore not recognized in plate or MPNcounts. In a soil model system inoculated with a Pseudomonasfluorescens strain, only 0.21% of the starting population couldbe recovered as cultivable cells after 40 days but approximately20% of the starting population was found as viable but non-culturable cells (3). These cells were able to form microcolo-nies but did not grow beyond a few cell divisions and were onlydetectable by a combined microcolony-epifluorescence assay(3). Thus, the viable, cultivable population of the Pseudomonasstrain corresponded to only 1% of the viable but nonculturablepopulation. A similar ratio of viable and culturable and viablebut nonculturable cells could apply to the Mariager Fjordsulfate reducers. Culturable sulfate-reducing bacteria in theanoxic water layers, estimated by MPN as being 200 to 300 cellsper ml, correspond to 0.2 to 0.3% of the 105 cells per ml foundby in situ hybridization with probe 385 (42).The chemical conditions in the water column, the position of
the chemocline, and the extent and overlap of oxidized andreduced water layers (42) are consistent with the results ob-tained in this molecular and microbiological investigation. Thecontinuous gradients of chemical conditions in the water col-umn are mirrored by highly differentiated bacterial popula-tions in the water column, as shown by DGGE (Fig. 2A). Theavailability of a wide range of electron donors and acceptors inthe chemocline, such as oxygen, sulfide, elemental sulfur, sul-fate, nitrate, ammonia, and oxidized and reduced forms ofmanganese and iron (42), is connected with high bacterialactivity and rRNA yield in the chemocline (Fig. 1). The num-bers of cultivable sulfate reducers increased within but notbelow the chemocline, as was evidenced by MPN counts andcongruent with fluorescent in situ hybridization of individualcells and membrane hybridization of PCR-amplified 16SrRNA and rDNA fragments.This result suggests the potential for sulfate reducers to
utilize alternative electron acceptors in the chemocline (5, 30,44, 47). Sulfur disproportionation, which has been demon-strated for enrichments, pure cultures, and the sulfate-reduc-ing bacterium D. propionicus, is another possible process in thechemocline. Elemental sulfur, together with oxidized iron andmanganese for the concomitant reoxidation of sulfide pro-duced by disproportionation, was found in concentrations of0.5 mM in the chemocline (30, 51). These reactions might beattributed to certain highly active delta subdivision chemoclinebacteria, such as the molecular isolate found by DGGE andsequencing in this study, and the long slim rod-shaped bacte-rium apparent by fluorescent in situ hybridization with probe385 shown in the 16-m sample in Fig. 5 of the accompanyingpaper (42). Isolation of new biogeochemically significant bac-terial types, combined with systematic probe development, isnecessary to link microbiological and biogeochemical pro-cesses.Summary. Different approaches in this polyphasic study al-
lowed us to infer this overall picture of the sulfate-reducingbacterial populations of Mariager Fjord. Amounts of total bac-terial nucleic acids remained almost constant throughout thewater column of Mariager Fjord, with the exception of thechemocline. The bacterial population was continuously chang-ing in composition but not in total mass throughout the watercolumn and showed a highly differentiated pattern of activeversus dormant subpopulations, as was revealed by DGGEanalysis of 16S rRNA- and 16S rDNA-derived PCR amplifi-cates. An rRNA-rich and therefore probably highly active sub-population of novel delta subdivision bacteria was found in the
VOL. 62, 1996 DISTRIBUTION OF SULFATE-REDUCING BACTERIA IN A FJORD 1413
on Novem
ber 5, 2019 at MA
X-P
LAN
CK
-INS
TIT
UT
FU
Rhttp://aem
.asm.org/
Dow
nloaded from

chemocline of Mariager Fjord by DGGE analysis and subse-quent sequencing of the individual bands. Delta subdivisionsulfate-reducing bacteria have their maximum cell density inthe anaerobic and anoxic water layers within and below thechemocline, a result substantiated by MPN counts, hybridiza-tion analysis of the DGGE patterns, and fluorescent in situhybridization of individual cells (42). Cultivation-dependentMPN counts of sulfate-reducing bacteria were consistently 3orders of magnitude lower than direct counts by fluorescent insitu hybridization, but both approaches indicated an increasein the numbers of sulfate-reducing bacteria in the chemoclineby approximately 1 order of magnitude. This ratio also resultedfrom an analysis of the integrated hybridization intensities ofPCR-amplified rRNA and rDNA-derived DGGE bands withprobes 385 and 804 (Fig. 3B). Although the maximum numberof sulfate-reducing bacteria occurred in and below the chemo-cline, cultivable sulfate-reducing bacteria were also quantifiedin the oxic part of the water column by MPN. Cultivable sul-fate-reducing bacteria of the oxic water layers were shown by16S rRNA sequencing to be affiliated to the genera Desulfo-vibrio and, although more distantly, Desulfobulbus.Biogeochemical, molecular, and microbiological approaches
contributed to this study of the sulfate-reducing bacteria andthe microbial ecosystem of Mariager Fjord. The methodolog-ical limitations of each approach constrain the range overwhich valid conclusions can be drawn and require a carefulintegration of these different perspectives to perceive thewhole picture of a natural habitat. Unexpected mismatchesbetween different data sets were found, such as the clearlydifferent DGGE patterns derived from rRNA and rDNA, thenonidentity of molecular and culture isolates, and the gapbetween fluorescent and culture-dependent bacterial counts.Nevertheless, these discrepancies are in fact highly valuableindicators of real phenomena: the highly differentiated patternof bacterial activity, the abundance of uncultured bacteria, andthe selectivity of our own approaches for the study of a micro-bial ecosystem.
ACKNOWLEDGMENTS
We would like to thank the following persons for their sailing skills,friendly help, fruitful advice, and inspiring discussions: Hans Jensen,Dan Jensen, Finn Andersen, Tim Ferdelman, Henrik Fossing, SabineHottentrager, Bo Barker Jørgensen, Rolf Lillebæk, and Bo Thamdrup.The paper also benefited from the comments of two anonymous re-viewers.This study was supported by the Max Planck Society, Munich, Ger-
many.
REFERENCES
1. Amann, R. I., B. J. Binder, R. J. Olson, S. W. Chisholm, R. Devereux, andD. A. Stahl. 1990. Combination of 16S rRNA-targeted oligonucleotideprobes with flow cytometry for analyzing mixed microbial populations. Appl.Environ. Microbiol. 56:1919–1925.
2. American Public Health Association. 1969. Standard methods for the exam-ination of water and wastewater, including bottom sediments and sludge, p.604–609. American Public Health Association, Washington, D.C.
3. Binnerup, S. J., D. F. Jensen, H. Thordal-Christensen, and J. Sørensen.1993. Detection of viable, but non-culturable Pseudomonas fluorescens DF57in soil using a microcolony epifluorescence technique. FEMS Microbiol.Ecol. 12:97–105.
4. Canfield, D., and D. J. Des Marais. 1991. Aerobic sulfate reduction inmicrobial mats. Science 251:1471–1473.
5. Dannenberg, S., M. Kroder, W. Dilling, and H. Cypionka. 1992. Oxidation ofH2, organic compounds and inorganic sulfur compounds coupled to reduc-tion of O2, or nitrite by sulfate-reducing bacteria. Arch. Microbiol. 158:93–99.
6. Delong, E., R. B. Frankel, and D. A. Bazylinski. 1993. Multiple evolutionaryorigins of magnetotaxis in bacteria. Science 259:803–806.
7. Devereux, R., M. D. Kane, J. Winfrey, and D. A. Stahl. 1992. Genus- andgroup-specific hybridization probes for determinative and environmental
studies of sulfate-reducing bacteria. Syst. Appl. Microbiol. 15:601–609.8. Devereux, R., and G. W. Mundfrom. 1994. A phylogenetic tree of 16S rRNAsequences from sulfate-reducing bacteria in a sandy marine sediment. Appl.Environ. Microbiol. 60:3437–3439.
9. Don, R. H., P. T. Cox, B. Wainwright, K. Baker, and J. S. Mattick. 1991.‘‘Touchdown’’ PCR to circumvent spurious priming during gene amplifica-tion. Nucleic Acids Res. 19:4008.
10. Emerson, S., R. E. Cranston, and P. S. Liss. 1979. Redox species in areducing fjord: equilibrium and kinetic considerations. Deep-Sea Res. 26A:859–878.
11. Felsenstein, J. 1989. Phylip—phylogeny inference package. Cladistics 5:164–166.
12. Ferguson, R. L., E. N. Buckley, and A. V. Palumbo. 1984. Response ofmarine bacterioplankton to differential filtration and confinement. Appl.Environ. Microbiol. 47:49–55.
13. Fischer, S. G., and L. S. Lerman. 1983. DNA fragments differing by singlebasepair substitutions are separated in denaturing gradient gels: correspon-dence with melting theory. Proc. Natl. Acad. Sci. USA 80:1579–1583.
14. Frund, C., and Y. Cohen. 1992. Diurnal cycles of sulfate reduction under oxicconditions in cyanobacterial mats. Appl. Environ. Microbiol. 58:70–77.
15. Fuhrman, J. E., D. E. Comeau, A. Hagstrom, and A. M. Chan. 1988. Extrac-tion from natural planktonic microorganisms of DNA suitable for molecularbiological studies. Appl. Environ. Microbiol. 54:1426–1429.
16. Fukui, M., and S. Takii. 1990. Survival of sulfate-reducing bacteria in oxicsurface sediment of a seawater lake. FEMS Microbiol. Ecol. 73:317–322.
17. Gilbert, D. G. 1992. SeqApp—a bio-sequence analysis application. IndianaUniversity, Bloomington.
18. Hastings, D., and S. Emerson. 1988. Sulfate reduction in the presence of lowoxygen levels in the water column of the Cariaco Trench. Limnol. Oceanogr.33:391–396.
19. Hoppe, H. G. 1978. Relations between active bacteria and heterotrophicpotential in the sea. Neth. J. Sea Res. 12:78–98.
19a.Isaksen, M., and A. Teske. Unpublished data.20. Jannasch, H., and G. E. Jones. 1959. Bacterial populations in seawater as
determined by different methods of enumeration. Limnol. Oceanogr. 4:128–139.
21. Jørgensen, B. B. 1977. Bacterial sulfate reduction within reduced mi-croniches of oxidized marine sediments. Mar. Biol. 41:7–17.
22. Jørgensen, B. B. 1989. Biogeochemistry of chemoautotrophic bacteria, p.117–146. In H. G. Schlegel and B. Bowien (ed.), Autotrophic bacteria.Science Tech Publishers and Springer Verlag, Madison, Wis.
23. Jørgensen, B. B., and F. Bak. 1991. Pathways and microbiology of thiosulfatetransformations and sulfate reduction in a marine sediment (Kattegat, Den-mark). Appl. Environ. Microbiol. 57:847–856.
24. Jukes, T. H., and R. R. Cantor. 1969. Evolution of protein molecules, p.21–132. In H. N. Munro (ed.), Mammalian protein metabolism. AcademicPress, New York.
25. Kane, M. D., L. K. Poulsen, and D. A. Stahl. 1993. Monitoring the enrich-ment and isolation of sulfate-reducing bacteria by using oligonucleotidehybridization probes designed from environmentally derived 16S rRNA se-quences. Appl. Environ. Microbiol. 59:682–686.
26. Kawasaki, E. S. 1990. Amplification of RNA, p. 21–27. InM. A. Innis, D. H.Gelfand, J. J. Sninsky, and T. J. White (ed.), PCR protocols: a guide tomethods and applications. Academic Press, San Diego.
27. Kogure, K., U. Simidu, and N. Taga. 1979. A tentative direct microscopicmethod for counting living marine bacteria. Can. J. Microbiol. 25:415–420.
28. Kogure, K., U. Simidu, and N. Taga. 1980. Distribution of viable marinebacteria in neritic seawater around Japan. Can. J. Microbiol. 26:318–323.
28a.Krekeler, D., et al. Unpublished data.29. Lee, S., and P. F. Kemp. 1994. Single-cell RNA content of natural marine
planktonic bacteria measured by hybridization with multiple 16S rRNA-targeted fluorescent probes. Limnol. Oceanogr. 39:869–879.
30. Lovley, D. R., and E. J. P. Philipps. 1994. Novel processes for anaerobicsulfate production from elemental sulfur by sulfate-reducing bacteria. Appl.Environ. Microbiol. 60:2394–2399.
31. Maidak, B. L., N. Larsen, M. J. McCaughey, R. Overbeek, G. J. Olsen, K.Fogel, J. Blandy, and C. R. Woese. 1994. The ribosomal database project.Nucleic Acids Res. 22:3485–3487.
32. Marschall, C., P. Frenzel, and H. Cypionka. 1993. Influence of oxygen onsulfate reduction and growth of sulfate-reducing bacteria. Arch. Microbiol.159:168–173.
33. Miljøkontorne i Århus og Nordjyllands Amtskommuner. 1990. MariagerFjord 1985–1989. Udvikling og status. Forvaltningerne for Teknik og Miljø,Århus, Denmark.
33a.Muyzer, G., et al. Unpublished data.34. Muyzer, G., and E. C. de Waal. 1994. Determination of the genetic diversity
of microbial communities using DGGE analysis of PCR-amplified 16SrDNA, p. 207–214. In L. J. Stal and P. Caumette (ed.), Microbial mats—structure, development and environmental significance. NATO ASI SeriesG35. Springer Verlag, Berlin.
35. Muyzer, G., E. C. de Waal, and A. G. Uitterlinden. 1993. Profiling of complexmicrobial populations by denaturing gradient gel electrophoresis analysis of
1414 TESKE ET AL. APPL. ENVIRON. MICROBIOL.
on Novem
ber 5, 2019 at MA
X-P
LAN
CK
-INS
TIT
UT
FU
Rhttp://aem
.asm.org/
Dow
nloaded from

polymerase chain reaction-amplified genes coding for 16S rRNA. Appl.Environ. Microbiol. 59:695–700.
36. Muyzer, G., S. Hottentrager, A. Teske, and C. Wawer. 1995. Denaturinggradient gel electrophoresis of PCR-amplified 16S rDNA—a new molecularapproach to analyse the genetic diversity of mixed microbial communities, p.3.4.4.1–3.4.4.22. In A. D. L. Akkermans, J. D. van Elsas, and F. J. de Bruijn(ed.), Molecular microbial ecology manual, 2nd ed. Kluwer, Dordrecht, TheNetherlands.
37. Muyzer, G., A. Teske, C. O. Wirsen, and H. W. Jannasch. 1995. Phylogenticrelationships of Thiomicrospira species and their identification in deep-seahydrothermal vent samples by denaturing gradient gel electrophoresis of 16SrDNA fragments. Arch. Microbiol. 164:165–174.
38. Myers, R. M., T. Maniatis, and L. S. Lerman. 1987. Detection and localiza-tion of single base changes by denaturing gradient gel electrophoresis. Meth-ods Enzymol. 155:501–527.
39. Oelmuller, U., N. Kruger, A. Steinbuchel, and C. G. Friedrich. 1990. Isola-tion of prokaryotic RNA and detection of specific mRNA with biotinylatedprobes. J. Microbiol. Methods 11:73–84.
40. Oliver, J. D. 1993. Formation of viable but non-culturable cells, p. 239–272.In S. Kjelleberg (ed.), Starvation in bacteria. Plenum Press, New York.
41. Poulsen, L. K., G. Ballard, and D. A. Stahl. 1993. Use of rRNA fluorescencein situ hybridization for measuring the activity of single cells in young andestablished biofilms. Appl. Environ. Microbiol. 59:1354–1360.
42. Ramsing, N. B., H. Fossing, T. G. Ferdelman, F. Andersen, and B. Tham-drup. 1996. Distribution of bacterial populations in a stratified fjord (Mar-iager Fjord, Denmark) quantified by in situ hybridization and related tochemical gradients in the water column. Appl. Environ. Microbiol. 62:1391–1404.
43. Risatti, J. B., W. C. Capman, and D. A. Stahl. 1994. Community structure ofa microbial mat: the phylogenetic dimension. Proc. Natl. Acad. Sci. USA91:10173–10177.
44. Roden, E. E., and D. E. Lovley. 1993. Dissimilatory Fe(III) reduction by themarine microorganism Desulfuromonas acetoxidans. Appl. Environ. Micro-biol. 59:734–742.
45. Rosset, R., J. Julien, and R. Monier. 1966. Ribonucleic acid composition ofbacteria as a function of growth rate. J. Mol. Biol. 18:308–320.
46. Sambrook, J., E. F. Fritsch, and T. Maniatis. 1989. Molecular cloning: alaboratory manual, 2nd ed. Cold Spring Harbor Laboratory Press, ColdSpring Harbor, N.Y.
47. Seitz, H.-J., and H. Cypionka. 1986. Chemolithotropic growth of Desulfo-vibrio desulfuricans with hydrogen coupled to ammonification of nitrate andnitrite. Arch. Microbiol. 146:63–67.
48. Sieburth, J. M. 1993. C1 bacteria in the water column of Chesapeake Bay,USA. I. Distribution of sub-populations of O2-tolerant, obligately anaerobic,methylotrophic methanogens that occur in microniches reduced by theirbacterial consorts. Mar. Ecol. Prog. Ser. 95:67–80.
49. Staley, J. T., and A. Konopka. 1985. Measurement of in situ activities ofnon-photosynthetic microorganisms in aquatic and terrestrial habitats.Annu. Rev. Microbiol. 39:321–346.
50. Teske, A., E. Alm, J. M. Regan, S. Toze, B. E. Rittmann, and D. A. Stahl.1994. Evolutionary relationships among ammonia- and nitrite-oxidizing bac-teria. J. Bacteriol. 176:6623–6630.
51. Thamdrup, B., K. Finster, J. W. Hansen, and F. Bak. 1993. Bacterial dis-proportionation of elemental sulfur coupled to chemical reduction of iron ormanganese. Appl. Environ. Microbiol. 59:101–108.
52. Uitterlinden, A. G., and J. Vijg. 1989. Two-dimensional DNA typing. TrendsBiotechnol. 7:336–341.
53. Wagner, M., R. Amann, H. Lemmer, and K.-H. Schleifer. 1993. Probingactivated sludge with oligonucleotides specific for proteobacteria: inade-quacy of culture-dependent methods for describing microbial communitystructure. Appl. Environ. Microbiol. 59:1520–1525.
53a.Wawer, C., and G. Muyzer. Unpublished results.54. Weller, R., J. W. Weller, and D. M. Ward. 1991. 16S rRNA sequences of
uncultivated hot spring cyanobacterial mat inhabitants retrieved as randomlyprimed cDNA. Appl. Environ. Microbiol. 57:1146–1151.
55. Widdel, F., and F. Bak. 1991. Gram-negative mesophilic sulfate-reducingbacteria, p. 3352–3378. In A. Balows, H. G. Truper, M. Dworkin, W. Harder,and K.-H. Schleifer (ed.), The prokaryotes, 2nd ed. Springer Verlag, NewYork.
56. Widdel, F., and N. Pfennig. 1981. Studies on dissimilatory sulfate-reducingbacteria that decompose fatty acids. I. Isolation of new sulfate-reducingbacteria enriched with acetate from saline environments. Description ofDesulfobacter postgatei gen. nov., sp. nov. Arch. Microbiol. 131:360–365.
57. Widdel, F., and N. Pfennig. 1984. Dissimilatory sulfate- or sulfur-reducingbacteria, p. 663–679. In N. R. Krieg and J. G. Holt (ed.), Bergey’s manual ofsystematic bacteriology, vol. 1. Williams and Wilkins, Baltimore.
58. Woese, C. R. 1987. Bacterial evolution. Microbiol. Rev. 51:223–271.
VOL. 62, 1996 DISTRIBUTION OF SULFATE-REDUCING BACTERIA IN A FJORD 1415
on Novem
ber 5, 2019 at MA
X-P
LAN
CK
-INS
TIT
UT
FU
Rhttp://aem
.asm.org/
Dow
nloaded from