Water level dynamics of Amazon wetlands at the watershed scale by satellite altimetry
33
This article was downloaded by: [Joecila Santos da Silva] On: 24 November 2011, At: 05:23 Publisher: Taylor & Francis Informa Ltd Registered in England and Wales Registered Number: 1072954 Registered office: Mortimer House, 37-41 Mortimer Street, London W1T 3JH, UK International Journal of Remote Sensing Publication details, including instructions for authors and subscription information: http://www.tandfonline.com/loi/tres20 Water level dynamics of Amazon wetlands at the watershed scale by satellite altimetry Joecila Santos Da Silva a b , Frédérique Seyler c , Stéphane Calmant b d , Otto Corrêa Rotunno Filho a , Emmanuel Roux e , Afonso Augusto Magalhães Araújo f & Jean Loup Guyot g h a Universidade Federal do Rio de Janeiro, UFRJ (COPPE-PEC), CP 68506, CEP 21945-970, Rio de Janeiro, Brazil b Université Toulouse, UPS (OMP-PCA), LEGOS, 14 Av, Edouard Belin, F-31400, Toulouse, France c IRD, S140 Unité ESPACE Montpellier, 500 Rue JF Breton, F-34093, Montpellier, France d IRD, LEGOS, F-31400, Toulouse, France e IRD, S140 Unité ESPACE Guyane, Route de Montabo, BP 16597323, Cayenne, Guyane, France f Universidade Federal do Paraná, UFPR (LEMMA), CP 19100, CEP 81531-990, Curitiba, Brazil g Université Toulouse, UPS (OMP-SVT), LMTG, 14 Av, Edouard Belin, F-31400, Toulouse, France h IRD, LMTG, F-31400, Toulouse, France Available online: 24 Nov 2011 To cite this article: Joecila Santos Da Silva, Frédérique Seyler, Stéphane Calmant, Otto Corrêa Rotunno Filho, Emmanuel Roux, Afonso Augusto Magalhães Araújo & Jean Loup Guyot (2012): Water level dynamics of Amazon wetlands at the watershed scale by satellite altimetry, International Journal of Remote Sensing, 33:11, 3323-3353 To link to this article: http://dx.doi.org/10.1080/01431161.2010.531914 PLEASE SCROLL DOWN FOR ARTICLE
-
Upload
independent -
Category
Documents
-
view
0 -
download
0
Transcript of Water level dynamics of Amazon wetlands at the watershed scale by satellite altimetry

This article was downloaded by: [Joecila Santos da Silva]On: 24 November 2011, At: 05:23Publisher: Taylor & FrancisInforma Ltd Registered in England and Wales Registered Number: 1072954 Registeredoffice: Mortimer House, 37-41 Mortimer Street, London W1T 3JH, UK
International Journal of RemoteSensingPublication details, including instructions for authors andsubscription information:http://www.tandfonline.com/loi/tres20
Water level dynamics of Amazonwetlands at the watershed scale bysatellite altimetryJoecila Santos Da Silva a b , Frédérique Seyler c , StéphaneCalmant b d , Otto Corrêa Rotunno Filho a , Emmanuel Roux e ,Afonso Augusto Magalhães Araújo f & Jean Loup Guyot g ha Universidade Federal do Rio de Janeiro, UFRJ (COPPE-PEC), CP68506, CEP 21945-970, Rio de Janeiro, Brazilb Université Toulouse, UPS (OMP-PCA), LEGOS, 14 Av, EdouardBelin, F-31400, Toulouse, Francec IRD, S140 Unité ESPACE Montpellier, 500 Rue JF Breton, F-34093,Montpellier, Franced IRD, LEGOS, F-31400, Toulouse, Francee IRD, S140 Unité ESPACE Guyane, Route de Montabo, BP16597323, Cayenne, Guyane, Francef Universidade Federal do Paraná, UFPR (LEMMA), CP 19100, CEP81531-990, Curitiba, Brazilg Université Toulouse, UPS (OMP-SVT), LMTG, 14 Av, EdouardBelin, F-31400, Toulouse, Franceh IRD, LMTG, F-31400, Toulouse, France
Available online: 24 Nov 2011
To cite this article: Joecila Santos Da Silva, Frédérique Seyler, Stéphane Calmant, Otto CorrêaRotunno Filho, Emmanuel Roux, Afonso Augusto Magalhães Araújo & Jean Loup Guyot (2012): Waterlevel dynamics of Amazon wetlands at the watershed scale by satellite altimetry, InternationalJournal of Remote Sensing, 33:11, 3323-3353
To link to this article: http://dx.doi.org/10.1080/01431161.2010.531914
PLEASE SCROLL DOWN FOR ARTICLE

Full terms and conditions of use: http://www.tandfonline.com/page/terms-and-conditions
This article may be used for research, teaching, and private study purposes. Anysubstantial or systematic reproduction, redistribution, reselling, loan, sub-licensing,systematic supply, or distribution in any form to anyone is expressly forbidden.
The publisher does not give any warranty express or implied or make any representationthat the contents will be complete or accurate or up to date. The accuracy of anyinstructions, formulae, and drug doses should be independently verified with primarysources. The publisher shall not be liable for any loss, actions, claims, proceedings,demand, or costs or damages whatsoever or howsoever caused arising directly orindirectly in connection with or arising out of the use of this material.
Dow
nloa
ded
by [
Joec
ila S
anto
s da
Silv
a] a
t 05:
23 2
4 N
ovem
ber
2011
International Journal of Remote SensingVol. 33, No. 11, 10 June 2012, 3323–3353
Water level dynamics of Amazon wetlands at the watershed scale bysatellite altimetry
JOECILA SANTOS DA SILVA∗†‡, FRÉDÉRIQUE SEYLER§, STÉPHANECALMANT‡¶, OTTO CORRÊA ROTUNNO FILHO†, EMMANUEL ROUX|,
AFONSO AUGUSTO MAGALHÃES ARAÚJO†† and JEAN LOUP GUYOT‡‡§§†Universidade Federal do Rio de Janeiro, UFRJ (COPPE-PEC), CP 68506, CEP
21945-970, Rio de Janeiro, Brazil‡Université Toulouse, UPS (OMP-PCA), LEGOS, 14 Av, Edouard Belin, F-31400
Toulouse, France§IRD, S140 Unité ESPACE Montpellier, 500 Rue JF Breton, F-34093 Montpellier,
France¶IRD, LEGOS, F-31400 Toulouse, France
|IRD, S140 Unité ESPACE Guyane, Route de Montabo, BP 16597323, Cayenne, GuyaneFrance
††Universidade Federal do Paraná, UFPR (LEMMA), CP 19100, CEP 81531-990,Curitiba, Brazil
‡‡Université Toulouse, UPS (OMP-SVT), LMTG, 14 Av, Edouard Belin, F-31400Toulouse, France
§§IRD, LMTG, F-31400 Toulouse, France
(Received 19 November 2009; in final form 25 August 2010)
In this study we used satellite altimetry to characterize the time and space vari-ations in water stored in or circulating through rivers, floodplains, wetlands andlakes in the major sub-basins of the Amazon basin. Using a specific methodologyto rigorously select original three-dimensional (3D) data from an EnvironmentalSatellite (ENVISAT) mission, water level time series were calculated at the cross-ing path of the satellite tracks with the water bodies. We took advantage of thecontinuous sampling of the water level along the satellite track segments that crossthe watershed to analyse both spatial and temporal relationships between: (i) theriver and its floodplain and (ii) different basins. This work evidences in particularthe existence of water leaking between the Negro and Solimões basins at the highwater stage. It highlights that the phenomenon of a secondary flood peak occurringin the water level series in the Solimões basin at rising water, known as repiquete,is caused by the rain equatorial regime of the northern upstream tributaries of theSolimões River, but is disconnected from the same phenomenon occurring withinthe Rio Negro basin.
1. Introduction
Hydrology mainly deals with continental water reservoirs (CWRs) but is also used tostudy elements of the atmosphere and the oceans that directly affect the movement of
*Corresponding author. Email: [email protected]
International Journal of Remote SensingISSN 0143-1161 print/ISSN 1366-5901 online © 2012 Taylor & Francis
http://www.tandf.co.uk/journalshttp://dx.doi.org/10.1080/01431161.2010.531914
Dow
nloa
ded
by [
Joec
ila S
anto
s da
Silv
a] a
t 05:
23 2
4 N
ovem
ber
2011
3324 J. Santos da Silva et al.
water in the Earth system. For the continental watersheds, time and space variationsof the water levels in rivers and wetlands are crucial hydrological observations to bemade (Calmant and Seyler 2006).
As wetlands are the result of climate and geomorphology dynamics, they play animportant role at the watershed scale (Birkett 1995). Wetlands are among the mostproductive environments of the world, providing water and primary productivity(Secretariat de la Convention de Ramsar 1998). They are cradles of biological diversity(Junk and Weber 1996, UNEP 1996, Acreman et al. 2007, Lake and Bond 2007) andcan significantly alter water quality and quantity, for example by sorting the sediments(Meade et al. 1985, Mertes et al. 1996, Dunne et al. 1998), regulating the biogeochem-ical fluxes and changing flood waves (Junk et al. 1989, Richey et al. 1989). As theycan modulate the surface energy and water balance, wetlands also influence climaticstability, with an impact on evapotranspiration processes, CO2 and methane emis-sions (Matthews 2000, Richey et al. 2002, Guerin et al. 2006, Ramillien et al. 2006,Rottenberger 2008). Although wetland systems deserve attention, few attempts havebeen made to monitor their water level dynamics, particularly in the Amazon basin,because of the difficulty of acquiring water level data. Moreover, wetlands are oftendifficult to define, as there are many different types and they cover the transitionalzone between permanently wet and occasionally dry environments.
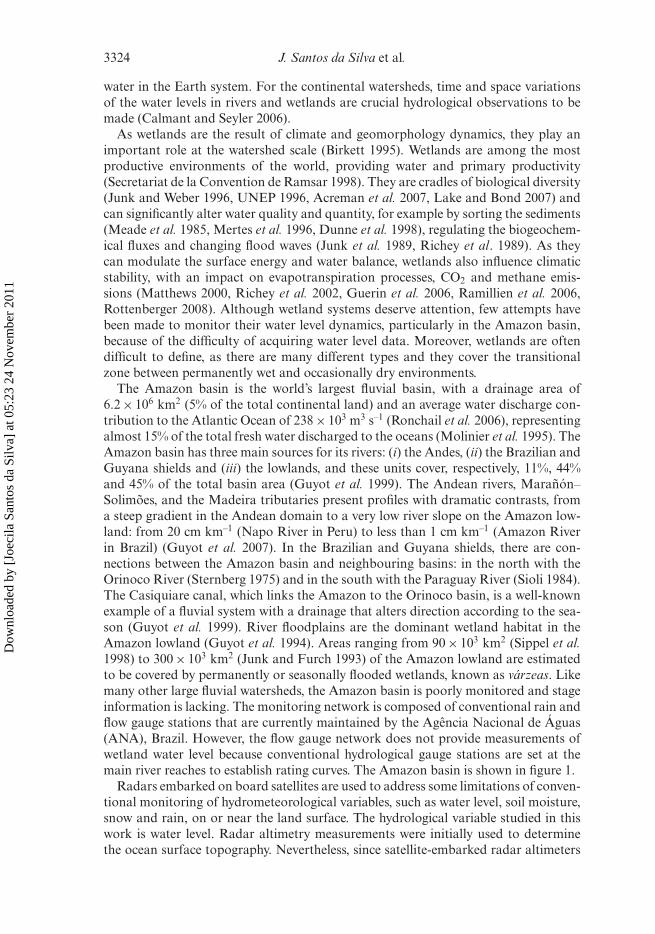
The Amazon basin is the world’s largest fluvial basin, with a drainage area of6.2 × 106 km2 (5% of the total continental land) and an average water discharge con-tribution to the Atlantic Ocean of 238 × 103 m3 s–1 (Ronchail et al. 2006), representingalmost 15% of the total fresh water discharged to the oceans (Molinier et al. 1995). TheAmazon basin has three main sources for its rivers: (i) the Andes, (ii) the Brazilian andGuyana shields and (iii) the lowlands, and these units cover, respectively, 11%, 44%and 45% of the total basin area (Guyot et al. 1999). The Andean rivers, Marañón–Solimões, and the Madeira tributaries present profiles with dramatic contrasts, froma steep gradient in the Andean domain to a very low river slope on the Amazon low-land: from 20 cm km–1 (Napo River in Peru) to less than 1 cm km–1 (Amazon Riverin Brazil) (Guyot et al. 2007). In the Brazilian and Guyana shields, there are con-nections between the Amazon basin and neighbouring basins: in the north with theOrinoco River (Sternberg 1975) and in the south with the Paraguay River (Sioli 1984).The Casiquiare canal, which links the Amazon to the Orinoco basin, is a well-knownexample of a fluvial system with a drainage that alters direction according to the sea-son (Guyot et al. 1999). River floodplains are the dominant wetland habitat in theAmazon lowland (Guyot et al. 1994). Areas ranging from 90 × 103 km2 (Sippel et al.1998) to 300 × 103 km2 (Junk and Furch 1993) of the Amazon lowland are estimatedto be covered by permanently or seasonally flooded wetlands, known as várzeas. Likemany other large fluvial watersheds, the Amazon basin is poorly monitored and stageinformation is lacking. The monitoring network is composed of conventional rain andflow gauge stations that are currently maintained by the Agência Nacional de Águas(ANA), Brazil. However, the flow gauge network does not provide measurements ofwetland water level because conventional hydrological gauge stations are set at themain river reaches to establish rating curves. The Amazon basin is shown in figure 1.
Radars embarked on board satellites are used to address some limitations of conven-tional monitoring of hydrometeorological variables, such as water level, soil moisture,snow and rain, on or near the land surface. The hydrological variable studied in thiswork is water level. Radar altimetry measurements were initially used to determinethe ocean surface topography. Nevertheless, since satellite-embarked radar altimeters
Dow
nloa
ded
by [
Joec
ila S
anto
s da
Silv
a] a
t 05:
23 2
4 N
ovem
ber
2011
Water level dynamics of Amazon wetlands using satellite altimetry 3325
GuyanaVenezuelaColombia
Ecuador
Peru
Bolivia
Brazil
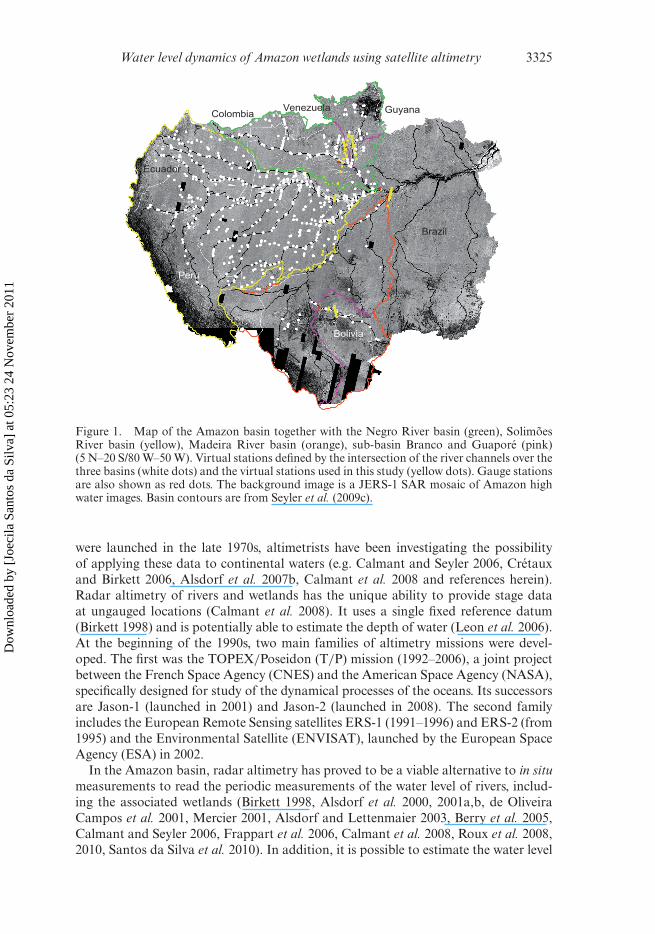
Figure 1. Map of the Amazon basin together with the Negro River basin (green), SolimõesRiver basin (yellow), Madeira River basin (orange), sub-basin Branco and Guaporé (pink)(5 N–20 S/80 W–50 W). Virtual stations defined by the intersection of the river channels over thethree basins (white dots) and the virtual stations used in this study (yellow dots). Gauge stationsare also shown as red dots. The background image is a JERS-1 SAR mosaic of Amazon highwater images. Basin contours are from Seyler et al. (2009c).
were launched in the late 1970s, altimetrists have been investigating the possibilityof applying these data to continental waters (e.g. Calmant and Seyler 2006, Crétauxand Birkett 2006, Alsdorf et al. 2007b, Calmant et al. 2008 and references herein).Radar altimetry of rivers and wetlands has the unique ability to provide stage dataat ungauged locations (Calmant et al. 2008). It uses a single fixed reference datum(Birkett 1998) and is potentially able to estimate the depth of water (Leon et al. 2006).At the beginning of the 1990s, two main families of altimetry missions were devel-oped. The first was the TOPEX/Poseidon (T/P) mission (1992–2006), a joint projectbetween the French Space Agency (CNES) and the American Space Agency (NASA),specifically designed for study of the dynamical processes of the oceans. Its successorsare Jason-1 (launched in 2001) and Jason-2 (launched in 2008). The second familyincludes the European Remote Sensing satellites ERS-1 (1991–1996) and ERS-2 (from1995) and the Environmental Satellite (ENVISAT), launched by the European SpaceAgency (ESA) in 2002.
In the Amazon basin, radar altimetry has proved to be a viable alternative to in situmeasurements to read the periodic measurements of the water level of rivers, includ-ing the associated wetlands (Birkett 1998, Alsdorf et al. 2000, 2001a,b, de OliveiraCampos et al. 2001, Mercier 2001, Alsdorf and Lettenmaier 2003, Berry et al. 2005,Calmant and Seyler 2006, Frappart et al. 2006, Calmant et al. 2008, Roux et al. 2008,2010, Santos da Silva et al. 2010). In addition, it is possible to estimate the water level
Dow
nloa
ded
by [
Joec
ila S
anto
s da
Silv
a] a
t 05:
23 2
4 N
ovem
ber
2011

3326 J. Santos da Silva et al.
slope (Cudlip et al. 1990, Birkett et al. 2002, LeFavour and Asdorf 2005) and the watervolume stored in the floodplains (Frappart et al. 2005, 2008). These studies have beenmostly conducted with the T/P mission.
ENVISAT measurements were used in this study. In the case study of the Curuaiwetland, Cauhope (2004) established relationships between river and floodplain. Leonet al. (2006) proposed a methodology to derive river bed height and slope from bothT/P and ENVISAT data, by estimating the rating curves at the altimetric crossingbetween satellite tracks and rivers. Based on a linear model exploiting ENVISAT dataat a limited number of in situ limnimetric stations along the Negro River, Roux et al.(2008) proposed a methodology to obtain daily time series. On the Curuai floodplain,Bonnet et al. (2008) modelled the transfer of water between river and floodplain, partlybased on altimetric water levels time series. More recently, Santos da Silva et al. (2011)developed studies of water level variability for some Amazon lakes, while Seyler et al.(2008, 2009a,b) studied Llanos de Mojos of the Madeira basin. These studies con-firmed that ENVISAT data sets provide valuable measurements to address water levelvariability for rivers and lakes, allowing monitoring of wetland systems, which is themain focus of this work.
This article presents an analysis of water stage measurement in rivers and wet-lands derived from ENVISAT Radar Altimeter 2 (RA-2) data for the Amazon basin(figure 1). Altimetry values from the satellite are referenced in a global geodetic frame.This provides access to the differences in level between water bodies and to the cycleof connections during high stages and disconnection at low water periods between thedifferent water bodies included in the sub-basins. We analyse the relationships betweenthe river and its floodplain, and between the river and the wetlands in its watershed,through the elevation profile along the track. It is worth noting that such a study couldnot be conducted with a conventional fluviometric network because there are no gaugesample water levels either in the floodplains or in the wetlands of this basin.
2. General description of the study area
Our study sites were all selected in the middle plains region of the Amazon basin.The drainage areas of the Negro, Solimões and Madeira river basins are 0.7 × 106,2.24 × 106 and 1.42 × 10⁶ km2, respectively, corresponding to a total of 70% of theAmazon basin area. The ENVISAT ground-track network crosscuts these basins onmain streams, small tributaries, swamps, wetlands and lakes.
2.1 The Negro River basin
With a mean annual discharge of 29 × 103 m3 s–1, the Negro River is the second largestdischarge tributary of the Amazon after the Madeira River (Molinier et al. 1997). Ithas a drainage area of around 0.7 × 10⁶ km2; rainfall varies from 3500 mm year–1 in theupper basin to 2137 mm year–1 in the lower basin (Villar et al. 2009). This river springsout in Colombia, flows into Venezuela and ends in Brazil, where it crosses the RoraimaLavrado savannas plains and lowland open ombrophilous forests (IBGE 2004). In themiddle reach, the Negro River receives some large tributaries. The largest one is theBranco River running east from the Guyana shield. The floodplains along the banks ofthe Negro River are fairly small because the river is reduced into a channel formed byfaulting (Franzinelli and Igreja 2002). The river transports little suspended sediment,less than 7 × 10⁶ t year–1 (Filizola and Guyot 2009). Frappart et al. (2008) determinedthe seasonal and interannual variations of the total inundated area in the Negro River
Dow
nloa
ded
by [
Joec
ila S
anto
s da
Silv
a] a
t 05:
23 2
4 N
ovem
ber
2011
Water level dynamics of Amazon wetlands using satellite altimetry 3327
basin for the period 1993–2000. The maximum level is observed from May to Julyand the minimum level from November to February, with a maximum inundated areavarying from 57 × 103 km2 (June 1996) to 42 × 103 km2 (June 1997) and a minimuminundated area varying from 28 × 103 km (January 1997) to 15.7 × 10³ km2 (December1997). The Rio Negro basin is shown in figure 1.
The first study site is the Branco River floodplain. The Branco River drains thehillslopes of Roraima State (Brazil) and the Brazil–Guyana border. In the middlecourse, the river crosses a huge low-gradient plain, called the ‘Northern Pantanal’.This wetland is bounded by cliffs that reach a height of 20 m and is surrounded byterra firme, that is, high land that is not inundated during floods (Franzinelli andIgreja 2002). Formed by banks of sediment up to 7 m high, the Rio Branco deltapenetrates like a progressive landform into the Negro valley and dams it; at thislocation, the Negro River bed narrows to a width of merely 2 km (Latrubesse andFranzinelli 2005).
The second site encompasses the Middle Negro River. The lack of alluvial wetlandshas been attributed to deep erosional valleys in the older depositional surfaces of thispart of the river, following a general northwest–southeast direction (Costa et al. 1978).A very large channel with numerous bars forms the Mariuá archipelago, bounded onthe left side by a huge asymmetrical cliff (Latrubesse and Franzinelli 2005).
2.2 The Madeira River basin
The Madeira River basin extends through Bolivia, Peru and Brazil. Although thedrainage area of the Madeira river corresponds to 23% of the total area of the Amazonbasin, its contribution in terms of total discharge is 31.2 × 10³ m3 s–1, that is, about15% of the Amazon mean discharge (Molinier et al. 1997). The basin rainfall rangesbetween 2000 and 2200 mm year–1 (Villar et al. 2009). The Madeira River bringsaround 50% of the total suspended sediment (2.8 × 10⁸ t year–1) transported by theAmazon (Filizola and Guyot 2009). The Madeira is characterized by three morpho-logical units, in the following proportions: the Andes (25%), the Brazilian shield (27%)and the Amazon lowland (48%) (Maurice-Bourgoin et al. 2000). Because of thesecharacteristics, high altitudes are encountered in the upstream part of the Madeirabasin, waterfalls in the Brazilian shield, and large floodplains in the lower course. TheMamoré River and its tributary the Guaporé River join the Beni River to form theMadeira. Mamoré flows mostly northwards into the Bolivian territory through exten-sive inundation plains, the Llanos de Mojos, made up of a thousand lakes of all shapesand sizes. The Madeira River basin is shown in figure 1.
The first study site is the Guaporé River. It springs out in the highlands of theParecis plateau, in the State of Mato Grosso, Brazil. From Pontes and Lacerda city, itforms the Bolivia–Brazil border, and runs along the outcrops of the Guaporé shield onits right bank. The river meanders in an alluvial plain bordered with swamps, savannas,inundated forest and surrounded by terra firme forest. This large floodplain varies insize according to the alternating dry and rainy tropical seasons (Ronchail et al. 2005).It can dry up during the austral winter and extend up to 150 × 103 km2 at the end ofthe rainy season (Roche and Fernandez 1988).
The second site is the floodplain of the Amazon basin at the mouth of the MadeiraRiver basin. These seasonally flooded habitats include floating meadows, sandbarscrub, river-edge forest and high flooded forest. During the flooding season, waters
Dow
nloa
ded
by [
Joec
ila S
anto
s da
Silv
a] a
t 05:
23 2
4 N
ovem
ber
2011

3328 J. Santos da Silva et al.
of main stems drain into these regions, where they remain for several months, mod-ifying the flood peak of the rivers. In the dry season, the water stored in the floodedplains is released back to the main channel.
3. Data
3.1 Conventional gauge data
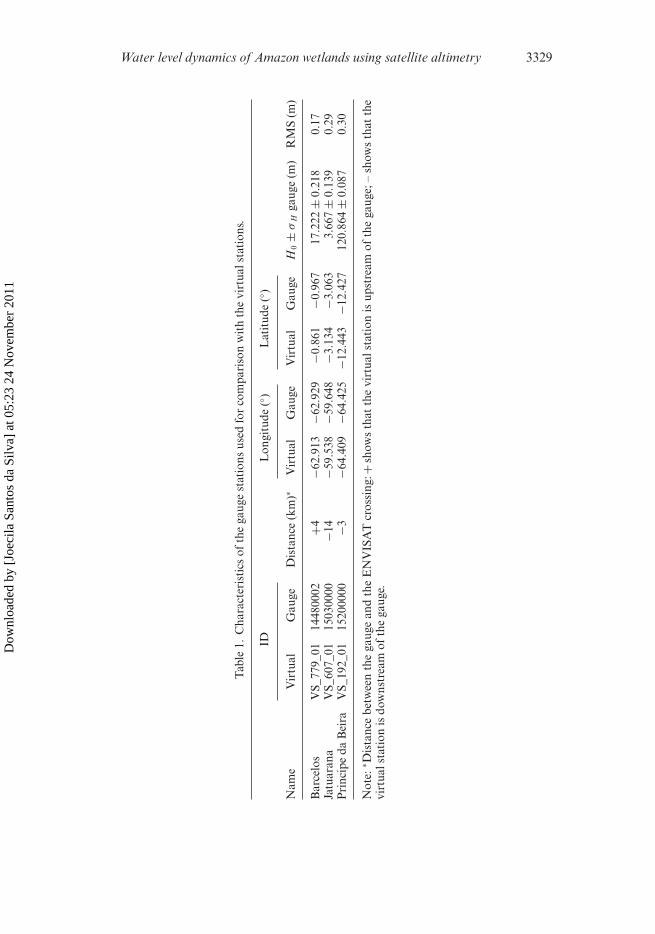
We used the time series from all the in situ gauges located along the studied river.Measurements have been available since 2002, matching altimetric ENVISAT datarecords. Information reported in table 1 comes from the HidroWeb site (ANA 2008).ANA is the Brazilian entity responsible for the implementation of the national waterresources management system and its regulation.
3.2 Satellite radar altimetry
Radar altimeters installed onboard various satellite missions emit a pulse towards thenadir and receive the echo reflected by the water surface level. The half time span forthe pulse to be reflected back to the altimeter corresponds to the distance ρ run bythe electromagnetic pulse between the satellite and the Earth’s surface, assuming thatthe pulse is propagating at the speed of light. The satellite altitude as with respect toa reference ellipsoid is known accurately by orbitography modelling. Therefore, theheight H of the reflector with respect to the geodetic reference is given at each pass ofthe satellite. Corrections relating to the delayed propagation through the atmosphere,the interaction with the ionosphere, and the solid Earth tides are taken into account:
H = as − ρ + Ciono + Cdry + Cwst + Cst + Cpt, (1)
where Ciono is the correction for delayed propagation through the ionosphere, Cdry andCwet are corrections for delayed propagation in the atmosphere, accounting respec-tively for pressure and humidity variations, and Cst and Cpt are the corrections forcrustal vertical motions, respectively, due to the solid and polar tides. Errors in allthese corrections were not evaluated in this study. A full discussion of the derivationof altimetric heights and their associated errors can be found in Fu and Cazenave(2001).
In the framework of the Earth Observation Programme, ESA launched ENVISATin March 2002. So far, ENVISAT has been the largest satellite built for Earth observa-tion. Data collected by ENVISAT are dedicated to Earth environmental and climatechange analyses. ENVISAT contains 10 instruments that provide an accurate analy-sis of atmosphere, continents, oceans and ice of the planet (Wehr and Attema 2001),including the nadir radar altimeter RA-2. ENVISAT follows a helio-synchronous cir-cular orbit with an inclination of 98.5◦ and a 35-day repeat period. It covers the Earthwithin latitudes of ±81.4◦, with an inter-track distance of approximately 80 km at theEquator. RA-2 is a high precision radar altimeter pointing towards the nadir and oper-ating at two frequencies (Zelli 1999): 13.575 GHz (2.3 cm wavelength, Ku band) and3.2 GHz (3.4 cm wavelength, S band). This dual-frequency system enables estimationof the ionospheric delay. The width of the ground footprint is approximately 3–4 km.
The ENVISAT altimetric data used in this study come from the Centre deTopographie des Océans et de l’Hydrosphère (CTOH 2008), which is a French
Dow
nloa
ded
by [
Joec
ila S
anto
s da
Silv
a] a
t 05:
23 2
4 N
ovem
ber
2011
Water level dynamics of Amazon wetlands using satellite altimetry 3329
Tab
le1.
Cha
ract
eris
tics
ofth
ega
uge
stat
ions
used
for
com
pari
son
wit
hth
evi
rtua
lsta
tion
s.
IDL
ongi
tude
(◦ )L
atit
ude
(◦ )
Nam
eV
irtu
alG
auge
Dis
tanc
e(k
m)∗
Vir
tual
Gau
geV
irtu
alG
auge
H0±
σH
gaug
e(m
)R
MS
(m)
Bar
celo
sV
S_77
9_01
1448
0002
+4−6
2.91
3−6
2.92
9−0
.861
−0.9
6717
.222
±0.
218
0.17
Jatu
aran
aV
S_60
7_01
1503
0000
−14
−59.
538
−59.
648
−3.1
34−3
.063
3.66
7±
0.13
90.
29P
rinc
ipe
daB
eira
VS_
192_
0115
2000
00−3
−64.
409
−64.
425
−12.
443
−12.
427
120.
864
±0.
087
0.30
Not
e:∗ D
ista
nce
betw
een
the
gaug
ean
dth
eE
NV
ISA
Tcr
ossi
ng:+
show
sth
atth
evi
rtua
lsta
tion
isup
stre
amof
the
gaug
e;–
show
sth
atth
evi
rtua
lsta
tion
isdo
wns
trea
mof
the
gaug
e.
Dow
nloa
ded
by [
Joec
ila S
anto
s da
Silv
a] a
t 05:
23 2
4 N
ovem
ber
2011

3330 J. Santos da Silva et al.
observation service in charge of maintaining a homogeneous and reliable altimet-ric database for the long-term global monitoring of oceans, lakes, rivers and ice.CTOH distributes the geophysical data records (GDRs) provided by the space agen-cies (namely ESA in the case of the ENVISAT satellite), with additional parameters.As far as ENVISAT radar altimetry data are concerned, the additional parametersare atmospheric and ionospheric corrections that are unavailable in the GDRs overcontinents.
The distance between the satellite and the water surface measured by the radar iscalled the range. Four ranges are routinely computed for the RA-2 Ku-band pulses.They come out of four different algorithms used to process the radar echo returned tothe satellite antenna. These algorithms are called retracking algorithms and those ofENVISAT are referred to as the Ocean Retracker, developed by Brown (1977), Ice-1,developed by Wingham et al. (1986) and applied by Bamber (1994), Ice-2, developedby Legrésy and Rémy (1997), and Sea Ice, developed by Laxon (1994). Different algo-rithms are used to best fit the highly variable time distribution of the echo energybounced back by the very different types of surfaces on the Earth. Frappart et al.(2006) compared the performances of these algorithms in delivering reliable water lev-els for land hydrology. They concluded that the Ice-1 algorithm, primarily designed forice sheets, provided the most robust estimated water stages for a sample set extractedon rivers and lakes (various locations within the Amazon basin). According to arecent study (Santos da Silva et al. 2010), when outliers are carefully eliminated fromthe dataset used to compute water level time series, Ice-1 and Ice-2 algorithms per-form similarly. Therefore, we used the range values provided by the Ice-1 retrackingalgorithm.
3.3 Virtual stations and time series
A virtual station (VS) consists of the intersection of a satellite ground track with awater body, making it possible to derive time series of the water stage variations fromthe radar measurements at each pass. However, not all of the radar measurementsreturned by a surface assumed to be inundated are necessarily valid measurements.Several factors can affect the measurements, in particular non-water reflectors, suchas banks, islets and vegetation, can bounce significant energy together with the watersurface and thus may affect the range computation; the water surface at the rim of thefootprint can also dominate the energy received by the satellite instead of the nadirpoint. Frappart et al. (2006) and Santos da Silva et al. (2010) showed that such aneffect of slant measurement could be dealt with by adjusting the level data with aparabola, of which the summit is retained as equivalent to a nadir measurement. Sucha correction was applied to the ENVISAT data when necessary.
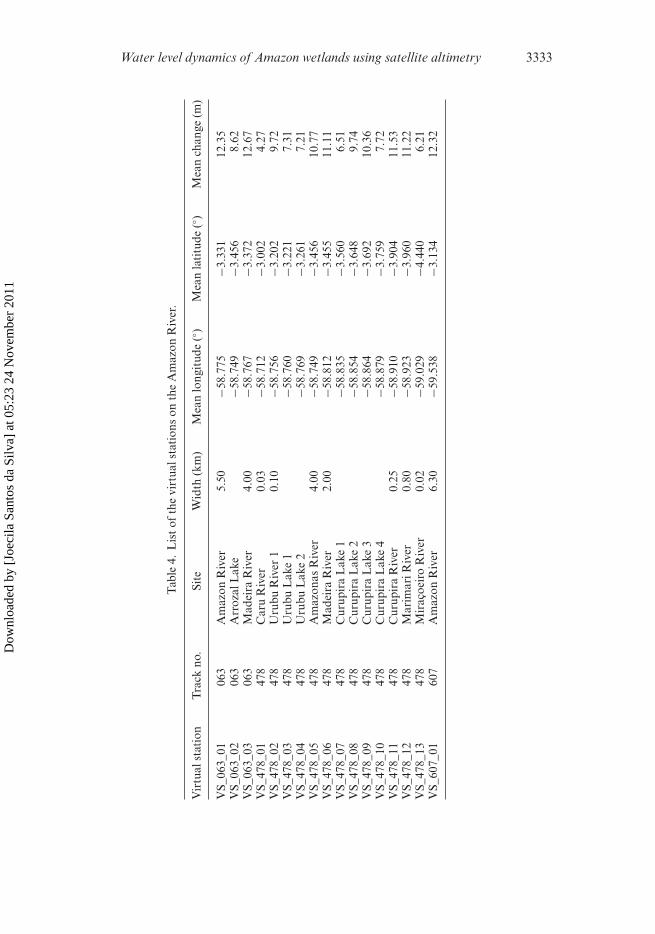
To overcome these problems in the selection of the data to be included in the esti-mate of the water height, Virtual Altimetry Station (VALS 2010) software was applied.VALS is a Java-based toolbox that was developed to interactively select altimetry dataat the virtual stations and apply the corrections individually to satellite passes or partsof passes (Santos da Silva et al. 2010). The data processing is performed in three mainsteps. The first step consists of a rough selection guided by imagery, currently GoogleEarth. The second step consists of refining the selection in a cross-sectional view. Thethird step consists of the computation of master points per pass. The median andmean values are computed for each pass using the data subset selected in the secondstep. The 71 VSs studied are listed in tables 2 to 5, and their locations are shownin figure 1.
Dow
nloa
ded
by [
Joec
ila S
anto
s da
Silv
a] a
t 05:
23 2
4 N
ovem
ber
2011

Water level dynamics of Amazon wetlands using satellite altimetry 3331
Tab
le2.
Lis
tof
the
virt
uals
tati
ons
onth
eG
uapo
réR
iver
.
Vir
tual
stat
ion
Tra
ckno
.Si
teW
idth
(km
)M
ean
long
itud
e(◦ )
Mea
nla
titu
de(◦ )
Mea
nch
ange
(m)
VS_
106_
0110
6G
uapo
réR
iver
0.32
−64.
409
−12.
443
4.37
VS_
106_
0210
6G
uapo
réL
ake
4−6
3.09
0−1
2.96
02.
62V
S_10
6_03
106
Gua
poré
Lak
e5
−63.
117
−13.
078
2.87
VS_
192_
0119
2G
uapo
réR
iver
0.62
−64.
409
−12.
443
8.57
VS_
650_
0165
0G
uapo
réR
iver
0.35
−63.
691
−12.
446
5.18
VS_
650_
0265
0G
uapo
réF
lood
plai
n20
.00
−63.
722
−12.
582
4.91
VS_
951_
0195
1G
uapo
réL
ake
1−6
3.24
5−1
2.29
73.
41V
S_95
1_02
951
Gua
poré
Lak
e2
−63.
202
−12.
483
2.05
VS_
951_
0395
1G
uapo
réL
ake
3−6
3.14
2−1
2.74
84.
07V
S_95
1_04
951
Gua
poré
Lak
e4
−63.
092
−12.
969
2.80
VS_
951_
0595
1G
uapo
réL
ake
6−6
3.05
1−1
3.14
71.
70V
S_95
1_06
951
Gua
poré
Riv
er0.
15−6
3.16
9−1
2.63
05.
35V
S_95
1_07
951
Gua
poré
Tri
buta
ry0.
06−6
3.11
8−1
2.85
33.
62
Dow
nloa
ded
by [
Joec
ila S
anto
s da
Silv
a] a
t 05:
23 2
4 N
ovem
ber
2011

3332 J. Santos da Silva et al.
Tab
le3.
Lis
tof
the
virt
uals
tati
ons
onth
eB
ranc
oR
iver
.
Vir
tual
stat
ion
Tra
ckno
.Si
teW
idth
(m)
Mea
nlo
ngit
ude
(◦ )M
ean
lati
tude
(◦ )M
ean
chan
ge(m
)
VS_
192_
0219
2It
apar
áR
iver
0.08
−61.
663
−0.0
857.
87V
S_69
3_01
693
Cap
ivar
aR
iver
0.05
−61.
903
1.08
75.
96V
S_69
3_02
693
Mor
roda
água
pret
aSw
amp
−61.
877
0.96
61.
68V
S_69
3_03
693
Mor
roda
água
pret
aSw
amp
−61.
841
0.80
51.
16V
S_69
3_04
693
Cat
rim
aniR
ivie
r0.
13−6
1.77
80.
515
6.92
VS_
693_
0569
3B
ranc
oR
iver
1.00
−61.
742
0.35
48.
44V
S_69
3_06
693
Igar
apé
dola
gogr
ande
0.05
−61.
718
0.24
54.
99V
S_69
3_07
693
Itap
ará
Riv
er0.
08−6
1.64
8−0
.075
7.91
VS_
693_
0869
3It
apar
áIg
arap
é0.
05−6
1.57
3−0
.417
3.59
VS_
693_
0969
3Ja
uape
riR
iver
0.48
−61.
504
−0.7
287.
92
Dow
nloa
ded
by [
Joec
ila S
anto
s da
Silv
a] a
t 05:
23 2
4 N
ovem
ber
2011
Water level dynamics of Amazon wetlands using satellite altimetry 3333
Tab
le4.
Lis
tof
the
virt
uals
tati
ons
onth
eA
maz
onR
iver
.
Vir
tual
stat
ion
Tra
ckno
.Si
teW
idth
(km
)M
ean
long
itud
e(◦ )
Mea
nla
titu
de(◦ )
Mea
nch
ange
(m)
VS_
063_
0106
3A
maz
onR
iver
5.50
−58.
775
−3.3
3112
.35
VS_
063_
0206
3A
rroz
alL
ake
−58.
749
−3.4
568.
62V
S_06
3_03
063
Mad
eira
Riv
er4.
00−5
8.76
7−3
.372
12.6
7V
S_47
8_01
478
Car
uR
iver
0.03
−58.
712
−3.0
024.
27V
S_47
8_02
478
Uru
buR
iver
10.
10−5
8.75
6−3
.202
9.72
VS_
478_
0347
8U
rubu
Lak
e1
−58.
760
−3.2
217.
31V
S_47
8_04
478
Uru
buL
ake
2−5
8.76
9−3
.261
7.21
VS_
478_
0547
8A
maz
onas
Riv
er4.
00−5
8.74
9−3
.456
10.7
7V
S_47
8_06
478
Mad
eira
Riv
er2.
00−5
8.81
2−3
.455
11.1
1V
S_47
8_07
478
Cur
upir
aL
ake
1−5
8.83
5−3
.560
6.51
VS_
478_
0847
8C
urup
ira
Lak
e2
−58.
854
−3.6
489.
74V
S_47
8_09
478
Cur
upir
aL
ake
3−5
8.86
4−3
.692
10.3
6V
S_47
8_10
478
Cur
upir
aL
ake
4−5
8.87
9−3
.759
7.72
VS_
478_
1147
8C
urup
ira
Riv
er0.
25−5
8.91
0−3
.904
11.5
3V
S_47
8_12
478
Mar
imar
iRiv
er0.
80−5
8.92
3−3
.960
11.2
2V
S_47
8_13
478
Mir
açoe
iro
Riv
er0.
02−5
9.02
9−4
.440
6.21
VS_
607_
0160
7A
maz
onR
iver
6.30
−59.
538
−3.1
3412
.32
Dow
nloa
ded
by [
Joec
ila S
anto
s da
Silv
a] a
t 05:
23 2
4 N
ovem
ber
2011

3334 J. Santos da Silva et al.
Tab
le5.
Lis
tof
the
virt
uals
tati
ons
onth
eN
egro
Riv
er.
Vir
tual
stat
ion
Tra
ckno
.Si
teW
idth
(m)
Mea
nlo
ngit
ude
(◦ )M
ean
lati
tude
(◦ )M
ean
chan
ge(m
)
VS_
235_
0123
5C
aapi
rang
aSw
amp
−62.
520
0.62
30.
70V
S_23
5_02
235
Caa
pira
nga
Swam
p−6
2.47
10.
401
0.98
VS_
235_
0323
5Ju
tari
Riv
ier
0.15
−62.
398
0.06
92.
23V
S_23
5_04
235
Caa
pira
nga
Swam
p−6
2.51
40.
595
0.91
VS_
235_
0523
5C
aapi
rang
aSw
amp
−62.
508
0.57
00.
88V
S_23
5_06
235
Caa
pira
nga
Swam
p−6
2.46
50.
375
0.72
VS_
235_
0723
5C
aapi
rang
aSw
amp
−62.
452
0.31
40.
84V
S_23
5_08
235
Caa
pira
nga
Swam
p−6
2.44
10.
266
0.68
VS_
235_
0923
5P
irar
ara
Riv
er0.
03−6
2.37
7−0
.027
2.02
VS_
235_
1023
5Ju
tari
Riv
ier
0.04
−62.
279
−0.4
735.
91V
S_73
6_01
736
Águ
abr
anca
Igar
apé
0.03
−62.
115
1.13
03.
15V
S_73
6_02
736
Cat
rim
aniR
ivie
r0.
10−6
2.13
51.
039
5.99
VS_
736_
0373
6N
ovo
Swam
p−6
2.20
20.
735
0.80
VS_
736_
0473
6B
ranq
uinh
oR
iver
0.03
−62.
275
0.40
24.
84V
S_73
6_05
736
Juta
riR
ivie
r0.
17−6
2.35
50.
041
2.07
VS_
736_
0673
6P
irar
ara
Riv
er0.
40−6
2.36
9−0
.027
2.39
VS_
736_
0773
6P
reto
Riv
er0.
03−6
2.42
3−0
.271
4.75
VS_
736_
0873
6Ju
tari
Riv
ier
0.09
−62.
521
−0.7
165.
40V
S_73
6_09
736
Neg
roR
iver
15.0
0−6
2.59
2−1
.041
8.53
VS_
736_
1073
6C
auré
sR
iver
0.07
−62.
653
−1.3
167.
85V
S_73
6_11
736
Uni
niR
iver
0.15
−62.
743
−1.7
286.
57V
S_73
6_12
736
Jaú
Riv
er0.
04−6
2.94
9−2
.663
5.49
VS_
736_
1373
6P
iori
niL
ake
5.00
−63.
160
−3.6
2111
.99
VS_
736_
1473
6So
limõe
sR
iver
4.00
−63.
227
−3.9
2412
.03
VS_
736_
1573
6C
oari
Lak
e5.
70−6
3.25
1−4
.033
13.7
3V
S_73
6_16
736
Pur
usR
iver
0.74
− 63.
619
−5.7
0015
.70
VS_
736_
1773
6M
ucui
mR
iver
0.04
−64.
131
−8.0
078.
59V
S_73
6_18
736
Muc
uim
Riv
er0.
02−6
4.18
9−8
.268
5.58
VS_
736_
1973
6M
adei
raR
iver
2.20
−64.
396
−9.1
9611
.93
VS_
779_
0177
9N
egro
Riv
er14
.55
−62.
912
−0.8
617.
25V
S_77
9_02
779
Uni
niR
iver
0.16
−62.
719
−1.7
416.
24
Dow
nloa
ded
by [
Joec
ila S
anto
s da
Silv
a] a
t 05:
23 2
4 N
ovem
ber
2011

Water level dynamics of Amazon wetlands using satellite altimetry 3335
In this study, we retained the median and associated mean absolute deviation toconstruct the time series. Furthermore, we found that, given the large number of pos-sible outliers with respect to the few points selected for each pass, the median offersa more robust predictor than the mean. Frappart et al. (2006) came to a similar con-clusion. Finally, a geoid undulation was subtracted from the height value. The geoidused in this study was GGM02C-GRACE, a mean tide solution (Tapley et al. 2004).This geoid model is provided on the T/P ellipsoid. Undulations have been referencedto the GRS80 ellipsoid of WGS84 to be consistent with the ENVISAT heights.
4. Results and discussion
In this study, we took altimetry measurements to assess the stage variations. Only afew gauges are available in the study area; they are all located on rivers and only oneis in the wetlands. Thus, altimetry series are difficult to validate because of the lack ofgauges for comparisons. An in-depth analysis of ENVISAT series in the Amazon basincan be found in Santos da Silva et al. (2010). In this study, we limit the assessment ofthe quality of the stage time series by ENVISAT by presenting two case studies: first,two examples of internal validation of two ENVISAT tracks forming a crossover withshort delays between pairs of measurements; second, comparisons between altimetryseries and in situ reading series with a distance of less than 15 km between the gaugeand the track (table 1).
4.1 VS validation
The case study of two ENVISAT tracks forming a crossover with short delays con-stitutes a good opportunity to check the quality of the altimetry series, since theyprovide data complying with the criterion of independent measurements of the samewater body. Assuming that the water stage changes little between the passes of thetwo tracks, a root mean square (RMS) difference of both passes of a given cyclethroughout the series can be computed. In the Unini River case study, the crossoveris formed by tracks 736 and 779. These tracks pass over the river with a 1.5-day dif-ference (figure 2). The RMS difference between the pass pairs is 18 cm. The secondexample is a wetland, labelled Lake of Guaporé River further on in this study anddisplayed in figure 3. ENVISAT tracks 106 and 951 form a crossover over this lakewith overflies passing 5.5 days apart. The RMS difference between the pass pairs is16 cm. It is noteworthy that this represents a robust estimation of the accuracy of thealtimetry series, since it includes the daily variability of the body stage.
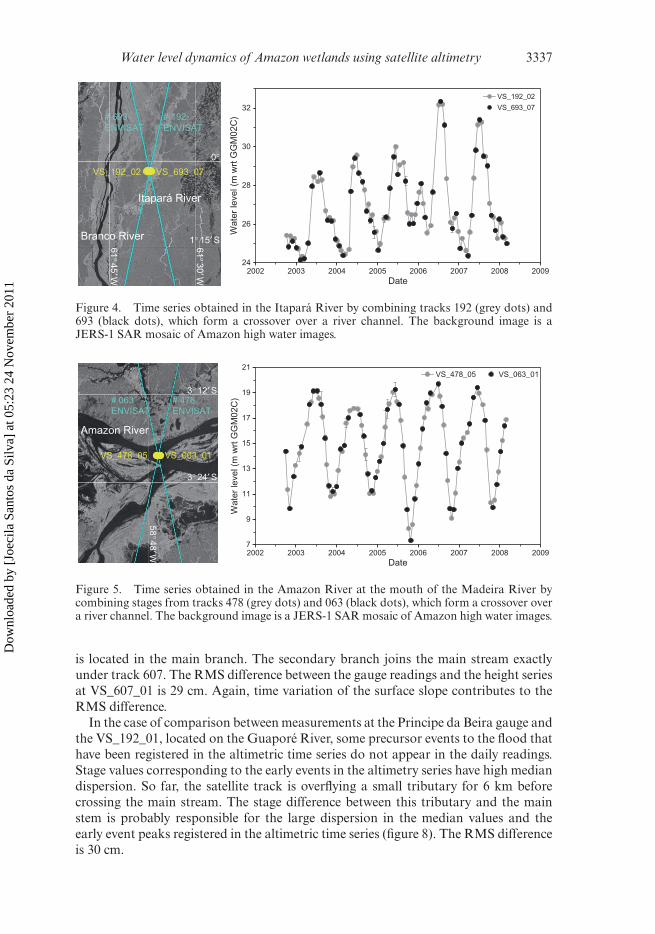
Other series that were computed using pairs of tracks at the Itapará River andAmazon River are shown in figures 4 and 5, respectively. No RMS difference wascalculated for these cases since the lag between pairs of measurements is several dayslong and the hypothesis of stage stability no longer holds.
Figures 6 to 8 show the altimetry series superimposed on readings from the closestin situ gauge with a distance of less than 15 km between the gauge and the track. Giventhe fact that the gauges are not levelled, we established a reference level for the gaugesby simple regression analysis between the altimetry values and gauge readings at thesame dates.
Comparison between the virtual stations and the conventional limnimetric gaugesdo not show any anomalies in any of the following three examples. Altimetric data aremonitoring the seasonal cycle of high and low flood and its interannual variations. Inthe Barcelos case (figure 6), the conventional limnimetric gauge is registering the water
Dow
nloa
ded
by [
Joec
ila S
anto
s da
Silv
a] a
t 05:
23 2
4 N
ovem
ber
2011

3336 J. Santos da Silva et al.
1°S
1°30′S
63°W
62°30′W
VS_779_02
VS_736_11
# 779ENVISAT
# 736ENVISAT
2°S18
20
22
24
26
2002 2003 2004 2005 2006 2007 2008 2009
Wa
ter
leve
l (m
wrt
GG
M0
2C
)
Date
VS_736_11 VS_779_02
Negro River
Unini River
Figure 2. Time series obtained in the Unini River by combining tracks 736 (grey dots) and 779(black dots), which form a crossover over a river channel. The background image is a JERS-1SAR mosaic of Amazon high water images.
63° 0
9′ W
12° 54′ S
13° 03′ S
VS_951_01VS_106_02
# 951ENVISAT
# 106ENVISAT
139
139.5
140
140.5
141
141.5
142
142.5
Wa
ter
leve
l (m
wrt
GG
M0
2C
)
VS_951_01 VS_106_02
Guaporé River
2002 2003 2004 2005 2006 2007 2008 2009
Date
Figure 3. Time series obtained in the lake of Guaporé River by combining tracks 951 (greydots) and 106 (black dots), which form a crossover over a lake. The background image is aJERS-1 SAR mosaic of Amazon high water images.
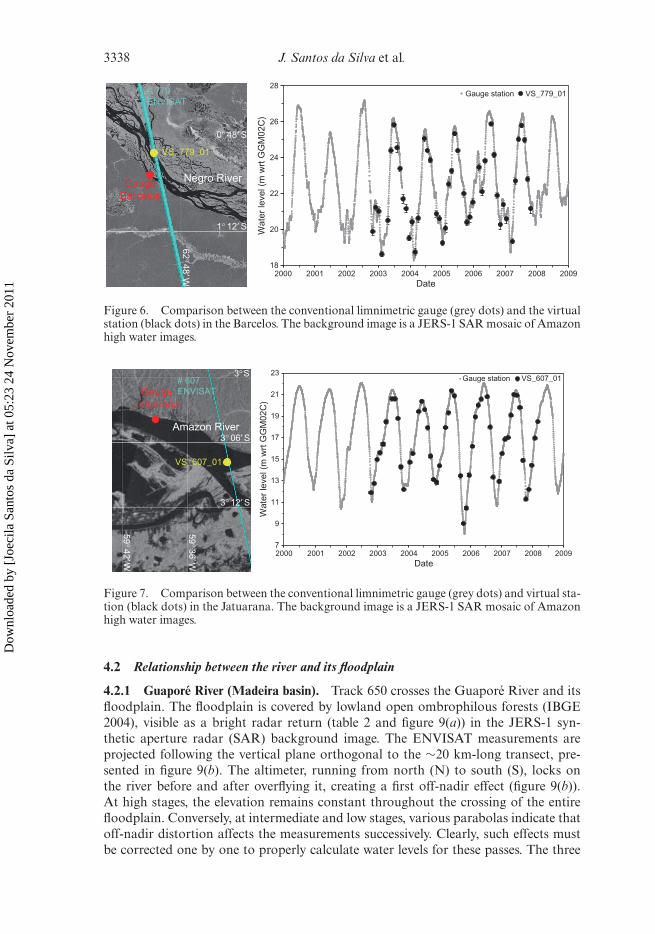
stage on the southernmost channel of the Negro River, while the altimetric virtualgauge is measuring the water surface elevation on a transect, that is, about 55 kmlong across the Mariuá archipelago, including a multichannel pattern and complexfloodplains with flooded forest. The RMS difference is 17 cm, mostly due to the timevariation in the surface slope between the gauge and the VS.
Virtual station VS_607_01 is located at the crossing of track 607 with the AmazonRiver at 14 km downstream of Jatuarana gauge. The flood and low stages are morepronounced in the VS_607_01 series than they are in the Jatuarana gauge series(figure 7). This difference in stage amplitude is likely to be related to different hydro-logical regimes between the two sites. At this location, the Amazon River dividesinto two branches and flows through a complex of strongly vegetated episodic islandand sand bars known as the ‘Ilha do Careiro’. The conventional limnimetric gauge
Dow
nloa
ded
by [
Joec
ila S
anto
s da
Silv
a] a
t 05:
23 2
4 N
ovem
ber
2011
Water level dynamics of Amazon wetlands using satellite altimetry 3337
0°
1° 15′ S
61° 4
5′ W
61° 3
0′ W
VS_693_07VS_192_02
# 693ENVISAT
# 192ENVISAT
24
26
28
30
32
2002 2003 2004 2005 2006 2007 2008 2009
Wate
r le
vel (m
wrt
GG
M02C
)
Date
VS_192_02
VS_693_07
Branco River
Itapará River
Figure 4. Time series obtained in the Itapará River by combining tracks 192 (grey dots) and693 (black dots), which form a crossover over a river channel. The background image is aJERS-1 SAR mosaic of Amazon high water images.
58° 4
8′ W
3° 12′ S
3° 24′ S
VS_063_01VS_478_05
# 063ENVISAT
# 478ENVISAT
7
9
11
13
15
17
19
21
2002 2003 2004 2005 2006 2007 2008 2009
Wa
ter
leve
l (m
wrt
GG
M0
2C
)
Date
VS_478_05 VS_063_01
Amazon River
Figure 5. Time series obtained in the Amazon River at the mouth of the Madeira River bycombining stages from tracks 478 (grey dots) and 063 (black dots), which form a crossover overa river channel. The background image is a JERS-1 SAR mosaic of Amazon high water images.
is located in the main branch. The secondary branch joins the main stream exactlyunder track 607. The RMS difference between the gauge readings and the height seriesat VS_607_01 is 29 cm. Again, time variation of the surface slope contributes to theRMS difference.
In the case of comparison between measurements at the Principe da Beira gauge andthe VS_192_01, located on the Guaporé River, some precursor events to the flood thathave been registered in the altimetric time series do not appear in the daily readings.Stage values corresponding to the early events in the altimetry series have high mediandispersion. So far, the satellite track is overflying a small tributary for 6 km beforecrossing the main stream. The stage difference between this tributary and the mainstem is probably responsible for the large dispersion in the median values and theearly event peaks registered in the altimetric time series (figure 8). The RMS differenceis 30 cm.
Dow
nloa
ded
by [
Joec
ila S
anto
s da
Silv
a] a
t 05:
23 2
4 N
ovem
ber
2011
3338 J. Santos da Silva et al.
0° 48′ S
1° 12′ S
62° 4
8′ W
VS_779_01
Gauge
Barcelos
# 779ENVISAT
18
20
22
24
26
28
2000 2001 2002 2003 2004 2005 2006 2007 2008 2009
Wate
r le
vel (m
wrt
GG
M02C
)
Date
Gauge station
Negro River
VS_779_01
Figure 6. Comparison between the conventional limnimetric gauge (grey dots) and the virtualstation (black dots) in the Barcelos. The background image is a JERS-1 SAR mosaic of Amazonhigh water images.
3° 06′ S
3° 12′ S
59° 3
6′ WVS_607_01
Gauge
Jatuarana
# 607ENVISAT
3°S
59° 4
2′ W
7
9
11
13
15
17
19
21
23
2000 2001 2002 2003 2004 2005 2006 2007 2008 2009
Wate
r le
vel (m
wrt
GG
M02C
)
Date
Gauge station VS_607_01
Amazon River
Figure 7. Comparison between the conventional limnimetric gauge (grey dots) and virtual sta-tion (black dots) in the Jatuarana. The background image is a JERS-1 SAR mosaic of Amazonhigh water images.
4.2 Relationship between the river and its floodplain
4.2.1 Guaporé River (Madeira basin). Track 650 crosses the Guaporé River and itsfloodplain. The floodplain is covered by lowland open ombrophilous forests (IBGE2004), visible as a bright radar return (table 2 and figure 9(a)) in the JERS-1 syn-thetic aperture radar (SAR) background image. The ENVISAT measurements areprojected following the vertical plane orthogonal to the ∼20 km-long transect, pre-sented in figure 9(b). The altimeter, running from north (N) to south (S), locks onthe river before and after overflying it, creating a first off-nadir effect (figure 9(b)).At high stages, the elevation remains constant throughout the crossing of the entirefloodplain. Conversely, at intermediate and low stages, various parabolas indicate thatoff-nadir distortion affects the measurements successively. Clearly, such effects mustbe corrected one by one to properly calculate water levels for these passes. The three
Dow
nloa
ded
by [
Joec
ila S
anto
s da
Silv
a] a
t 05:
23 2
4 N
ovem
ber
2011

Water level dynamics of Amazon wetlands using satellite altimetry 3339
12° 24′ S
12° 30′ S
64° 2
4′ W
VS_192_01
Gauge
Principe da Beira
# 192ENVISAT
124
126
128
130
132
134
136
2000 2001 2002 2003 2004 2005 2006 2007 2008 2009
Wa
ter
leve
l (m
wrt
GG
M0
2C
)
Date
Gauge station VS_192_01
Guaporé River
Figure 8. Comparison between the conventional limnimetric gauge (grey dots) and virtualstation (black dots) in the Principe da Beira. The background image is a JERS-1 SAR mosaicof Amazon high water images.
S N
(a)
(b)
130
131
132
133
134
135
136
137
2002 2003 2004 2005 2006 2007 2008 2009
Wate
r le
vel (m
wrt
GG
M02C
)
Date
Main stream
Floodplain
(c)
VS_650 _01
VS_650_02
12° 24′ S
12° 30′ S
12° 36′ S43° 4
8′ W
43 ° 4
2′ W
43° 3
6′ W
#650
ENVISAT
Guapore River
Figure 9. Comparison between the mainstream and the floodplain in the Gauporé River. (a)Track 650 crosses the Gauporé River and its floodplain. The background image is a JERS-1SAR mosaic of Amazon high water images. (b) The transect of the ENVISAT data. (c) Thetime series extracted at the two extremities of the floodplain. The series over the mainstream isshown with black dots and the series over the floodplain is shown with grey dots.
Dow
nloa
ded
by [
Joec
ila S
anto
s da
Silv
a] a
t 05:
23 2
4 N
ovem
ber
2011
3340 J. Santos da Silva et al.
solid arrows in figure 9(b) indicate three branches of the river that are permanentlyinundated (narrow sinuous black lines at the south of the floodplain).
The time series displayed in figure 9(c) are extracted at the two ends of the flood-plain. The seasonal water cycle is well phased with multimodal distributions. Therising limb and the recession limb are symmetrical and the level difference betweenhigh and low stage is about 5 m. The difference of water stage observed between thetwo water bodies is 50 to 70 cm. The maximum is observed from February to Apriland the minimum from September to November.
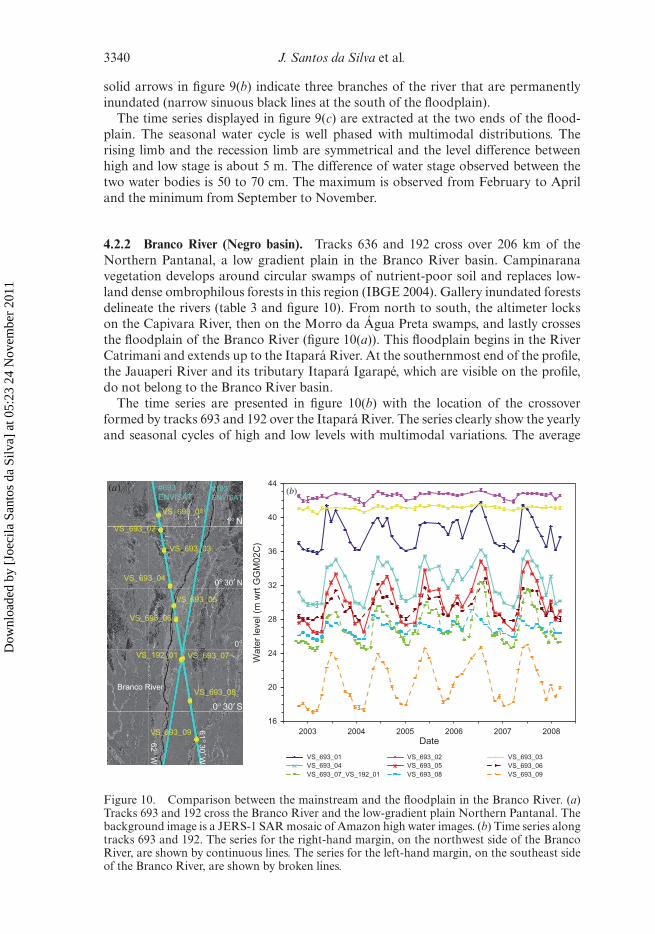
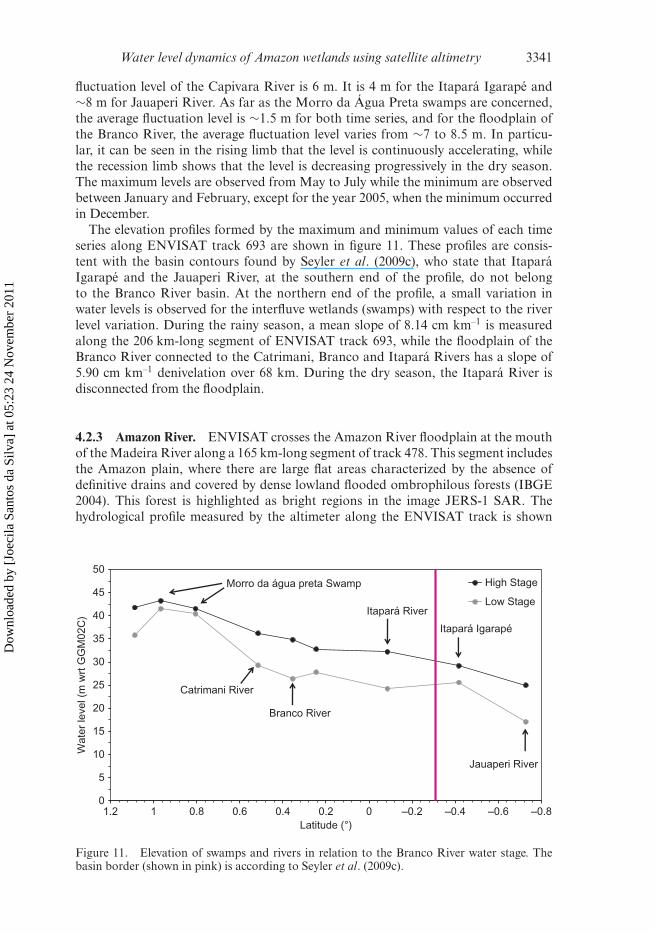
4.2.2 Branco River (Negro basin). Tracks 636 and 192 cross over 206 km of theNorthern Pantanal, a low gradient plain in the Branco River basin. Campinaranavegetation develops around circular swamps of nutrient-poor soil and replaces low-land dense ombrophilous forests in this region (IBGE 2004). Gallery inundated forestsdelineate the rivers (table 3 and figure 10). From north to south, the altimeter lockson the Capivara River, then on the Morro da Água Preta swamps, and lastly crossesthe floodplain of the Branco River (figure 10(a)). This floodplain begins in the RiverCatrimani and extends up to the Itapará River. At the southernmost end of the profile,the Jauaperi River and its tributary Itapará Igarapé, which are visible on the profile,do not belong to the Branco River basin.
The time series are presented in figure 10(b) with the location of the crossoverformed by tracks 693 and 192 over the Itapará River. The series clearly show the yearlyand seasonal cycles of high and low levels with multimodal variations. The average
16
20
24
28
32
36
40
44
2003 2004 2005 2006 2007 2008
Wate
r le
vel (m
wrt
GG
M02C
)
Date
VS_693_01 VS_693_02 VS_693_03
VS_693_04 VS_693_05 VS_693_06
VS_693_07_VS_192_01 VS_693_08 VS_693_09
1° N
0° 30′ N
0°
0° 30′ S
62° W
61° 3
0′ W
VS_693_01
VS_693_02
VS_693_03
VS_693_04
VS_693_05
VS_693_06
VS_693_07VS_192_01
VS_693_08
VS_693_09
#693
ENVISAT#192
ENVISAT
(a) (b)
Branco River
Figure 10. Comparison between the mainstream and the floodplain in the Branco River. (a)Tracks 693 and 192 cross the Branco River and the low-gradient plain Northern Pantanal. Thebackground image is a JERS-1 SAR mosaic of Amazon high water images. (b) Time series alongtracks 693 and 192. The series for the right-hand margin, on the northwest side of the BrancoRiver, are shown by continuous lines. The series for the left-hand margin, on the southeast sideof the Branco River, are shown by broken lines.
Dow
nloa
ded
by [
Joec
ila S
anto
s da
Silv
a] a
t 05:
23 2
4 N
ovem
ber
2011
Water level dynamics of Amazon wetlands using satellite altimetry 3341
fluctuation level of the Capivara River is 6 m. It is 4 m for the Itapará Igarapé and∼8 m for Jauaperi River. As far as the Morro da Água Preta swamps are concerned,the average fluctuation level is ∼1.5 m for both time series, and for the floodplain ofthe Branco River, the average fluctuation level varies from ∼7 to 8.5 m. In particu-lar, it can be seen in the rising limb that the level is continuously accelerating, whilethe recession limb shows that the level is decreasing progressively in the dry season.The maximum levels are observed from May to July while the minimum are observedbetween January and February, except for the year 2005, when the minimum occurredin December.
The elevation profiles formed by the maximum and minimum values of each timeseries along ENVISAT track 693 are shown in figure 11. These profiles are consis-tent with the basin contours found by Seyler et al. (2009c), who state that ItaparáIgarapé and the Jauaperi River, at the southern end of the profile, do not belongto the Branco River basin. At the northern end of the profile, a small variation inwater levels is observed for the interfluve wetlands (swamps) with respect to the riverlevel variation. During the rainy season, a mean slope of 8.14 cm km–1 is measuredalong the 206 km-long segment of ENVISAT track 693, while the floodplain of theBranco River connected to the Catrimani, Branco and Itapará Rivers has a slope of5.90 cm km–1 denivelation over 68 km. During the dry season, the Itapará River isdisconnected from the floodplain.
4.2.3 Amazon River. ENVISAT crosses the Amazon River floodplain at the mouthof the Madeira River along a 165 km-long segment of track 478. This segment includesthe Amazon plain, where there are large flat areas characterized by the absence ofdefinitive drains and covered by dense lowland flooded ombrophilous forests (IBGE2004). This forest is highlighted as bright regions in the image JERS-1 SAR. Thehydrological profile measured by the altimeter along the ENVISAT track is shown
0
5
10
15
20
25
30
35
40
45
50
–0.8–0.6–0.4–0.200.20.40.60.811.2
Wate
r le
vel (m
wrt
GG
M02C
)
Latitude (°)
High Stage
Low Stage
Branco River
Morro da água preta Swamp
Itapará River
Itapará Igarapé
Jauaperi River
Catrimani River
Figure 11. Elevation of swamps and rivers in relation to the Branco River water stage. Thebasin border (shown in pink) is according to Seyler et al. (2009c).
Dow
nloa
ded
by [
Joec
ila S
anto
s da
Silv
a] a
t 05:
23 2
4 N
ovem
ber
2011

3342 J. Santos da Silva et al.
VS_478_02
VS_063_03
VS_478_05
and
VS_063_01
# 478
ENVISAT
VS_478_01
# 063
ENVISAT
(a)
VS_478_03
VS_478_04
VS_478_06
VS_478_07
VS_478_10
VS_478_09SV_478_08
VS_478_11
VS_478_12
S(b) N
VS_063_02
VS_478_13
Madeira River
Amazon River
3° S
3° 30′ S
4° 30′ S58°
30′ W
59° W
59° 3
0′ W
60° W
60° 3
0′ W
4° S
Figure 12. Comparison between the mainstream and the floodplain in the Amazon River. (a)Tracks 478 and 063 cross the Amazon River. The background image is a JERS-1 SAR mosaicof Amazon high water images. (b) The transect of the ENVISAT data along track 478. Theyellow arrows indicate the location of the successive virtual stations along the ENVISAT tracks.Crossing of the track with the Amazon River is indicated by a red arrow.
in figure 12(a) and the data are listed in table 4. This profile samples the whole flood-plain, starting with the Urubu River at the northern end, then two lakes, the AmazonRiver, the Madeira River, the Curupira Lake, the Curupira River, the Marimari Riverand the Miraçoeiro River at the southern end. In addition, three virtual stations wereestablished along track 063 at the crossings with the Amazon River, the Madeira Riverand the Arrozal Lake, respectively (figure 12(b)). The corresponding time series arepresented in figure 13. Note that the altimetric time series of the Amazon River ismade up of the two tracks 478 and 063 that cross exactly over the river.
The series presented in figure 13 enables the hydrological regime to be described. Theflood wave presents various peaks during the rising limb, while the recession showsa fast falling limb. In this Amazon floodplain, the flood occurs during May and atthe beginning of July. The water level reaches a maximum altitude of 21 m. Droughtoccurs during October and November down to a minimum altitude of 7 m. The timeseries of the Caru River (dark blue series at the top of figure 13) do not follow thesame hydrological regime, as it belongs to the Uatumã basin, which joins the Amazondownstream of the region analysed.
The elevation of the Amazon floodplain at the mouth of the Madeira River is pre-sented in figure 14. The profiles are formed by the maximum and minimum values
Dow
nloa
ded
by [
Joec
ila S
anto
s da
Silv
a] a
t 05:
23 2
4 N
ovem
ber
2011

Water level dynamics of Amazon wetlands using satellite altimetry 3343
6
8
10
12
14
16
18
20
22
2002 2003 2004 2005 2006 2007 2008 2009
Wa
ter
leve
l (m
wrt
GG
M0
2c)
Date
VS_478_01 VS_478_02 VS_478_03 VS_478_04 VS_063_01_VS_478_05
VS_063_03 VS_063_02 VS_478_06 VS_478_07 VS_478_08
VS_478_09 VS_478_10 VS_478_11 VS_478_12 VS_478_13
Figure 13. The time series along tracks 478 and 063 of the Amazon floodplain.
0
5
10
15
20
25
–4.5 –4.3 –4.1 –3.9 –3.7 –3.5 –3.3 –3.1 –2.9
Wa
ter
leve
l (m
wrt
GG
M0
2C
)
Latitude (°)
High stage
Low stage
Amazon River
Madeira River
Curupira Lake
Miraçoeiro River
Caru River
Figure 14. Elevation of the lakes and the rivers in relation to the Amazon River water stage.
of the successive time series. During flooding, all of the rivers and lakes of the stud-ied area are connected in a unique hydrological system corresponding to the AmazonRiver with a low slope of 0.84 cm km–1. In the dry season, however, there are five differ-ent hydrological patterns. Miraçaoeiro, Marimani and Curupira rivers belong to the
Dow
nloa
ded
by [
Joec
ila S
anto
s da
Silv
a] a
t 05:
23 2
4 N
ovem
ber
2011
3344 J. Santos da Silva et al.
same hydrological system. Curupira Lake, Urubu River and Caru River are discon-nected from the floodplain, forming individual systems. Conversely, Madeira River,Arrozal Lake and the small lakes between the Amazon River and the Urubu Riverform one system, since they remain connected with the Amazon River even during thedrought.
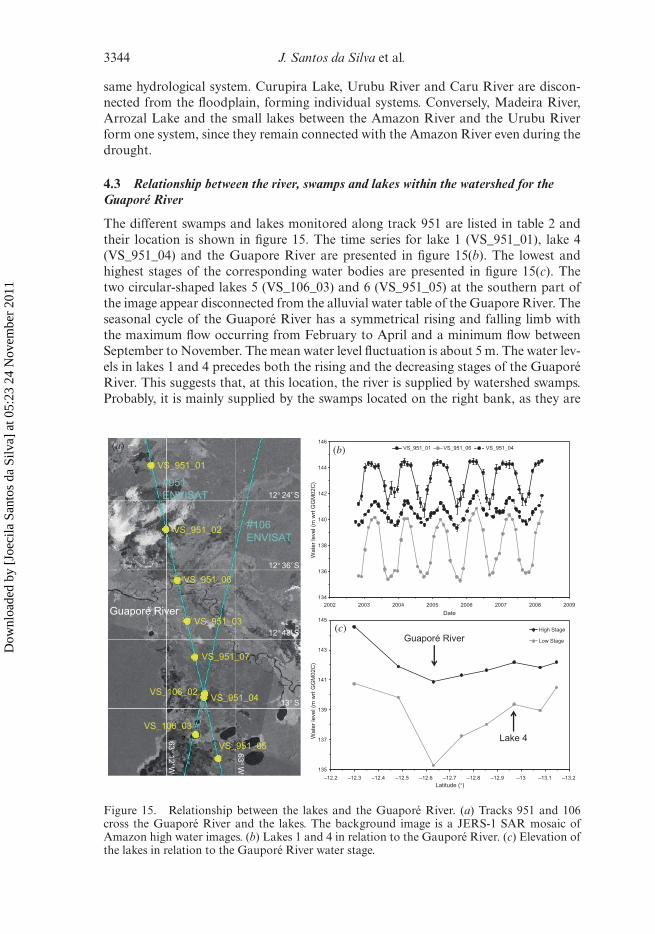
4.3 Relationship between the river, swamps and lakes within the watershed for theGuaporé River
The different swamps and lakes monitored along track 951 are listed in table 2 andtheir location is shown in figure 15. The time series for lake 1 (VS_951_01), lake 4(VS_951_04) and the Guapore River are presented in figure 15(b). The lowest andhighest stages of the corresponding water bodies are presented in figure 15(c). Thetwo circular-shaped lakes 5 (VS_106_03) and 6 (VS_951_05) at the southern part ofthe image appear disconnected from the alluvial water table of the Guapore River. Theseasonal cycle of the Guaporé River has a symmetrical rising and falling limb withthe maximum flow occurring from February to April and a minimum flow betweenSeptember to November. The mean water level fluctuation is about 5 m. The water lev-els in lakes 1 and 4 precedes both the rising and the decreasing stages of the GuaporéRiver. This suggests that, at this location, the river is supplied by watershed swamps.Probably, it is mainly supplied by the swamps located on the right bank, as they are
12° 24′ S
12° 36′ S
12° 48′ S
13° S
63° W
63° 1
2′ W#951
ENVISAT
#106
ENVISAT
VS_951_01
VS_951_02
VS_951_03
VS_951_04
VS_951_05
VS_951_06
VS_951_07
VS_106_02
VS_106_03
(a) (b)
(c)
134
136
138
140
142
144
146
2002 2003 2004 2005 2006 2007 2008 2009
Wate
r le
vel (m
wrt
GG
M02C
)
Date
VS_951_01 VS_951_06 VS_951_04
135
137
139
141
143
145
–13.2–13.1–13–12.9–12.8–12.7–12.6–12.5–12.4–12.3–12.2
Wate
r le
vel (m
wrt
GG
M02C
)
Latitude (°)
High Stage
Low StageGuaporé River
Lake 4
Guaporé River
Figure 15. Relationship between the lakes and the Guaporé River. (a) Tracks 951 and 106cross the Guaporé River and the lakes. The background image is a JERS-1 SAR mosaic ofAmazon high water images. (b) Lakes 1 and 4 in relation to the Gauporé River. (c) Elevation ofthe lakes in relation to the Gauporé River water stage.
Dow
nloa
ded
by [
Joec
ila S
anto
s da
Silv
a] a
t 05:
23 2
4 N
ovem
ber
2011

Water level dynamics of Amazon wetlands using satellite altimetry 3345
more extensive than those on the left bank and have almost the same amplitude ofstage variation as the main stream.
4.4 Relationships between basins
4.4.1 Negro River. From north to south, track 736 crosses over 1168 km of thealluvial wetlands in the Middle Negro River (figure 16). From the north, it crossessuccessively small and large unnamed tributaries and the Caapiranga Swamps, and atthe end crosses the Negro River in the Mariuá archipelago. Further south, it crossesthe Solimões (grey dots) and Purus Rivers (bright pink dots), then the Madeira River(dark green dots) in the southernmost part of the segment (table 5). The Unini Rivertime series is made up from crossover measurements of ground tracks 736 and 779. Infigure 16(b), the altimetric time series are given, ranging from Água Branca Igarapé,passing through the Novo and Caapiranga wetland systems, and Jatari, Pirarara,Negro and Unini Rivers extending out to the Madeira River (figure 16(c)). The samehydrological regime is evidenced from Água Branca Igarapé to the Unini River. Thishydrological regime is characterized by a bimodal flood wave, fast rise and slow reces-sion. It should be noted that the flood occurs between April and August and thedrought between September and February. Moreover, the flooded wetlands demon-strate an in-phase temporal pattern. A small variation in water levels (between 0.7
16
26
36
46
56
66
76
2003 2004 2005 2006 2007 2008 .5
Date
VS_736_09
VS_736_10
VS_736_11
VS_736_12
VS_736_13
VS_735_14
VS_736_15
VS_736_16
VS_736_17
VS_736_18
VS_736_19
16
26
36
46
56
2003 2004 2005 2006 2007 2008 .5
Wate
r le
vel (m
wrt
GG
M02C
)W
ate
r le
vel (m
wrt
GG
M02C
)
VS_736_01
VS_736_02
VS_736_03
VS_235_01
VS_235_02
VS_235_03
VS_235_04
VS_235_05
VS_235_06
VS_736_04
VS_235_07
VS_235_08
VS_736_05
VS_736_06
VS_235_09
VS_736_07
VS_235_10
VS_736_08
VS_736_09
#235
ENVISAT#736
ENVISAT
#779
ENVISAT
VS_736_01
VS_736_02VS_736_03
VS_736_04
VS_736_05VS_736_06
VS_736_07
VS_736_08 VS_736_09
VS_736_10
VS_736_11
VS_736_12
VS_736_13
VS_736_14VS_736_15
VS_736_16
VS_736_17
VS_736_18
VS_736_19
VS_779_01
VS_779_02
VS_235_01
TO
VS_235_09
0°
2° S
4° S
6° S
8° S
60° W
62 ° W
64 ° W
(b)
(c)
(a)
Negro River
Solimões River
Madeira River
Figure 16. Height relationships between the swamps and the lakes with the river channelsin the Negro, Solimões and Madeira basins. (a) Tracks 235, 736 and 779 crossing the Negro,Solimões and Madeira Rivers. The background image is a JERS-1 SAR mosaic of Amazonhigh water images. (b) Time series at these crossings from the north to the Negro River (reddots). (c) Time series at these crossings from the south to the Negro River (red dots).
Dow
nloa
ded
by [
Joec
ila S
anto
s da
Silv
a] a
t 05:
23 2
4 N
ovem
ber
2011

3346 J. Santos da Silva et al.
15
25
35
45
55
65
75
–9.5–8.5–7.5–6.5–5.5–4.5–3.5–2.5–1.5–0.50.51.5
Latitude (°)
NEGRO BASIN HIGH STAGE NEGRO BASIN LOW STAGE UPSTREAM LIMIT OF BRANCO BASIN
BRANCO BASIN HIGH STAGE BRANCO BASIN LOW STAGE DOWNSTREAM LIMIT OF BRANCO BASIN
LIMIT OF NEGRO AND SOLIMÕES BASINS SOLIMÕES BASIN HIGH STAGE SOLIMÕES BASIN LOW STAGE
LIMIT OF SOLIMÕES AND MADEIRA BASINS MADEIRA BASIN HIGH STAGE MADEIRA BASIN LOW STAGE
Branco River
Negro River
Solimões River
Madeira River
Wate
r le
vel (m
wrt
GG
M02C
)
Figure 17. Elevation of the swamps, lakes and rivers in relation to the water stage of theBranco, Negro, Solimões and Madeira Rivers. The basin borders are according to Seyler et al.(2009c).
and 1 m) is observed for the Novo and Caapiranga wetlands with respect to the otherrivers, Caapiranga wetland being located at the Branco River border.
The elevation profile along the north–south ENVISAT track 736 over the NegroRiver is shown in figure 17. The limits of the Branco, Negro, Solimões and Madeirabasins are marked on this profile. The altimetric track cuts the four basins at almostthe same time (<1 h), representing a transversal section though the basins, highlight-ing the altitudinal relationship between water bodies, within each basin, and amongbasins. Connections can be observed at the high stage between Madeira and Solimõesbasins, and between Solimões and Negro basins. There is a general dissymmetry fromsouth to north, the Negro River being the centre of the general depression. TheSolimões River flows at the northernmost extension of its basin, close to the Negrobasin border. The general decline from the north to the Negro River is only about20 m at the high stage and 30 m at the low stage for a distance of 300 km, that fromthe south to the Solimões River is about 40 m at the high stage and 50 m at the lowstage for a distance of about 500 km.
Continuing with the observation of this crosstrack within the basins, we discussthe temporal relationship of the water levels at the particular location of the trackcrossing. Different time series variations are shown in the figure 18. We have limitedthe discussion to the crossings of the Negro and Solimões Rivers by ENVISAT track736. At the locations of the crossing, the flood peak has occurred at the same timefor the first three years (2003, 2004 and 2005). The time series miss the cycle of theSolimões River 2006 flood peak, which causes an apparent dephasage of the floodpeak. In 2007, the Negro River was still at high water while the Solimões was entering
Dow
nloa
ded
by [
Joec
ila S
anto
s da
Silv
a] a
t 05:
23 2
4 N
ovem
ber
2011

Water level dynamics of Amazon wetlands using satellite altimetry 3347
5
10
15
20
25
30
35
2003 2004 2005 2006 2007 2008
Date
NEGRO RIVER VS_779_02 NEGRO RIVER VS_736_09 SOLIMÕES RIVER VS_736_14
AMAZON RIVER VS_607_01 AMAZON RIVER VS_478_05
Wate
r le
vel (m
wrt
GG
M02C
)
Figure 18. Time series of water level characteristics of the Negro and Solimões Rivers.
its recession period. Another striking dephasage that has occurred since the end of2005 is the extremely low stage of the Solimões, while the Negro has not been regis-tering any unusual low stage. From 2005 to 2008, high stages have been reached veryquickly in the Solimões, whereas the water has remained low in the Negro. For someyears, the Negro River has had a secondary flood peak occurring either in December(2002, 2006) or in January (2004) (equatorial regime). In the same years, the phe-nomenon known as repiquete, which is an inflection in the rising stage, has occurred inthe Solimões River. For some other years (the end of 2004 and of 2005), a weak inflec-tion in the rising peak of the Solimões does not correspond to the Negro secondaryflood peak. This suggests that the repiquete is related to the equatorial rain regime ofthe tributaries located upstream of the Negro confluence, rather than being influencedby the Negro River itself.
5. Conclusions
Altimetric data recorded by the radar altimeter RA-2 onboard the ENVISAT missionenabled the quantification of spatial and temporal variations in seasonal wetlands andrivers at the watershed scale. These measurements are referenced to a unique systemthroughout the basin. This allows a basin-wide vision of the various seasonal cycles aswell as the general altitude distribution in space and time of the different water bodiesmaking up the Amazon basin.
Monitoring water levels by altimetry could be extended over the past two decadesby combining the different available missions: the T/P mission has been reprocessedfor continental water studies in the scope of the Contribution de l’Altimétrie Spatialepour l’Hydrologie (CASH 2010) project, while ERS mission data have been repro-cessed by the Ice-2 algorithm, implemented by the Observation of Surface ContinentalAltimetrie Radar (OSCAR) project (Legresy 1995). The next steps should include data
Dow
nloa
ded
by [
Joec
ila S
anto
s da
Silv
a] a
t 05:
23 2
4 N
ovem
ber
2011
3348 J. Santos da Silva et al.
processing for recent (Jason-2 launched in 2008) or future missions (CryoSat II andAltikA, planned to be launched in 2010).
Although the virtual stations can only be established under satellite ground tracksand under sampling time schedules defined by the altimetric missions, such as 35days for the ENVISAT mission, water level time series with decimetre accuracy wereobtained for wetland and rivers of approximate 20 m width (see tables 4 and 5).
Water level variability was also defined for wetlands and for lakes that were verydifficult to access and with predominant flooded vegetation. In these hydrosystemsthe amplitudes of water level variability are usually small, limited to a few decimetres.As the dynamics of wetlands are more stable, it is possible to select a larger amountof points in the virtual stations, with a more regular temporal sampling and with adetailed spatial and temporal acquisition enriched by a combination of ground tracks.
Such a sampling scheme, although obtained by a nadir track altimeter, can giveus an insight into what might be observed with the future Surface Water OceanTopography (SWOT) altimeter. The SWOT mission is planned for 2020 and will con-duct a comprehensive mapping of flooded areas and water levels, using a technologycalled interferometric altimetry (Alsdorf et al. 2007a). With this mission, the dynamicsof floods will be studied with higher quality and temporal resolution, since bidimen-sional images will be provided with a horizontal resolution of 50–100 m and a timeresolution of 10–20 days.
Such as they are today, altimeter data can provide us with some guidance inthe dominant mechanisms to be considered under the framework of rainfall–runoffmodelling. For instance, with this study, monitoring the spatial and temporal dis-tribution of the saturated areas throughout the basin has become possible. Suchinformation should provide valuable constraints over semi-distributed schemes such asTOPMODEL (Beven and Kirkby 1979). The implications of the availability of thesenew sources of data flows are still to be evaluated. New ways to be incorporated in themodelling methods also need to be defined.
Constraints on the availability of observational data obtained by conventionalhydrometric networks are high, particularly in remote areas or spatially complex areassuch as wetlands. This study shows the feasibility of using altimetric data to circum-vent the scarcity of conventional data, and also suggests new ways of using spatiallydistributed stage measurements in modelling schemes.
AcknowledgementsWe thank the reviewers who greatly helped in rewriting the preliminary version ofthe manuscript. We are grateful for the financial support provided to the first authorby Conselho Nacional de Desenvolvimento Científico e Tecnológico (CNPq), Braziland by Coordenação de Aperfeiçoamento de Pessoal de Nível Superior (CAPES)Brazil (ref. CAPES/COFECUB no. 516/05), and to the French contributors fundedby the French Centre National d’Etudes Spatiale through the TOSCA programme,project Hydrologie Spatiale. Acquisition of JERS-1 imagery was made possible byNASDA’s Global Rain Forest Mapping Project. We thank the Instituto Brasileiro deGeografia e Estatística (IBGE) for the maps of the region, the Agência Nacional deÁguas (ANA), Brazil for the gauge data and the CTOH (Centre de Topographie desOcéans et de l’Hydrosphère, LEGOS, France) for access to ERS-2 and ENVISATGDRs and additional tropospheric corrections through their online database system,and the European Space Agency (ESA) for granting the use of the data. We are alsograteful to Gerard Cochonneau for his work on the treatment of the altimetric data.
Dow
nloa
ded
by [
Joec
ila S
anto
s da
Silv
a] a
t 05:
23 2
4 N
ovem
ber
2011

Water level dynamics of Amazon wetlands using satellite altimetry 3349
ReferencesACREMAN, M.C., FISHER, J., STRATFORD, C.J., MOULD, D.J. and MOUNTFORD, J.O.,
2007, Hydrological science and wetland restoration: some case studies from Europe.Hydrology and Earth System Sciences, 11, pp. 158–169.
ALSDORF, D.E., BIRKETT, C.M., DUNNE, T., MELACK, J. and HESS, L., 2001a, Water levelchanges in a large Amazon lake measured with spaceborne radar interferometry andaltimetry. Geophysical Research Letters, 28, pp. 2671–2674.
ALSDORF, D.E., CAZENAVE, A., FU, L.-L. and MOGNARD, N., 2007a, The WATERHM Satellite Mission. Available online at: http://bprc.osu.edu/water/publications/WATERHM_FirstDocument_ Final.pdf (accessed 1 October 2007).
ALSDORF, D.E. and LETTENMAIER, D.P., 2003, Tracking fresh water from space. Science, 301,pp. 1491–1494.
ALSDORF, D.E., MELACK, J.M., DUNNE, T., MERTES, L.A.K., HESS, L.L. and SMITH, L.C.,2000, Interferometric radar measurements of water level changes on the Amazonfloodplain. Nature, 404, pp. 174–177.
ALSDORF, D.E., RODRIGUEZ, E. and LETTENMAIER, D., 2007b, Measuring surface water fromspace. Reviews of Geophysics, 45, RG2002, doi:10.1029/2006RG000197.
ALSDORF, D.E., SMITH, L.C. and MELACK, J.M., 2001b, Amazon floodplain water levelchanges measured with interferometric SIR-C radar. IEEE Transactions on Geoscienceand Remote Sensing, 39, pp. 423–431.
ANA, 2008, Hydrometeorological networks for the Amazonian region. National Water Agency.Available online at: www.ana.gov.br/GestaoRecHidricos/InfoHidrologicas/hidrometeorologia/rh_amazonica/Rede_Hidrometeorologica_Amazonia.asp (accessed 29November 2008).
BAMBER, J.L., 1994, Ice sheet altimeter processing scheme. International Journal of RemoteSensing, 15, pp. 925–938.
BERRY, P.A.M., GARLICK, J.D., FREEMAN, J.A. and MATHERS, E.L., 2005, Global inland watermonitoring from multi-mission altimetry. Geophysical Research Letters, 32, L16401,doi:10.1029/2005GL022814.
BEVEN, K.J. and KIRKBY, M.J., 1979, A physically based variable contributing area model ofbasin hydrology. Hydrological Sciences Bulletin, 24, pp. 43–69.
BIRKETT, C.M., 1995, The global remote sensing of lakes, wetlands and rivers for hydrologicaland climate research. Geoscience and Remote Sensing Symposium, 1995 (IGARSS ‘95),Quantitative Remote Sensing for Science and Applications, 3, pp. 1979–1981.
BIRKETT, C.M., 1998, Contribution of the TOPEX NASA radar altimeter to theglobal monitoring of large rivers and wetlands. Water Resources Research, 34,pp. 1223–1239.
BIRKETT, C.M., MERTES, L.A.K., DENNE, T., COSTA, M.H. and JASINSKI, M.J., 2002, Surfacewater dynamics in the Amazon basin: application of satellite radar altimetry. Journal ofGeophysical Research, 107, 8059, doi:10.1029/2001JD000609.
BONNET, M.P., BARROUX, G., MARTINEZ, J.M., SEYLER, F., MOREIRA-TURCQ, P.,COCHONNEAU, G., MELACK, J.M., BOAVENTURA, G., MAURICE-BOURGOIN, L., LEON,J.G., ROUX, E., CALMANT, S., KOSUTH, P., GUYOT, J.L. and SEYLER, P., 2008,Floodplain hydrology in an Amazon floodplain lake (Lago Grande de Curuaí). Journalof Hydrology, 349, pp. 18–30.
BROWN, G.S., 1977, The average impulse response of a rough surface and its applications. IEEETransactions on Antennas and Propagation, 25, pp. 67–74.
CALMANT, S. and SEYLER, F., 2006, Continental surface water from satellite altimetry. ComptesRendus Geoscience, 338, pp. 1113–1122.
CALMANT, S., SEYLER, F. and CRETAUX, J.-F., 2008, Monitoring continental surface waters bysatellite altimetry. Surveys in Geophysics, 29, pp. 247–269.
CASH, 2010, Contribution of Satellite Altimetry to Hydrology. Available online at:http://ocean.cls.fr/html/cash/welcome.html (accessed 10 May 2010).
Dow
nloa
ded
by [
Joec
ila S
anto
s da
Silv
a] a
t 05:
23 2
4 N
ovem
ber
2011
3350 J. Santos da Silva et al.
CAUHOPE, M., 2004, Hauteurs d’eau d’une plaine d’inondation amazonienne par altimétrie spa-tiale. Rapport de stage de DEA ‘Sciences de la Terre et l’Environnement’ (Toulouse:IMFT).
COSTA, R.C.R., FILHO, T.N. and DE OLIVEIRO, A.A.B., 1978, Geomorfologia. In ProjetoRADAMBRASIL, Folha SA.20 Manaus; geologia, geomorfologia, pedologia, vegetacãoe uso potencial da terra, pp. 167–244 (Rio de Janeiro: DNPM).
CRÉTAUX, J.F. and BIRKETT, C., 2006, Lake studies from satellite radar altimetry. ComptesRendus Geoscience, 338, pp. 1098–1112.
CTOH, 2008, Center for Topographic Studies of the Oceans and Hydrosphere. Available onlineat: http://www.ctoh.legos.obs-mil.fr/fr/ (accessed 15 May 2008).
CUDLIP, W.J., RIDLEY, K. and RAPLEY, C.G., 1990, The use of satellite radar altimetry formonitoring wetlands. In Remote Sensing and Global Change. Proceedings of the 16thAnnual Conference of the Remote Sensing Society, University College of Swansea, 19–21 September 1990, M.G. Coulson (Ed.), Wales, UK (Nottingham: Remote SensingSociety), pp. 207–216.
DE OLIVEIRA CAMPOS, I., MERCIER, F., MAHEU, C., COCHONNEAU, G., KOSUTH, P.,BLITZKOW, D. and CAZENAVE, A., 2001, Temporal variations of river basin watersfrom Topex/Poseidon satellite altimetry: application to the Amazon basin. Comptesrendus de l’Académie des Sciences, Paris. Sciences de la Terre et des Planètes, 333,pp. 1–11.
DUNNE, T., MERTES, L.A.K., MEADE, R.H., RICHEY, J.E. and FORSBERG, B.R., 1998,Exchanges of sediment between the flood plain and channel of the Amazon River inBrazil. Geological Society of America Bulletin, 110, pp. 450–467.
FILIZOLA, N. and GUYOT, J.L., 2009, Suspended sediment yields in the Amazon basin:an assessment using the Brazilian national data set. Hydrological Processes, 23,pp. 3207–3215.
FRANZINELLI, E. and IGREJA, H., 2002, Modern sedimentation in the lower Negro River,Amazon State, Brazil. Geomorphology, 44, pp. 259–271.
FRAPPART, F., CALMANT, S., CAUHOPÉ, M., SEYLER, F. and CAZENAVE, A., 2006, Preliminaryresults of ENVISAT RA-2-derived water levels validation over the Amazon basin.Remote Sensing of Environment, 100, pp. 252–264.
FRAPPART, F., PAPA, F., FAMIGLIETTI, J.S., PRIGENT, C., ROSSOW, W. and SEYLER, F., 2008,Interannual variations of river water storage from a multiple satellite approach: a casestudy for the Rio Negro River basin. Journal of Geophysical Research, 113, D21104,doi:10.1029/2007D009438.
FRAPPART, F., SEYLER, F., MARTINEZ, J.M., LEON, J.G. and CAZENAVE, A., 2005, Floodplainwater storage in the Negro River basin estimate from microwave remote sensing ofinundation area and water levels. Remote Sensing of Environment, 99, pp. 387–39.
FU, L.L. and CAZENAVE, A., 2001, Satellite Altimetry and Earth Science. A Handbook ofTechniques and Applications (London: Academic Press).
GUERIN, F., ABRIL, G., RICHARD, S., BURBAN, B., REYNOUARD, C., SEYLER, P. andDELMAS, R., 2006, Methane and carbon dioxide emissions from tropical reser-voirs: significance of downstream rivers. Geophysical Research Letters, 33, L21407,doi:10.1029/2006GL027929.
GUYOT, J.L., CALLÈDE, J., COCHONNEAU, G., FILIZOLA, N., GUIMARAES, V., KOSUTH, P.,MOLINIER, M., DE OLIVEIRA, E., SEYLER, F. and SEYLER, P., 1999, Caractéristiqueshydrologiques du bassin amazonien. In International Symposium on Hydrological andGeochemical Processes in Large Scale River Basins, 15–19 November 1999, J.L. Guyot(Ed.), Manaus (AM), Brazil (Paris: ORSTOM, IRD Editions), pp. 1–12.
GUYOT, J.L., JOUANNEAU, J.M., SOARES, L., BOAVENTURA, G.R., MAILLET, N. and LAGANE,C., 2007, Clay mineral composition of river sediments in the Amazon Basin. Catena,71, pp. 340–356.
Dow
nloa
ded
by [
Joec
ila S
anto
s da
Silv
a] a
t 05:
23 2
4 N
ovem
ber
2011
Water level dynamics of Amazon wetlands using satellite altimetry 3351
GUYOT, J.L., MOLINIER, M., GUIMARAES, V., CUDO, K. and OLIVEIRA, E., 1994, Nouveautéssur les débits monstrueux de l’Amazone. Revue de Géographie Alpine, 12, pp. 77–83.
IBGE, 2004, Mapa de Vegetação do Brasil. Rio de Janeiro: Ministério do Planejamento,Orçamento e Gestão (Rio de Janeiro: Instituto Brasileiro de Geografia e Estatística,IBGE).
JUNK, W.J., BAYLEY, P.B. and SPARKS, R.E., 1989, The flood pulse concept in river flood-plain systems. Canadian Special Publication of Fisheries and Aquatic Sciences, 106,pp. 110–127.
JUNK, W.J. and FURCH, K., 1993, A general review of tropical South America floodplains.Wetlands Ecology and Management, 2, pp. 231–238.
JUNK, W.J. and WEBER, G.E., 1996, Amazonian floodplains: a limnological perspective.Verhandlungen Internationale Vereinigung für Theoretische und Angewandte Limnologie.26, pp. 149–157.
LAKE, P.S. and BOND, N.R., 2007, Australian futures: freshwater ecosystems and human waterusage. Futures, 39, pp. 288–305.
LATRUBESSE, E.M. and FRANZINELLI, E., 2005, The late quaternary evolution of the NegroRiver, Amazon, Brazil: implications for island and floodplain formation in largeanabranching tropical systems. Geomorphology, 70, pp. 372–397.
LAXON, S., 1994, Sea ice altimeter processing scheme at the EODC. International Journal ofRemote Sensing, 15, pp. 915–924.
LEFAVOUR, G. and ASDORF, D., 2005, Water slope and discharge in the Amazon River esti-mated using the shutter radar topography mission digital elevation model. GeophysicalResearch Letters, 32, L17404, doi:10.1029/2005GL023836.
LEGRESY, B., 1995, Etude du retracking des surfaces des formes d’onde altimétriques au-dessus descalottes. Rapport CNES, CT/ED/TU/UD96.188, contrat no. 856/2/95/CNES/006.
LEGRÉSY, B. and RÉMY, F., 1997, Surface characteristics of the Antarctic ice sheet andaltimetric observations. Journal of Glaciology, 43, pp. 265–275.
LEON, J.G., CALMANT, S., SEYLER, F., BONNET, M.P., CAUHOPE, M., FRAPPART, F., FILIZOLA,N. and FRAIZY, P., 2006, Rating curves and estimation of average water depth at theupper Negro River based on satellite altimeter data and modeled discharges. Journal ofHydrology, 328, pp. 481–496.
MATTHEWS, E., 2000, Wetlands. In Atmospheric Methane: Its Role in the Global Environment,M.A.K. Khalil (Ed.), pp. 202–233 (Berlin: Springer-Verlag).
MAURICE-BOURGOIN, L., QUIROGA, I., CHINCHEROS, J. and COURAU, P., 2000, Mercurydistribution in waters and fishes of the upper Madeira Rivers and mercury expo-sure in riparian Amazonian populations. Science of the Total Environment, 260,pp. 73–86.
MEADE, R.H., DUNNE, T., RICHEY, J.E., SANTOS, U.M. and SALATI, E., 1985, Storage andremobilization of suspended sediment in the lower Amazon River of Brazil. Science,228, pp. 488–490.
MERCIER, F., 2001, Altimétrie spatiale sur les eaux continentales: apport des missionsTopex/Poseidon et ERS1&2 à l’étude des lacs, mers intérieures et bassins fluviaux. PhDthesis, Université Toulouse III-Paul Sabatier, Toulouse, France.
MERTES, L.A.K., DUNNE, T. and MARTINELLI, L.A., 1996, Channel–floodplain geomorphol-ogy along the Solimões-Amazon River, Brazil. Geological Society of America Bulletin,108, pp. 1089–1107.
MOLINIER, M., GUYOT, J.L., CALLÈDE, J., GUIMARÃES, V., OLIVEIRA, E. and FILIZOLA, N.,1997, Hydrologie du bassin amazonien. In Environnement et développement en Amazoniebrésilienne, H. Théry (Ed.), pp. 24–41 (Paris: Editions Belin).
MOLINIER, M., GUYOT, J.L., OLIVEIRA, E., GUIMARAES, V. and CHAVES, A., 1995,Hydrologie du bassin de l’Amazone. In Grands bassins fluviaux périatlantiques:Congo, Niger, Amazone, J. Boulegue and J.C. Olivry (Eds.), pp. 335–344.
Dow
nloa
ded
by [
Joec
ila S
anto
s da
Silv
a] a
t 05:
23 2
4 N
ovem
ber
2011

3352 J. Santos da Silva et al.
Actes du Colloque PEGI/INSU/CNRS, 22-24/11/1993 (Paris: ORSTOM, IRDEditions).
RAMILLIEN, G., FRAPPART, F., GUNTNER, A., NGO-DUC, T., CAZENAVE, A. and LAVAL, K.,2006, Time variations of the regional evapotranspiration rate from gravity recoveryand climate experiment (GRACE) satellite gravimetry. Water Resources Research, 42,W10403, doi:10.1029/2005WR004331.
RICHEY, J.E., MELACK, J.M., AUFDENKAMPE, A.K., BALLESTER, V.M. and HESS L.L., 2002,Outgassing from Amazonian rivers and wetlands as a large tropical source of atmo-spheric CO2. Nature, 416, pp. 617–620.
RICHEY, J.E., MERTES, L.A.K., DUNNE, T., VICTORIA, R., FORSBERG, B.R., TANCREDI, C.N.S.and OLIVEIRA, E., 1989, Sources and routing of the Amazon River flood wave. GlobalBiogeochemical Cycles, 3, pp. 191–204.
ROCHE, M.A. and FERNANDEZ, C., 1988, Water resources, salinity and salt yields of the riversof the Bolivian Amazon. Journal of Hydrology, 101, pp. 305–331.
RONCHAIL, J., BOURREL, L., COCHONNEAU, G., VAUCHEL, P., PHILLIPS, L., CASTRO, A.,GUYOT, J.L. and DE OLIVEIRA, E., 2005, Inundations in the Mamore basin (south-western Amazon–Bolivia) and sea-surface temperature in the Pacific and AtlanticOceans. Journal of Hydrology, 302, pp. 223–238.
RONCHAIL, J., GUYOT, J.L., VILLAR, J.C.E., FRAIZY, P., COCHONNEAU, G., OLIVEIRA, E.,FILIZOLA, N. and ORDENEZ, J.J., 2006, Impact of the Amazon tributaries on majorfloods at Óbidos. In Climate Variability and Change: Hydrological Impacts, S. Demuth,A. Gustard, E. Planos, F. Scatena and E. Servat (Eds.), pp. 220–225 (Oxfordshire: IAHSPublication Red book 308).
ROTTENBERGER, S., KLEISS, B., KUHN, U., WOLF, A., PIEDADE, M.T.F., JUNK, W. andKESSELMEIER, J., 2008, The effect of flooding on the exchange of the volatile C2-compounds ethanol, acetaldehyde and acetic acid between leaves of Amazonianfloodplain tree species and the atmosphere. Biogeosciences, 5, pp. 1085–1100.
ROUX, E., CAUHOPÉ, M., BONNET, M.-P., CALMANT, S., VAUCHEL, P. and SEYLER, F.,2008, Daily water stage estimated from satellite altimetric data for large river basinmonitoring. Hydrological Sciences Journal, 53, pp. 81–99.
ROUX, E., SANTOS DA SILVA, J., GETIRANA, A.C.V., BONNET, M.-P., MARTINEZ, J.-M.,CALMANT, S. and SEYLER, F., 2010, Producing time series of river water heightby means of satellite radar altimetry: comparison of methods. Hydrological SciencesJournal, 55, pp. 104–120.
SANTOS DA SILVA, J., CALMANT, S., ROTUNNO FILHO, O.C., SEYLER, F. and ROUX, E., 2009,In revision, water level of Amazon wetlands by satellite altimetry. Revista Brasileira deRecoursos Hidrιcos.
SANTOS DA SILVA, J., CALMANT, S., SEYLER, F., ROTUNNO FILHO, O.C., COCHONNEAU, G. andMANSUR, W.J., 2010, Water levels in the Amazon basin derived from the ERS 2 andENVISAT radar altimetry missions. Remote Sensing of Environment, 114, pp. 2160–2181.
SECRETARIAT DE LA CONVENTION DE RAMSAR, 1998, The role of wetlands in the face of theglobal water crisis. In Conférence internationale l’eau et le développement durable, 19–21March 1998, Paris, France.
SEYLER, F., CALMANT, S., SANTOS DA SILVA, J., FILIZOLA, N., COCHONNEAU, G., BONNET,M.-P. and ZOPPAS COSTI, A.C., 2009a, Inundation risk in large tropical basins andpotential survey from radar altimetry: example in the Amazon basin. Marine Geodesy,32, pp. 303–319.
SEYLER, F., CALMANT, S., SANTOS DA SILVA, J., FILIZOLA, N., ROUX, E., COCHONNEAU, G.,VAUCHEL, P. and BONNET, M.-P., 2008, Monitoring water level in large trans-boundaryungauged basins with altimetry: the example of ENVISAT over the Amazon basin.Journal of Applied Remote Sensing, 7150, 715017, doi:10.1117/12.813258.
SEYLER, F., CALMANT, S., SANTOS DA SILVA, J., LEON, J.G., FRAPPART, F., BONNET,M.P., FILIZOLA, N., ROUX, E., COSTI, A.C.Z., DE OLIVEIRA, E., GUYOT, J.L. and
Dow
nloa
ded
by [
Joec
ila S
anto
s da
Silv
a] a
t 05:
23 2
4 N
ovem
ber
2011

Water level dynamics of Amazon wetlands using satellite altimetry 3353
SEYLER, P., 2009b, New perspectives in monitoring water resources in large tropi-cal transboundary basins based on remote sensing and radar altimetry. In ImprovingIntegrated Surface and Groundwater Resources Management in a Vulnerable andChanging Word, G. Blöschl N. Van de Giesen, D. Muralidharan, L. Ren, F. Seyler,U. Sharma and J. Vrba (Eds.), pp. 282–288 (Oxfordshire: IAHS Publication Red Book330).
SEYLER, F., MULLER, F., COCHONNEAU, G., GUIMARÃES, L. and GUYOT, J.L., 2009c,Watershed delineation for the Amazon sub-basin system using GTOPO30 DEM anda drainage network extracted from JERS SAR images. Hydrological Processes, 23,pp. 3173–3185.
SIOLI, H. (Ed.), 1984, The Amazon and its main affluents: hydrography, morphology of theriver courses, and river types. In The Amazon, Limnology and Landscape Ecology of aMighty Tropical River and Its Basin, pp. 127–165 (Dordrecht: Dr. W. Junk).
SIPPEL, S.J., HAMILTON, S.K., MELACK, J.M. and NOVO, E.M.M., 1998, Passive microwaveobservations of inundation area and the area/stage relation in the Amazon Riverfloodplain. International Journal of Remote Sensing, 19, pp. 3055–3074.
STERNBERG, H.O’R., 1975, The Amazon River of Brazil (Wiesbaden: Steiner-Verlag GMBH).TAPLEY, B.D., BETTADPUR, S., WATKINS, M. and REIGBER, C., 2004, The gravity recovery and
climate experiment: mission overview and early results. Geophysical Research Letters,31, L09607, doi:10.1029/2004GL019920.
UNEP, 1996, Wetlands and biological diversity: cooperation between the convention onwetlands of international importance especially as waterfowl habitats (Ramsar,Iran, 1991) and the convention on biological diversity. In Third Ordinary Meetingof the Conference of the Parties to the Convention on Biological Diversity, 4–15November 1996, Buenos Aires, Argentina (UNEP/CBD/COP/3/30). Available onlineat: http://old.cbd.int/doc/meetings/cop/cop-03/official/cop-03-30-en.pdf (accessed 2November 2011).
VALS, 2010, Virtual ALtimetry Station (VALS) Software, Version 0.6.2. Available online at:www.mpl.ird.fr/hybam/outils/logiciels_test.php
VILLAR, J.C.E., RONCHAIL, J., GUYOT, J.L., COCHONNEAU, G., NAZIANO, F., LAVADO, W.,OLIVEIRA, E. and POMBOSAG, R., 2009, Spatio-temporal rainfall variability in theAmazon basin countries (Brazil, Peru, Bolivia, Colombia, and Ecuador). InternationalJournal of Climatology, 29, pp. 1574–1594.
WEHR, T. and ATTEMA, E., 2001, Geophysical validation of ENVISAT data products. Advancesin Space Research, 28, pp. 83–91.
WINGHAM, D.J., RAPLEY, C.G. and GRIFFITHS, H., 1986, New techniques in satellite altime-ter tracking systems. In Proceedings of the 1986 International Geoscience and RemoteSensing Symposium (IGARSS ’86) on Remote Sensing: Today’s Solution for Tomorrow’sInformation Needs (ESA SP–254), 8–11 September 1986, T.D. Guyenne (Ed.), Zürich,Switzerland (Zürich: ESA Publication Division), pp. 1339–1344.
ZELLI, C., 1999, ENVISAT RA-2 advanced radar altimeter: instrument design and pre-launchperformance assessment review. Acta Astronautica, 44, pp. 323–333.
Dow
nloa
ded
by [
Joec
ila S
anto
s da
Silv
a] a
t 05:
23 2
4 N
ovem
ber
2011