ATLAS OF MANGROVE WETLANDS - | India Water Portal
151
ATLAS OF MANGROVE WETLANDS OF INDIA Part 2 - Andhra Pradesh T. Ravishankar L. Gnanappazham R. Ramasubramanian D. Sridhar M. Navamuniyammal V. Selvam M. S. Swaminathan Research Foundation Chennai, India
-
Upload
khangminh22 -
Category
Documents
-
view
2 -
download
0
Transcript of ATLAS OF MANGROVE WETLANDS - | India Water Portal

ATLAS OFMANGROVE WETLANDS
OF INDIA
Part 2 - Andhra Pradesh
T.RavishankarL. GnanappazhamR. Ramasubramanian
D. SridharM.Navamuniyammal
V.Selvam
M. S. Swaminathan Research FoundationChennai, India
r .
M.S. Swaminathan Research Foundation3rd Cross Street, Institutional Area,Taramaru, Chennai - 600 113, India.
Telephone
Fax
:+ 91(44) 22541229+ 91(44) 22541698
: + 91(44) 22351319
[email protected] [email protected]
MSSRF/MG/03/15
March 2004
<9 Government of India, Copyright 2002
• Based on Survey of India map with the permission of the Surveyor General of India.• The responsibility for the correctness of internal details rests with the publisher.• The territorial waters of India extended into the sea up to a distance of 12 nautical milesmeasured from the appropriate base line.
<Q M.S. Swaminathan Research Foundation.
All rights reserved. No part of this publication can be reproduced or transmitted inany form or by any means, without permission.
This Atlas was prepared with the generous support of the India-Canada Environment Facility, New Delhi, through theproject "Coastal Wetlands: Mangrove Conservation and Management".
Printed and Designed fryTTK Healthcare Limited - Printing Division328, GST Road, ChromepetChennai - 600044.
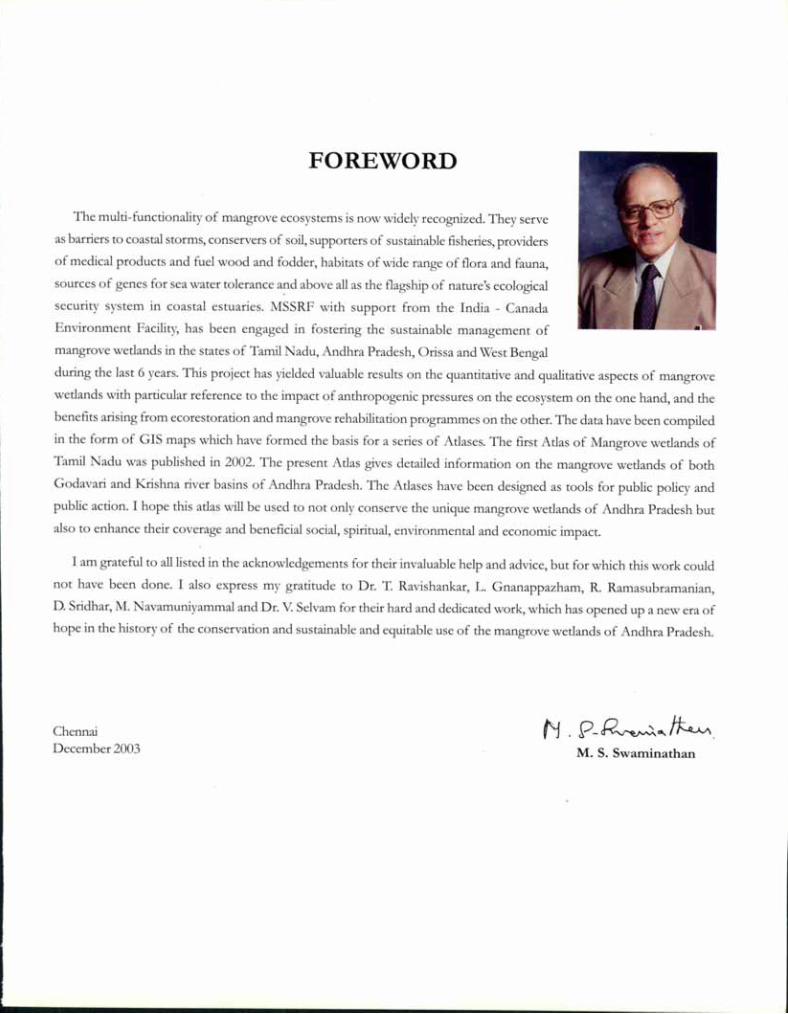
FOREWORD
The multi-functionality of mangrove ecosystems is now widely recognized. They serve
as barriers to coastal storms, conservers of soil, supporters of sustainable fisheries, providers
of medical products and fuel wood and fodder, habitats of wide range of flora and fauna,
sources of genes for sea water tolerance a?d above all as the flagship of nature's ecological
security system in coastal estuaries. MSSRF with support from the India - Canada
Environment Facility, has been engaged in fostering the sustainable management of
mangrove wetlands in the states of Tamil Nadu, Andhra Pradesh, Orissa and West Bengal
during the last 6 years. This project has yielded valuable results on the quantitative and qualitative aspects of mangrove
wetlands with particular reference to the impact of anthropogenic pressures on the ecosystem on the one hand, and the
benefits arising from ecorestoration and mangrove rehabilitation programmes on the other. The data have been compiled
in the form of GIS maps which have formed the basis for a series of Atlases. The first Atlas of Mangrove wetlands of
Tamil adu was published in 2002. The present Atlas gives detailed information on the mangrove wetlands of both
Godavari and Krishna river basins of Andhra Pradesh. The Atlases have been designed as tools for public policy and
public action. I hope this atlas will be used to not only conserve the unique mangrove wetlands of Andhra Pradesh but
also to enhance their coverage and beneficial social, spiritual, environmental and economic impact.
I am grateful to all listed in the acknowledgements for their invaluable help and advice, but for which this work could
not have been done. I also express my gratitude to Dr. T. Ravishankar, L. Gnanappazham, R. Ramasubramanian,
D. Sridhar, M. Navamuniyammal and Dr. V Selvam for their hard and dedicated work, which has opened up a new era of
hope in the history of the conservation and sustainable and equitable use of the mangrove wetlands of Andhra Pradesh.
ChennaiDecember 2003 M. S. Swaminathan
ACKNOWLEDGEMENT
We are grateful to the Forest Department, Government of Andhra Pradesh, for providing facilities for data collectionand ground truthing.
We would like to express our thanks to
•
•••
•
Mr S. K. Das, I.F.S,. Principal Chief Conservator of Forests; Mr . K. Subba Rao, IFS; and Mr . S. D. MukherjeeIFS, former Principal Chief Conservators of Forests;
Mr T. Ramakrishna, IFS; Mr. J. v. K. T. Prabakar Rao, IFS, Mr. Manoranjan Bhanja, IFS, Conservators of Forests .
Mr. K. Ravi Kumar, IFS., Mr. K. Prakasha Rao and Mr. Thatha Rao Deputy Conservators of Forests .
Mr. C. V. Satyanarayana, Shri. M. V. V. Satyanarayana, and Mr. Mallikarjuna Rao, Forest Range Officers, and thestaff of Coringa and Krishna Wildlife Sanctuary
Dr. H M. Kasim and Dr. R. Narayanakumar, Scientists, Central Marine Fisheries Research Institute (CMFRI) Mr.Venkatesh Salagrama, Integrated Coastal Management, Kakinada for their help.
We are grateful to Prof. M.S.Swaminathan, Chairman, MSSRF, for his encouragement, guidance and support in thepreparation of this Atlas. We would like to thank Dr. M. Velayutham, Executive Director, MSSRF, for his guidance andsupport, Prof P.C. Kesavan, Former Executive Director, MSSRF for his support in preparing this Atlas. Mr. S. Krishnakumarand Mr. N. Veerabadrarao, MSSRF, for their valuable contributions in the preparation of maps. The advice andencouragement by Dr. L. R. A. Narayan, Distinguished Fellow, MSSRF, is gratefully acknowledged.
Our thanks are due to Mr. Allen Ferguson and i\lr. Bernard Boudreau, former Directors, of the India-CanadaEnvironment Facility (ICEF), New Delhi; Shri. Ujjwal Choudary, Director, ICEF, Dr. Jaya Chatterji, Senior ProjectOfficer, ICEF; and members of the Joint Project Steering Committee of ICEF, the Project Management Committee, theState Guidance Committee and the Joint Working Groups of the Project for their encouragement and continued support.
We are thankful to Dr. Shailash Nayak, Space Application Centre, Ahmadabad; Dr. C. B. S. Dutt, Scientist, NationalRemote Sensing Agency; Dr. B. R. Subramaniam, Director, Integrated Coastal and Marine Area Management Programme,Department of Ocean Development, Government of India.
We thank the fishers and farmers of eight village level institutions; Mandai officials, Village Sarpanchs of Krishnaand Godavari mangrove areas for their active participation.

CONTRIBUTORS
M.S. Swaminathan Research Foundation
Dr. T. Ravishankar
Dr. R. Ramasubramanian
r-.ls.L. Gnanappazham
Ms. M. Navamuniyammal
Dr. D. Sridhar
Mr. Md. Najeebullah Shariff
.Mr.S. Sankaramurthy
Prof. S. Chelliah
Mr. K. Johnson
Mr. D. Ramakrishna
Mr. M. M. Jeelani
Mr. N. Srinivasa Rao
Dr. Md. Maqbool
Dr. R. Krishnamurthy
Ethnobotanist and Principal Scientist
Mangrove Ecologist
G IS Specialist
G IS Specialist
Mangrove Ecologist
Social Scientist
Former Project Director
Former Project Director
Former Project Officer
Former Hydrogeologist
Former Agronomist
Former Social Scientist
Former Agronomist
Former G IS Specialist
Andhra Pradesh Forest Department
Mr. A.v. Joseph
Mr. Ramesh Kalghatghi
Mr. Hitesh Malhotra
Mr. H.C. 1'lishra
Mr. N. Vaiaprasada Rao
Mr. N. Bhujanga Rao
VII
Conservator of Forests
Conservator of Forests
Additional PCCF
Conservator of Forests
State Silviculurist
Forest Range Officer

CONTENTSPage
FOREWORD ill
ACKNOWLEDGEMENT IV
CONTRIBUTORS V
1. Introduction
1.1 Distribution of Mangroves 2
1.2 Mangroves of India 3
2. Mangrove Wetlands of Andhra Pradesh 5
2.1. Floristic diversity of Mangroves of Andhra Pradesh 5
2.2. Rivers of Andhra Pradesh 8
2.3 Godavari River Basin 8
2.4 Krishna River Basin 12
3 Godavari Mangrove wetland 17
3.1. Geomorphology 17
3.2. Remote sensing imagery 17
3.3 Reserve Forests 20
3.4 Flora of the Mangrove Forest 21
3.5. .Mangrove Species Zonation 27
3.6. Soil properties :Y)
3.7. Hydrological conditions :Y)
3.8. \'V'ood and Fishery resources 39
3.9. Socio-economic condition 43
3.10. Live stock 53
3.11. Land use around mangroves 56
3.12 Dependency 60
3.13. Causes for degradation 67
3.14. Present management practices 68
3.15. Restoration and Redevelopment 69
ix

Page
3.16. Changes in mangrove vegetation between 1975 and 1986 72
3.17. Changes in mangrove vegetation between 1986 and 1998 74
3.18. Changes in mangrove vegetation between 1998 and 2001 74
3.19. Shoreline changes 77
4. Krishna Mangrove Wetland 81
4.1. Geomorphology 81
4.2. Remote Sensing Imagery 81
4.3. Reserve forests 84
4.4. Mangrove Species Zonation 92
4.5. Soil properties 92
4.6. Hydrological conditions 92
4.7. \X'ood and Fishery resources 98
4.8. Socio-economic condition 100
4.9. Land use 112
4.10. Dependency 116
4.11 Causes of degradation 120
4.12. Restoration and Redevelopment 122
4.13 Joint l\langrove Management 123
4.14. Changes in manbtrove vegetation between 1986 and 1996 125
4.15. Changes in mangrove vegetation between 1996 and 2001 127
4.16 Shoreline changes 127
5. Long Term Management 131
REFERENCES 136
x

MAPS
Page.
Map 1.1 Distribution of mangroves in India 4
Map 2.1 Distribution of Mangroves in Andhra Pradesh 7
Map 2.2 Rivers flowing through Andhra Pradesh 9
Map 2.3 Godavari River Basin 10
Map 2.4 River Godavari 11
Map 2.5 Krishna River Basin 13
Map 2.6 River Krishna 14
Godavari Mangrove Wetland
Map 3.1 Geomorphology
Map 3.2 Landsat 5 TM Remote Sensing Imagery of Godavari delta - 1986
Map 3.3 IRS lD LlSS III Remote Sensing Imagery of Godavari delta - 2001
Map 3.4 Reserve Forest
Map 3.5a Mangrove Species Zonation - Coringa Wildlife Sanctuary
Map 3.5b Mangrove Species Zonation - Non Sanctuary Area
Map 3.6 Soil Salinity
Map 3.7 Soil pH
Map 3.8 Soil Phosphorus
Map 3.9 Tidal Amplitude
Map 3.10 Water Salinity
Map 3.11 Water Temperature
Map 3.12 Water Temperature in Kakinada Bay
Map 3.13 Water Salinity in Kakinada Bay
Map 3.14 Fishery Resources - Coringa Wildlife Sancturary
Map 3.15 Mangrove User Villages
Map 3.16a Population - Coringa Wildlife Sanctuary
1\lap 3.16b Population - Non Sanctuary Area
Map 3.17a Occupation - Coringa Wildlife Sanctuary
xi
16
18
19
23
28
29
31
32
33
34
35
36
37
38
40
45
46
47
48
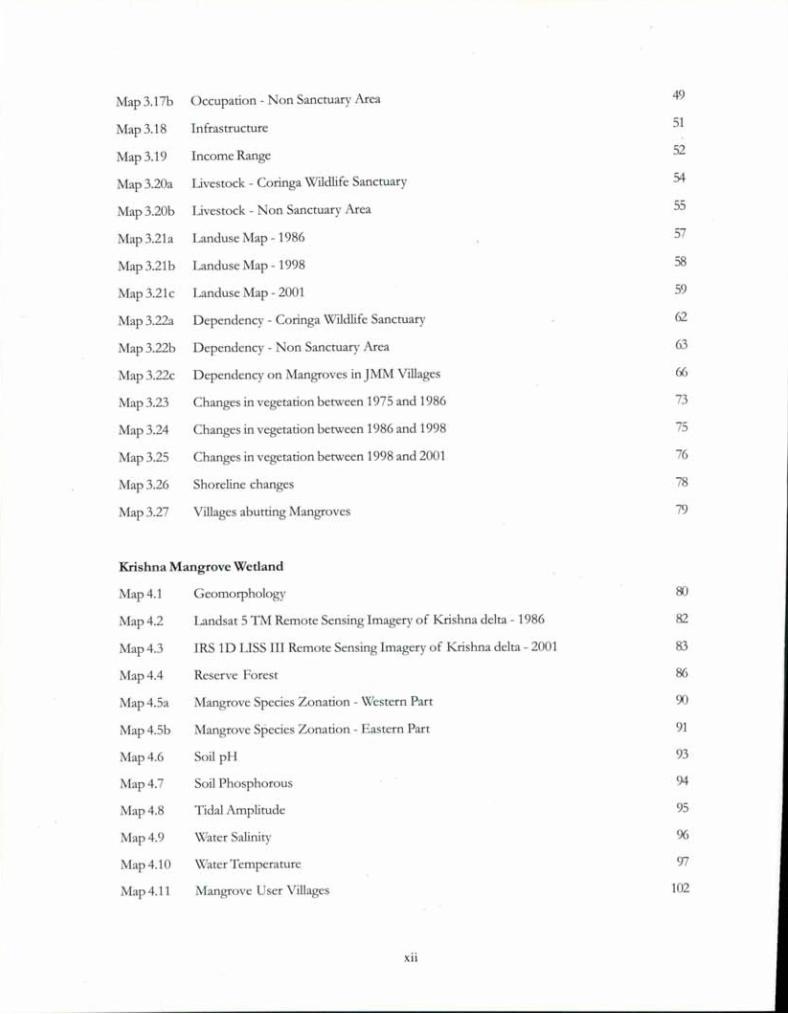
Map3.17b Occupation - Non Sanctuary Area 49
Map3.18 Infrastructure 51
Map 3.19 Income Range 52
Map3.20a IJvestock - Coringa Wildlife Sanctuary 54
Map3.20b IJvestock - Non Sanctuary Area 55
Map3.21a Landuse Map - 1986 57
Map3.21b Landuse Map - 1998 58
Map3.21c Landuse Map - 2001 59
Map3.22a Dependency - Coringa Wildlife Sanctuary 62
Map3.22b Dependency - Non Sanctuary Area 63
Map3.22c Dependency on Mangroves in JMM Villages 66
Map 3.23 Changes in vegetation between 1975 and 1986 73
Map 3.24 Changes in vegetation between 1986 and 1998 75
Map 3.25 Changes in vegetation between 1998 and 2001 76
Map 3.26 Shoreline changes 78
Map 3.27 Villages abutting Mangroves 79
Krishna Mangrove Wetland
Map 4.1
Map 4.2
Map 4.3
Map 4.4
Map4.5a
Map4.5b
Map 4.6
Map 4.7
Map 4.8
Map 4.9
Map4.10
Map4.11
Geomorphology
Landsat 5 TM Remote Sensing Imagery of Krishna delta - 1986
IRS 1D LlSS III Remote Sensing Imagery of Krishna delta - 2001
Reserve Forest
Mangrove Species Zonation - Western Part
Mangrove Species Zonation - Eastern Part
Soil pH
Soil Phosphorous
Tidal Amplitude
Water Salinity
\'(!aterTemperature
Mangrove User Villages
xii
80
82
83
86
90
91
93
94
95
96
97
102

Map4.12a Population - Western Part 104-
Map4.12b Population - Eastern Part 105
Map4.13a Occupation - \X!estern Part 106
Map 4.13b Occupation - Eastern Part 107
Map 4.14 Infrastructure 108
Map4.15 Income Range in JMM Villages 109
lYIap4.16a Livestock - \X!estern Part 110
Map4.16b Livestock - Eastern Part 111
Map4.17a Landuse Map - 1986 113
Map4.17b Landuse Map - 1996 114
Map4.17c Landuse Map - 2001 115
Map4.18a Dependency - Western Part 118
Map4.18b Dependency - Eastern Part 119
Map4.19 Villages abutting Mangroves 124
Map 4.20 Changes in vegetation between 1986 and 1996 126
Map 4.21 Changes in vegetation between 1996 and 2001 128
Map 4.22 Shoreline changes 129
TABLES
Table 1
Table 2
Table 3
Table 4
Table 5
Table 6
Table 7
Table 8
Table 9
Table 10
Estimates of mangrove areas given by various authors
Area of Mangrove Vegetation in Coastal States of India
Mangrove species found in Andhra Pradesh
Reserve Forest areas in Godavari Wetland
Particulars of Fishing Craft and Fish landing near Coringa Mangroves (2001-2002)
Mangrove User Villages in Godavari
Details of Restoration and Manb'iove Management Units - Godavari
Changes in Manb'iove Area (in ha)
Mangrove User Villages in Krishna
Details of Restoration and Mangrove Management Units - Krishna
XIII
2
3
5
20
41
44
71
74
101
123

EDC
RRA
PRA
MSSRF
MMU
JrvIM
JFM
FD
VSS
RF
VU
IRS
LISS
1M
IUCN
FSI
ABBREVIATION
Eco-Development Committee
Rapid Rural Appraisal
Participatory Rural Appraisal
M. S. Swaminathan Research Foundation
Mangrove Management Unit
Joint Mangrove Management
Joint Forest Management
Forest Department
Vana Samrakshana Samithi
Reserve Forest
Village Level Institution
Indian Remote Sensing Satellite
Linear Image Self Scanning System
Thematic Mapper
International Union for the conservations of Nature and Natural resources
Forest Survey of India
xiv
ATLAS OF MANGROVE WETLANDS OF INDIA
Part 2 - Andhra Pradesh

CHAPTER 1
Introduction
Mangroves are plants that occur along the inter- tidal zones of tropical and subtropical areas between 32° Nand38° S, mostly on the eastern coast of continents. l\Iangrove forests cover the areas between low and highwater levels. The plant communities of the mangrove wetlands are able to survive in estuarine conditions and
adapt to the environment tllrough unique characteristics - stilt roots, viviparous seeds, salt glands, salt-excluding mechanism,thick cuticles (wax coated leaf surfaces), leathery leaves and pneumatophores (roots for breathing).
They perform many protective, productive and economic functions. Mangrove forests near estuarine areas act as abarrier against cyclones and mitigate their effects. They prevent storm water from entering the mainland and prevent soilerosion along the coastal areas. Mangrove wetlands serve as spawning and nursery grounds for many economicallyimportant estuarine/marine fishes and shellfishes; their impact on ecology is equally significant: they harbour manyresident and migratory birds.
Though the mangrove ecosystem is highly productive and has multiple uses, mangroves suffered serious neglect tillvery recently. They are undergoing widespread degradation due to a combination of physical, biological, anthropogenicand social factors. Human-induced stresses and factors - such as unscientific management practices, changes in waterquality, soil salinity, diversion of fresh water upstream, and conversion of mangrove wetlands for aquaculture, salt pansand other land use practices - have reduced mangrove vegetation. The reduction in fresh water flow into the mangroveecosystem has generated conditions of hypersalinity, and reduced the transportation of sediments that would create newareas for mangrove extension. Species diversity is declining with the increase in salinity; this is manifest from theextinction of many low saline tolerant mangrove species. Mangrove wetlands have also been degraded by indiscriminatedestruction of mangrove resources and clear-felling of mangrove forest. Recently, unsustainable collection of prawnseeds for supply to aqua farms has affected prawn and fishery resources in mangrove wetlands. Result: fishery recruitmentlevels have fallen, and the livelihoods of local fishermen have been affected.
2
1.1. Distribution of Mangroves
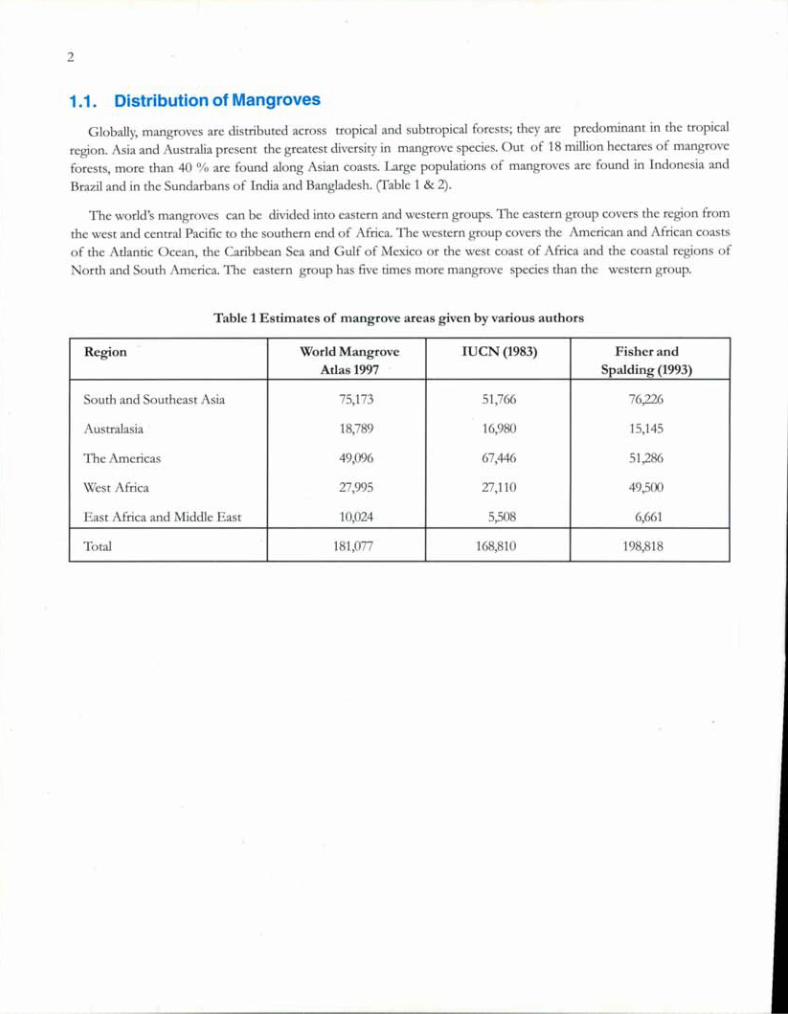
Globally, mangroves are distributed across tropical and subtropical forests; they are predominant in the tropicalregion. Asia and Australia present the greatest diversity in mangrove species. Out of 18 million hectares of mangroveforests, more than 40 % are found along Asian coasts. Large populations of mangroves are found in Indonesia andBrazil and in the Sundarbans of India and Bangladesh. (fable 1 & 2).
The world's mangroves can be divided into eastern and western groups. The eastern group covers the region fromthe west and central Pacific to the southern end of Africa. The western group covers the American and African coastsof the Atlantic Ocean, the Caribbean Sea and Gulf of Mexico or the west coast of Africa and the coastal regions ofNorth and South America. The eastern group has five times more mangrove species than the western group.
Table 1 Estimates of mangrove areas given by various authors
Region World Mangrove IUCN (1983) Fisher andAtlas 1997 Spalding (1993)
South and Southeast Asia 75,173 51,766 76,226
Australasia 18,789 16,980 15,145
The Americas 49,096 67,446 51,286
West Africa 27,995 27,110 49,500
East Africa and J'v1iddleEast 10,024 5,508 6,661
Total 181,077 168,810 198,818
3
1.2. Mangroves of India
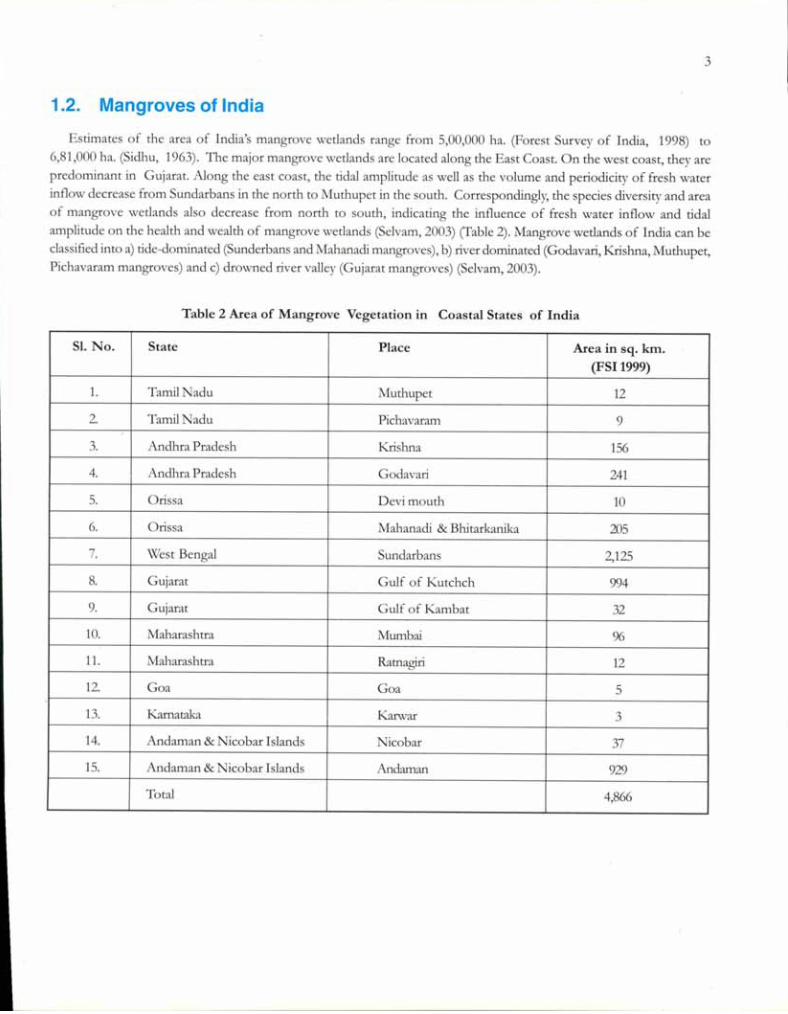
Estimates of the area of India's mangrove wetlands range from 5,00,000 ha. (Forest Survey of India, 1998) to6,81,000 ha. (Sidhu, 1963). The major mangrove wetlands are located along the East Coast. On the west coast, they arepredominant in Gujarat. Along the east coast, the tidal amplitude as well as the volume and periodicity of fresh waterinflow decrease from Sundarbans in the north to Muthupet in the south. Correspondingly, the species diversity and areaof mangrove wetlands also decrease from north to south, indicating the influence of fresh water inflow and tidalamplitude on the health and wealth of mangrove wetlands (Selvam, 2003) (Table 2). Mangrove wetlands of India can beclassified into a) tide-dominated (Sunderbans and Mahanadi mangroves), b) river dominated (Godavari, Krishna, Muthupet,Pichavaram mangroves) and c) drowned river valley (Gujarat mangroves) (SeIvam,2003).
Table 2 Area of Mangrove Vegetation in Coastal States of India
S1. No. State Place Area in sq. km.(FSI1999)
1. Tamil Nadu Muthupet 12
2. Tamil Nadu Pichavaram 9
3. Andhra Pradesh Krishna 156
4. Andhra Pradesh Godavari 241
5. Orissa Devi mouth 10
6. Orissa Mahanadi & Bhitarkanika 205
7. West Bengal Sundarbans 2,125
8. Gujarat Gulf of Kutchch 994
9. Gujarat Gulf of Kambat 32
10. Maharashtra Mumbai %
11. Maharashtra Ratnagiri 12
12. Goa Goa 5
13. Karnataka Karwar 3
14. Andaman & Nicobar Islands Nicobar 37
15. Andaman & Nicobar Islands Andaman 929
Total 4,866

Map 1.1 Distribution of Mangroves in India
150 Km
'0.\)
N
A150 0~--
AN
Bayo!
Bellgal
I
I B t: TT"
SIIIIdarbansBllitarkanika
'MahanadiDevi MOllth
c
Godamri
o
o
o 0o 0o."0
Sea
Arahiall
Indian Ocean
CHAPTER 2
Mangrove Wetlands of Andhra Pradesh
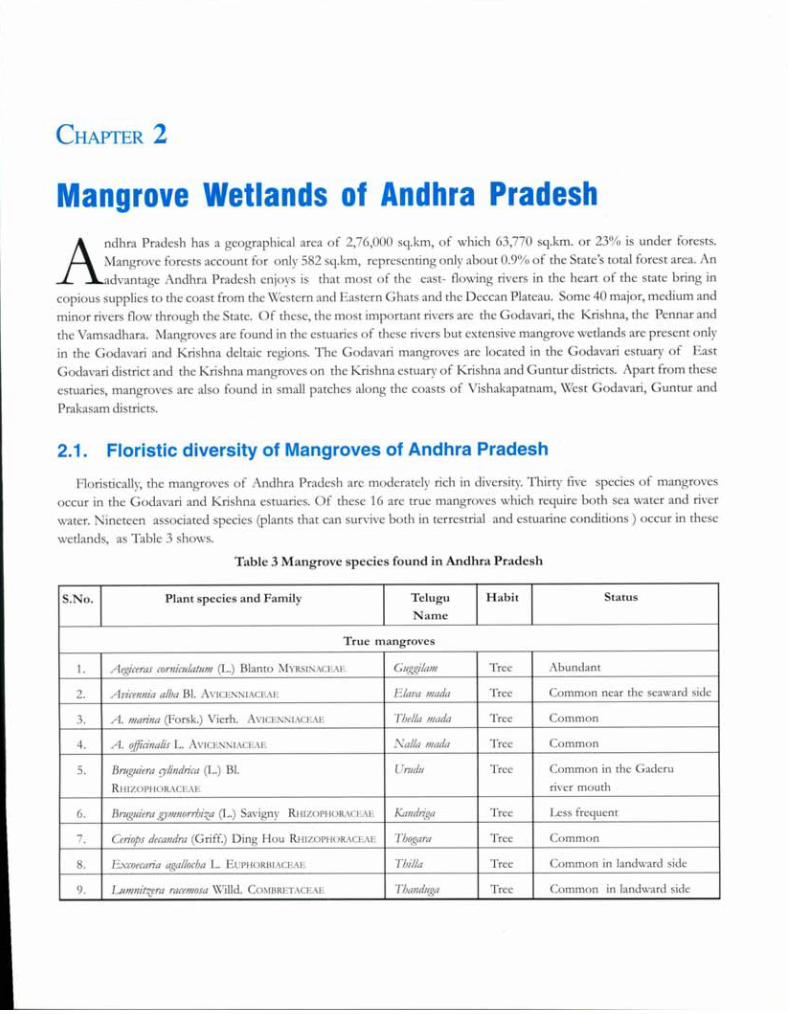
Andhra Pradesh has a geographical area of 2,76,000 sq.km, of which 63,770 sq.km. or 23% is under forests.Mangrove forests account for only 582 sq.km, representing only about 0.9% of the State's total forest area. Anadvantage Andhra Pradesh enjoys is that most of the east- Howing rivers in the heart of the state bring in
copious supplies to the coast from the Western and Eastern Ghats and the Deccan Plateau. Some 40 major, medium andminor rivers flow through the State. Of these, the most important rivers are the Godavari, the Krishna, the Pennar andthe Vamsadhara. Mangroves are found in the estuaries of these rivers but extensive mangrove wetlands are present onlyin the Godavari and Krishna deltaic regions. The Godavari mangroves are located in the Godavari estuary of EastGodavari district and the Krishna mangroves on the Krishna estuary of Krishna and Guntur districts. Apart from theseestuaries, mangroves are also found in small patches along the coasts of Vishakapatnam, West Godavari, Guntur and
Prakasam districts.
2.1. Floristic diversity of Mangroves of Andhra Pradesh
Floristically, the mangroves of Andhra Pradesh are moderately rich in diversity. Thirty five species of mangrovesoccur in the Godavari and Krishna estuaries. Of these 16 are true mangroves which require both sea water and riverwater. Nineteen associated species (plants that can survive both in terrestrial and estuarine conditions) occur in thesewetlands, as Table 3 shows.
Table 3 Mangrove species found in Andhra Pradesh
S.No. Plant species and Family Telugu Habit Status
Name
True mangroves
1. Aegiceras comiclllalllllJ (L.) Blanto l\[YRSINACE,\E GIIggilalll Tree Abundant
2. At'icel1llia alba Bl. AVICENNIACEAE Elm'a lIIada Tree Common near the seaward side
3. A. lIIa/illa (Forsk.) Vierh. AVICENNIACE,\E Thelia iliad a Tree Common
4. A. ojJicillalis L. AVICENNIACEAE 1Valla iliad a Tree Common
5. Bmglliera c:ylilldtica (L.) Bl. Ul7ldll Tree Common in the Gaderu
RlflZOl'llORACEAE river mouth
6. 13mglliera g)'lIIllorrbiza (L.) Savigny RHIZOI'HORACI,,\E Mlld,iga Tree Less frecjuent
7. Celiops decalldra (Griff.) Ding Hou RHIZOI'HORACE,\E Tbogara Tree Common
8. Excoecaria agallocba L. EUI'HORBIACEAE Thilla Tree Common in landward side
9. uIJ)lIIi1zera racelllosa \\1il1d. COMBRETACEAE Tballdllga Tree Common in landward side

6
S.No. Plant species and Family Telugu Habit Status
Name
10. Rhizophora apimlata Bl. RHIZOPHORACEAE Ponna Tree Abundant
11. R mllcronata Lamk. RHIZOPHORACEAE Ponna Tree Less common
12. Sryphiphora /!)drop/!)llacea Gaertn. f. - RUBIACEAE Narathandl/ga Tree Rare and Endemic
13. Sonneratia alba J. Smith SONNERATIACEAE Pedha Kalinga Tree Rare
14. S. apetala Buch. -Ham SONNERATIACEAE Kalinga Tree Common
15. Xylocarplls granatllm Koen. J\fELlACEAE Senl/ga Tree Rare - Occurs only in
Krishna Mangroves
16. X. moll/ccel/sis (Lamk.) J\1. Roem. MELIACEAE Sel/I/ga Tree Rare
Mangrove Associates
17. Acanthlls ificijohils L. l\CANTHACEAE Alfchi Shrub Common in less saline areas
18. Aeluroplls lagopoides (L.) Trin POACEAE - Herb
19. Caesalpinia msta L. CAESALPINIACEAE Rakkisi Vine Common in less saline areas
20. ClerodendmllJ ine17JJeGaertn. VERBANACEAE Pisingi Tree Common
21. Dalbergia spinosa Roxb. FABACEAE Chillinga Shrub Common in less saline areas
22. Derns trifoliata Lour. FABACEAE Nalla theega Vine Common in less saline areas
23. Fimbnstyhs jermginea (L.) Vahl. CYPERACEAE - Herb Low saline areas near riverbanks
24. Hibisms tifiamls L. MALVACEAE Attaka !Jara Tree Common in landward side
25. Ipomoea pes-caprae (L.) Sweet CONVOLVULACEAE - Vine Common in sandy shores
26. Ipomoea tuba L. CONVOLVULACEAE Thellateega Vine Common in less saline areas
27. Mynostac0'a llJigbtiana (Nees ex.Steud)
Hook. f. POACEAE Dhabba gaddi Herb Common in less saline areas
28. Porteresia coarctata (Roxb.) Tateoka POACEAE Yeiligaddi Herb Along the river mouths and
accreted areas
29. Salicornia brachiata Roxb. CHENOPODlACEAE - Herb Common in degraded areas
30. SarcolobllS cannatus Wall. ASCLEPIADACEAE Balaboddi theega Vine Common
theega
31. SeslllJill1lJportulacastrtl1JJ (L.) L. AIZOACEAE - Herb Common in sandy areas
32. SlIaeda mantima (L.) Duman CHENOPODlACEAE Elakura Herb Common in degraded areas
33. S. t1lldiflora (\X1illd.) Moq. CHENOPODlACEAE Elak"ra Herb Common in deb'Taded areas
34. Tamanx trollpii Hole T AMARIACEAE Palitdll Tree Only in Rathikalava RF
35. Thespesia popl/lneoides (Roxb.) Kastel MALVACEAE GangllrmJi Tree Common in landward side
Map2.1Distribution
ofMangroves
inAndhraPradesh
INDIA
N A
ORISSA
50Km
BayofBengal
a50
••.•HENNAI
PRAKASAM
MAHARASHTRA
KARNATA
KA
KARNATAKA
~.l~
-.)
_._.........
c..:..::.
\....
L.
'(
.1Ir'-'\.-..,-.
L..
I'I
._.J
\."".
~.\)
'")
.,',
ADILAB
.,...
~:')
~'_.
AD
)J
.....,/
))
,.
'J'
.)(
).('.
'",
••••~....
J.•••~-J-~
\..I
\~.J"\
.,(
~y\_
\"CHHATTISGARH.-i
~'J"~"
._\
'-/',
\'-,l
.-'
J./.r
"\.~.
Y./
".•..•"
)'"
'=\'OJ
/-......;
"",--
\.---
.J)K
ARIMNAGAR
j'-'.:...,...,-
's'VIZIANAGARAM
(SRIKAKULA
..~I~IZAMABAD
('....-,(~,""
I!...
.\(.
.""'
'7'-I
.r!~
I\
Jen/
)"
(j
't•...•.•\..
/~~.~\
)....__....
('\,'
.r'
'J'/..1
~1-\
'-.(....•.f
\--',
(v'"v\
/'I)
,,2;,.
(',-,(
c-)
I.
r'_.....)
l,"-oJ
r•./(
}r'
r->
(,J
I.......
:--...........
_//-_.1..
.r(\..
rc:.-'
/MEDAK
/WARANGAL.
(1!/',..
L"I
~.
LI
\L
"""
,~~N'.j
.-':
_J)-"",
...•~•..•l
/'-.
.~/
(~~VISHAKHAPATNAM
~.r
<..(,
\--I
~"'
J/
L-~,
..__..."
/\
....,
IEAST'
~-""':~
\..1'--...•\
"r...•.~
.•......••.•.......•.
,\
~('"\'"
.~.'\....,
(RANGARED[ll'\"H,t""'ERABAD
'\/~,/J
KHAMMAM
r-!
GODAVAR(
>I
r(
Y,-
(,.'-(,N
t'((r\
~D
-(•\J-
J
~I
(••••
'\~
',r\..1'-_.l.
iC)
--,~~)
NALGONDA
}'....,-\~v"
.-_.....
,)
~)
r,J'\...~
).~r
,.,.../\-\
f~
)/_
.•..(:..J'MAHBUBNAGAR
~--",
(-•..--;..',
,\--
\.,.._~/I
,\
Il
f"rr-...•.-..,.•..)\,
~._._._....
1I
..,
J\
,,_/'-
__,..-
(0'-'-1.
)C,AND
HRA
iPRADES
H-<
I~.
KURNOOL)
)I
..r-_/.--
..J'\._:.-...
'1-1 \.-,
)'1._.1
\'"/'I
J..----,----"
':rJ
f"!J1..•••
..JJ
~l_"J
.J/\
\NELLORE
)\....
)
i(/
I.\..
ANANTAPUR\f
-\/
'\
<..r'~"\.
'......
..•;.:......
''1")~
'-~CUDDAPAH"
'->.1.
i"~
\(.
"'"\'~':"
?,I
~:toL
('v)
....l~l
~-(.
'"!L.--:'t)
.r'.r''"'.
(ooJ
-l,.""\J--'.I"-".•••.,
r"'~..Jl...."',
'r.r-
(.s".t."'-
.r-Jl".
__"..)
<••.••....
-l".
l'-i
CHITIOOR
f'"\
!......•..~
~."'\.-""':l'..--'
l.-./.-",
~..1".-•.•.•...•
'-.>
.I..,
r--.J",.fr
.....'".i
.....:
v-'"I'
TAMIL
NADU
8
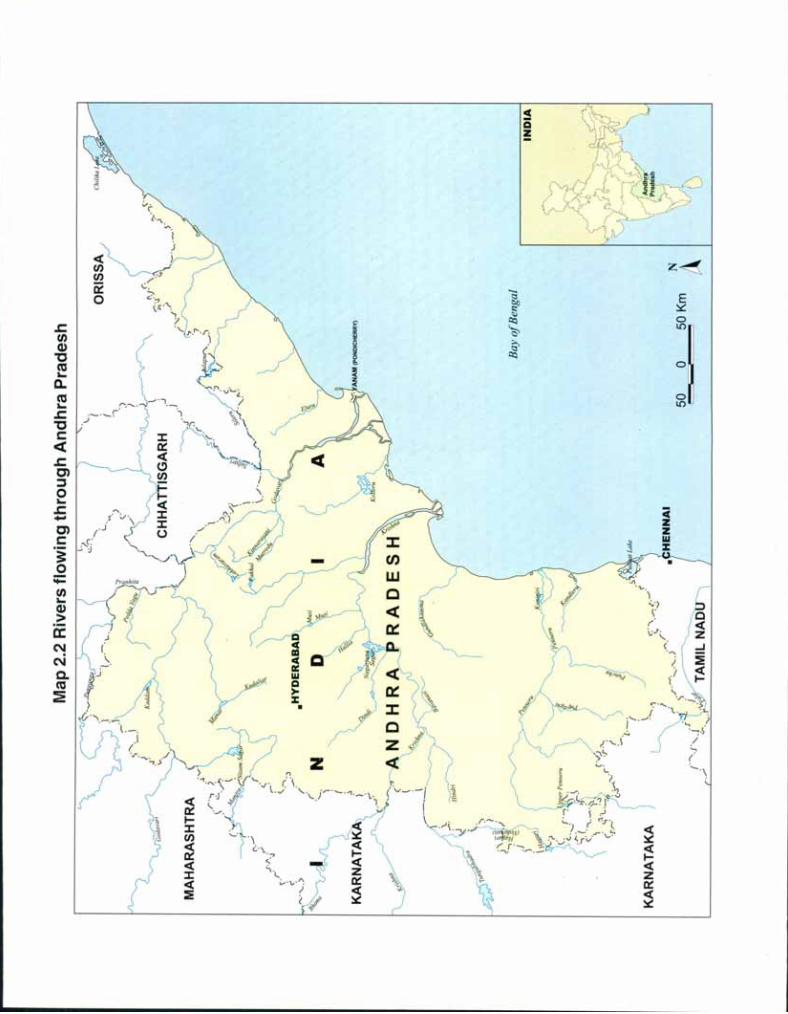
2.2. Rivers of Andhra Pradesh
The Godavari
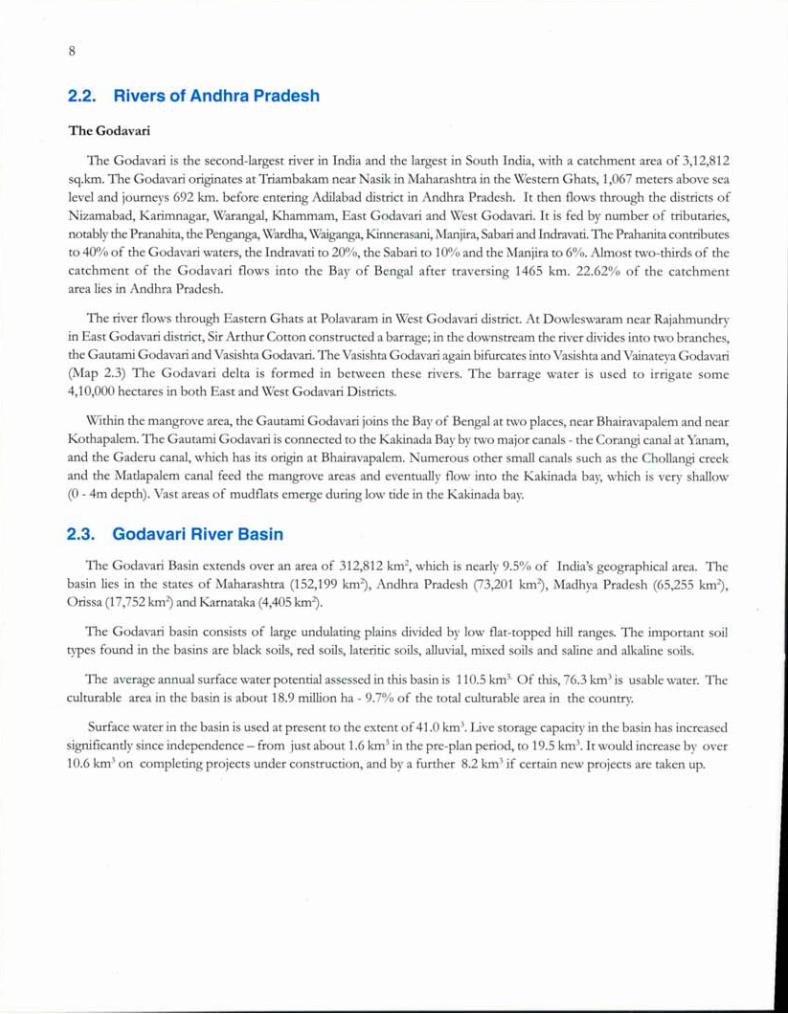
The Godavari is the second-largest river in India and the largest in South India, with a catchment area of 3,12,812sq.km. The Godavari originates at Triambakam near Nasik in Maharashtrain the Western Ghats, 1,067 meters above sealevel and journeys 692 km. before entering Adilabad district in Andhra Pradesh. It then flows through the districts ofNizamabad, Karimnagar, Warangal, Khammam, East Godavari and West Godavari. It is fed by number of tributaries,notably the Pranahita, the Penganga, Wardha, Waiganga, Kinnerasani, :Manjira, Sabari and Indravati. The Prahanita contributesto 40% of the Godavari waters, the Indravati to 20%, the Sabari to 10% and the Manjira to 6%. Almost two-thirds of thecatchment of the Godavari flows into the Bay of Bengal after traversing 1465 km. 22.62% of the catchmentarea lies in Andhra Pradesh.
The river flows through Eastern Ghats at Polavaram in West Godavari district. At Dowleswaram near Rajahmundryin East Godavari district, Sir Arthur Cotton constructed a barrage; in the downstream the river divides into two branches,the Gautarni Godavari and Vasishta Godavari. The Vasishta Godavari again bifurcates into Vasishta and Vainateya Godavari(J'vlap 2.3) The Godavari delta is formed in between these rivers. The barrage water is used to irrigate some4,10,000 hectares in both East and West Godavari Districts.
\V'ithin the mangrove area, the Gautarni Godavari joins the Bay of Bengal at two places, near Bhairavapalem and nearKothapalem. The Gautami Godavari is connected to the Kakinada Bay by two major canals - the Corangi canal at Yanam,and the Gaderu canal, which has its origin at Bhairavapalem. Numerous other small canals such as the Chollangi creekand the Matlapalem canal feed the mangrove areas and eventually flow into the Kakinada bay, which is very shallow(0 - 4m depth). Vast areas of mudflats emerge during low tide in the Kakinada bay.
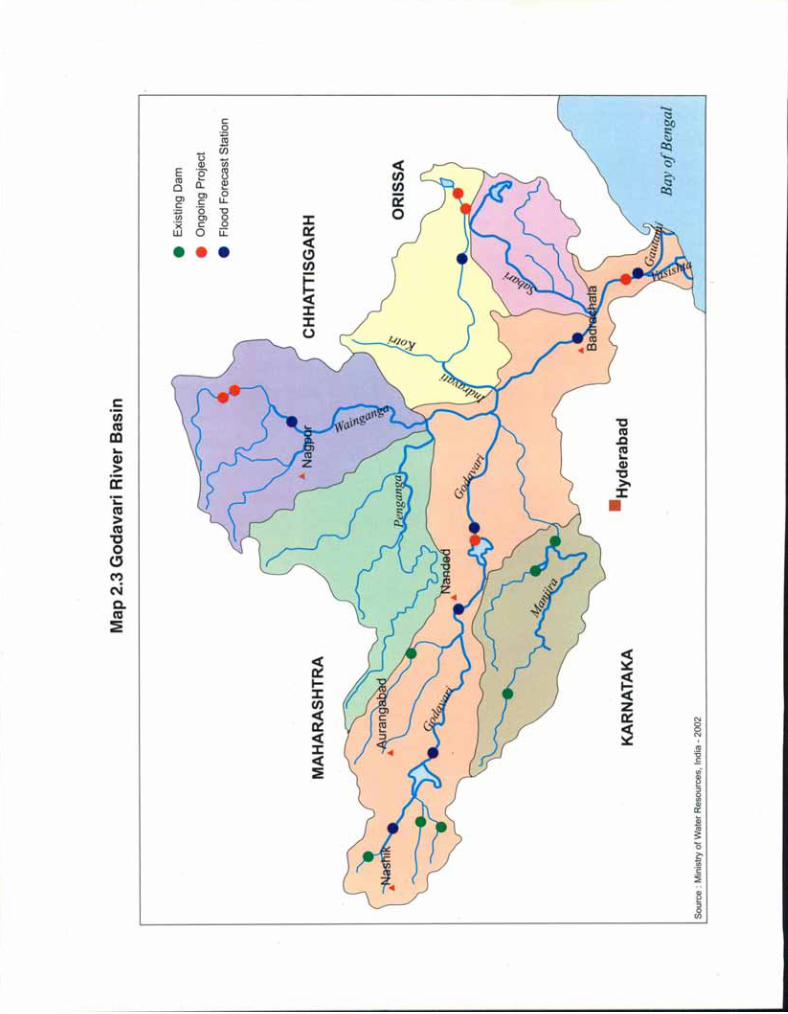
2.3. Godavari River Basin
The Godavari Basin extends over an area of 312,812 km2, which is nearly 9.5% of India's geographical area. Thebasin lies in the states of Maharashtra (152, 199 km~, Andhra Pradesh (73,201 km~, Madhya Pradesh (65,255 km~,Orissa (17,752 km~ and Karnataka (4,405 km~.
The Godavari basin consists of large undulating plains divided by low flat-topped hill ranges. The important soiltypes found in the basins are black soils, red soils, lateritic soils, alluvial, mixed soils and saline and alkaline soils.
The average annual surface water potential assessed in this basin is 110.5 km3. Of this, 76.3 km3 is usable water. Theculturable area in the basin is about 18.9 million ha - 9.7% of the total culturable area in the country.
Surface water in the basin is used at present to the extent of 41.0 km3. Live storage capacity in the basin has increasedsignificantly since independence - from just about 1.6 km3 in the pre-plan period, to 19.5 km3• It would increase by over10.6 km3 on completing projects under construction, and by a further 8.2 km3 if certain new projects are taken up.
KARNATAKA
INDIA
N A
ORISSA
50Km
BayofBengal
a50 ~
\... ( ; ., ') ? ~ ).J!
J ? r
l~ c..:..:""'.
" L. >
~ISGARH
•••HENNAI
Map2.2RiversflowingthroughAndhraPradesh
'"~M
L.l.r.-.•...J
~Iht
J Q~
~
MAHARASHTRA
('\.~ ;-
!'/'.j
r~. ~
"""'"'-.'.>
,Q>?••.~
•••
MAHA
RASH
TRA
KARN
ATAK
A
Source:
Ministry
ofWater
Resources,India-2002
Map
2.3GodavariRiverBasin
-Hyderabad
•ExistingDam
•Ongoing
Project
•FloodForecast
Station
CHHA
TTIS
GARH
ORIS
SA
BayofBengal

11
Discharge of Godavari Water into the Mangroves
Data on water discharge at the Dowleswaram barrage, obtained for the period 1969-1998, revealed that there is nosignificant variation in the discharge. However, monthly discharge data showed that the peak flow was during thesouthwest monsoon, because most of the catchment area receives rain then. The discharge starts declining during thenortheast monsoon; in summer, the discharge is almost negligible.
Map 2.4 River Godavari
Source: National Remote Sensing Agency, Hyderabad
12
The Krishna
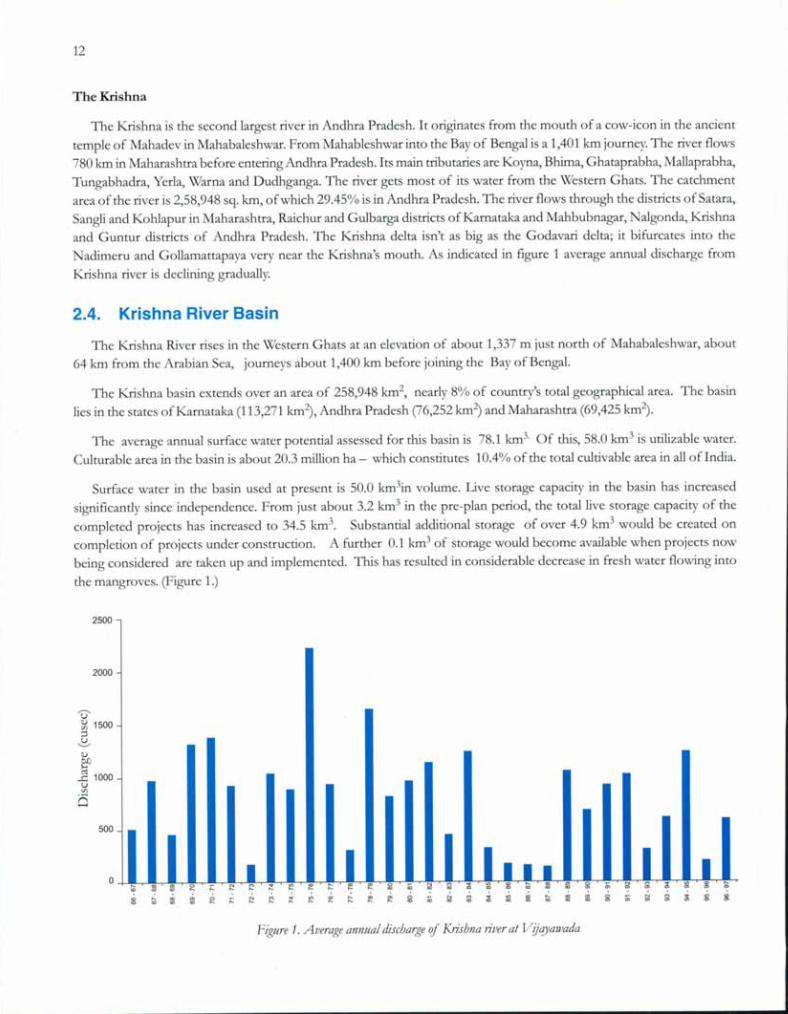
The Krishna is the second largest river in Andhra Pradesh. It originates from the mouth of a cow-icon in the ancienttemple of Mahadev in Mahabaleshwar. From Mahableshwar into the Bay of Bengal is a 1,401 km journey. The river flows780 km in Maharashtra before entering Andhra Pradesh. Its main tributaries are Koyna, Bhima, Ghataprabha, Mallaprabha,Tungabhadra, Yerla, Warna and Dudhganga. The river gets most of its water from the Western Ghats. The catchmentarea of the river is 2,58,948 sq. km, of which 29.45% is in Andhra Pradesh. The river flows through the districts of Satara,Sangli and Kohlapur in Maharashtra, Raichur and Gulbarga districts of Karnataka and Mahbubnasrar, Nalgonda, Krishnaand Guntur districts of Andhra Pradesh. The Krishna delta isn't as big as the Godavari delta; it bifurcates into theNadimeru and Gollamattapaya very near the Krishna's mouth. As indicated in figure 1 average annual discharge fromKrishna river is declining gradually.
2.4. Krishna River Basin
The Krishna River rises in the Western Ghats at an elevation of about 1,337 m just north of Mahabaleshwar, about64 km from the Arabian Sea, journeys about 1,400 km before joining the Bay of Bengal.
The Krishna basin extends over an area of 258,948 km2, nearly 8% of country's total geographical area. The basinlies in the states of Karnataka (113,271 km2), Andhra Pradesh (76,252 km~ and Maharashtra (69,425 km2).
The average annual surface water potential assessed for this basin is 78.1 km3. Of this, 58.0 km3 is utilizable water.Culturable area in the basin is about 20.3 million ha - which constitutes 10.4% of the total cultivable area in all of India.
Surface water in the basin used at present is 50.0 km3in volume. Live storage capacity in the basin has increasedsignificantly since independence. From just about 3.2 km3 in the pre-plan period, the total live storage capacity of thecompleted projects has increased to 34.5 km3. Substantial additional storage of over 4.9 km3 would be created oncompletion of projects under construction. A further 0.1 km3 of storage would become available when projects nowbeing considered are taken up and implemented. This has resulted in considerable decrease in fresh water flowing into
the mangroves. (Figure 1.)
2500
2000
'U'~ 1500;::l~eo11000uV'l
6500
0N:0 ill fll 0
'"'" '"ill '" ill fll 0 ;:::'" '"
"':ii
Figure 1. Average annual discharge of Krishna river at VijqyaJlJada

•••Kolapur
KAR
NATA
KA
Source:
Ministry
ofWater
Resources,India-2002
Map
2.5KrishnaRiverBasin
ExistingDam
Ongoing
Project
FloodForecast
Station
BayofBengal

Map 2.6 River Krishna

15
ThePennar
The Pennar, also known as Uttara Pinakini, enters Anantapur district of Andhra Pradesh after traversing 40 km fromthe Nandidurg hills of Mysore. Confluence into the Bay of Bengal occurs 29 km north of Nellore. The importanttributaries of the Pennar are jayamangali, Chitravati, Kunderu, Papagni, Sagileru, Cheyyuru, Boggeru and Biraperu.
The Vamsadhara
The Vamsadhara is the biggest of the river systems flowing from the Eastern Ghats into Bay of Bengal, and traversesmostly through Srikakulam district. Originating in Orissa, it runs through the Pulbani and Rayagada districts of Orissaand the Srikakulam district of Andhra Pradesh for 250 km. Its catchment area is 41,400 sq.km.
Rainfall
. The rainfall in Andhra Pradesh is influenced by both the southwest and northeast monsoons. The southwest monsoonOune-September) provides the bulk of rainfall (68.5%), while the northeast monsoon of October-December accountsfor 22.3%. The rest (9.2%) of the rainfall is received during winter and summer months. The influence of the southwestmonsoon (602.26 mm) is predominant in coastal Andhra Pradesh; the northeast monsoon here provides 316.8 mm ofrainfall. In the East Godavari district, the average total rainfall is about 1,160 mm (Figure 2). Average maximum andminimum temperatures recorded in Kakinada are 32.360 C and 24.40 C respectively.
This region has a tropical humid climate with the monsoon season commencing in june and extending up to December.The area receives a copious supply of freshwater during the southwest and northeast monsoons. Salinity during thisperiod is very low (-5 ppt). From january, the weather is mainly dry and there is a steady progression in heat till thesummer months (March to May).
15
10
III>.coC
5
o
Monthly Mean Rainy days • Monthly Mean Rainfall
400
300
E200 ~
~c'iiiII::
100
oJan. Mar. May MonthsJul. Sep. Nov.
Figure 2. Rail!fall (111111) and the nUlI/ber if rairry dtrys in Tallarevtl mandaI, East Godavari disl1ict, 1998 - 2002
J

Map 3.1 Geomorphology
@ Government ofindia Copyright 2002.Based upon Survey ofindia map with the permission of the Surveyor General of India.The responsibility for the correctness of Internal details rests with the publisher.The territorial waters of India extend into the sea to a distance of twelve nauticalmiles measured from the appropriate base line.
CD -@ Reserve Forests
Legend
IIMangroveD Mudflat
D Terrestrial Land
D Sand
IIAquaculture/Salt pan
D Coastal Vegetation
D Beach ridge
2Kmo
N
A
Bayof
Bengal
Spit
Kakinada Bay
/

CHAPTER 3
Godavari Mangrove Wetland3.1 Geomorphology
The geomorphology of the Godavari estuarine area (Map 3.1) shows the following features: rivers and channels,flood plain, natural levees, mangrove forest, tidal channels, tidal flats, lagoon, Kakinada Bay, sand spit, main land beachand sand dunes and paleo sand ridges. Natural levees of Godavari delta is well developed, which is about 500 m in wideand 2 m about the flood plain near Doweleswaram area. In the mangrove areas its width varies from 3 to 5 m and about1 m in height. This prevents free flow of tidal water in some of the mangrove areas. The Kakinada Bay is anotherimportant geomorphological features of Godavari region, which appears to be compound and consists of estuariesadjoining lagoon. Sediments are brought into the bay are mostly silty clays and the finest and purest muds are depositedin the protected and deeper parts of the Bay. !\[ost of the fine turbid material that has been in suspension along the floodtide is deposited on the tidal flats during the slack of high tide and these areas are suitable for colonization of newmangroves. I t has been observed that rapid deposition of sediments has been taking place at the confluences of thedistributaries of Godavari in general and of the Goutami in particular resulting in the formation of number of spits.Among them, the sand spit of Kakinada Bay including Hope Island is very interesting. According to the British AdmiraltyChart the sand spit did not exist in 1857 but the 1878 chart shows the budding of this sand spit which has now grown tolength of about 17 km with a head of about 5 km and tail of 12 km (Mishra, 1999). It protects the mangroves from oceancurrents and forms a sheltered coastline. In the non-sanctuary area River water flow has decreased substantially in theKothapalem mouth and change in the direction of the flow has led to the formation of sand bars near the river mouth.
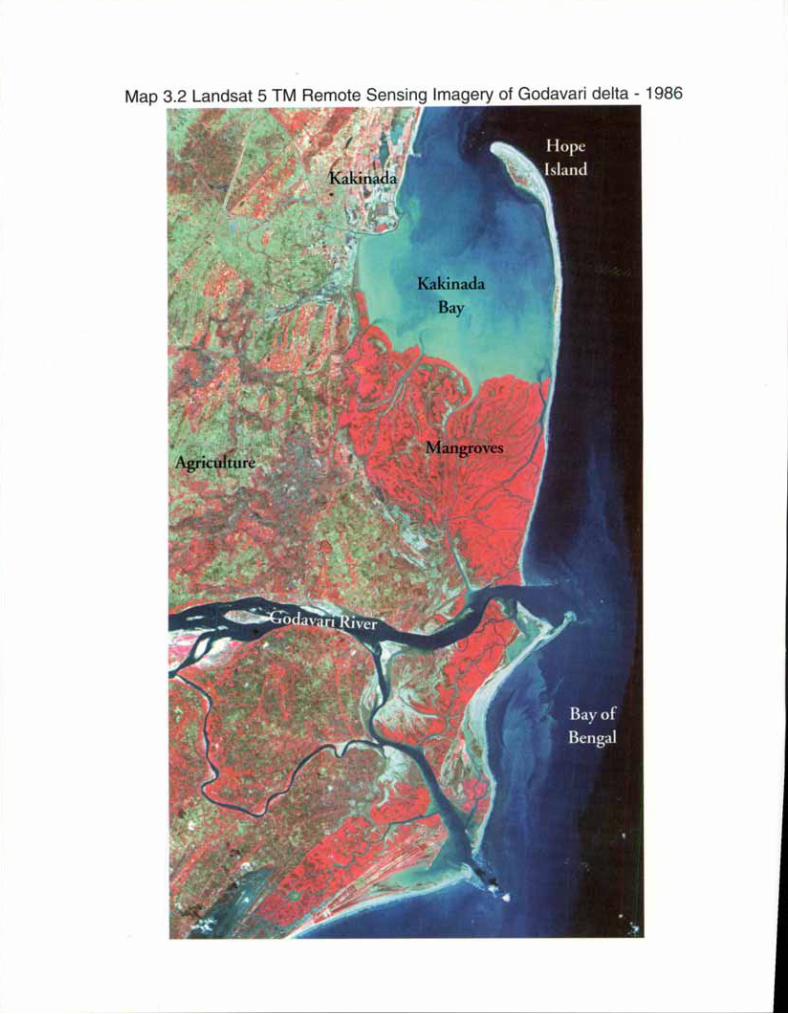
3.2 Remote Sensing Imagery
Imagery from the Indian Remote Sensing Satellite (IRS) 1 D Linear Image Self-Scanning System (USS) III was usedto map the various land uses near the Godavari mangrove wetland.
The smooth bright red color indicates the dense mangrove forest of the delta. Density of mangrove cover is greaterin the sanctuary area than in the non-sanctuary area that lies to its south. The small creeks and drainage system of thewetland can be clearly identified from remote sensing data. As we proceed toward the mainland beyond the ReservedForest (RF) boundary, rel:,'Ularsquare or rectanl:,'Ular blocks in bluish gray or dark blue seen are aquaculture farms (Map3.3) which is not practiced during 1986 (Map 3.2). A very wide spread of agricultural area is identified in red color whichare identified as paddy fields and plantations. The shallow depth of the Kakinada bay is clearly seen as light blue darkensto blue in the direction of the sea. The temporal remote sensing data of the Godavari delta is used to monitor changes inthe wetland. It enables the development of different thematic maps.
Map 3.2 Landsat 5 TM Remote Sensing Imagery of Godavari delta - 1986

,
Map 3.3 IRS 1D L1SS III Remote Sensing Imagery of Godavari delta - 2001
20
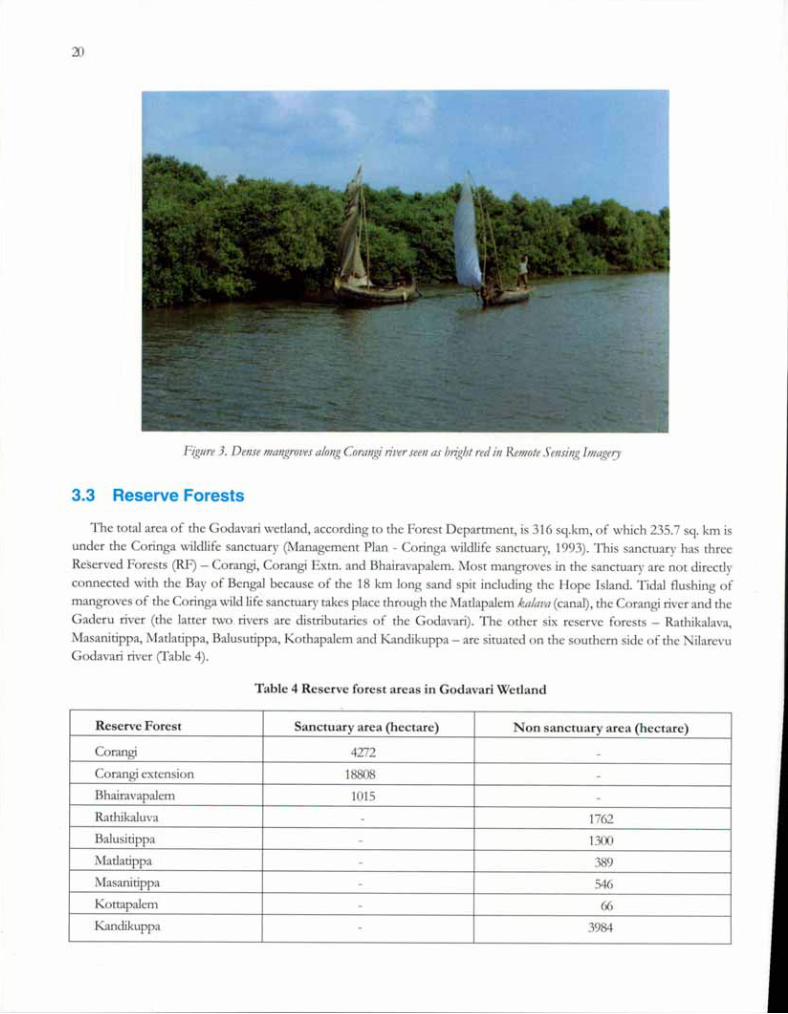
Figure 3. Dense llIangroves along Corangi 17'/Jerseen as blight red in RellIote Sensing IllIage!)'
3.3 Reserve Forests
The total area of the Godavari wetland, according to the Forest Department, is 316 sq.km, of which 235.7 sq. km isunder the Coringa wildlife sanctuary (Management Plan - Coringa wildlife sanctuary, 1993). This sanctuary has threeReserved Forests (RF) - Corangi, Corangi Extn. and Bhairavapalem. Most mangroves in the sanctuary are not directlyconnected with the Bay of Bengal because of the 18 km long sand spit including the Hope Island. Tidal flushing ofmangroves of the Coringa wild life sanctuary takes place through the Matlapalem kalava (canal), the Corangi river and theGaderu river (the latter two. rivers are distributaries of the Godavari). The other six reserve forests - Rathikalava,Masanitippa, Matlatippa, Balusutippa, Kothapalem and Kandikuppa - are situated on the southern side of the NilarevuGodavari river (fable 4).
Table 4 Reserve forest areas in Godavari Wetland
Reserve Forest Sanctuary area (hectare) Non sanctuary area (hectare)
Corangi 4272 -
Corangi extension 18808 -
Bhairavapalem 1015 -
Rathikaluva - 1762
Balusitippa - 1300
Matlatippa - 389
Masanitippa - 546
Kottapalem - 66
Kandikuppa - 3984

21
Figure 4. MallgrrJl'es alollg Mat/apalell/ callal
3.4 Flora of the mangrove forest
Vegetation in the Corangi RF indicates that Al'icellllia Il/arilla and Excoecal7'a agallocba are the dominant species. Along thecreeks of Corangi river near Ramannapalem and 1\Iatlapalem, /leall/bus i/icifolius, i\'!;'lioJ/ac0ta IJligb/ialia are seen, along withassociated species like Tbespesia populneoides, HibisC/ls /iliacetlJ and Clerodendmlll inert/If. Suaeda II/mi/ill/a and S. lIudifiora arecommon in degraded and partially degraded areas. In elevated areas where the soil is highly saline, the presence ofSalicomia bracbia/a has been recorded, as also the presence of /lcall/bus i/ici{olius and Dalbergia spillosa and climbers such asIpoll/oea tuba, Sarcolobus calilla/us, Caesalpillia Clis/a, alld Dems /ri{olia/a. LUll/lii/zera racell/osa, Excoeeana agalloc/;a and /lllicelllliaIl/milla are found in the elevated areas. The mangrove species Rhizopbora apiCtlla/a, ){yloearpus ll/oluccellJis, /3mguiera qlilld,ica,Celiops deealldra and /3mguiera gyll/llorrbiza are rarely found.
Figure 5. Mallgrolles alollg Ra/ikalalla callal

22
Figure 6. Dense mangroves near the Corangi river mouth
In Corangi Extension RF the areas along the Matlapalem creek and Gaderu creek are thick with vegetation. Excoecmiaagallocha is the dominant species while Avicennia marina ranks next. The average height of the mangroves is about 4.5m.The zonation is not that conspicuous in the Gaderu riverside. On the eastern side of the Gaderu river, species such asBmguiera gy/llnorrhiza, B. rylindn'ca, RJ]izophora apiCtilata, R. mucronata and Xylocarpus moluccensis have been recorded. Thesespecies are either rare or absent in the Matlapalem canal side. Sonneratia alba has been recorded near the Gaderu rivermouth, whereas species such as Acanthus ilicijolius, Myriostacl!ya IJJightiana, and Fimbristylis jermginea have been recordedalong the creeks. Suaeda species and Salicornia brachiata have been found in degraded areas. SesuvitllJl portulacastnll" is alsoabundant in this RF along with l3mgtliera rylindrica near the Gaderu river.
Almost all species except Sryphiphora /!ydrop/!yllacea have been recorded In Bhairavapalem RF. Excoecmia agallocha,Avicennia marina, A. rfjicinalis, Aegiceras corniCtilattim are the abundant species in this reserve forest. Rhizophora apiCtilata, R.l1It1cronata,
Figure 7. l'-'langrove vegetation in Corangi RF
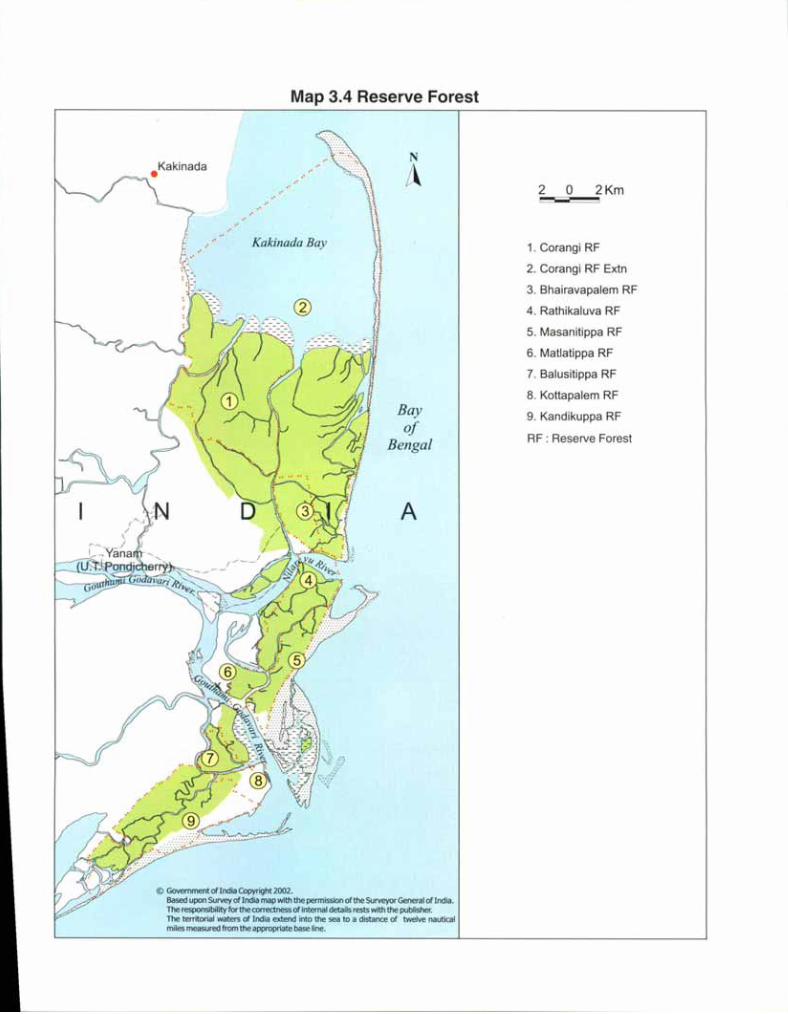
Map 3.4 Reserve Forest
@ Govemment of India Copyright 2002.Based upon Survey of India map with the permission of the Surveyor General ofIndia.The responsibility for the correctness ofintemal details rests with the publisher.The territorial waters of India extend into the sea to a distance of twelve nauticalmiles measured from the appropriate base line.
A
N
i~2 0 2Km__ ===os
Kakinada Bay 1. Corangi RF
2. Corangi RF Extn
3. Bhairavapalem RF
@ 4. Rathikaluva RF
5. Masanitippa RF
6. Matlatippa RF
7. Balusitippa RF
8. Kottapalem RFBay 9. Kandikuppa RFof
RF : Reserve ForestBengal
24
>{ylocarp"s molllccensis, Jonneratia apetala, Bmglliera g)'mnorrbiza and B. rylindnca are seen along the creeks. Other species suchas - Derris triftliata, Sarcoloblls cminatlls, Clerodendrtflt/ inerme and Dalbergia spinosa have also been recorded. The soil of thisRF is clayey near the Gaderu river, and sandy clay near the seaside. SlIaeda spp. is noticed in degraded areas.
In Rathikalava RF RNzopbora apimlata, R. IIII/cronata,>{ylocarplls lIlolllccensis,Bmglliera l':Y"lIIorrbiza, AZ'icennia mmina, A.rifftcinalis and E::x:coecanaagallocba are the species that occur. Trees of Rhizopbora and Bmglliera are seen along the creeks.RJ]izopbora trees are about 4 - 6m in height. Large trees of Avicetlllia rfjicinalis are found in the RF. Tamanx trollpii, amangrove associate, is recorded in this RF along with Tbespesiapop"lmoides. HibisCtfs liliacells, Clerodendmm inerme, SlIaeda spp.and Jalicornia bracbiata occur in degraded areas. Also observed in degraded areas is stunted growth of Excoecana agallocbaand LII/llnitzera racemosa and Prosopis invasion along the Saleru canal.
In Masanitippa RF tall trees about Sm in height of Rhizopbora apiClilata and R. ""ICfYJnataare seen along the creeks.Avicetlllia mmina, Excoecmia agallocba are the dominant species in this RF. Jonneratia apetala, Bmglliera g)'mnorrbiza, Celiopsdecandra, LII/llnitzera racemosa and Bmglliera rylindtica are also recorded in this RF. Large areas of mangroves are found tooccur outside the RF on the Bay of Bengal side, which faces severe erosion due to oceanic currents and tidal action.Prosopis is also noticed in this area.
In Matlatippa RF fairly dense vegetation is found on the eastern side. The western side is elevated; further, there areno creeks to supply tidal water. Hence a large area on this side is degraded. The Forest Department has restored theseareas. Species such as Sonlleratia apetala, Rhizopbora apiClilata, Bmguiera g)'mnorrbiza, Avicennia manila, Avicennia q{ficinalis,Avicennia alba, LIIII/nitzera racemosa, Celiops decandra and >{ylocarplls II/olllccensishave been recorded in this RF. Also recorded- climbers like Derns tnfoliata and Jarcoloblls cminatlls; grasses such as Pm1eresia coarctata and Mynostacl!}a lI'igbtiantl; andshrubs like Dalbergia spinosa and Acantblls ilicijolills.
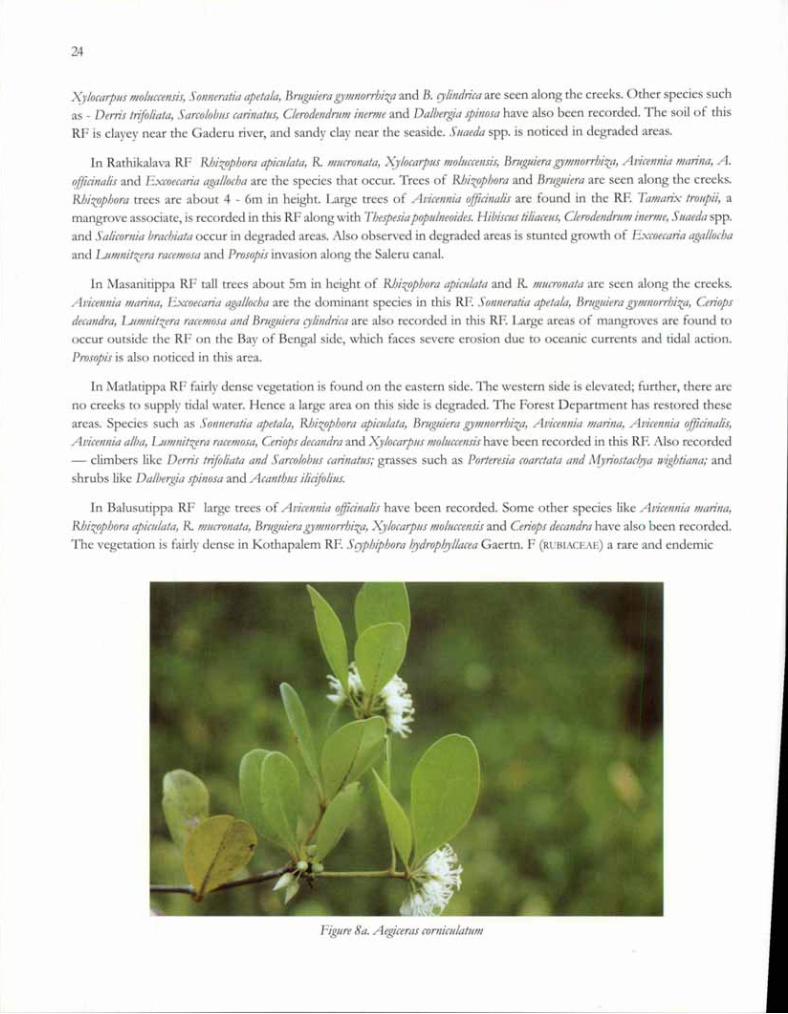
In Balusutippa RF large trees of AZ'icennia r!f[icinalishave been recorded. Some other species like Avicennia matina,RJ]izopbora apiClilata, R. /lJucronata, Bmglliera g)'l1/norrbiza, >{ylocarp"s molllccensisand Cenops decandra have also been recorded.The vegetation is fairly dense in Kothapalem RF. S0pbipbora 0'dropl?),llaceaGaertn. F (RUBIACEAE) a rare and endemic
Figure 8a. Aegiceras corniClilatllm
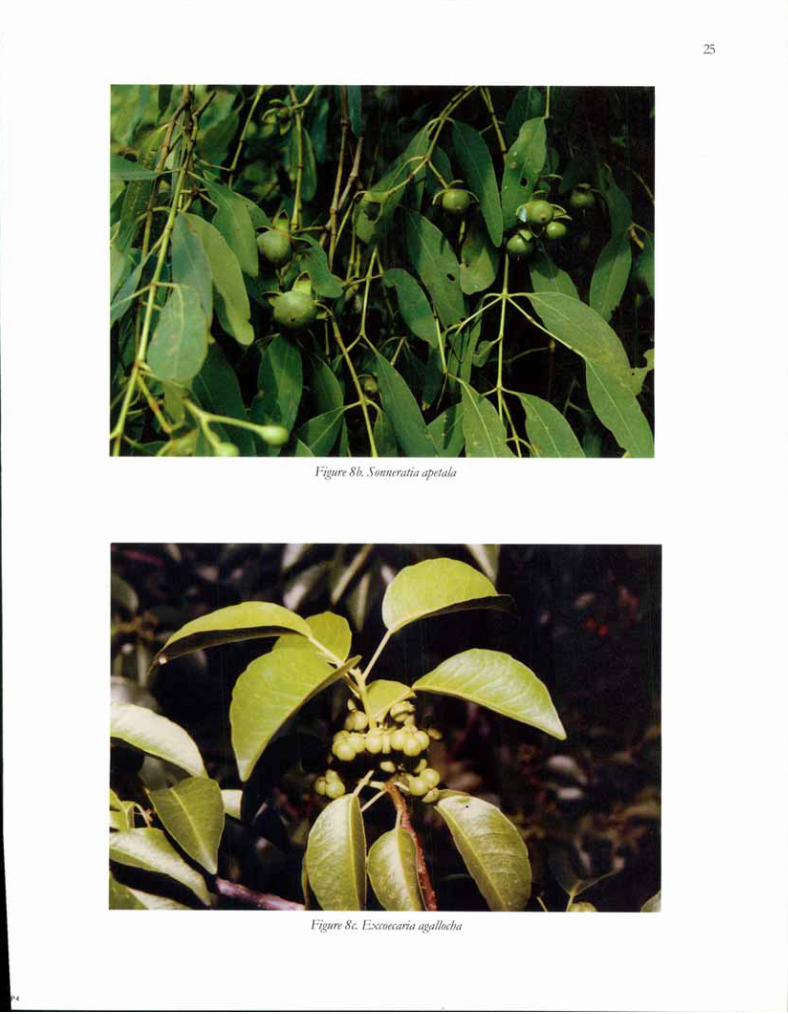
Figure 8/;. SOl/neratia apetala
Figure Sr. ExcoecaJia agallocba
25

26
Figtlre 8d. Bmgtliera gylJlllorrbiza
species, has been recorded in this RF. Plants of the species are about two metres tall. About a hundred of them havebeen found near the Sacramento lighthouse. Along the entire East Coast it occurs only in this RF. Excoecaria agallocba,LlIlJIllitzera racelJlosa, RlJizoplJora apiCIIlata, R. flll(crollata, XYlocarpus lJIoltlccensis, Bmgtliera gylJlllorrlJiza, AZlicenllia fflan'lla and A.qJ]icillalis have also been recorded: they are about 4 - Sm in height. Climbers such as Derris trifoliata and Sarcolobtls carillattlshave also been recorded, as also shrubs like Dalbergia spillosa, Clerodendn/!fI illerlJle and herbs such as Suaeda and Salicornia.
In Kandikuppa RF mangroves are notable for their health and rich diversity. True mangroves - such as RIJizoplJoraapimlata, R. IJItlCrollata, Bmgtliera gylllllorrbiifl, Celiops decalldra, XYlocarpus lJIoltlccensis- are found in the RF. Excoecaria agalloclJa,Al'icellllia lJIan'lla, Al'ice111zia ifficillalis alld LUlJlllitzera racelJlosa have also been recorded in this RF.
Fig/(re 8e. S rypIJipbora /!}drop/!}llacea - a rare lJIallgrove
27
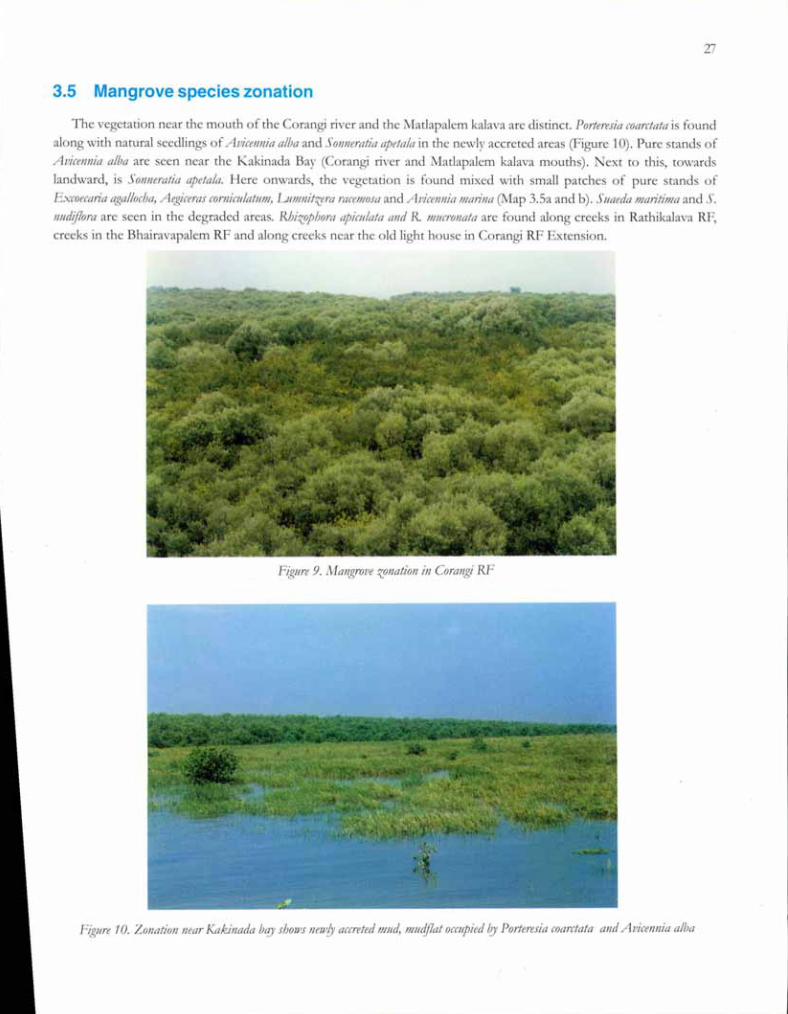
3.5 Mangrovespecies zonation
The vegetation near the mouth of the Corangi river and the Matlapalem kalava are distinct. P011eresia coaretata is foundalong with natural seedlings of A1Jicelillia alba and SOlllleratia apeta/a in the newly accreted areas (Figure 10). Pure stands ofAvicemlia a/ba are seen near the Kakinada Bay (Corangi river and Matlapalem kalava mouths). Next to this, towardslandward, is SOlllleratia apeta/a. Here onwards, the vegetation is found mixed with small patches of pure stands ofExcoecaria aga//ocba, Aegiceras comim/atllJJJ, LlIll/nitzera racell/osa and Avicellniall/atilla (Map 3.5a and b). Suaeda !!1atitilJla and S.Iludiflora are seen in the degraded areas. Rbizopbora apim/ata alld R II/!Icrollata are found along creeks in Rathikalava RF,creeks in the Bhairavapalem RF and along creeks near the old light house in Corangi RF Extension.
rlgure 9. Alangrove zonation ill Corallgi RF
Figure 10. ZOllatioll near Kakillada bqy Sb01IJSIlellJD'accreted Il/ud, lJIu1f/at oCCllpiedby P01teresia coarctata alld Avicellllia alba
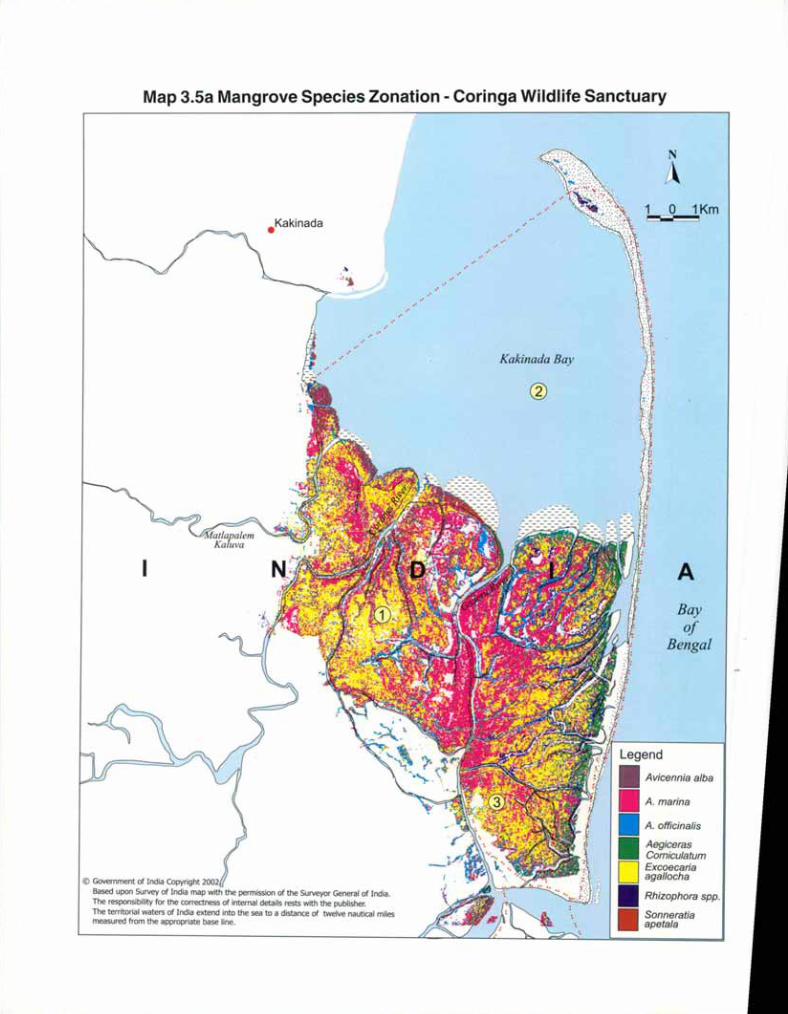
Map 3.5a Mangrove Species Zonation - Coringa Wildlife Sanctuary
ABayof
Bengal
N
A
Avicennia alba
AegicerasComiculatumExcoecariaagallocha
Rhizophora spp.
Sonneratiaapetala
!".Kakinada Bay
,''' ..,....
.Kakinada
@ Government of India Copyright 2002Based upon Survey of India map with the permission of the Surveyor General of India.The responsibility for the correctness of internal details rests with the publisher.The territorial waters of India extend into the sea to a distance of twelve nautical milesmeasured from the appropriate base line.

Map 3.19 Income Range
2Kmo2
Bayof
Bengal
A
Kaf..:inada Bay Legend (Rs. per annum)
1II6000 - 12000II12000 - 18000@
..;,...:..:. ... D 18000 - 24000
@ Government ofIndia Copyright 2002.Based upon Survey ofIndia map with the permission of the Surveyor General ofIndia.The responsibility for the correctness of internal details rests with the publisher.The territorial waters of India extend into the sea to a distance of twelve nauticaimiles measured from the appropriate base line.

Map 3.18 Infrastructure
@ Government of India Copyright 2002.Based upon Survey of India map with the permission ofthe Surveyor General of India.The responsibility for the correctness of internal details rests with the publisher.The territorial waters of India extend into the sea to a distance of twelve nauticalmiles measured from the appropriate base line.
Legend•• Bank
• FD Guest house
~ Ferry
2Kmo2
A Fish landing centre-~
Lighthouse
5 Middle/High school
D Police Station
+ Primary health centre
Temple
'Y Veterinary hospital
m Post office
N
A
A
Bayof
Bengal
Kakinada Bay
r.:t.
A-.•.
Chollangi
50
Infrastructure
Most of the villages are well-connected by road. Almost all of them are equipped with cyclone shelters, primaryschools, and post offices. Corangi has a police station, Forest Department guest house and engineering college. A highschool, junior college, bank, primary health center and mandaI (adminis"rrative office) are found in Tallarevu. Twolighthouses one at Kakinada and another near Kothapalem - are active, an abandoned lighthouse is found near Gaderuriver mouth. An FD guest house is located in the Kandikuppa Reserved Forest near Kothapalem lighthouse (Map 3.18).
Income
The RRA conducted in Manl:,trove user villages indicate in general, that incomes in the Godavari manl:,trove area rangefrom Rs. 6,000 to 18,000 per year. Incomes of entire families in Bhairavalanka village range from Rs.6,000 to Rs.12,000 peryear. In Matlapalem, 14 families have incomes ranging between Rs.18,000 and Rs.24, 000; 18 families earn between Rs12,000 and Rs. 18,000 and other 18 Families earn below Rs. 12,000. In Dindu, 46 families earn between Rs.6,000 andRs.12,000 and four families between Rs.12,000 and Rs.18,000. In Kobbarichcttupeta, 79 families earn between Rs.12,000
and Rs.18,000 (Map 3.19).
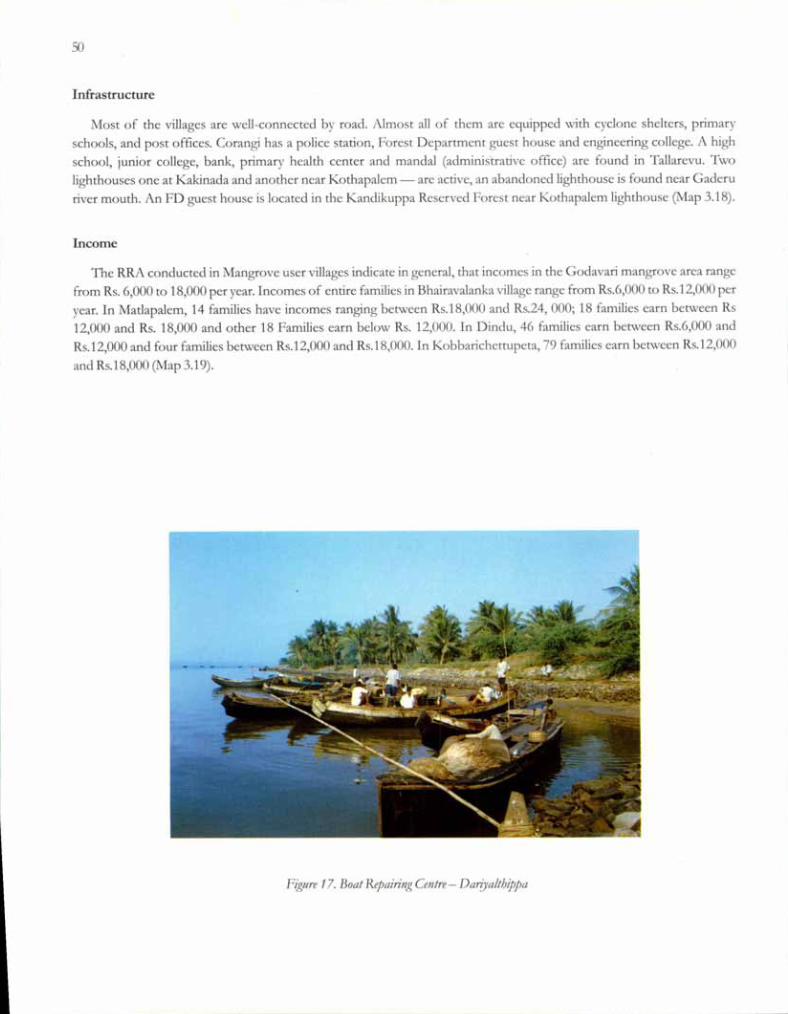
Figure 17. Boat Repailing Centre - Dariyalthippa

Legend
~ Agriculture
IIFishingPopulation~4000U 500
GAP7
Map 3.17b Occupation- Non Sanctuary Area
...Mallavaram
•••• • •• ••
@ Government of India Copyright 2002.Based upon Survey of India map with the permission of the Surveyor General of India.The responsibility for the correctness of internal details rests with the publisher.The territorial waters of India extend into the sea to a distance of twelve nautical milesmeasured from the appropriate base line.
N
o
Bayof
Bengal
1Km
A
Map 3.17a Occupation - Coringa Wildlife Sanctuary
Bayof
Bengal
A
N
A1 0 1Km~===s
Legend
~ Agriculture
IIFishingPopulation
(I 8000
\{Y 300
Kakinada Bay
.Kakinada
• •••••••••••••••
• .•• p j adalp,ef ..... ' ....
Uppulanka'" -i.. ..' .--\ .".-:1.
@ Government of India Copyright 2002Based upon Survey of India map with the permission of the Surveyor General of India. GeramThe responsibility for the correctness of internal details rests with the publisher.The territorial waters of India extend into the sea to a distance of twelve nautical milesmeasured from the appropriate base line.

N
A
A
1 0 1Km~--
Bayof
Bengal
Legend
Population
_ Households
ooooN
o8 Babanagar'"~ g . A
GadlmogaooC')
8 Mallavaramo '"
o .'0 ..c:::l
....N
Map 3.16b Population - Non Sanctuary Areaooo
@ Government of India Copyright 2002.Based upon Survey of India map with the permission of the Surveyor General of India.The responsibility for the correctness of internal details rests with the publisher.The territorial waters of India extend into the sea to a distance of twelve nautical milesmeasured from the appropriate base line.

Map 3.16a Population - Coringa Wildlife Sanctuary
1Km
ABayof
Bengal
Households
Population
N
A1 0:---.
.....
Kakinada Bay
o(0
.•.Polekuru.•.Mallavaram ...
Gopalapuram
.Kakinada
oooN
Chollangi .•.
LONC")
oo"""
oo
oooN
!t
o00C")LO
ooo
oooco
@ Government of India Copyright 2002Based upon Survey of India map with the permission of the Surveyor General of India.The responsibility for the correctness of internal details rests with the publisher.The territorial waters of India extend into the sea to a distance of twelve nautical milesmeasured from the appropriate base line.
Map 3.15 Mangrove User Villages
Legend
Metalled RoadUnmetalled RoadCart TrackFoot Path
2Kma2
N
A
A
Bayof
Bengal
Kakinada Bay
@ GovernmentofIndia Copyright 2002.Based upon Survey of India map with the permission of the Surveyor General of India.The responsibility for the correctness of internal details rests with the publisher.The territorial waters of India extend into the sea to a distance of twelve nauticalmiles measured from th,eappropriate base line.
44
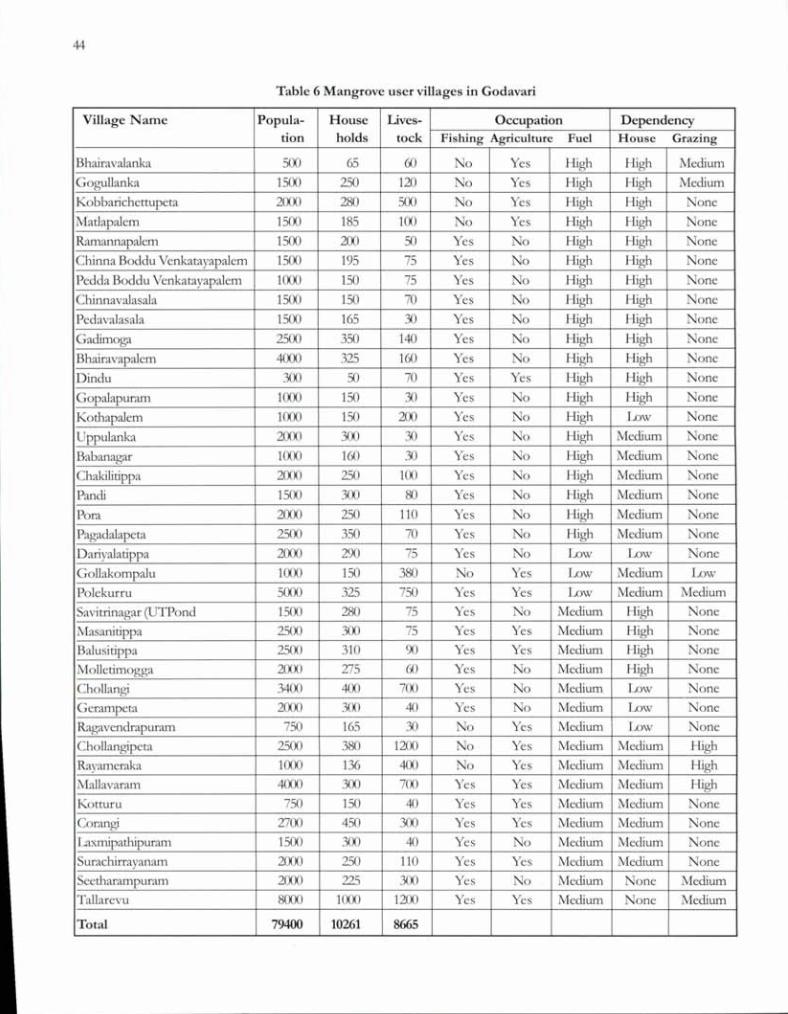
Table 6 Mangrove user villages in Godavari
Village N arne Popula- House Uves- Occupation Dependencytion holds tack Fishing Agriculture Fuel House Grazing
Bhairavalanka 500 65 (fJ No Yes High High Medium
GOt,JUllanka 1500 250 120 No Yes I-ugh High Medium
Kobbarichettupeta 2000 280 500 No Yes High High None
Matlapalem 1500 185 100 No Yes High I-Ligh None
Ramannapalem 1500 200 50 Yes No I-Ligh I-Ligh None
Chinna Boddu Venkatayapalem 1500 195 75 Yes No High High None
Pedda Boddu Venkatayapalem 1000 150 75 Yes No High High None
Chinnavalasala 1500 150 70 Yes No High I-Ligh None
Pedavalasala 1500 165 30 Yes No High I-Ligh None
Gadimoga 2500 350 140 Yes No High I-Ligh None
Bhairavapalem 4000 325 160 Yes No High High None
Dindu 300 50 70 Yes Yes High I-Ligh None
Gopalapuram 1000 150 30 Yes No High High None
Kothapalem 1000 150 200 Yes No High Low None
Uppulanka 2000 300 30 Yes No High Medium None
Babanagar 1000 160 30 Yes No High Medium None
Chakilitippa 2000 250 100 Yes No High Medium None
Pandi 1500 300 80 Yes No High Medium None
Para 2000 250 110 Yes No High Medium None
Pagadalapeta 2500 350 70 Yes No High Medium None
Dariyalacippa 2000 290 75 Yes No Low Low None
Gollakompalu 1000 150 380 No Yes Low ~Iedium Low
Polekurru 5000 325 750 Yes Yes Low Medium Medium
Savitrinagar (UTPond 1500 280 75 Yes No Medium High None
Masanicippa 2500 300 75 Yes Yes Medium High None
Balusicippa 2500 310 90 Yes Yes Medium High None
Mollecimogga 2000 275 (fJ Yes No Medium High None
Chollangi 3400 400 700 Yes No Medium Low None
Gerampeta 2000 300 40 Yes No Medium Low None
Rat,t<lvendrapuram 750 165 30 No Yes Medium Low None
Chollangipeta 2500 380 1200 No Yes Medium Medium I-Ligh
Rayameraka 1000 136 400 No Yes Medium Medium I-Ligh
J\Iallavaram 4000 300 700 Yes Yes Medium Medium HighKotturu 750 150 40 Yes Yes Medium Medium None
Corangi 2700 450 300 Yes Yes Medium Medium NoneLa.xmipathipuram 1500 300 40 Yes No Medium Medium NoneSurachirrayanam 2000 250 110 Yes Yes Medium Medium NoneSeetharampuram 2000 225 300 Yes No Medium None MediumTallarevu 8000 1000 1200 Yes Yes Medium None Medium
Total 79400 10261 8665
43
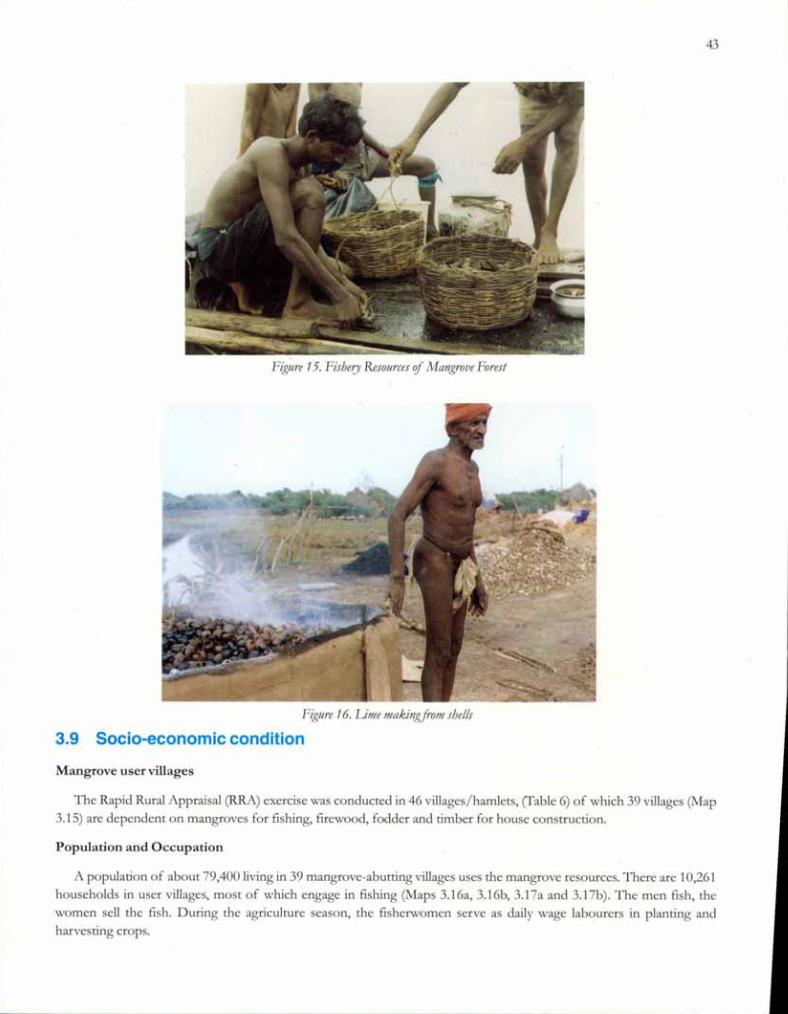
rlgllre 15. Fishery Resollrces if Mangrove Forest
Figllre 16. Litlle tIIakingfrom shells
3.9 Socio-economic condition
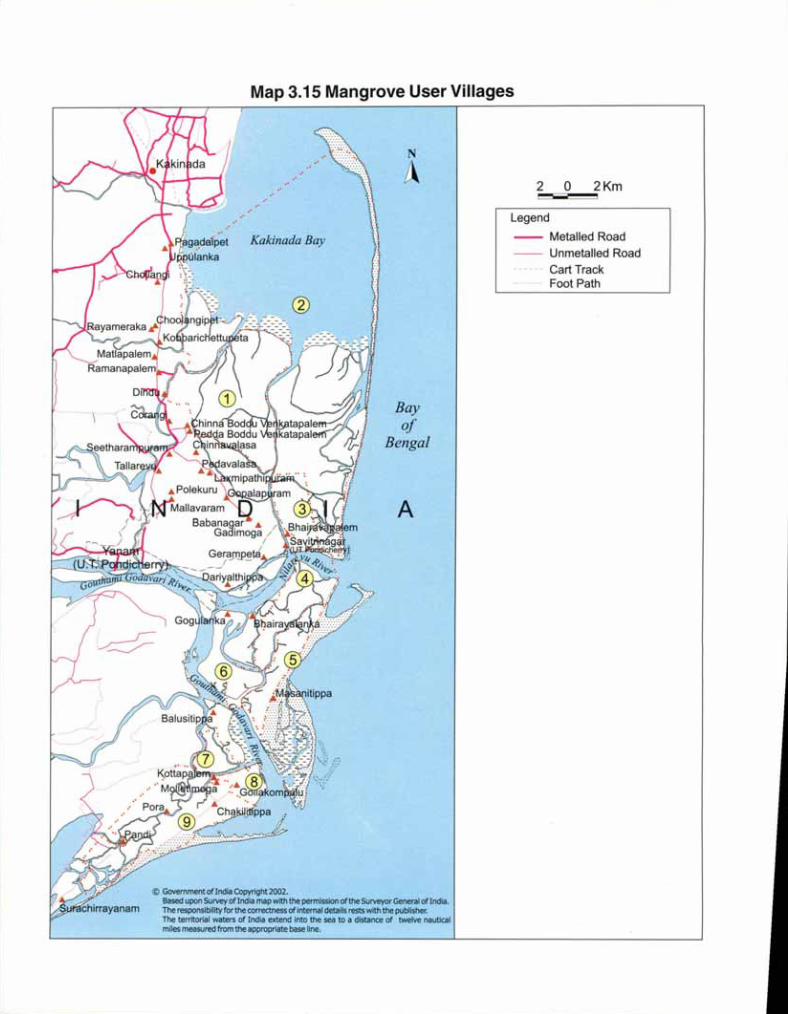
Mangrove user villages
The Rapid Rural Appraisal (RRA) exercise was conducted in 46 villages/hamlets, (fable 6) of which 39 villages (J'vlap3.15) are dependent on mangroves for fishing, firewood, fodder and timber for house construction.
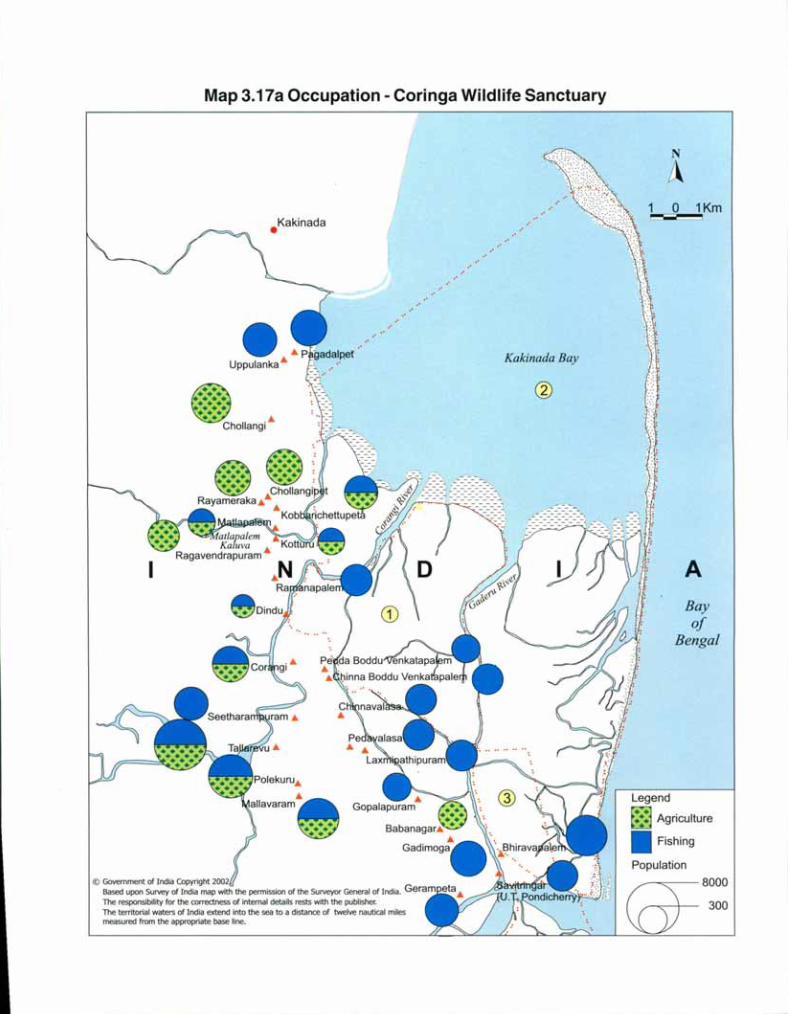
Population and Occupation
A population of about 79,400 living in 39 mangrove-abutting villages uses the mangrove resources. There are 10,261households in user villages, most of which engage in fishing (J'vlaps3.16a, 3.16b, 3.17a and 3.17b). The men fish, thewomen sell the fish. During the agriculture season, the fisherwomen serve as daily wage labourers in planting andharvesting crops.
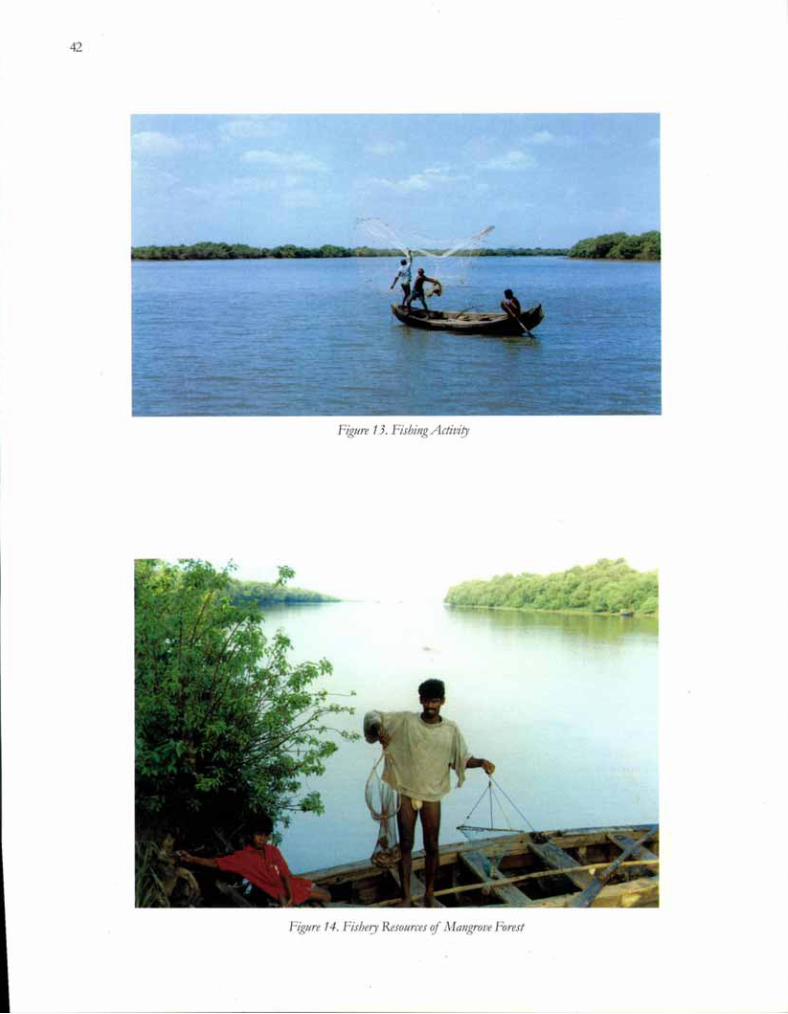
42
Figure 13. Fishing Activity
Figure 14. Fishe,y Resources 0/ Mangrove Forest
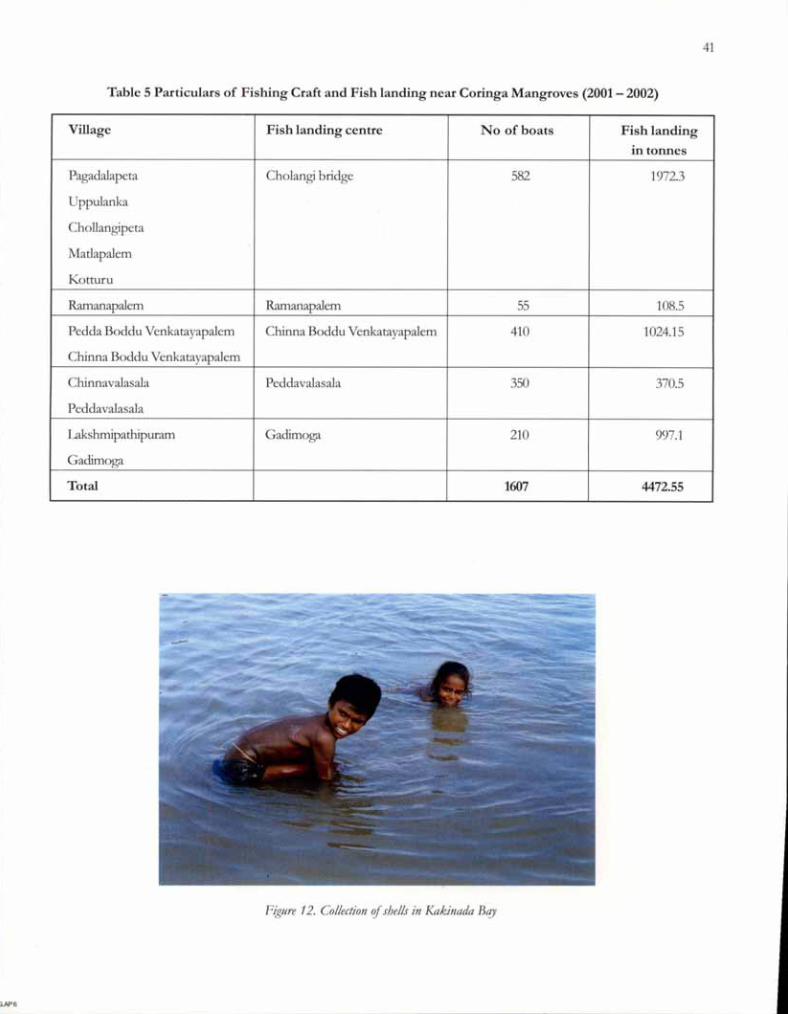
Table 5 Particulars of Fishing Craft and Fish landing near Coringa Mangroves (2001- 2002)
41
.AP6
Village Fish landing centre No of boats Fish landingin tonnes
Pagadalapeta Cholansti bridge 582 1972.3
UppuJanka
Chollangipeta
Matlapalem
Kotturu
Ramanapalem Ramanapalem 55 108.5
Pedda Boddu Venkatayapalem Chinna Boddu Venkatayapalem 410 1024.15
Chinna Bodclu Venkatayapalem
Chinnavalasala Peddavalasala 350 370.5
Peddavalasala
Ltkshmipathipuram Gadimoga 210 997.1
Gadimoga
Total 1607 4472.55
Figtlre 12. Collection if shells in Kakinada 13cry
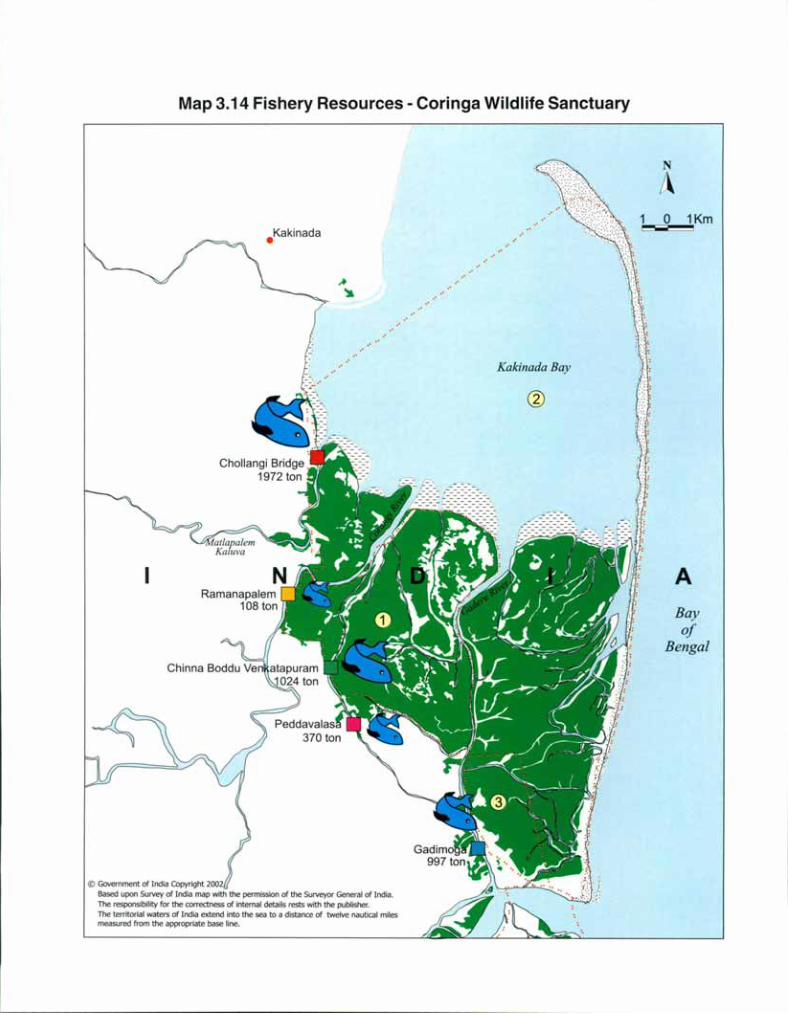
Map 3.14 Fishery Resources - Coringa Wildlife Sanctuary
.Kakinada
@ Government of India Copyright 2002Based upon Survey of India map with the pennission of the Surveyor General of India.The responsibility for the correctness of internal details rests with the publisher.The territorial waters of India extend into the sea to a distance of twelve nautical milesmeasured from the appropriate base line.
Kakinada Bay
N
A1 0 1Km~
. :.' ..:.: :
::.:
~:. :
.-", .:;
ABayof
Bengal

39
3.8 Wood and Fishery Resources
Mangroves play an important role in coastal fisheries production. The fishermen community living in 39 villages usemangrove resources of Godavari mangroves for artisanal fishing. The mangrove areas are rich in crustacean, mollusksand finfish resources. Marine fisheries production in the East Godavarai district was 19,796 tons and 23,530 tons respectivelyduring 1998-99 and 1999-2000 (Source: Commissioner of Fisheries, Andhra Pradesh), accounting for 36% of the totalproduction of Andhra Pradesh. No data on fishery potential and landings from Godavarai mangroves are available.
The prawn seed and juvenile resources of the Godavari manhl"fove ecosystem profoundly influence the artisanalfishery around Kakinada coast. But indiscriminate prawn seed collection in recent years has depleted fishery resources,leading to a ban on prawn seed collection and fishing curbs during the breeding season.
Kakinada Bay is rich in bivalve resources like Anadara granosa, Placenta place11ta and Lvleretrix !lJeretrix and gastropods likeTelescopiH!lJ spp. and CerethidiH!lJ species. Shells collected from the area are used for lime-making and are transported toTamil Nadu for ornament-making. Crustaceans like prawns and crabs constitute a higher percentage of trawl landings atKakinada (about 25% more) than in non-mangrove areas, where they account for between 9 and 15% (CMFRl). Five fishlanding centers adjoining Coringa wildlife sanctuary account for nearly 4,472.55 tons (Table 5) of fishery resources peryear (Department of Fisheries, Kakinada, 2001 - 2002) which includes catches from mangroves, Kakinada Bay and opensea.
Local fishermen and the farming community depend on mangroves for firewood, fodder, fencing and timber forhouse construction. The Porteresia coarctata grass is used as fodder and the Afyriostac!?;a lIJightiana is used as thatchingmaterial. The bark of Ceriops decandra is used for coloring (dye) the fishing nets.
FigHre 11. Afyriostac!?;a Ivightiana - Thatchinggrass

Map 3.13 Water Salinity in Kakinada Bay
1Km
ABayof
Bengal
"".'\."
N
A1 0r--w-
:.,'
; ...:
Salinity (ppt)
DSummer
D Post-monsoon
IISouthwestmonsoon
Kakinada Bay
2621
.Kakinada
@ Government of India Copyright 2002Based upon Survey of India map with the permission of the Surveyor General of India.The responsibilit)l for the correctness of internal details rests with the publisher.The territorial waters of India extend into the sea to a distance of tweive nautical milesmeasured from the appropriate base line.
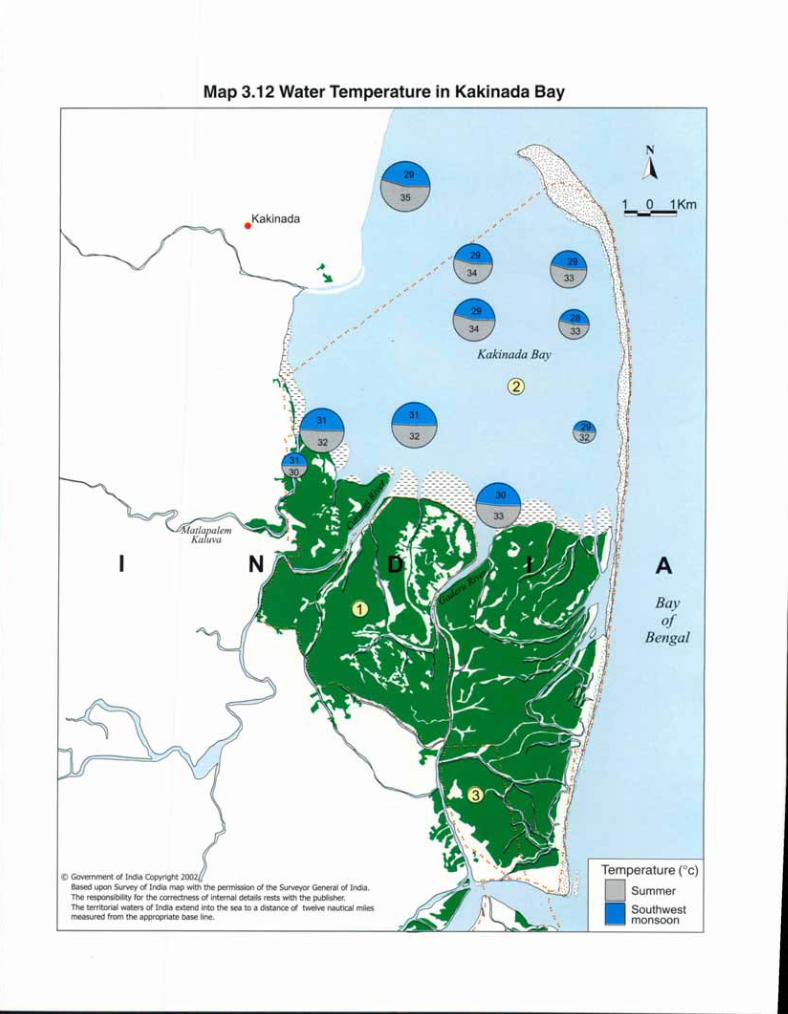
Map 3.12 Water Temperature in Kakinada Bay
,/
o 1Km
ABayof
Bengal
N
A
.,
Temperature (oc)
D Summer
Southwestmonsoon
32
Kakinada Bay
.Kakinada
@ Government of India Copyright 2002Based upon Survey of India map with the permission of the Surveyor General of India.The responsibility for the correctness of internal details rests with the publisher.The territorial waters of India extend Into the sea to a distance of twelve nautical milesmeasured from the appropriate base line.

Map 3.5b Mangrove Species Zonation - Non Sanctuary Area
.AegicerasCorniculatumExcoecariaagallocha
1Km
A
N
A
Bayof
Bengal
1 0r--s;;;
Legend
IIAvicennia alba
IIA. marinaIIA. officinalisIIDIIRhizophora spp.
IISonneratiaapetala
@ Government of India Copyright 2002.
Based upon Survey of India map with the permission of the Surveyor General of India.The responsibility for the correctness of internal details rests with the publisher.The territorial waters of India extend Into the sea to a distance of twelve nautical milesmeasured from the appropriate base line.

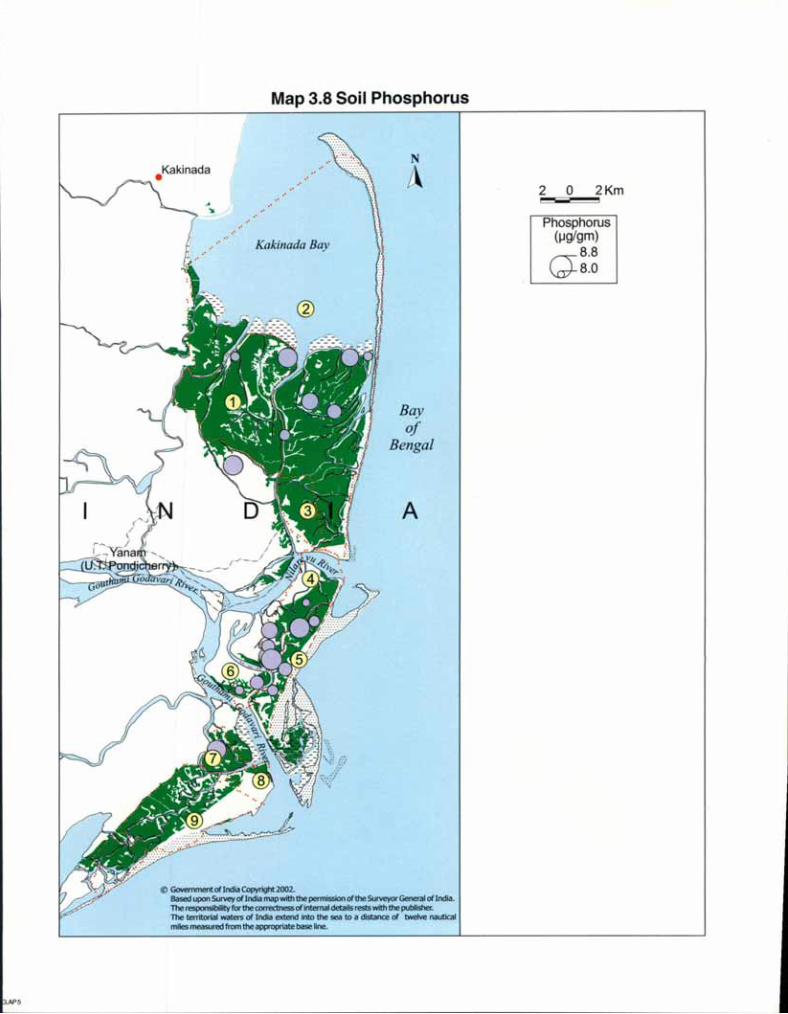
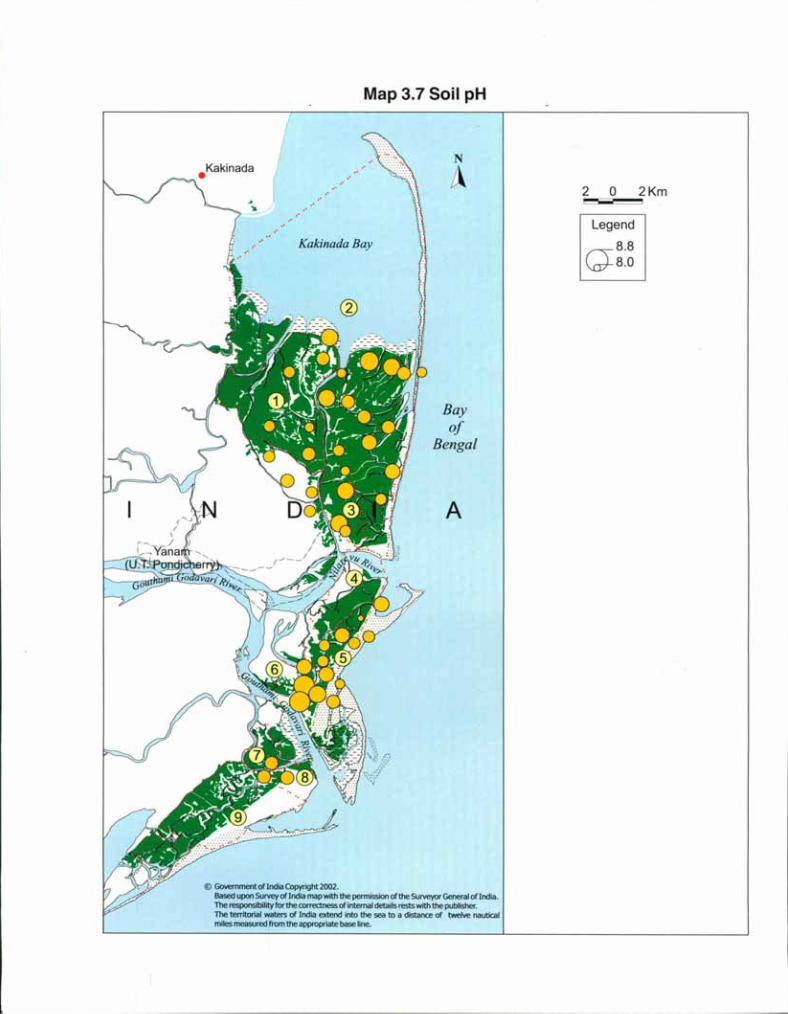
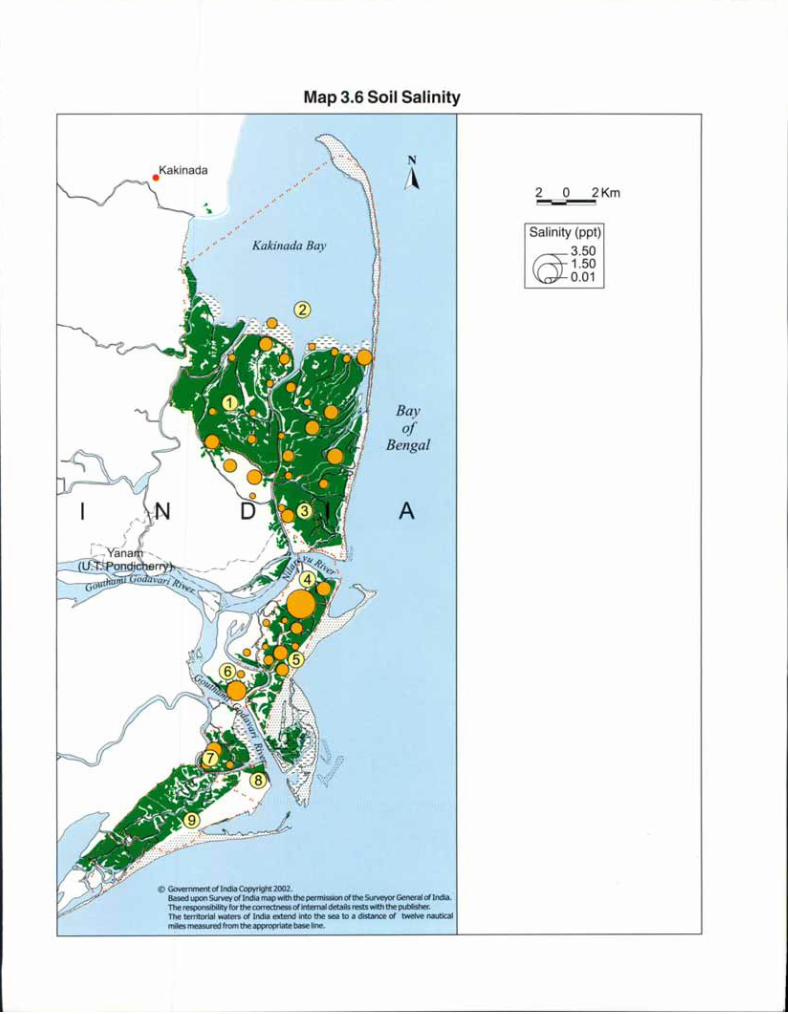
3.6 Soil Properties
Surface soil samples were collected from the mangroves and analysed for soil texture, nutrient status, soil salinityand pH. Soil collected inside the mangroves are predominantly clayey, whereas samples collected from near the shorearea showed higher per-centage of sand and thus, can be classified as sandy-clay. The soil composition tests carried outby U rna Maheswara Rao et a!. (1988) during 1985 showed values ranging from- 1 to 18% sand, 7 to 63% silt and 15 to
90% clay.
The pH of the soil is alkaline, between 8 and 8.8. Organic matter is low in degraded areas and in creeks. In densemangrove areas, the mean organic matter value is 2.71% (Uma Maheswara Rao et a!., 1988). Similarly, in the studyconducted by MSSRF, the organic carbon varied from "low" in degraded areas to "high" in dense mangrove areas. Thephosphorus content is relatively low, while potassium levels are high.
3.7 Hydrological conditions
Tidal amplitude
Tidal variation in the Godavari mangroves was analyzed in two places, near Bhairavalanka and in Corangi river nearRamanapalem, for both monsoon and sU!llmer months. Near Bhairalanka it showed a maximum value of 0.80 m duringthe monsoon season and 0.50 cm during the summer period. In the interior mangroves, the tidal amplitude varied from1.00 to 1.30 m during the summer and 0.20 m to 0.50 m during the monsoon season.
Salinity and Temperature
Variations in salinity and temperature were studied with an in situ salinity-temperature probe for over a period of 24hours in the Saleru creek, near the Bhairavalanka during December, February and May. The salinity varied between 6and 8 ppt (parts per thousand or grams per litre) during December, indicating the predominance of fresh water flow inthe creek. Salinity in February varied from 26 to 30.5 ppt and from 21 to 29 ppt in May.
Salinity variations in Kakinada Bay were studied during May and August. Salinity during August varied from 11.7 pptnear the mangroves in the Kakinada Bay to 33.4 ppt near Hope Island. The salinity near the mouths of Corangi andGaderu rivers is considerably low, only 9.5 ppt and 11.7 ppt respectively. This clearly indicated that Matlapalem canal,Corangi and Gaderu rivers discharge a considerable amount of fresh water into the Kakinada Bay. In the Matlapalemcanal, salinity was between 1 and 3 ppt. The salinity ranged from 17 to 31 ppt., indicating that the Matlapalem creekreceives fresh water even during during May. In Kakinada Bay the salinity varied between 19 and 31.3 ppt during May.
Temperature in December varied from 26 to 28°C in the creek and from 24 to 28.5 "C in February and in May,temperature varied from 30 to 32.5 0c. Temperature variations in the bay was between 28 and 310 C. Salinity in summerQ'vray)varied from 19 ppt to 31.3 ppt. In Matlapalem creek, temperature during May varied from 27 to 36 "c. The widevariations in salinity and temperature indicated mixing of fresh water with seawater near the Matlapalem kalava.

Temperature (Oc)
IIMonsoonD Summer
Map 3.11 Water Temperature
N
A
Kakinada Bay
Bayof
Bengal
A
@ Government of India Copyright 2002.Based upon Survey of India map with the permission of the Surveyor General of India.The responsibility for the correctness of internal detaiis rests with the publisher.The territorial waters of India extend into the sea to a distance of twelve nauticalmiles measured from the appropriate base line.
2 o 2Km
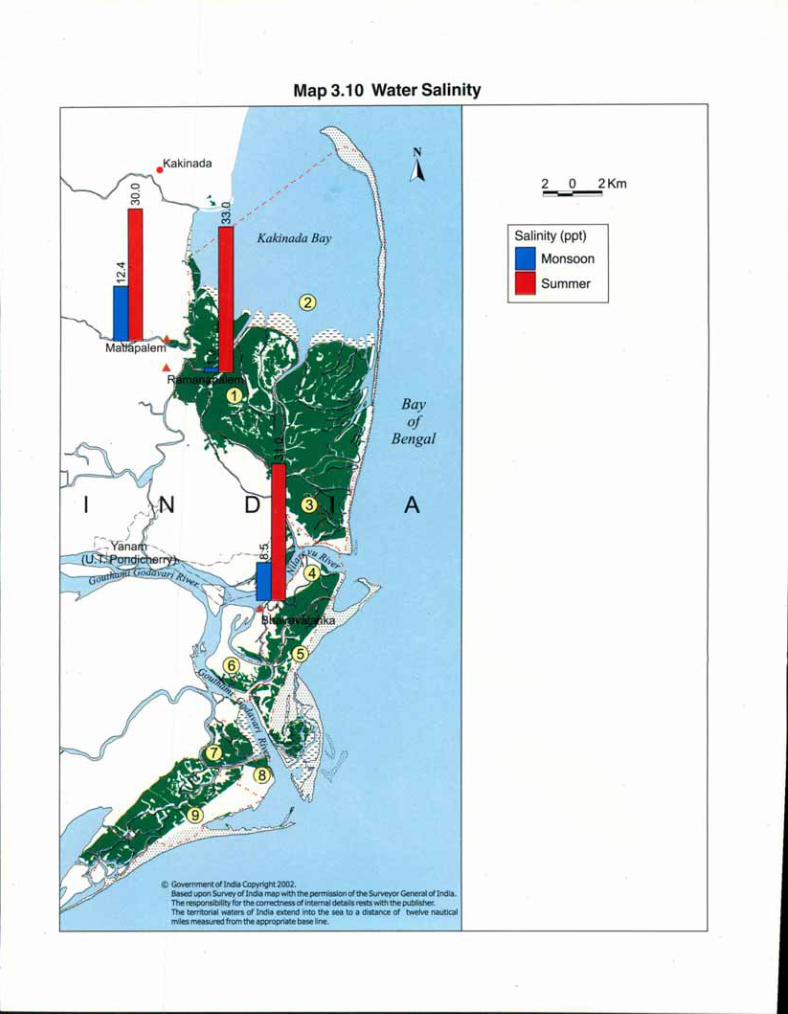
Map 3.10 Water Salinity
@ Government of India Copyright 2002.Based upon Survey ofindia map with the permission of the Surveyor General of India.The responsibility for the correctness of Internal details rests with the publisher.The territorial waters of India extend into the sea to a distance of twelve nauticalmiles measured from the appropriate base line.
.Kakinada
Kahnada Bay
N
A
Bayof
Bengal
A
o
Salinity (ppt)
IIMonsoonIISummer
2Km

Map 3.9 Tidal Amplitude
@ Government of India Copyright 2002.Based upon Survey of India map with the permission of the Surveyor General of India.The responsibility for the correctness of internal details rests with the publisher.The territorial waters of India extend into the sea to a distance of twelve nauticalmiles measured from the appropriate base line.
• MaXimUm}D M. . Summer
InJmum
Tidal Amplitude (meters)
MaXimUm}• M" . MonsoonInJmum
2Km2 0~--N
A
A
Bayof
Bengal
Kakinada Bay
I!
!
Phosphorus(lJg/gm)f'\8.8\a:T8.O
.APS
Map 3.8 Soil Phosphorus
N
A
Kakinada Bay
Bayof
Bengal
A
@ Government of India Copyright 2002.Based upon Survey of India map with the permission of the Surveyor General of India.The responsibility for the rorrectness of internal details rests with the publisher.The territorial waters of India extend into the sea to a distance of twelve nauticalmiles measured from the appropriate base line •
2 o 2Km
Map 3.7 Soil pH
N
A
Kakinada Bay
Bayof
Bengal
A
@ Government of India Copyright 2002.Based upon Survey ofIndia map with the permission of the Surveyor General of India.The responsibility for the correctness of internal details nests with the publisher.The territorial waters of India extend into the sea to a distance of twelve nauticalmiles measured from the appropriate base line.
2 0==Legend
(\8.8\nj-8.0
2Km
Salinity (ppt)
63.501.500.01
Map 3.6 Soil Salinity
N
A
Kakinada Bay
Bayof
Bengal
A
@ Government of India Copyright 2002.Based upon Survey of India map with the permission of the Surveyor General ofIndia.The responsibility for the correctness of internal details rests with the publisher.The territorial waters of India extend into the sea to a distance of twelve nauticalmiles measured from the appropriate base line.
2 o 2Km
53
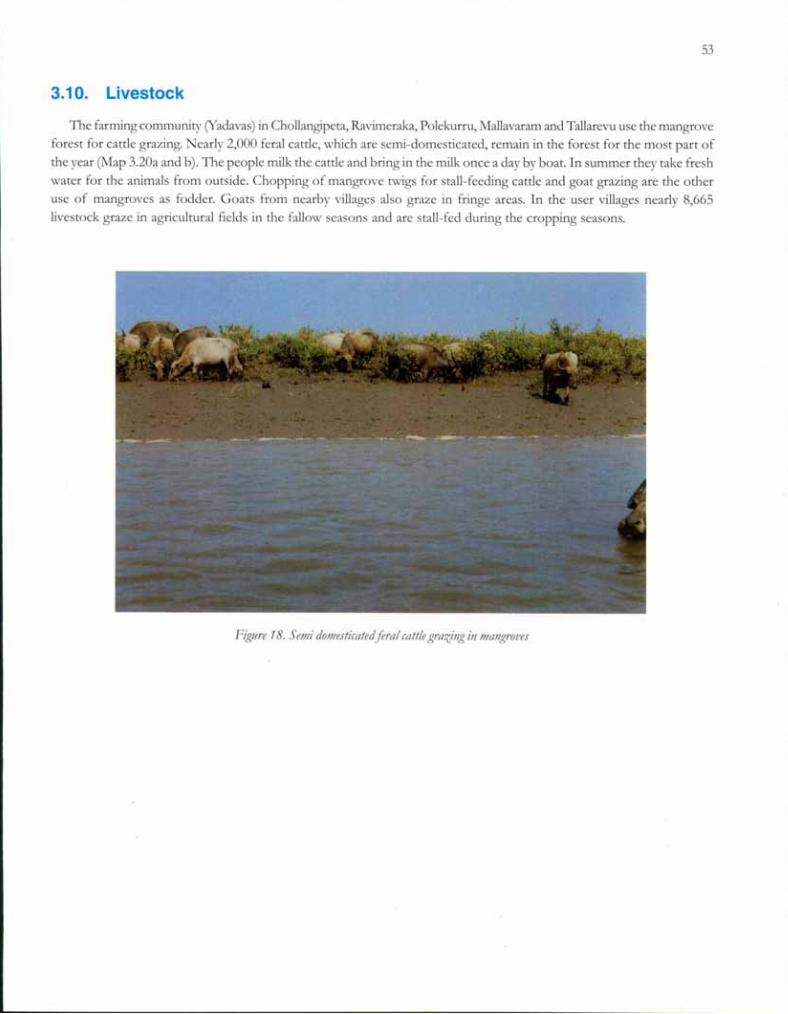
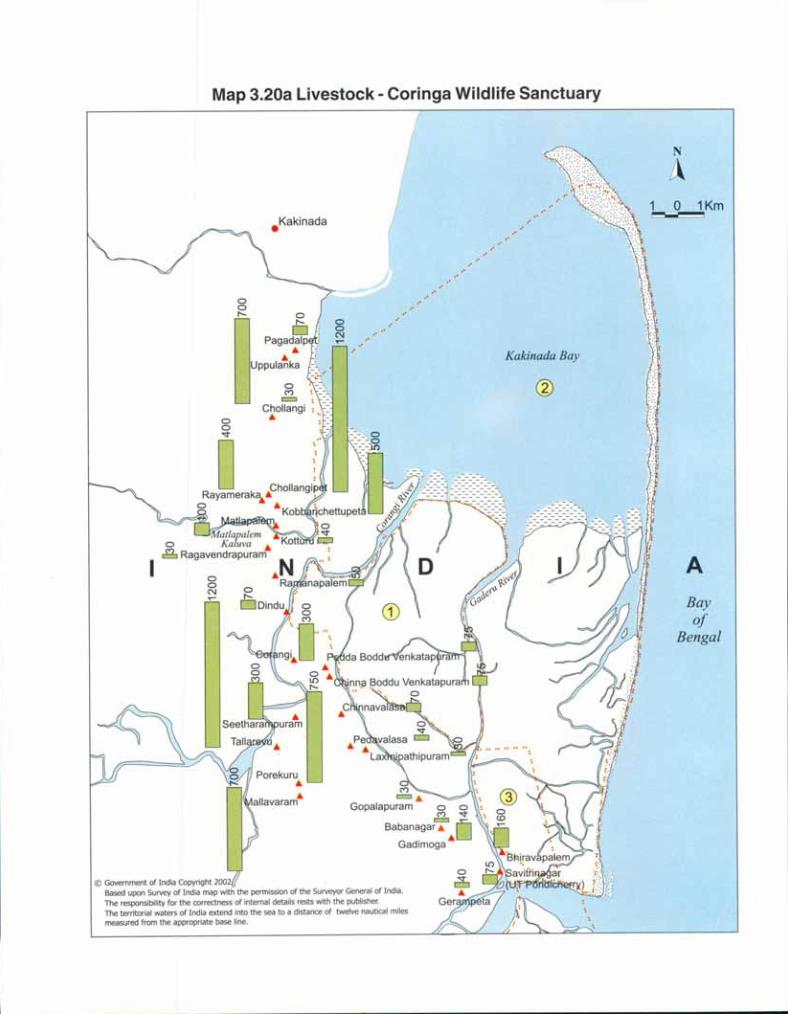
3.10. Livestock
The farming community (Yadavas) in Chollangipeta, Ravimeraka, Polekurru, Mallavaram and Tallarevu use the mangroveforest for cattle grazing. Nearly 2,000 feral cattle, which are semi-domesticated, remain in the forest for the most part ofthe year (Map 3.20a and b). The people milk the cattle and bring in the milk once a day by boat. In summer they take freshwater for the animals from outside. Chopping of mangrove twigs for stall-feeding cattle and goat grazing are the otheruse of mangroves as fodder. Goats from nearby villages also graze in fringe areas. In the user villages nearly 8,665livestock graze in agricultural fields in the fallow seasons and are stall-fed during the cropping seasons.
Figure 18. Semi domesticated feral cattle graz.!ng inlJ/angro/Jes
Map 3.20a Livestock - Coringa Wildlife Sanctuary
1Km
N
A
:.'
.....
Kakinada Bay
C')= .•
Gopalapuram 0C') '<t
Babanagar~ 0Gadimoga .•
.Kakinada
oC')=Chollangi••
ooI'-
I A00N
Bayof
Bengal
@ Government of India Copyright 2002Based upon Survey of India map with the permission of the Surveyor General of India.The responsibility for the correctness of internal details rests with the publisher.The territorial waters of India extend into the sea to a distance of twelve nautical milesmeasured from the appropriate base line.
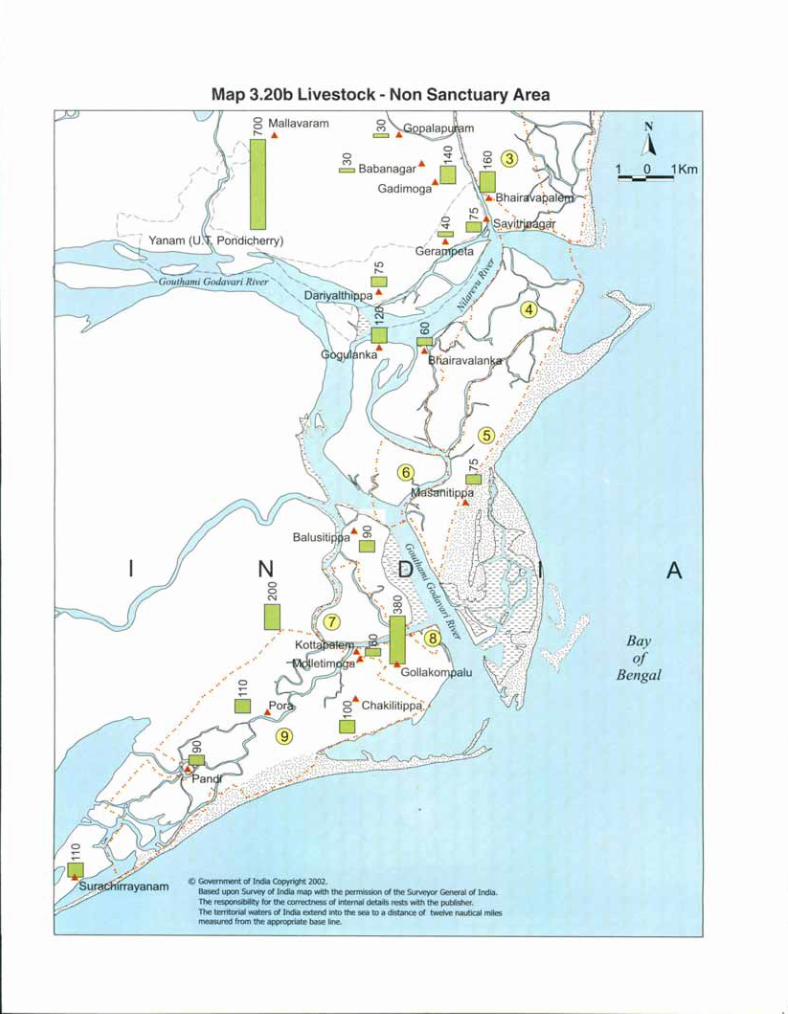
Map 3.20b Livestock - Non Sanctuary Areag Mallavaramt-- •••
o
o
@ Government of India Copyright 2002.Based upon Survey of India map with the permission of the Surveyor General of India.The responsibility for the correctness of intemal details rests with the publisher.The territorial waters of India extend into the sea to a distance of twelve nautical milesmeasured from the appropriate base line.
o 1Km~-------'
A
Bayof
Bengal

56
3. 11 Land Use around mangroves
Cropping, plantation and weeds
Coconut groves and paddy are synonymous with agriculture in this area. Canal-irrigated water from the Dowleswarambarrage helps cultivate paddy. In most places, paddy is cultivated twice and a legume crop once, both with irrigationsupport. The Forest Department of Andhra Pradesh planted casuarina under its shelterbelt program along the coast.Plantations of casuarinas are seen in Hope Island along the shore near Masanitippa, and in Kandikuppa RF near Sacramentolighthouse. The plantations are being raised by the Vana Samrakshana Samiti (VSS), a village level society formed underJoint Forest Management programme of the Andhra Pradesh Forest Department in the non-sanctuary area. Revenuefrom the plantations will be given to the village as per JFM guidelines. The high tidal mud flats along the Saleru creeknear Bhairavalanka, where inundation is rare, Prosopis trees have invaded. Prosopis invasion is also noticeable near theriver mouth of Gauthami Godavari.
r/gure 19. Agn"CIIltural Ll11duse - Padrfy CIIltivation and Coconut plantation
Salt pan
Some of the areas around mangroves are under salt production. Salt pans are found near Balusutippa RF and in theoutskirts of Kakinada near Chollangi adjoining the mangroves, which are divided by the Kakinada- Yanam Road. TheChollangi creek supplies water for the salt pans.
Figure 20. Saltpan near Mangrove vegetation

Map 3.21a Landuse Map - 1986
Kakinada Bay
@ Government of India Copyright 2002.Based upon Survey ofIndia map with the permission of the Surveyor General ofIndia.The responsibility for the correctness of internal details rests with the publisher.The territorial waters of India extend into the sea to a distance of twelve nauticalmiles measured from the appropriate base line.
2Kmo2
Legend
IIDense MangrovesD Degraded Mangroves
DMUdflat
DAgriculture
DSand
IISalt panBayof
Bengal
N
A
A

Map 3.21 b Landuse Map - 1998
N
A 2 0 2Km=
.' LegendKakinada Bay IIDense Mangroves
.. D Degraded Mangroves
@ D Mudflat
D Agriculture
D Sand
D Casuarina
Bay IIAquaculture/Salt pan
ofBengal
A
@ Government of India Copyright 2002.Based upon Survey of India map with the permission of the Surveyor General of India.The responsibility for the correctness of internal details rests with the publisher.The territorial waters of India extend into the sea to a distance of twelve nauticalmiles measured from the appropriate base line.
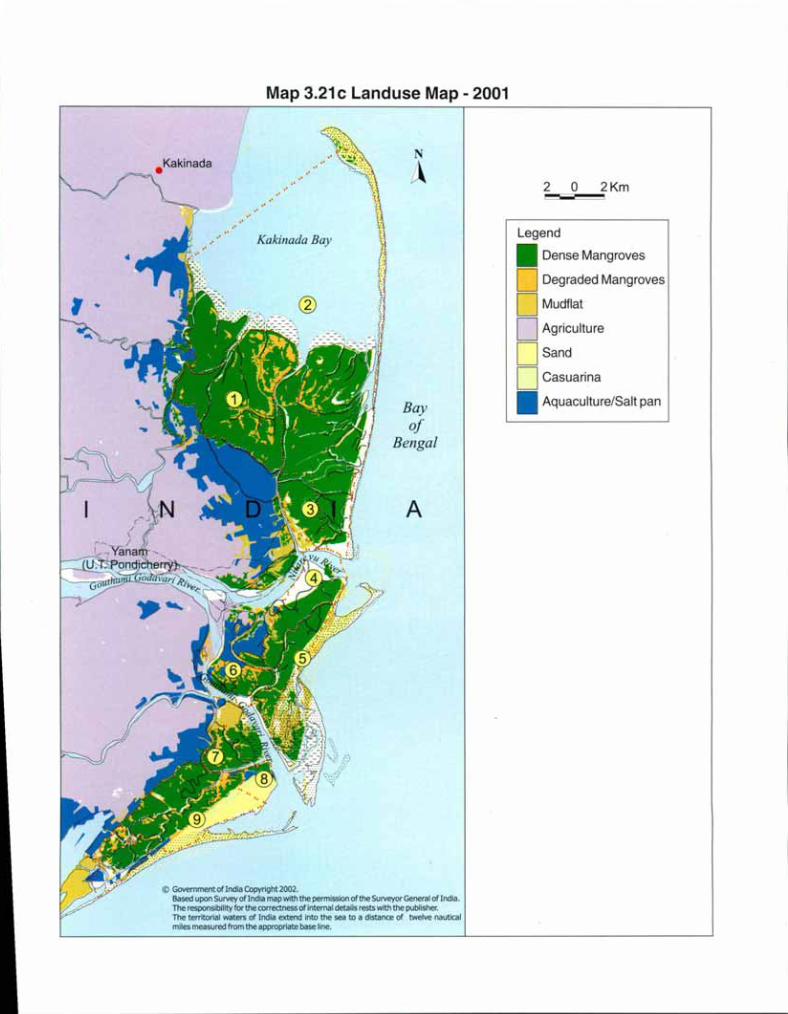
Map 3.21c Landuse Map - 2001
@ Government of India Copyright 2002.Based upon Survey of India map with the permission of the Surveyor General of India.The responsibility for the correctness of internal details rests with the publisher.The territorial waters of India extend into the sea to a distance of twelve nauticalmiles measured from the appropriate base line.
A
N
A 2 a 2Km~
"
Kakinada Bay Legend
IIDense Mangroves
D Degraded Mangroves
@ D Mudflat
D Agriculture
D Sand
D Casuarina
Bay IIAquaculture/Salt pan
ofBengal

Aquaculture
In Andhra Pradesh, the extent of aqua farms has increased from 6000 ha in 1990 to 84,629 ha in 1999. Near toGodavari estuarine region alone, area of aqua farms has increased from 2006 ha in 1989 to 19239 ha in 1999 (AndhraPradesh Remote Sensing Centre, 1999). A recent survey by the aquaculture sector found that about 5% of the shrimpfarms in India have been constructed in former mangrove areas. (ADB/NACA, 1998). Mangrove conversion for prawnfarming has been taken both for small scale extensive system as well as for large scale semi-intensive method of farming.In the Godavari delta, about 14% of the aquaculture farms have been constructed on mangrove lands located outsidethe reserve forests. Most of the lands owned by private abutting the mangroves are being converted to shrimp ponds.The rate of conversion of manh'Tove to shrimp ponds increased in the period 1997 to 1999. The increase in shrimpfarming area led to an increase in shrimp production from 30,000 tones during 1990 to 102,000 tones in 1999. Shrimpfarms are located very close to mangroves and revenue lands. Impact of discharge of effluents from aqua farms intomangrove wetlands has not been studied systematically. The study by Rangarao et al (2003) indicate that pollutantsincluding effluents released from the aqua farms into mangrove canals are not flushed out completely due to existingwater circulation pattern and tend to accumulate in the southern part bay where mangroves are located.
Figure 21. Aquaculture Jamls at/jacellt to mangrove vegetation
3.12. Dependency
Grazing
The farming community in Chollangipeta, Ravimeraka, Polekurru, Mallavaram and Tallarevu depend on the mangroveforests for feral cattle grazing. Apart frbm this, Porieresia grass and AJ!iceIlnia twigs are used as fodder for stall-feeding thelivestock. Goats from the nearby villages h'Taze along the fringes of mangroves (Map 3.22a and b).
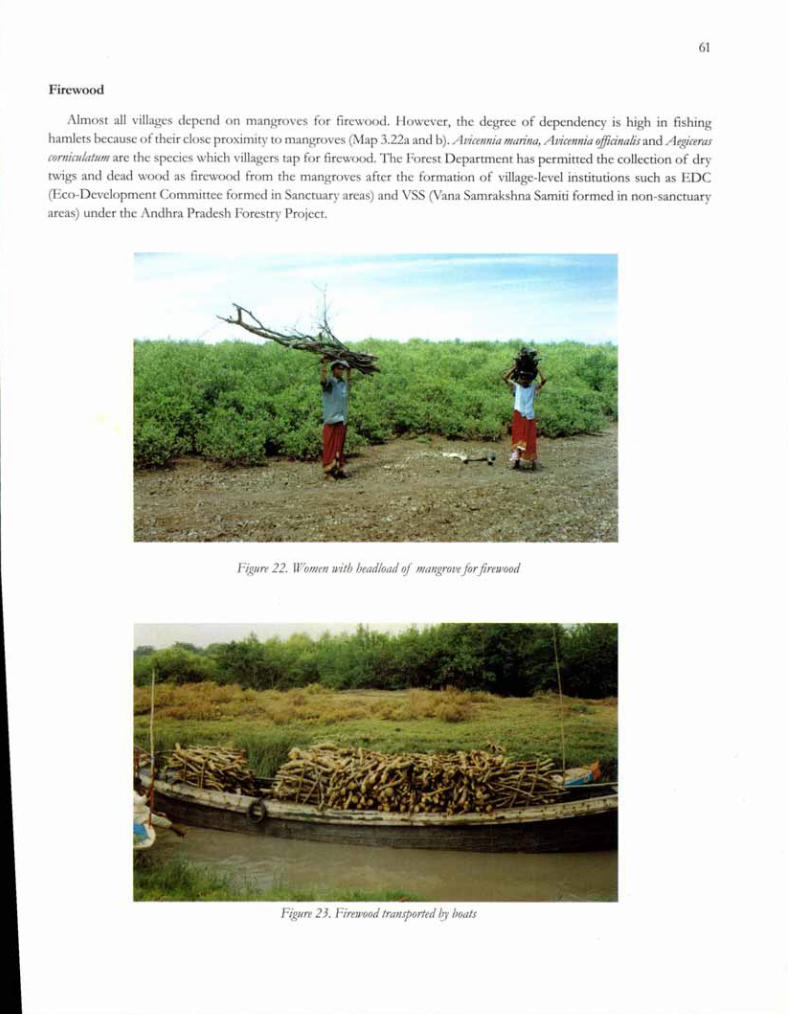
61
Firewood
Almost all villages depend on mangroves for firewood. However, the degree of dependency is high in fishinghamlets because of their close proximity to manh"oves (Map 3.22a and b). Avicennia manna, Avicennia qfficinalis and Aegicerascomimlatllm are the species which villagers tap for firewood. The rorest Department has permitted the collection of drytwigs and dead wood as firewood from the mangroves after the formation of village-level institutions such as EDC(Eco-Development Committee formed in Sanctuary areas) and VSS (Vana Samrakshna Samiti formed in non-sanctuaryareas) under the Andhra Pradesh rorestry Project.
Figure 22. Il/"omenwith headload if mangrove for jirelJ100d
Figure 23. FirelJ100dtransported by boats
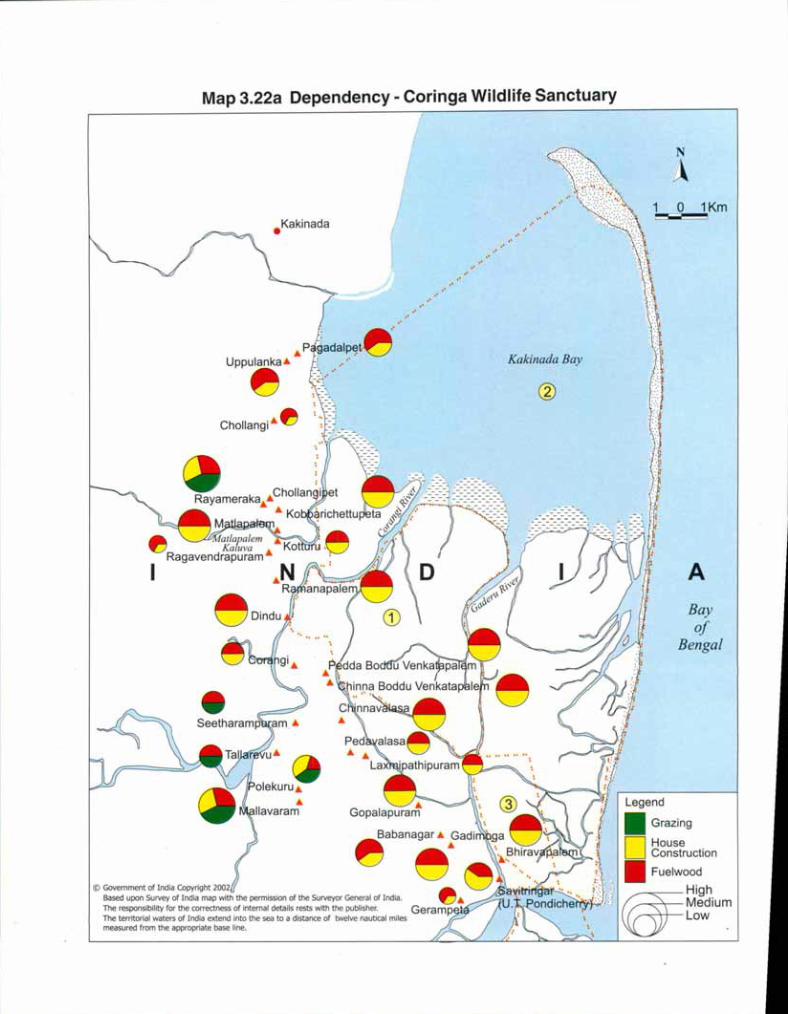
Map 3.22a Dependency - Coringa Wildlife Sanctuary
fi
.Kakinada
A.P Jada'P~te'UppulankaA. ' ".eChOliangiA.~
@ Government of India Copyright 2002
Kakinada Bay
N
A1 a 1Km~-~
ABayof
Bengal
Legend
_ Grazing
DHouseConstruction
_ Fuelwood
High~Medium~LOW
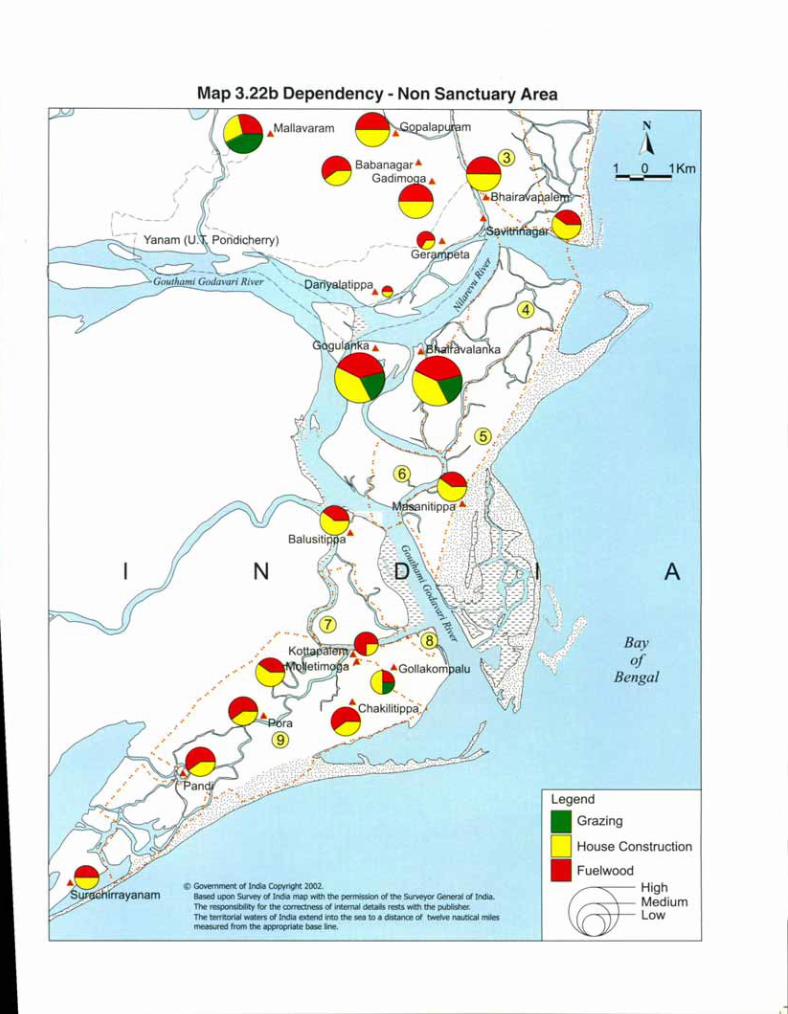
Map 3.22b Dependency - Non Sanctuary Area
HighMediumLow
A
Bayof
Bengal
N
A1 0 1Km=--===
Legend
IIGrazingDHouse Construction
IIFuelwood
~
~ .Mallavaram
~ " _ Babanagar.
~ Gad;~,
/
~~--- -f!!!;./ Ger--_/-. __ /
@ Government of India Copyright 2002.Based upon Survey of India map with the permission of the Surveyor General of India.The responsibility for the correctness of intemal details rests with the publisher.The territorial waters of India extend Into the sea to a distance of twelve nautical milesmeasured from the appropriate base line.
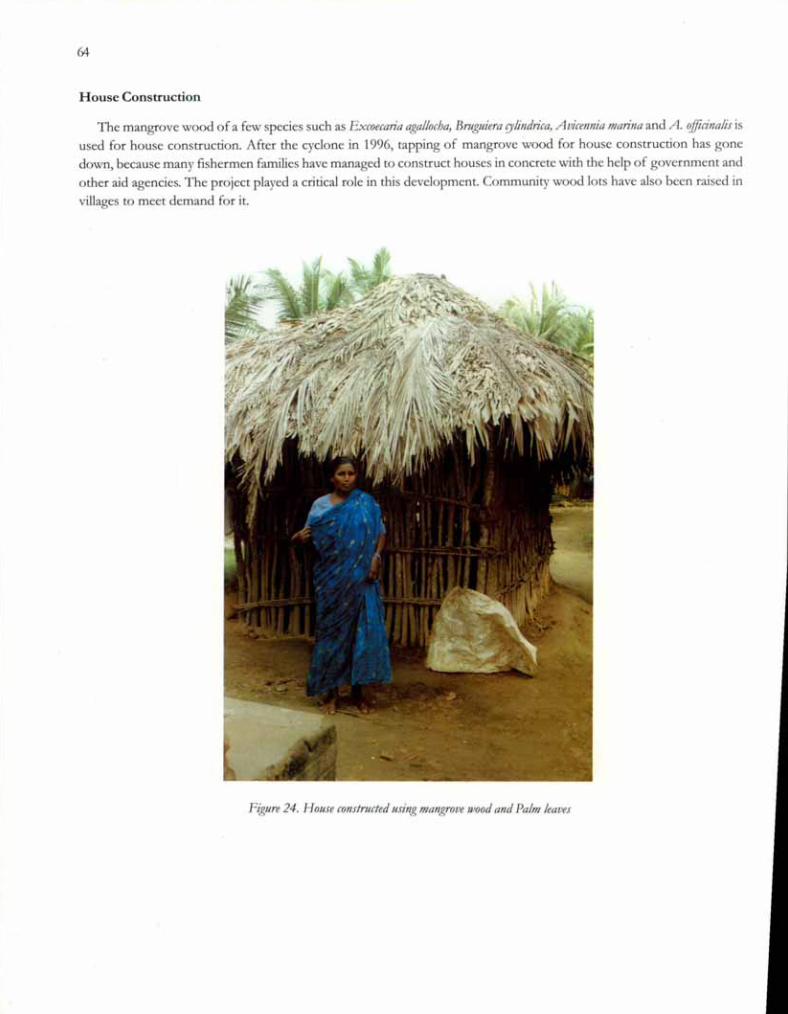
House Construction
The mangrove wood of a few species such as Excoecaria agal/ocha, Bruguiera D'/indrica, Avicel1nia marina and A. ojftcina/is isused for house construction. After the cyclone in 1996, tapping of mangrove wood for house construction has gonedown, because many fishermen families have managed to construct houses in concrete with the help of government andother aid agencies. The project played a critical role in this development. Community wood lots have also been raised invillages to meet demand for it.
Figure 24. House constructed using mangrove IIJoodand Palm/eaves
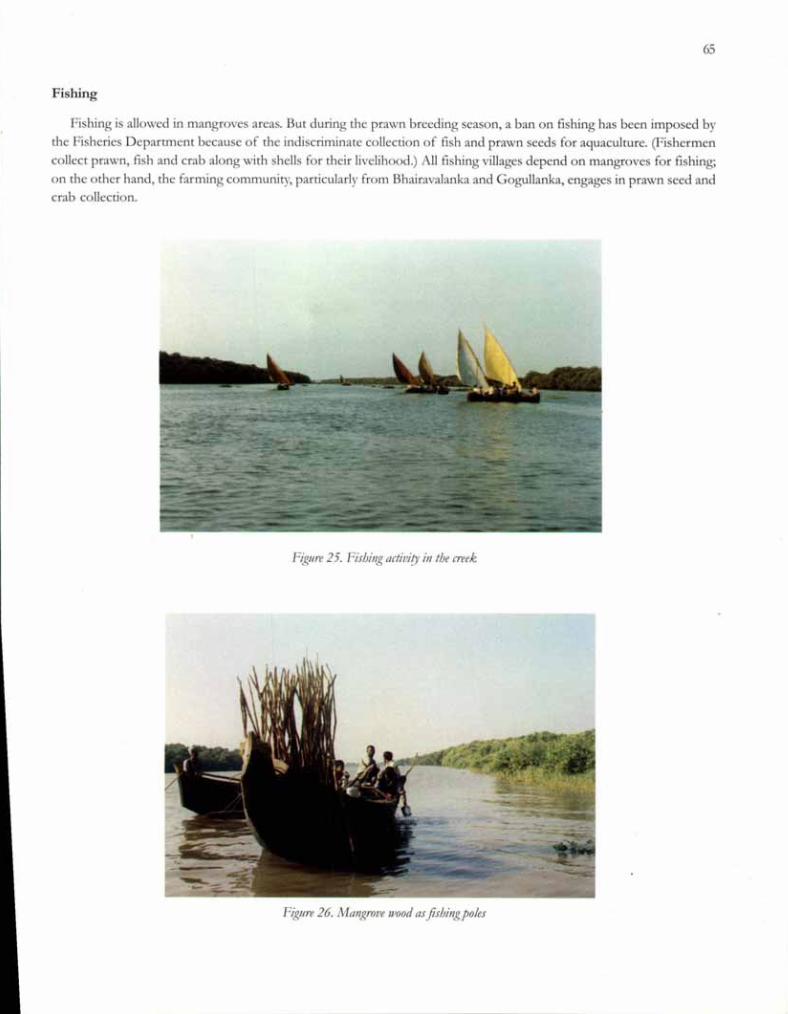
65
Fishing
Fishing is allowed in mangroves areas. But during the prawn breeding season, a ban on fishing has been imposed bythe Fisheries Department because of the indiscriminate collection of fish and prawn seeds for aquaculture. (Fishermencollect prawn, fish and crab along with shells for their livelihood.) 1\11fishing villages depend on mangroves for fishing;on the other hand, the farming community, particularly from Bhairavalanka and Gogullanka, engages in prawn seed andcrab collection.
Figure 25. Fisbing activity in tbe creek
Figure 26. Mangrove l/lood asfisbingpoles
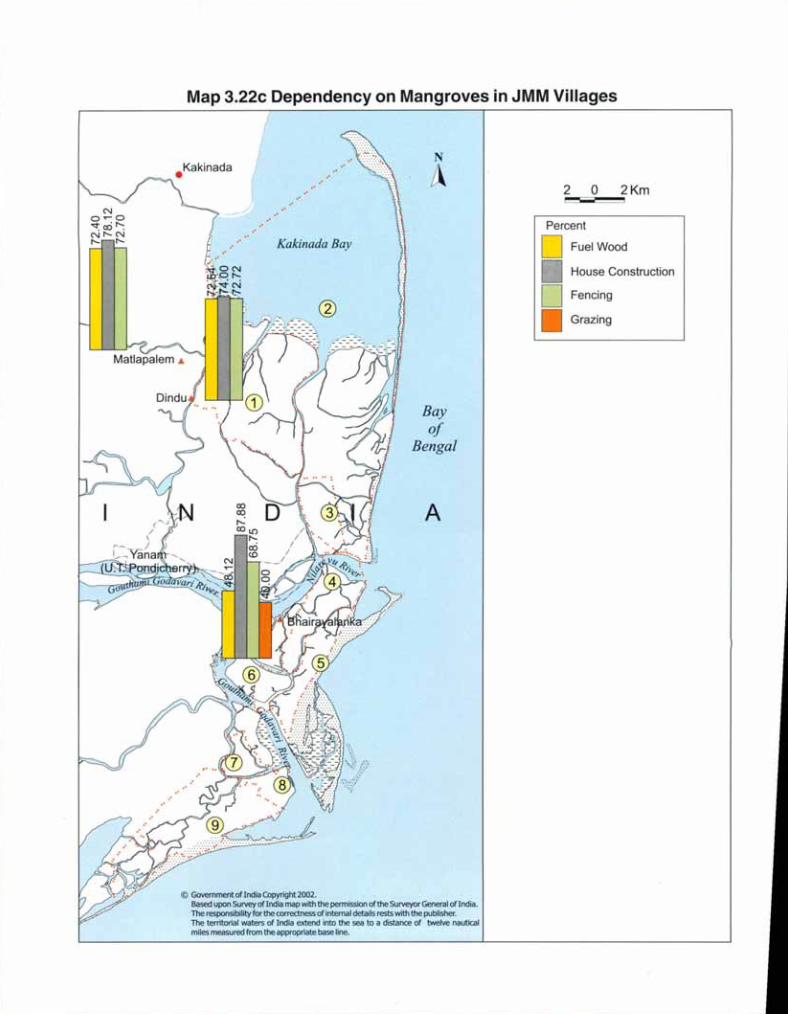
Map 3.22c Dependency on Mangroves in JMM Villages
2Kma
Fencing
Grazing
2=.~--=-=--Percent
D FuelWood
House Construction
N
A
A
Bayof
Bengal
':"':;".
Kaldnada Bay
@ Government of India Copyright 2002.Based upon Survey of India map with the permission of the Surveyor General ofindia.The responsibility for the correctness of internal details rests with the publisher.The territorial waters of India extend into the sea to a distance of twelve nauticalmiles measured from the appropriate base line.
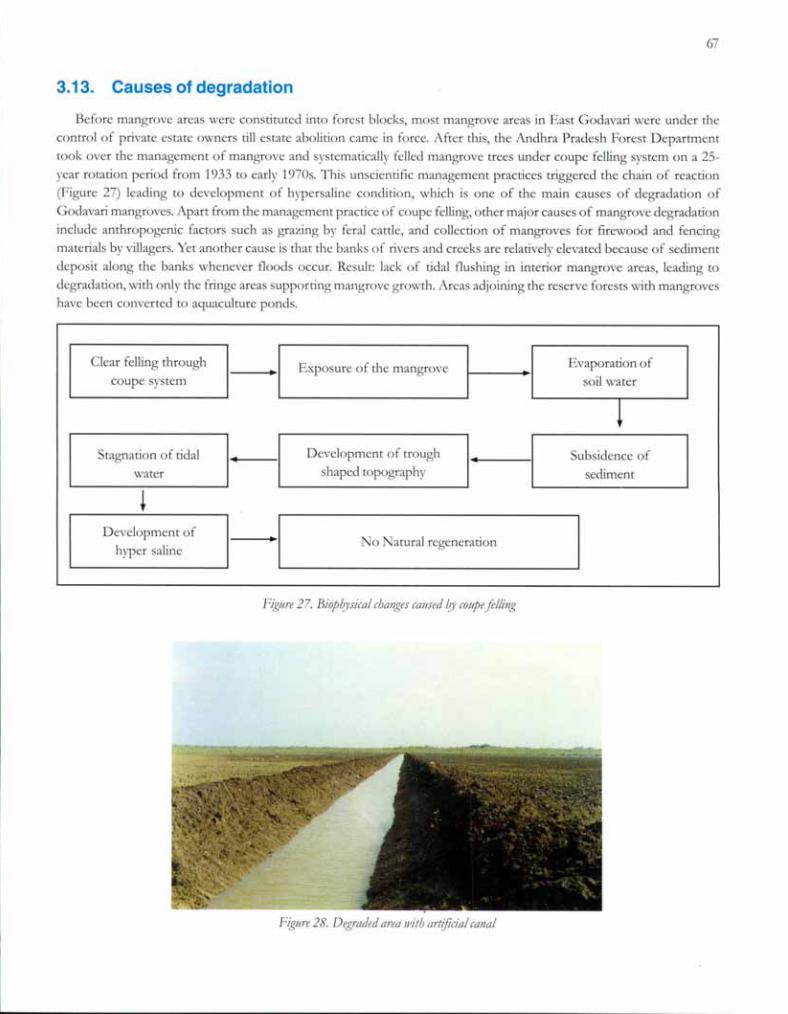
67
3.13. Causes of degradation
Before mangrove areas were constituted into forest blocks, most mangrove areas in East Godavari were under thecontrol of private estate owners till estate abolition came in force. After this, the Andhra Pradesh Forest Departmenttook over the management of mangrove and systematically felled mangrove trees under coupe felling system on a 25-year rotation period from 1933 to early 1970s. This unscientific management practices triggered the chain of reaction(Figure 27) leading to development of hypersaline condition, which is one of the main causes of degradation ofGodavari mangroves. Apart from the management practice of coupe felling, other major causes of mangrove degradationinclude anthropogenic factors such as grazing by feral cattle, and collection of mangroves for firewood and fencingmaterials by villagers. Yet another cause is that the banks of rivers and creeks are relatively elevated because of sedimentdeposit along the banks whenever floods occur. Result: lack of tidal flushing in interior mangrove areas, leading todegradation, with only the fringe areas supporting mangrove growth. Areas adjoining the reserve forests with mangroveshave been converted to aquaculture ponds.
Clear felling throughcoupe system
Stagnation of tidalwater
Exposure of the mangrove
Development of troughshaped topography
••
Evaporation ofsoil water
Subsidence ofsediment
Development ofhyper saline
No Natural regeneration
Figure 27. Biop0'sical changes callsed 0' cOllpejelling
Figure 28. Degraded area ]/Jith m1iftcial canal
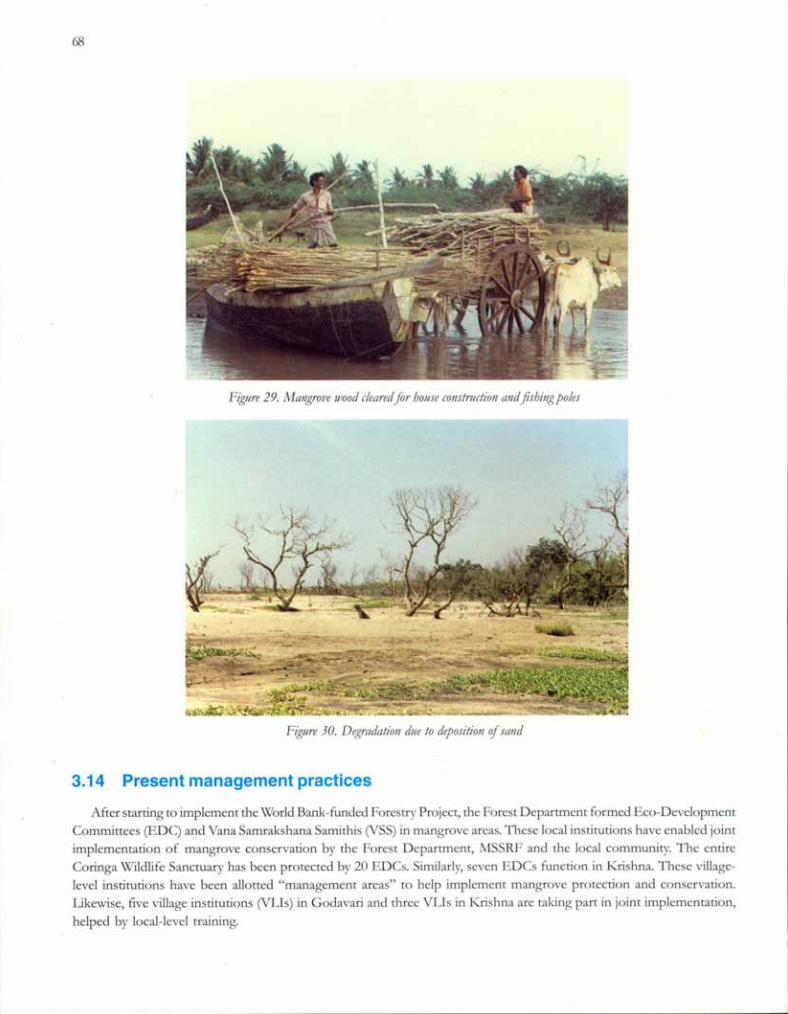
r--- -
68
Figllre 29. Mangrove wood clearedfor bOllseconst17lctionand ftsbingpoles
Figure 30. Degradation due to deposition 0/ sand
3.14 Present management practices
After starting to implement the World Bank-funded Forestry Project, the Forest Department formed Eco-DevelopmentCommittees (EDC) and Van a Samrakshana Samithis (VSS) in mangrove areas. These local institutions have enabled jointimplementation of mangrove conservation by the Forest Department, MSSRF and the local community. The entireCoringa Wildlife Sanctuary has been protected by 20 EDCs. Similarly, seven EDCs function in Krishna. These village-level institutions have been allotted "management areas" to help implement mangrove protection and conservation.Likewise, five village institutions (VLIs) in Godavari and three VLIs in Krishna are taking part in joint implementation,helped by local-level training.

69
3.15. Restoration and Redevelopment
Mangrove restoration activity on the lines of the Pichavaram model was initiated in degraded areas of the Krishna andthe Godavari. The Andhra Pradesh Forest Department initiated restoration of mangroves in the Godavari in 1991 with acanal-digging exercise. The canals were dug perpendicular to the river, with side canals at right angles to the main canal.An exposure visit to the Pichavaram mangrove restoration area was organized for Forest Department staff. After this theystarted digging canals at 30° from the main canal. This method reduces the rate of siltation of canals and also facilitateseasy flow of tidal water. The restoration of the Kobbarichettupeta ]\Iangrove Management Unit was done jointly with theForest Department. Canals in the plantations near Dindu raised by the Forest Department during 1995 have beenreoriented for proper tidal flushing by the MSSRF.
Restoration of degraded mangroves was carried out in the J\1angrove J\lanagement Units (JVIMU) of demonstrationvillages. An area of 520 ha. has been restored using the canal construction method in the Godavari and Krishnamangroves. The canals were designed in a trapezoidal shape with an angle of 45° to facilitate free flow of tidal water andfresh water. This is to reduce siltation. Of the 520 ha., 165 ha. were restored in the Godavari mangroves (Table 7), therest in the Krishna mangroves. The restoration in Godavari was done by five. village - level institutions (EDC and VSS)formed by the project in collaboration with the Forest Department. Restoration was undertaken only in RF areas in orderto ensure sustainable maintenance by the Forest Department and Village Level Institutions. Such restoration not merelyincreases healthy mangrove areas, it also arrested further degradation of pristine mangroves adjoining the degradedpatches. Canal construction in degraded areas expands the water body areas, and strengthens the resources of crab andother species. Training for nursery raising, canal digging and planting was conducted for the demonstration villagers.A community mangrove nursery was developed, and the saplings were used for planting in the restored area.
Replication ofjMM model by NGOs trained in the project
Three N GOs - Coastal Community Development Program (CCD P) of Machilipatnam; Sangamithra Service Societyof Vijayawada; and Sravanthi of Tallarevu - trained by the MSSRF unit at Andhra Pradesh, adopted the Joint MangroveManagement model and restored a mangrove area of 215 ha.
rlgtlre 31. Topographical slln'~'for restoration
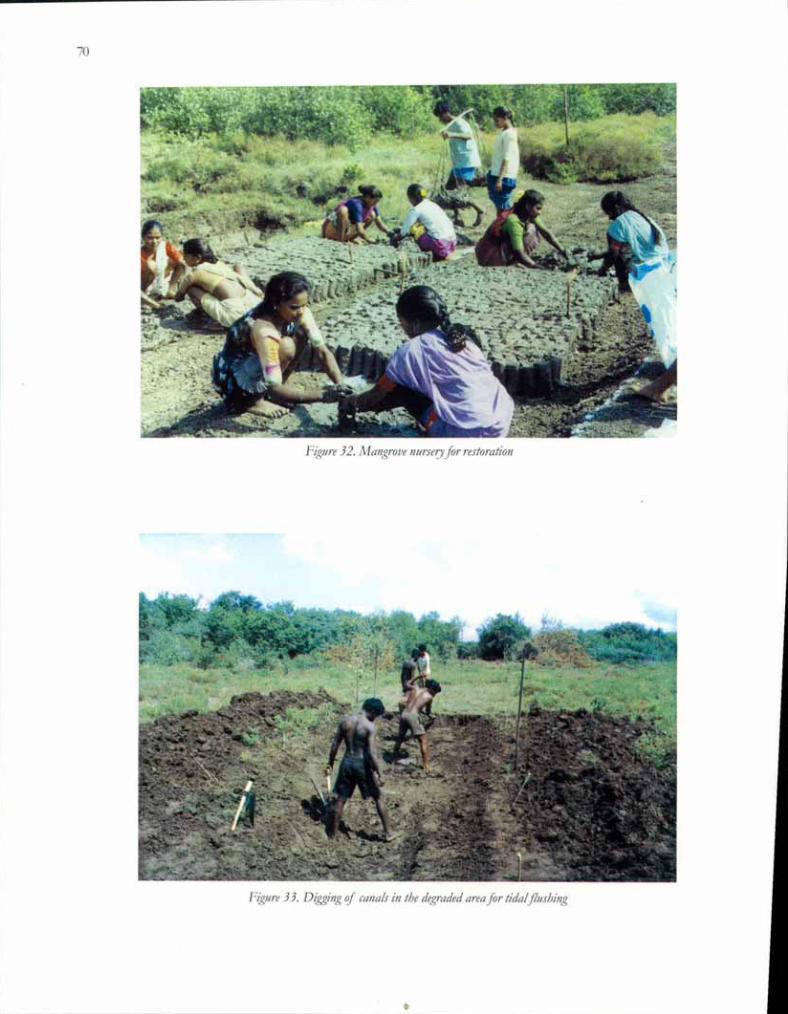
70
Figure 32. Afangrove mmeryfor restoratioll
Figure 33. Diggillg 0/ callais ill tbe degraded areafor tidal jlusbillg

Figure 34. Planting of IJJangrOl!e Jap/in,gJ along the cana/J
Table 7 Details of restoration and Mangrove Management Units - Godavari
71
Demonstration Village Area Restored (ha) Area under MMU (ha)
Matlapalem 5 502
Dindu 25 900
Kohharichettupeta 35 3925
Gadimob>a 25 900
Bhairavalanka 75 615
Total 165 6842
J

72
3.16 Changes in Mangrove vegetation between 1975 and 1986
i\ comparison of mangrove areas in the 1975 Survey of India toposheet and the Landsat 5 TM remote sensing data of1986 is revealing, what was indicated as core mangrove area in the Survey of India toposheet is found degraded in the1986 Landsat 5 TM data. Chapter 3.13 discussed the reasons for such degradation. Mangrove vegetation found in theperiphery of the sanctuary (boundary) ~ear villages, is degraded due to anthropogenic pressure. Mangroves on theeastern side of the sanctuary along the Bay of Bengal are eroded due to tidal action. But at the same time, accretion in theKakinada Bay increased the area of mangroves by about 350 ha. The accretion is due to sedimentation of alluvialdeposits from the Corangi, Gaderu and Matlapalem river runoff.
Mangrove vegetation near the southern bank of Godavari river (Nilarevu river) in Rathikaluva RF has erodedbecause of floods during the southwest monsoon. The course of the river has changed too, resulting in further mangroveerosion. Two islands south of Gerampeta conspicuous for dense mangroves in the 1975 Survey of India map, look lessimpressive in the 1986 Landsat 5 TM data: mangroves are now thinner in the eastern side; other mangrove areas arechanged to sandy.
But there are positive changes as well. In the northern side of the Kothapalem river mouth, the mudflats in 1975show up as mangrove vegetation in 1986 with many patches of new mangroves. Similarly, along the Godavari river nearBalusutippa RF the mudflats in 1975 now glow ,green with dense mangroves in 1986 (Map 3.23).
Figure 35. Erosion along the Cora1rgiRF Extension, AIa1rgrovesfad!rg Bery of Be!rgal

Map 3.23 Changes in Vegetation between 1975 and 1986
A
2Kmo2
LegendD Mangroves• Newly formed MangrovesD Degraded Mangroves
Bayof
Bengal
N
A
Kakinada Bay
@ Government of India Copyright 2002.Based upon Survey of India map with the pennission of the Surveyor General ofIndia.The responsibility for the correctness of internal details rests with the publisher.The territorial waters of India extend into the sea to a distance of twelve nauticalmiles measured from the appropriate base line.

74
3.17 Changes in Mangrove vegetation between 1986 and 1998
A comparison of 1986 Landsat 5 TM data and 1998 IRS 1D LlSS III data revealed an increase of about 680 ha whichis mainly due to new mangrove growth in newly accredited mud flats. The 1998 data shows that about 450 ha of densemangroves found outside the RF boundary in 1986 were converted into aguaculture farms.
Accretion in the Kakinada Bay area increased mangrove area by 412 ha and erosion along the shore in the eastern sideof the sanctuary area reduced mangroves by 495 ha (Map 3.24). The erosion of mangroves along the southern bank ofNilarevu river increased further; The river is wider in 1998 than 1986. Man!:,'Tovesnear the northern side of the Kothapalemriver mouth eroded on the seaward side and regenerated landward near Kothapalem village and in the lagoon near theKothapalem lighthouse.
3.18 Changes in Mangrove vegetation between 1998 and 2001
Mangroves that showed up as degraded in 1986 and 1998 satellite data are now found thinly covered with mangrovevegetation, by recently interpreted IRS LISS III data of2001 (Map 3.25). The mangrove plantations (discussed in Chapter3.14) organized by the Forest Department and by J\fSSRF under the ICEF-supported project "Coastal Wetland: MangroveConservation and Management" have helped to revive the degraded area. 2001 data has shown an increase in erosionalong the Bay of Bengal in the eastern side of the sanctuary, also an increase in accretion in the Kakinada Bay. Mangrovesin the accreted area near Uppulanka in the Kakinada Bay have increased (fable 8). The data shows an overall increase of367 ha between 1986 and 2001 and this was mainly due to the effort of the Forest Department under Andhra PradeshForestry Project.
Table 8 Changes in Mangrove Area (in ha)
Description Changes between1986 and 2001
Restoration ofman!:,'Tovesandnatural regenerationin the degraded areas 3275 (+)
Natural Regenerationin the accreted areas 223 (+)
Total increase 3498 (+)
Degradation due toAguaculture/ Saltpan 658 (-)
Erosion 806 (-)
Degradation due toother causes - coupefelling, !:,'Tazingand felling 1667 (-)
Tota11oss 3131 (-)
Net Increase 367
(-) Decrease in area (+) Increase in area
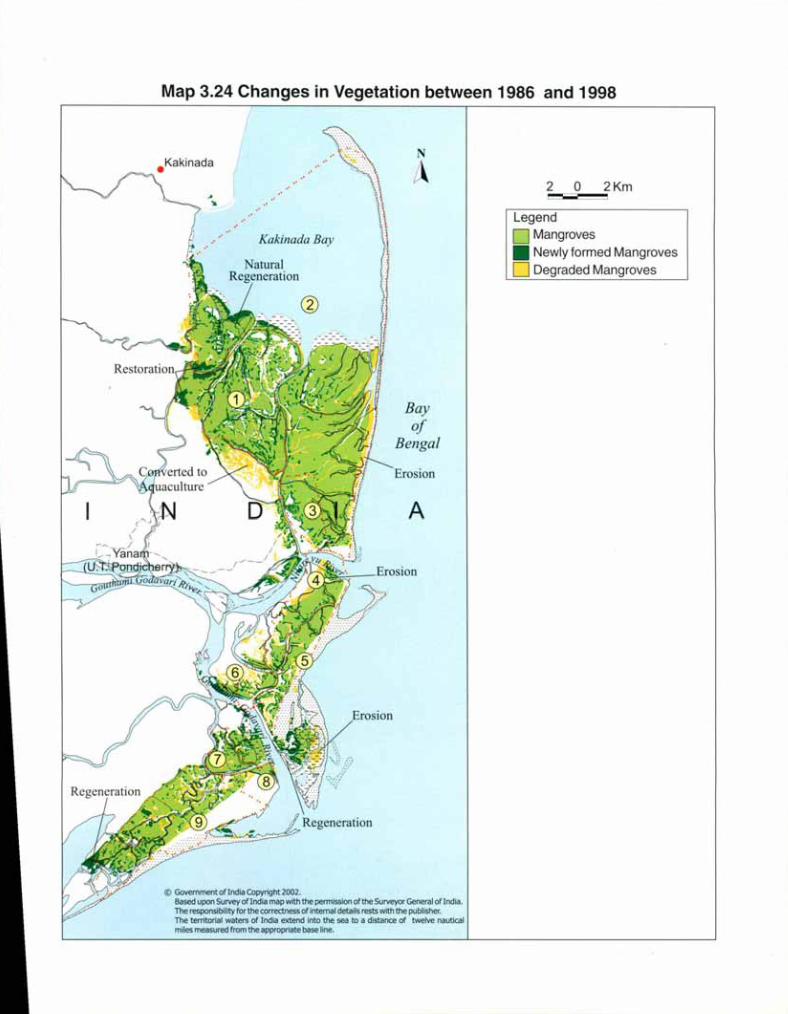
Map 3.24 Changes in Vegetation between 1986 and 1998
Erosion
2Kma2=----.:=---LegendD Mangroves• Newly formed MangrovesDDegraded Mangroves
Bayoj
Bengal
A
N
A
Kakinada Bay
@ Government of India Copyright 2002.Based upon Survey oflndia map with the permission of the Surveyor General oflndia.The responsibility for the correctness of internal details rests with the publisher.The territorial waters of India extend into the sea to a distance of twelve nauticalmiles measured from the appropriate base line.
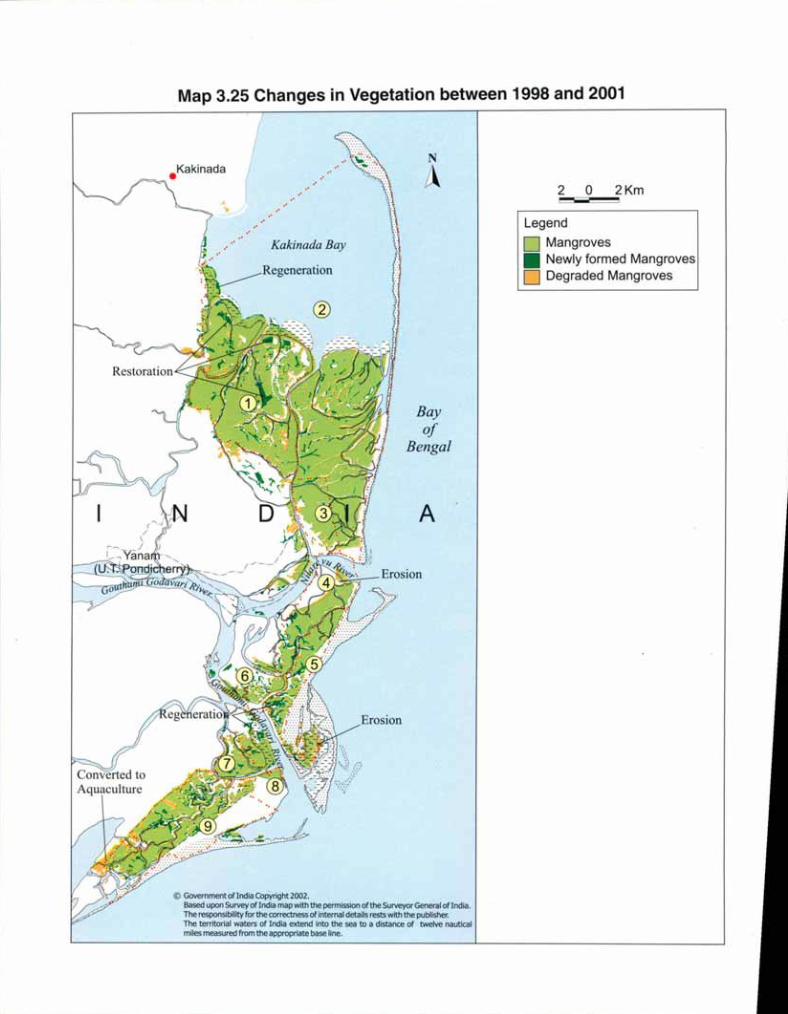
Map 3.25 Changes in Vegetation between 1998 and 2001
2Kmo~-2
LegendD Mangroves• Newly formed MangrovesD Degraded Mangroves
A
N
A
Bayof
Bengal
Kakinada Bay
@ Government of India Copyright 2002.Based upon Survey oflndia map with the permission of the Surveyor General of India.The responsibility for the correctness of internal details rests with the publisher.The territorial waters of India extend into the sea to a distance of twelve nauticalmiles measured from the appropriate base line.

77
3.19 Shoreline changes
As shorelines and coastal belts are dynamic, temporal changes in the mangrove wetlands were mapped on the basisof the shoreline derived from the 1970 Survey of India toposheet and the remote sensing data of 1986 and 2001.Appreciable changes are seen in both the sanctuary and non-sanctuary areas. Accretion in Kakinada Bay is due tosediment deposit from the Gaderu and Corangi rivers (distributaries of Gauthami Godavari river). The deposit ofsediments up to 300 meters towards the bay was noticed by comparing the latest data from earlier data.
The southern part of Kakinada port is eroded, but Hope Island is enlarging, and is extending north and northwest.The bay region has accretions from the north (near Uppulanka) to Gaderu river mouth in Corangi RF extension. Erosionwas noticed from the Gaderu river mouth onwards up to the sand bar of Hope Island; also from the end of Hope Islandup to the Nilarevu river mouth.
In the Nilarevu river mouth, the river course has changed a great deal from Yanam to the river mouth.
• The sand bed in the middle of the river has shifted southeast and joined the mainland near Gogullanka.
• The area under the Rathikaluva RF along the river has eroded to the extent of approximately 500 meters.
• The spit formation in the southern part of the Nilarevu river mouth has got extended northward. The river mouthhas also shifted towards northeast from east.
Unlike the sanctuary area, the southern part of the delta has acquired more accretions along its shoreline (northeastto Masanitippa). The non-reserve forest area south of the Masanitippa RF has eroded; the small mangroves found in thisarea have disappeared. The eroded material must have been deposited north of this area near Masanitippa. Accretion hasalso been noticed along the coastline southwest of the river mouth near Kothapalem village.
Coastline erosion has reduced both mangrove vegetation and beach sand. At the same time, accretion has led to anincrease in the mangrove area in the Kakinada Bay (Map 3.26).

Map 3.26 Shoreline Changes
N
A 2 0 2Kme:::--.:::=::s
.:.Legend
Kakinada Bay 2001 shoreline
.~
1986 shorelineShift inSpit -- 1975 shoreline
Bayof
Bengal
A
Erosion
@ Government of India Copyright 2002.Based upon Survey oflndia map with the permission of the Surveyor General of India.The responsibility for the correctness of Internal details rests with the publisher.The territorial waters of India extend into the sea to a distance of twelve nauticalmiles measured from the appropriate base line.

*JMM Villages
!\/lap 3.27 Villages abutting Mangrove!)
N
A
Kakinada Bay
Bayof
Bengal
A
@ Government of India Copyright 2002.Based upon Survey of India map with the permission of the Surveyor General of India.The responsibility for the correctness of internal details rests with the publisher.The territorial waters of India extend into the sea to a distance of twelve nauticalmiles measured from the appropriate base line.
2 2Km
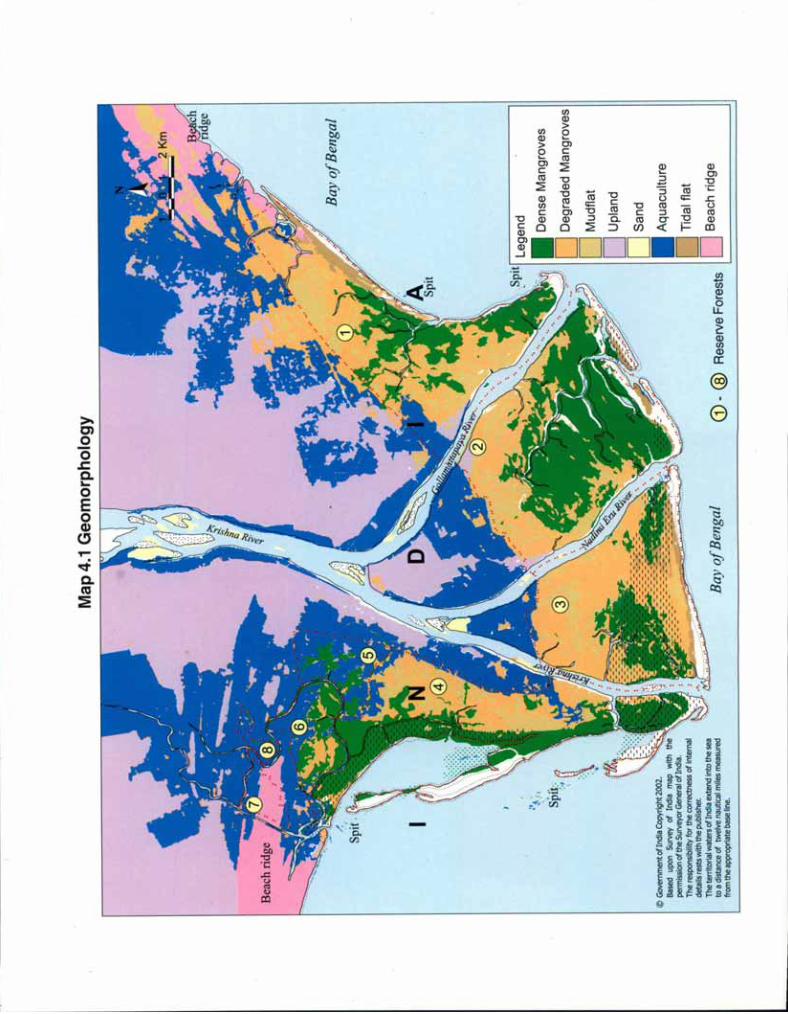
Map4.1Geomorphology
@GovernmentofIndiaCopyright2002.
Basedupon
Survey
ofIndia
map
with
the"
permissionoftheSurveyorGeneralofIndia.
Theresponsibilityforthe
correctness
ofInternal
detailsrestswiththepubiisher.
TheterritorialwatersofIndiaextend
intothesea
toadistanceof
twelve
nauticalm
ilesmeasured
fromtheappropriatebaseline.
BayofBengal
BayofBengal
Legend
_DenseMangroves
DDegraded
Mangroves
DMudflat
DUpland
DSand
IIAquaculture
DTidalflat
CD-@
ReseNe
ForestsID
Beachridge
I
APl1
CHAPTER 4
Krishna Mangrove Wetland
~
he Krishna mangroves in Andhra Pradesh are located in the coastal plains of Krishna delta. According to theForest Department, the total area under mangroves is 5,000 ha. The Krishna mangroves lie between 15°2' Nand 15° 55' N in latitude and 80° 42'- 81° 01' E in longitude spread across Krishna and Guntur districts.
The Krishna wildlife sanctuary has been established in a part of the mangrove wetland - the total area of this sanctuaryis 19,481 ha (194.81) sq.km.; it includes Sorlagondi Reserve Forest (RF), Nachugunta RF, Yelichetladibba RF, KottapalemRF, Molagunta RF, Adavuladivi RF and Lankivanidibba RF. They occupy the islands of the delta and the adjacentmainlands of both districts. A part of the mangroves is located far from the main mangrove area; it's near Machilipatnamon its eastern side and Nakshatranagar on its western side.
Fishermen in surrounding areas use the mangrove resources for fishing, house construction and firewood and toobtain fencing material for their houses. A devastating cyclone that hit the Machilipatnam coast during 1977 led to largeareas of the forest getting degraded.
4.1. Geomorphology
l\langrove areas near the river mouth joining the sea are slightly elevated because of sand casting. This inhibits theentry of tidal water into the area, thereby affecting mangrove growth. This type of area can be seen near Nadimeruand Gollamattapaya. The area is elevated along the edges of the delta, whereas the middle area is low-lying andswampy. The delta can be clearly segregated from the mainland through the beach ridge running from east to west, northof the delta.
4.2. Remote Sensing Imagery
Remote sensing imagery of the Krishna delta (2001), as acquired from IRS 10 LISS III data, shows a wide bright redpatch - mangrove vegetation in the delta. Most of the wetland and terrestrial area adjacent to the mangroves (dark blueto bluish gray) have been converted into aquaculture farms. Such farms also occupy some of the areas in Molasrunta RF,Kottapalem RF Bit NO.1 and 2, Adavuladivi RF and the northern part of the Lankivanidibba RF as seen in 2001 (Map4.3) which in not in 1986 data (Map 4.2). The northern part of the delta consists of farm fields that show up as fallowland in the imagery. Small mangrove islands (Lankivanidibba RF) are found on the western part of the delta's shoreline.In Yelichetladibba RF, a bluish gray strand indicates water stagnation. Remote sensing data from various satellitesensors of various years have been used in this atlas to prepare thematic maps of the wetland area and monitorchanges in the mangroves of the Krishna delta.
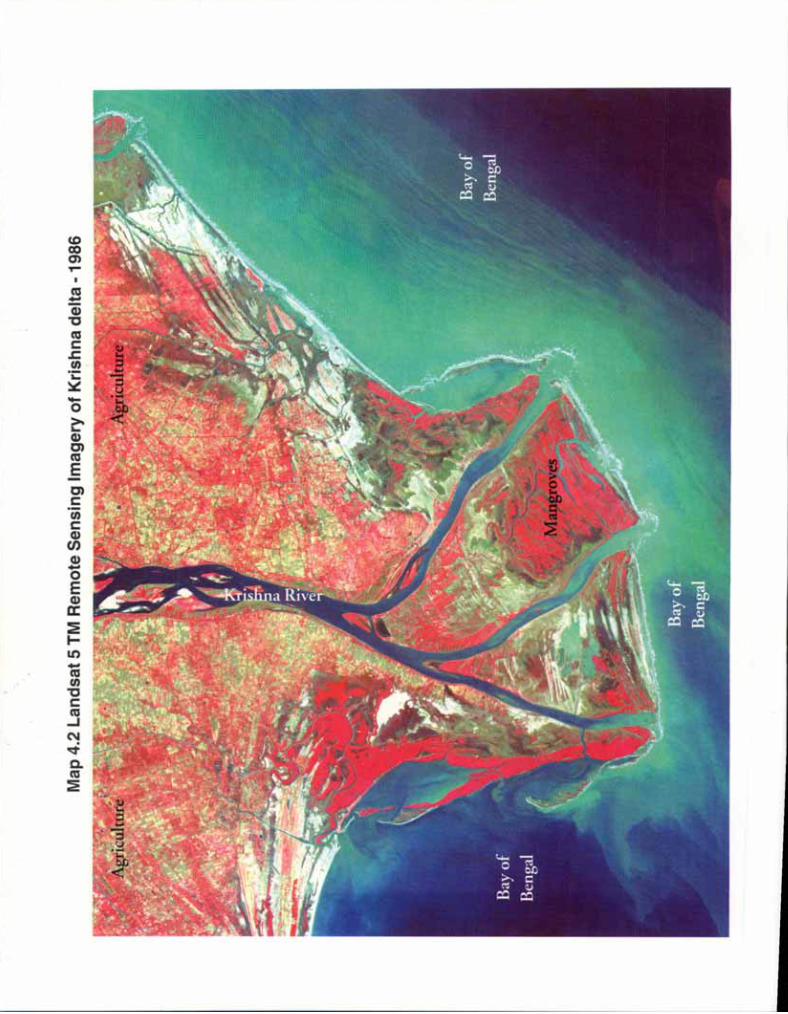

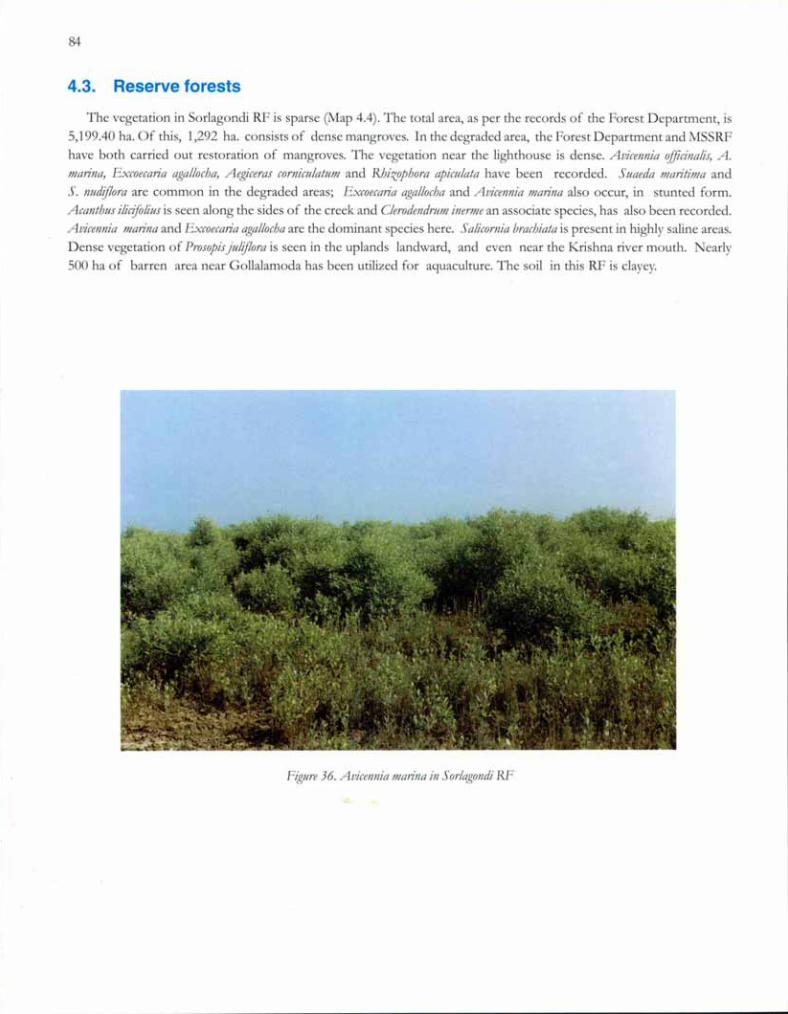
84
4.3. Reserve forests
The vegetation in Sorlagondi RF is sparse (Map 4.4). The total area, as per the records of the Forest Department, is5,199.40 ha. Of this, 1,292 ha. consists of dense mangroves. In the degraded area, the Forest Department and MSSRFhave both carried out restoration of mangroves. The vegetation near the lighthouse is dense. Avicellllia officilla/is, A./lianna, Excoecana aga//ocha, Aegiceras comim/atu/II and Rhizophora apim/ata have been recorded. Suaeda /IIaf7ti/lla andS. nlldiflora are common in the degraded areas; Excoecan'a aga//ocha and Avicellllia /IIarina also occur, in stunted form.Acanthus diciio/ills is seen along the sides of the creek and C/erodelldm/ll iner/lle an associate species, has also been recorded.Avicellnia /IIanna and Excoecana aga//ocha are the dominant species here. Sa/icomia brachiata is present in highly saline areas.Dense vegetation of Prosopis )u/iflora is seen in the uplands landward, and even near the Krishna river mouth. Nearly500 ha of barren area near Gollalamoda has been utilized for aquaculture. The soil in this RF is clayey.
rigllre 36. Avim/llia /IIaf711ain Sorlagolldi RF
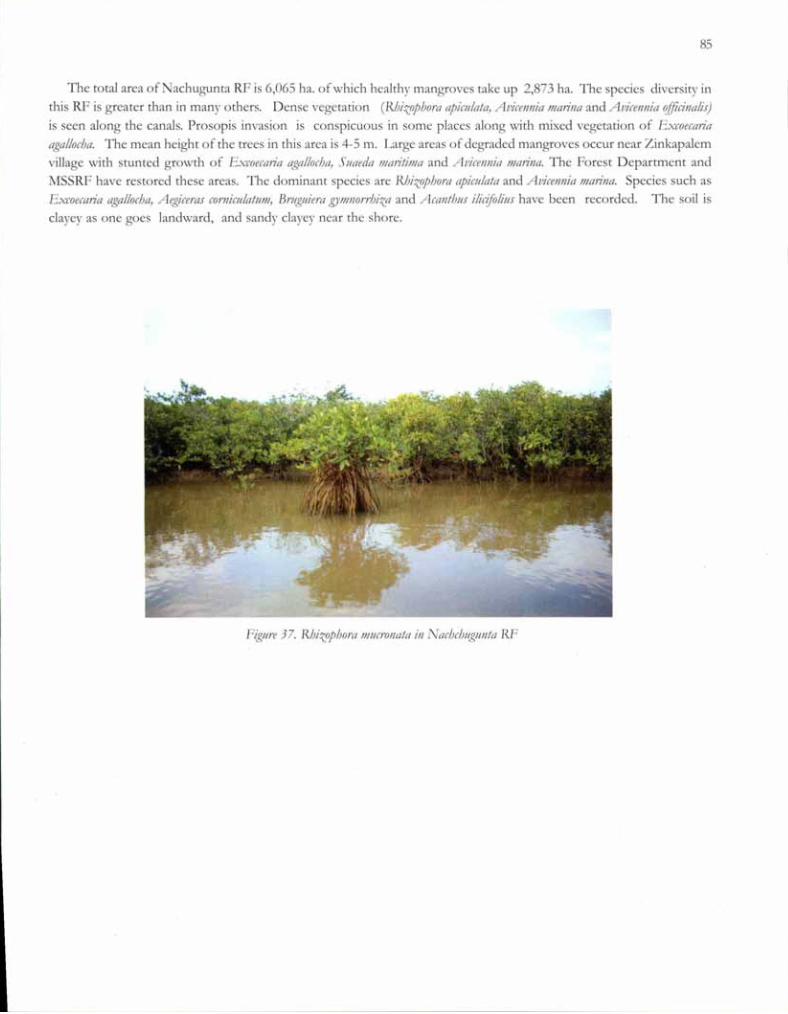
85
The total area of Nachugunta RF is 6,065 ha. of which healthy mangroves take up 2,873 ha. The species diversity inthis RF is greater than in many others. Dense vegetation (Rbizopbom apiClila/a, ALJiceJlllia lJIarilia and AlJiceI7l1ia ofjidllalis)is seen along the canals. Prosopis invasion is conspicuous in some places along with mixed vegetation of Ewoecm7aagallocba. The mean height of the trees in this area is 4-5 m. Large areas of degraded mangroves occur near Zinkapalemvillage with stunted growth of Excoecm7a agallocba, SlIaeda IJICll7/ilJlaand Al,ieeJlllia lJIal7l1a. The Forest Department andMSSRF have restored these areas. The dominant species are Rbizopoom apiClila/a and AIJimlllia lJIal7l1a. Species such asExcoeearia agalloeoa, Aegieeras corniClila/IIlIl, Bmglliera g)llJIliorroiza and Acali/OIlS ilidiolills have been recorded. The soil isclayey as one goes landward, and sandy clayey near the shore.
Figllre 37. RNzopoora "merolla/a ill Naebeollgllll/a RF
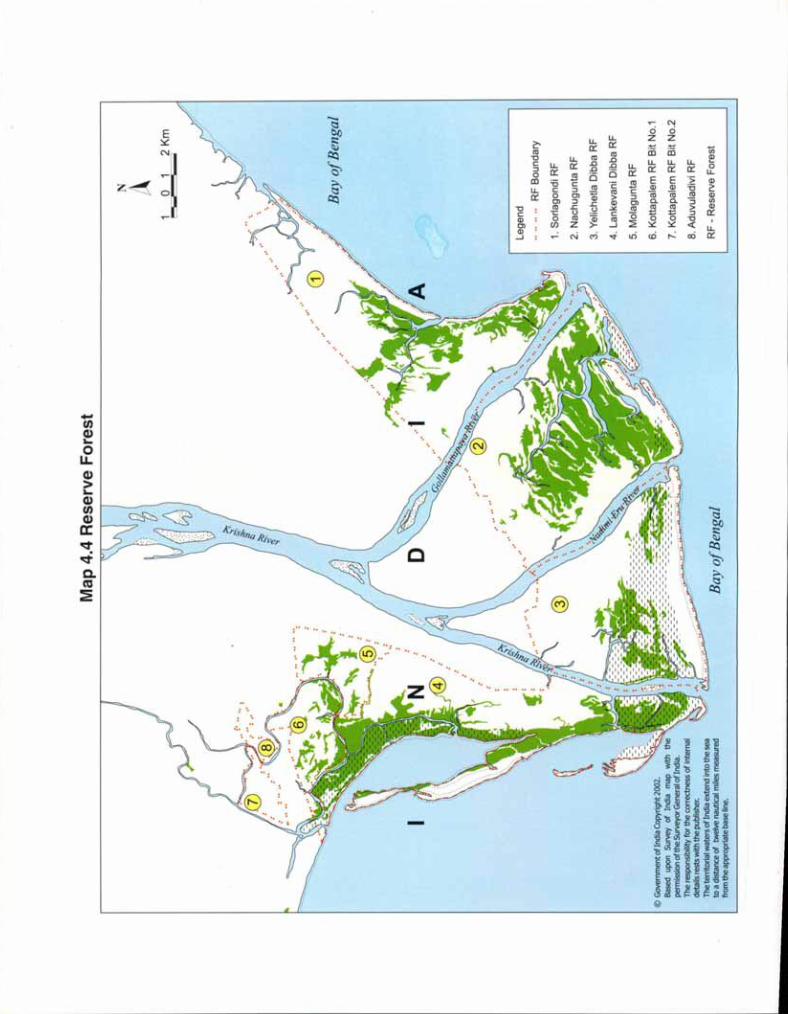
Map
4.4Reserve
Forest
Legend
BayofBengal
RFBoundary
1.SorlagondiRF
2.NaehuguntaRF
3.Yeliehetla
Dibba
RF
4.LankevaniDibba
RF
5.Molagunta
RF
6.Kottapalem
RFBitNO.1
7.Kottapalem
RFBitNO.2
8.Aduvuladivi
RF
RF-Reserve
Forest2Km
N A1
0~
BayofBengal
@Governmentofindia
Copyright
2002.
"Based
upon
Survey
ofIndia
map
with
the"
pem1issionoftheSurveyorGeneralofIndia.
Theresponsibility
forthecorrectnessofinternal
details
restswith
thepublisher.
TheterritorialwatersofIndiaextend
intothesea
toadistance
oftwelve
nautical
milesmeasured
fromtheappropriate
baseline.
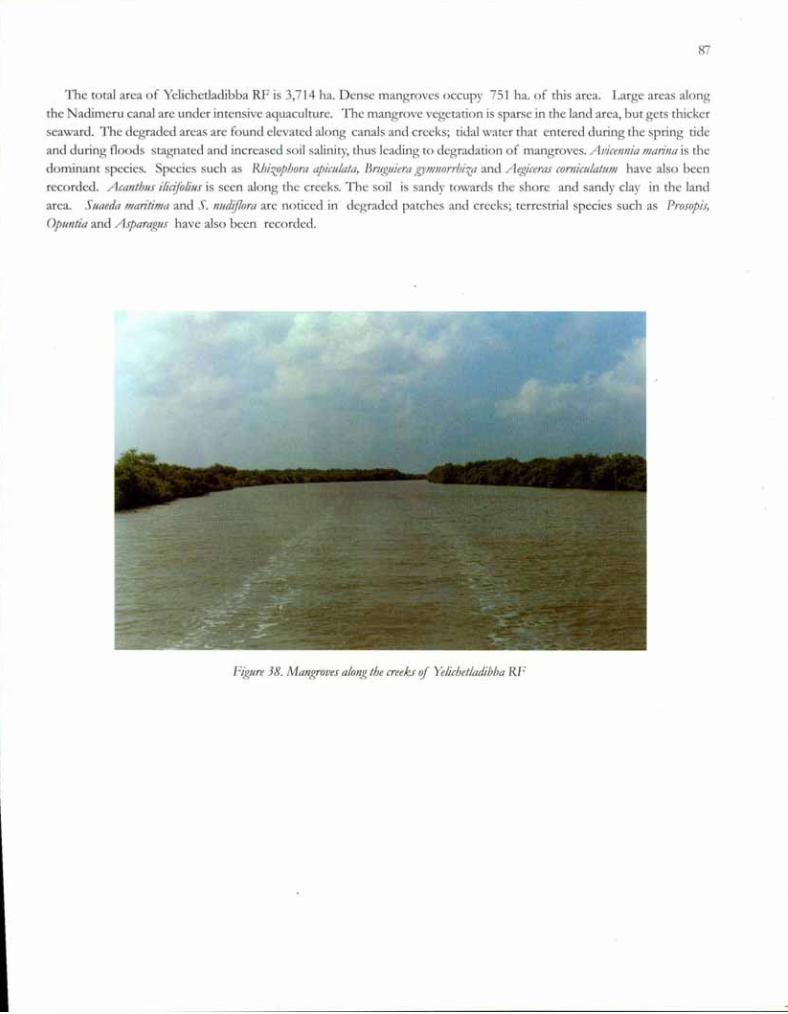
87
The total area of Yelichetladibba RF is 3,714 ha. Dense mangroves occupy 751 ha. of this area. Large areas alongthe Nadimeru canal are under intensive aquaculture. The mangrove vegetation is sparse in the land area, but gets thickerseaward. The de/:,>radedareas are found elevated along canals and creeks; tidal water that entered during the spring tideand during floods sta/:,'11atedand increased soil salinity, thus leading to degradation of mangroves. Avicennia ilia/ina is thedominant species. Species such as Rhizophora apimlata, 13mguiera X,Yl//flOrrhiza and Aegiceras comimlatwll have also beenrecorded. Acanthus ilicijolius is seen along the creeks. The soil is sandy towards the shore and sandy clay in the landarea. Suaeda maritima and S. nudiflora are noticed in degraded patches and creeks; terrestrial species such as Prosopis,Opuntia and Asparagus have also been recorded.
Figure 38. Mangroves along the creeks r!f Yelichetladibba RF

88
Kottapalem RF is named after the village Kottapalem situated nearby. The total area of the RF is 1,554 ha, of whichhealthy mangroves occupy only 285 ha. Large areas of degraded patches near Vasalsink kalava have been convertedinto aquaculture farms.
Thick vegetation of A1Jicellnia /JIarina, Rhizopbora apiCli/ata, Rhizopbora /JIlICl'Onataand Bmglliera ry/indrica, Bmguieragy/JInorrbiifl,){y/ocarp"s granatll/JI is seen along the canals. Jllaeda /JIatiti/JIa and Ja/icornia brachiata occur in abandoned aqua farms as wellas in the degraded areas. Species such as Ceriops decandra, Avicellnia officina/is, C/erodelldmlll iner/JIe, Jesllvill/JI pOl111/acastm/JI andJa/icornia brachiata have been recorded.
Figllre 39. Avicellnia officina/is
Figllre 40. Rhizophora apiCli/ata

~G.AP12
89
The total area under Lankivanidibba RF is 5,382 ha. of which 1,974 ha. is covered with thick mangrove vegetation.Species such as A~'ieeJ1nia Illanna, A. ifftcina/is, _'0'/oearp"s granatlllll, Exeoeeal7'a aga//oeha, Celiops deeandra, RIJizophora apiCII/ataand I3mglliera q/indliea have been recorded. The vegetation is fairly thick. Large degraded areas are found in this RF.Anthropological pressure is noticed from villages nearby such as Molagunta, Kottapalem, Patur, Nakshatranagar andLankivanidibba. The soil in this RF is clayey. Prosopis invasion is high in some areas.
Figllre 41. RJ)izophora IJIlleronata found along the ereekJ qf Lonkivanidibba RF

.'.- .-
. io'.'''' ,,"~ ~.~ '- '~.. '''';'~''' ii Ii" ';".
Bay of Bengal
o~--N
L~
Map 4.5a Mangrove Species Zonation - Western Part
Bay ofBengal
Legend
IIAvic~nniamanna
IIBruguieracylindrica
D Excoecariaagallocha
IIRhizophora spp.
IISuaeda spp.
@ Government of India Copyright 2002.Based upon Survey of India map with the permission of theSurveyor General of India.The responsibility for the correctness of internal details rests withthe publisher.The territorial waters of India extend into the sea to a distance oftwelve nautical miles measured from the appropriate base line.
..............
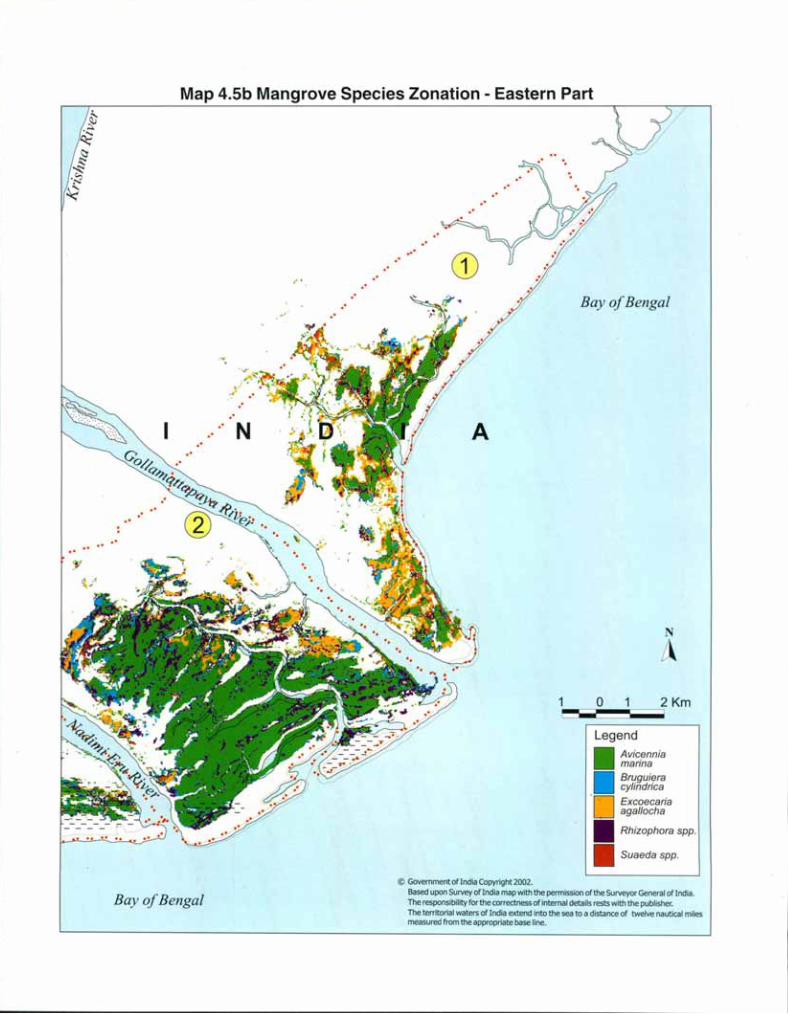
Map 4.5b Mangrove Species Zonation - Eastern Part
A
Bay of Bengal
N
A1 2 Km==:JAvicenniamarinaBruguieracylindricaExcoecariaagallocha
Legend
II.~IIRhizophora spp.
IISuaeda spp.
1 0~-
.'.'
.'.'..'
.'.'.'
.'.'
.'
.' .'
.'
"'~""~'~""';'."'~ .
Bay of Bengal@ Government of India Copyright 2002.Based upon Survey oflndia map with the permission of the Surveyor General of India.The responsibility for the correctness of internal details rests with the publisher.The territorial waters of India extend into the sea to a distance of twelve nautical milesmeasured from the appropriate base line.
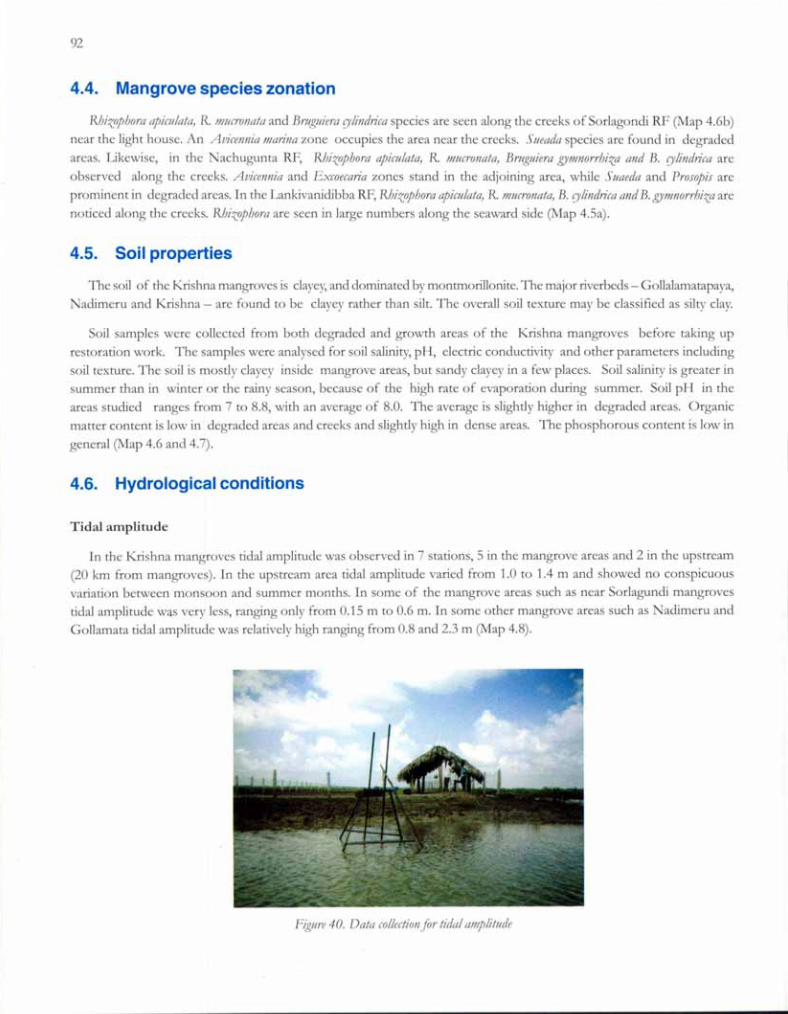
92
4.4. Mangrove species zonation
Rbizopbora apimlata, R. IIII/ClVlwta and Bmgt/iera rylilldrica species are seen along the creeks of Sorlagondi RF (Nlap 4.6b)near the light house. An A'JiceJJllia lIIanlia zone occupies the area near the creeks. St/eada species are found in degradedareas. Likewise, in the Nachugunta RF, Rbizopbora apiculata, R. IIII/crollata, Bmgt/iem gylllllorrbiza alld B. rylilldnca areobserved along the creeks. Avicellnia and Excoecana zones stand in the adjoining area, while St/aeda and Prosopis areprominent in degraded areas. In the Lankivanidibba RF, Rhizophom apiculata, R. lIIt/cronata, B. rylindnca and B.gylllllorrhiza arenoticed along the creeks. RlJizopbom are seen in large numbers along the seaward side (Map 4.5a).
4.5. Soil properties
The soil of the Krishna mangroves is clayey, and dominated by montmorillonite. The major riverbeds - Gollalamatapaya,adimeru and Krishna - are found to be clayey rather than silt. The overall soil texture may be classified as silty clay.
Soil samples were collected from both degraded and growth areas of the Krishna mangroves before taking uprestoration work. The samples were analysed for soil salinity, pH, electric conductivity and other parameters includingsoil texture. The soil is mostly clayey inside mangrove areas, but sandy clayey in a few places. Soil salinity is greater insummer than in winter or the rainy season, because of the high rate of evaporation during summer. Soil pH in theareas studied ranges from 7 to 8.8, with an average of 8.0. The average is slightly higher in degraded areas. Organicmatter content is low in degraded areas and creeks and slightly high in dense areas. The phosphorous content is low ingeneral (Map 4.6 and 4.7).
4.6. Hydrological conditions
Tidal amplitude
In the Krishna mangroves tidal amplitude was observed in 7 stations,S in the mangrove areas and 2 in the upstream(20 km from man!:,'Toves). In the upstream area tidal amplitude varied from 1.0 to 1.4 m and showed no conspicuousvariation between monsoon and summer months. In some of the mangrove areas such as near Sorlagundi mangrovestidal amplitude was very less, ranging only from 0.15 m to 0.6 m. In some other mangrove areas such as Nadimeru andGollamata tidal amplitude was relatively high ranging from 0.8 and 2.3 m (Map 4.8).
Figure 40. Data collectioll for tidal alllplitude
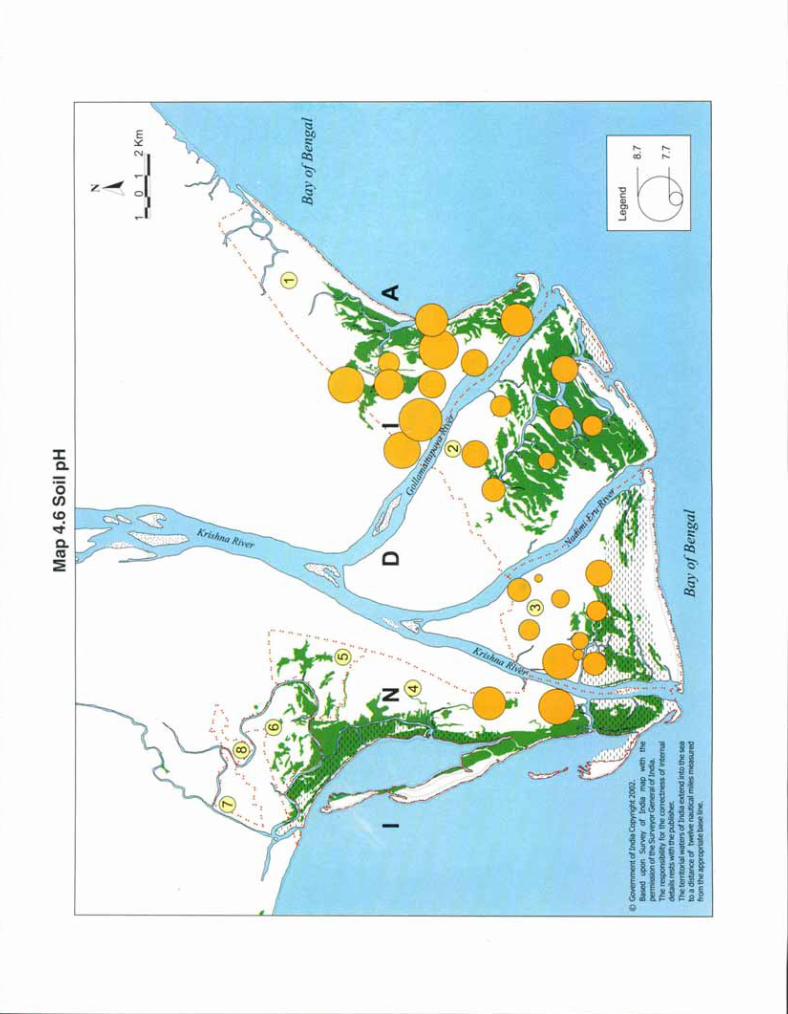
BayofBengal
@GovernmentofIndiaCopyright
2002.,.,
Based
upon
Survey
ofIndia
map
with
the
permission
oftheSurveyorGeneralofIndia.
Theresponsibility
forthecorrectnessofinternal
details
restswith
thepublisher.
TheterritorialwatersofIndiaextend
intothesea
toadistance
oftwelve
nautical
milesmeasured
fromtheappropriate
baseline.
Map
4.6SoilpH
BayofBengal
N L~1
0~ Legend 0=
2Km
8.7
7.7
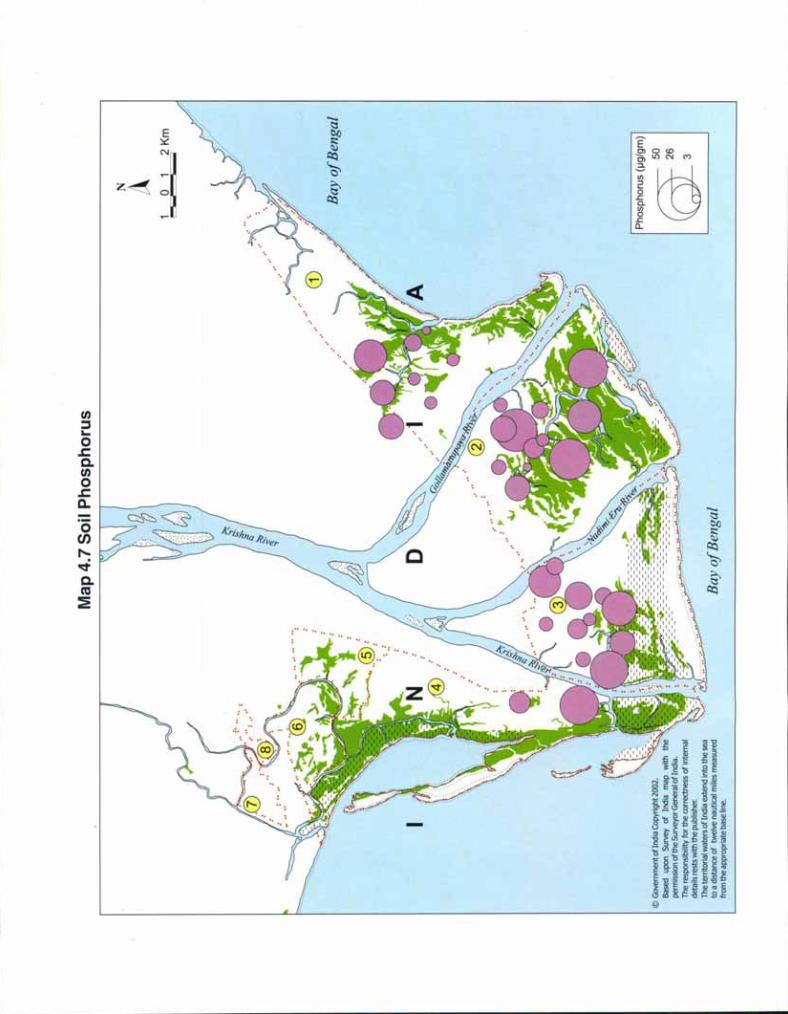
Map
4.7SoilPhosphorus
BayofBengal
o1
2Km
~N A ((j
Phosphorus
(lJg/gm)
50 26 3
BayofBengal
@GovernmentofIndiaCopyright2002.
Basedupon
Survey
ofIndiamap
with
the
permissionoftheSurveyorGeneralofIndia.
Theresponsibilityforthecorrectnessofinternal
detailsrestswiththepublisher.
TheterritorialwatersofIndiaextendintothesea
toadistanceof
twelvenauticalmilesmeasured
fromtheappropriatebaseline.
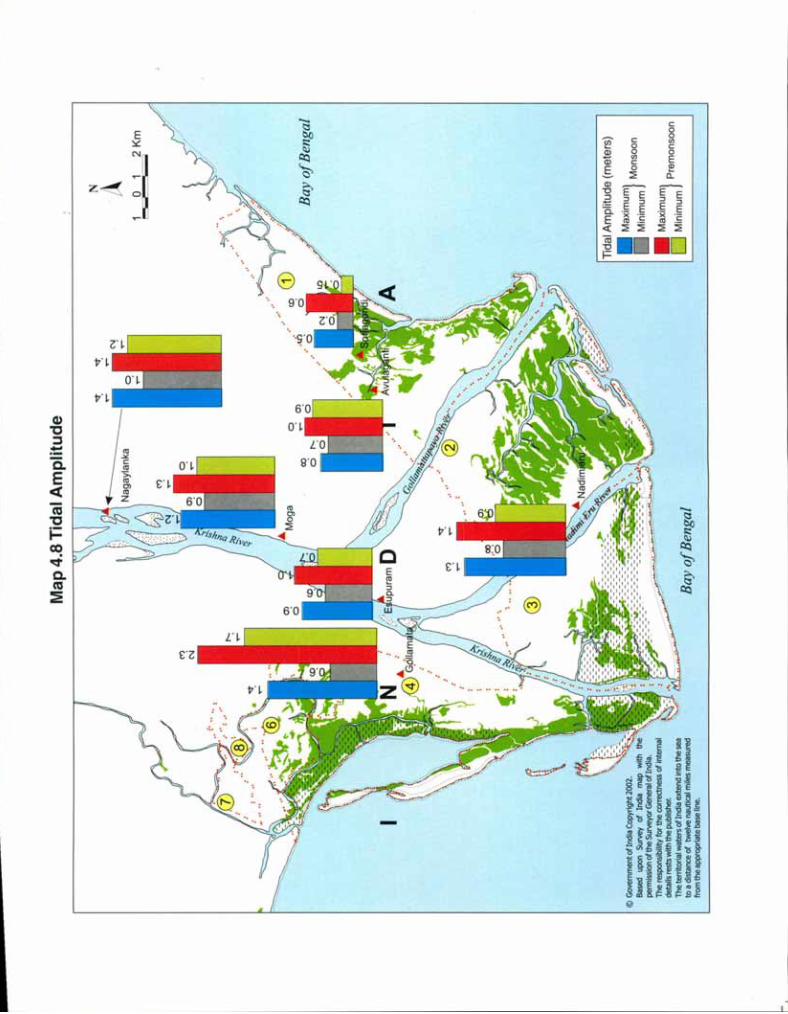
~ \
@GovernmentofIndiaCopyright2002.
Basedupon
Survey
ofIndiamap
with
the"
permissionoftheSurveyorGeneralofIndia.
Theresponsibilityforthecorrectnessofinternal
detailsrestswiththepublisher.
TheterritorialwatersofIndiaextendintothesea
toadistanceof
twelve
nauticalmilesmeasured
fromtheappropriatebaseline.
Map4.8TidalAmplitude
BayofBengal
"!;"!;
N A1
01
2Km
~-==l-'
BayofBengal
TidalAmplitude
(meters)
•MaXimUm}Monsoon
_Minimum
•MaXimUm}
O..
Premonsoon
Minimum
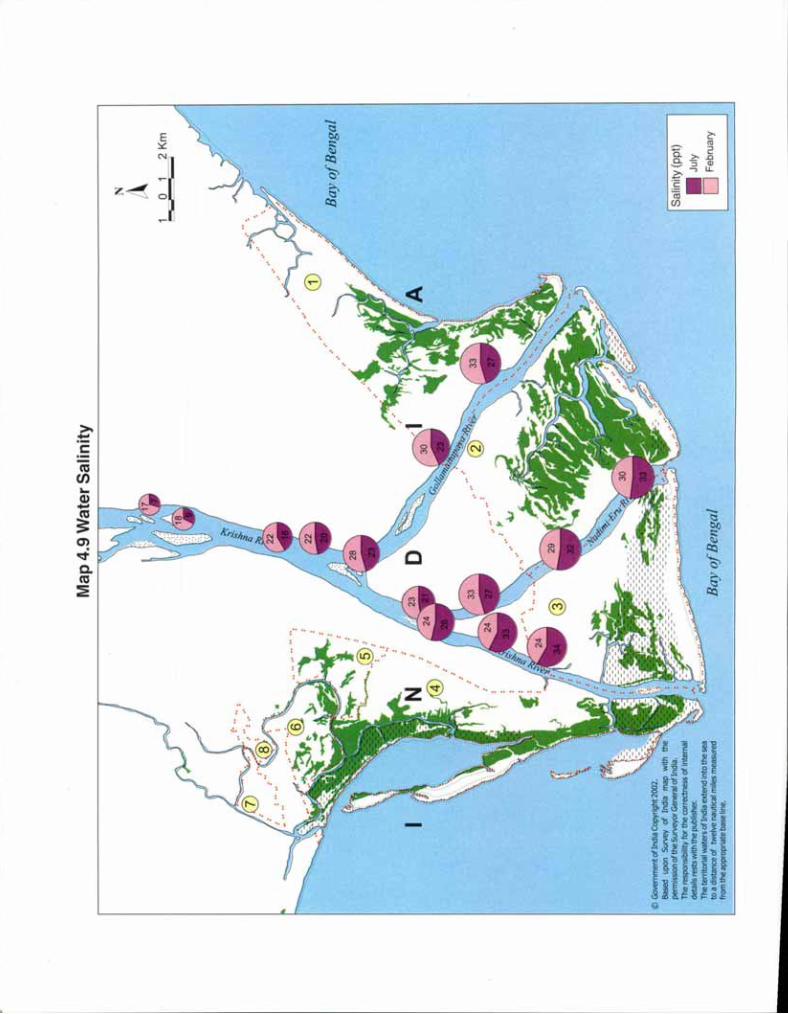
(! \1 ~ "..
@GovernmentofIndiaCopyright2002.
Basedupon
Survey
ofIndiamap
with
the
permissionoftheSurveyorGeneralofIndia.
Theresponsibilityforthecorrectnessofinternal
detailsrestswiththepublisher.
TheterritoriaiwatersofIndiaextend
Intothesea
toadistanceof
twelvenauticalmilesmeasured
fromtheappropriatebaseline.
Map4.9WaterSalinity
BayojBengal
N L~L
01
2Km
- BayojBengal
Salinity(ppt)
•July
DFebruary

~'"
,~.;''''
'\;. I\; \1-
" "'\,tr' \,( \\ '~ .. r&til" \e~.
i1--.;
"'\f~~:~.:
@GovernmentofIndiaCopyright2002,
",:{'"~:.;;~
Basedupon
Survey
ofIndiamap
with
the'
'~;
permissionoftheSurveyorGeneralofIndia,
'\Theresponsibilityforthe.correctnessofinternal
'~,'''''"'':''f:'-
detalisrestsWiththepublisher.
'~~-
-:1,,-,
The!enntorialwatersofIndiaextend
intothesea
'"",."
toadistanceof
twelve
nauticalmilesmeasured
fromtheappropriatebaseline.
Map
4.10
WaterTemperature
BayofBengal
N !~
o1
2Km
-- BayofBengal
Temperature
(Oc)
•July
DFebruary
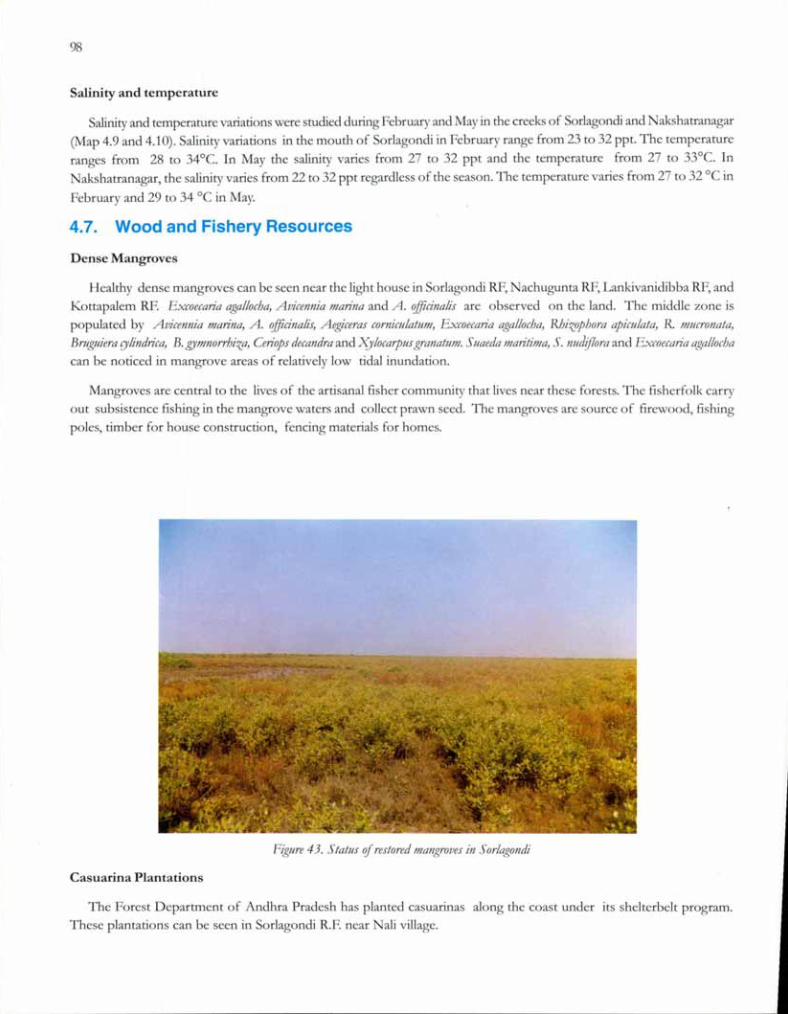
98
Salinity and temperature
Salinity and temperature variations were studied during February and May in the creeks of Sor1agondi and Nakshatranagar(Map 4.9 and 4.10). Salinity variations in the mouth of Sorlagondi in February range from 23 to 32 ppt. The temperatureranges from 28 to 34°C. In May the salinity varies from 27 to 32 ppt and the temperature from 27 to 33°C. InNakshatranagar, the salinity varies from 22 to 32 ppt regardless of the season. The temperature varies from 27 to 32°C in
February and 29 to 34°C in May.
4.7. Wood and Fishery Resources
Dense Mangroves
Healthy dense mangroves can be seen near the light house in Sorlagondi RF, Nachugunta RF, Lankivanidibba RF, andKottapalem RF. Excoecaria agallocba, Avicennia marina and A. rifJicinalis are observed on the land. The middle zone ispopulated by Avicennia marina, A. rifJicinalis, Al(giceras corniculatlllll, Excoecan'a agallocha, Rbizopbora apiculata, R /JlJlcronata,Bmglliera rylindrica, B.gymnorrhiza, Ceriops decandra and XJlocmplls granatllm. SlIaeda IIImitima, S. nlldij70ra and Excoecaria agallochacan be noticed in mangrove areas of relatively low tidal inundation.
Mangroves are central to the lives of the artisanal fisher community that lives near these forests. The fisherfolk carryout subsistence fishing in the manhtrove waters and collect prawn seed. The mangroves are source of firewood, fishingpoles, timber for house construction, fencing materials for homes.
Figllre 43. Status if restored mangroves in SorlagondiCasuarina Plantations
The Forest Department of Andhra Pradesh has planted casuarinas along the coast under its shelterbclt program.These plantations can be seen in Sor1agondi R.E near Nali village.

99
Prosopis Invasion
Invasion by Prosopis in the mangrove area is prominent and pervasive all along the three main distributaries ofKrishna River as well as in the interior of some of the mangrove forests. Dense Prosopis vegetation is observed alongthe Gollamatapaya river up to the river mouths of the Krishna.
Figure 44. 111I'aSioll0/Prosopis ill man grows
Fishes
Fish species such as catfish, mullets, snappers, milkfish, carps, tilapia and mudskipper are common in mangroveareas. Snails, crabs, prawns and molluscs are also found. Prawn species such as Penaells IIJotlOdon and P.indiClls are quitecommon. Many varieties of edible crabs live in mangrove areas, and giant fresh water prawns in swampy areas.
Figllre 45. Dry fish and prallJII for marketing
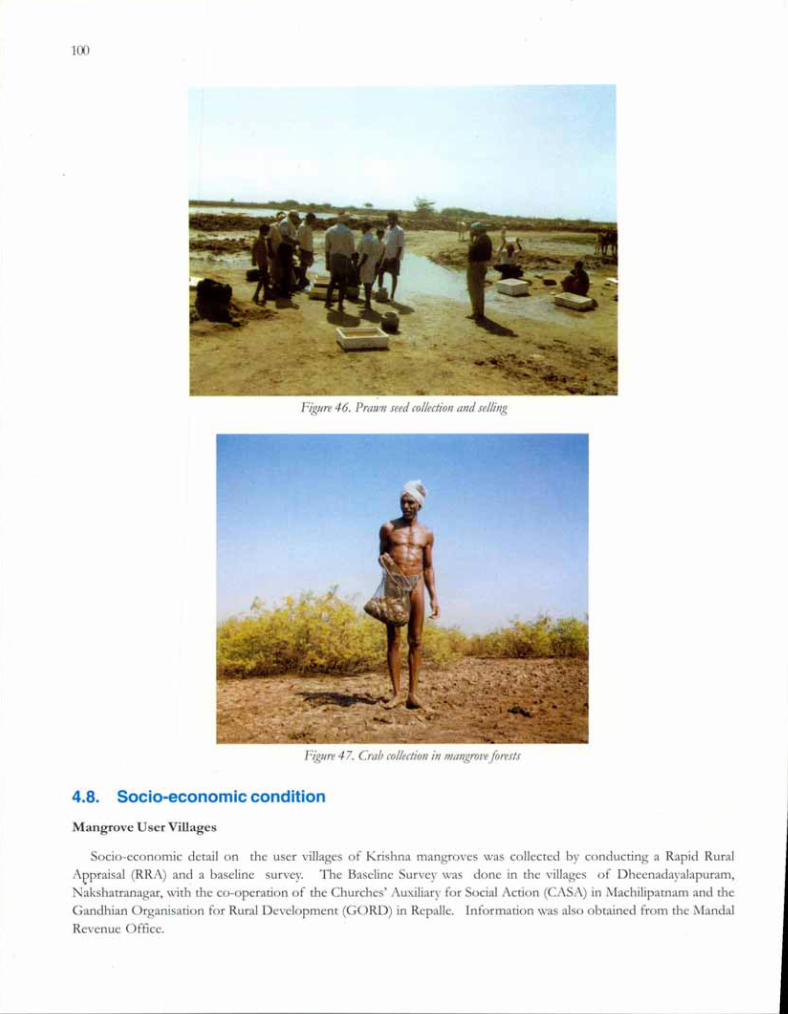
100
Figure 46. Prall'n seed collection alld selling
Figure 47. Crab collectioll ill mangrolJe forests
4.8. Socio-economic condition
Mangrove User Villages
Socio-economic detail on the user villages of Krishna mangroves was collected by conducting a Rapid RuralAppraisal (RRA) and a baseline survey. The Baseline Survey was done in the villages of Dheenaclayalapuram,Nakshatranagar, with the co-operation of the Churches' Auxiliary for Social Action (CASA) in Machilipatnam and theGandhian Organisation for Rural Development (GORD) in Repalle. Information was also obtained from the MandaiRevenue Office.
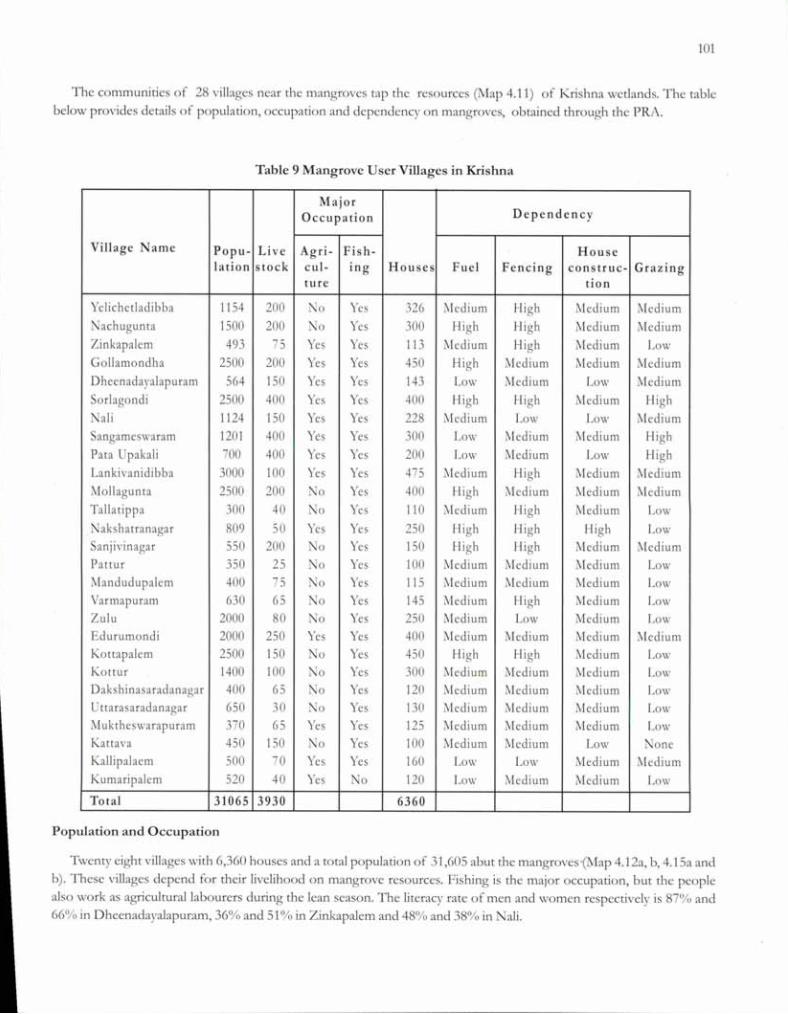
101
The communities of 28 villages near the mangroves tap the resources (Map 4.11) of Krishna wetlands. The tablebelow provides details of population, occupation and dependency on mangroves, obtained through the PRA.
Table 9 Mangrove User Villages in Krishna
MajorDependencyOccupation
Village Name Popu- Live Agri- Fish- House\ation stock cul- ing Houses Fuel Fencing construc- Grazing
ture tion
Ye!ichetladi bba 1154 200 No Yes 326 ~Iedium High ~Iedium MediumNachugunta 1500 200 No Yes 300 High High Medium MediumZinkapalem 493 75 Yes Yes 113 ~Iedium High Medium LowGollamondha 2500 200 Yes Yes 450 High Medium Medium MediumD heenada yalapuram 564 150 Yes Yes 143 Low Medium Low MediumSorlagondi 2500 400 Yes Yes 400 High High Medium HighNali 1124 150 Yes Yes 228 Medium Low Low MediumSangameswaram 1201 400 Yes Yes 300 Low ~Iedium Medium HighPata Upakali 700 400 Yes Yes 200 Low ~Iedium Low HighLankivanidibba 3000 100 Yes Yes 475 ~Iedium High i\ledium ~IediumMollagunta 2500 200 No Yes 400 High ~Iedium Medium MediumTallatippa 300 40 No Yes 110 ~Iedium High Medium LowNakshatranagar 809 50 Yes Yes 250 High High High LowSanjivinagar 550 200 No Yes 150 High High i\ledium MediumPattur 350 25 No Yes 100 Medium Medium r.ledium Low~Iandudupalem 400 75 No Yes 115 i\ledium Medium ~Iedium LowVarmapuram 630 65 No Yes 145 i\ledium High Medium LowZulu 2000 80 No Yes 250 Medium Low i\[edium LowEdurumondi 2000 250 Yes Yes 400 i\ledium Medium Medium ~IediumKottapalem 2500 150 No Yes 450 High High r.ledium LowKottur 1400 100 No Yes 300 ~Iedium Medium i\[edium LowDakshinasaradanagar 400 65 No Yes 120 Medium ~Iedium Medium LowU ttarasaradanagar 650 30 No Yes 130 ~Iedium Medium Medium Low~Iuktheswarapuram 370 65 Yes Yes 125 Medium ~ledium i\ledium LowKattava 450 150 No Yes 100 Medium Medium Low loneKallipalaem 500 70 Yes Yes 160 Low Low ~Iedium MediumKumaripalem 520 40 Yes No 120 Low r.ledium Medium Low
Total 31065 3930 6360
Population and Occupation
Twenty eight villages with 6,360 houses and a total population of 31,605 abut the mangroves'(JYlap 4.12a, b, 4.15a andb). These villages depend for their livelihood on mangrove resources. Fishing is the major occupation, but the peoplealso work as agricultural labourers during the lean season. The literacy rate of men and women respectively is 87[Y., and66[10 in Dheenadayalapuram, 36% and 51 % in Zinkapalem and 48% and 38% in Nali.

@GovernmentofIndiaCopyright
2002."
Based
upon
Survey
ofIndia
map
with
the'
permission
oftheSurveyorGeneralofIndia.
Theresponsibility
forthecorrectnessofinternal
details
restswith
thepublisher.
TheterritorialwatersofIndiaextend
intothesea
toadistance
oftwelve
nautical
milesmeasured
fromtheappropriate
baseline.
Map
4.11MangroveUserVillages
BayofBengal
BayofBengal
Legend
--MetalledRoad
--Unmetalled
Road
--Carttrack
-...-Footpath
----------
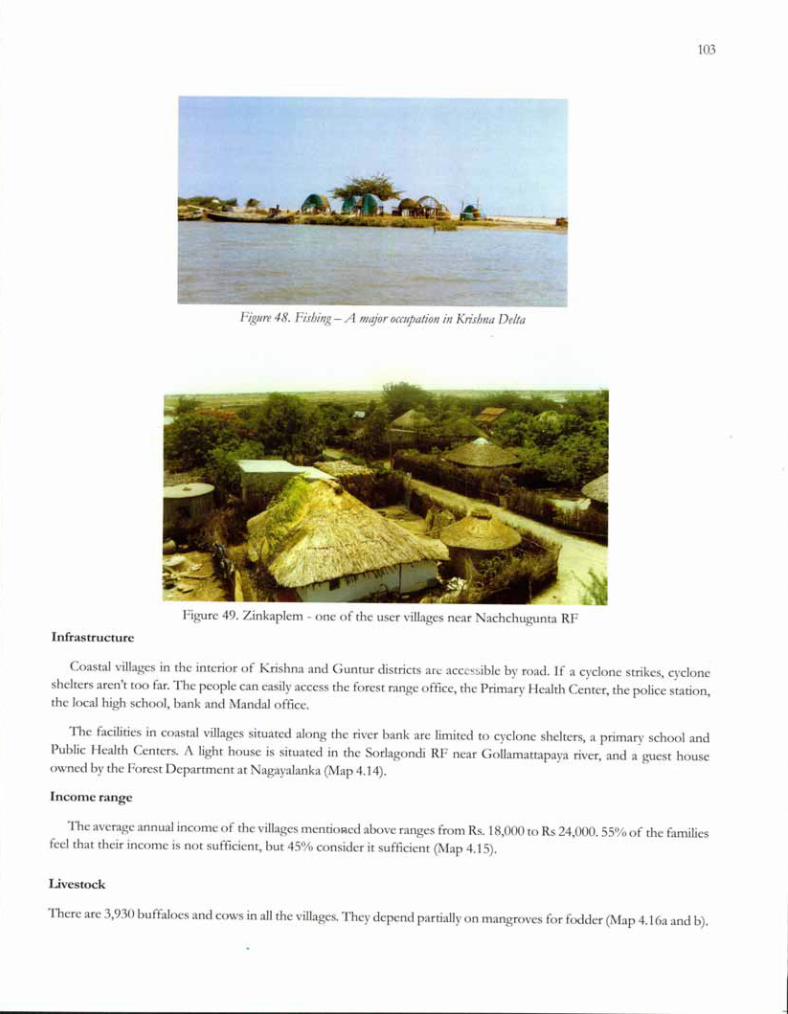
103
rlgure 48. Fishing - A mqjor ocCtlpationin Krishna Delta
Figure 49. Zinkaplem - one of the user villages near Nachchugunta RF
Infrastructure
Coastal villages in the interior of Krishna and Guntur districts are acccs~ible by road. If a cyclone strikes, cycloneshelters aren't too far. The people can easily access the forest range office, the Primary Health Center, the police station,the local high school, bank and MandaI office.
The facilities in coastal villages situated along the river bank are limited to cyclone shelters, a primary school andPublic Health Centers. A light house is situated in the Sorlagondi RF near Gollamattapaya river, and a guest houseowned by the Forest Department at Nagayalanka (Map 4.14).
Income range
The average annual income of the villages mentiof.lcd above ranges from Rs. 18,000 to Rs 24,000. 55% of the familiesfeel that their income is not sufficient, but 45% consider it sufficient (Map 4.15).
Livestock
There are 3,930 buffaloes and cows in all the villages. They depend partially on mangroves for fodder (Map 4.16a and b).
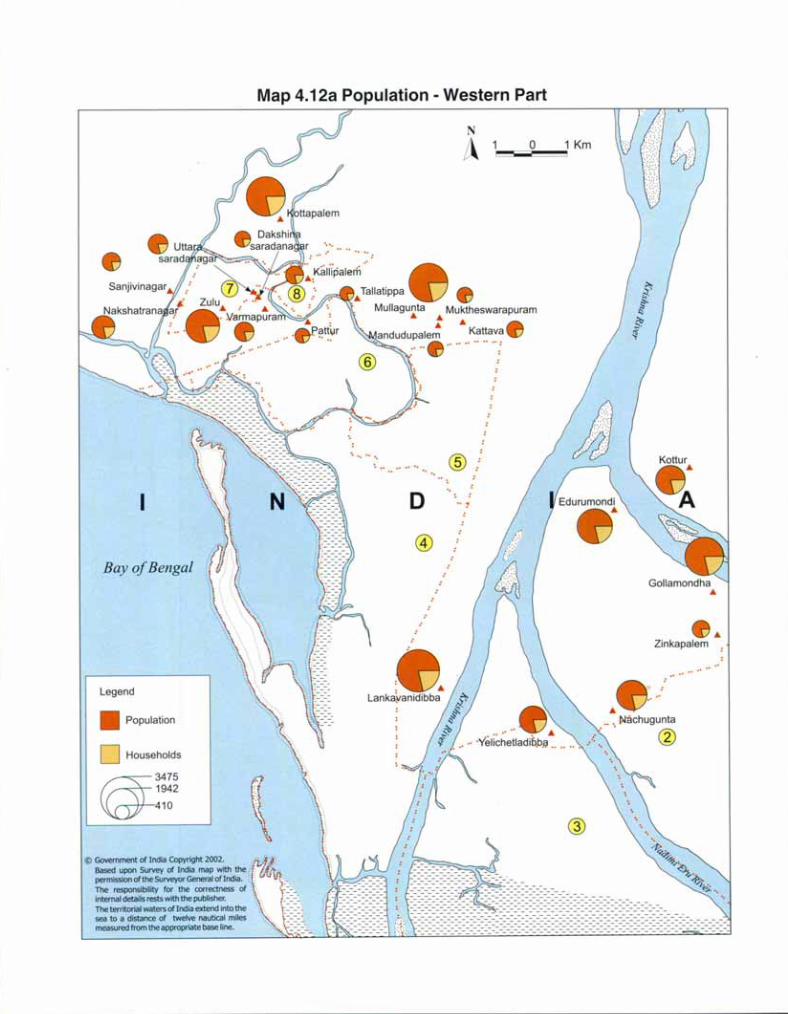
Map 4.12a Population - Western Part
....
N
i~ 1 0----- 1 Km
Bay of Bengal
Legend
• Population
D Households
@34751942410
@ Government of India Copyright 2002.Based upon Survey of India map with thepermission of the Surveyor General of India.The responsibility for the correctness ofinternal details rests with the publisher.The territorial waters of India extend into thesea to a distance of twelve nautical milesmeasured from the appropriate base line.
Muktheswarapuram
t •..andudupalem Kattava
". ". @. ., ._.0° •
0 •• 1
@
Zinkapalem
•... Nl'lchugunta. @
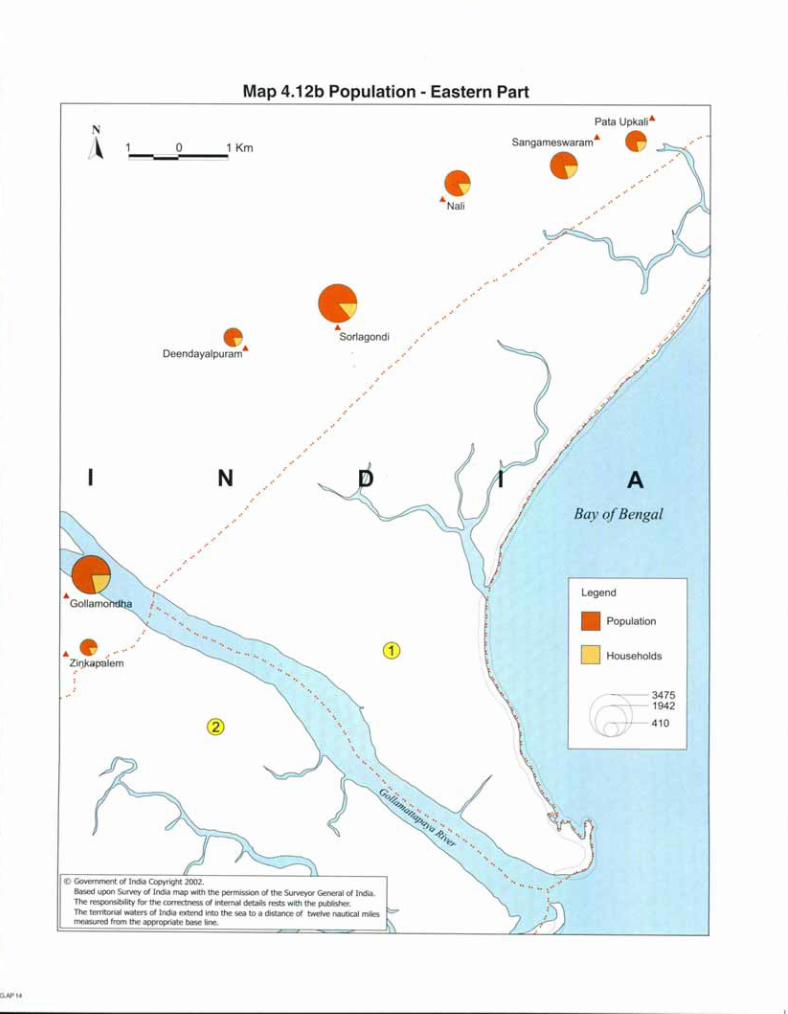
Map 4.12b Population - Eastern Part
@ Government of India Copyright 2002.
Based upon Survey of India map with the permission of the Surveyor General of India.The responsibility for the correctness of internal details rests with the publisher.The territorial waters of India extend into the sea to a distance of twelve nautical milesmeasured from the appropriate base line.
Deendayalpuram'"
." "
A
((
~3475 1942
410
Legend
• Population
D Households
Bay oj Bengal
Pata Upkali'"
Sangameswaram'"
"'Nali
'"Sorlagondi
1 Km
N
oN
L~
••• • .0
0
"
Zil).l<apalem
~GAP14
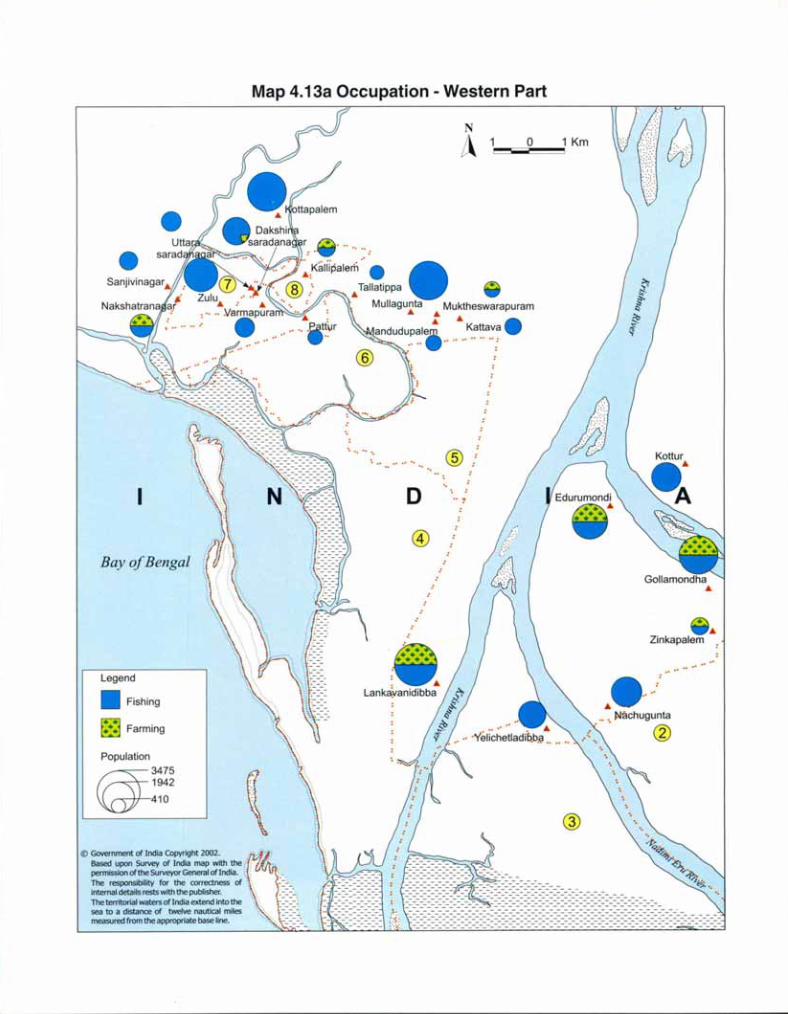
Map 4.13a Occupation - Western Part
.•.•
•• 0°
Zinkapalem
•....:'.•... . Nachugunta. @
1 0 1 Km~====sN
A
-:::= ==::: =:=:=::: =:::=:=::: =:==:=:=:=::::::: =:=::: =::::::: =:=:=::::::: =:=:=::::::::::::: =:=:=:=:=:=::::::::-:-:-:::::: =:=::::
... @
D .. ,
@)
•....Kalii.palerii. •
...@ .:. .•.Tallatippa •
: Mullagu~ta Muktheswarapuram.•. .•.andud~~~.I.'" ~~~a.~~ •
@. .
•
Bay of Bengal
M~ Farming
Legend
• Fishing
Population((;#34751942410
@ Government of India Copyright 2002.Based upon Survey of India map with thepermission of the Surveyor General of India.The responsibility for the correctness ofinternal details rests with the publisher.The territorial waters of India extend into thesea to a distance of twelve nautical milesmeasured from the appropriate base line.

Map 4.13b Occupation - Eastern Part
@ Government of India Copyright 2002.Based upon Survey of India map with the permission of the Surveyor General of India.The responsibility for the correctness of internal details rests with the publisher.The territorial waters of India extend into the sea to a distance of twelve nautical miiesmeasured from the appropriate base line.
Deendayalpuram'"
A
Population
~ Agriculture
Legend
• Fishing
cg=34751942410
Bay oj Bengal
•
Pata Upkali'"
Sangameswaram .•.
•.•.Nali
CD
1 Km
N
oN
L~
.•. .Zif)kapalem

@Governmentoflndia
Copyright
2002.,
Based
upon
Survey
ofIndia
map
with
the'
permission
oftheSurveyorGeneralofIndia.
Theresponsibility
forthecorrectnessofinternal
details
restswith
thepublisher.
TheterritorialwatersofIndiaextend
intothesea
toadistance
oftwelve
nautical
milesmeasured
fromtheappropriate
baseline.
Map4.14
Infrastructure
DDlID.
sD
r\'i't
Sorlagondi
_J.W~...
.•.Deendayalpuram
BayofBengal
Nali .•.
N i~1
01
2Km
==- BayofBengal
Legend
~Lighthouse
•Panchayat
Office
DPoliceStation
SHighSchool
SPrimarySchool
+PrimaryHealth
Centre
fATemple
"IVeterinaryHospital
tilBank
lIDCyclone
Shelter
~Ferry
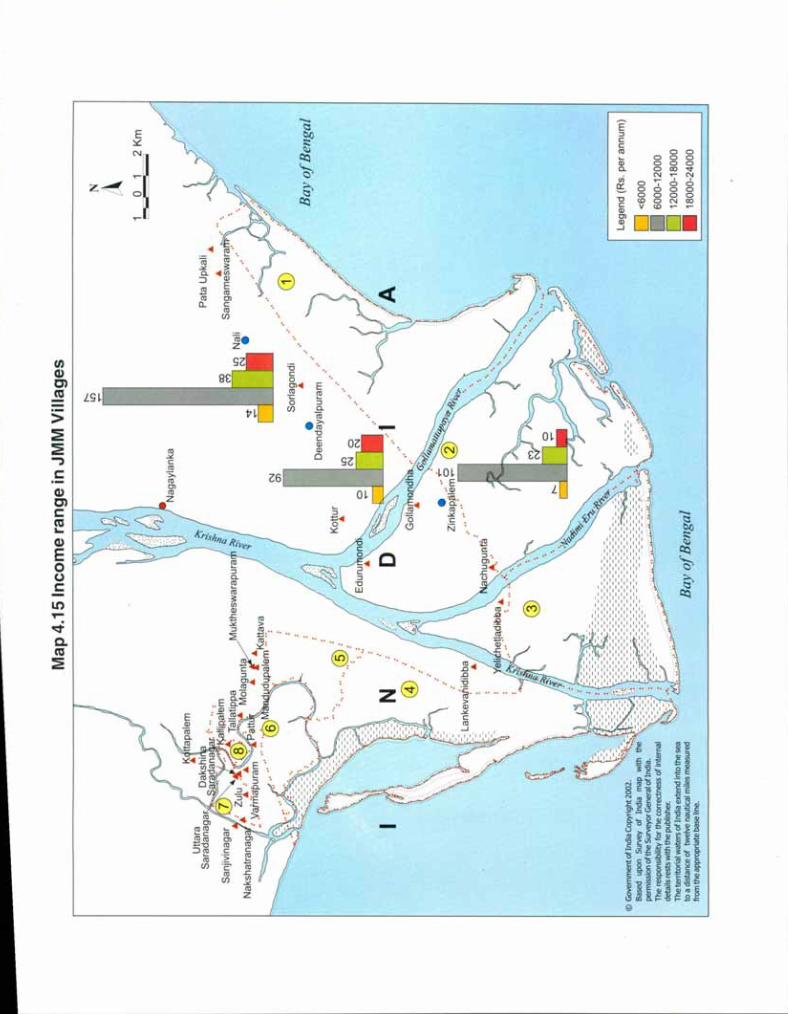
Map4.15
IncomerangeinJMMVillages
Legend
(Rs.perannum)
10
12Km
~-==J
<6000
6000-12000
12000-18000
18000-24000
BayofBengal
N L~
D Cj D •
..'
Nali •
co C'?
I'-It)
Sorlagondi
.•.•
Deendayalpuram
N O'l
.~
..;
BayofBengal
~
.~."'~._..,.,
~Based
upon
Survey
ofIndia
map
with
the""
permission
oftheSurveyorGeneralofIndia.
Theresponsibility
forthecorrectnessofinternal
details
restswith
thepublisher.
TheterritorialwatersofIndiaextend
Intothesea
toadistance
oftwelve
nautical
milesmeasured
fromtheappropriate
baseline.

Map 4.16a Livestock - Western Part
Zinkapalem
.00° .0
.to." . ~achugunla. @
f 0!ijjjjjjjjjii
N
A
D
Muklheswarapuramt .to.
andudupalem ~~~a.~~
40021225
Bay of Bengal
Legend
@ Government of India Copyright 2002.Based upon SUl'\ley of India map withpermission of the SUl'\leyor General of India.The responsibility for the correctness ofinternal details rests with the publisher.The territorial waters of India extend into thesea to a distance of twelve nautical milesmeasured from the appropriate base line.
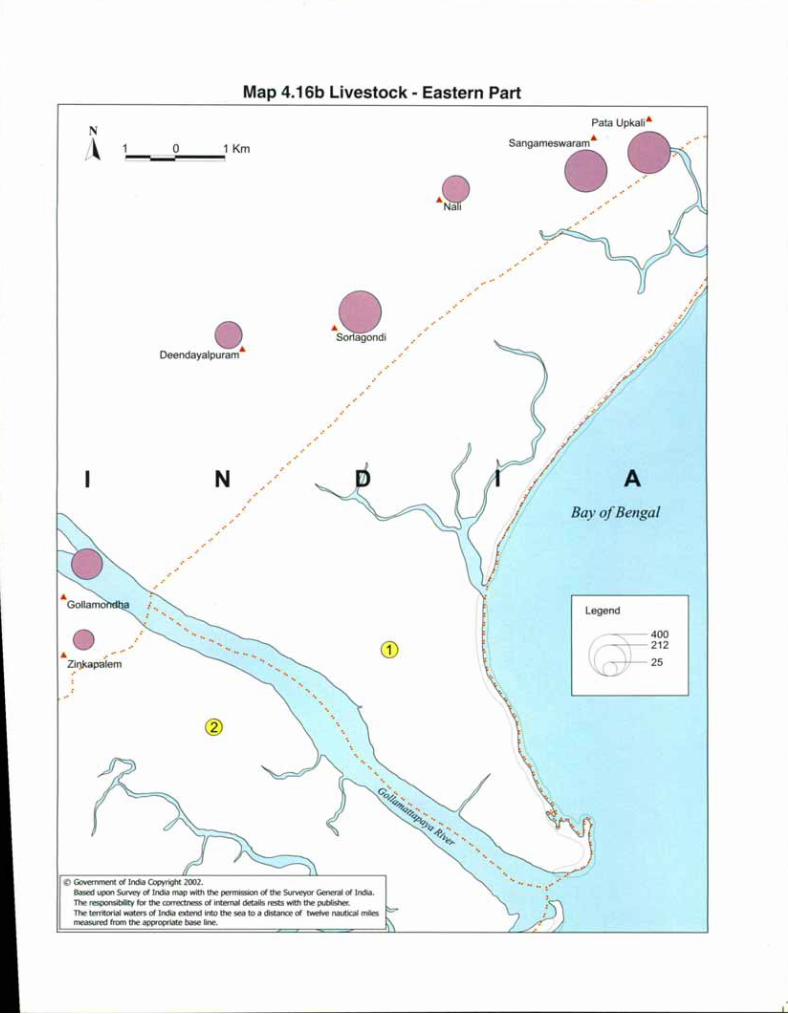
Map 4.1Gb Livestock - Eastern Part
,
.' .
A
~
400212
25
Legend
Bay of Bengal
Pata Upkali&& '
Sangameswaram
&0.~
1 Km
N
o
Deendayalpuram&
N
L~
@ Government of India Copyright 2002.Based upon Survey of India map with the permission of the Surveyor General of India.The responsibility for the correctness of internal details rests with the publisher.The territorial waters of India extend into the sea to a distance of twelve nautical milesmeasured hum the appropriate base line.
& .Zil)kapalem
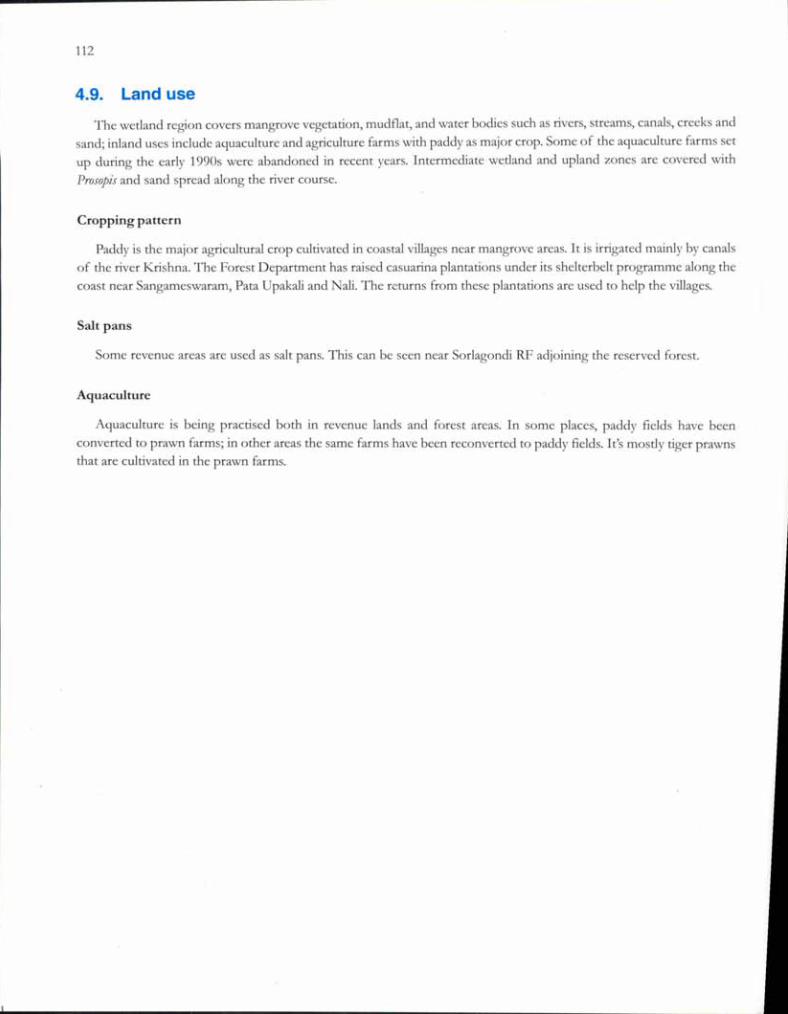
112
4.9. Land use
The wetland region covers mangrove vegetation, mudflat, and water bodies such as rivers, streams, canals, creeks andsand; inland uses include aquaculture and agriculture farms with paddy as major crop. Some of the aquaculture farms setup during the early 1990s were abandoned in recent years. Intermediate wetland and upland zones are covered withProsopis and sand spread along the river course.
Cropping pattern
Paddy is the major agricultural crop cultivated in coastal villages near mangrove areas. It is irrigated mainly by canalsof the river Krishna. The Forest Department has raised casuarina plantations under its shelterbelt programme along thecoast near Sangameswaram, Pata Upakali and Nali. The returns from these plantations are used to help the villages.
Salt pans
Some revenue areas arc used as salt pans. This can be seen near Sorlagondi RF adjoining the reserved forest.
Aquaculture
Aquaculture is being practised both in revenue lands and forest areas. In some places, paddy fields have beenconverted to prawn farms; in other areas the same farms have been reconverted to paddy fields. It's mostly tiger prawnsthat are cultivated in the prawn farms.
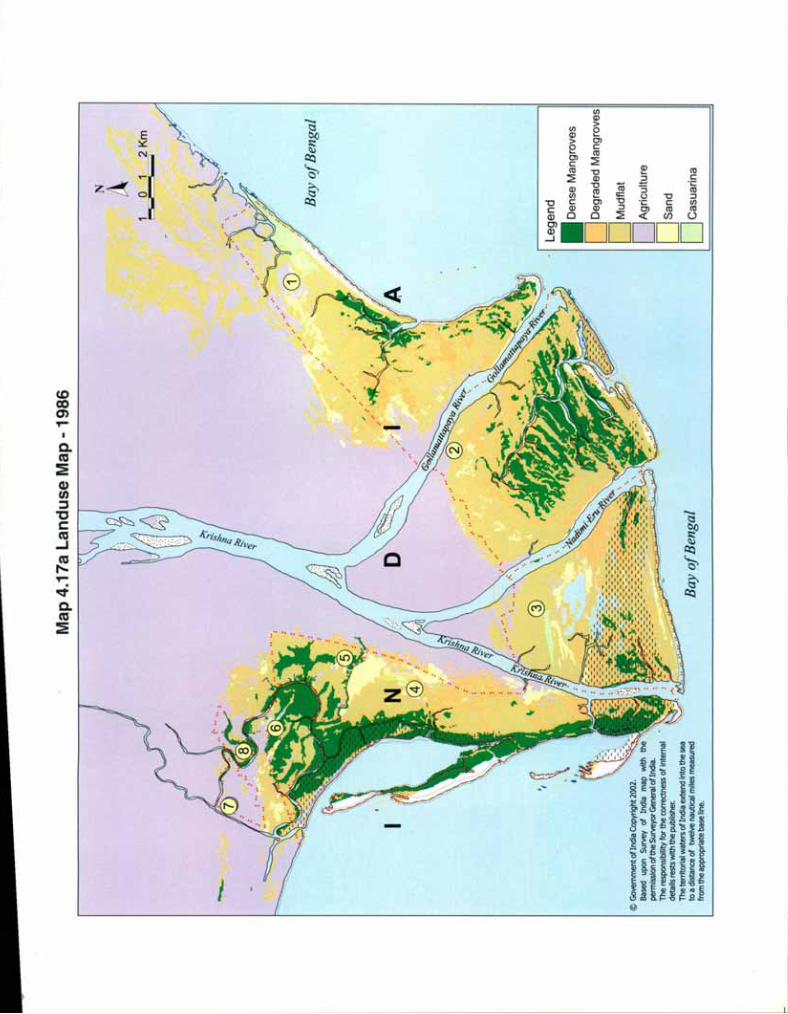
---
@GovernmentofindiaCopyright2002.
."._
Basedupon
Survey
ofIndiamap
with
the'
permissionoftheSurveyorGeneralofIndia.
TheresponsibilityforthecorrectnessofInternal
detailsrestswiththepublisher.
TheterritorialwatersofIndiaextend
Intothesea
toadistance
oftwelve
nauticalm
ilesmeasured
fromtheappropriatebaseline.
Map
4.17aLanduseMap
-1986
BayofBengal
..'
N A o1
2Km
~ BayofBengal
Legend
IIDenseMangroves
DDegradedMangroves
DMudflat
DAgriculture
DSand
DCasuarina
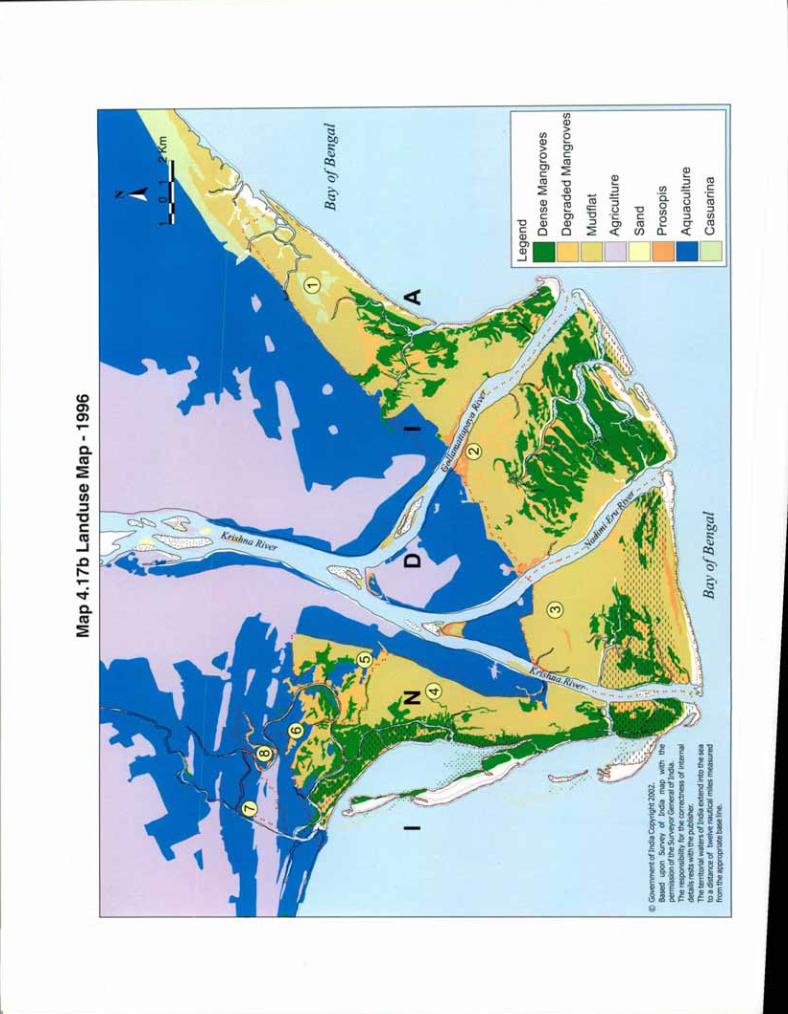
@GovernmentofindiaCopyright2002.
Basedupon
Survey
ofIndiamap
with
the
permissionoftheSurveyorGeneralofIndia.
Theresponsibilityforthe
correctnessofinternal
detailsrestswiththepublisher.
TheterritorialwatersofIndiaextendintothesea
toadistanceof
twelvenauticalmilesmeasured
fromtheappropriatebaseline.
Map
4.17bLanduseMap
-1996
BayofBengal
BayofBengal
Legend
IIDense
Mangroves
DDegraded
Mangroves
DMudflat
DAgriculture
DSand
.--Prosopis
'----!l IIAquaculture
DCasuarina

-:.:
.t}-""
'\~..'.
'\1
.\....•\...•• \\ ~\ 1J .~
•.\:-:.
..:-.
\ \.... \~
"'.
•~.<t .. +~ .\
~'.:\ ..•. ..
@GovernmentofIndiaCopyright
2002..
..Based
upon
Survey
ofIndia
map
with
the...
permission
oftheSurveyorGeneralofIndia.
Theresponsibility
forthecorrectnessofinternai
details
restswith
thepublisher.
TheterritorialwatersofIndiaextend
intothesea
toadistance
oftwelve
nautical
milesmeasured
fromtheappropriate
baseline.
Map
4.17cLanduseMap
-2001
"~"'l~
BayofBengal
BayofBengal
Legend
IIDense
Mangroves
DDegradedMangroves
DMudflat
DAgriculture
DSand
IIAquaculture
DAbandoned
Aquaculture
DProsopis

116
4.10. Dependency
Grazing
Cattle-grazing in mangrove areas inhibits mangrove growth and the establishment of young seedlings. The cattlegobble up young leaves of Avicennia manna, and this aborts or limits the growth of mangrove saplings in particular.According to the local community, cattle graze in the mangrove forest nearby because fodder isn't available (Map 4.18aand b).
Firewood
Coastal communities depend on mangroves for firewood, because of the proximity of the mangroves and the easyaccess to them. Avicel1l1ia manna, A. officina/is and Aegiceras comiCli/atll!!/are the major species used for firewood.
House construction
Mangroves are tapped for house construction. The main species used are Avicennia matina, A. officina/is, Excoecatiaaga//ocha and Bmglliera t)'/indlica. Following the 1977 cyclone, the Rashtria Swayam Sevak Sang (RSS), TATA, and RedCross Society have constructed pucca houses in a few villages.
"
Figllre 50. Mangrove wood IIsedjorjencing
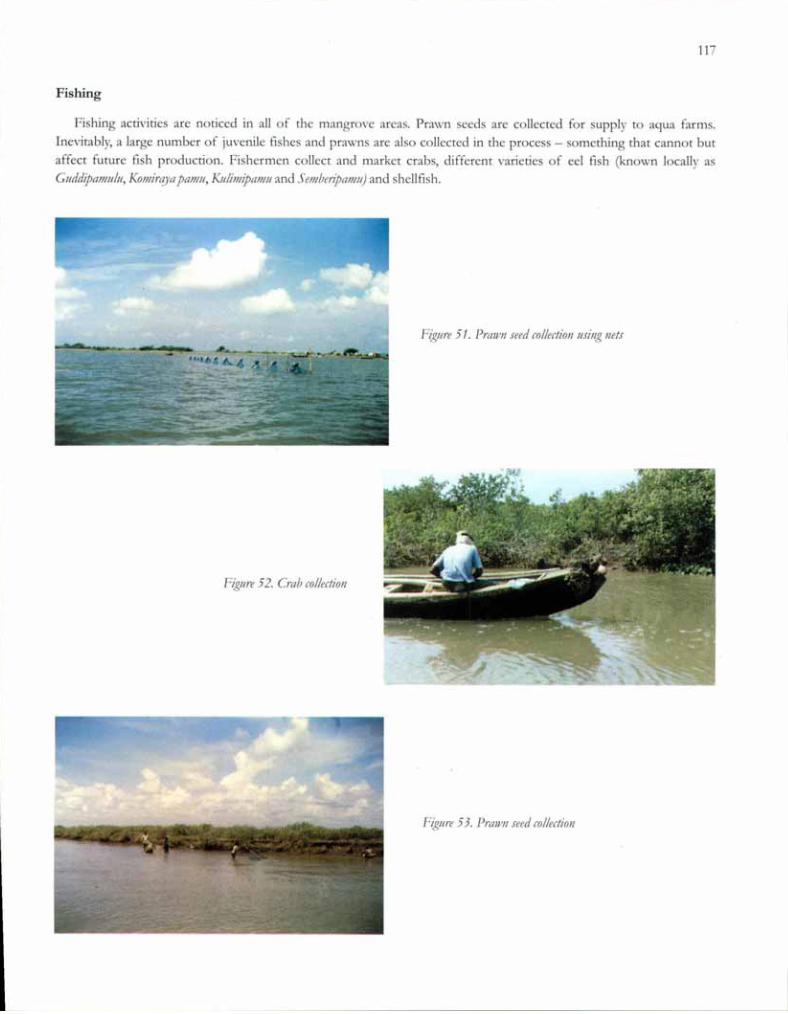
117
Fishing
Fishing activities are noticed in all of the mangrove areas. Prawn seeds are collected for supply to aqua farms.Inevitably, a large number of juvenile fishes and prawns are also collected in the process - something that cannot butaffect future fish production. Fishermen collect and market crabs, different varieties of eel fish (known locally asGuddipamll/II, Komirqya pat/III, Ku/imipat/III and Selllimipamll) and shellfish.
Figllre 51. Pra1l11l seed collectiollllsing nets
Figure 52. Crab collectioll
Figllre 53. Prall'lI seed collectioll
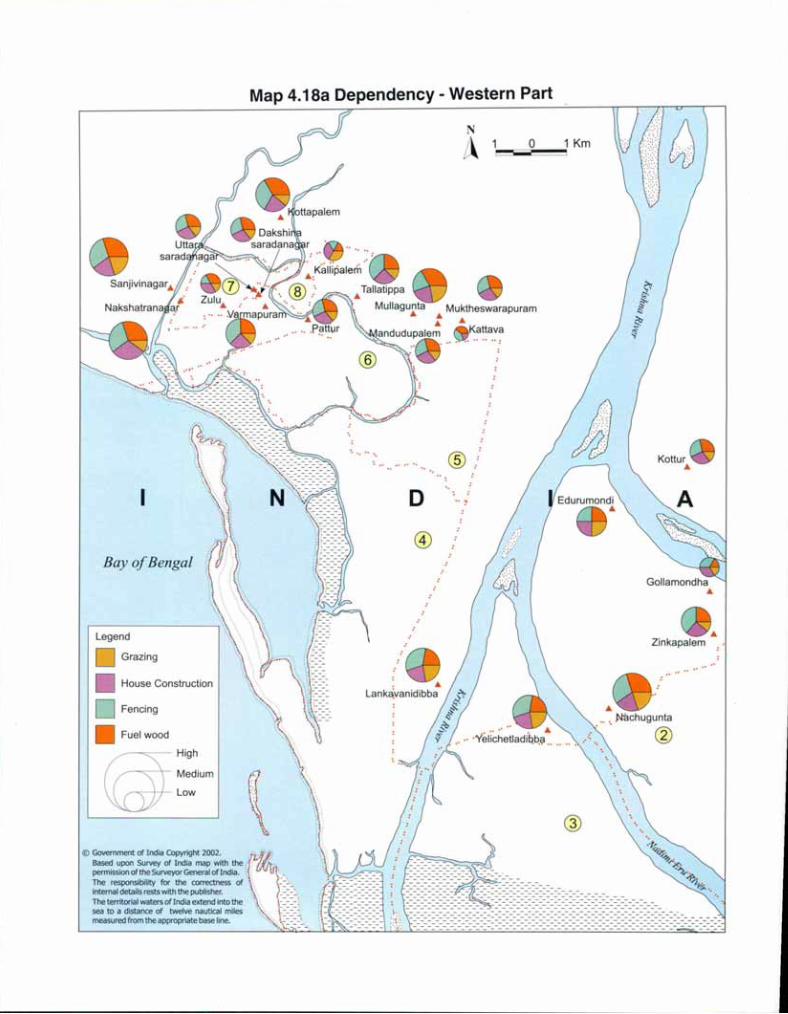
Map 4.18a Dependency - Western Part
@GovernmentofIndiaCopyright2002.\UJBased upon Survey of India map with the ,..: {IJI".permissionof the SurveyorGeneralof India. ~." ...•The responsibility for the correctness of.\. :=':,~internal details restswith the publisher. '. _-=-:;The territorial watersof India extend into the \...3::=:= isea to a distance of twelve nautical miles ". ". .-_-_,measuredfrom the appropriatebaseline. "'\'\.,i=::= :::.".
KolturA
AZinkapalem
A... Nachugunta. @
1 0 1 Kme=;;;;;;;;;;:~
Kaltava........ :
N
L~
---- ---- ---- ---- ---- ----_.
:=~:~::~:~:~:~::~:~:~:~=:=:=:=::::=:=:=::::=:: =:=::::: =:=:=:=:=:=::::::::=:: =:=::::::=:=:=:::::::::
... @... .".0°.
0 .. "
@)
.................... , ,
".\i. '. - -(.c ,- -
High
Medium
Low
Grazing
House Construction
Bay of Bengal
Legend
D
D Fencing
• Fuelwood
(g
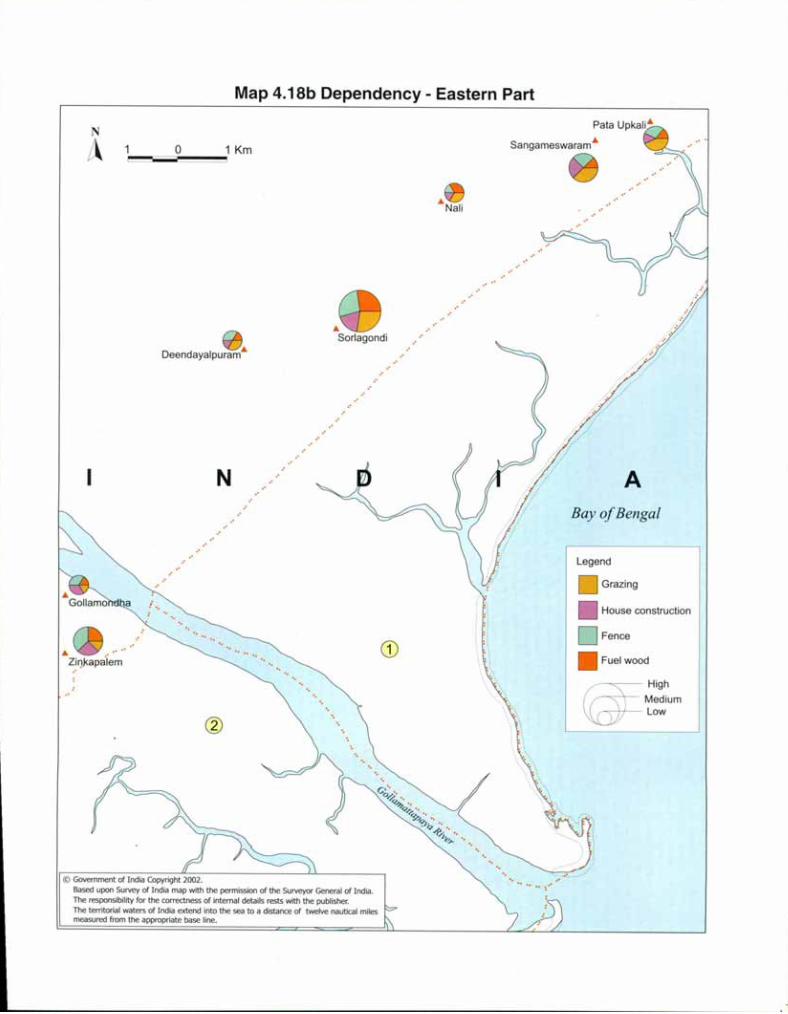
Map 4.18b Dependency - Eastern Part
Pata Upkali'"
Sangameswaram '"
'"Sorlagondi
1 Kmo
Deendayalpuram'"
N
A
@ Government of India Copyright 2002.Based upon Survey of India map with the permission of the Surveyor General of India.The responsibility for the correctness of internal details rests with the publisher.The territorial waters of India extend into the sea to a distance of twelve nautical milesmeasured from the appropriate base line.
N ABay of Bengal
Legend
Grazing
House construction
CDDFence
'" • Fuel woodZil)J<apalem
~H;9hMediumLow
@
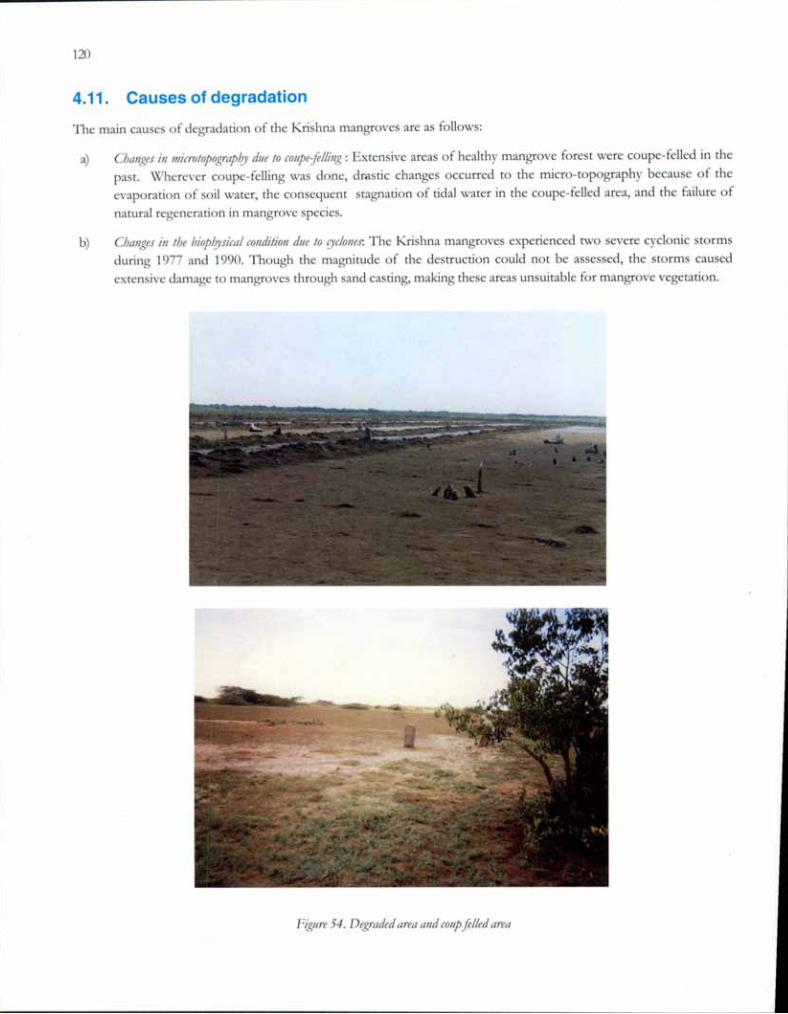
120
4.11. Causes of degradation
The main causes of degradation of the Krishna mangroves are as follows:
a) Changes ill microtopograpl?)'dlle to coupejellillg : Extensive areas of healthy mangrove forest were coupe-felled in thepast. \'V'hcrever coupe-felling was done, dmstic changes occurred to the micro-topography because of theevaporation of soil water, the consequent stagnation of tidal water in the coupe-felled area, and the failure of
natural regeneration in mangrove species.
b) Changes ill the /Jiop/?}sicalconditioll due to odones: The Krishna mangroves experienced two severe cyclonic stormsduring 1977 and 1990. Though the magnitude of the destruction could not be assessed, the storms causedextensive damage to man!:,'Toves through sand casting, making these areas unsuitable for mangrove vegetation.
Figure 54. Degraded area alld COIIP felled area
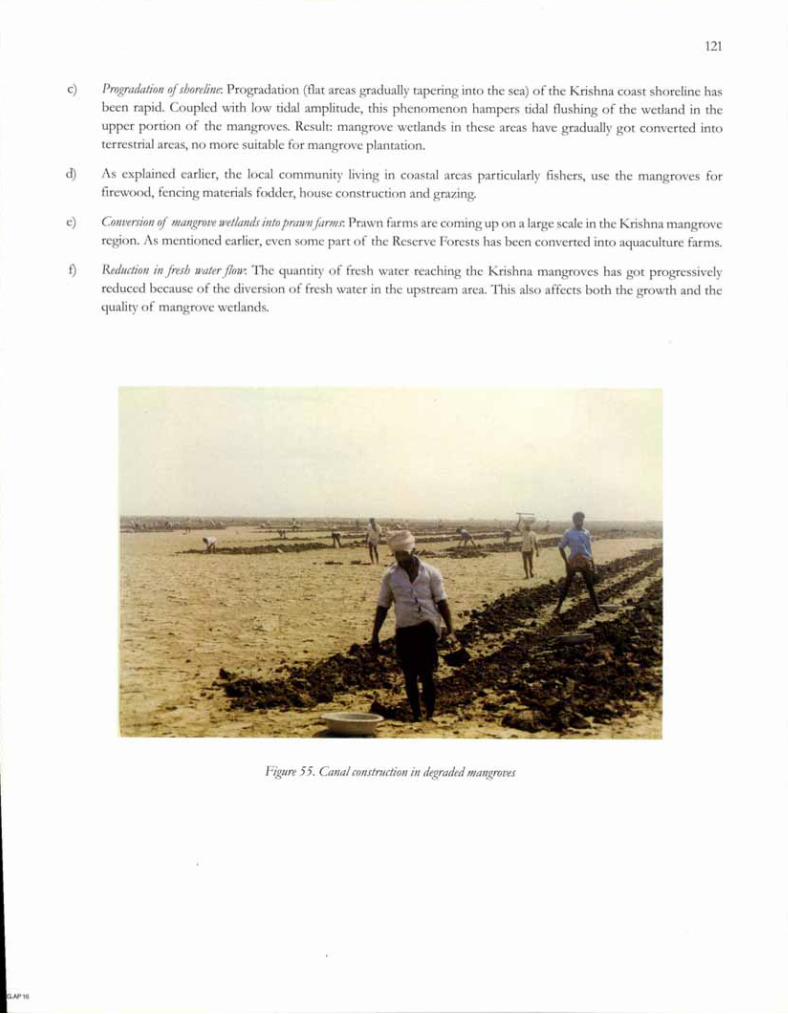
G.AP16
121
c) Progradation oj shoreline: Progradation (flat areas gradually tapering into the sea) of the Krishna coast shoreline hasbeen rapid. Coupled with low tidal amplitude, this phenomenon hampers tidal flushing of the wetland in theupper portion of the mangroves. Result: mangrove wetlands in these areas have gradually got converted intoterrestrial areas, no more suitable for mangrove plantation.
d) As explained earlier, the local community living in coastal areas particularly fishers, use the mangroves forfirewood, fencing materials fodder, house construction and grazing.
e) Conversion oj mangrove IJ!etlands into praJvn farms: Prawn farms are coming up on a large scale in the Krishna mangroveregion. As mentioned earlier, even some part of the Reserve Forests has been converted into aquaculture farms.
f) Reduction in fresh water JlOIlr. The quantity of fresh water reaching the Krishna mangroves has got progressivelyreduced because of the diversion of fresh water in the upstream area. This also affects both the growth and thequality of mangrove wetlands.
Figure 55. Canal eonstmetion in degraded mangroves

122
4.12. Restoration and Redevelopment
1
The mangrove forest area is diminishing gradually, because of the reasons cited above. The project took up canalconstruction to restore degraded areas and expand the mangrove area. As much as 355 ha of degraded mangroves havebeen restored in the Krishna in this manner (fable 10). This activity also gave the local community - which providedlabour for constructing the canals and planting the seedlings - much-needed income. Mangrove seedlings were raisedin nursery beds in co-operation with mangrove villagers as per standard measurements and methods. All mangroveseedlings were raised to optimum height (to a pencil-thick 60 ems), then planted in the site when climatic and biophysicalconditions were favourable. Seed beds were prepared during November and December, and seedlings planted inDecember and January. Training on nursery-raising and planting was imparted to members of the community and tovillage-level institutions in the respective demonstration villages.
Figure 56. NurselY (top) and ({/nal COllstme/ion (botto/ll) in Sor/agondi RF
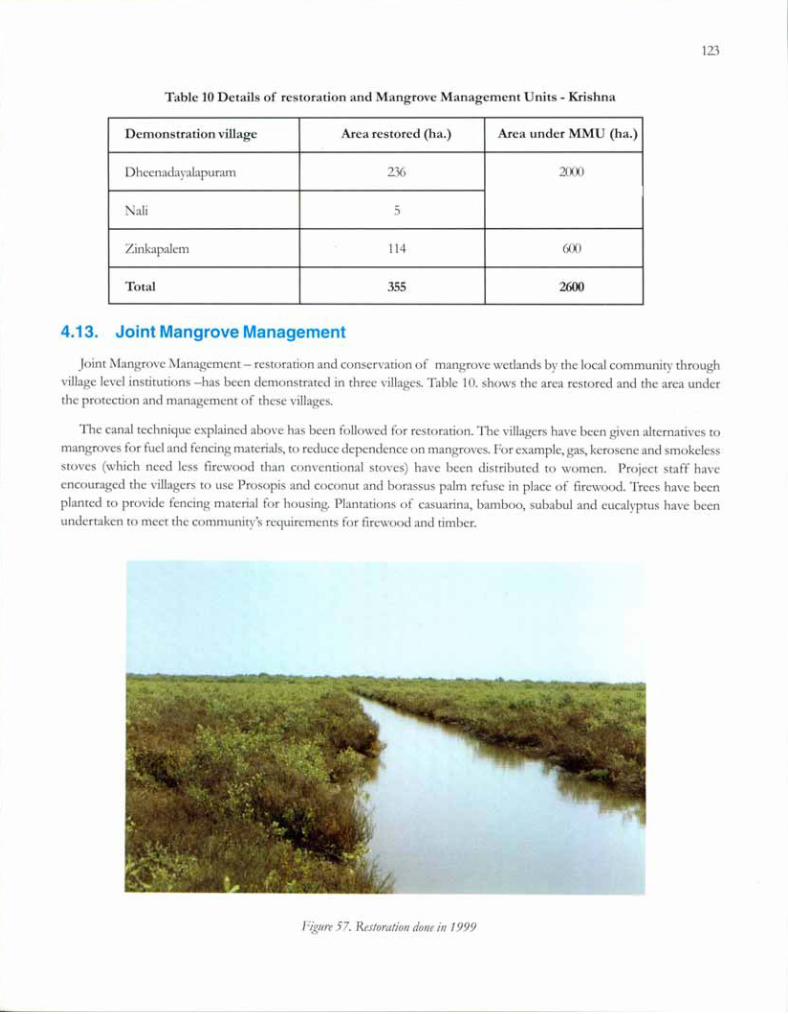
123
Table 10 Details of restoration and Mangrove Management Units - Krishna
Demonstration village Area restored (ha.) Area under MMU (ha.)
Dheenadayalapuram 236 2000
Nali 5
Zinkapalem 114 600
Total 355 2600
4.13. Joint Mangrove Management
Joint l\Iangrove l\[anagement - restoration and conservation of mangrove wetlands by the local community throughvillage level institutions -has been demonstrated in three villages. Table 10. shows the area restored and the area underthe protection and management of these villages.
The canal technique explained above has been followed for restoration. The villagers have been given alternatives tomangroves for fuel and fencing materials, to reduce dependence on mangroves. For example, gas, kerosene and smokelessstoves (which need less firewood than conventional stoves) have been distributed to women. Project staff haveencouraged the villagers to use Prosopis and coconut and borassus palm refuse in place of firewood. Trees have beenplanted to provide fencing material for housing. Plantations of casuarina, bamboo, subabul and eucalyptus have beenundertaken to meet the community's requirements for firewood and timber.
Fig"re 57. Restoratioll done ill 1999

*JMMVillages
BayofBengal
@GovernmentofIndiaCopyright
2002.
""Based
upon
Survey
ofIndia
map
with
the"
permission
oftheSurveyorGeneralofIndia.
Theresponsibility
forthecorrectl1essofinternal
details
restswith
thepublisher.
TheterritorialwatersofIndiaextend
intothesea
toadistance
oftwelve
nautical
milesmeasured
fromtheappropriate
baseline.
Map
4.19VillagesabuttingMangroves
Sorlagondi
A
*Deendayalpuram
.
BayofBengal
Nali *
N L'1
0~_""!
2Km
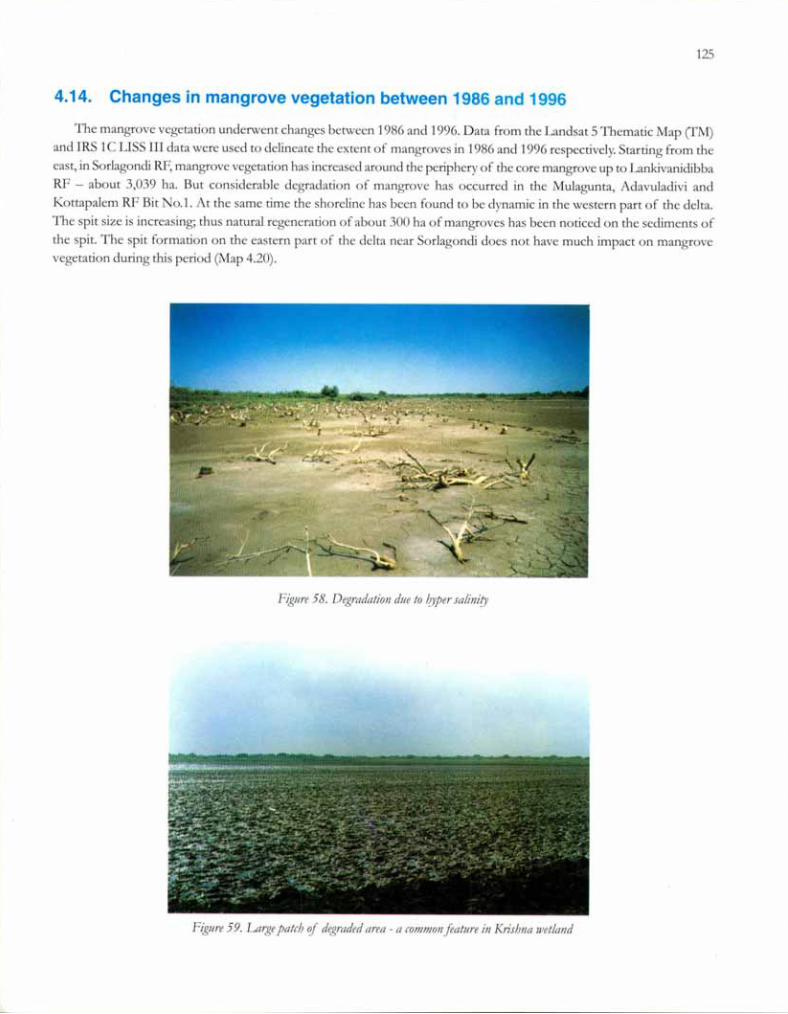
125
4.14. Changes in mangrove vegetation between 1986 and 1996
The mangrove vegetation underwent changes between 1986 and 1996. Data from the Landsat 5 Thematic Map erM)and IRS 1C LlSS III data were used to delineate the extent of mangroves in 1986 and I996 respectively. Starting from theeast, in Sorlagondi RF, mant,lTove vegetation has increased around the periphery of the core mangrove up to LankivanidibbaRF - about 3,039 ha. But considerable degradation of mangrove has occurred in the MuIagunta, AdavuIadivi andKottapaIem RF Bit NO.1. At the same time the shoreline has been found to be dynamic in the western part of the delta.The spit size is increasing; thus natural regeneration of about 300 ha of mangroves has been noticed on the sediments ofthe spit. The spit formation on the eastern part of the delta near Sorlagondi does not have much impact on mangrovevegetation during this period (Map 4.20).
Figure 58. Degradation due to hyper salinity
Figure 59. Large patel] if degraded area - a common feature in Krishna Ivetland
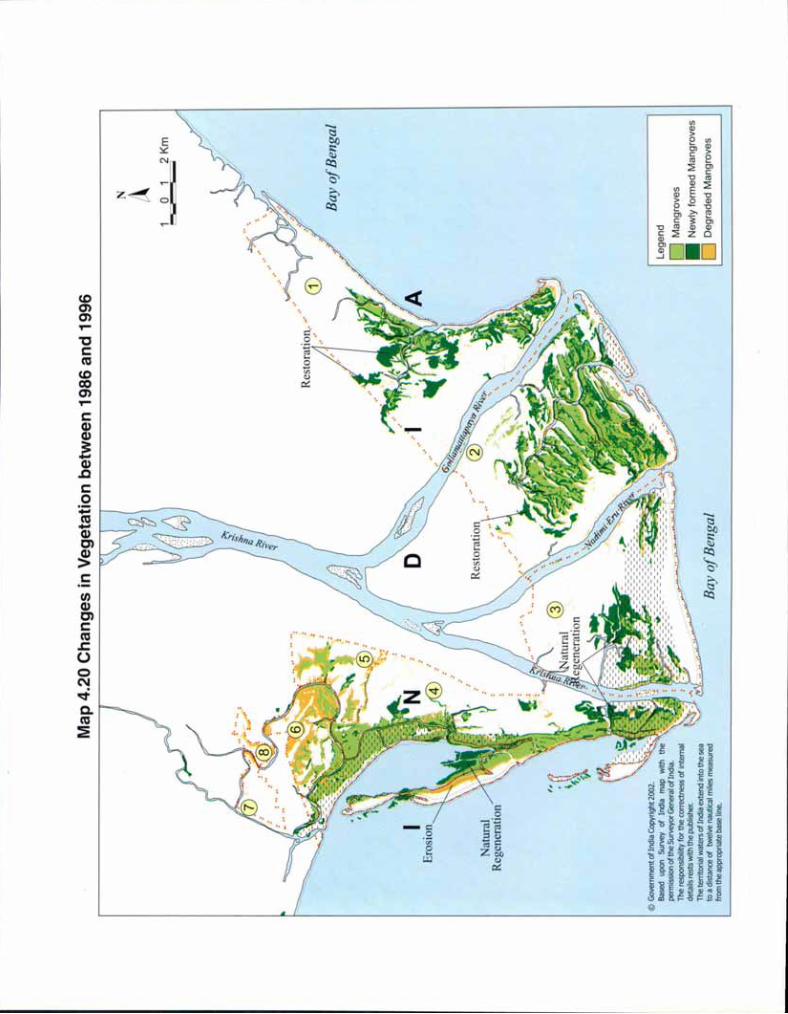
Natural
Regeneration
@Governmentoflndia
Copyright
2002.
'.Based
upon
Survey
ofIndia
map
with
the.
permission
oftheSurveyorGeneralofIndia.
Theresponsibility
forthecorrectnessofinternal
details
restswith
thepublisher.
TheterritorialwatersofIndiaextend
intothesea
toadistance
oftwelve
nautical
milesmeasured
fromtheappropriate
baseline.
Map
4.20
Changes
inVegetationbetween1986and1996
BayofBengal
N L~1
01
2Km
IIiiiO
BayofBengal
Legend
DMangroves
•Newlyformed
Mangroves
DDegradedMangroves
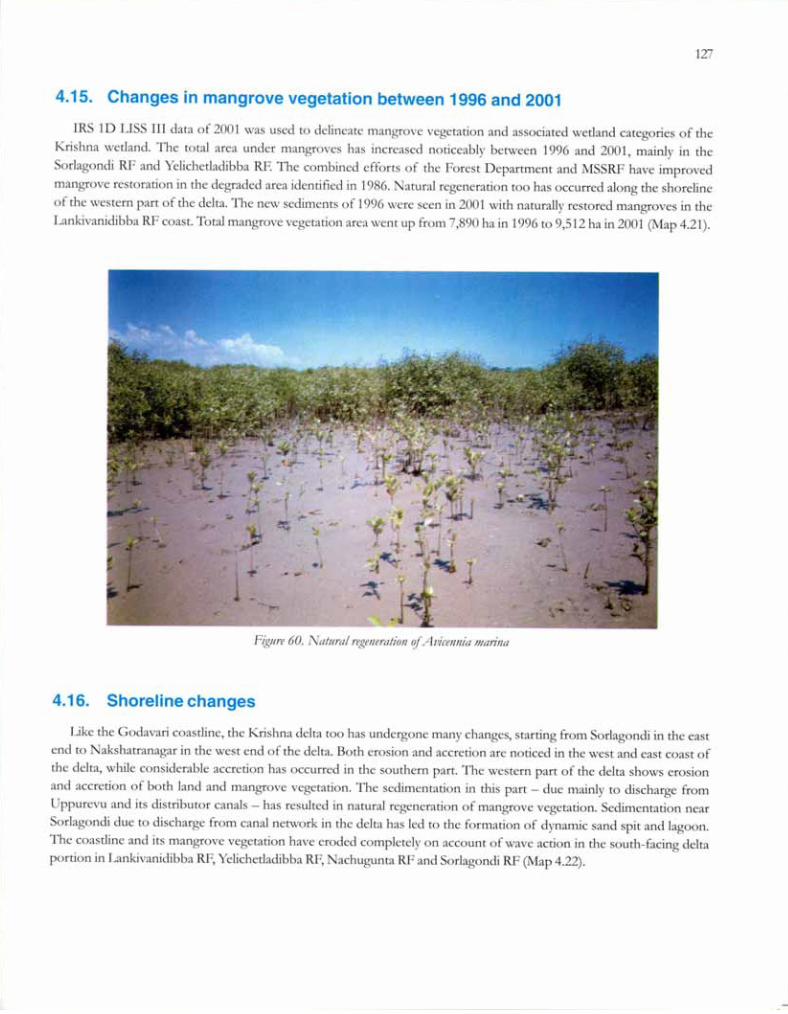
127
4.15. Changes in mangrove vegetation between 1996 and 2001
IRS 1D LISS III data of 2001 was used to delineate man!:,'Tove vegetation and associated wetland categories of theKrishna wetland. The total area under mangroves has increased noticeably between 1996 and 2001, mainly in theSoriagondi RF and Yelichetladibba RF. The combined efforts of the Forest Department and MSSRF have improvedmangrove restoration in the degraded area identified in 1986. atural regeneration too has occurred along the shorelineof the western part of the delta. The new sediments of 1996 were seen in 2001 with naturally restored mangroves in theLankivanidibba RF coast. Total mangrove vegetation area went up from 7,890 ha in 1996 to 9,512 ha in 2001 (Map 4.21).
Figure 60. Natura/ regeneration ifAvicennia manna
4.16. Shoreline changes
Like the Godavari coastline, the Krishna delta too has undergone many changes, starting from Soriagondi in the eastend to Nakshatranagar in the west end of the delta. Both erosion and accretion are noticed in the west and east coast ofthe delta, while considerable accretion has occurred in the southern part. The western part of the delta shows erosionand accretion of both land and mangrove vegetation. The sedimentation in this part - due mainly to discharge fromUppurevu and its distributor canals - has resulted in natural regeneration of mangrove vegetation. Sedimentation nearSoriagondi due to discharge from canal network in the delta has led to the formation of dynamic sand spit and lagoon.The coastline and its mangrove vegetation have eroded completely on account of wave action in the south-facing deltaportion in Lankivanidibba RF, Yelichetladibba RF, Nachugunta RF and Soriagondi RF (Map 4.22).
J
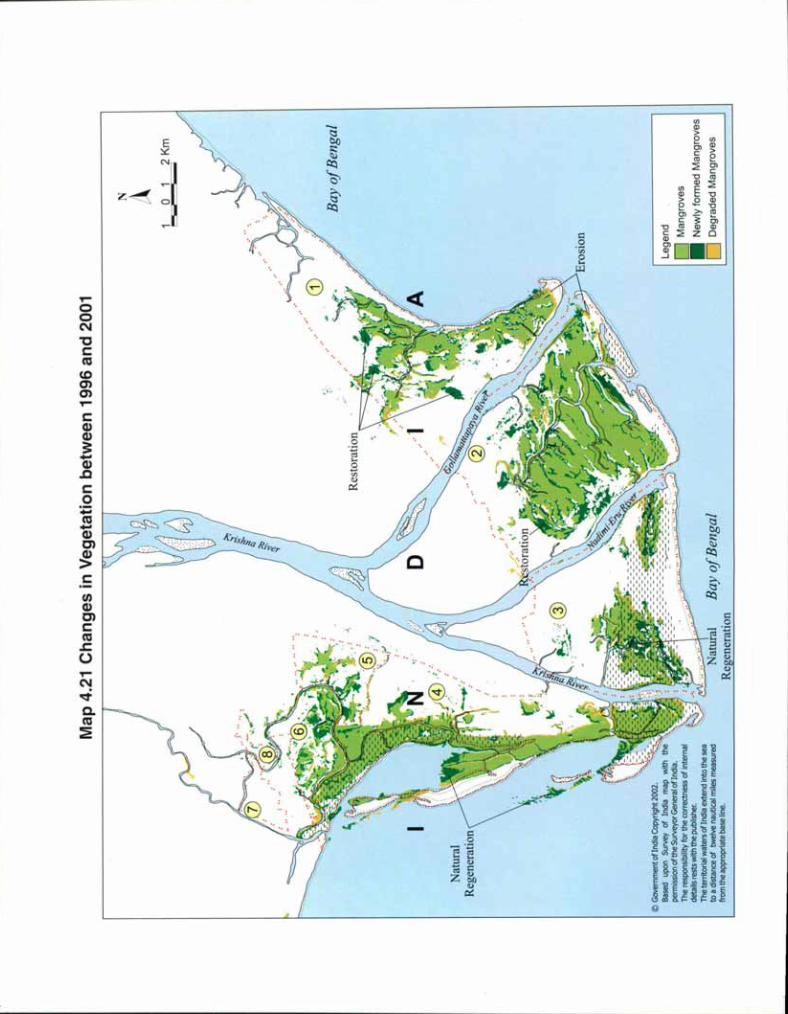
Natural
Regeneration
Map
4.21
Changes
inVegetationbetween1996
and2001
...
Restoration
Natural
BayofBengal
Regeneration
N A o1
2Km
~ BayofBengal
Legend
DMangroves
•Newlyformed
Mangroves
oDegradedMangroves
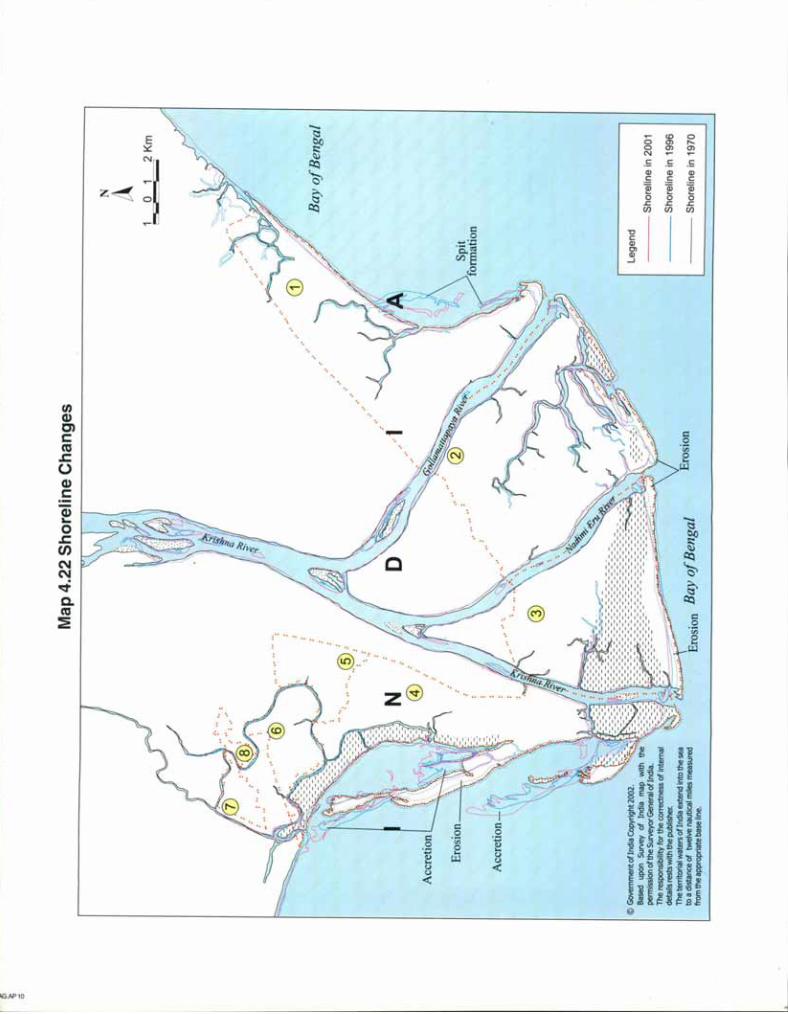
~io o
...,....":
....
f2\.
'0'
N @)
Map4.22
ShorelineChanges
Erosion
N A1
01
2Km
~
BayofBengal
Legend
----
Shorelinein2001
---
Shorelinein1996
---
Shorelinein1970

CHAPTER 5
Long-term Management
The species diversity and population density of each species relate directly to the spatial and temporal dischargeof river water flow. It has been determined that the past management practice of clear felling by coupe contractors(without realizing that mangroves are not coppicing by nature) has led to blank formations and inhibited natural
regeneration.
The dams constructed across the Godavari river at Dowleswaram and Alamatti Dam in Karnataka; as well as thePrakasham barrage at Vijayawada in Andhra Pradesh across the Krishna to increase cultivable areas - have reduced riverwater flow and consequently the nutrients that mangroves require. The natural regeneration of mangrove species andthe establishment of saplings have been inhibited. This has in fact led to the gradual disappearance of some mangrovespecies. The loss of SOflfleratia apetela from the mangroves of Pichavaram is an example. It happened because of thereduced flow of river water from 1950 till date.
Chronological data on salinity and tidal amplitude show that past mangrove species need to be restored and re-established through afforestation as a means of long-term management. The river mouths must be periodically clearedand sand bars removed to ensure free flow of river water into the sea. This can improve nutrient supply not only to themangroves but also to the juveniles of fish that breed in the open sea and take shelter in the mangroves. Periodicalmonitoring of sandbar formation in the river mouth, coupled with monitoring of rainfall and water discharge fromDowleswaram and other barrages, could be very effective. These measures must be implemented with rigour. Dredgingof the river mouth can be organized in co-operation with port authorities and local fishermen, as both will benefit fromthe resulting economic and ecological improvements.
Another important cause of degradation is the felling of mangroves by the poor to meet genuine basic needs.A mangrove protection policy should offer these people viable alternatives to mangroves for firewood, fencing, fodderand house construction. A sustainable method of mangrove harvesting should also be evolved .. Participatory patrollingby members of EDC/ VSS and the staff of the Forest Department, and strict and systematic vigilance, are essential forbetter mangrove management.

132
Figure 61. Alvareness programme in Deenadqyalpuram p/qyed I!J Mangrove club cbi/dren
Figure 62. AIIJareness tbrougb wall paintings for mangrove conservation

133
Fig"re63. PRA in Nali village
Fig"re 64. Preparation if LBA Microplan-Bhairavalanka
Fig"re 65. SupplY if drinking lvater - Solving theI'illageconcems through microplan

134
rtgure 66. Casuan'na plalltation as altemative for timber in Bhairavalanka
Figure 67. Traillillgfor altemative illcotJle through coir rope makillg

/
Figure 68. Alternatives for fencing - Jatropha being used as line fencing
Figure 69. Alternatives for timber - commlmiry plantation in Deenadcryalpuram
135

136
REFERENCES
1. ADB /NACA. 1998. Aquaculture sustainability and the environ/llent, Report on a Regional Study and Workshop onAguaculture Sustainabilit:y and the Environment, Bangkok, Thailand, Asian Development Bank and Network ofAguaculture Centres in Asia and the Pacific.
2. Andhra Pradesh Remote Sensing Application Centre (APRSAC). 1999. Environmental management andmonitoring of shrimp culture project, East Godavari District, Andhra Pradesh - land use/land cover,Hyderabad, India.
3. Forest Survey of India. 1999. Status of Forest Report, Ministry of Environment and Forest, Government ofIndia, New Delhi.
4. Blasco, F. and Aizpura, M. 2002. Mangroves along the coastal stratch of the Bay of Bengal: Present status,IndianJournal of Marine Sciences, 9 - 20.
5. Blasco F.,Kerrest, R. and Marius, C. 1985. Considerations on some ecological factors influencing the biologyof Indian mangroves. In Bhosale. L. J. (ed.), The Mangroves, Shivaji University, Kolhapur. 135 -146.
6. Caratini, C. F.,Blasco, F.and Thanikoimoni, G. 1973. Relations between the pollen spectra and the vegetationof a south Indian mangrove, Pollen et spores, 15: 281- 292.
7. Mishra, H. C. 1999. The dynamics of Hope Island - A study using IRS IB & lC satellite data, GIS India,817 -18.
8. Mittal, R. 1993. Management plan for Coringa Wildlife Sanctuary, Forest Department, Government ofAndhra Pradesh, Hyderabad.
9. Rangarao, v., Reddy, B.S. R., Raman, A. V.and Ramana Murthy, M. V.2003. Oceanographic features of the Bay_ Mangrove water ways of Coringa, East coast of India, Proceedings of AP Akademy Sci., 135-142.
10. Reddy, B.S.R. and Prasad, K.V.S.R.1982. The sand spit near Kakinada - Further studies, IndianJ Ear Sci., 9:167 -173.
11. Robertson, A.I. and Alongi, D.M. 1992. Tropical mangrove ecosystems: Coastal and Estuarine studies,American Geophysical Union,Washington DC, 329.
12. Selvam, V.2003. Environmental classification of Mangrove wetlands of Inida, Current science, 84 (6): 757-765.
13. Selvam, v., Gnanappazham, L., Navamuniyammal, M., Ravichandran, K. K. and Karunakaran,V. M. 2002. Atlas of Mangrove Wetlands of India Part 1 - Tamil Nadu, M. S. Swaminathan ResearchFoundation, Chennai, India.
14. Selvam, v., Ravichandran, K., Gnanappazham, L., Navamuniyammal, M. 2003. Asessment ofcommunity-based restoration of Pichavaram mangrove wetland using remote sensing data. Currentscience, 85: 794-98.
15. Sidhu.S.S. 1963. Studies on the mangroves of India: East Godavari Region, Indian Forester, 89: 337-351.
16. Uma Maheswara Rao, M. and Narasimha Rao, G.M. 1988. Mangrove populations of the Godavari deltacomplex. IndianJournal of Marine Sciences, 17:326-329.
17. http://wrminnic.in/riverbasin