Water and Halide Adsorption to Corrosion Surfaces: Molecular Simulations of Atmospheric Interactions...
12
Water and Halide Adsorption to Corrosion Surfaces: Molecular Simulations of Atmospheric Interactions with Aluminum Oxyhydroxide and Gold Louise J. Criscenti,* Randall T. Cygan, Ara S. Kooser, and Harold K. Moffat Sandia National Laboratories, Albuquerque, New Mexico 87185-0754 ReceiVed September 27, 2007. ReVised Manuscript ReceiVed April 17, 2008 Atmospheric corrosion due to adsorption of water and solutes onto metal and metal oxide surfaces is a critical factor in the long term reliability of electronic devices. To investigate the atomistic mechanisms of corrosion, we used molecular dynamics (MD) simulations to study the structure of water adsorbed onto both boehmite (γ-AlO(OH)) and gold (Au) surfaces and electrolyte adsorption and surface speciation on the boehmite (010) surface. Boehmite forms a thin film on aluminum metal under oxidizing conditions, is hydrophilic, and readily adsorbs water from the atmosphere. In contrast, gold surfaces are hydrophobic, and condensed water does not readily bond with the surface. Our MD simulations were performed using the CLAYFF force field that maintains full flexibility of water and substrate and allows for full energy and momentum transfer among all atoms. The boehmite (010) and gold (111) surfaces were initially simulated with no water present and then with incremental additions of water molecules. The calculations indicate the boehmite (010) surface structure strongly controls the organization of the first monolayer of interfacial water. In contrast, the structure of water on the gold (111) surface is controlled by hydrogen bonding among the water molecules. To investigate Cl - adsorption to the boehmite surface, Na + and Cl - ions were added to two boehmite-water simulation cells, one with 3.5 monolayers of water on the boehmite surface and the other representing water-saturated conditions. In both scenarios, the addition of NaCl solute disturbed the first monolayer of water adsorbed to the surface. Chloride ions displaced water molecules that were originally bound to the boehmite surface. In contrast, the Na + ions do not disturb the arrangement of these water molecules. Na + -Cl - pairs were observed to occur on the surface. Both the near-surface water structure and the effects of ion adsorption were similar regardless of the number of monolayers of water present in the simulation cells. Background Metals such as Al exhibit a significant degree of corrosion resistance in a wide variety of environments due to the presence of protective surface oxides. Boehmite, an Al- oxyhydroxide (γ-AlO(OH)), is one of the several aluminum oxides, oxyhydroxides, and hydroxides that form upon the oxidation of aluminum 1,2 and has been observed in the passive thin films protecting Al metal and Al-metal alloys. 3,4 Gold is representative of common connector and post materials used in microelectronics; it often coexists with Al components in circuits and related devices and does not react with the environment to form a protective oxide coating. Exposure of Al metal to halides like chloride (Cl - ) results in pitting corrosion. In pitting, the metal corrosion is extremely localized and is typically initiated at a lattice defect site expressed on the metal surface. Pit initiation may involve the transport of aggressive anions such as Cl - through the passive oxide/hydroxide film to the interface with Al metal where aggressive dissolution is promoted. Or pit initiation may occur by a film-breaking mechanism in which Cl - adsorption to the Al-hydroxide surface is the first step in passive film thinning. These theories are discussed in detail in many metal corrosion review papers 5–7 and are supported by spectroscopic observations that chloride is taken up by oxide thin films 8–13 prior to pit initiation. First-principles and atomistic molecular dynamics simula- tions have been used in the past to establish the sites of water molecule dissociation or physisorption on oxides such as MgO, 14,15 CaO, 14 R-TiO 2 , 16 R-SiO 2 , 17–20 R-Al 2 O 3 , 21,22 and * Corresponding author. E-mail: [email protected]. (1) Lopez, S.; Petit, J.-P.; Dunlop, H. M.; Butruille, J.-R.; Tourillon, G. J. Electrochem. Soc. 1998, 145, 823. (2) Lopez, S.; Petit, J.-P.; Tourillon, G.; Dunlop, H. M.; Butruille, J.-R. J. Electrochem. Soc. 1998, 145, 829. (3) Ahmad, Z.; Aleem, B. J. A. Mater. Des. 2002, 23, 173. (4) Rotole, J. A.; Sherwood, P. M. A. Fresenius’ J. Anal. Chem. 2001, 369, 342. (5) Strehblow, H. H. Werkstoffe und Korrosion 1984, 35, 437. (6) Frankel, G. S. J. Electrochem. Soc. 1998, 145, 2186. (7) Bohni, H. Localized Corrosion of Passive Metals. In Uhlig’s Corrosion Handbook; Revie, W., Ed.; John Wiley & Sons, Inc.: New York, 2000; p 173. (8) Natishan, P. M.; O’Grady, W. E.; McCafferty, E.; Ramaker, D. E.; Pandya, K.; Russell, A. J. Electrochem. Soc. 1999, 146, 1737. (9) Yu, S. Y.; O’Grady, W. E.; Ramaker, D. E.; Natishan, P. M. J. Electrochem. Soc. 2000, 147, 2952. (10) Natishan, P. M.; Yu, S. Y.; O’Grady, W. E.; Ramaker, D. E. Electrochim. Acta 2002, 47, 3131. (11) Kolics, A.; Polkinghorne, J. C.; Wieckowski, A. Electrochim. Acta 1998, 43, 2605. (12) Kolics, A.; Polkinghorne, J. C.; Thomas, A. E.; Wieckowski, A. Chem. Mater. 1998, 10, 812. (13) Kolics, A.; Besing, A. S.; Baradlai, P.; Haasch, R.; Wieckowski, A. J. Electrochem. Soc. 2001, 148, B251. (14) Carrasco, J.; Illas, F.; Lopez, N. Phys. ReV. Lett. 2008, 100, 016101. 4682 Chem. Mater. 2008, 20, 4682–4693 10.1021/cm702781r CCC: $40.75 2008 American Chemical Society Published on Web 06/27/2008
-
Upload
independent -
Category
Documents
-
view
3 -
download
0
Transcript of Water and Halide Adsorption to Corrosion Surfaces: Molecular Simulations of Atmospheric Interactions...
Water and Halide Adsorption to Corrosion Surfaces: MolecularSimulations of Atmospheric Interactions with Aluminum
Oxyhydroxide and Gold
Louise J. Criscenti,* Randall T. Cygan, Ara S. Kooser, and Harold K. Moffat
Sandia National Laboratories, Albuquerque, New Mexico 87185-0754
ReceiVed September 27, 2007. ReVised Manuscript ReceiVed April 17, 2008
Atmospheric corrosion due to adsorption of water and solutes onto metal and metal oxide surfaces isa critical factor in the long term reliability of electronic devices. To investigate the atomistic mechanismsof corrosion, we used molecular dynamics (MD) simulations to study the structure of water adsorbedonto both boehmite (γ-AlO(OH)) and gold (Au) surfaces and electrolyte adsorption and surface speciationon the boehmite (010) surface. Boehmite forms a thin film on aluminum metal under oxidizing conditions,is hydrophilic, and readily adsorbs water from the atmosphere. In contrast, gold surfaces are hydrophobic,and condensed water does not readily bond with the surface. Our MD simulations were performed usingthe CLAYFF force field that maintains full flexibility of water and substrate and allows for full energyand momentum transfer among all atoms. The boehmite (010) and gold (111) surfaces were initiallysimulated with no water present and then with incremental additions of water molecules. The calculationsindicate the boehmite (010) surface structure strongly controls the organization of the first monolayer ofinterfacial water. In contrast, the structure of water on the gold (111) surface is controlled by hydrogenbonding among the water molecules. To investigate Cl- adsorption to the boehmite surface, Na+ andCl- ions were added to two boehmite-water simulation cells, one with 3.5 monolayers of water on theboehmite surface and the other representing water-saturated conditions. In both scenarios, the additionof NaCl solute disturbed the first monolayer of water adsorbed to the surface. Chloride ions displacedwater molecules that were originally bound to the boehmite surface. In contrast, the Na+ ions do notdisturb the arrangement of these water molecules. Na+-Cl- pairs were observed to occur on the surface.Both the near-surface water structure and the effects of ion adsorption were similar regardless of thenumber of monolayers of water present in the simulation cells.
Background
Metals such as Al exhibit a significant degree of corrosionresistance in a wide variety of environments due to thepresence of protective surface oxides. Boehmite, an Al-oxyhydroxide (γ-AlO(OH)), is one of the several aluminumoxides, oxyhydroxides, and hydroxides that form upon theoxidation of aluminum1,2 and has been observed in thepassive thin films protecting Al metal and Al-metal alloys.3,4
Gold is representative of common connector and postmaterials used in microelectronics; it often coexists with Alcomponents in circuits and related devices and does not reactwith the environment to form a protective oxide coating.
Exposure of Al metal to halides like chloride (Cl-) resultsin pitting corrosion. In pitting, the metal corrosion isextremely localized and is typically initiated at a lattice defectsite expressed on the metal surface. Pit initiation may involvethe transport of aggressive anions such as Cl- through thepassive oxide/hydroxide film to the interface with Al metal
where aggressive dissolution is promoted. Or pit initiationmay occur by a film-breaking mechanism in which Cl-
adsorption to the Al-hydroxide surface is the first step inpassive film thinning. These theories are discussed in detailin many metal corrosion review papers5–7 and are supportedby spectroscopic observations that chloride is taken up byoxide thin films8–13 prior to pit initiation.
First-principles and atomistic molecular dynamics simula-tions have been used in the past to establish the sites of watermolecule dissociation or physisorption on oxides such asMgO,14,15 CaO,14 R-TiO2,16 R-SiO2,17–20 R-Al2O3,21,22 and
* Corresponding author. E-mail: [email protected].(1) Lopez, S.; Petit, J.-P.; Dunlop, H. M.; Butruille, J.-R.; Tourillon, G.
J. Electrochem. Soc. 1998, 145, 823.(2) Lopez, S.; Petit, J.-P.; Tourillon, G.; Dunlop, H. M.; Butruille, J.-R.
J. Electrochem. Soc. 1998, 145, 829.(3) Ahmad, Z.; Aleem, B. J. A. Mater. Des. 2002, 23, 173.(4) Rotole, J. A.; Sherwood, P. M. A. Fresenius’ J. Anal. Chem. 2001,
369, 342.
(5) Strehblow, H. H. Werkstoffe und Korrosion 1984, 35, 437.(6) Frankel, G. S. J. Electrochem. Soc. 1998, 145, 2186.(7) Bohni, H. Localized Corrosion of Passive Metals. In Uhlig’s Corrosion
Handbook; Revie, W., Ed.; John Wiley & Sons, Inc.: New York, 2000;p 173.
(8) Natishan, P. M.; O’Grady, W. E.; McCafferty, E.; Ramaker, D. E.;Pandya, K.; Russell, A. J. Electrochem. Soc. 1999, 146, 1737.
(9) Yu, S. Y.; O’Grady, W. E.; Ramaker, D. E.; Natishan, P. M. J.Electrochem. Soc. 2000, 147, 2952.
(10) Natishan, P. M.; Yu, S. Y.; O’Grady, W. E.; Ramaker, D. E.Electrochim. Acta 2002, 47, 3131.
(11) Kolics, A.; Polkinghorne, J. C.; Wieckowski, A. Electrochim. Acta1998, 43, 2605.
(12) Kolics, A.; Polkinghorne, J. C.; Thomas, A. E.; Wieckowski, A. Chem.Mater. 1998, 10, 812.
(13) Kolics, A.; Besing, A. S.; Baradlai, P.; Haasch, R.; Wieckowski, A.J. Electrochem. Soc. 2001, 148, B251.
(14) Carrasco, J.; Illas, F.; Lopez, N. Phys. ReV. Lett. 2008, 100, 016101.
4682 Chem. Mater. 2008, 20, 4682–4693
10.1021/cm702781r CCC: $40.75 2008 American Chemical SocietyPublished on Web 06/27/2008
R-Fe2O3.23 These studies have contributed to our understand-ing of the formation of hydroxylated surface sites in anatmospheric environment. The adsorption of water to hy-droxylated oxides (i.e., rutile (R-TiO2),24 cassiterite (SnO2),25
quartz (R-SiO2)18), hydroxides (i.e., brucite (Mg(OH)2),26
gibbsite (Al(OH)3),26 white rust (Fe(OH)2)23), and oxyhy-droxides (i.e., goethite (R-FeO(OH))23) has also been simu-lated to investigate water structure at solid-water interfaces.Most molecular dynamics simulations of crystal-water in-teractions implement a point charge model for water.However, polarizable and dissociative water models havealso been developed and used to investigate associative anddissociative adsorption of water to oxide surfaces.15,17–20,23,27–35
In this study, a series of classical molecular dynamicssimulations was used to investigate the adsorption of watermolecules and chloride on an Al-oxyhydroxide boehmite (γ-AlO(OH)), a representative passivating, thin film-formingoxyhydroxide on Al metal under atmospheric conditions. Inaddition, water adsorption to the gold (111) surface wassimulated to qualitatively compare the calculated adsorptionenergies and water structure as a function of relative humidityon a hydrophilic surface (i.e., boehmite (010)) and a relativelyhydrophobic surface (i.e., Au(111)).
Simulation Methods
Molecular dynamics simulations were performed using theCLAYFF force field originally developed to study hydroxi-
de and aluminosilicate mineral-water interactions.36 Thisforce field is based on an ionic (nonbonded) description ofthe metal-oxygen interactions within hydrated crystallinecompounds. CLAYFF incorporates the simple point charge(SPC) water model37 to represent the bonded and nonbondedinteractions for water molecules and surface hydroxyl groups.Bond stretch and bond angle terms are introduced into thestandard SPC water model to provide full flexibility for thewater molecules and hydroxyl groups.38 The total energy,Etotal, calculated with CLAYFF, has contributions fromCoulombic (electrostatic), short-range (van der Waals), andbonded interactions:
Etotal )Ecoul +EVDW +Ebondstretch +Eanglebend (1)
The interactions within boehmite are described primarilyby the Coulombic and van der Waals energy terms. The bondstretch and angle bend energy terms are represented byharmonic functions in the flexible SPC water model used todescribe adsorbing water molecules and hydroxyl groups bothwithin the bulk and on the surface of the boehmite. The fullatomic flexibility of CLAYFF allows the exchange of mo-mentum and energy across all atoms, in the crystal structure,the aqueous phase, and the interface. CLAYFF has alreadybeen shown to successfully simulate the interaction of otherhydroxide surfaces with aqueous solutions.39–41 To investi-gate the adsorption of Na+ and Cl- onto boehmite, accurateforce field parameters for aqueous Na+ and Cl- ions42 wereincorporated into CLAYFF.
For comparison with boehmite, we also performed mo-lecular simulations of water adsorption onto a gold surface.The Lennard-Jones parameters for gold were taken from thecharge valence force field43 (CVFF) and incorporated intothe CLAYFF parameter set. Conventional combination ruleswere applied to generate the nonbonded parameters betweenspecific atom pairs.44 No partial charges were assigned tothe gold atoms; all water and electrolyte interactions withthe gold surface are represented solely by the van der Waalsinteractions. All molecular dynamics simulations wereperformed using the Cerius2 (Accelrys, Inc.45) open forcefield (OFF) module, using a spline function with cutoffs of8.0 Å and 8.5 Å (to ensure a smooth transition to zero energy)to calculate the van der Waals energies and a Ewald sum-mation with a real space cut off of 10.85 Å (and η ) 3.21)to evaluate the long-range Coulombic interactions.
Boehmite (010) and Gold (111) Surfaces. The boehmite(010) surface model was created based on published unit
(15) de Leeuw, N. H.; Parker, S. C. Phys. ReV. B 1998, 58, 13901.(16) Bandura, A. V.; Sykes, D. G.; Shapovalov, V.; Truong, T. N.; Kubicki,
J. D.; Evarestov, R. A. J. Phys. Chem. B 2004, 108, 7844.(17) de Leeuw, N. H.; Higgins, F. M.; Parker, S. C. J. Phys. Chem. B
1999, 103, 1270.(18) Du, Z.; de Leeuw, N. H. Dalton Trans. 2006, 2623.(19) Garofalini, S. H. J. Non-Cryst. Solids 1990, 120, 1.(20) Mahadevan, T. S.; Garofalini, S. H. J. Phys. Chem. B 2007, 111, 8919.(21) Hass, K. C.; Schnieder, W. F.; Curioni, A.; Andreoni, W. J. Phys.
Chem. B 2000, 104, 5527.(22) de Leeuw, N. H.; Parker, S. C. J. Am. Ceram. Soc. 1999, 82, 3209.(23) de Leeuw, N. H.; Cooper, T. G. Geochim. Cosmochim. Acta 2007,
71, 1655.(24) Predota, M.; Bandura, A. V.; Cummings, P. T.; Kubicki, J. D.;
Wesolowski, D. J.; Chialvo, A. A.; Machesky, M. L. J. Phys. Chem.B 2004, 108, 12049.
(25) Vlcek, L.; Zhang, Z.; Machesky, M. L.; Fenter, P. A.; Rosenqvist, J.;Wesolowski, D. J.; Anovitz, L. M.; Predota, M.; Cummings, P. T.Langmuir 2007, 23, 4925.
(26) Wang, J.; Kalinichev, A. G.; Kirkpatrick, R. J. Geochim. Cosmochim.Acta 2006, 70, 562.
(27) Rustad, J. R.; Felmy, A. R.; Hay, B. P. Geochim. Cosmochim. Acta1996, 60, 1553.
(28) Rustad, J. R.; Felmy, A. R.; Hay, B. P. Geochim. Cosmochim. Acta1996, 60, 1563.
(29) de Leeuw, N. H.; Parker, S. C. J. Am. Ceram. Soc. 1999, 82, 3209.(30) Rustad, J. R.; Wasserman, E.; Felmy, A. R.; Wilke, C. J. Colloid
Interface Sci. 1998, 198, 119.(31) Rustad, J. R.; Wasserman, E.; Felmy, A. R. Surf. Sci. 1999, 424, 28.(32) Wasserman, E.; Rustad, J. R.; Felmy, A. R. Surf. Sci. 1999, 424, 17.(33) Rustad, J. R.; Felmy, A. R. Molecular statics calculations of acid/
base reactions on magnetite (001). In Solid-Liquid Interface Theory;Halley, J. W., Ed.; ACS Symposium Series 789; American ChemicalSociety: Washington, DC, 2001; Chapter 9, p 113.
(34) Rustad, J. R.; Wasserman, E.; Felmy, A. R. The magnetite (001)surface: Insights from molecular dynamics calculations. In Propertiesof Complex Inorganic Solids; Meike, A., Gonis, A., Turchi, P. E. A.,Rajan, K., Eds.; Kluwer Academic/Plenum Publishers: Dordrecht,2000; Vol. II; p 499.
(35) Rustad, J. R.; Felmy, A. R.; Bylaska, E. J. Geochim. Cosmochim. Acta2003, 67, 1001.
(36) Cygan, R. T.; Liang, J.-J.; Kalinichev, A. G. J. Phys. Chem. B 2004,108, 1255.
(37) Berendsen, H. J. C.; Postma, J. P. M.; van Gunsteren, W. F.; Hermans,J. Interaction models for water in relation to protein hydration. InIntermolecular Forces; Pullman, B., Ed.; D. Reidel: Dordrecht, 1981;p 331.
(38) Teleman, O.; Jonsson, B.; Engstrom, S. Mol. Phys. 1987, 60, 193.(39) Wang, J.; Kalinichev, A. G.; Kirkpatrick, R. J.; Hou, X. Chem. Mater.
2001, 13, 145.(40) Kalinichev, A. G.; Kirkpatrick, R. J. Chem. Mater. 2002, 14, 3539.(41) Hou, X.; Kalinichev, A. G.; Kirkpatrick, R. J. Chem. Mater. 2002,
14, 2078.(42) Smith, D. E.; Dang, L. X. J. Chem. Phys. 1994, 100, 3757.(43) Dauber-Osguthorpe, P.; Roberts, V. A.; Osguthorpe, D. J.; Wolff, J.;
Genest, M.; Hagler, A. T. PROTEINS: Structure, Function, andGenetics 1988, 4, 31.
(44) Halgren, T. A. J. Am. Chem. Soc. 1992, 14, 7827.(45) Accelyrs, Inc., San Diego, CA.
4683Chem. Mater., Vol. 20, No. 14, 2008Water and Halide Adsorption to Corrosion Surfaces
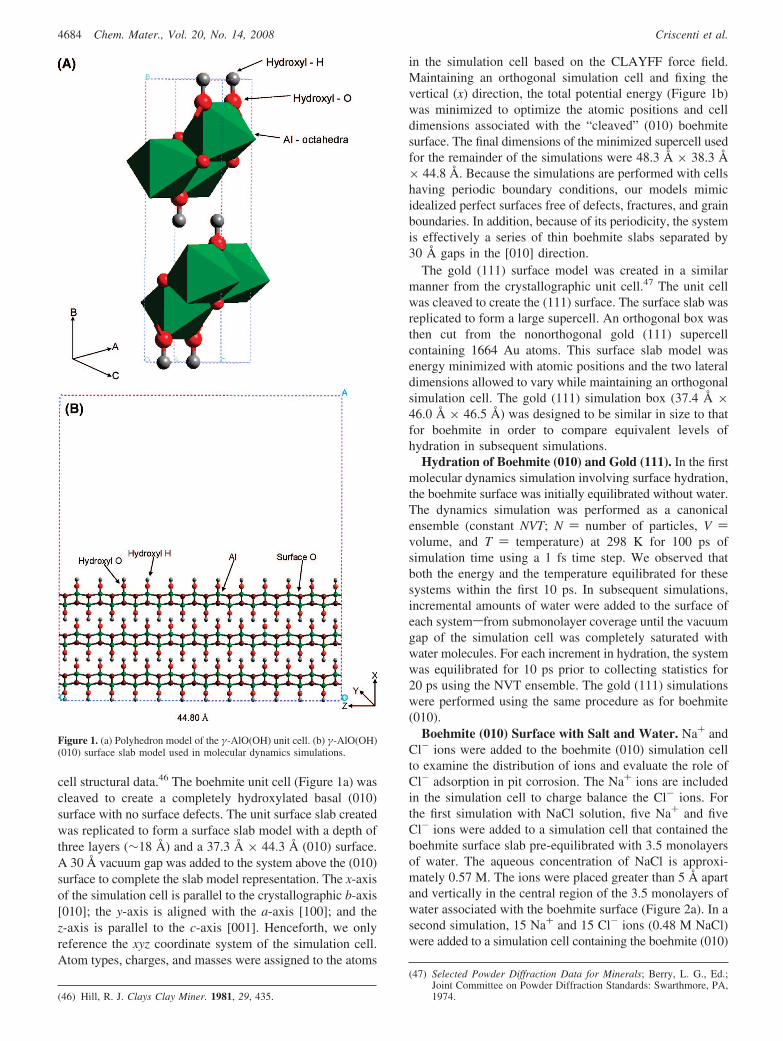
cell structural data.46 The boehmite unit cell (Figure 1a) wascleaved to create a completely hydroxylated basal (010)surface with no surface defects. The unit surface slab createdwas replicated to form a surface slab model with a depth ofthree layers (∼18 Å) and a 37.3 Å × 44.3 Å (010) surface.A 30 Å vacuum gap was added to the system above the (010)surface to complete the slab model representation. The x-axisof the simulation cell is parallel to the crystallographic b-axis[010]; the y-axis is aligned with the a-axis [100]; and thez-axis is parallel to the c-axis [001]. Henceforth, we onlyreference the xyz coordinate system of the simulation cell.Atom types, charges, and masses were assigned to the atoms
in the simulation cell based on the CLAYFF force field.Maintaining an orthogonal simulation cell and fixing thevertical (x) direction, the total potential energy (Figure 1b)was minimized to optimize the atomic positions and celldimensions associated with the “cleaved” (010) boehmitesurface. The final dimensions of the minimized supercell usedfor the remainder of the simulations were 48.3 Å × 38.3 Å× 44.8 Å. Because the simulations are performed with cellshaving periodic boundary conditions, our models mimicidealized perfect surfaces free of defects, fractures, and grainboundaries. In addition, because of its periodicity, the systemis effectively a series of thin boehmite slabs separated by30 Å gaps in the [010] direction.
The gold (111) surface model was created in a similarmanner from the crystallographic unit cell.47 The unit cellwas cleaved to create the (111) surface. The surface slab wasreplicated to form a large supercell. An orthogonal box wasthen cut from the nonorthogonal gold (111) supercellcontaining 1664 Au atoms. This surface slab model wasenergy minimized with atomic positions and the two lateraldimensions allowed to vary while maintaining an orthogonalsimulation cell. The gold (111) simulation box (37.4 Å ×46.0 Å × 46.5 Å) was designed to be similar in size to thatfor boehmite in order to compare equivalent levels ofhydration in subsequent simulations.
Hydration of Boehmite (010) and Gold (111). In the firstmolecular dynamics simulation involving surface hydration,the boehmite surface was initially equilibrated without water.The dynamics simulation was performed as a canonicalensemble (constant NVT; N ) number of particles, V )volume, and T ) temperature) at 298 K for 100 ps ofsimulation time using a 1 fs time step. We observed thatboth the energy and the temperature equilibrated for thesesystems within the first 10 ps. In subsequent simulations,incremental amounts of water were added to the surface ofeach systemsfrom submonolayer coverage until the vacuumgap of the simulation cell was completely saturated withwater molecules. For each increment in hydration, the systemwas equilibrated for 10 ps prior to collecting statistics for20 ps using the NVT ensemble. The gold (111) simulationswere performed using the same procedure as for boehmite(010).
Boehmite (010) Surface with Salt and Water. Na+ andCl- ions were added to the boehmite (010) simulation cellto examine the distribution of ions and evaluate the role ofCl- adsorption in pit corrosion. The Na+ ions are includedin the simulation cell to charge balance the Cl- ions. Forthe first simulation with NaCl solution, five Na+ and fiveCl- ions were added to a simulation cell that contained theboehmite surface slab pre-equilibrated with 3.5 monolayersof water. The aqueous concentration of NaCl is approxi-mately 0.57 M. The ions were placed greater than 5 Å apartand vertically in the central region of the 3.5 monolayers ofwater associated with the boehmite surface (Figure 2a). In asecond simulation, 15 Na+ and 15 Cl- ions (0.48 M NaCl)were added to a simulation cell containing the boehmite (010)
(46) Hill, R. J. Clays Clay Miner. 1981, 29, 435.
(47) Selected Powder Diffraction Data for Minerals; Berry, L. G., Ed.;Joint Committee on Powder Diffraction Standards: Swarthmore, PA,1974.
Figure 1. (a) Polyhedron model of the γ-AlO(OH) unit cell. (b) γ-AlO(OH)(010) surface slab model used in molecular dynamics simulations.
4684 Chem. Mater., Vol. 20, No. 14, 2008 Criscenti et al.
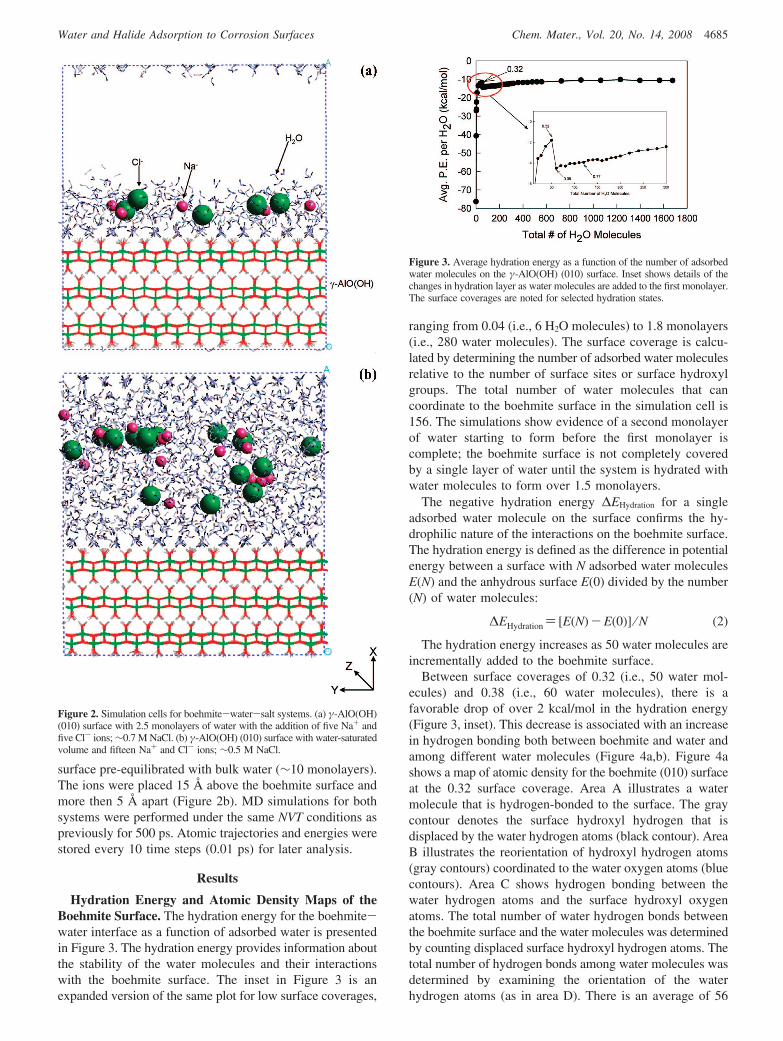
surface pre-equilibrated with bulk water (∼10 monolayers).The ions were placed 15 Å above the boehmite surface andmore then 5 Å apart (Figure 2b). MD simulations for bothsystems were performed under the same NVT conditions aspreviously for 500 ps. Atomic trajectories and energies werestored every 10 time steps (0.01 ps) for later analysis.
Results
Hydration Energy and Atomic Density Maps of theBoehmite Surface. The hydration energy for the boehmite-water interface as a function of adsorbed water is presentedin Figure 3. The hydration energy provides information aboutthe stability of the water molecules and their interactionswith the boehmite surface. The inset in Figure 3 is anexpanded version of the same plot for low surface coverages,
ranging from 0.04 (i.e., 6 H2O molecules) to 1.8 monolayers(i.e., 280 water molecules). The surface coverage is calcu-lated by determining the number of adsorbed water moleculesrelative to the number of surface sites or surface hydroxylgroups. The total number of water molecules that cancoordinate to the boehmite surface in the simulation cell is156. The simulations show evidence of a second monolayerof water starting to form before the first monolayer iscomplete; the boehmite surface is not completely coveredby a single layer of water until the system is hydrated withwater molecules to form over 1.5 monolayers.
The negative hydration energy ∆EHydration for a singleadsorbed water molecule on the surface confirms the hy-drophilic nature of the interactions on the boehmite surface.The hydration energy is defined as the difference in potentialenergy between a surface with N adsorbed water moleculesE(N) and the anhydrous surface E(0) divided by the number(N) of water molecules:
∆EHydration ) [E(N)-E(0)] ⁄ N (2)
The hydration energy increases as 50 water molecules areincrementally added to the boehmite surface.
Between surface coverages of 0.32 (i.e., 50 water mol-ecules) and 0.38 (i.e., 60 water molecules), there is afavorable drop of over 2 kcal/mol in the hydration energy(Figure 3, inset). This decrease is associated with an increasein hydrogen bonding both between boehmite and water andamong different water molecules (Figure 4a,b). Figure 4ashows a map of atomic density for the boehmite (010) surfaceat the 0.32 surface coverage. Area A illustrates a watermolecule that is hydrogen-bonded to the surface. The graycontour denotes the surface hydroxyl hydrogen that isdisplaced by the water hydrogen atoms (black contour). AreaB illustrates the reorientation of hydroxyl hydrogen atoms(gray contours) coordinated to the water oxygen atoms (bluecontours). Area C shows hydrogen bonding between thewater hydrogen atoms and the surface hydroxyl oxygenatoms. The total number of water hydrogen bonds betweenthe boehmite surface and the water molecules was determinedby counting displaced surface hydroxyl hydrogen atoms. Thetotal number of hydrogen bonds among water molecules wasdetermined by examining the orientation of the waterhydrogen atoms (as in area D). There is an average of 56
Figure 2. Simulation cells for boehmite-water-salt systems. (a) γ-AlO(OH)(010) surface with 2.5 monolayers of water with the addition of five Na+ andfive Cl- ions; ∼0.7 M NaCl. (b) γ-AlO(OH) (010) surface with water-saturatedvolume and fifteen Na+ and Cl- ions; ∼0.5 M NaCl.
Figure 3. Average hydration energy as a function of the number of adsorbedwater molecules on the γ-AlO(OH) (010) surface. Inset shows details of thechanges in hydration layer as water molecules are added to the first monolayer.The surface coverages are noted for selected hydration states.
4685Chem. Mater., Vol. 20, No. 14, 2008Water and Halide Adsorption to Corrosion Surfaces
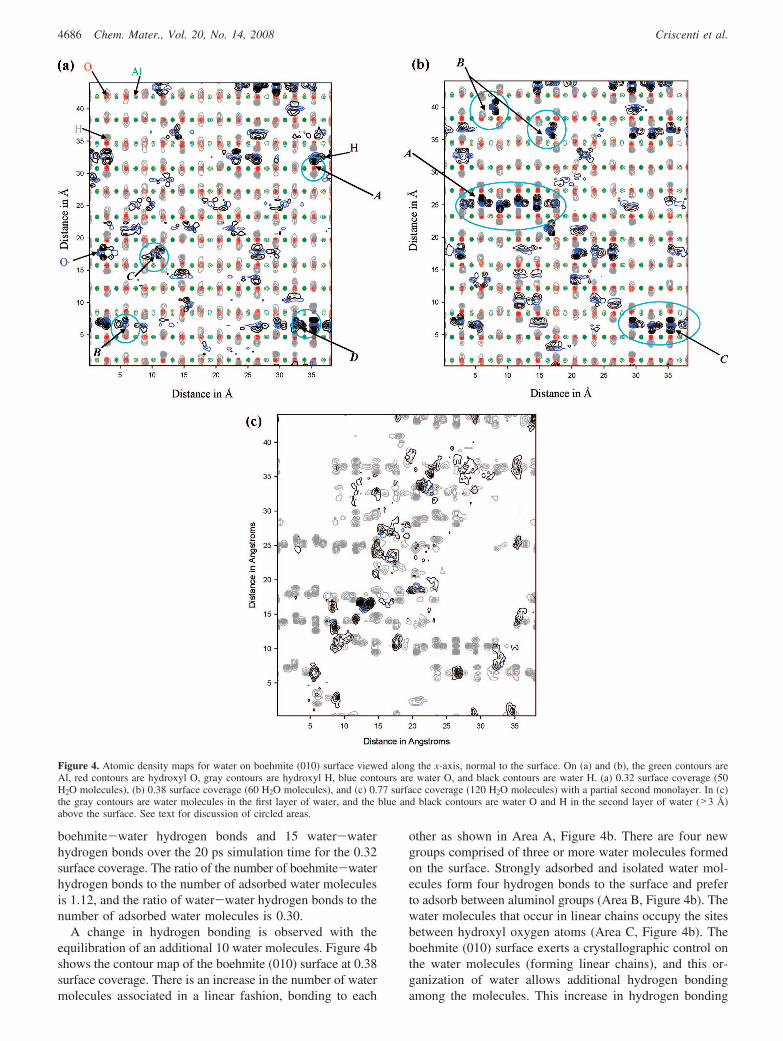
boehmite-water hydrogen bonds and 15 water-waterhydrogen bonds over the 20 ps simulation time for the 0.32surface coverage. The ratio of the number of boehmite-waterhydrogen bonds to the number of adsorbed water moleculesis 1.12, and the ratio of water-water hydrogen bonds to thenumber of adsorbed water molecules is 0.30.
A change in hydrogen bonding is observed with theequilibration of an additional 10 water molecules. Figure 4bshows the contour map of the boehmite (010) surface at 0.38surface coverage. There is an increase in the number of watermolecules associated in a linear fashion, bonding to each
other as shown in Area A, Figure 4b. There are four newgroups comprised of three or more water molecules formedon the surface. Strongly adsorbed and isolated water mol-ecules form four hydrogen bonds to the surface and preferto adsorb between aluminol groups (Area B, Figure 4b). Thewater molecules that occur in linear chains occupy the sitesbetween hydroxyl oxygen atoms (Area C, Figure 4b). Theboehmite (010) surface exerts a crystallographic control onthe water molecules (forming linear chains), and this or-ganization of water allows additional hydrogen bondingamong the molecules. This increase in hydrogen bonding
Figure 4. Atomic density maps for water on boehmite (010) surface viewed along the x-axis, normal to the surface. On (a) and (b), the green contours areAl, red contours are hydroxyl O, gray contours are hydroxyl H, blue contours are water O, and black contours are water H. (a) 0.32 surface coverage (50H2O molecules), (b) 0.38 surface coverage (60 H2O molecules), and (c) 0.77 surface coverage (120 H2O molecules) with a partial second monolayer. In (c)the gray contours are water molecules in the first layer of water, and the blue and black contours are water O and H in the second layer of water (>3 Å)above the surface. See text for discussion of circled areas.
4686 Chem. Mater., Vol. 20, No. 14, 2008 Criscenti et al.
leads to a significant and stabilizing decrease in the hydrationenergy. The total number of boehmite-water hydrogenbonds is 74, and the number of water-water hydrogen bondsis 25. This provides an average of 1.23 boehmite-waterhydrogen bonds per water molecule, and 0.41 water-waterhydrogen bonds per water molecule in the system. Thechange in water-boehmite bonding and energetics between0.32 and 0.38 coverage suggests that there is a thresholdcoverage associated with creating water-molecule chains onthe boehmite surface. This threshold coverage will be afunction of the random spatial distribution of water moleculeson the surface and cannot be precisely characterized withoutdetailed statistical analysis of many molecular simulationswith different initial water arrangements.
As the number of water molecules added to the systemincreases beyond 280 (surface coverage of 1.8) there is asteady rise in the hydration energy (Figure 3). Additionalwater-water interactions occur through the formation of thesecond monolayer of water before the first monolayer hasbeen completed. This process initially occurs (Figure 4c) at0.77 surface coverage and continues until the exposedboehmite surface is fully covered with adsorbed water. Theincrease in hydration energy is attributed to increasedinteractions among water molecules rather than between thesurface and the adsorbed water. As more water moleculesare added to the system, the hydration energy approachesthe limiting value of -9.95 kcal/mol which is equivalent tothe calculated self-interaction energy for bulk water calcu-lated using the flexible SPC water model. At a 0.77 surfacecoverage, 147 boehmite-water hydrogen bonds exist. Thenumber of hydrogen bonds among water molecules is 78.The average number of boehmite-water hydrogen bonds perwater molecule remains unchanged at 1.23 (the same as forthe lower (0.30) surface coverage), but the average numberof water-water hydrogen bonds per water molecule hasincreased to 0.65.
Atomic Density Profiles and Dipole Plots of the Boe-hmite (010) Surface. Atomic density profiles provideinformation about the orientation of water molecules nearthe surface, the local ordering of these molecules, and howadditional monolayers of water affect surface–water interac-tions. These profiles are constructed by taking thin volumeslices (typically 3 Å thick) of the simulation cell parallel tothe surface. The number of each unique atom type in eachvolume is counted by analysis of the trajectory data toproduce an atomic density for a given atom. For the boehmite(010) surface, atomic density profiles were derived parallelto the x-axis and normal to the boehmite surface (see Figure1b).
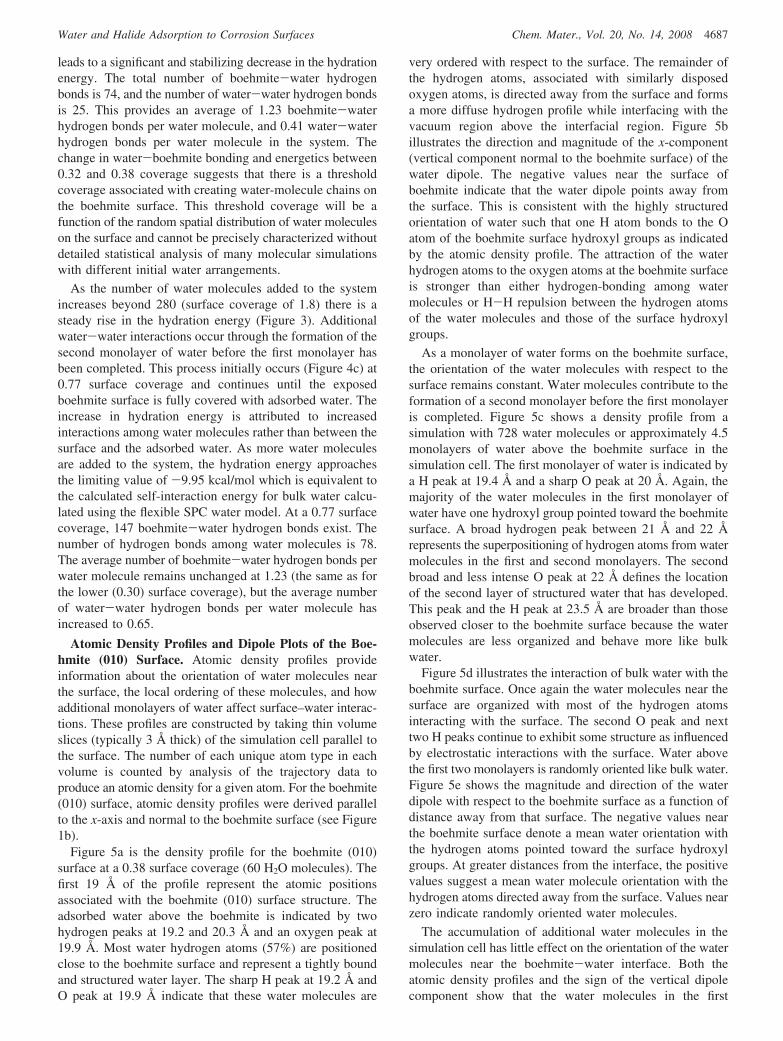
Figure 5a is the density profile for the boehmite (010)surface at a 0.38 surface coverage (60 H2O molecules). Thefirst 19 Å of the profile represent the atomic positionsassociated with the boehmite (010) surface structure. Theadsorbed water above the boehmite is indicated by twohydrogen peaks at 19.2 and 20.3 Å and an oxygen peak at19.9 Å. Most water hydrogen atoms (57%) are positionedclose to the boehmite surface and represent a tightly boundand structured water layer. The sharp H peak at 19.2 Å andO peak at 19.9 Å indicate that these water molecules are
very ordered with respect to the surface. The remainder ofthe hydrogen atoms, associated with similarly disposedoxygen atoms, is directed away from the surface and formsa more diffuse hydrogen profile while interfacing with thevacuum region above the interfacial region. Figure 5billustrates the direction and magnitude of the x-component(vertical component normal to the boehmite surface) of thewater dipole. The negative values near the surface ofboehmite indicate that the water dipole points away fromthe surface. This is consistent with the highly structuredorientation of water such that one H atom bonds to the Oatom of the boehmite surface hydroxyl groups as indicatedby the atomic density profile. The attraction of the waterhydrogen atoms to the oxygen atoms at the boehmite surfaceis stronger than either hydrogen-bonding among watermolecules or H-H repulsion between the hydrogen atomsof the water molecules and those of the surface hydroxylgroups.
As a monolayer of water forms on the boehmite surface,the orientation of the water molecules with respect to thesurface remains constant. Water molecules contribute to theformation of a second monolayer before the first monolayeris completed. Figure 5c shows a density profile from asimulation with 728 water molecules or approximately 4.5monolayers of water above the boehmite surface in thesimulation cell. The first monolayer of water is indicated bya H peak at 19.4 Å and a sharp O peak at 20 Å. Again, themajority of the water molecules in the first monolayer ofwater have one hydroxyl group pointed toward the boehmitesurface. A broad hydrogen peak between 21 Å and 22 Årepresents the superpositioning of hydrogen atoms from watermolecules in the first and second monolayers. The secondbroad and less intense O peak at 22 Å defines the locationof the second layer of structured water that has developed.This peak and the H peak at 23.5 Å are broader than thoseobserved closer to the boehmite surface because the watermolecules are less organized and behave more like bulkwater.
Figure 5d illustrates the interaction of bulk water with theboehmite surface. Once again the water molecules near thesurface are organized with most of the hydrogen atomsinteracting with the surface. The second O peak and nexttwo H peaks continue to exhibit some structure as influencedby electrostatic interactions with the surface. Water abovethe first two monolayers is randomly oriented like bulk water.Figure 5e shows the magnitude and direction of the waterdipole with respect to the boehmite surface as a function ofdistance away from that surface. The negative values nearthe boehmite surface denote a mean water orientation withthe hydrogen atoms pointed toward the surface hydroxylgroups. At greater distances from the interface, the positivevalues suggest a mean water molecule orientation with thehydrogen atoms directed away from the surface. Values nearzero indicate randomly oriented water molecules.
The accumulation of additional water molecules in thesimulation cell has little effect on the orientation of the watermolecules near the boehmite-water interface. Both theatomic density profiles and the sign of the vertical dipolecomponent show that the water molecules in the first
4687Chem. Mater., Vol. 20, No. 14, 2008Water and Halide Adsorption to Corrosion Surfaces
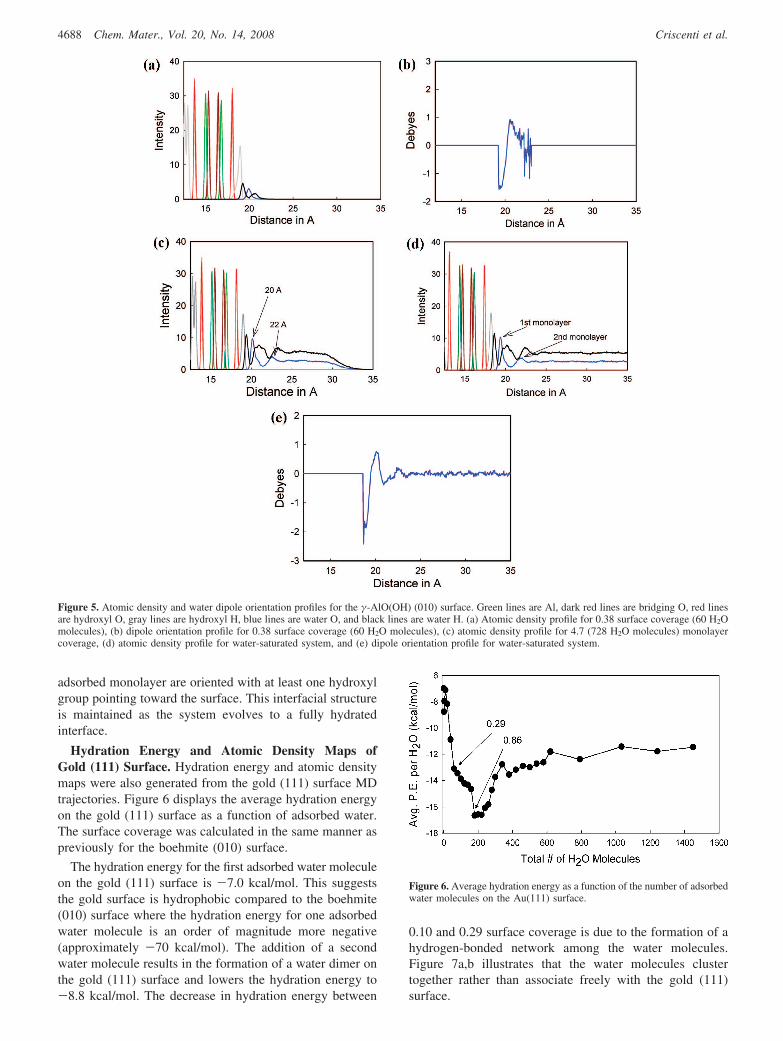
adsorbed monolayer are oriented with at least one hydroxylgroup pointing toward the surface. This interfacial structureis maintained as the system evolves to a fully hydratedinterface.
Hydration Energy and Atomic Density Maps ofGold (111) Surface. Hydration energy and atomic densitymaps were also generated from the gold (111) surface MDtrajectories. Figure 6 displays the average hydration energyon the gold (111) surface as a function of adsorbed water.The surface coverage was calculated in the same manner aspreviously for the boehmite (010) surface.
The hydration energy for the first adsorbed water moleculeon the gold (111) surface is -7.0 kcal/mol. This suggeststhe gold surface is hydrophobic compared to the boehmite(010) surface where the hydration energy for one adsorbedwater molecule is an order of magnitude more negative(approximately -70 kcal/mol). The addition of a secondwater molecule results in the formation of a water dimer onthe gold (111) surface and lowers the hydration energy to-8.8 kcal/mol. The decrease in hydration energy between
0.10 and 0.29 surface coverage is due to the formation of ahydrogen-bonded network among the water molecules.Figure 7a,b illustrates that the water molecules clustertogether rather than associate freely with the gold (111)surface.
Figure 5. Atomic density and water dipole orientation profiles for the γ-AlO(OH) (010) surface. Green lines are Al, dark red lines are bridging O, red linesare hydroxyl O, gray lines are hydroxyl H, blue lines are water O, and black lines are water H. (a) Atomic density profile for 0.38 surface coverage (60 H2Omolecules), (b) dipole orientation profile for 0.38 surface coverage (60 H2O molecules), (c) atomic density profile for 4.7 (728 H2O molecules) monolayercoverage, (d) atomic density profile for water-saturated system, and (e) dipole orientation profile for water-saturated system.
Figure 6. Average hydration energy as a function of the number of adsorbedwater molecules on the Au(111) surface.
4688 Chem. Mater., Vol. 20, No. 14, 2008 Criscenti et al.
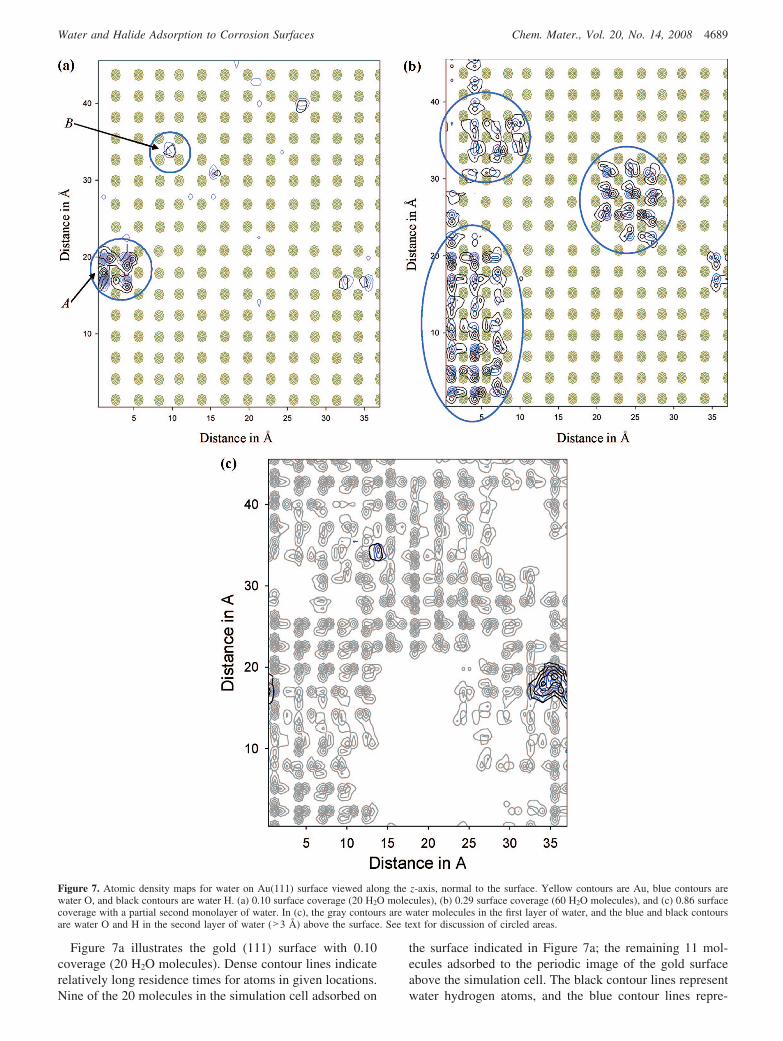
Figure 7a illustrates the gold (111) surface with 0.10coverage (20 H2O molecules). Dense contour lines indicaterelatively long residence times for atoms in given locations.Nine of the 20 molecules in the simulation cell adsorbed on
the surface indicated in Figure 7a; the remaining 11 mol-ecules adsorbed to the periodic image of the gold surfaceabove the simulation cell. The black contour lines representwater hydrogen atoms, and the blue contour lines repre-
Figure 7. Atomic density maps for water on Au(111) surface viewed along the z-axis, normal to the surface. Yellow contours are Au, blue contours arewater O, and black contours are water H. (a) 0.10 surface coverage (20 H2O molecules), (b) 0.29 surface coverage (60 H2O molecules), and (c) 0.86 surfacecoverage with a partial second monolayer of water. In (c), the gray contours are water molecules in the first layer of water, and the blue and black contoursare water O and H in the second layer of water (>3 Å) above the surface. See text for discussion of circled areas.
4689Chem. Mater., Vol. 20, No. 14, 2008Water and Halide Adsorption to Corrosion Surfaces
sent water oxygen atoms. In the area marked A there arefour water molecules that form a hydrogen-bonded cluster.The other five molecules (example in area B) are isolatedand dynamically interact with the gold surface during theMD simulation.
Figure 7b shows three distinct clusters (indicated by cyancircles) of water forming internally hydrogen-bonded net-works on the gold. These networks help to stabilize the watermolecules on the surface leading to a decrease in thehydration energy. This trend continues until 0.86 surfacecoverage (see Figure 6). The hydration energy increasestoward the representative value for bulk water (-9.95 kcal/mol) as water molecules form a second monolayer beforethe first layer is completed (Figure 7c).
The minimal interaction between the water molecules andthe gold (111) surface allows for the water molecules to forma hydrogen-bonded network among each other. The interac-tion between water and the gold (111) surface is controlledsolely by van der Waals forces in our force field model. Thesimulations indicate the gold (111) surface does not exertcrystallographic control on the water; instead the hydrationenergy is largely controlled by water-water interactions.
Atomic Density Profiles and Dipole Plots of Gold(111) Surface. As shown through the atomic density mapsdiscussed above, adsorbed water behaves differently on thegold (111) surface than on the boehmite surface. Thisdifference is also exhibited in the atomic density profiles anddipole orientation plots for the gold (111) surface. The gold(111) density profile is obtained parallel to the z-axis andnormal to the gold (111) surface.
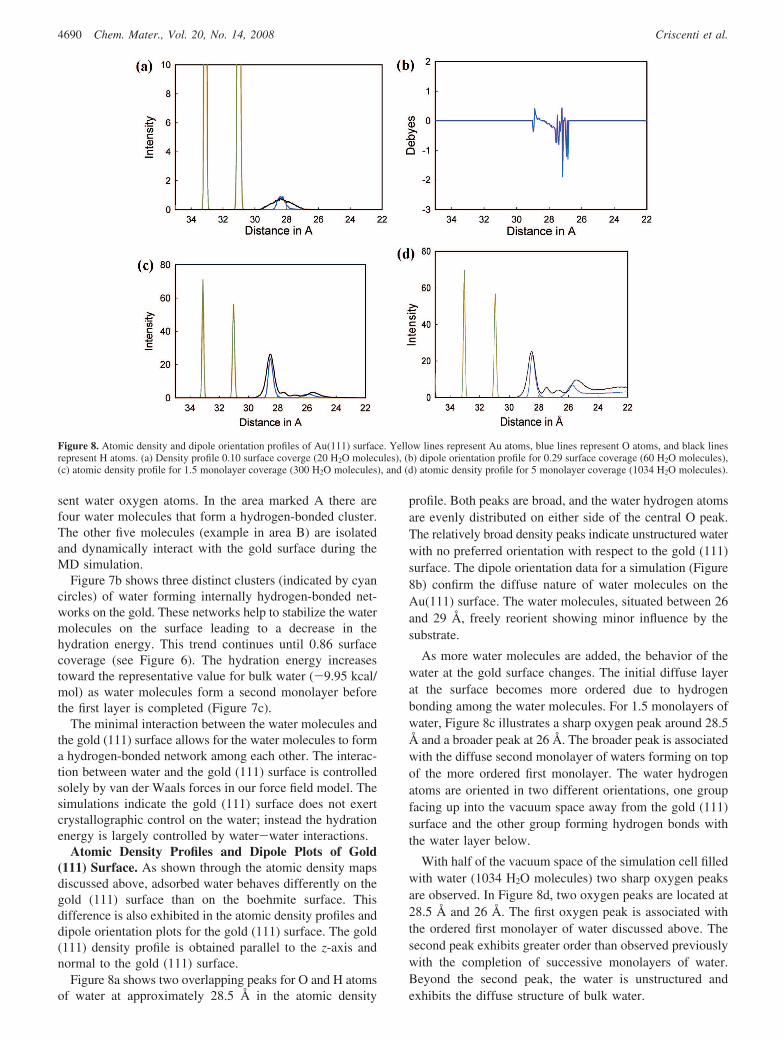
Figure 8a shows two overlapping peaks for O and H atomsof water at approximately 28.5 Å in the atomic density
profile. Both peaks are broad, and the water hydrogen atomsare evenly distributed on either side of the central O peak.The relatively broad density peaks indicate unstructured waterwith no preferred orientation with respect to the gold (111)surface. The dipole orientation data for a simulation (Figure8b) confirm the diffuse nature of water molecules on theAu(111) surface. The water molecules, situated between 26and 29 Å, freely reorient showing minor influence by thesubstrate.
As more water molecules are added, the behavior of thewater at the gold surface changes. The initial diffuse layerat the surface becomes more ordered due to hydrogenbonding among the water molecules. For 1.5 monolayers ofwater, Figure 8c illustrates a sharp oxygen peak around 28.5Å and a broader peak at 26 Å. The broader peak is associatedwith the diffuse second monolayer of waters forming on topof the more ordered first monolayer. The water hydrogenatoms are oriented in two different orientations, one groupfacing up into the vacuum space away from the gold (111)surface and the other group forming hydrogen bonds withthe water layer below.
With half of the vacuum space of the simulation cell filledwith water (1034 H2O molecules) two sharp oxygen peaksare observed. In Figure 8d, two oxygen peaks are located at28.5 Å and 26 Å. The first oxygen peak is associated withthe ordered first monolayer of water discussed above. Thesecond peak exhibits greater order than observed previouslywith the completion of successive monolayers of water.Beyond the second peak, the water is unstructured andexhibits the diffuse structure of bulk water.
Figure 8. Atomic density and dipole orientation profiles of Au(111) surface. Yellow lines represent Au atoms, blue lines represent O atoms, and black linesrepresent H atoms. (a) Density profile 0.10 surface coverge (20 H2O molecules), (b) dipole orientation profile for 0.29 surface coverage (60 H2O molecules),(c) atomic density profile for 1.5 monolayer coverage (300 H2O molecules), and (d) atomic density profile for 5 monolayer coverage (1034 H2O molecules).
4690 Chem. Mater., Vol. 20, No. 14, 2008 Criscenti et al.
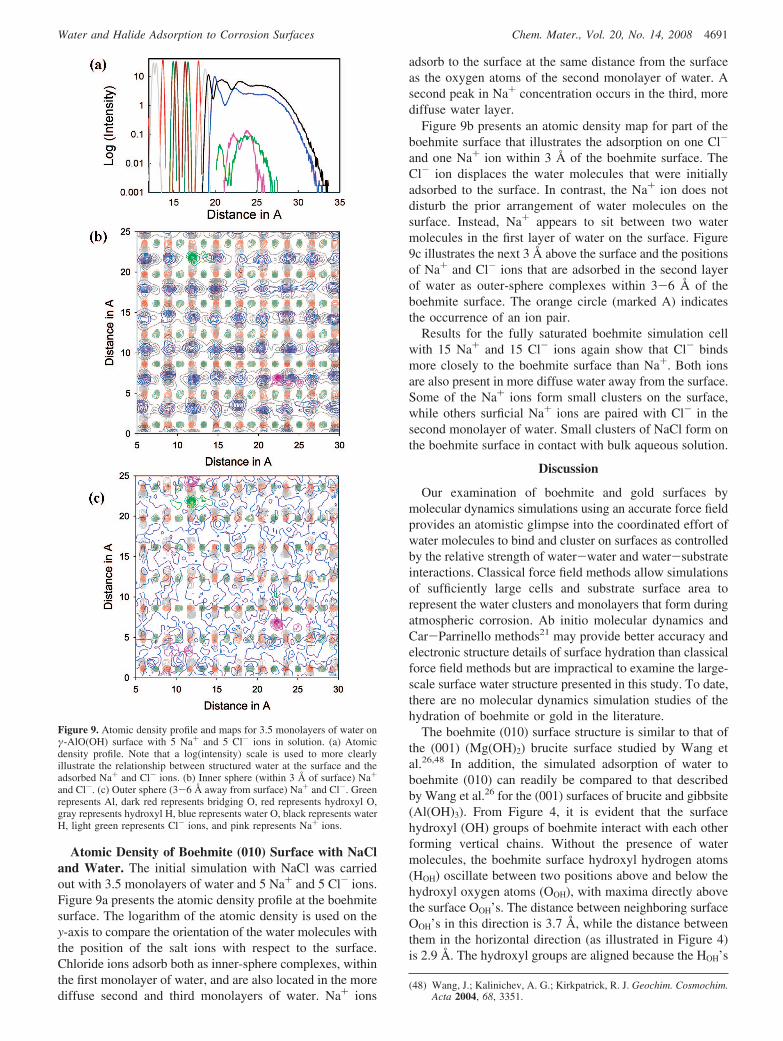
Atomic Density of Boehmite (010) Surface with NaCland Water. The initial simulation with NaCl was carriedout with 3.5 monolayers of water and 5 Na+ and 5 Cl- ions.Figure 9a presents the atomic density profile at the boehmitesurface. The logarithm of the atomic density is used on they-axis to compare the orientation of the water molecules withthe position of the salt ions with respect to the surface.Chloride ions adsorb both as inner-sphere complexes, withinthe first monolayer of water, and are also located in the morediffuse second and third monolayers of water. Na+ ions
adsorb to the surface at the same distance from the surfaceas the oxygen atoms of the second monolayer of water. Asecond peak in Na+ concentration occurs in the third, morediffuse water layer.
Figure 9b presents an atomic density map for part of theboehmite surface that illustrates the adsorption on one Cl-
and one Na+ ion within 3 Å of the boehmite surface. TheCl- ion displaces the water molecules that were initiallyadsorbed to the surface. In contrast, the Na+ ion does notdisturb the prior arrangement of water molecules on thesurface. Instead, Na+ appears to sit between two watermolecules in the first layer of water on the surface. Figure9c illustrates the next 3 Å above the surface and the positionsof Na+ and Cl- ions that are adsorbed in the second layerof water as outer-sphere complexes within 3-6 Å of theboehmite surface. The orange circle (marked A) indicatesthe occurrence of an ion pair.
Results for the fully saturated boehmite simulation cellwith 15 Na+ and 15 Cl- ions again show that Cl- bindsmore closely to the boehmite surface than Na+. Both ionsare also present in more diffuse water away from the surface.Some of the Na+ ions form small clusters on the surface,while others surficial Na+ ions are paired with Cl- in thesecond monolayer of water. Small clusters of NaCl form onthe boehmite surface in contact with bulk aqueous solution.
Discussion
Our examination of boehmite and gold surfaces bymolecular dynamics simulations using an accurate force fieldprovides an atomistic glimpse into the coordinated effort ofwater molecules to bind and cluster on surfaces as controlledby the relative strength of water-water and water-substrateinteractions. Classical force field methods allow simulationsof sufficiently large cells and substrate surface area torepresent the water clusters and monolayers that form duringatmospheric corrosion. Ab initio molecular dynamics andCar-Parrinello methods21 may provide better accuracy andelectronic structure details of surface hydration than classicalforce field methods but are impractical to examine the large-scale surface water structure presented in this study. To date,there are no molecular dynamics simulation studies of thehydration of boehmite or gold in the literature.
The boehmite (010) surface structure is similar to that ofthe (001) (Mg(OH)2) brucite surface studied by Wang etal.26,48 In addition, the simulated adsorption of water toboehmite (010) can readily be compared to that describedby Wang et al.26 for the (001) surfaces of brucite and gibbsite(Al(OH)3). From Figure 4, it is evident that the surfacehydroxyl (OH) groups of boehmite interact with each otherforming vertical chains. Without the presence of watermolecules, the boehmite surface hydroxyl hydrogen atoms(HOH) oscillate between two positions above and below thehydroxyl oxygen atoms (OOH), with maxima directly abovethe surface OOH’s. The distance between neighboring surfaceOOH’s in this direction is 3.7 Å, while the distance betweenthem in the horizontal direction (as illustrated in Figure 4)is 2.9 Å. The hydroxyl groups are aligned because the HOH’s
(48) Wang, J.; Kalinichev, A. G.; Kirkpatrick, R. J. Geochim. Cosmochim.Acta 2004, 68, 3351.
Figure 9. Atomic density profile and maps for 3.5 monolayers of water onγ-AlO(OH) surface with 5 Na+ and 5 Cl- ions in solution. (a) Atomicdensity profile. Note that a log(intensity) scale is used to more clearlyillustrate the relationship between structured water at the surface and theadsorbed Na+ and Cl- ions. (b) Inner sphere (within 3 Å of surface) Na+
and Cl-. (c) Outer sphere (3-6 Å away from surface) Na+ and Cl-. Greenrepresents Al, dark red represents bridging O, red represents hydroxyl O,gray represents hydroxyl H, blue represents water O, black represents waterH, light green represents Cl- ions, and pink represents Na+ ions.
4691Chem. Mater., Vol. 20, No. 14, 2008Water and Halide Adsorption to Corrosion Surfaces
are each repelled by two neighboring Al atoms (1.9 Å) andattracted to four equidistant (2.8 Å) bridging oxygen atomsin the gibbsite structure.
The pattern created by the surface hydroxyl groups differsfrom those formed on the brucite and gibbsite surfaces. Forbrucite, the OH groups tilt with equal probability toward threeneighboring tetrahedral vacancies on the surface, displayinga triangular distribution.26 For gibbsite, there are two distinctpopulations of OH groups: one-third of them tilt slightlytoward octahedral vacancies, while the other two-thirds aredynamically distributed between two preferred orientations.26
Chains of water molecules form on the boehmite surface(see Figure 4b) perpendicular to the chains of OH groups,with one water hydrogen atom above each bridging O atomof the boehmite surface structure. The water molecules formhydrogen bonds with each other and the surface hydroxylgroups. In addition, one of the two hydrogen atoms in eachadsorbed water molecule is within a 4 Å distance from abridging O atom. A single chain of water molecules on thesurface imposes additional constraints on the motion of theOH groups. The hydroxyl groups in one chain all orient inthe same direction (e.g., up) forming a series of hydrogenbonds. The OH groups in the neighboring chains orient inthe opposite direction. A hydrogen-bonded network is thusformed between the water molecules and the surface hy-droxyl groups.
Figure 5a,c,d provides the atomic density profiles forboehmite, with different water concentrations. To comparethe position of the water molecules above the boehmitesurface with those calculated for brucite and gibbsite, wemeasured the distance between the average position ofthe OOH’s and the OH2O’s. For the fully saturated system,the first OH2O density maximum is 1.88 Å away from thesurface oxygen atoms, and the second density maximumis 4.64 Å away from them. These two OH2O densitymaxima are closer to the boehmite surface than thosereported for brucite (2.40 Å and 4.95 Å) and gibbsite (2.55Å and 5.10 Å).26 The relative peak distances can becompared accurately because the simulations were allperformed using the same force field.36 Measurements ofthe positions of the two OH2O peaks with respect to thesurface were also compared for four different waterconcentrations. Although minor variations were observed(1.88-1.98 Å and 4.35-4.64 Å for the first and secondmaxima, respectively), a more detailed study would benecessary to determine if these variations are indicativeof a trend.
The small bond distances formed between boehmite andsurface water are probably a result of attraction between theHH2O’s and the surface bridging O atoms that occur lowerin the surface structure rather than the Al atoms. The basalsurface of boehmite is hydrophilic. The hydroxyl-terminatedsurface sites provide both hydrogen bond donors andacceptors that interact with the first monolayer of watermolecules, and the bridging oxygen atoms provide additionalhydrogen-bond acceptors. We observed that the majority ofwater molecules in the first water layer are oriented withhydrogen toward the surface forming a hydrogen-bondnetwork with the hydroxyl oxygen atoms of the boehmite.
Isolated water molecules exhibit more than two hydrogenbonds to surface hydroxyl groups. Above 0.30 surfacecoverage, a second layer of less tightly bound water withhydrogen atoms directed away from the surface starts toform. For the simulations involving multiple monolayers orbulk water, the water oxygen profile loses structure beyond10 Å and becomes more diffuse.
It should be noted that although water molecules on theAu(111) surface orient freely on the surface and are notcontrolled by the crystal structure, water still forms at leasttwo clearly distinct water layers at the gold surface. The firstmonolayer of water molecules is flat, parallel to the surfaceof Au atoms, with the water molecules forming a hydrogen-bonded network with each other. The second layer of waterthen forms hydrogen bonds with the first layer. From theatomic density profile illustrated in Figure 8d, it is evidentthat interfacial water at the gold surface also exhibits two tothree relatively structured layers of water before losingstructure beyond 7 Å from the surface.
Although no experimental measurements or molecularsimulations of Na+Cl- adsorption or other electrolyte ad-sorption have been performed for boehmite prior to thisstudy, molecular simulations have been performed to inves-tigate cation and anion adsorption to other oxide surfaces.In one study, the Cl- density profile for the neutralhydroxylated rutile (110) surface exhibited a small Cl- peakresulting from the direct interaction with hydrogen atoms ofthe surface hydroxyl groups.49 We also observed the adsorp-tion of Cl- ions on boehmite as an inner-sphere complex,directly interacting with the surface hydroxyl groups. Ex-perimental measurements or other molecular simulations ofelectrolyte adsorption on boehmite are not available in theliterature. We must rely on the quality of the force fieldparameters and previous parameter validation to judge thequality of the adsorption results for these ions.
Conclusions
By using an accurate energy force field and a series ofmolecular dynamics simulations, the hydration of boehmite(010) and gold (111) surfaces was successfully calculated.In addition, a set of simulations involving a NaCl electrolytesolution provided insight into the adsorption of Na+ and Cl-
to the boehmite surface.Water molecules strongly adsorbed to the boehmite (010)
surface. The density profiles, atomic density, and dipoleprofiles indicate that water molecules in the first monolayerhave a preferred orientation. The majority of these moleculesform a hydrogen bond between a water hydrogen and surfacehydroxyl oxygen. The attraction of water hydrogen to thesurface hydroxyl oxygen is greater than the repulsion of thesurface hydrogen to water hydrogen. As the water in the sys-tem approaches bulk behavior, the first monolayer remainsintact with the majority of the water hydrogens bonded tothe surface. The water molecules on the boehmite (010)
(49) Zhang, Z.; Fenter, P.; Cheng, L.; Sturchio, N. C.; Bedzyk, M. J.;Predota, M.; Bandura, A.; Kubicki, J. D.; Lvov, S. N.; Cummings,P. T.; Chioalvo, A. A.; Ridley, M. K.; Benezeth, P.; Anovitz, L.;Palmer, D. A.; Machesky, M. L.; Wesolowski, D. J. Langmuir 2004,20, 4954.
4692 Chem. Mater., Vol. 20, No. 14, 2008 Criscenti et al.
surface occupy different sites depending on the extents ofwater coverage. Isolated water molecules on the surfaceprefer to occupy the sites between two surface aluminolgroups. As more water is added to the simulation cell thewater molecules prefer to occupy the sites between twosurface hydroxyl oxygen atoms.
The water behavior at the gold (111) interface is signifi-cantly different relative to boehmite hydration. The firstmonolayer forms a hydrogen bonded network of watermolecules rather than associating with the gold surface. Thereis minimal surface–water interaction. The atomic densityplots and the density profiles exhibit an even distribution inthe orientation of the water hydrogens. Nonetheless, for bothboehmite and gold, the effect of the surface in structuringwater is minimal after the second water layer.
The addition of NaCl electrolyte solution to the boehmite(010) simulation cell disrupts the first monolayer of water.The Cl- ions in the 0.04 monolayer coverage simulationdisplace several waters in the first monolayer. The Na+ ionsthat diffuse into the first monolayer do not displace any
adsorbed surface waters. The Cl- ions prefer sites betweensurface oxygen atoms, and the Na+ ions prefer sites betweensurface aluminum atoms. Na+-Cl- pairs were observed tooccur on the surface. Both the near-surface water structureand the effects of ion adsorption were similar regardless ofthe number of monolayers of water overlying the boehmitesurface.
Acknowledgment. This research was funded by the Ad-vanced Simulation and Computing program of the U.S. Depart-ment of Energy for investigating the aqueous chemistry at theatmosphere-solid interface of microelectronics materials. Dis-cussions with Jeffrey Braithwaite, Andrey Kalinichev, andNancy Missert were helpful in the design of computer simula-tions and in the interpretation of the results. Two anonymousreviews helped improve this manuscript. Sandia is a multipro-gram laboratory operated by Sandia Corporation, a LockheedMartin company, for the U.S. Department of Energy undercontract DE-AC04-94AL85000.
CM702781R
4693Chem. Mater., Vol. 20, No. 14, 2008Water and Halide Adsorption to Corrosion Surfaces