Breakthrough curve modeling of liquid-phase adsorption of fluoride ions on aluminum-doped bone char...
8
Breakthrough curve modeling of liquid-phase adsorption of fluoride ions on aluminum-doped bone char using micro-columns: Effectiveness of data fitting approaches C.K. Rojas-Mayorga a , A. Bonilla-Petriciolet a, ⁎, F.J. Sánchez-Ruiz a , J. Moreno-Pérez a , H.E. Reynel-Ávila a , I.A. Aguayo-Villarreal a , D.I. Mendoza-Castillo a,b a Instituto Tecnológico de Aguascalientes, Aguascalientes 20256, Mexico b Consejo Nacional de Ciencia y Tecnología, Cátedras CONACYT, México D.F. 03940, Mexico abstract article info Available online xxxx Keywords: Packed-bed columns Fluoride Aluminum-modified bone char Breakthrough curve modeling Liquid-phase adsorption A comparative numerical analysis of three approaches for the breakthrough curve modeling has been performed using the experimental data of packed-bed fluoride adsorption on a novel aluminum-doped bone char using micro-columns. The performance of traditional Thomas and Yan breakthrough equations, a mass transfer model for a mobile fluid flowing through a porous media, and an artificial neural network with the optimal brain surgeon approach have been studied and discussed in the data fitting of asymmetric fluoride breakthrough curves. Results of this study highlighted the relative merits of tested breakthrough curve models for the non- linear adsorption data analysis involved in water defluoridation using a new adsorbent. In particular, the appli- cation of artificial neural networks is reliable for fitting highly non-linear adsorption patterns of priority water pollutants. © 2015 Elsevier B.V. All rights reserved. 1. Introduction Adsorption processes can be performed using batch and continuous type configurations [1,2]. Both operation modes offer different advan- tages but the dynamic adsorption systems are preferred for large-scale applications in water treatment due to their flexibility and easy opera- tion [1,3]. The liquid-phase adsorption at continuous flow conditions is recognized as a non-linear and multivariable process that can be ana- lyzed by the breakthrough curve. Specifically, the breakthrough curve describes the adsorption column dynamics and provides relevant infor- mation and key parameters for the design, operation and optimization of the separation system [4–6]. For example, the sharpness of the break- through curves is an indicator of the effectiveness of the adsorption pro- cess [4]. The characteristics of breakthrough curves depend on the bed configuration, feed flow, adsorbate concentration, pH, temperature, ad- sorbent mass, and other relevant variables [1,5–8]. Therefore, it is ex- pected that the adsorption pattern may vary significantly for each adsorbent–adsorbate system in packed-bed columns. Results reported in the literature indicate that the breakthrough curves obtained in the adsorption of water pollutants usually show an asymmetric sigmoidal profile even for mono-component solutions (i.e., solutions with only one adsorbate/pollutant). The modeling of these breakthrough curves for liquid-phase adsorption is fundamental for water treatment design in real-life applications [8]. The principal ob- jective of the breakthrough data modeling stage is the correlation and prediction of adsorption behavior based on the parameters obtained from experimental studies. However, the fitting of adsorption patterns in packed-bed columns is more difficult than the modeling in batch pro- cesses because the concentration profiles in the adsorbent and liquid phases for dynamic systems are determined by the mass transfer phe- nomena, adsorption kinetics and thermodynamics [4]. The break- through curve modeling is considered as a challenging mathematical problem, which implies non-linear data regressions for the determina- tion of model parameters using an error function. Depending on the model complexity, the application of other computational strategies is often necessary in breakthrough curve fitting, e.g., the use of numerical methods for solving partial differential equations. To date, several models have been proposed for the correlation of breakthrough curve data obtained in dynamic adsorption processes. These models include the Thomas [9], Bohart-Adams [10], Yon-Nelson [11], Clark [12], Yan [13] and other empirical or semi-empirical break- through equations [2,4]. These models are usually analytical equations that require a low computational time for data processing and are pop- ular for the correlation of adsorption data in water treatment due to their simple form and acceptable-fitting performance. Alternatively, a variety of mass transfer models can be applied for data fitting of adsorp- tion results at dynamic conditions [2,14]. This type of models shows dif- ferent degrees of mathematical complexity depending on the transport phenomena considered for the adsorption analysis [2]. Besides the Journal of Molecular Liquids 208 (2015) 114–121 ⁎ Corresponding author. E-mail address: [email protected] (A. Bonilla-Petriciolet). http://dx.doi.org/10.1016/j.molliq.2015.04.045 0167-7322/© 2015 Elsevier B.V. All rights reserved. Contents lists available at ScienceDirect Journal of Molecular Liquids journal homepage: www.elsevier.com/locate/molliq
Transcript of Breakthrough curve modeling of liquid-phase adsorption of fluoride ions on aluminum-doped bone char...

Journal of Molecular Liquids 208 (2015) 114–121
Contents lists available at ScienceDirect
Journal of Molecular Liquids
j ourna l homepage: www.e lsev ie r .com/ locate /mol l iq
Breakthrough curve modeling of liquid-phase adsorption of fluoride ionson aluminum-doped bone char using micro-columns: Effectiveness ofdata fitting approaches
C.K. Rojas-Mayorga a, A. Bonilla-Petriciolet a,⁎, F.J. Sánchez-Ruiz a, J. Moreno-Pérez a, H.E. Reynel-Ávila a,I.A. Aguayo-Villarreal a, D.I. Mendoza-Castillo a,b
a Instituto Tecnológico de Aguascalientes, Aguascalientes 20256, Mexicob Consejo Nacional de Ciencia y Tecnología, Cátedras CONACYT, México D.F. 03940, Mexico
⁎ Corresponding author.E-mail address: [email protected] (A. Bonilla-P
http://dx.doi.org/10.1016/j.molliq.2015.04.0450167-7322/© 2015 Elsevier B.V. All rights reserved.
a b s t r a c t
a r t i c l e i n f oAvailable online xxxx
Keywords:Packed-bed columnsFluorideAluminum-modified bone charBreakthrough curve modelingLiquid-phase adsorption
A comparative numerical analysis of three approaches for the breakthrough curvemodeling has been performedusing the experimental data of packed-bed fluoride adsorption on a novel aluminum-doped bone char usingmicro-columns. The performance of traditional Thomas and Yan breakthrough equations, a mass transfermodel for a mobile fluid flowing through a porous media, and an artificial neural network with the optimalbrain surgeon approach have been studied and discussed in the data fitting of asymmetric fluoride breakthroughcurves. Results of this study highlighted the relative merits of tested breakthrough curve models for the non-linear adsorption data analysis involved in water defluoridation using a new adsorbent. In particular, the appli-cation of artificial neural networks is reliable for fitting highly non-linear adsorption patterns of priority waterpollutants.
© 2015 Elsevier B.V. All rights reserved.
1. Introduction
Adsorption processes can be performed using batch and continuoustype configurations [1,2]. Both operation modes offer different advan-tages but the dynamic adsorption systems are preferred for large-scaleapplications in water treatment due to their flexibility and easy opera-tion [1,3]. The liquid-phase adsorption at continuous flow conditionsis recognized as a non-linear andmultivariable process that can be ana-lyzed by the breakthrough curve. Specifically, the breakthrough curvedescribes the adsorption column dynamics and provides relevant infor-mation and key parameters for the design, operation and optimizationof the separation system [4–6]. For example, the sharpness of the break-through curves is an indicator of the effectiveness of the adsorption pro-cess [4]. The characteristics of breakthrough curves depend on the bedconfiguration, feed flow, adsorbate concentration, pH, temperature, ad-sorbent mass, and other relevant variables [1,5–8]. Therefore, it is ex-pected that the adsorption pattern may vary significantly for eachadsorbent–adsorbate system in packed-bed columns.
Results reported in the literature indicate that the breakthroughcurves obtained in the adsorption of water pollutants usually show anasymmetric sigmoidal profile even for mono-component solutions(i.e., solutions with only one adsorbate/pollutant). The modeling ofthese breakthrough curves for liquid-phase adsorption is fundamental
etriciolet).
for water treatment design in real-life applications [8]. The principal ob-jective of the breakthrough data modeling stage is the correlation andprediction of adsorption behavior based on the parameters obtainedfrom experimental studies. However, the fitting of adsorption patternsin packed-bed columns ismore difficult than themodeling in batch pro-cesses because the concentration profiles in the adsorbent and liquidphases for dynamic systems are determined by the mass transfer phe-nomena, adsorption kinetics and thermodynamics [4]. The break-through curve modeling is considered as a challenging mathematicalproblem, which implies non-linear data regressions for the determina-tion of model parameters using an error function. Depending on themodel complexity, the application of other computational strategies isoften necessary in breakthrough curve fitting, e.g., the use of numericalmethods for solving partial differential equations.
To date, several models have been proposed for the correlation ofbreakthrough curve data obtained in dynamic adsorption processes.These models include the Thomas [9], Bohart-Adams [10], Yon-Nelson[11], Clark [12], Yan [13] and other empirical or semi-empirical break-through equations [2,4]. These models are usually analytical equationsthat require a low computational time for data processing and are pop-ular for the correlation of adsorption data in water treatment due totheir simple form and acceptable-fitting performance. Alternatively, avariety ofmass transfermodels can be applied for data fitting of adsorp-tion results at dynamic conditions [2,14]. This type of models shows dif-ferent degrees of mathematical complexity depending on the transportphenomena considered for the adsorption analysis [2]. Besides the

115C.K. Rojas-Mayorga et al. / Journal of Molecular Liquids 208 (2015) 114–121
analytical and mass transfer models, the breakthrough curves can bealso modeled using computationally intelligent data processing algo-rithms such as artificial neural networks [6–8,15,16]. These strategiesare considered as effective empirical approaches for non-linear dataanalysis [17].
Herein, it is convenient to highlight that the desirable characteristicsfor the breakthrough curvemodels include a suitable mathematical com-plexity, a capability for providing an acceptable accuracy in the correlationand estimation of adsorption patterns at different operating conditions,and the model should be useful for assessing the effect of operating vari-ables on the adsorption column dynamics [2]. Depending on the type ofbreakthrough model, some of these desirable characteristics can be ful-filled. However, the numerical performance of available models cannotbe determined a priori based on the fact that they may show limitationsfor data analysis depending on the adsorption system under study andits experimental conditions. In fact, some studies have reported the per-formance of different approaches for breakthrough curve modeling butusing concentration patterns with symmetric behavior [18]. In order toimprove the performance of breakthroughmodels and to develop reliableapproaches for adsorption data processing, it is important to identify andto compare the relative advantages of available models in the analysis ofdynamic processes for the removal of priority water pollutants involvinghighly asymmetric adsorption profiles.
In this study, a comparative numerical analysis of three approachesfor breakthrough curve modeling has been performed using the exper-imental data of packed-bed fluoride adsorption on a novel aluminum-doped bone char. Specifically, the performance of traditional Thomasand Yan breakthrough equations, the mass transfer model for a mobilefluid flowing through a porous media, and an artificial neural networkapproach have been studied and discussed in the data fitting of asym-metric fluoride breakthrough curves obtained with micro-columns. Tothe best of the authors' knowledge, a systematic study of the capabilitiesand limitations of breakthrough models for the correlation and predic-tion of adsorption patterns in packed beds for water defluoridationhas not been reported. In summary, the results of this study highlightthe relative merits of tested breakthrough curve modeling strategiesfor the adsorption data analysis involved in water defluoridation usinga new bone char.
2. Methodology
2.1. Synthesis of aluminum-doped bone char used in fluoride adsorptionwith packed-bed columns
Packed-bed adsorption experiments forfluoride removal fromwaterwere performed using an aluminum-doped bone char. This novel adsor-bent was obtained via metal surface modification of bone char using anaqueous solution of aluminum sulfate. First, the bone charwas obtainedfrom the pyrolysis of bovine bones using the optimum synthesis condi-tions reported by Rojas-Mayorga et al. [19]. These conditions involved apyrolysis process with N2 at 700 °C during 2 h of residence time. In a
1. Train a reasonably large network to minimum err
2. Compute H -1
3. Find the q that gives the smallest saliency, Eq. (1
the error function used in training process, then t
with step 4 of this algorithm; otherwise step 5 app
4. Use the q from step 3 to update all weights using
5. No more weights can be deleted without large in
At this point it may be desirable to retrain the netw
Fig. 1. Algorithm reported by Hassibi et al. [22 for the optimal b
second stage, the surface modification of bone char was performedwith an aluminum sulfate solution 0.1 M. The adsorbent was mixedwith this metallic solution at 50 °C during 6 h. The samples ofaluminum-doped bone char were washed using deionized water,dried and stored for dynamic adsorption experiments. The physico-chemical properties of the modified adsorbent were determined usingthe results from FTIR, XPS and XRD analyses. Diffraction pattern ofbone char was obtained using an X-ray diffractometer Bruker D8-Advance with a mirror Göebel that has a tube with cooper anode RXand radiation CuKα (λ=1.5406 Å). Functional groups of the adsorbentwere identified via FTIR spectroscopy using a Bruker IFS 66/S spectro-photometer and all samples were analyzed using spectroscopic gradeKBr. XPS studies were performed with a Prevac photoelectron spec-trometer equipped with a hemispherical analyzer (VG SCIENTAR3000). Finally, the textural properties of metal-modified bone charwere determined via N2 adsorption–desorption isotherm at 77 K usinga N2 Gsorb-6 equipment.
2.2. Determination of breakthrough curves for fluoride adsorption onaluminum-doped bone char using packed-bed micro-columns
Fluoride adsorption experiments were performed in packed-bedmicro-columns with 5.4 cm of length and 1.8 cm of internal diameter.These columns were packed with 10.35 g of metal-doped bonecharwith a particle size of 20–35mesh fractions. Dynamic adsorption ex-perimentswere performed at pH 7 and 30 °C using different fluoride feedconcentrations from10 to100mg/L and feedflowrates of 0.18 and0.36 L/h. All adsorption micro-columns were operated at up flow operatingmode using a peristaltic pump. The mean bed porosity (ε) in all adsorp-tion columns was 30%. For the determination of experimental fluoridebreakthrough curves, several sampleswere collected from the adsorptioncolumn outlet at regular time intervals (i.e., 10min) and the fluoride con-centrations were quantified. Adsorbate concentrations were determinedusing a fluoride ion selective electrode and TISAB chemical reagent [21]where linear calibration curves were used. All experiments were per-formed twice, including the fluoridemeasurements, and themean resultswere used for adsorption calculations.
Analysis of fluoride breakthrough curves implied the determinationof the breakthrough time (tb in h), the bed adsorption capacity (qbedin mg/g), the retardation factor (rf) and the degree of bed utilization(Rq in %). These parameters were calculated using
tb¼toper where 0:2· F−½ �feed ð1Þ
qbed ¼ ∫t¼topert¼0
F−½ �feed− F−½ �outletmbed
� �Qdt ð2Þ
rf ¼V50%
ALεð3Þ
Rq ¼qbedqbatch
ð4Þ
or
6). If this candidate error increase is lower than
he qth weight should be deleted, and continue
lies.
Eq. (15). Go to step 2.
crease in the error function of training process.
ork.
rain surgeon procedure in artificial neural network models.

a)
b)
10 20 30 40 50 60 70 80
Inte
nsity
(a.
u.)
* Hydroxyapatite
**
*
*
*
*
**
*
*
*
*
2θ (°)
BC-AlS
4000 3500 3000 2500 2000 1500 1000 500
559
599
873
1018
14501619++
++
+
+
3309+
Tra
nsm
ittan
ce (
%)
Wavenumber (cm-1)
BC-AlS
Fig. 3. Results of a) XRD and b) FTIR analyses of aluminum-modified bone char used forfluoride adsorption in packed-bed micro-columns.
116 C.K. Rojas-Mayorga et al. / Journal of Molecular Liquids 208 (2015) 114–121
where [F−]feed and [F−]outlet are the fluoride concentrations of the feedand outlet of adsorption columns given in mg/L, Q is the feed flow inL/h, mbed is the mass of bone char packed in the adsorption columnsgiven in g, t is the operating time of adsorption columns in h, ε is the col-umn void fraction of the packed-bed column (~0.3), L is the bed heightof the adsorption column given in cm, A is the cross sectional area of theadsorption column reported in cm2, V50% is the treated volume whenthe effluent concentration has reached50% of the influent concentrationand it is given in cm3, and qbatch is the fluoride adsorption capacityof bone char obtained at batch mode using the same operating condi-tions (i.e., pH and temperature) of dynamic experiments and it isgiven in mg/g, respectively. All parameters were determined for testedconditions of fixed-bed adsorption studies. Note that the integration ofEq. (2) for the calculation of the bed adsorption capacity was performedusing the trapezoidal rule.
2.3. Modeling of the fluoride fixed-bed adsorption on aluminum-dopedbone char
In this study, three approaches have been used for data fitting offluoride breakthrough curves on the metal-modified bone char. Theseapproaches include the application of: a) analytical breakthrough equa-tions, b) a mass transfer model and c) an artificial neural networkmodel. In the following subsections, a brief description of eachmodelingapproach is provided.
2.3.1. Analytical breakthrough equations: Thomas and Yan modelsTwo analytical breakthrough curve equationswere employed for the
data modeling of dynamic fluoride adsorption on the modified bonechar. These models include the Thomas [9] and Yan [13] equations,which are defined as
F−½ �outletF−½ �feed
¼ 1
1þ expkThQ
qbed;Tmbed− F−½ �feedVeff
� �� � ð5Þ
F−½ �outletF−½ �feed
¼ 1− 1
1þ Q2tkyqbed;Ymbed
� � kY F−½ �feed=Qð Þ ð6Þ
where Veff is the treated volume of the fluoride solution in L, qbed,T is theadsorption capacity estimated by the Thomas model given in mg/g, kThis the Thomas rate constant reported in L/h mg, kY is the Yan rate con-stant given in L/h mg, and qbed,Y is the adsorption capacity estimatedby the Yan model given in mg/g, respectively. Parameters of these ana-lytical models (kTh, qbed,T) and (kY, qbed,Y) were obtained from a non-linear regression of the fluoride breakthrough curves using a global op-timization method.
2.3.2. Mass transfer model for a porous mediumA general liquid phase mass transfer model for a porous medium
was used in data fitting of the fluoride breakthrough curves. Thismodel is based on a macroscopic mass conservation equation applied
Fig. 2.Architecture of artificial neural network (ANN)model for the correlation of fluoridebreakthrough curves on aluminum-doped bone char.
for a control volume and it is given by [2]
ε þ ρbKp
� �∂c∂t þ u
∂c∂x ¼ DDap
∂2c∂x2
ð7Þ
where Kp is an adsorption constant given in m3/Kg, DDap is anapparent dispersion coefficient in m2/h, x is the distance along the bedlength in m, ρb is the bulk density in Kg/m3, t is the operation time inh, c = [F−] is the adsorbate concentration in the fluid phase given inmol/m3, and u is the fluid velocity in m/h, respectively. The model pa-rameters Kp and DDap were also determined via the non-linear datafitting of experimental fluoride breakthrough curves. The initial and
Table 1Functional groups and XPS surface composition of aluminum-doped bone char used forfluoride adsorption in packed-bed micro-columns.
FTIR interpretation XPS surface chemicalcomposition
Wavenumber, cm−1 Functional groups Element Wt, %
3309 \\OH C 14.911619 C_O O 38.121450 C_C P 19.681018 PO4
3− Ca 19.49873 CO3
2− Al 7.80599 PO4
3−
559 Ca

Table 2Parameters of breakthrough curves for the fluoride adsorption on aluminum-doped bonechar in packed-bed micro-columns.
Feed conditions Design parameters of breakthrough curves
[F−]feed, mg/L Q, L/h tb at 0.2·[F−]feed, h rf qbed, mg/g Rq, %
10 0.18 9.50 702.3 3.3 10.70.36 4.83 704.1 4.2 13.5
25 0.18 8.67 647.3 7.7 24.90.36 4.33 593.6 8.4 27.2
50 0.18 8.00 464.2 13.5 43.60.36 4.17 493.1 11.7 37.6
100 0.18 5.67 319.4 14.2 45.90.36 3.33 420.4 18.5 59.7
117C.K. Rojas-Mayorga et al. / Journal of Molecular Liquids 208 (2015) 114–121
boundary conditions used for solving this mass transfer model are
t ¼ 0; 0 b x b L; c ¼ 0t N0; x ¼ 0; c ¼ cft N0; x ¼ L; c ¼ 0
ð8Þ
where cf = [F−]outlet is the final fluoride concentration in the columnoutlet obtained from the experimental breakthrough curves. ComsolMultiphysics® was used for solving this model and the best values ofKp and DDap were determined one-at-a-time via a parametric studyusing this software.
2.3.3. Artificial neural network model for fluoride breakthrough curvesAn artificial neural network (ANN) model with the optimal
brain surgeon procedure [22] was employed for the correlation offluoride breakthrough curves. In general, a basic neural networkmodel has nI input units, onehidden layerwith nH units, and a single lin-ear output unit. The response yp of the network to an input vector s canbe written as
yp ¼XnH
j¼1
WjhXnIi¼1
wjisi þ bj
!þ B ð9Þ
[F- ] o
utle
t/[F
- ] feed
Tim
0 4 8 12 16 20 240.0
0.2
0.4
0.6
0.8
1.0
100 mg/L 50 mg/L 25 mg/L 10 mg/L
Thomas modelYan model
0.18 L/h
0 4 80.0
0.2
0.4
0.6
0.8
1.00.18 L/h
0 4 8 12 16 20 240.0
0.2
0.4
0.6
0.8
1.00.36 L/h
0 4 80.0
0.2
0.4
0.6
0.8
1.00.36 L/h
Fig. 4. Breakthrough curves of fluoride adsorption on aluminum-doped bone ch
wherewji is the weight for the link from input i to the hidden cell j,Wj istheweight for the link fromhidden cell j to the output, h is a tangent hy-perbolic or linear transfer function, bj and B are the biases of the model,respectively. Theweights and biases are the ANN adjustable parametersand they are determined from the data under analysis via the trainingprocess. The objective of this training procedure is to find a set of possi-ble weights and biases so that the ANN model will provide predictions(yp) as similar as possible to the known outputs (y). The objective func-tion used for this training process is given by
F ¼ 12N
XNi¼1
y−yp� �2
ið10Þ
where N is the number of data used in the ANN training. To avoid theover-fitting and to guarantee the generalization ability of ANN model,a validation set is used to compute the objective function. This set con-sists of data that are not used in the training set.
On the other hand, the optimal brain surgeon procedure is usedto estimate the increment in the training error when some weightsare deleted using the information in the second-order derivatives ofthe error surface. This approach can be employed to minimize theANN complexity via the reduction of the number of connectionweights.It is also useful to prevent the overfitting problemswithout a significantimpact on theANNmodel generalization. In this approach, a localmodelof the error surface is constructed to evaluate the effect of weightdeletion [22]
δF ¼ ∂F∂w
� �T
·δwþ 12δwT·H·δwþ O δwk k3
� �ð11Þ
where H≡∂2F/∂w2 is the Hessian matrix and the superscript T denotesthe vector transpose. For a network trained to a local minimum in theerror function, the first (linear) term vanishes and the third and allhigher order terms are also discarded. Then, a set of the weights (wp)can be discarded (i.e., their values can be set to zero) for minimizingthe increment in the error given by Eq. (11). Note that
eTq·δwþwq ¼ 0 ð12Þ
e, h
12 16 20 24
Mass transfer model
0 4 8 12 16 20 240.0
0.2
0.4
0.6
0.8
1.0
Artificial neural networks (ANNs)
0.18 L/h
12 16 20 24 0 4 8 12 16 20 240.0
0.2
0.4
0.6
0.8
1.00.36 L/h
ar in packed-bed micro-columns and results of data modeling approaches.
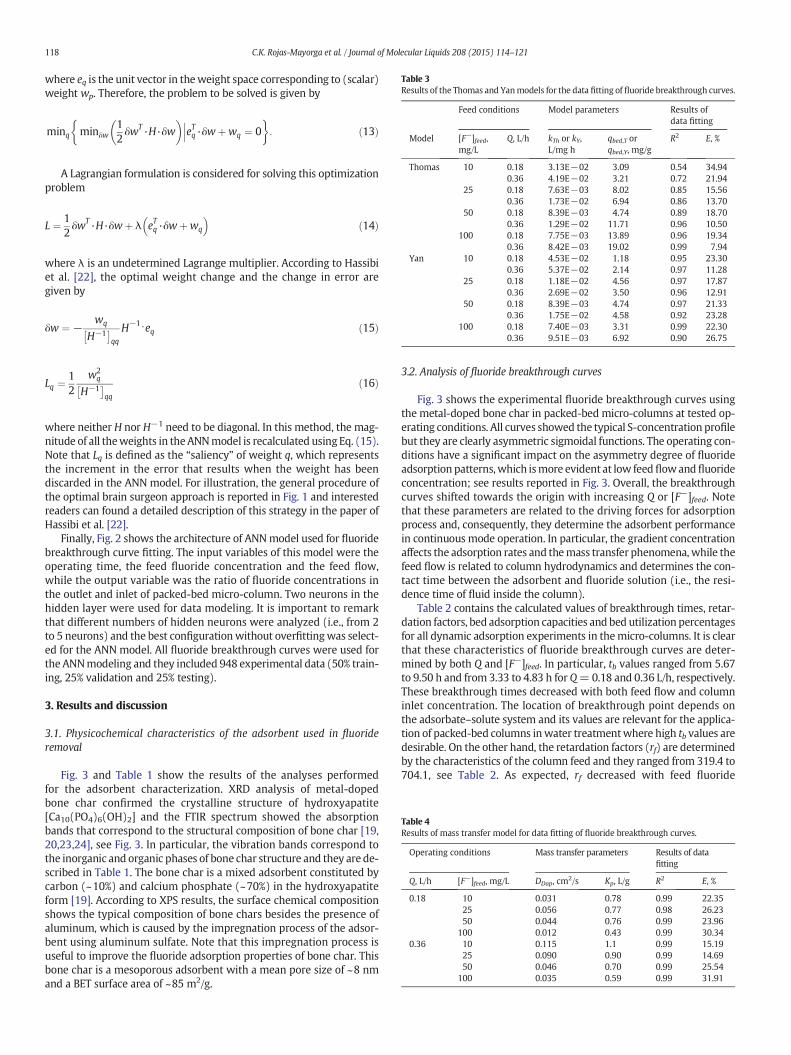
Table 4Results of mass transfer model for data fitting of fluoride breakthrough curves.
Operating conditions Mass transfer parameters Results of datafitting
Q, L/h [F−]feed, mg/L DDap, cm2/s Kp, L/g R2 E, %
0.18 10 0.031 0.78 0.99 22.3525 0.056 0.77 0.98 26.2350 0.044 0.76 0.99 23.96
100 0.012 0.43 0.99 30.340.36 10 0.115 1.1 0.99 15.19
25 0.090 0.90 0.99 14.6950 0.046 0.70 0.99 25.54
100 0.035 0.59 0.99 31.91
Table 3Results of the Thomas and Yanmodels for the data fitting of fluoride breakthrough curves.
Feed conditions Model parameters Results ofdata fitting
Model [F−]feed,mg/L
Q, L/h kTh or kY,L/mg h
qbed,T orqbed,Y, mg/g
R2 E, %
Thomas 10 0.18 3.13E−02 3.09 0.54 34.940.36 4.19E−02 3.21 0.72 21.94
25 0.18 7.63E−03 8.02 0.85 15.560.36 1.73E−02 6.94 0.86 13.70
50 0.18 8.39E−03 4.74 0.89 18.700.36 1.29E−02 11.71 0.96 10.50
100 0.18 7.75E−03 13.89 0.96 19.340.36 8.42E−03 19.02 0.99 7.94
Yan 10 0.18 4.53E−02 1.18 0.95 23.300.36 5.37E−02 2.14 0.97 11.28
25 0.18 1.18E−02 4.56 0.97 17.870.36 2.69E−02 3.50 0.96 12.91
50 0.18 8.39E−03 4.74 0.97 21.330.36 1.75E−02 4.58 0.92 23.28
100 0.18 7.40E−03 3.31 0.99 22.300.36 9.51E−03 6.92 0.90 26.75
118 C.K. Rojas-Mayorga et al. / Journal of Molecular Liquids 208 (2015) 114–121
where eq is the unit vector in theweight space corresponding to (scalar)weight wp. Therefore, the problem to be solved is given by
minq minδw12δwT·H·δw
� �eTq·δwþwq
��� ¼ 0� �
: ð13Þ
A Lagrangian formulation is considered for solving this optimizationproblem
L ¼ 12δwT·H·δwþ λ eTq·δwþwq
� �ð14Þ
where λ is an undetermined Lagrange multiplier. According to Hassibiet al. [22], the optimal weight change and the change in error aregiven by
δw ¼ −wq
H−1
H−1⋅eq ð15Þ
Lq ¼12
w2q
H−1 qq
ð16Þ
where neither H nor H−1 need to be diagonal. In this method, the mag-nitude of all theweights in theANNmodel is recalculated using Eq. (15).Note that Lq is defined as the “saliency” of weight q, which representsthe increment in the error that results when the weight has beendiscarded in the ANN model. For illustration, the general procedure ofthe optimal brain surgeon approach is reported in Fig. 1 and interestedreaders can found a detailed description of this strategy in the paper ofHassibi et al. [22].
Finally, Fig. 2 shows the architecture of ANNmodel used for fluoridebreakthrough curve fitting. The input variables of this model were theoperating time, the feed fluoride concentration and the feed flow,while the output variable was the ratio of fluoride concentrations inthe outlet and inlet of packed-bed micro-column. Two neurons in thehidden layer were used for data modeling. It is important to remarkthat different numbers of hidden neurons were analyzed (i.e., from 2to 5 neurons) and the best configurationwithout overfittingwas select-ed for the ANN model. All fluoride breakthrough curves were used forthe ANNmodeling and they included 948 experimental data (50% train-ing, 25% validation and 25% testing).
3. Results and discussion
3.1. Physicochemical characteristics of the adsorbent used in fluorideremoval
Fig. 3 and Table 1 show the results of the analyses performedfor the adsorbent characterization. XRD analysis of metal-dopedbone char confirmed the crystalline structure of hydroxyapatite[Ca10(PO4)6(OH)2] and the FTIR spectrum showed the absorptionbands that correspond to the structural composition of bone char [19,20,23,24], see Fig. 3. In particular, the vibration bands correspond tothe inorganic and organic phases of bone char structure and they are de-scribed in Table 1. The bone char is a mixed adsorbent constituted bycarbon (~10%) and calcium phosphate (~70%) in the hydroxyapatiteform [19]. According to XPS results, the surface chemical compositionshows the typical composition of bone chars besides the presence ofaluminum, which is caused by the impregnation process of the adsor-bent using aluminum sulfate. Note that this impregnation process isuseful to improve the fluoride adsorption properties of bone char. Thisbone char is a mesoporous adsorbent with a mean pore size of ~8 nmand a BET surface area of ~85 m2/g.
3.2. Analysis of fluoride breakthrough curves
Fig. 3 shows the experimental fluoride breakthrough curves usingthe metal-doped bone char in packed-bed micro-columns at tested op-erating conditions. All curves showed the typical S-concentration profilebut they are clearly asymmetric sigmoidal functions. The operating con-ditions have a significant impact on the asymmetry degree of fluorideadsorption patterns,which ismore evident at low feedflowandfluorideconcentration; see results reported in Fig. 3. Overall, the breakthroughcurves shifted towards the origin with increasing Q or [F−]feed. Notethat these parameters are related to the driving forces for adsorptionprocess and, consequently, they determine the adsorbent performancein continuous mode operation. In particular, the gradient concentrationaffects the adsorption rates and themass transfer phenomena,while thefeed flow is related to column hydrodynamics and determines the con-tact time between the adsorbent and fluoride solution (i.e., the resi-dence time of fluid inside the column).
Table 2 contains the calculated values of breakthrough times, retar-dation factors, bed adsorption capacities and bed utilization percentagesfor all dynamic adsorption experiments in themicro-columns. It is clearthat these characteristics of fluoride breakthrough curves are deter-mined by both Q and [F−]feed. In particular, tb values ranged from 5.67to 9.50 h and from 3.33 to 4.83 h for Q=0.18 and 0.36 L/h, respectively.These breakthrough times decreased with both feed flow and columninlet concentration. The location of breakthrough point depends onthe adsorbate–solute system and its values are relevant for the applica-tion of packed-bed columns inwater treatmentwhere high tb values aredesirable. On the other hand, the retardation factors (rf) are determinedby the characteristics of the column feed and they ranged from 319.4 to704.1, see Table 2. As expected, rf decreased with feed fluoride

Table 5Results of ANN model for data fitting of fluoride breakthrough curves.
Operating conditions Results of ANN model
Feed flow, L/h [F−]feed, mg/L R2 E, %
0.18 10 0.99 12.425 0.99 3.350 0.99 4.8
100 0.99 9.40.36 10 0.99 5.3
25 0.99 3.250 0.99 4.0
100 0.99 4.5
119C.K. Rojas-Mayorga et al. / Journal of Molecular Liquids 208 (2015) 114–121
concentration independently of the feed flow used. Note that highvalues of retardation factor indicated a better removal performance ofthe packed-bed column. The estimated values of bed capacities for fluo-ride adsorption ranged from 3.3 to 18.5 mg/g at tested experimentalconditions. These bed capacities correspond to a degree of bed utiliza-tion of 10.7–59.7%. Results of these calculations are consistent withthe dynamic performance reported for water defluoridation using com-mercial bone chars in micro-columns where the bed utilization mayrange from 35 to 50% [6]. Bed capacities for fluoride adsorption and,consequently the degree of bed utilization, increased with both feedfluoride concentration and flow. It is convenient to remark that thefluo-ride uptakes of the novel aluminum-doped bone char are higher (up to500%) than those values reported for packed-bed micro-columns usingcommercial bone chars, i.e., 1.0–3.0 mg/g [6].
3.3. Numerical performance of tested breakthrough curve models
Proposed models were fitted to the experimental fluoride adsorp-tion data and the model-calculated breakthrough curves are reportedin Fig. 4. As expected, each model has different capabilities forrepresenting the transient behavior of fluoride adsorption pattern inthe packed-bed columns of aluminum-modified bone char. However,
calfeed
oulet
F
F
][][
−
− a)
c)
0
0.1
0.2
0.3
0.4
0.5
0.6
0.7
0.8
0.9
1
0.0 0.1 0.2 0.3 0.4 0.5 0.6 0.7 0.8 0.9
Thomas model
± 5%± 10%
0
0.1
0.2
0.3
0.4
0.5
0.6
0.7
0.8
0.9
1
0.0 0.1 0.2 0.3 0.4 0.5 0.6 0.7 0.8 0.9
Mass transfer model
Fig. 5. Experimental (exp) and predicted (cal) breakthrough curves for fluoride adsorption onb) Yan equation, c) mass transfer model and c) artificial neural networks.
the curve-fitting capability of tested models may vary significantly de-pending on the operating condition of micro-columns. Determinationcoefficients (R2) and average errors (E, %) of all models are reported inTables 3–5 and these results have been used for a comparative analysis.Specifically, the errors in fluoride adsorption fitting were calculatedusing
E ¼ 100ndat
Xndati¼1
F−½ �outlet= F−½ �feed i; exp− F−½ �outlet= F−½ �feed��� ���
i;cal
F−½ �outlet= F−½ �feed i; exp
����������
������� ð17Þ
where the subscripts exp and cal correspond to experimental and calcu-lated values of breakthrough curve data and ndat is the number of exper-imental points, respectively.
In general, the analytical breakthrough curve models showed sys-tematic discrepancies for data correlation of fluoride adsorption pat-terns, see Fig. 4. In particular, Thomas and Yan models showed theworst performance for data fitting of fluoride breakthrough curveswhere their determination coefficients ranged from 0.54 to 0.99 withmean errors from 7.9 to 34.9%, see Table 3. Although the Yan model isbetter than the Thomasmodel, the Yan-based adsorption bed capacities(qbed,Y) differ significantly from the bed capacities calculated viathe integration of experimental data. In contrast, Thomas model pro-vides reasonable estimations of the bed adsorption capacities for severalbreakthrough curves. It is convenient to remark that the concentration-time profiles obtained in the fixed-bed experiments suggest that theaxial dispersion may play an important role on fluoride adsorption attested conditions. Therefore, it could be expected that the Thomasmodel may fail for breakthrough curve data correlation because thismodel assumes an adsorption–desorption process with negligibleaxial dispersion [2,9]. On the other hand, the Yan model is consideredas an empirical equation that could overcome some drawbacks ofThomas model [25]. Unfortunately, both models may fail for the accu-rate modeling of asymmetric breakthrough curves as those reportedin this study.
b)
d)
exp][][
feed
oulet
F
F
1.00
0.1
0.2
0.3
0.4
0.5
0.6
0.7
0.8
0.9
1
0.0 0.1 0.2 0.3 0.4 0.5 0.6 0.7 0.8 0.9 1.0
Yan model
1.0
0
0.1
0.2
0.3
0.4
0.5
0.6
0.7
0.8
0.9
1
0.0 0.1 0.2 0.3 0.4 0.5 0.6 0.7 0.8 0.9 1.0
ANNs model
−
−
aluminum-doped bone char in packed-bed micro-columns. Model: a) Thomas equation,

Table 6Error analysis of tested fitting approaches for different regions of the fluoride break-through curve.
Error (%) ± σ for
Model 0:0 bF−½ �outletF−½ �feed b 0:2 0:2 b
F−½ �outletF−½ �feed b 0:8 0:8 b
F−½ �outletF−½ �feed b 1:0
Thomas equation 21.4 ± 17.4 19.9 ± 13.6 14.2 ± 6.2Yan equation 40.3 ± 31.1 10.9 ± 6.7 6.3 ± 5.6Mass transfer equation 66.3 ± 36.7 4.18 ± 7.2 1.82 ± 1.8ANN 14.5 ± 18.8 2.2 ± 1.8 2.2 ± 1.3
120 C.K. Rojas-Mayorga et al. / Journal of Molecular Liquids 208 (2015) 114–121
The fluoride breakthrough curves are better predicted by ANN andmass transfer models, see Fig. 5 and Table 6. Eq. (7) is a simple masstransfer equation that may offer a good performance for asymmetricbreakthrough curve modeling. In fact, this model can outperform thetraditional Thomas and Yanmodels especially for experimental data ob-tained at low feed flow andfluoride concentration. In general, the deter-mination coefficients ofmass transfermodel are higher than 0.98with amean error from 15.2 to 31.9%, see Table 4. The calculated values of theapparent dispersion coefficient DDap ranged from 0.012 to 0.115 cm2/s,while the adsorption constant Kp ranged from 0.43 to 1.1 L/g. On theother hand, the artificial neural network model provides outstandingcorrelations for the fluoride breakthrough curves and its performanceis better than those obtained for Thomas and Yang equations and themass transfer model, see Fig. 4. For all curves, the determination coeffi-cients of ANNmodel are≥0.99 and the fitting errors ranged from 3.2 to12.4%, see Table 5.
A detailed error analysis has been performed for different regions ofthe breakthrough curves where [F−]outlet / [F−]feed has been divided inthree zones: (0–0.2), (0.2–0.8) and (0.8–1.0). Results of this analysisare reported in Table 6 and Fig. 5. Herein, it is convenient to note thatFig. 5 contains baselines for data analysis considering relative errors inthe fluoride concentration patterns of ±5 and ±10%, respectively. Allmodels showed the worst fitting performance and significant discrep-ancies between experimental and predicted adsorption patterns forthe relative concentration region b0.2 (i.e., the breakthrough zone). Infact, all models tended to underestimate the dynamic adsorption
Residual ei
a)
c)
-0.4
-0.3
-0.2
-0.1
0.0
0.1
0.2
0.3
0.4
0.0 0.2 0.4 0.6 0.8
Thomas model
-0.4
-0.3
-0.2
-0.1
0
0.1
0.2
0.3
0.4
0 0.2 0.4 0.6 0.8
Mass transfer model
Fig. 6. Residual plots of tested modeling approaches used
pattern in this zone. Thomas and Yan models can show mean percent-age errors up to 40%. It is interesting to remark that the mass transfermodel showed the worst performance for breakthrough modeling inthis zone with a mean error of 66%. Mass transfer-type models usuallyoffer an acceptable accuracy for the breakthrough curve correlationand prediction. However, this result indicated that this mass transfermodel is not valid at [F−]outlet / [F−]feed ratios lower than the break-through point in highly asymmetric curves. The ANN outperformedother breakthrough curve models in this region but its errors werestill high, see Table 6 and Fig. 5.
The capabilities of tested models improved for the region0.2 b [F−]outlet / [F−]feed b 0.8 where both the mass transfer modeland ANN showed better data fits (i.e., errors b 5%). Thomas and Yanequations tended to underestimate the adsorption profile at this zoneof breakthrough curve and their modeling errors were higher than10%. At the saturation zone, [F−]outlet / [F−]feed N 0.8, the calculated ad-sorption profiles of the mass transfer model and ANN were in goodagreement with the experimental data. In fact, these models showederror values lower than 2% inside this region and they outperformedboth analytical Thomas and Yan equations. Note that mass transfermodel may outperform the ANN in this region of the breakthroughcurve, while Thomas equation showed the worst predictions for fluo-ride adsorption pattern.
Finally, this error analysis has been complemented using the plots ofresiduals (ei) of the breakthrough models, which are reported in Fig. 6.In particular, the residual ei is given by
ei ¼ F−½ �outlet= F−½ �feed i; exp− F−½ �outlet= F−½ �feed��� ���
i;cal: ð18Þ
These residual plots have been used to assess the quality of adsorp-tion data fitting. In a proper data fitting, the residuals would have to berandomly distributed around zero and they should not show any trend.It is clear that the residual plot of ANN showed a randomly distributionin comparison to the other breakthroughmodels. Note that the residualplots of Thomas andYanmodels showed non-randompatterns and theyhave an increasing trend that suggests that the error variance increases
b)
d)
feed
oulet
F
F
][][
-
-
1.0
-0.4
-0.3
-0.2
-0.1
0
0.1
0.2
0.3
0.4
0.0 0.2 0.4 0.6 0.8 1.0
Yan model
1
-0.4
-0.3
-0.2
-0.1
0
0.1
0.2
0.3
0.4
0 0.2 0.4 0.6 0.8 1
ANNs model
in data fitting of the fluoride breakthrough curves.

121C.K. Rojas-Mayorga et al. / Journal of Molecular Liquids 208 (2015) 114–121
with respect to [F−]outlet / [F−]feed, see Fig. 6. These results confirmed thatthe best adsorption data fitting has been obtained using the ANNmodel.
In summary, ANNmodel offered a good agreement between predict-ed and experimental fluoride adsorption profiles. It is convenient to re-mark that Du et al. [18], reported the comparison of a general ratemodeland a traditional ANN model for data fitting of adsorption of solanesolusing resins in packed-bed chromatographic columns. These authorsconcluded that the ANN model may offer a better performance thanthe tested general rate model. However, the breakthrough curves usedin data modeling showed a low degree of asymmetry. Results reportedin this study confirmed that an ANNmodel, with the optimal brain sur-geon procedure, may offer a better data fitting performance than thoseobtained for a mass transfer model but using highly asymmetric break-through curves.
Finally, this study highlighted the challenging task of finding abreakthrough model of general applicability. It is clear that break-through curve experiments are time consuming and, for some adsor-bent–pollutant systems, they could be expensive. Therefore, themodeling and prediction of column performance at micro-scale levelis an interesting alternative if reliable models are applied. Based onthese facts, the artificial neural networks offer additional advantagesfor the packed-bed column design because these black-box modelsmay predict the adsorption performance at other operating conditionsused in its training process. In the absence of a universal breakthroughcurve model, ANN-based models emerge as promising approach forthe data fitting of dynamic adsorption processes involved in watertreatment.
4. Conclusions
This study has analyzed and compared the capabilities and limita-tions of three approaches for themodeling of asymmetric breakthroughcurves of the fluoride adsorption on a metal-modified bone char usingmicro-columns. Overall, results indicated that each model has differentcapabilities for representing the transient behavior of fluoride adsorp-tion pattern in the packed-bed columns of aluminum-modified bonechar and its performance depends on the operating conditions. Thomasand Yan equations showed systematic discrepancies for data correlationof fluoride adsorption patterns and they offered the worst modelingperformance. On the other hand, the ANN and the mass transfermodel are better options for the data fitting of fluoride breakthroughcurves where ANN provides the best correlation properties. A detailederror analysis indicated that all models may fail to predict the fluorideadsorption patterns at the breakthrough zone but ANN still offers thebest performance for the data fitting. This study showed that ANN canbe effectively used for modeling and predicting the asymmetric break-through curves in the adsorption of priority water pollutants. This intel-ligent data processing algorithm offers additional advantages for thepacked-bed column design using experiments at micro-scale and ANNmodel emerges as promising approach for non-linear data processingand modeling involved in water treatment.
References
[1] W.J. Weber, Adsorption processes, Pure Appl. Chem. 37 (1974) 375–392.[2] Z. Xu, J. Cai, B. Pan, Mathematically modeling fixed-bed adsorption in aqueous
systems, J. Zhejiang Univ. Sci. A Appl. Phys. Eng. 14 (2013) 155–176.[3] L. Lv, Y. Zhang, K. Wang, A.K. Ray, X.S. Zhao, Modeling of the adsorption break-
through behaviors of Pb2+ in a fixed bed of ETS-10 adsorbent, J. Colloid InterfaceSci. 325 (2008) 57–63.
[4] K.H. Chu, Improved fixed bed models for metal biosorption, Chem. Eng. J. 97 (2004)233–239.
[5] I.A. Aguayo-Villarreal, A. Bonilla-Petriciolet, V. Hernández-Montoya, M.A. Montes-Morán, H.E. Reynel-Avila, Batch and column studies of Zn2+ removal from aqueoussolution using chicken feathers as sorbents, Chem. Eng. J. 167 (2011) 67–76.
[6] R. Tovar-Gómez, M.R. Moreno-Virgen, J.A. Dena-Aguilar, V. Hernández-Montoya, A.Bonilla-Petriciolet, M.A. Montes-Morán, Modeling of fixed-bed adsorption of fluo-ride on bone char using a hybrid neural network approach, Chem. Eng. J. 228(2013) 1098–1109.
[7] L. Cavas, Z. Karabay, H. Alyuruk, H. Dogan, G.K. Demir, Thomas and artificial neuralnetwork models for the fixed-bed adsorption of methylene blue by a beach wastePosidonia oceanica (L.) dead leaves, Chem. Eng. J. 171 (2011) 557–562.
[8] C.E.A. Padilha, C.A.A. Padilha, D.F.S. Souza, J.A. Oliveira, G.R. Macedo, E.S. Santos, Pre-diction of rhamnolipid breakthrough curves on activated carbon and AmberliteXAD-2 using artificial neural network and group method data handling models,J. Mol. Liq. 206 (2015) 293–299.
[9] H.C. Thomas, Heterogeneous ion exchange in a flowing system, J. Am. Chem. Soc. 66(1944) 1664–1666.
[10] G. Bohart, E.Q. Adams, Some aspects of the behavior of charcoal with respect to chlo-rine, J. Am. Chem. Soc. 42 (1920) 523–544.
[11] Y.H. Yoon, J.H. Nelson, Application of gas adsorption kinetics, Am. Ind. Hyg. Assoc. J.45 (1984) 509–516.
[12] R.M. Clark, Evaluating the cost and performance of field-scale granular activatedcarbon systems, Environ. Sci. Technol. 21 (1987) 573–580.
[13] G. Yan, T. Viraraghavan, M. Chen, A new model for heavy metal removal in abiosorption column, Adsorpt. Sci. Technol. 19 (2001) 25–43.
[14] M.S. Shafeeyan, W.M.A.W. Daud, A. Shamiri, A review of mathematical modeling offixed-bed columns for carbon dioxide adsorption, Chem. Eng. Res. Des. 99 (2014)961–988.
[15] C. Faur, A. Cougnaud, G. Dreyfus, P. Le Cloirec, Modelling the breakthrough of acti-vated carbon filters by pesticides in surface waters with static and recurrent neuralnetworks, Chem. Eng. J. 145 (2008) 7–15.
[16] E. Oguz, M. Ersoy, Removal of Cu2+ from aqueous solution by adsorption in a fixedbed column and neural network modeling, Chem. Eng. J. 164 (2010) 56–62.
[17] I.A. Basheer, M. Hajmeer, Artificial neural networks: fundamentals, computing,design and application, J. Microbiol. Methods 43 (2000) 3–31.
[18] X. Du, Q. Yuan, J. Zhao, Y. Li, Comparison of general rate model with a new model-artificial neural network model in describing chromatographic kinetics of solanesoladsorption in packed column by macroporous resins, J. Chromatogr. A 1145 (2007)165–174.
[19] C.K. Rojas-Mayorga, A. Bonilla-Petriciolet, I.A. Aguayo-Villarreal, V. Hernández-Montoya, M.R. Moreno-Virgen, R. Tovar-Gómez, M.A. Montes-Morán, Optimizationof pyrolysis conditions and adsorption properties of bone char for fluoride removalfrom water, J. Anal. Appl. Pyrolysis 104 (2013) 10–18.
[20] C.K. Rojas-Mayorga, J. Silvestre-Albero, I.A. Aguayo-Villarreal, D.I. Mendoza-Castillo,A. Bonilla-Petriciolet, A new synthesis route for bone chars using CO2 atmosphereand their application as fluoride adsorbents, Microporous Mesoporous Mater. 209(2014) 38–44.
[21] Standard Methods for Examination of Water and Wastewater, 20th ed AmericanPublic Health Association, 1998.
[22] B. Hassibi, D.G. Stork, G.J. Wolff, Optimal brain surgeon and general networkpruning, Proc. IEEE I.C.N.N. (1993) 293–299.
[23] M. Figueiredo, A. Fernando, G. Martins, J. Freitas, F. Judas, H. Figueiredo, Effect of thecalcination temperature on the composition and microstructure of hydroxyapatitederived from human and animal bone, Ceram. Int. 36 (2010) 2383–2393.
[24] S. Lurtwitayapont, T. Srisatit, Comparison of lead removal by various types of swinebone adsorbents, Environ. Asia 3 (2010) 32–38.
[25] F. Zeinali, A.A. Ghoreyshi, G.D. Najafpour, Adsorption of dichloromethane fromaqueous phase using granular activated carbon: isotherm and breakthrough curvemeasurements, Middle-East J. Sci. Res. 5 (4) (2010) 191–198.