The creation of breakthrough concepts by design teams
39
14th Annual Conference of European Academy of Management, Valencia, Spain 1 The creation of breakthrough concepts by design teams Thomas GILLIER * Grenoble Ecole de Management, Grenoble, France Gerald PIAT R&D Division, Electricité de France (EDF), Paris, France Akin Osman KAZAKCI Ecole Nationale Supérieure des Mines de Paris, Paris, France * corresponding author: [email protected] Abstract How do design teams think in order to bring about breakthrough concepts? What are the main underlying cognitive mechanisms at the front end of such creation processes? Empirical evidence shows that firms often have difficulties breaking free from the conventional ideas surrounding products. Although prior works in creativity emphasize the ideation process in the design teams, little theoretical attention has been devoted to understand these teams’ approaches to think about new ideas. Through the experimental analysis of ten design teams aiming to elaborate upon a breakthrough concept of a movable and eco-friendly Antarctica museum, we examine the thought processes used to follow or go beyond the existing museums. This research suggests that thinking outside the box does not follow the two-steps funnel model in which idea generation is separated from selection. Our results better support a process where breakthrough concepts result from the continuous reconfiguration of known properties and unknown properties. Our findings indicate that elaborating a breakthrough concept toward an “ecosystem of properties” approach (i.e. connected network of solutions) outperforms the “primer concept fixation” (i.e. attachment to first solutions) and “random exploration” approaches (i.e. free generation of many isolated solutions). Managerial recommendations to assist design teams in pursuing an “ecosystem of properties” approach are provided. Keywords: design team, breakthrough concepts, new concept development, creative thinking, innovation, fuzzy front end, ideation
-
Upload
grenoble-em -
Category
Documents
-
view
5 -
download
0
Transcript of The creation of breakthrough concepts by design teams

14th Annual Conference of European Academy of Management, Valencia, Spain 1
The creation of breakthrough concepts by design teams
Thomas GILLIER* Grenoble Ecole de Management, Grenoble, France
Gerald PIAT R&D Division, Electricité de France (EDF), Paris, France
Akin Osman KAZAKCI Ecole Nationale Supérieure des Mines de Paris, Paris, France
*corresponding author: [email protected]
Abstract
How do design teams think in order to bring about breakthrough concepts? What are the main
underlying cognitive mechanisms at the front end of such creation processes? Empirical evidence
shows that firms often have difficulties breaking free from the conventional ideas surrounding
products. Although prior works in creativity emphasize the ideation process in the design teams,
little theoretical attention has been devoted to understand these teams’ approaches to think about
new ideas. Through the experimental analysis of ten design teams aiming to elaborate upon a
breakthrough concept of a movable and eco-friendly Antarctica museum, we examine the thought
processes used to follow or go beyond the existing museums. This research suggests that thinking
outside the box does not follow the two-steps funnel model in which idea generation is separated
from selection. Our results better support a process where breakthrough concepts result from the
continuous reconfiguration of known properties and unknown properties. Our findings indicate
that elaborating a breakthrough concept toward an “ecosystem of properties” approach (i.e.
connected network of solutions) outperforms the “primer concept fixation” (i.e. attachment to
first solutions) and “random exploration” approaches (i.e. free generation of many isolated
solutions). Managerial recommendations to assist design teams in pursuing an “ecosystem of
properties” approach are provided.
Keywords: design team, breakthrough concepts, new concept development, creative thinking, innovation, fuzzy front end, ideation

14th Annual Conference of European Academy of Management, Valencia, Spain 2
1. Introduction and research gap
How do design teams think in order to generate breakthrough concepts? What are the main
underlying cognitive mechanisms at the beginning of such creation processes? Today, in an
increasingly competitive context, organizations often try to create breakthrough concepts. These
are usually defined as ideas about new categories of products which could re-shape or break
current industrial paradigms, induce revolutionary changes in the structure of firms and provide
higher customer benefits compared to existing products (Ahuja et Morris Lampert 2001; C. M.
Christensen 1997; Danneels 2002; Leifer et al. 2001; Markides 2006; McDermott et O’Connor
2002; Stringer 2000). When comparing the creation process of incremental innovation which
follows predictable trajectories, the creation process of radical or disruptive innovations which
brings about unpredicted breakthrough concepts is often characterized as a more complex and
fuzzy process (Goldenberg, Lehmann, et Mazursky 2001; Khurana et Rosenthal 1998; Reid et de
Brentani 2004; V. Seidel 2007). The thinking processes to create breakthrough concepts are more
erratic, involving the unexpected connections of several pieces of knowledge that were not linked
before. This specific creation process is still not well understood, and it is not uncommon for
practitioners to feel confused and uncomfortable in this creation process (Assink 2006; Coyne,
Clifford, et Dye 2007; Goddard, Eccles, et Birkinshaw 2012; V. Seidel 2007).
In their search for distinction, innovative organizations often incorporate design teams who are
responsible for managing the front end of innovation by generating breakthrough concepts.
Although existing research in new product development (NPD) provides key findings for
developing breakthrough commercial products, little research investigates how designers think in
order to elaborate breakthrough concepts (Goldenberg, Lehmann, et Mazursky 2001; V. Seidel
2007). Research about how design teams think is still required as claimed by (Dahl 2011, 425) in
a recent JPIM special issue: “Research directed towards a better understanding of what enables
design team effectiveness is clearly needed (…) One approach to studying design teams would be
to seek a better understanding of the internal processes undertaken during the design function. As
one example, how design teams facilitate creativity in a group context would be interesting to
investigate. (p.425)” So, how do design teams think when they are invited to elaborate
breakthrough concepts that, at first, appear to be strange, unusual and ill-defined? How do design
teams reason for diverting from the norm and not being locked into traditional procedures?

14th Annual Conference of European Academy of Management, Valencia, Spain 3
Our contribution differs from the prior research on NPD along two dimensions.
First, existing research has extensively suggested both organizational factors such as motivation,
autonomy, process formalization or intra-organizational knowledge (Amabile 1996; Amabile et
al. 1996; Im, Montoya, et Workman 2013; Kim, Im, et Slater 2013) and creative techniques such
as brainstorming and analogical thinking (Dahl et Moreau 2002; Osborn 1953; Paulus et Nijstad
2003; Paulus 2013; Schirr 2012; Sutton et Hargadon 1996) increase the quantity and the quality
of the concepts generated by design teams. Rather than focusing on the external conditions that
increase the probability of success for innovative ideas for teams, this research aims to open the
black box of the ideation process to better understand the inner processes under which
breakthrough concepts are elaborated. We investigate how creative ideas emerge and how they
are welcomed, modified and formalized into a defined product.
Second, research on innovative design teams has gained a great deal of attention in the last
decade. In these studies, the generation of bright ideas is said not to come from single individuals
but to emerge from the interactions of ideas and knowledge from multiple actors (Hargadon et
Bechky 2006; Hargadon 1999; K. Sawyer 2008). Such interactions are proven to be innovative
mainly because of the analogical thinking that enable teams to build on each other's ideas and to
link their current problems, past solutions and prior experiences (B. T. Christensen et Schunn
2007; Dahl et Moreau 2002). Even if these interactions are often reported as important starting
points for the generation of new concepts, studies that explain how the interactions of thinking
processes influence the elaboration of preliminary breakthrough concepts at a fine-grain level are
still missing.
Our research proposes to investigate the elaboration of breakthrough concepts through the
comparison of experimental sessions conducted by ten design teams, each composed of three
professionals with experience in R&D activities. These sessions are part of an innovative real-life
projecti that aims to develop a breakthrough concept of a museum that immerses visitors in the
world of Antarctica while being eco-friendly and easily movable for exhibits all over the world.
In contrast to the current experimental studies about the ideation process, we use two important
methodological aspects to open the black box of ideation. First, the design brief is significantly
out of the ordinary and out of any known expertise areas immediately accessible: the participants

14th Annual Conference of European Academy of Management, Valencia, Spain 4
are placed in a situation where they have to create a novel conceptualization of what a museum
is. Then, a specific process-based metric is developed to distinguish whether design teams think
in conformity with current definitions of museums or in new directions. Thus, our research
methodology permits us to better identify and understand the “breaks” that are commonly
observed in breakthrough innovation thinking (V. Seidel 2007).
This research offers rich data and allows us to investigate two critical research questions: (1)
what are the different thinking approaches used by design teams during the elaboration of
breakthrough concepts? (2) Then, among these different approaches which are the best suited to
enhance breakthrough innovation? In order to answer this question, the approaches observed are
discussed and compared in respect to the quality of the final concepts produced. The final
concepts were assessed by a panel of thirteen experts with high experience in the domain of
museum and public events organizations.
In the next section, we will expand on what is currently known and expected regarding the
process of breakthrough concept elaboration in design teams.
2. Theoretical Model
2.1. The process of breakthrough concepts production
Although prior research in NPD has described the development, commercialization and diffusion
of breakthrough innovation in details, the research about ideation process is still claimed to be
scarce (Spanjol, Qualls, et Rosa 2011). According to (Page et Schirr 2008), ideation and
creativity topics represent only 5% of the 815 product innovation articles published between 1989
and 2004. Most existing research in this field is a collection of idea generation tools to help
people break free from conventional products and to challenge common assumptions (e.g.
brainstorming (Osborn 1953), brainsketching (Van Der Lugt 2002), active works with users
(Lilien et al. 2002; Nicholas, Ledwith, et Bessant 2013; Urban et Von Hippel 1988), TRIZ
methods (Altshuller, Shulyak, et Rodman 1999; Ilevbare, Probert, et Phaal 2013), Delphi
methods (Steinert 2009), unrelated stimuli (Hender et al. 2002; McFadzean 1998), open
innovation systems (Bayus 2012; Franke et Piller 2004; Poetz et Schreier 2012) or Concept-
Knowledge tools (Elmquist et Segrestin 2009; Gillier et al. 2010)).

14th Annual Conference of European Academy of Management, Valencia, Spain 5
All these different techniques point out that the breakthrough ideation process covers several
different thinking processes and approaches. Regarding the existing models of breakthrough
ideation itself, inspired by early studies in psychology, a body of research describes it as
“divergent thinking”, or individual and collective cognitive abilities that permit the generation of
a large set of ideas (Ames et Runco 2005; Guilford 1956; Williams 2004). In this perspective,
ideation for breakthrough concepts is viewed as a combinatorial process of ideas (Dahl et Moreau
2002; Kohn, Paulus, et Choi 2011). For (J.G. March 1991), such new associations may be
obtained through the wide exploration of new knowledge and competencies. (Kim, Im, et Slater
2013; Rietzschel, Nijstad, et Stroebe 2007) found that a deep exploration of heterogeneous
knowledge enhances the originality and novelty of ideas. In contrast, (Gabrielsson et Politis
2012) showed that the breadth rather than the depth of knowledge for functional work experience
favors the generation of new ideas. More fundamentally, some authors show that these creative
connections can be better interpreted using a design perspective (Dorst 2006; Hatchuel et Weil
2009; Simon 1969; Verganti 2009). In this perspective, final breakthrough concepts are explained
to come from the exploration of different design paths. A design path is defined as a successive
linkage of properties that can be more or less original. (McFadzean 1998) claimed that the
solutions proposed during ideation can be classified into a continuum ranging from “1- Paradigm
preserving ± where no elements or relationships are introduced. 2- Paradigm stretching ± where
either new elements are introduced or new relationships are conceived. In other words, the
problem space or paradigm boundary is stretched to enable group members to consider something
new. 3 - Paradigm breaking ± where both new elements and new relationships are introduced.
This occurs when the paradigm's boundary is completely broken by the participants.” (p133).
(Boden 2003) claimed that the higher level of creativity (“transformational creativity”) is
achieved because of the design of a new conceptual space (i.e. a new paradigm). For the author,
the “breaks” that characterize the “breakthrough” ideation process occur when the established
conceptual spaces are transformed into new ones. Quite similarly, (Hatchuel et Weil 2009;
Hatchuel et Weil 2003) model such conceptual shift as the expansion of concepts (i.e. unknown
propositions) and knowledge spaces (i.e. known propositions).
Formally, this first proposition is explored:

14th Annual Conference of European Academy of Management, Valencia, Spain 6
Proposition 1: The breakthrough ideation process is composed by a sequence of “known”
properties (i.e. existing knowledge about the current paradigm) and “unknown”
properties (i.e. ideas that go beyond the existing paradigm).
In summary, the elaboration of breakthrough concepts is usually defined as a creative design
process that radically changes the dominant logics and traditional beliefs of industries. Existing
studies in creativity and innovation management have extensively investigated the external
factors (techniques, appropriate environments…) to produce a large quantity of ideas with the
hope of obtaining a few great ones, but the process of ideation itself has been much less
investigated. Breakthrough ideation process is depicted as a design process that requires both the
involvement of “known” properties (i.e. elements that come from the existing paradigm) and
“unknown” properties (i.e. elements that go beyond the existing paradigm) (Hatchuel et Weil
2009; McFadzean 1998). However, little is known if different approaches exist to involve such
properties. The next section presents the literature findings regarding the characteristics and
challenges of design teams in breakthrough situations.
2.2. The dynamics of design teams during breakthrough concepts generation
To concur with (Dahl 2011), the existing research on innovative design teams is quite scarce and
mostly falls under the category of NPD team performance. In this perspective, multiple
organizational and contextual factors have been emphasized. Among other studies, innovative
NPD teams are most often those involving a collaborative leaderships style that permits a high
level of cohesiveness, open-mindedness, and high individual satisfaction and motivation
(Amabile et al. 1996; Jassawalla et Sashittal 2000; King et Anderson 1990; Sarin et McDermott
2003; Thamhain 2003; West 1990). The organic and autonomous NPD teams composed by
heterogeneous members increase their chance to be innovative (Keller 2001; Magni et al. 2013;
McDonough III 2000; Patanakul, Chen, et Lynn 2012). However, an important amount of
research in group brainstorming showed that not all teams are innovative. Specifically, it is
proven that the creativity of individuals outperforms when they work alone rather than when they
evolve in groups (Diehl et Stroebe 1987; Mullen, Johnson, et Salas 1991; Paulus 2013; Schirr
2012; Taylor, Berry, et Block 1958). (Hoegl et Parboteeah 2007) found that, in comparison to
single individuals, teams are better for elaborating and discussing ideas than for generating ideas.

14th Annual Conference of European Academy of Management, Valencia, Spain 7
Issues such as social loafing, free-riding and evaluation apprehension are pointed out (Eppler,
Hoffmann, et Bresciani 2011; Gallupe et al. 1992).
In contrast to experimental studies of brainstorming, several researchers try to understand how
teams innovatively think in real-life contexts, such as in product design firms like IDEO (Brown
2008; Kelley 2007; Sutton et Hargadon 1996). Those design teams are first characterized by their
“design thinking” competencies, i.e. a set of skills and methodologies to take into account
customers’ experiences and needs, to brainstorm new ideas and to develop early prototypes and
markets proofs (Brown 2008; Martin 2009; Victor Seidel et Fixson 2014; Sutton et Hargadon
1996). Those skills are reported to stimulate the imagination and the exchange of tacit knowledge
(Hargadon et Bechky 2006; Litchfield 2008; Mascitelli 2000; Schirr 2012). More particularly, in
these longitudinal studies, design teams are said to be innovative because of the ways the
participants interact with each other. (K. Sawyer 2008; R. K. Sawyer et DeZutter 2009) insisted
on the fact that breakthrough innovation does not come from a sudden flash of insights but it is
achieved through a participatory process that supports a sustaining “flow” of ideas. They
proposed some basic principles to follow, such as deep listening, building on each other or
provoking surprising questions. (Kohn, Paulus, et Choi 2011) found that ideas produced in
brainstorming are better when they are built on other ideas. In a qualitative study of 8 engineering
design organizations, (Hargadon 1999) showed that the interactions between designers often rely
on analogical thinking that permit the making of non-obvious connections between knowledge
from past problems or experiences and their current problems. During these interactions,
(Berchicci et Tucci 2010) highly stressed the capacity of design teams to build mental models and
shared belief systems. Often, this is a difficult task because breakthrough innovations may invoke
numerous instances for misunderstandings because of issues of ambiguity and equivocality, i.e.,
different interpretations may exist regarding the targeted market segments, the technologies
involved or the financial resources required. According to (Davison et Blackman 2005), teams
that are able to co-develop new ideas are those that have shared mental models that tolerate the
differences in points-of-view. Similarly, rather than searching for solutions that are convenient
for everyone concerned, (Badke-Schaub, Goldschmidt, et Meijer 2010) found that the most
innovative design teams do not look for agreement but instead confront their mindsets. However,

14th Annual Conference of European Academy of Management, Valencia, Spain 8
still much research is required to understand to what extent team members’ interactions
contribute to the elaboration of breakthrough innovation.
Finally, this second proposition is investigated:
Proposition 2: Breakthrough concepts are elaborated upon via an interactive process
through which team members generate properties by building on the properties of others
or their own.
In summary, the innovative design teams are usually said to pay a great deal of attention to how
they interact with each other. Design teams are required to both create new mental models and to
assure a certain level of cohesiveness between individuals. However, the relationships between
the process of elaboration of breakthrough concepts and the dynamics of design teams are still
not well investigated. The research proposes interesting frameworks to describe the trajectory of
concepts but the consequences on the collective reasoning is not investigated. Inversely, design
team interactions are well described but their impact on the trajectory of concepts is under
investigated. This provides the motivation for our research.
3. Research design and protocol for analysis
3.1.Overview of the research design methodology
This research is a comparison of ten innovative sessions conducted by ten different design teams,
each comprised of three people with experience in R&D activities. These sessions lasted one-
and-a-half hours each. These sessions are part of an innovative real-life project, supported by a
French cross industry innovation partnership, called MINATEC IDEAs Laboratory®, aiming to
elaborate an innovative concept of a museum that could be movable and eco-friendly, promoting
the experience of Antarctica. In 2012, MINATEC IDEAs Laboratory® decided to organize a
series of innovative workshops involving multiple external professional designers. The sessions
took place in a laboratory setting. All recorded data were analyzed following the principles of
verbal protocol analysis (or “thinking aloud protocol”) (Dunbar et Blanchette 2001; Ericsson et
Simon 1985; Green et Gilhooly 1996; Jaaskelainen 2010).
Our research goals were to explore how design teams manage their ideation processes and intra-
team relationships when they need to generate breakthrough concepts. In particular, we observed

14th Annual Conference of European Academy of Management, Valencia, Spain 9
the different approaches of exploration pursued by design teams and compared them with
quantitative and qualitative data. Contrary to prior research that mostly used case-study
methodologies for understanding group creativity at the firm level (Hargadon et Bechky 2006; V.
Seidel 2007; Sutton et Hargadon 1996), verbal protocol analysis permits tracking the team
cognitive process at a more fine-grained level. Historically developed in psychology and
cognitive sciences, this methodology gains popularity for studying innovation management (Dahl
et Moreau 2002; Dunbar 1995; Ruiz, Jain, et Grayson 2012; Van Der Lugt 2002; Ziamou, Gould,
et Venkatesh 2012). According to our knowledge, no prior studies have studied the process of
breakthrough concept ideation with such extensive data (i.e. studying the reasoning of ten design
teams during ten sessions, covering 15 hours total). The next two sections present our research
methodology regarding the context of the experiments, data collection and analytical process.
3.2. Data collection
3.2.1. Research protocol of the innovative sessions
A. Participants and formation of design teams
The 30 participants were all either engineering designers or industrial designers with an average
of 12 years of professional experience in R&D and innovation. Participants came from various
industrial sectors and held different positions at the moment of the experiments: 10 were
innovation managers, 11 engineering designers, 4 industrial designers, 3 industrial buyers and 2
B-to-B marketers. No participants had previous experience in the design of museum exhibits or in
the creation of important public social events. The participants were debriefed and compensated
for their participation.
B. Presentation of the design brief: a non-routine and breakthrough task
The ten design teams were given the assignment to further develop a breakthrough museum
concept that gives the visitor an immersive experience in an Antarctica-like world. The
participants were asked to elaborate both the form and functions of the museum (Luchs et Swan
2011). They were advised to design the architectural aspects and the possible museum activities.
The guidelines included the following:
• The museum aims to make people aware of the impending need to protect Antarctica.

14th Annual Conference of European Academy of Management, Valencia, Spain 10
• The museum is mobile – it is a touring museum that could be deployed anywhere in the
world, whatever the conditions.
• The museum is practical and easy to install and transport.
• The museum is eco-friendly as much as possible (ecological materials; energy harvesting
solutions…)
• The museum size is approximately 3600 m2.
This design brief was chosen for three main reasons. First, the theme of “museum” is simple and
easily appropriable for the subjects. Because museums are commonplace, all participants have
some experience with them. Second, this design brief is sufficiently open-ended; it offers the
opportunity to investigate how design teams think in very different ways about different domains
(architecture of the museum, visitors’ activities and experiences, business models, visitors’
management…). Thirdly, this design brief offers a great potential for disruptiveness since, by its
very definition, it is outside the scope of any known instance of its category. In prior
experimental studies, the design brief usually aims to create new products by an extension of a
known and existing product line (e.g. new SMS-based services for mobile phones (Magnusson
2009), additive feeding for babies (Poetz et Schreier 2012), a flexible-size tent for hiking (Badke-
Schaub, Goldschmidt, et Meijer 2010)) or through the re-design of a pre-existing product, such as
a re-designed bicycle rack (Dorst 2006). In contrast, the design task for the teams involves the
creation of a new category of product. The unusual dimensions of the design task (mobile
museum, eco-friendly…) challenge and go beyond the traditional definition of a museum. To a
certain extent, the participants are urged to deeply revise and break the classic identity and
common assumptions of what a “museum” is. It is significantly out of the ordinary and out of any
known expertise areas immediately accessible to them. So, how do people come to generate
descriptions of a system that they do not know? The fact that the design brief is too foreign to
instantly imagine what the final concept can be, design teams cannot use a rule-based approach
but need considerable effort for imaginative and innovative design. This shift in their thinking
enables us to truly study how design teams cope when breaking from paradigms. These two
criteria are essential for studying the “foolishness” of teams (James G. March 2006) and detecting
the controlling parameters used by the design teams in order to not get lost while proceeding in
the dark.

14th Annual Conference of European Academy of Management, Valencia, Spain 11
C. Organization of the design sessions
Each of the ten design sessions was run individually. In order to analyze how the design teams
naturally reason, they worked in total autonomy without any helps from facilitators. At the start
of each session, the design task was given to the design team. They were informed that they had
one hour and thirty minutes to formulate one single concept for an innovative museum. The
design teams were asked to summarize their concept on an A3 sheet of paper with sketches, user
scenarios, texts and motto. All experiments were launched in the same large room; table, white
paper, and pencils were provided. Participants did not have any access to external documents (no
computer, no internet connections, no books, no phone…). Participants were free to use
whichever innovative techniques they wanted. Basically, they all adopted an unstructured form of
brainstorming. At the end of each session, the participants were asked to present their concept in
ten minutes to one of the authors. In order to cover all the aspects of the design proposals and to
provide reliable and comparable qualitative data between the ten designs, a semi-structured guide
was used (see Appendix 1). All the experiments and interviews were video- and audio-recorded;
the ten final concepts were collected. Finally, because teams varied in their ability to sketch their
concepts, and this was outside the scope of research, a professional designer polished the ten final
concepts in order to avoid bias during their evaluation. In order to faithfully respect the concepts
proposed by the ten design teams, the professional designer was closely supervised and informed
of the initial sketches and semi-opened interviews.
3.2.2. Research protocol of the ratings of the final concepts
The 10 final concepts were then assessed by a panel of 14 professionals – 6 of them were experts
in museums (2 directors of museums, 2 curators, 1 public programmer and 1 exhibition designer)
and 8 of them were specialized in the organization of public events (1 director and 7 project
managers) (see Appendix 2). Judges were asked to rate the 10 final concepts with 3 criteria
according to a five level Likert scale: 1/ “novelty” compared to the existing museums – all kinds
of museum could be considered (from old-fashioned museum to innovative one (planetarium,
3D-relief movies…)); 2/ “feasibility” in terms of how simple it would be to implement it –
economically and technically; 3/ “value” for the visitors, or the possible benefits for users to visit
such a place. The score of one judge was not taken into account in the study because some scores
were not provided. Although many criteria can be used to evaluate new concepts, these 3 criteria

14th Annual Conference of European Academy of Management, Valencia, Spain 12
are the most frequently used in idea evaluation processes (Magnusson 2009; Poetz et Schreier
2012). All judges were blind to the research. In order to increase the reliability of judges, the
evaluation process was divided into 3 steps according to an adapted version of Delphi techniques.
In the first step, the rating criteria were presented and discussed by the judges. This aims to
reduce the possible differences in the interpretation of the 3 criteria. Then, the final sketches of
the 10 final concepts were presented and each judge rated independently. Finally, the results of
ratings were discussed in an unstructured form by the judges who could modify (or not) their
initial grading.
Inter-rater reliability between the judges was measured using the inter-judge agreement reliability
formula, called the Proportional Reduction Loss (PRL) of Rust and Cooil (1994). PRL is proven
to be of superior performance to several other reliability approaches for qualitative or quantitative
data (cronbach’s alpha, cohen’s k…) because PRL does not allow reliability to appear inflated
(Rust et Cooil 1994). The applicability of this statistic formula has been successfully tested by
(Cabra and Joniak, 2008) for the assessment of innovative products and services. The inter-rater
reliability was calculated for each of the criteria during both the first and second round of
evaluation: PRL-novelty {2nd=.74;1st=.71}; PRL-feasibility {2nd=.74;1st=.71}; PRL-value
{2nd=0.70;1st = .71}. All statistics show PRL ≥ 0.7 and so the internal consistency is largely
acceptable. The results also show that raters had a high degree of agreement among them from
the first evaluation round on. The Delphi method used during the second evaluation enabled
raters to improve, to a small extent, their joint agreement, but, overall, the raters’ judgments were
confirmed rather than modified.
3.3. Data analysis protocol of the experimental sessions
3.3.1. Coding and analysis of the verbal protocols: process-measures metrics
For analyzing and tracking the evolution of design team reasoning, we follow the principles of
verbal protocol analysis (Dunbar et Blanchette 2001; Dunbar 1995; Ericsson et Simon 1985;
Nisbett et Wilson 1977). Within the verbal protocol analysis approach, the participants are asked
to say out loud what she or he is thinking while carrying out their innovative design process.
Such research methodology has been extensively used in several domains for understanding the
mind (decision making, creativity, learning, knowledge acquisition…) and the team dynamics

14th Annual Conference of European Academy of Management, Valencia, Spain 13
(communication, team mental model…). In innovation, this methodology has been particularly
used to investigate the role of analogical thinking of innovative people and scientists (B. T.
Christensen et Schunn 2007; Kalogerakis, Lüthje, et Herstatt 2010), and consumers’ experiences
and their learning process when faced with technological innovations (Ruiz, Jain, et Grayson
2012; Ziamou, Gould, et Venkatesh 2012). Such methodology is appropriate to fully investigate
real-time situations. It also permits to avoid biases of interpretation after the experiment.
The conversations and the different interactions between the participants of each team were
recorded and transcribed. Information regarding the identification of the speaker and the specific
actions and reactions of participants (drawing, handling objects, jokes, laughing, mime…) were
integrated into the transcripts. In total, the ten transcripts covering 15 hours of video were used in
the present data analysis. The degree of verbalization varies between teams, and the number of
words per team ranges from 12,500 to 23,000 words.
A. Identification of the design properties
We define the final concept as a conceptual entity composed by a sequence of design properties
(Hatchuel et Weil 2009; Hatchuel et Weil 2003). Regarding our context, basically, four broad
categories of design properties were expressed by the different teams: the organization of the
museum (i.e., “how the museum concept works”) – the nature of the exhibition (i.e. “what the
museum concept does”) - the architecture of the museum (“how the museum concept is built”)
and miscellaneous. Each category includes design properties such as functions (e.g., visitor
activities, mode of transports…), technical elements (e.g. video, rooms…) or visual aesthetics
(e.g., size, shape, and decoration). Although such categorization was not taken as an exhaustive
list, it helped the authors identify and code the design properties (see Appendix 3 for examples of
design properties).
On average, the design properties represented 18.3% of the total number of words per transcript
and each design team discussed a single design property between three and four times during the
session. Participants spent the rest of their discussion dealing with other activities such as
problem framing, team coordination or team socialization. In total, the ten design teams
generated 822 design properties (S.D. = 20.61).

14th Annual Conference of European Academy of Management, Valencia, Spain 14
B. Codification of the design properties: unknown or known
All the design properties were then either coded as “known” or “unknown”. Adapting the
framework of (McFadzean 1998), “known” properties refer to those that preserve the current
paradigm of museums by not introducing any new elements or relationships to the domain of
museum, contrary to an “unknown” property that breaks the current paradigm by looking at
something in an entirely new way. More precisely, a design property was considered to be
“known” if it could be obviously and easily observed in existing or past museums. In this case,
the design property can be viewed as being part of the knowledge or past experience of at least
one member of the team. All types of museum (scientific, artistic, cultural, or historical) were
considered – note that, a specific attention was given to the website of the major museum
dedicated to Antarctica, the museum of the Arctic and Antarctic in St. Petersburg (Russia). For
instance, the design property “including a map of the southern hemisphere” was assigned as
“known” because it already exists in the St. Petersburg museum. The design property “discounted
cost of tickets for children” was also a “known” property because it appears in most museums.
These known properties can be interpreted as the participants’ current knowledge and
experiences of museums. Because the participants were not specialized in museums, the known
properties were mostly pieces of common and established knowledge.
In the cases where the design property was not usually encountered in museums, the design
properties were judged as “unknown”. For instance, the design properties “a museum that is a
zeppelin” or “museum with ice footsteps sound effects” fall into this category. The degree of
feasibility or the value delivered by the design properties was not taken into account. These
unknown properties came from the imaginations of the design team members; they are ideas that
were unproven or unrealized in the domain of a museum.
Among the 822 design properties reported, there were 510 unknown properties (62%, SD=16.06)
and 312 known properties (38%, SD=9.32).
C. Inter-rater reliability measures
Identifying concepts in free-form text is not a simple task. However, (Chiu et Salustri 2012)
found that humans are able to identify and agree upon concepts. In order to increase the scientific
rigor of this research, our coding procedure followed the indications provided by (Chiu et Salustri
2012). Two of the three authours completed the coding of all the data independently and without

14th Annual Conference of European Academy of Management, Valencia, Spain 15
communicating. Identified design properties were indicated by highlighting each time they
appeared; the two coders individually named each design property with their time of appearance
and the names of the creators. For coding, the software Atlas Ti (version 6.2, www.atlasti.com)
was used. Afterwards, the two coders analyzed and compared their coding segments side-by-side
in order to validate (or not) their identification. The Percentage Agreement (PA) between the two
coders for identifying the design properties was calculated for each team. While this method does
not exclude agreements that occurred by chance, it is simple and appropriate for exploratory
conditions. For each transcript, the PA was calculated. The meaning of design properties was
discussed thanks to the names which were provided by the two coders. All the differences in the
interpretations were resolved between the two coders. The overall average PA was 0.77, which
shows that the identification of design properties can thus be considered acceptable and
satisfactory because it reaches common thresholds (> .7). Then, for each property, the two coders
judged if the property was “known” or “unknown”. Inter-rater reliability was measured for the
full set of design properties. The PRL for each team reached a satisfactory level (> 0.7), and
overall, the PRL was 0.75.
D. Understanding the elaboration of concepts through linkography
Once the different design properties were identified and coded, an analysis of the relationships
between them were made by two of the authors. As previously said, we define a concept (or idea)
as a conceptual entity composed by a sequence of design properties. This analysis permits a
better view of how the different concepts were elaborated. For doing this, the linkography
methodology was used (Goldschmidt et Weil 1998; Goldschmidt 1995). We refer to previous
works in design literature to detail the original methodology (Kan et Gero 2008; Perry et
Krippendorff 2013). Tracking the links between the ways in which participants interact
innovatively (Van Der Lugt 2002). For each design property, we examined its possible linkages
with one or more previous design properties. If a design property was evoked without any
references to other design properties, no links were reported. The careful study of the verbal
protocols and video recordings permitted the links with explicit evidence. In total, 1279 links
were identified with a standard deviation of 45.32. Basically, we noticed links between design
properties in two frequent situations. The first identified when a design property was used to
modify or better elaborate one or more past design properties (“backward links”). We observed

14th Annual Conference of European Academy of Management, Valencia, Spain 16
that design teams frequently build several design properties around one topic (e.g. providing a
sensation of cold, simulation of a storm, walking on the ice, turning down the temperature…). A
second frequent case occurred when participants used design properties to jump to a totally
different idea (“forward links”). The following scenario illustrates this kind of situation. After
reading the design brief, participants were thinking about possible solutions for designing a
mobile and easy-to-install museum when one participant came up with the idea that the museum
could be “some barges” (design property A). After some discussion, participants decided that this
solution was not an appropriate one because the museum could only be installed in cities with
waterways (a river, sea…). Another participant proposed that the museum could “fly as an
airship” (design property B).
Finally, the Linkographer software1 was used to obtain a link diagram for each of the ten teams.
(Figure 1 gives an example of the established links over the timeline of the session for team #1;
Appendix 4 represents all diagrams). The right axis represents the set of design properties and the
“V” shapes are the connections between them. Once the links diagrams were completed, three
kinds of indicators were then used to better analyze the results.
Self-link index
This index was originally provided by (Van Der Lugt 2002). In our case, the self-link index is the
ratio of the links that the members make with their own prior properties, in relation to the total
number of links made. The self-link index indicates to what extent members interact when
generating properties. Thus, a design team with a low self-link index is a team that generates
properties by building on each member’s properties.
Link density
The notion of link density (or “index density” (Goldschmidt 1995)) indicates how the design
properties are connected with each other. It is calculated by dividing the number of links between
design properties by the total number of design properties. Thus, design teams with a high level
1 version 1.1. https://sites.google.com/a/linkographer.com/linkographer

14th Annual Conference of European Academy of Management, Valencia, Spain 17
of link density can be interpreted as design teams that adopt a holistic mindset. Inversely, the
teams that encompass a reductionist mindset (the generation of single ideas, no deep investigation
of previous ideas…) have a low level of link density. From there, we developed three specific
measures: the unknown link density, the known link density and the mixed link density.
The unknown link density measures how teams develop the connections between their unknown
properties. It informs us how the current paradigm boundary of a museum is broken. It is
calculated by the ratio between the number of links between unknown properties and the number
of unknown properties. A high level means that the teams have the ability to string uncommon
(unusual) design properties together. Such teams succeed to build a coherent and understandable
imaginative world involving new objects or new situations. Usually, these design teams are
comfortable with navigating between “strange” or even inappropriate ideas; the reality and the
feasibility aspects are not taken into account.
The known link density measures how much teams develop links between their known properties
(i.e. the ratio between the number of links among the set of known properties and the number of
known properties). A high level of known link density means that teams create concepts by the
integration of elements coming from the current dominant design. In this case, the design process
preserves the current paradigm of a museum.
If unknown link density implies a break in paradigm and known links density evokes paradigm
preservation, the mixed link density can be viewed as an intermediate level and labeled as
paradigm stretching (McFadzean 1998). It is calculated by the ratio between the number of links
between unknown properties and known properties and the number of design properties. It
provides information about how closely unknown and known design properties are connected
together. Typically, in our study, this indicator reveals how teams rely on their current knowledge
in the domain of “museum” for creating unknown concepts.
Cluster
Our second family of indicators is built around the notion of clusters (Goldschmidt 1995). A
cluster is a series of successive design properties that explore same specific issues. In our
experiment, a cluster was obtained by the formation of three consecutive links. A cluster
indicates how much the design teams continuously focused on the development of partial
solutions. The visual investigation of clusters permits us to attest whether teams focused on a

14th Annual Conference of European Academy of Management, Valencia, Spain 18
connected set of design properties or not (cf. Figure 1). Three kinds of clusters were defined: the
forward clusters, the backward clusters and the double clusters. The forward clusters are a
structured set of consecutive design properties that are used by design teams to enrich a solution
or used as the basis for generating new ones. The Backward clusters are used to revisit and refine
previous design properties, and double clusters are simultaneously forward and back-linked
clusters. Double clusters are made of design properties that are useful both to modify existing
ones and generate new ones. See (Bilda et Gero 2008) for further details.
Figure 1. A simplified example of a linkography diagram for team #1
4. Presentation of the results In the following section, we will first, in sub-section 4.1, give a short synthesis of our main
findings. We found that three main approaches were used by the design teams to elaborate
breakthrough concepts: “primer concept fixation” (teams #1, #9 and #10), “random exploration”
(teams #4 and #8), and “ecosystem of properties” (teams #3, #5, #6, #2 and #7) (see Figure 2).
According to the final concept ratings, design teams that use the last approaches received the best
scores (see Table 1). Then, in sub-section 4.2., we deeply analyzed to what extend the ecosystem
approach differs from the two other approaches in terms of the generation of known and
unknown properties (proposition 1) and how team members interacted to link the properties
(proposition 2).
Name of the design property **known or unknown **
links
backward cluster
forward cluster
double cluster

14th Annual Conference of European Academy of Management, Valencia, Spain 19
4.1. Description of three approaches of breakthrough concepts elaboration
4.1.1. Primer concept fixation approach: attachment to early properties
Teams # 1, #9 and #10 conducted a primer concept fixation approach. For these teams, the
linkographs show a much higher density of links at the beginning of the sessions than at the end
of the sessions. It means that these teams generate more backward clusters than forward clusters.
These teams tend to create a “heavy” property at the beginning of the session and they never
abandon it. Most of the design properties generated in the middle or at the end of the sessions are
linked to the primer property. The generated design properties are used only for reinforcing and
better elaborating the primer property. We noted that even if the primer property induced
difficulties or design problems, the design teams did not discard it. They did not start to think in
new directions but they persisted in making it work. Such an approach seems to not be
appropriated for breakthrough concepts: team #10 and #1 strongly lie below the average of the
three criteria. They scored lowest (hereafter referred to as the “less innovative teams”).
Alternatively, team #9 is ranked 7th since this teams provides an original concept, but it is hardly
feasible and provides poor value for the visitors.
4.1.2. Random exploration approach: generating concepts randomly
Teams #4 and #8 adopt a Random exploration approach. The link density and the number of
clusters are the lowest score compared to other teams. Even if these teams generated design
properties, they were disconnected from each other. These teams may have great ability to
brainstorm, but unfortunately, their results are produced in isolation. Team #4 is the team that
generates the least number of properties and the least number of citations per properties. Once a
property is generated, it is abandoned. In contrast, team #8 produced a very high rate of known
properties. During their work, they acknowledged that they were too focused on their current
knowledge: “we are really stuck, we are always thinking about what we know, and maybe we
need to innovate and to invent things that do not exist in reality” (45min.). The final concepts are
rated quite medium/low by the judges.
4.1.3. Ecosystem approach: integrating properties into a platform
Teams #2, #3, #5, #6 and #7 used what we label an ecosystem of properties. These teams
produced interdependent and entangled clusters of design properties. The density of links is high

14th Annual Conference of European Academy of Management, Valencia, Spain 20
and, in average, there are a balanced number of backward and forward clusters. Teams #2 and #7
constituted two or three ecosystems of properties and the teams #3, #5 and #6 succeeded to create
only one single ecosystem of properties. Clusters created by teams #3, #5 and #6 are specific
because they are backward, forward and double clusters. It means that these teams proposed
properties which enabled them to reconnect with prior properties and to stimulate the creation of
later properties.
The judges’ ratings show that creating one single ecosystem of properties was the most
appropriate approach for breakthrough concept elaboration: teams #3 and #6 scored highest
(hereafter referred as the “highly innovative teams”). Team #3 is clearly the highest innovative
team regarding the three criteria of novelty, feasibility and value. Team #6 scores very good
results on the three criteria. Teams #2 and #5 propose solutions that are not really original but
they are feasible and of value for visitors. In contrast, the final concept proposed by team #7 is
original but it is not very feasible and provides poor value for the visitors.
14th Annual Conference of European Academy of Management, Valencia, Spain 21
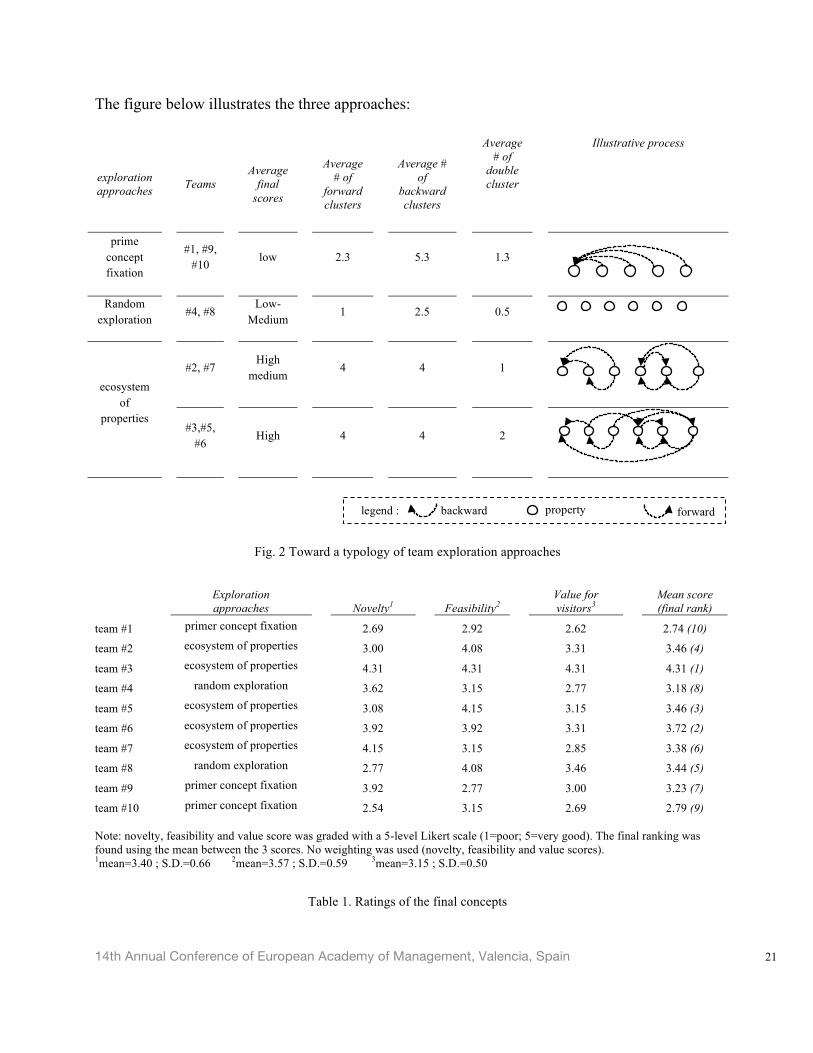
The figure below illustrates the three approaches:
exploration approaches Teams
Average final
scores
Average # of
forward clusters
Average # of
backward clusters
Average # of
double cluster
Illustrative process
prime concept fixation
#1, #9,
#10
low
2.3
5.3
1.3
Random exploration
#4, #8
Low-Medium
1
2.5
0.5
ecosystem of
properties
#2, #7
High
medium
4
4
1
#3,#5,
#6
High
4
4
2
Fig. 2 Toward a typology of team exploration approaches
Exploration approaches
Novelty1
Feasibility2
Value for visitors3
Mean score (final rank)
team #1 primer concept fixation 2.69
2.92
2.62
2.74 (10)
team #2 ecosystem of properties 3.00 4.08 3.31 3.46 (4)
team #3 ecosystem of properties 4.31 4.31 4.31 4.31 (1)
team #4 random exploration 3.62 3.15 2.77 3.18 (8)
team #5 ecosystem of properties 3.08 4.15 3.15 3.46 (3)
team #6 ecosystem of properties 3.92 3.92 3.31 3.72 (2)
team #7 ecosystem of properties 4.15 3.15 2.85 3.38 (6)
team #8 random exploration 2.77 4.08 3.46 3.44 (5)
team #9 primer concept fixation 3.92 2.77 3.00 3.23 (7)
team #10 primer concept fixation 2.54 3.15 2.69 2.79 (9) Note: novelty, feasibility and value score was graded with a 5-level Likert scale (1=poor; 5=very good). The final ranking was found using the mean between the 3 scores. No weighting was used (novelty, feasibility and value scores). 1mean=3.40 ; S.D.=0.66 2mean=3.57 ; S.D.=0.59 3mean=3.15 ; S.D.=0.50
Table 1. Ratings of the final concepts
property
backward link
forward
legend ::

14th Annual Conference of European Academy of Management, Valencia, Spain 22
4.2. Lessons from the ecosystem approach
4.2.1. Elaborating breakthrough concepts is not generating solutions: producing a lot of
unknown properties is not a promise of success
Contrary to the random exploration approach, the ecosystem approach highlights the fact that
breakthrough concept elaboration does not require the generation of a large number of ideas.
Interestingly, this result strongly contradicts the common assumption that considers fluency
(skills to generate a high number of ideas generated) as a key factor of creativity (Osborn 1953).
Our data does not confirm that more ideas lead to better ideas – as suggested by other authors in
creativity who show that quantity does not always breeds quality (Osborn 1953, 131; Rietzschel,
Nijstad, et Stroebe 2007; Yang 2009). We found no significant correlations between the quantity
of properties generated and the three evaluation criteria. Indeed, if team #6 generated the highest
number of design properties (125 design properties, ranking 2nd), the team that proposed the most
breakthrough final concepts (team #3) was also the one that generated a low number of
properties. In comparison with the random exploration approach, the ecosystem approach does
not direct design teams to generate solutions but to think in more rational ways.
Although we found that generating a large number of unknown properties increases the novelty
of the final concepts (r = .077, p < .05, n=822) and that design teams naturally talk much more
and much more often about unknown properties than about the known properties (respectively, r
=.107; r = .138; p < .01; n=822). We found that the number of unknown properties does not
necessarily impact the feasibility and the value of the final concepts. Thus, a design team can
generate a high amount of unknown properties with a low overall score (e.g. team #10, ranking 9)
or inversely, a design team can generate a low amount of unknown properties with a high overall
score (e.g. team #3, ranking 1). More precisely, we found that what is important for breakthrough
concept elaboration is not the quantity of properties but rather the proportion between the number
of unknown properties and the number of known properties. Our empirical analysis suggests an
optimum ratio of about 65%. When too few unknown properties are generated in comparison to
known properties (<65%), like the less innovative teams (team #1 and team #10), teams stay
fixed around the usual dominant paradigms of museums. To the contrary, if too many unknown
properties are generated in comparison to known properties (>65%), teams create final concepts
that do not make sense for the judges.

14th Annual Conference of European Academy of Management, Valencia, Spain 23
Differing from the primer concept fixation approach, the ecosystem approach increases the
possibility of design teams generating useful properties. Indeed, our results show that the
production of design properties is required during all of the design process, and the timing of
generation has differing impacts on the three criteria. Firstly, the unknown properties produced
early in the process seem to have a higher impact on the novelty of the final concepts than the
unknown properties produced late in the process (correlation between time of unknown
properties emergence and novelty r= -.103; p < .05, n=512). Secondly, the properties that are
generated late in the process positively impact the feasibility score of the final concept
(correlation between time of properties emergence and feasibility r= -.08; p < .05, n=822). The
design properties generated at the end of the sessions can reinforce the feasibility aspect of the
final concept, but the properties can be unknown or known properties. Finally, the known
properties generated late in the process increase the value score better than the known properties
proposed earlier in the process (correlation between time of known properties emergence and
feasibility
r = -.13; p < .05, n=310).
nb of design properties
citation average
Average score
(final rank)
known property1
unknown property2 known property3 unknown property4
team #1 34 31 5 7,19 2.74 (10)
team #2 29 39 4,85 4,41 3.46 (4)
team #3 21 39 3,32 5,49 4.31 (1)
team #4 21 36 1,9 2,22 3.18 (8)
team #5 21 74 2,15 2,62 3.46 (3)
team #6 46 79 2,91 2,57 3.72 (2)
team #7 32 55 2,93 3,82 3.38 (6)
team #8 44 51 2,66 3,49 3.44 (5)
team #9 26 59 2,15 4,34 3.23 (7)
team #10 38 47 3,15 2,31 2.79 (9)
1 mean=31.20 S.D.= 9.32
2 mean=51.44 S.D.=16.06
3 mean= 3.10 S.D.=1.06
4 mean= 3.85 S.D.=1.59
Table 2. Number and citation average of known and unknown properties per team
4.2.2. Linking unknown properties in order to create a collective “imaginary” world
While our results show that the quantity of properties is not crucial, the ability of design teams to
make links between their properties is a much more important factor for elaborating breakthrough

14th Annual Conference of European Academy of Management, Valencia, Spain 24
concepts. Compared with the design teams that make either no links between their properties
(random exploration approach) or only backward links with the first properties (primer concept
fixation approach), the design teams that follow an ecosystem approach focuses much more on
establishing links between their properties rather than generating properties individually.
Indeed, our results significantly show that the mean score of the ten teams increases with the link
density (r = .657, p < .05, n=10). The more a property is linked to other properties, the more it
increases the novelty score (r = .155; p=.000; n=821), the feasibility score (r=.089; p < .05;
n=822) and the value score (r = .155; p= .000; n=821) of the final concepts.
More precisely, our result shows that not all links are equal. Indeed, to generate properties by
building on prior unknown properties is particularly effective. In fact, the design teams who link
properties with prior unknown properties increase the novelty score (r=.212; p=.000; n=822), the
feasibility score (r=.092; p<.01; n=822) and the value score (r=.177; p=.000; n=822) of the final
concepts. Opposingly, one property that is built on known properties has a negative impact on the
novelty score of the final concept (r= -.084; p<.01; n=822) and no significant impact on the other
scores. We also notice that linking several successive unknown properties may provoke some
confusion in the design teams. Indeed, in such situation, the design teams may realize how much
their creativity challenges their common frame of reference as illustrated by team #2:
− [designer 1] : We can imagine that… − [designer 2] : ooh… wait a moment. Finally, I am not sure we are still designing a
museum. The word “museum” is confusing. For me, this is no more a museum. − [designer 3] : yeah, I agree. We should stop using the word “museum”, let’s name it the
“storm-arium”
Analyzing the results of the extreme design teams, we found that the less innovative teams are
often stuck by known design properties. Although the highly innovative teams also generated
known properties, they did not use them for generating unknown properties, and this is supported
in the analysis of the number of times that design properties are cited and mobilized during the
sessions. Although the frequency of discussion around the design properties is quite similar (609
citations for the high-innovative and 624 citations for the low-innovative), the highly innovative
teams tend to focus their attention much more on the unknown properties than the less innovative
teams. On average, the citation of unknown properties represents 71.26 % for highly innovative
teams and 59.45% for less innovative teams (χ2 < .001). According to our observations, the highly

14th Annual Conference of European Academy of Management, Valencia, Spain 25
innovative design teams used known design properties mostly for sharing the main issues of the
topic. Metaphorically speaking, the known properties enabled them only to agree about “what is
the box to think outside”. Thus, the design teams were then more able to monitor whether their
thinking was breakthrough or not. However, more research is required to validate this hypothesis.
Another result concerns between whom the links are established. We found that when designers
“built on each other”, it had a positive impact on the mean score of the final concepts (r = .073; p
< .05; n =822). Contrarily, when designers built upon their own ideas, it was negatively
correlated to the mean score of the final concepts (r = -.076; p < .05; n =822). This analysis is
qualitatively confirmed by counting the talk turnovers in the design teams. The highly innovative
teams involve the participation of the three designers whereas the discussions in the less
innovative teams are often monopolized by one designer.
mean score (rank)
total links1 link density2 known link density3
unknown link
density4
mixed link
density5 self-link
index6
team #1 2.74 (10) 113 1.73 .76 1.35 .68 .59 team #2 3.46 (4) 99 1.44 .51 1.13 .57 .48 team #3 4.31 (1) 154 2.53 .52 2.41 .78 .29 team #4 3.18 (8) 60 1.04 .43 1.1 .19 .36 team #5 3.46 (3) 143 1.46 .25 1.36 .34 .37 team #6 3.72 (2) 226 1.8 .58 1.66 .54 n.d. team #7 3.38 (6) 163 1.85 .53 1.33 .82 .51 team #8 3.44 (5) 112 1.18 .66 .76 .46 .43 team #9 3.23 (7) 104 1.22 .15 1.1 .42 .45
team #10 2.79 (9) 105 1.24 .53 .98 .46 .38
1mean=127 S.D.=45.7
2mean=1.55 S.D.= .44
3mean= .49 S.D.=.18
4mean=1.31 ; S.D.= .45
5mean= .53 ; S.D.= .20
6mean= 0.39 S.D.= .09
Table 3. Linkography results
4.2.3. Economy of thought and inventive design thinking: evaluating the “fit” of properties
Our result also shows that the ecosystem approach used by the most innovative team (team #6
and team #3) enable them to economize mental resources. In fact, this team did not have to
produce a lot of design properties to be inventive. They proposed very few design properties
compared to other groups but they exploited them efficiently. Once a property was generated, this

14th Annual Conference of European Academy of Management, Valencia, Spain 26
team tried to directly make links with previous properties. This winning approach enabled them
to increase the degree of cohesiveness and limit the number of abandoned design properties.
As a consequence, we also observed that this approach had an impact on how the design team
evaluated the different design properties. Basically, once a design property was generated, we
observed two kinds of reactions in the other teams. A first common attitude was to evaluate each
design property individually. This evaluation was either made immediately after the generation of
each design property or at the end of the session. In general, design properties were evaluated
according to their novelty or feasibility aspects; quite frequently, participants disagreed and long
discussions are required to resolve the conflicts reach compromise. Team #3 and #5 evaluated
design properties in a radically different way. The design properties were not evaluated according
to their novelty or feasibility but rather, team members evaluated whether the design properties
“fit” each other. This team did not evaluate design properties in a linear way, but it rather
followed an evolutionary process where design properties appeared and disappeared according to
their fitness to the overall concept. They did not evaluate the properties at the end, nor did they
choose which were the best and worst properties to keep in the final concept. Rather, the
ecosystem of properties was designed is progressively by re-forming and modifying step-by-step
the generated design properties. The evaluation of the design properties were made in more
“natural” way in the sense that they did not necessarily choose the most original or feasible
properties. Instead, they evaluated whether each design property “fit” the overall ecosystem.
5. Conclusion, implications and further research
5.1. Synthesis and theoretical implications
The results presented in this article indicate that, behind the generic term of ideation process,
design teams can at least follow three different approaches when generating ideas: “primer
concept fixation”, “random exploration” and “ecosystem of properties”. According to our results,
the last approach is the most effective one to develop breakthrough concepts. The ecosystem
approach incorporates three main features. The design teams (1) generate both unknown and
known properties, not just a large number of unknown properties, (2) and single structure their
thinking by simultaneously generating and linking properties instead of generating disparate

14th Annual Conference of European Academy of Management, Valencia, Spain 27
properties, and (3) do not evaluate the properties individually toward the classic criteria
(feasibility, novelty, value…) but rather evaluate properties during the generation phase by
collectively discussing the “fit” between the properties.
At a theoretical level, our research invites us to reconsider the fuzzy front end that is discussed in
the current models for the development of breakthrough concepts by the generation of numerous
ideas in the hope of selecting the most satisfying ones. In comparison with this ideas generation-
selection model, our results suggest that the process of elaboration of breakthrough concepts is
better depicted by design models where the final concept is not viewed as a single unit but as an
aggregation of several properties. The identification of known and unknown properties shows
that breakthrough concepts do not involve one single break but they are the consequence of
several linked breaks.
Furthermore, an important contribution concerns the research methods. Although the existing
creativity and innovation litterature often argues that the specific cognitive processes involved in
creative thinking need to be investigated through the creative process itself rather than the
outcome, research protocols and process-based metrics are still missing. In this research, our
codification schemes (the unknown and known properties) and the different measurement indices
developed (number of properties, link density, self-index) now permit an improved apprehension
of the creative process.
5.2. Managerial implications
Regarding the managerial implications, one main question remains: if design teams follow the
three approaches, what can organizations do to push their design teams toward the best one (i.e.
the ecosystem approach)?
Some answers may be found regarding the role of facilitators and the appropriate organization of
such creative sessions. Existing literature usually recommends that managers follow the funnel
model which calls for the generation of a large and various set of ideas, and then, the evaluation
and selection of the best ones. In this perspective, research on organizational creativity often
recommends having two contrasted climates for the generation and the selection of ideas: an open
and safe environment where participants fell free to generate ideas as much as possible, and, a
more dissident atmosphere where each idea and opinion can be discussed and confronted

14th Annual Conference of European Academy of Management, Valencia, Spain 28
(Amabile et al. 1996). Contrary to that, our research proposes to combine the two activities
through a compositional design process where links between properties are reinforced. This
suggests that facilitators need to possess new skills and responsibilities. Rather than stimulating
and energizing people to produce a large quantity of various ideas, the facilitators should devote
more time to coordinate the ecosystems of properties. For instance, it may require a person to
help insure that participants produce an appropriate ratio of unknown and known properties (65%
according to our empirical result). In order to achieve such a ratio, even the least novel ideas (i.e.
the known properties) have to be shared and discussed. Furthermore, our results also confirm the
importance of people expanding on the ideas of others (Kohn et Smith 2011; Kohn, Paulus, et
Choi 2011). However, our research offers additional clarifications. For instance, the main reasons
for this primary reason of such is not to increase the number of ideas but it rather aims to
continuously discuss the possible links and compare the ideas as soon as they are generated.
Consequently, the facilitators may have the responsibility incite the confrontation of opposite
point of preventing opposing points-of-views until the right moment and managing creative. Note
that the necessity to encourage cognitive conflicts (Badke-Schaub, Goldschmidt, et Meijer 2010).
This contradicts contradict one of the most common brainstorming rules (“never criticize ideas”)
(Osborn 1953). A second clarification is that participants do not have to expand on all kinds of
ideas: the facilitators must be able to differentiate the known and the unknown ideas in order to
favor only the links between the unknown ones. Finally, rather than delaying the evaluation of
ideas at the end of the session, the facilitator must encourage participants to shape an ecosystem
of ideas by measuring the fit and the coherence between their ideas. This objective must be
clearly communicated to participants: the objective is no more to obtain a ranked list of many
ideas but it is to design well-articulated, linked networks of ideas.
5.3. Generalizability and further research
The findings are based on an experimental study of ten professional design teams committed to
one hour and thirty minutes of work. Although we collected more in comparison to other studies,
future research is encouraged to conduct experimentations in other contexts. For instance,
observing the process of elaboration of breakthrough concepts in even more naturalistic settings
and over the entire life of a project would allow researchers to better know if the three approaches
presented here differ and if the ecosystem approach is also the one that is the final concepts are

14th Annual Conference of European Academy of Management, Valencia, Spain 29
most efficiently integrated into an organization. Alternatively, conducting other laboratory
experiments could be helpful to better know how critical factors such as socialization aspects,
personality traits or techniques used impact the different approaches. Other research limitations
can also be identified. In our research, a preliminary briefing was given to the design teams.
However, the design of such briefings could be considered as a creative design process in itself.
We may thus hypothesize that such initial activities may influence the approaches that are
mobilized by the design teams afterwards. Regarding the methodology, our research protocol
enables us to quickly follow the design thinking but some additional coding could be relevant.
For instance, this research does not specifically examine major creative cognitive processes, such
as analogizing, in detail. Therefore, we notice that design teams use different kinds of heuristics
to generate unknown properties and to establish links. For instance, they often tend to “inverse”
or “virtualize” prior properties. Finally, our research emphasizes the importance of building
properties on the unknown properties of others. This result extends existing results found in
brainstorming literature (Bayus 2012; Kohn et Smith 2011; Osborn 1953). In this research, we
provide supplementary findings by showing that links between properties are not equal: if
building on unknown properties impacts the quality of the final concepts, the inverse is not true
Further but further theoretical research on the exchange process of concepts and knowledge are
required to better explain such results.
14th Annual Conference of European Academy of Management, Valencia, Spain 30
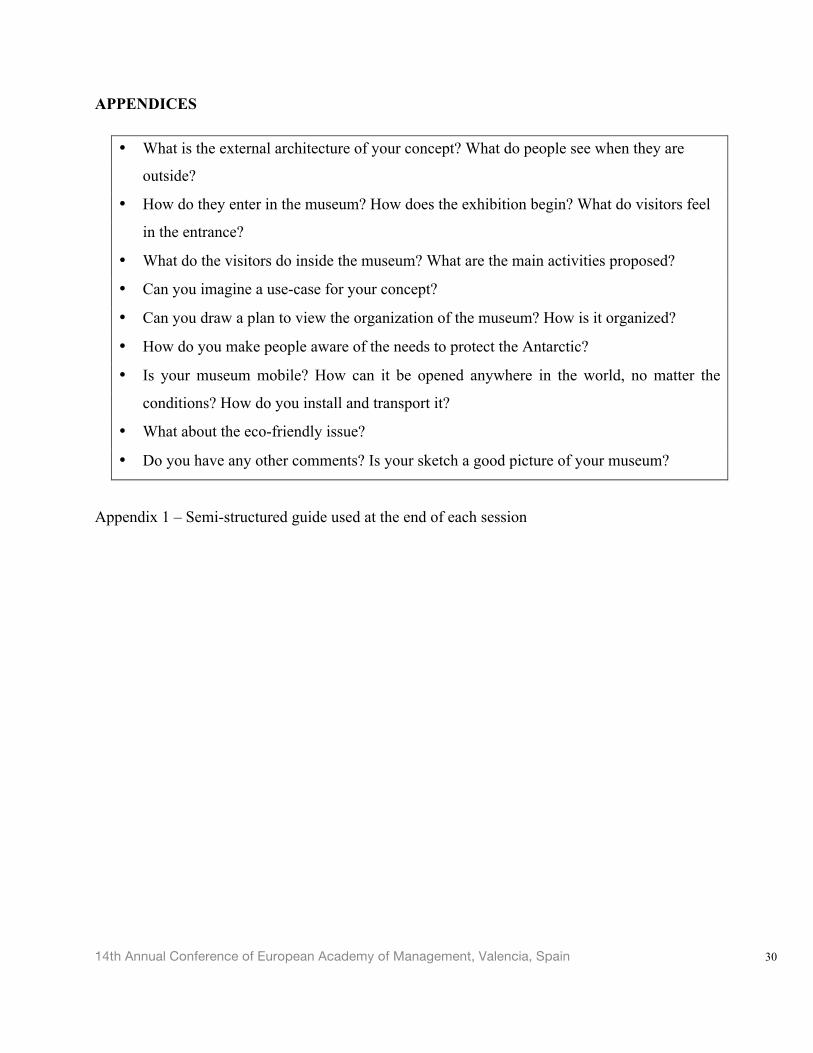
APPENDICES
• What is the external architecture of your concept? What do people see when they are
outside?
• How do they enter in the museum? How does the exhibition begin? What do visitors feel
in the entrance?
• What do the visitors do inside the museum? What are the main activities proposed?
• Can you imagine a use-case for your concept?
• Can you draw a plan to view the organization of the museum? How is it organized?
• How do you make people aware of the needs to protect the Antarctic?
• Is your museum mobile? How can it be opened anywhere in the world, no matter the
conditions? How do you install and transport it?
• What about the eco-friendly issue?
• Do you have any other comments? Is your sketch a good picture of your museum?
Appendix 1 – Semi-structured guide used at the end of each session

14th Annual Conference of European Academy of Management, Valencia, Spain 31
the organization of the museum (i.e. “how the museum concept works”)
MUSEUM WITH THEMATIC
ROOMS
DARK ROOM FOR MOVIES
AGORA
“a room where you can learn the history of Antarctica, another about animals and nature and another about scientific experimentations”
“museum with rooms that are sufficiently dark to watch movies correctly”
“Let’s have a main room where people can meet and chat each-other, a kind of Agora”
the nature of the exhibition (i.e. “what the museum concept does”)
MOVIES PROJECTION ON
WALL
ICE-FLOOR MOVING BY BOAT
“Imagine you walk in a corridor with projection of movies on the wall”
“Yes, I think that it could be nice to walk on a strange ground. It could be a slippery surface with ice”
“ What is really fun, it is that the visitors enter inside the museum with a boat like Conquistadors
the architecture of the museum (“how the museum concept is built”)
CIRCUS TENT TRANSLUCENT ROOF
ENERGY HARVESTING
“we can have canvas like in the circus”
« A roof where you can see outside, a translucent roof, for the lights…”
« We didn’t speak about the ground…we need to have something special. For instance, a ground that harvests the people energy when walking »
Appendix 2 – Examples of design properties and verbatim

14th Annual Conference of European Academy of Management, Valencia, Spain 32
Appendix 3 – A breakthrough final concept (left) and a less innovative final concept (right) – (illustration made by Etienne GIORGETTI)
Appendix 4 – overview of linkography diagrams

14th Annual Conference of European Academy of Management, Valencia, Spain 33
Appendix 5 – Average evolution of the design properties for the ten design teams
Ahuja, Gautam, et Curba Morris Lampert. 2001. « Entrepreneurship in the large corporation: A longitudinal study of how established firms create breakthrough inventions ». Strategic Management Journal, 22 (6-‐7): 521‑543.

14th Annual Conference of European Academy of Management, Valencia, Spain 34
Altshuller, G.S., L. Shulyak, et S. Rodman. 1999. The innovation algorithm: TRIZ, systematic innovation and technical creativity. Worcester, Mass.: Technical Innovation Center.
Amabile, Teresa M. 1996. Creativity and innovation in organizations. Harvard Business School.
Amabile, Teresa M., Regina Conti, Heather Coon, Jeffrey Lazenby, et Michael Herron. 1996. « Assessing the work environment for creativity ». Academy of management journal, 39 (5): 1154‑1184.
Ames, Michael, et Mark A. Runco. 2005. « Predicting entrepreneurship from ideation and divergent thinking ». Creativity and Innovation Management, 14 (3): 311‑315.
Assink, Marnix. 2006. « Inhibitors of disruptive innovation capability: a conceptual model ». European Journal of Innovation Management, 9 (2): 215‑233. doi:10.1108/14601060610663587.
Badke-Schaub, Petra, Gabriela Goldschmidt, et Martijn Meijer. 2010. « How Does Cognitive Conflict in Design Teams Support the Development of Creative Ideas? » Creativity and Innovation Management, 19 (2): 119‑133.
Bayus, B. L. 2012. « Crowdsourcing New Product Ideas over Time: An Analysis of the Dell IdeaStorm Community ». Management Science, 59 (1): 226‑244. doi:10.1287/mnsc.1120.1599.
Berchicci, Luca, et Christopher L. Tucci. 2010. « There Is More to Market Learning than Gathering Good Information: The Role of Shared Team Values in Radical Product Definition* ». Journal of Product Innovation Management, 27 (7): 972‑990. doi:10.1111/j.1540-5885.2010.00765.x.
Bilda, Zafer, et JohnS. Gero. 2008. « Idea Development Can Occur Using Imagery Only ». In Design Computing and Cognition ’08. John S. Gero et Ashok K. Goel (Eds), 303‑320.
Boden, M. 2003. The creative mind: Myths and mechanisms. Routledge.
Brown, T. 2008. « Design Thinking ». Harvard Business Review.
Chiu, I., et F.A. Salustri. 2012. « Understanding the Design Concept Identification Process ». Design Computing & Cognition. College Station, Texas.
Christensen, B.T., et C.D. Schunn. 2007. « The relationship of analogical distance to analogical function and preinventive structure: The case of engineering design ». Memory & Cognition, 35 (1): 29-38.
Christensen, C. M. 1997. The innovator’s dilemma: when new technologies cause great firms to fail. Harvard Business Press.
Coyne, Kevin P., Patricia Gorman Clifford, et Renée Dye. 2007. « Breakthrough Thinking from Inside the Box ». Harvard Business Review, 85 (12): 70‑78.
Dahl, Darren W. 2011. « Clarity in Defining Product Design: Inspiring Research Opportunities for the Design Process* ». Journal of Product Innovation Management, 28 (3): 425–427. doi:10.1111/j.1540-5885.2011.00816.x.
Dahl, Darren W., et Page Moreau. 2002. « The influence and value of analogical thinking during new product ideation ». Journal of Marketing Research, 39(1): 47‑60.
Danneels, E. 2002. « The dynamics of product innovation and firm competences ». Strategic Management Journal, 23:1095‑1121.
Davison, Graydon, et Deborah Blackman. 2005. « The role of mental models in innovative teams ». European journal of innovation management, 8 (4): 409‑423.

14th Annual Conference of European Academy of Management, Valencia, Spain 35
Diehl, Michael, et Wolfgang Stroebe. 1987. « Productivity loss in brainstorming groups: Toward the solution of a riddle ». Journal of personality and social psychology, 53 (3): 497‑509.
Dorst, K. 2006. « Design problems and design paradoxes ». Design issues, 22 (3): 4‑17.
Dunbar, K. 1995. « How scientists really reason: Scientific reasoning in real-world laboratories. » In R.J. Sternberg, and J. Davidson (Eds). Mechanisms of Insight. Cambridge MA: MIT Press
Dunbar, K., et I. Blanchette. 2001. « The “in vivo”/“in vitro” approach to cognition: the case of analogy ». Trends in Cognitive Sciences, 5 (8): 334‑339.
Elmquist, Maria, et Blanche Segrestin. 2009. « Sustainable development through innovative design: lessons from the KCP method experimented with an automotive firm ». International Journal of Automotive Technology and Management, 9 (2): 229‑244. doi:10.1504/IJATM.2009.026399.
Eppler, Martin J., Friederike Hoffmann, et Sabrina Bresciani. 2011. « New business models through collaborative idea generation ». International Journal of Innovation Management, 15 (06): 1323‑1341.
Ericsson, K., et H. Simon. 1985. Protocol analysis: Verbal reports as data. Cambridge, MA : MIT Press
Franke, Nikolaus, et Frank Piller. 2004. « Value Creation by Toolkits for User Innovation and Design: The Case of the Watch Market ». Journal of Product Innovation Management, 21 (6): 401‑415.
Gabrielsson, Jonas, et Diamanto Politis. 2012. « Work experience and the generation of new business ideas among entrepreneurs: An integrated learning framework ». International Journal of Entrepreneurial Behaviour & Research, 18 (1): 48‑74. doi:10.1108/13552551211201376.
Gallupe, R. B., A. R. Dennis, W. H. Cooper, J. S. Valacich, L. M. Bastianutti, et J. F. Nunamaker. 1992. « Electronic brainstorming and group size » Academy of Management Journal, 35 (2): 350‑369. doi:10.2307/256377.
Gillier, Thomas, Gerald Piat, Benoît Roussel, et Patrick Truchot. 2010. « Managing Innovation Fields in a Cross-Industry Exploratory Partnership with C-K Design Theory ». Journal of Product Innovation Management, 27 (6): 883‑896. doi:10.1111/j.1540-5885.2010.00758.x.
Goddard, J., T. Eccles, et J. Birkinshaw. 2012. « Uncommon Sense: How to Turn Distinctive Beliefs Into Action ». MIT Sloan Management Review, 53 (3): 33‑39.
Goldenberg, Jacob, Donald R. Lehmann, et David Mazursky. 2001. « The idea itself and the circumstances of its emergence as predictors of new product success ». Management Science, 47 (1): 69‑84.
Goldschmidt, Gabriela. 1995. « The designer as a team of one ». Design Studies, 16 (2): 189‑209.
Goldschmidt, Gabriela, et Maya Weil. 1998. « Contents and structure in design reasoning ». Design issues, 14 (3): 85‑100.
Green, Caroline, et Ken Gilhooly. 1996. « Protocol analysis: Practical implementation ». In .Handbook of qualitative research methods for psychology and the social sciences. Leicester: BPS Book, 55‑74.
Guilford, Joy Paul. 1956. « The structure of intellect. » Psychological Bulletin, 53 (4): 267.
Hargadon, Andrew B. 1999. « Group cognition and creativity in organizations ». Research on managing groups and teams, 2: 137‑155.
Hargadon, Andrew B., et Beth A. Bechky. 2006. « When collections of creatives become creative collectives: A field study of problem solving at work ». Organization Science, 17 (4): 484‑500.

14th Annual Conference of European Academy of Management, Valencia, Spain 36
Hatchuel, A., et B. Weil. 2003. « A new approach of innovative design: an introduction to C-K theory ». In International Conference on Engineering Design. Stockholm.
Hatchuel, A., et B. Weil. 2009. « C-K design theory: an advanced formulation ». Research in Engineering Design, 19 (4): 181‑192.
Hender, Jillian M, Douglas L Dean, Thomas L Rodgers, et Jr. Nunamaker. 2002. « An Examination of the Impact of Stimuli Type and GSS Structure on Creativity: Brainstorming Versus Non-Brainstorming Techniques in a GSS Environment ». Journal of Management Information Systems, 18 (4): 59–85.
Hoegl, Martin, et K. Praveen Parboteeah. 2007. « Creativity in innovative projects: How teamwork matters ». Journal of Engineering and Technology Management, 24 (1): 148‑166.
Ilevbare, Imoh M., David Probert, et Robert Phaal. 2013. « A review of TRIZ, and its benefits and challenges in practice ». Technovation, 33 (2–3): 30‑37. doi:10.1016/j.technovation.2012.11.003.
Im, Subin, Mitzi M. Montoya, et John P. Workman. 2013. « Antecedents and Consequences of Creativity in Product Innovation Teams ». Journal of Product Innovation Management, 30 (1): 170–185. doi:10.1111/j.1540-5885.2012.00887.x.
Jaaskelainen, Riitta. 2010. « Think-aloud protocol ». Handbook of Translation Studies. Amsterdam: John Benjamins Publishing: 371‑3.
Jassawalla, Avan R., et Hemant C. Sashittal. 2000. « Strategies of Effective New Product Team Leaders ». California Management Review, 42 (2) : 34‑51. doi:10.2307/41166031.
Kalogerakis, Katharina, Christian Lüthje, et Cornelius Herstatt. 2010. « Developing Innovations Based on Analogies: Experience from Design and Engineering Consultants ». Journal of Product Innovation Management, 27 (3): 418‑436. doi:10.1111/j.1540-5885.2010.00725.x.
Kan, Jeff WT, et John S. Gero. 2008. « Acquiring information from linkography in protocol studies of designing ». Design Studies, 29 (4): 315‑337.
Keller, R. T. 2001. « Cross-functional project groups in research and new product development: diversity, communications, job stress, and outcomes. » Academy of Management Journal, 44 (3): 547‑555. doi:10.2307/3069369.
Kelley, Thomas. 2007. The art of innovation: lessons in creativity from IDEO, America’s leading design firm. Random House Digital, Inc.
Khurana, A., et S.R. Rosenthal. 1998. « Towards Holistic “Front Ends” In New Product Development ». Journal of Product Innovation Management, 15 (1): 57‑74.
Kim, Namwoon, Subin Im, et Stanley F. Slater. 2013. « Impact of Knowledge Type and Strategic Orientation on New Product Creativity and Advantage in High-Technology Firms ». Journal of Product Innovation Management, 30 (1): 136‑153. doi:10.1111/j.1540-5885.2012.00992.x.
King, Nigel, et Neil Anderson. 1990. « Innovation in working groups ». In M. A. West et J. L. Farr (Eds). Innovation and creativity at work: Psychological and organizational strategies, 81‑100. Oxford, England: John Wiley & Sons
Kohn, Nicholas W., Paul B. Paulus, et YunHee Choi. 2011. « Building on the ideas of others: An examination of the idea combination process ». Journal of Experimental Social Psychology, 47 (3): 554‑561.
Kohn, Nicholas W., et Steven M. Smith. 2011. « Collaborative fixation: Effects of others’ ideas on brainstorming ». Applied Cognitive Psychology, 25 (3): 359‑371. doi:10.1002/acp.1699.

14th Annual Conference of European Academy of Management, Valencia, Spain 37
Leifer, Richard, Gina Colarelli O’Connor, Mark Rice, et Gina Colarelli O’Connoer. 2001. « Implementing Radical Innovation in Mature Firms: The Role of Hubs ». The Academy of Management Executive, 15 (3): 102‑113.
Lilien, Gary L., Pamela D. Morrison, Kathleen Searls, Mary Sonnack, et Eric von Hippel. 2002. « Performance Assessment of the Lead User Idea-Generation Process for New Product Development ». Management Science, 48 (8): 1042‑1059. doi:10.2307/822674.
Litchfield, Robert C. 2008. « Brainstorming reconsidered: A goal-based view ». Academy of Management Review, 33 (3): 649‑668.
Luchs, Michael, et K. Scott Swan. 2011. « Perspective: The Emergence of Product Design as a Field of Marketing Inquiry* ». Journal of Product Innovation Management, 28 (3): 327–345. doi:10.1111/j.1540-5885.2011.00801.x.
Magni, Massimo, Likoebe M. Maruping, Martin Hoegl, et Luigi Proserpio. 2013. « Managing the Unexpected Across Space: Improvisation, Dispersion, and Performance in NPD Teams ». Journal of Product Innovation Management, 30 (5):1009-1026. doi:10.1111/jpim.12043.
Magnusson, Peter R. 2009. « Exploring the Contributions of Involving Ordinary Users in Ideation of Technology-Based Services ». Journal of Product Innovation Management, 26 (5): 578‑593. doi:10.1111/j.1540-5885.2009.00684.x.
March, J.G. 1991. « Exploration and exploitation in organizational learning ». Organization Science, 2 (1): 71‑87.
March, James G. 2006. « Rationality, foolishness, and adaptive intelligence ». Strategic Management Journal, 27 (3): 201‑214.
Markides, Constantinos. 2006. « Disruptive Innovation: In Need of Better Theory* ». Journal of Product Innovation Management, 23 (1): 19–25. doi:10.1111/j.1540-5885.2005.00177.x.
Martin, Roger L. 2009. Design of business: Why design thinking is the next competitive advantage. Harvard Business Press.
Mascitelli, Ronald. 2000. « From Experience: Harnessing Tacit Knowledge to Achieve Breakthrough Innovation ». Journal of Product Innovation Management, 17 (3): 179–193. doi:10.1111/1540-5885.1730179.
McDermott, C, et G.C. O’Connor. 2002. « Managing radical innovation: an overview of emergent strategy issues ». Journal of Product Innovation Management, 19(6): 424‑438. doi:10.1016/S0737-6782(02)00174-1.
McDonough III, Edward F. 2000. « Investigation of Factors Contributing to the Success of Cross-‐Functional Teams ». Journal of product innovation management, 17 (3): 221‑235.
McFadzean, E. 1998. « The Creativity Continuum: Towards a Classification of Creative Problem SolvingTechniques ». Creativity and Innovation Management, 7 (3): 131‑139.
Mullen, Brian, Craig Johnson, et Eduardo Salas. 1991. « Productivity loss in brainstorming groups: A meta-analytic integration ». Basic and applied social psychology, 12 (1): 3‑23.
Nicholas, John, Ann Ledwith, et John Bessant. 2013. « Reframing the Search Space for Radical Innovation ». Research-Technology Management, 56 (2): 27‑35. doi:10.5437/08956308X5601098.
Nisbett, Richard E., et Timothy D. Wilson. 1977. « Telling more than we can know: Verbal reports on mental processes ». Psychological Review, 84 (3): 231‑259. doi:10.1037/0033-295X.84.3.231.
Osborn, Alex F. 1953. Applied Imagination: Principles and Procedures of Creative Thinking. New York: Scribner.

14th Annual Conference of European Academy of Management, Valencia, Spain 38
Page, Albert L., et Gary R. Schirr. 2008. « Growth and Development of a Body of Knowledge: 16 Years of New Product Development Research, 1989–2004* ». Journal of Product Innovation Management, 25 (3): 233–248. doi:10.1111/j.1540-5885.2008.00297.x.
Patanakul, Peerasit, Jiyao Chen, et Gary S. Lynn. 2012. « Autonomous Teams and New Product Development ». Journal of Product Innovation Management, 29 (5): 734–750. doi:10.1111/j.1540-5885.2012.00934.x.
Paulus, Paul B. 2013. « Interview: Paul Paulus on Group Creativity ». Creativity and Innovation Management, 22 (1): 96‑99. doi:10.1111/caim.12020.
Paulus, Paul B., et Bernard A. Nijstad. 2003. Group creativity: Innovation through collaboration. Oxford University Press, USA.
Perry, Gabriela Trindade, et Klaus Krippendorff. 2013. « On the reliability of identifying design moves in protocol analysis ». Design Studies, 34 (5):612-635.
Poetz, M. K., et M. Schreier. 2012. « The value of crowdsourcing: can users really compete with professionals in generating new product ideas? » Journal of Product Innovation Management, 29 (2): 245‑256.
Reid, S.E., et U. de Brentani. 2004. « The Fuzzy Front End of New Product Development for Discontinuous Innovations: A Theoretical Model ». Journal of Product Innovation Management, 21: 170‑184.
Rietzschel, Eric F., Bernard A. Nijstad, et Wolfgang Stroebe. 2007. « Relative accessibility of domain knowledge and creativity: The effects of knowledge activation on the quantity and originality of generated ideas ». Journal of Experimental Social Psychology, 43 (6): 933‑946. doi:10.1016/j.jesp.2006.10.014.
Ruiz, Dirk, Dipak Jain, et Kent Grayson. 2012. « Subproblem Decomposition: An Exploratory Research Method for Effective Incremental New Product Development ». Journal of Product Innovation Management, 29 (3): 385–404.
Rust, Roland T., et Bruce Cooil. 1994. « Reliability measures for qualitative data: Theory and implications ». Journal of Marketing Research, 31 (1): 1‑14.
Sarin, Shikhar, et Christopher McDermott. 2003. « The Effect of Team Leader Characteristics on Learning, Knowledge Application, and Performance of Cross-Functional New Product Development Teams ». Decision Sciences, 34 (4): 707–739. doi:10.1111/j.1540-5414.2003.02350.x.
Sawyer, K. 2008. Group genius: The creative power of collaboration. Basic Books (AZ).
Sawyer, R. Keith, et Stacy DeZutter. 2009. « Distributed creativity: How collective creations emerge from collaboration. » Psychology of Aesthetics, Creativity, and the Arts, 3 (2): 81.
Schirr, Gary R. 2012. « Flawed Tools: The Efficacy of Group Research Methods to Generate Customer Ideas ». Journal of Product Innovation Management, 29 (3): 473‑488. doi:10.1111/j.1540-5885.2012.00918.x.
Seidel, V. 2007. « Concept Shifting and the Radical Product Development Process ». The Journal of Product Innovation Management, 24 (6): 522-533.
Seidel, Victor, et Sebastian Fixson. 2013. « Adopting “design thinking” in novice multidisciplinary teams: The application and limits of design methods and reflexive practices ». Journal of Product Innovation Management, 30 (1): 19-33.
Simon, H. 1969. The Sciences of the Artificial. Cambridge, Massachusetts: The MIT Press.
Spanjol, Jelena, William J. Qualls, et José Antonio Rosa. 2011. « How Many and What Kind? The Role of Strategic Orientation in New Product Ideation* ». Journal of Product Innovation Management, 28 (2): 236–250. doi:10.1111/j.1540-5885.2010.00794.x.
14th Annual Conference of European Academy of Management, Valencia, Spain 39
Steinert, Martin. 2009. « A dissensus based online Delphi approach: An explorative research tool ». Technological Forecasting and Social Change, 76 (3): 291‑300. doi:10.1016/j.techfore.2008.10.006.
Stringer, R. 2000. « How to manage radical innovation ». California management review, 42 (4): 70-88
Sutton, R.I., et A. Hargadon. 1996. « Brainstorming Groups in Context: Effectiveness in a Product Design Firm ». Admmistrative Science Quarterly, 41: 685‑718.
Taylor, Donald W., Paul C. Berry, et Clifford H. Block. 1958. « Does group participation when using brainstorming facilitate or inhibit creative thinking? » Administrative Science Quarterly, 3 (1) : 23‑47.
Thamhain, Hans J. 2003. « Managing Innovative R&D Teams ». R&D Management, 33 (3): 297–311.
Urban, Glen I., et Eric Von Hippel. 1988. « Lead user analyses for the development of new industrial products. » Management Science, 34 (5): 569‑582.
Van Der Lugt, Remko. 2002. « Brainsketching and How It Differs from Brainstorming ». Creativity and Innovation Management, 11 (1): 43–54. doi:10.1111/1467-8691.00235.
Verganti, Roberto. 2009. Design driven innovation: changing the rules of competition by radically innovating what things mean. Harvard Business Press.
West, Michael A. 1990. « The social psychology of innovation in groups ». In M. A. West et J. L. Farr (Eds). Innovation and creativity at work: Psychological and organizational strategies. 309‑333. Oxford, England: John Wiley & Sons.
Williams, Scott David. 2004. « Personality, attitude, and leader influences on divergent thinking and creativity in organizations ». European Journal of Innovation Management, 7 (3): 187‑204. doi:10.1108/14601060410549883.
Yang, Maria C. 2009. « Observations on concept generation and sketching in engineering design ». Research in Engineering Design, 20 (1): 1‑11.
Ziamou, Paschalina (Lilia), Stephen Gould, et Alladi Venkatesh. 2012. « “Am I Getting It or Not?” The Practices Involved in “Trying to Consume” a New Technology ». Journal of Product Innovation Management, 29 (2): 216–228. doi:10.1111/j.1540-5885.2011.00891.x.
i This project is supported by MINATEC IDEAs Laboratory®, a French cross-industry innovation partnership.