Green Food Packaging As Breakthrough To Replace Styrofoam
88
Green Food Packaging As Breakthrough To Replace Styrofoam A Paper For Chemical Product Design Competition 2014 Proposed by: Fahima Honesty Indria Nisa Meyda Astria Radhianisa Igatama Viky Muruatut UNIVERSITAS INDONESIA
Transcript of Green Food Packaging As Breakthrough To Replace Styrofoam

Green Food Packaging As Breakthrough
To Replace Styrofoam
A Paper For
Chemical Product Design Competition 2014
Proposed by:
Fahima
Honesty Indria Nisa
Meyda Astria
Radhianisa Igatama
Viky Muruatut
UNIVERSITAS INDONESIA

ii Universitas Indonesia
COCOFOAM:
Green Food Packaging As Breakthrough
To Replace Styrofoam
A Paper For
Chemical Product Design Competition 2014
Proposed by:
Fahima
Honesty Indria Nisa
Meyda Astria
Radhianisa Igatama
Viky Muruatut
UNIVERSITAS INDONESIA

iii Universitas Indonesia
SUMMARY
In this dynamic era, people tend to have interest in something practical since time
is considered as the precious one. This fact also reflects in food consumption.
They want to carry on their food in the package that is normally made of
styrofoam. It is one kind of polystyrene with the following thermal properties:
high thermal, light, and easy to be manufactured. Nevertheless, it has negative
impact either for environment or the consumer. Styrene is raw material for
styrofoam which is carcinogenic agent for human being, can’t be biodegraded,
and unrenewable petroleum derived compound. Therefore, Styrofoam has to be
replaced by the material that is eco-friendly and safe for human. We propose a
breakthrough as the solution to solve this problem: Cocofoam. It uses coconut
fiber as raw material because of the high availability of coconut in Indonesia.
According to Asia Pacific Coconut Community, Indonesia has big potential as it
has big area of coconut planting,on 2010 it has 3.8 million ha as the coconut
planting area. Further, based on Badan Pusat Statistik, Indonesia has 3.29 million
coconut trees available to be produced. Coconut fiber can produce strong, durable,
and thermostable food package. The manufacturing process is initiated by
washing the fiber to remove wax. Then it is immersed in NaOH solution 20% for
1 hour to remove lignin and hemicellulose. Next step is performing chemical
treatment using acetic anhydride for 3 hours to strengthen bond between the fiber
and its matrix. After that, the fiber is manufactured as composite using acrylic
thermoplastic resin as the matrix. Last step is composite moulding using
aluminium mould by heating process. This product will be distributed to food
industry in Java and Bali areas.
Keyword : Coconut fiber, Styrofoam, Food Packaging

iv Universitas Indonesia
TABLE OF CONTENT
COVER ............................................................................................................................... i
SUMMARY ...................................................................................................................... iii
TABLE OF CONTENT ................................................................................................... iv
LIST OF FIGURE .......................................................................................................... vii
LIST OF TABLE ........................................................................................................... viii
CHAPTER I INTRODUCTION ..................................................................................... 1
1.1 Background ............................................................................................................... 1
1.1.1 Problem Identification..................................................................................... 1
1.1.2 Problem Boundaries ........................................................................................ 2
1.2 Needs Identification ................................................................................................. 2
1.2.1 List of Needs ................................................................................................... 2
1.2.2 Benchmarking ................................................................................................. 3
1.3 Concept Selection .................................................................................................... 4
CHAPTER II LITERATURE REVIEW ........................................................................ 6
2.1 Overview of Food Industry and Food Packaging ..................................................... 6
2.2 Type of Food Packaging ........................................................................................... 7
2.3 Styrofoam (Polystyrene) ........................................................................................... 7
2.3.1 Definition of Styfrofoam .................................................................................... 7
2.3.2 Bad Impact of Styrofoam (Polystyrene) ............................................................ 8
2.4 Coconut Fiber Availability and Potency ................................................................... 9
2.5 Overview of Coconut Fibers ................................................................................... 11
2.5.1 Coconut Fibers content .................................................................................... 11
2.5.2 Advantages of Coconut Fibers ......................................................................... 11
2.5.3 Properties of coconut fibers that can be used as food packaging ..................... 11
2.6 Composite ............................................................................................................... 12
CHAPTER III PROTOTYPE........................................................................................ 14
3.1 Product Description ............................................................................................... 14
3.1.1 Characteristic and Spesification of the Product .............................................. 14
3.1.2 Product Positioning ........................................................................................ 15
CHAPTER IV PRODUCT MANUFACTURING AND SUPPLY CHAIN ............... 18
4.1 Market Segmentation ............................................................................................. 18
4.2 Production Capacity ............................................................................................... 19

v Universitas Indonesia
4.3 Manufacturing Process ........................................................................................... 20
4.3.1 Block Flow Diagram ....................................................................................... 20
4.3.2 Detailed Process Explanation .......................................................................... 22
4.3.3 Equipment Profile ........................................................................................... 22
4.3.4 Scheduling ....................................................................................................... 23
4.4 Mass and Energy Balance ...................................................................................... 24
4.4.1 Mass Balance .................................................................................................. 24
4.4.2 Energy Balance ............................................................................................... 24
4.5 Plant Location and Layout ..................................................................................... 25
4.5.1 Plant Location ................................................................................................. 25
4.5.2 Plant Layout .................................................................................................... 26
4.6 Raw Materials Supply ............................................................................................ 28
PT.ZeltsAishwaryaMulia, Jakarta ............................................................................. 28
4.7 Product Distribution ............................................................................................... 29
4.7.1 Location of Product Distribution Based On Plant Location ........................... 29
4.7.2 Product Distribution Chain ............................................................................. 30
4.7.3 Distribution Route ........................................................................................... 30
CHAPTER V PRODUCT ECONOMICS .................................................................... 32
5.1 Capital Expenditure .............................................................................................. 32
5.1.1 Equipment Cost and Installation Cost ............................................................. 32
5.1.2 Market Research Cost .................................................................................... 34
5.1.3 Site Development and Building Cost ............................................................. 35
5.1.4 Installation Cost ............................................................................................. 35
5.1.5 Total Capital Investment ................................................................................ 36
5.2 Operational Expenditure ........................................................................................ 36
5.2.1 Raw Material Cost ......................................................................................... 36
5.2.2 Utility Cost ..................................................................................................... 37
5.2.3 Maintenance Cost ........................................................................................... 37
5.2.4 Labor Cost ..................................................................................................... 37
5.2.5 Patent Cost .................................................................................................... 38
5.2.6 Distribution Cost ........................................................................................... 38
5.2.7 Marketing Cost ............................................................................................... 39
5.2.8 General Expenses .......................................................................................... 39
5.2.9 Insurance and Factory Over Head (FOH) ..................................................... 40

vi Universitas Indonesia
5.2.10 Total Operational Cost .................................................................................. 40
5.3 Economic Analysis ................................................................................................ 41
5.3.1 Product Pricing ................................................................................................ 41
5.3.2 Investment ....................................................................................................... 41
5.3.3 Cash Flow ....................................................................................................... 42
5.3.4 Cost Breakdown .............................................................................................. 43
5.4 Profitability Analysis ............................................................................................. 43
5.4.1 Internal Rate of Return (IRR) ......................................................................... 43
5.4.2 Payback Period ................................................................................................ 44
5.4.3 Break Even Point (BEP) ................................................................................. 44
5.4.4 Net Present Value (NPV) ................................................................................ 45
5.5 Sensitivity Analysis ............................................................................................... 45
5.5.1 Influence of Raw Material Cost .................................................................... 46
5.5.2 Influence of Product Price ............................................................................. 46
CHAPTER VI CONCLUSION AND SUGGESTION................................................. 49
REFERENCE .................................................................................................................. 50
Appendix .......................................................................................................................... 52
Appendix A.1 ................................................................................................................ 52
Appendix A.2 ................................................................................................................ 54
Appendix A.3 ................................................................................................................ 57
Appendix A.4 ................................................................................................................ 58
Appendix A.5 ................................................................................................................ 63

vii Universitas Indonesia
LIST OF FIGURE
Figure 2.1 Coconut Planting Areas in Asia-Pacific Country (APCC, 2003) ................... 10
Figure 3.1 Product Positioning ......................................................................................... 15
Figure 3.2 Cocofoam’s Logo and Tagline ....................................................................... 16
Figure 3.3 Cocofoam’s Medium Size Blueprint .............................................................. 17
Figure 4.1 Block Flow Diagram of Cocofoam Production .............................................. 21
Figure 4.2 Satelite View of Factory Location .................................................................. 26
Figure 4.3 Map View of Factory Location ....................................................................... 26
Figure 4.4 Plant Layout .................................................................................................... 27
Figure 4.5 Product Distribution Chain ............................................................................. 30
Figure 4.6 Alternative Routes of Product Distribution .................................................... 30
Figure 4.7 Distribution Route .......................................................................................... 31
Figure 4.8 Distribution Process Through Land Route ..................................................... 31
Figure 4.9 Grinder ............................................................................................................ 58
Figure 4.10 Oven Drier .................................................................................................... 58
Figure 4.11 Hot Press Machine ........................................................................................ 59
Figure 4.12 Moulding Machine........................................................................................ 59
Figure 4.13 Mass balance Diagram of Cocofoam Production ......................................... 60
Figure 4.14 Energy balance Diagram of Cocofoam Production ...................................... 61
Figure 5.1After Tax Cashflow and Before Tax Cashflow ............................................... 42
Figure 5.2 Cumulative Cashflow ..................................................................................... 42
Figure 5.3 Cost Breakdown ............................................................................................. 43
Figure 5.4 Payback Period ............................................................................................... 44
Figure 5.5 Sensitivity Analysis Curve-IRR ..................................................................... 47
Figure 5.6 Sensitivity Analysis Curve-NPV .................................................................... 48
Figure 5.7 Sensitivity Analysis Curve-PBP ..................................................................... 48

viii Universitas Indonesia
LIST OF TABLE
Table 1.1 List of Needs and Rankings ............................................................................... 3
Table 1.2 List of Spesification ........................................................................................... 4
Table 1.3 Criteria in Food Packaging ................................................................................. 4
Table 1.4 Concept Screening ............................................................................................. 5
Table 1.5 Concept Scoring ................................................................................................. 5
Table 1.6 List of Needs and Rankings Based on Several Categories ............................... 52
Table 1.7 List of Metrics .................................................................................................. 52
Table 1.8 Benchmarking .................................................................................................. 53
Table 1.9 Concept Combination ....................................................................................... 53
Table 1.10 List of Concept ............................................................................................... 54
Table 2.1 Type of Some Food Packagings ....................................................................... 54
Table 3.1 Perceptual Mapping Detail Computation ......................................................... 57
Table 3.2 Dimension of Cocofoam’s Size ........................................................................ 57
Table 4.1 Calculation of Cocofoam Production Capacity ................................................ 20
Table 4.2 Production Time of Cocofoam Production ...................................................... 23
Table 4.3 Production Time of Cocofoam Production ...................................................... 24
Table 4.4 Scheduling of Cocofoam Production ............................................................... 24
Table 4.5 Mass balance of Cocofoam production ............................................................ 24
Table 4.6 Energy Balance balance of Cocofoam production ........................................... 25
Table 4.7 Alternatives of Raw Material Supplier ............................................................. 28
Table 4.8 Raw Material Supplier ..................................................................................... 28
Table 4.9 Region and Percentage of Distribution ............................................................ 29
Table 4.10 Retailer in Jabodetabek Region ...................................................................... 62
Table 4.11 Retailer in Java Region .................................................................................. 62
Table 4.12 Retailer in Bali Region ................................................................................... 63
Table 5.1 Main Equipment Cost....................................................................................... 33
Table 5.2 Market Research Cost ...................................................................................... 35
Table 5.3 Site Development and Building Cost ............................................................... 35
Table 5.4 Installation Cost ............................................................................................... 35
Table 5.5 Total Capital Investment .................................................................................. 36
Table 5.6 Raw Material Cost ............................................................................................ 36
Table 5.7 Utility Cost ....................................................................................................... 37
Table 5.8 Total Maintenance Cost ................................................................................... 37
Table 5.9 Total Patent Fee ................................................................................................ 38
Table 5.10 Total Distribution Cost ................................................................................... 39
Table 5.11 Total Marketing Cost ..................................................................................... 39
Table 5.12 General Expenses ........................................................................................... 40
Table 5.13 Insurance Cost ................................................................................................ 40
Table 5.14 Factory Over Head (FOH) Cost ..................................................................... 40
Table 5.15 Total Operational Cost ................................................................................... 41
Table 5.16 Break Even Point ............................................................................................ 45
Table 5.17 Influence of Raw Material Cost Towards IRR, NPV, and Payback Period ... 46
Table 5.18 Influence of Product Price Towards IRR, NPV, and Payback Period ............ 47

ix Universitas Indonesia
Table 5.19 Main Equipment Cost..................................................................................... 63
Table 5.20 Detail of Equipment Electricity Cost ............................................................. 64
Table 5.21 Maintenance Cost of Main Equipment ........................................................... 64
Table 5.22 Maintenance Cost of Supporting Equipment ................................................. 64
Table 5.23 Maintenance Cost of Buliding ........................................................................ 65
Table 5.24 Direct Labor Cost ........................................................................................... 66
Table 5.25 Indirect Labor Cost......................................................................................... 66
Table 5.26 Patent Fee ....................................................................................................... 67
Table 5.27 Copyright Fee ................................................................................................. 67
Table 5.28 Industry Design Fee ....................................................................................... 67
Table 5.29 Brand Fee ....................................................................................................... 68
Table 5.30 Distribution Cost From Factory to Distribution Center ................................. 68
Table 5.31 Distribution Cost From Distribution Center to Retailer (Jabodetabek Area) . 68
Table 5.32 Distribution Cost From Distribution Center to Retailer (Java Area) ............. 69
Table 5.33 Distribution Cost From Distribution Center to Retailer (Bali Area) .............. 69
Table 5.34 Marketing Cost in Printed Media ................................................................... 69
Table 5.35 Marketing Cost in Online Media .................................................................... 69
Table 5.36 Marketing Cost in Radio ................................................................................ 70
Table 5.37 Creating an Developing Website Cost ........................................................... 70
Table 5.38 Detail of Employee Insurance Cost ................................................................ 70
Table 5.39 Product Pricing ............................................................................................... 70
Table 5.40 Loan From Bank ............................................................................................ 71
Table 5.41 Loan From Investor ........................................................................................ 71
Table 5.42 Depreciation of Main Equipment ................................................................... 72
Table 5.43 Depreciation of Supporting Equipment .......................................................... 73
Table 5.44 Cashflow Calculation ..................................................................................... 77

1 Universitas Indonesia
CHAPTER I
INTRODUCTION
1.1 Background
In this dynamic era, people tend to have interest in something practical since
time is considered as the precious one. This fact also reflects in food consumption.
They want to carry on their food in the package that is normally made of
styrofoam. Styrofoam is one kind of polystyrene with the following thermal
properties: high thermal stability, light, and rather easy to be manufactured.
Nevertheless, it has negative impact either for environment or the consumers.
Styrene is raw material for styrofoam which is carcinogenic agent for human
being, can only be degradaded after hundred of years, and unrenewable petroleum
derived compound. Therefore, Styrofoam has to be replaced by the material that is
eco-friendly and safe for human.
Our team is designing a product that can replace styrofoam that is named
Cocofoam. The name is derived from two words namely Coconut which is the raw
material for these products, which can replace the styrofoam. Cocofoam uses a
composite principle by using resin to make coconut fibers can be molded into a
food packing form. It uses coconut fiber as raw material because of the high
availability of coconut fiber in Indonesia. According to Asia Pacific Coconut
Community, Indonesia has big potential as it has big area of coconut planting, on
2010 it has 3.8 million hectare as the coconut planting area. Based on Badan
Pusat Statistik, Indonesia has 3.29 million coconut trees available to be produced.
Coconut fiber can produce strong, durable, and thermostable food package.
1.1.1 Problem Identification
Identifications of problems from Cocofoam packaging are as follows:
1. Indonesia is a country which has many fast food consumers and therefore
uses a lot of food packaging.
2. The existing food packaging which is commonly used is made from
petroleum-based compound.
2
Universitas Indonesia
3. Most of existing food packaging when having contact with a high temperature
food is releasing carcinogenic compound which is very harmful to human body.
4. Some of existing food packaging has bad impact for environment because it
takes a very long time to be degradaded by the environment.
5. The existing packaging has many weakness such easy to spills over, easy to leak
and not practical.
1.1.2 Problem Boundaries
1. Cocofoam packaging can be used for the food with a temperature range of 0oC to
93oC.
2. Our company is small scale companies, with simple technology and utilization of
production capacity that is not too large.
3. Our consumers is small and medium scale of food industry's in Java and Bali
areas.
1.2 Needs Identification
For determining needs, first we spread questionnaire and form of interview to
people in which are potential users of food packaging. The most important thing to
determine needs is asking them about their complains of current food packaging they
used.
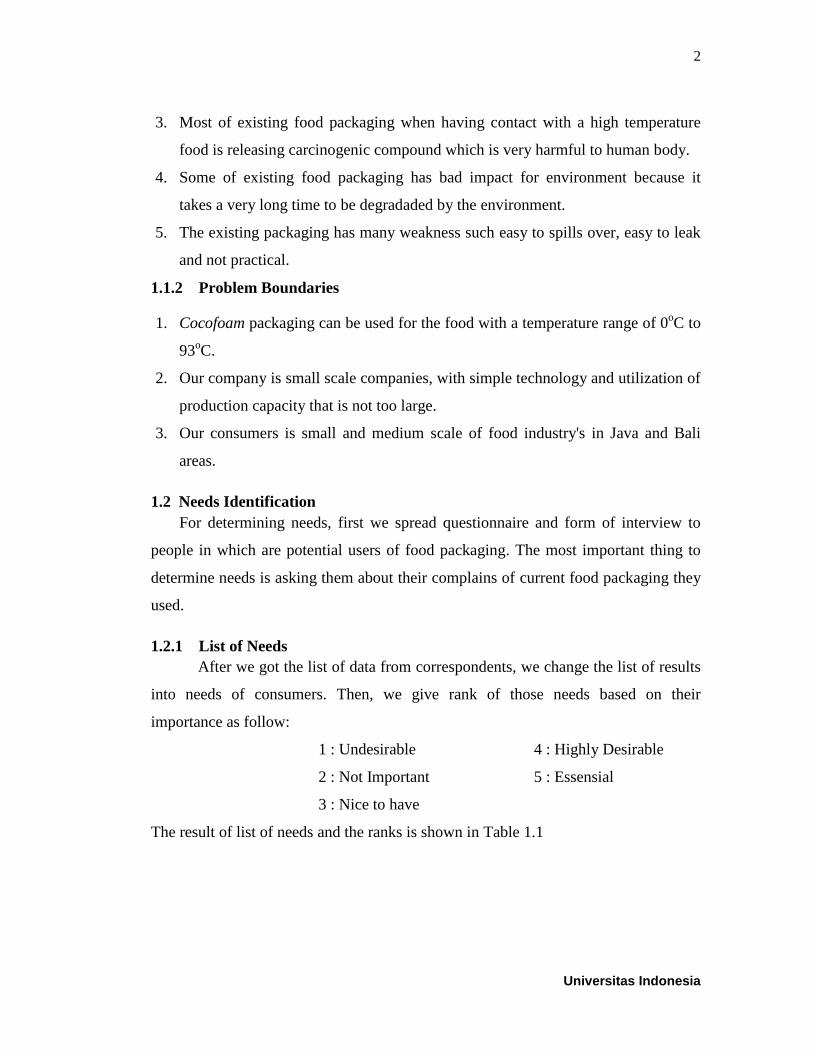
1.2.1 List of Needs
After we got the list of data from correspondents, we change the list of results
into needs of consumers. Then, we give rank of those needs based on their
importance as follow:
1 : Undesirable 4 : Highly Desirable
2 : Not Important 5 : Essensial
3 : Nice to have
The result of list of needs and the ranks is shown in Table 1.1

3
Universitas Indonesia
Table 1.1 List of Needs and Rankings
Needs
Number Needs Rank
Essential
6 Not dangerous for human body 5
Highly Desirable
7 Degrade Easily 4
2 Water Proof 4
4 Thermostable 4
Nice to Have
3 Affordable Price 3
1 Practical 3
Not Important
5 Has no odor 2
Undesireable
8 Attractive Form 1
9 Attractive Color 1
After we make list of needs and give rankings, the next step is arranging the
needs into several categories, as shown in Table 1.2
1.2.2 Benchmarking
To determine the spesification of our product, we need to make list of metrics
and then comparing our product with existing food packaging as our competitors. List
of metrics of our product is shown in Table 1.3
After making list of metrics, the next step is comparing our product with
existing product. Existing food packaging that we choose as our competitors are
styrofoam, plastic, paper, and paper box. We choose these product as our competitors
because these product this far is the most commonly used food packaging in
Indonesia. The benchmarking is shown in Table 1.4
After we do the bechmarking with existing food packaging, we make list of
list of spesification which contain spesification of our product and also marginal
value and ideal value of the metric unit. List of spesification is shown in Table 1.5
4
Universitas Indonesia
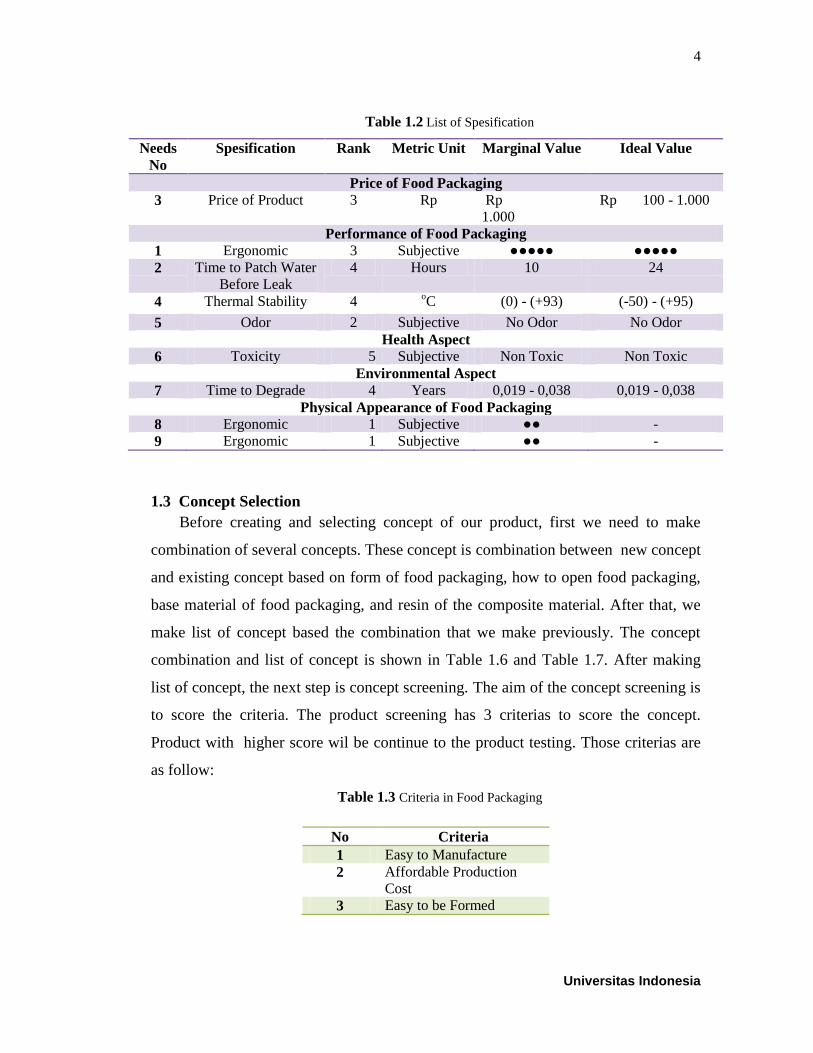
Table 1.2 List of Spesification
Needs
No
Spesification Rank Metric Unit Marginal Value Ideal Value
Price of Food Packaging
3 Price of Product 3 Rp Rp
1.000
Rp 100 - 1.000
Performance of Food Packaging
1 Ergonomic 3 Subjective ●●●●● ●●●●●
2 Time to Patch Water
Before Leak
4 Hours 10 24
4 Thermal Stability 4 oC (0) - (+93) (-50) - (+95)
5 Odor 2 Subjective No Odor No Odor
Health Aspect
6 Toxicity 5 Subjective Non Toxic Non Toxic
Environmental Aspect
7 Time to Degrade 4 Years 0,019 - 0,038 0,019 - 0,038
Physical Appearance of Food Packaging
8 Ergonomic 1 Subjective ●● -
9 Ergonomic 1 Subjective ●● -
1.3 Concept Selection
Before creating and selecting concept of our product, first we need to make
combination of several concepts. These concept is combination between new concept
and existing concept based on form of food packaging, how to open food packaging,
base material of food packaging, and resin of the composite material. After that, we
make list of concept based the combination that we make previously. The concept
combination and list of concept is shown in Table 1.6 and Table 1.7. After making
list of concept, the next step is concept screening. The aim of the concept screening is
to score the criteria. The product screening has 3 criterias to score the concept.
Product with higher score wil be continue to the product testing. Those criterias are
as follow:
Table 1.3 Criteria in Food Packaging
No Criteria
1 Easy to Manufacture
2 Affordable Production
Cost
3 Easy to be Formed

5
Universitas Indonesia
In concept screening, we give rate of each concept. The rate is explained as
follow:
Score minus (-) indicate that the new product has lower quality than
reference product
Score zero (0) indicate that the new product has same quality than
reference product
Score plus (+) show that the new product has better quality than reference
product
Then, the concept screening is shown in Table 1.9
Table 1.4 Concept Screening
Concept Number
Criteria 1 2 3 4 5 6 7 8 9 10 11 12
Easy to Manufacture - - + 0 0 0 + + + 0 + 0
Affordable Production
Cost
- - + 0 0 0 + - - 0 - -
Easy to be Formed - - - - - - 0 0 0 0 + 0
Total -3 -3 1 -1 -1 -1 2 0 0 0 1 -1
Result No No Yes No No No Yes No No Reference Yes No
The result of concept screening shows that concept number 3, 7, and 11 can
continue to the next step which is concept screening. In concept scoring, each of
selection criteria will be given a weight factor based on priority of the criteria. The
concept that will be chosen in this concept scoring is the concept that has the highest
score. Concept scoring is shown in Table 1.10
Table 1.5 Concept Scoring
Criteria Weight Concept Number
3 7 11
Easy to Manufacture 25% 3 0,75 3 0,75 3 0,75
Affordable Production
Cost
40% 4 1,6 4 1,6 4 1,6
Easy to be Formed 25% 2 0,5 5 1,25 3 0,75
Practical 10% 2 0,2 3 0,3 3 0,3
Total 100% 3,05 3,9 3,4
Result Not Chosen Chosen Not Chosen
So based on concept scoring, the selected concept for our product is concept
number 7. So based on this, the concept of food packaging that we make is in form of
cubic which is clamshell type, made from coconut husk as base material and resin
used is Ethyl Vinyl Acetate (EVA).

6 Universitas Indonesia
CHAPTER II
LITERATURE REVIEW
2.1 Overview of Food Industry and Food Packaging
Packaging is a means of providing the correct environmental conditions for food
during the length of time it is stored and/or distributed to the consumer. A good
package has to perform the following functions:
1. It must keep the product clean and provide a barrier against dirt and other
contaminants.
2. It should prevent losses. Its design should provide protection and convenience in
handling, during transport, distribution and marketing. In particular, the size,
shape and weight of the packages must be considered.
3. It must provide protection to the food against physical and chemical damage (eg
water and water vapour, oxidation, light) and insects and rodents.
4. It must provide identification and instruction so that the food is used correctly
and have sales appeal.
In Indonesia, food industry is one of the most important industries which need
packaging to protect and serve their food to their customer. It has the expenditure
50.66% compared with non-food industry. We can divide to two types of food
industries; there are fast food industry and processed food. Five biggest fast food
restaurants are McDonald’s with 142 outlets, KFC (Kentucky Fried Chicken) with
457 outlets, Dunkin Donut with more than 200 outlets, Pizza Hut with more than 200
outlets, and Hoka Hoka Bento with 141 outlets. They use various types of packaging
such as paper, wood fiber, and plastic. As example is McDonald’s, it uses plastic
material called Clarified Polypropylene (CPP) for McCafe beverage cups, and wood
fibre for sandwich. Meanwhile for KFC is using paper for its packaging. In 2012,
Greenpeace organization accused KFC using paper packaging made using wood from
Indonesian rainforests which it said was endangering the habitat of the Sumatran
Tiger. Greenpeace said that it has examined for paper packaging KFC by testing
glass, cardboard, french fries package and tissue.

7
Universitas Indonesia
For processed food, the main player is UKM (Unit Kecil Menengah) and
they use styrofoam as their packaging. It is because by using the material like
wood fiber is too expensive for them. However styrofoam is dangerous for human
body because it contains styrene that is processed by using benzene. Benzene can
generate problem in thyroid gland, disturb the neuron system that can cause
fatigue, accelerated heartbeat, insomnia, tremble body, and become easily
agitated. In Indonesia, the utilization of styrofoamis 884 million per day. So it is
an important issue to make a packaging with the low cost and also not give a bad
impact to the health.
2.2 Type of Food Packaging
Generally, the packaging material may either be rigid or flexible. Rigid
containers include glass and plastic bottles and jars, cans, pottery, wood boxes,
drums, tins, plastic pots and tubes. They give physical protection to the food
inside that is not provided by flexible packaging. Flexible packaging is a major
group of materials that includes plastic films, papers, foil, some types of vegetable
fibers and cloths that can be used to make wrappings, sacks and sealed or
unsealed bags. Food industries have to decide which packaging material will be
more appropriate for their food product taking note of the advantages and
disadvantages of their choice or perhaps what other attributes can be incorporated
in the packaging material based on the end use properties of the food product.
Type of some food packaging is shown in Table 2.1
2.3 Styrofoam (Polystyrene)
2.3.1 Definition of Styfrofoam
Styrofoam is actually a brand name for the material, polystyrene (PS).
The single-molecule form of polystyrene is known as styrene. PS foam, the type
used in food packaging for products like take-away containers, supermarket meat
trays, etc., is created by injecting the plastic polymer, polystyrene, with a gas-such
as HCFC 22, CFC 11, or CFC 12 (all ozone destroying chlorofluorocarbons), or
pentane-to expand it into that puffy material. Toxic and hazardous chemicals,
including styrene, benzene and ethylene, are used to make PS foam and are a
byproduct of PS foam production.

8
Universitas Indonesia
We use Styrofoam on a daily basis, in particular, the disposable food
packaging used for take-aways. It is so commonly used that people assume it
should be safe, especially since there are hardly any news in the media relating to
the harms of Styrofoam. However, no news does not always mean good news.
Studies have been done worldwide and countless reports have been published on
the negative impacts of this material, both on the environment and on health. Most
Singaporeans are not fully aware of this issue and do not know the seriousness of
it. We feel it is about time to create some awareness and for the people to make
their own informed choice. Or better yet, to completely ban this silent killer.
2.3.2 Bad Impact of Styrofoam (Polystyrene)
The main impact of styrofoam are from Benzene and Polystyrene, the big
effect of thestyrofoam are human health and enviroment. It will be explained
below about the bad impact of styrofoam;
a. Human Health Impacts of Polystyrene
There are potential health impacts from polystyrene foam food packaging
associatied with its production, and with the leaching of some of its chemical
components into food and drink. The general public is not typically warned of
these public hazards. Styrene, a component of polystyrene, is a known
hazardous subtance that mediacal evidence and the US Food and Drug
Administration suggests leaches from polystyrene containers into food and
drink. Polystyrene food containers leach styrene when they come into contact
with warm food or drink, and acidic foods causing human contamination and
posing a direct health risk to people. It is for the reasons that is not
recomemended that plastic take – out containers ever be heated in a
microwave. Styrene is a suspected carcinogen and neurotoxin which
potentially threatens human health. Several adverse health effect have been
attributted to styrene. Some studies have concluded that at expose levels
above 100 parts per million, human experience acute mucous membrane
irritation with the eyes, nose, and throat particularly affected. Increased levels
of styrene concentration may cause fatique, irritation, and decrease in
concentration ability. Styrene has been linked to increased levels of

9
Universitas Indonesia
chromosomal damage, abnormal pulmonary function and cancer in workers at
polystyrene and styrene plants.
Another known toxin, Benzene, is a chemical component of polystyrene
foam. It is a known carcinogen and enters the human body either though the
skin or respiratory sistem.
b. Environmental Impacts of Polystyrene
Polystyrene foam is designed for a useful life of minutes or hours, but it
continues to exist in our enviroment for hundreds or thousands of year. Non-
biodegradable food service ware, especially polystyrene foam, constitutes a
large portion of litter in Hong Kong, and the cost of managing this litter is
high and rising. Like any another disposable product or packing material, the
proliferated used of polystyrene foam containers will add to the burden on
disposal and the landfills.
Polystyrene foam present unique management issues because of its
lightweight nature, floatability, and prevalence to be be blown from disposal
sites even when disposed of properly. The lightweight and buoyant
polystyrene travels easily through gutters and storm drains, eventually
reaching the ocean. Pollution of waterways and waterfront negatively affects
to tourism and quality of life. When polystyrene travel down waterways and
storm drains into the ocean, it breaks down into smaller, non-biodegradable
pieces that are ingested marine life and other wildlife thus harming or killing
them.
Although polystyrene manufactures claim that their products are “ozone-
friendly” or free of CFC’s, this is only partially true. Most polystyrene is now
manufactured with HCFC-22, which, though less sestructive than its chemical
cousins, CFC-11 and CFC-12, is still a greenhouse gas and harmful to ozone
layer.
2.4 Coconut Fiber Availability and Potency
Indonesia has the widest planting area of coconut compared by other country
(APCC, 2005). However, coconut production per year is still low. The production
of coconut in Indonesia reaches about 15.5 billion per year while the total of by-
product is accumulated by 3.75 million tons coconut water, 0.75 million tons shell

10
Universitas Indonesia
charcoal, 1.8 billion tons coconut fiber, and 3.3 million tons coir dust (Mahmud,
Zainal and Yulius Ferry, DepartemenPertanian, 2005). Normally, some industries
still focus on coconut meat to be processed whereas the by-products only become
waste. Actually, there are a lot of business opportunities that can be developed by
processing the by-products.
One of by-product being potential is coconut fiber. The fiber is produced
about 35% from one coconut. Fiber is normally utilized as raw material for car
seat, bed, pillow, hardboard, and car dashboard, and any composite material.
Besides, it is also processed to obtain coco peat as planting media for horticultural
plant and is used as heavy metal pollutant adsorbent. The properties of fiber that is
thermostable, strong, and able to neutralize soil acidity make it suitable to be
processed to obtain the product mentioned earlier. Nevertheless, Indonesia only
export 191 tons of coconut husk containing fiber on 2003. This amount is really
low since we actually can augment the production regarding to wide planting area
in this country.
Inspired by that facts above, we propose a new innovation about utilizing
coconut fiber to be eco-friendly polymer for food packaging. We are strongly sure
to choose coconut fiber since its availability is high and coconut fiber utilizing is
only a few. In addition, enormous amount of non-degradable packaging waste
which has become serious problem encourage us to invent high feasibility eco-
friendly packaging. Figure 2.1 shows coconut planting areas in Asia-Pacific
Country.
Figure 2.1 Coconut Planting Areas in Asia-Pacific Country (APCC, 2003)
11
Universitas Indonesia
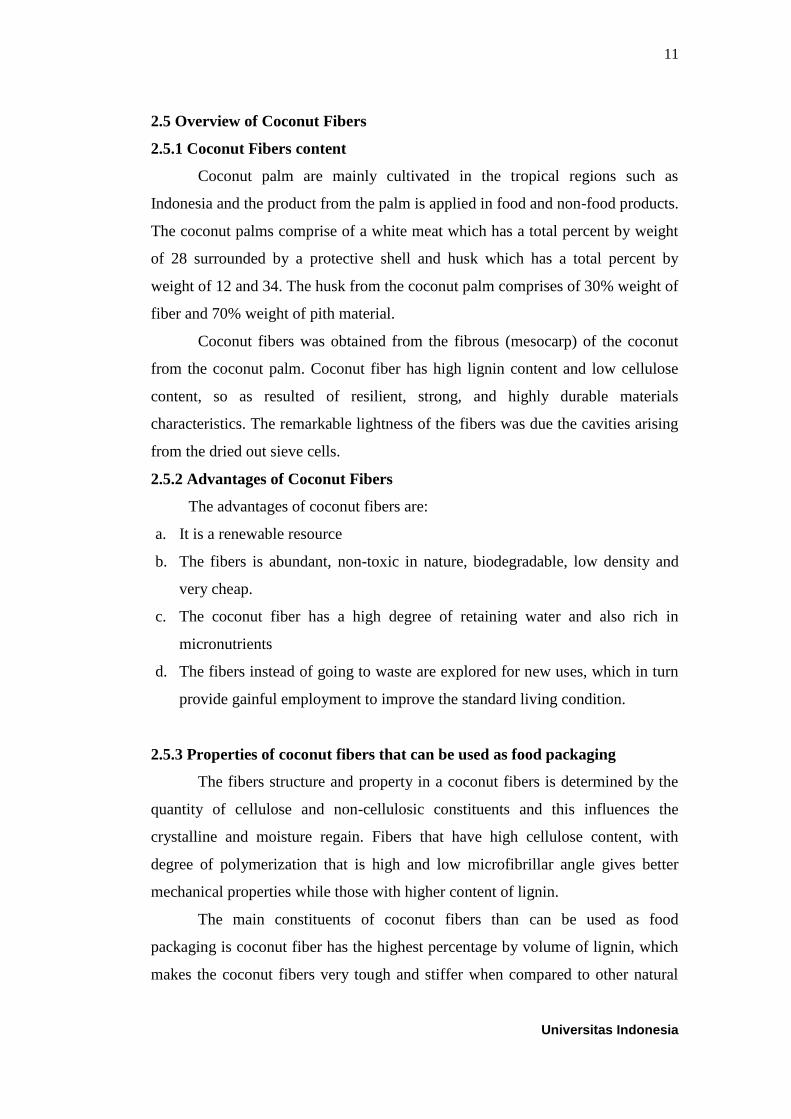
2.5 Overview of Coconut Fibers
2.5.1 Coconut Fibers content
Coconut palm are mainly cultivated in the tropical regions such as
Indonesia and the product from the palm is applied in food and non-food products.
The coconut palms comprise of a white meat which has a total percent by weight
of 28 surrounded by a protective shell and husk which has a total percent by
weight of 12 and 34. The husk from the coconut palm comprises of 30% weight of
fiber and 70% weight of pith material.
Coconut fibers was obtained from the fibrous (mesocarp) of the coconut
from the coconut palm. Coconut fiber has high lignin content and low cellulose
content, so as resulted of resilient, strong, and highly durable materials
characteristics. The remarkable lightness of the fibers was due the cavities arising
from the dried out sieve cells.
2.5.2 Advantages of Coconut Fibers
The advantages of coconut fibers are:
a. It is a renewable resource
b. The fibers is abundant, non-toxic in nature, biodegradable, low density and
very cheap.
c. The coconut fiber has a high degree of retaining water and also rich in
micronutrients
d. The fibers instead of going to waste are explored for new uses, which in turn
provide gainful employment to improve the standard living condition.
2.5.3 Properties of coconut fibers that can be used as food packaging
The fibers structure and property in a coconut fibers is determined by the
quantity of cellulose and non-cellulosic constituents and this influences the
crystalline and moisture regain. Fibers that have high cellulose content, with
degree of polymerization that is high and low microfibrillar angle gives better
mechanical properties while those with higher content of lignin.
The main constituents of coconut fibers than can be used as food
packaging is coconut fiber has the highest percentage by volume of lignin, which
makes the coconut fibers very tough and stiffer when compared to other natural

12
Universitas Indonesia
fiber. This can be attributed to the fact that the lignin helps provide plant tissue
and the individual cells with compressive strength and also stiffens the cell wall of
the fiber where it protect the carbohydrate from chemical and physical damage.
The lignin of the coconut fibers is practically multicellular naturally and
its diameter and length range from different dimensions and its usually very thick
at the middle of the fiber length. Furthermore, the lignin content also influences
the structure such as properties, flexibility, hydrolysis rate and with high lignin
content it appear to be finer and also more flexible. From the above explanation, it
can conclude that coconut fibers can be used as food packaging.
2.6 Composite
Composite is a blend of two or more materials with different phase into a new
material that has a physical or mechanical properties which are better than both
(Zulfia, 2010). Composites consist of reinforcment and filler (matrix). Generally
reinforcement is the form of fiber, metal, or fiber. The reinforcement has less
elastic properties but harder and more powerful. Meanwhile, the filler has the
function of binding fibers into one unified structure, protects the fiber from
damage and environmental effects and affect the appearance of a composite
material. Usually the material that used as a filler is metal, ceramics, and
polymers. If the resin is used it will less hard
From fiber and resin will be generated composite materials with the physical
and mechanical properties that are different from their constituent. Composite
materials have many advantages, including lighter weight, strength and higher
strength, corrosion resistant and has a lower assembly costs due to the reduced
number of components and connecting bolts.
Now, in general,man-made composites can be divided into three main groups:
1. Polymer Matrix Composites (Polymer Matrix Composites - PMC)
This material is a composite material that is often used , called, as (FRP -
Fibre Reinforced Polymers or Plastics) - these materials use a polymer-based
resin as the matrice, and some types of fiber such as glass, carbon and aramid
(Kevlar) as the reinforcement.
2. Metal Matrix Composites (Metal Matrix Composites - MMC)

13
Universitas Indonesia
MMC evolves in automotive industry, these materials use a metal such as
aluminum as matrices and reinforcements with fibers such as silicon carbide.
3. Ceramic Matrix Composites (Ceramic Matrix Composites - CMC)
CMC is used in very high temperature environments, these materials use a
ceramic as the matrix and reinforced with short fibers, or fibers (whiskers)
which are made of silicon carbide or boron nitride
Currently, various types of natural fibers has been investigated for use in
composites, such as straw, wood, coconut husk, rice husk, wheat fiber, sugar,
bamboo, grass, sisal, raffia, banana fiber, pineapple leaf fiber, papyrus, corn, etc. .
Some herbs have properties such as thermoplastic that can be used as a substitute
for thermoplastics. Natural fibers are a renewable source, has a lower price, it is
not harmful to health, and is the solution of the problem of environmental
pollution because it can be produced from the recycled waste material.

14 Universitas Indonesia
CHAPTER III
PROTOTYPE
3.1 Product Description
3.1.1 Characteristic and Spesification of the Product
Our product has added value as it is biodegradable since it comes from
natural raw material and experiences manufacturing process turning it into
unhazardous material. We consider “biodegradable” as our main parameter in
facing world problem related to environment. Therefore, our product has to
represent our ideas as a solution to one of the problem.
The product will be a package which is a container box that will be used as
food packaging. In order to make it easy to open and close, there is hasp to keep
the box close, this type of food packaging usually called clamshell. Besides, it is
also waterproof and practical that it will be really portable one. The materials
contained in every single box are mixture of coconut husk and resin ethyl vinyl
acetate (EVA)
The manufacturing process itself contributes to properties of our product.
Mostly made from coconut husk, our product has added value that make it capable
to compete in the market. It is thermostable as it is really important since we live
in the world that force us to be practical and in hurry. Moreover, it is easy to be
degraded thus we believe our product will reduce the problem of waste and it will
be first step that we especially environmental department do not need to think
about the enormous amount of waste that exists every single time.
The color of our product is brown. We prefer to keep the original color of
coconut husk in order to show the people the originality of our product. Therefore,
the customers will believe that our product comes from nature, synergize with the
nature, and will be back to the nature. The shape itself is a box which is preferred
by our respondent filling our questionnaire and it is considered as the suitable
shape since rectangle makes us easier in organizing some items of food in the
container.

15
Universitas Indonesia
3.1.2 Product Positioning
Figure 3.1 Product Positioning
We use perceptual mapping to know the advantages of our product
compared to others. As we know, in Indonesia, the similar products that usually
used in the market are styrofoam, plastic, paper box, and paper. As the
comparison, there are five product functions which we have gotten by identifying
the main customers need, those are; ease of degradation, price, practical, water
proof, thermostable, and level of danger.
The perceptual mapping shows that our product has the excellence in the
case of water proof, thermostable, practical, level of danger, and ease of
degradation. Meanwhile in terms of price, our product has the lowest score
compare to others, but consumers nowadays are smart when choosing product.
They don’t mind with the price of the product as long as the quality is appropriate.
Based on that, we believe that the consumer will buy our product because it is
practical and concern of healthy and environment. Table 3.1 shows detail
computation of perceptual mapping.
00.20.40.60.8
11.21.4
Price
Practical
Water Proof
Thermostable
Level of
Danger
Ease of
degradation Cocofoam
Styrofoam
Plastic
Paper
Paper Box

16
Universitas Indonesia
3.2 Product’s Brand, Logo, and Motto
Our society tends to be interested and eager to try new product when a
new type of product is launched. One parameter that gives significant impact is
brand. Brand has a role as icon to attract customers along market competition. A
product with an attractive selling namehas a great opportunity to get the attention
of costumers and compete in the market.Brand which has a unique side, different
from others, but exclusive, will be easily remembered by customers and will build
the image of the product. Figure 3.2 shows Cocofoam’s logo and tagline
Figure 3.2 Cocofoam’s Logo and Tagline
We create brand called “cocofoam” in order to emphasize that our product
comes from part of coconut. In addition, “cocofoam” is a name that simply
represent the product and direct the customer into an imagination that coconut is
our raw material. The use of English was done to anticipate when these products
are marketed abroad or exported. In addition, Indonesian people are more
interested in a foreign language because it seems more interesting and qualified.
We choose green as dominant color in the logo to show that this product is
biodegradable. We believe that the logo perfectly demonstrates the synergy
between our product and environment. The recycle replacing “o” letter illustrated
are the way we show and later prove that our product is recyclable. It is important
since our main goal is to make the better condition on the earth by generating
ideas and turning it into the product as the “representative” of our ideas.
Our tagline represents our action to love the earth by creating eco-friendly
product and proposing an action to love the body by using unhazardous raw
material that is save for our healthy. Besides, the tagline is really simple that it
will be memorized easily. We think that this tagline will make the product more
attractive since the point that people concern is that what happens through their
body. It will make the customers wonder about what this product can do related to
our healthy. Through this product, we will prove the world that we can utilize one

17
Universitas Indonesia
of asset that is highly available in Indonesia to make a change for environment in
order to give contribution for better earth.
3.3 Product’s Blueprint
As we have mentioned in advance, Cocofoam is container box that will fit
for the food. This shape is chosen since it is preferred by our respondents filling
the questionnaire. Besides, this shape is considered as the suitable one related to
its easiness in organizing food. We vary the size of Cocofoam to suit it towards
the portion of the food served hence the customers can choose the size which fits
with the food that they want to serve.
Cocofoam will be wrapped by plastic in order to organize them in carton
box. One carton box consists of six packs. One pack comprises of twenty pieces
of Cocofoam. All of them will be distributed to some regions with the logo
attached in each carton box. Table 3.2 shows dimension of three size types of
Cocofoam. Figure 3.3 below shows Cocofoam’s blueprint which is in medium
size
Figure 3.3 Cocofoam’s Medium Size Blueprint
18 Universitas Indonesia
CHAPTER IV
PRODUCT MANUFACTURING AND SUPPLY CHAIN
4.1 Market Segmentation
The market segmentation is marketing strategy that involves dividing a broad
target market into subsets of consumer who have common need, grouping market
in segments potential consumer with same characteristic, designing and
implementing strategies to target their needs and desires using media channel and
best allow to reach them. The criteria for segmentation are :
1. It is possible to measure
2. It must be large enough to earn profit
3. It must be stable
The main important from the segmentation market our fabric is more focused
to sources allocation and it is basis to determine strategy all of component statistic
and value. The segmentation have market target to give basic for positioning and
market segmentation is the key factor for survive with other products.
We classify our consumers in terms of geographic, demographic,
psychographic, and behavior. Those fundamental elements are considered to give
the significant impact for our product.
a. Geographic segmentation
In geographic segmentation, consumer market is divided based on the
location, address, or in this case is the city. Our product will first be sold in
some of big cities in Bali and Java. The location selection is based on the
percentage of population, sum of population in Bali and Java is 50% of
Indonesian population. Furthermore, in MP3EI (Masterplan Percepatandan
Perluasan Pembangunan Ekonomi Indonesia) Java Island has the role of the
drivers of national industry and service and one of the main activities is in the

19
Universitas Indonesia
food industry. Beside, Bali is located near Java so that the distribution cost can
be minimized. After that, we will distribute our product to the other island in
Indonesia.
b. Demographic segmentation
In this segmentation we divide the market as end costumer and non-end
customer. We will use mass production in our production system so that our
focus is in the non-end consumer that involved a company level until retailer
level, from traditional market into the multinational company.
c. Psychographic segmentation
Market segmentation in terms of psychographic classifies the market based on
the costumer characteristic. Our product is classified as the product that aware
in the environmental issue. Many companies and retailers recently concern
about the health and environment of their product so that we believe it will
help to increase our selling.
d. Behavior segmentation
This segmentation classifies the costumer based on the knowledge and the
reaction of the product. The segmentation that based on the knowledge hopes
that the user can understand clearly the function of our product so that their
attitude and reaction to the product will be better. Moreover, in Indonesia
itself, many companies and retailers give a positive reaction for green product.
4.2 Production Capacity
The objective of our product is to replace Styrofoam, so to determine the
production capacity of Cocofoam we only use data of styrofoam usage in
Indonesia per day. In one day, Indonesian people use 29.5 million Styrofoam
(kompas.com). Based on our market target, Cocofoam will be distributed to only
in Java and Bali region. The population in Java and Bali region is 57% of total
Indonesia population. So based on this data, the styrofoam usage in Java and Bali
region would be 14.7 million per day.
After getting data of styrofoam usage, we can determine the production
capacity of Cocofoam. Based on styrofoam usage, production capacity of
Cocofoam which want to be created in 2015 is only 0,5% from total usage of
styrofoam. We decided to do so because Cocofoam is a new product that has to

20
Universitas Indonesia
compete with existing product (styrofoam) and also we want to see consumer’s
response towards Cocofoam. The calculation of Cocofoam production capacity is
shown in Table 4.1 below:
Table 4.1 Calculation of Cocofoam Production Capacity
Styrofoam usage 14.700.000 packages per day
4.851.000.000 packages per year
Working Time 330 days per year
11 hours per day
Production Capacity
(0,5 % of styrofoam usage)
242.550.000 packages per year
Production Capacity per day 735.000 packages per day
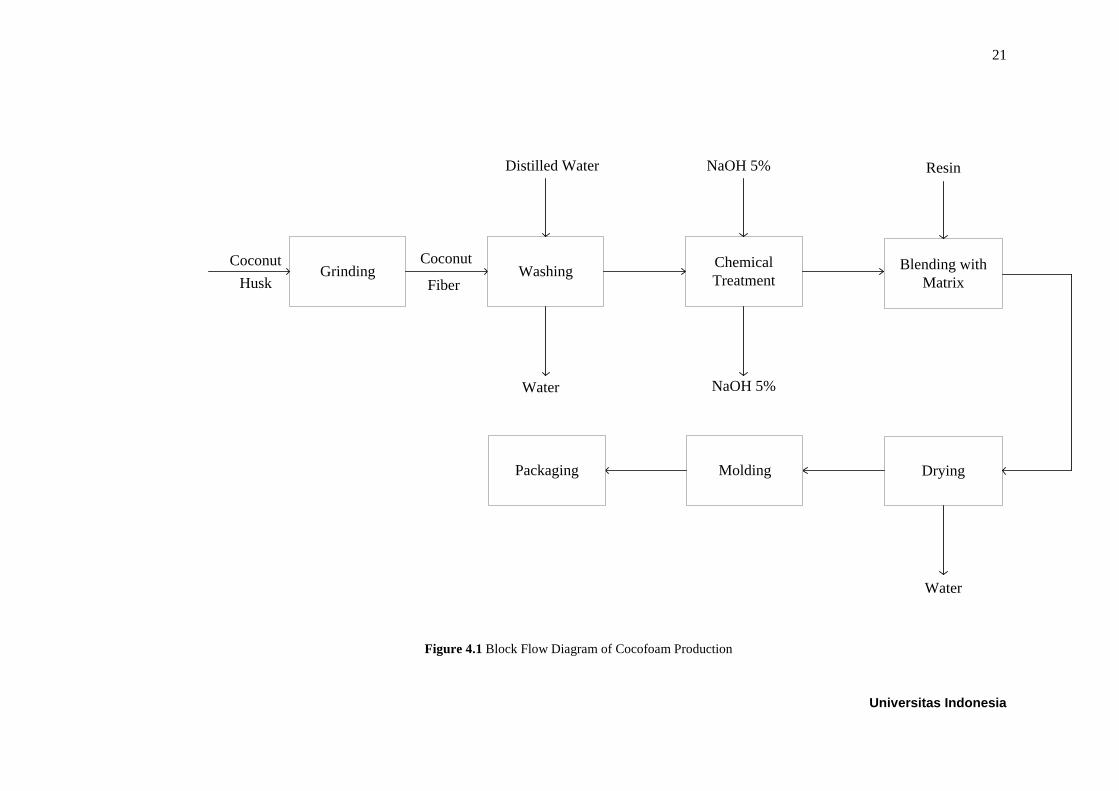
4.3 Manufacturing Process
The main production process to make Cocofoam includes seven main stages
which are drying of coconut husk, extraction of coconut husk, washing of coconut
husk, chemical treatment, blending with matrix, molding, and packaging.
4.3.1 Block Flow Diagram
The block flow diagram of Cocofoam production is shown in Figure 4.1
21
Universitas Indonesia
Grinding WashingCoconut
Fiber
Water
Distilled Water
Chemical
Treatment
NaOH 5%
NaOH 5%
Blending with
Matrix
Resin
Drying
Water
MoldingPackaging
Coconut
Husk
Figure 4.1 Block Flow Diagram of Cocofoam Production

22
Universitas Indonesia
4.3.2 Detailed Process Explanation
The first step in making Cocofoam is to grind the coconut husk. Coconut
husk is part of coconut fruit which contain fiber. Coconut husk is grinded to
obtain coconut fiber. After being grinded, coconut fiber will become softer and
fiber-like appearance. The next step is soaking coconut fiber in water for 1 day.
For 1 kg of coconut fiber, it needs 5 L of water. This steps aims to remove outer
most wax layer of the coconut fibre, to ensure the proper interaction between fibre
and matrix material.
The next step is chemical treatment of coconut fiber. This step aims to
remove lignin, hemicellulose, silica and pith from the fibre to have better
impregnation between fibre and matrix and also to improve fibre surface
roughness. This step is done by soaking coconut fibre in 5 % aqueous solution of
NaOH for 2 days. For 1 kg of coconut fiber, it needs 2 L of NaOH.
After soaked in NaoH solution, coconut fiber is mixed with matrix or
binder. This step matrix is done to make the sheet of coconut fibre which is ready
to be mold in the next step. The first step is preparing the resin. Resin which used
is Ethylene Vinyl-Acetate (EVA). The composites composed of the coconut fibres
and resin were mixed for 30 minutes and being dried for 30 minutes using oven
with temperature 70 ºC before the sampled were prepared with a hot press. The
mixture of cocout fibre with resin is done by weight ratio 80:20.
The next step to make Cocofoam is molding of coconut fiber sheet. The
coconut fibre sheet is placed between two moulds then the sheet is pressed and
heated. This process takes 3 minutes. After that, Cocofoam can be taken out of the
mould. The last step is packaging of Cocofoam before distributed to consumers.
For 1 kg of coconut fibre can produced 12 cocofoam.
4.3.3 Equipment Profile
a. Grinder
Grinder or extraction machine is used to separate coconut husk and make
it into coconut fiber. There is 1 grinder used in Cocofoam plant.

23
Universitas Indonesia
b. Oven Drier
Oven drier is used to dry coconut fiber sheet before mold in molding.
There are 7 units of oven drier used in Cocofoam plant.
c. Hot Press Machine
Hot pressed is used to make coconut fibre into sheets, before molded in
moulding. There is 1 unit of hot press machine used in Cocofoam plant.
d. Moulding Machine
Moulding is used to mold coconut fiber sheet into clamshell form (like
common stryrofoam form). There is 1 unit of molding machine used in
Cocofoam plant.
4.3.4 Scheduling
The determination of production time and production scheduling is very
important which will affect production capacity and also profit of this Cocofoam
plant. Cocofoam plant will operate starting from 7 a.m. until 6 p.m., 7 days a
week and 330 days a year. Table 4.2, Table 4.3 and Table 4.4 shows production
time and scheduling. Since the first two steps to make Cocofoam (washing and
chemical treatment) are process which needs more than one days in process, so
the production time and scheduling is made in different table with the rest of the
process (resin mixing, oven drying, and molding).
Table 4.2 Production Time of Cocofoam Production
Process Step
Number Minutes
Total
Minutes Number
of
Operators 30 60 90 120
Grinding 1
30 1
Resin Mixing 4
30 2
Oven Drying 5
30 2
Molding 6
30 2

24
Universitas Indonesia
Table 4.3 Production Time of Cocofoam Production
Process Step
Number Days
Total
Days Number
of
Operators 1 2 3
Washing 2
1 2
Chemical treatment 3
2 2
Table 4.4 Scheduling of Cocofoam Production
Process Work Hours Total
Work
Hours 7 8 9 10 11 12 1 2 3 4 5 6
Start-up
Equipment
3
Loading Raw
Material
3
Process Batch
6
Equipment
Washing
3
4.4 Mass and Energy Balance
4.4.1 Mass Balance
Mass balance of Cocofoam production is shown in Table 4.5 and Figure 4.6
Table 4.5 Mass balance of Cocofoam production
Process Input Output
Component Mass Component Mass
Grinding Coconut Husk (kg) 49001,6 Coconut Husk (kg) 49001,6
Washing Coconut Fiber (kg) 49001,6 Coconut Fiber (kg) 49001,6
Water (L) 245008 Water (L) 245008
Chemical Treatment Coconut Fiber (kg) 49001,6 Coconut Fiber (kg) 49001,6
NaOH (kg) 98003,2 NaOH (kg) 98003,2
Blending with Resin Coconut Fiber (kg) 49001,6 Coconut Fiber (kg) 61252
Resin (kg) 12250,4 Resin (kg) 0
Drying in Oven Coconut Fiber (kg) 61252 Coconut Fiber (kg) 61250
Water (L) 2
Molding Coconut Fiber (kg) 61250 Cocofoam (pieces) 735000
4.4.2 Energy Balance
Energy balance of Cocofoam production is shown in Table 4.6 and Figure 4.7

25
Universitas Indonesia
Table 4.6 Energy Balance balance of Cocofoam production
Process Equipment Equipment
Capacity
Production
per Day
(kg)
Number of
Equipment
Power per
Equipment
(kW)
Total
Power
(kW)
Grinding Grinder 15
tonne/hour
49001,6 1 45 45
Washing Storage Tank -
Chemical
Treatment
Storage Tank -
Blending with
Resin
Storage Tank -
Drying in Oven Oven Drier 800 kg/hour 61252 7 10 70
Hot Press Hot Press
Machine
12 sheets/kg 61252 1 20 20
Molding Molding
Machine
20000
pieces/hour
735000
pieces
4 20,2 80,8
As can be seen in Table above, washing process, chemical treatment
process, and blending with resin process do not use any energy, since these
process is done without using any elctricity. But for washing process, the needs of
water will be calculated in economic analysis.
4.5 Plant Location and Layout
4.5.1 Plant Location
We choose the location of Cocofoam factory is in Jabodetabek region. The
exact place of the factory is at Karangsari, East Cikarang, West Java, Indonesia.
The location is considered to become our factory place based on some reasons,
which are:
a. The selected location is still in Jabodetabek region, and it becomes the main
consideration. It becomes easy to sell our product in Jabodetabek market if we
put factory location also in Jabodetabek region. In Cikarang itself, there are
many target distributors of our food packingproduct, such as: traditional
market, modern market, and food packing retail .
b. Karangsari, East Cikarang is near of tol. It is reachable by using
any kind of road transportation, including freight car or truck. Not only close
to distributors, this factory location is also close to the raw material supplier.

26
Universitas Indonesia
These are the view of factory location based on satellite view (Figure 4.8) or
based on map view (Figure 4.9).
Figure 4.2 Satelite View of Factory Location
Figure 4.3 Map View of Factory Location
4.5.2 Plant Layout
Plant layout of Cocofoam plant is shown in Figure 4.10

27
Universitas Indonesia
Equipment Warehouse
Raw Material Warehouse
Chemical Warehouse
CanteenDrying process
Office
Toilet
Mo
squ
e
Product Warehouse
Molding Process
Blending Process With Resin
Chemical Treatment
Washing Process Grinding Process
Security
Parking Lot
Green Area
Ben
gkel
Per
alat
an
Gate
Gate
Figure 4.4 Plant Layout

28
Universitas Indonesia
4.6 Raw Materials Supply
The distribution process of raw material is one of important factor in
determining factory location.. The distribution of raw material is important thing
to do to keep the raw material flow going smoothly. If the raw material flow going
smoothly, the product flow to consumers will also going smoothly.
Table 4.7 Alternatives of Raw Material Supplier
N
o
Raw
Materia
ls
Feed
Stock
Per Day
1st Supplier 2
nd Supplier 3
rd Supplier
Company
Name Price
Company
Name Price Company Name Price
1. Coconut
Fiber
61250
kg/day
CV.
Alindo,
Bandung,
Jawa
Barat
Rp
2.500/
kg
CV.
MuaraSubu
r,
Surabaya,
JawaTimur
Rp
3.500
/kg
MansaputraGemilang,
Surabaya, JawaTimur
Rp
2.500,00 -
3.000,00
/kg
2. NaOH
5%
122500
Liter/day
PT.Anugr
ah Putra
Kencana,
Bekasi
Rp
65.000
/Liter
PT.
CiptaBang
un, Bogor
Rp.
64.50
0/Lite
r
CV. Harum Kimia,
Jakarta Pusat
Rp
67.000/Lit
er
3 Resin
Ethylen
e Vinyl
Acetate
15312.5
kg/day
CV. Yes
Karya,
Bekasi
Rp10.
500.00
0/
metric
ton
CV.
Libratama,
Semarang
Rp.
10.19
0.000
/metri
c ton
PT.ZeltsAishwarya
Mulia, Jakarta
Rp.
11.700.00
0/ metric
ton
Table 4.8 Raw Material Supplier
Raw Materials Feed
Stock
per Day
1st Alternative of
Supplier (Factory
Location is at
Cikarang)
Order
Frequency
(in a
week)
Price Units
Coconut Fiber 61250
kg/day
CV. Alindo, Bandung,
Jawa Barat
once Rp 2.500,00 Kg
NaOH 5% 122500
Liter/day
PT.Anugrah Putra
Kencana, Bekasi
once Rp 65.000,00 Liter
Water 306250
Liter/day
PDAM Cikarang once Rp. 8.517,00 m3
Resin Ethylene
Vinyl Acetate
15312.5
kg/day
CV. Yes Karya, Bekasi once Rp10.500.000,00 ton

29
Universitas Indonesia
4.7 Product Distribution
The next process after the product had been made and packaged is the
distribution of the product to consumer. “Cocofoam” which have been packed in
packaging box will be processed to the stage of distribution to consumers. We use
box truck to distribute food packing product. Besides that, the location of our
product is in Java and Bali. So we decide to distribute our product to distribution
center first and then pay some service to distribute our product to market or
retailer.
4.7.1 Location of Product Distribution Based On Plant Location
Location of product distribution is determined based on the target area of
marketing. We decide that this food packing product will be distributed to some
big cities in Java and Bali such as Jabodetabek, Bandung, Yogyakarta, Semarang,
Solo, Surabaya. This decision is taken based on the fact that Java and Bali are the
island with the highest fast food industry in Indonesia. Beside that, Java and Bali
is quite near to each other compared to another island in Indonesia.Our
consumer’s targets are small and medium scale of food industry's in Java and Bali
areas. Consumer segmentation is more in urban areas or big cities in Indonesia.
Table 4.9 until Table 4.11 shows about retailer and its location:
Table 4.9 Region and Percentage of Distribution
Region Percentage
Jabodetabek and West Java 40%
Bali 25%
East Java 20%
Central Java 15%
Total 100%

30
Universitas Indonesia
Cikarang Bandung Yogyakarta Surakarta Semarang Surabaya
4.7.2 Product Distribution Chain
The product that had been made will be saved in storage for distribution to
consumer.
Figure 4.5 Product Distribution Chain
Figure 4.6 Alternative Routes of Product Distribution
4.7.3 Distribution Route
There are some distribution center that we choose, which are Jakarta,
Bandung, Depok, Tangerang, Bekasi, Solo, Yogyakarta, Semarang, Surabaya.
From these distribution center, products will be distributed to the retailer and
retailer. The distribution rute is shown below
Product Distribution
Plant Location Cikarang
Raw Material Supplier Local
Distribution Route Land Route
Transportation Truck

31
Universitas Indonesia
Figure 4.7 Distribution Route
Figure 4.8 Distribution Process Through Land Route
For the distribution using land route, we decide to use the truck because
the effectiveness and the flexibility to location target. By using truck, Shavol will
be sent to distribution center. After that, the product from distribution senter will
be distributed to retailer.
Storage Distribution
(Box Truck) Store
Storage
Retailer Consumer

32 Universitas Indonesia
CHAPTER V
PRODUCT ECONOMICS
The calculation of product economics in this chapter is based on
these following assumptions:
The construction of Cocofoam plant will start in the end of 2014. It
will take about a year to build the plant, hence it will be operated by
the end of 2015.
Some equipments will have the salvage value in the end of its year
period
Currency of 1 US$ is equal to Rp 12.090,00 based on the data on
January 19th 2014
In order to determine the product selling price, we use these following
assumptions:
- The plant will be operated for 10 years. It is excluded the
construction time.
- A year consists of 330 working days.
The Declining Balance method (DB 200%) is used to calculate the
depretiation value of each equipment (non-building). Meanwhile, to
calculate the depretiation value of building, the linear depretiation
method is used (based on UU PPH).
5.1 Capital Expenditure
5.1.1 Equipment Cost and Installation Cost
a. Main Equipment Cost
Bare-module cost is the total cost of main equipment that
required for production process. It is the whole cost that calculated
from the purchasing process of the equipment until it is installed on
the plant and ready to be used, therefore it consists of Free On
Board purchase cost, shipping cost, and installation cost.
33
Universitas Indonesia
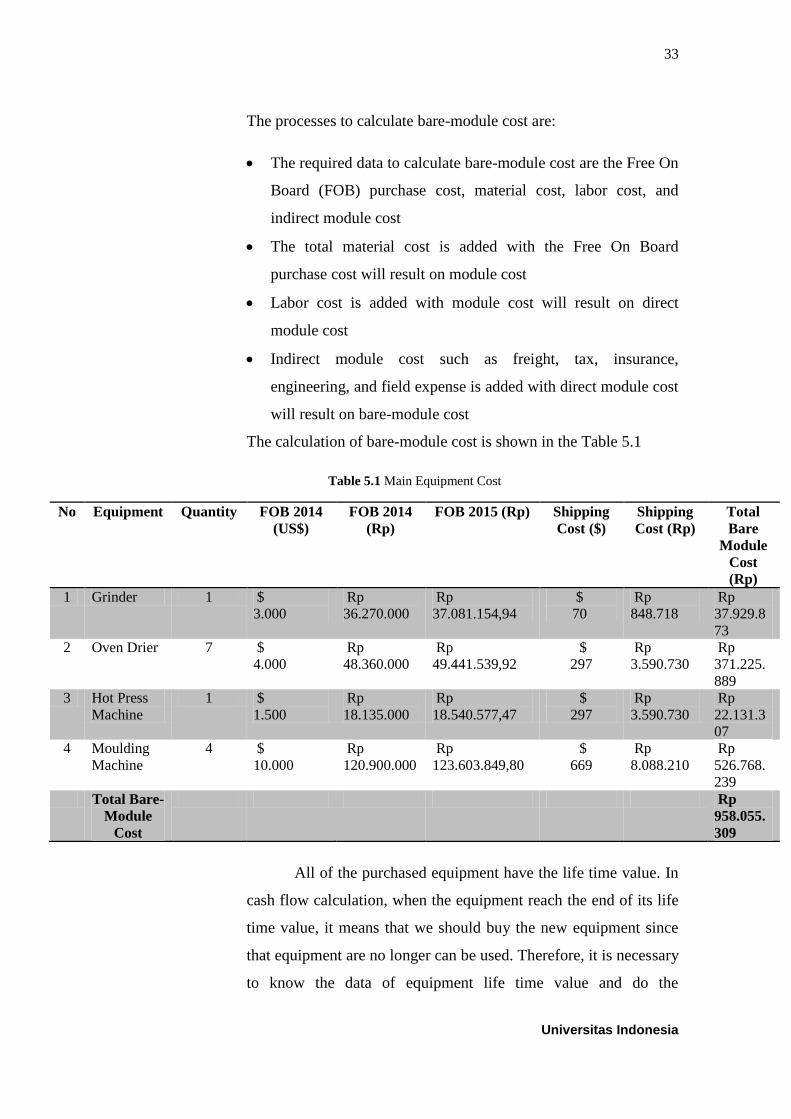
The processes to calculate bare-module cost are:
The required data to calculate bare-module cost are the Free On
Board (FOB) purchase cost, material cost, labor cost, and
indirect module cost
The total material cost is added with the Free On Board
purchase cost will result on module cost
Labor cost is added with module cost will result on direct
module cost
Indirect module cost such as freight, tax, insurance,
engineering, and field expense is added with direct module cost
will result on bare-module cost
The calculation of bare-module cost is shown in the Table 5.1
Table 5.1 Main Equipment Cost
No Equipment Quantity FOB 2014
(US$)
FOB 2014
(Rp)
FOB 2015 (Rp) Shipping
Cost ($)
Shipping
Cost (Rp)
Total
Bare
Module
Cost
(Rp)
1 Grinder 1 $
3.000
Rp
36.270.000
Rp
37.081.154,94
$
70
Rp
848.718
Rp
37.929.8
73
2 Oven Drier 7 $
4.000
Rp
48.360.000
Rp
49.441.539,92
$
297
Rp
3.590.730
Rp
371.225.
889
3 Hot Press
Machine
1 $
1.500
Rp
18.135.000
Rp
18.540.577,47
$
297
Rp
3.590.730
Rp
22.131.3
07
4 Moulding
Machine
4 $
10.000
Rp
120.900.000
Rp
123.603.849,80
$
669
Rp
8.088.210
Rp
526.768.
239
Total Bare-
Module
Cost
Rp
958.055.
309
All of the purchased equipment have the life time value. In
cash flow calculation, when the equipment reach the end of its life
time value, it means that we should buy the new equipment since
that equipment are no longer can be used. Therefore, it is necessary
to know the data of equipment life time value and do the

34
Universitas Indonesia
depreciation calculation by using that data. The purpose of this
calculation is to know how much the amount of the equipment
value depreciation that occur in their life time value and to know
how much the amount of the salvage value that will be used in cash
flow calculation. We use the declining balance (DB 200%) method
on this calculation. The depreciation of equipment cost is shown in
the table in appendix.
b. Supporting Equipment Cost
Supporting equipment is the office equipment that also
required in supporting production process. The amount of
supporting equipment is estimated based on the total workers in
office. The example of supporting equipment are computer, fax,
printer, scanner, safety equipment such as safety shoes, fire
extinguisher, photocopy machine, table, chair, sofa, etc. The
calculation of supporting equipment cost is shown in the Table 5.2
From the table above, we can see that the total supporting
equipment cost required is Rp817,445,000. The depreciation
calculation for the supporting equipment is also required. The life
time value for the supporting equipment is different one to each
other. The depreciation calculation of supporting equipment will be
shown on the appendix.
5.1.2 Market Research Cost
As a new product, “Cocofoam” has to be very competitive in
market. However, it has to be known by consumer first before it can reach
through the next level which is to be the favorite packaging product. In
order to know the suitable marketing strategy for “Cocofoam”, we have to
do a market research. In doing market research, we hire consultant’s
service in order to get an accurate analysis.
Market research cost for this product is shown in the Table 5.3

35
Universitas Indonesia
Table 5.2 Market Research Cost
No Type of Cost Quantity Based Cost Cost (Rp)
1 Surveyor 2 Rp 2.800.000 Rp 5.600.000
2 Consultant 2 Rp 12.600.000 Rp 25.200.000
3 Survey Needs Rp 6.300.000 Rp 6.300.000
Total Market Research Cost Rp 37.100.000
5.1.3 Site Development and Building Cost
Site development and building cost is the cost required to build the
office and the plant. This cost consists of land cost, site development cost,
and building cost. The calculation of site development and building cost is
shown in Table 5.4
Table 5.3 Site Development and Building Cost
No Type of Cost Quantity Based Cost Cost (Rp)
1 Land (m2) 600 Rp 1.000.000 Rp 600.000.000
2 Site Development (Grass
Root Plant)
Rp -
3 Building (Office) (m2) 200 Rp 2.200.000 Rp 440.000.000
4 Building (Plant) (m2) 300 Rp 2.200.000 Rp 660.000.000
Total Site Development and
Building Cost
Rp 1.700.000.000
5.1.4 Installation Cost
Installation cost is the beginning cost for equipment, it consists of
water installation, electricity installation, hydrant installation, telephone
installation, and internet installation. The component of this cost is in the
Table 5.5.
Table 5.4 Installation Cost
No Type of Cost Cost
1 Water Installation Rp 55.000.000
2 Electricity Installation Rp 98.500.000
3 Hydrant Installation Rp 40.000.000
4 Telephone Installation Rp 30.000.000
5 Internet Installation Rp 10.000.000
Total Installation Rp 233.500.000

36
Universitas Indonesia
5.1.5 Total Capital Investment
According to Guthrie method, the formula to calculate TCI is:
) +
The purpose of TCI calculation is to know how much the cost
needed to start-up the plant construction and production process, analyze
the feasibility of the plant construction, and determine whether the product
price will result the acceptable profit margin or not.
Table 5.5 Total Capital Investment
Bare-Module Cost Rp 958.055.309
Supporting Equipment Cost Rp 817.445.000
Offsite Facilities Cost Rp 281.402.765,45
Site Development and Building Cost Rp 1.700.000.000
Market Research Cost Rp 37.100.000
Total Plant Investment Rp 5.789.003.075
Working Capital Rp 1.018.864.541
Total Capital Investment Rp 6.807.867.616
5.2 Operational Expenditure
5.2.1 Raw Material Cost
Raw material cost from Cocofoam is one of important cost in
economic analysis. Raw material costs are include the cost of purchased
the raw material that is Coconut fiber, NaOH 5%, and Resin EVA.
Table 5.6 Raw Material Cost
No Raw Material Requirement
per day
Unit Price (Rp) Total Price (Rp)
1 Coconut Fiber 49001,6 kg 2500 Rp122.504.000
2 NaOH 5% 46011,0 L 3000 Rp138.033.000
3 Resin EVA 12250,4 kg 10500 Rp128.629.200
Total Raw Material Cost Per Day Rp389.166.200
Total Raw Material Cost Per Year Rp128.424.846.000

37
Universitas Indonesia
5.2.2 Utility Cost
For this part we calculate the utility cost as the cost which is used
for the importance of production process or know as variable cost. The
following utilities are electricity and water to operate generator when there
is no supply of electricity from PLN. The electricity cost is shown in Table
5.8.
Table 5.7 Utility Cost
No. Utility Needs Unit Charge Charge
Unit
Cost (a day)
1 Water 245008 Liter/day 8,517 /L 2086733,136
2 Electricity at Waktu Beban
Puncak (WBP)
170,8 kW/day 1342 /kWh 229213,6
3 Electricity at Lewat Waktu
Beban Puncak (LWBP)
539,5 kW/day 760 /kWh 410020
Total Variable Cost in a day Rp2.725.966,74
Total Variable Cost in a year Rp899.569.022,88
5.2.3 Maintenance Cost
The continuous process which is done by each process equipment
can make the equipment did not work in intensive and optimum way. So,
we need to do maintenance. The maintenance is also done for factory
building and supporting tools for office needs. Total maintenance cost is
shown in Table 5.13
Table 5.8 Total Maintenance Cost
Maintenance Cost
Main equipment Rp17.530.500,00
Supporting equipment Rp 34.144.500,00
Building Rp96.048.162,34
Total Rp147.723.162,34
5.2.4 Labor Cost
We calculate the labor cost for direct labor and indirect labor
separately. Direct labor is all of the labors who are involved directly in a
production process at a factory. In this section, we will explain about the
cost in the direct labor. The decision about the salary of the labors is based

38
Universitas Indonesia
on UMR (Upah Minimum Regional), which is rule of Indonesia’s
government about minimum salary for employee or laborer based on
regional where the employee or laborer works.
Meanwhile, indirect labor consists of employees who do not affect
the amount of product produced or not directly related to production
activities of “Cocofoam” product. Indirect labor’s requirements are suited
to the organizational structure owned. The salary of each employee is
included employee benefits per year and insurance costs for employees
which are deducted each month for the cost of insurance. The details of
indirect labor can be seen in the Table 5.15
5.2.5 Patent Cost
Our product category is innovation product, so that we must
register it for patent, copy right, industry design, and brand. The
calculation of each fee can be seen in the Table 5.16 until 5.19
Table 5.9 Total Patent Fee
Fee Cost
Patent Fee Rp 62.425.000
Copyright Fee Rp 425.000
Industry Design Fee Rp 1.150.000
Brand Fee Rp 3.350.000
Total Fee Rp 67.350.000
5.2.6 Distribution Cost
To distribute our product from factory to distribution center we use
our own distribution car. The cost of this distribution consists of fuel cost,
driver fee, port fee, toll fee,etc. The detailing of distribution cost from
factory to distribution center is shown in Table 5.21until Table 5.24
For distribution of product from distribution centre to retailer we
use expedition service company. This company will send and distribute
our product from distribution centre to retailers. The fee for this expedition
company is based on weight of the product and the distance from

39
Universitas Indonesia
distribution centre to retailers. The distribution is done once a week, then
we calculate the distribution cost in a year.
Table 5.10 Total Distribution Cost
Distribution Cost
From factory to distribution center Rp348.000.000,00
From distribution center to traditional
market
Rp675.097.904,00
Total Distribution Cost per Year Rp1.023.097.904,00
5.2.7 Marketing Cost
The purpose of the marketing is to introduce, inform and
understand customer needs about suitability of the Cocofoam product with
consumer needs, so that our product will be sold quickly in accordance
with the economic analysis which we are designed. Marketing costs
include promotional activities planned; those are the cost of printed media,
online media, radio advertising, and websites. The total marketing cost is
shown in the Table 5.30
Table 5.11 Total Marketing Cost
No Type of Cost Cost per year
1 Grand Launching Product Cost Rp67.100.000
2 Advertising (Printed Media, Radio,
Online Advertising) Cost
Rp433.800.000
3 Creating and Developing Website
Cost
Rp2.200.000
Total Marketing Cost per year Rp503.100.000
5.2.8 General Expenses
General expenses are the expenses related to routine expenses of the
factory office to support the operational activity of the factory. The routine
expenses mainly come from administration expenses. The detail of general
expenses is shown in Table 5.31

40
Universitas Indonesia
Table 5.12 General Expenses
Expenses Total Cost per Year
Shipping and Correspondencies Rp 2.000.000
Phone Rp 5.000.000
Faximile Rp 2.500.000
Internet Rp 6.000.000
Operational Expenses Rp 10.000.000
Total General and Administrative Expenses
(Rp)
Rp 25.500.000
5.2.9 Insurance and Factory Over Head (FOH)
The insurances include insurance for accident, insurance for retired, and
insurance for health care.
Table 5.13 Insurance Cost
No. Insurance Type Amount Insurance Cost
1 Building and Equipments 2% from Total Plant Investment Rp115.780.061,49
2 Raw Materials 2% from Total Raw Materials Cost Rp2.568.496.920,00
3 Employees Total Insurance Rp166.327.080,00
Total Insurance Cost Rp2.850.604.061,49
Factory Over Head (FOH) includes indirect labor costs, office expenses,
insurance, and depreciation. FOH of company consists of fixed costs and
variable costs. The calculation of total FOH is shown at Table 5.34
Table 5.14 Factory Over Head (FOH) Cost
Fixed FOH Cost
Indirect Labour Rp 134.000.000
Fixed Utilitity Rp 899.569.023
Maintenance Rp 147.723.162
Depresiasi Rp 238.188.765
Asuransi Pabrik Rp 2.850.604.061
Total Fixed FOH Rp 4.270.085.011
5.2.10 Total Operational Cost
Operational cost is the expenses which are related to the operation of a
business, or to the operation of a device, component, piece of equipment

41
Universitas Indonesia
or facility. They are the cost of resources used by an organization just to
maintain its existence.
Table 5.15 Total Operational Cost
Operational Cost Fixed Cost (FC) (Rp) Variable Cost (VC) (Rp)
Direct Material Rp 128.424.846.000
Direct Labor Rp 898.200.000
Factory Over Head (FOH) Rp 4.270.085.011
Marketing Cost Rp 503.100.000
Distribution Cost Rp 1.023.097.904,00
Patent Rp 67.350.000,00
General Expenses Rp 25.500.000
Income tax Rp 43.841.696.455
TOTAL (Rp/Year) Rp 50.125.929.371 Rp 128.927.946.000
TOTAL (Rp/Year) Rp 179.053.875.371
5.3 Economic Analysis
5.3.1 Product Pricing
Price of product per unit can be determine by calculating direct material,
direct labor, factory overhead, marketing expenses, distribution expenses, general
and administration expenses, invest, and sales volume. Price of the product also
calculated based on forecasting for a high, moderate, and low production
capacity. The calculation is shown in Table 5.36. Based on calculation on Table
5.36, it is decided that sales price for Cocofoam after adding profit is Rp 850 per
package.
5.3.2 Investment
Interest rate is the amount of interest that must be pay for loan to Bank and
investors. In this case, our product loan the capital cost to one bank, Bank
Mandiri, as much as 40% of the Total Capital Investment and to investors with
60% of the Total Capital Investment.
For Bank loan, the interest rates is10,5%per year which will be paid in 5
years and the interest rate for investors is10% per year (higher than deposito rate
interest) which will also be paid in 5 years. Table 5.37 and Table 5.38 shows the
calculation of investment in Bank and investors.

42
Universitas Indonesia
5.3.3 Cash Flow
The cashflow consists of income and expense. The source of income are
revenue, before tax income, after tax income, and salvage value. Meanwhile, the
source of expenses are investment, operation cost, loan payment, and interest
payment. We assume that on the first and second year of production, our product
only sold about 50% and 70% of total production. This assumption is based on the
fact that our product is new, and it will take some time for consumer to receive
our product. For the rest of the year, the amount of our product that sold is equal
to total production. The cashflow calculations can be seen in appendix.
Figure 5.1After Tax Cashflow and Before Tax Cashflow
Figure 5.2 Cumulative Cashflow
Rp(80,000,000,000)
Rp(60,000,000,000)
Rp(40,000,000,000)
Rp(20,000,000,000)
Rp-
Rp20,000,000,000
Rp40,000,000,000
Rp60,000,000,000
1 2 3 4 5 6 7 8 9 10
ATCF dan BTCF
ATCF
BTCF
Rp(100,000,000,000)
Rp(50,000,000,000)
Rp-
Rp50,000,000,000
Rp100,000,000,000
Rp150,000,000,000
Rp200,000,000,000
Rp250,000,000,000
Rp300,000,000,000
After Tax
Cumulative Cashflow
Cumulative Cashflow

43
Universitas Indonesia
5.3.4 Cost Breakdown
Cost breakdown is used to see the percentage of each expense
spent by the factory. By making cost breakdown, we will know which
variable has the biggest percentage from operation cost.
Figure 5.3 Cost Breakdown
From Figure 5.3, it can be seen that direct material is the biggest
expenses at 95.03% from total operation cost, and general expenses is the
smallest expenses at 0.02%. Based on this, it is known that direct material
has the biggest influence to operational cost. Therefore, if there’s an
increase in direct material (such as raw material to produce Cocofoam), it
will also affect operational cost.
5.4 Profitability Analysis
The main reason for making a business is to get its profit. We use three
aspects to decide whether our business is feasible or not: IRR, Payback Period,
Break Even Point (BEP), and Net Present Value (NPV).
5.4.1 Internal Rate of Return (IRR)
Internal Rate of Return (IRR) is the measurement of maximum interest
that have to be paid for a project and still have a break event in the end of project
life. In other words, IRR is an interest while the value of NPV is 0, so that the
formula to calculate IRR is
Direct Material
(95,03%)Direct Labor (0,66%)
Factory Over Head
(FOH) (3,6%)Marketing Cost (0,37%)
Distribution Cost
(0,76%)General Expenses
(0,02%)

44
Universitas Indonesia
With the value of r is IRR. By using Microsoft Excel, we get that the value of IRR
for Cocofoam plant is 29%. This value is a quite high value for IRR, so that it will
attract the investor
5.4.2 Payback Period
Payback period is the time that needed for an investment to be paid back.
The formula to calculate payback period with effect of time-value money is
shown in equation below:
Payback period for Cocofoam plant is 3,92 year as shown in Figure 5.4
Figure 5.4 Payback Period
5.4.3 Break Even Point (BEP)
Break Even Pint (BEP) is an analysis to determine and find number of
products that have to be sold to the consumers in a certain price to cover the
operational cost and other cost, and also to gain profit. The equation to calculate
BEP is:
Rp(100)
Rp(50)
Rp-
Rp50
Rp100
Rp150
Rp200
Rp250
Rp300
0 2 4 6 8 10 12
Bil
lio
ns
Payback Period
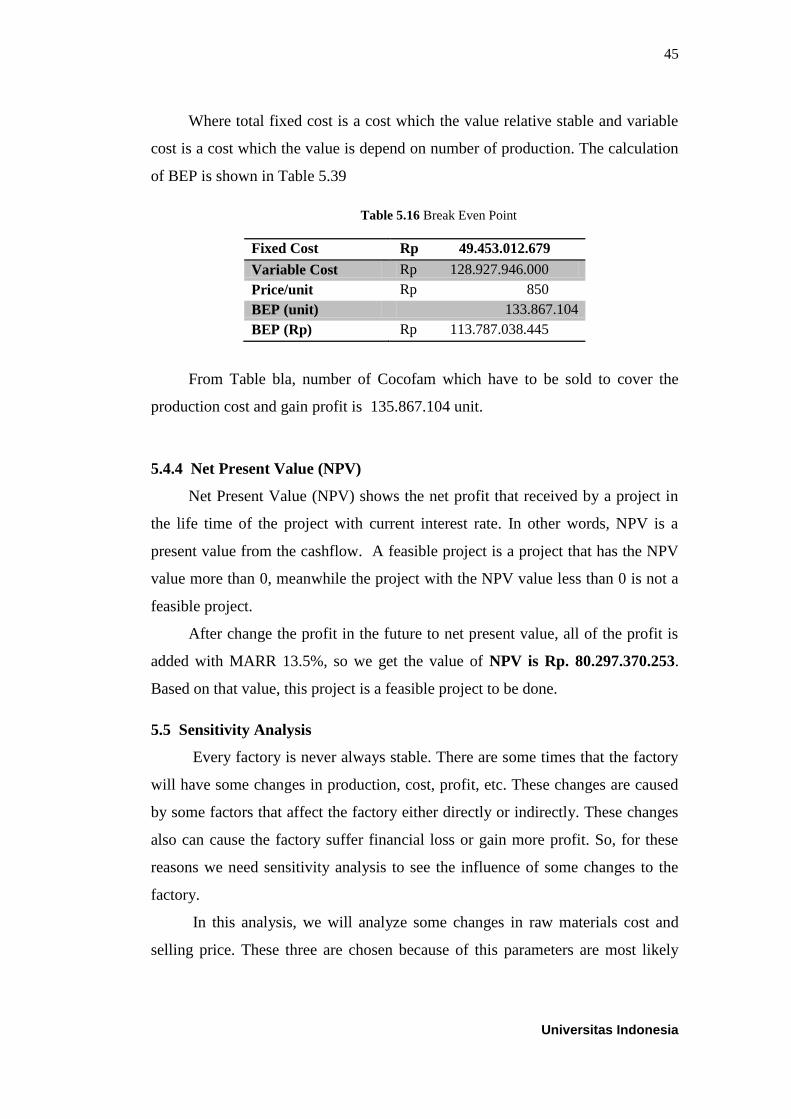
45
Universitas Indonesia
Where total fixed cost is a cost which the value relative stable and variable
cost is a cost which the value is depend on number of production. The calculation
of BEP is shown in Table 5.39
Table 5.16 Break Even Point
Fixed Cost Rp 49.453.012.679
Variable Cost Rp 128.927.946.000
Price/unit Rp 850
BEP (unit) 133.867.104
BEP (Rp) Rp 113.787.038.445
From Table bla, number of Cocofam which have to be sold to cover the
production cost and gain profit is 135.867.104 unit.
5.4.4 Net Present Value (NPV)
Net Present Value (NPV) shows the net profit that received by a project in
the life time of the project with current interest rate. In other words, NPV is a
present value from the cashflow. A feasible project is a project that has the NPV
value more than 0, meanwhile the project with the NPV value less than 0 is not a
feasible project.
After change the profit in the future to net present value, all of the profit is
added with MARR 13.5%, so we get the value of NPV is Rp. 80.297.370.253.
Based on that value, this project is a feasible project to be done.
5.5 Sensitivity Analysis
Every factory is never always stable. There are some times that the factory
will have some changes in production, cost, profit, etc. These changes are caused
by some factors that affect the factory either directly or indirectly. These changes
also can cause the factory suffer financial loss or gain more profit. So, for these
reasons we need sensitivity analysis to see the influence of some changes to the
factory.
In this analysis, we will analyze some changes in raw materials cost and
selling price. These three are chosen because of this parameters are most likely

46
Universitas Indonesia
occur in our factory. The parameter to analyze these changes is Net Present Value
(NPV), Payback period, and IRR
5.5.1 Influence of Raw Material Cost
Raw materials influence the operation cost, so indirectly influence NPV
too. The deviation of raw materials price is making the NPV decrease along with
the increases of deviation because if the raw materials price increases, the
outcome of the factory is increase.
Besides that, the payback period also changes because of raw materials
deviation. The deviation of raw materials caused the payback period longer than
before along with the increase in raw materials price. These reason is caused by
the increase in raw material prices is influence the operation cost and if the other
cost and income is constant, the profit we have for payback period is decrease and
so the payback period is longer than before deviation.
Table 5.17 Influence of Raw Material Cost Towards IRR, NPV, and Payback Period
Deviation Total Raw Material
Cost IRR NPV PBP (Year)
-6% Rp120.719.355.240 43% Rp126.893.269.642 3,375015804
-4% Rp123.287.852.160 37% Rp111.361.303.179 3,584232358
-2% Rp125.856.349.080 31% Rp95.829.336.716 3,821101688
0% Rp128.424.846.000 25% Rp80.297.370.253 4,091494169
2% Rp130.993.342.920 19% Rp64.765.403.790 4,403068335
4% Rp133.561.839.840 13% Rp49.233.437.327 4,766007854
6% Rp136.130.336.760 9% Rp33.701.470.864 5,194155735
5.5.2 Influence of Product Price
Selling price is the only factor that not influenced directly with
operating cost or the other cost, but we cannot decide the selling price
randomly because if we decide the selling price randomly without consider
IRR, profit, etc the factory will not working or the investor will not invest
in our product.

47
Universitas Indonesia
Table 5.18 Influence of Product Price Towards IRR, NPV, and Payback Period
Deviation Product Price IRR NPV PBP
-6% Rp799 7% Rp25.069.898.839 5,419685169
-4% Rp816 15% Rp43.479.055.977 4,871974459
-2% Rp833 20% Rp61.888.213.115 4,44037137
0% Rp850 25% Rp80.297.370.253 4,091494169
2% Rp867 31% Rp98.706.527.391 3,803638637
4% Rp884 37% Rp117.115.684.529 3,562082468
6% Rp901 43% Rp135.524.841.667 3,35648678
If we assume the other value is constant, the increase in selling
price will increase the profit that will the factory get. Hence, the payback
period will decrease, NPV increase, and IRR increase.
Figure 5.5 Sensitivity Analysis Curve-IRR
0%
10%
20%
30%
40%
50%
-10% -5% 0% 5% 10%
IRR
Deviation
Sensitivity Analysis-IRR
Raw Material Cost
Product Price
Rp0
Rp50
Rp100
Rp150
-10% -5% 0% 5% 10%
NP
V Bil
lio
ns
Deviation
Sensitivity Analysis-Net Present
Value
Raw Material Cost
Product Price

48
Universitas Indonesia
Figure 5.6 Sensitivity Analysis Curve-NPV
Figure 5.7 Sensitivity Analysis Curve-PBP
0
1
2
3
4
5
6
-10% -5% 0% 5% 10%
Pa
yb
ack
Per
iod
Deviation
Sensitivity Analysis-Payback
Period
Raw Material Cost
Product Price

49
Universitas Indonesia
CHAPTER VI
CONCLUSION AND SUGGESTION
6.1 Conclusion
Based on explanation and review stated before, the conclusion for this paper are:
1. Based on questionnaire and interview result, consumers prefer food packaging with
these criteria: practical, do not harmful for human body, water proof, affordable,
and degrade easily.
2. Name of our product is Cocofoam with motto Love the Earth, Love Your Body
3. The factory is located in Karangsari, East Cikarang, West java, Indonesia.
4. The plant will be operated for 10 years
5. The capacity of production per day is 735000 packages.
6. Our market target located in Java and Bali region
7. Price of Cocofoam per piece is Rp. 850,-
8. Based on economic calculation, Cocofoam plant has IRR as much as 29%, NPV Rp.
87.766.760.161, and payback period 3,92 years.
6.2 Suggestion
The biggest obstacle in marketing Cocofoam is ensuring consumers to buy our product.
This is mainly because our competitor product such as styrofoam and plastic have been
widely used. To overcome this problem, informing consumers about the hazard of
styrofoam and plastic as food packaging is required. Further research and development is
needed in order to maximizing the quality of Cocofoam which is focusing in both
enviromentally friendly and healthy product. Also, deeper economic analysis is needed to
maximizing profit of this plant. We hope that in the future Cocofoam can be distributed in a
broader area in Indonesia and also foreign country.

50
Universitas Indonesia
REFERENCE
Anonym. “Ethy Vinyl Acetate”. http://aozora-aap.indonetwork.co.id/4147348. (visited on
20/12/2013 at 17.00)
Anonym. “Larutan Laboratorium”. http://asamedika.com/larutan-laboratorium/.(visited on
20/12/2013 at 17.00)
Anonym. “Polypropilene” http://kimiaindustri.com/category/jenis-bahan-kimia/bahan-
kimia-analys/. (visited on 20/12/2013 at 17.00)
Anonym. “Waste Degradation Time”. http://www.ecowarriors.it/en/eco-
encyclopedia/ricycle-pedia/59-tempi-di-degradazione-dei-rifiuti.html (visited on
20/12/2013 at 17.00)
Anonym. “What is Polyethylene”. http://www.wisegeek.org/what-is-polyethylene.htm
(visited on 20/12/2013 at 17.00)
Arifuzzaman, G., Alam, Md., and Terano, Minoru. 2011. “Thermal Characterization of
Chemically Treated Coconut Husk Fibre”. Indian Journal of Fibre and Textile
Research
Bakri et al. 2010. “Preliminary Study on Bagasse Fibre With Polystyrene As a Polymer
Composites”. School of Material Engineering University Malaysia Perlis.
Hayleys et al. 2003. Composite Application Using Coir Fibres in Srilanka. Delft University
of Technology Netherlands
Ho, et al. 2011. “Critical Factors on Manufacturing Process of Natural Fibre Composites”.
Elsevier: Composites
Jayabal, S and Natarajan, U. 2010. “Drilling Analysis of Coir-Fibre-Reinforced Polyester
Composites”. India: Departement of Mechanical Engineering College of Engineering
and Techonoly
Oroh, et al. 2013. “Analisis Sifat Mekanik Material Komposit dari Serabut Kelapa”.
Indonesia: Teknik Mesin Universitas Sam Ratulangi Manado

51
Universitas Indonesia
Saxena et al. 2010. “Composite Materials from Natural Resources: Recent Trends and
Future Potentials”. India: Council of Scientific and Industrial Research
Tudu, Prakash. 2009. “Processing and Characterization of Natural Fiber Reinforced
Polymer Composites”. Departement of Mechanical Engineering National Institute of
Technology Rourkela
Verma, et al. 2012. “Coir Fibre Reinforcement and Application in Polymer Composites: A
Review”. India: Departement of Mechanical Engineering College of Engineering
Roorkee.

52
Universitas Indonesia
Appendix
Appendix A.1
Table 1.6 List of Needs and Rankings Based on Several Categories
Need
Number
Need Description Rank
Price of Food Packaging
3 Affordable Food Packaging 3
Performance of Food Packaging
1 Practical 3
2 Water Proof 4
4 Thermostable 4
5 Has no odor 2
Health Aspect
6 Not dangerous for human body 5
Environmental Aspect
7 Degrade Easily 4
Physical Appearance of Food Packaging
8 Attractive Form 1
9 Attractive Color 1
Table 1.7 List of Metrics
Needs No Needs Spesification Metric Unit Rank
Price of Food Packaging
3 Affordable Food Packaging Price of Product Rp 3
Performance of Food Packaging
1 Practical Ergonomic Subjective 3
2 Water Proof Time to Patch Water
Before Leak
Hours 4
4 Thermostable Thermal Stability oC 4
5 Has no odor Odor Subjective 2
Health Aspect
6 Not dangerous for human body Toxicity Subjective 5
Environmental Aspect
7 Degrade Easily Time to Degrade Years 4
Physical Appearance of Food Packaging
8 Attractive Form Ergonomic Subjective 1
9 Attractive Color Ergonomic Subjective 1

53
Universitas Indonesia
Table 1.8 Benchmarking
Number Needs Spesification Metric
Unit
Own
Product
Product A
(Styrofoam
)
Product
B
(Plastic)
Product
C (Paper)
Product D
(Paper
Box)
3 Affordable Food
Packaging
Price of
Product
Rp Rp
1.000
Rp
210
Rp 100 -
150
Rp
75
Rp 800 -
1000
1 Practical Ergonomic Subjective ●●●●● ●●●●● ●●●●● ●● ●●●●
2 Water Proof Time to Patch
Water Before
Leak
Hours 10 Infinite Infinite 0,08 -
0,16
0,08 - 0,16
4 Thermostable Thermal
Stability
oC (0) - (+93) (-50) -
(+95)
(-10) -
(+80)
(+ 25) -
(+35)
(+ 25) -
(+35)
5 Has no odor Odor Subjective No Odor No Odor No Odor No Odor No Odor
6 Not dangerous
for human body
Toxicity Subjective Non Toxic Very Toxic Very
Toxic
Non
Toxic
Non Toxic
7 Degrade Easily Time to
Degrade
Years 0,019 -
0,038
300-1000 100-1000 0,083 0,083
8 Attractive Form Ergonomic Subjective ●● ●● ●● ●● ●●
9 Attractive Color Ergonomic Subjective ●● ●● ●● ●● ●●
Table 1.9 Concept Combination
No Concept Based on
Form of Food
Packaging
Concept Based on How
to Open Food
Packaging
Concept Based on
Base Material of
Food Packaging
Concept Based on Resin
of Food Packaging
1 Round Clamshell Coconut Husk Ethyl Vinyl Acetate
(EVA)
2 Cubic With casing Bagasse Poly Propylene
Urea Formaldehyde
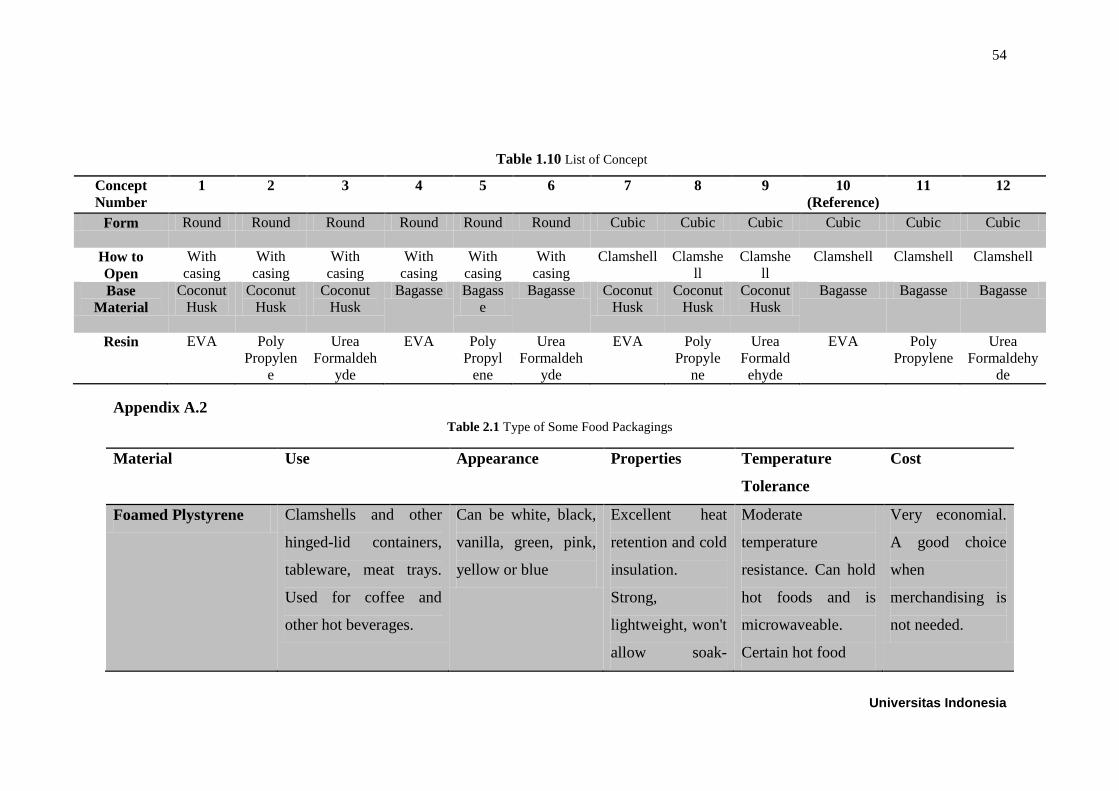
54
Universitas Indonesia
Table 1.10 List of Concept
Concept
Number
1 2 3 4 5 6 7 8 9 10
(Reference)
11 12
Form Round Round Round Round Round Round Cubic Cubic Cubic Cubic Cubic Cubic
How to
Open
With
casing
With
casing
With
casing
With
casing
With
casing
With
casing
Clamshell Clamshe
ll
Clamshe
ll
Clamshell Clamshell Clamshell
Base
Material
Coconut
Husk
Coconut
Husk
Coconut
Husk
Bagasse Bagass
e
Bagasse Coconut
Husk
Coconut
Husk
Coconut
Husk
Bagasse Bagasse Bagasse
Resin EVA Poly
Propylen
e
Urea
Formaldeh
yde
EVA Poly
Propyl
ene
Urea
Formaldeh
yde
EVA Poly
Propyle
ne
Urea
Formald
ehyde
EVA Poly
Propylene
Urea
Formaldehy
de
Appendix A.2
Table 2.1 Type of Some Food Packagings
Material Use Appearance Properties Temperature
Tolerance
Cost
Foamed Plystyrene Clamshells and other
hinged-lid containers,
tableware, meat trays.
Used for coffee and
other hot beverages.
Can be white, black,
vanilla, green, pink,
yellow or blue
Excellent heat
retention and cold
insulation.
Strong,
lightweight, won't
allow soak-
Moderate
temperature
resistance. Can hold
hot foods and is
microwaveable.
Certain hot food
Very economial.
A good choice
when
merchandising is
not needed.

55
Universitas Indonesia
through.
Polypropylene The most common
takeout packaging
material, used for
chicken roasters, bakery
and microwaveable
takeout containers.
Ussually made in
black or clear. Can
easily be made into
many shapes, sizes
and compartments
and molded with
design elements.
Very rigid, crack-
resistant, leak-
resistant. Can be
film sealed, if rim
is wide enough.
Preferred material
for microwave and
hot case. Can resist
temperatures up to
220 to 240.
Moderately
priced. Not as
expensive as
CPET.
Foamed Polypropylene Good for clamshells and
other hinged-lid
containers, tableware,
meat trays. This is a
relatively new product
and will become more
used various customers.
Usually white but can
be other colors
Excellent heat
retention and cold
insulation.
Strong,
lightweight, won't
allow soak-
through.
Can hold hot foods
and is
microwaveable
Moderately
priced. Not as
expensive as
CPET.
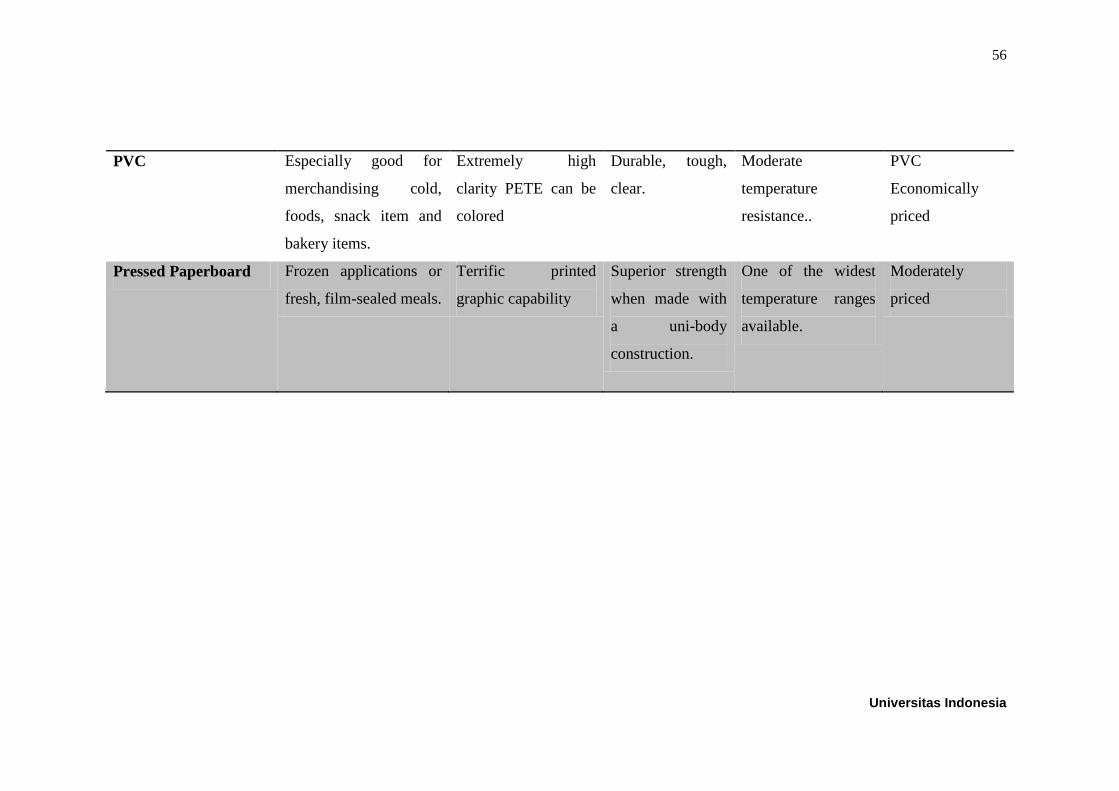
56
Universitas Indonesia
PVC Especially good for
merchandising cold,
foods, snack item and
bakery items.
Extremely high
clarity PETE can be
colored
Durable, tough,
clear.
Moderate
temperature
resistance..
PVC
Economically
priced
Pressed Paperboard Frozen applications or
fresh, film-sealed meals.
Terrific printed
graphic capability
Superior strength
when made with
a uni-body
construction.
One of the widest
temperature ranges
available.
Moderately
priced

57
Universitas Indonesia
Appendix A.3
Table 3.1 Perceptual Mapping Detail Computation
Criteria
Selection
Weight Own Product Product A
(Styrofoam)
Product B
(Plastic)
Product C
(Paper)
Product D
(Paper Box)
Score Total Score Total Score Total Score Total Score Total
Price
1: Very
Expensive
5: Very Cheap
15% 2 0,3 3 0,45 4 0,6 5 0,75 2 0,3
Practical
1: Very not
practical
5: Very
practical
15% 5 0,75 5 0,75 3 0,45 1 0,15 4 0,6
Water Proof
1: Not water
proof
5: Water proof
10% 5 0,5 5 0,5 5 0,5 1 0,1 2 0,2
Thermostable
1: Not
thermostable
5:
Thermostable
10% 5 0,5 5 0,5 3 0,3 1 0,1 1 0,1
Level of
danger to
human body
1: Harmful
5: Not harmful
25% 5 1,25 1 0,25 2 0,5 4 1 4 1
Ease of
degradation
1: Difficult to
be degradaded
5: Easy to be
degradaded
25% 5 1,25 1 0,25 2 0,5 3 0,75 3 0,75
Table 3.2 Dimension of Cocofoam’s Size
Specification Dimension (cm)
Large Size
Length:Width:Height 25:10:7
Medium Size
Length:Width:Height 18:8:5
Small Size
Length:Width:Height 10:5:3
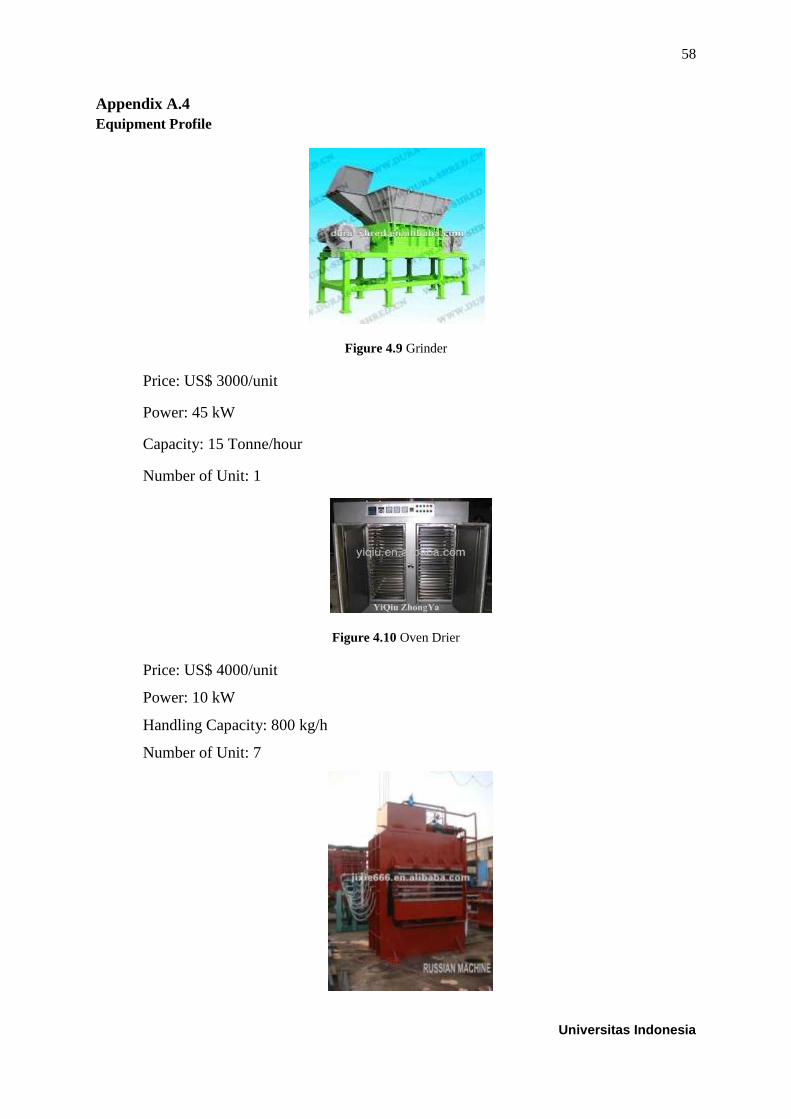
58
Universitas Indonesia
Appendix A.4
Equipment Profile
Figure 4.9 Grinder
Price: US$ 3000/unit
Power: 45 kW
Capacity: 15 Tonne/hour
Number of Unit: 1
Figure 4.10 Oven Drier
Price: US$ 4000/unit
Power: 10 kW
Handling Capacity: 800 kg/h
Number of Unit: 7

59
Universitas Indonesia
Figure 4.11 Hot Press Machine
Price: US$ 1500/unit
Power: 20 kW
Number of Unit: 1
Capacity: 12 sheets/kg
Figure 4.12 Moulding Machine
Price: US$ 10000/unit
Power: 20,2 kW
Number of Unit: 4
Capacity: 20000 pieces/hour

60
Universitas Indonesia
Grinding WashingCoconut
Fiber
Water
Distilled Water
Chemical
Treatment
NaOH 5%
NaOH 5%
Blending with
Matrix
Resin
Drying
Water
MoldingPackaging
Coconut
Husk49001,6 kg
49001,6 kg
245008 L
245008 L
Coconut
Fiber
49001,6 kg
98003,2 kg
98003,2 kg
Coconut
Fiber
49001,6 kg
12250,4 kg
2 L
Coconut
Fiber
61252 kg
Coconut
Fiber
61250 kgCocofoam
735000 pieces
Figure 4.13 Mass balance Diagram of Cocofoam Production

61
Universitas Indonesia
Grinding WashingCoconut
Fiber
Water
Water
Chemical
Treatment
NaOH 5%
NaOH 5%
Blending with
Matrix
Resin
Drying
Water
MoldingPackaging
Coconut
Husk45 kW
Coconut
Fiber
Coconut
Fiber
Coconut
Fiber
70 kW
Coconut
Fiber
100,8 kWCocofoam
Figure 4.14 Energy balance Diagram of Cocofoam Production
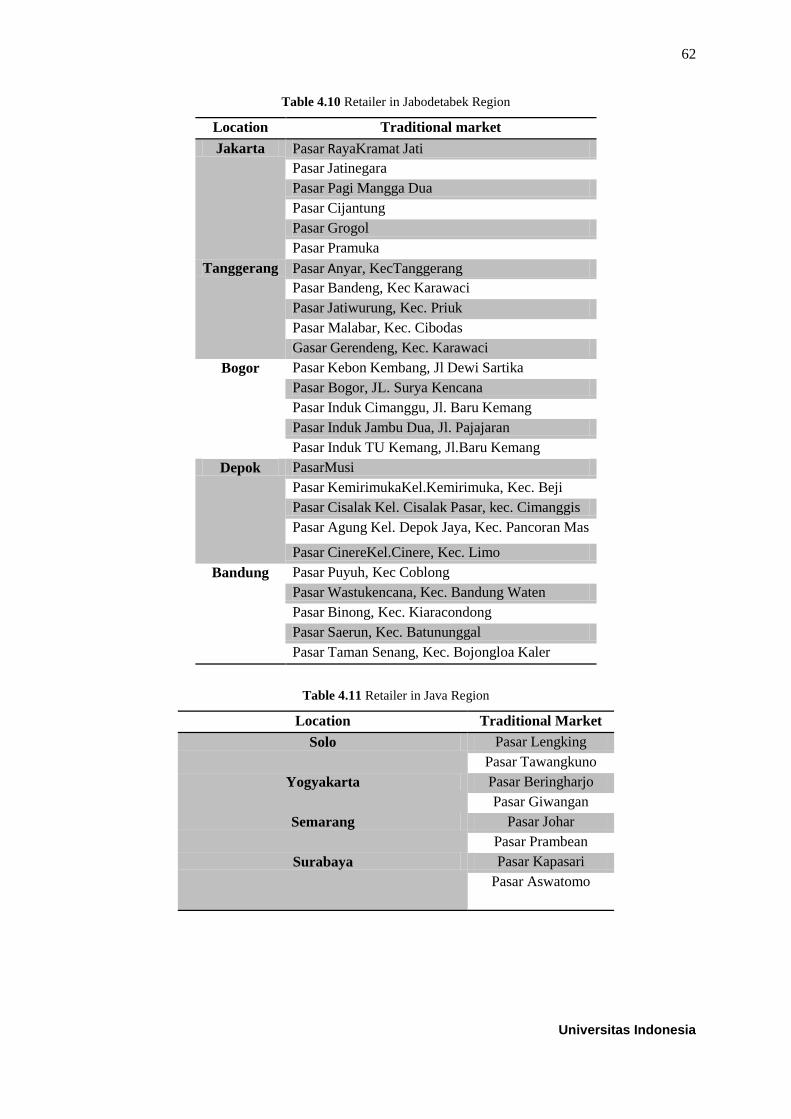
62
Universitas Indonesia
Table 4.10 Retailer in Jabodetabek Region
Location Traditional market
Jakarta Pasar RayaKramat Jati
Pasar Jatinegara
Pasar Pagi Mangga Dua
Pasar Cijantung
Pasar Grogol
Pasar Pramuka
Tanggerang Pasar Anyar, KecTanggerang
Pasar Bandeng, Kec Karawaci
Pasar Jatiwurung, Kec. Priuk
Pasar Malabar, Kec. Cibodas
Gasar Gerendeng, Kec. Karawaci
Bogor Pasar Kebon Kembang, Jl Dewi Sartika
Pasar Bogor, JL. Surya Kencana
Pasar Induk Cimanggu, Jl. Baru Kemang
Pasar Induk Jambu Dua, Jl. Pajajaran
Pasar Induk TU Kemang, Jl.Baru Kemang
Depok PasarMusi
Pasar KemirimukaKel.Kemirimuka, Kec. Beji
Pasar Cisalak Kel. Cisalak Pasar, kec. Cimanggis
Pasar Agung Kel. Depok Jaya, Kec. Pancoran Mas
Pasar CinereKel.Cinere, Kec. Limo
Bandung Pasar Puyuh, Kec Coblong
Pasar Wastukencana, Kec. Bandung Waten
Pasar Binong, Kec. Kiaracondong
Pasar Saerun, Kec. Batununggal
Pasar Taman Senang, Kec. Bojongloa Kaler
Table 4.11 Retailer in Java Region
Location Traditional Market
Solo Pasar Lengking
Pasar Tawangkuno
Yogyakarta Pasar Beringharjo
Pasar Giwangan
Semarang Pasar Johar
Pasar Prambean
Surabaya Pasar Kapasari
Pasar Aswatomo

63
Universitas Indonesia
Table 4.12 Retailer in Bali Region
Area Traditional Market
Bali Pasar Kumbasari
Pasar Ubud
Appendix A.5
Table 5.19 Main Equipment Cost
No Tools Quantity Prices per quantity
(Rp)
Shipping Cost (Rp) Total Price (Rp)
1 Computer 6 Rp 4.000.000 Rp
100.000
Rp
24.100.000
2 Fax 1 Rp 1.000.000 Rp
-
Rp
1.000.000
3 Photocopy Machine 1 Rp 10.000.000 Rp
-
Rp
10.000.000
4 Scanner 1 Rp 600.000 Rp
-
Rp
600.000
5 Printer 6 Rp 1.400.000 Rp
100.000
Rp
8.500.000
6 Projector 1 Rp 3.200.000 Rp
-
Rp
3.200.000
7 Chair 20 Rp 400.000 Rp
200.000
Rp
8.200.000
8 Table 20 Rp 500.000 Rp
300.000
Rp
10.300.000
9 Cabinet 3 Rp 1.500.000 Rp
300.000
Rp
4.800.000
10 Fan 3 Rp 550.000 Rp
-
Rp
1.650.000
11 Air Conditioner 1 Rp 2.500.000 Rp
-
Rp
2.500.000
12 Trash Can 5 Rp 25.000 Rp
-
Rp
125.000
13 Office Equipment 100 Rp 20.000 Rp
-
Rp
2.000.000
14 Alarm Bell 5 Rp 150.000 Rp
-
Rp
750.000
15 Fire Extuingisher 5 Rp 250.000 Rp
-
Rp
1.250.000
16 Masker 100 Rp 1.000 Rp
-
Rp
100.000
17 Helm 40 Rp 200.000 Rp
150.000
Rp
8.150.000
18 Gloves 40 Rp 2.500 Rp
-
Rp
100.000
19 Safety Shoes 40 Rp 200.000 Rp
100.000
Rp
8.100.000
20 Dispenser 3 Rp 1.000.000 Rp
100.000
Rp
3.100.000
21 Truck 4 Rp 144.250.000 Rp Rp

64
Universitas Indonesia
100.000 577.100.000
22 Operational Car 1 Rp 115.000.000 Rp
300.000
Rp
115.300.000
23 Motorcycle 1 Rp 12.000.000 Rp
200.000
Rp
12.200.000
24 Electrical Generator 1 Rp 7.000.000 Rp
100.000
Rp
7.100.000
25 Lamp 72 Rp 50.000 Rp
100.000
Rp
3.700.000
26 Room Air Freshener 8 Rp 90.000 Rp
-
Rp
720.000
27 CCTV 8 Rp 350.000 Rp
-
Rp
2.800.000
Total Supporting
Equipment Cost
Rp
817.445.000
Table 5.20 Detail of Equipment Electricity Cost
No. Equipment Amount Power (kW) Total Power
(kW)
Usage Time
(minute)
Usage Time
(hour)
kWh
1 Grinder 1 45 45 90 1,5 67,5
2 Oven Drier 7 10 70 90 1,5 105
3 Hot Press
Machine
1 20 20 90 1,5 30
4 Molding Machine 4 20,2 80,8 90 1,5 121,2
Total (in a day) 323,7
Table 5.21 Maintenance Cost of Main Equipment
Main Equipment Quantity Cost Total Cost Factor Maintenance Cost
Grinder 1 Rp36.270.000,00 Rp36.270.000,00
0,02
Rp725.400,00
Oven Drier 7 Rp48.360.000,00 Rp338.520.000,00
0,02
Rp6.770.400,00
Hot Press Machine 1 Rp18.135.000,00 Rp18.135.000,00
0,02
Rp362.700,00
Moulding Machine 4 Rp120.900.000,00 Rp483.600.000,00
0,02
Rp9.672.000,00
Total Rp17.530.500,00
Table 5.22 Maintenance Cost of Supporting Equipment
Supporting
Equipment
Quantity Price per Unit Shipping
Cost
Total Cost Factor Maintenance
Cost
Computer 6 Rp
4.000.000,00
Rp
100.000,00
Rp
24.100.000,00
0,1 Rp 2.410.000,00
Fax 1 Rp
1.000.000,00
Rp
-
Rp
1.000.000,00
0,1 Rp 100.000,00
Photocopy
Machine
1 Rp
10.000.000,00
Rp
-
Rp
10.000.000,00
0,1 Rp 1.000.000,00
Scanner 1 Rp
600.000,00
Rp
-
Rp
600.000,00
0,1 Rp 60.000,00

65
Universitas Indonesia
Printer 6 Rp
1.400.000,00
Rp
100.000,00
Rp
8.500.000,00
0,1 Rp 850.000,00
Projector 1 Rp
3.200.000,00
Rp
-
Rp
3.200.000,00
0,1 Rp 320.000,00
Chair 20 Rp
400.000,00
Rp
200.000,00
Rp
8.200.000,00
0,1 Rp 820.000,00
Table 20 Rp
500.000,00
Rp
300.000,00
Rp
10.300.000,00
0,1 Rp 1.030.000,00
Cabinet 3 Rp
1.500.000,00
Rp
300.000,00
Rp
4.800.000,00
0,1 Rp 480.000,00
Fan 3 Rp
550.000,00
Rp
-
Rp
1.650.000,00
0,1 Rp 165.000,00
Air
Conditioner
1 Rp
2.500.000,00
Rp
-
Rp
2.500.000,00
0,1 Rp 250.000,00
Trash Can 5 Rp
25.000,00
Rp
-
Rp
125.000,00
0,1 Rp 12.500,00
Office
Equipment
100 Rp
20.000,00
Rp
-
Rp
2.000.000,00
0,1 Rp 200.000,00
Alarm Bell 5 Rp
150.000,00
Rp
-
Rp
750.000,00
0,1 Rp 75.000,00
Fire
Extuingisher
5 Rp
250.000,00
Rp
-
Rp
1.250.000,00
0,1 Rp 125.000,00
Masker 100 Rp
1.000,00
Rp
-
Rp
100.000,00
0,1 Rp 10.000,00
Helm 40 Rp
200.000,00
Rp
150.000,00
Rp
8.150.000,00
0,1 Rp 815.000,00
Gloves 40 Rp
2.500,00
Rp
-
Rp
100.000,00
0,1 Rp 10.000,00
Safety Shoes 40 Rp
200.000,00
Rp
100.000,00
Rp
8.100.000,00
0,1 Rp 810.000,00
Dispenser 3 Rp
1.000.000,00
Rp
100.000,00
Rp
3.100.000,00
0,1 Rp 310.000,00
Truck 2 Rp
50.000.000,00
Rp
100.000,00
Rp
100.100.000,00
0,1 Rp10.010.000,00
Operational
Car
1 Rp
115.000.000,00
Rp
300.000,00
Rp
115.300.000,00
0,1 Rp11.530.000,00
Motorcycle 1 Rp
13.000.000,00
Rp
200.000,00
Rp
13.200.000,00
0,1 Rp 1.320.000,00
Electrical
Generator
1 Rp
7.000.000,00
Rp
100.000,00
Rp
7.100.000,00
0,1 Rp 710.000,00
Lamp 72 Rp
50.000,00
Rp
100.000,00
Rp
3.700.000,00
0,1 Rp 370.000,00
Room Air
Freshener
8 Rp
90.000,00
Rp
-
Rp
720.000,00
0,1 Rp 72.000,00
CCTV 8 Rp
350.000,00
Rp
-
Rp
2.800.000,00
0,1 Rp 280.000,00
Total Rp34.144.500,00
Table 5.23 Maintenance Cost of Buliding
TPI Rp960.481.623,45
Factor 0,1
Cost Rp96.048.162,34
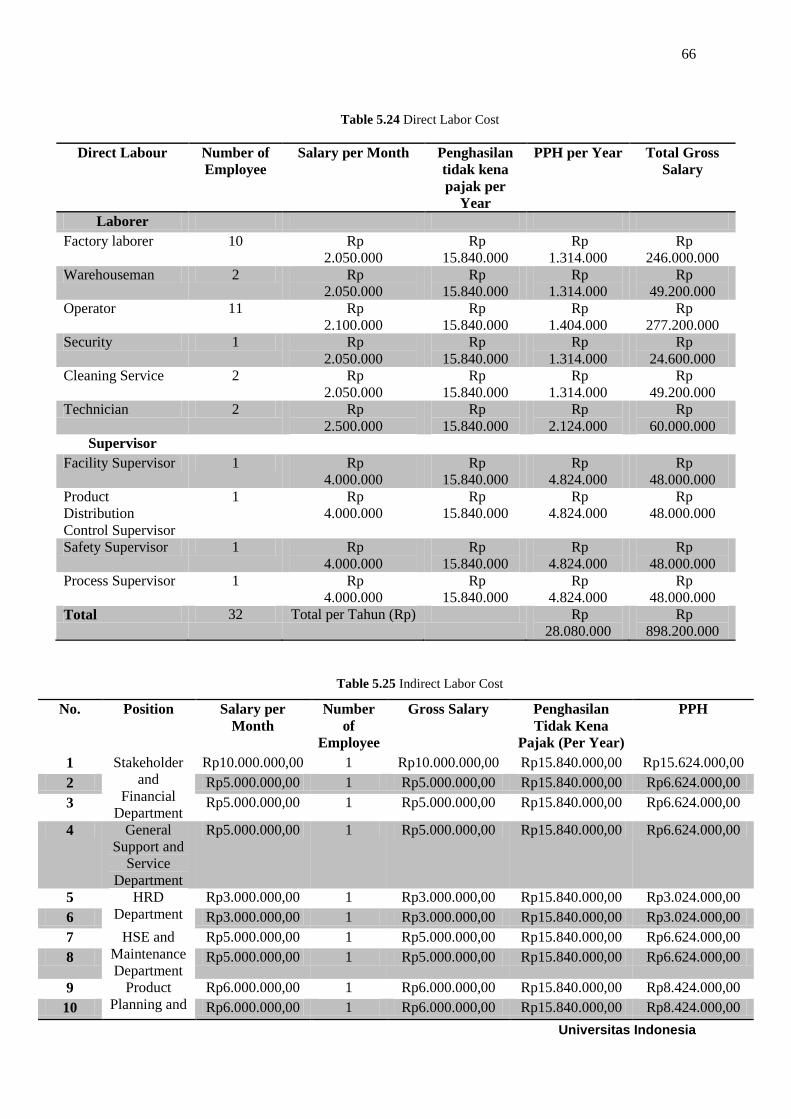
66
Universitas Indonesia
Table 5.24 Direct Labor Cost
Direct Labour Number of
Employee
Salary per Month Penghasilan
tidak kena
pajak per
Year
PPH per Year Total Gross
Salary
Laborer
Factory laborer 10 Rp
2.050.000
Rp
15.840.000
Rp
1.314.000
Rp
246.000.000
Warehouseman 2 Rp
2.050.000
Rp
15.840.000
Rp
1.314.000
Rp
49.200.000
Operator 11 Rp
2.100.000
Rp
15.840.000
Rp
1.404.000
Rp
277.200.000
Security 1 Rp
2.050.000
Rp
15.840.000
Rp
1.314.000
Rp
24.600.000
Cleaning Service 2 Rp
2.050.000
Rp
15.840.000
Rp
1.314.000
Rp
49.200.000
Technician 2 Rp
2.500.000
Rp
15.840.000
Rp
2.124.000
Rp
60.000.000
Supervisor
Facility Supervisor 1 Rp
4.000.000
Rp
15.840.000
Rp
4.824.000
Rp
48.000.000
Product
Distribution
Control Supervisor
1 Rp
4.000.000
Rp
15.840.000
Rp
4.824.000
Rp
48.000.000
Safety Supervisor 1 Rp
4.000.000
Rp
15.840.000
Rp
4.824.000
Rp
48.000.000
Process Supervisor 1 Rp
4.000.000
Rp
15.840.000
Rp
4.824.000
Rp
48.000.000
Total 32 Total per Tahun (Rp) Rp
28.080.000
Rp
898.200.000
Table 5.25 Indirect Labor Cost
No. Position Salary per
Month
Number
of
Employee
Gross Salary Penghasilan
Tidak Kena
Pajak (Per Year)
PPH
1 Stakeholder
and
Financial
Department
Rp10.000.000,00 1 Rp10.000.000,00 Rp15.840.000,00 Rp15.624.000,00
2 Rp5.000.000,00 1 Rp5.000.000,00 Rp15.840.000,00 Rp6.624.000,00
3 Rp5.000.000,00 1 Rp5.000.000,00 Rp15.840.000,00 Rp6.624.000,00
4 General
Support and
Service
Department
Rp5.000.000,00 1 Rp5.000.000,00 Rp15.840.000,00 Rp6.624.000,00
5 HRD
Department
Rp3.000.000,00 1 Rp3.000.000,00 Rp15.840.000,00 Rp3.024.000,00
6 Rp3.000.000,00 1 Rp3.000.000,00 Rp15.840.000,00 Rp3.024.000,00
7 HSE and
Maintenance
Department
Rp5.000.000,00 1 Rp5.000.000,00 Rp15.840.000,00 Rp6.624.000,00
8 Rp5.000.000,00 1 Rp5.000.000,00 Rp15.840.000,00 Rp6.624.000,00
9 Product
Planning and
Rp6.000.000,00 1 Rp6.000.000,00 Rp15.840.000,00 Rp8.424.000,00
10 Rp6.000.000,00 1 Rp6.000.000,00 Rp15.840.000,00 Rp8.424.000,00

67
Universitas Indonesia
11 Development
Department
Rp6.000.000,00 1 Rp6.000.000,00 Rp15.840.000,00 Rp8.424.000,00
12 Sales and
Marketing
Department
Rp4.000.000,00 1 Rp4.000.000,00 Rp15.840.000,00 Rp4.824.000,00
13 Rp4.000.000,00 1 Rp4.000.000,00 Rp15.840.000,00 Rp4.824.000,00
Total per Month 13 Rp67.000.000,00 Rp89.712.000,00
Total per Year Rp134.000.000,00 Rp422.658.000,00
Table 5.26 Patent Fee
Patent Request Rp 1.725.000
Pendaftaran Pencatatan Perjanjian
Lisensi
Rp 2.000.000
Lisence Obligation Request Rp 6.000.000
List of patent request Rp 300.000
Patent maintenance fee Rp 2.150.000 year 1
Rp 2.150.000 year 2
Rp 2.150.000 year 3
Rp 3.100.000 year 4
Rp 3.100.000 year 5
Rp 4.650.000 year 6
Rp 6.200.000 year 7
Rp 6.200.000 year 8
Rp 7.950.000 year 9
Rp 10.750.000 year 10
Administration fee Rp 1.000.000
Regional Patent Implementation fee Rp 3.000.000
Total Patent fee Rp 62.425.000
Table 5.27 Copyright Fee
Copyright request fee Rp 200.000
Copyright certification fee Rp 100.000
List of copyright request Rp 50.000
Copyright lisence fee Rp 75.000
Total copyright fee Rp 425.000
Table 5.28 Industry Design Fee
Industry design registration fee Rp 600.000
List of Industry design certificate fee Rp 100.000
Design Industry Priority Document Request Rp 100.000
Copy of Industry Design Certificate Request Rp 100.000
Agreement Letter of Design Industry Lisence Rp 250.000
Total Industry Design Fee Rp 1.150.000

68
Universitas Indonesia
Table 5.29 Brand Fee
Request of Brand Registration Rp 600.000
Extention of Brand Protection Fee Rp 2.000.000
Brand Certificate fee Rp 100.000
Lisence Agreement Record Rp 500.000
Brand Registration Request Fee Rp 150.000
Total Brand Fee Rp 3.350.000
Table 5.30 Distribution Cost From Factory to Distribution Center
Factory Location Cost Bali Yogyakarta-Solo-
Semarang-Surabaya
Jabodetabek
Cikarang Fuels Rp6.000.000,00 Rp4.000.000,00 Rp700.000,00
Ship Fee Rp400.000,00 - -
Driver's fee Rp2.300.000,00 Rp1.700.000,00 Rp500.000,00
Port fee Rp100.000,00 - -
Toll fee Rp300.000,00 Rp200.000,00 Rp150.000,00
Rp6.800.000,00 Rp4.900.000,00 Rp950.000,00
Total distribution cost from factory to distribution centre per month Rp29.000.000,00
Total distribution cost from factory to distribution centre per year Rp348.000.000,00
Table 5.31 Distribution Cost From Distribution Center to Retailer (Jabodetabek Area)
Location Traditional market Cost
Jakarta Pasar RayaKramat Jati Rp367.196
Pasar Jatinegara Rp239.964
Pasar Pagi Mangga Dua Rp367.196
Pasar Cijantung Rp239.964
Pasar Grogol Rp239.964
Pasar Pramuka Rp239.964
Tanggerang Pasar Anyar, KecTanggerang Rp367.196
Pasar Bandeng, Kec Karawaci Rp239.964
Pasar Jatiwurung, Kec. Priuk Rp239.964
Pasar Malabar, Kec. Cibodas Rp239.964
Gasar Gerendeng, Kec. Karawaci Rp239.964
Bogor Pasar Kebon Kembang, Jl Dewi Sartika Rp331.460
Pasar Bogor, JL. Surya Kencana Rp331.460
Pasar Induk Cimanggu, Jl. Baru Kemang Rp331.460
Pasar Induk Jambu Dua, Jl. Pajajaran Rp331.460
Pasar Induk TU Kemang, Jl.Baru Kemang Rp331.460
Depok PasarMusi Rp331.460
Pasar KemirimukaKel.Kemirimuka, Kec. Beji Rp331.460
Pasar Cisalak Kel. Cisalak Pasar, kec. Cimanggis Rp331.460
Pasar Agung Kel. Depok Jaya, Kec. Pancoran Mas Rp331.460

69
Universitas Indonesia
Pasar CinereKel.Cinere, Kec. Limo Rp331.460
Bandung Pasar Puyuh, Kec Coblong Rp459.120
Pasar Wastukencana, Kec. Bandung Waten Rp300.080
Pasar Binong, Kec. Kiaracondong Rp300.080
Pasar Saerun, Kec. Batununggal Rp300.080
Pasar Taman Senang, Kec. Bojongloa Kaler Rp459.120
Total per Week Rp8.154.380
Total per Year Rp424.027.760
Table 5.32 Distribution Cost From Distribution Center to Retailer (Java Area)
Location Traditional Market Cost (Rp)
Solo Pasar Lengking Rp580.470,00
Pasar Tawangkuno Rp700.892,00
Yogyakarta Pasar Beringharjo Rp570.780,00
Pasar Giwangan Rp589.660,00
Semarang Pasar Johar Rp307.484,00
Pasar Prambean Rp307.484,00
Surabaya Pasar Kapasari Rp250.130,00
Pasar Aswatomo Rp156.278,00
Rp156.278,00
Total per week Rp3.619.456,00
Total per year Rp188.211.712,00
Table 5.33 Distribution Cost From Distribution Center to Retailer (Bali Area)
Area Retailer Cost (Rp)
Bali Pasar Kumbasari Rp604.408,00
Pasar Ubud Rp604.408,00
Total per week Rp1.208.816,00
Total per year Rp62.858.432,00
Table 5.34 Marketing Cost in Printed Media
No Printed Media Types Dimension
(mmk)
Cost per
Dimension
Time
(day/year)
Total Cost
1 Harian Media
Indonesia
Display
Full Color
400 Rp 65,500.00 3 Rp
78,600,000.00
2 Nova Display
Full Color
600 Rp 76,000.00 4 Rp
182,400,000.00
Total Printed Media Cost Rp
386,200,000.00
Table 5.35 Marketing Cost in Online Media
No Web Address Time Price
1 Google Adsense - Free

70
Universitas Indonesia
2 http://www.kaskus.us/ 30 hari Rp. 1,800,000
3 www.detik.com 30 hari Rp. 2,300,000
4 http://www.iklan-gratis.com/ 30 hari Free
Total Advertising Online Rp. 4,100,000
Table 5.36 Marketing Cost in Radio
No Radio Station Period Time Duration Cost per
duration
Cost per year
1 Gen FM Prime
Time
06.00-
10.00
60 detik Rp.
525000
Rp7.875.000
Prime
Time
15.00-
21.00
60 detik Rp.
525000
Rp7.875.000
2 101 Jak FM Prime
Time
06.00-
10.00
60 detik
x 2
Rp.
750000
Rp7.500.000
Prime
Time
16.00-
20.00
60 detik
x 2
Rp.
50000
Rp11.250.000
Prime
Time
10.00-
14.00
60 detik
x 2
Rp.
600000
Rp9.000.000
Total Radio Advertising Cost Rp43.500.000
Table 5.37 Creating an Developing Website Cost
No Types Cost
1 Creating Website Cost Rp500,00
2 Design Website Cost Rp500,00
3 Annual Cost Rp 1,200,000
Total cost of creating and developing website Rp 2,200,000
Table 5.38 Detail of Employee Insurance Cost
Insurance Type Total Cost
Jaminan Kecelakaan Kerja Rp10.195.680,00
Jaminan Hari Tua Rp80.945.400,00
Jaminan Pemeliharaan
Kesehatan
Rp75.186.000,00
Total Biaya Asuransi Rp166.327.080,00
Table 5.39 Product Pricing
Low (85%) Moderate (100%) High (115%)
Sales Volume (unit) 228.033.750 268.275.000 308.516.250
Direct Material (DM) Rp 109.161.119.100,00 Rp 128.424.846.000 Rp 147.688.572.900,00
Direct Labor (DL) Rp 763.470.000,00 Rp 898.200.000 Rp 1.032.930.000,00
Factory Overhead (FOH) Rp 3.629.572.259,55 Rp 4.270.085.011 Rp 4.910.597.762,92
Marketing Expenses
(ME)
Rp 427.635.000,00 Rp 503.100.000 Rp 578.565.000,00

71
Universitas Indonesia
Distribution Expenses Rp 869.633.218,40 Rp1.023.097.904,00 Rp 1.176.562.589,60
Invest (CAPEX) Rp 5.789.003.074,53 Rp 5.789.003.075 Rp 5.789.003.074,53
General & Adm.
Expenses
Rp 25.500.000,00 Rp 25.500.000 Rp 25.500.000,00
Total Cost (COGs)
(100%)
Rp 120.665.932.652,48 Rp 140.933.831.990 Rp 161.201.731.327,06
Expected π (1%) Rp 1.206.659.327 Rp 1.409.338.320 Rp 1.612.017.313
Expected Sales Revenues Rp 121.872.591.979,01 Rp 142.343.170.310 Rp 162.813.748.640,33
Gross Value (in Rp/unit) Rp 534,45 Rp 531 Rp 527,73
Net Value (PPN 10%) Rp 587,89 Rp 584 Rp 580,50
Table 5.40 Loan From Bank
Year Bank Loan Nominal Interest Loan Paying Salvage
0 Rp
2.723.147.046
1 Rp
2.723.147.046
Rp
285.930.440
-Rp727.558.161 Rp
2.281.519.325
2 Rp
2.281.519.325
Rp
239.559.529
-Rp727.558.161 Rp
1.793.520.693
3 Rp
1.793.520.693
Rp
188.319.673
-Rp727.558.161 Rp
1.254.282.205
4 Rp
1.254.282.205
Rp
131.699.632
-Rp727.558.161 Rp
658.423.675
5 Rp
658.423.675
Rp
69.134.486
-Rp727.558.161 Rp
-
Total Paying Nominal Interest Rp
914.643.759
Table 5.41 Loan From Investor
Year Investor Loan Nominal Interest Loan Paying Salvage
0 Rp
4.084.720.569
1 Rp
4.084.720.569
Rp
408.472.056,94
-Rp1.077.538.996 Rp
3.415.653.630
2 Rp
3.415.653.630
Rp
341.565.363,04
-Rp1.077.538.996 Rp
2.679.679.997
3 Rp
2.679.679.997
Rp
267.967.999,75
-Rp1.077.538.996 Rp
1.870.109.001
4 Rp
1.870.109.001
Rp
187.010.900,12
-Rp1.077.538.996 Rp
979.580.905
5 Rp
979.580.905
Rp
97.958.090,54
-Rp1.077.538.996 Rp0
Total paying investor nominal
interest
Rp
1.302.974.410

72
Universitas Indonesia
Table 5.42 Depreciation of Main Equipment
Tools n Total Price Life Time R Depreciation
(Rp) 2016
Salvage Value
(Rp)
Depreciation
(Rp) 2017
Salvage Value
(Rp)
Depreciation
(Rp) 2018
Grinder 1 Rp 37.929.873 10 0,2 Rp 7.585.975 Rp 30.343.898 Rp 6.068.780 Rp 24.275.119 Rp 4.855.024
Oven Drier 7 Rp 371.225.889 10 0,2 Rp 74.245.178 Rp 296.980.712 Rp 59.396.142 Rp 237.584.569 Rp 47.516.914
Hot Press Machine 1 Rp 22.131.307 10 0,2 Rp 4.426.261 Rp 17.705.046 Rp 3.541.009 Rp 14.164.037 Rp 2.832.807
Moulding Machine 4 Rp 526.768.239 10 0,2 Rp 105.353.648 Rp 421.414.591 Rp 84.282.918 Rp 337.131.673 Rp 67.426.335
Total Depretiation Rp 191.611.062 Rp 153.288.849 Rp 122.631.080
Salvage Value
(Rp)
Depreciation
(Rp) 2019
Salvage Value
(Rp)
Depreciation
(Rp) 2020
Salvage Value
(Rp)
Depreciation
(Rp) 2021
Salvage Value
(Rp)
Depreciation (Rp)
2022
Rp 19.420.095 Rp 3.884.019 Rp 15.536.076 Rp 3.107.215 Rp 12.428.861 Rp 2.485.772 Rp 9.943.089 Rp 1.988.618
Rp 190.067.655 Rp 38.013.531 Rp 152.054.124 Rp 30.410.825 Rp 121.643.299 Rp 24.328.660 Rp 97.314.640 Rp 19.462.928
Rp 11.331.229 Rp 2.266.246 Rp 9.064.984 Rp 1.812.997 Rp 7.251.987 Rp 1.450.397 Rp 5.801.589 Rp 1.160.318
Rp 269.705.338 Rp 53.941.068 Rp 215.764.271 Rp 43.152.854 Rp 172.611.417 Rp 34.522.283 Rp 138.089.133 Rp 27.617.827
Rp 98.104.864 Rp 78.483.891 Rp 62.787.113 Rp 50.229.690
Salvage Value (Rp) Depreciation (Rp)
2023
Salvage Value (Rp) Depreciation (Rp)
2024
Salvage Value (Rp) Depreciation (Rp)
2025
Salvage Value (Rp)
Rp 7.954.471 Rp 1.590.894 Rp 6.363.577 Rp 1.272.715 Rp 5.090.861 Rp 1.018.172 Rp 4.072.689
Rp 77.851.712 Rp 15.570.342 Rp 62.281.369 Rp 12.456.274 Rp 49.825.095 Rp 9.965.019 Rp 39.860.076
Rp 4.641.272 Rp 928.254 Rp 3.713.017 Rp 742.603 Rp 2.970.414 Rp 594.083 Rp 2.376.331
Rp 110.471.307 Rp 22.094.261 Rp 88.377.045 Rp 17.675.409 Rp 70.701.636 Rp 14.140.327 Rp 56.561.309
Rp 40.183.752 Rp 32.147.002 Rp 25.717.601

73
Universitas Indonesia
Table 5.43 Depreciation of Supporting Equipment
No Tools n Total Price Life Time R Depreciation
(Rp) 2015
Salvage Value
(Rp)
Depreciation
(Rp) 2016
Salvage Value
(Rp)
1 Computer 6 Rp 24.100.000 8 0,25 Rp 6.025.000 Rp 18.075.000 Rp 4.518.750 Rp 13.556.250
2 Fax 1 Rp 1.000.000 8 0,25 Rp 250.000 Rp 750.000 Rp 187.500 Rp 562.500
3 Photocopy Machine 1 Rp 10.000.000 8 0,25 Rp 2.500.000 Rp 7.500.000 Rp 1.875.000 Rp 5.625.000
4 Scanner 1 Rp 600.000 8 0,25 Rp 150.000 Rp 450.000 Rp 112.500 Rp 337.500
5 Printer 6 Rp 8.500.000 8 0,25 Rp 2.125.000 Rp 6.375.000 Rp 1.593.750 Rp 4.781.250
6 Projector 1 Rp 3.200.000 8 0,25 Rp 800.000 Rp 2.400.000 Rp 600.000 Rp 1.800.000
7 Chair 20 Rp 8.200.000 8 0,25 Rp 2.050.000 Rp 6.150.000 Rp 1.537.500 Rp 4.612.500
8 Table 20 Rp 10.300.000 8 0,25 Rp 2.575.000 Rp 7.725.000 Rp 1.931.250 Rp 5.793.750
9 Cabinet 3 Rp 4.800.000 8 0,25 Rp 1.200.000 Rp 3.600.000 Rp 900.000 Rp 2.700.000
10 Fan 3 Rp 1.650.000 8 0,25 Rp 412.500 Rp 1.237.500 Rp 309.375 Rp 928.125
11 Air Conditioner 1 Rp 2.500.000 8 0,25 Rp 625.000 Rp 1.875.000 Rp 468.750 Rp 1.406.250
12 Trash Can 5 Rp 125.000 8 0,25 Rp 31.250 Rp 93.750 Rp 23.438 Rp 70.313
13 Office Equipment 100 Rp 2.000.000 4 0,5 Rp 1.000.000 Rp 1.000.000 Rp 500.000 Rp 500.000
14 Alarm Bell 5 Rp 750.000 8 0,25 Rp 187.500 Rp 562.500 Rp 140.625 Rp 421.875
15 Fire Extuingisher 5 Rp 1.250.000 8 0,25 Rp 312.500 Rp 937.500 Rp 234.375 Rp 703.125
16 Masker 100 Rp 100.000 4 0,5 Rp 50.000 Rp 50.000 Rp 25.000 Rp 25.000
17 Helm 40 Rp 8.150.000 8 0,25 Rp 2.037.500 Rp 6.112.500 Rp 1.528.125 Rp 4.584.375
18 Gloves 40 Rp 100.000 8 0,25 Rp 25.000 Rp 75.000 Rp 18.750 Rp 56.250
19 Safety Shoes 40 Rp 8.100.000 8 0,25 Rp 2.025.000 Rp 6.075.000 Rp 1.518.750 Rp 4.556.250
20 Dispenser 3 Rp 3.100.000 8 0,25 Rp 775.000 Rp 2.325.000 Rp 581.250 Rp 1.743.750
21 Truck 4 Rp 577.100.000 5 0,4 Rp 230.840.000 Rp 346.260.000 Rp 138.504.000 Rp 207.756.000

74
Universitas Indonesia
22 Operational Car 1 Rp 115.300.000 5 0,4 Rp 46.120.000 Rp 69.180.000 Rp 27.672.000 Rp 41.508.000
23 Motorcycle 1 Rp 12.200.000 5 0,4 Rp 4.880.000 Rp 7.320.000 Rp 2.928.000 Rp 4.392.000
24 Electrical Generator 1 Rp 7.100.000 5 0,4 Rp 2.840.000 Rp 4.260.000 Rp 1.704.000 Rp 2.556.000
25 Lamp 72 Rp 3.700.000 8 0,25 Rp 925.000 Rp 2.775.000 Rp 693.750 Rp 2.081.250
26 Room Air Freshener 8 Rp 720.000 8 0,25 Rp 180.000 Rp 540.000 Rp 135.000 Rp 405.000
27 CCTV 8 Rp 2.800.000 8 0,25 Rp 700.000 Rp 2.100.000 Rp 525.000 Rp 1.575.000
Total Depretiation Rp 311.641.250 Rp 190.766.438
Depreciation
(Rp) 2017
Salvage Value
(Rp)
Depreciation
(Rp) 2018
Salvage Value
(Rp)
Depreciation
(Rp) 2019
Salvage Value
(Rp)
Depreciation
(Rp) 2020
Salvage Value
(Rp)
Rp 3.389.063 Rp 10.167.188 Rp 2.541.797 Rp 7.625.391 Rp 1.906.348 Rp 5.719.043 Rp 1.429.761 Rp 4.289.282
Rp 140.625 Rp 421.875 Rp 105.469 Rp 316.406 Rp 79.102 Rp 237.305 Rp 59.326 Rp 177.979
Rp 1.406.250 Rp 4.218.750 Rp 1.054.688 Rp 3.164.063 Rp 791.016 Rp 2.373.047 Rp 593.262 Rp 1.779.785
Rp 84.375 Rp 253.125 Rp 63.281 Rp 189.844 Rp 47.461 Rp 142.383 Rp 35.596 Rp 106.787
Rp 1.195.313 Rp 3.585.938 Rp 896.484 Rp 2.689.453 Rp 672.363 Rp 2.017.090 Rp 504.272 Rp 1.512.817
Rp 450.000 Rp 1.350.000 Rp 337.500 Rp 1.012.500 Rp 253.125 Rp 759.375 Rp 189.844 Rp 569.531
Rp 1.153.125 Rp 3.459.375 Rp 864.844 Rp 2.594.531 Rp 648.633 Rp 1.945.898 Rp 486.475 Rp 1.459.424
Rp 1.448.438 Rp 4.345.313 Rp 1.086.328 Rp 3.258.984 Rp 814.746 Rp 2.444.238 Rp 611.060 Rp 1.833.179
Rp 675.000 Rp 2.025.000 Rp 506.250 Rp 1.518.750 Rp 379.688 Rp 1.139.063 Rp 284.766 Rp 854.297
Rp 232.031 Rp 696.094 Rp 174.023 Rp 522.070 Rp 130.518 Rp 391.553 Rp 97.888 Rp 293.665
Rp 351.563 Rp 1.054.688 Rp 263.672 Rp 791.016 Rp 197.754 Rp 593.262 Rp 148.315 Rp 444.946
Rp 17.578 Rp 52.734 Rp 13.184 Rp 39.551 Rp 9.888 Rp 29.663 Rp 7.416 Rp 22.247
Rp 250.000 Rp 250.000 Rp 125.000 Rp 125.000 Rp 62.500 Rp 62.500 Rp - Rp -

75
Universitas Indonesia
Rp 105.469 Rp 316.406 Rp 79.102 Rp 237.305 Rp 59.326 Rp 177.979 Rp 44.495 Rp 133.484
Rp 175.781 Rp 527.344 Rp 131.836 Rp 395.508 Rp 98.877 Rp 296.631 Rp 74.158 Rp 222.473
Rp 12.500 Rp 12.500 Rp 6.250 Rp 6.250 Rp 3.125 Rp 3.125 Rp - Rp -
Rp 1.146.094 Rp 3.438.281 Rp 859.570 Rp 2.578.711 Rp 644.678 Rp 1.934.033 Rp 483.508 Rp 1.450.525
Rp 14.063 Rp 42.188 Rp 10.547 Rp 31.641 Rp 7.910 Rp 23.730 Rp 5.933 Rp 17.798
Rp 1.139.063 Rp 3.417.188 Rp 854.297 Rp 2.562.891 Rp 640.723 Rp 1.922.168 Rp 480.542 Rp 1.441.626
Rp 435.938 Rp 1.307.813 Rp 326.953 Rp 980.859 Rp 245.215 Rp 735.645 Rp 183.911 Rp 551.733
Rp 83.102.400 Rp 124.653.600 Rp 49.861.440 Rp 74.792.160 Rp 29.916.864 Rp 44.875.296 Rp 17.950.118 Rp 26.925.178
Rp 16.603.200 Rp 24.904.800 Rp 9.961.920 Rp 14.942.880 Rp 5.977.152 Rp 8.965.728 Rp 3.586.291 Rp 5.379.437
Rp 1.756.800 Rp 2.635.200 Rp 1.054.080 Rp 1.581.120 Rp 632.448 Rp 948.672 Rp 379.469 Rp 569.203
Rp 1.022.400 Rp 1.533.600 Rp 613.440 Rp 920.160 Rp 368.064 Rp 552.096 Rp 220.838 Rp 331.258
Rp 520.313 Rp 1.560.938 Rp 390.234 Rp 1.170.703 Rp 292.676 Rp 878.027 Rp 219.507 Rp 658.521
Rp 101.250 Rp 303.750 Rp 75.938 Rp 227.813 Rp 56.953 Rp 170.859 Rp 42.715 Rp 128.145
Rp 393.750 Rp 1.181.250 Rp 295.313 Rp 885.938 Rp 221.484 Rp 664.453 Rp 166.113 Rp 498.340
Rp 117.322.378 Rp 72.553.439 Rp 45.158.634 Rp 28.285.578
Depreciation (Rp)
2021
Salvage Value
(Rp)
Depreciation (Rp)
2022
Salvage Value
(Rp)
Rp 1.072.321 Rp 3.216.962 Rp 804.240 Rp 2.412.721
Rp 44.495 Rp 133.484 Rp 33.371 Rp 100.113
Rp 444.946 Rp 1.334.839 Rp 333.710 Rp 1.001.129
Rp 26.697 Rp 80.090 Rp 20.023 Rp 60.068
Rp 378.204 Rp 1.134.613 Rp 283.653 Rp 850.960
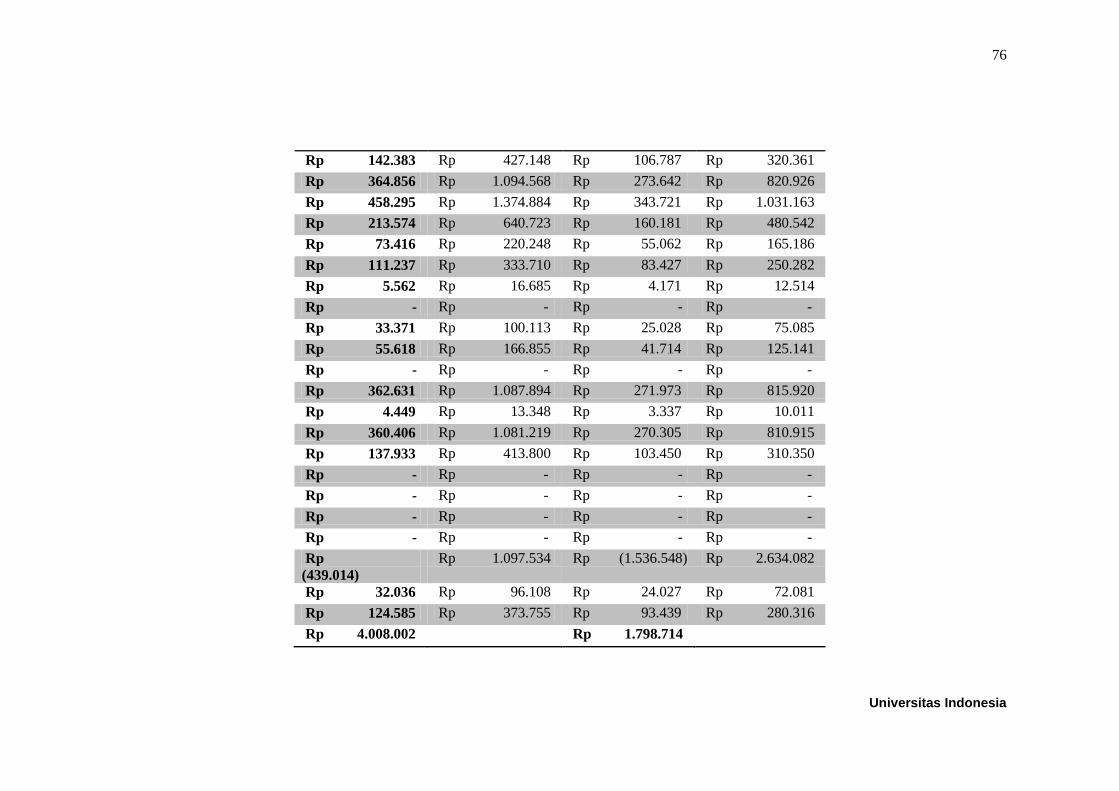
76
Universitas Indonesia
Rp 142.383 Rp 427.148 Rp 106.787 Rp 320.361
Rp 364.856 Rp 1.094.568 Rp 273.642 Rp 820.926
Rp 458.295 Rp 1.374.884 Rp 343.721 Rp 1.031.163
Rp 213.574 Rp 640.723 Rp 160.181 Rp 480.542
Rp 73.416 Rp 220.248 Rp 55.062 Rp 165.186
Rp 111.237 Rp 333.710 Rp 83.427 Rp 250.282
Rp 5.562 Rp 16.685 Rp 4.171 Rp 12.514
Rp - Rp - Rp - Rp -
Rp 33.371 Rp 100.113 Rp 25.028 Rp 75.085
Rp 55.618 Rp 166.855 Rp 41.714 Rp 125.141
Rp - Rp - Rp - Rp -
Rp 362.631 Rp 1.087.894 Rp 271.973 Rp 815.920
Rp 4.449 Rp 13.348 Rp 3.337 Rp 10.011
Rp 360.406 Rp 1.081.219 Rp 270.305 Rp 810.915
Rp 137.933 Rp 413.800 Rp 103.450 Rp 310.350
Rp - Rp - Rp - Rp -
Rp - Rp - Rp - Rp -
Rp - Rp - Rp - Rp -
Rp - Rp - Rp - Rp -
Rp
(439.014)
Rp 1.097.534 Rp (1.536.548) Rp 2.634.082
Rp 32.036 Rp 96.108 Rp 24.027 Rp 72.081
Rp 124.585 Rp 373.755 Rp 93.439 Rp 280.316
Rp 4.008.002 Rp 1.798.714

77
Universitas Indonesia
Table 5.44 Cashflow Calculation
Year Income
Loan Sales Percentage Revenue Salvage Value
Bank Investor
0 Rp 1.784.699.046 Rp 2.677.048.569
1 50% Rp 114.016.875.000
2 70% Rp 159.623.625.000
3 100% Rp 228.033.750.000
4 100% Rp 228.033.750.000 Rp 62.500
5 100% Rp 228.033.750.000
6 100% Rp 228.033.750.000
7 100% Rp 228.033.750.000
8 100% Rp 228.033.750.000 Rp 12.702.367
9 100% Rp 228.033.750.000
10 100% Rp 228.033.750.000 Rp 220.982.006
Year Outcome
Capital Cost Operating Cost Loan Payment Interest Payment
Bank Investor Bank Investor
0 Rp
(4.461.747.616)
1 Rp
178.380.958.679
Rp
476.827.852
Rp
706.198.669
Rp
187.393.400
Rp
267.704.857
2 Rp
178.380.958.679
Rp
476.827.852
Rp
706.198.669
Rp
86.313.446
Rp
223.855.476

78
Universitas Indonesia
3 Rp
178.380.958.679
Rp
476.827.852
Rp
706.198.669
Rp
45.309.434
Rp
175.621.156
4 Rp
178.380.958.679
Rp
706.198.669
Rp
122.563.405
5 Rp 2.100.000 Rp
178.380.958.679
Rp
706.198.669
Rp
64.199.879
6 Rp
711.700.000
Rp
178.380.958.679
7 Rp
178.380.958.679
8 Rp
178.380.958.679
9 Rp
103.645.000
Rp
178.380.958.679
10 Rp
178.380.958.679
Year BTCF Depreciation Pendapatan
Kena Pajak
Income Tax ATCF Cumulative Tax
0 Rp
(4.461.747.616)
Rp
(4.461.747.616)
Rp
(1.115.436.904)
1 Rp
(66.002.208.456)
Rp
723.252.312
Rp
(66.725.460.768)
Rp
(10.008.819.115)
Rp
(56.716.641.652)
Rp
(61.178.389.268)
Rp
(14.179.160.413)
2 Rp
(20.250.529.121)
Rp
520.055.287
Rp
(20.770.584.408)
Rp
(3.115.587.661)
Rp
(17.654.996.747)
Rp
(78.833.386.015)
Rp
(4.413.749.187)
3 Rp
48.248.834.211
Rp
126.160.127
Rp
48.122.674.083
Rp
7.218.401.113
Rp
40.904.272.971
Rp
(37.929.113.044)
Rp
10.226.068.243

79
Universitas Indonesia
4 Rp
48.824.091.748
Rp
283.298.302
Rp
48.540.793.445
Rp
7.281.119.017
Rp
41.259.674.428
Rp
3.330.561.384
Rp
10.314.918.607
5 Rp
48.880.292.774
Rp
213.754.525
Rp
48.666.538.248
Rp
7.299.980.737
Rp
41.366.557.511
Rp
44.697.118.896
Rp
10.341.639.378
6 Rp
48.941.091.321
Rp
163.162.291
Rp
48.777.929.031
Rp
7.316.689.355
Rp
41.461.239.676
Rp
86.158.358.572
Rp
10.365.309.919
7 Rp
49.652.791.321
Rp
111.909.372
Rp
49.540.881.949
Rp
7.431.132.292
Rp
42.109.749.657
Rp
128.268.108.229
Rp
10.527.437.414
8 Rp
49.665.493.689
Rp
88.119.810
Rp
49.577.373.879
Rp
7.436.606.082
Rp
42.140.767.797
Rp
170.408.876.025
Rp
10.535.191.949
9 Rp
49.549.146.321
Rp
69.056.877
Rp
49.480.089.444
Rp
7.422.013.417
Rp
42.058.076.028
Rp
212.466.952.053
Rp
10.514.519.007
10 Rp
49.873.773.328
Rp
55.245.502
Rp
49.818.527.826
Rp
7.472.779.174
Rp
42.345.748.652
Rp
254.812.700.705
Rp
10.586.437.163