Water and Environment Sector Performance Report 2020
342
1 Government of Uganda Ministry of Water and Environment Water and Environment Sector Performance Report 2020 SEPTEMBER 2020
-
Upload
khangminh22 -
Category
Documents
-
view
5 -
download
0
Transcript of Water and Environment Sector Performance Report 2020
1
Government of Uganda
Ministry of Water and Environment
Water and Environment Sector Performance Report 2020
SEPTEMBER 2020
Uganda Water and Environment Sector Performance Report 2020
i
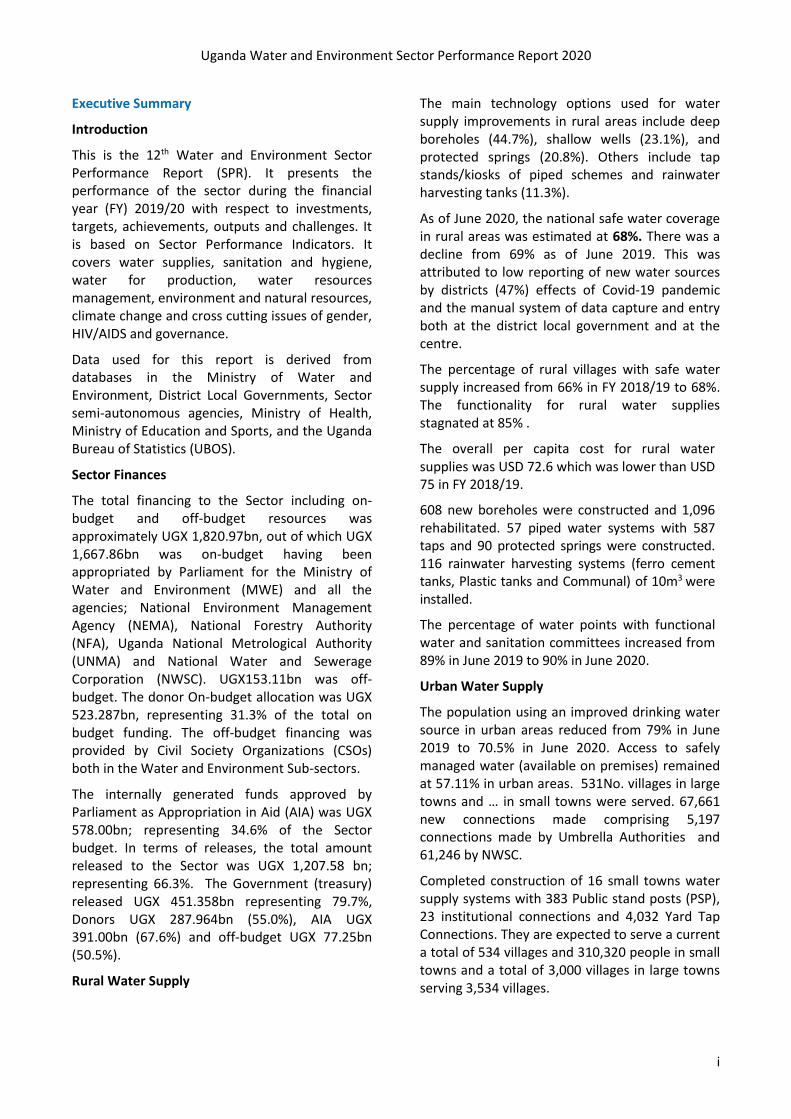
Executive Summary
Introduction
This is the 12th Water and Environment Sector Performance Report (SPR). It presents the performance of the sector during the financial year (FY) 2019/20 with respect to investments, targets, achievements, outputs and challenges. It is based on Sector Performance Indicators. It covers water supplies, sanitation and hygiene, water for production, water resources management, environment and natural resources, climate change and cross cutting issues of gender, HIV/AIDS and governance.
Data used for this report is derived from databases in the Ministry of Water and Environment, District Local Governments, Sector semi-autonomous agencies, Ministry of Health, Ministry of Education and Sports, and the Uganda Bureau of Statistics (UBOS).
Sector Finances
The total financing to the Sector including on-budget and off-budget resources was approximately UGX 1,820.97bn, out of which UGX 1,667.86bn was on-budget having been appropriated by Parliament for the Ministry of Water and Environment (MWE) and all the agencies; National Environment Management Agency (NEMA), National Forestry Authority (NFA), Uganda National Metrological Authority (UNMA) and National Water and Sewerage Corporation (NWSC). UGX153.11bn was off-budget. The donor On-budget allocation was UGX 523.287bn, representing 31.3% of the total on budget funding. The off-budget financing was provided by Civil Society Organizations (CSOs) both in the Water and Environment Sub-sectors.
The internally generated funds approved by Parliament as Appropriation in Aid (AIA) was UGX 578.00bn; representing 34.6% of the Sector budget. In terms of releases, the total amount released to the Sector was UGX 1,207.58 bn; representing 66.3%. The Government (treasury) released UGX 451.358bn representing 79.7%, Donors UGX 287.964bn (55.0%), AIA UGX 391.00bn (67.6%) and off-budget UGX 77.25bn (50.5%).
Rural Water Supply
The main technology options used for water supply improvements in rural areas include deep boreholes (44.7%), shallow wells (23.1%), and protected springs (20.8%). Others include tap stands/kiosks of piped schemes and rainwater harvesting tanks (11.3%).
As of June 2020, the national safe water coverage in rural areas was estimated at 68%. There was a decline from 69% as of June 2019. This was attributed to low reporting of new water sources by districts (47%) effects of Covid-19 pandemic and the manual system of data capture and entry both at the district local government and at the centre.
The percentage of rural villages with safe water supply increased from 66% in FY 2018/19 to 68%. The functionality for rural water supplies stagnated at 85% .
The overall per capita cost for rural water supplies was USD 72.6 which was lower than USD 75 in FY 2018/19.
608 new boreholes were constructed and 1,096 rehabilitated. 57 piped water systems with 587 taps and 90 protected springs were constructed. 116 rainwater harvesting systems (ferro cement tanks, Plastic tanks and Communal) of 10m3 were installed.
The percentage of water points with functional water and sanitation committees increased from 89% in June 2019 to 90% in June 2020.
Urban Water Supply
The population using an improved drinking water source in urban areas reduced from 79% in June 2019 to 70.5% in June 2020. Access to safely managed water (available on premises) remained at 57.11% in urban areas. 531No. villages in large towns and … in small towns were served. 67,661 new connections made comprising 5,197 connections made by Umbrella Authorities and 61,246 by NWSC.
Completed construction of 16 small towns water supply systems with 383 Public stand posts (PSP), 23 institutional connections and 4,032 Yard Tap Connections. They are expected to serve a current a total of 534 villages and 310,320 people in small towns and a total of 3,000 villages in large towns serving 3,534 villages.

Uganda Water and Environment Sector Performance Report 2020
ii
NWSC geographical coverage increased from 253 towns as at 30th June 2019 to 258 towns as at 30th June 2020, a growth of 2%.
Functionality of small towns and rural growth centres piped water supply systems reduced from 94.3% in June 2019 to 81.23%. This decline was as a result of taking over many schemes that were originally not functional at all. In large towns, the average hours of service were 18 hours per day.
Non-Revenue Water (NRW) increased from 30.73% to 33.5% in large towns and from 33% to 37.78% in small towns and RGCs.
The average per capita investment cost for the new water facilities was USD57.95 compared to USD 58 in FY 2018/19.
Water for Production
The cumulative WfP storage increased from 41.124 million m3 in FY 2018/19 to 42.0 million m3.
The Ministry has completed construction of four (4) medium scale Irrigation schemes of Olweny in Lira District, Agoro in Lamwo District, Mubuku I in Kasese District and Doho I in Butaleja District.
Constructed Sixteen (16) valley tanks in the Districts of Soroti (1), Butebo (1), Kapelebyong (1), Kumi (1), Bukedea (1), Kaabong (1), Kotido (1), Lyantonde (1), Mbarara (2), Butambala (1), Rukungiri (1), Ntungamo (1), Kyankwanzi (1), Sembabule (1), Bushenyi (1) and expanded one (1) valley tank in Bugiri District by 7,000m3 creating a water storage capacity of 256,000,000 litres Constructed thirty five (58) valley tanks in the Districts of Kiruhura (12), Mbarara (6), Kazo (1), Ntungamo (1), Gomba (1), Sembabule (3), Rakai (1), Lyantonde (9), Mubende (1), Busia (1), Nakapiripirit (1), Nabilatuk (1), Moroto (3), Kotido (5), Kamuli (1), Katakwi (2), Kapelebyong (1), Ngora (1), Amudat (3), Karenga (1), Amuria (1), Kumi (1) and Soroti (1) creating a water storage capacity of 645,000,000 litres. Completed construction of one (1) small scale Irrigation scheme in Nakaseke District. Functionality of WfP facilities remained at 87.2% and 88% of WfP facilities had functional management systems compared to 86% in FY 2018/19.
Water Resources Management
The average compliance to the permits (surface water, groundwater and waste water discharge) conditions increased to 77.6% from 73% in FY 2018/19. The proportion of water safely treated increased from 28% to 30%.
Status of the lakes and rivers was updated and daily updates provided to the Office of the Prime Minister. The Lake Victoria levels have continued to oscillate above the long-term average of 1134.37 metres above mean sea level (11.48 metres above the local datum) since the end of 2013. Lake Victoria recorded a new highest daily level of 13.49 metres on the afternoon of 19th May 2020.
A total of 629 samples were collected to assess the water quality for rural water sources compared to 1,107 samples in FY 2018/19. Compliance increased to 67% from 64% in the previous year. Water safety by technology type was; 81% of boreholes, 55% shallow wells and 37% protected springs had safe water for drinking based on compliance to bacteriological safety or E. coli. Samples taken from peri-urban water sources (protected springs) . 50% and 90% of protected springs in Entebbe and Kampala were contaminated with E.coli. The compliance levels with respect to E. coli for small towns was 94% compared to 96% in FY 2018/19. A total of 151 wastewater discharge facilities were monitored countrywide in the year under review. Industries monitored included tanneries, diaries, beverages, fish processing, sugar processing, other food processing factories and pharmaceuticals. The average compliance was at 30% which was a slight improvement comparable to that of the previous year which was at 28% Trans-boundary organizations continued to be supported through financial contributions and providing technical guidance. These include the Nile Basin Initiative (NBI), Lake Victoria Basin Commission (LVBC), Global Water Partnership (GWP). Implementation continued of trans-boundary projects; Multinational Lakes Edward

Uganda Water and Environment Sector Performance Report 2020
iii
and Albert Integrated Fisheries and Water Resources Management (LEAF II) Project is implemented nationally by Uganda and Democratic Republic of Congo. Five fish landing sites are under construction in various districts including 19 modern smoking kilns, 21.4 kilometres of feeder roads to the facilities, 50 modern sun drying facilities (platforms/racks), 8 sanitation facilities and 4 solar powered mini water supply systems to the fishing communities. Implementation of catchment restoration interventions is ongoing in rivers’ catchments of Sebwe in Kasese District, Tokwe and Humya in Bundibugyo District, and Semiliki in Ntoroko District.
Sanitation and Hygiene
Most districts implemented Community Led Total Sanitation (CLTS) and Home Improvement Campaigns (HIC) to improve their sanitation and hygiene status.
According to district reports, access to some form of sanitation in rural areas increased from 77.2% to 78%. In urban areas, access to some form of sanitation also increased from 87.9% to 89.1%. Use of basic sanitation in rural areas increased from 16.6% to 18% and in urban from 42.8% to 44.8%. Use of safely managed sanitation in rural areas remained at 7.1% and in urban areas increased from 37.4% to 38.9%.
The national standards recommend a pupil to stance ratio of 40:1 in schools. According to district reports, the national pupil: stance ratio increased from 71:1 to 72:1. Access to hand washing facilities in schools increased from 42% in FY 2018/19 to 58%.
District reports show that 22 % of the rural population were practising open defecation.
Three Faecal Sludge Management Facilities were constructed to completion including Dzaipi, Kamuli, Nakasongola (under test running).
CSOs Contribution to Water and Sanitation
Civil Society Organizations (CSOs) investment in FY 2019/20 was UGX 52.12 bn compared to UGX 69.13 bn in FY 2018/19. UGX 29.88 bn was invested in water supply and UGX 9.72 bn in sanitation and hygiene. UGX 3.08 bn in IWRM, UGX 0.77 bn in water for production, UGX 8.08 bn
in capacity building and UGX 0.60 bn in research and development.
CSOs reported construction of 251 boreholes, 110 rainwater harvesting tanks and 15 shallow wells. Rehabilitated 303 boreholes, 5 protected springs and 49 shallow wells. Constructed 10 piped water supply systems and rehabilitated/expanded 11.
Wetlands Management
In 1994, wetland coverage on the surface area of Uganda was 15.6%. However, over time this gradually reduced and is currently at 8.9%. This is attributed to expansion in Agriculture, industry and urbanisation. During the FY 2019/20, a total of 6,642.939 ha of critical wetlands were restored across the country.
Since FY 2012/13, the area of wetlands restored is 16,906.5ha (1.9%) of the 865,700ha of degraded section of wetland countrywide. 480.39Km of wetland boundary were demarcated across the country. The cumulative boundary of wetland demarcated since 2012 is 2208.9km (1.56%) out of the 141,366km earmarked for demarcation countrywide.
Forestry Management
De-forestation remains the major challenge which has led to decline of forest cover from 24% in 1990 to 10% in 2017. Currently the forest cover stands at 12.4%.
2,233ha of degraded natural forests were restored through planting indigenous tree species and bamboo. 6,123,553 tree seedlings were raised. 2,696.5 ha of local forest reserves were planted. 19,800.4ha of industrial tree plantations with above 70% survival were established (1,400.4ha by NFA and 18,400ha by licensed tree farmers). 307Km of forest boundary was resurveyed and marked with concrete pillars.
Supplied a total of 114,528,770 assorted seedlings out of the target 175 million seedlings to increase forest cover during NDP II (2015-2020), representing 65% performance. 26,398,947 of the annual planned 31,400,000 assorted seedlings (84%) were produced and supplied for tree planting from 12 NFA regional tree nurseries and 22 community nurseries for increasing tree cover across the country.
Environmental Support Services

Uganda Water and Environment Sector Performance Report 2020
iv
Six (6) districts were supported to develop bye-Law in Mbale (Wanale & Nyendo), Bulambuli (Bulageni & Sisiyi), and Manafwa (khabutoola & Nalondo) Mitoma, Ntungamo, and Buhweju. Project Briefs (PBs) and Environmental Impact Statements (EISs) totaling 1,381 were submitted to NEMA. 991 ESIA certificates were issued to the developers. Eighty (80) environmental inspectors were trained in Environment integrity and sustainability of the green and brown environment following the gazette of 774 environmental inspectors in FY 2018/19.
Meteorology, Weather and Climate Services
UNMA support to the Aviation sector provided through issuance of 2196 Terminal Aerodrome Forecasts and 13700 flight folders to enable air navigation in and outside the country. Four seasonal climate outlooks of July 2019-May 2020 issued for regions of Uganda and disseminated the seasonal forecasts of the September to December 2019 and the January to April 2020 season 36 Manual Weather Stations, 31 ADCON Automatic Weather Stations and 12 DAVIS Community Automatic Weather Stations' functionality improved across the country. State of the climate report for Uganda for 2019 was completed The first weather Radar was successfully installed in Kigungu-Entebbe and is operational. The procurement of the second Radar (Mwizi – Mbarara) is in advanced stages. Lira University-Lira - Radar equipment already shipped and civil works for its installation is ongoing at Lira University.
The performance of manual weather station was at 72%, automated weather stations 72% and rainfall stations 40%.
CSOs in Environment and Natural Resources (ENR)
CSOs active in ENR reported a contribution of USD 1,987,482.
Investment in environment constituted USD 529,425 for forestry, USD 467,909 for environment and USD 346,802 climate change among others.
Cross cutting issues
The percentage of Water Source Committees (WSC) with women holding key positions increased to 86% from 85%.
Critical Issues for the Sector
Inadequate financing to the sector remains a major challenge and affects the fulfilment of core functions.
Capacity gaps in the sector remains a critical issue particularly in newly created local governments, Umbrella Authorities and the ENR subsector.
Inequity in water service coverage is another critical issue affecting the sector. 17 least served districts with less than 55% coverage require special attention. The majority of these districts fall in the dry cattle corridor with low surface and ground water potential and require expensive technologies like bulk piped water supply.
The revised sector performance measurement framework, 2016 remains not disseminated. With limited support from UNICEF, the ministry produced a guide for computation of the WASH indicators but this also needs widespread dissemination across the Water and Sanitation sub-sector. This is partially responsible for the persistent lack of data (including baselines) on a number of sector performance indicators since FY 2016/17 the first year of implementation of the revised framework.

Uganda Water and Environment Sector Performance Report 2020
5
WATER AND ENVIRONMENT SECTOR PERFORMANCE INDICATORS
Performance Indicators (n/a = not applicable, ND = No Data)
2015/
16 2016/
17 2017/
18 2018/
19 2019/2
0
Water Supply
1. Basic water: Percentage of population using an improved drinking water source
Rural 67% 70% 70% 69% 68%
Urban 71% 71% 77% 79% 70.5%
2. Safely managed water: Percentage of population using safely managed drinking water services located on premises
Rural n/a ND ND ND ND
Urban n/a ND 20% 57.2% 57.11%
3. Percentage of villages with a source of safe water supply
Rural n/a 64% 66% 66% 68%
Urban n/a ND ND 28.3% 33.5%
4. Percentage of towns with pro-poor facilities where people pay less or equal to the house connection tariff in the service area
STs n/a ND 38% 31% 31%
NWSC n/a ND 83% ND ND
5. Functionality: rural: % of water sources functional at time of spot-check
Rural 86% 85% 85% 85% 85%
urban: % piped water service availability STs n/a 92% 93% 94.3% 81%
NWSC n/a ND ND ND ND
6a. Management - rural: % of water points with actively functioning Water & Sanitation Committees
Rural 87% 88% 89% 89% 90%
6b. Management – piped schemes: % of piped water schemes with formal contract-based management structure
STs n/a ND ND 100% 100%
7a. % Non-revenue water (piped schemes)
STs n/a ND 42% 33% 37.78%
NWSC 28% 31.3% 30.7% 30.73%
33.5%
7b. Customer satisfaction: NSWC´s customer satisfaction index
NWSC 88% 84% 85% 86% 77%
8. Financial Sustainability: Ratio between total revenue collection and O&M costs
STs n/a ND 158% 79% ND
9. Per Capita Investment Cost: Average cost per beneficiary of new water and sanitation schemes (USD)
Rural 32 32 68 75 72.6
Urban 65.5 54 58 58 58
10. Drinking water quality: % of water samples taken that comply with national standards (Point water sources / Piped schemes)
Rural 41% 59% 64% 59% 59%
STs n/a ND 89% 93.3% 91.6%
NWSC 99% 99.6% 99.3% 99.6% 98%
Sanitation and Hygiene
11. Basic sanitation: Percentage of population using an improved sanitation facility not shared with other households
Rural n/a ND ND 16.6% 18%
Urban n/a ND 36.3% 42.8%
44.8%
12. Safely managed sanitation: Percentage of population using safely managed sanitation services
Rural n/a ND ND 7.1% 7%
Urban n/a ND 26% 37.4% 39.2%.
13. Open defecation: Percentage of population practicing open defecation
Rural n/a ND 8% 22.9% 22%
Urban n/a ND 12.6% 12.1% 12.1%
14. Hand washing: Percentage of population with Rural 36% 37% 36.5% 36% 38%

Uganda Water and Environment Sector Performance Report 2020
6
Performance Indicators (n/a = not applicable, ND = No Data)
2015/
16 2016/
17 2017/
18 2018/
19 2019/2
0 hand washing facilities with soap and water at home
Urban 39.1% 40% 39.6% 40% 61.1%
Schools: Percentage of pupils enrolled in schools with basic hand washing facilities
Schools 34% 35% 40% 42% 58%
Water for Production
15. Cumulative Water for Production Storage Capacity (million m³)
37.2 38.9 39.3 41.124 42.025
16a. Irrigation: Proportion of irrigation potential utilized
n/a ND ND ND ND
17a. Irrigation: Proportion of actual water abstraction to total irrigation water requirement
n/a ND ND ND ND
18. WfP Functionality: % of water for production facilities that are functional at time of spot-check
84% 85% 86.7% 87.2% 87.8%
19. WfP Management: % of water for production facilities with actively functioning Water User Committees
81% 83% 84% 86% 88%
Water Resources Management
20. Compliance with permit conditions: % of permit holders complying with permit conditions
72% 71% 72% 73% 77.6%
21. Proportion of wastewater safely treated n/a ND ND 28% 30%
22. Proportion of bodies of water with good ambient water quality
n/a ND ND ND ND
23. Water use efficiency: Gross Value Added by irrigated agriculture per vol. of water used [USD/m3]
n/a ND ND ND ND
24. Level of water stress: Water withdrawal as a proportion of available water resources
n/a ND ND ND ND
Environment and Natural Resources
25. % Uganda’s land surface area covered by forest
10-11%
9% 9% 9% 12.4%
26. % forest area under management plans 35% 36% 34% 34.4% 34.4%
27. Proportion of population with primary reliance on clean fuels and technology
n/a ND ND ND ND
28. % Uganda’s land surface area covered by wetlands
10.90%
10.90%
10.9% 8.9% 8.9%
29. % wetland area with approved management plans
11.30%
11.30%
18.4% 18.4% 20.3%
Meteorology and Climate Change
30. % urban solid waste safely disposed of or recycled in municipalities
65%-70%
65%-70%
24% - 52%
ND ND
31. % weather observation stations operational and submitting data throughout the year
n/a ND 56% 60% 72%
32. % of districts with functioning early warning systems
n/a 28% 29% 48% 53%
33. CC Mitigation: n/a ND ND ND ND
34. CC Adaptation: % change in budgets for CC adaptation * ministries
n/a ND ND ND ND
35 % change in Uganda’s climate change n/a ND ND ND ND
Uganda Water and Environment Sector Performance Report 2020
7
Performance Indicators (n/a = not applicable, ND = No Data)
2015/
16 2016/
17 2017/
18 2018/
19 2019/2
0 vulnerability index
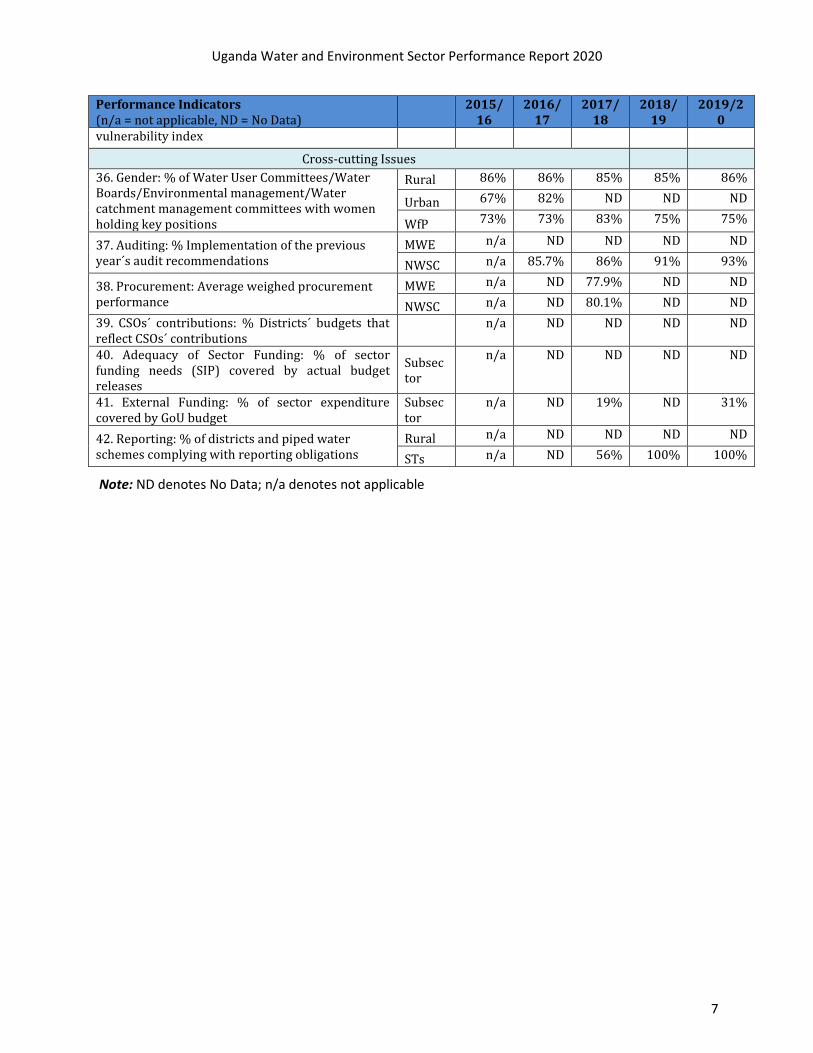
Cross-cutting Issues
36. Gender: % of Water User Committees/Water Boards/Environmental management/Water catchment management committees with women holding key positions
Rural 86% 86% 85% 85% 86%
Urban 67% 82% ND ND ND
WfP 73% 73% 83% 75% 75%
37. Auditing: % Implementation of the previous year´s audit recommendations
MWE n/a ND ND ND ND
NWSC n/a 85.7% 86% 91% 93%
38. Procurement: Average weighed procurement performance
MWE n/a ND 77.9% ND ND
NWSC n/a ND 80.1% ND ND
39. CSOs´ contributions: % Districts´ budgets that reflect CSOs´ contributions
n/a ND ND ND ND
40. Adequacy of Sector Funding: % of sector funding needs (SIP) covered by actual budget releases
Subsector
n/a ND ND ND ND
41. External Funding: % of sector expenditure covered by GoU budget
Subsector
n/a ND 19% ND 31%
42. Reporting: % of districts and piped water schemes complying with reporting obligations
Rural n/a ND ND ND ND
STs n/a ND 56% 100% 100%
Note: ND denotes No Data; n/a denotes not applicable

Uganda Water and Environment Sector Performance Report 2020
viii
Contents
EXECUTIVE SUMMARY ............................................................................................................................................ I
LIST OF TABLES ................................................................................................................................................... XIII
LIST OF FIGURES .................................................................................................................................................. XVI
LIST OF ABBREVIATIONS ...................................................................................................................................XVIII
GLOSSARY AND DEFINITIONS ............................................................................................................................. XXII
1. INTRODUCTION ............................................................................................................................................. 1
2. SECTOR PLANNING, HUMAN RESOURCES DEVELOPMENT AND FINANCE ........................................................... 3
2.1 INTRODUCTION ................................................................................................................................................ 3
2.2 SECTOR PLANNING FRAMEWORK......................................................................................................................... 3
2.2.1 Budget for FY 2019/20 ................................................................................................................................ 3
2.2.2 New Projects ................................................................................................................................................ 4
2.3 SECTOR MONITORING AND REPORTING ................................................................................................................ 6
2.4 ACCREDITATION OF THE MINISTRY OF WATER AND ENVIRONMENT FOR GREEN CLIMATE FUND (GCF) AND ADAPTATION
FUND (AF) ................................................................................................................................................................... 6
2.5 SECTOR CAPACITY DEVELOPMENT ....................................................................................................................... 7
2.6 SECTOR FINANCE ............................................................................................................................................ 11
2.6.1 Overview .................................................................................................................................................... 11
2.6.2 National Development Plan ...................................................................................................................... 12
2.6.3 Budget share by votes ............................................................................................................................... 13
2.6.4 Budget Performance ................................................................................................................................. 13
2.6.5 Sector Funding as a Share of the National Budget durinng the NDP II period ........................................ 15
2.6.6 Off- budget Financing ............................................................................................................................... 16
2.6.7 On-Budget Grants to Local Governments ................................................................................................. 18
2.6.8 Challenges ................................................................................................................................................. 22
3. JOINT SECTOR REVIEW UNDERTAKINGS 2019/20 ............................................................................................. 23
4.RURAL WATER SUPPLY...................................................................................................................................... 30
4.1 INTRODUCTION ...................................................................................................................................................... 30
4.2 PROGRAMS AND PROJECTS FOR RURAL WATER SUPPLY AND SANITATION ........................................................................ 30
4.2.1 District Water and Sanitation Development Conditional Grant (DWSDCG). ...................................... 30
4.3 MWE CENTRALLY IMPLEMENTED DEVELOPMENT PROJECTS AND APPROACHES ................................................................ 31
4.4 TECHNICAL SUPPORT TO LOCAL GOVERNMENTS .......................................................................................................... 37
4.5 APPROPRIATE TECHNOLOGY CENTRE FOR WATER AND SANITATION, MUKONO ................................................................ 38
4.6 UNICEF WASH INTERVENTIONS 2019/20 ............................................................................................................... 40
4.7 CAPACITY BUILDING AND STRENGTHENING THE ENABLING ENVIRONMENT ........................................................................ 42
4.8 STATUS AND TRENDS OF KEY INDICATORS FOR RURAL WATER AND SANITATION ................................................................. 42
4.8.1 Indicator No 1: Basic water: Percentage of population using an improved drinking water source ....... 42
4.8.2 Indicator No 2: Percentage of villages with a source of safe water supply ............................................ 43
4.8.3 Indicator No 3: Functionality: rural: % of water sources functional at time of spot-check .................... 43
4.8.4 Indicator No 4: Management - rural: % of water points with actively functioning Water & Sanitation
Committees......................................................................................................................................................... 44

Uganda Water and Environment Sector Performance Report 2020
ix
4.8.5 Indicator No 5: Per Capita Investment Cost: Average cost per beneficiary of new water and sanitation
schemes (USD) .................................................................................................................................................... 44
4.9 CHALLENGES AND RECOMMENDATIONS ..................................................................................................................... 45
5. URBAN WATER SUPPLY .................................................................................................................................... 46
5.1 INTRODUCTION ...................................................................................................................................................... 46
5.2 CENTRALLY IMPLEMENTED WATER AND SANITATION PROJECTS ....................................................................................... 46
5.3 IMPLEMENTATION OF PIPED WATER SYSTEMS BY WATER AND SANITATION DEVELOPMENT FACILITIES ................................. 47
5.4 IMPLEMENTATION OF PROJECTS UNDER LARGE TOWNS / NWSC ................................................................................... 50
5.5 KEY PERFORMANCE INDICATORS FOR URBAN AREAS BY JUNE 2019 ............................................................................... 60
5.6 CHALLENGES AND RECOMMENDATIONS ..................................................................................................................... 63
6. REGULATION OF WATER AND SANITATION SERVICES ...................................................................................... 66
6.1 INTRODUCTION ...................................................................................................................................................... 66
6.2 STATUS OF THE SECTOR PERFORMANCE INDICATORS .................................................................................................. 66
6.3 PERFORMANCE OF UMBRELLA WATER AUTHORITIES WITH REGARD TO PERFORMANCE CONTRACT ..................................... 67
6.4 PERFORMANCE OF NWSC WITH REGARD TO PERFORMANCE CONTRACT VI ............................................................. 71
6.5 MEMBERSHIP AND COLLABORATION WITH ESAWAS ................................................................................................. 73
6.6 URBAN WATER O&M CONDITIONAL GRANT FOR FY2019/20 ..................................................................................... 76
6.7 CONCLUSION AND WAY FORWARD ........................................................................................................................... 77
7.SANITATION AND HYGIENE ............................................................................................................................... 79
7.1 INTRODUCTION ...................................................................................................................................................... 79
7.2 RURAL SANITATION ................................................................................................................................................ 79
7.2.1 Programs /Projects and Initiatives ........................................................................................................... 79
7.2.1.1 District Water and Sanitation Conditional Development Grant-DWSCDG ........................................... 79
7.2.1.2 District Sanitation and Hygiene Conditional Grant-DSHCG .................................................................. 79
7.2.1.3 Uganda Sanitation Fund ........................................................................................................................ 80
7.2.1.4 National Hand Washing Initiative (NHWI) ............................................................................................ 80
7.2.1.5 COVID-19 Response ................................................................................................................................ 81
7.2.1.6 UNICEF interventions ............................................................................................................................. 81
7.2.1.7 Uganda Sanitation for Health Activity (USHA)...................................................................................... 81
1.2.1.8 Centrally managed projects ............................................................................................................. 82
7.3 URBAN SANITATION AND HYGIENE ........................................................................................................................... 83
7.3.1 Access to Fecal Sludge Management (FSM) Services ............................................................................... 83
7.3.3 Other Initiatives and projects to improve urban Sanitation .................................................................... 85
7.3.4 Achievements by Kampala Capital City Authority ................................................................................... 87
7.4 STATUS OF HYGIENE AND SANITATION SECTOR INDICATORS .......................................................................................... 88
7.4.1 Sector Indicator 1 : Percentage of population using Basic Sanitation .................................................... 88
7.4.2 Sector Indicator 2: Percentage of population using Safely Managed Sanitation .................................. 88
7.4.3 Sector Indicator 3: Open Defecation ........................................................................................................ 89
7.4.4 Sector indicator 4: Hand washing with soap at household level............................................................ 89
7.4.5 Sector indicator 5: Hand washing in schools ........................................................................................... 89
7.5 BENCHMARKING OF DISTRICT PERFORMANCE .............................................................................................................. 90
7.6 KEY EMERGING ISSUES ............................................................................................................................................ 90
8. WATER FOR PRODUCTION ............................................................................................................................... 92

Uganda Water and Environment Sector Performance Report 2020
x
8.1 INTRODUCTION ...................................................................................................................................................... 92
8.2 IMPLEMENTATION OF WFP OBJECTIVES ..................................................................................................................... 92
8.3 FACILITIES CONSTRUCTED UNDER WFP DEPARTMENT ................................................................................................... 92
8.4 OPERATION & MAINTENANCE OF WFP FACILITIES ....................................................................................................... 95
8.5 STATUS AND TRENDS OF KEY INDICATORS: MANAGEMENT ............................................................................................ 95
9. WATER RESOURCES MANAGEMENT .............................................................................................................. 100
9.1 INTRODUCTION .................................................................................................................................................... 100
9.2 WATER RESOURCES MONITORING AND ASSESSMENT .................................................................................................. 100
9.2.1 Operate and maintain water information system ................................................................................. 101
9.2.2 Dissemination of water resources data and information to users ........................................................ 101
9.2.3 Water Resources Availability .................................................................................................................. 102
9.2.4 Groundwater Resources .......................................................................................................................... 102
9.2.5 Surface Water Resources ........................................................................................................................ 104
9.2.6 Flood Risk Assessment and Management .............................................................................................. 108
9.2.7 Challenges and recommendations ......................................................................................................... 112
9.4 WATER RESOURCES PLANNING AND REGULATION ...................................................................................................... 112
9.4.1 INTRODUCTION ................................................................................................................................................. 112
9.4.2 OVERVIEW OF PERFORMANCE ............................................................................................................................. 113
9.4.3 CONCLUSIONS AND WAY FORWARD ...................................................................................................................... 120
9.4.4 CROSS CUTTING WATER RESOURCES MANAGEMENT INITIATIVES ................................................................................ 121
9.4.5 OPERATIONALIZATION OF THE WATER RESOURCES INSTITUTE ................................................................................... 129
TRAINING ON ROADS FOR WATER HARVESTING AND REVIEW OF GCF CN ............................................................................. 130
9.5 WATER QUALITY MANAGEMENT ............................................................................................................................ 133
9.5.1 Ambient water quality ............................................................................................................................ 133
5.5.2 Drinking water quality ............................................................................................................................ 135
5.2.3 Laboratory Performance ......................................................................................................................... 139
5.2.4 Wastewater quality ................................................................................................................................ 141
5.2.5 Water Quality Assessments .................................................................................................................... 142
5.2.6 Challenges and Way forward.................................................................................................................. 143
9.6 INTERNATIONAL AND TRANSBOUNDARY WATER RESOURCES MANAGEMENT ................................................................... 144
9.6.1 Introduction ......................................................................................................................................... 144
9.6.2 Trans-boundary agreements, laws, policies, standards .................................................................... 144
9.6.3 Trans-boundary/cross border organizations coordinated, supported and are operational ............. 144
9.6.4 Trans-boundary Projects and Investments ......................................................................................... 146
9.6.5 Adapting to Climate Change for Lake Victoria Basin Project (ACC-LVB) ........................................... 156
10.ENVIRONMENT AND NATURAL RESOURCES .................................................................................................. 159
10.1 WETLAND MANAGEMENT ................................................................................................................................... 159
10.1.1 Status of wetland Resources in Uganda ............................................................................................... 159
10.1.2 Restoration of Degraded areas ............................................................................................................. 159
10.1.3 Promotion of knowledge of environment and natural resources........................................................ 161
10.1.4 Demarcation of critical wetland boundaries ........................................................................................ 161
10.1.5 Wetland Management Plans developed .............................................................................................. 163
10.1.6 Development of wetland wise use demonstration sites ...................................................................... 164
10.1.7 Coding and gazettement of Wetlands .................................................................................................. 164
10.1.8 Compliance monitoring and enforcement ............................................................................................ 165

Uganda Water and Environment Sector Performance Report 2020
xi
10.1.9 Policy, Planning and Legal framework ................................................................................................. 166
10.1.10 Capacity building and technical support ............................................................................................ 166
10.1.11 Resource Mobilization for Wetlands management ........................................................................... 166
10.1.12 Challenges, Lessons Learnt and Recommendations ........................................................................... 166
10.2 ENVIRONMENT MANAGEMENT ............................................................................................................................ 167
10.2.1 INTRODUCTION ............................................................................................................................................... 167
10.2.2 PROMOTION OF KNOWLEDGE OF ENVIRONMENT AND NATURAL RESOURCE .............................................................. 167
10.2.3 RESTORATION OF DEGRADED AND PROTECTION OF ECOSYSTEMS ............................................................................. 167
10.2.4 POLICY, PLANNING, AND LEGAL FRAMEWORK ....................................................................................................... 168
10.2.5 COORDINATION, MONITORING, INSPECTION, MOBILIZATION AND SUPERVISION. ...................................................... 169
10.2.6 CAPACITY BUILDING AND TECHNICAL BACK-STOPPING. .......................................................................................... 169
10.2.7 KEY INITIATIVES, PROGRAMMES AND PROJECTS ................................................................................................... 169
10.3 FORESTRY MANAGEMENT ................................................................................................................................... 171
10.3.1 District Forestry services ....................................................................................................................... 174
10.3.2 Management Central Forest Reserves (National Forestry Authority) ................................................. 174
10.3.3 Nyabyeya Forestry College ................................................................................................................... 183
10.3.4 National Forestry Resources Research Institute-NaFORRI ................................................................... 183
10.5 THE NATIONAL ENVIRONMENT MANAGEMENT AUTHORITY (NEMA)......................................................................... 187
10.5.1 Introduction ........................................................................................................................................... 187
10.5.2 Summary of Performance in FY2019/20 ............................................................................................... 187
10.5.3 Challenges, Lessons Learnt and Recommendations ............................................................................. 203
10.6 METEOROLOGY ............................................................................................................................................. 204
10.6.1 INTRODUCTION ............................................................................................................................................... 204
10.6.2 ACHIEVEMENT IN THE FY 2019/20 ................................................................................................................... 204
10.6.3 STATUS AND TRENDS OF SECTOR PERFORMANCE INDICATORS ................................................................................ 207
10.6.4 CHALLENGES AND RECOMMENDATIONS .............................................................................................................. 208
10.7 CLIMATE CHANGE ......................................................................................................................................... 208
10.7.1 Introduction ........................................................................................................................................... 208
10.7.2 Monitoring Adaptation projects: .......................................................................................................... 212
11. CROSS CUTTING ISSUES................................................................................................................................... 219
11.1 GENDER EQUALITY AND WOMEN EMPOWERMENT ............................................................................................. 219
11.1.1 Performance Indicators on Gender ....................................................................................................... 219
11.1.2 Gender in staff Composition ................................................................................................................. 220
11.1.3 Gender and equity Planning and budgeting ........................................................................................ 222
The improvement in the sector performance is attributed to capacity building initiatives undertaken for MWE
staff and the technical support/ back stopping efforts provided by the EoC. ................................................... 223
11.1.4 Gender Manuals and tools .................................................................................................................... 223
11.1.5 Gender Capacity Building ............................................................................................................... 223
11.1.6 Gender Analysis studies ........................................................................................................................ 224
11.2 ECONOMIC EMPOWERMENT AND INITIATIVES TO SUPPORT THE POOR AND DISADVANTAGED .......................................... 224
11.2.1 National Water Pro Poor Initiatives ..................................................................................................... 224
11.2.2 Economic Empowerment/ Livelihood support initiatives in towns and gravity flow scheme areas .. 225
11.2.3 Empowerment Initiatives by Water for Production ............................................................................. 227
11.2.4 Livelihood Restoration Plans................................................................................................................. 227
11.3 HIV/ AIDS Mainstreaming ...................................................................................................................... 227
11.4 Challenges for mainstreaming cross- cutting issues ............................................................................... 229

Uganda Water and Environment Sector Performance Report 2020
xii
12. CIVIL SOCIETY ORGANISATIONS IN WATER AND SANITATION ...................................................................... 230
12.1 SCOPE AND STRUCTURE OF THE REPORT ................................................................................................................. 230
12.2 UWASNET SECRETARIAT CONTRIBUTION .............................................................................................................. 230
12.3 INVESTMENT OF CSOS IN THE WATER AND SANITATION SUB-SECTOR ......................................................................... 233
12.3.1 Financing to the sector .......................................................................................................................... 233
12.3.2 Financing water supply infrastructure ................................................................................................. 236
12.3.3 Water supply infrastructure per-capita investment cost ..................................................................... 237
12.3.4 Access to Water supply – Beneficiaries ................................................................................................ 239
12.3.5 Water supply infrastructure functionality ............................................................................................ 239
12.4 INVESTMENT IN SANITATION AND HYGIENE ............................................................................................................ 240
12.4.1 Hygiene and Sanitation Promotion....................................................................................................... 242
12.5 INTEGRATED WATER RESOURCES MANAGEMENT (IWRM) ................................................................................... 246
12.5.1 Investment in Integrated Water Resources Management................................................................... 246
12.5.2 IWRM activities during FY2019/20 ....................................................................................................... 246
12.5.3 Water Quality Management .............................................................................................................. 246
12.5.4 Permit compliance............................................................................................................................... 247
12.6 WATER FOR PRODUCTION ................................................................................................................................. 247
12.6 CAPACITY DEVELOPMENT AND COMMUNITY ENGAGEMENT....................................................................................... 247
12.7 Research and Development (R&D) .......................................................................................................... 249
12.8 CROSS CUTTING ISSUES ......................................................................................................................... 249
12.8.1 COORDINATION AND COLLABORATION................................................................................................................ 249
12.9 PROGRESS ON RECOMMENDATIONS FROM LAST NGO REPORT AND IDENTIFIED CRITICAL SECTOR ISSUES ........................... 251
13. CIVIL SOCIETY ORGANISATIONS IN ENVIRONMENT AND NATURAL RESOURCES .......................................... 253
13.1 BACKGROUND ................................................................................................................................................... 253
13.2 FINANCIAL CONTRIBUTION OF ENR CSOS TO THE SECTOR ......................................................................................... 253
13.3 CSO ACHIEVEMENTS IN THE FORESTRY SUB SECTOR ............................................................................................ 254
13.4 CSO ACHIEVEMENTS IN THE ENVIRONMENT SUB SECTOR ...................................................................................... 255
13.5 CSO ACHIEVEMENTS IN THE WETLANDS SUB SECTOR ........................................................................................... 256
13.6 WEATHER, CLIMATE AND CLIMATE CHANGE ...................................................................................................... 257
13.7 ENR GOVERNANCE ....................................................................................................................................... 258
13.8 RESEARCH STUDIES/ SURVEYS ......................................................................................................................... 259
13.9 SUB SECTOR CHALLENGES AND RECOMMENDATIONS .......................................................................................... 260
14. GOOD GOVERNANCE IN WATER AND ENVIRONMENT ........................................................................... 263
14.1 MONITORING GOVERNANCE IN THE WATER AND SANITATION SUB-SECTOR ................................................................... 263
14.2 DESCRIPTION AND ANALYSIS OF GOVERNANCE INDICATORS PERFORMANCE .................................................................. 264
ANNEXES ........................................................................................................................................................... 267

Uganda Water and Environment Sector Performance Report 2020
xiii
LIST OF TABLES Table 2- 2: Exited projects from PIP 2019/2020 .......................................................................................................... 4
Table 2- 3: New projects approved into the PIP for the FY 2020/2021-2025 period ................................................... 5
Table 2- 4: Projects still under review .......................................................................................................................... 5
Table 2- 5: Funding Sources for the Sector 2019/20 ................................................................................................. 12
Table 2- 6: Aggregate Sector Releases versus Absorption ........................................................................................ 14
Table 2- 7: On budget performance ( GoU only) ........................................................................................................ 14
Table 2- 8: Performance of Appropriation in Aid 2019/20 in UGX bn ....................................................................... 16
Table 2- 9:CSO Financing per subsector (UGX bn) ...................................................................................................... 17
Table 2- 10: Sector Budget Performance by vote function including off budget by category. FY 2019/20............. 17
Table 2- 11: Conditional Grants to Local Governments, FY2019/20 .......................................................................... 19
Table 2- 12: Performance of Grant funded projects................................................................................................... 19
Table 2- 13: Performance of projects funded by loans .............................................................................................. 20
Table 4- 2: Categories of safe water supply technology as of June 2020 ....................................................................... 30
Table 4- 3: Targets and achievements under the DWSDCG for 2018/ 2019 .................................................................. 31
Table 4- 4: Performance of development projects managed by MWE .......................................................................... 31
Table 4- 5: Boreholes rehabilitated by UNICEF ............................................................................................................ 40
Table 4- 6: School latrine and water facilities constructed by UNICEF ........................................................................ 40
Table 4- 7: Construction of motorized water supply systems by UNICEF..................................................................... 41
Table 4- 8: Progress made on realizing the NDP II 2015/2016- 2019/2020 Targets ................................................... 44
Table 5- 1: Progress on Specific Projects ..................................................................................................................... 47
Table 5- 2: Summary of physical performance of WSDFs and Karamoja Towns Water Supply and Sanitation in FY
2019/20 ....................................................................................................................................................................... 49
Table 5- 3: Summary Implementation Status of SCAP100 Project for the FY 2019/20 ................................................ 50
Table 5- 4: NWSC Tariff Structure FY 2019/20 (VAT Exclusive) .................................................................................... 51
Table 5- 5: Annual Trend of PSPs/Kiosks for the period 2015- 2020 ............................................................................ 51
Table 5- 6: Trends in access to improved water supply in urban areas - 2011 to 2019 ............................................. 53
Table 5- 7: Trend of Access to Safe and Clean Water using source per Village ........................................................... 53
Table 5- 8: Water Quality Monitoring in Small Towns (Comparison 2018/2019 and 2019/2020) .............................. 58
Table 5- 9: Financial Viability /Sustainability, Non-Revenue Water, Functionality, and Collection Efficiency
Performance ................................................................................................................................................................ 59
Table 5- 10: NWSC Tariff Structure FY 2019/20 (VAT Exclusive) .................................................................................. 59
Table 5- 11: Physical performance of Individual Umbrellas of Water and Sanitation ................................................. 60
Table 5- 12: Financial Performance for July 2029 - June 2020 ..................................................................................... 62
Table 5- 13: Villages Operations in the 6No. Regional Areas for Umbrellas of Water and Sanitation ........................ 62
Table 5- 14: Employment Opportunities created by Umbrellas of Water and Sanitation (2019/2020) ...................... 63
Table 6- 1: Status of Gazetted Water and Sewerage Authorities .................................................................................... 66
Table 6- 2: Achievement of the UWA on NRW against the PC targets ........................................................................ 68
Table 6- 3: achievement of the UWA on metering ratio against the PC targets ......................................................... 69
Table 6- 4: Performance of NWSC against the set targets in PC6 .............................................................................. 71
Table 6- 5: Status of NRW as at end of FY 2019/20 ..................................................................................................... 72
Table 6- 6: Status of Compliance to Drinking Water Standards ................................................................................ 73
Table 6- 7: Summary of Utility Performance................................................................................................................ 74
Uganda Water and Environment Sector Performance Report 2020
xiv
Table 6- 8: Additional population served with safe water by Umbrella Authority ...................................................... 77
Table 7- 1: Hygiene and sanitation promotion under the six-water supply and sanitation projects ........................... 82
Table 7- 2: Achievements in provision of FSM services ................................................................................................ 84
Table 7- 3: Achievements in improving access to Public sanitation ............................................................................. 84
Table 8- 1: Performance of Planned Projects and Programmes in FY 2019/20......................................................... 92
Table 8- 2: Functionality of earth dams, valley tanks, small scale Irrigation systems and medium scale Irrigation
schemes as at June 30th, 2020 ..................................................................................................................................... 95
Table 8- 3: Functionality status per facility type as at June 30th, 2020 .................................................................... 96
Table 8- 4: Trend in Functionality in the last 5 years ................................................................................................. 96
Table 8- 5: Trend in Cumulative WfP Storage Capacity created in the last 5 years .................................................. 96
Table 8- 6: Volumes of WfP storage created through construction of various WfP facilities in FY 2019/20. .......... 97
Table 8- 7: Community Management of WfP facilities constructed between 2000 – 2020 as at June 30th, 2020 ... 98
Table 8- 8: Trend in Management in the last 5 years ................................................................................................ 98
Table 9- 2: Planned activities for the FY2019/2020 ................................................................................................... 100
Table 9- 3: Purposes for data disseminated during FY2019/2020 ............................................................................. 101
Table 9- 4: Water Level Rise in Centimetres .............................................................................................................. 106
Table 9- 5: Surface Water level Monitoring Stations Affected by Rising Water Levels of Lake Victoria and above
normal rainfall received during MAM ....................................................................................................................... 110
Table 9- 6: List of identified water users without permits per Water Management Zone ......................................... 114
Table 9- 7: Compliance to Permit Conditions FY 2019/20 .......................................................................................... 115
Table 9- 8: Current status of Revising the Water Policy and Amending the Water Act ............................................. 119
Table 9- 9: Interventions implemented in AWMZ by Catchment ............................................................................... 122
Table 9- 10: Interventions implemented in VWMZ by Catchment ............................................................................. 124
Table 9- 11: Interventions implemented in UNWMZ by catchment .......................................................................... 126
Table 9- 12: Showing the List of the Trainings conducted at Water Resources Institute FY2019/20 ........................ 129
Table 9- 13: Performance of WMZs in Ambient Water Quality Monitoring ........................................................... 133
Table 9- 14: Samples received and analyzed by category ....................................................................................... 139
Table 10- 1: Trends on key wetland indicators .......................................................................................................... 159
Table 10- 2: Ha of wetlands restored during the FY 2019/20 .................................................................................... 159
Table 10- 4: Km of wetlands demarcated during the FY 2019/20 ............................................................................. 162
Table 10- 5: Wetland Management Plans developed during the FY 2019/20 ........................................................... 163
Table 10- 6: Forest cover trend in Uganda (1990-2017) ............................................................................................ 176
Table 10- 7: Status on development of environmental regulations ........................................................................... 188
Table 10- 8: EPF activities undertaken between July and June 2020 ......................................................................... 192
Table 10- 9: Number of applicants for waste handling.............................................................................................. 195
Table 10- 10: MEAs projects under NEMA coordination in FY 2019/20 ................................................................. 201
Table 10- 11: Progress of implementation of Radar project ...................................................................................... 205
Table 10- 12: Performance in Weather Data Transmission ....................................................................................... 207
Table 10- 13: Weather stations district coverage ..................................................................................................... 207
Table 10- 14: Functionality of Weather Stations in Districts ..................................................................................... 208

Uganda Water and Environment Sector Performance Report 2020
xv
Table 11- 1: Gender analysis in MWE by seniority ................................................................................................. 221
Table 11- 2: NWSC Staff Composition ........................................................................................................................ 222
Table 11- 3: Trend Gender and Equity Performance. ................................................................................................. 223
Table 11- 4: Annual Trend of PSPs/Kiosks for the period 2015- 2020 ........................................................................ 224
Table 11- 5: Economic empowerment beneficiary Groups and activities supported ................................................. 225
Table 11- 6: This table should have a heading be updated with missing data .......................................................... 228
Table12- 1: Investment in safe water supply ............................................................................................................. 236
Table12- 2: Per-capita investment costs .................................................................................................................... 237
Table12- 3: Beneficiaries - Access to water supply .................................................................................................... 239
Table12- 4: WHAVE solutions – performance data ................................................................................................... 240
Table12- 5: Toilet technological options invested in by CSOs .................................................................................... 242
Table12- 6: Toilet beneficiaries .................................................................................................................................. 242
Table12- 7: Promotion of hygiene and sanitation ..................................................................................................... 242
Table12- 8: School sanitation facilities and pupil stance ratio ................................................................................. 244
Table12- 9: Rating of school WASH ........................................................................................................................... 244
Table12- 10: Compliance with permit ........................................................................................................................ 247
Table12- 11: Summary of CSO Water for production interventions FY 2019/20 ....................................................... 247
Table12- 12: Summary of CSO capacity development interventions - FY 2019/20 .................................................... 247
Table12- 13: Summary of Collaboration Arrangements ............................................................................................ 249
Table12- 14: women in key position .......................................................................................................................... 250
Table12- 15: Analysis of the intervention districts against 2019 reported safe water coverage .............................. 251
Table 13- 1: ENR related studies executed................................................................................................................. 259
Table 13- 2: Emerging issues and recommendations ................................................................................................ 260
Table 14- 2: Performance of Governance Indicator ................................................................................................... 263
Table 14- 3: Status of NWSC Regional Compliance to Audit Recommendations as at 30th June 2020 .................... 264

Uganda Water and Environment Sector Performance Report 2020
xvi
LIST OF FIGURES Figure 2- 1: Staff who completed courses within the FY 2019/20 ............................................................................. 11
Figure 2- 2: Sector financing Requirements ............................................................................................................... 12
Figure 2- 3: Sectoral Budget by MDA FY 2019/20 as Propriated by Parliament ..................................................... 13
Figure 2- 4: Trends in GoU/ DP Support in the Medium Term 2011/12-2019/20 ..................................................... 15
Figure 2- 5: Sector funding as share of national budget ............................................................................................ 16
Figure 2- 6: Trends in CSO financing: Planned and Releases (UGX bn) ..................................................................... 17
Figure 5- 1: Annual Trend of NRW for the Period ........................................................................................................ 52
Figure 5- 2: Customer Satisfaction Index Trends for the Period 2016 – 2020 .............................................................. 52
Figure 5- 3: To indicate comparison 2004/2005 – 2019/2020 ..................................................................................... 56
Figure 5- 4: Per capita investment per town ................................................................................................................ 57
Figure 6- 1: Achievement of the UWSA on functionality against the PC targets ......................................................... 69
Figure 6- 2: Achievement of the UWA on Collection Efficiency against the PC ............................................................ 70
Figure 6- 3: targets verse as actual performance on active connections ................................................................... 71
Figure 6- 4: Achievements of connection target ......................................................................................................... 73
Figure 6- 6: Subsidy allocation per UWSA .................................................................................................................... 77
Figure 7- 1: Construction of public sanitation facility along Kampala – Mbarara road at Kiruhura............................ 83
Figure 7- 2: Benchmarking of district performance ..................................................................................................... 90
Figure 7- 3: Comparison between sanitation and hand washing coverage by region ................................................. 90
Figure 9- 2: Shows variation of water level and rainfall of Rwebisengo monitoring well. ......................................... 102
Figure 9- 3: Corrected hydrograph of Rwebisengo monitoring station. .................................................................... 102
Figure 9- 4: shows water level variations at Moroto monitoring station .................................................................. 103
Figure 9- 5: show variation of groundwater level at Apac Monitoring station ......................................................... 103
Figure 9- 6: Variation of Net Basin Supply and Mean Lake Levels from 2010 to 2019 .............................................. 104
Figure 9- 7: Variation of Net Basin Supply and Mean Lake Levels from 1960 to 1965 .............................................. 105
Figure 9- 8: Lake Victoria Mean Monthly Levels from 1900 to 2020 ......................................................................... 105
Figure 9- 9: Comparison of Lake Victoria Mean Monthly Levels in 1964 and 2020 ................................................... 106
Figure 9- 10: Water level trends of Lakes Victoria, Kyoga and Albert ....................................................................... 107
Figure 9- 11: Water level trends of representative rivers in Uganda ......................................................................... 108
Figure 9- 12: Water level trends of major inflows into Kyoga ................................................................................... 108
Figure 9- 13: Map showing flooded areas in Amolatar District ................................................................................. 109
Figure 9- 14: Trends of water permit applications received, and permits issued over the last seven years. ............. 113
Figure 9- 15: Trends of Number of Permit Holders Monitored for Compliance over the last 8 years ........................ 115
Figure 9- 16: Total annual non-tax revenue collected from water use over years .................................................... 117
Figure 9- 17: Showing the Lake Victoria Water Release for Last Ten Months ........................................................... 118
Figure 9- 18: Environment impact assessment reports reviewed .............................................................................. 119
Figure 9- 19: Monitoring sites in the IMB .................................................................................................................. 134
Figure 9- 20: Compliance to E. coli by Technology ................................................................................................... 136
Figure 9- 21: Compliance to E. coli for springs in Kampala and Wakiso ................................................................. 137
Uganda Water and Environment Sector Performance Report 2020
xvii
Figure 9- 22: Compliance to E. coli for water sources in Luuka district ................................................................... 138
Figure 9- 23: Compliance of piped water in Kampala and Wakiso .......................................................................... 138
Figure 9- 24: Samples received by category ............................................................................................................ 140
Figure 9- 25: NTR collection ...................................................................................................................................... 141
Figure 9- 26: Compliance to TSS ............................................................................................................................... 141
Figure 9- 27: Compliance to COD .............................................................................................................................. 142
Figure 9- 28: Access to critical facilities serving the fisheries communities ............................................................ 147
Figure 9- 29: Revenue generated from Lake Albert in 2019 presented by District ................................................. 148
Figure 9- 30: Identified and mapped fish breeding areas within lakes Edward and Albert in Uganda................. 148
Figure 9- 31: Analytical bathymetric map for Lake Albert ....................................................................................... 152
Figure 9- 32: Gender spread of trainings and sensitization under the project ........................................................ 153
Figure 9- 33: Location of Nakivubo Wetland in Kampala .......................................................................................... 155
Figure 9- 34: Proposed configuration of the proposed Nakivubo constructed wetland system............................. 156
Figure 9- 35: Trends in wetland restoration in Uganda over the years ..................................................................... 160
Figure 10- 1: Trends in wetland demarcation in Uganda over the years to date ..................................................... 163
Figure 10- 2: Trends in compliance monitoring and enforcement by EPPU and WMD staff over the year’s FY 2012-
2020 ........................................................................................................................................................................... 165
Figure 10- 3: NFA contribution to Forestry program Outcome performance 2015-2020. ......................................... 175
Figure 10- 4: Trend of forest cover in Uganda between 1990 and 2017. .................................................................. 175
Figure 10- 5: NFA Nurseries and Plantation Management Areas .............................................................................. 178
Figure 10- 6: Comparison between total number of PB and EISs submitted and total projects approved in FY
2019/20..................................................................................................................................................................... 190
Figure 10- 7: Projects approved during FY 2019/20 by sector category .................................................................... 191
Figure 10- 8: Revenue collection in Uganda shillings by EPF- NEMA in FY 2019/20 .................................................. 193
Figure 10- 9: Nitrogen dioxide variations before and during COVID-19 lockdown .................................................... 194
Figure 10- 10: Particulate matter variations before and during COVID-19 lockdown ........................................... 194
Figure 11- 1: women in key positions ........................................................................................................................ 219
Figure 11- 2: Gender staffing over years ................................................................................................................. 221
Figure 11- 3: Gender Composition for Contract staff over the years .................................................................... 222
Figure 12- 1: Distribution of interventions by regions ............................................................................................... 233
Figure 12- 2: CSO Investment profile ......................................................................................................................... 234
Figure 12- 3: Funding sources for reported CSO investments .................................................................................... 236
Figure 12- 4: Management activities undertaken Figure 12- 5: Presence of CMP in intervention areas ....... 246
Figure 12- 6: Percentage of CSO budget reflected in district budget ......................................................................... 250
Figure 13- 1: ENR CSOs reporting (n=22). .................................................................................................................. 253
Figure 13- 2: Investment made in the Financial Year ................................................................................................ 253
Figure 13- 3: ENR sub sector investment. .................................................................................................................. 254
Uganda Water and Environment Sector Performance Report 2020
xviii
List of Abbreviations ACCRA Africa Climate Change Resilience Alliance ADB African Development Bank BFP Budget Framework Paper BOD Biological Oxygen Demand BoP Best operational Practices CBO Community Based Organisation CBMS Community Based Maintenance System CCU Climate Change Unit CDD Community-Driven Development sub-project CDM Clean Development Mechanism CFA Cooperative Framework Agreement CFR Central Forest Reserves CLTS Community Led Total Sanitation CMO Catchment Management Organisation CSO Civil Society Organisation DESS Department of Environment Services DHI District Health Inspector DLG District Local Government DP Development Partner DWAP District Wetland Action Plan DWD Directorate of Water Development DWO District Water Office(r ) DWRM Directorate of Water Resources Management DWSCC District Water and Sanitation Coordination Committee DWSDCG District Water and Sanitation Development Conditional Grant EAC East African Community EC European Commission EHD Environment Health Division (of Ministry of Health) EIS Environmental Impact Statement ENR Environment and Natural Resources EPPU Environment Protection Police Unit FAO Food and Agricultural Organisation FGD Focus Group Discussion FIEFOC Farm Income and Enhancement and Forestry Conservation FMP Forest Management Plans FO Forest Officers FSSD Forestry Sector Support department FY Financial Year GEF Global Environmental Facility GFS Gravity Flow Scheme GIZ Deutsche Gesellschaft für Internationale Zusammenarbeit GGAP Good Governance Action Plan GGDS Green Growth Development Strategy GGWG Good Governance sub-sector Working Group GIS Geographical Information System

Uganda Water and Environment Sector Performance Report 2020
xix
GoU Government of Uganda ha Hectares HIC Home Improvement Campaigns HIP Hygiene Improvement Programme HIV/AIDS Human immunodeficiency virus / acquired immunodeficiency syndrome HPM Hand Pump Mechanic HPMA Hand Pump Mechanic Association HWF Hand Washing Facility ICT Information Communication Technology IDAMC Internally Delegated Area Management Contract IDP Internally Displaced Persons IGAD Intergovernmental Authority on Development ISDP Infrastructure Service Delivery Plan ISH Integrated Sanitation and Hygiene INDC Intended Nationally Determined Contributions JAF Joint Assessment Framework JBSF Joint Budget Support Framework JPF Joint Partnership Fund JSR Joint Sector Review JWESSP Joint Water and Environment Sector Support Programme (2013 – 2018) KCCA Kampala City Council Authority KfW Kreditanstalt für Wiederaufbau KP Kyoto Protocol KPI Key Performance Indicators LG Local Government LGDP Local Government Development Programme LVEMP Lake Victoria Environmental Management Project LVWATSAN Lake Victoria Water and Sanitation Initiative M&E Monitoring and evaluation MAAIF Ministry of Agriculture, Animal Industry and Fisheries MIS Management Information System MoEMD Ministry of Energy and Mineral Development MOESTS Ministry of Education, Science, Technology and Sports MoFPED Ministry of Finance, Planning and Economic Development MoGLSD Ministry of Gender Labour and Social Development MoH Ministry of Health MoLG Ministry of Local Government MoLHUD Ministry of Lands Housing and Urban Development MoTTI Ministry of Tourism, Trade and Industry MoU Memorandum of Understanding MUCCRI Makerere University Centre for Climate Change Research and Innovations MTEF Medium Term Expenditure Framework MWE Ministry of Water and Environment MTEF Medium Term Expenditure Framework MRV Measuring, Reporting and Verification NAADS National Agricultural Advisory Services NAPA National Adaptation Programme of Action NAMA Nationally Appropriate Mitigation Actions

Uganda Water and Environment Sector Performance Report 2020
xx
NBI Nile Basin Initiative NDP National Development Plan NEA National Environment Act NEC National Environment Council NEMA National Environment Management Authority NEMP National Environmental Management Policy NFA National Forestry Authority NGOs Non-Government Organisations NPHC National Population and Housing Census NPV Net Present Value NRW Non-Revenue Water NSDS National Service Delivery Survey NSOER National State of Environment Report NSWG National Sanitation Working Group NWIS National Wetland Information System NWSC National Water and Sewerage Cooperation NWQRL National Water Quality Reference Laboratory O&M Operation and Maintenance OBA Output Based Aid ODF Open Defecation Free PAF Poverty Action plan PEAP Poverty Eradication Action Plan PES Payment for Ecosystem Services PHAST Participatory Hygiene and Sanitation Transformation PMF Performance Measurement Framework PPDA Public Procurement and Disposal of Assets Authority PPEA Participating Poverty Environment Assessment PPD Policy and Planning Department PPP Public Private Partnership PSP Public Stand Post PRT Performance Review Team PWD Person(s) with disabilities PWP Public water points REDD Reducing Carbon Emissions from Forest destruction and Degradation RGC Rural Growth Centre R-PP Readiness Preparation Proposal RWHT Rain Water Harvesting Tank RWSS Rural Water Supply and Sanitation RWT Rain Water Tank SIM Sector Investment Model SIP Sector Investment Plan SPGS Saw log Production Scheme SPR Sector Performance Report SSIP Sector Strategic Investment Plan STWSS Small Towns Water and Sanitation SWAp Sector Wide Approach SWC Soil and Water Conservation SWG Sector Working Group

Uganda Water and Environment Sector Performance Report 2020
xxi
SWSSB Sub-county Water Supply and Sanitation Boards TA Technical Assistance ToR Terms of Reference TSS Total Suspended Solids TSU Technical Support Unit UBOS Uganda Bureau of Statistics UfW Unaccounted for Water UGX Uganda Shillings UIA Uganda Investment Authority ULGA Uganda Local Governments Association UN United Nations UNMA Uganda National Meteorological Authority UNDP United Nations Development Programme UNFCCC United Nations Framework Convention on Climate Change UNICEF United Nations International Children’s Fund UPHC Uganda Population and Housing Census USAID United States Agency for International Development UWASNET Uganda Water and Sanitation NGO Network UWSS Urban Water Supply and Sanitation VCT Voluntary Counselling and Testing VfM Value for Money VHT Village Health Team VIP Ventilated Improved Pit VT Valley Tank WAG Wetland Advisory Group WAP Wetland Action Planning WASH Water, Sanitation and Hygiene WED World Environment Day WfP Water for Production WMD Wetland Management Department WMZ Water Management Zones WPC Water Policy Committee WQ Water Quality WRM Water Resources Management WSDF Water and Sanitation Development Facility WSP Water and Sanitation Programme WSC Water Source Committee WSS Water Supply and Sanitation WSSWG Water and Sanitation Sector Working Group WUC Water User Committee WURD Water Utility Regulation Department Exchange Rate1
USD 1 = UGX 3,700 EUR 1 = UGX 4,400
1 Actual annual average exchange rates based on official statistical exchange rate information from Bank of Uganda and The European Central Bank.

Uganda Water and Environment Sector Performance Report 2020
xxii
Glossary and Definitions Alignment: an arrangement whereby the activities and systems of a Development Partner are harmonised with the Government’s priorities and systems, thereby increasing the Government’s “ownership” of activities and systems and making implementation more effective. Basket Funding: aid finance flowing from a Development Partners’ account, kept separate from other funding. The Joint Partnership Fund (JPF) is an example in the water sector of basket funding using on-budget project modalities. Biomass: is the total living woody natural vegetation found above ground. It includes stems, branches and twigs. Biomass refers to their air-dry mass, measured after drying the wood for up to 15 days, until the mass is constant. Biodiversity: the variability among living organisms from all sources including, inter alia, terrestrial, marine and other aquatic ecosystems and the ecological complexes of which they are part; this includes diversity within species, between species and of ecosystems. Consolidated Fund: the consolidated fund is the main treasury account where all Government and external funds are received. Funds are then allocated according to approved budgets to the ministries and via fiscal decentralisation mechanisms to the local Governments. Development Partner (DP): Bilateral, multilateral and international organisations and agencies providing support to Uganda. (Earmarked) Sector Budget Support: financial support channelled through the Government budget that is notionally earmarked to a specific sector or sub-sector. In the water and sanitation sub-sector earmarked sector budget support includes support via the consolidated fund and Poverty Action Fund (PAF) to the District Water and Sanitation Development Conditional Grant (DWSDCG) and also to the Ministry of Water and Environment (MWE) at central level. There is no difference between earmarked sector budget support and sector budget support for the water, health and education (sub-) sectors as all sector expenditure is under the PAF. Harmonisation: the process of rendering approaches, systems or policies between Development Partners and Government coherent. Large Towns: are classified as those gazetted for operation by National Water and Sewerage Corporation (NWSC), which provides water and sewerage services. NWSC currently operates in 110 “Areas”. The NWSC coverage area extends beyond the above urban boundaries. Medium Term Expenditure Framework (MTEF): is a three-year rolling budget framework used to guide public-sector resource allocation, including Aid. At the beginning of the budget process, sectors are provided with medium-term resource ceilings, which, in aggregate are consistent with the achievement of macroeconomic objectives. Sector working groups allocate these ceilings to institutions within the sector over the medium term consistent with the achievement of sector policy objectives. These allocations are articulated in the Budget Framework Paper (BFP), which represents the Government’s medium-term budget strategy. The first year of the MTEF forms the basis of the annual budget allocations, which are voted by parliament. On-budget Aid: is Aid that is included in the MTEF and presented in the GoU budget estimate books. This includes aid that flows through Government systems (such as general, sector and PAF budget support), as well as other programme aid and projects that are reported to GoU and that the Ministry of Finance, Planning and Economic Development considers should be included in the MTEF and the budget presented to Parliament. A second category of on-budget aid includes Technical Assistance (TA) and basket funds that support GoU activities and institutions whose budgets are included in the MTEF and official estimate books. On budget aid falls within the sector ceiling. Off-budget Aid is Aid that is not reported in the MTEF and budget estimates GoU either because it is not reported to GoU, or because it is not related to institutions included in the MTEF and GoU official

Uganda Water and Environment Sector Performance Report 2020
xxiii
budget estimates. This might include some Aid to local Governments, as well as support to parastatals and NGOs, although many DPs do provide information on such aid to MOFPED. Off-budget aid is not included within sector ceilings. Poverty Action Fund (PAF): established by GoU in 1998 under the Medium-Term Expenditure Framework, is a ring-fenced fund aimed at protecting resources for key poverty reducing areas including water, health, education and rural infrastructure. Poverty Action Fund Budget Support: budget support notionally earmarked to expenditures within the Poverty Action Fund areas, but not earmarked to any specific sector. Transfers are made through the Government systems. Project Support refers to assistance that is not channelled via the Government systems. It can be on-budget (i.e. within the ceiling) or off-budget (i.e. outside the ceiling). Sector Ceilings: are the upper limits that each sector can spend. They include all on-budget DP finance. DP finance to a sector will not necessarily raise the sector ceiling. Sector budget support will not increase the sector ceiling and is therefore not additional funding. Sector earmarking is thus only notional. The strict imposition of sector ceilings means that earmarking only offsets the Government budget. Sector Wide Approach (SWAP) is a mechanism whereby GoU, civil society and Development Partners support a single policy, development plan and expenditure programme, which is under Government leadership and follows a common approach. A SWAP de-emphasises donor-specific project approaches and promotes funding for the sector through general, sector earmarked budget support or through basket funding. The rural water and sanitation sub-sector is the most advanced in terms of SWAP implementation. Small Towns urban centres as defined by UBOS that are not served by National Water and Sewerage Corporation (NWSC), also includes Town Boards and Rural Growth Centres (RGCs) with populations of more than 500 people. Currently, there are 198 Urban Councils and 1,772 RGCs. Software: is an umbrella term used to cover the activities of awareness creation, community sensitisation mobilisation and post-construction follow-up with respect to water supply and sanitation. These activities are undertaken to change behaviour and attitudes towards hygiene and sanitation and to ensure community management of improved water supply facilities. Undertaking: strategic action agreed on in the Joint Sector Review to be undertaken by the sector, ideally within a 12-month period (in time for the subsequent JSR). Urban and Rural: as defined by UBOS’ National Population and Housing Census (NPHC) 2014, urban centres include all areas gazetted as City, Municipality, Town Council or Town Board All other areas are classified as rural. Water and Environment Sector Working Group (WESWG): comprising stakeholders from GoU institutions within a sector, civil society organisations and Development Partners, the WESWG meet to agree sector budget submissions and new projects proposed for the sector, as well as to review sector performance and to deliberate on key sectoral policies.
Uganda Water and Environment Sector Performance Report 2020
1
1. INTRODUCTION
About this Report
The Uganda Water and Environment Sector Performance Report (SPR) is the most important document for assessing the performance of the water and environment sector. It provides an annual assessment of investments, targets, achievements, outputs and highlights the major challenges and strategic issues which effect performance. The Sector Performance Report is based on the revised sector performance indicators (2016) which replaced the golden and platinum indicators. A sector-wide approach to planning, implementation, reporting and accountability was first adopted in 2001, when several individual donor specific projects and reviews were phased out. The Joint Sector Review (JSR) for the water and environment sector has been held annually since the merger of the water and environment sectors in 2008. The SPR forms the basis for discussions at the Joint Sector Review, during which several Undertakings for the subsequent year are formulated and agreed. The SPR has been prepared through a participatory process with inputs from the Ministry of Water and Environment (MWE), the National Water and Sewerage Corporation (NWSC), the National Environment Management Authority (NEMA), the National Forestry Authority (NFA), the Uganda National Meteorological Authority (UNMA), the Environment Health Division (EHD) of the Ministry of Health (MoH) as well as the Uganda Water and Sanitation NGO Network (UWASNET) and Environment and Natural Resources CSO Network. The various contributing stakeholders mentioned above, validated the contents of this report at an internal retreat held in the Auditorium at the Headquarters of the Ministry of Water and Environment. A senior management team from MWE then collated, quality assured and synthesised these inputs. The primary data sources are from databases at the Local and Central Governments as well as at MWE, sector Agencies (NWSC, NEMA, UNMA and NFA) and CSO umbrella organizations (UWASNET and ENR-CSO Network). The urban water and sanitation sub-sector, through MWE’s Water Utility Regulation Department, reports on the targets and achievements for the performance indicators under the performance contracts signed between MWE and NWSC, and the Water Authorities. Section 2 on Sector Planning, Human Resources Development and Finance includes an analysis of on-budget and off-budget resources, Government (GoU) and Development Partner contributions, and contributions from large cross-sectoral projects and programmes. The on-budget GoU financial data was obtained from the Integrated Financial Management System (IFMS), while the donor funding was obtained from development projects. The off-budget financial information was obtained from the sector agencies and from the CSO umbrella organisations. Section 3 provides a brief summary of the status of the undertakings agreed at the last JSR in 2019. Section 4 to Section 10 considers each component within the sector in the order of the Vote Function numbering under the Sector Budget Framework and Ministerial Policy Statement, namely (Section 4) Rural Water Supply, (Section 5) Urban Water Supply, (Section 6) Water for Production, (Section 7) Water Resources Management, (Section 8) Sanitation and Hygiene, (Section 9) Environment & Natural Resources and (Section 10) Climate Change. The remainder of the SPR describes progress on cross-cutting issues (Section 11), the contributions from Civil Society Organisation under Section 12 (Water and Sanitation) and Section 13 (Environment and Natural Resources), and progress of implementation of Good Governance
Uganda Water and Environment Sector Performance Report 2020
2
activities in the sector (Section 14). Finally, Section 15 provides some considerations on selected key issues for further dialogue and/or action during the next twelve months. Sector Institutional Framework
The Water and Environment sector consists of two sub-sectors: the Water and Sanitation (WSS) sub-sector and the Environment and Natural Resources (ENR) sub-sector. The WSS sub-sector comprises water resources management, rural water supply and sanitation, urban water supply and sanitation, and water for production. The ENR sub-sector comprises environmental management; management of forests and trees; management of wetlands and aquatic resources; and weather and climate. The institutional sector framework consists of:
• The Ministry of Water and Environment with the Directorates for Water Development (DWD), Water Resources Management (DWRM) and Environmental Affairs (DEA);
• Local Governments (Districts and Town Councils), which are legally in charge of service delivery under the Decentralisation Act;
• A number of de-concentrated support structures related to MWE, are at different stages of institutional establishment, including Technical Support Units (TSUs), Water Supply Development Facilities (WSDFs), Water Management Zones (WMZs), and Umbrella for Water and Sanitation Authorities;
• Four semi-autonomous agencies: (i) National Water and Sewerage Corporation (NWSC) for urban water supply and sewerage in the large towns; (ii) National Environment Management Authority (NEMA) for environment management; (iii) National Forestry Authority (NFA) for forestry management in Government’s Central Forest Reserves; and (iv) the Uganda National Meteorological Authority (UNMA) for weather and climate services;
• Sector NGOs/CBOs (coordinated through UWASNET and ENR-CSO Network) and Water User Committees/Associations;
• The private sector (water and sanitation infrastructure operators, contractors, consultants and suppliers of goods); and
• Communities who are the users/consumers of the provided services.
Activities undertaken in Sanitation and Water for Production (mainly focusing on agricultural and animal production) require close coordination with other line ministries including the Ministry of Health, Ministry of Education & Sports and the Ministry of Agriculture, Animal Industry & Fisheries. The Water and Environment Sector Working Group (WESWG) provides policy and technical guidance and has representatives from key sector institutions (GoU), Development Partners and NGOs). A more detailed description of the institutional set up at the national level, de-concentrated level, district level, private sector and community level is provided in Annex 1.

Uganda Water and Environment Sector Performance Report 2020
3
2. SECTOR PLANNING, HUMAN RESOURCES DEVELOPMENT AND FINANCE
2.1 Introduction The section provides highlights of sector planning, financing, monitoring and capacity building achievements in the financial year 2019/20.
2.2 Sector Planning Framework The sector planning framework devolves from the Public Finance Management Act (2015) which spells out the processes of the government planning cycle. The water and environment sector has been linking the annual development expenditure work plans to the five year Sector Development plan that ends in year 2020 and the sector strategic Investment plan (2017) that is aligned to the second National Development plan (NDP II) covering the period 2015/16 – 2019/20. The planning and budgeting framework in the sector are well spelled out in the Public finance and Management Act 2015 (PFMA 2015) with the Water and Environment Sector Working Group as the overall governing and approving body for the sector’s budgets. Sector planning and budgeting is coordinated under the Policy and Planning Department responsible for preparation and coordination of the sector plans and budgets. It presents to the Water and Environment Sector Working Group (WESWG) for approval before submission to Parliament. The WESWG is chaired by the Permanent Secretary and co-chaired by two lead Development Partners one for the Water and Sanitation Subsector and the other for the Environment and Natural Resources (ENR) sub-sector. To enhance effective coordination, implementation and monitoring, the WESWG is supported by two sub-sector working groups; Water and Sanitation (WSS) and Environment and Natural Resources (ENR) sub-sector working groups. To support the management of cross-cutting issue, the WESWG has other seven (7) functional sub-groups (FSG). These are (i) Finance, (ii)Good Governance, (iii)Sector Capacity Development, (iv)De-concentrated Structures, (v)Sanitation, (vi)Catchment Management, and (vii) Climate Change Sub-Groups. This is aimed at enhancing effective and detailed review, participation by members in governance and oversight management of the sector. The FSGs draw representation from Development Partners in the Water and Environment sector ( WES), Civil Society Organisations, line Ministries, Departments and Agencies, private sector and Local Government representatives. The planning framework nationwide is guided by the Government set procedures with Parliament of Uganda at the helm of approval and it is spearheaded by Ministry of Finance, Planning and Economic Development (MoFPED) that manages the procedures and budget cycles through planning and budgeting circulars issued from time to time. Upon approval of the sector budget by the Water and Environment Sector Working Group, it is submitted to MoFPED for quality assurance and adherence to the financing and budgeting guidelines as guided in the budget call circulars issued for the respective financial year and later submitted to Parliament in the form of a Ministerial Budget Policy Statement for consideration and appropriation.
2.2.1 Budget for FY 2019/20
The government budget policy emphasizes program-based management. The FY 2019/2020 sector budget was based on program-Based Budgeting framework ensuring that the sector plans and budgets are linked and focused on sector outcomes rather than outputs. In this regard, the Water and Environment sector budget is generally linked to sector outcome indicators as indicated in the summary below. The guiding factors for the budget 2019/20 were; the Sector Development plan 2015-2020, the sector strategic Investment Plan 2017-2030, the NRM Manifesto pledges 2016-2021 and the multiyear projects carried forward from the previous years that link to the sector outcomes. The

Uganda Water and Environment Sector Performance Report 2020
4
major focus of the budget was on solar mini micro irrigation systems aimed at boosting agricultural production and less reliance on weather, solar powered water supply systems to provide domestic water supply to reduce distances and crowding of people on water points, and increase efficiency in water supply at water points. It also focused on construction of water supply points by targeting to have at least one source per village, increasing water coverage targeting 100% coverage in service areas managed by NWSC through 100% accelerated water service coverage project, catchment management planning and implementation, enhanced tree planting and forestry restoration through reclamation, replanting of the gazetted areas, wetland restoration and maintenance of the critical wetlands national wide.
2.2.2 New Projects
In order to ensure that MDAs deliver on the development targets envisaged in Vision 2040, In order to ensure that MDAs deliver on the development targets envisaged in Vision 2040, Government instituted and strengthened the Development Committee to ensure that identification, preparation, appraisal, and implementation of public projects is critically undertaken by the sectors. In respect to this, MoFPED issued guidelines to provide clarity and strengthen the link between the PIP and the NDP, avoid duplication of government interventions, improve coordination in order to harness synergies among MDAs and ensure that Cost Benefit Analysis (CBA) of intended projects is undertaken so that only those projects with the greatest benefit to welfare are implemented. In the above respect, the sector undertook review of the existing projects together with MoFPED and at the same time prepared new projects for financing in the FY 2019/2020 and the subsequent financial years. It should be noted that the Water and Environment sector had a profile of 14 projects due for exiting at the end of the FY 2019/20 and they were presented for extension. However, a number were closed, and others were given an extension to finalise pending project activities as indicated in table 2-1 below.
Table 2- 1: Exited projects from PIP 2019/2020
Program Code
Subprogram Code
Sub Program Name Start Date End Date
02 0168 Urban Water Reform 01/07/2007 30/06/2020
04 1348 Water Management Zones Project 01/07/2015 30/06/2020
01 1301 The National REDD-Plus Project 01/07/2014 30/06/2020
03 0151 Policy and Management Support 07/07/2015 30/06/2020
03 1190 Support to Nabyeya Forestry College Project 01/07/2015 30/06/2020
03 1304 Support to NEMA Phase II 01/07/2015 30/06/2020
02 0161 Support to National Forestry Authority 01/07/2015 30/06/2020
05 1371 Uganda National Meteorological Authority 01/07/2015 30/06/2020
The project approval process of the Development Committee (DC) is keenly followed and has been institutionalised to the extent that moving forward it is a requirement that all externally financed projects must adhere and get approved through this system before financing agreements are signed or approved by Parliament of Uganda. .

Uganda Water and Environment Sector Performance Report 2020
5
During the year, the sector prepared and approved five new projects and six other projects transited to phase two of their implementation. These projects went through the project preparation and approval processes from the Finance and Projects subcommittee (PPC committee of the ministry), to the WESWG up to the Development Committee approval and hence their inclusion in the Public Investment Plan 2019/2020. The total value for these projects is approximately UGX 151.143 bn annually under GoU funding and UGX 4,761.8bn as their total value for their life time period. Table 2-2 shows new approved projects.
Table 2- 2: New projects approved into the PIP for the FY 2020/2021-2025 period
Program Code
Sub Program Name
Go U Start Date End Date Approved budget for FY 2020/21 (UGXbn)
Total Project cost
01 1614 Support To Rural Water Supply and Sanitation Project
01/07/20 30/06/25 8.073 1,910.54
02 1562 Lake Victoria Water and Sanitation (LVWATSAN) Phase 3
01/07/20 30/06/25 2.0 242
02 1660 Strengthening Water Utilities Regulation Project
01/07/20 30/06/25 3.949 36.155
03 1661 Irrigation For Climate Resilience Project Profile
01/07/20 30/06/25 61.850 736.233
03 1666 Development of Solar Powered Irrigation and Water Supply Systems
01/07/20 30/06/25 39.000 476.725
04 1662 Water Management Zones Project Phase 2
01/07/20 30/06/25 4.361 312
05 1613 Investing in Forests and Protected Areas for Climate-Smart Development
01/07/20 30/06/25 4.290 836.5
05 1697 Natural Wetlands Restoration Project
01/07/20 30/06/25 0.700 14.450
49 1638 Retooling of Ministry of Water and Environment
01/07/20 30/06/25 12.718 53.215
51 1639 Retooling of National Environment Management Authority
01/07/2020 30/06/25 0 60
53 1678 Retooling of Uganda National Meteorological Authority
01/07/2020 30/06/25 14.202 84
151.143 4,761.818
Other projects under pipeline for respective review and approval already submitted to the Development Committee are as in Table 2-3 below.
Table 2- 3: Projects still under review
Sr.N Project Name Current Status
1 Wakiso West Water and Sanitation Project Concept
2 Multinational Lakes Edward and Albert Integrated Fisheries and Water Resources Management Project (LEAF III)
Concept
3 Water and Sanitation Development Facility – Karamoja (WSDF-K) Concept
4 Feacal Sludge Management and Sewerage Services Enhancement Project (FSM-SEP)
Concept
5 Tertiary & Secondary Sewer Networks Expansion and Development of Gaba And Mukono Wastewater Treatment Systems in The Kampala Metropolitan Area (KSP-LVP III)
Concept
6 Safe Water for Healthy Productive Population by 2030 (SWAHPP 2030) Profile
7 National Community Tree Planting Project Concept
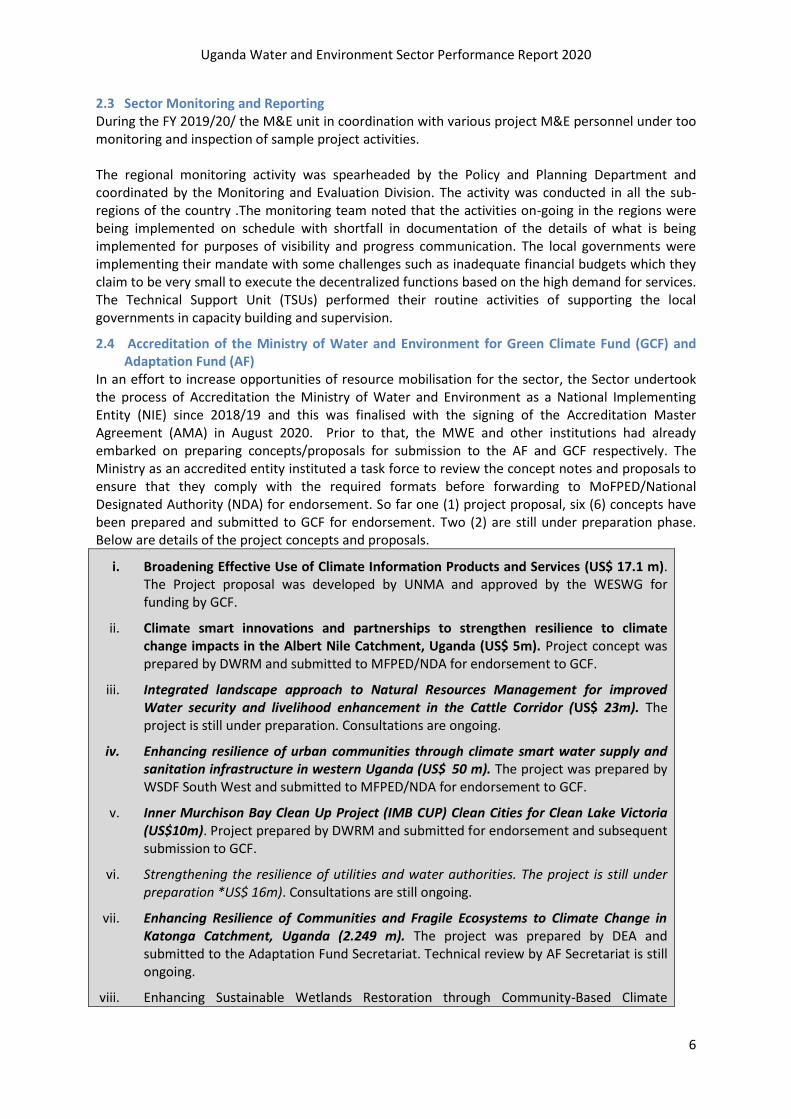
Uganda Water and Environment Sector Performance Report 2020
6
2.3 Sector Monitoring and Reporting During the FY 2019/20/ the M&E unit in coordination with various project M&E personnel under too monitoring and inspection of sample project activities. The regional monitoring activity was spearheaded by the Policy and Planning Department and coordinated by the Monitoring and Evaluation Division. The activity was conducted in all the sub- regions of the country .The monitoring team noted that the activities on-going in the regions were being implemented on schedule with shortfall in documentation of the details of what is being implemented for purposes of visibility and progress communication. The local governments were implementing their mandate with some challenges such as inadequate financial budgets which they claim to be very small to execute the decentralized functions based on the high demand for services. The Technical Support Unit (TSUs) performed their routine activities of supporting the local governments in capacity building and supervision.
2.4 Accreditation of the Ministry of Water and Environment for Green Climate Fund (GCF) and Adaptation Fund (AF)
In an effort to increase opportunities of resource mobilisation for the sector, the Sector undertook the process of Accreditation the Ministry of Water and Environment as a National Implementing Entity (NIE) since 2018/19 and this was finalised with the signing of the Accreditation Master Agreement (AMA) in August 2020. Prior to that, the MWE and other institutions had already embarked on preparing concepts/proposals for submission to the AF and GCF respectively. The Ministry as an accredited entity instituted a task force to review the concept notes and proposals to ensure that they comply with the required formats before forwarding to MoFPED/National Designated Authority (NDA) for endorsement. So far one (1) project proposal, six (6) concepts have been prepared and submitted to GCF for endorsement. Two (2) are still under preparation phase. Below are details of the project concepts and proposals.
i. Broadening Effective Use of Climate Information Products and Services (US$ 17.1 m). The Project proposal was developed by UNMA and approved by the WESWG for funding by GCF.
ii. Climate smart innovations and partnerships to strengthen resilience to climate change impacts in the Albert Nile Catchment, Uganda (US$ 5m). Project concept was prepared by DWRM and submitted to MFPED/NDA for endorsement to GCF.
iii. Integrated landscape approach to Natural Resources Management for improved Water security and livelihood enhancement in the Cattle Corridor (US$ 23m). The project is still under preparation. Consultations are ongoing.
iv. Enhancing resilience of urban communities through climate smart water supply and sanitation infrastructure in western Uganda (US$ 50 m). The project was prepared by WSDF South West and submitted to MFPED/NDA for endorsement to GCF.
v. Inner Murchison Bay Clean Up Project (IMB CUP) Clean Cities for Clean Lake Victoria (US$10m). Project prepared by DWRM and submitted for endorsement and subsequent submission to GCF.
vi. Strengthening the resilience of utilities and water authorities. The project is still under preparation *US$ 16m). Consultations are still ongoing.
vii. Enhancing Resilience of Communities and Fragile Ecosystems to Climate Change in Katonga Catchment, Uganda (2.249 m). The project was prepared by DEA and submitted to the Adaptation Fund Secretariat. Technical review by AF Secretariat is still ongoing.
viii. Enhancing Sustainable Wetlands Restoration through Community-Based Climate

Uganda Water and Environment Sector Performance Report 2020
7
Change Adaptive Livelihood Options in Okole Wetland System Lira District (US$0.250 m). The project was submitted to AF Secretariat and is still under review.
Furthermore, the MWE as an accredited entity received US$ 25,000 as grant from AF for formulation of the Environmental, Social and Gender Risk Assessment Guidelines (ESG) for Ministry of Water and Environment. These guidelines are aimed at ensuring compliance with Adaptation Fund’s Environmental and Social Policy and Gender Policy during projects/programme formulation and implementation. The Terms of Reference (ToRs) for the consultant were prepared and the procurement process is under way. The final guidelines are expected by November 2020. The challenge has been failure by Project Review Task Force to meet as scheduled due to COVID 19 Pandemic coupled with inadequate facilitation. As a result, most of the projects were submitted to the MoFPED/NDA without adequate review.
2.5 Sector Capacity Development Sector Capacity Development (CD) is planned and coordinated under the Policy and Planning Department of MWE. During the FY2019/20, key CD activities included; (i) development of water supply design manual for solar powered water systems, and guidelines for solar powered water systems, (ii) field consultations to determine the key challenges to effective Operation and Maintenance of solar water supply systems in rural institutional facilities, (iii) developed the operation and maintenance manual for mini solar powered water systems (schools and health facilities), (iv) conducted theoretical and practical training on the operation and repair of solar water pumping systems for personnel from various rural institutional facilities, as well as health facilities, (v) conducted training in water well borehole siting, drilling supervision and test pumping supervision for District Water Officers, NGOs and Private Sector in the Karamoja sub region, (vi) conducted training in Hydrogeological Survey for staff of the MWE and private sector at the Water Resources Institute, Entebbe, (vii)printed and disseminated copies of the water well borehole siting, drilling supervision and test pumping supervision. In addition, short term performance improvement training interventions continued to be conducted for the sub sectors. Key achievements during the FY 2019/20 are highlighted in the subsequent subsections Development of Water Supply design for solar water systems and guidelines
As part of the operationalization of the Memorandum of Understanding (MoU) between MWE and Engineers without Borders (EWB) – USA for Institutional Strengthening and Capacity Development of Water and Environment Sector Stakeholders in management of water supply systems across the country, the following manuals were developed; (1) Annex to the Water Supply Design Manual: Guidelines for Solar Powered Water Supply Systems (2020); (2) The Solar Powered Water System Practical Design Manual; and (3) The Solar Powered Water System Operation and Maintenance Manual (2019). The development of the national guidelines for solar powered water supply provides an opportunity to harmonize the design of systems under a set of nationally recognized standards. Dissemination activities are planned for sector-wide adoption and harmonization of the Solar systems guidelines. Capacity Development activities in the design, operation and maintenance of solar powered water systems are also planned. Theoretical and practical training on the operation and repair of solar water pumping systems for
personnel from various rural institutional facilities
The sector is currently shifting from the use of fuel powered water pumps to solar powered piped water supply systems. The advent of the new technology has created a challenge in terms of inadequate capacity to install and manage the solar systems, hence the need for the sector to equip her personnel with knowledge and skills in design, installation and Operation and Maintenance
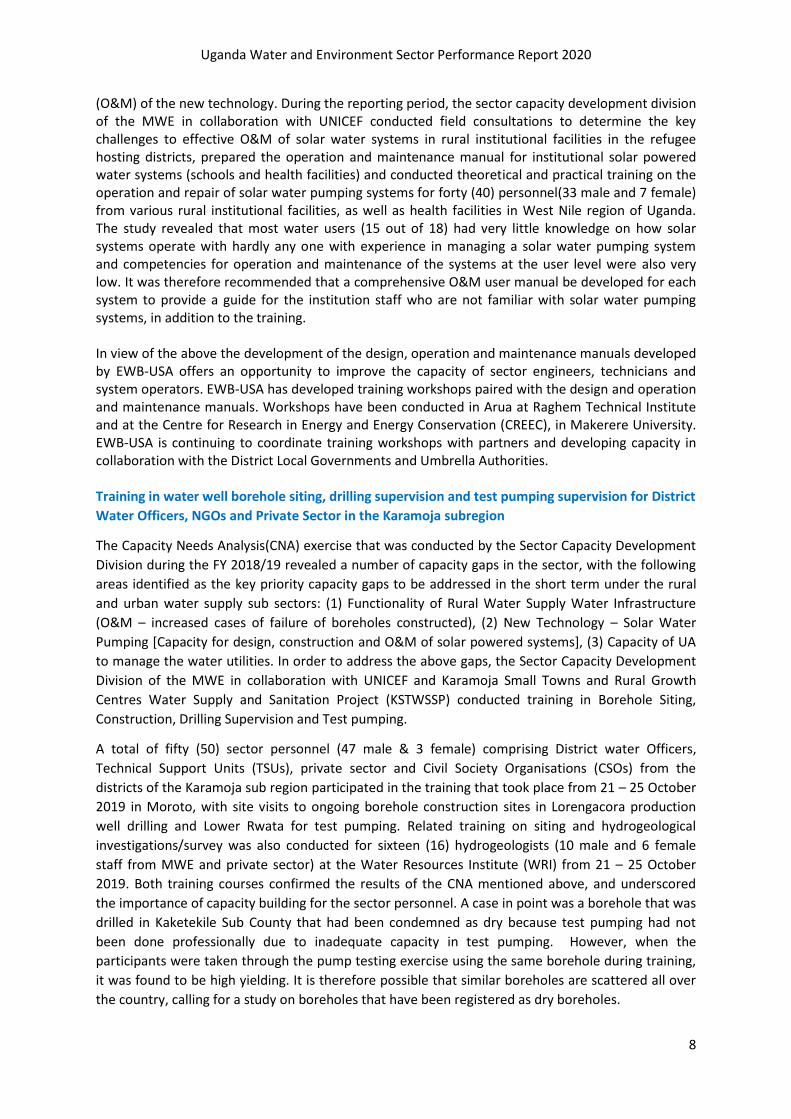
Uganda Water and Environment Sector Performance Report 2020
8
(O&M) of the new technology. During the reporting period, the sector capacity development division of the MWE in collaboration with UNICEF conducted field consultations to determine the key challenges to effective O&M of solar water systems in rural institutional facilities in the refugee hosting districts, prepared the operation and maintenance manual for institutional solar powered water systems (schools and health facilities) and conducted theoretical and practical training on the operation and repair of solar water pumping systems for forty (40) personnel(33 male and 7 female) from various rural institutional facilities, as well as health facilities in West Nile region of Uganda. The study revealed that most water users (15 out of 18) had very little knowledge on how solar systems operate with hardly any one with experience in managing a solar water pumping system and competencies for operation and maintenance of the systems at the user level were also very low. It was therefore recommended that a comprehensive O&M user manual be developed for each system to provide a guide for the institution staff who are not familiar with solar water pumping systems, in addition to the training. In view of the above the development of the design, operation and maintenance manuals developed by EWB-USA offers an opportunity to improve the capacity of sector engineers, technicians and system operators. EWB-USA has developed training workshops paired with the design and operation and maintenance manuals. Workshops have been conducted in Arua at Raghem Technical Institute and at the Centre for Research in Energy and Energy Conservation (CREEC), in Makerere University. EWB-USA is continuing to coordinate training workshops with partners and developing capacity in collaboration with the District Local Governments and Umbrella Authorities. Training in water well borehole siting, drilling supervision and test pumping supervision for District
Water Officers, NGOs and Private Sector in the Karamoja subregion
The Capacity Needs Analysis(CNA) exercise that was conducted by the Sector Capacity Development
Division during the FY 2018/19 revealed a number of capacity gaps in the sector, with the following
areas identified as the key priority capacity gaps to be addressed in the short term under the rural
and urban water supply sub sectors: (1) Functionality of Rural Water Supply Water Infrastructure
(O&M – increased cases of failure of boreholes constructed), (2) New Technology – Solar Water
Pumping [Capacity for design, construction and O&M of solar powered systems], (3) Capacity of UA
to manage the water utilities. In order to address the above gaps, the Sector Capacity Development
Division of the MWE in collaboration with UNICEF and Karamoja Small Towns and Rural Growth
Centres Water Supply and Sanitation Project (KSTWSSP) conducted training in Borehole Siting,
Construction, Drilling Supervision and Test pumping.
A total of fifty (50) sector personnel (47 male & 3 female) comprising District water Officers,
Technical Support Units (TSUs), private sector and Civil Society Organisations (CSOs) from the
districts of the Karamoja sub region participated in the training that took place from 21 – 25 October
2019 in Moroto, with site visits to ongoing borehole construction sites in Lorengacora production
well drilling and Lower Rwata for test pumping. Related training on siting and hydrogeological
investigations/survey was also conducted for sixteen (16) hydrogeologists (10 male and 6 female
staff from MWE and private sector) at the Water Resources Institute (WRI) from 21 – 25 October
2019. Both training courses confirmed the results of the CNA mentioned above, and underscored
the importance of capacity building for the sector personnel. A case in point was a borehole that was
drilled in Kaketekile Sub County that had been condemned as dry because test pumping had not
been done professionally due to inadequate capacity in test pumping. However, when the
participants were taken through the pump testing exercise using the same borehole during training,
it was found to be high yielding. It is therefore possible that similar boreholes are scattered all over
the country, calling for a study on boreholes that have been registered as dry boreholes.

Uganda Water and Environment Sector Performance Report 2020
9
Other On-going CD Interventions
Strengthening the capacities of the human resources for sustainability of sector services
The recruitment exercise for fresh graduates and undergraduates for internship and graduate training was concluded, however the candidates could not be deployed to the respective field stations for the practical skills training because of the COVID 19 pandemic. Skills Development of the Human Resources Project
Under the Skills Development of the Human Resources (SDHR) project being implemented by the
MWE with support from Enabel, on-line short term training course were conducted for staff of the beneficiary Departments in MWE (Forestry Sector Services Department, Policy and Planning &
Uganda National Meteorology Authority) in Project Management and Resources Mobilization
during the months of April and May 2020. The training course revealed the need to strengthen the
capacity of the resource mobilization function in the MWE. The SDHR project ended in February
2020, and our sector agency UNMA was awarded for being the best beneficial organization (BO) in
the MWE for successfully implementing the SDHR Project by Enabel in February 2020. Capacity Development Interventions by Sector Agencies
National Water and Sewerage Corporation (NWSC)
The Training and Capacity Development Department (TCD) of NWSC conducted (45) refresher courses in management related topics, while Six (6) vocational practical courses were done, to equip our technicians and artisans with technical skills to perform their jobs in the field. In total, 1,346 staff (693 males, 653 females) were trained during the period. In addition, successful graduation and accreditation of 203 Technicians (195 males, 08 females) under the Workers Practically Acquired Skills (PAS) qualification framework, 18 Industrial Plumbers and 102 customer care advisors (30 males, 72 females) were awarded certificates of merit by the Directorate of Industrial Training (DIT). Also 38 Electro–mechanical Technicians (EMTs) are being prepared for DIT assessment under Level IV Uganda Vocational Qualifications Framework (UVQF). The certified staff have greatly aided in improving performance in their respective fields of work. During the reporting period, the TCD department oversaw the successful completion of 6 of the 14 NWSC staff, who have been pursuing MSc degrees at Loughborough University funded by NWSC. The rest of the staff under the same program are currently undertaking their research theses, and are due to complete their courses, next Financial Year. Regarding long term professional development of staff, NWSC signed a partnership agreement with the Institute of Water Education (IHE) Netherlands; where up to 10 NWSC staff will be supported to acquire Master of Science (MSc) in sanitation through co–funding by NWSC and Bill & Melinda Gates Foundation. The course was slated to begin in April 2020 but was rescheduled to commence in October 2020 due to the disruptions caused by the COVID–19 pandemic. A partnership agreement was also signed between NWSC and Swiss Federal Institute for Environmental Science and Technology (EAWAG), with funding from the United States Agency for International Development (USAID) and Bill and Belinda Gates foundation, to organize and run joint courses at NWSC’s International Resource Centre (IREC) across the region
All the Area Managers, Branch Managers and General Managers were successfully trained in people management – as a way of improving staff productivity – through a well–managed workforce. A total of 180 new staff (94 males and 86 females) who joined NWSC during the Financial Year (FY)

Uganda Water and Environment Sector Performance Report 2020
10
2019–2020, were duly inducted by the TCD Department. All staff continue to be sensitized on customer handling practices through customer care trainings to improve the way they handle customers while the technical staff proceeded well with vocational training. The onset of COVID–19 greatly affected the performance of the TCD Department in some of key areas. This new reality has compelled the Department to re–think and re–focus on how best learning could be conducted, by coming up with new innovative ways of delivering training using digital tools like zoom, skype and other online platforms. A total of five (5) live online zoom trainings were conducted during the period and a total of 148 staff (94 males, 54 females) benefited from new online sessions. Additionally, the Department developed some funding proposals for funding training and capacity building initiatives financed by external partners. As a result, two (2) proposals were successful in this regard: i.e. EAWAG and USAID’s – Water for Africa through Leadership and Institutional Support (WALIS) Project in sanitation, and another one with Water for People, which brought in much needed resources to finance more training activities.
National Forestry Authority (NFA)
During the FY 2019/20, 172 (44female and 128male) out of 364 (94 female and 270 male) staff from NFA participated in various short term performance improvement capacity development interventions as follows: (i) 20 staff members (6 female and 14 male) from the finance department attended a course in Planning and Budgeting, (ii) 5Legal staff members (2 female and 3 male) were trained in labour law, (iii) 102 staff members (30 female and 72 male)from Budongo, Muzizi, Mwenge, Mbarara, South West Sango Bay forest reserve, Kyoga, Karamoja and Lakeshore plantations were trained in forest monitoring system tools/field work data collection, (iv) 30 male transport Assistants were trained in defensive driving, (v) 6 members (2 female and 4 male) of NFA Board including ED and the HR Manager attended the Chartered Directors Duties and Board Governance course, (vi) 6. Finance Headquarter staff members (2 female and 4 male) attended continuous Professional Development training. Other staff (2 female and 7 male) capacity development programs included Green House Gas Inventory, Labour Intensive Public Works, Information Technology Infrastructure Library for Foundation and Managing Professional level and Business Administration, rule of law, transparency, responsiveness, and consensus oriented equity and inclusiveness, effectiveness and efficiency and accountability.
Uganda National Meteorological Authority (UNMA)
During the period, UNMA focused on both individual and institutional capacity-building interventions aimed at strengthening the overall performance of the organization.
Several staff in the organization were facilitated to pursue professional and managerial courses both locally and internationally, with the overall aim of professionalizing the human resources in the country. Figure 2-1 below provides a graphical representation of courses pursued by staff during the FY 2019/20, including the numbers of staff and gender representation:
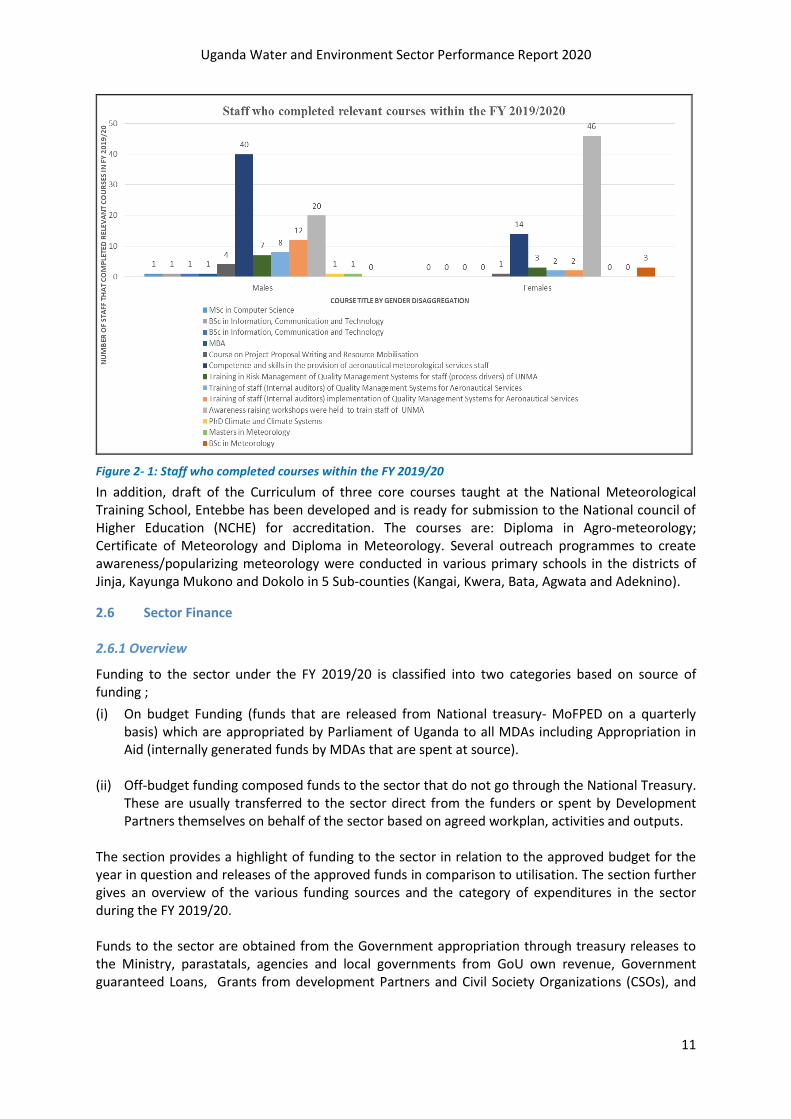
Uganda Water and Environment Sector Performance Report 2020
11
Figure 2- 1: Staff who completed courses within the FY 2019/20
In addition, draft of the Curriculum of three core courses taught at the National Meteorological Training School, Entebbe has been developed and is ready for submission to the National council of Higher Education (NCHE) for accreditation. The courses are: Diploma in Agro-meteorology; Certificate of Meteorology and Diploma in Meteorology. Several outreach programmes to create awareness/popularizing meteorology were conducted in various primary schools in the districts of Jinja, Kayunga Mukono and Dokolo in 5 Sub-counties (Kangai, Kwera, Bata, Agwata and Adeknino).
2.6 Sector Finance 2.6.1 Overview
Funding to the sector under the FY 2019/20 is classified into two categories based on source of funding ;
(i) On budget Funding (funds that are released from National treasury- MoFPED on a quarterly basis) which are appropriated by Parliament of Uganda to all MDAs including Appropriation in Aid (internally generated funds by MDAs that are spent at source).
(ii) Off-budget funding composed funds to the sector that do not go through the National Treasury. These are usually transferred to the sector direct from the funders or spent by Development Partners themselves on behalf of the sector based on agreed workplan, activities and outputs.
The section provides a highlight of funding to the sector in relation to the approved budget for the year in question and releases of the approved funds in comparison to utilisation. The section further gives an overview of the various funding sources and the category of expenditures in the sector during the FY 2019/20. Funds to the sector are obtained from the Government appropriation through treasury releases to the Ministry, parastatals, agencies and local governments from GoU own revenue, Government guaranteed Loans, Grants from development Partners and Civil Society Organizations (CSOs), and

Uganda Water and Environment Sector Performance Report 2020
12
the private sector through direct funding and direct implementation in the beneficiary communities. Table 2-4 shows sector funding by source.
Table 2- 4: Funding Sources for the Sector 2019/20
Funding Source
Approved Budget including (UGX Bn) Released (UGX Bn) % of budget Released
On budget
GoU 566.577 451.358 79.7%
Donor 523.287 287.964 55.0%
AIA 578.00 391.00 67.6%
Off- Budget
Off- Budget 153.11 77.25 50.5%
Total
1,820.97 1,207.58 66.3%
The sector budget for the FY 2019/20 was UUGX 1,820.97bn (including off-budget) which was less than UGX 1,939.12 in FY 2018/19. The funding also includes Direct funding by other development agencies like UNDP, DENMARK and UNICEF to the sector. 2.6.2 National Development Plan
During the FY 2019/20, GoU prepared and submitted the National Development Plan 2020-25 where the water and Environment subsector made contributions to the development plan under chapter 9; Natural Resources, Environment, climate change, land and water management. The sector presented 79 projects to be implemented during the NDP III period at an estimated cost of UGX 13.9trillion.
The sector has an annual financial requirement of approximately UGX 5.10 trillion which will gradually increase to 10 trillion by 2030 if it is to realise its set targets in the sector strategic investment plan (2017) that will take the country to a middle-income status. The figure 2-2 below shows funding requirement to meet the sector’s set goals and the available funding over the 8-year period. Despite the increased allocations to the sector in the medium term, the gaps are increasing due to inadequacies in release of the approved budgets.
Figure 2- 2: Sector financing Requirements
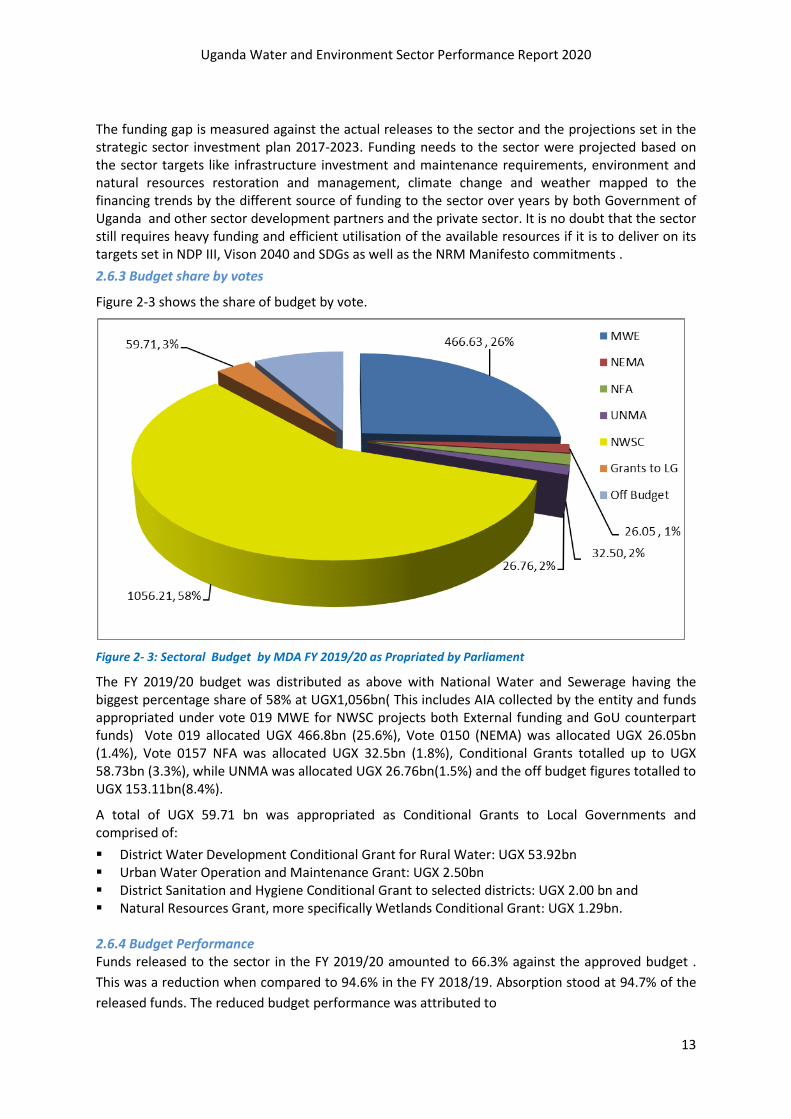
Uganda Water and Environment Sector Performance Report 2020
13
The funding gap is measured against the actual releases to the sector and the projections set in the strategic sector investment plan 2017-2023. Funding needs to the sector were projected based on the sector targets like infrastructure investment and maintenance requirements, environment and natural resources restoration and management, climate change and weather mapped to the financing trends by the different source of funding to the sector over years by both Government of Uganda and other sector development partners and the private sector. It is no doubt that the sector still requires heavy funding and efficient utilisation of the available resources if it is to deliver on its targets set in NDP III, Vison 2040 and SDGs as well as the NRM Manifesto commitments .
2.6.3 Budget share by votes
Figure 2-3 shows the share of budget by vote.
Figure 2- 3: Sectoral Budget by MDA FY 2019/20 as Propriated by Parliament
The FY 2019/20 budget was distributed as above with National Water and Sewerage having the biggest percentage share of 58% at UGX1,056bn( This includes AIA collected by the entity and funds appropriated under vote 019 MWE for NWSC projects both External funding and GoU counterpart funds) Vote 019 allocated UGX 466.8bn (25.6%), Vote 0150 (NEMA) was allocated UGX 26.05bn (1.4%), Vote 0157 NFA was allocated UGX 32.5bn (1.8%), Conditional Grants totalled up to UGX 58.73bn (3.3%), while UNMA was allocated UGX 26.76bn(1.5%) and the off budget figures totalled to UGX 153.11bn(8.4%).
A total of UGX 59.71 bn was appropriated as Conditional Grants to Local Governments and comprised of:
▪ District Water Development Conditional Grant for Rural Water: UGX 53.92bn ▪ Urban Water Operation and Maintenance Grant: UGX 2.50bn ▪ District Sanitation and Hygiene Conditional Grant to selected districts: UGX 2.00 bn and ▪ Natural Resources Grant, more specifically Wetlands Conditional Grant: UGX 1.29bn.
2.6.4 Budget Performance Funds released to the sector in the FY 2019/20 amounted to 66.3% against the approved budget .
This was a reduction when compared to 94.6% in the FY 2018/19. Absorption stood at 94.7% of the
released funds. The reduced budget performance was attributed to

Uganda Water and Environment Sector Performance Report 2020
14
• The COVID-19 pandemic and the related lock down that led to government reallocations to curb
the threat.
• Shut down of the sector related activities that led to delayed absorption leading to low utilisation of funds hence affecting replenishment on the externally financed projects.
Table 2-5 shows the sector absorption of funds released.
Table 2- 5: Aggregate Sector Releases versus Absorption
Source Budget [bn UGX] Released Spent % Released % release spent
GoU 566.577 451.358 449.749 79.7% 99.6%
Donor 523.287 287.964 225.267 55.0% 78.2%
AIA 578.00 391.00 391.00 67.6% 100.0%
Off Budget 153.11 77.25 77.25 50.5% 100.0%
Total 1,820.97 1,207.58 1,143.27 66.3% 94.7%
Releases on the GoU component only to the whole sector stood at 67.8 % which was below 92.2% in the FY 2018/19 of which 91.3% was spent. The external financing release was 55% against 78.2% utilisation. Off budget component performed at 50.5% (77.2bn ) compared to 105bn in the FY 2018/19. Details are provided in Table 2-6.
Table 2- 6: On budget performance ( GoU only)
Vote Function/Centre
Approved budget [bn UGX]
Released Spent % of Budget Released
% release spent
MWE 944.84 618.41 555.75 65.5% 89.9%
NEMA 26.05 19.81 19.65 76.0% 99.2%
NFA 32.50 23.29 23.05 71.6% 99.0%
UNMA 26.76 18.10 16.85 67.6% 93.1%
Grants to LG 59.71 59.71 59.71 100.0% 100.0%
GRAND TOTAL 1089.86 739.32 675.02 67.8% 91.3%
On Budget Performance 2019/20 by Votes less appropriation in Aid On budget allocations include both GoU contribution and external financing to the sector. On budget funding reduced from UGX 1,273 bn in the FY 2018/19 to 1,089bn in 2019/20. The drop on the budget side was mainly due to delayed completion of externally financed projects and the different implementation levels of projects that have different funding requirements. Projects tend to require more funds during the third to the fifth years of implementation compared to the first two years hence the varying budgets in the MTEF. On the utilisation and disbursement side, the reason has been well elaborated in the earlier sections. Figure 2-4 depicts trends in on budget funding.
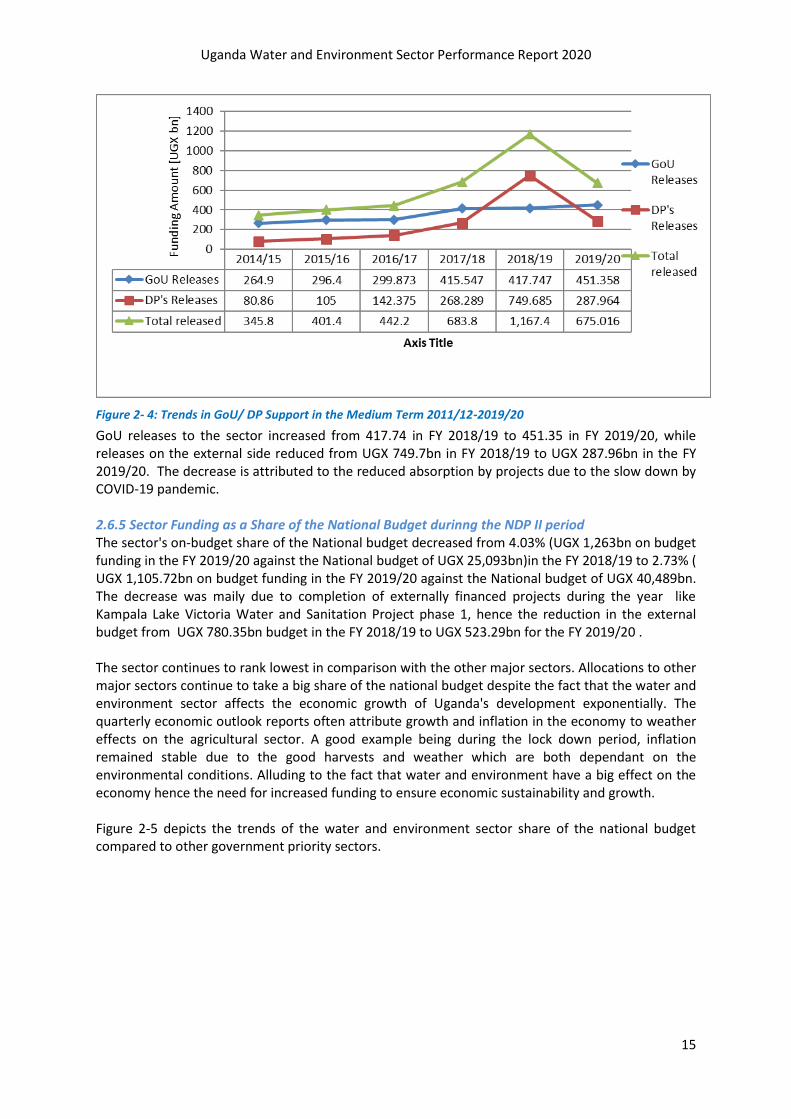
Uganda Water and Environment Sector Performance Report 2020
15
Figure 2- 4: Trends in GoU/ DP Support in the Medium Term 2011/12-2019/20
GoU releases to the sector increased from 417.74 in FY 2018/19 to 451.35 in FY 2019/20, while releases on the external side reduced from UGX 749.7bn in FY 2018/19 to UGX 287.96bn in the FY 2019/20. The decrease is attributed to the reduced absorption by projects due to the slow down by COVID-19 pandemic. 2.6.5 Sector Funding as a Share of the National Budget durinng the NDP II period The sector's on-budget share of the National budget decreased from 4.03% (UGX 1,263bn on budget funding in the FY 2019/20 against the National budget of UGX 25,093bn)in the FY 2018/19 to 2.73% ( UGX 1,105.72bn on budget funding in the FY 2019/20 against the National budget of UGX 40,489bn. The decrease was maily due to completion of externally financed projects during the year like Kampala Lake Victoria Water and Sanitation Project phase 1, hence the reduction in the external budget from UGX 780.35bn budget in the FY 2018/19 to UGX 523.29bn for the FY 2019/20 . The sector continues to rank lowest in comparison with the other major sectors. Allocations to other major sectors continue to take a big share of the national budget despite the fact that the water and environment sector affects the economic growth of Uganda's development exponentially. The quarterly economic outlook reports often attribute growth and inflation in the economy to weather effects on the agricultural sector. A good example being during the lock down period, inflation remained stable due to the good harvests and weather which are both dependant on the environmental conditions. Alluding to the fact that water and environment have a big effect on the economy hence the need for increased funding to ensure economic sustainability and growth. Figure 2-5 depicts the trends of the water and environment sector share of the national budget compared to other government priority sectors.

Uganda Water and Environment Sector Performance Report 2020
16
Figure 2- 5: Sector funding as share of national budget
The previous MWE Economic Study recommended that as Uganda seeks to industrialize, water resources development and environmental management will be critical to ensure steady growth of the industrial sector since industries depend on water and environment. Table 2-7 shows the performance of appropriation in Aid during the period under review.
Table 2- 7: Performance of Appropriation in Aid 2019/20 in UGX bn
Vote Function/Centre Budget Release % release spent
NWSC 578.00 391.00 68%
Umbrella Organization 1.00 0.125 12.5%
GRAND TOTAL 579.00 391.125 67.55%
Effective FY 2019/20, the sector had only NWSC with Appropriation in Aid budget component. The appropriated budget in the period in question was UGX 578bn of which UGX 391.125bn was released. This under performance at 67.55% was mainly due to reduction in collections by over UGX 279.5bn due to the non-disconnection policy during the COVID-19 lockdown against full water supply to all households .
2.6.6 Off- budget Financing The off- budget contribution is mainly from funds from the NGO and CBOs in the Water and Environment subsectors under the umbrella organisations i.e. UWASNET (WASH CSOs) and Environment and Natural Resources Civil Society (ENR CSOs) respectively and the development agencies that prefer to channel their funds through International development Institutions like KFW and DANIDA mainly supporting the Refuge settlements in Northern Uganda and other development partners who prefer direct implementation. The section highlights the financial contributions of Civil Society Organizations (CSOs) to the Water and Environment sector in Uganda. It is based on reports from 49 CSOs that made submissions to the Uganda Water and Sanitation NGO Network (UWASNET) and 22 CSOs, from Environment and Natural Resources Civil Society (ENR CSOs) Network. This section highlights the CSO financial investments to the sector for the Financial Year 2019/20 as well as activities by key thematic area including trends against historical performance. Details of the

Uganda Water and Environment Sector Performance Report 2020
17
physical performance are given in the detailed report. The ENR CSO contributions decreased from U$2.17m to 1.98m (UGX 7.4bn) in the FY 2019/20.
Table 2- 8:CSO Financing per subsector (UGX bn)
Subsector Agency Budget Release Spent % Release
Water supply subsector
UWASNET 145.652 69.8 69.8 48%
Environment and Natural Resources
CSOs 7.45 7.45 7.45 100%
Total 153.102 77.25 77.25 50.4%
Figure 2- 6: Trends in CSO financing: Planned and Releases (UGX bn)
NGOs/CSOs have continued to make significant investments in water supply infrastructure as well as Natural resource contributions over years with a total investment of UGX 77.2bn which however reduced from UGX 105.45bn in the FY 2018/2019. The reasons for reduction were mainly due to the effect of COVID-19 pandemic which affected many outputs and financial sources of the funders. Funds have been invested in financing water supply infrastructure, like drilling of bore holes, piped water supply, sanitation, community management and WASH activities, water for production investment in integrated water resource management, forestry services, wetland management and weather, climatic change activities and other refugee resettlement activities.
Table 2- 9: Sector Budget Performance by vote function including off budget by category. FY 2019/20
Vote Function/ Centre
Budget Category Approved budget [bn UGX]
Released Spent % of Budget Released
% release spent
VOTE 019 (MWE)
Recurrent Component Wage 7.182 7.182 7.091 100.0% 98.7%
Non-wage 14.681 11.742 11.741 80.0% 100.0%
Development Budget
GoU 386.764 298.599 298.732 77.2% 100.0%
Donor 523.287 287.964 225.267 55.0% 78.2%
Arrears 12.925 12.925 12.921 100.0% 100.0%
Vote 019 Total
944.84
618.41
555.75 65.5% 89.9%
Vote 0150 (NEMA)
Recurrent Component Wage 6.722 6.203 6.203 92.3% 100.0%
Non-wage 18.34 13.18 13.022 71.9% 98.8%

Uganda Water and Environment Sector Performance Report 2020
18
Development Budget GoU 0.99 0.429 0.429 43.3% 100.0%
Vote 0150 Total 26.05 19.81 19.65 76.0% 99.2%
Vote 157 (NFA)
Recurrent Component Wage 6.47 6.47 6.39 100.0% 98.8%
Non-wage 20.15 13.18 13.03 65.4% 98.8%
Development Budget GoU 5.88 3.64 3.64 61.9% 99.9%
Vote 157 (NFA) Total 32.50 23.29 23.05 71.6% 99.0%
Vote 302 (UNMA)
Recurrent Component Wage 7.41 7.41 6.47 100.0% 87.3%
Non-wage 5.15 4.09 3.78 79.5% 92.4%
Development Budget GoU 14.20 6.60 6.60 46.4% 100.0%
Vote 157 (NFA) Total 26.76 18.10 16.85 67.6% 93.1%
NWSC Development Budget AIA 578.00 391.00 391.00 67.6% 100.0%
Conditional Grants to LG
Rural Water Development
Devept 51.92 51.92 51.92 100.0% 100.0%
Recurrent 2.00 2.00 2.00 100.0% 100.0%
Urban Water O&M Recurrent 2.50 2.50 2.50 100.0% 100.0%
Sanitation Development
Recurrent 2.00 2.00 2.00 100.0% 100.0%
Wetlands Recurrent 1.29 1.29 1.29 100.0% 100.0%
Vote 0580 LGs 59.71 59.71 59.71 100.0% 100.0%
OFF BUDGET
WSS 145.65 69.80 69.80 47.9% 100.0%
ENR 7.45 7.45 7.45 100.0% 100.0%
Off-Budget Total 153.11 77.25 77.25 50.5% 100.0%
GRAND TOTAL
1820.97 1207.58 1143.27 66.3% 94.7%
The releases to the sector performed at 66.3% to budget and this was attributed to the reasons highlighted earlier like the re-allocations in order to address COVID -19 effects among others while absorption on the released funds performed at 94.7% for the same reasons. On the other hand, there was great improvement in the performance of the agencies in terms of funds utilisation compared to FY 2018/19 especially releases to NFA which performed at 71.6% – compared to 66.9% in the FY 2018/19, though there was a reduction by NEMA that performed at 76% compared to 96% in the previous year. 2.6.7 On-Budget Grants to Local Governments
The sector has four conditional grants of which two are development grants (Rural Water Development Conditional Grant and Sanitation Development Grant), while Urban O&M Grant and the Wetland Grant are recurrent grants. The total annual budget for all the four conditional grants was UGX bn 59.71bn in the year under review. These conditional Grants are transferred directly to the district local governments from Treasury upon approval of the local government budget and on recommendation of release by the Ministry.
The performance on each of these grants varies as per the table 2-10 below. As agreed, and promised by MoFPED, the LG conditional grant budget was released up to 100% by the end of the 3rd quarter of the financial year. The absorption level in year stood at 92.1% which was an improvement from 87.2% in the FY 2018/19. However, Local Governments still lack competent staff to run the water and environment offices due to failure to attract and retain these specialised personnel in up country stations. The effect of this is manifested in late preparation of procurement requirements leading to delays in execution of planned activities. (see detailed local government reports are provided in the report under rural water, urban water and Environment sections in this report).
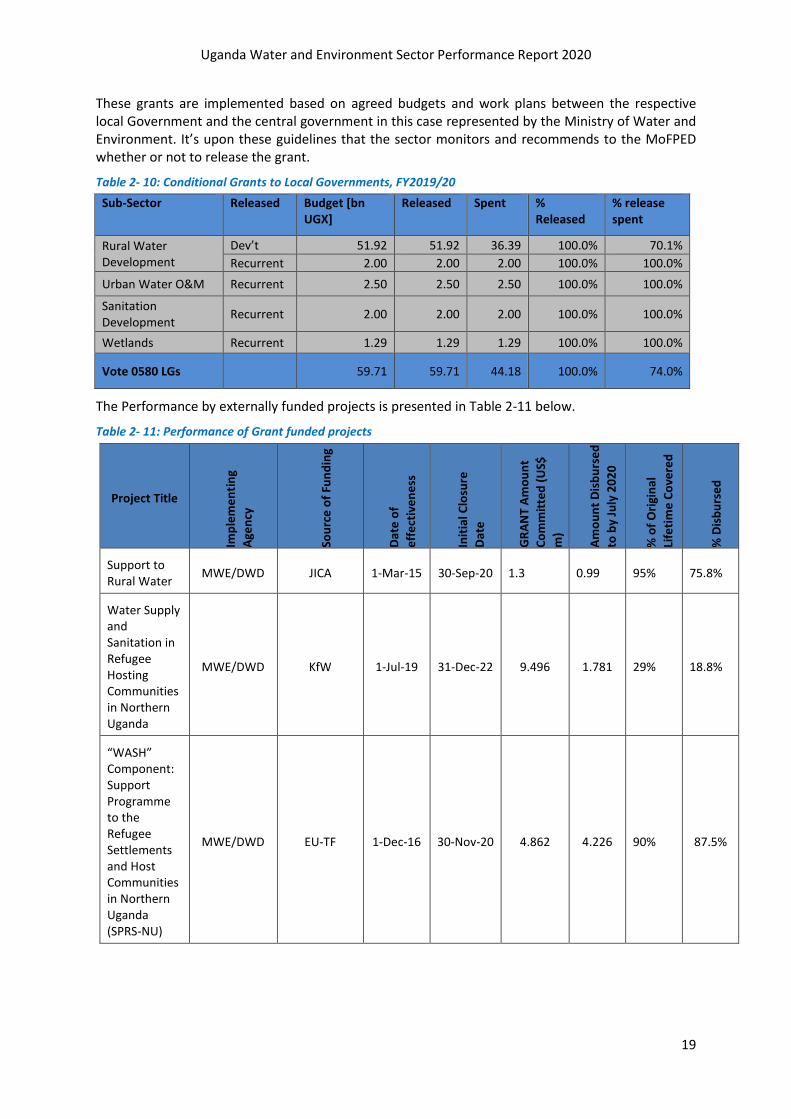
Uganda Water and Environment Sector Performance Report 2020
19
These grants are implemented based on agreed budgets and work plans between the respective local Government and the central government in this case represented by the Ministry of Water and Environment. It’s upon these guidelines that the sector monitors and recommends to the MoFPED whether or not to release the grant.
Table 2- 10: Conditional Grants to Local Governments, FY2019/20
Sub-Sector Released Budget [bn UGX]
Released Spent % Released
% release spent
Rural Water Development
Dev’t 51.92 51.92 36.39 100.0% 70.1%
Recurrent 2.00 2.00 2.00 100.0% 100.0%
Urban Water O&M Recurrent 2.50 2.50 2.50 100.0% 100.0%
Sanitation Development
Recurrent 2.00 2.00 2.00 100.0% 100.0%
Wetlands Recurrent 1.29 1.29 1.29 100.0% 100.0%
Vote 0580 LGs 59.71 59.71 44.18 100.0% 74.0%
The Performance by externally funded projects is presented in Table 2-11 below.
Table 2- 11: Performance of Grant funded projects
Project Title
Imp
lem
en
tin
g
Age
ncy
Sou
rce
of
Fun
din
g
Dat
e o
f
eff
ect
ive
ne
ss
Init
ial C
losu
re
Dat
e
GR
AN
T A
mo
un
t
Co
mm
itte
d (
US$
m)
Am
ou
nt
Dis
bu
rse
d
to b
y Ju
ly 2
02
0
% o
f O
rigi
nal
Life
tim
e C
ove
red
% D
isb
urs
ed
Support to Rural Water
MWE/DWD JICA 1-Mar-15 30-Sep-20 1.3 0.99 95% 75.8%
Water Supply and Sanitation in Refugee Hosting Communities in Northern Uganda
MWE/DWD KfW 1-Jul-19 31-Dec-22 9.496 1.781 29% 18.8%
“WASH” Component: Support Programme to the Refugee Settlements and Host Communities in Northern Uganda (SPRS-NU)
MWE/DWD EU-TF 1-Dec-16 30-Nov-20 4.862 4.226 90% 87.5%
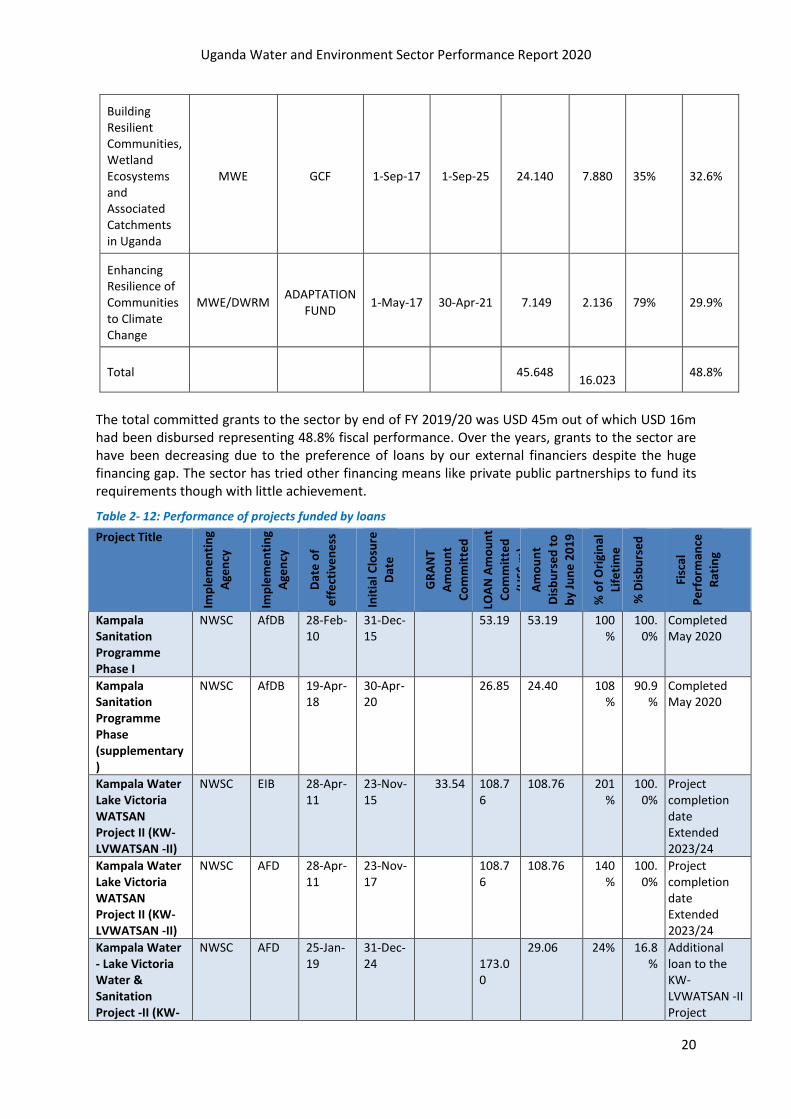
Uganda Water and Environment Sector Performance Report 2020
20
Building Resilient Communities, Wetland Ecosystems and Associated Catchments in Uganda
MWE GCF 1-Sep-17 1-Sep-25 24.140 7.880 35% 32.6%
Enhancing Resilience of Communities to Climate Change
MWE/DWRM ADAPTATION
FUND 1-May-17 30-Apr-21 7.149 2.136 79% 29.9%
Total 45.648
16.023 48.8%
The total committed grants to the sector by end of FY 2019/20 was USD 45m out of which USD 16m had been disbursed representing 48.8% fiscal performance. Over the years, grants to the sector are have been decreasing due to the preference of loans by our external financiers despite the huge financing gap. The sector has tried other financing means like private public partnerships to fund its requirements though with little achievement.
Table 2- 12: Performance of projects funded by loans
Project Title
Imp
lem
en
tin
g
Age
ncy
Imp
lem
en
tin
g
Age
ncy
Dat
e o
f
eff
ect
ive
ne
ss
Init
ial C
losu
re
Dat
e
GR
AN
T
Am
ou
nt
Co
mm
itte
d
(US$
m)
LOA
N A
mo
un
t
Co
mm
itte
d
(US$
m)
Am
ou
nt
Dis
bu
rse
d t
o
by
Jun
e 2
01
9
% o
f O
rigi
nal
Life
tim
e
Co
vere
d
% D
isb
urs
ed
Fisc
al
Pe
rfo
rman
ce
Rat
ing
Kampala Sanitation Programme Phase I
NWSC AfDB 28-Feb-10
31-Dec-15
53.19 53.19 100%
100.0%
Completed May 2020
Kampala Sanitation Programme Phase (supplementary)
NWSC AfDB 19-Apr-18
30-Apr-20
26.85 24.40 108%
90.9%
Completed May 2020
Kampala Water Lake Victoria WATSAN Project II (KW-LVWATSAN -II)
NWSC EIB 28-Apr-11
23-Nov-15
33.54 108.76
108.76 201%
100.0%
Project completion date Extended 2023/24
Kampala Water Lake Victoria WATSAN Project II (KW-LVWATSAN -II)
NWSC AFD 28-Apr-11
23-Nov-17
108.76
108.76 140%
100.0%
Project completion date Extended 2023/24
Kampala Water - Lake Victoria Water & Sanitation Project -II (KW-
NWSC AFD 25-Jan-19
31-Dec-24
173.00
29.06 24% 16.8%
Additional loan to the KW-LVWATSAN -II Project

Uganda Water and Environment Sector Performance Report 2020
21
LVWATSAN -II)
Water Supply and Sanitation Programme - Phase II (WSSP- II)
MWE/DWD
AfDB 11-May-16
30-Jun-20
92.3 91.6 100%
99.2%
Project still ongoing, and to end December 2020
Strategic Towns Water Supply and Sanitation Project (STWSSP)
MWE/DWD
ADB 0-Jul-19 30-Jun-22
62.48 4.45 33% 7.1% Effective Start July 1st 2019
South Western Cluster Towns of Masaka and Mbarara Project
NWSC AFD 14-Jan-19
31-Dec-24
138.4 7.2 24% 5.2% Effective Start July 1st 2019
Farm Income and Forest Conservation Project Phase II (FIEFOC-II)
MWE/DWD
AfDB & NDF
06-Jan-16
30-Jun-21
5.6 76.7 46.7 82% 38.5%
Project still On-going
Multi-National Lakes Edward and Albert Integrated Fisheries and Water Resources Management Project (LEAF)
MWE/DWRM
AfDB 11-May-16
30-Jun-21
6.91 6.1 81% 87.7%
Project still On-going
Integrated Water Management & Development Project (IWMDP)
MWE & NWSC
IDA 01-Jul-19
30-Jun-25
29 251 10.3 17% 4.1% Effective Started July 1st 2019
NEXUS GREEN Development of Solar Powered Water Supply Systems
MWE UK Export Finance
01-Jul-19
30-Jun-22
110.1 0 33% 0.0% Effective Started March 1st 2020
Total
1,208.4 492.9
40.8%
50% Moderate
The sector is funded externally by World Bank, Arab Bank for Economic Development in Africa (BADEA), African Development Bank (AfDB), European Investment Bank (EIB) and French Development Fund (AFD) through development loans. The loan portfolio to the sector during the FY 2019/20 amounted to USD 1,208.8million financing 12 projects as indicated above. Though no new loan agreements were signed during the year.
The overall projects performance rating was moderate at 50% fiscal performance. Twenty five percent (3 No) of the assessed projects had Satisfactory fiscal performance, sixty six percent (8 No) were moderately satisfactory by June 2020 and 8% (1 No) was ranked unsatisfactory.
Uganda Water and Environment Sector Performance Report 2020
22
Physical progress: Eighty-Nine (89%) of the loans were ranked On-track, 13% require follow up not to get off track and 8% was off track.
2.6.8 Challenges i) Rising lake and river water levels that required re-allocations of sector plans and budgets hence
affected the planned targets and allocations. ii) The advent of the COVID 19 pandemic and its Standard Operating Procedures (SOPs) coupled
with related budget reductions constrained all planned Face to Face (F2F) training programmes. Sector institutions will therefore need to invest in online training technology to address the COVID 19 impacts on the management of capacity building interventions in the sector.
iii) Uncoordinated Sector planning and actual implementation of projects which affected the outputs and absorption of funds. The planned outputs were not well aligned to the implementation timelines.
iv) Freezing of components of the budget like consultancy services and allowances that were deemed consumptive yet they affect delivery of projects outputs.
v) Low prioritization of water despite the ever-increasing demand for it.
Uganda Water and Environment Sector Performance Report 2020
23
3. JOINT SECTOR REVIEW UNDERTAKINGS 2019/20
Undertaking 1: Finalize the mainstreaming guidelines and support preparation of sector specific
mainstreaming guidelines for the 4 remaining high impact sectors (Agriculture, Infrastructure,
Lands, Energy) by FY 2019/20.
Actions taken:
• Finalized and printed the General Environment mainstreaming guidelines,
• Draft Environment mainstreaming guidelines for Agriculture Sector in place with support
from FAO.
Next steps: i) Dissemination of the general guidelines,
ii) Training the users.
Challenges: Lack of funds to carry out the institutional consultations, dissemination/ training and for
preparing the sector specific mainstreaming guidelines for the 3 remaining sectors (Infrastructure,
Lands, Energy).
Recommendations: a) The outstanding activities related to awareness raising /dissemination and
trainings should be conducted online considering that the MWE has been facilitated to acquire video
conferencing/online platforms, b) Build capacity in the concept of mainstreaming in practice.
Undertaking 1 is on track and level of achievement is 40% may not be achieved fully due to lack of funds.
Undertaking 2: Put in place a strategy and action plan for accelerated implementation of the CC
mainstreaming guidelines including capacity building, resource mobilizing and a framework for
reporting by FY 2019/20.
Action taken:
• Shared guidelines with sectors,
• ii) Contacted various partners to support the mainstreaming process,
• iii) FAO has supported the development of the Agriculture sector CC mainstreaming guidelines,
• iv) USAID is supporting the awareness raising in DLGs,
• v) Boardroom trainings to sectors,
• vi) ToRs for the specific guidelines developed. Next steps: i) As an entry point update the 2014 guidelines, ii) Develop capacity building plan for
training at the level of planners and practitioners for priority sectors/LG, iii) Develop training manual
and modules on screening tools; and offline demo version and iv) Hands-on dedicated training and
clinics on mainstreaming process and implementation, v) Intensify boardroom meetings especially
with MFPED and all sectors including DLGs and vi) Continued underscoring of mainstreaming process
as an unfunded priority.
Undertaking is off track and level of achievement is 25% hence will not be achieved due to lack of funds.
Undertaking 3: Prepare a study to guide parliament on increased financing of Climate Change
interventions including contribution from other MDAs by FY 2020/2021.
Uganda Water and Environment Sector Performance Report 2020
24
Action taken
• Mapped existing financing streams,
• Carried out an analysis of GoU & other sources of financing,
• Prepared ToRs for hiring a consultant to support implementation of the undertaking.
Next steps: i) Procurement of a consultant, ii) Plan for cconsultations in various MDAs & DLGs,
iii) Encourage Private-Public Partnerships (PPPs) in enhancement of climate change response
actions, iv) Promote climate research in the highly impacted sectors through concept development
to attract funding.
Challenges: Limited of financial support to conduct the undertaking.
Recommendations: The undertaking should be carried forward to FY 2020/2021.
Undertaking is off track and level of achievement is 10% hence will not be achieved due to lack
of funds.
Undertaking 4: Prepare at least 4 project proposals for approval to be funded under the Green
Climate Fund (GCF) and Adaptation Fund (AF) by the Ministry and LGs spearheaded by the de-
concentrated units focusing on ENR by FY 2019/20.
Action taken;
• A 10-member project preparation Task Force with representatives from Policy and Planning Department, WRM, DWD, ENR, CCD, WSDFs, Agencies i.e. UNMA, NFA, NEMA, NWSC in place,
• Project proposal was developed by UNMA and approved by the WESWG on 16th /July/2020 and ready for submission to GCF through MFPED/NDA,
• Project concept was prepared by DWRM and submitted to MFPED on 20.2.2020 for endorsement and subsequent submission to GCF,
• project was prepared by WSDF South West and submitted to MFPED/GGI on 20th/July/2020 for endorsement to GCF,
• Project prepared by DWRM and submitted in June 2020 for endorsement and subsequent submission to GCF,
• The project was prepared by DWRM and submitted to MFPED for endorsement by the Adaptation Fund Board as a pipeline project.
Challenges: Lack of funds to facilitate the task force meetings and thus the respective MDAs took
their own initiatives, prepared concepts/proposals and submitted.
Undertaking is on track and its level of achievement is 50% and is unlikely to be fully achieved.
Undertaking 5: Upgrade 13 water schemes in refugee hosting districts and integrate management
of existing water supply and sanitation into utility management structures sustainably.
Action taken
• Water and Environment Refuge Response Plan completed and launched in March 2020;
Refugee Sub-group & Secretariat functional,
• Technical engineering designs developed for 10 schemes and 1 Feacal sludge treatment plant,
Uganda Water and Environment Sector Performance Report 2020
25
• Completed Construction of 10No WSS in: Ranch 1 (Kiryandongo); Alere, Nyumanzi, Ofua III, Omugo VI, Olujobo/Tika, Ayilo II (Adjumani); Bidi-Bidi Zone V (Yumbe); Pawor (Madi Okolo); & Yelulu (Terego).
• Construction of 06No WSS at 50% completion in: Odobo, Wanyange, Ocea, Eden, Buluku-atuni (Madi Okolo); Cinya (Terego),
• For O&M, Umbrella approach is under pilot in 3 schemes of Alere, Ofua 2 and Nyumanzi. Ranch 1 and Rwamwanja are under NWSC,
• (v) The Kagera WSS project funded by EU through AFD (Euro.10.7m) implemented by NWSC is at Detailed design stage, it will supply Orucinga and Nakivale refugee settlements,
• (vi) The feacal sludge treatment plant construction in Rhino-camp, Terego district is under procurement, funded by KFW and implemented by Oxfam through OPM (this includes the 8No Schemes),
• Planned upgrade of 20 schemes and handover to NUWS by GIZ/MWE under Water Supply and Sanitation for Refugee Settlements and Host Communities in Northern Uganda (WatSSUP) (viii) Uganda’s IWMDP – WSS, & Capacity building, WB. in Yumbe, Moyo, Adjumani, Lamwo, Arua, Kiryandongo,
• (ix) Development of WSS schemes, feacal sludge treatment plant and well-functioning O&M structures in refugee settlements in Arua, Kiryandongo, Adjumani & Yumbe by EU trust fund, (x) Northern Uganda Resilience Initiative (NURI) - Development of 8 Micro-Catchment Management Plans, Setting up MCP coordination structures by DANIDA,
• (xi) Conclusion of town gazetting criteria and guidelines by MWE, (xii) Development of O&M model for operator schemes – ADA and GIZ, vii) UNHCR-OPM-MWE agreement on schemes handover process and timelines.
Challenges: i) Delays in construction progress due to Covid-19 Pandemic, ii) Funding gaps for the
operations of the secretariat’s coordination role in monitoring progress of implementation of the
undertakings and iii) Understaffing of the secretariat.
Undertaking is on track and level of achievement is 85% will most likely be achieved.
Undertaking 6: Restore degraded hotspots within the refugee hosting micro-catchments.
Action taken
• 14 micro catchments have been mapped around refugee settlements. 6 Micro Catchment
Management Plans are planned to be prepared this year,
• 3 Micro Catchment Management Plans prepared (under NURI Project). This include Yelulu
(Arua), Ora (Zombo) and Nyarwodho (Nebbi) micro catchments,
• Degraded hotpots from the 3 Micro Catchment Management Plans identified,
• Restoration of degraded hotspots in the 3 Micro Catchment Management Plans initiated
(under NURI Project),
• Micro Catchment Stakeholders Forum (CSF) established awaiting election of Micro
Catchment Management Committee,
• Formulation of community bylaws on natural resources management is ongoing,
• Preparation of 5 Micro Catchment Management Plans initiated (under NURI Project). This
include Ogwapoke (Kitgum), Nyivura (Adjumani), Iboa (Moyo/Obongi) and Abongo
(Packwach) micro-catchments,
• Procurement of consultants for preparation of 6 Micro Catchment Management Plans is
ongoing (under World Bank).

Uganda Water and Environment Sector Performance Report 2020
26
Challenges: i) Impact of Covid-19 virus which limited stakeholder interactions (Processes are largely
stakeholder driven), ii) Limited Capacity in Integrated Water Resources Management (IWRM) among
various stakeholders and iii) Limited awareness of Community Based IWRM (CbIWRM).
Undertaking is on track and level of achievement is 70% but the remaining actions will not be achieved due to lack of funds.
Undertakings No. 7: Conduct a comprehensive review to identify the causes of water supply inequity and identify strategies to address them by FY 2019/20 Action taken:
• Terms of Reference were approved by the procurement committee of UNICEF in January 2020;
• UNICEF Procurement committee selected a successful bidder in February 2020;
• Contract was signed by the Consultant and the responsible entities (MWE & UNICEF) in April 2020;
• The consultant held start-up meeting/ commencement of assignment; and,
• The consultant conducted desk study/literature review and interviews with key stakeholders including with HoDs for RWD, UWD and WFP.
Next Action
• Submission of Inception Report;
• The consultant is expected to conduct field Visits;
• Diagnosis Review & Consultations;
• Presentation of Draft Comprehensive Report to the Technical Working Group; and
• Final Report.
This undertaking is largely achieved
Undertaking 8: Develop and document a sustainable financing strategy for the Umbrella
Authorities by the end of FY 2019/20
Action taken
• Work plan for the undertaking developed,
• ToR for procurement of the consultancy to develop a financing strategy for Umbrellas of
Water and Sanitation (Under Professionalization Consultant for the Umbrellas of Water
and Sanitation) prepared and submitted to the World bank for approval,
• Solicitation for Resources,
• Initiation of the Procurement,
• Consultations with the World Bank,
• Regional Consultative Meetings,
• Development of Performance Improvement Plans (PIPs) for selected WSSs.
Next steps: (i) Approval of the final Terms of Reference (ToRs) by the WB, (ii) Procurement of the
Professionalization Consultant to design and document the long term financing strategy for the
Umbrella Authorities, (iii) Commencing/development of the Financing Strategy, (iv) Dissemination of
the strategy for execution.
Undertaking is off track and level of achievement is about 20% will not be achieved due to lack of funds therefore it should be carried on in the FY 2020/21.
Undertaking 9: Develop a management framework for faecal sludge service management chain
(including business aspects) by end of FY 2019/20 (continued from last FY).

Uganda Water and Environment Sector Performance Report 2020
27
Action taken;
• Prepared Standard Operating Procedures for FSTPs,
• Test running/ pilot management of Apac FSTP under UWS – North; Kyotera under UWS –
Central,
• Undertaking consultancy services to conduct feasibility studies and detailed design of
fecal sludge management facilities in 10 un-sewered towns in Uganda i.e. assignment to
suggest alternative feasible management frameworks,
Next steps: (i) Complete feasibility study assignment with recommendations of alternative
management frameworks, (ii) Stakeholder consultation and recommendations for adoption, (iii)
Formulation of Feacal Sludge Management (FSM) tools (Financial/business models), (iv) In
collaboration with Water for People: Pilot project on safely managed sanitation in 03 towns of
Pallisa, Kole and Nansana to experiment innovations in FSM promotion and management (WSSP), (v)
Design and implementation Feacal Sludge Treatment Plant (FSTP) infrastructure under AfDB
(STWSSP/WSSP II) WB (IWMDP), (vi) Expediting commencement of Assignment 2. Completion of
study under Assignment 1, (vii) Stakeholder engagement on the management framework for faecal
sludge service chain in Uganda and (viii) Undertaking will be substantially completed by December
2020.
Challenges: (i) Procurement delays in the consultancy assignment (Assignment 2: North and Eastern
regions), ii) Administrative challenges due to COVID-19 restrictions: Stakeholder consultations, delay
in consultancy fieldwork (Assignment 1: Central and South Western regions).
Undertaking is on track and level of achievement is 70% will not be achieved by the 2020 JSR but will be complete by the end of year December 2020.
Undertaking 10: Disseminate the sanitation monitoring indicators, measurement framework and
develop an improved MIS system (digital based) by FY 2019/20.
Action taken
• Procurement of consultant for Development of the improved MIS system with
support from UNICEF has been concluded,
• Contract signed with Advanced Geospatial Solutions (AGS) on 8th June 2020, (
• AGS was introduced to the key contact persons,
• AGS presented their rough understanding of the task and general plans,
• Scoping by the Consultant is ongoing to gather user requirements and (vi)
Consultative meetings with key contact persons are ongoing.
Next steps: (i) Complete development of the MIS system, (ii) Disseminate and build capacity of
District Local Governments and CSOs on use of the MIS and (iii) Disseminate the performance
indicators to local governments and other stakeholders.
Undertaking is off track still at infancy stages level of achievement is 20% hence will not be
achieved. It is therefore recommended to carry it over to next FY 2020/2021.
Undertaking 11: Develop a national master plan for improved coverage of “safely managed”
sanitation by FY 2019/2020.
Uganda Water and Environment Sector Performance Report 2020
28
Action taken;
• Stakeholder consultations on the requirements for development of Master plan,
• Drafted ToRs for consultancy services to develop the National master plan for improved
coverage of safely managed sanitation,
• Shared the ToRs with stakeholders for funding opportunities,
Next steps: (i) Finalise preparation of ToRs for consultancy to develop the National master plan for
improved coverage of safely managed sanitation, (ii) Engage a consultant for the study, (iii)
Stakeholder engagement on improved coverage of safely managed sanitation, (iv) Development of
the National master plan for improved coverage of safely managed sanitation, (v) Continued
engagement with stakeholders for funding of the National master plan for improved coverage of
safely managed sanitation (Sanitation and Hygiene Fund, BMBF, WfP …..) (vi) Completion of the ToR
for the study with clarity on sub-sector responsibilities, (vii) Procurement of consultant and
implementation of the study.
Challenges: (i) Inadequate policy framework for un-sewered sanitation, (ii) No funding for the
consultancy study and (iii) Limited opportunities for stakeholder engagement in light COVID-19
restrictions.
Undertaking is off track and level of achievement is 20% hence will not be achieved due to lack
of funds. It is therefore recommended to continue with this undertaking in next Financial Year
Undertaking 12: Develop a strategy and a plan for joint action to enforcement and compliance to
water and Environment Laws using the Ministry of Water and Environment (MWE) regional
structures and Local Governments.
Action taken: This undertaking has not been implemented so far because it lacked anchoring so that
a specific directorate to spearhead it. It was agreed during the Joint Technical Review that the
Undertaking be split between DWRM and ENR respectively and to ease its implementation as
follows:
12a. Develop a strategy and a plan for enforcement and compliance to water Laws using the
Ministry of Water and Environment (MWE) structures and Local Governments.
12b. Develop a strategy and a plan for enforcement and compliance to Environment Laws using the
Ministry of Water and Environment (MWE) structures and Local Governments.
Key issues/observations: i) The undertaking is very crucial and currently ENR and DWRM is
implementing bits and pieces of it, ii) At the MWE regional level, enforcing is taking place, what is
lacking is coordination and sharing of information.
Recommendation: a) Undertakings 12a and 12b be carried forward for the implementation in the
next 12 months.
Undertaking 13: Review the Environmental Impact Assessment (EIA) process including approvals,
monitoring and enforcing conditions in the EIA certificates.
Action taken:

Uganda Water and Environment Sector Performance Report 2020
29
• Carried out management response through implementing administrative and technical
reforms,
• Legal reforms- where the National Environment Act (NEA) and regulations on EIAs, audit
and permits have been reviewed to meet the new and emerging national priorities and
the related environmental and social concerns including; a) Process steps-merger
where various steps in the EIA review process have been merged in order to create
efficiency through time saving and reduction in the lengths of processes and procedures
and b) Use of electronic data base which has been established and operationalized
to enhance efficiency and effectiveness in the review, approval, inspections and
monitoring of EIAs and permits,
• Use of soft systems and real time data through GIS, remote sensing and satellite
applications which are time-saving and more effective,
• Electronic transfer of reports to Lead Agencies to save time and avoid unnecessary
forward and backward movements of documents,
• Application of the full cycle process- baseline verifications, monitoring and inspection as
well as environmental audits through the cluster teams and use of technology and
scientific applications like Google earth,
• Formation of cluster teams for the review of EIAs on sector basis like – energy, mining,
infrastructure, manufacturing, agriculture and ICT, among others and (vii) Joining the
One-Stop-Centre with other Government institutions, which are involved in handling of
investments such as Uganda Investment Authority (UIA), Uganda Revenue Authority
(URA),
• Recruitment of more staff with budget support from Government of Uganda ,
• Mobilization of more funding from Government and off-budget projects to support
environmental monitoring and compliance activities ,
• Establishment and operationalization of three (3) more regional offices in Lira, Mbale
and Mbarara in addition to one in the Masindi, which was established earlier,
• These four regional offices decentralized service delivery to local governments and
investors (developers) and thus saving them time and costs, and
• NEMA supported the development of the Strategy on Coordination and Integration of
Environment and Sustainability Concerns into Lead Agency Plans and Operations.
Observation/ recommendation: NEMA should utilize the lead agencies e.g. ENR has 3 staff who
could support the EIA processes.
Undertaking is on track and level of achievement is 90% but will not be fully achieved due to
lack of funds.
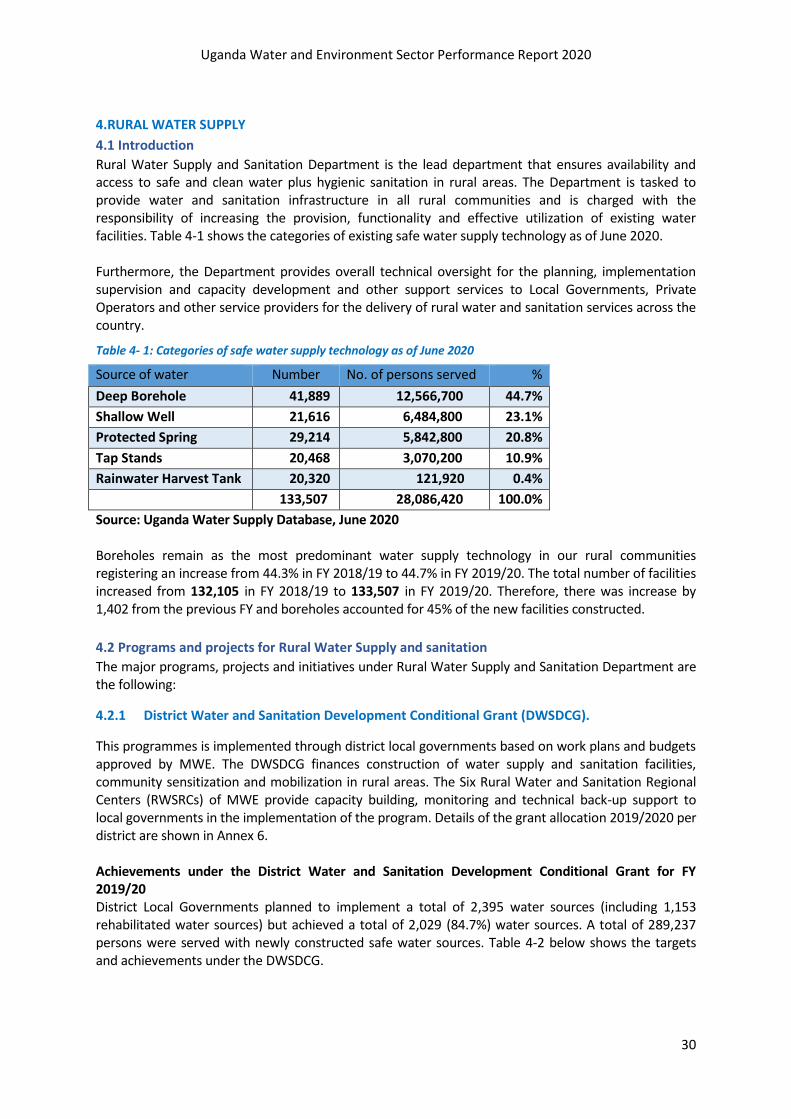
Uganda Water and Environment Sector Performance Report 2020
30
4.RURAL WATER SUPPLY
4.1 Introduction
Rural Water Supply and Sanitation Department is the lead department that ensures availability and access to safe and clean water plus hygienic sanitation in rural areas. The Department is tasked to provide water and sanitation infrastructure in all rural communities and is charged with the responsibility of increasing the provision, functionality and effective utilization of existing water facilities. Table 4-1 shows the categories of existing safe water supply technology as of June 2020. Furthermore, the Department provides overall technical oversight for the planning, implementation supervision and capacity development and other support services to Local Governments, Private Operators and other service providers for the delivery of rural water and sanitation services across the country.
Table 4- 1: Categories of safe water supply technology as of June 2020
Source of water Number No. of persons served %
Deep Borehole 41,889 12,566,700 44.7%
Shallow Well 21,616 6,484,800 23.1%
Protected Spring 29,214 5,842,800 20.8%
Tap Stands 20,468 3,070,200 10.9%
Rainwater Harvest Tank 20,320 121,920 0.4% 133,507 28,086,420 100.0%
Source: Uganda Water Supply Database, June 2020 Boreholes remain as the most predominant water supply technology in our rural communities registering an increase from 44.3% in FY 2018/19 to 44.7% in FY 2019/20. The total number of facilities increased from 132,105 in FY 2018/19 to 133,507 in FY 2019/20. Therefore, there was increase by 1,402 from the previous FY and boreholes accounted for 45% of the new facilities constructed.
4.2 Programs and projects for Rural Water Supply and sanitation
The major programs, projects and initiatives under Rural Water Supply and Sanitation Department are the following:
4.2.1 District Water and Sanitation Development Conditional Grant (DWSDCG).
This programmes is implemented through district local governments based on work plans and budgets approved by MWE. The DWSDCG finances construction of water supply and sanitation facilities, community sensitization and mobilization in rural areas. The Six Rural Water and Sanitation Regional Centers (RWSRCs) of MWE provide capacity building, monitoring and technical back-up support to local governments in the implementation of the program. Details of the grant allocation 2019/2020 per district are shown in Annex 6. Achievements under the District Water and Sanitation Development Conditional Grant for FY 2019/20 District Local Governments planned to implement a total of 2,395 water sources (including 1,153 rehabilitated water sources) but achieved a total of 2,029 (84.7%) water sources. A total of 289,237 persons were served with newly constructed safe water sources. Table 4-2 below shows the targets and achievements under the DWSDCG.
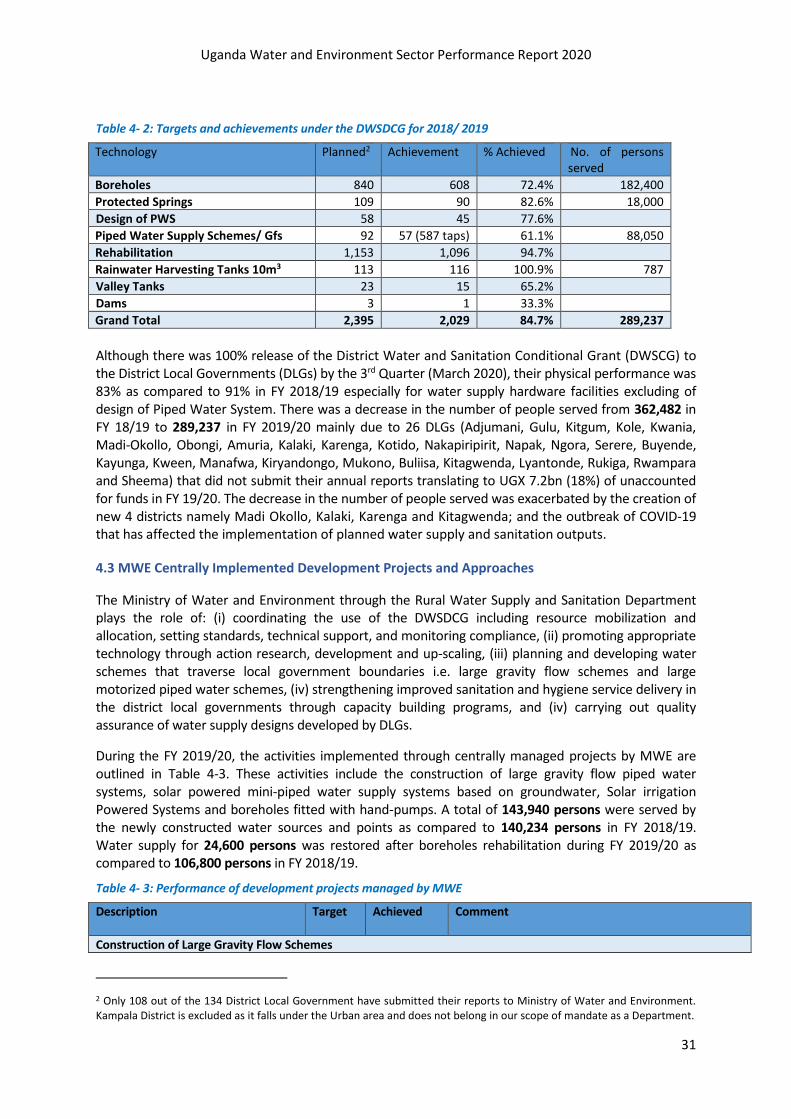
Uganda Water and Environment Sector Performance Report 2020
31
Table 4- 2: Targets and achievements under the DWSDCG for 2018/ 2019
Technology Planned2 Achievement % Achieved No. of persons served
Boreholes 840 608 72.4% 182,400
Protected Springs 109 90 82.6% 18,000
Design of PWS 58 45 77.6%
Piped Water Supply Schemes/ Gfs 92 57 (587 taps) 61.1% 88,050
Rehabilitation 1,153 1,096 94.7%
Rainwater Harvesting Tanks 10m3 113 116 100.9% 787
Valley Tanks 23 15 65.2%
Dams 3 1 33.3%
Grand Total 2,395 2,029 84.7% 289,237
Although there was 100% release of the District Water and Sanitation Conditional Grant (DWSCG) to the District Local Governments (DLGs) by the 3rd Quarter (March 2020), their physical performance was 83% as compared to 91% in FY 2018/19 especially for water supply hardware facilities excluding of design of Piped Water System. There was a decrease in the number of people served from 362,482 in FY 18/19 to 289,237 in FY 2019/20 mainly due to 26 DLGs (Adjumani, Gulu, Kitgum, Kole, Kwania, Madi-Okollo, Obongi, Amuria, Kalaki, Karenga, Kotido, Nakapiripirit, Napak, Ngora, Serere, Buyende, Kayunga, Kween, Manafwa, Kiryandongo, Mukono, Buliisa, Kitagwenda, Lyantonde, Rukiga, Rwampara and Sheema) that did not submit their annual reports translating to UGX 7.2bn (18%) of unaccounted for funds in FY 19/20. The decrease in the number of people served was exacerbated by the creation of new 4 districts namely Madi Okollo, Kalaki, Karenga and Kitagwenda; and the outbreak of COVID-19 that has affected the implementation of planned water supply and sanitation outputs.
4.3 MWE Centrally Implemented Development Projects and Approaches
The Ministry of Water and Environment through the Rural Water Supply and Sanitation Department plays the role of: (i) coordinating the use of the DWSDCG including resource mobilization and allocation, setting standards, technical support, and monitoring compliance, (ii) promoting appropriate technology through action research, development and up-scaling, (iii) planning and developing water schemes that traverse local government boundaries i.e. large gravity flow schemes and large motorized piped water schemes, (iv) strengthening improved sanitation and hygiene service delivery in the district local governments through capacity building programs, and (iv) carrying out quality assurance of water supply designs developed by DLGs.
During the FY 2019/20, the activities implemented through centrally managed projects by MWE are outlined in Table 4-3. These activities include the construction of large gravity flow piped water systems, solar powered mini-piped water supply systems based on groundwater, Solar irrigation Powered Systems and boreholes fitted with hand-pumps. A total of 143,940 persons were served by the newly constructed water sources and points as compared to 140,234 persons in FY 2018/19. Water supply for 24,600 persons was restored after boreholes rehabilitation during FY 2019/20 as compared to 106,800 persons in FY 2018/19.
Table 4- 3: Performance of development projects managed by MWE
Description Target Achieved
Comment
Construction of Large Gravity Flow Schemes
2 Only 108 out of the 134 District Local Government have submitted their reports to Ministry of Water and Environment. Kampala District is excluded as it falls under the Urban area and does not belong in our scope of mandate as a Department.
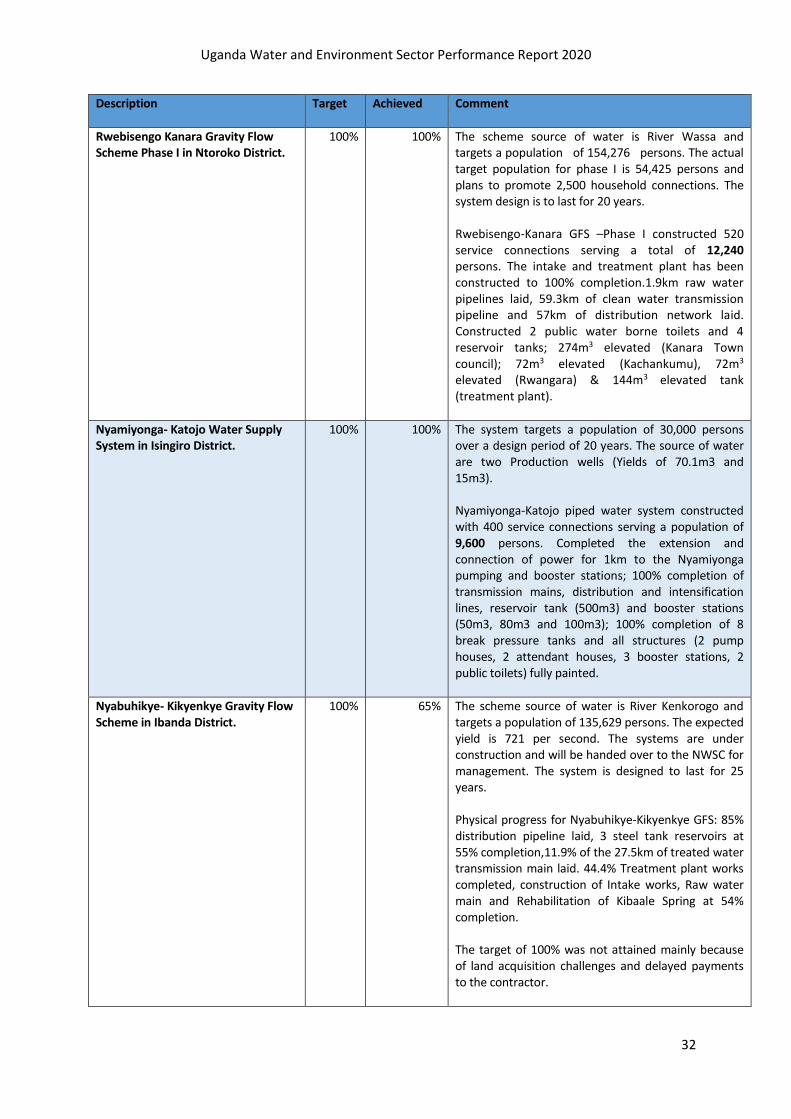
Uganda Water and Environment Sector Performance Report 2020
32
Description Target Achieved
Comment
Rwebisengo Kanara Gravity Flow Scheme Phase I in Ntoroko District.
100% 100% The scheme source of water is River Wassa and targets a population of 154,276 persons. The actual target population for phase I is 54,425 persons and plans to promote 2,500 household connections. The system design is to last for 20 years. Rwebisengo-Kanara GFS –Phase I constructed 520 service connections serving a total of 12,240 persons. The intake and treatment plant has been constructed to 100% completion.1.9km raw water pipelines laid, 59.3km of clean water transmission pipeline and 57km of distribution network laid. Constructed 2 public water borne toilets and 4 reservoir tanks; 274m3 elevated (Kanara Town council); 72m3 elevated (Kachankumu), 72m3 elevated (Rwangara) & 144m3 elevated tank (treatment plant).
Nyamiyonga- Katojo Water Supply System in Isingiro District.
100% 100% The system targets a population of 30,000 persons over a design period of 20 years. The source of water are two Production wells (Yields of 70.1m3 and 15m3). Nyamiyonga-Katojo piped water system constructed with 400 service connections serving a population of 9,600 persons. Completed the extension and connection of power for 1km to the Nyamiyonga pumping and booster stations; 100% completion of transmission mains, distribution and intensification lines, reservoir tank (500m3) and booster stations (50m3, 80m3 and 100m3); 100% completion of 8 break pressure tanks and all structures (2 pump houses, 2 attendant houses, 3 booster stations, 2 public toilets) fully painted.
Nyabuhikye- Kikyenkye Gravity Flow Scheme in Ibanda District.
100% 65% The scheme source of water is River Kenkorogo and targets a population of 135,629 persons. The expected yield is 721 per second. The systems are under construction and will be handed over to the NWSC for management. The system is designed to last for 25 years. Physical progress for Nyabuhikye-Kikyenkye GFS: 85% distribution pipeline laid, 3 steel tank reservoirs at 55% completion,11.9% of the 27.5km of treated water transmission main laid. 44.4% Treatment plant works completed, construction of Intake works, Raw water main and Rehabilitation of Kibaale Spring at 54% completion. The target of 100% was not attained mainly because of land acquisition challenges and delayed payments to the contractor.
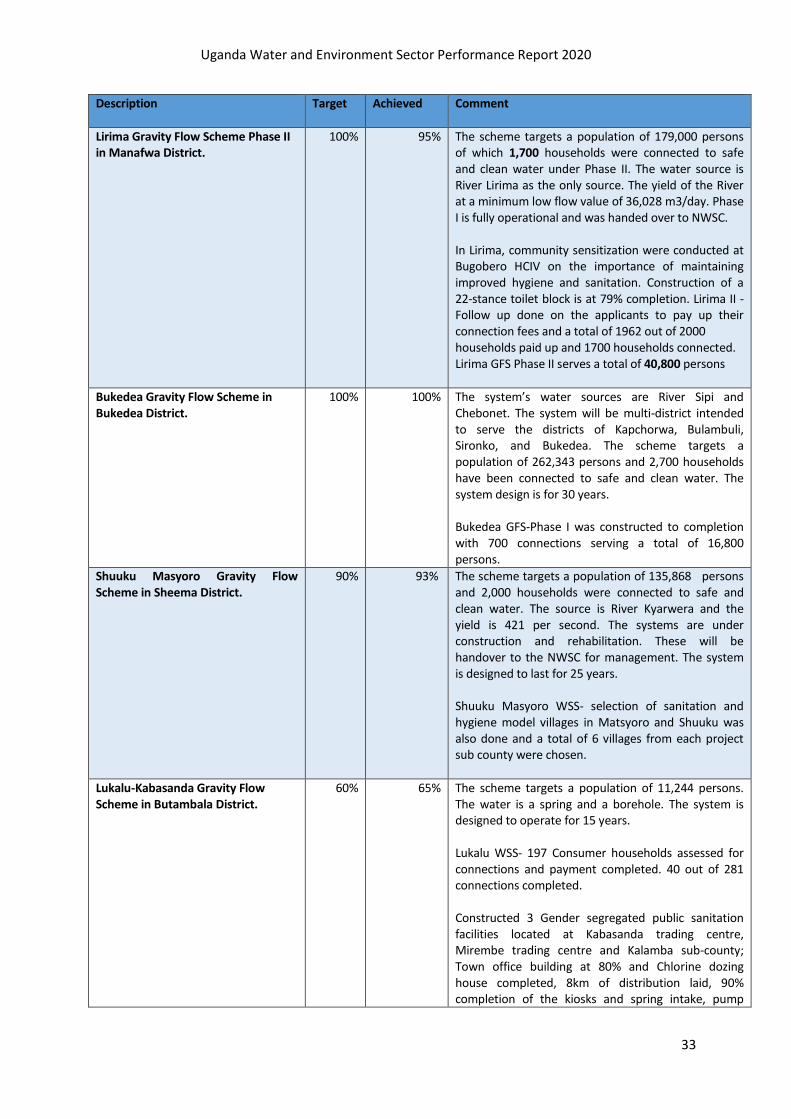
Uganda Water and Environment Sector Performance Report 2020
33
Description Target Achieved
Comment
Lirima Gravity Flow Scheme Phase II in Manafwa District.
100% 95% The scheme targets a population of 179,000 persons of which 1,700 households were connected to safe and clean water under Phase II. The water source is River Lirima as the only source. The yield of the River at a minimum low flow value of 36,028 m3/day. Phase I is fully operational and was handed over to NWSC. In Lirima, community sensitization were conducted at Bugobero HCIV on the importance of maintaining improved hygiene and sanitation. Construction of a 22-stance toilet block is at 79% completion. Lirima II - Follow up done on the applicants to pay up their connection fees and a total of 1962 out of 2000 households paid up and 1700 households connected. Lirima GFS Phase II serves a total of 40,800 persons
Bukedea Gravity Flow Scheme in Bukedea District.
100% 100% The system’s water sources are River Sipi and Chebonet. The system will be multi-district intended to serve the districts of Kapchorwa, Bulambuli, Sironko, and Bukedea. The scheme targets a population of 262,343 persons and 2,700 households have been connected to safe and clean water. The system design is for 30 years. Bukedea GFS-Phase I was constructed to completion with 700 connections serving a total of 16,800 persons.
Shuuku Masyoro Gravity Flow Scheme in Sheema District.
90% 93%
The scheme targets a population of 135,868 persons and 2,000 households were connected to safe and clean water. The source is River Kyarwera and the yield is 421 per second. The systems are under construction and rehabilitation. These will be handover to the NWSC for management. The system is designed to last for 25 years. Shuuku Masyoro WSS- selection of sanitation and hygiene model villages in Matsyoro and Shuuku was also done and a total of 6 villages from each project sub county were chosen.
Lukalu-Kabasanda Gravity Flow Scheme in Butambala District.
60% 65% The scheme targets a population of 11,244 persons. The water is a spring and a borehole. The system is designed to operate for 15 years. Lukalu WSS- 197 Consumer households assessed for connections and payment completed. 40 out of 281 connections completed. Constructed 3 Gender segregated public sanitation facilities located at Kabasanda trading centre, Mirembe trading centre and Kalamba sub-county; Town office building at 80% and Chlorine dozing house completed, 8km of distribution laid, 90% completion of the kiosks and spring intake, pump

Uganda Water and Environment Sector Performance Report 2020
34
Description Target Achieved
Comment
station at 95% completion. 70% transmission pipeline laid. Highway sanitation facility constructed to 68% completion. Construction of toilet at 70%, Attendants house at 75% with roofing completed, Lock ups and restaurants at 63% with roofing completed. Site clearance works at 68% completion. Lukalu Kabasanda – Community sensitization conducted on the need to pay up for water connections and a total of 197 applicants paid up.
Orom Water Supply System in Kitgum District.
50% 60% The scheme targets a population of 1,819 persons. The system is designed to operate for 20 years. The O&M plan is to handover to the Umbrella Organization upon completion. Works in Orom WSS are ongoing in 6 supply areas. In Katwotwo-Lakwanya, a total of 31km of pipe line was laid. In Orom (Agoromin/Bale), a total 31.4 km pipe work was laid. Construction of offices at Orom at ring beam level. In Kalabong, a total 15.05km pipe work was laid. In Longor, a total 8.3 km pipe work was laid; construction of 1 out of 3 water offices is at 33%, 4 out of 6 pump houses constructed to 67% completion.
Kahama Water Supply and Sanitation System in Ntugamo District.
80% 55% The scheme targets a population of 22,009 persons. The water is a spring with two water sources yielding 11 litres per second (950.4m3/day). The system is designed to last for 20 years. Construction works of the source intake are at 60%, 2 sedimentation and collection tanks at 98%, pumping mains at 98% and 50% completion of the distribution line. Office block constructed to 60%. and 2 chlorine houses, the guard house and attendants’ houses constructed to 60% completion, reservoir tanks 55%. In Kahama WSS- Sub county advocacy conducted in 2 sub counties (Nyabihoko and Nyabushenyi). Conducted a baseline survey to assess the sanitation situation of the project area and a total of 3590 households were included in the survey. Village sensitization meetings were conducted in the 17 villages of Kiziko, Zeituni, Kiramo, Kigarama, Ruyenja, Ekibare, Nkongoro, Rireju,, Kaira, Nyamikoni, Katabwigute, Kacuragyenyi, Rwenshekye, Rwamanebe, Nyabikiri, Kabonero, Rwemiroro to create awareness about the project and also hygiene and sanitation. The set target of 80% was not attained due to delayed payments and COVID-19 pandemic affected construction.

Uganda Water and Environment Sector Performance Report 2020
35
Description Target Achieved
Comment
Kabuyanda Water Supply System in Isingiro District.
100%. 73% Kabuyanda WSS was constructed to 73% completion, with the 5000cc reservoir tank installed on the dwarf walls and 10 valve boxes installed with 83km of distribution and intensification network laid, 2 water borne toilets completed and fully painted at the Health Centre IV and office block; 1 office block completed and fully painted.
Rehabilitation of Nyakabingo Gravity Flow Scheme in Rukungiri District.
100% 100% Rehabilitation of Nyakabingo Gravity Flow Scheme in Rukungiri district with 100% completion of the supply and installation of HDPE pipes, 100% re-protecting of the source done, 100% completion of 4 public kiosks done. The rehabilitation has served a total of 3,600 new persons.
Constructed Highway Sanitation facility in Kiruhura District.
80% 68% The Highway Sanitation Facility constructed to 68% completion. Construction of the toilet is at 70%, Attendants house at 75% with roofing completed, Lock ups and restaurants at 63% with roofing completed and the sanitation facility/toilet is at 65% at wall plate level. Site clearance works were at 68% completion
Construction of Bitsya Gravity Flow System in Buhweju District.
Bitsya Water supply system Buhweju district has been designed. The shortlist of consultancy firms for redesign of the piped systems was submitted to the World Bank seeking a no objection.
Construction of Nyamugasani Water supply system in Kasese District.
Nyamugasani Water supply system in Kasese district has been designed. The shortlist of consultancy firms for redesign of the piped systems was submitted to the World Bank seeking a no objection.
Kanyabwanga Water Supply System in Mitooma District.
50% - The Water Supply System is under design with no tangible progress achieved.
Mbunga-Nyakanzinga Gravity Flow Scheme in Kasese District.
30% - The Gravity Flow Scheme is under design with no tangible progress achieved.
Solar powered Solar Powered mini piped schemes
40 Mini Solar Powered Piped Systems.
80% 55% 34 out of the 40 sites for mini solar powered piped water supply systems were handed over to the contractors and construction is ongoing. Under Lot 1 comprising of 20 sites, progress is at 50% completion while under Lot 2 comprising of 20 sites, progress is at 55% completion. The progress was slowed done by COVID-19 pandemic especially for the key components which are to be imported from outside. Communities in all the 34 solar powered mini piped system sites were sensitized on critical requirements
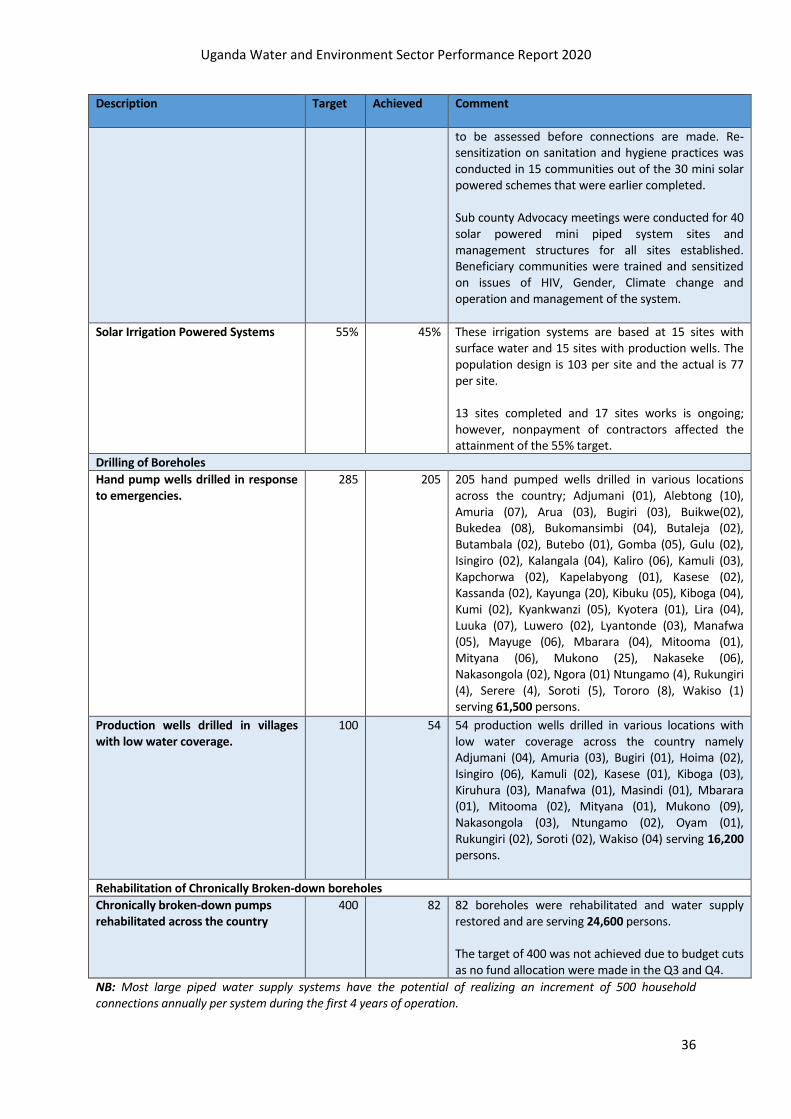
Uganda Water and Environment Sector Performance Report 2020
36
Description Target Achieved
Comment
to be assessed before connections are made. Re-sensitization on sanitation and hygiene practices was conducted in 15 communities out of the 30 mini solar powered schemes that were earlier completed. Sub county Advocacy meetings were conducted for 40 solar powered mini piped system sites and management structures for all sites established. Beneficiary communities were trained and sensitized on issues of HIV, Gender, Climate change and operation and management of the system.
Solar Irrigation Powered Systems 55% 45% These irrigation systems are based at 15 sites with surface water and 15 sites with production wells. The population design is 103 per site and the actual is 77 per site. 13 sites completed and 17 sites works is ongoing; however, nonpayment of contractors affected the attainment of the 55% target.
Drilling of Boreholes
Hand pump wells drilled in response to emergencies.
285 205 205 hand pumped wells drilled in various locations across the country; Adjumani (01), Alebtong (10), Amuria (07), Arua (03), Bugiri (03), Buikwe(02), Bukedea (08), Bukomansimbi (04), Butaleja (02), Butambala (02), Butebo (01), Gomba (05), Gulu (02), Isingiro (02), Kalangala (04), Kaliro (06), Kamuli (03), Kapchorwa (02), Kapelabyong (01), Kasese (02), Kassanda (02), Kayunga (20), Kibuku (05), Kiboga (04), Kumi (02), Kyankwanzi (05), Kyotera (01), Lira (04), Luuka (07), Luwero (02), Lyantonde (03), Manafwa (05), Mayuge (06), Mbarara (04), Mitooma (01), Mityana (06), Mukono (25), Nakaseke (06), Nakasongola (02), Ngora (01) Ntungamo (4), Rukungiri (4), Serere (4), Soroti (5), Tororo (8), Wakiso (1) serving 61,500 persons.
Production wells drilled in villages with low water coverage.
100 54 54 production wells drilled in various locations with low water coverage across the country namely Adjumani (04), Amuria (03), Bugiri (01), Hoima (02), Isingiro (06), Kamuli (02), Kasese (01), Kiboga (03), Kiruhura (03), Manafwa (01), Masindi (01), Mbarara (01), Mitooma (02), Mityana (01), Mukono (09), Nakasongola (03), Ntungamo (02), Oyam (01), Rukungiri (02), Soroti (02), Wakiso (04) serving 16,200 persons.
Rehabilitation of Chronically Broken-down boreholes
Chronically broken-down pumps rehabilitated across the country
400 82 82 boreholes were rehabilitated and water supply restored and are serving 24,600 persons. The target of 400 was not achieved due to budget cuts as no fund allocation were made in the Q3 and Q4.
NB: Most large piped water supply systems have the potential of realizing an increment of 500 household connections annually per system during the first 4 years of operation.

Uganda Water and Environment Sector Performance Report 2020
37
4.4 Technical Support to Local Governments
Reorganisation of Ministry Technical Support Structures The Ministry reorganised the eight (8) technical support units and transformed them into 5No Rural water and sanitation regional support centres with regional bases located in Lira, Mbale, Moroto, Wakiso and Mbarara. The reorganisation was aimed at ensuring that the roles of the regional rural water centres are modified and expanded to accommodate the other department mandates of research and development as well as rural water supplies operation and maintenance. Therefore, effective 2020/2021 F/Y, the rural water and sanitation regional centres are actively and meaningfully involved in the planning and development of rural water piped water supplies financed centrally through the rural water and sanitation department.
The Regional Water and Sanitation Rural Centers (RWSRCs) over the reporting period continued to support the implementation of the District Water and Sanitation Conditional Grant (DWSCG). The RWSRCs activities included monitoring to ensure adherence to standards, quality assurance and accountability for the resources received by various DLGs; and, build the capacity of the District Local Governments (DLG). Additionally, the RWSRCs provide technical support to District Local Governments in the aspects of planning, budgeting, procurement, contract management as well as monitoring DLG activities. Preparation and formulation of the Additional Financing for Water Component under Uganda Intergovernmental Fiscal Transfers Program for Results (IFTRP)
The division participated in the preparation and formulation of the IFTRIP with the objective of enhancement of the adequacy and equity of fiscal transfers to Local Governments and improving fiscal management of resources for service delivery by LGs. Effective 2020/21 F/Y, the program is providing additional financing to the LGs up to a tune of UGX 150billion over a period of three years towards the DWSCDG. LGs are expected to prioritise investments in piped water supply systems and rural water supply functionality improvements.
Operationalizing the National Framework for Operation & maintenance of Rural Water Infrastructure The MWE with support from UNICEF, ILF, UWP, IRC and Whave Solutions has finalized the development of Water Supply Service Board (WSSB) & Area Service Provider (ASP) manuals that are key requisite documents for operationalizing the National Framework for Operation & maintenance of Rural Water Infrastructure. The purpose of the manuals is to provide guidance on procedures and processes for successful establishment, functioning and operations of the WSSB and ASP. The O&M Framework has been disseminated in Karamoja, West Nile, Rwenzori and Central Region. Dissemination in some districts is in progress with support from UNICEF, USAID Uganda sanitation & Hygiene Activity (USHA).

Uganda Water and Environment Sector Performance Report 2020
38
4.5 Appropriate Technology Centre for Water and Sanitation, Mukono
In the FY 2019/20, the operations of Appropriate Technology Centre (ATC) has been strengthened. The following outputs were registered in FY 2019/20: The ATC continues to undertake the mandate of applied research, capacity building and promotion of appropriate water, sanitation and environmental preservation technologies. To be able to effectively handle the task at hand, the ATC continually forges partnership with relevant organizations and this year the Centre started collaborating with CSE, a research institution based in India.
Research: This financial year the Centre carried nine (09) Knowledge, Attitude and Practice Studies (KAPS). These studies are used to identify challenges facing adoption of water, sanitation, hygiene and environmental protection technologies. They are in addition used to inform technology development. Three (03) of the nine studies were published i.e., i) The clotted access: a tale of six water supply systems in rural Uganda snagged by salinity and high
iron concentration. The shift to large scale water supply in a bid to reach everyone with safe water This study was carried out in is crippled with water quality issues in some parts of the country. Apparently, the country largely relies on ground water that is in some places affected by salinity and high iron concentration but the country lacks appropriate technologies to address the problem. This study carried out using mixed methods indicated salinity and high iron concentration in ground water as a big problem in the districts of Rakai, Namayingo and Isingiro however, water supply systems constructed in those places do not have any arrangements to improve the physio-chemical parameters of water being supplied. Four out of the six water supply systems studied had either challenge of high iron concentration or salinity and these resulted into users abandoning the water supply systems shortly after construction. Going by the establishments we are counting “improved access” however it is “clotted access” since communities are not using the water.
ii) The rise of hand washing facilities technological innovation in the wake of COVID 19 pandemic: A rapid assessment of the performance and implied sustainability in Uganda. This study was carried out in Kampala and Wakiso covering public places such as markets (28), administrative units (07), health centres (06) and fish landing sites (04) with a total of 317 hand washing facilities. Findings revealed that 64.7% of the assessed facilities were hand operated and 35.3% peddle operated. Most of the facilities visited were operational at the time of spot check, respective leaders of the visited institutions were keen to undertake repairs in case of facility breakdown for fear of their ‘businesses’ being closed down by government. There was an observed inability for users to operate peddle based hand washing facilities and general lack of interest to learn. Besides, proper hand washing was compromised by rush hour syndrome. Break down of taps was the main cause of non-functionality for both peddle based and hand operated hand washing facilities. Peddle operated facilities that broke down in the process were converted to hand operated partly due to lack of technical capacity to repair the peddle system. The study observed a window to strengthen innovation and value chain for hand washing facilities in the wake of COVID 19 and thus called upon stakeholders to use the opportunity to create community based technology fabrication groups, merge enforcement with provision of technological options and health promotion to strengthen sustainability.
iii) Prospect of bamboo briquetting in Uganda: A case of Kabale, Rubanda and Kisoro in Kigezi region. Bamboo briquetting is popularly positioned to provide alternative source of cooking energy to relieve pressure from the heavily destroyed forests in Uganda. This study investigated the readiness of stakeholders including the community people, district local government and NGOs to embrace bamboo for biomass energy. The largely qualitative study was carried out in Kigezi region

Uganda Water and Environment Sector Performance Report 2020
39
since the region presented deliberate bamboo growing interventions. The study results showed that the country is unprepared to start using bamboo briquettes partly because it is still an abstract idea. Stakeholders lack information, supportive structures are non-existent and the apparent low stock of bamboo in the country cannot support mass briquetting. However, the growing scarcity of trees for charcoal burning presents an opportunity that can be exploited to promote bamboo briquetting. Key to note is that about a decade of mass campaign and purposive promotions embedded in development discourses such as a circular economy is required to synergize uptake of bamboo briquettes in Uganda. The government should therefore take a lead role in capacity building, restructure development and creation of an enabling environment for promotion of bamboo briquette adoption and use in Uganda.
iv) Other studies pending publication were carried out on pertinent water and sanitation issues in the districts of Kampala, Wakiso, Mukono, Kayunga, Kyotera, Kamuli, Sheema, Buliisa, Ntoroko, Masindi, Kikuube, Kagadi, Buyende, Kaliro, Iganga, Mayuge and Bugiri.
Technology profiling: The Centre profiled technologies that can be adopted to promote the circular economy concept i.e.., production of school bags, ornaments, tiles, gas and fuel from plastics waste. The ATC produced these products from solid waste and profiled them now they are ready for trial in the communities. If these technologies are scaled up, they can help enhance proper solid waste management.
Technology Promotion: COVID 19 saw the rise of the demand for handwashing facilities as the public is urged to frequently wash their hands to minimize chances of contracting the disease. During this period, the ATC fabricated about 145 peddle based hand washing facilities that were distributed to public places. The ATC kept on changing the design of the facilities based of learnings from the users with the overall goal of making the facilities more robust. In addition, the centre produced sanitizers and liquid soap that were distributed in the same package to communities within Kampala, Mukono and Wakiso.
Photo 4- 1: improved handwashing facility
Capacity building: The ATC carried out capacity building for 30 district water officers and young professionals on integration of appropriate technologies in engineering designs for piped water supply systems. This training was informed by the observed shortfalls in the water supply systems designs submitted to the Ministry of Water and Environment’s design review committee. Thus, the training aimed at improving skills and expertise of the participants to design and construct robust water supply systems that integrate emerging/new appropriate technologies.
Photo 4- 2: Capacity building for district officers In the same year, 25 community people (13 women and 12 men) from Kayunga district were trained on construction of stone masonry large diameter rainwater harvesting tank with a capacity of 100,000 litres. This is part of the drive to promote rainwater harvesting through building of grassroots capacity to construct, operate and maintain rainwater harvesting tanks at community level. The constructed 100,000 litre tank serves Wampongo mosque, the attached primary school and neighbouring households.
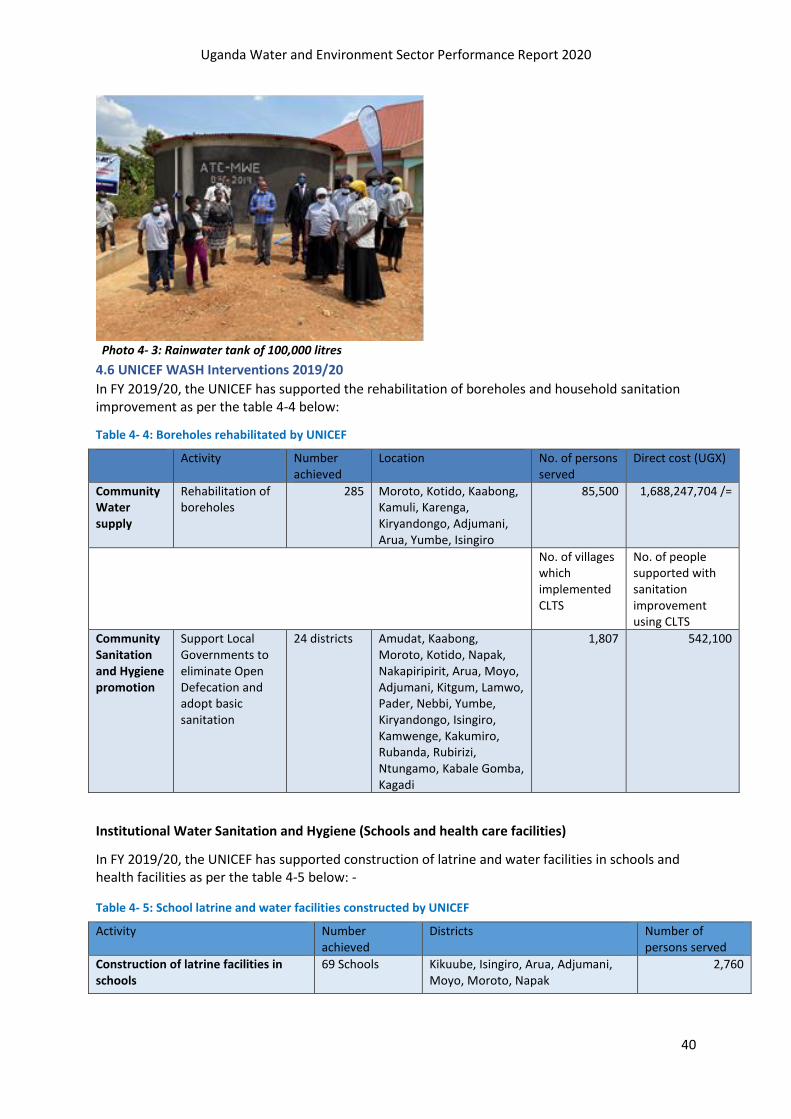
Uganda Water and Environment Sector Performance Report 2020
40
Photo 4- 3: Rainwater tank of 100,000 litres
4.6 UNICEF WASH Interventions 2019/20
In FY 2019/20, the UNICEF has supported the rehabilitation of boreholes and household sanitation improvement as per the table 4-4 below:
Table 4- 4: Boreholes rehabilitated by UNICEF
Activity Number achieved
Location No. of persons served
Direct cost (UGX)
Community Water supply
Rehabilitation of boreholes
285 Moroto, Kotido, Kaabong, Kamuli, Karenga, Kiryandongo, Adjumani, Arua, Yumbe, Isingiro
85,500 1,688,247,704 /=
No. of villages which implemented CLTS
No. of people supported with sanitation improvement using CLTS
Community Sanitation and Hygiene promotion
Support Local Governments to eliminate Open Defecation and adopt basic sanitation
24 districts Amudat, Kaabong, Moroto, Kotido, Napak, Nakapiripirit, Arua, Moyo, Adjumani, Kitgum, Lamwo, Pader, Nebbi, Yumbe, Kiryandongo, Isingiro, Kamwenge, Kakumiro, Rubanda, Rubirizi, Ntungamo, Kabale Gomba, Kagadi
1,807 542,100
Institutional Water Sanitation and Hygiene (Schools and health care facilities)
In FY 2019/20, the UNICEF has supported construction of latrine and water facilities in schools and health facilities as per the table 4-5 below: -
Table 4- 5: School latrine and water facilities constructed by UNICEF
Activity Number achieved
Districts Number of persons served
Construction of latrine facilities in schools
69 Schools Kikuube, Isingiro, Arua, Adjumani, Moyo, Moroto, Napak
2,760

Uganda Water and Environment Sector Performance Report 2020
41
Construction of latrine facilities in health facilities
42 Health care facilities
Ntoroko, Bundibugyo, Kasese, Kisoro 126,000
Construction of mini solar powered pumping water systems for schools and health facilities
48 Napak, Moroto, Arua, Moyo, Nebbi, and Adjumani
24,000
To sustain the functionality of the new WASH infrastructure and to promote positive behaviour change, school health clubs, School Management Committees (SMCs) Health Unit Management Committees (HUMCs) were trained on WASH promotion, menstrual hygiene management, and operation and maintenance of WASH facilities
Photo 4- 4: Handwashing in Bitare PS-Kisoro district
Photo 4- 5: Kentomi PS -Kikuube district
Photo 4- 6: Motorized water system, Karusandra HCIII-Kasese district
Emergency Water, Sanitation and Hygiene Intervention
a) Response to refugee influx and flood affected communities Supported emergency intervention through construction of motorised water supply systems in refugee settlements and host communities as per the table 4-56 below:-.
Table 4- 6: Construction of motorized water supply systems by UNICEF
Activity Number achieved
Locations Number of persons served
Direct cost (UGX)
Construction and upgrading of water supply systems
1 Construction and upgrading of water systems in Maratatu, Kasonga, Kagoma, Kavule 11 (Kyangwali, Kikuube district)
22,000 1,364,254,973 /=
Rehabilitation of boreholes in response to Flood
23 Bundibugyo district 6,900 171,889,000 /=
Rehabilitation of gravity flow schemes in response to Flood
3 Bundibugyo district 22,100 342,833,471 /=
Installation of mobile toilets in response to Flood
15 Bundibugyo district 7500 70,833,651/=
b) COVID-19 and Ebola Virus Disease preparedness and response As the country was preparing for and responding to the COVID-19 emergency, UNICEF provided infection prevention and control WASH supplies to 211 health care facilities reaching approximately 290,030 in Adjumani, Arua, Amuru, Gulu, Moyo, Koboko, Yumbe, Zombo, Hoima, Kikuube,

Uganda Water and Environment Sector Performance Report 2020
42
Kamwenge, Kasese, Isingiro, Abim, Amudat, Kotido, Moroto, Napak, Nakapiripiriti, Nabilatuk, Kaabong, Karenga, Kampala, Wakiso, Masaka, Mukono, Iganga, Wakiso districts
In the times of EVD, UNICEF provided infection prevention and control WASH supplies (6,640 hand-washing facilities; 2,298 cartons of bar soap; 1,142 buckets of HTC Chlorine 45 kgs (51,390 Kg); 60 tanks. 50 solar powered chlorine generators) to 482 health facilities, 384 schools and 44 points of entry: in Kisoro, Kasese, Bundibuyo, Ntoroko, Kabarole, Kikuube, Kyegegwa, Kamwenge, Bunyangabo, Kanungu, Rubirizi, Rukungiri, Hoima, Isingiro, Arua, Kagadi, Kyenjojo, Zombo, Packwach. districts.
UNICEF trained 769 health workers and 613 teachers on IPC WASH, including support to mentorship capacities in Kisoro, Kasese, Bundibugyo, Wakiso, Arua, Zombo,Kanungu & Ntoroko districts.
4.7 Capacity building and strengthening the enabling environment
Supported Ministry of Water and Environment in: -
i) Development of Integrated Refugee response plan and the national launch of the costed Water and Environment sector response plan for refugees and host communities.
ii) Development of asset registers and asset analysis of water supply infrastructure in five districts (Kamuli, Kikuube, Obongi, Yumbe and Madi Okolo).
iii) Provided technical and financial support to the national Handwashing Secretariat. iv) Supported the development of the National operation and maintenance framework for rural
water infrastructure. v) Supported the revision of the water sector indicators in line with SDG 6.1 vi) Supported the training 50 district staff and partners in test pumping and drilling supervision vii) and 16 national and district staff in siting and hydrogeological investigation viii) Supported the development of consolidate plan for COVID-19 response. ix) Development of MIS strengthening reporting on SDG 6.1 (ongoing)
Supported Ministry of Health in: -
i) Development of National Handwashing Communication Strategy ii) Open Defecation Free Road map (at finalization stage with in the Ministry of Health). iii) Ongoing support provided for development of National standards for WASH in Health Care
Facilities. iv) Support the training of 32 CLTS facilitators v) Development of MIS strengthening reporting on SDG 6.2 (ongoing)
Supported Ministry of Education in: -
1. Development of National micro plans for WASH in Schools covering all districts of the country 2. Development of Management Information System (MIS) strengthening reporting on WASH in
School (ongoing)
4.8 Status and trends of key indicators for rural water and sanitation
4.8.1 Indicator No 1: Basic water: Percentage of population using an improved drinking water
source
Basic water: Percentage of population using an improved drinking water source indicator refers to the percentage of population using an improved water source. The computation excludes non-functional water facilities (which are reported to be broken for more than 5 years).

Uganda Water and Environment Sector Performance Report 2020
43
As of June 2020, the percentage of population using an improved water source was estimated at 68%, decline from 69% recorded in June 2019. It is noted that the 68% performance estimation as of June 2020 is based on only 47% of the data for new water sources implemented by LGs and captured in the Water supply database. In addition, the new investments (433,177 persons) during the reporting period only cover 47% of the projected population increase (928,075 persons). Based on the analysis done under the water atlas update, 64% of the districts had either equal or above the 68% of population using an improved water source as compared to 36% of the districts that had below the 68%. There was an improvement of the districts that use an improved water source from 36% in FY 2018/19 to 64% in FY 2019/20. This therefore means that a higher number of Ugandans are using an improved water source. The districts with access below 50% included Buvuma (31%), Kyegegwa (31%), Kakumiro (33%), Kazo (36%), Rakai (36%), Buyende (37%), Kasanda (37%), Mubende (38%), Ssembabule (38%), Kisoro (42%), Lyantonde (43%), Wakiso (43%), Isingiro (44%), Amudat (47%), Kiruhura (47%) and Yumbe (48%). The map on the next page shows the rural water safe water coverage.
4.8.2 Indicator No 2: Percentage of villages with a source of safe water supply
Equity indicator that specifically intended to promote provision of equal opportunities for the water supply delivery service and minimize differences between groups of people was replaced by the Percentage of villages with a source of safe water supply indicator. This is because the Government of Uganda passed a strategic policy directive emphasizing provision of at least one improved water source per village. Drawing from that policy directive, the indicator of percentage of villages with a source of safe water supply was developed and replaced the indicator of equity that measured “the mean sub-county deviation from the district average in persons per water point”. During the FY 2019/20, out of the 57,150 (excluding Kampala district) villages, only 38,785 (68%) had a safe water source as compared to 38,183 (66%) out of 57,585 villages in FY 2018/19. This indicates that an increase in the number of villages having at least one improved water source than previous FY of 2018/19 by 2%.3
4.8.3 Indicator No 3: Functionality: rural: % of water sources functional at time of spot-check
The indicator for functionality for rural water supplies is defined as the “% of improved water sources that are functional at time of spot-check”. The average functionality rate for rural water supplies by district. The trend in average nation-wide functionality of rural water supplies, defined as the “percentage of improved water facilities found functional at the time of spot check.” As of June 2020, the functionality for rural water supplies stagnated at 85% similar to that of FY 2018/19 and 2017/18. This is attributed to decrease in the budget allocation on rehabilitation as a result of creation of new DLGs. Overall, 45% of the districts have functionality above the nationwide average of 85%. The low number of districts is as a consequence of inadequate finance and structures to sustain functionality. The five districts with lowest functionality include Omoro (43%), Kitgum (60%), Bundibugyo (62%), Gomba (62%) and Nabilatuk (65%), while the five districts with highest functionality include; Isingiro (97%), Kapelebyong (97%), Pallisa (97%), Rwampara (97%) and Namisindwa (98%).
3 This analysis includes areas covered by NWSC and Rainwater Harvesting Tanks
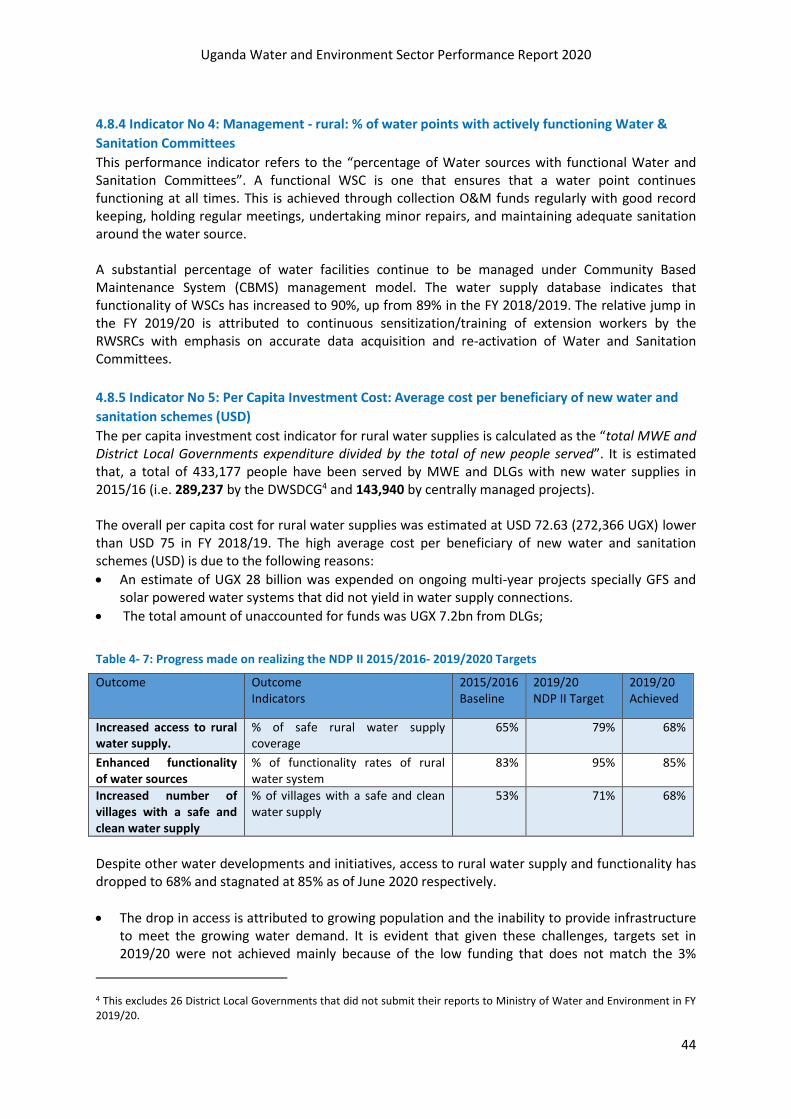
Uganda Water and Environment Sector Performance Report 2020
44
4.8.4 Indicator No 4: Management - rural: % of water points with actively functioning Water &
Sanitation Committees
This performance indicator refers to the “percentage of Water sources with functional Water and Sanitation Committees”. A functional WSC is one that ensures that a water point continues functioning at all times. This is achieved through collection O&M funds regularly with good record keeping, holding regular meetings, undertaking minor repairs, and maintaining adequate sanitation around the water source. A substantial percentage of water facilities continue to be managed under Community Based Maintenance System (CBMS) management model. The water supply database indicates that functionality of WSCs has increased to 90%, up from 89% in the FY 2018/2019. The relative jump in the FY 2019/20 is attributed to continuous sensitization/training of extension workers by the RWSRCs with emphasis on accurate data acquisition and re-activation of Water and Sanitation Committees.
4.8.5 Indicator No 5: Per Capita Investment Cost: Average cost per beneficiary of new water and
sanitation schemes (USD)
The per capita investment cost indicator for rural water supplies is calculated as the “total MWE and District Local Governments expenditure divided by the total of new people served”. It is estimated that, a total of 433,177 people have been served by MWE and DLGs with new water supplies in 2015/16 (i.e. 289,237 by the DWSDCG4 and 143,940 by centrally managed projects). The overall per capita cost for rural water supplies was estimated at USD 72.63 (272,366 UGX) lower than USD 75 in FY 2018/19. The high average cost per beneficiary of new water and sanitation schemes (USD) is due to the following reasons:
• An estimate of UGX 28 billion was expended on ongoing multi-year projects specially GFS and solar powered water systems that did not yield in water supply connections.
• The total amount of unaccounted for funds was UGX 7.2bn from DLGs;
Table 4- 7: Progress made on realizing the NDP II 2015/2016- 2019/2020 Targets
Outcome Outcome Indicators
2015/2016 Baseline
2019/20 NDP II Target
2019/20 Achieved
Increased access to rural water supply.
% of safe rural water supply coverage
65%
79% 68%
Enhanced functionality of water sources
% of functionality rates of rural water system
83% 95% 85%
Increased number of villages with a safe and clean water supply
% of villages with a safe and clean water supply
53% 71% 68%
Despite other water developments and initiatives, access to rural water supply and functionality has dropped to 68% and stagnated at 85% as of June 2020 respectively.
• The drop in access is attributed to growing population and the inability to provide infrastructure to meet the growing water demand. It is evident that given these challenges, targets set in 2019/20 were not achieved mainly because of the low funding that does not match the 3%
4 This excludes 26 District Local Governments that did not submit their reports to Ministry of Water and Environment in FY 2019/20.

Uganda Water and Environment Sector Performance Report 2020
45
annual population growth. On the other hand, there are dilapidated and aging infrastructure that cannot meet the growing demand for water in rural areas. Together with their inefficient management, these water utilities are unable to deliver continuous water service or adequate water quality.
• The stagnation of the national functionality rate was attributed to the rate of repair of water facilities could not out match the rate of breakdown of water facilities.
Therefore, there is urgent need to invest heavily in piped water supplies in order to raise the percentage of persons served by piped water supplies in rural areas from the current 11% up to 50% by 2030.
4.9 Challenges and Recommendations
i) COVID-19 outbreak affected the implementation of activities such as site meetings, verification
and construction works by the LGs specifically the closure of airports affected the importation of components for, solar water schemes Shuuku Masyoro GFS and Kahama II. Travel restrictions within the country affected the implementation of sensitization activities since the activity requires gathering people and travelling across districts. The COVID-19 country wide lock down affected the progress significantly.
ii) Limited funding to facilitate the Rural Water and Sanitation Regional Centres (RWSRCs) operations in the country affected service delivery among the DLGs.
iii) The creation of new districts affected the threshold allocated to other districts as this did not translate into additional funds to the grant namely Madi Okollo, Kalaki, Karaenga and Kitagwenda.
iv) Vandalism of the water infrastructure for purposes of selling them as steel scrap targeting mainly solar panels and generators is a becoming a common vice. This has consequently affected the supply of water to communities as the distribution pipes and taps are targeted resulting to consumption unsafe water.
To address these challenges, the following recommendations are made: v) Enhance financing mechanisms of the RWSRCs to ensure continuous Technical Support to the
district local governments; to minimize the capacity gaps in planning, budgeting, procurement, implementation and O&M of water facilities.
vi) Continuous engagement with MoFPED to increase the water grant is highly recommended to
accelerate rural water supply coverage as well as strengthening Operation and Maintenance of rural water facilities in Uganda.
vii) A multiple approach to water supply system to ensure a water source per village through large
gravity flow schemes, solar powered mini-piped water schemes, boreholes, rainwater harvesting and self-supply in water stressed areas as this approach will lead to a higher per capita cost, and therefore needs more financial resources.
Uganda Water and Environment Sector Performance Report 2020
46
5. URBAN WATER SUPPLY
5.1 Introduction
Uganda’s urban population is estimated to be more than 10 million (24% of Ugandan population) and it is likely to double by 2040. Provision of water supply infrastructure is vital if the population is to enjoy its constitutional right of access to reliable, safe and affordable water supply. Uganda’s urban population growth is at a higher rate and has outstripped the rate of infrastructure development. This is attributed to rural urban migration and creation of new districts, Cities, municipalities and town councils which has let to gazetting former rural areas as urban areas The National Development Plan III (NDP III) aims at increasing access to safe water in urban areas to 95% (100% in NWSC towns) by 2020 . SGD (6.1) advocates for universal and equitable water access by 2030. It further advocates for access to safe water at premises. Uganda has a total of 498 urban centres comprising of one City (10 newly approved Cities ), 55 Municipalities, 47 newly approved Counties and 442 Town Councils and Town Boards There are more than 1,100 rural growth centres (RGC) with a population of about 3.3 million that are expected to be gazetted as urban centres in the near future. Uganda has a total of 68, 731 Villages where 16,154 villages are in Large Towns, 14,494 villages are in Small Towns / Rural Growth Centres and 38,083 villages are in Rural areas.
5.2 Centrally implemented water and sanitation projects
Lake Victoria Water and Sanitation Project Phase III (LVWATSAN III) is at starting stage of
implementation for the piped water supply and sanitation in the three Greater areas of Gomba,
Bugadde and Rakai. Detailed engineering designs for water supply and sanitation systems are
ongoing. The areas covered include Greater Gomba Area (Kanoni, Bulo, Nsabwe, Ngomanene, Kiriri,
Bukandura, Rugaga, Kabulasoke, Butiti, Kifampa, Kisozi, Kajumiro and Maddu); Greater Rakai Area
(Rakai, Nsaro, Rumbugu, Birabago, Buyamba, Rwanda-Kooki, Dwaniro, Byakabanda, Kamukala and
Kibbale); and Greater Bugadde Area (Bugadde, Kityerera, Busakira and Kuluuba). During the
reporting period, feasibility studies were completed and detailed engineering designs are being
finalised. The actual construction will commence during the financial year 2020/2021
Integrated Water Management Development Project (IWMDP): This programme took over water
supply systems not completed under WMDP and these include Butaleja, Busia, Busolwe, Budaka,
Kadama, Tirinyi, Kibuku, Namasale, Kaliro, Namungarwe, Kyegeggwa, Mpara and Ruyonza. The
project will also offer support towards the operations and maintenance, functionality and
sustainability of the piped water supply and sanitation systems in rural and RGCs through the six
Umbrella Water and Sanitation(UWS). The type of support included professionalization of UWS,
supply of pipes, meters and improving the monitoring aspect of the UWS. Detailed Designs for the
Piped Water Supply and Sanitation Systems in the towns of Busia, Busolwe, Butaleja, Budaka have
been completed. Procurement for the Consultants and Contractors has been embarked on and
respective towns have reached different levels of the procurement process. The construction of
Nyero-Ngora-Kumi town water supply was completed during the reporting period. A total of 42
villages, 114.1 kilometers, 850 yard tap new connections added to 501 old connections, 68,828
people as part of the project outputs. The detailed engineering designs for Butalejja, Busia,

Uganda Water and Environment Sector Performance Report 2020
47
Busolwe, Budaka, Kadama, Tirinyi and Kibuku town water supply and sanitation systems were
completed.
Strategic Town Water and Sanitation Project (STWSSP): The project is to construct piped Water Supply and Sanitation Systems in 10No. strategic towns Kayunga, Busana, Dokolo, Nakasongola, Kyenjojo, Katooke, Buikwe, Kapchorwa, Kamuli and Bundibugyo. The Project is also to design and construct three Feacal Sludge Management Facilities for the Towns of Dokolo, Buikwe and Kyenjojo-Katooke. A total of 10 Climate Resilient Project designs will be designs in the Albertine and Kyoga Regions. The Project has handed over sites for Construction in Kayunga-Busana and Dokolo and the achievement is still at mobilization stage. The 8 Piped Water Supply and Sanitation Systems are under design and have reached substantial stages of the Procurement Process for the construction contractors. The Feacal Sludge Management Facilities Designing process is under procurement at the Evaluation stage of the Expression of Interest.
Table 5- 1: Progress on Specific Projects
Other Projects Completed water supply/project
WSS Under construction
WSS Under procurement
WSS Completed designs
WSS Under design
FSM under Design
FSM completed
FSM under construction
WMDP 1 - - - - - - -
IWMDP - 5 8 3 - -
Karamoja Small towns 1 2 1 3 3 - -
LV Watsan III - - - - 27 - -
SCAP 100 Umbrellas - - - - 1 - - -
ERT III5 12 4 11 30 - - -
Strategic Towns Water and Sanitation Project
- 2 5 10 8 3 - -
Total Other Projects 14 8 22 51 42 3 - -
5.3 Implementation of Piped Water Systems by Water and Sanitation Development Facilities
The regional Water and Sanitation Development Facilities (WSDFs) are MWE’s financial mechanisms
deconcentrated structures for implementation of water and sanitation interventions in small towns
(STs) and rural growth centres (RGCs). There are four regional Branches; WSDF North based in Lira,
WSDF Central (Wakiso), WSDF South-West (Mbarara) and WSDF East (Mbale). WSDF- Karamoja
(Moroto) is under the approval Process and has passed the Sector Working Group approval stage
and submitted to DC in MOFPED for continued approval process for Karamoja Region water and
sanitation interventions.
Water and Sanitation Development Facility (WSDF) Central: Operates in the Central and Mid-
Western Region in 29No. Districts of Hoima, Buliisa, Masindi, Nakasongola, Nakaseke, Kiboga,
Kibaale, Luwero, Mityana, Masaka, Mpigi, Mubende, Mukono, Buikwe, Kayunga, Kalangala, Wakiso,
Buvuma, Gomba, Kiryandongo, Kyankwanzi, Butambala, Bukomansimbi, Kalungu, Lwengo, Kakumiro,
Kagadi, Kikuube and Kasanda. Since inception WSDF-Central has constructed 49No. Piped Water
Supply and Sanitation Systems, serving 947,309 People.
Piped Water Supply and Sanitation Systems were constructed for the towns of Kiwoko-Butalangu,
Busiika and Kayunga-Busana Phase 1. Currently there are 1,809 Villages in the Central Jurisdiction
Uganda Water and Environment Sector Performance Report 2020
48
being served. Construction was on-going for the towns of Butemba-Lusozi - 6% (Kyankwanzi District),
Butenga-Kawoko-70% (Bukomansimbi), Kasambya-Kikandwa -81% (Mubende District), Kakunyu-
Kiyindi -68% (Buikwe District), Bamunanika – 45% (Luwero District), Lwamata – 48% (Kiboga District),
Expansion of Kangulumira (85%), Kazigo – 80% (Kayunga District), Expansion of Kassanda – 95%
(Mubende District), Ngoma – under Procurement (Nakaseke District), Kagadi – 76% (Kagadi District)
and completion of construction of Mini Solar Water Systems in Kyanya, Kyampisi and Namulanda
(45%) . Construction for the FSM was on-going in Kiboga and designs for Feacal Sludge Facilities were
on-going for the towns of Nakasongola ongoing (95%). During the Reporting Period 3No. piped
Water Supply and Sanitation systems of Kayunga-Busana, Busiika and Kiwoko – Butalangu have been
completed serving an additional population of 77,257People and 91 additional Villages.
Water and Sanitation Development Facility (WSDF) North: Operates in the Northern Region in
28No. (West Nile Sub-regions; Nebbi, Zombo, Arua, Maracha, Koboko, Yumbe, Moyo, Adjumani,
Pakwach, Madi-Okollo Acholi Sub-region; Amuru, Nwoya, Gulu, Pader, Agago, Kitgum, Lamwo,
Omoro Lango Sub-regions; Oyam, Apac, Kole, Lira, Alebtong, Otuke, Dokolo, Amolatar, Kwania )
28No. (West Nile Sub-regions; Nebbi, Zombo, Arua, Maracha, Koboko, Yumbe, Moyo, Adjumani,
Pakwach, Madi-Okollo Acholi Sub-region; Amuru, Nwoya, Gulu, Pader, Agago, Kitgum, Lamwo,
Omoro Lango Sub-regions; Oyam, Apac, Kole, Lira, Alebtong, Otuke, Dokolo, Amolatar, Kwania ).
Since inception WSDF- North has constructed 31No. Piped Water Supplya nd Sanitation Systems,
serving 326,469 No. People. Currently there are 2,382 Villages in the Northern Jurisdiction being
served. During the Reporting Period 3No. Of piped Water Supply and Sanitation Systems of Ranch 1
(Kiryandongo), Alere (Adjumani) and Nyumanzi (Adjumani) were constructed to completion and
served an addition population of 79,161People and 15 additional Villages.
Construction is on-going in the towns of Moyo TC and Padibe TC (Mobilization Stage) Refugee
Settlements: Olujobo/Tika (72.3%), Omugo VI (75%), Ofua III (75%), Alere (98%), Ayilo II (85%), and
Bidibidi Zone V (54%) and the digns were on-going for the towns of Odramachaku, Keri-Oraba RGC
and Okokoro RGC, Bibia/Elegu RGC, Amuru TC and Atiak RGC and construction of Dzaipi FSM was
ongoing ( 70%) while Yumbe FSM was under design. . Procurement was on-going for the
consultancy services to undertake feasibility study and detailed designs for water supply systems
and sanitation facilities for Bala, Aboke, Kole, Apala, Ngai, Iceme, Otwal Railway station RGCs and
Alebtong TC awaits signing by the Permanent Secretary.
Water and Sanitation Development Facility (WSDF) East: Operates in the Eastern Region in 30No.
(Kaliro, Jinja, Namutumba, Kamuli, Namayingo, Iganga, Bugiri, Buyende, Luuka, Mayuge,Butaleja,
Tororo, Busia, Budaka, Pallisa, Kibuku, Kween, Bukwo, Kapchorwa, Kaberamaido, Serere, Ngora,
Kumi, Soroti, Bukedea, Amuria, Katakwi, Mbale, Manafwa, Sironko, Bulambuli, Bududa,).
Construction was on-going for the towmn of Binyiny (85%) and feacla Sludge management facilitiy
was under construction in Kamuli (98%). Since inception WSDF- East has constructed 35No. Piped
Water Supplya nd Sanitation Systems, serving 251,909No. People. Currently there are 2,854 Villages
in the Eastern Jurisdiction being served. During the Reporting Period 3No. Of piped Water Supply
and Sanitation Systems for the towns of Namwiwa, Bulopa and Bulegeni were constructed to
completion and served an addition population of 24,680 People and 281 additional Villages.
Construction is on-going in the town of Binyiny(80%).and designs were on-going for the towns of
Bugadde-Idudi.
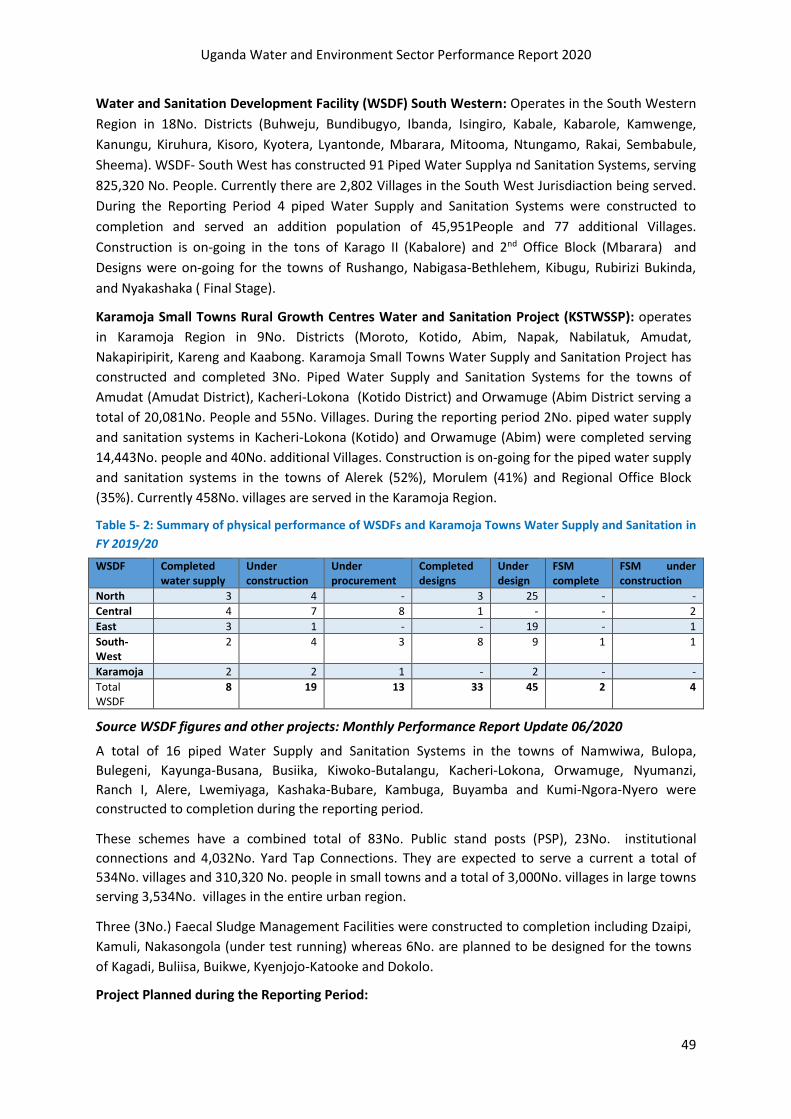
Uganda Water and Environment Sector Performance Report 2020
49
Water and Sanitation Development Facility (WSDF) South Western: Operates in the South Western
Region in 18No. Districts (Buhweju, Bundibugyo, Ibanda, Isingiro, Kabale, Kabarole, Kamwenge,
Kanungu, Kiruhura, Kisoro, Kyotera, Lyantonde, Mbarara, Mitooma, Ntungamo, Rakai, Sembabule,
Sheema). WSDF- South West has constructed 91 Piped Water Supplya nd Sanitation Systems, serving
825,320 No. People. Currently there are 2,802 Villages in the South West Jurisdiaction being served.
During the Reporting Period 4 piped Water Supply and Sanitation Systems were constructed to
completion and served an addition population of 45,951People and 77 additional Villages.
Construction is on-going in the tons of Karago II (Kabalore) and 2nd Office Block (Mbarara) and
Designs were on-going for the towns of Rushango, Nabigasa-Bethlehem, Kibugu, Rubirizi Bukinda,
and Nyakashaka ( Final Stage).
Karamoja Small Towns Rural Growth Centres Water and Sanitation Project (KSTWSSP): operates
in Karamoja Region in 9No. Districts (Moroto, Kotido, Abim, Napak, Nabilatuk, Amudat,
Nakapiripirit, Kareng and Kaabong. Karamoja Small Towns Water Supply and Sanitation Project has
constructed and completed 3No. Piped Water Supply and Sanitation Systems for the towns of
Amudat (Amudat District), Kacheri-Lokona (Kotido District) and Orwamuge (Abim District serving a
total of 20,081No. People and 55No. Villages. During the reporting period 2No. piped water supply
and sanitation systems in Kacheri-Lokona (Kotido) and Orwamuge (Abim) were completed serving
14,443No. people and 40No. additional Villages. Construction is on-going for the piped water supply
and sanitation systems in the towns of Alerek (52%), Morulem (41%) and Regional Office Block
(35%). Currently 458No. villages are served in the Karamoja Region.
Table 5- 2: Summary of physical performance of WSDFs and Karamoja Towns Water Supply and Sanitation in
FY 2019/20
WSDF Completed water supply
Under construction
Under procurement
Completed designs
Under design
FSM complete
FSM under construction
North 3 4 - 3 25 - -
Central 4 7 8 1 - - 2
East 3 1 - - 19 - 1
South-West
2 4 3 8 9 1 1
Karamoja 2 2 1 - 2 - -
Total WSDF
8 19 13 33 45 2 4
Source WSDF figures and other projects: Monthly Performance Report Update 06/2020
A total of 16 piped Water Supply and Sanitation Systems in the towns of Namwiwa, Bulopa,
Bulegeni, Kayunga-Busana, Busiika, Kiwoko-Butalangu, Kacheri-Lokona, Orwamuge, Nyumanzi,
Ranch I, Alere, Lwemiyaga, Kashaka-Bubare, Kambuga, Buyamba and Kumi-Ngora-Nyero were
constructed to completion during the reporting period.
These schemes have a combined total of 83No. Public stand posts (PSP), 23No. institutional
connections and 4,032No. Yard Tap Connections. They are expected to serve a current a total of
534No. villages and 310,320 No. people in small towns and a total of 3,000No. villages in large towns
serving 3,534No. villages in the entire urban region.
Three (3No.) Faecal Sludge Management Facilities were constructed to completion including Dzaipi,
Kamuli, Nakasongola (under test running) whereas 6No. are planned to be designed for the towns
of Kagadi, Buliisa, Buikwe, Kyenjojo-Katooke and Dokolo.
Project Planned during the Reporting Period:

Uganda Water and Environment Sector Performance Report 2020
50
Kapeeka Industrial Park: Kapeeka Industrials Park Sewerage System was designed, and a feasibility
study was completed. A Consultant was procured for development of the Detailed Engineering
Design for the Sewerage Network and the Water Supply System for the Kapeeke Industrial Park.
This undergo the project approval process with the Development Committee of MOFPED.
WSDF-Karamoja is being planned for the next Financial year which will be a successor project for
Karamoja Small Towns Water and Sanitation Project which will expire this financial year. The Project
plans to cover over 30 small towns and rural growth centres of the 9 Districts covering Karamoja
Region.
5.4 Implementation of Projects under Large Towns / NWSC
The Corporation’s geographical coverage increased from 253 towns as at 30th June 2019 to 258 towns as at 30th June 2020, a growth of 2%. Based on the NWSC Service Coverage Baseline Survey Report 2018, the overall water service coverage is estimated at 74% comprising 84% within the Municipal Boundaries and 54% outside the Municipal Boundaries.
100% Service Coverage Acceleration Project (SCAP 100)
In line with the Government Strategic Aspiration of achieving universal access to water supply, NWSC is implementing a Three-Year Project code named, “100% Service Coverage Acceleration Project (SCAP100)”. The project aims at ensuring universal and equitable access to safe water supply in all villages under NWSC jurisdiction by the year 2020.
The Project entails implementation of at least 8,000 Km of new water mains, 140,000 new water connections and 20,000 Pubic Taps (PSPs) covering 12,000 villages, with at least two (2) PSPs per village or 1 PSP per 200 people. The table 5-3 below summarizes the status of implementation of the SCAP100 Project as at 30th June 2020 in the various Regions.
Table 5- 3: Summary Implementation Status of SCAP100 Project for the FY 2019/20
Region New Water Mains
(Km)
New Water Connections (No.) New Public Stand Posts
(No.)
Target Installed % Perf. Target Installed % Perf. Target Installed % Perf.
Kampala
Metropolitan
531 73 14% 27,725 28,720 104% 331 1,355 409%
Central 638 516 81% 10,896 11,350 104% 2,480 580 23%
Eastern & Northern 620 438 71% 6,852 8,908 130% 2,983 948 32%
Western & South-
Western
1,210 1,107 91% 10,028 12,268 122% 2,706 1,271 47%
Total 3,000 2,135 71% 55,501 61,246 110% 8,500 4,154 49%
As a result of the SCAP100 project implementation, the Corporation has registered a growth in the water network of 13%, from 17,623 Km (June 2019) to 19,974 Km (June 2020). Over the period, more than 3,000 additional villages have been covered and consequently 61,246 customers have been connected. On the other hand, the number of PSPs installed per annum grew by 19% from 3,500 (June 2019) to 4,154 (June 2020). The growth in PSPs points towards the NWSC’s increased commitment to extend services to the less privileged of the population in all Areas of jurisdiction.

Uganda Water and Environment Sector Performance Report 2020
51
NWSC Tariff Structure
The Corporation implements a uniform tariff with a cross subsidy in all towns and consumer categories. Since there were insignificant changes on the indexation parameters, the tariff structure was maintained. Table 5-4 shows the NWSC tariff implemented for the various consumer categories during the Financial Year 2019/20.
Table 5- 4: NWSC Tariff Structure FY 2019/20 (VAT Exclusive)
Customer Category Water tariff 2018/19 (Ushs./m3)
Tariff per 20Liter Jerrycan (Ushs./m3)
Sewerage Tariff 2018/19 (Ushs./m3)
Public Standpipe 1,060 25 n/a**
Domestic 3,516 83 2.637
Institutions / Government
3,558 84 3,558
Commercial < 500m3/m 4,220 99 4,220
Commercial > 1500m3/m 3,373 79 3,373
Industrial < 1000m3 4,220 99 4,220
Industrial > 1000m3 2,500 59 2,500
Average Commercial 3,938 92 3,938
Sewerage charges are 75% of the water tariff for Domestic and 100% of the water tariff for other categories. Sewerage is not billed in isolation; it is based on volume of water consumed.
Pro-poor Measures NWSC is cognizant of the fact that access to safe water is a human right, thus provision of at least the basic water services to all sections of the population is paramount. One of the ways the Corporation reaches out to the poor living in urban areas is through the construction of Public Stand Pipes which have affordable tariff.
During the Financial Year 2019/20, the number of PSPs installed per annum grew by 19%, from 3,550 PSPs in the FY 2018/19 to 4,154 PSPs as at June 2020. The total number of PSPs as at 30th June 2020 was 21,600.
Table 5- 5: Annual Trend of PSPs/Kiosks for the period 2015- 2020
Financial Year 2014/15 2015/16 2016/17 2017/18 2018/19 2019/20
New PSPs/Kiosks 924 1,093 1,087 1,503 3,550 4,154
Total Active PSPs/Kiosks 6,594 8,161 8,859 10,185 15,066 19,007
Total Inactive PSPs/Kiosks 2,488 2,680 2,378 2,120 2,120 2,593
Total PSPs/Kiosks 9,082 10,841 11,237 12,305 17,186 21,600
Non-Revenue Water (NRW)
As at 30th June 2020, NRW was 33.5%, compared to 29.8% in the financial year 2018/19. This is more severe in the Kampala Metropolitan Area, where NRW stands at 39.5%. The water losses are mainly attributed to rising level of illegal water use by some customers, leaks and bursts due to road works. The Corporation will continue being vigilant and more innovative in combating water losses.
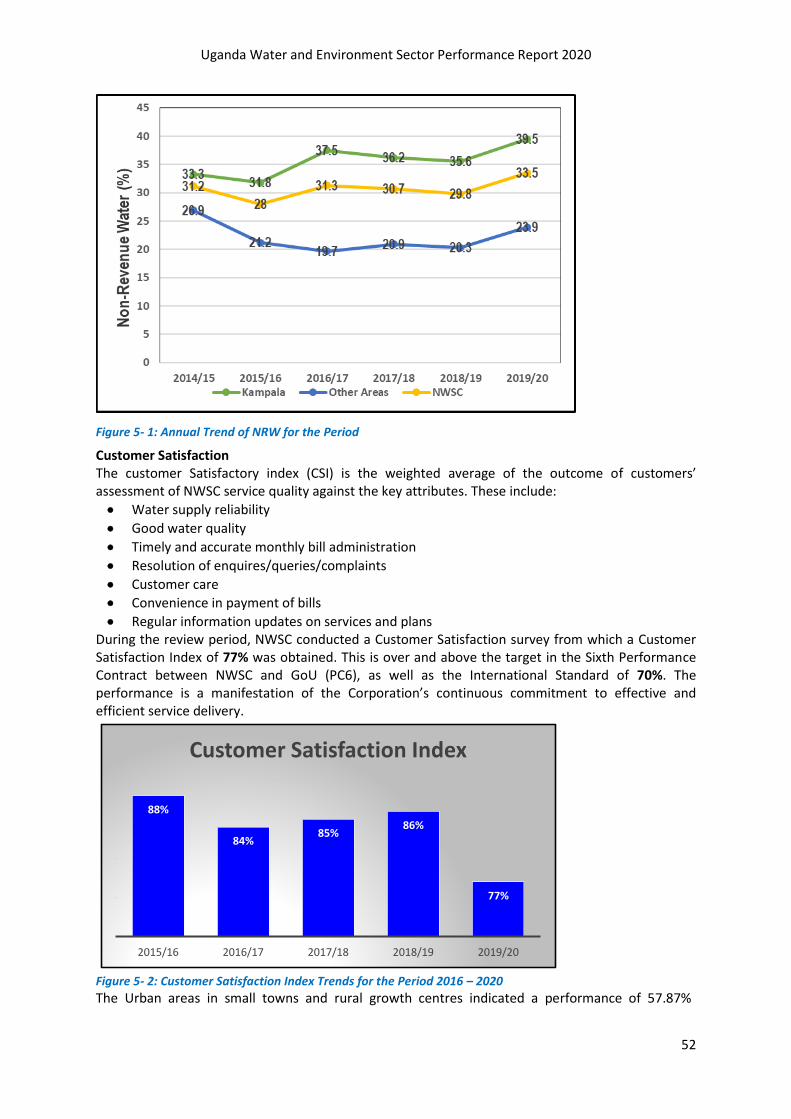
Uganda Water and Environment Sector Performance Report 2020
52
Figure 5- 1: Annual Trend of NRW for the Period
Customer Satisfaction The customer Satisfactory index (CSI) is the weighted average of the outcome of customers’ assessment of NWSC service quality against the key attributes. These include:
• Water supply reliability
• Good water quality
• Timely and accurate monthly bill administration
• Resolution of enquires/queries/complaints
• Customer care
• Convenience in payment of bills
• Regular information updates on services and plans During the review period, NWSC conducted a Customer Satisfaction survey from which a Customer Satisfaction Index of 77% was obtained. This is over and above the target in the Sixth Performance Contract between NWSC and GoU (PC6), as well as the International Standard of 70%. The performance is a manifestation of the Corporation’s continuous commitment to effective and efficient service delivery.
88%
84%85%
86%
77%
2015/16 2016/17 2017/18 2018/19 2019/20
Customer Satisfaction Index
Figure 5- 2: Customer Satisfaction Index Trends for the Period 2016 – 2020
The Urban areas in small towns and rural growth centres indicated a performance of 57.87%

Uganda Water and Environment Sector Performance Report 2020
53
compared to 55.90% performance scored in the year 2019. The improvement was as a result of the wider population served and closer service in the villages in the areas/regions of operation with clean water through the WMDP intervention in Pallisa and 15No. WSDFs construction towns including the 2 in Karamoja, and the additional connections and coverage by UwsAs. The overall performance of the Urban areas including Large towns, small towns and rural growth centres was scored at 70.5% compared to 79.2% for the year 2019. The decline from last year’s 79% is mainly due to an improved data base and increased intervention by the Umbrellas of Water and Sanitation and bigger projects covering bigger region and bigger populations. Umbrella added on 58 Piped Water Supply and Sanitation systems targets through a gazette.
Table 5- 6: Trends in access to improved water supply in urban areas - 2011 to 2019
Reporting Period 10/11 11/12 12/13 13/14 14/15
15/16 16/17 17/18 18/19 2019/2020
NWSC
Towns
Total Population (mn)
3.24 3.38 3.84 4.42 4.90 6.64 8.0 9.7 16.8
Population served (mn)
2.43 2.61 2.99 3.38 3.72 5.44 6.3 8.1 13.7
% Coverage 75% 77% 78% 77% 76% 82%* 79% 84% 81.6% 74%
MWE /
DWD
Towns
Total Population (mn)
2.38 2.49 2.61 2.23 2.07 1.69 1.50 1.6 1.543 491,197
Population served (mn)
1.28 1.42 1.52 1.46 1.38 0.45 0.44 0.57 0.733 275,678
% Coverage 54% 57% 58% 65% 67% 27% 29% 36% 55.9.% 69.7%
Total
(Urban)
Total Population (mn)
5.62 5.87 6.45 6.65 6.97 8.34 9.4 11.3 18.304 491,197
Population served (mn)
3.71 4.04 4.51 4.84 5.11 5.89 6.6 8.7 14.471 275,678
% Coverage 66% 69% 70% 73% 73% 71% 71% 77% 79.1%
70.5%
Notes:
The access in the large towns targeted to serve 4,928No.Villages and a total of 531No. villages were
served. The contribution of the large towns to the overall access performance was 81.6% which was
lower than the previous year of 84%, The decline was as a result of the newly created Municipal
Councils which were brought on board afresh and increased the targeted coverage in due course.
Table 5- 7: Trend of Access to Safe and Clean Water using source per Village
Reporting Period 2018/2019 Addiotional Villages served
2019/2020
NWSC
Towns
Total Number of Villages
16,154 Total Number of Villages
100%
Number of Villages Served
9,906 Number of Villages Served
3,000 12,906 (79.9%)
Villages Unserved
6,248 % Coverage
3,248 3,148 (20.1%)
MWE / DWD Total Number of Villages
14,494 Total Number of Villages
100%

Uganda Water and Environment Sector Performance Report 2020
54
Towns Number of Villages served
9,566 Number of Villages served
534 10,100 (69.7%)
Villages Unserved
4,928 % Coverage
4,396 4,394 (30.3%)
Total
(Urban)
Total Number of Villages
30,648 Total Number of Villages
100%
Number of Villages served
19,472 Number of Villages served
3,534 23,006 (75.1%)
Villages Unserved
11,176 % Coverage
7,644 7,644 (24.9%)
The overall access which is the percentage of people within 200 metres of an improved water
source score at 70.5% % with a decrease of 8.7% compared to the 79.2% score for last year. The
decline was attributed to the increase in the number of small towns and rural growth centres which
were gazetted and added to the scope of coverage by the 6Regional Umbrellas of Water and
Sanitation and the intensification of the baseline of supply by the MWE Headquarters. The scope for
NWSC was also increased as a result of the baseline study undertaken during the last year in the
NWSC areas of operation. The actual urban coverage pertaining to villages is approximately 23,006
No. Villages, out of the 30,648No. baseline score of the coverage indicating 7,644No. villages that
are un served in the Urban Areas of Jurisdiction including small Towns, Rural Growth Centres and
Large Towns.
Safely Managed Water
This is the percentage of population using safely managed drinking water services located at
premises. This parameter is calculated by %age on premises*percentage functionality*copying with
water quality. Safely managed water scored at 57.11% (Functionality (81%) * %age Access ( 70.5%)
during the year 2019/2020 compared to 57% during 2018/2029. The slight improvement was on the
emphasis increased to establish yard tap connections compared to establishment of the Public Stan
Posts.
Percentage of Villages source of Safe Water Supply
During the year 531No. additional villages have been served with safe and clean drinking water from
the 16No. piped Water Supply and Sanitation systems completed by the small Towns and rural
growth centres and large towns.
Another 9,566 villages in small towns and rural growth centres are being served by the schemes
managed by the Umbrellas and Water and Sanitation (Source: PEGUSUS Billing software). A total of
the 10,097No. Villages are being served under small towns, 12,909No. are being served under Large
towns.
Pro-Poor / Affordability
This is the average sum of Public stand Posts that charge below or equal in in-house tariff per town
over total number of towns offering a service. For the financial year 2019 /2020 a total of 16No.
towns have been constructed and completed and in all these towns the Pro-poor tariff is below the
in-house tariff thus scoring 100%. Amongst the towns managed by the Umbrellas of Water and
Sanitation 98.4% of the public stand posts offer a tariff below the in-house and the 1.6% offer a tariff
equal or slightly above the in-house. This is because some of the public kiosks / stand posts are sub
contracted and the sub contracts try to solicit for some profits which makes this a little higher than
the in-house tariff. The MWE serves the poor (both individual households and Institutions) through
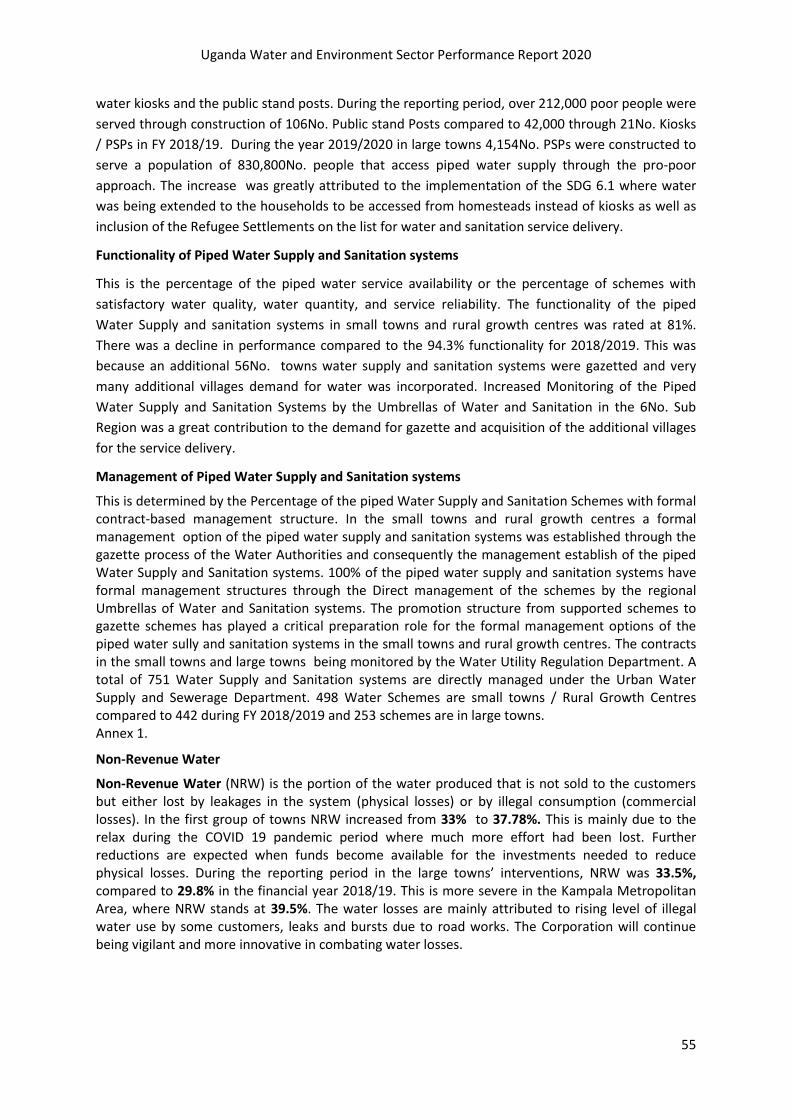
Uganda Water and Environment Sector Performance Report 2020
55
water kiosks and the public stand posts. During the reporting period, over 212,000 poor people were
served through construction of 106No. Public stand Posts compared to 42,000 through 21No. Kiosks
/ PSPs in FY 2018/19. During the year 2019/2020 in large towns 4,154No. PSPs were constructed to
serve a population of 830,800No. people that access piped water supply through the pro-poor
approach. The increase was greatly attributed to the implementation of the SDG 6.1 where water
was being extended to the households to be accessed from homesteads instead of kiosks as well as
inclusion of the Refugee Settlements on the list for water and sanitation service delivery.
Functionality of Piped Water Supply and Sanitation systems
This is the percentage of the piped water service availability or the percentage of schemes with
satisfactory water quality, water quantity, and service reliability. The functionality of the piped
Water Supply and sanitation systems in small towns and rural growth centres was rated at 81%.
There was a decline in performance compared to the 94.3% functionality for 2018/2019. This was
because an additional 56No. towns water supply and sanitation systems were gazetted and very
many additional villages demand for water was incorporated. Increased Monitoring of the Piped
Water Supply and Sanitation Systems by the Umbrellas of Water and Sanitation in the 6No. Sub
Region was a great contribution to the demand for gazette and acquisition of the additional villages
for the service delivery.
Management of Piped Water Supply and Sanitation systems
This is determined by the Percentage of the piped Water Supply and Sanitation Schemes with formal contract-based management structure. In the small towns and rural growth centres a formal management option of the piped water supply and sanitation systems was established through the gazette process of the Water Authorities and consequently the management establish of the piped Water Supply and Sanitation systems. 100% of the piped water supply and sanitation systems have formal management structures through the Direct management of the schemes by the regional Umbrellas of Water and Sanitation systems. The promotion structure from supported schemes to gazette schemes has played a critical preparation role for the formal management options of the piped water sully and sanitation systems in the small towns and rural growth centres. The contracts in the small towns and large towns being monitored by the Water Utility Regulation Department. A total of 751 Water Supply and Sanitation systems are directly managed under the Urban Water Supply and Sewerage Department. 498 Water Schemes are small towns / Rural Growth Centres compared to 442 during FY 2018/2019 and 253 schemes are in large towns. Annex 1.
Non-Revenue Water
Non-Revenue Water (NRW) is the portion of the water produced that is not sold to the customers but either lost by leakages in the system (physical losses) or by illegal consumption (commercial losses). In the first group of towns NRW increased from 33% to 37.78%. This is mainly due to the relax during the COVID 19 pandemic period where much more effort had been lost. Further reductions are expected when funds become available for the investments needed to reduce physical losses. During the reporting period in the large towns’ interventions, NRW was 33.5%, compared to 29.8% in the financial year 2018/19. This is more severe in the Kampala Metropolitan Area, where NRW stands at 39.5%. The water losses are mainly attributed to rising level of illegal water use by some customers, leaks and bursts due to road works. The Corporation will continue being vigilant and more innovative in combating water losses.

Uganda Water and Environment Sector Performance Report 2020
56
Per capita investment Cost
This is average cost per beneficiary of the new water and sanitation scheme (USD). The indicator is
defined as the amount of financial resources expended to each and every individual within the
project area. It is computed as the total amount of capital investment spent on a project against the
total design population of the project coverage area.
It should be noted that per capita costs depend on a number of factors, including the settlement
pattern, the topography, the definition of the supply area, and the type of water supply and
technology used. Additionally, it is important to know that the “per capita cost” is a rather weak
indicator since it does not include operational nor capital maintenance cost. This can lead to
negative decision in terms of high operational costs over the whole life cycle and low life span
because of low material quality.
The average per capita investment cost for the completed 16 towns water supply systems in FY
2019/20 was USD 57.95 compared to the USD 58 in FY 2018/19. The reduction was based on the
increase population served in many of the competed schemes and some schemes where
constructed was implemented.
Figure 5- 3: To indicate comparison 2004/2005 – 2019/2020
Figure 5-4 shows the per capita invest costs of the piped water supply system constructed per town.

Uganda Water and Environment Sector Performance Report 2020
57
Figure 5- 4: Per capita investment per town
5.2.9 Drinking Water Quality
The umbrellas of Water and Sanitation in the 6No. regional operation areas conduct water quality monitoring on a quarterly basis. During the reporting period 379No samples compared to 508No.(2018/2019) samples were collected in the 6No. regional areas (small Towns) out of which 91.6% of the samples compared to 96.3% of the samples were compliant to the national water quality standards (absence of microbiological contamination). There was a decline in the Water Quality Levels due to the high levels of rains and floods in the year 2019/2020. The low compliance of the small towns in Central (87%) and Midwestern (86%) and Karamoja (79%) were as a result of the increasing old schemes that are being provided with some level of technical improvement to cater for water safety, the increased levels of floods in the regions and the higher numbers of the piped water supply and sanitation schemes that were been added on the management list. The results registered a decline in Central from 89% to 87% and an improvement in Mid-Western from 84.2% to 86% and 99.6% in the large towns. The general trend indicated an improvement to 100% in the 4No. Regions of the Umbrellas. The overall performance declined from 97.5% to 91.6% In Large Towns 99.8% of the water samples from all Areas complied with the National standards for the Bacteriological quality of potable water exceeding the WHO standard of 97%. On average, the overall compliance of both physio-chemical (colour, turbidity, chlorine residual, pH, Alkalinity, Hardness, Electrical conductivity) and bacteriological parameters to the National standards was 98% meeting the National target as per the Performance Contract VI with Government of Uganda as summarized Table 5-8 below. With regard to Wastewater, the systems achieved an overall compliance of 46.0%. Although efforts have been made to desludge most waste stabilization ponds, many of the sewerage systems receive faecal sludge which they are not designed to treat. The Corporation has plans to establish faecal sludge systems.
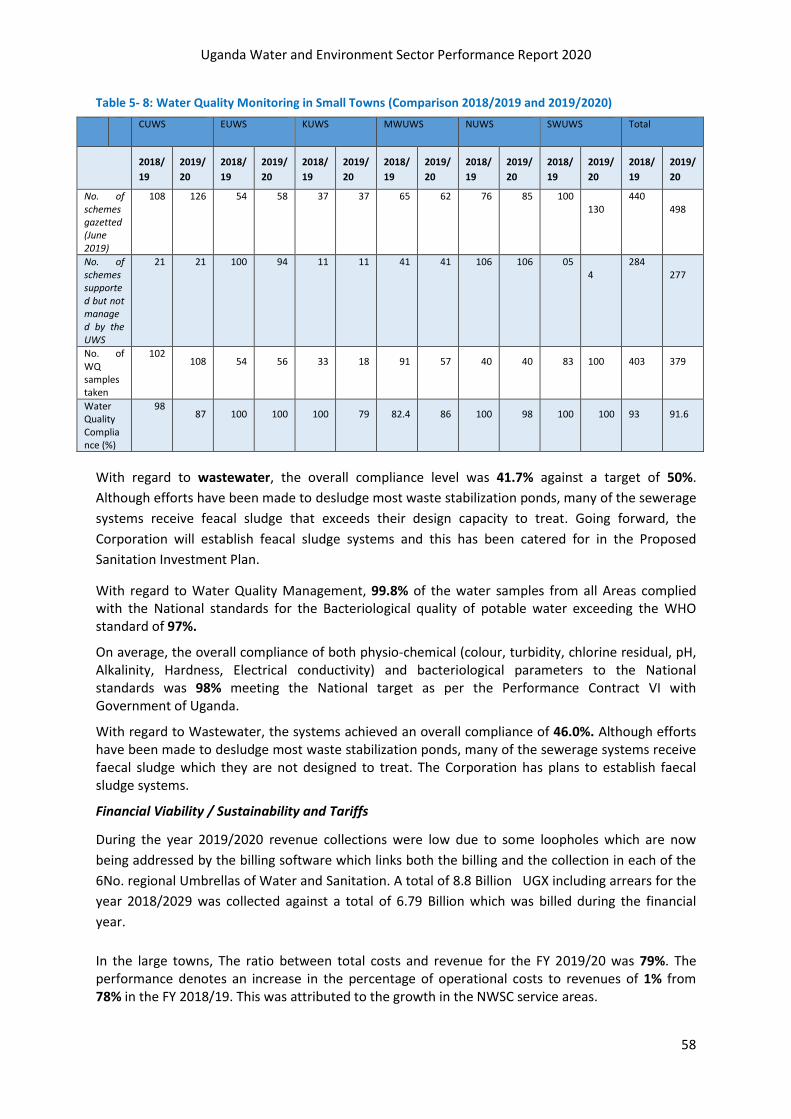
Uganda Water and Environment Sector Performance Report 2020
58
Table 5- 8: Water Quality Monitoring in Small Towns (Comparison 2018/2019 and 2019/2020)
CUWS EUWS KUWS MWUWS NUWS SWUWS Total
2018/
19
2019/
20
2018/
19
2019/
20
2018/
19
2019/
20
2018/
19
2019/
20
2018/
19
2019/
20
2018/
19
2019/
20
2018/
19
2019/
20
No. of schemes gazetted (June 2019)
108
126 54 58 37 37 65 62 76 85 100 130
440 498
No. of schemes supported but not managed by the UWS
21
21 100 94 11 11 41 41 106 106 05 4
284 277
No. of WQ samples taken
102 108 54 56 33 18 91 57 40 40 83 100 403 379
Water Quality Compliance (%)
98 87 100 100 100 79 82.4 86 100 98 100 100 93 91.6
With regard to wastewater, the overall compliance level was 41.7% against a target of 50%.
Although efforts have been made to desludge most waste stabilization ponds, many of the sewerage
systems receive feacal sludge that exceeds their design capacity to treat. Going forward, the
Corporation will establish feacal sludge systems and this has been catered for in the Proposed
Sanitation Investment Plan.
With regard to Water Quality Management, 99.8% of the water samples from all Areas complied with the National standards for the Bacteriological quality of potable water exceeding the WHO standard of 97%.
On average, the overall compliance of both physio-chemical (colour, turbidity, chlorine residual, pH, Alkalinity, Hardness, Electrical conductivity) and bacteriological parameters to the National standards was 98% meeting the National target as per the Performance Contract VI with Government of Uganda.
With regard to Wastewater, the systems achieved an overall compliance of 46.0%. Although efforts have been made to desludge most waste stabilization ponds, many of the sewerage systems receive faecal sludge which they are not designed to treat. The Corporation has plans to establish faecal sludge systems.
Financial Viability / Sustainability and Tariffs
During the year 2019/2020 revenue collections were low due to some loopholes which are now
being addressed by the billing software which links both the billing and the collection in each of the
6No. regional Umbrellas of Water and Sanitation. A total of 8.8 Billion UGX including arrears for the
year 2018/2029 was collected against a total of 6.79 Billion which was billed during the financial
year.
In the large towns, The ratio between total costs and revenue for the FY 2019/20 was 79%. The performance denotes an increase in the percentage of operational costs to revenues of 1% from 78% in the FY 2018/19. This was attributed to the growth in the NWSC service areas.

Uganda Water and Environment Sector Performance Report 2020
59
Financial Viability, Non-Revenue Water, Functionality and Collection Efficiency
The financial viability of the respective Umbrellas of Water and Sanitation is generally still low.
Overall viability of all the six Umbrellas of Water and Sanitation was at 93.9%, Non-Revenue Water
at 33.78% and Collection Efficiency was 91.4%. The functionality of piped Water Supply and
Sanitation was 81% compared to 94% in FY 2018/219. The decline was as a result of the many
villages brought on board through the additional gazetted 58No. piped Water Supply and Sanitation
Systems.
The detailed performance of the financial viability, Non-Revenue Water and Collection Efficiency is
presented in the table 5-9 below:
Table 5- 9: Financial Viability /Sustainability, Non-Revenue Water, Functionality, and Collection Efficiency Performance
SN UWSs Financial Viability
/Sustainability (%)
Non-Revenue Water
(NRW) (%)
Functionality (%) Collection Efficiency (%)
2018/19 2019/20 2018/19 2019/20 2018/19 2019/20 2018/19 2019/20
1 Central 76 104
22.4 36.28 86 88.7 111.5 104.4
2 South West 81 96 23 30.4 97 91.0 81 94.86
3 North 83 94 24 37.91 70 70.0 0 89.86
4 East 89 96 53 35.0 75 96.0 39.1 88.86
5 Mid-West 80 87 26.6 25.0 75 75.0 48 103.79
6 Karamoja 64 86 42.1 38.0 66 65.0 17.7 59.09
TOTAL 79 93.9 33 37.78 94 81 49.7 90.14
Tariff Structure
The Corporation implements a uniform tariff with a cross subsidy in all towns and consumer categories. Since there were insignificant changes on the indexation parameters, the tariff structure was maintained. Table 5-10 shows the NWSC tariff implemented for the various consumer categories during the Financial Year 2019/20.
Table 5- 10: NWSC Tariff Structure FY 2019/20 (VAT Exclusive)
Customer Category Water tariff 2018/19 (Ushs./m3)
Tariff per 20Liter Jerrycan (Ushs./m3)
Sewerage Tariff 2018/19 (Ushs./m3)
Public Standpipe 1,060 25 n/a**
Domestic 3,516 83 2.637
Institutions / Government
3,558 84 3,558
Commercial < 500m3/m 4,220 99 4,220
Commercial > 1500m3/m
3,373 79 3,373
Industrial < 1000m3 4,220 99 4,220
Industrial > 1000m3 2,500 59 2,500
Average Commercial 3,938 92 3,938
Sewerage charges are 75% of the water tariff for Domestic and 100% of the water tariff for other
categories. Sewerage is not billed in isolation; it is based on volume of water consumed.
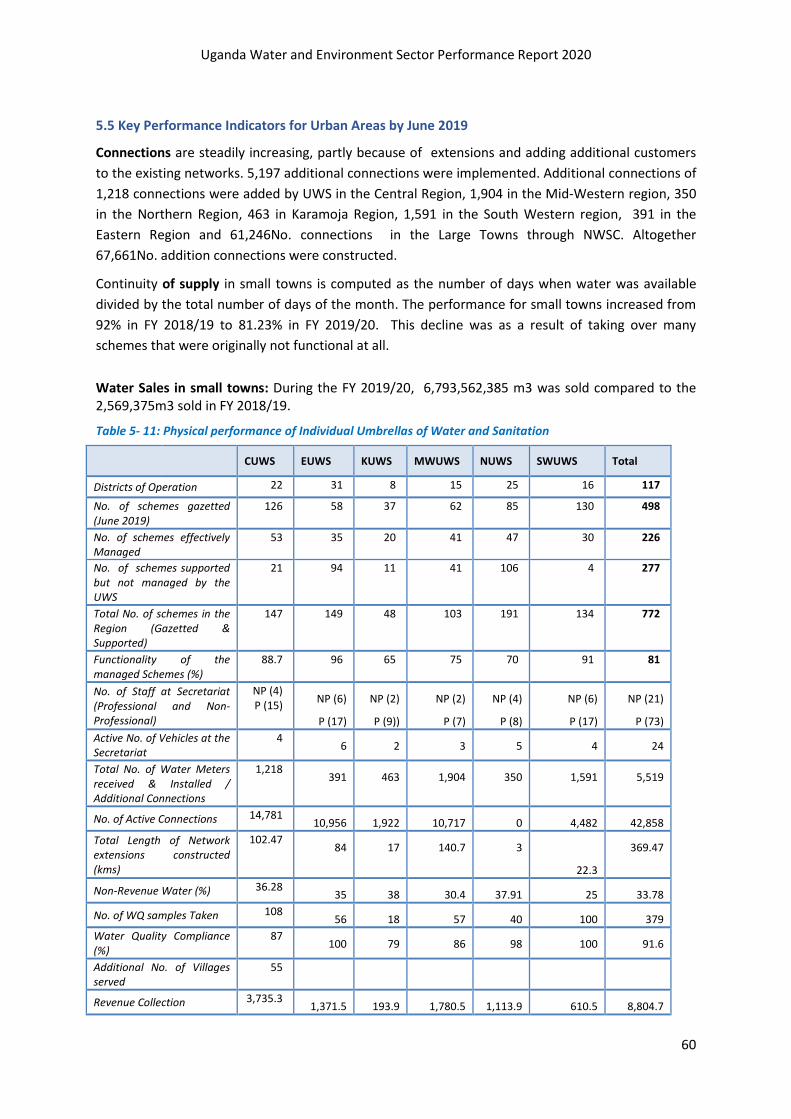
Uganda Water and Environment Sector Performance Report 2020
60
5.5 Key Performance Indicators for Urban Areas by June 2019
Connections are steadily increasing, partly because of extensions and adding additional customers
to the existing networks. 5,197 additional connections were implemented. Additional connections of
1,218 connections were added by UWS in the Central Region, 1,904 in the Mid-Western region, 350
in the Northern Region, 463 in Karamoja Region, 1,591 in the South Western region, 391 in the
Eastern Region and 61,246No. connections in the Large Towns through NWSC. Altogether
67,661No. addition connections were constructed.
Continuity of supply in small towns is computed as the number of days when water was available
divided by the total number of days of the month. The performance for small towns increased from
92% in FY 2018/19 to 81.23% in FY 2019/20. This decline was as a result of taking over many
schemes that were originally not functional at all.
Water Sales in small towns: During the FY 2019/20, 6,793,562,385 m3 was sold compared to the 2,569,375m3 sold in FY 2018/19.
Table 5- 11: Physical performance of Individual Umbrellas of Water and Sanitation
CUWS EUWS KUWS MWUWS NUWS SWUWS Total
Districts of Operation 22 31 8 15 25 16 117
No. of schemes gazetted (June 2019)
126 58 37 62 85 130 498
No. of schemes effectively Managed
53 35 20 41 47 30 226
No. of schemes supported but not managed by the UWS
21 94 11 41 106 4 277
Total No. of schemes in the Region (Gazetted & Supported)
147 149 48 103 191 134 772
Functionality of the managed Schemes (%)
88.7 96 65 75 70 91 81
No. of Staff at Secretariat (Professional and Non-Professional)
NP (4) P (15)
NP (6)
P (17)
NP (2)
P (9))
NP (2)
P (7)
NP (4)
P (8)
NP (6)
P (17)
NP (21)
P (73)
Active No. of Vehicles at the Secretariat
4 6 2 3 5 4 24
Total No. of Water Meters received & Installed / Additional Connections
1,218 391 463 1,904 350 1,591 5,519
No. of Active Connections 14,781 10,956 1,922 10,717 0 4,482 42,858
Total Length of Network extensions constructed (kms)
102.47 84 17 140.7 3
22.3
369.47
Non-Revenue Water (%) 36.28 35 38 30.4 37.91 25 33.78
No. of WQ samples Taken 108 56 18 57 40 100 379
Water Quality Compliance (%)
87 100 79 86 98 100 91.6
Additional No. of Villages served
55
Revenue Collection 3,735.3 1,371.5 193.9 1,780.5 1,113.9 610.5 8,804.7
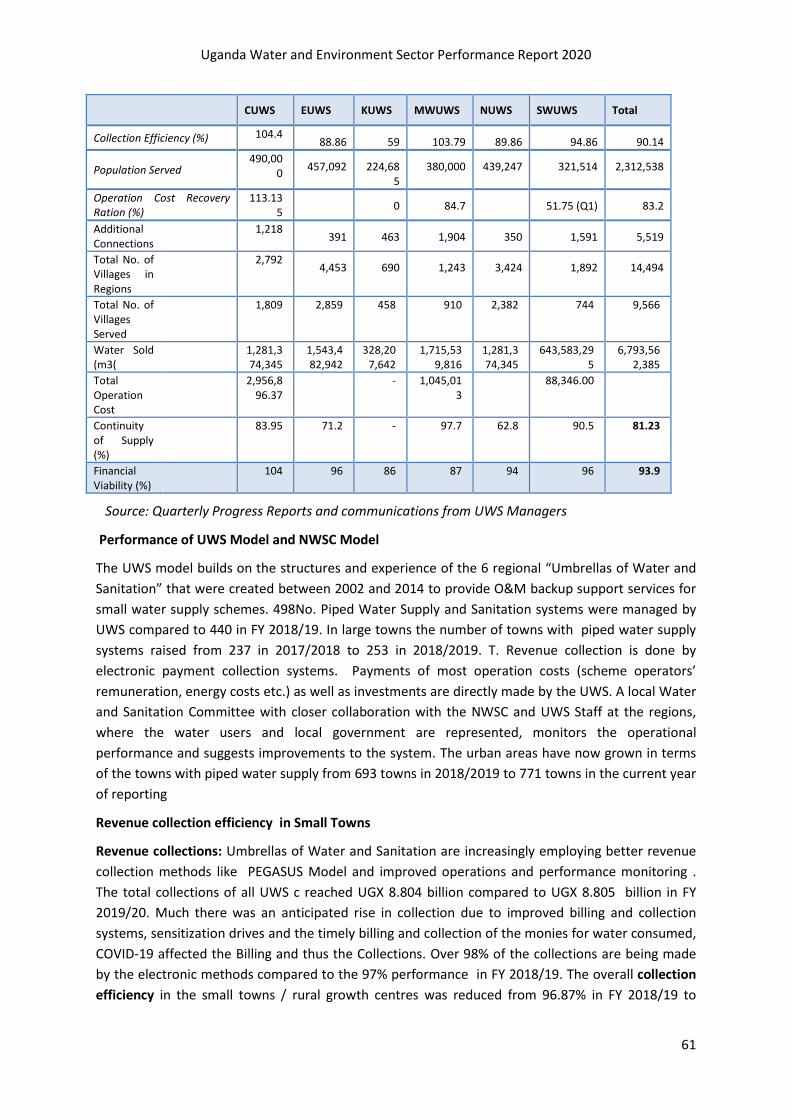
Uganda Water and Environment Sector Performance Report 2020
61
CUWS EUWS KUWS MWUWS NUWS SWUWS Total
Collection Efficiency (%) 104.4 88.86 59 103.79 89.86 94.86 90.14
Population Served 490,00
0 457,092 224,68
5 380,000 439,247 321,514 2,312,538
Operation Cost Recovery Ration (%)
113.135
0 84.7 51.75 (Q1) 83.2
Additional Connections
1,218
391 463 1,904 350 1,591 5,519
Total No. of Villages in Regions
2,792
4,453 690 1,243 3,424 1,892 14,494
Total No. of Villages Served
1,809 2,859 458 910 2,382 744 9,566
Water Sold (m3(
1,281,374,345
1,543,482,942
328,207,642
1,715,539,816
1,281,374,345
643,583,295
6,793,562,385
Total Operation Cost
2,956,8
96.37 - 1,045,01
3 88,346.00
Continuity of Supply (%)
83.95 71.2 - 97.7 62.8 90.5 81.23
Financial Viability (%)
104 96 86 87 94 96 93.9
Source: Quarterly Progress Reports and communications from UWS Managers
Performance of UWS Model and NWSC Model
The UWS model builds on the structures and experience of the 6 regional “Umbrellas of Water and
Sanitation” that were created between 2002 and 2014 to provide O&M backup support services for
small water supply schemes. 498No. Piped Water Supply and Sanitation systems were managed by
UWS compared to 440 in FY 2018/19. In large towns the number of towns with piped water supply
systems raised from 237 in 2017/2018 to 253 in 2018/2019. T. Revenue collection is done by
electronic payment collection systems. Payments of most operation costs (scheme operators’
remuneration, energy costs etc.) as well as investments are directly made by the UWS. A local Water
and Sanitation Committee with closer collaboration with the NWSC and UWS Staff at the regions,
where the water users and local government are represented, monitors the operational
performance and suggests improvements to the system. The urban areas have now grown in terms
of the towns with piped water supply from 693 towns in 2018/2019 to 771 towns in the current year
of reporting
Revenue collection efficiency in Small Towns
Revenue collections: Umbrellas of Water and Sanitation are increasingly employing better revenue
collection methods like PEGASUS Model and improved operations and performance monitoring .
The total collections of all UWS c reached UGX 8.804 billion compared to UGX 8.805 billion in FY
2019/20. Much there was an anticipated rise in collection due to improved billing and collection
systems, sensitization drives and the timely billing and collection of the monies for water consumed,
COVID-19 affected the Billing and thus the Collections. Over 98% of the collections are being made
by the electronic methods compared to the 97% performance in FY 2018/19. The overall collection
efficiency in the small towns / rural growth centres was reduced from 96.87% in FY 2018/19 to

Uganda Water and Environment Sector Performance Report 2020
62
90.14%. This was attributed to the effects of COVID 19 that hampered the payment for the water
bills by almost 92% of the Water Users. However, this short fall has been solved by continued
engagement of the Water users and sensitization on how to approach all the operations despite the
existence of the Corona Virus.
Table 5- 12: Financial Performance for July 2029 - June 2020
Sn Umbrella Amount Billed (UGX) Amount Collected (UGX) Collection Efficiency
(%)
1 Karamoja 328,207,642 193,922,413 59.09
2 North 1,281,374,345 1,112,983,934 89.86
3 Central 1,281,374,345 3,735,338,721 104.4
4 East 1,543,482,942 1,371,474,435 88.86
5 Mid-West 1,715,539,816 1,780,534,183 103.79
6 South West 643,583,295 610,490,412 94.86
Totals 6,793,562,385 8,804,744,098 90.14%
The operating cost coverage ratio is defined here as the total collections divided by the total direct
operating costs at the local level. This includes energy costs, the remuneration of scheme operators
and the cost of chemicals and minor repairs, but not the operational costs of the UWS incurred at
the regional level. The performance is this aspect was realised at 94.8% compared to the 93.9%
performance (2018/2019) indicating that generally all the 6No. UWAs can slightly above average
meet their operational cost by average. Efforts like clustering of the piped Water Supply and
Sanitation systems, managing of the NRW lower than the current, making additional extensions, are
being implemented to cut down some costs for maximisation of resources and minimization of the
accrued costs.
Operation and Maintenance (O&M) in small Towns: It was envisaged during the reporting period that Repair, extension and metering investments will be made through both internal and external support to enhance performance. Attempts have been made through support Agencies like Government of Uganda, Development Partners especially NGOs (WSUP Advisory supporting Mid-Western Umbrella), USAID – USHA supporting Central, East and Northern Umbrellas, Water Aid Uganda supporting both East and Central Umbrellas, Water for People supporting Mid-Western Umbrella, GIZ supporting Northern Umbrella but all these are mainly capacity building, governance and a few system rehabilitations and digitizing pipe networks.
Table 5- 13: Villages Operations in the 6No. Regional Areas for Umbrellas of Water and Sanitation
Umbrellas Total No. of Villages Villages Served Additional Villages
Served
Central 2,792 1,809 91
Eastern 4,453 2,859 308
Karamoja 690 458 40
Mid-Western 1,243 910 43
Northern 3,424 2,382 15
South Western 1,892 1,892 34
Total 14,494 10,310 531
Water Sources and Catchment Protection: WSDFs, and other Ministry Implementation approaches
continued with the implementation of Water Resources Management Framework and Guideline for
Water Source Protection (2013). All water source and catchment protection activities were
implemented in conjunction with the Water Management Zone (WMZ) teams.

Uganda Water and Environment Sector Performance Report 2020
63
Water Source Protection activities were implemented in all ongoing and completed water supply
and sanitation systems. The activities included advocacy, sensitizations, tree planting and restriction
of activities at water sources. Water source protection plans for the projects under IWMDP have
been planned and ready for implementation. 16No Water Catchment Protection plans were
prepared and implemented for each of the Namwiwa, Bulopa, Bulegeni, Kayunga-Busana, Busiika,
Kiwoko-Butalangu, Kacheri-Lokona, Orwamuge, Nyumanzi, Ranch I, Alere, Lwemiyaga, Kashaka-
Bubare, Kambuga, Buyamba and Kumi-Ngora-Nyero .implemented and completed Piped Water
Supply and Sanitation Projects. The 6No. Umbrellas of Water and Sanitation have developed Water
Safety Plans which are part of the implementation plans during the Extension, rehabilitations and
expansions of the existing piped water supply and sanitation systems.
Outcomes as a results of UWAs New Management Option: The new management option of the
piped Water Supply Systems in the Umbrellas of Water and Sanitation has created a number of
opportunities including employment / jobs both technical and semi-skilled. The approach has
created 94 employment opportunities compared to the 58 employment opportunities during the FY
2018/2019 at the regional level in the 6 Umbrellas of Water and Sanitation and 162No. compared to
the 1,014 employment opportunities in the regional schemes in the FY 2018/2019. A cumulated
total of 1,234 people compared to the 1,072 people (2018/2019) have been employed through the
approach of direct management of the piped water supply and sanitation systems across the
country.
Table 5- 14: Employment Opportunities created by Umbrellas of Water and Sanitation (2019/2020)
Umbrella Additional Number Of Employees In The F/Y 2019/20 Per Umbrella
Total Number Of Employees Per Umbrella
Umbrella of Water and Sanitation – Central 18 358
Umbrella of Water and Sanitation- East 0 227
Umbrella of Water and Sanitation - Karamoja
12 71
Umbrella of Water and Sanitation – Mid West
60 232
Umbrella of Water and Sanitation - North 30 186
Umbrella of Water and Sanitation – South West
42 160
TOTAL 162 1234
5.6 Challenges and Recommendations
Challenges:
i) Delays in land acquisition: Land acquisition for housing Water and Sanitation Facilities like
Water Reservoirs, Water Source Areas, Sanitation Facilities take quite a lot of time due to absent
landlords. This has caused a lot of time loss in procurement / contract management and thus
delays in delivering outputs within the planned timeframe. Land Acquisition process shall always
be started on early enough to make sure that land is acquired ahead time contract management.
ii) Delays in Contractors’ Mobilization: Contractors in most cases take a lot of time mobilization
the contracted human resources and the machinery to be sited on sites. This makes a lot of time
loss bearing the fact that by this time the contract has already commenced. Delays caused by
the COVID -19 pandemic

Uganda Water and Environment Sector Performance Report 2020
64
iii) Lengthy Procurement Process especially where NO OBJECTION is required to proceed:
Sometimes the procurement process is quit long due to the higher threshold values which
cannot be handled by the regional PDUs. This includes the prolonged approval by most of the
third parties to the implementation process.
iv) Climate Changes: Un regulated human activities in the implementation towns and Climate
change and variability affecting reliability of water sources.
v) Government budgets and inadequate infrastructure: Government budget for utilities does not
match with the actual GoU bills leading to accumulation of arrears. The available infrastructure
is such small that it cannot pace up with the overgrowing demand from the increasing
population growths and the urbanization rate. Inadequate physical planning leading to high
costs for securing project sites and way leaves.
vi) Accuracy of the Data: There is lack of software data management system which could be more
accurate and realistic during the establishment of performance based on data and information.
vii) Environment: Source protection through Implementation of Priority Based Water Source Protection Programmes. NWSC is implementing a number of initiatives, designed to address the environmental concerns. Among them are; tree planting through the School Water and Sanitation Clubs (SWAS), Young Water Professionals and community-based water and sanitation engagements.
viii) Non – Revenue Water (NRW): Collaborating with the Uganda Police and Crime prevention units to fight water losses caused by illegal connections and Water Loss Prevention Programs in all NWSC Areas to investigate illegal water users and reinforcement of fines.
ix) Low Business: Customer relationship management in all Areas through strengthened engagement with customers e.g. use of SMS messages to remind our customers to clear water bills. Aggressive sensitization of customers through localized radio talk shows and radio announcements requesting them to pay their bills to ensure sustainable supply of water.
Recommendations
• Accumulation of Government Arrears: Continuously engage Government to ensure
adequate budgeting and timely release of funds.
• Climate Change and Variability: Partnership with other stakeholders in implementation of
mitigation measures, as well as explore alternative water sources.
• Inadequate Infrastructure: Prioritizing Infrastructure growth through the various
development programs of NWSC and improve on investment efficiency
• Inadequate Investment / Infrastructure Financing: Pursue alternative financing options and
advocate for more allocation for GoU counterpart funding.
• Physical Planning: Maintaining close collaboration with planning authorities’ right from
project inception.
• Source protection: Implementation of Priority Based Water Source Protection Programmes.
• Undertake regional studies on financial viability considering the life span of the respective
schemes.
• Revise and harmonize the Umbrellas Quarterly Progress Reporting Format for uniform
measurement of performance and inclusion of the sector performance contribution from all
Umbrella interventions.

Uganda Water and Environment Sector Performance Report 2020
65
• Develop, Establish, and design a more robust Monitoring, Evaluation, Learning and Periodic
Reporting System that only calls for great input at data entry and the rest becomes
automated.
• Development of the robust business plans for maximization of the available local resources
particularly in the small towns and rural growth centres.
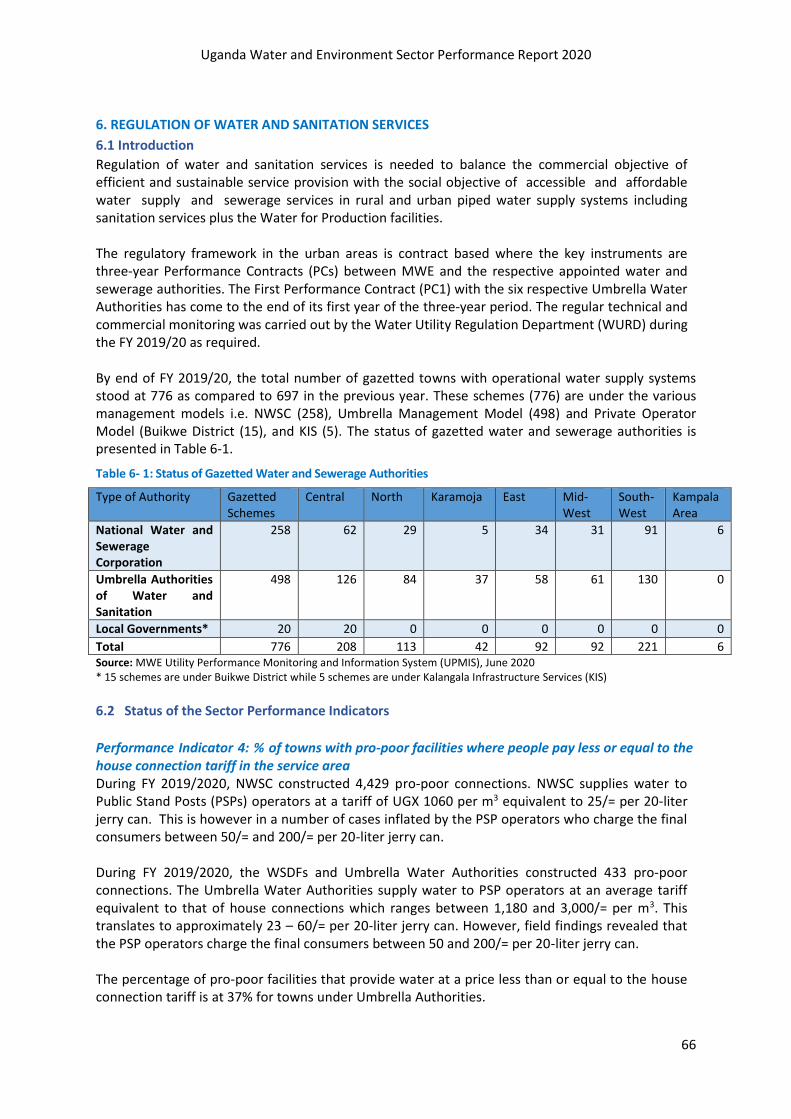
Uganda Water and Environment Sector Performance Report 2020
66
6. REGULATION OF WATER AND SANITATION SERVICES
6.1 Introduction
Regulation of water and sanitation services is needed to balance the commercial objective of efficient and sustainable service provision with the social objective of accessible and affordable water supply and sewerage services in rural and urban piped water supply systems including sanitation services plus the Water for Production facilities. The regulatory framework in the urban areas is contract based where the key instruments are three-year Performance Contracts (PCs) between MWE and the respective appointed water and sewerage authorities. The First Performance Contract (PC1) with the six respective Umbrella Water Authorities has come to the end of its first year of the three-year period. The regular technical and commercial monitoring was carried out by the Water Utility Regulation Department (WURD) during the FY 2019/20 as required. By end of FY 2019/20, the total number of gazetted towns with operational water supply systems stood at 776 as compared to 697 in the previous year. These schemes (776) are under the various management models i.e. NWSC (258), Umbrella Management Model (498) and Private Operator Model (Buikwe District (15), and KIS (5). The status of gazetted water and sewerage authorities is presented in Table 6-1.
Table 6- 1: Status of Gazetted Water and Sewerage Authorities
Type of Authority Gazetted Schemes
Central North Karamoja East Mid-West
South-West
Kampala Area
National Water and Sewerage Corporation
258 62 29 5 34 31 91 6
Umbrella Authorities of Water and Sanitation
498 126 84 37 58 61 130 0
Local Governments* 20 20 0 0 0 0 0 0
Total 776 208 113 42 92 92 221 6 Source: MWE Utility Performance Monitoring and Information System (UPMIS), June 2020 * 15 schemes are under Buikwe District while 5 schemes are under Kalangala Infrastructure Services (KIS)
6.2 Status of the Sector Performance Indicators
Performance Indicator 4: % of towns with pro-poor facilities where people pay less or equal to the house connection tariff in the service area During FY 2019/2020, NWSC constructed 4,429 pro-poor connections. NWSC supplies water to Public Stand Posts (PSPs) operators at a tariff of UGX 1060 per m3 equivalent to 25/= per 20-liter jerry can. This is however in a number of cases inflated by the PSP operators who charge the final consumers between 50/= and 200/= per 20-liter jerry can. During FY 2019/2020, the WSDFs and Umbrella Water Authorities constructed 433 pro-poor connections. The Umbrella Water Authorities supply water to PSP operators at an average tariff equivalent to that of house connections which ranges between 1,180 and 3,000/= per m3. This translates to approximately 23 – 60/= per 20-liter jerry can. However, field findings revealed that the PSP operators charge the final consumers between 50 and 200/= per 20-liter jerry can. The percentage of pro-poor facilities that provide water at a price less than or equal to the house connection tariff is at 37% for towns under Umbrella Authorities.

Uganda Water and Environment Sector Performance Report 2020
67
(Total number of connections charging a price less than or equal to the house connection tariff /
Total number of pro-poor connections X 100) It was also established that NWSC cross subsidizes water supply to PSPs, however this has no significant effect on the final cost at the PSP paid by consumer. This applies to both NWSC and the Umbrella Water Authorities. It is therefore recommended that NWSC and the Umbrella Water Authorities should place price tags on all PSPs to ensure that the PSP operators charge a uniform tariff of 50/= per 20 litter jerry can and also have a formal operation contract with the PSP attendant that clearly stipulates the tariff to be charged to the final consumers. It is further recommended that implementation of new PSPs be carried out to increases access to clean and safe water by the vulnerable poor. Performance Indicator 42: % of Water Authorities that submit according to reporting requirements Reporting is a legal requirement stipulated in the Performance Contract with respective Water Authorities. The Water Authorities are required to submit reports on operational and financial parameters. This is the basis for regulation of their performance with a view of improving management and operations services provided by the respective Water Authorities. The performance reports from the Umbrella Authorities and Local Government (LG) were provided in digital format through the web-based Utility Performance Monitoring and Information System (UPMIS). NWSC’s quarterly and annual performance reports were also received as required. For more effective performance analysis, timely reporting by NWSC it is recommended that the process of integrating NWSC into UPMIS should be expedited. The percentage of Water Authorities that submit according to the reporting requirements is calculated as; ‘Number of gazetted water schemes with published performance divided by total number of gazetted schemes’. Of the 498 gazetted schemes (Umbrellas and LG) 329 published performance reports. The performance achieved was 66% which was due to the numerous schemes gazetted to Umbrellas and not yet taken over. During the reporting period, all the 258 schemes gazetted to NWSC submitted/ published performance reports.
6.3 Performance of Umbrella Water Authorities with regard to Performance Contract
The 6 (six) Umbrella Water Authorities of Central, Eastern, Northern, Karamoja, South-Western and
Mid-Western entered into 3-year Performance Contracts (PCs) with the Ministry of Water and
Environment in July 2019. The PCs stipulated the roles, rights and obligations as well as performance
targets of the respective Water Authorities and provided a framework within which they can
contribute to the overall National Water Sector goals. Financial Year 2019/20 was therefore the first
year of implementation of the Umbrella PCs. The ministry of Water and Environment through the
Water Utility Regulation Department conducted a performance assessment of Umbrella Water
Authorities in relation to PC targets and the findings on Key Performance Indicators are presented
below:
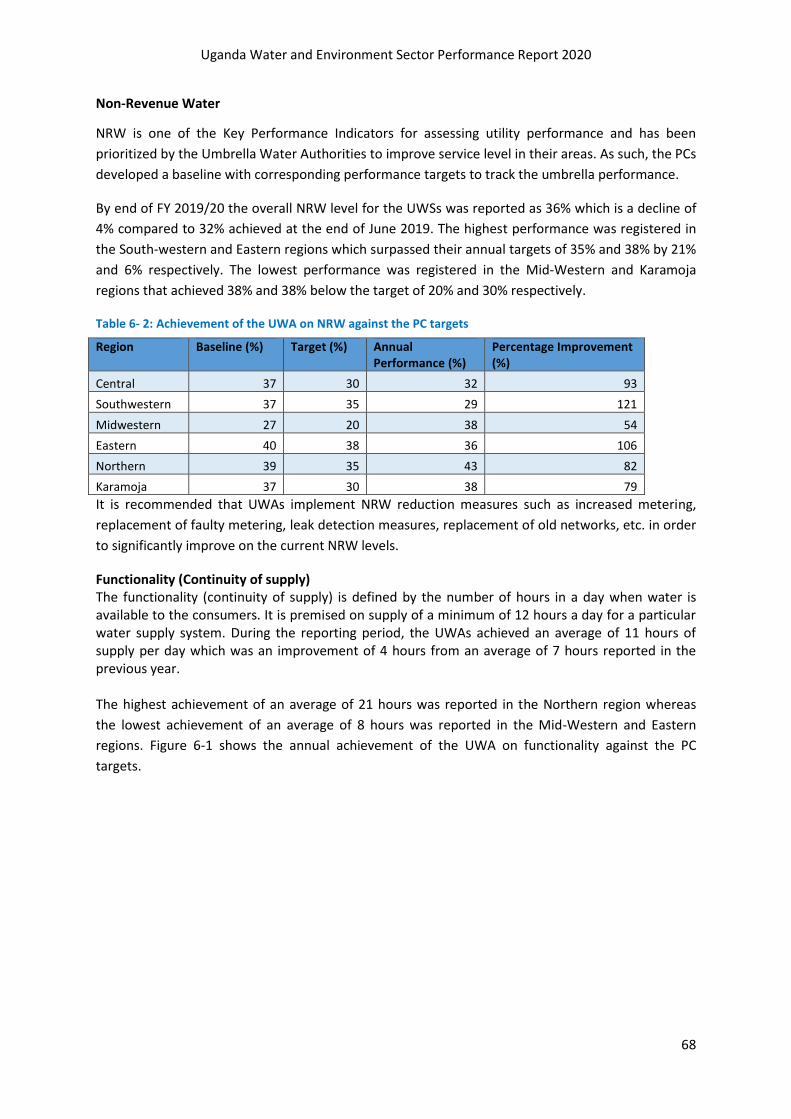
Uganda Water and Environment Sector Performance Report 2020
68
Non-Revenue Water
NRW is one of the Key Performance Indicators for assessing utility performance and has been
prioritized by the Umbrella Water Authorities to improve service level in their areas. As such, the PCs
developed a baseline with corresponding performance targets to track the umbrella performance.
By end of FY 2019/20 the overall NRW level for the UWSs was reported as 36% which is a decline of
4% compared to 32% achieved at the end of June 2019. The highest performance was registered in
the South-western and Eastern regions which surpassed their annual targets of 35% and 38% by 21%
and 6% respectively. The lowest performance was registered in the Mid-Western and Karamoja
regions that achieved 38% and 38% below the target of 20% and 30% respectively.
Table 6- 2: Achievement of the UWA on NRW against the PC targets
Region Baseline (%) Target (%) Annual Performance (%)
Percentage Improvement (%)
Central 37 30 32 93
Southwestern 37 35 29 121
Midwestern 27 20 38 54
Eastern 40 38 36 106
Northern 39 35 43 82
Karamoja 37 30 38 79
It is recommended that UWAs implement NRW reduction measures such as increased metering,
replacement of faulty metering, leak detection measures, replacement of old networks, etc. in order
to significantly improve on the current NRW levels.
Functionality (Continuity of supply) The functionality (continuity of supply) is defined by the number of hours in a day when water is available to the consumers. It is premised on supply of a minimum of 12 hours a day for a particular water supply system. During the reporting period, the UWAs achieved an average of 11 hours of supply per day which was an improvement of 4 hours from an average of 7 hours reported in the previous year. The highest achievement of an average of 21 hours was reported in the Northern region whereas
the lowest achievement of an average of 8 hours was reported in the Mid-Western and Eastern
regions. Figure 6-1 shows the annual achievement of the UWA on functionality against the PC
targets.
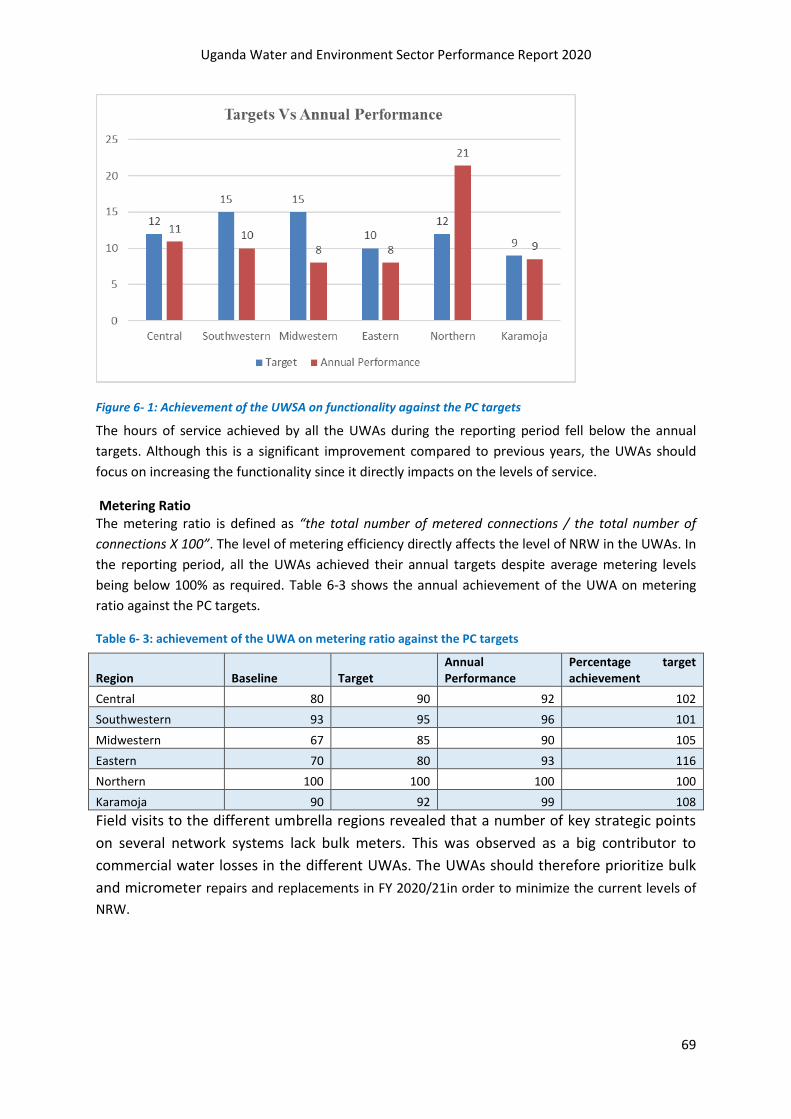
Uganda Water and Environment Sector Performance Report 2020
69
Figure 6- 1: Achievement of the UWSA on functionality against the PC targets
The hours of service achieved by all the UWAs during the reporting period fell below the annual
targets. Although this is a significant improvement compared to previous years, the UWAs should
focus on increasing the functionality since it directly impacts on the levels of service.
Metering Ratio The metering ratio is defined as “the total number of metered connections / the total number of
connections X 100”. The level of metering efficiency directly affects the level of NRW in the UWAs. In
the reporting period, all the UWAs achieved their annual targets despite average metering levels
being below 100% as required. Table 6-3 shows the annual achievement of the UWA on metering
ratio against the PC targets.
Table 6- 3: achievement of the UWA on metering ratio against the PC targets
Region Baseline Target Annual Performance
Percentage target achievement
Central 80 90 92 102
Southwestern 93 95 96 101
Midwestern 67 85 90 105
Eastern 70 80 93 116
Northern 100 100 100 100
Karamoja 90 92 99 108
Field visits to the different umbrella regions revealed that a number of key strategic points
on several network systems lack bulk meters. This was observed as a big contributor to
commercial water losses in the different UWAs. The UWAs should therefore prioritize bulk
and micrometer repairs and replacements in FY 2020/21in order to minimize the current levels of
NRW.
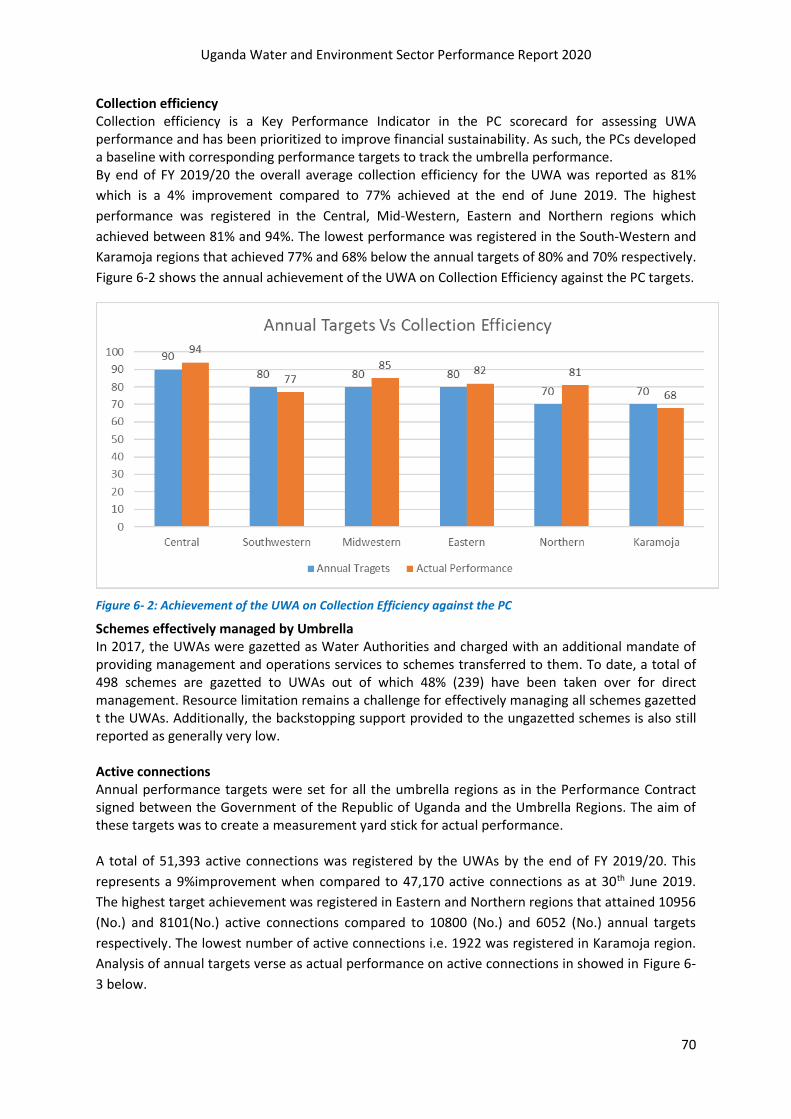
Uganda Water and Environment Sector Performance Report 2020
70
Collection efficiency Collection efficiency is a Key Performance Indicator in the PC scorecard for assessing UWA performance and has been prioritized to improve financial sustainability. As such, the PCs developed a baseline with corresponding performance targets to track the umbrella performance. By end of FY 2019/20 the overall average collection efficiency for the UWA was reported as 81%
which is a 4% improvement compared to 77% achieved at the end of June 2019. The highest
performance was registered in the Central, Mid-Western, Eastern and Northern regions which
achieved between 81% and 94%. The lowest performance was registered in the South-Western and
Karamoja regions that achieved 77% and 68% below the annual targets of 80% and 70% respectively.
Figure 6-2 shows the annual achievement of the UWA on Collection Efficiency against the PC targets.
Figure 6- 2: Achievement of the UWA on Collection Efficiency against the PC
Schemes effectively managed by Umbrella In 2017, the UWAs were gazetted as Water Authorities and charged with an additional mandate of providing management and operations services to schemes transferred to them. To date, a total of 498 schemes are gazetted to UWAs out of which 48% (239) have been taken over for direct management. Resource limitation remains a challenge for effectively managing all schemes gazetted t the UWAs. Additionally, the backstopping support provided to the ungazetted schemes is also still reported as generally very low. Active connections Annual performance targets were set for all the umbrella regions as in the Performance Contract signed between the Government of the Republic of Uganda and the Umbrella Regions. The aim of these targets was to create a measurement yard stick for actual performance. A total of 51,393 active connections was registered by the UWAs by the end of FY 2019/20. This
represents a 9%improvement when compared to 47,170 active connections as at 30th June 2019.
The highest target achievement was registered in Eastern and Northern regions that attained 10956
(No.) and 8101(No.) active connections compared to 10800 (No.) and 6052 (No.) annual targets
respectively. The lowest number of active connections i.e. 1922 was registered in Karamoja region.
Analysis of annual targets verse as actual performance on active connections in showed in Figure 6-
3 below.
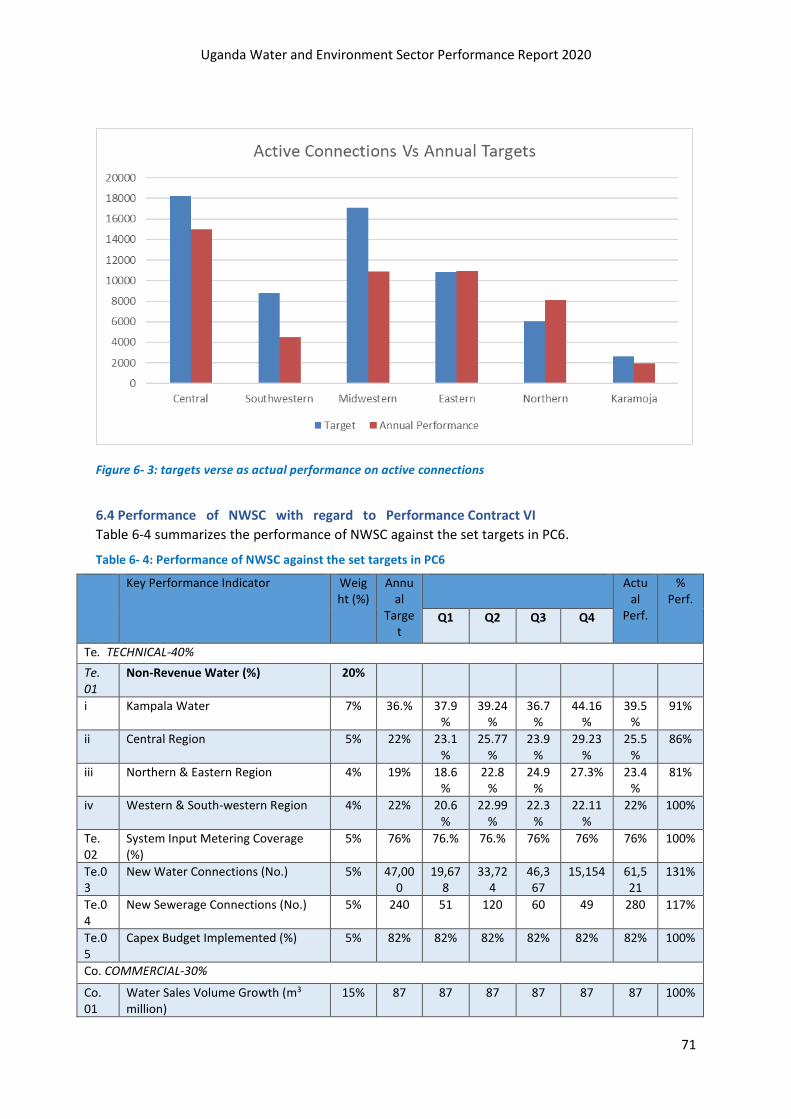
Uganda Water and Environment Sector Performance Report 2020
71
Figure 6- 3: targets verse as actual performance on active connections
6.4 Performance of NWSC with regard to Performance Contract VI
Table 6-4 summarizes the performance of NWSC against the set targets in PC6.
Table 6- 4: Performance of NWSC against the set targets in PC6
Key Performance Indicator Weight (%)
Annual
Target
Actual
Perf.
% Perf.
Q1 Q2 Q3 Q4
Te. TECHNICAL-40%
Te. 01
Non-Revenue Water (%) 20%
i Kampala Water 7% 36.% 37.9%
39.24%
36.7%
44.16%
39.5%
91%
ii Central Region 5% 22% 23.1%
25.77%
23.9%
29.23%
25.5%
86%
iii Northern & Eastern Region 4% 19% 18.6%
22.8%
24.9%
27.3% 23.4%
81%
iv Western & South-western Region 4% 22% 20.6%
22.99%
22.3%
22.11%
22% 100%
Te. 02
System Input Metering Coverage (%)
5% 76% 76.% 76.% 76% 76% 76% 100%
Te.03
New Water Connections (No.) 5% 47,000
19,678
33,724
46,367
15,154 61,521
131%
Te.04
New Sewerage Connections (No.) 5% 240 51 120 60 49 280 117%
Te.05
Capex Budget Implemented (%) 5% 82% 82% 82% 82% 82% 82% 100%
Co. COMMERCIAL-30%
Co. 01
Water Sales Volume Growth (m3 million)
15% 87 87 87 87 87 87 100%
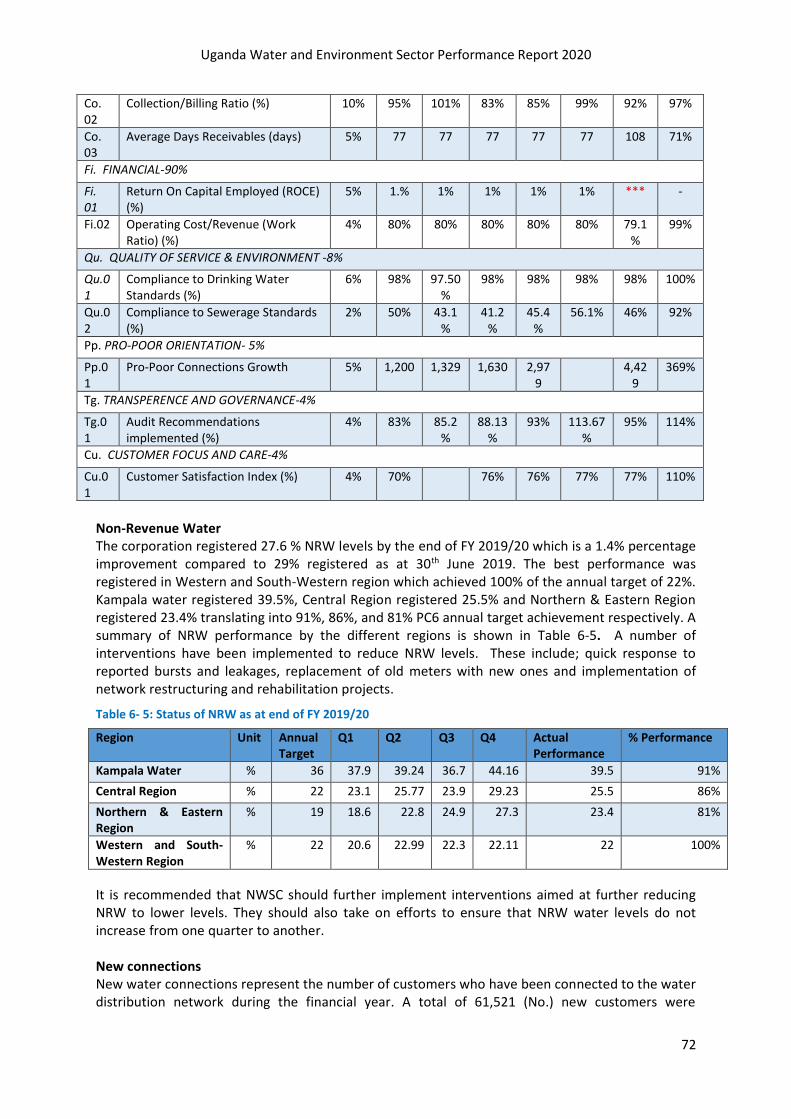
Uganda Water and Environment Sector Performance Report 2020
72
Co. 02
Collection/Billing Ratio (%) 10% 95% 101% 83% 85% 99% 92% 97%
Co. 03
Average Days Receivables (days) 5% 77 77 77 77 77 108 71%
Fi. FINANCIAL-90%
Fi. 01
Return On Capital Employed (ROCE) (%)
5% 1.% 1% 1% 1% 1% *** -
Fi.02 Operating Cost/Revenue (Work Ratio) (%)
4% 80% 80% 80% 80% 80% 79.1%
99%
Qu. QUALITY OF SERVICE & ENVIRONMENT -8%
Qu.01
Compliance to Drinking Water Standards (%)
6% 98% 97.50%
98% 98% 98% 98% 100%
Qu.02
Compliance to Sewerage Standards (%)
2% 50% 43.1%
41.2%
45.4%
56.1% 46% 92%
Pp. PRO-POOR ORIENTATION- 5%
Pp.01
Pro-Poor Connections Growth 5% 1,200 1,329 1,630 2,979
4,429
369%
Tg. TRANSPERENCE AND GOVERNANCE-4%
Tg.01
Audit Recommendations implemented (%)
4% 83% 85.2%
88.13%
93% 113.67%
95% 114%
Cu. CUSTOMER FOCUS AND CARE-4%
Cu.01
Customer Satisfaction Index (%) 4% 70% 76% 76% 77% 77% 110%
Non-Revenue Water The corporation registered 27.6 % NRW levels by the end of FY 2019/20 which is a 1.4% percentage improvement compared to 29% registered as at 30th June 2019. The best performance was registered in Western and South-Western region which achieved 100% of the annual target of 22%. Kampala water registered 39.5%, Central Region registered 25.5% and Northern & Eastern Region registered 23.4% translating into 91%, 86%, and 81% PC6 annual target achievement respectively. A summary of NRW performance by the different regions is shown in Table 6-5. A number of interventions have been implemented to reduce NRW levels. These include; quick response to reported bursts and leakages, replacement of old meters with new ones and implementation of network restructuring and rehabilitation projects.
Table 6- 5: Status of NRW as at end of FY 2019/20
Region Unit Annual Target
Q1 Q2 Q3 Q4 Actual Performance
% Performance
Kampala Water % 36 37.9 39.24 36.7 44.16 39.5 91%
Central Region % 22 23.1 25.77 23.9 29.23 25.5 86%
Northern & Eastern Region
% 19 18.6 22.8 24.9 27.3 23.4 81%
Western and South-Western Region
% 22 20.6 22.99 22.3 22.11 22 100%
It is recommended that NWSC should further implement interventions aimed at further reducing NRW to lower levels. They should also take on efforts to ensure that NRW water levels do not increase from one quarter to another. New connections New water connections represent the number of customers who have been connected to the water distribution network during the financial year. A total of 61,521 (No.) new customers were

Uganda Water and Environment Sector Performance Report 2020
73
connected to the system against an annual target of 47,000 (No.), which is 131% target achievement. This performance represents a decline of 11% compared to 69,215 new connections in the FY 2018/19. The customer base has now increased from 659,157 as at 30th June 2019 to 720,678 as at 30th June 2020. Figure 6-4 below shows a summary of annual targets verse as new connections achieved. The Corporations carried out a number of interventions like implementation of SCAP 100, taking over new towns and sensitizing communities about the need to use safe water sources.
Figure 6- 4: Achievements of connection target
Compliance to drinking water standards Compliance to drinking water standards is an indicator for the Biological quality, Color, Turbidity, Chlorine residual, pH, Electrical conductivity, Alkalinity and Hardness. The annual target for the compliance to National Water Standards for drinking water is 98%. Apart from the 97% compliance level achieved in quarter one, the Corporation attained 100% target achievement in compliance to National Water Standards for drinking water from quarter two to quarter four, FY 2019/20. Table 6- 6: Status of Compliance to Drinking Water Standards
KPI Unit Annual Target (2019/2020) Q1 Q2 Q3 Q4
Actual Performance
% Performance
COMPLIANCE % 98 97.5 98 98 98 98 100
6.5 Membership and collaboration with ESAWAS
The Water Utility Regulation Department (WURD) was ratified as an Associate Members of The Eastern and Southern Africa Water and Sanitation Regulators’ Association (ESAWAS) in an extra ordinary meeting held in Dar es salaam, Tanzania, March 2019. The Association was formed in 2009 with two-fold objectives including Capacity Building and Information Sharing and Regional Regulatory Cooperation to identify and encourage the adoption of best practices to improve the effectiveness of WSS regulation in the region. ESAWAS currently has 10 Members including Burundi, Kenya, Lesotho, Malawi, Mozambique, Rwanda, Tanzania, Uganda, Zambia and Zanzibar.
The department has realized the following achievements during the period: Strengthening Urban Sanitation Regulation Development of Citywide Inclusive Sanitation Service Assessment and Planning Tool (CWIS SAP) tool with technical support from Anthena Infonomics and Agua consult funded by BMGF. The
Uganda Water and Environment Sector Performance Report 2020
74
department is piloting the tool, alongside WASREB- Kenya, NWASCO-Zambia and EWURA-Tanzania. The tool is being piloted under collaborated efforts of National water and sewerage co-operation (NWSC) for sewered and KCCA for non-sewered within the jurisdiction of Kampala Capital city Authority boundaries. The plan will be to roll out the tool and integrate in sanitation planning for the recently created cities in the country.
The major objective of the CWIS SAP tool is to help decision-makers to analyse the outcomes of
different sanitation interventions or investments along the dimensions of equity, financial
sustainability and safety. This will therefore aid in evaluating a variety of options and prioritizing
those that cost-effectively expand access to safely managed sanitation along the entire sanitation
chain. It is hoped that if well institutionalised, the tool will aid in analysis of outcomes of different
sanitation interventions or investments along the dimensions of equity, financial sustainability and
safety. This will also be rolled and integrated in the planning of the newly created cities.
To further strengthen urban sanitation regulation in the country, a concept note was shared BMGF
and has shown willingness to fund. The concept note covers aspects of operationalization of the
sanitation regulation framework across the different stakeholders, develop appropriate tools and
instruments for sanitation regulation and support the implementation of developed operation and
maintenance guidelines for faecal sludge treatment plants and monitoring compliance to set
guidelines.
Regional bench marking Bench-marking of NWSC with other regional water utilities in East and Southern Africa. The Association conducted fourth bench marking analysis of the performance of water and sewerage Utilities in nine countries of the Eastern and Southern African region for the period 2015/2016 and 2016/2017. The largest or single Utilities in each country selected for benchmarking were National Water and Sewerage Corporation (NWSC) of Uganda; Nairobi City Water and Sewerage Company (NCW&SC) of Kenya; Lusaka Water and Sewerage Company (LWSC) of Zambia; Dar Es Salaam Water and Sewerage Corporation (DAWASCO) of Tanzania; Águas da Região de Maputo (AdeM) of Mozambique; Water and Sewerage Company (WASCO) of Lesotho; Water and Sanitation Corporation Ltd (WASAC) of Rwanda; Régie de Production et de Distribution d'Eau et d'électricité (REGIDESO) of Burundi; and Zanzibar Water Authority (ZAWA) of Zanzibar.
The analysis of the performance was done against ten key performance indicators grouped according to similarity in the components of Quality of Service, Economic Efficiency and Operational Sustainability. Finally, the performance of the Utilities was ranked using an integrated measurement of performance in the aforementioned components, called the Water Utility Performance Index. The best performing KPI was Staff/1,000 W&S Connections where all the Utilities met the acceptable benchmark. The worst performing KPIs remained the same over three years, which were Sewerage Coverage and NRW where only one Utility met the acceptable benchmark. The report recommends the need for innovative and pragmatic approaches that take a holistic view of service delivery, with particular emphasis on increasing access to safely managed sanitation services and reducing NRW, which have continued to be unimproved and below acceptable benchmarks.
Table 6- 7: Summary of Utility Performance

Uganda Water and Environment Sector Performance Report 2020
75
The best performing KPI was Staff/1,000 W&S Connections where all the Utilities met the acceptable benchmark. The worst performing KPIs remained the same over three years which were Sewerage Coverage and NRW where only one Utility met the acceptable benchmark.
Figure 6- 5: Overall performance of the different utilities for two years
WASAC, Rwanda emerged as the best performer in all the three components aggregated for the third year running with consistency in improvements NWSC, Uganda maintained the second position while WASCO, Lesotho moved from 6th to 3rd position and pushed NCW&SC, Kenya down to 4th position from 3rd. LWSC, Zambia moved up from 7th to 5th position which pushed AdeM, Mozambique down to 6th position from 5th. DAWASCO, Tanzania dropped from 4th to 7th position while ZAWA still trailed bottom. REGIDESO could not be ranked due to information gaps.

Uganda Water and Environment Sector Performance Report 2020
76
Non-Revenue Water Management One of the endemic challenges that water utility companies in the Eastern and Southern African region are faced with is severe water losses or more technically called, non-revenue water (NRW). The benchmarking report of 2018 produced by the Eastern and Southern Africa Water and Sanitation (ESAWAS) Regulators Association revealed a staggering NRW of 43% against a benchmark of 20%. NRW arises through a number of avenues such as leaks in the distribution networks, water thefts, non-invoicing of water distributed in the supply system, human induced errors or deliberate manipulation of billing systems and malfunction water meters. This is often coupled with a lack of strategic organizational plan and commitment to address it. The scourge negatively impacts the already stressed water supply situation that most of the region experiences, with utilities losing millions of dollars in revenue while consumers end up paying for inefficiencies through increased water tariffs and reduced hours of supply. As a consequence, service provision deteriorates, becomes unaffordable and service extensions hindered, especially where the majority of the consumers are poor, forcing them to resort to other sources which may be unsafe. NRW also has a direct correlation to climate change as resultant over-exploitation of the resource in an effort to meet demand, increases the carbon footprint through energy consumption during water production phases right through to waste generation, treatment and disposal. Thus, it becomes
imperative to implement interventions that aim at reducing NRW as an economic alternative to exploiting new water sources and expanding water production facilities whose investment requirements may be astronomical. The department participated in the non-revenue water (NRW) case study methodology with support from Climate Resilient Infrastructure Development Facility (CRIDF), a UK funded (DFID) programme which supports Southern African Development Community (SADC) Member States to manage water resources better and provide long-term water solutions to improve the lives of the poor and vulnerable in Southern Africa, embarked on a process of identifying potential NRW case studies where industry best practices could be drawn for possible replication in member countries. This was conducted in three utilities in Moshi -Tanzania, Nyeri -Kenya and Maseru in Lesotho. Detailed investigations of how NRW was being managed in these three sites showed a combination of measures that cut across organization culture to community participation. This will form a basis for development of guidelines for NRW management across member countries.
6.6 Urban Water O&M Conditional Grant for FY2019/20
In FY 2019/2020, 12 Water Authorities (6 Umbrellas and 6 Small Towns) were supported by the Government of Uganda inform of conditional grant to primarily address O&M Challenges and increasing access to safe water. Umbrellas Authorities received 2.4Billion out of the total subsidy allocated (2.5Billion), whereas other Water Authorities (Small Towns) received 0.1Billion. In the reporting period, a Budget Performance of 100% from all the 12 Water Authorities was reported as shown in the graph below.

Uganda Water and Environment Sector Performance Report 2020
77
0
100,000
200,000
300,000
400,000
500,000
Subsidy Allocation per Water Authority in FY 2019/2020
Allocation Received
Figure 6- 6: Subsidy allocation per UWSA
In the reporting period, conditional grant contributed to an increase in access to safe water by an additional 174,656 people as shown in table 6-8 below.
Table 6- 8: Additional population served with safe water by Umbrella Authority
Water Authority House
Connections
PSP
Connections
Total Connections Increase in
Population Served
1. Central Umbrella 1,041 85 1,126 25,328
2. Northern Umbrella 990 206 1,196 49,120
3. Eastern Umbrella 2,680 20 2,700 25,440
4. Mid-West Umbrella 2,238 15 2,253 20,904
5. South-West Umbrella 2,567 106 2,673 41,736
6. Karamoja Umbrella 371 1 372 3,168
7. Other Water Authorities 120 40 160 8,960
Total 10,007 473 7,807 174,656
Assumption: * 1 Household Connection serves 8 persons
* 1 PSP Connection serves 200 persons
However, the increase in the number of towns being supported by the Umbrella Water Authorities has ensured that the impact of subsidy progressively deteriorates. In addition, there being no clear criteria for determining the impact created by conditional grant in other intervention areas such as energy subsidy and system specific due to limitations in quantifying them, has made impact assessments very challenging. Furthermore, the Conditional grant allocation criteria needs to be reviewed. For easy monitoring of subsidy utilization and reporting (Subsidy Management), the Allocation should majorly focus on a small number of Water Authorities (Umbrella Water Authorities) rather than other Small Towns.
6.7 Conclusion and Way Forward
• There is need to review the pro-poor strategy to harmonize the water supply operations with
service to the poor. Service providers should be required to publish tariff regimes on the PSPs
and also have formal operation contract with the PSP attendants to ensure that the consumers
pay for the water at a price less than or equal to the house connection tariff.

Uganda Water and Environment Sector Performance Report 2020
78
• Timely submission of reports by gazetted Water Authorities remains a challenge to WURD which
constrains the validation of performance data.
• NWSC and UWAs have generally superseded their set annual targets in the Performance
Contracts. It is strongly recommended that these targets be reviewed with a view of
harmonizing the targets with the improved capacities.
• The Utility Performance Monitoring and Information System is going to be updated and
upgraded to improve the reporting by the UWAs. To also improve reporting, data entry into
UPMIS should be done by the operating areas (at the scheme level) from which it is derived
instead of routing it through UWA Headquarters as this has been found to a source of errors
which cannot be verified by the operating areas.
• It is recommended, in the water subsector, that the criteria for allocating conditional grant be
reviewed and streamlined to make it easy to budget, allocate and monitor impact. In addition,
clear guidelines need to be established for the subsidy utilization by the UWAs to guide the
implementation of activities.

Uganda Water and Environment Sector Performance Report 2020
79
7.SANITATION AND HYGIENE
7.1 Introduction
Safely managed sanitation and hygiene services provide an essential building block in protecting human health and controlling spread of diarrheal diseases and other infections. The United Nations recognizes access to sanitation as a basic human right and to amplify this, the formulators of the Sustainable Development Goals SDG) deemed it fit to accord the sanitation and hygiene sub sector its own discrete and separate target – SDG 6.2, with its indicator to achieve universal access to safely managed sanitation and hygiene and to end open defecation, paying special attention to the needs of women and girls and the most vulnerable. In addition to promoting healthy lives and wellbeing, progress on access to SDG 6.2 also advances many other SDGs such as ending poverty and hunger, education and economic outcomes. Uganda still faces an enormous challenge in ensuring universal access to safely managed sanitation and hygiene services at community level, in public places as well as institutions; despite the existing institutional, legal and policy framework necessary for improved hygiene and sanitation promotion. This chapter highlights the sanitation and hygiene improvement efforts by Government of Uganda through the District Sanitation and Hygiene Conditional Grant (DSHCG) and the District Water and Sanitation Conditional Development Grant from Ministry of Water and Environment (MWE) and the Uganda Sanitation Fund (USF) from the Ministry of Health; contributions from Civil Society Organizations (CSOs), other development agencies like UNICEF and USAID through the Uganda Sanitation for Health Activity (USHA).
7.2 Rural Sanitation
7.2.1 Programs /Projects and Initiatives
Hygiene and sanitation activities in rural areas are implemented by Local Governments mainly using
the conditional grants, as well as through centrally managed projects. During FY 2019/20, the
sanitation sub-sector leveraged resources and registered achievements as highlighted below;
7.2.1.1 District Water and Sanitation Conditional Development Grant-DWSCDG
The District Water and Sanitation Conditional Development Grant is disbursed to the District Local Governments to support development of water and sanitation infrastructure. The MWE issues guidelines to districts on an annual basis to inform the planning and utilisation of this grant. In the FY 2019/20, an estimated UGX 1.96 Billion was spent on construction of sanitation and hygiene facilities in the District Local Governments. A total of 50 public sanitation facilities were constructed across the entire country, a decline from last year’s 70 sanitation facilities. This decline is mainly attributed to reprioritization of the DWSCDG. These facilities were mainly Ventilated Improved Pit Latrines (VIPs) constructed in public places such as markets and trading centres. In line with the Water Source Protection Guidelines and the principle of the safe water chain, part of this grant is used by LGs to promote hygiene and sanitation in communities that are planned to benefit from new water sources as well as conduct water quality testing for new and existing water sources.
7.2.1.2 District Sanitation and Hygiene Conditional Grant-DSHCG
The DSHCG has been in existence for the last 9 years with Government disbursing a total of UGX 2Bn annually to all districts except those benefitting from the Uganda Sanitation Fund. In FY 2019/20, a total of 101 districts benefitted from the DSHCG. At the inception of this grant, districts were receiving between UGX 21-23 million but with creation of new districts, this amount has continued

Uganda Water and Environment Sector Performance Report 2020
80
to reduce to a current less than UGX 20 million shillings per year. This notwithstanding, remarkable achievements have been realised since the introduction of the grant as highlighted in this report. The grant is was planned to reach a total of 2020 villages in FY 2019/20. The main approaches used for hygiene and sanitation promotion were Community Led Total Sanitation-CLTS and Home Improvement Campaigns-HIC. Out of the 2020 villages reached, only 460 (23 %) villages became Open Defecation Free-ODF during the reporting period. This was attributed to limited follow up as a result of movement restrictions due to COVID-19. Over the last 5 years, a total of 2,239 villages have been declared ODF and have gained access to household sanitation.
7.2.1.3 Uganda Sanitation Fund
The Uganda Sanitation Fund (USF) is a project implemented under the Ministry of Health as an Executing Agency and a total of 44 Districts Local Governments as sub grantees. The USF is funded from the Global Sanitation Fund of the Water Supply and Sanitation Collaborative Council with counterpart funding from Government of Uganda and has been in existence for the last 9 years. The total project amount is USD 12.8M and during FY 2019/20, approximately USD 700,000 was disbursed targeting 2,271 villages. Out of these, 1,021 (45%) villages were declared ODF. An additional 623,016 people are now living in ODF communities while 445,560 additional people gained access to improved household toilets during the reporting period. The USF program shall be closed in December 2020.
7.2.1.4 National Hand Washing Initiative (NHWI)
The National Hand Washing Initiative (NHWI) is a government led initiative that was conceived by
the National Sanitation Working Group in 2006 with the aim of championing the national hand
washing with soap campaign in Uganda. The secretariat of the NHWI is currently hosted at the MWE
and basically has 3 functions of capacity building of sector players and partners on hand washing
with soap; coordination and alignment of the national hand washing campaign; learning and
knowledge management on hand washing with soap.
During the FY 2019/20 the NHWI trained a total of 76 Local Government staff as trainers in aspects
of hand washing with soap, behavioural change communication among others; who later trained
100 Hand Washing Ambassadors from the districts of Iganga and Kamuli. Out of this training it was
realised district staff often require to be reignited and refreshed with hand washing knowledge and
skills to keep the campaign running and active in the districts.
Other activities done in these districts include school hygiene competitions which had over 10,000
primary school pupils reached with hand hygiene messages through edutainment; and school essay
writing competitions in which 158 girls and 106 boys participated. These involved all government
primary schools in these two districts and the adjudicators were tutors from Bishop Willis Primary
Teachers’ college, Iganga.
In line with coordination and alignment of national hand washing campaign, several multi
stakeholder meetings have been conducted with sector players from government (MOH, MWE,
MOES), CSOs, and private sector to discuss the strategic positioning and integration of hand washing
with soap in development programs and projects including resource mobilization. Key among the
outcomes of such meetings was the revision of the National Hand Washing with soap Strategy,
which assignment is ongoing and will be completed in October 2020.
Uganda Water and Environment Sector Performance Report 2020
81
7.2.1.5 COVID-19 Response
The emergence of the COVID-19 pandemic further underlined the importance of hand washing with
soap in disease prevention and control. Hand washing with soap was identified by the WHO as a key
preventive measure to minimize the transmission of the Corona Virus in addition to other measures
like social distancing.
The NHWI participated in COVID-19 response in many ways including mobilizing resources from CSOs and private sector to support hand washing interventions. With support from the Water Supply and Sanitation Collaborative Council (WSSCC) and the International Water and Sanitation Centre (IRC), the NHWI conducted a media campaign on CBS fm, NBS television, KFM radio, Next Radio and Online media like Watchdog. Over 2 million people in greater Kampala Metropolitan Area were reached with hand washing with soap messages. Under the same support from WSSCC/IRC and additional support from World Vision and UNILEVER limited, the NHWI worked with Wakiso District Local Government and Makindye Sabagabo Municipality to provide soap, hand washing facilities, branded stickers and masks to vulnerable people in Mirembe Zone in Masajja, Makindye Sabagabo Municipality. Other vulnerable and high-risk groups provided with soap, hand washing facilities, stickers and masks included traffic police officers, Community Liaison Police officers and health workers in Wakiso and Kampala. A total of 2000 people have so far benefitted from this support. The NHWI also played a key role in promotion of workplace safety against COVID -19 through active promotion and sensitization of workers at the MWE on hand washing with soap, and provision of branded stickers and masks.
7.2.1.6 UNICEF interventions
During FY 2019/20, UNICEF supported a total of 24 districts in Karamoja, Rwenzori and West Nile regions in their efforts to increase access to basic sanitation as well as eliminate open defecation. These districts include Amudat, Kaabong, Moroto, Kotido, Napak, Nakapiripirit, Arua, Moyo, Adjumani, Kitgum, Lamwo, Pader, Nebbi, Yumbe, Kiryandongo, Isingiro, Kamwenge, Kakumiro, Rubanda, Rubirizi, Ntungamo, Kabale Gomba, Kagadi. Under this support, a total of 1807 villages were triggered and 542,100 people impacted by the project activities. A total of 111 institutional sanitation facilities were constructed; 69 facilities in schools in the districts of Kikuube, Isingiro, Arua, Adjumani, Moyo, Moroto, Napak and 42 facilities in healthcare facilities in the districts of Ntoroko, Bundibugyo, Kasese, Kisoro. These facilities are envisaged to serve a total of 15,360 persons.
7.2.1.7 Uganda Sanitation for Health Activity (USHA)
The Uganda Sanitation for Health Activity (USHA) is a 32million USD project financed by USAID in Uganda with the goal of increasing access to improved and sustainable water, sanitation, and hygiene (WASH) services, ultimately leading to improved health and nutrition status in focus areas and population groups. The USHA project commenced in January 2018 and will run for a period of five years. USAID contracted Tetra Tech ARD to implement USHA project in collaboration with a cadre of distinguished nongovernmental organizations, SNV USA, BRAC, and FSG; and a Ugandan small-business partner, Sanitation Solutions Group (SSG). In addition, USHA collaborates with Rotary International to increase water services at schools, health care facilities and in communities as part of the USAID-Rotary International Global Development Alliance. USHA focuses on achieving three interdependent Outputs: 1) Increased household access to sanitation and water services; 2) Key hygiene behaviors at home, school, and health facilities adopted and expanded; and, 3) Strengthened district water and sanitation governance for sustainable services.

Uganda Water and Environment Sector Performance Report 2020
82
By June 2020, USHA had constructed 100 VIP latrine stances in the project districts and supported the development of the National Sanitation Marketing Guidelines. Through the USHA project, 153,415 people have gained access to basic sanitation while basic sanitation; 33 institutions have gained access to safely managed sanitation while 2,188 households have gained access to hand washing facilities with soap. Additionally, 25 enterprises have been supported to offer latrine services and products; and 3 FSM enterprises and 10 urban councils have been supported to increase access to safely managed sanitation services.
1.2.1.8 Centrally managed projects
Water Supply and Sanitation Projects Centrally managed Water Supply and Sanitation Projects have a Sanitation and Hygiene component that targets both promotion of improved sanitation and hygiene practices as well as construction of Public and Institutional Sanitation facilities in the project area. During the reporting period, hygiene and sanitation achievements were registered under the projects of Bukedea Gravity Flow System-GFS, Lirima GFS, Kahama II Water Supply system - WSS, Lukalu - Kabasanda WSS, Shuuku Masyoro GFS, Nyabuhikye GFS, and Orom WSS. A Highway Public Sanitation and Hygiene facility is also under construction and is estimated to be completed in December 2020. Table 7-1 summarises the achievements in the above projects.
Table 7- 1: Hygiene and sanitation promotion under the six-water supply and sanitation projects
implemented in FY 2019/20
ACTIVITY Sanitation facilities constructed
No. of villages targeted
No. of villages covered
No. of villages with improved Sanitation (100%)
No. of model villages
PROJECT
Bukedea GFS Three 6-stance gender segregated water borne toilets
193 193 81 15
Lirima GFS One 22-stance gender segregated waterborne toilet
179 179 52 villages 10
Shuuku WSS Two 8-stance lined institutional VIP latrines Two 4-stance public waterborne toilets
96 96 5 villages with overall latrine coverage in the project area is at 96%
05
Nyabuhikye GFS One 10-stance gender segregated sanitation facility with a Menstrual Hygiene Management room
34 34 4 villages with overall latrine coverage in the project area at 95%
04
Lukalu-Kabasanda WSS
3 gender segregated water borne toilets
13 15 10 0
Kahama Three 6-stance gender segregated sanitation facilities
43 43 Activities still ongoing
Activities still ongoing
Orom Water Supply and Sanitation System
Construction of three 10-stance gender segregated institutional lined VIP latrines with MHM rooms and incinerator has commenced
45 Activities still ongoing
Activities still ongoing

Uganda Water and Environment Sector Performance Report 2020
83
Highway Public Sanitation and Hygiene Project
Open defecation is prevalent among the travellers along the various highways in the whole country. This vice has been attributed to limited access to public sanitation and hygiene facilities along the different highways. Ministry of Water and Environment in its efforts to address poor sanitation along the major highways is constructing a highway public sanitation and hygiene facility consisting of a waterborne18-stalls sanitation facility with bathroom for both men and women in the district of Kiruhura. The sanitation facility will be a multi-purpose complex having auxiliary services such as restaurant, pharmacy, parking and a mini grocery and currently, construction works are estimated at 72.4% completion. This project is part of a wider sector plan to construct at least 30 similar facilities by 2030.
Figure 7- 1: Construction of public sanitation facility along Kampala – Mbarara road at Kiruhura
7.3 Urban Sanitation and Hygiene
Hygiene and Sanitation in urban areas is achieved through interventions by Urban Councils (Municipalities and Town Councils); National Water and Sewerage Corporation (NWSC) mainly in large towns, municipalities and cities; CSOs; Water and Sanitation Development Facilities and centrally managed projects that intervene in small towns and Rural Growth Centres. The priority focus for the urban sanitation sub sector is to improve access to public sanitation and sewerage services in urban centres with a goal of controlling pollution of water supplies and subsequently contributing to improvement of socio-economic, environmental and health conditions of the people living in the urban areas. Other efforts have been directed towards improving the Feacal Sludge Management (FSM) service chain to address the FSM challenges associated to onsite sanitation through; 1) Construction and sustainable operation and maintenance (O&M) of regional FS treatment plants (FSTPs) to reduce the haulage distances travelled by cesspool emptiers to dispose-off fecal sludge; 2) Reduction of the transport costs that result into high charges to the customers; and 3) Support the transportation system along the FS service chain through purchase of cesspool emptier/vacuum trucks.
During FY2019/20, a number of achievements were registered in the urban sanitation sub - sector as
highlighted below:
7.3.1 Access to Fecal Sludge Management (FSM) Services
Increase to fecal sludge management services has been achieved through construction of Fecal
Sludge Treatment Plants at various places and provision of cesspool emptier trucks as highlighted in
table 7-2 below.

Uganda Water and Environment Sector Performance Report 2020
84
Table 7- 2: Achievements in provision of FSM services
Planned Achieved Implementing Agency Remarks
03 FSTPs in Buliisa, Kagadi and Nakasongola,
Nakasongola FSTP 100% completed and is under test running
WSDF-Central O&M will be done under Umbrella of Water and Sanitation – Central
Buliisa and Kagadi FSTPs under design
05 FSTPs in Parabongo, Pabo Amuru, Yumbe and Dzaipi
Feasibility and detailed designs are ready for Parabongo, Pabo and Amuru
WSDF - North 3 Cubic meter Fecal Sludge emptier, 02 gulpers with 08 sludge barrels and 02 tricycles provided to support Operations of the Dzaipi FSTP.
Preliminary designs for Yumbe ongoing
Construction for Dzaipi completed
01 FSTP in Namayingo Detailed Engineering Designs completed
WSDF-East
09 FSTPs in Kyazanga, Kira Kanungu, Kigumba Wobulenzi, Kumi, Busia, Koboko and Rukungiri
FSTPs in Kyazanga, Kira Municipality, Kanungu, Kigumba Wobulenzi under design
MWE headquarters Construction works for Kumi, Busia, Koboko and Rukungiri FSTPs scheduled for construction 2020/21. Detailed Engineering
Designs completed for Kumi, Busia, Koboko and Rukungiri FSTPs
8.2.2 Access to improved Public Sanitation Facilities
Access to improved public sanitation facilities has been increased through construction of public toilets in small towns and RGCs as highlighted in the table 7-3 below; Table 7- 3: Achievements in improving access to Public sanitation
Planned Achieved Implementing Agency
Remarks
1 public and 3 institutional sanitation facilities at Moyo Main Market; Moyo mixed school, Padibe Primary School and Ngora Primary School.
13 stance public toilet for Moyo main market at Roofing level
WSDF-North All facilities are gender segregated. Institutional facilities have hand washing facilities, Urinal for boys, MHM room for girls, a stance for children with disability and an incinerator. In Padibe Primary School and Ngora Primary School, 2 stances were
10-stance institutional toilets in Moyo Mixed school at roofing stage
Constructions of 12-stance institutional toilets in Padibe Primary School just commenced

Uganda Water and Environment Sector Performance Report 2020
85
Construction of 12-stance institutional toilets in Ngora primary school completed.
allocated for teachers
22 water borne toilets in Kagadi, Kakunyo, Kiyindi, Butenga, Kawoko, Kikandwa, Kasambya, Kiwoko, Bamunanika, Busiika Butemba-Nalukonge and Butalangu
Kiwoko, Butalangu and Busiika are completed while the rest are still under construction.
WSDF-Central O&M will be done by the respective Town Councils.
04 gender segregated institutional lined VIP latrines in Karago TC, Lwemiyaga RGC, Bigando RGC, Nyakatonzi RGC
Construction in Karago, Bigando and Nyakatonzi is yet to commence while the facility in Lwemiyaga RGC is at 90% completion.
WSDF-South West All the institutional toilets are 10-stance each and are gender segregated.
Eight 8-stance water borne public toilets in the urban councils of Tirinyi, Luuka, Nakapipirit, Suan, Kibuku, Buwuni, Bulambuli and Kachumbala
All the 8 waterborne Public sanitation facilities are complete and in use.
WSDF-East All the 8 public toilets are water borne, gender segregated, and are being operated and maintained by the respective Town Councils
7.3.3 Other Initiatives and projects to improve urban Sanitation
7.3.3.1 Support to FSM services in refugee settlements and host communities
Uganda hosts over a million refugees mainly from DRC, South Sudan, Burundi and Rwanda in 12
border districts. In the refugee settlements across the country, refugees are allocated plots of land
to grow some food as well as construct houses and sanitation facilities. The dominant sanitation
technology in these refugee settlements are traditional pit latrines and from time to time, these pits
fill up and require construction of new ones yet there is limited land allocated to every family. The
schools and other institutions have drainable technologies like water borne facilities and line VIP
latrines. However, access to emptying services and fecal sludge treatment plants is limited and often
times, manual emptying and subsequent indiscriminate disposal of sludge into the environment is a
common practice.
To address these challenges, the MWE constructed a FSTP in Dzaipi, provided a cesspool truck, 2
tricycles with 2no gulping equipment and 8 sludge barrels to support the fecal sludge service chain.
Given the long distances between the beneficiary towns/settlements and the location of the FSTP in
Dzaipi, MWE through WSDF North has located 4 Sludge holding tanks in Ayillo 1, Ayillo 2, Nyumanzi
and Pagirinya refugee settlements. Fecal Sludge will be transported using the tricycles to these
holding tanks which will thereafter be emptied by the cesspool truck and sludge transported to the
FSTP in Dzaipi for treatment. FSTP constructed in Dzaipi, cesspool trucks and the tricycles with
gulpers provided by MWE
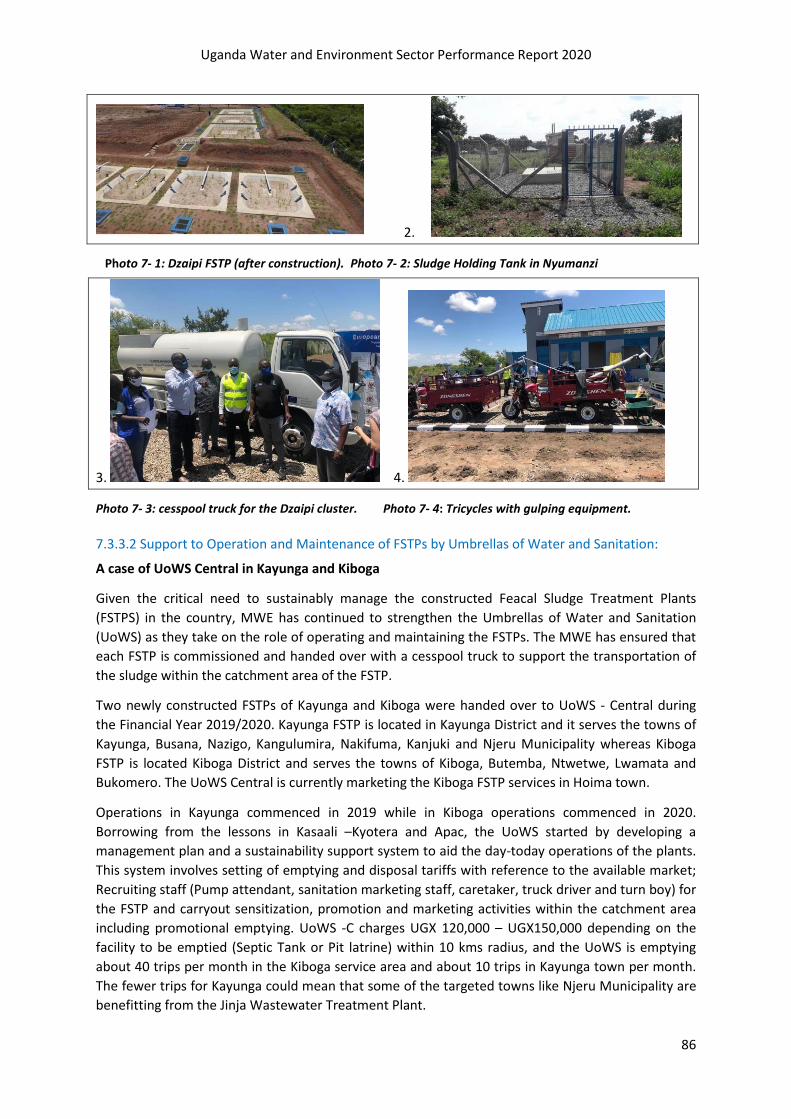
Uganda Water and Environment Sector Performance Report 2020
86
2.
Photo 7- 1: Dzaipi FSTP (after construction). Photo 7- 2: Sludge Holding Tank in Nyumanzi
3. 4.
Photo 7- 3: cesspool truck for the Dzaipi cluster. Photo 7- 4: Tricycles with gulping equipment.
7.3.3.2 Support to Operation and Maintenance of FSTPs by Umbrellas of Water and Sanitation:
A case of UoWS Central in Kayunga and Kiboga
Given the critical need to sustainably manage the constructed Feacal Sludge Treatment Plants
(FSTPS) in the country, MWE has continued to strengthen the Umbrellas of Water and Sanitation
(UoWS) as they take on the role of operating and maintaining the FSTPs. The MWE has ensured that
each FSTP is commissioned and handed over with a cesspool truck to support the transportation of
the sludge within the catchment area of the FSTP.
Two newly constructed FSTPs of Kayunga and Kiboga were handed over to UoWS - Central during
the Financial Year 2019/2020. Kayunga FSTP is located in Kayunga District and it serves the towns of
Kayunga, Busana, Nazigo, Kangulumira, Nakifuma, Kanjuki and Njeru Municipality whereas Kiboga
FSTP is located Kiboga District and serves the towns of Kiboga, Butemba, Ntwetwe, Lwamata and
Bukomero. The UoWS Central is currently marketing the Kiboga FSTP services in Hoima town.
Operations in Kayunga commenced in 2019 while in Kiboga operations commenced in 2020.
Borrowing from the lessons in Kasaali –Kyotera and Apac, the UoWS started by developing a
management plan and a sustainability support system to aid the day-today operations of the plants.
This system involves setting of emptying and disposal tariffs with reference to the available market;
Recruiting staff (Pump attendant, sanitation marketing staff, caretaker, truck driver and turn boy) for
the FSTP and carryout sensitization, promotion and marketing activities within the catchment area
including promotional emptying. UoWS -C charges UGX 120,000 – UGX150,000 depending on the
facility to be emptied (Septic Tank or Pit latrine) within 10 kms radius, and the UoWS is emptying
about 40 trips per month in the Kiboga service area and about 10 trips in Kayunga town per month.
The fewer trips for Kayunga could mean that some of the targeted towns like Njeru Municipality are
benefitting from the Jinja Wastewater Treatment Plant.
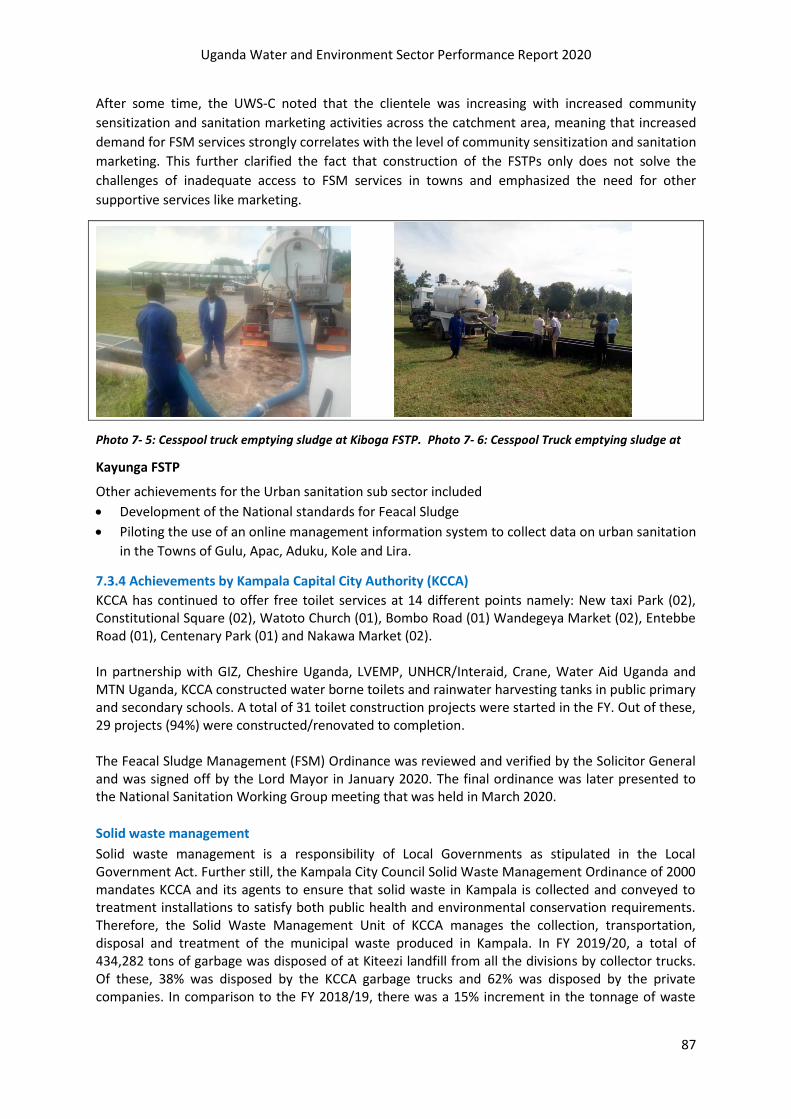
Uganda Water and Environment Sector Performance Report 2020
87
After some time, the UWS-C noted that the clientele was increasing with increased community
sensitization and sanitation marketing activities across the catchment area, meaning that increased
demand for FSM services strongly correlates with the level of community sensitization and sanitation
marketing. This further clarified the fact that construction of the FSTPs only does not solve the
challenges of inadequate access to FSM services in towns and emphasized the need for other
supportive services like marketing.
Photo 7- 5: Cesspool truck emptying sludge at Kiboga FSTP. Photo 7- 6: Cesspool Truck emptying sludge at
Kayunga FSTP
Other achievements for the Urban sanitation sub sector included
• Development of the National standards for Feacal Sludge
• Piloting the use of an online management information system to collect data on urban sanitation
in the Towns of Gulu, Apac, Aduku, Kole and Lira.
7.3.4 Achievements by Kampala Capital City Authority (KCCA)
KCCA has continued to offer free toilet services at 14 different points namely: New taxi Park (02), Constitutional Square (02), Watoto Church (01), Bombo Road (01) Wandegeya Market (02), Entebbe Road (01), Centenary Park (01) and Nakawa Market (02). In partnership with GIZ, Cheshire Uganda, LVEMP, UNHCR/Interaid, Crane, Water Aid Uganda and MTN Uganda, KCCA constructed water borne toilets and rainwater harvesting tanks in public primary and secondary schools. A total of 31 toilet construction projects were started in the FY. Out of these, 29 projects (94%) were constructed/renovated to completion. The Feacal Sludge Management (FSM) Ordinance was reviewed and verified by the Solicitor General and was signed off by the Lord Mayor in January 2020. The final ordinance was later presented to the National Sanitation Working Group meeting that was held in March 2020.
Solid waste management
Solid waste management is a responsibility of Local Governments as stipulated in the Local Government Act. Further still, the Kampala City Council Solid Waste Management Ordinance of 2000 mandates KCCA and its agents to ensure that solid waste in Kampala is collected and conveyed to treatment installations to satisfy both public health and environmental conservation requirements. Therefore, the Solid Waste Management Unit of KCCA manages the collection, transportation, disposal and treatment of the municipal waste produced in Kampala. In FY 2019/20, a total of 434,282 tons of garbage was disposed of at Kiteezi landfill from all the divisions by collector trucks. Of these, 38% was disposed by the KCCA garbage trucks and 62% was disposed by the private companies. In comparison to the FY 2018/19, there was a 15% increment in the tonnage of waste

Uganda Water and Environment Sector Performance Report 2020
88
disposed of at Kiteezi landfill. A total of 191 clean-up exercises were conducted across all divisions. A total of 262 Community dialogues and sensitization meetings were conducted as part of the communication strategies for integrated solid waste management in the city. From these engagements, a total of 4,681 households were sensitized during the door to door activities by scouts, Community Activation Teams (CATs) and Village Health Teams (VHTs). Achievements under National Water and Sewerage Corporation (NWSC) NWSC operates centralized sewerage systems for collecting, treating and discharging effluent in 17 towns out of 258 towns with a total sewerage pipe network of 693Km and 23,914 connections. The population using NWSC sewer services grew by 10% from 750,629 to 826,965 as at June 2020. The total population in the parishes/wards covered by NWSC sewer network has also grown by 3% from 3,495,376 to 3,608,711 people, leading to an increase in the sewerage coverage from 21.5% in FY2018/19 to 23% in FY2019/20. The sewerage coverage is still low due to the limited pipe network coverage.
Table 7- 4: Sewerage Service Coverage Trend for the period 2015 to 2020
Financial Year 2014/15 2015/16 2016/17 2017/18 2018/19 2019/20
Target Population (No.) 2,135,980 2,921,051 3,008,683 3,495,376 3,495,376 3,608,711
Population Served (No.) 136,703 186,947 419,843 750,629 750,629 826,965
% Population Served 6.4% 6.4% 14% 21.5% 21.5% 23%
Number of Service Areas 16 16 16 16 17 17
7.4 Status of Hygiene and Sanitation Sector Indicators
7.4.1 Sector Indicator 1 : Percentage of population using Basic Sanitation
This indicator is defined as the “percentage of the population using an improved sanitation facility
not shared with other households” and computed as (F/G)*100, F denoting total number of
households with improved sanitation facilities not shared, and G-total number of households in an
area.
Sanitation Coverage (population accessing any form of sanitation facility) increased from 77.2%
during FY 2018/19 to 78% in the FY 2019/20 in rural areas compared to 89.1% in urban areas. In
Kampala City, 99% of the population has access to any form of sanitation facility.
The percentage population accessing basic sanitation services in rural areas is 18%, up from 16.6% in
FY 2018/19. In urban areas, the percentage population accessing basic sanitation services increased
by approximately 2 percentage points from 37.4% to 39.2% during FY 2019/20.
7.4.2 Sector Indicator 2: Percentage of population using Safely Managed Sanitation
This indicator is defined as the “percentage of the population using improved sanitation facilities not
shared where excreta is safely disposed insitu or transported and treated off site” and computed as
{(A+B+C)/D}*100 A denoting total household population disposing safely insitu, B- total household
population reported to have emptied and transported excreta by gulpers/cesspool emptier, C- total
household population using sanitation facilities connected to a sewer system, and D- total household
population of District i.e. RGCs and Sub-counties.
For urban areas, three main conditions/assumptions were applied to confirm evidence of access to
safely managed sanitation services in institutions, household and business premises. These were;
i) The Institutions, household and business premises must have a functional drainable sanitation facility without evidence of any form of Open Defecation.

Uganda Water and Environment Sector Performance Report 2020
89
ii) Institutions, household and business premises must be practicing safe emptying and transportation done by licensed service providers.
iii) Having a connection to a sewerage network
Every household/institution or business premises had to fulfill condition 1, and either 2 or 3 in order to be considered safely managed.
The percentage of the rural population having access to safely managed sanitation experienced a
slight decline from 7.1 % to 7% reported in FY 2019/20. This means that the other segment of the
population 93% was either accessing basic sanitation, sharing sanitation facilities or practicing open
defecation. In urban areas, access to safely managed sanitation services increased just slightly from
37.4% to 39.2%.
7.4.3 Sector Indicator 3: Open Defecation
Open defecation is defined as “percentage of the population practicing open defecation” and
calculated as (H/I)*100 H denoting total number of people in households practicing open
defecation, and I total household population in a District i.e. RGCs and Sub-counties.
The population that practiced open defecation in FY2019/20 reduced to 22% from 22.8% reported
in the FY 2018/19. An estimated 8.8 million people are said to be defecating in the open pointing to
the need for more promotion of hygiene and sanitation coupled with provision of sanitation and
hygiene infrastructure if SDG 6.2 is to be attained.
7.4.4 Sector indicator 4: Hand washing with soap at household level
This indicator is defined as “percentage of population with access to hand washing facilities with soap
in households” and computed as (M/N)*100, M denoting total number of households with hand
washing facilities with soap, and N total number of households in the locality.
Access to handing washing with soap at household level increased by 2 percentage points from 36%
in FY 2018/19 to 38% in rural areas while in urban areas it leapt to 61.1% from 40%. The increase in
coverage is attributed to the COVID-19 response messaging which has resulted to positive
behaviour change amongst the population towards hand washing with soap.
7.4.5 Sector indicator 5: Hand washing in schools
Hand washing in schools is measured as “Percentage of pupils enrolled in schools with basic hand washing facilities” and is calculated as, (R/S)*100 R denoting Total number of pupils accessing functional HWFs with soap and water and S Total number of pupils enrolled in schools that have functional hand washing facilities with soap and water.
Hand washing coverage in schools improved by 16 percentage points from 42% reported last FY
2018/19 to 58% with the pupil: stance ratio increased from 1:71 to 1:72 which is further away from
the national standard of 1:40. This pupil: stance ratio calls for more investment in school sanitation
to make the school environment safer and more conducive for the learners. The spike in hand
washing coverage for institutions is attributed to the hand hygiene Behavior Change
Communication-BCC messaging being shared across the different media platforms in the country
and the benefits that are accruing from the practice

Uganda Water and Environment Sector Performance Report 2020
90
7.5 Benchmarking of district performance
In benchmarking district performance, input, output, and outcome indicators are looked at to get
the total score of a particular district and as of end of the reporting period, two districts emerged in
the Superior Band (>75%) while 6 districts are in the Critical Band (<25%). On a good note, more
districts moved from the critical band to the weak band indication and slight improvement in the
performance of districts.
Figure 7- 2: Benchmarking of district performance
Relatedly, a comparison between access to sanitation and hand washing facilities was made across
the regions in Uganda and generally, access to hand washing facilities is lower than access to
sanitation in the whole country. It also emphasizes the fact that behavioral change is a key driver to
ensuring universal access to sanitation and hygiene and had it been only dependent on having good
social economic indicators, Western Uganda would have achieved universal access already. The
figure 7-3 below shows access to sanitation and hand washing facilities across the region of Uganda.
Figure 7- 3: Comparison between sanitation and hand washing coverage by region
7.6 Key Emerging Issues
The sub sector continued to work towards improving the sanitation and hygiene conditions of the
population with the following as the key emerging issues;
i) Un-sewered sanitation is inadequately addressed in the existing policy framework which calls for
policy review.
Uganda Water and Environment Sector Performance Report 2020
91
ii) The sector performance measurement framework is still alien to many stakeholders which
makes it difficult to report on sanitation and hygiene in the country.
iii) Institutional WASH is still a challenge that requires a multi-sectoral effort to address especially as
the world continues to battle the COVID – 19 pandemic. Failure to comprehensively reach
everyone everywhere with sanitation and hygiene services will make achievement of the SDG
6.2 a far-fetched dream.

Uganda Water and Environment Sector Performance Report 2020
92
8. WATER FOR PRODUCTION
8.1 Introduction
Water for Production (WfP) refers to development and utilisation of water resources for productive use in crop irrigation, livestock, aquaculture, rural industries, energy and other commercial uses. Globally Water for Production accounts to over 80% of water withdrawn for use. However, in Uganda, less than 2% of water is used in production but there is a sharp increase in demand primarily due to climate change and degradation of natural resources. The current mandate for WfP facilities in Uganda is shared between MWE and other Ministries. For water for Agricultural development, MWE is responsible for “off-farm” activities, while Ministry of Agriculture, Animal Industry and Fisheries (MAAIF) is responsible for “on-farm” activities. “Off-farm” refers to development of water sources and transmission (bulk transfer to farm gates) and “on-farm” refers to irrigation infrastructure, water use and management. Water for energy, MWE works with Ministry of Energy and Mineral Development, Water for Industry, MWE produces water to the Industries premises while Ministry of Trade, Industry and Cooperatives is responsible for water use and management in the Industries.
8.2 Implementation of WfP Objectives
MWE undertakes several programmes and projects to provide WfP facilities in order to improve the livelihoods of the people in rural areas. It constructs and rehabilitates earth dams and valley tanks mainly in the cattle corridor that stretches from Isingiro in South West to Karamoja in North East. The bulk water transfer programme aims to supply adequate amounts and quality of water all year round for multi-purpose use by conveying large quantities from places of plenty to places of scarcity. MWE is constructing Small scale Irrigation schemes countrywide with GoU funding and medium scale Irrigation schemes under the Farm Income Enhancement and Forestry Conservation (FIEFOC) Project II. MWE also operates and manages earth moving equipment for construction of valley tanks, hired out to individual farmers at subsidised rates. Finally, MWE plays an important role of technical support to local governments and line ministries such as Ministry of Agriculture, Animal Industry and Fisheries (MAAIF).
8.3 Facilities constructed under WfP Department
Water for Production is in charge of provision of water for productive use through construction of earth dams, valley tanks, fish ponds, bulk water transfer systems, small irrigation systems, medium and large-scale Irrigation schemes.
Table 8- 1: Performance of Planned Projects and Programmes in FY 2019/20
Planned output Achieved Output Remarks
Sustainable management systems established at existing/old WfP facilities (Farmer Field Schools (FFS)).
One Hundred Seventeen (117) FFS were established at the Irrigation schemes of Doho II, Ngenge and Mubuku II in the Districts of Butaleja, Kween and Kasese respectively.
Farmers are being trained in water management, Operation and Maintenance (O&M), roles and responsibilities of Farmer Based Management Organizations (FBMO).
Construction of Rwengaaju Irrigation Scheme in Kabarole District (100% Progress)
Works estimated at 88% cumulative progress.
Progress derailed by the COVID 19 restrictions.
Construction completion of Mabira Dam in Mbarara District
Substantial completion Outbreak of COVID-19 affected Political commissioning.
Construction of sixty (60) Small Scale Irrigation schemes countrywide
Completed construction of one (1) small scale Irrigation scheme in Nakaseke District putting nine (9) acres to
Works are ongoing for construction of forty eight (48) small scale Irrigation schemes in the Districts of Oyam (1),

Uganda Water and Environment Sector Performance Report 2020
93
Planned output Achieved Output Remarks
irrigation benefitting ten (10) farmers thus increasing on crop production.
Omoro (2), Dokolo (1), Kitgum (1), Zombo (1), Nwoya (1), Agago (1), Kiryandongo (1) Luweero (1), Nakasongola (2), Nebbi (1), Pader (1), Hoima (1), Kibaale (1), Kalangala (1), Buvuma (1), Mpigi (1), Rakai (1), Kanungu (1), Rukungiri (3), Buhweju (1), Isingiro (1), Kasanda (2), Lwengo (1), Mbarara (2), Ntungamo (1), Kayunga (1), Kaberamaido (1), Serere (1), Napak (1), Bukedea (1), Busia (1), Mbale (2), Kapchorwa (2), Amuria (1), Budaka (1), Butebo (1), Kumi (1), Soroti (1) and Kapelebyong (1).
Construction of twenty (20) Communal valley tanks
Constructed Sixteen (16) valley tanks in the Districts of Soroti (1), Butebo (1), Kapelebyong (1), Kumi (1), Bukedea (1), Kaabong (1), Kotido (1), Lyantonde (1), Mbarara (2), Butambala (1), Rukungiri (1), Ntungamo (1), Kyankwanzi (1), Sembabule (1), Bushenyi (1) and expanded one (1) valley tank in Bugiri District by 7,000m3 creating a water storage capacity of 256,000,000 litres.
Works are ongoing for construction of fourteen (14) valley tanks in the Districts of Luweero (1), Nakasongola (2), Omoro (1), Arua (1), Dokolo (1), Agago (2), Kasese (3), Lwengo (1), Kazo (1) and Isingiro (1).
Construction of WfP facilities using Ministry WfP Equipment
Constructed fifty eight (58) valley tanks in the Districts of Kiruhura (12), Mbarara (6), Kazo (1), Ntungamo (1), Gomba (1), Sembabule (3), Rakai (1), Lyantonde (9), Mubende (1), Busia (1), Nakapiripirit (1), Nabilatuk (1), Moroto (3), Kotido (5), Kamuli (1), Katakwi (2), Kapelebyong (1), Ngora (1), Amudat (3), Karenga (1), Amuria (1), Kumi (1) and Soroti (1) creating a water storage capacity of 645,000,000 litres.
All the facilities are fully functional
Construction completion of Olweny Irrigation Scheme in Lira District
Olweny irrigation scheme construction works is at substantial completion.
Feasibility studies for fourteen (14) Multi-purpose earth dams in Karamoja Sub-region
50% progress (Draft feasibility report submitted)
Community resistance has also halted the project
Feasibility studies for Mega Irrigation schemes around Mt. Elgon area, Mt. Rwenzori area, Agoro Hills and South Western Highlands
50% progress (Draft feasibility report submitted)
Community resistance has affected progress.
Design of small scale Irrigation systems countrywide
Completed designs of twenty eight (28) small scale irrigation systems in the Districts of Budaka (1), Butebo (1), Kumi (1), Mbale (1), Soroti (1), Tororo (1), Sironko (1), Bulambuli (1), Ngora (1), Kayunga (1), Mayuge (1), Bududa (1), Manafwa (1), Kapchorwa (1), Mukono (1), Mubende (1), Ntoroko (1), Kagadi (1), Kibaale (2), Lwengo (1), Kalungu (1),
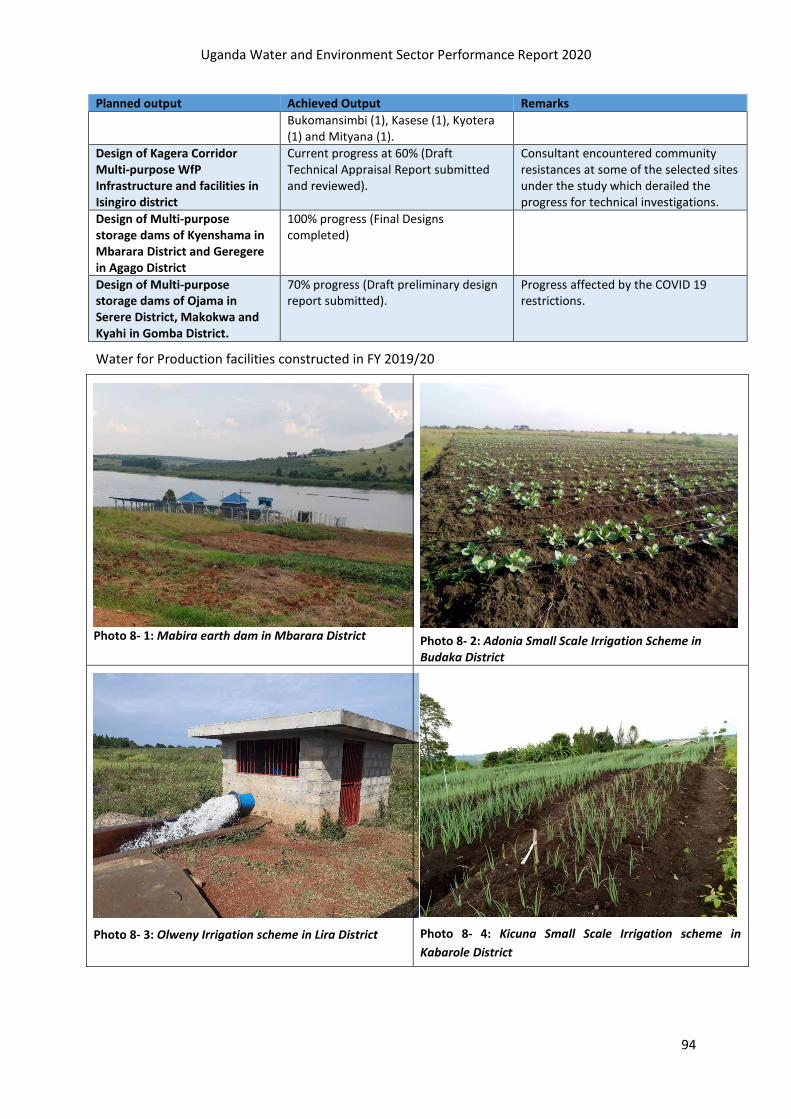
Uganda Water and Environment Sector Performance Report 2020
94
Planned output Achieved Output Remarks
Bukomansimbi (1), Kasese (1), Kyotera (1) and Mityana (1).
Design of Kagera Corridor Multi-purpose WfP Infrastructure and facilities in Isingiro district
Current progress at 60% (Draft Technical Appraisal Report submitted and reviewed).
Consultant encountered community resistances at some of the selected sites under the study which derailed the progress for technical investigations.
Design of Multi-purpose storage dams of Kyenshama in Mbarara District and Geregere in Agago District
100% progress (Final Designs completed)
Design of Multi-purpose storage dams of Ojama in Serere District, Makokwa and Kyahi in Gomba District.
70% progress (Draft preliminary design report submitted).
Progress affected by the COVID 19 restrictions.
Water for Production facilities constructed in FY 2019/20
Photo 8- 1: Mabira earth dam in Mbarara District
Photo 8- 2: Adonia Small Scale Irrigation Scheme in Budaka District
Photo 8- 3: Olweny Irrigation scheme in Lira District
Photo 8- 4: Kicuna Small Scale Irrigation scheme in
Kabarole District

Uganda Water and Environment Sector Performance Report 2020
95
Photo 8- 5: Namutya Small Scale Irrigation Scheme in Kayunga District
Photo 8- 6: Harvested green pepper at Amosingo Small Scale Irrigation
scheme in Kumi District
8.4 Operation & Maintenance of WfP facilities
To ensure sustainability, boost the management and effective use of WfP facilities, the department introduced Farmer Field Schools (FFS) Approach that includes; (i) Strengthening knowledge and capacities for climate change adaptation, (ii) Strengthening skills in operation, maintenance and management of water for production facilities at communal and individual level, (iii) Better access of livestock and crops to water through training in water management, (iv) Resilience of Livestock and crop production systems in the cattle corridor improved, (v) Established, trained and integrated FFS with community based water management system on sustainability, operation and maintenance of water for production facilities, (vi) Saving and marketing, (vii) Integrated and modern agricultural practices (vi) Strengthen collaboration, monitoring, supervision and networks among the farmers within FFS.
8.5 Status and trends of key indicators: Management
Management of the WfP facilities is by private operators for Individual facilities, communal management for dams and valley tanks (Water User Committees, Water Associations and Farmer Field Schools) and cooperative societies for the case of medium and large-scale Irrigation schemes. To achieve this, the WfP Department has brought on board a variety of management models and trained its staff on implementation of all different models as Training of Trainers (ToT) and staff have gone ahead to train the District staff and end users.
Sector Performance Indicator 2: Functionality
Functionality was assessed for all facilities constructed between 2000 – 2020. One hundred and twenty-one (121) districts have so far been covered in the WfP database where data sets have been fully assessed. The results are shown in Table 8-2. The functionality rate for WfP facilities was estimated at 87.8% (including the newly constructed facilities) in FY 2019/20. The data is based on a total of 1382 valley tanks, 35 dams, 4 medium scale Irrigation schemes and constructed 50 small scale Irrigation schemes.
Table 8- 2: Functionality of earth dams, valley tanks, small scale Irrigation systems and medium scale Irrigation schemes as at June 30th, 2020
Functionality Level Description Total
Fully Functional 100% functional, i.e. without any damage 87.8%
Partially Functional Operational but with reduced functionality due to siltation, pump breakdown or other problems
11.5%
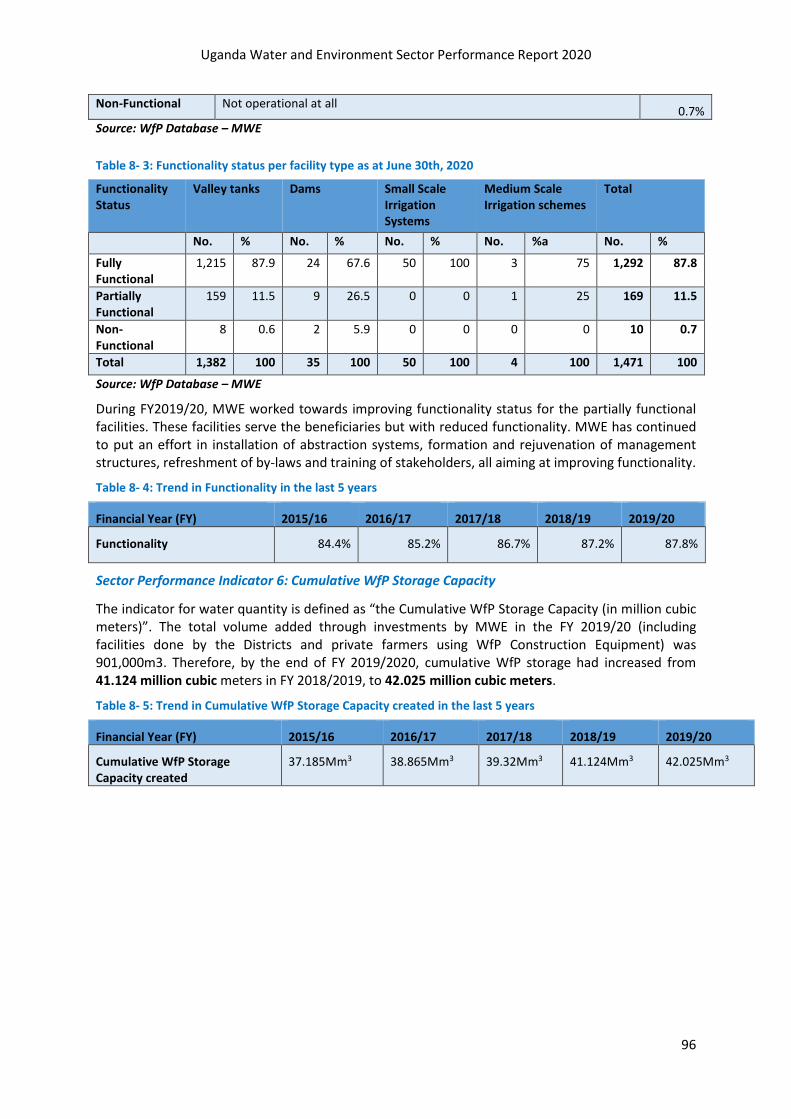
Uganda Water and Environment Sector Performance Report 2020
96
Non-Functional Not operational at all 0.7%
Source: WfP Database – MWE
Table 8- 3: Functionality status per facility type as at June 30th, 2020
Functionality Status
Valley tanks Dams Small Scale Irrigation Systems
Medium Scale Irrigation schemes
Total
No. % No. % No. % No. %a No. %
Fully Functional
1,215 87.9 24 67.6 50 100 3 75 1,292 87.8
Partially Functional
159 11.5 9 26.5 0 0 1 25 169 11.5
Non-Functional
8 0.6 2 5.9 0 0 0 0 10 0.7
Total 1,382 100 35 100 50 100 4 100 1,471 100
Source: WfP Database – MWE
During FY2019/20, MWE worked towards improving functionality status for the partially functional facilities. These facilities serve the beneficiaries but with reduced functionality. MWE has continued to put an effort in installation of abstraction systems, formation and rejuvenation of management structures, refreshment of by-laws and training of stakeholders, all aiming at improving functionality.
Table 8- 4: Trend in Functionality in the last 5 years
Financial Year (FY) 2015/16 2016/17 2017/18 2018/19 2019/20
Functionality 84.4% 85.2% 86.7% 87.2% 87.8%
Sector Performance Indicator 6: Cumulative WfP Storage Capacity
The indicator for water quantity is defined as “the Cumulative WfP Storage Capacity (in million cubic meters)”. The total volume added through investments by MWE in the FY 2019/20 (including facilities done by the Districts and private farmers using WfP Construction Equipment) was 901,000m3. Therefore, by the end of FY 2019/2020, cumulative WfP storage had increased from 41.124 million cubic meters in FY 2018/2019, to 42.025 million cubic meters.
Table 8- 5: Trend in Cumulative WfP Storage Capacity created in the last 5 years
Financial Year (FY) 2015/16 2016/17 2017/18 2018/19 2019/20
Cumulative WfP Storage Capacity created
37.185Mm3 38.865Mm3 39.32Mm3 41.124Mm3 42.025Mm3
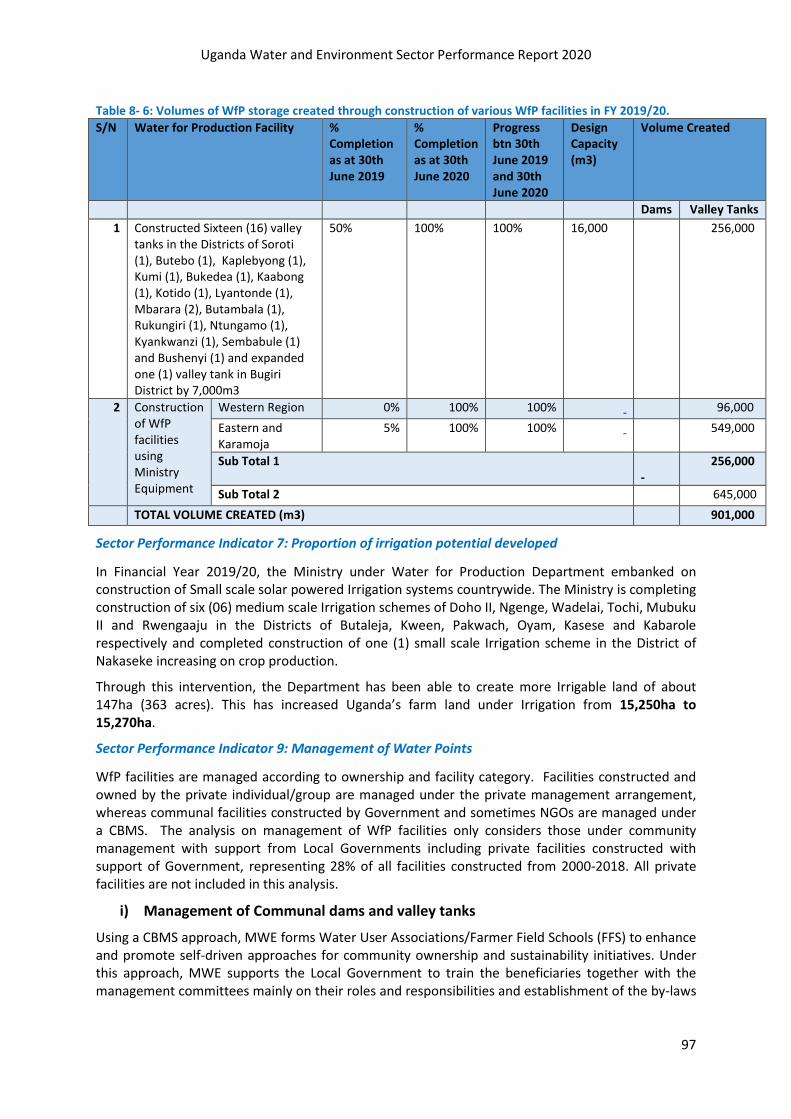
Uganda Water and Environment Sector Performance Report 2020
97
Table 8- 6: Volumes of WfP storage created through construction of various WfP facilities in FY 2019/20.
S/N Water for Production Facility % Completion as at 30th June 2019
% Completion as at 30th June 2020
Progress btn 30th June 2019 and 30th June 2020
Design Capacity (m3)
Volume Created
Dams Valley Tanks
1 Constructed Sixteen (16) valley tanks in the Districts of Soroti (1), Butebo (1), Kaplebyong (1), Kumi (1), Bukedea (1), Kaabong (1), Kotido (1), Lyantonde (1), Mbarara (2), Butambala (1), Rukungiri (1), Ntungamo (1), Kyankwanzi (1), Sembabule (1) and Bushenyi (1) and expanded one (1) valley tank in Bugiri District by 7,000m3
50% 100% 100% 16,000 256,000
2 Construction of WfP facilities using Ministry Equipment
Western Region 0% 100% 100% 96,000
Eastern and Karamoja
5% 100% 100% 549,000
Sub Total 1 -
256,000
Sub Total 2 645,000
TOTAL VOLUME CREATED (m3) 901,000
Sector Performance Indicator 7: Proportion of irrigation potential developed
In Financial Year 2019/20, the Ministry under Water for Production Department embanked on construction of Small scale solar powered Irrigation systems countrywide. The Ministry is completing construction of six (06) medium scale Irrigation schemes of Doho II, Ngenge, Wadelai, Tochi, Mubuku II and Rwengaaju in the Districts of Butaleja, Kween, Pakwach, Oyam, Kasese and Kabarole respectively and completed construction of one (1) small scale Irrigation scheme in the District of Nakaseke increasing on crop production.
Through this intervention, the Department has been able to create more Irrigable land of about 147ha (363 acres). This has increased Uganda’s farm land under Irrigation from 15,250ha to 15,270ha.
Sector Performance Indicator 9: Management of Water Points
WfP facilities are managed according to ownership and facility category. Facilities constructed and owned by the private individual/group are managed under the private management arrangement, whereas communal facilities constructed by Government and sometimes NGOs are managed under a CBMS. The analysis on management of WfP facilities only considers those under community management with support from Local Governments including private facilities constructed with support of Government, representing 28% of all facilities constructed from 2000-2018. All private facilities are not included in this analysis.
i) Management of Communal dams and valley tanks
Using a CBMS approach, MWE forms Water User Associations/Farmer Field Schools (FFS) to enhance and promote self-driven approaches for community ownership and sustainability initiatives. Under this approach, MWE supports the Local Government to train the beneficiaries together with the management committees mainly on their roles and responsibilities and establishment of the by-laws

Uganda Water and Environment Sector Performance Report 2020
98
to ensure sustainability of the facilities. Through the FFS approach farmers are trained on efficient and effective use of the created storage all aiming at Sustainability of the facilities.
The Performance indicator for management of Water for Production facilities is “the %age of water points with actively functioning Water User Committees/FFS”. The total number of facilities constructed since the year 2000, so far entered in the Water for Production database, is 1,391, for 121 districts so far covered in the database, the functionality of WUCs for FY 2019/20 based on the reports of 491 facilities under community management is 88%.
ii) Management of medium and small-scale Irrigation schemes
Medium scale Irrigation schemes are managed through the Cooperative society model and small-scale Irrigation schemes are managed through the FFS Approach. All these two (2) management models focus on effective utilization and sustainability of the schemes.
Table 8- 7: Community Management of WfP facilities constructed between 2000 – 2020 as at June 30th, 2020
Facility Type Total No. of Facilities
Under community management
With established WUC
With functioning WUC
No. % No. % No. %a
Valley Tanks 1302 402 31% 402 100% 354 88%
Dams 35 35 100% 35 100% 25 71%
Small scale Irrigation systems
50 50 100% 50 100% 50 100%
Medium scale Irrigation schemes
4 4 100% 4 100% 3 75%
Total 1,391 491 35% 491 100% 432 88%
Source: MWE WfP Database6
In Table 8-7, the total number of facilities (dams and valley tanks) constructed from 2000 to 2020 is 1,391 for 121 districts so far covered in the WfP database. Out of 1,391, 491 facilities are under community management system with established Water User Committees, and 432
Water User Committees were still fully functional at the time of spot check. The rest of the facilities (959) are non-communal and managed by individual farmers (constructed using MWE equipment under Public Private Partnership (PPP) arrangement).
All the 402 valley tanks under CBMS have established Water User Committees (WUCs) and 354 (88%) were fully functional at the time of spot check. A total of 35 dams were constructed from 2000-2020, all are under CBMS and 25 Water User Committees (71%) were fully functional at the time of spot check.
Table 8- 8: Trend in Management in the last 5 years
Financial Year (FY) 2015/16 2016/17 2017/18 2018/19 2019/20
Management 81% 83% 84% 86% 88%
Public-Private Partnership (PPP): MWE has been developing facilities under a PPP arrangement with farmers; these farmers take responsibility of managing their facilities. To-date, 973 valley tanks have been constructed under this arrangement since 2008. In FY 2019/20 a total of 58 valley tanks were constructed. This was attributed to intensive sensitization that has brought more farmers on board.
6 Valley tanks include those constructed using Ministry WfP equipment
2Fish ponds were not included in this years’ analysis because the department is not active in fish ponds construction. This has a slight impact on the functionality rate.
Uganda Water and Environment Sector Performance Report 2020
99
Firstly, there is no question of ownership as each facility is privately owned by an individual farmer. All the facilities constructed in Busia, Nakapiripirit, Nabilatuk, Moroto, Kotido, Kamuli, Katakwi, Kapelebyong, Kumi, Ngora, Amudat, Kaabong, Soroti, Butebo, Karenga, Amuria, Kumi, Bukedea, Kiruhura, Kazo, Ntungamo, Gomba, Sembabule, Mbarara, Rakai, Lyantonde and Mubende are fenced and there is no direct watering of animals at the facilities.
The use of both traditional and modern troughs is high, access to the facilities is no longer a problem, functionality rates are high and care of facilities are commendable, silting of facilities is limited, cleanliness at the facilities is high and this arrangement has also minimised the challenge of livestock diseases. A coordination committee is established at sub-county level, including sub-county officials, councillors and Farmers’ Coordination Committee together with the other sub-county and district technical team who work with private farmers to ensure sustainability of the constructed facilities. This approach has addressed the O&M and functionality challenges that are associated with the community-managed facilities.

Uganda Water and Environment Sector Performance Report 2020
100
9. WATER RESOURCES MANAGEMENT
9.1 Introduction
This section presents the achievements under Water Resources Management. It describes
achievements under water resources monitoring and assessment, water resources planning and
regulation, water quality management, international and transboundary water resources.
9.2 Water resources monitoring and assessment
Water Resources information is a critical requirement for socio-economic development. MWE
manages a water quantity information system through a network of surface water and groundwater
stations that daily collect data on the amount of water in different lakes, rivers and groundwater
aquifers. The data is quality assured and processed into meaningful information for various uses,
namely; design of water supply schemes, sizing of hydropower plants, irrigation, road infrastructure,
industrial, water transport, recreation, disaster management, water resources management among
others. Real time data is used to provide forecasts for floods and droughts in order to warn and
protect communities that may be affected. Information is also used to assess long term variation of
water resources in response to climatic variability and climate change to understand and guide
water allocation for different uses.
In line with this mandate, the table that follows shows the outputs that were planned for the
financial year 2019/2020.
Table 9- 1: Planned activities for the FY2019/2020
Planned Output Achieved Output Remarks
Real time data transmission Jinja, Kafu and Manafwa monitoring stations
Configuration of additional stations was not possible due to inadequate funding
Groundwater and surface water stations rehabilitated
Temporary gauges were constructed at critical stations along River Nile in order to monitor the impact of increased release from Lake Victoria
The requirements for rehabilitation exceeded the available budget. Emergency flood funds were used to support rehabilitation on six critical stations
Operation and maintenance of the surface water and groundwater monitoring network
Basic operation & site maintenance done for 40% of the stations including payment of observers.
Insufficient funds for O&M of the network
Servers and databases regularly updated, and quality assured
This was done but belatedly Delays in data collection during O&M
Water resources models for assessing state of water resources in catchments & for forecasting developed
Partially done
Output required use of computers and smooth internet connectivity. Internet interruptions disrupted the activity
Status of Uganda’s water
resources updated
Status of the lakes and rivers was updated, and daily updates provided to the Office of the Prime Minister

Uganda Water and Environment Sector Performance Report 2020
101
9.2.1 Operate and maintain water information system
The three core functions under water information system are the groundwater monitoring, surface
water monitoring and information management. Figure 9-1 highlights the status of the monitoring
networks for the period under review.
13.7
34.2
47.9
93.2
10.0
26.7
50.0
73.3
51.0 51.0 51.0 51.0
0.0
10.0
20.0
30.0
40.0
50.0
60.0
70.0
80.0
90.0
100.0
Quarter 1 Quarter 2 Quarter 3 Quarter 4
Pe
rce
nta
ge
Period
Surface Water Stations Automatic Weather Stations Groundwater Stations
Figure 9- 1: Percentage of Stations Operated During FY 2019/20
More manual stations were operated during Q4 after the release of emergency flood funds. Operation of the monitoring network was affected by among others low budget release. High water levels and floods which washed away some of the installations as well as vandalism.
9.2.2 Dissemination of water resources data and information to users
During the period under the review, water resources data was used to inform the development of a number of projects summarized in the table 9-2. However, some data requests received by DWRM could not be met due to lack of operational monitoring stations in the areas where the projects are being implemented. In such cases, the projects implemented may be at risk. The rivers affected include River Semliki, River Aswa, River Sezibwa, River Mpologoma, River Namalu, River Nyamwamba and Lake Bunyonyi.
Table 9- 2: Purposes for data disseminated during FY2019/2020
No. Purpose for Data Dissemination
1 Construction of ferry landing platforms at Bugala, Buvuma and Kiyindi on Lake Victoria
2 Construction of ferry landing platforms at Buyende, Kaberamaido and Kagwara landing sites on Lake Kyoga
3 Hydro power development on River Mitano (feasibility)
4 Owen falls dam management
5 Development of the national irrigation master plan
6 Academia (Makerere and Kyambogo universities)
7 Application of satellite altimetry in Uganda (virtual network design)

Uganda Water and Environment Sector Performance Report 2020
102
9.2.3 Water Resources Availability
In order to efficiently manage and use the water resources of Uganda for the present and future generations, the DWRM continuously monitors the quantity of both ground and surface water bodies. Monitoring is affected through a network of stations spread across the country that are operated to record daily water levels.
9.2.4 Groundwater Resources To manage groundwater, a network of observation wells was established by DWRM. The objectives
of the groundwater level monitoring are to:
• monitor groundwater sustainability
• detect long term trends,
• understand groundwater resource availability,
• design management strategies at different levels
The water table responds to the various recharge and discharge stresses that characterize a
groundwater system and is therefore constantly changing. This can be well seen when the data is
plotted in hydrographs.
Figure 9- 2: Shows variation of water level and rainfall of Rwebisengo monitoring well.
Figure 9- 3: Corrected hydrograph of Rwebisengo monitoring station.
There’s a rise in water level observed in the last quarter of 2017 at Rwebisengo groundwater
monitoring station following a period of rain, then a rapid decline as time passes. In the first quarter
of 2018 which is characterized with low rainfall (figure 9-3). The trend fluctuation changes rapidly
with few peak high and lower than the first peak observed at the beginning of the hydrograph.

Uganda Water and Environment Sector Performance Report 2020
103
Further the fluctuation does not follow seasonal variations of the rain. This simply shows there’s
pumping well which draws most of the recharged rain.
A rapid increase in groundwater levels is again observed from July 2019 and exceeds the first peak
level. This can probably be attributed to increased rainfall received in that period, hence recharge
exceed abstraction or a combination of high recharge and low abstraction.
The fluctuation of water table at the monitoring station of Moroto is a typical of baseline condition.
The graphical representation of the natural recession curve (figure 9-4) following a dry season in the
last quarter of 2014. It can be shown that the logarithm of the water table height decreases linearly
with time. However, there’s no linearity in rise of the water table. This can be explained by the fact
that recharge is sporadic and keeps on changing as the surface soil conditions change. For the
example flat water table level observed from April 2015 to April 2017, if we constrain ourselves to
recharge rate; it can be attributed to imperviousness of the soil cover, which lower or stops rainfall
infiltration and promote evaporation and runoff. Nevertheless, it can also be due to poor data
recording from the station observer.
Figure 9- 4: shows water level variations at Moroto monitoring station
Apac Monitoring station compared to Moroto have almost similar trends in water table variation.
The Apac groundwater monitoring station show a continuous response to rainfall, atypical of
unconfined aquifer.
Figure 9- 5: show variation of groundwater level at Apac Monitoring station

Uganda Water and Environment Sector Performance Report 2020
104
9.2.5 Surface Water Resources
The surface water resources under daily monitoring comprise; rivers and lakes. Daily water levels are measured and converted into flow for several rivers. The three major lakes of interest are; Victoria, Kyoga and Albert. Lake Victoria being the largest freshwater lake in Africa and with nearly 45% of the lake area in Uganda is presented in the next paragraph.
a) Lake Victoria
The primary drivers of water level changes in Lake Victoria are precipitation falling directly on the lake surface, runoff (inflows) draining into the lake, groundwater percolation and evaporation from the lake surface. The combined effects of these hydrologic factors are referred to as the Net Basin Supply (NBS7) to the lake. The Water Resources Monitoring and Assessments (WRM&A) invokes the water budget equation to calculate NBS, which is equal to change in storage plus outflow discharge (releases). The NBS is an important quantity for understanding the amount of water supplied to the lake and it is the most significant driver of water level change.
b) Net Basin Supply and Lake Victoria Levels
Figure 9-6 shows the variation in the annual NBS of Lake Victoria plotted along with the mean Lake level for the past 10 years. The graph shows that the NBS in a particular year greatly influences the levels in the subsequent year/s. Close examination of the graph reveals that there was a fall in mean annual Lake levels of about 49cm between the period 2016 to 2017. This is attributed to the drop in annual NBS that occurred earlier between 2015 and 2016. Similarly, the increase in annual NBS from 0 million cubic metres in 2016 to more than 60,000 million cubic metres during the years 2017 to 2019 resulted in a rise in mean Lake levels.
Figure 9- 6: Variation of Net Basin Supply and Mean Lake Levels from 2010 to 2019
Similarly, figure 9-7 gives a comparative historical perspective. It is noted that the very high and rapid increase in annual NBS that occurred between 1961 to 1962 resulted in steady rise of Lake Levels during the period of 1962 to 1964. The subsequent drop in Lake Levels from 1964 to 1965 is a result of the cumulative drop in NBS.
7 The NBS is the actual amount of water contributed by Lake Victoria basin after accounting for losses due to evaporation
and groundwater
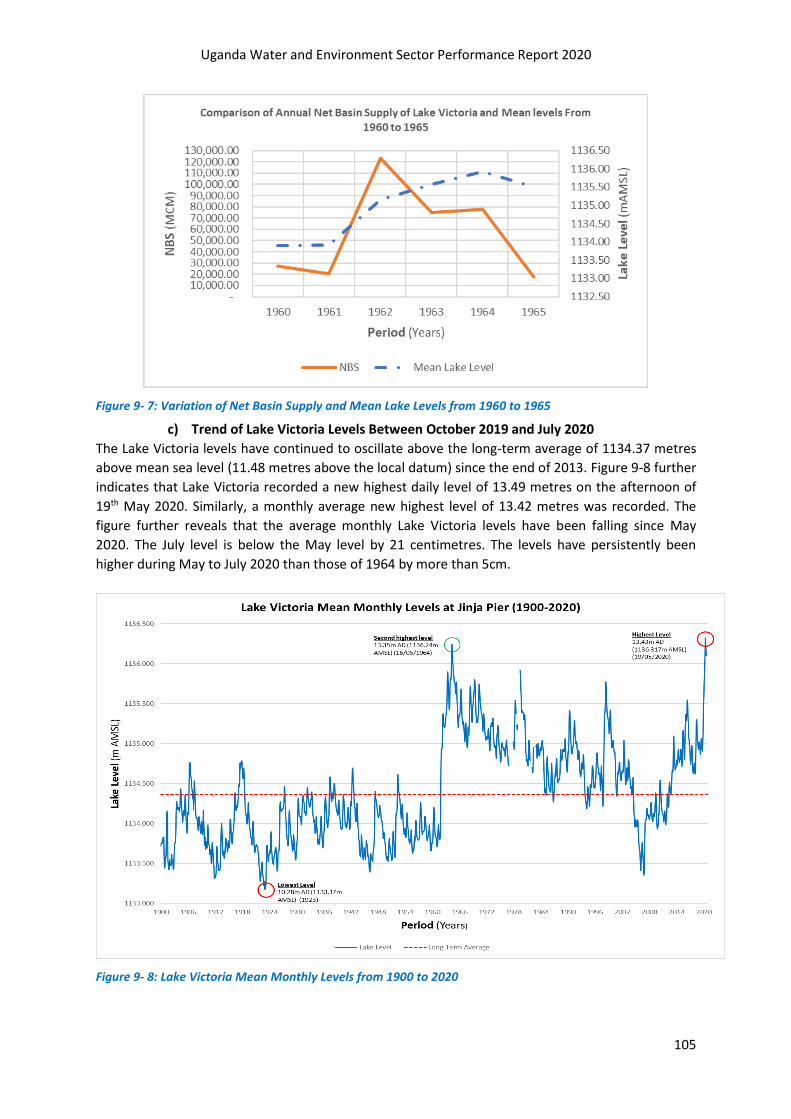
Uganda Water and Environment Sector Performance Report 2020
105
Figure 9- 7: Variation of Net Basin Supply and Mean Lake Levels from 1960 to 1965
c) Trend of Lake Victoria Levels Between October 2019 and July 2020
The Lake Victoria levels have continued to oscillate above the long-term average of 1134.37 metres
above mean sea level (11.48 metres above the local datum) since the end of 2013. Figure 9-8 further
indicates that Lake Victoria recorded a new highest daily level of 13.49 metres on the afternoon of
19th May 2020. Similarly, a monthly average new highest level of 13.42 metres was recorded. The
figure further reveals that the average monthly Lake Victoria levels have been falling since May
2020. The July level is below the May level by 21 centimetres. The levels have persistently been
higher during May to July 2020 than those of 1964 by more than 5cm.
Figure 9- 8: Lake Victoria Mean Monthly Levels from 1900 to 2020

Uganda Water and Environment Sector Performance Report 2020
106
d) Comparison of Lake Victoria levels During 1964 and 2020 The Lake Victoria mean monthly levels of 1964 show similar trend with those of 2020. However, the
levels registered in 2020 are higher than those of 1964 as indicated in table 9-3 and figure 9-9.
Table 9- 3: Water Level Rise in Centimetres
Month
Average Lake Levels
2020 1964 Rise
(cm)
May 13.42 13.34 8.0
June 13.36 13.29 6.9
July 13.21 13.15 6.0
Figure 9- 9: Comparison of Lake Victoria Mean Monthly Levels in 1964 and 2020
e) Analysis of Water Levels in Victoria, Kyoga and Albert
Regulation of the rising Lake Victoria levels was mainly implemented through spilling excess water at
the Owen Falls Dam Complex. This has since resulted in an increase of levels at the downstream
lakes of Kyoga and Albert and the Nile river in general. Figure 9-10 shows a trend in level comparison
of the three lakes.

Uganda Water and Environment Sector Performance Report 2020
107
Figure 9- 10: Water level trends of Lakes Victoria, Kyoga and Albert
The levels of the Lakes Kyoga and Albert have continued to rise while that of Lake Victoria has been
falling since May 2020 and is still below the new highest level of 13.49 meters. The very high-water
levels of lakes Kyoga and Albert have led to persistent expansion of lakeshore flooding in
surrounding districts affecting additional settlements and essential public infrastructure.
f) Analysis of Water Levels in major Streams The water level trends of the three rivers shown in Figure 9-11 illustrate the general trend in major
rivers of the country. The water levels in various sections of River Nile (Victoria Nile, Kyoga Nile and
Albert Nile) fluctuated at the new maximum watermarks. On average, the new highest watermarks
are 0.1 meters above the previous highest mark recorded in 1964.

Uganda Water and Environment Sector Performance Report 2020
108
Figure 9- 11: Water level trends of representative rivers in Uganda
Water levels of other major rivers in the country continued a downward trend as shown in figures 9-12. With the exception of the Nile and River Kagera, the levels are below the historical maximum water levels.
Figure 9- 12: Water level trends of major inflows into Kyoga
9.2.6 Flood Risk Assessment and Management
Several districts in Uganda were hit by floods from April 2020 to end of June 2020. While floods
along Rivers receded after March, April, May (MAM) rainy season, districts on the shores of the lakes
Victoria, Kyoga and Albert were still experiencing flooding as of 30th June 2020. The above normal
rainfall received during MAM 2020 in the Lake Victoria basin led to a rise in Lake Victoria water
levels which were already high from the previous SOND 2019 rainfall season. Lakes Kyoga and Albert
which are downstream of Lake Victoria subsequently registered high-water levels due to the
increased excess flow from Lake Victoria.

Uganda Water and Environment Sector Performance Report 2020
109
The Rwenzori region also received high rainfall which led to bursting of riverbanks on; Nyamwamba,
Nyamugasanyi, Luhubiriha and Mubuku in South Western Uganda and River Tochi in Northern
Uganda. The affected districts included Nakasongola, Kiryandongo, Mayuge, Nakasongola, Amolator,
Bulisa, Kiryandongo, Soroti, Bugondo, Dokolo, Serere, Amolatar and Nakaseke which share Lake
Kyoga. Busia, Kampala and Rakai along Lake Victoria, Bundibugyo and Kasese in the Rwenzori region
as well as Kagadi and Ntoroko along Lake Albert.
The floods severely impacted the affected communities for example in Kasese district, 8 people lost
their lives, communities were displaced and household property lost. A lot of infrastructure was
damaged including bridges, hydro power plants (Mubuku) and roads.
By end of June 2020, more than 25% of the surface water level monitoring stations across the
country had been severely affected. Table 9-4 shows the impacts of floods on the stations in the four
Water Management Zones (WMZ) and the recommended actions.
Figure 9- 13: Map showing flooded areas in Amolatar District
Photo 9- 1: Surface water monitoring stations
s

Uganda Water and Environment Sector Performance Report 2020
110
Table 9- 4: Surface Water level Monitoring Stations Affected by Rising Water Levels of Lake Victoria and above normal rainfall received during MAM
No River/Lake Name of Water Level
Station
Name of Basin
Flood Impact Emergency Action Taken Further Recommendations
1 Jinja Jinja Pier VWMZ • Stilling well submerged & pully loosened
• Partial blockage of water way by water hyacinth d/s & causing temp damming at station
• Temporally heightening of stilling well & pully system
• removal of water hyacinth
Rehabilitation of stilling well & associated components
2 Kagera Kikagati VWMZ • Telemetry house & staff gauges submerged
• Telemetry digital equipment safely removed
• Temporally gauges added
Reconstruction of telemetry house & permanent gauges
3 Kagera Masangano VWMZ • Telemetry house, bench marks & staff gauges washed away
• Telemetry digital equipment safely removed
Reconstruction of telemetry house & permanent gauges
4 Kiruruma Kiruruma VWMZ • Telemetry house, bench marks & staff gauges washed away
• No equipment at time of flooding Reconstruction of telemetry house & permanent gauges
5 Muvumba Mirama hills VWMZ • Telemetry house, bench marks & staff gauges washed away
• No equipment at time of flooding Reconstruction of telemetry house & permanent gauges
6 Victoria Nile Mbulamuti KWMZ • Staff gauges submerged • Temporally gauges added Permanent gauges required
7 Kyoga Bugondo KWMZ • Telemetry house & staff gauges all submerged
• Digital equipment safely removed,
• transfer of old gauge & temporally gauges added
Reconstruction of telemetry house & permanent gauges
8 Kyoga Outlet Masindi Port KWMZ • Staff gauges submerged twice • Telemetry house submerged,
• Transfer of old gauge & temporally gauges added
Rehabilitation of telemetry house & permanent gauges
9 Kyoga Kachung KWMZ • Telemetry house & staff gauges all submerged
• Temporally gauges added Rehabilitation of telemetry house & permanent gauges
10 Sironko Sironko KWMZ • Staff gauges washed away • None Additional permanent gauges required

Uganda Water and Environment Sector Performance Report 2020
111
11 Greek Kelim KWMZ • Telemetry house & staff gauges all submerged
• None (No equipment to secure) Rehabilitation of telemetry house & permanent gauges
12 Awoja Mpologoma KWMZ • partial blockage of water way by water hyacinth
• Removal of water hyacinth Provision of dredging equipment’s for maintenance of the water bodies at flow measurement sections
13 Malaba Malaba KWMZ • Staff gauges submerged • Temporally gauges added Additional permanent gauges required
14 Albert Butiaba AWMZ • Staff gauges submerged • Temporally gauges added Additional permanent gauges required
15 Kafu Kafu AWMZ • Some staff gauges vandalised and others submerged
• Temporally gauges added Additional permanent gauges required
16 Nyamwamba Nyamwamba AWMZ • Telemetry house washed away • No equipment at time of flooding Reconstruction of telemetry house & permanent gauges
17 Albert Nile Panyango UNWMZ • Staff gauges submerged • Temporally gauges added Additional permanent gauges required
18 Atura Atura UNWMZ • Telemetry house & staff gauges all submerged
• No equipment at time of flooding Rehabilitation of telemetry house & permanent gauges
19 Kwania Kwania UNWMZ • Telemetry house & staff gauges all submerged
• No equipment at time of flooding Rehabilitation of telemetry house & permanent gauges
20 Kyoga Nile Kamdin UNWMZ • Staff gauges submerged • None Additional of permanent gauges
Uganda Water and Environment Sector Performance Report 2020
112
9.2.7 Challenges and recommendations
Maintenance of the monitoring stations faces a number of challenges which affect the quality of data provided. The major challenges are outlined below: i) Inadequate hydrological equipment required for operation and maintenance of stations. Most stations are
located in areas with unstable controls due to the nature of Ugandan rivers. Such stations require regular maintenance and rating curve updates to avoid inaccuracies in flow estimation. However due to constraints on human and equipment, this is not done. In order to improve the quality of data collected and facilitate optimal operation from the stations, MWE intends to stabilize some stations and review the entire monitoring network.
ii) Routine operation and maintenance of monitoring stations is required to ensure timely and continuous transmission of good quality data. This function puts a huge demand on the already dwindling resources and yet receives less attention which causes interruption in some critical operations such as; Flood Early Warning System (FEWS). It is advised to put in place a fund for source monitoring from planned water supply, irrigation and hydro projects before implementation.
9.4 Water resources planning and regulation
9.4.1 Introduction
MWE’s Water Resources Planning and Regulation Department (WRPR) is responsible for ensuring that the water
resources of Uganda are used and allocated in a rational manner to meet the needs of various stakeholders and
are also protected from overexploitation and pollution. This is done through preparation of water use plans and
strategies, issuance of water permits, and monitoring compliance to permit conditions and water laws and
regulations. During the FY 2019/2020, the following were the key initiatives of the Department:
• Improving planning for allocation and use of water resources in order to guide various water related sectors
on the development and management of water resources.
• Support to the Water Policy Committee (WPC) to enable it to provide policy advice to the Minister of Water
and Environment and other government agencies on integrated and sustainable management and
development of water resources of Uganda.
• Continue strengthening of the water resources regulatory framework through review and amendment of the
National Water Policy and Water Act, and implementation of the strategy for compliance and enforcement of
water laws and water permit conditions.
• Implement a regulatory framework for dams and reservoirs to ensure that appropriate dam safety practices
are built into plans and programs for the management of electricity generating facilities.
• Continue implementation of catchment-based water resources management through the 4 Water
Management Zones (WMZs), supporting and facilitating preparation and implementation of Catchment
Management Plans and establishment of Catchment Management Organizations to promote coordination
and collaboration among stakeholders.
• Promote use of Water Source Protection Guidelines to secure the quality and quantity of water resources for
water related infrastructure projects.
• Support the Water Resources Institute (WRI) to undertake and implement its four core functions of applied
training, applied research, outreach and dialogue

Uganda Water and Environment Sector Performance Report 2020
113
9.4.2 Overview of performance
The progress made in terms of water resources planning and regulation over the last eight years continues to be
assessed based on various sub-sector indicators.
Permits applications and assessment
During the reporting period 142 new permits applications were received and all of them were assessed. 148 new
permits were issued during the same period. The reason for more new permits issued compared to the
applications received was due to the backlog from the previous years. In addition, 186 permit applications for
renewal were received and of these 153 were renewed. Some of the applications were not approved for renewal
due to non-compliance to permit conditions such as: i) submission of self-monitoring data for abstraction and/ or
discharge and ii) non-payment of annual water use fees even after persistent reminders and iii) delayed or non-
response or no provision of justification or reasons for non- compliance to permit conditions. The Ministry
communicated its decision to these permit holders.
Overall, 301 permits (148 new and 153 renewal) were issued compared to 371 issued in FY 2018/19. The number
of permit issued decreased as compared to last FY due to fewer new permit applications received as the country
experienced lockdown due to the pandemic (COVID-19) that impacted on the permitting system. Figure 9-14
shows the numbers of water permit applications received, assessed, and issued over the last eight years.
Figure 9- 14: Trends of water permit applications received, and permits issued over the last seven years.
It is noted that there is generally a steady increase in the number of permit applications received, assessed and issued since FY2012/13 as a result of increased awareness by water users, continuous inventory and mapping of the water users and waste water dischargers, and close follow up of the illegal water users and waste water dischargers through the Water Management Zones.

Uganda Water and Environment Sector Performance Report 2020
114
Compliance to Water Act Cap 152 and Water Resources Regulations
In an effort to ensure compliance to the Water Act and Water Resources Regulations by all those abstracting water resources and discharging wastewater into the environment, it was made mandatory for every team going out in the field to always identify illegal water users and waste water dischargers. The table 9-5 below shows the achievements per Water Management Zone. This activity is planned to continue to ensure that water users and wastewater dischargers without permits are identified and assisted to apply for permits since some of them are not aware of the requirement to legalise their water use. The identified illegal water users and wastewater dischargers were issued with permit applications to legalise their activities and follow up actions will be taken during the next year.
Table 9- 5: List of identified water users without permits per Water Management Zone
No. Water Management Zone No. of illegal water users Identified
1 Victoria Water Management Zone 40
2 Albert Water Management Zone 15
3 Kyoga Water Management Zone 30
4 Upper Nile Water Management Zone 17
Compliance to permit conditions
A total of 1,466 of 1,696 (86.4%) water permit holders for wastewater discharge, drilling, groundwater and surface water abstraction permits were monitored for compliance to the provisions of Water Act and permit conditions. One major area of improvement in water resources regulation has been enforcement. During the year under review there was significant increase in the number of permit holders monitored for compliance. This was mainly due to the de-concentration of the functions of water resources management through the four Water Management Zones. As a result, compliance to water laws and permit conditions has continued to improve as seen from the increase in the number of new permit applicants and those applying for renewal as well as the compliance status to water abstraction and wastewater discharge permit conditions. The trends of the number of permit holders monitored over years is shown in figure 9-15.

Uganda Water and Environment Sector Performance Report 2020
115
Figure 9- 15: Trends of Number of Permit Holders Monitored for Compliance over the last 8 years
Sector Indicator no. 11: % of water abstraction and discharge permits holders complying with permit conditions
The indicator for water resources management related to compliance is defined as “% of water abstraction and discharge permits holders complying with permit conditions”. The permit conditions considered are compliance to quarterly submission of data for the drilling permits, wastewater discharge standards including possession of wastewater treatment facilities for wastewater discharge and compliance to permitted water abstraction volumes.
Table 9- 6: Compliance to Permit Conditions FY 2019/20
Type of permit Permit Condition Total No. of Permit Holders monitored
No. of permits complying
Percentage compliance (%) FY2019/20
Wastewater discharge
Effluent discharge 189 117 62
Surface water abstraction
Abstracting within permitted amount
351 270 77
Groundwater abstraction
Abstracting within permitted amount
866 645 74.5
Drilling Quarterly submission of Borehole Completion Reports
60 59 98
Total 1466 1091 77.6
Table 9-6 presents the status of compliance to various permit conditions. The average percentage of compliance to the permits (surface water, groundwater, wastewater discharge and drilling permit) conditions currently stands at 77.6% compared to 78% in the previous financial year. Majority of the permit holders generally
Uganda Water and Environment Sector Performance Report 2020
116
complied with the permit conditions such as i) quarterly data submission on daily volume of water consumed ii) installation of bulk water meter iii) testing raw water samples, submitting quarterly reports timely and iv) paying annual charges. However, some have not complied especially with installation of dip tubes and bulk water meters and therefore do not record groundwater levels and /or volume of water abstraction per day respectively. In general compliance to water permit conditions remained constant at about 77.6% in the past two year. The slight drop in compliance is attributed to the effects of COVID-19 pandemic.
More effort is needed to improve on compliance to waste water discharge permit conditions that dropped to 62% from 63% for the previous year. The biggest waste water dischargers such as NWSC wastewater treatment facilities, sugar manufacturing companies, soft drinks, leather tanning industries have slightly improved their compliance this financial year, though they still do not fully meet the National Standards for waste water discharge into land for some parameters. Enforcement efforts continue to ensure that permit holders put in place measures to comply with these conditions. The challenges faced by these companies relate to inadequate and inefficient wastewater treatment plants due to financial and human resource capacity in addition to operational inefficiency.
As part of compliance and enforcement of the water laws and permit conditions, 415 letters providing feedback, technical advice and indicating areas for improved compliance were written and dispatched to various permit holders and positive feedback continues to be received. In order to improve groundwater development and ensure value for money during borehole drilling, registration of private hydrogeologists and hydrogeological consulting companies initiated in FY 2015/16 continued. Thus 88 Hydrogeologists and 20 groundwater hydrogeological consultant firms were registered and issued with registration certificates that authorise them to undertake groundwater investigation and drilling supervision activities in the country. To regulate the increasing demand of drilling boreholes in urban/gazetted water supply areas, permission to drill boreholes are issued to those who submit their requests with enough evidence for a need of an alternative water supply source. In the current year, a total number of 42 requests related to the issue were received and out of this, 20 permissions were issued while the rest were not issued because of issues related to poor environmental sanitation of the proposed drilling sites, lack of sufficient evidence to justify the need for alternative water supply source and failure to secure no objection letters from the relevant mandated water supply authority in their area.
Achievements of the Pollution Task Force (PTF)
The Kampala Pollution Task Force (PTF) composed of key government agencies such as National Environment
Management Authority (NEMA), National Water and Sewerage Corporation (NWSC), Kampala Capital City
Authority (KCCA), and Directorate of Water Resources Management (DWRM), and Uganda Cleaner Production
Centre (UCPC) and Uganda Manufacturers’ Association (UMA)8 was instituted with support from GIZ. The task
force main objective is improving institutional coordination so as to enhance regulation of industrial wastewater
pollution in the Greater Kampala through joint inspections, sensitization awareness campaigns, enforcement and
public-private dialogue.
8In full National Environment Management Authority (NEMA), Directorate of Water Resources Management (DWRM), National Water and Sewerage Corporation (NWSC), Kampala Capital City Authority (KCCA), Uganda Cleaner Production Centre (UCPC) and Uganda Manufacturer’s Association(UMA)

Uganda Water and Environment Sector Performance Report 2020
117
During this reporting year, as part of the routine monitoring activities of the Task Force, environmental
inspections were carried out to various industries within the Kampala Metropolitan Area that include among
others; MB fruit Agency, Samona Beauty products, Britania Allied Industries, Regal paints Limited, Global Paints
limited, Peacock Paints Limited, Hariss International Limited, Hema Beverages, Jakaranda, Steal and Tube
industries Limited, City abattoir, Fine spinners limited, Fresh Cuts Limited, Roofing’s rolling mill, Luuka Plastics,
Nice house of plastics, Dembe Limited, Fresh Diary Limited, National water and sewerage corporation Bugolobi,
Cipla quality Chemicals Limited and Graphic designs limited.
The common non-compliance issues noted at many of these industries included: discharging without permits,
discharging above the National Standards for effluent discharge, discharging above the maximum permitted limit,
lack of capacity for self-monitoring of the quality and quantity of the effluent and non-compliant to the permit
condition. Most industries visited had discharge permits except a few who were in the process of acquiring them.
A few of these Permit Holders were complying with National Standards for effluent discharge including
submission of self-monitoring data to relevant Authorities and Agencies. Industries discharging without permits
were assisted to apply for Wastewater Discharge Permits.
Non-tax revenue
Figure 9- 16: Total annual non-tax revenue collected from water use over years
Water use planning and allocation
Reservoir regulation activities are undertaken to ensure optimal utilization of water resources by reservoir/dam operators while dam safety activities are undertaken to ensure that dams are safely operated. During the reporting period a total of 20 mini hydropower dams (Rwimi Hydro Power Plant (HPP), Kakaka HPP, Nyamugasani 1 HPP, Nyamugasani 2 HPP, Nyamwamba HPP1, Nyamwamba HPP2, Mubuku 1 HPP, Mubuku 2 HPP, Mubuku 3 HPP, Lubhilia HPP, Ndugutu HPP, Sindila HPP, Kikagati HPP, Mpanga HPP, Achwa 1 HPP, Achwa 2 HPP, Siti 1 HPP, Siti 2 HPP, Suam HPP and Kabelega HPP) were inspected for compliance to water use permit conditions and reservoir safety regulations. Additionally, 3 multi-purpose dams, namely Kibimba, Mubuku, and
The annual non-tax revenue collection has
significantly increased over the years. In
FY2019/20, UGX461.1 million was collected
from permit processing fees, annual water use
and wastewater discharge fees. This was
lower than the amount collected last FY
(UGX545 million). This was due to closure of
most permitting related activities during the
COVID-19 lockdown.

Uganda Water and Environment Sector Performance Report 2020
118
Doho, and 12 bridges’ hydraulic works across rivers were inspected for compliance to water use permit conditions including the hydraulic Construction Permit conditions. Furthermore, the department has continued to inspect four large hydropower dams, namely Nalubale Dam, Kira Dam, Bujagali Dam, Isimba Dam and Karuma Dam to ensure that water is used efficiently, and the structures are operated safely in accordance with Dam Safety Regulation. Despite the incidents of climate change associated with flooding and rise in water levels of Lake Victoria, the dams were found to operate safely in compliance to Regulations. The department continued to regulate water releases along the various river water system in the country especially those under the hydropower generation. During this reporting period, the Nile river water system experienced flooding that resulted in the Lake Victoria water levels to rise above the historic 13.4 meters of 1964. Consequently, to minimize the negative impact of the rise, on the settlements, ecosystems and infrastructure within basin, the department undertook strategic regulations guided by regular and scientific assessment for sustainable management of lake and allowed extra release of water from Lake Victoria as shown in figure 9-17. In addition, strategic inspections were done to examine the status of infrastructure around Nalubale and Kira dams to ensure that water does not rise above the maximum safe operating level.
Figure 9- 17: Showing the Lake Victoria Water Release for Last Ten Months
DWRM has continued to carry out Dam Safety Inspections with priority to critical dams namely Nalubale, Kira, Bujagali, Isimba and Karuma Dams in the River Nile system in assessment of the infrastructure safety but also continued to provide guidance on the most appropriate safety instrumentations for the various dam infrastructure components as well as reviewing and guiding on safety status of various dam infrastructure based in the dam safety reporting. Continuous implementation of Dam Safety Guidelines has been ongoing on a number of small, medium and large dams under development in Uganda. Uganda joined the International Commission on Large Dams (ICOLD) and became the 101 members of the commission. As a result, the Uganda Committee for Large Dams (UCOLD) was created and is chaired by the Directorate of Water Resources Management. UCOLD has initiated the process of expanding its committee and has held a number of collaborative meetings aimed at coordinated management of the Nile Cascade dams as well as dam safety in heightened risk periods. This has continued to advance the art, science and engineering techniques for planning, design, construction, operation and maintenance of safe dams to ensure sustainable development and management of the Uganda’s water resources. Environmental Impact Assessments

Uganda Water and Environment Sector Performance Report 2020
119
DWRM continued to review Environmental and Social Impact Assessment reports, Environmental Audit reports, Project Briefs, Scoping reports and Terms of References submitted through NEMA by various developers of water resources related projects and programs. In relation to the review of these reports, the Directorate carries out compliance assistance to developers during projects planning and implementation through stakeholder consultation meetings. A total of 82 EIA reports were reviewed, and 39 consultative meetings were held during the reporting period. The review findings and recommendations were submitted to NEMA for consideration at various decision-making levels and for follow up with the project developers. Through stakeholder consultations, developers were guided on the key water resources issues to address and the permit application process. Most of these projects have since applied and acquired water abstraction and/ or construction permits. Figure 9-18 shows the environmental impact reports reviewed and consultative meetings held during this reporting period.
Figure 9- 18: Environment impact assessment reports reviewed
Water laws, policies and regulations
The process of revising the Water Policy and amending the water Act, the Regulatory Impact Assessment (RIA)
report on water resources in the country was finalised and is due for review by the relevant stake holders. The
process has however stalled due to the COVID 19 Pandemic. The progress made is presented in table 9-7 below.
Table 9- 7: Current status of Revising the Water Policy and Amending the Water Act
DESCRIPTION PROGRESS 2019/20 Status
Regulatory impact
assessment (RIA) report
• Draft RIA report approved by the Water Policy Committee for revising the Water Policy and amending the Water Act.
Done
Implementation • Draft Implementation strategy plan approved by the Committee for
Pending
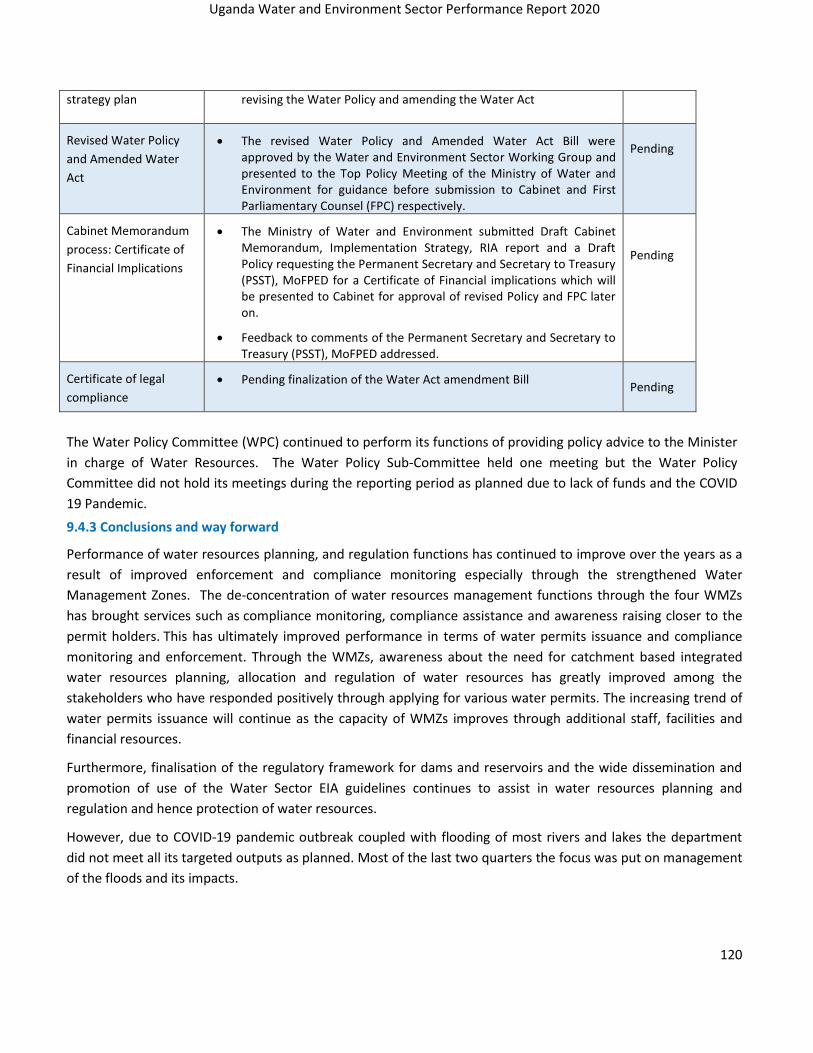
Uganda Water and Environment Sector Performance Report 2020
120
strategy plan revising the Water Policy and amending the Water Act
Revised Water Policy
and Amended Water
Act
• The revised Water Policy and Amended Water Act Bill were approved by the Water and Environment Sector Working Group and presented to the Top Policy Meeting of the Ministry of Water and Environment for guidance before submission to Cabinet and First Parliamentary Counsel (FPC) respectively.
Pending
Cabinet Memorandum
process: Certificate of
Financial Implications
• The Ministry of Water and Environment submitted Draft Cabinet Memorandum, Implementation Strategy, RIA report and a Draft Policy requesting the Permanent Secretary and Secretary to Treasury (PSST), MoFPED for a Certificate of Financial implications which will be presented to Cabinet for approval of revised Policy and FPC later on.
• Feedback to comments of the Permanent Secretary and Secretary to Treasury (PSST), MoFPED addressed.
Pending
Certificate of legal
compliance
• Pending finalization of the Water Act amendment Bill
Pending
The Water Policy Committee (WPC) continued to perform its functions of providing policy advice to the Minister
in charge of Water Resources. The Water Policy Sub-Committee held one meeting but the Water Policy
Committee did not hold its meetings during the reporting period as planned due to lack of funds and the COVID
19 Pandemic.
9.4.3 Conclusions and way forward
Performance of water resources planning, and regulation functions has continued to improve over the years as a
result of improved enforcement and compliance monitoring especially through the strengthened Water
Management Zones. The de-concentration of water resources management functions through the four WMZs
has brought services such as compliance monitoring, compliance assistance and awareness raising closer to the
permit holders. This has ultimately improved performance in terms of water permits issuance and compliance
monitoring and enforcement. Through the WMZs, awareness about the need for catchment based integrated
water resources planning, allocation and regulation of water resources has greatly improved among the
stakeholders who have responded positively through applying for various water permits. The increasing trend of
water permits issuance will continue as the capacity of WMZs improves through additional staff, facilities and
financial resources.
Furthermore, finalisation of the regulatory framework for dams and reservoirs and the wide dissemination and
promotion of use of the Water Sector EIA guidelines continues to assist in water resources planning and
regulation and hence protection of water resources.
However, due to COVID-19 pandemic outbreak coupled with flooding of most rivers and lakes the department
did not meet all its targeted outputs as planned. Most of the last two quarters the focus was put on management
of the floods and its impacts.

Uganda Water and Environment Sector Performance Report 2020
121
9.4.4 Cross cutting water resources management initiatives
Implementation of catchment-based water resources management
a) Water Management Zone operations and implementation of the Catchment Management Plans
The Ministry of Water and Environment (MWE) through the Directorate of Water Resources Management
(DWRM) has since 2011 been operationalizing catchment-based integrated water resource management
(IWRM) throughout the country through the four Water Management Zones (WMZs) of Kyoga, Victoria, Albert
and Upper Nile.
The developed catchment management plans contain priority investment and management measures needed to
be implemented to protect and restore the catchment while improving people’s livelihoods in the various
catchments. Implementation of some of the priority measures in the CMPs is ongoing through either
collaboration between various stakeholders and the Water Management Zones or by stakeholders alone. The
zones have continued to implement some interventions in catchments with developed Catchment Management
Plans.
(I) ALBERT WATER MANAGEMENT ZONE (AWMZ)
The Albert Water Management Zone has continued implementing the Catchment Management Plans that were
developed since 2015. The Catchment Management Plans (CMP) highlight the vital socio-economical concerns
and identifies remedial measures in hotspot areas within Catchment. The implementation of the developed
CMPs has been guided by the constituted Catchment Management Committee (CMC) that comprises of a cross-
sectoral representation of stakeholders. The Catchment Management Plans developed to-date include: Mpanga,
Ruhezamyenda, Semliki, Kiiha, Nkusi, Muzizi, Mitano, and Nyamwamba and these have been developed through
active stakeholder engagement. In FY 2019/20 most interventions were implemented in the following
catchments among others i) Mpanga Catchment, ii) Semiliki Catchment, and iii) Kiiha Catchment.
Photo 9- 2: Demarcated riverbank zone, planted trees along the banks of River Mubuku and communities participating in wetland restoration
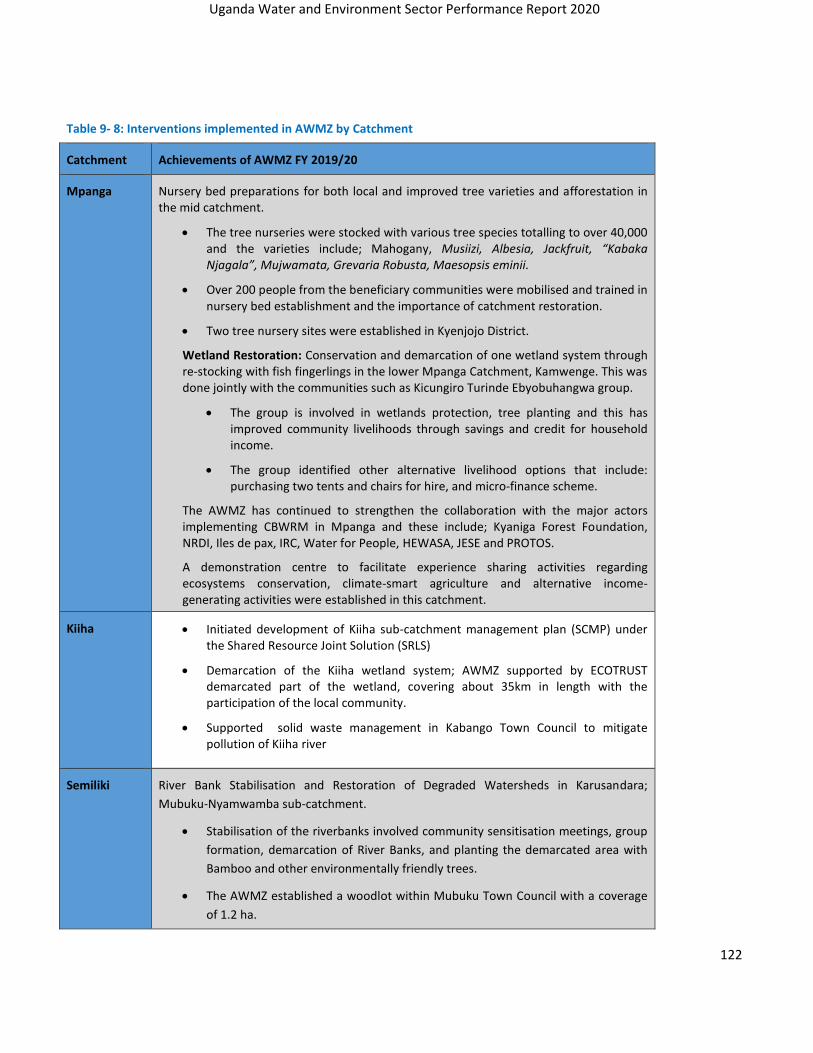
Uganda Water and Environment Sector Performance Report 2020
122
Table 9- 8: Interventions implemented in AWMZ by Catchment
Catchment Achievements of AWMZ FY 2019/20
Mpanga Nursery bed preparations for both local and improved tree varieties and afforestation in the mid catchment.
• The tree nurseries were stocked with various tree species totalling to over 40,000 and the varieties include; Mahogany, Musiizi, Albesia, Jackfruit, “Kabaka Njagala”, Mujwamata, Grevaria Robusta, Maesopsis eminii.
• Over 200 people from the beneficiary communities were mobilised and trained in nursery bed establishment and the importance of catchment restoration.
• Two tree nursery sites were established in Kyenjojo District.
Wetland Restoration: Conservation and demarcation of one wetland system through re-stocking with fish fingerlings in the lower Mpanga Catchment, Kamwenge. This was done jointly with the communities such as Kicungiro Turinde Ebyobuhangwa group.
• The group is involved in wetlands protection, tree planting and this has improved community livelihoods through savings and credit for household income.
• The group identified other alternative livelihood options that include: purchasing two tents and chairs for hire, and micro-finance scheme.
The AWMZ has continued to strengthen the collaboration with the major actors implementing CBWRM in Mpanga and these include; Kyaniga Forest Foundation, NRDI, Iles de pax, IRC, Water for People, HEWASA, JESE and PROTOS.
A demonstration centre to facilitate experience sharing activities regarding ecosystems conservation, climate-smart agriculture and alternative income-generating activities were established in this catchment.
Kiiha • Initiated development of Kiiha sub-catchment management plan (SCMP) under the Shared Resource Joint Solution (SRLS)
• Demarcation of the Kiiha wetland system; AWMZ supported by ECOTRUST demarcated part of the wetland, covering about 35km in length with the participation of the local community.
• Supported solid waste management in Kabango Town Council to mitigate pollution of Kiiha river
Semiliki River Bank Stabilisation and Restoration of Degraded Watersheds in Karusandara;
Mubuku-Nyamwamba sub-catchment.
• Stabilisation of the riverbanks involved community sensitisation meetings, group
formation, demarcation of River Banks, and planting the demarcated area with
Bamboo and other environmentally friendly trees.
• The AWMZ established a woodlot within Mubuku Town Council with a coverage
of 1.2 ha.

Uganda Water and Environment Sector Performance Report 2020
123
• Over 2,545 tree seedlings (Grevillea grandis, Markhamia lutea and Bathedavia
javanica) were planted on different demonstration sites along the river Mubuku
banks
Photo 9- 3: Interventions in implementation of CMPs such as re-stocking of fish, demarcation of wetlands and community participation in environment protection
Photo 9- 4: Launching of native tree nurseries in Muzizi and Mpanga Catchment
(II) VICTORIA WATER MANAGEMENT ZONE (VWMZ)
Victoria WMZ has continued to implement a stakeholders driven Catchment Based Integrated Water Resources Management (CbIWRM) in its various catchments of Rwizi, Kagera, Inner Murchsion bay and Katonga. The implementation of the developed CMPs has been guided by the constituted Catchment Management Committee (CMC) and Sub catchment management committees that comprises of a cross-sectoral representation of

Uganda Water and Environment Sector Performance Report 2020
124
stakeholders. The Catchment Management Plans developed to-date include Rwizi, Kagera (Maziba) and Katonga and these have been developed through active stakeholder engagement. In FY 2019/20 most interventions were implemented in the catchments highlighted in table 9-9 below. Furthermore, with support from AB InBev a parent company for Nile Breweries Limited Uganda, the Ministry of Water and Environment through Victoria water management Zone, partnered with World Wide Fund for Nature (WWF-UCO) to implement full landscape interventions in the Rwizi Catchment. The project is called “multi-stakeholder partnerships for water stewardship and community livelihoods in the Rwizi Catchment” the vision of the project is to restore the integrity and quality of priority water sources within R. Rwizi catchment by 2035 and the project outputs aim at implementing landscape interventions in highly degraded ecosystems and demarcation of the river buffer zone.
Table 9- 9: Interventions implemented in VWMZ by Catchment
Catchment Achievements of VWMZ FY 2019/20
Rwizi • 30 people trained in conservation and mitigation of the impacts of land and ecosystem
degradation in Kakigani micro catchment.
• Identified land in Bubale, Kakigani Church of Uganda, and Kamabale in Kakigani micro catchment for tree planting and tracing as a measure for flood control.
• Held a meeting with Rwizi CMC to review the Rwizi CMP and this was done in partnership with ACORD.
• Supervised the development of river bank and buffer zones utilisation plan in Rwizi catchment.
• Provided support to 10 District Water Officers in implementing water source protection measures.
• Task force and sub CMC for Kakigani micro catchment were formed.
• Undertook monitoring of the progress of implementation of interventions in the restored micro catchments of Kabingo, Kakondo and Masyoro.
Katonga and inner
Murchison bay
• Assessment of areas affected by flooding and mudslides was undertaken in the districts of Rakai, Kiruhura, Namayingo, Busia and Mayuge.
• Identified hotspot areas for possible interventions such as River bank and wetland restoration, afforestation and source protection measures.
Kagera (Maziba Sub-
catchment)
• Launched and disseminated the popular version and revised catchment management planning guidelines for Maziba.
Tree planting
• Established3Tree Nurseries under Public Private Partnerships.
• 28 persons (13 males and 15 females) were trained as Trainings for Trainers (TOTs) in tree nursery bed establishment and management in Maziba catchment. The training targeted District Forest Officers, District Natural Resource Officers, Tree Nursery operators and representatives of selected women groups in Maziba.
• Trained 352 community members in tree planting in Maziba sub catchment.
• 38,170 assorted trees seedlings of pine, Grevellea, Alnus, bamboo, muzizi, and fruits trees were planted
Cooking stoves
• Training of women groups in improved Cooking stoves production and marketing in Maziba catchment commenced.
• 1734 community members were sensitized on the benefits of using improved cooking stoves.
• 164 students and pupils were sensitized on the advantages of using cooking stoves
• .203 community members have adopted the use of improved cooking stoves
• 4117 rocket Lorena and 311 shielded cooking stoves have been produced.
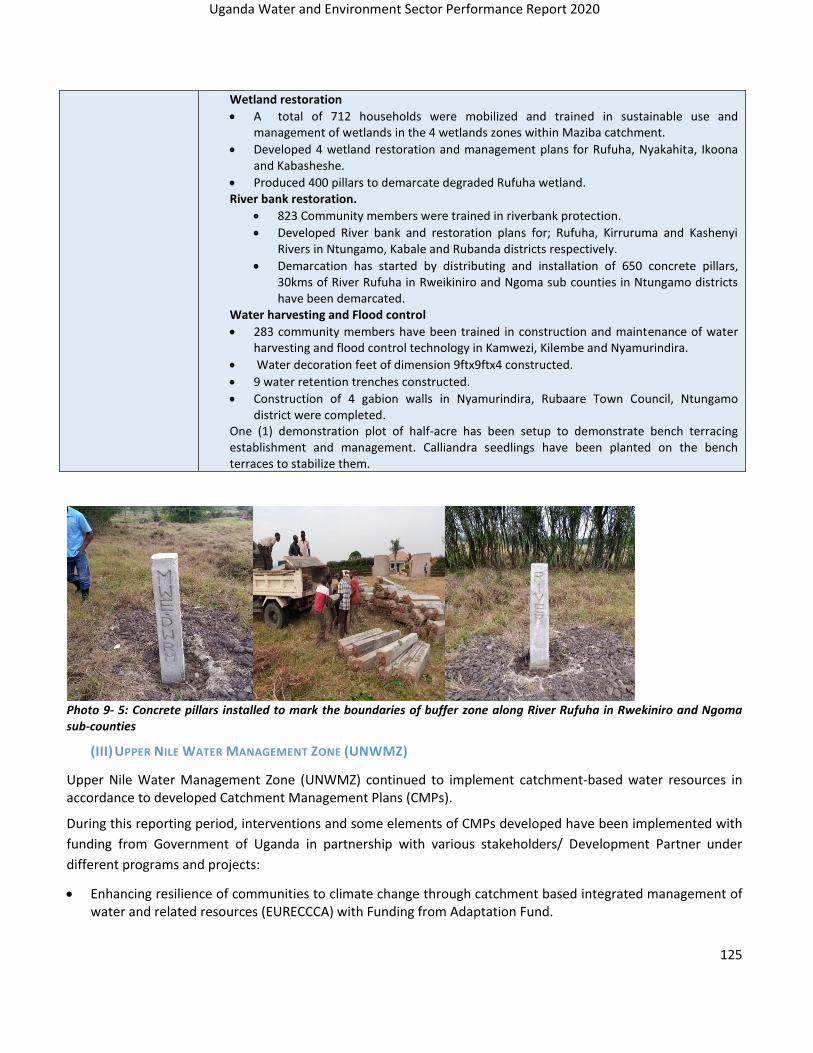
Uganda Water and Environment Sector Performance Report 2020
125
Wetland restoration
• A total of 712 households were mobilized and trained in sustainable use and management of wetlands in the 4 wetlands zones within Maziba catchment.
• Developed 4 wetland restoration and management plans for Rufuha, Nyakahita, Ikoona and Kabasheshe.
• Produced 400 pillars to demarcate degraded Rufuha wetland. River bank restoration.
• 823 Community members were trained in riverbank protection.
• Developed River bank and restoration plans for; Rufuha, Kirruruma and Kashenyi Rivers in Ntungamo, Kabale and Rubanda districts respectively.
• Demarcation has started by distributing and installation of 650 concrete pillars, 30kms of River Rufuha in Rweikiniro and Ngoma sub counties in Ntungamo districts have been demarcated.
Water harvesting and Flood control
• 283 community members have been trained in construction and maintenance of water harvesting and flood control technology in Kamwezi, Kilembe and Nyamurindira.
• Water decoration feet of dimension 9ftx9ftx4 constructed.
• 9 water retention trenches constructed.
• Construction of 4 gabion walls in Nyamurindira, Rubaare Town Council, Ntungamo district were completed.
One (1) demonstration plot of half-acre has been setup to demonstrate bench terracing establishment and management. Calliandra seedlings have been planted on the bench terraces to stabilize them.
Photo 9- 5: Concrete pillars installed to mark the boundaries of buffer zone along River Rufuha in Rwekiniro and Ngoma sub-counties
(III) UPPER NILE WATER MANAGEMENT ZONE (UNWMZ)
Upper Nile Water Management Zone (UNWMZ) continued to implement catchment-based water resources in accordance to developed Catchment Management Plans (CMPs).
During this reporting period, interventions and some elements of CMPs developed have been implemented with
funding from Government of Uganda in partnership with various stakeholders/ Development Partner under
different programs and projects:
• Enhancing resilience of communities to climate change through catchment based integrated management of water and related resources (EURECCCA) with Funding from Adaptation Fund.
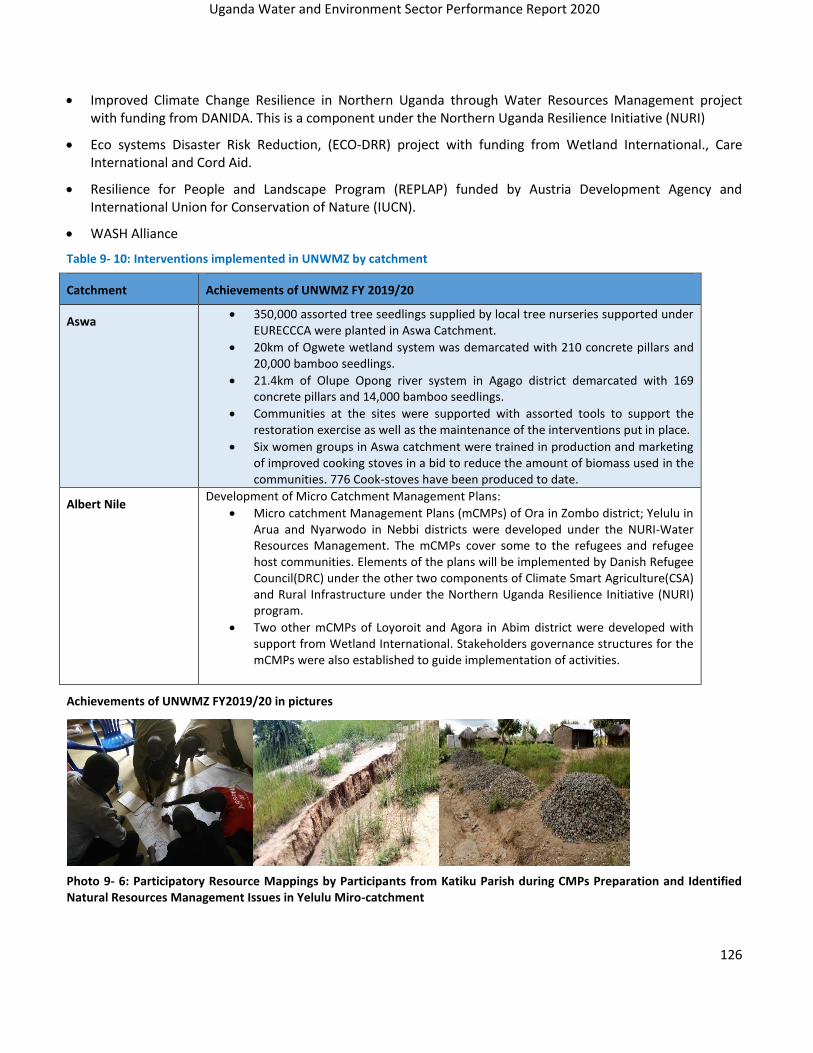
Uganda Water and Environment Sector Performance Report 2020
126
• Improved Climate Change Resilience in Northern Uganda through Water Resources Management project with funding from DANIDA. This is a component under the Northern Uganda Resilience Initiative (NURI)
• Eco systems Disaster Risk Reduction, (ECO-DRR) project with funding from Wetland International., Care International and Cord Aid.
• Resilience for People and Landscape Program (REPLAP) funded by Austria Development Agency and International Union for Conservation of Nature (IUCN).
• WASH Alliance
Table 9- 10: Interventions implemented in UNWMZ by catchment
Catchment Achievements of UNWMZ FY 2019/20
Aswa • 350,000 assorted tree seedlings supplied by local tree nurseries supported under
EURECCCA were planted in Aswa Catchment.
• 20km of Ogwete wetland system was demarcated with 210 concrete pillars and 20,000 bamboo seedlings.
• 21.4km of Olupe Opong river system in Agago district demarcated with 169 concrete pillars and 14,000 bamboo seedlings.
• Communities at the sites were supported with assorted tools to support the restoration exercise as well as the maintenance of the interventions put in place.
• Six women groups in Aswa catchment were trained in production and marketing of improved cooking stoves in a bid to reduce the amount of biomass used in the communities. 776 Cook-stoves have been produced to date.
Albert Nile Development of Micro Catchment Management Plans:
• Micro catchment Management Plans (mCMPs) of Ora in Zombo district; Yelulu in Arua and Nyarwodo in Nebbi districts were developed under the NURI-Water Resources Management. The mCMPs cover some to the refugees and refugee host communities. Elements of the plans will be implemented by Danish Refugee Council(DRC) under the other two components of Climate Smart Agriculture(CSA) and Rural Infrastructure under the Northern Uganda Resilience Initiative (NURI) program.
• Two other mCMPs of Loyoroit and Agora in Abim district were developed with support from Wetland International. Stakeholders governance structures for the mCMPs were also established to guide implementation of activities.
Achievements of UNWMZ FY2019/20 in pictures
Photo 9- 6: Participatory Resource Mappings by Participants from Katiku Parish during CMPs Preparation and Identified Natural Resources Management Issues in Yelulu Miro-catchment

Uganda Water and Environment Sector Performance Report 2020
127
Photo 9- 7: Demarcation of Ogwete wetland in Otuke district will pillars and bamboo; Assorted seedlings distributed to 13 project beneficiaries in Kuju Sub-county, Amuria District witnessed by LC1, Parish Chief and District technical officers
(IV) KYOGA WATER MANAGEMENT ZONE (KWMZ)
Kyoga Water Management Zone (KWMZ) continued to implement its activities in partnership with various stakeholders within the catchments. During the reporting period, interventions and some elements of CMPs developed, continued to be implemented by Zone in partnership with various stakeholders within the catchments. The achievements were possible due to funding from Government of Uganda in partnership with various stakeholders/ Development Partners under different programs and projects namely:
• Enhancing resilience of communities to climate change through catchment based integrated management of water and related resources in Uganda (EURECCCA Project) with Funding from Adaptation Fund.
• Welthungerhilfe (WHH) that is implementing a number of interventions under a 3-year (2019-2021) project called Protection and Preservation of Lokere Water Catchment for Socio-economic Change in Karamoja and Teso, Uganda.
• Enhancing climate resilience through increased water for production capacities in Karamoja.
• Strengthening climate resilience and operation and maintenance of water supply systems of selected health centres in Karamoja.
Key achievements In FY 2019/20 majority of the activities under the implementation of the Catchment Management Plans were implemented in Awoja catchment under the EURECCCA project. Reforestation 155,435 assorted tree seedlings were distributed to individual farmers, communities and institutions for ecosystem restoration. The seedlings were planted in about 140ha of degraded land. Wetland restoration
25km of Ongino-Aakum wetland system in Ongino Sub County, Kumi District were demarcated with 250 concrete pillars.

Uganda Water and Environment Sector Performance Report 2020
128
Photo 9- 8: Awoja CMC Chairperson (LCV Kumi), other political leaders, district technical officers and communities
participate in the official launch and demarcation of Ongino Aakum wetland
Key Challenges
a) Inadequate resources to scale up the implementation of different intervention options identified during the environmental hotspot assessment.
b) Reduced engagement and support to CMC and Associations to continue with the monitoring of interventions.
c) Inadequate resource mobilisation guidelines to engage stakeholders that share water risk and opportunities in water resources and other natural resources.
d) COVID-19 pandemic that cause lockdown of all the activities in last quarter of FY 2019/20.
8.6.2 Planning and implementation of the water source protection guidelines
According to the Water Source Protection Guidelines (WSPG) 2013, each water infrastructure project is expected
to prepare and implement a Water Source Protection Plan. During the reporting period support continued to be
provided to various organisations and agencies in implementation of water source protection guidelines and
operationalization of 3% contribution by water infrastructure project for water source protection.
Four short course trainings targeting relevant staff in departments and agencies in the Ministry of Water and
Environment as well as relevant NGOs, local governments and other partners were conducted. The trainings
covered preparation and implementation of water sources protection plans using the Water source protection
guidelines and operationalization of 3% contribution to water source protection.
Piloting of the water source protection guidelines has been ongoing in 14 towns (8 under National Water and
Sewerage Corporation and 6 under Directorate of Water Development) with technical guidance and support from
the Directorate of Water Resources Management. Water Source Protection Plans of the 14 towns have been
completed and implementation has started in some of them.
It is now mandated as a form of implementation of water source protection guidelines, that development and
implementation of water source protection plan is one of the conditions for all new and renewed water use
permits. This will easily enable Directorate of Water Resources Management to enforce and operationalise WSPG
to all water related infrastructure developments.
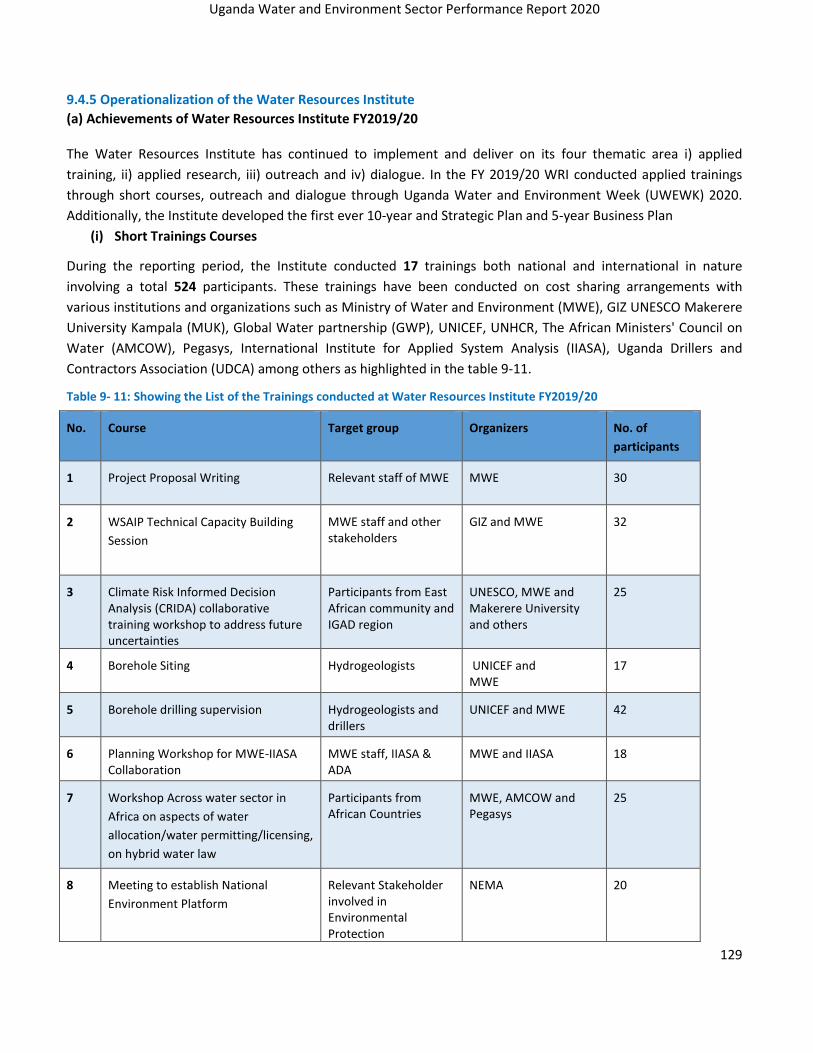
Uganda Water and Environment Sector Performance Report 2020
129
9.4.5 Operationalization of the Water Resources Institute
(a) Achievements of Water Resources Institute FY2019/20
The Water Resources Institute has continued to implement and deliver on its four thematic area i) applied
training, ii) applied research, iii) outreach and iv) dialogue. In the FY 2019/20 WRI conducted applied trainings
through short courses, outreach and dialogue through Uganda Water and Environment Week (UWEWK) 2020.
Additionally, the Institute developed the first ever 10-year and Strategic Plan and 5-year Business Plan
(i) Short Trainings Courses
During the reporting period, the Institute conducted 17 trainings both national and international in nature
involving a total 524 participants. These trainings have been conducted on cost sharing arrangements with
various institutions and organizations such as Ministry of Water and Environment (MWE), GIZ UNESCO Makerere
University Kampala (MUK), Global Water partnership (GWP), UNICEF, UNHCR, The African Ministers' Council on
Water (AMCOW), Pegasys, International Institute for Applied System Analysis (IIASA), Uganda Drillers and
Contractors Association (UDCA) among others as highlighted in the table 9-11.
Table 9- 11: Showing the List of the Trainings conducted at Water Resources Institute FY2019/20
No. Course Target group Organizers No. of
participants
1 Project Proposal Writing Relevant staff of MWE MWE 30
2 WSAIP Technical Capacity Building
Session
MWE staff and other stakeholders
GIZ and MWE 32
3 Climate Risk Informed Decision Analysis (CRIDA) collaborative training workshop to address future uncertainties
Participants from East African community and IGAD region
UNESCO, MWE and Makerere University and others
25
4 Borehole Siting Hydrogeologists UNICEF and MWE
17
5 Borehole drilling supervision Hydrogeologists and drillers
UNICEF and MWE 42
6 Planning Workshop for MWE-IIASA Collaboration
MWE staff, IIASA & ADA
MWE and IIASA 18
7 Workshop Across water sector in
Africa on aspects of water
allocation/water permitting/licensing,
on hybrid water law
Participants from African Countries
MWE, AMCOW and Pegasys
25
8 Meeting to establish National
Environment Platform
Relevant Stakeholder involved in Environmental Protection
NEMA 20

Uganda Water and Environment Sector Performance Report 2020
130
9 Training on Roads for Water Harvesting and Review of GCF CN
MWE Staff 25
10 Hydrogeological Investigations Engineers and hydrogeologists
UDCA and MWE 35
11 Pan-Africa Training on International
Water Law and Water Governance
for improved transboundary water
investment in Africa
Transboundary water practitioners from African countries
MWE, WRI, GWP, CapNet, UNDP, MUK, ANBO, UNECE, UNESCO, GIZ, NEPAD and others
55
12 WSAIP Technical Capacity Building
Session
MWE staff and other stakeholders
GIZ and MWE 27
13 Using IWRM as a Tool for Water
Resources Development and
Management
Relevant staff of MWE MWE 45
14 “Exploring Transition Management
approach for inclusive urban water
and sanitation services in Uganda
Experts across the
globe in urban water
and sanitation
management
MWE & MUK 40
15 Sharing Water quality experiences –
LEAF II Project with NELSAP
Water quality specialist
from Uganda and DR
Congo
MWE & NBI (LEAF II &
NELSAP)
32
16 Write-shop for abstract and full-
paper writing
Persons who
submitted abstracts for
UWEWK2020
MWE-WRI 30
17 Training and skilling of in the
rapporteurs
Selected Persons to
rapporteur in
UWEWK2020
MWE-WRI 26
(ii) Strategic and Business Plans for WRI
Preparation of a ten-year strategic plan and five-year business plan have been completed and printed for
dissemination. The 10 -year Strategic Plan will be implemented in three phases i) immediate investment covering
2019/2020 FY, ii) short term covering 2021/2024 FY and iii) medium term covering FY 2025/26 – FY2027/28
The 5-year Business Plan is designed for implementing the first five years of the Strategic Plan for WRI 2019-2024.
Under Business Plan the Water Resources Institute tends to: i) Costing and pricing of WRI’s products and services;

Uganda Water and Environment Sector Performance Report 2020
131
ii) Target market segments, clients, competitors and their characteristics, iii) Strategies to grow the market and
competitiveness- Strengthening WRI competitiveness iv) Establishing Partnerships and v) Resource mobilization.
(iii) Uganda Water and Environment Week (UWEWK 2020)
The Uganda Water and Environment Week (UWEWK) is a weeklong event that provides an interface for
knowledge exchange and dialogue on pertinent water resources issues among sector actors and other
stakeholders. UWEWK 2020 borrows from the successes and lessons from both UWEWK 2018 and UWEWK 2019.
This year the UWEWK was organised under the theme: “Water and Environment Resources for Inclusive-
Growth, Employment and Wealth Creation.” with 3 sub themes: i) Water and Environment Security for
Inclusive-growth, ii) Water and Environment for Employment and Wealth Creation and iii) Climate change and
achievement of NDP III goals. The overall goal of UWEWK 2020 was improved understanding of the importance
of sustainable management and development of water and environment resources in Sustainable
Industrialization for Inclusive-growth, Employment and Wealth Creation.
During the reporting period, only the pre-event activities were carried out. These pre-event activities included
decentralised UWEWK 2020 activities that were carried out in the de-concentrated regional structures of MWE
(WMZ, WSDF, TSUs) and Walking for Water, Environment and climate change from 10th to 20th March 2020
starting from Mabira Forest in Buikwe to Rwizi catchment in south western Uganda. This was considered
effective approach to broaden the scope and impact of the UWEWK. The actual events of the week were not
carried due to restrictions on gathering caused by COVID-19 pandemic. The highlights of the outcomes of the
activities conducted in de-concentrated regional structures of MWE and other aspects of the UWEWK.
Pre-event Activities for UWEWK 2020
Media talk shows and awareness campaigns across the country; held several radio talk shows, TV shows and
published newspaper articles to raise awareness and campaign on issues on water, environment and climate
change at national and regional levels.
The walk for water, environment and climate change; the Walker Association of Uganda (WAU) in partnership
with the Ministry of Water and Environment undertook approximately 330km walk from Najjembe Ecotourism
site in Mabira Central Forest Reserve (CFR), Buikwe district to River Rwizi catchment in Mbarara district from 10th
to 20th March 2020. The following were achieved throughout the route from Mabira CFR to Rwizi catchment:
• At least 5 schools along the Buikwe - Mbarara route were engaged on sustainable use of water and
environmental resources.
• At least 100,000 tree seedlings were planted or distributed to school and/or community members.
• At least 5 community sensitisation meetings on water and environment conservation were held;
• Support of local communities, local leaders, District Local Governments, (political and technical leaders), the
legislators, cultural and religious leaders, business community, schools, tree nursery operators natural
resource managers, CSOs, sustainable development and management of water and environment resources
was secured.

Uganda Water and Environment Sector Performance Report 2020
132
Clean up exercises or restoration activities organized by regional de-concentrated structures of the MWE and their partners in various locations to deal with key pressing issues in those regions; Four regional de-concentrated structures of the MWE (Mbarara, Mbale, Lira and Fort Portal) held the UWEWK activities in the week of 16th to 20th March 2020. These achievements included:
• Radio talk shows on localized issues and challenges of management and development of water and environment resources for inclusive growth.
• School children, communities and local leaders planted tree seedlings and restoration of riverbanks and wetlands. About 10,000 tree seedlings were distributed and planted by 15 schools in Entebbe Municipality.
• Awareness campaign on role of water and environment in sustainable industrialization for inclusive-growth, employment and wealth creation and achievement of National Development Plan 3.
• Cleaning up exercises were held in various municipalities and town in the de-concentrated structures following the needs of the communities.
• The symposium was held on 19th March 2020 on the centrality of water and environment resources in sustainable industrialization for inclusive-growth, employment and wealth creation in relation to catchment water resources management approach for Rwizi catchment
The sessions of the UWEWK are planned to be held online in September 2020.
Photo 9- 9: Some of the activities that took place during the Walk for Water, Environment and Climate Change from Mabira CFR to Rwizi Catchment in pictures
Photo 9- 10: Pre-event activities held in De-Concentrated Regional Structures of MWE and by Water Resources Institute in Entebbe as part of UWEWK2020 in pictures

Uganda Water and Environment Sector Performance Report 2020
133
9.5 Water Quality Management
9.5.1 Ambient water quality
The department operates a multi-objective water quality monitoring network comprising 119 stations covering major lakes and rivers in the country. The ambient water quality monitoring stations measure long term trends, pollution loads and ecological functioning of the water resources.
Ambient water quality monitoring is being undertaken by the Water Management Zones (WMZs) since 2011 with back up support provided by the center where required. Planned visits to each station is four times a year depending on availability of funding. If all visits are taken, a minimum of 476 water samples are collected annually. For the period under review, 54 visits were made and a total of 93 water samples only were collected out of the target of 476 samples. This represents a performance of 20% only. This performance was low compared to 431 water samples collected in the FY 2018/19. This was attributed to a reduction in funding for water quality data collection and implementation of field activities for only two quarters as a result of lockdown due to the Covid-19 pandemic. The table 9-12 presents the performance of WMZs with respect to water quality monitoring.
Table 9- 12: Performance of WMZs in Ambient Water Quality Monitoring
WMZ No. of stations Annual Target for samples
Achieved Performance (%)
Upper Nile 16 64 16 25
Albert 37 148 19 13
Kyoga 33 132 45 34
Victoria 33 132 13 10
Total 119 476 93
Water quality of Inner Murchison Bay
Inner Murchison Bay (IMB) is one of the pollution 'hotspots' on Lake Victoria. The bay has been receiving municipal and industrial wastewater, urban waste and storm run-off from Kampala city for over 50 years now. The bay is source of raw water for Ggaba water works that supplies Kampala city with drinking water. It is a hub for navigation through Port-bell where ferries connect Uganda to the rest of East Africa. There are many ot h e r economic activities including fisheries, hotels/tourism and recreation within the bay. IMB has become both a sink and source of pollution to the rest of the lake because the major wetland systems such as Nakivubo, Kansanga, Kinawataka, Kirinya have been encroached upon and long been destroyed, thus compromising the wetlands ability to perform most of its ecological functions such as filtering wastewater and flood stabilization. The obvious effects of pollution in the bay include eutrophication, invasion by water hyacinth and other invasive water weeds, fish kills resulting from toxic and anaerobic conditions, offensive smells and unattractive conditions for investment.

Uganda Water and Environment Sector Performance Report 2020
134
During the period under review, samples were taken from 20 monitoring sites in the bay on quarterly basis. A total of 192 integrated water samples from depth profiles were collected and water quality characteristics established. Key findings
i) The
bottom of the IMB consists of soft mud as a result of continued deposition of sediments from the catchment thus reducing the depth of the bay to less than 8 meters on average.
ii) The entire length of the Nakivubo channel right from Bat Valley to the entrance into the IMB has been grossly encroached on by settlements or cultivation that the vital role which the Nakivubo swamp provided for water purification is no more and the channel has become a net polluter to the bay.
iii) Analysis of water samples collected from the IMB showed presence chlopyrifos. Chlorpyrifos is an organophosphate insecticide, acaricide and miticide. Among 50 farm pesticides studied, chlorpyrifos was one of two found to be associated with higher risks of lung cancer among frequent pesticide applicators.
iv) Sediment samples showed presence of toxic metals from monitoring sites close to the shores. Samples collected near the entrance of the Nakivubo Channel and close to Ggaba and Port Bell pier particularly showed significant levels of 3 toxic metals namely lead, arsenic and chromium.
v) Light attenuation in the bay ranged from 0.2 m to 0.9 m measured as secchi depth. This result correlates very well with total suspended solids which on average was as high as 185mg/l. High suspended solids cover breeding sites for fish and affect fish visibility thereby affecting fisheries in the bay.
vi) Inspection of the protected buffer zone within the IMB showed that several settlements had been constructed within the 200 meters of the shoreline. Some of these properties were affected by the recent rise in water levels of Lake Victoria.
vii) The IMB is highly eutrophic with water samples showing phosphates levels as high as 1.75mg/l as phosphate and nitrate levels as high as 3.74mg/l as nitrogen.
viii) Algal blooms in the IMB have become more frequent with the introduction of cage fish farms in the bay.
Figure 9- 19: Monitoring sites in the IMB
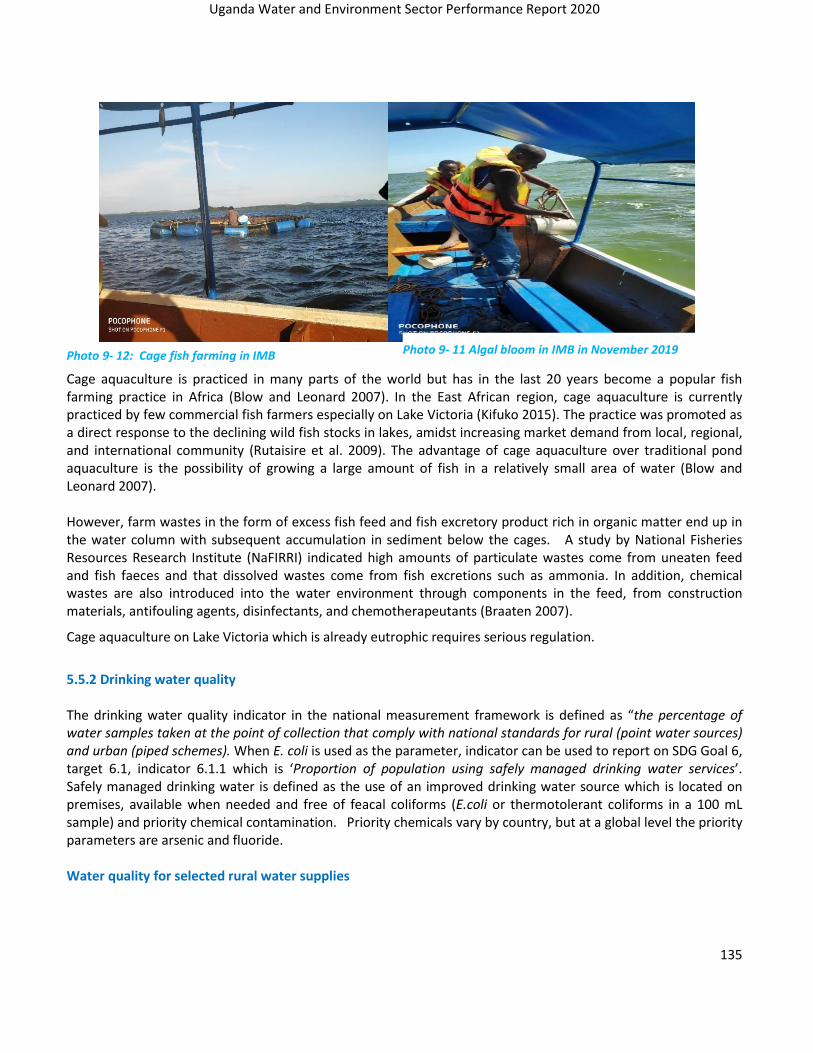
Uganda Water and Environment Sector Performance Report 2020
135
Photo 9- 12: Cage fish farming in IMB
Cage aquaculture is practiced in many parts of the world but has in the last 20 years become a popular fish farming practice in Africa (Blow and Leonard 2007). In the East African region, cage aquaculture is currently practiced by few commercial fish farmers especially on Lake Victoria (Kifuko 2015). The practice was promoted as a direct response to the declining wild fish stocks in lakes, amidst increasing market demand from local, regional, and international community (Rutaisire et al. 2009). The advantage of cage aquaculture over traditional pond aquaculture is the possibility of growing a large amount of fish in a relatively small area of water (Blow and Leonard 2007). However, farm wastes in the form of excess fish feed and fish excretory product rich in organic matter end up in the water column with subsequent accumulation in sediment below the cages. A study by National Fisheries Resources Research Institute (NaFIRRI) indicated high amounts of particulate wastes come from uneaten feed and fish faeces and that dissolved wastes come from fish excretions such as ammonia. In addition, chemical wastes are also introduced into the water environment through components in the feed, from construction materials, antifouling agents, disinfectants, and chemotherapeutants (Braaten 2007).
Cage aquaculture on Lake Victoria which is already eutrophic requires serious regulation.
5.5.2 Drinking water quality The drinking water quality indicator in the national measurement framework is defined as “the percentage of water samples taken at the point of collection that comply with national standards for rural (point water sources) and urban (piped schemes). When E. coli is used as the parameter, indicator can be used to report on SDG Goal 6, target 6.1, indicator 6.1.1 which is ‘Proportion of population using safely managed drinking water services’. Safely managed drinking water is defined as the use of an improved drinking water source which is located on premises, available when needed and free of feacal coliforms (E.coli or thermotolerant coliforms in a 100 mL sample) and priority chemical contamination. Priority chemicals vary by country, but at a global level the priority parameters are arsenic and fluoride. Water quality for selected rural water supplies
Photo 9- 11 Algal bloom in IMB in November 2019

Uganda Water and Environment Sector Performance Report 2020
136
Rural water supply systems, for purposes of reporting water quality, means improved water supply technologies such as deep wells, shallow wells, protected springs, dug wells and rain water collected for use from a single point (point source).
A total of 629 water samples were collected during the period under review. This was a decline from 1,107 water samples collected in the FY 2018/19. 67% of the samples taken from rural water sources complied with E. coli compared with 64% in the previous year. The difference in compliance may be due to low number of samples.
Water safety by technology type indicated 81% of boreholes, 55% of shallow wells and only 37% of protected springs had safe water for drinking based on compliance to bacteriological safety or E. coli (see figure 9-20 below).
Figure 9- 20: Compliance to E. coli by Technology
Water quality in Informal Settlements in Wakiso
A good percentage of informal settlements in Kampala and Entebbe and small business establishments use protected springs for domestic water supply.
A total of 179 water samples were collected from protected springs in twenty-eight parishes from the five divisions of Kampala (Central, Kawempe, Makindye, Nakawa and Rubaga) and two municipalities of Entebbe and Makindye Sebagabo in Wakiso district and the results are displayed in figure 9-21.
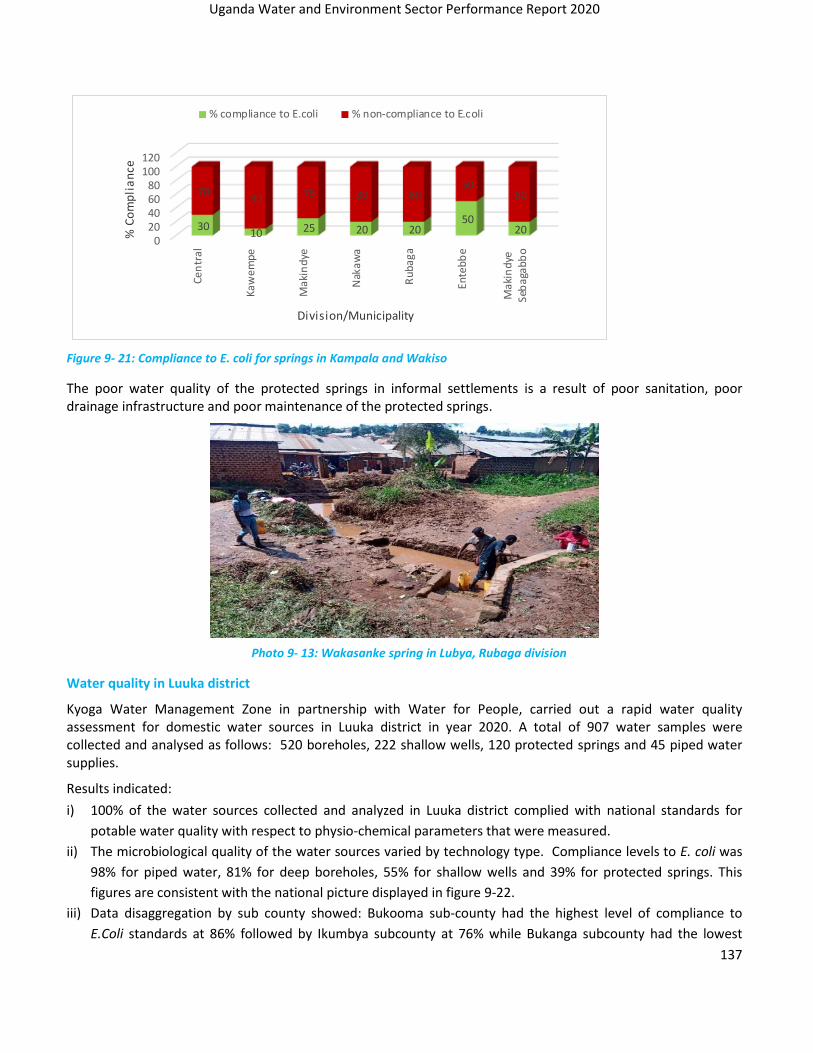
Uganda Water and Environment Sector Performance Report 2020
137
020406080
100120
Cen
tral
Ka
we
mp
e
Ma
kin
dye
Nak
awa
Rub
aga
Ente
bb
e
Mak
indy
eSe
bag
abb
o
3010 25 20 20
5020
7090 75 80 80
5080
% C
om
pli
an
ce
Division/Municipality
% compliance to E.coli % non-compliance to E.coli
Figure 9- 21: Compliance to E. coli for springs in Kampala and Wakiso
The poor water quality of the protected springs in informal settlements is a result of poor sanitation, poor drainage infrastructure and poor maintenance of the protected springs.
Photo 9- 13: Wakasanke spring in Lubya, Rubaga division
Water quality in Luuka district
Kyoga Water Management Zone in partnership with Water for People, carried out a rapid water quality assessment for domestic water sources in Luuka district in year 2020. A total of 907 water samples were collected and analysed as follows: 520 boreholes, 222 shallow wells, 120 protected springs and 45 piped water supplies.
Results indicated:
i) 100% of the water sources collected and analyzed in Luuka district complied with national standards for
potable water quality with respect to physio-chemical parameters that were measured.
ii) The microbiological quality of the water sources varied by technology type. Compliance levels to E. coli was
98% for piped water, 81% for deep boreholes, 55% for shallow wells and 39% for protected springs. This
figures are consistent with the national picture displayed in figure 9-22.
iii) Data disaggregation by sub county showed: Bukooma sub-county had the highest level of compliance to
E.Coli standards at 86% followed by Ikumbya subcounty at 76% while Bukanga subcounty had the lowest
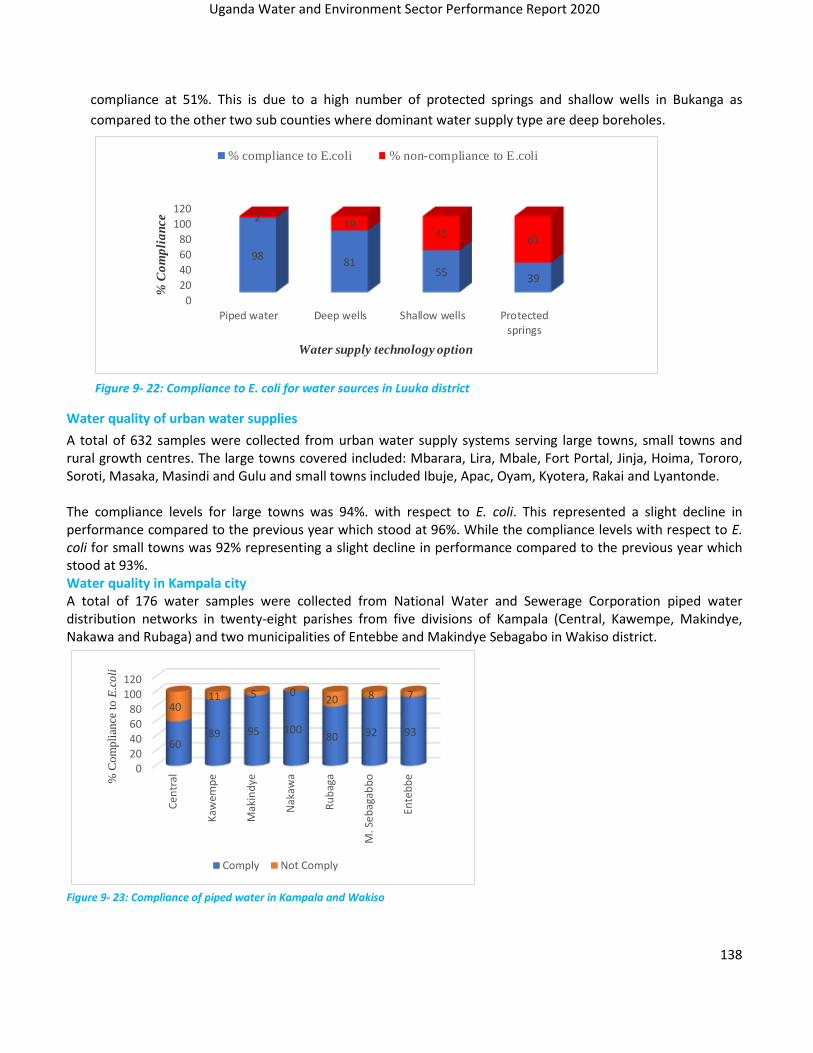
Uganda Water and Environment Sector Performance Report 2020
138
compliance at 51%. This is due to a high number of protected springs and shallow wells in Bukanga as
compared to the other two sub counties where dominant water supply type are deep boreholes.
0
20
40
60
80
100
120
Piped water Deep wells Shallow wells Protectedsprings
9881
5539
219
4561
% C
om
pli
an
ce
Water supply technology option
% compliance to E.coli % non-compliance to E.coli
Figure 9- 22: Compliance to E. coli for water sources in Luuka district
Water quality of urban water supplies
A total of 632 samples were collected from urban water supply systems serving large towns, small towns and rural growth centres. The large towns covered included: Mbarara, Lira, Mbale, Fort Portal, Jinja, Hoima, Tororo, Soroti, Masaka, Masindi and Gulu and small towns included Ibuje, Apac, Oyam, Kyotera, Rakai and Lyantonde. The compliance levels for large towns was 94%. with respect to E. coli. This represented a slight decline in performance compared to the previous year which stood at 96%. While the compliance levels with respect to E. coli for small towns was 92% representing a slight decline in performance compared to the previous year which stood at 93%. Water quality in Kampala city A total of 176 water samples were collected from National Water and Sewerage Corporation piped water distribution networks in twenty-eight parishes from five divisions of Kampala (Central, Kawempe, Makindye, Nakawa and Rubaga) and two municipalities of Entebbe and Makindye Sebagabo in Wakiso district.
020406080
100120
Cen
tral
Kaw
emp
e
Mak
ind
ye
Nak
awa
Ru
bag
a
M. S
eb
agab
bo
Ente
bb
e
6089 95 100
80 92 93
4011 5 0
20 8 7
% C
om
pli
ance
to
E.c
oli
Comply Not Comply
Figure 9- 23: Compliance of piped water in Kampala and Wakiso
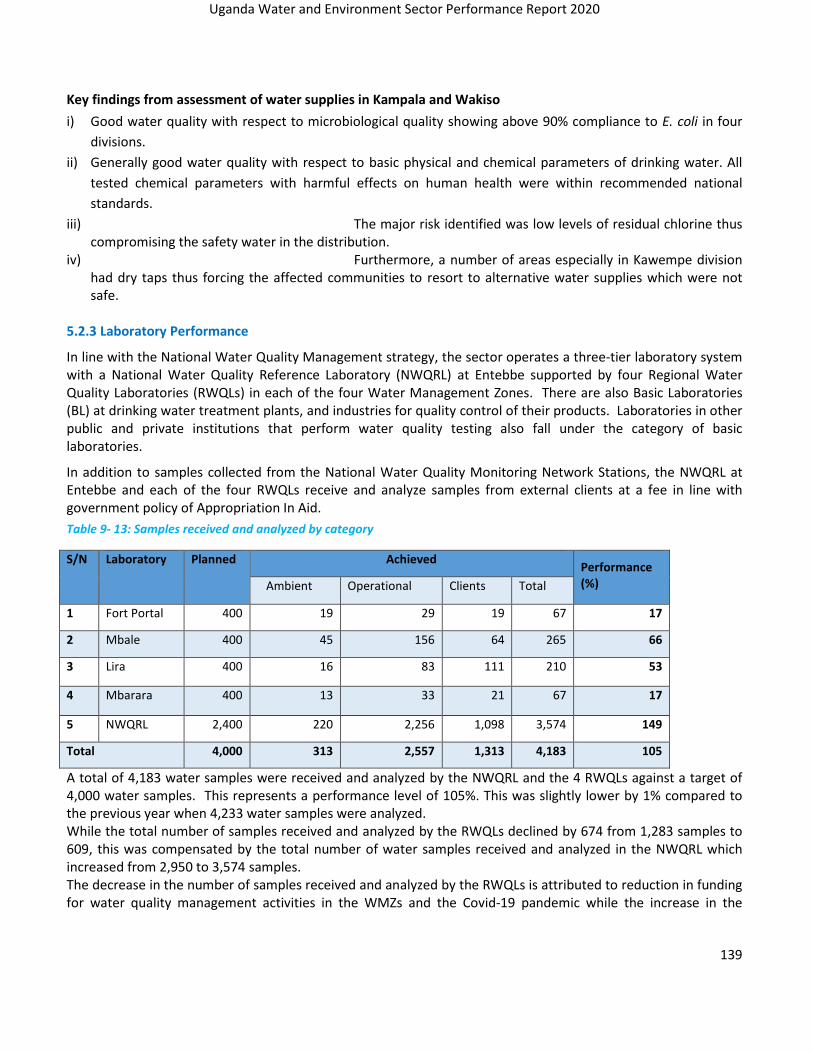
Uganda Water and Environment Sector Performance Report 2020
139
Key findings from assessment of water supplies in Kampala and Wakiso
i) Good water quality with respect to microbiological quality showing above 90% compliance to E. coli in four
divisions.
ii) Generally good water quality with respect to basic physical and chemical parameters of drinking water. All
tested chemical parameters with harmful effects on human health were within recommended national
standards.
iii) The major risk identified was low levels of residual chlorine thus compromising the safety water in the distribution.
iv) Furthermore, a number of areas especially in Kawempe division had dry taps thus forcing the affected communities to resort to alternative water supplies which were not safe.
5.2.3 Laboratory Performance
In line with the National Water Quality Management strategy, the sector operates a three-tier laboratory system with a National Water Quality Reference Laboratory (NWQRL) at Entebbe supported by four Regional Water Quality Laboratories (RWQLs) in each of the four Water Management Zones. There are also Basic Laboratories (BL) at drinking water treatment plants, and industries for quality control of their products. Laboratories in other public and private institutions that perform water quality testing also fall under the category of basic laboratories.
In addition to samples collected from the National Water Quality Monitoring Network Stations, the NWQRL at Entebbe and each of the four RWQLs receive and analyze samples from external clients at a fee in line with government policy of Appropriation In Aid.
Table 9- 13: Samples received and analyzed by category
S/N Laboratory Planned Achieved Performance (%) Ambient Operational Clients Total
1 Fort Portal 400 19 29 19 67 17
2 Mbale 400 45 156 64 265 66
3 Lira 400 16 83 111 210 53
4 Mbarara 400 13 33 21 67 17
5 NWQRL 2,400 220 2,256 1,098 3,574 149
Total 4,000 313 2,557 1,313 4,183 105
A total of 4,183 water samples were received and analyzed by the NWQRL and the 4 RWQLs against a target of 4,000 water samples. This represents a performance level of 105%. This was slightly lower by 1% compared to the previous year when 4,233 water samples were analyzed. While the total number of samples received and analyzed by the RWQLs declined by 674 from 1,283 samples to 609, this was compensated by the total number of water samples received and analyzed in the NWQRL which increased from 2,950 to 3,574 samples. The decrease in the number of samples received and analyzed by the RWQLs is attributed to reduction in funding for water quality management activities in the WMZs and the Covid-19 pandemic while the increase in the
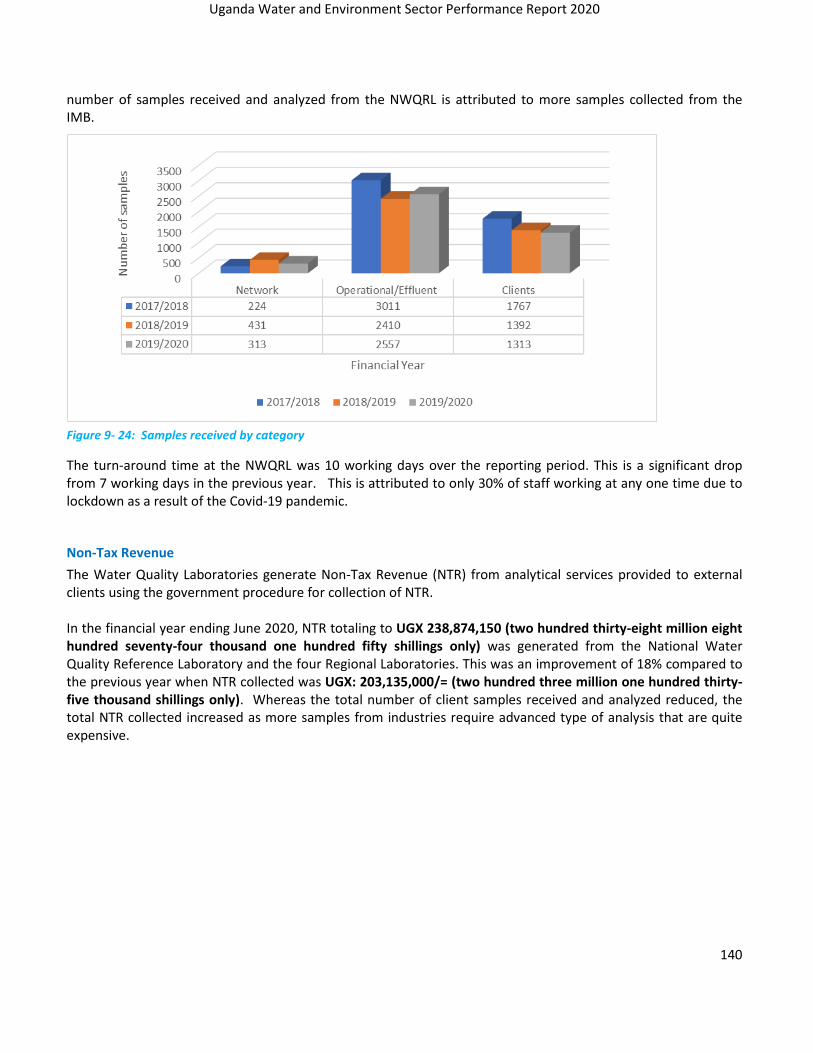
Uganda Water and Environment Sector Performance Report 2020
140
number of samples received and analyzed from the NWQRL is attributed to more samples collected from the IMB.
Figure 9- 24: Samples received by category
The turn-around time at the NWQRL was 10 working days over the reporting period. This is a significant drop from 7 working days in the previous year. This is attributed to only 30% of staff working at any one time due to lockdown as a result of the Covid-19 pandemic.
Non-Tax Revenue
The Water Quality Laboratories generate Non-Tax Revenue (NTR) from analytical services provided to external clients using the government procedure for collection of NTR. In the financial year ending June 2020, NTR totaling to UGX 238,874,150 (two hundred thirty-eight million eight hundred seventy-four thousand one hundred fifty shillings only) was generated from the National Water Quality Reference Laboratory and the four Regional Laboratories. This was an improvement of 18% compared to the previous year when NTR collected was UGX: 203,135,000/= (two hundred three million one hundred thirty-five thousand shillings only). Whereas the total number of client samples received and analyzed reduced, the total NTR collected increased as more samples from industries require advanced type of analysis that are quite expensive.

Uganda Water and Environment Sector Performance Report 2020
141
0.0
20.0
40.0
60.0
80.0
100.0
120.0
140.0
160.0
180.0
200.0
Fort Portal Mbale Lira Mbarara NWQRL
NT
R (
mil
lion
s)
Laboratory
2015/2016 2016/17 2017/18 2018/19 2019/20
Figure 9- 25: NTR collection
5.2.4 Wastewater quality A total of 151 wastewater samples was collected and analysed from industrial and municipal effluent discharge points in the year under review. This was an increase by 24% from 122 wastewater samples collected and analysed in FY 2018/19. Industries visited included food processing: fish, soft drinks, breweries, diaries, meat and oils and fats. Others included battery manufacturing, tanneries, cement, steel and pharmaceuticals. Effluent samples were also collected from flower farms and sewerage treatment plants. Compliance levels to Total Suspended Solids (TSS) and Chemical Oxygen Demand (COD) are displayed in figures 9-26 and 9-27. The quality of the wastewater depends on the type of industry.
Figure 9- 26: Compliance to TSS

Uganda Water and Environment Sector Performance Report 2020
142
Figure 9- 27: Compliance to COD
Key findings from monitoring of industrial and municipal discharges
i) Generally, compliance to the national wastewater effluent discharge standards is still very low. The average
compliance level was 30%.
ii) Many industrial establishments are reluctant in allowing compliance monitoring teams into their premises.
5.2.5 Water Quality Assessments Impact of Flooding The country experienced above normal rainfall during the year. As a result, water levels of the major surface water bodies including the Nile and Lake Victoria recorded above historical water levels. This caused flooding of shorelines, destruction of infrastructure, displacement of people and destruction of water sources and sanitation facilities. To support displaced persons affected by the flooding in the Rwenzori region, the department deployed a mobile water treatment unit and provided safe drinking water to over 250 displaced persons in Kanara sub-county in Ntoroko district for a period of 2 weeks.
Photo 9- 14: setting up mobile water treatment Photo 9- 15 system communities fetching treated water
COD Standard = 100 mg/litre

Uganda Water and Environment Sector Performance Report 2020
143
Following reports of fish kills in River Nile at Masindi Port, the department conducted a water quality assessment in Kitukuza and Kikaito villages in Waibango parish, Masindi Port sub-county in Kiryadongo district. It was established that hypoxic conditions caused by floating vegetation (floating papyrus (Cyperus9-14: sun drying fish harvested after the fish kills papyrus) and water hyacinth (Eichhornia crassipes) as a result of increased water release at Jinja caused oxygen depletion in the water column thus leading to suffocation and death of fish which was reported.
Photo 9- 16: Assessment of fish kill at Masindi Port Photo 9- 17: Dead fish floating on the water at Masindi Port
Assessment of cholera out-break in Moroto district
Cholera is a severe and acute diarrheal disease caused by vibrio cholerae. Cholera outbreaks often occur in poor communities with limited access to clean drinking water and inadequate sanitation. Two thirds of the estimated 2.8 million annual cholera cases and 88% of the 91,000 annual fatalities globally, occur in Sub-Saharan Africa. In late March 2020, a cholera outbreak was reported in Nandunget, Rupa and Katikekile sub-counties and in northern and southern divisions of Moroto municipality in Moroto district. Over 209 people were affected and 5 deaths were reported. In response to the outbreak, water quality tests were carried out for drinking water sources in the area in order to establish the transmission pathway. Results indicated that:
• 60% of the water sources visited were at high risk of contamination based on the sanitary risk assessment score.
• 40% of the point water sources (boreholes) sampled showed poor microbiological water quality with presence of E. coli detected.
• 2% of the piped water sites sampled showed poor microbiological water quality with presence of E. coli detected.
• Residents were advised to boil water for drinking or treat drinking water using chlorine tablets.
5.2.6 Challenges and Way forward
Challenges
i) Inadequate funding for water quality management activities and water quality infrastructure development.
ii) Low level of staffing.
iii) Dilapidated building and inadequate laboratory space at the NWQRL at Entebbe
iv) Inadequate capacities for water quality management in Refugee Hosting districts.

Uganda Water and Environment Sector Performance Report 2020
144
v) Poor compliance to and inadequate enforcement of water quality standards.
vi) Increasing pollution of water resources.
vii) Lack of accreditation of the NWQRL.
Way forward
i) Need for increased financing to the department for improved water quality management.
ii) Need to fast-track development of regulations for drinking water quality.
iii) The policy directive to DLGs to phase out shallow wells and protected springs should be enforced.
iv) All water treatment schemes in small towns should have as a minimum form of treatment a chlorination unit to ensure supply of safe water.
v) Cage aquaculture on Lake Victoria which is already eutrophic requires regulation.
9.6 International and transboundary water resources management
9.6.1 Introduction
MWE, through its International and Transboundary Water Affairs Department coordinates national efforts to manage shared water resources with the overall objective to secure and safeguard Uganda’s interests in the shared water resources and therefore ensure availability of water to meet her ecosystem and national development needs. The strategic areas of focus are through partnership and cooperative management initiatives through Lake Victoria Basin Commission, (LVBC), Nile Basin Initiative (NBI), Nile Equatorial Lakes Subsidiary Action Program (NELSAP), African Ministerial Council for Water (AMCOW), Inter-governmental Agency for Development (IGAD) Initiatives, Global Water Partnerships (GWP) and World Meteorological Organization (WMO). During the FY 2019/20, the following were the key outputs under International and Transboundary Water Affairs: Policy Reviews to account for national interest in trans-boundary water resources. Institutional reviews for improved management of cross-border river basins Coordinating Investments and Projects in trans-boundary basins and catchments
The overall progress made in International and Transboundary Water Affairs is shown below;
9.6.2 Trans-boundary agreements, laws, policies, standards
Cooperative Framework Agreement (CFA) for the Nile Basin countries NBI Partner states negotiated the Cooperative Framework Agreement (CFA), for the sustainable management and utilization of the shared Nile basin water resources, which has been signed by six (6) countries (Ethiopia, Rwanda, Tanzania, Kenya, Burundi and Uganda). Following Cabinet’s approval for Uganda to ratify the CFA, Uganda’s ratification documents have been deposited at the African Union Headquarters in Addis Ababa, Ethiopia. 9.6.3 Trans-boundary/cross border organizations coordinated, supported and are operational
A number of Trans-boundary organizations have continued to be supported through both financial contributions and or providing technical guidance as follows; Nile Basin Initiative (NBI) Nile Basin Initiative (NBI) was established in 1999 by 10 countries that share river Nile basin to harness the full potential of the common River Nile Basin water resources for sustainable Socio-economic development and has been instrumental in development of tools and projects for equitable utilization of the common Nile Basin water

Uganda Water and Environment Sector Performance Report 2020
145
resources of the partner states. Uganda hosts the NBI Secretariat. During the FY 2019/20, the following achievements were realised;
• The Government fulfilled part of its obligations to supporting international organisations by paying USD170,270 towards NBI operations and maintaining of the institution’s personnel and equipment and also governance meetings.
• Supported, by funding participation of Ministers and technical staff, various Governance meetings as follows; 1 Nile Council of Ministers’ meetings and 2 Nile Technical Committee meetings in Nairobi-Kenya and Khartoum - Sudan respectively. During these meetings policy and technical guidance was provided to the Nile Basin Initiative and its two investment programmes (Nile Equatorial Lakes Subsidiary Action Programme (NELSAP) & Eastern Nile Subsidiary Action Programme (ENSAP).
• The Ministry in conjunction with the Nile Equatorial Lakes Subsidiary Action Program (NELSAP) coordinated and participated in the training of 20 technical officers from the 10 Nile Basin countries and NELSAP Coordination Unit (6 women and 14 men), of which 2 officers were from Uganda in Climate Change financing and Resource mobilisation. Participants were drawn from the Sector and other line Ministries and Agencies of; Foreign Affairs, Internal Affairs, Defence and Veteran Affairs, East African Community Affairs, Finance, Planning and Economic Development, Works and Transport, Local Government, and Energy and Mineral Development. This helped in the building of the national capacities and enhancing skills for resources mobilisation for the implementation of the trans-boundary water resources programmes and activities.
• The department Supervised and coordinated the consultancy for the update and development as well as the review and validation of the Wetlands Management and Conservation Investment Plans of the trans-boundary wetlands of; Sio -Siteko (Kenya and Uganda), Sango Bay/ Minziro (Tanzania and Uganda) and Semliki Delta Wetland (DR Congo and Uganda). Final Management and Investment plans were reviewed and approved. The next step will be the actualisation/implementation of the Management and Investment plans for the 3 wetlands landscapes.
• Supported participation of Uganda in cooperative meetings and joint stakeholders for a, i.e. the Regional Nile Day celebrations 2020 and NBI-Donor Strategic Dialogue in Khartoum-Sudan. This greatly facilitated in enhancing awareness of the NBI’s achievements at country and regional level as well as creating the opportunity to reflect on successes and challenges of the last 21 years of trans-boundary cooperation on the Nile waters and also consolidating members’ commitment to the Basin cooperation agenda as laid out in the NBI’s 10 Year Strategy.
To note is that there has been increased participation in NBI activities at highest Political and technical levels. However, financial performance in form of annual contribution to NBI has remained at slightly below 50% thereby accumulating a lot of arrears to the organization and affecting its progress considering that Uganda is the host of NBI Secretariat. Lake Victoria Basin Commission (LVBC) EAC, through a protocol, established Lake Victoria Basin Commission (LVBC) to coordinate management and sustainable development of the Lake Victoria Basin. Government has supported LVBC governance meetings in One (1) Joint Policy Steering Committee Meeting and also availed technical staff to participate in various activities of LVBC. The department also continued to coordinate participation by various institutions and other stakeholders in LVBC
Projects and Programmes. These include; the Lake Victoria Basin Integrated Water Resources Management (LVB
– IWRM) Programme and Adapting to Climate Change in Lake Victoria Basin (ACC-LVB) Project, as well as
preparation of the third phase of Lake Victoria Environmental Management Project (LVEMP III) among others.
Joint Permanent Commissions
Uganda Water and Environment Sector Performance Report 2020
146
Joint Permanent Commissions are permanent and regular forums where two countries meet at the highest level.
The JPCs is a legal framework to deepen consultations and the existing cordial bilateral cooperation and
exchanges between two countries and encourage intensive dialogue, exchanges and implementation of
cooperative activities as well as strengthening institutional relationships pursuant to the JPC agreement. Further
instruments, projects and programmes are concluded and/or established to efficiently effect mutual cooperation
between the parties.
The department coordinates activities related to the water and environment sector in a number of JPCs. In the
period under review, the following activities were undertaken:
a. Facilitated cross border cooperation meetings between Uganda and Tanzanian where modalities for
development of a bulk water transfer system from River Kagera to serve border communities in Insigiro were
agreed upon. Uganda prepared an Environmental and Social Impact Assessment, as well as designs for the
intake works for the 8cm3/s water supply to be constructed at an abstraction point downstream of
Nshungenzi/Nsongezi Hydro Power Plant (HPP) but upstream of border point BP 27 along the UG-TZ border.
The ESIA report and design documents were shared with Tanzania for its validation.
b. Facilitated cross border cooperation meetings between Uganda and Democratic Republic of Congo on the
use of Lakes Albert and Edward, where DRC agreed to ratify the Nile CFA so as to bring in into effect.
Global Water Partnership (GWP)
The Uganda Water Partnership (UWP) is the national accredited entity of the Global Water Partnership in Uganda. The Ministry oversees and coordinates UWP activities. For the period under review, the department coordinated and participated in the preparation of a Concept Note for Strengthening Resilience to Climate Change impacts in the Albert Nile Catchment, Uganda to be funded under the Global Climate Fund (GCF). The main objective of the project is to implement proposed interventions in the Albert Nile Catchment Management Plan (CMP) that are of a transboundary nature.
African Ministerial Council for Water (AMCOW)
The African Ministers' Council on Water (AMCOW) was formed in 2002 in Abuja Nigeria, primarily to promote
cooperation, security, social and economic development and poverty eradication among member states through
the effective management of the continent’s water resources and provision of water supply services. The mission
of AMCOW is to provide political leadership, policy direction and advocacy in the provision, use and management
of water resources for sustainable social and economic development and maintenance of African ecosystems.
During this period, Uganda participated in the 12th Ordinary Session of the Executive Committee (EXCO) for
AMCOW in November 2019 in Abuja-Nigeria, where AMCOW’s Strategic and Operational Plan (2020-2024) was
adopted.
9.6.4 Trans-boundary Projects and Investments
Multinational Lakes Edward and Albert Integrated Fisheries and Water Resources Management (LEAF II) Project The Multinational Lakes Edward and Albert Integrated Fisheries and Water Resources Management (LEAF II) Project is implemented nationally by Uganda and Democratic Republic of Congo (DR Congo) on one hand through financing from the African Development Bank/Fund, and regionally by the Nile Basin Initiative (NBI)/Nile
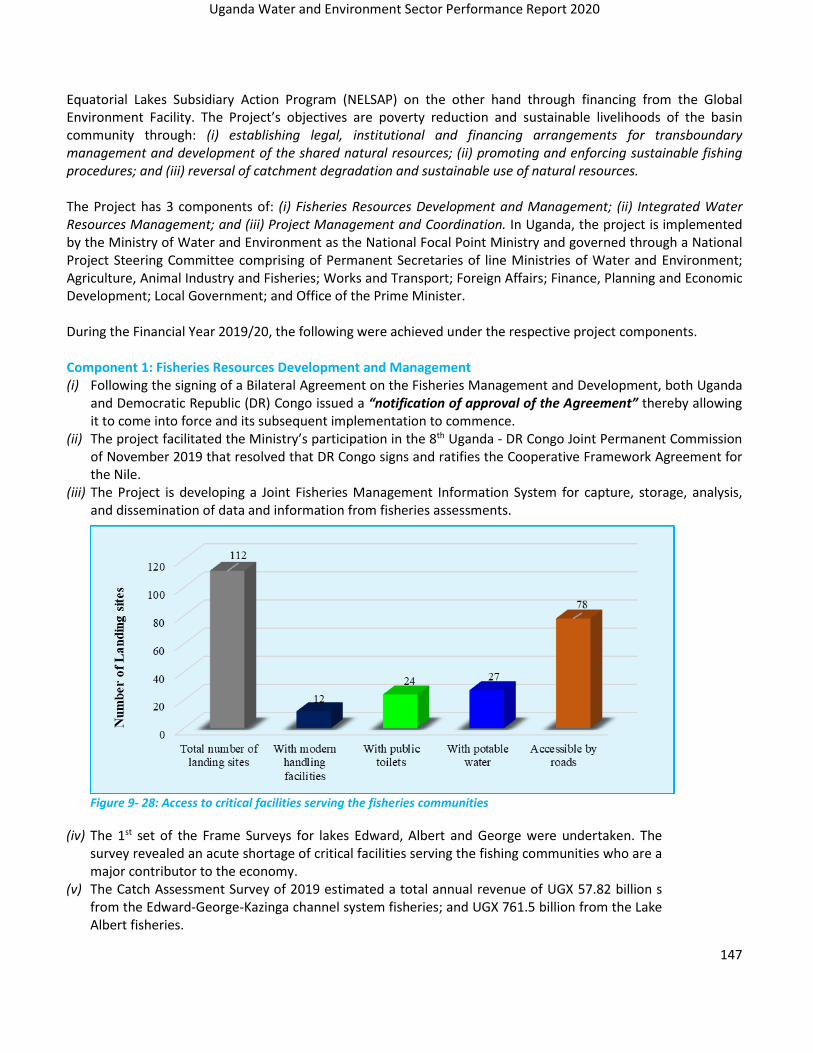
Uganda Water and Environment Sector Performance Report 2020
147
Equatorial Lakes Subsidiary Action Program (NELSAP) on the other hand through financing from the Global Environment Facility. The Project’s objectives are poverty reduction and sustainable livelihoods of the basin community through: (i) establishing legal, institutional and financing arrangements for transboundary management and development of the shared natural resources; (ii) promoting and enforcing sustainable fishing procedures; and (iii) reversal of catchment degradation and sustainable use of natural resources. The Project has 3 components of: (i) Fisheries Resources Development and Management; (ii) Integrated Water Resources Management; and (iii) Project Management and Coordination. In Uganda, the project is implemented by the Ministry of Water and Environment as the National Focal Point Ministry and governed through a National Project Steering Committee comprising of Permanent Secretaries of line Ministries of Water and Environment; Agriculture, Animal Industry and Fisheries; Works and Transport; Foreign Affairs; Finance, Planning and Economic Development; Local Government; and Office of the Prime Minister. During the Financial Year 2019/20, the following were achieved under the respective project components. Component 1: Fisheries Resources Development and Management (i) Following the signing of a Bilateral Agreement on the Fisheries Management and Development, both Uganda
and Democratic Republic (DR) Congo issued a “notification of approval of the Agreement” thereby allowing it to come into force and its subsequent implementation to commence.
(ii) The project facilitated the Ministry’s participation in the 8th Uganda - DR Congo Joint Permanent Commission of November 2019 that resolved that DR Congo signs and ratifies the Cooperative Framework Agreement for the Nile.
(iii) The Project is developing a Joint Fisheries Management Information System for capture, storage, analysis, and dissemination of data and information from fisheries assessments.
Figure 9- 28: Access to critical facilities serving the fisheries communities
(iv) The 1st set of the Frame Surveys for lakes Edward, Albert and George were undertaken. The survey revealed an acute shortage of critical facilities serving the fishing communities who are a major contributor to the economy.
(v) The Catch Assessment Survey of 2019 estimated a total annual revenue of UGX 57.82 billion s from the Edward-George-Kazinga channel system fisheries; and UGX 761.5 billion from the Lake Albert fisheries.

Uganda Water and Environment Sector Performance Report 2020
148
Figure 9- 29: Revenue generated from Lake Albert in 2019 presented by District
(vi) Information on aquatic biodiversity of Lakes Edward and Albert is very scanty, despite the importance of the information for classification, establishing and protecting fish spawning areas, controlling water pollution, and building the capacity of local institutions in conservation measures. To this end, the identification, characterization and mapping of fish breeding areas (lakeshore wetlands) was completed. The study identified a total 37 fragile ecosystems on Lake Edward (10 priority areas in Uganda) and 29 fragile ecosystems on Lake Albert (14 priority in Uganda) that need appropriate demarcation and protection. The outcome of this activity will be gazettement through legislation.
Figure 9- 30: Identified and mapped fish breeding areas within lakes Edward and Albert in Uganda

Uganda Water and Environment Sector Performance Report 2020
149
(vii) Aquaculture is prioritized as one of the potential alternative sources of livelihoods to address the deficit in fish supplies in view of the declining catches against increasing demand for fish both nationally, regionally and globally. The project conducted a comprehensive “assessment of the potential for cage aquaculture development”. The study identified 2 commercial aquaculture management areas on the Uganda side of Lake Edward with a carrying capacity of 2,270 tons of Nile tilapia while 6 areas were identified on the Uganda side of Lake Albert with a carrying capacity of 41,775 tons of Nile tilapia.
The project will establish a bilateral fisheries monitoring, control and surveillance (MCS) system that is sustainably funded. As part of the capacity needs enhancement, 15 fisheries officers from Buliisa, Hoima, Kagadi, Kamwenge, Kasese, Kanungu, Kibaale, Kikuube, Ntoroko, Pakwach, Rubirizi, and Rukungiri have undergone a 9 month training at the Law Development Centre, Uganda.
Photo 9- 18: Patrol boat on Lake Albert
Additionally, Standard Operating Procedures for joint surveillance operations were developed and harmonized by both Uganda and DR Congo. This will guide in the joint lake patrols aimed at preventing, deterring and eliminating illegal, unreported and unregulated fishing on the lakes Edward and Albert.
In the efforts to reduce post-harvest losses, improve fish quality and value addition, five fish landing sites are under construction in various districts including 19 modern smoking kilns, 21.4 kilometres of feeder roads to the facilities, 50 modern sun drying facilities (platforms/racks), 8 sanitation facilities and 4 solar powered mini water supply systems to the fishing communities. A total annual revenue of UGX 69 billion is estimated to be generated from the fish handled and processed through these facilities. In line with this development, community engagement and sensitization on the proposed infrastructure development is continuously conducted with appropriate management structure established for the operation and maintenance of the facilities.
The fish landing sites include:
a) Rwenshama landing site in Rukungiri District completed and commissioned by the Minister of State

Uganda Water and Environment Sector Performance Report 2020
150
for Fisheries under the Ministry of Agriculture, Animal Industry and Fisheries
b) Mahyoro landing site in Kitagwenda District completed and commissioned by the Minister of State for Fisheries under the Ministry of Agriculture, Animal Industry and Fisheries
c) Dei landing site in Pakwach District at 97% physical progress
d) Mbegu landing site in Hoima District at 98% physical progress

Uganda Water and Environment Sector Performance Report 2020
151
e) Kitebere landing site in Kagadi District at 80% physical progress
Component 2: Integrated Water Resources Management
1) The project facilitated the update and adoption of the Integrated Lake management Plan (ILMP) by Uganda and DR Congo. Through coordination by NELSAP, the ILMP was updated/developed with 7 comprehensive thematic sub plans on: (i) water resources management; (ii) fisheries and aquaculture; (iii) agriculture and livestock; (iv) hydro-power and electrification; (v) navigation and maritime safety; (vi) aquatic invasive weeds; and (vii) strategic basin infrastructure. Through this, the project was able to identify potential investment options, prioritize and sequence potential investments and other interventions, strengthen the regional knowledge base, and clearly elaborate the transboundary institutional arrangements (LEA Basin Commission).
2) Enhanced water quality monitoring is a key objective of the project to promote good health and provide adequate information on the physical, chemical, and biological characteristics of water and also water resources development. Through this, regional office block for the Ministry of Water and Environment and the regional water quality laboratory in Fort Portal was completed and commissioned by the Minister of Water and Environment.

Uganda Water and Environment Sector Performance Report 2020
152
3) The project is undertaking a bathymetry/ hydrographic survey of the lakes Edward and Albert. The resultant bathymetric maps and associated survey outputs will guide and strengthen fisheries research and its related sectoral activities; water resources planning and management; navigation and maritime safety; and other lake-based activities.
4) One of the key project outputs is preparing and implementing community-based integrated catchment management plans for selected catchments and strengthening local capacities on soil and water conservation. Five plans for catchment of transboundary significance are being developed for rivers Nkusi, Muzizi, Semliki, river Mitano, and Nyamwamba. Catchment Management Organizations comprising of Catchment Management Committees, Catchment Technical Committees and Catchment Stakeholder Forums have also been established.
Figure 9- 31: Analytical bathymetric map for Lake Albert
5) Implementation of catchment restoration interventions is ongoing in rivers’ catchments of Sebwe in Kasese District, Tokwe and Humya in Bundibugyo District, and Semiliki in Ntoroko District. To date, the project through close collaboration with the Districts and beneficiary communities have: (i) planted 207,400 trees as improvement to the basin vegetation cover; (ii) restored and protected 41km of river bank areas by fencing and planting bamboo;(iii) established 46km of soil and water conservation measures; (iv) setup 4 tree nursery beds with a total capacity of 61,580 trees; (iv) constructed 3 solar-powered mini water systems in Ntoroko District that incorporates public stand posts for domestic use and cattle watering troughs away from the protected river buffer zone.
September 2019 May 2020

Uganda Water and Environment Sector Performance Report 2020
153
September 2019 May 2020
Photo 9- 19: Restored banks of River Semiliki in Ntoroko
6) As part of the project efforts to contribute to reduced pressure on the fisheries and natural resources, the project is supporting:
a) Capacity building of fishing communities to adopt responsible fishing practices and modern processing techniques;
b) Community sensitization on alternative livelihoods for increased incomes;
c) 42 start-up enterprises established as incubators for alternative livelihoods.
Figure 9- 32: Gender spread of trainings and sensitization under the project
Angololo Multipurpose Project
The proposed Angololo Multi-purpose project is one of the trans-boundary projects identified under the NELSAP Sio-Malaba-Malakisi (SMM) River Basin Management Project. It is aimed at enabling the Republics of Kenya and Uganda to increase irrigated agriculture on 2,500 ha of land when fully developed. The project when implemented is expected to benefit at least 127,300 people from Tororo, Manafwa and Namisindwa districts in Uganda and Busia and Bungoma counties in Kenya directly or indirectly through creation of employment opportunities, agricultural production (irrigation), piped water supply, and livestock and fisheries production.
In the FY 2019/20, the project was launched in Entebbe –Uganda to ; inform stakeholders on its scope, objectives, study outputs and benefits. Consultants to undertake feasibility studies, detailed designs and preparation of tender

Uganda Water and Environment Sector Performance Report 2020
154
documents in addition to the Environmental and Social Impact Assessment (ESIA) and Resettlement and Compensation Action Plan (RCAP) were procured. Two community awareness creation and sensitization meetings were carried out in March 2020 in Busia County –Kenya and Tororo district-Uganda. The project studies are being funded by a grant from NEPAD Infrastructure Project Preparation Facility Special Fund (NEPAD IPPF Special fund) as well as co-funding from the governments of Uganda and Kenya to the tune of USD 75,000 each.
Support to Hydropower Project on River Nile in Uganda
The project aims at optimizing use of Lake Victoria for hydropower production at Owen Falls dam, as well as at downstream plants, while conferring benefits to other riparian countries. This is being achieved through development of the Nile Water Allocation Tool. The tool will guide the water resources regulation of the Nile within Uganda and provide information to guide national negotiations with riparian states on the Nile and Lake Victoria regarding the development of an adaptive “Agreed Curve”. WREM International is undertaking the development of the Nile Water Allocation Tool. During the period under review, the development of the tool progressed to 75% completion. This entailed completion of ; Tool A – Policy and Scenario Assessment/Planning Model: The purpose of this tool is to assess risks, costs and benefits of alternative lake regulation strategies, water and energy infrastructure development options, climate change scenarios, domestic energy demand and export scenarios and long-term management policies involving the water and energy sectors. Tool B: Seasonal Management Model: this tool is used to determine Lake and reservoir releases and energy generation levels that meet water resources management, hydropower generation and environmental interests while complying with regional agreements on the Nile. Tool D – Short Term Hydropower scheduling: The model is used to determine the power generation levels of individual turbines across the different power stations on the Nile in Uganda. The model optimises the deployment of installed turbines to meet two objectives (a) Meet national power demands and (b) adhere to water release limits issued by the Ministry of Water and Environment through the water use Permits. Outstanding work Completion of an Integrated Nile Decision Support System (DSS) Software; this software will incorporate all modules mentioned above into a single integrated system accessed through a user-friendly interface under the windows operating environment. The consultant is working on a second beta version of the Nile DSS Software, which is expected to be delivered to the Ministry in the in FY2020/21.
Putting the tool to test The tool (in this current development state) was used to generate forecasts on the rising water levels on Lake Victoria and the Nile system in Uganda for the March to May 2020 rainy season. The tool successfully simulated the rising water levels, flood inundation area and vulnerable infrastructure such as roads, settlements, schools, hospitals among others. The information was useful in informing the executive and the public on the rising water levels as well as a preliminary multi-sectoral national flood response plan. Lake Victoria Basin – Integrated Water Resource Management Project (LVB-IWRM) Implementation of the Lake Victoria Basin Integrated Water Resources Management (LVB-IWRM) Program was launched at a colourful ceremony on 15 February 2020, in Kisumu, Kenya. The LVB-IWRM programme is a

Uganda Water and Environment Sector Performance Report 2020
155
systematic cross-border approach for prioritization of pollution control investments; promote sustainable development and monitoring of the Lake Victoria water resource. Its overall objective is to improve water quality and availability through strategic and sustainable management of the LVB via regional IWRM investments and related measures. The regional Programme, which is funded by the European Union and Federal Government of Germany to a tune of €40m aims at reducing effluents into Lake Victoria through targeted High Priority infrastructure investments in the cities of Kigali in Rwanda; Mwanza,in Tanzania; Kampala in Uganda and Kisumu in Kenya. In Kampala, the programme is focusing on the construction of a large nature-orientated plant drainage system at
the mouth of the Nakivubo channel. The constructed wetland will act as a tertiary treatment facility for
“polishing” the Nakivubo drainage before pouring into Lake Victoria.
Why Nakivubo Wetland?
The Nakivubo Wetland cleans wastewater from Kampala prior to its discharge into Lake Victoria through the Inner Murchison Bay, at a point just upstream of the intake of the City’s water supply. Figure 9-33 shows the location of Nakivubo wetland in Kampala. Feeding the wetland is the Nakivubo Channel with an approximate length of 9km and drains approximately 25% of the surface area of (a catchment area of 50 km2). It traverses through highly populated informal areas of Makerere Kivulu, three busy markets in the city centre and the Kampala industrial area. The quality of the wastewater includes pollutants such as faecal waste from households and raised pit latrines, seepage from broken sewer lines, discharges from garages and washing bays, household and healthcare waste from communities and markets, other organic matter, heavy metals, nitrogen, phosphorus and other industrial wastes (from paint, soap and informal industries) and lastly storm water. The nature of the wastewater cleaned by the Nakivubo wetland therefore is a mix of partially treated sewage, storm water run-off, solid waste and raw sewage (see pictures below). The Nakivubo Wetland has been performing this role of cleaning wastewater from Kampala for more than 40 years. The rapid growth of Kampala has had far reaching impacts; and, one outcome, which is observable today, is degradation of the Nakivubo Wetland system which has compromised the cleaning efficiency of the wetland.
Photo 9- 20: Water Quality impression of the Nakivubo channel at the proposed site for the constructed wetland
Figure 9- 33: Location of Nakivubo Wetland in Kampala
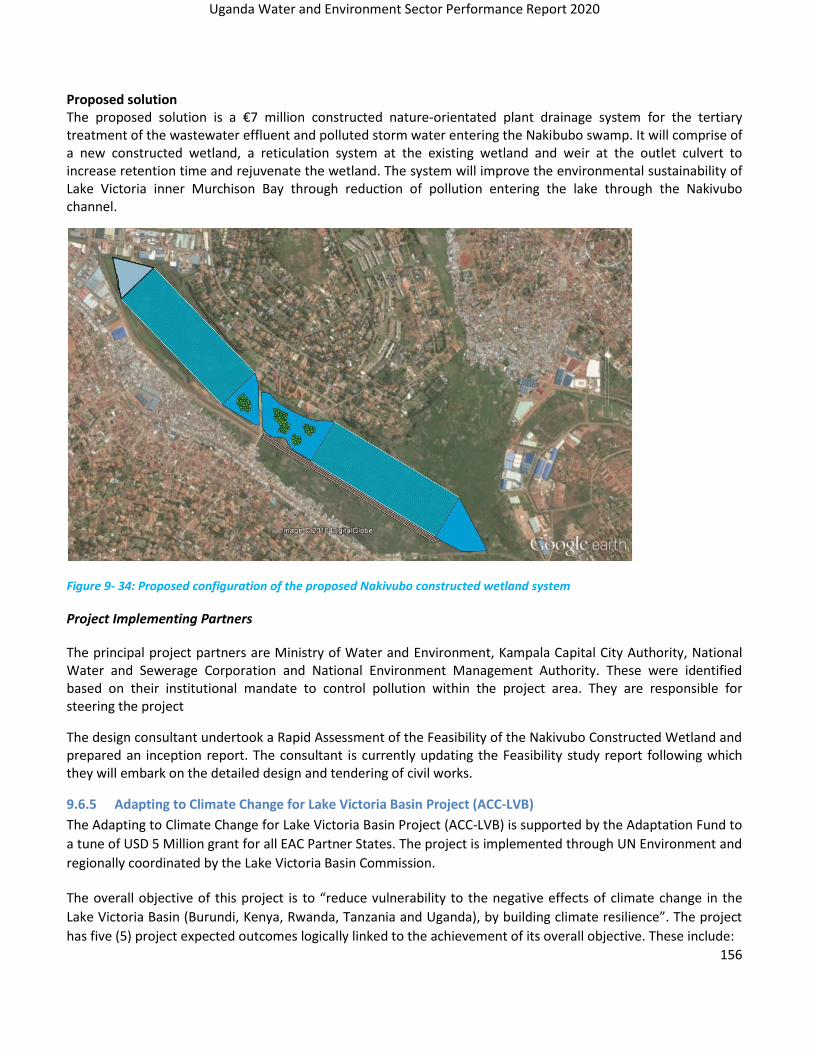
Uganda Water and Environment Sector Performance Report 2020
156
Proposed solution The proposed solution is a €7 million constructed nature-orientated plant drainage system for the tertiary treatment of the wastewater effluent and polluted storm water entering the Nakibubo swamp. It will comprise of a new constructed wetland, a reticulation system at the existing wetland and weir at the outlet culvert to increase retention time and rejuvenate the wetland. The system will improve the environmental sustainability of Lake Victoria inner Murchison Bay through reduction of pollution entering the lake through the Nakivubo channel.
Figure 9- 34: Proposed configuration of the proposed Nakivubo constructed wetland system
Project Implementing Partners
The principal project partners are Ministry of Water and Environment, Kampala Capital City Authority, National Water and Sewerage Corporation and National Environment Management Authority. These were identified based on their institutional mandate to control pollution within the project area. They are responsible for steering the project
The design consultant undertook a Rapid Assessment of the Feasibility of the Nakivubo Constructed Wetland and prepared an inception report. The consultant is currently updating the Feasibility study report following which they will embark on the detailed design and tendering of civil works.
9.6.5 Adapting to Climate Change for Lake Victoria Basin Project (ACC-LVB)
The Adapting to Climate Change for Lake Victoria Basin Project (ACC-LVB) is supported by the Adaptation Fund to
a tune of USD 5 Million grant for all EAC Partner States. The project is implemented through UN Environment and
regionally coordinated by the Lake Victoria Basin Commission.
The overall objective of this project is to “reduce vulnerability to the negative effects of climate change in the
Lake Victoria Basin (Burundi, Kenya, Rwanda, Tanzania and Uganda), by building climate resilience”. The project
has five (5) project expected outcomes logically linked to the achievement of its overall objective. These include:

Uganda Water and Environment Sector Performance Report 2020
157
a) Strengthened institutional capacity to integrate climate resilience into transboundary water catchment
management;
b) Improved delivery of accurate and timely climate information – with an emphasis on transboundary water
catchment management – to regional and national policymakers, technical officers and local communities;
c) Climate change adaptation technologies transferred to communities to reduce their vulnerability to
climate change;
d) Regional resilience to climate change promoted through innovative, community-based projects; and
e) Improved knowledge management frameworks for the collection and maintenance of regional knowledge
in transboundary water catchment management and climate change adaptation practices.
Uganda received USD 520,000 as part of the grant and the Department of International and Transboundary
Water Affairs under the Ministry of Water and Environment is coordinating implementation of national adaption
interventions in identified climate change hotspots in the districts of Mubende and Masaka. The project has four
(4) sites for project intervention, i.e., Kitooma and Buyaga in Masaka district, and Kyankungu and Kalungi in
Mubende district.
For the period under review, the project
i. Hosted workshops with communities at intervention sites selected in to identify specific climate change impacts and appropriate community-based adaptation interventions. Sensitisation workshops were held with communities at all the seven (7) sites that were considered prior to selection of priority intervention sites, including Bugere ‘A’ parish in Masaka, and Kashenyi and Kyakasa in Mubende as a means of giving feedback from the selection process to communities, and improving their knowledge on climate change impacts and adaptation in order to provide a stepping stone for the communities to participate in other climate change funded projects. Sensitisation and identification of specific climate change impacts and appropriate community-based adaptation was carried out for the four selected sites of Kitooma, Buyaga, Kyankungu and Kalungi. A total of 295 community members (165 male and 130 female) participated in the community workshops.
Photo 9- 21: Creating Awareness on Causes and Impacts Of Climate Change in Mijjunju Village - Masaka
Photo 9- 22: creating awareness on Eco-System Based Adaptation in Masaka District

Uganda Water and Environment Sector Performance Report 2020
158
ii. Provided training to local communities and relevant local-level government & NGOs on how to develop a sub-project proposals and the necessary financial, administrative and monitoring procedures for a small-scale project. The project carried out two community trainings, one each in Masaka and Mubende districts. The training focused on building the capacity of community groups and selected local NGOs in developing small-scale proposals, administrative and financial management of community-based small-scale projects, as well as self-monitoring and evaluation by communities.
Ten (10) community groups were trained in Masaka District and Fourteen (14) groups were trained in Mubende District. There were 108 participants (52 participants from Masaka District comprising of 25 M and 27 F, and 56 Participants from Mubende District comprising of 29 M and 27 F), inclusive of District Extension Workers and local NGOs. The community groups are intended to be an entry and contact point of the project to the communities, while a landscape approach will be applied during implementation of the small-scale projects. Technical aspects of training was carried out jointly by the National Project Team (NPT) and relevant district staff from the natural resources, finance, The trained community groups have submitted proposals that have been evaluated, and successful selected sub-projects will begin implementation of climate change adaptation technologies in FY 2020/21.
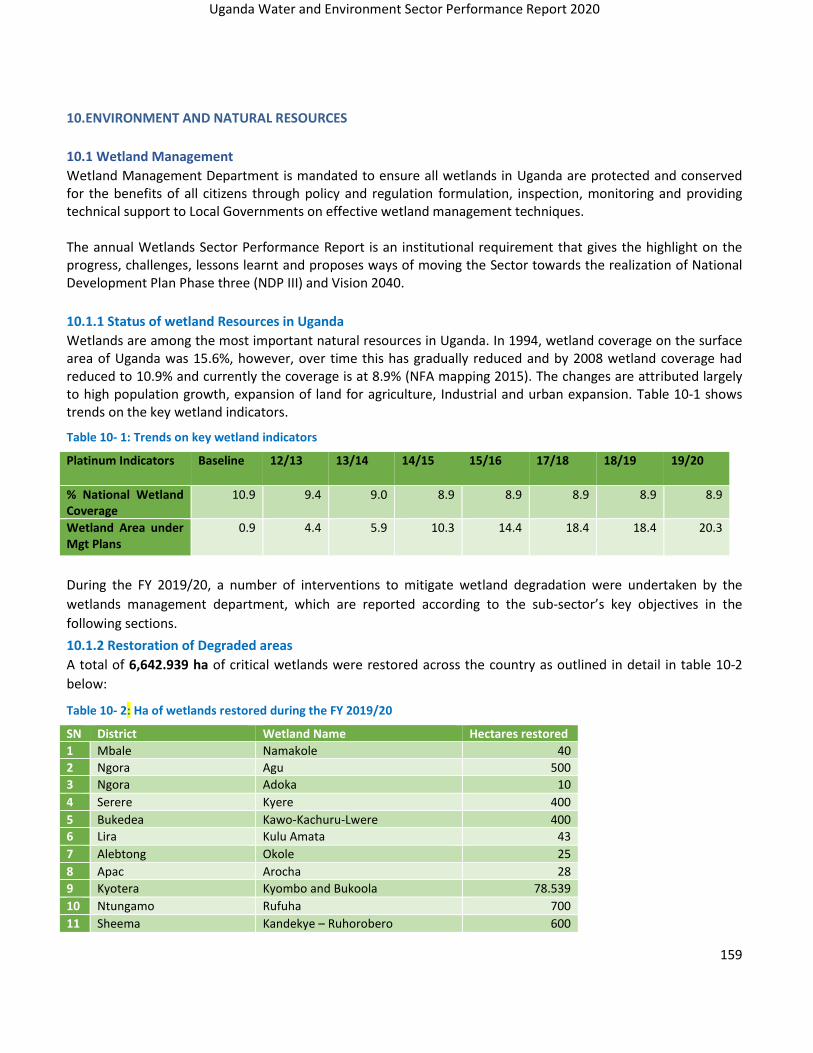
Uganda Water and Environment Sector Performance Report 2020
159
10.ENVIRONMENT AND NATURAL RESOURCES
10.1 Wetland Management
Wetland Management Department is mandated to ensure all wetlands in Uganda are protected and conserved for the benefits of all citizens through policy and regulation formulation, inspection, monitoring and providing technical support to Local Governments on effective wetland management techniques. The annual Wetlands Sector Performance Report is an institutional requirement that gives the highlight on the progress, challenges, lessons learnt and proposes ways of moving the Sector towards the realization of National Development Plan Phase three (NDP III) and Vision 2040.
10.1.1 Status of wetland Resources in Uganda
Wetlands are among the most important natural resources in Uganda. In 1994, wetland coverage on the surface area of Uganda was 15.6%, however, over time this has gradually reduced and by 2008 wetland coverage had reduced to 10.9% and currently the coverage is at 8.9% (NFA mapping 2015). The changes are attributed largely to high population growth, expansion of land for agriculture, Industrial and urban expansion. Table 10-1 shows trends on the key wetland indicators.
Table 10- 1: Trends on key wetland indicators
Platinum Indicators Baseline 12/13 13/14 14/15 15/16 17/18 18/19 19/20
% National Wetland Coverage
10.9 9.4 9.0 8.9 8.9 8.9 8.9 8.9
Wetland Area under Mgt Plans
0.9 4.4 5.9 10.3 14.4 18.4 18.4 20.3
During the FY 2019/20, a number of interventions to mitigate wetland degradation were undertaken by the
wetlands management department, which are reported according to the sub-sector’s key objectives in the
following sections.
10.1.2 Restoration of Degraded areas
A total of 6,642.939 ha of critical wetlands were restored across the country as outlined in detail in table 10-2
below:
Table 10- 2: Ha of wetlands restored during the FY 2019/20
SN District Wetland Name Hectares restored
1 Mbale Namakole 40
2 Ngora Agu 500
3 Ngora Adoka 10
4 Serere Kyere 400
5 Bukedea Kawo-Kachuru-Lwere 400
6 Lira Kulu Amata 43
7 Alebtong Okole 25
8 Apac Arocha 28
9 Kyotera Kyombo and Bukoola 78.539
10 Ntungamo Rufuha 700
11 Sheema Kandekye – Ruhorobero 600

Uganda Water and Environment Sector Performance Report 2020
160
12 Kanungu Ntungwa 30
13 Mitooma Nyamirizi-Kagogo 500
14 Buhweju Kyenzogyera-Mushasha-Rugongo 530.72
15 Kisoro Mutanda-Murehe 600
16 Pallisa L. Lemwa 457.68
17 Kibuuku Tirinyi 200
18 Lira and Aleptong Aswa catchment 1,500
Total 6,642.9
The restoration process followed the approved wetland restoration guideline where the involvement of all
stakeholders is prerequisite to ensure commitment and ownership right from the inception to the final outputs
photo 3and 4.
Photo 10- 1: Mikomago wetland restoration in Masaka Photo 10- 2: Restoration of Mpologoma wetland in Kibuuku
The department has been restoring degraded section of wetlands since FY 2012 to 2020 making the cumulative area of wetlands restored at 16,906.5ha (1.9%) of the 865,700ha of degraded section of wetland countrywide. The reporting period noted tremendous increment in wetland restoration mainly due to establishment of the Regional Technical Support Unit which works with DLG to undertake wetland restoration as well as direct release of fund to the regions and LGs to undertake the tasks. This needs to be strengthened furthermore to realize more outputs.
Figure 9- 35: Trends in wetland restoration in Uganda over the years
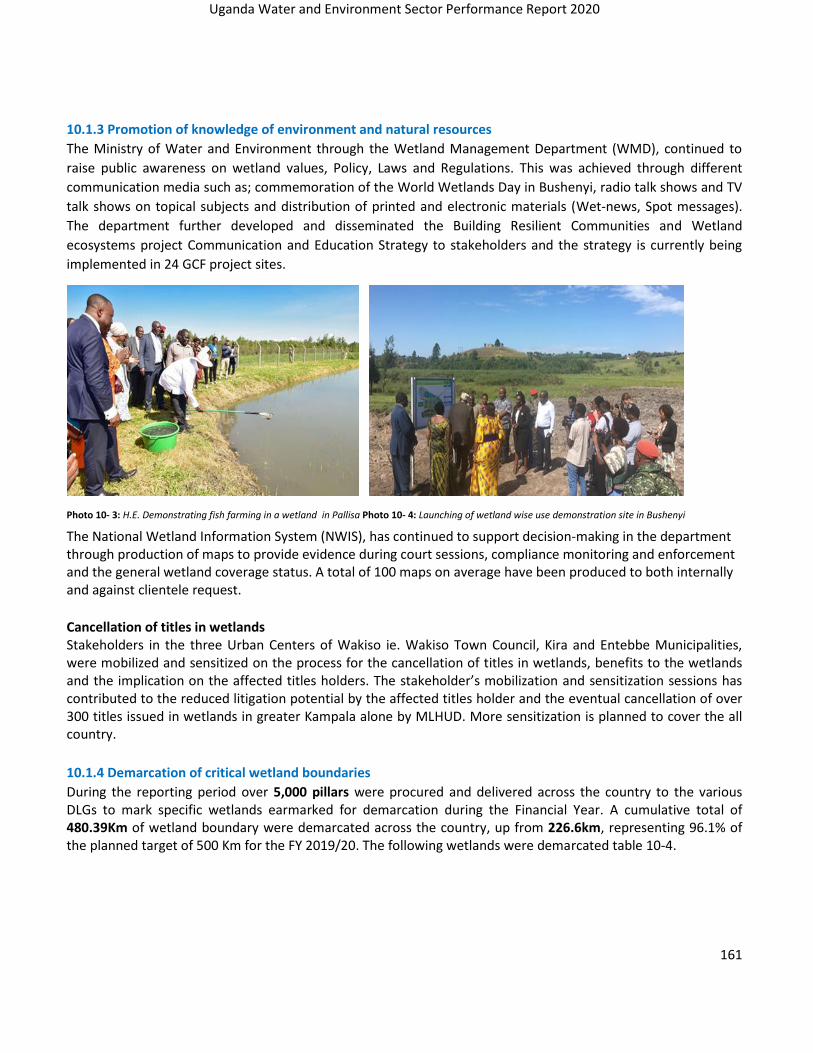
Uganda Water and Environment Sector Performance Report 2020
161
10.1.3 Promotion of knowledge of environment and natural resources
The Ministry of Water and Environment through the Wetland Management Department (WMD), continued to
raise public awareness on wetland values, Policy, Laws and Regulations. This was achieved through different
communication media such as; commemoration of the World Wetlands Day in Bushenyi, radio talk shows and TV
talk shows on topical subjects and distribution of printed and electronic materials (Wet-news, Spot messages).
The department further developed and disseminated the Building Resilient Communities and Wetland
ecosystems project Communication and Education Strategy to stakeholders and the strategy is currently being
implemented in 24 GCF project sites.
Photo 10- 3: H.E. Demonstrating fish farming in a wetland in Pallisa Photo 10- 4: Launching of wetland wise use demonstration site in Bushenyi
The National Wetland Information System (NWIS), has continued to support decision-making in the department through production of maps to provide evidence during court sessions, compliance monitoring and enforcement and the general wetland coverage status. A total of 100 maps on average have been produced to both internally and against clientele request.
Cancellation of titles in wetlands Stakeholders in the three Urban Centers of Wakiso ie. Wakiso Town Council, Kira and Entebbe Municipalities, were mobilized and sensitized on the process for the cancellation of titles in wetlands, benefits to the wetlands and the implication on the affected titles holders. The stakeholder’s mobilization and sensitization sessions has contributed to the reduced litigation potential by the affected titles holder and the eventual cancellation of over 300 titles issued in wetlands in greater Kampala alone by MLHUD. More sensitization is planned to cover the all country.
10.1.4 Demarcation of critical wetland boundaries
During the reporting period over 5,000 pillars were procured and delivered across the country to the various DLGs to mark specific wetlands earmarked for demarcation during the Financial Year. A cumulative total of 480.39Km of wetland boundary were demarcated across the country, up from 226.6km, representing 96.1% of the planned target of 500 Km for the FY 2019/20. The following wetlands were demarcated table 10-4.

Uganda Water and Environment Sector Performance Report 2020
162
Table 10- 3: Km of wetlands demarcated during the FY 2019/20
SN District Wetland Name Kilometers demarcated
1 Gomba Kibimba Wetland 80.55
2 Wakiso Kato-Mayanja wetland 43.34
3 Sheema Nyakambu wetland 20
4 Bushenyi Nyamirembe wetland 60.9
5 Mbale Namakole wetland 25.7
6 Soroti Opiyai wetland 25.3
7 Soroti Asuret wetland 25.3
8 Bukedea Lwere wetland 50
9 Bukedea Kawo wetland 26
10 Namutumba Nawaibete wetland 16
11 Ngora Agu wetland 22
12 Adjumani Ayugi (tete) wetland 5
13 Pakwach Ora wetland 2
14 Lira Kulu Amata wetland 5
15 Nebbi Nyarwodo wetland 6
16 Napak Okok and Okere wetland 1
16 Nakapiripirit Chosan- Cholol wetland 36.3
17 Civil Society Organizations (ENR-CSO Country wide 30
Total 480.39
The WMD has also been demarcating wetland boundary since FY 2012/13 to date following an established
wetland demarcation strategy making the cumulative boundary of wetland demarcated at 2208.9km (1.56%) out
of the 141366km earmarked for demarcation countrywide. The reporting period noted tremendous increment in
boundary of wetland demarcated countrywide mainly attributed to close involvement of the RTSU and DLG to
undertake demarcation process as well as direct release of fund to the regions and LGs to undertake the tasks.
This needs to be strengthen further to realize more outputs photo 10-5 and 10-6.
Photo 10- 5: District Chairperson Bushenyi launching Photo 10- 6: RDC Soroti planting the first concrete pillar at Opiyai
wetland demarcation exercise. Wetland boundary, Soroti
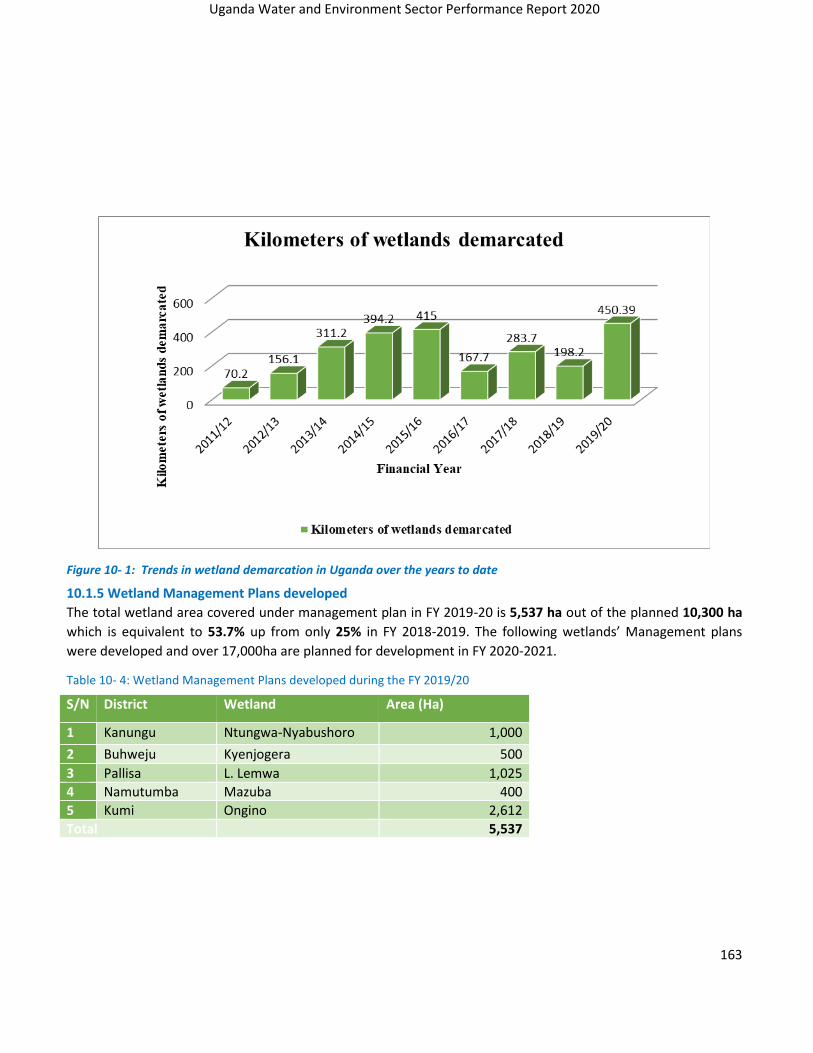
Uganda Water and Environment Sector Performance Report 2020
163
Figure 10- 1: Trends in wetland demarcation in Uganda over the years to date
10.1.5 Wetland Management Plans developed
The total wetland area covered under management plan in FY 2019-20 is 5,537 ha out of the planned 10,300 ha
which is equivalent to 53.7% up from only 25% in FY 2018-2019. The following wetlands’ Management plans
were developed and over 17,000ha are planned for development in FY 2020-2021.
Table 10- 4: Wetland Management Plans developed during the FY 2019/20
S/N District Wetland Area (Ha)
1 Kanungu Ntungwa-Nyabushoro 1,000
2 Buhweju Kyenjogera 500
3 Pallisa L. Lemwa 1,025
4 Namutumba Mazuba 400
5 Kumi Ongino 2,612
Total 5,537

Uganda Water and Environment Sector Performance Report 2020
164
Photo 10- 7: PWO/AIM presenting during the development of Ntungwa–Nyabushoro community management plan.
Photo 10- 8: Nyamirama sub-county community members developing the Ntungwa–Nyabushoro Wetlands Management Plan.
10.1.6 Development of wetland wise use demonstration sites
To support livelihoods income generation of the community dependent on wetland resources from wetland function and services, the GCF project constructed 02 water retention facilities at Nyaruzinga wetland in Bushenyi district and Kandekye-Ruhorobero wetland in Sheema district with a capacity of 20 and 15 million liters of water respectively. The facilities are aimed at enhancing wetland recovery while supplying clean and safe water for mini-irrigation of the communities’ crop adjacent to the wetland covering an area of 40acres. This new approach to wise use of wetland is meant to demonstrate how wetland users’ communities can be compensated from evacuating wetland ecosystem willing which needs to be scaled up countrywide photo 5:
Photo 10- 9Launching the restoration of Kandekye-Ruhorobero. Photo 10- 10: Water retention facility for enhancing wetland Wetland in Sheema recovery
10.1.7 Coding and gazettement of Wetlands
All the 8 drainage basins were coded. Coding is assigning a wetland unique identifier for instance number
followed by names. Each drainage basin has a code from 01 to 08. Kyoga-04-001-001-001-01. These codes will be
used for gazettement process.
So far over 05 technical reports out of the 08 have been compiled for Lake Victoria, Lake Edward, L. Kyoga, L.
Albert and Kidepo basins showing wetland codes, names, area, boundary and location to support the
gazettement process. The gazettement process has progressed to stakeholder consultations at the national level
and proceeding to LGs who are the custodians of wetland in their jurisdiction to seek their views on what
categories of wetland to be gazettee for ease of management.
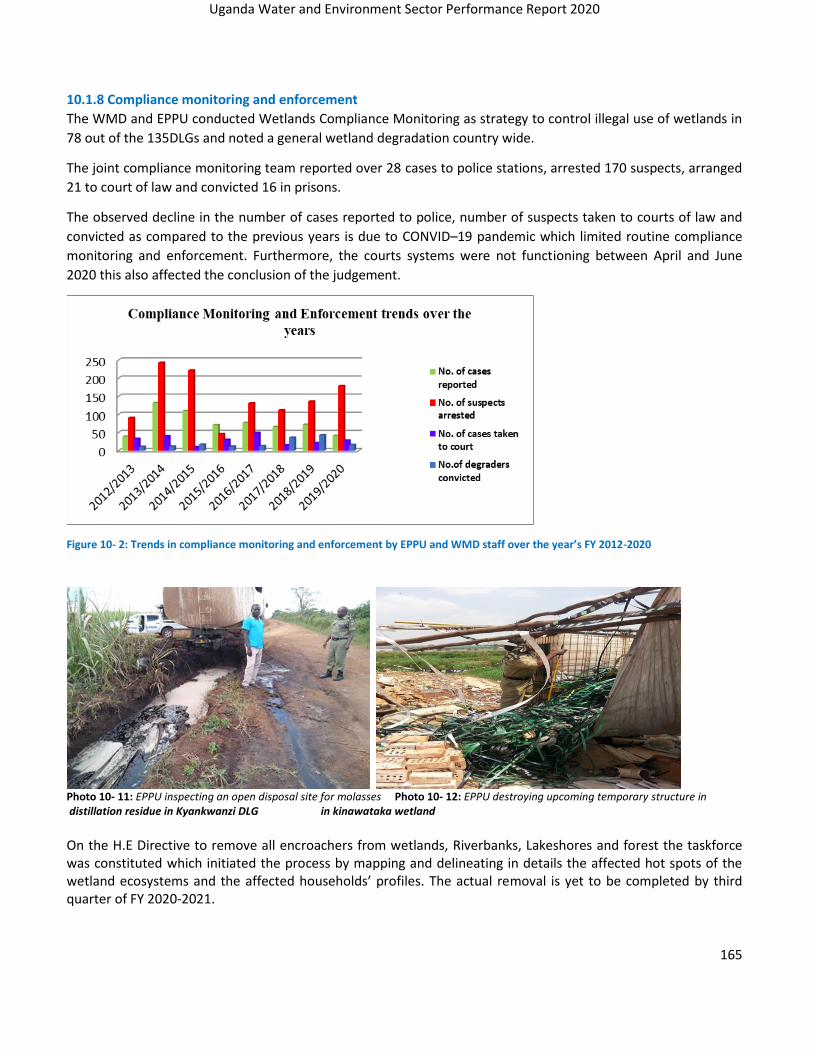
Uganda Water and Environment Sector Performance Report 2020
165
10.1.8 Compliance monitoring and enforcement
The WMD and EPPU conducted Wetlands Compliance Monitoring as strategy to control illegal use of wetlands in
78 out of the 135DLGs and noted a general wetland degradation country wide.
The joint compliance monitoring team reported over 28 cases to police stations, arrested 170 suspects, arranged
21 to court of law and convicted 16 in prisons.
The observed decline in the number of cases reported to police, number of suspects taken to courts of law and
convicted as compared to the previous years is due to CONVID–19 pandemic which limited routine compliance
monitoring and enforcement. Furthermore, the courts systems were not functioning between April and June
2020 this also affected the conclusion of the judgement.
Figure 10- 2: Trends in compliance monitoring and enforcement by EPPU and WMD staff over the year’s FY 2012-2020
Photo 10- 11: EPPU inspecting an open disposal site for molasses Photo 10- 12: EPPU destroying upcoming temporary structure in distillation residue in Kyankwanzi DLG in kinawataka wetland
On the H.E Directive to remove all encroachers from wetlands, Riverbanks, Lakeshores and forest the taskforce was constituted which initiated the process by mapping and delineating in details the affected hot spots of the wetland ecosystems and the affected households’ profiles. The actual removal is yet to be completed by third quarter of FY 2020-2021.

Uganda Water and Environment Sector Performance Report 2020
166
10.1.9 Policy, Planning and Legal framework
The Wetland Policy and Bill were reviewed to incorporate emerging issues during regional and national consultative workshops and the Regulatory Impact Assessment (RIA) report was drafted to support the submission of the Policy and Bill to Cabinet for approval process. The department is drafting the Cabinet memorandum to submit the Draft Policy and Bill.
10.1.10 Capacity building and technical support
Over 45 District officers were trained in data generation and management and a strategy for mitigating gender-based violence during implementation of GCF project wetland activities developed. 74 LGs from Eastern and South Western Uganda and Wetland Management Department (WMD) officers were trained in the application of Open data kit for capturing wetland data using smart phones, this is useful in compliance and restoration monitoring and inventory. In addition, 25 officers from LGs, DEA, DWRM, UNMA, MAAIF and UNDP trained on Advanced GIS and Remote sensing skills and over 200 wetland users trained on the wise use of wetland resources focusing on fish farming, wetland edge gardening, among others.
10.1.11 Resource Mobilization for Wetlands management
The National Wetland Restoration project was developed and approved in the Public Investment Plan (PIP) of MoFPED. The project targets over 16 major wetland systems country wide, covering the restoration of over 108,500ha in the next 5 years of NDP III. The project will also be used to advocate for more resource allocation to the WMD from both GoU and Development Partners.
10.1.12 Challenges, Lessons Learnt and Recommendations
During the course of the FY 2019/20, the Department interfaced a number of challenges during execution of key planned outputs. Key among others, are the following.
1. Resistance of wetland encroachers to evacuate wetlands due to uncoordinated enforcement by the relevant institutions
2. Delayed and intermittent release of funds for implementing planned outputs and activities 3. Inadequate human resource to effectively undertake planned outputs and activities 4. Political interventions at all levels.
Lessons learnt 1. Restoration of wetlands is an expensive venture requiring sufficient resources both humans and financial
to accomplish planned targets. 2. It is also a long and tedious process requiring enough time for engaging all stakeholders to participate
willingly and own the outcomes. 3. Restoration needs to be accompanied by the tangible alternative livelihood option for vulnerable
communities to leave the wetlands willingly. 4. Political support is key to wetland restoration and continued protection. 5. Wetland restoration and management needs a specific law with well stated penalties to restrain
encroachers from abusing the wetlands. Recommendations
1. Fast track the formulation of the Wetland Bill to its conclusion 2. Ensure consistence and timely release of funds. 3. Lift the ban on recruitment. 4. Harmonize the enforcement approaches and institutions

Uganda Water and Environment Sector Performance Report 2020
167
10.2 Environment Management
10.2.1 Introduction
The Department of Environment Sector Support Services (DESSS) is mandated to carry out policy making, standard setting, national planning, regulation, coordination, inspection, monitoring, resource mobilization and back up technical support relating to the environment. The purpose of DESSS is to ensure a sustainable, productive environment and natural resource base and a healthy environment for improved livelihoods, poverty eradication and economic growth. In the 2019/20 financial year, DESSS planned to prepare guidelines for mainstreaming environment in high impact sectors under the promotion of knowledge of environment and natural resources, restore 80 hectares of degraded sections of Mabira Central Forest Reserves, 100 km of protection zone of R. Nile demarcated with concrete pillars and integrate of the mountain strategy in District Development Plans in 8 districts under restoration of degraded and protection of ecosystem. Under Policy, Planning, Legal and Institutional framework, the department planned to review Environmental Impact Statements especially at regional level, prepare guidelines for the local government non-wage conditional grant and prepare concepts for project proposal development. Under coordination, monitoring, inspection, mobilization and supervision, the department planned to monitor, inspect and supervise local governments, monitor oil and gas activities and coordinate multi-lateral environmental agreements.
10.2.2 Promotion of Knowledge of Environment and Natural Resource
Environmental mainstreaming; Guidelines for Mainstreaming Environment and Natural Resources Issues into
sectors, Ministries, Agencies and Local Governments (MALGs) plans, programmes and budgets were developed.
The overall objective of the guidelines is to provide assistance to different sectors, Ministries, Agencies and Local
Governments (MALGs) on how they can integrate cross cutting issues into their plans and programs and assess
progress.
The sectors will have to be assisted to develop their specific guidelines that address current and emerging issues
that are aligned to national and global development frameworks. Capacity building is therefore a critical input
and the ministry will work with line Ministries, Agencies and Partners to ensure that both human and technical
capacity is developed within sectors and programs. The guidelines have been sent to the Ministry of Finance,
Planning and Economic Development (MoFPED) to guide in the implementation of the Uganda
Intergovernmental Fiscal Transfer (UGIFT) project.
Guidelines for Mainstreaming Environment and Natural Resources, and Climate Change into the Water and
Sanitation Sub-sector were developed as part of the GoU initiatives to address the effects of environmental
degradation and climate change on the water and sanitation sub-sector, as well as reduce the subsector
contribution to degradation and greenhouse gas (GHG) emissions. The guidelines are an important tool in the
efforts to develop sustainable and climate resilient water supply and sanitation systems, and ultimately to a
healthier, prosperous and greener country. The department is to support the water subsector to build capacity in
the use of the guidelines. The staff from the department seconded to the regions are taking lead in
mainstreaming activities.
10.2.3 Restoration of degraded and protection of ecosystems
Kalagala offset Sustainable Management Plan (KSMP); The Department of Environment Sector Support Services
(DESSS) supported restoration planting of 250 Ha of degraded sections in Mabira CFR using indigenous seedlings

Uganda Water and Environment Sector Performance Report 2020
168
including; Maesopsis eminii, Prunus africana, Khaya anthotheca, Albizia spp, Cordia spp, Milicia excela, Markamia
lutea and Terminalia superba. This gives a total of 2,250 hectares so far restored within the Mabira Central Forest
Reserve. In addition, live markers were planted around Mabira Central Forest Reserve for an area of 501
hectares. The trees planted include; Eucalyptus grandis and Spathodia compamulata
The Nile River banks in the districts of Jinja, Kayunga and Buikwe were restored with 200 hectares of indigenous
trees of; Bambusa giganta, Bambusa vulgaris, Strictus spp, asper spp and Bambusa bamboo.
Photo 10- 13: Bamboo planted along the River Nile Banks in Butagaya Subcounty, Jinja district
10.2.4 Policy, planning, and legal framework
Declaration of Kalagala and Itanda Falls Special Conservation Area; An instrument was issued by the minister on
23rd December 2019 declaring the Kalagala and Itanda forests? Special Conservation Area. The area is between
Bujagali and Isimba dams covering the 3 Central Forest Reserves of Kalagala, Nile bank and Namavundu and the
100m protection zone on both sides of the river banks. Government is to regulate activities within the special
conservation area and the purpose of the declaration is stipulated therein.
2 Concepts were prepared:
1. Strengthening the productivity of mountains Elgon and Rwenzori and the resilience of communities in the
two ecosystems for sustainable development
2. Addressing the rising Lake Victoria water levels through restoration of the lake Victoria basin, to be presented
to the WESWG
Staff from DESSS participated in the review the Environment and Social Impact Assessment Report for Tilenga
Feeder Oil and Gas pipeline. The department also undertook assessment of proposed sites in Sheema, Kanungu,
Pallisa, Ngora and Ntugamo districts under the wetland restoration project.

Uganda Water and Environment Sector Performance Report 2020
169
10.2.5 Coordination, Monitoring, Inspection, Mobilization and Supervision.
The Local governments of Ntungamo, Kabarole, Sheema, Mitooma, Kikuube and Hoima were monitored for compliance. Key compliance challenges found in the local governments included; limited funding for mainstreaming activities, low level of appreciation of the importance of the environment, poor coordination of key stakeholders and lack of transport facilities. The number of districts visited was very small compared to the number of districts in the country due to limited resources and the restrictions due to the COVID 19 pandemic.
The Department supported the procurement process for undertaking boundary delineation and formulation of management plan for Mabira dam upstream wetland and micro-catchment areas, supported WfP in environment assessment of mass water (dams) storage sites in Kyenshama, supported EURECA activities in Rufuha wetland and River Maziba areas on management planning and boundary delineation, supported LEAF project mainstream environment aspects in ongoing formulation of River Matanda, Nkusi & Nyamwamba catchment management plans.
Supported 24 Water for Production facilities in baselines and scoping assessments. In addition, undertook catchment environment assessment of water schemes. This helped to provide guidance in relation to environment laws and regulations to water facilities contractors and managers.
10.2.6 Capacity building and Technical back-stopping.
Supported the formation of Jinja district and Butagaya Sub county Environment Committees and oriented them on Kalagala sustainable management planned activities and implementation.
Projects supported to mainstream Environment and Natural Resources and Climate Change in the Water and Sanitation sub sector included; Western Uganda: Rakai-Buyamba water supply; Kyotera -Kasali fecal sludge projects; Kanungu-Kambunga and Kanyanpanga water supply projects; Rukungiri-Kahengye water supply; Ibanda-Ishongororo fecal sludge and Nyabuhikye water supply projects; Kabarole- Karango; and Bundibungyo-Nyahuka; NtorokoKiranga Eastern Uganda: Ngora-Nyero-Kumi Water Supply and Sanitation System; Pallisa Town Water Supply and Sanitation and Limoto Small Scale Irrigation Systems and Bulopa Water Supply System in Kamuli district.
Northern Uganda, Arua / Madi Okollo-Okollo; Yumbe-Midigo and Bidibidi; Lira-Amach and Ogweng; Agago-Kalongo TC and Agago; Ajuman-Oyilo II, Ajuman, Alere and Nyamanzi; Pakwach-Pacego and Patong; Kiryadongo-Bweyale and Moyo-Moyo
10.2.7 Key Initiatives, Programmes and Projects
Population, Health and Environment (PHE) Program
Under the National Population, Health and Environment Network, the department participated in;
Training 40 PHE model home champions from Rubanda district in Sub counties of Bufundi, Hamurwa and Nyamweru

Uganda Water and Environment Sector Performance Report 2020
170
Photo 10- 14: PHE model champions undergoing training in Bufundi Subcounty Trainees awarded certificates of completion at Nyamweru subcounty headquarters
- Monitoring of PHE activities in Kagadi site with support from National Population Council - Supporting PHE household champions in Rubanda to train others in installation and use of hand washing
“tippy tap” method as a way of improving household hygiene in fight to prevent COVID 19.
Photo 10- 15: Tippy tap installed at Nyameru Sub county
Under One Health approach;
• support MoH in the review of Health Care waste management policy for Uganda
• Planted about 20,000 seedlings in Mityana district during the regional Uganda Water and Environment Week for central region

Uganda Water and Environment Sector Performance Report 2020
171
Photo 10- 16Seedlings delivered for planting in Mityana Photo 10- 17The representative of the Permanent Secretary and the Resident District Commissioner planting trees in Mityana
10.3.6 Contribution by Cross-Sectoral Projects
Inclusive Green Growth for Poverty Reduction (IGGPR): The DESSS continued with the coordination of the implementation of the IGGPR. The project is funded by the United Nations Development Program. Implementation is in collaboration with other key institutions including; the Ministry of Energy and Mineral Development, Ministry of Gender, Labour and Social Development, the National Environment Management Authority and Civil Society.
10.3 Forestry Management
Forestry as a sector is managed by three institutions namely: (i) the Forestry Sector Support Department (FSSD)
of Ministry of Water and Environment responsible for oversight of the forestry sector as well as policy
formulation and regulation. (ii) the National Forestry Authority (NFA), a semi-autonomous agency that manages
the Central Forest Reserves, and (iii) District Forestry Services (DFS) responsible for forests on private land and
local forest reserves.
The private sector, academia, research institutions and the civil society organisations (CSOs) such as Uganda
Timber Growers Association (UTGA), Nyabyeya Forestry College among others play an important role in
supporting the forestry sector to fulfil its commitments and obligations at national and international levels.
Key programmes and projects
Forestry management is supported by implementation of Programme 15 covering FSSD, National Forestry
Authority activities in Central Forest Reserves, and the District Forestry Services. In addition, there are several
ongoing projects and initiatives including:
i. The National REDD+ Readiness project
ii. Saw log Production Grant Scheme (SPGS)
iii. Farm Income Enhancement and Forestry Conservation (FIEFOC II)
iv. Forestry Law Enforcement Governance and Trade (FLEGT Phase 3)
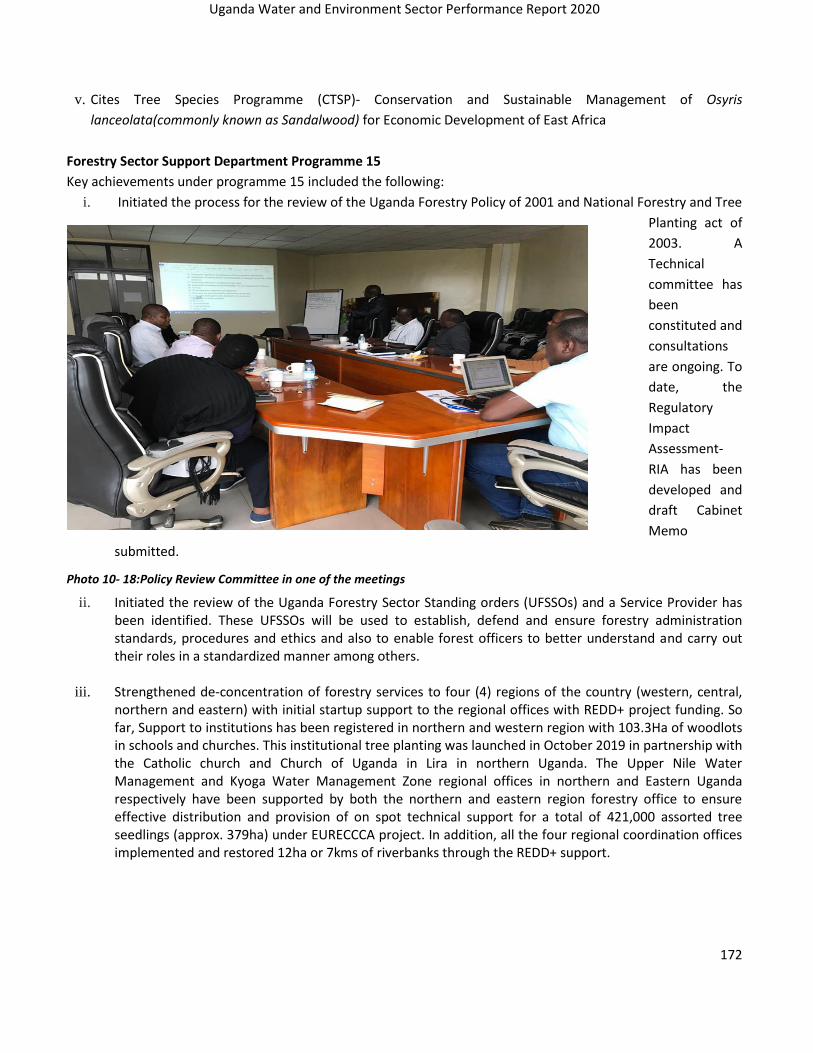
Uganda Water and Environment Sector Performance Report 2020
172
v. Cites Tree Species Programme (CTSP)- Conservation and Sustainable Management of Osyris
lanceolata(commonly known as Sandalwood) for Economic Development of East Africa
Forestry Sector Support Department Programme 15
Key achievements under programme 15 included the following:
i. Initiated the process for the review of the Uganda Forestry Policy of 2001 and National Forestry and Tree
Planting act of
2003. A
Technical
committee has
been
constituted and
consultations
are ongoing. To
date, the
Regulatory
Impact
Assessment-
RIA has been
developed and
draft Cabinet
Memo
submitted.
Photo 10- 18:Policy Review Committee in one of the meetings
ii. Initiated the review of the Uganda Forestry Sector Standing orders (UFSSOs) and a Service Provider has been identified. These UFSSOs will be used to establish, defend and ensure forestry administration standards, procedures and ethics and also to enable forest officers to better understand and carry out their roles in a standardized manner among others.
iii. Strengthened de-concentration of forestry services to four (4) regions of the country (western, central, northern and eastern) with initial startup support to the regional offices with REDD+ project funding. So far, Support to institutions has been registered in northern and western region with 103.3Ha of woodlots in schools and churches. This institutional tree planting was launched in October 2019 in partnership with the Catholic church and Church of Uganda in Lira in northern Uganda. The Upper Nile Water Management and Kyoga Water Management Zone regional offices in northern and Eastern Uganda respectively have been supported by both the northern and eastern region forestry office to ensure effective distribution and provision of on spot technical support for a total of 421,000 assorted tree seedlings (approx. 379ha) under EURECCCA project. In addition, all the four regional coordination offices implemented and restored 12ha or 7kms of riverbanks through the REDD+ support.
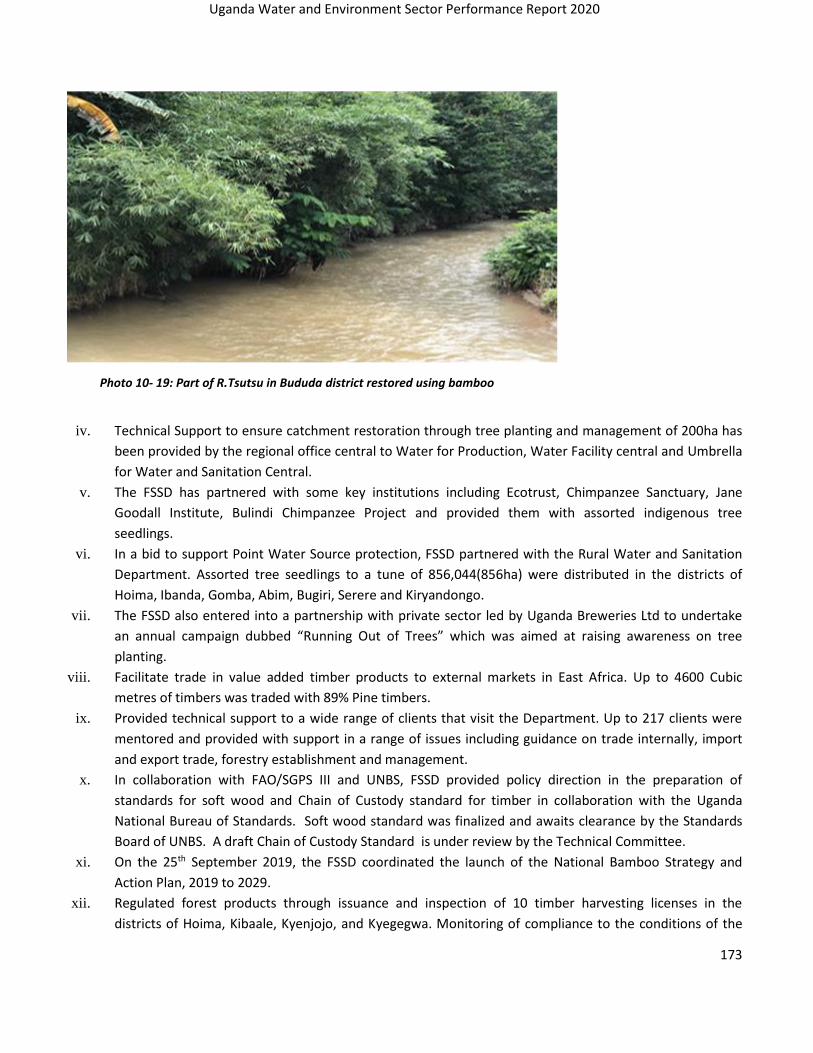
Uganda Water and Environment Sector Performance Report 2020
173
Photo 10- 19: Part of R.Tsutsu in Bududa district restored using bamboo
iv. Technical Support to ensure catchment restoration through tree planting and management of 200ha has
been provided by the regional office central to Water for Production, Water Facility central and Umbrella
for Water and Sanitation Central.
v. The FSSD has partnered with some key institutions including Ecotrust, Chimpanzee Sanctuary, Jane
Goodall Institute, Bulindi Chimpanzee Project and provided them with assorted indigenous tree
seedlings.
vi. In a bid to support Point Water Source protection, FSSD partnered with the Rural Water and Sanitation
Department. Assorted tree seedlings to a tune of 856,044(856ha) were distributed in the districts of
Hoima, Ibanda, Gomba, Abim, Bugiri, Serere and Kiryandongo.
vii. The FSSD also entered into a partnership with private sector led by Uganda Breweries Ltd to undertake
an annual campaign dubbed “Running Out of Trees” which was aimed at raising awareness on tree
planting.
viii. Facilitate trade in value added timber products to external markets in East Africa. Up to 4600 Cubic
metres of timbers was traded with 89% Pine timbers.
ix. Provided technical support to a wide range of clients that visit the Department. Up to 217 clients were
mentored and provided with support in a range of issues including guidance on trade internally, import
and export trade, forestry establishment and management.
x. In collaboration with FAO/SGPS III and UNBS, FSSD provided policy direction in the preparation of
standards for soft wood and Chain of Custody standard for timber in collaboration with the Uganda
National Bureau of Standards. Soft wood standard was finalized and awaits clearance by the Standards
Board of UNBS. A draft Chain of Custody Standard is under review by the Technical Committee.
xi. On the 25th September 2019, the FSSD coordinated the launch of the National Bamboo Strategy and
Action Plan, 2019 to 2029.
xii. Regulated forest products through issuance and inspection of 10 timber harvesting licenses in the
districts of Hoima, Kibaale, Kyenjojo, and Kyegegwa. Monitoring of compliance to the conditions of the
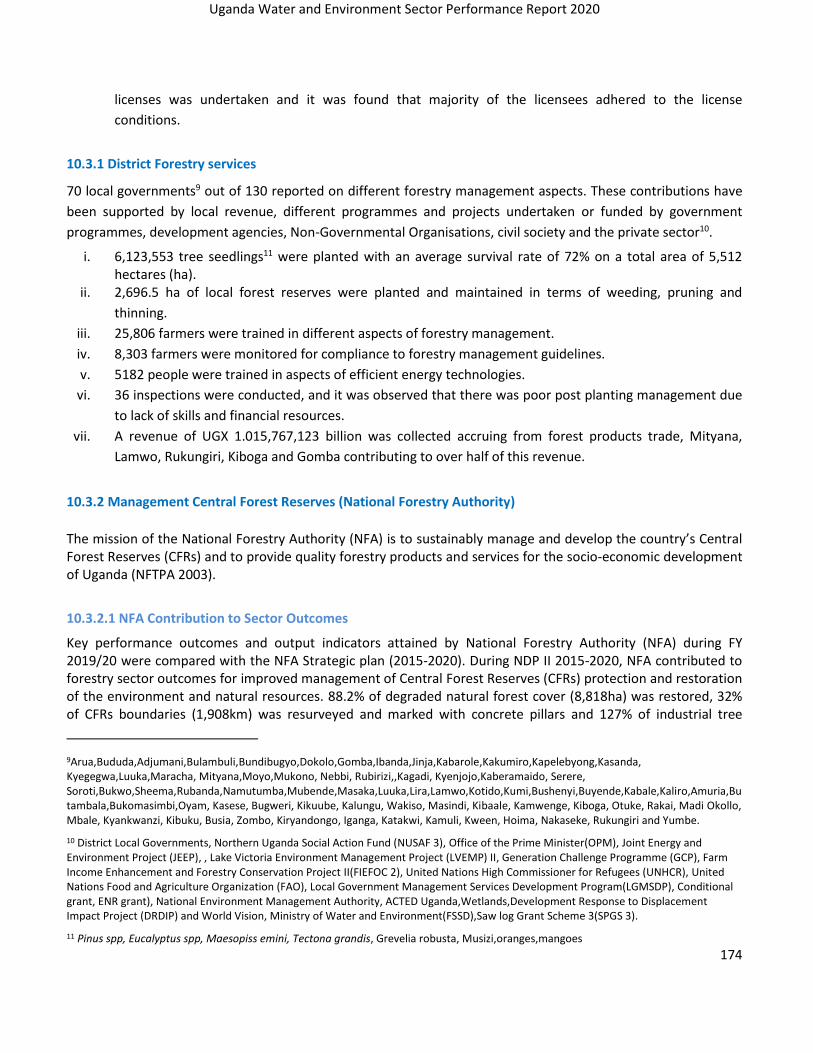
Uganda Water and Environment Sector Performance Report 2020
174
licenses was undertaken and it was found that majority of the licensees adhered to the license
conditions.
10.3.1 District Forestry services
70 local governments9 out of 130 reported on different forestry management aspects. These contributions have
been supported by local revenue, different programmes and projects undertaken or funded by government
programmes, development agencies, Non-Governmental Organisations, civil society and the private sector10.
i. 6,123,553 tree seedlings11 were planted with an average survival rate of 72% on a total area of 5,512 hectares (ha).
ii. 2,696.5 ha of local forest reserves were planted and maintained in terms of weeding, pruning and
thinning.
iii. 25,806 farmers were trained in different aspects of forestry management.
iv. 8,303 farmers were monitored for compliance to forestry management guidelines.
v. 5182 people were trained in aspects of efficient energy technologies.
vi. 36 inspections were conducted, and it was observed that there was poor post planting management due
to lack of skills and financial resources.
vii. A revenue of UGX 1.015,767,123 billion was collected accruing from forest products trade, Mityana,
Lamwo, Rukungiri, Kiboga and Gomba contributing to over half of this revenue.
10.3.2 Management Central Forest Reserves (National Forestry Authority)
The mission of the National Forestry Authority (NFA) is to sustainably manage and develop the country’s Central Forest Reserves (CFRs) and to provide quality forestry products and services for the socio-economic development of Uganda (NFTPA 2003).
10.3.2.1 NFA Contribution to Sector Outcomes
Key performance outcomes and output indicators attained by National Forestry Authority (NFA) during FY 2019/20 were compared with the NFA Strategic plan (2015-2020). During NDP II 2015-2020, NFA contributed to forestry sector outcomes for improved management of Central Forest Reserves (CFRs) protection and restoration of the environment and natural resources. 88.2% of degraded natural forest cover (8,818ha) was restored, 32% of CFRs boundaries (1,908km) was resurveyed and marked with concrete pillars and 127% of industrial tree
9Arua,Bududa,Adjumani,Bulambuli,Bundibugyo,Dokolo,Gomba,Ibanda,Jinja,Kabarole,Kakumiro,Kapelebyong,Kasanda, Kyegegwa,Luuka,Maracha, Mityana,Moyo,Mukono, Nebbi, Rubirizi,,Kagadi, Kyenjojo,Kaberamaido, Serere, Soroti,Bukwo,Sheema,Rubanda,Namutumba,Mubende,Masaka,Luuka,Lira,Lamwo,Kotido,Kumi,Bushenyi,Buyende,Kabale,Kaliro,Amuria,Butambala,Bukomasimbi,Oyam, Kasese, Bugweri, Kikuube, Kalungu, Wakiso, Masindi, Kibaale, Kamwenge, Kiboga, Otuke, Rakai, Madi Okollo, Mbale, Kyankwanzi, Kibuku, Busia, Zombo, Kiryandongo, Iganga, Katakwi, Kamuli, Kween, Hoima, Nakaseke, Rukungiri and Yumbe.
10 District Local Governments, Northern Uganda Social Action Fund (NUSAF 3), Office of the Prime Minister(OPM), Joint Energy and Environment Project (JEEP), , Lake Victoria Environment Management Project (LVEMP) II, Generation Challenge Programme (GCP), Farm Income Enhancement and Forestry Conservation Project II(FIEFOC 2), United Nations High Commissioner for Refugees (UNHCR), United Nations Food and Agriculture Organization (FAO), Local Government Management Services Development Program(LGMSDP), Conditional grant, ENR grant), National Environment Management Authority, ACTED Uganda,Wetlands,Development Response to Displacement Impact Project (DRDIP) and World Vision, Ministry of Water and Environment(FSSD),Saw log Grant Scheme 3(SPGS 3).
11 Pinus spp, Eucalyptus spp, Maesopiss emini, Tectona grandis, Grevelia robusta, Musizi,oranges,mangoes
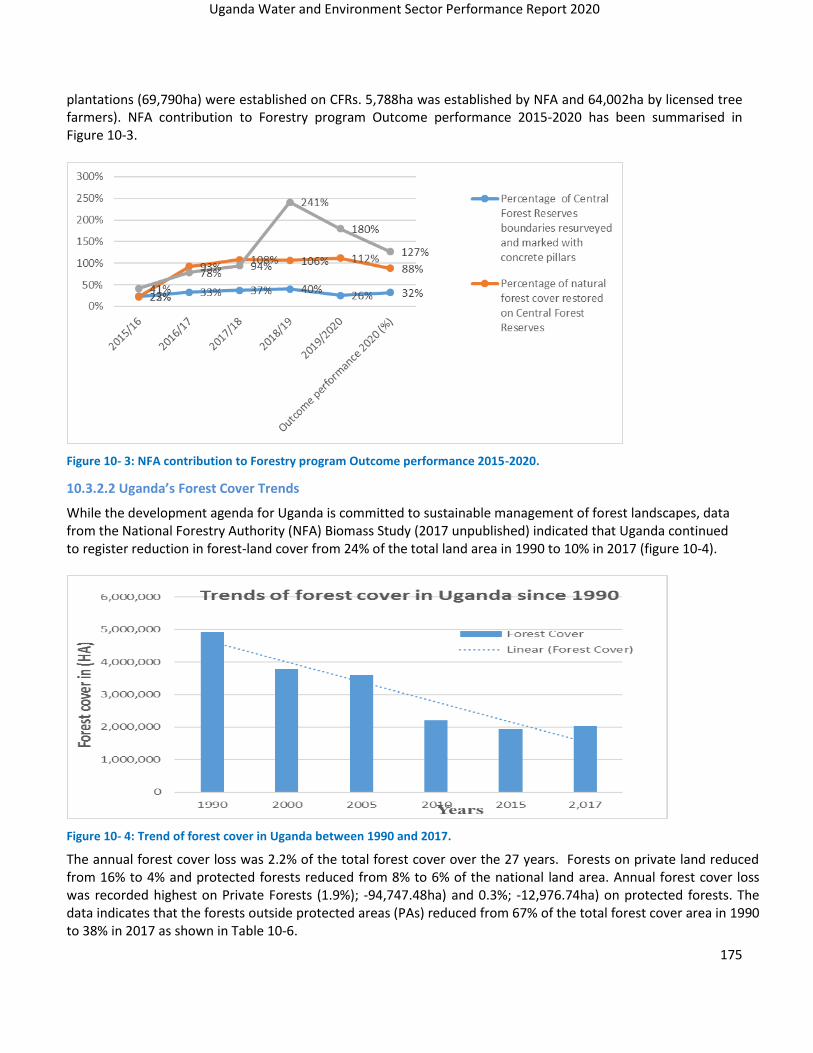
Uganda Water and Environment Sector Performance Report 2020
175
plantations (69,790ha) were established on CFRs. 5,788ha was established by NFA and 64,002ha by licensed tree farmers). NFA contribution to Forestry program Outcome performance 2015-2020 has been summarised in Figure 10-3.
Figure 10- 3: NFA contribution to Forestry program Outcome performance 2015-2020.
10.3.2.2 Uganda’s Forest Cover Trends
While the development agenda for Uganda is committed to sustainable management of forest landscapes, data from the National Forestry Authority (NFA) Biomass Study (2017 unpublished) indicated that Uganda continued to register reduction in forest-land cover from 24% of the total land area in 1990 to 10% in 2017 (figure 10-4).
Figure 10- 4: Trend of forest cover in Uganda between 1990 and 2017.
The annual forest cover loss was 2.2% of the total forest cover over the 27 years. Forests on private land reduced from 16% to 4% and protected forests reduced from 8% to 6% of the national land area. Annual forest cover loss was recorded highest on Private Forests (1.9%); -94,747.48ha) and 0.3%; -12,976.74ha) on protected forests. The data indicates that the forests outside protected areas (PAs) reduced from 67% of the total forest cover area in 1990 to 38% in 2017 as shown in Table 10-6.

Uganda Water and Environment Sector Performance Report 2020
176
Table 10- 5: Forest cover trend in Uganda (1990-2017)
Forest cover Type 1990 2000 2005 2010 2015 2017
Private forests (ha) 3,325,846 2,357,243 2,081,388 842,330 765,651 767,664
% Private forests 16% 12% 10% 4% 4% 4%
Protected forests (ha)
1,607,900 1,429,321 1,522,788 1,113,731 1,185,997 1,257,528
% Protected forests 8% 7% 7% 5% 6% 6%
Total forest cover (ha)
4,933,746 3,786,564 3,604,176 1,956,061 1,951,648 2,025,192
% Total forest cover 24% 18% 18% 9% 10% 10%
National land area* (ha)
20,465,745 20,474,456 20,448,859 20,866,959 20,405,768 20,409,730
Source: NFA Biomass Study (2017)
* This varies over time due to variations in the water level of the Victoria-Nile river basin system While tree plantations increased from 35,066ha in 1990 to 159,929ha in 2017, natural forests cover reduced from 4,898,680ha to 1,865,263ha during the same period. It should be noted that although there is generally an increased rate of tree planting in the country, and increased tree cover, the survival of the trees beyond 3 years remains low and ought to be evaluated. Government support to National Forestry Authority (NFA) during NDPII increased forest cover to 12.4% during 2019.Reversing deforestation rates in Uganda is expected to increase forest cover to 15% by 2025, 18% by 2030 and 24% by 2040.
10.3.2.3 Performance Output Indicators
Key performance outputs for NFA during FY 2019/2020 were summarised into;-improved Management of Central Forest Reserves, establishment and management of forest plantations and supply of seed and seedlings. Improved Management of CFRs
2,233ha of the annual planned 3,000ha (74%) of degraded natural forests was restored through planting
indigenous tree species and bamboo12 .A total of 5,730 beneficiaries were employed through local contracts
during restoration planting (75% -were youth, and 25% old persons and 44%-were women, 56%-men.0.87% of
the women involved had children who were breast feeding. COVID-19 (Corona Virus Disease) Pandemic and
government lockdown during the fourth quarter hampered restoration of degraded forests. 1,945ha of the
planned 2,000ha of restoration planting were weeded (97%)13despite, inadequate funds for the high intensity of
restoration weeding. The intensity of weeding was high due to extended rainy season. Community Based
Organizations (CBOs) were involved through the Collaborative Forest Management (CFM) process with local
forest adjacent communities.66% of the total 9,557 local contract workers were men and 34% were women and
96% were youth and only 4% were elderly.
12
Restoration planting of ; 493-Budongo, Bugoma & Wambabya, 15-Karamoja- Mt. Moroto, 30ha-Bukaleeba,10ha-Namalemba ,50-Laura and 20ha -Enzeva , Kyoga-65ha (in West Bugwe Habuleke Block), South West-50ha (Kalinzu
CFR-25ha, Kasyoha-Kitomi CFR-25ha,[Achwa - 38 ha in Oliduro CFR under partnership with NEMA and ERA.Muzizi -350ha ( Bwezigolo-gunga-60, Kabukira-20, Lukuga-20, Itwara-180,North Rwenzori-20ha,Kyampisi-25,Kajonde-
25). Lakeshore-195ha (130-Mabira, 12ha CFM planting in Lwamunda CFR and 53ha in Gangu CFR with UETCL and the World Bank]. Eria CFR - 73.2ha, Era CFR - 149.3ha, Sango-Bay 150ha (Lukalu, Buga and Jogolo CFRs),
Kalinzu - 30ha, Kasyoha Kitomi - 50ha, Achwa; 88ha-bamboo planting & 80ha- indigenous tree in Ogom CFR (Planted by the CFM group with 14 women and 9 men , Mabira - 250ha, Lwamunda 31.6ha of Bamboo, Kasenyi CFR –
15ha.Indigenous and local communities of the IK and Tepesi in Karamoja were involved in restoration of Mt.Moroto forest reserve.
13 Restoration weeding in Achwa-223ha (170-Ogom ,38-Oliduro and 15- Ongom CFR ); Budongo Systems:406ha (50-Bugoma CFR , 303-Kagombe CFR & 53-Wambabya CFR); ); Kyoga-285
(115ha Bukaleba, 140ha, West Bugwe and 30ha Namatale);Lakeshores:616ha (Zirimi-70ha, Mpanga-78ha, Lwamunda-70ha,Buvuma-70ha lwankima-Mabira - 328ha;Muzizi 366ha in the entire range, South West-170ha (Kalinzu-120ha, Kasyoha-Kitomi-50ha); West Nile- 140ha (Mt. Kei-70 , Laura-50 and Enzeva-20), , 50- Bukaleeba. Karamoja 40ha- 25-Akur Shear nut oil trees project by UNDP, Moroto CFR - 15ha (10ha in areas supported by Parliament and 5ha in areas supported by UNCST by a labour force of 24men and 12females)
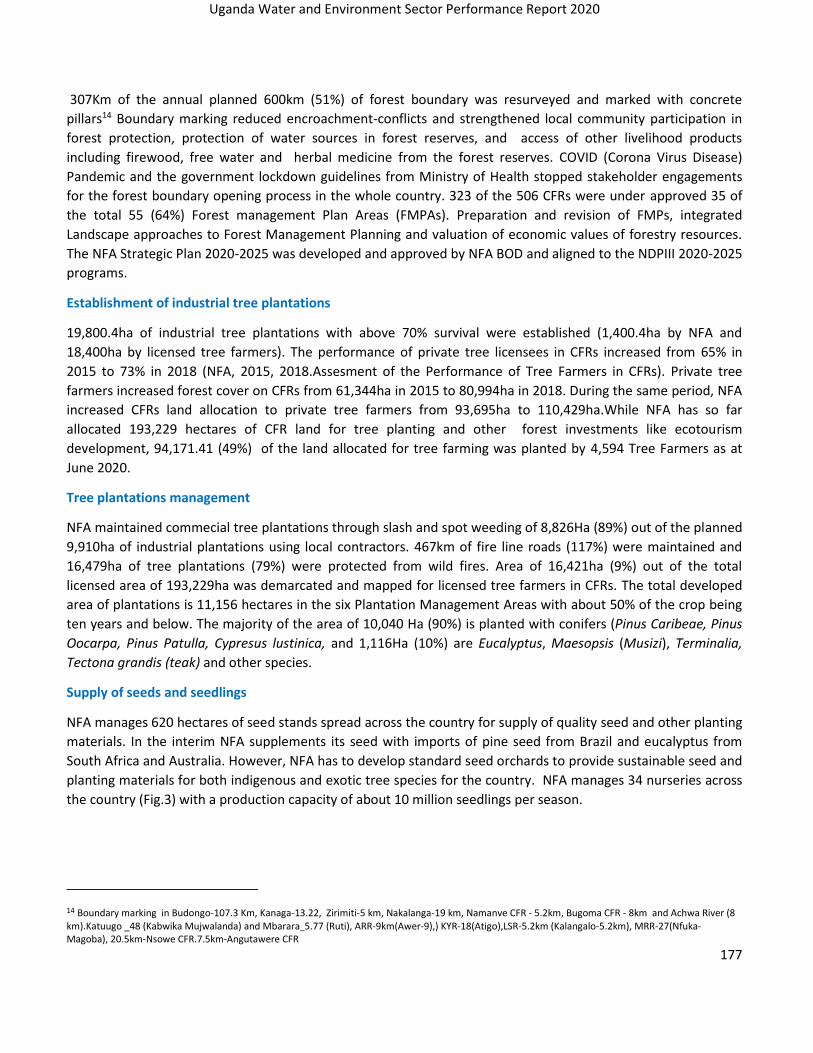
Uganda Water and Environment Sector Performance Report 2020
177
307Km of the annual planned 600km (51%) of forest boundary was resurveyed and marked with concrete
pillars14 Boundary marking reduced encroachment-conflicts and strengthened local community participation in
forest protection, protection of water sources in forest reserves, and access of other livelihood products
including firewood, free water and herbal medicine from the forest reserves. COVID (Corona Virus Disease)
Pandemic and the government lockdown guidelines from Ministry of Health stopped stakeholder engagements
for the forest boundary opening process in the whole country. 323 of the 506 CFRs were under approved 35 of
the total 55 (64%) Forest management Plan Areas (FMPAs). Preparation and revision of FMPs, integrated
Landscape approaches to Forest Management Planning and valuation of economic values of forestry resources.
The NFA Strategic Plan 2020-2025 was developed and approved by NFA BOD and aligned to the NDPIII 2020-2025
programs.
Establishment of industrial tree plantations
19,800.4ha of industrial tree plantations with above 70% survival were established (1,400.4ha by NFA and
18,400ha by licensed tree farmers). The performance of private tree licensees in CFRs increased from 65% in
2015 to 73% in 2018 (NFA, 2015, 2018.Assesment of the Performance of Tree Farmers in CFRs). Private tree
farmers increased forest cover on CFRs from 61,344ha in 2015 to 80,994ha in 2018. During the same period, NFA
increased CFRs land allocation to private tree farmers from 93,695ha to 110,429ha.While NFA has so far
allocated 193,229 hectares of CFR land for tree planting and other forest investments like ecotourism
development, 94,171.41 (49%) of the land allocated for tree farming was planted by 4,594 Tree Farmers as at
June 2020.
Tree plantations management
NFA maintained commecial tree plantations through slash and spot weeding of 8,826Ha (89%) out of the planned
9,910ha of industrial plantations using local contractors. 467km of fire line roads (117%) were maintained and
16,479ha of tree plantations (79%) were protected from wild fires. Area of 16,421ha (9%) out of the total
licensed area of 193,229ha was demarcated and mapped for licensed tree farmers in CFRs. The total developed
area of plantations is 11,156 hectares in the six Plantation Management Areas with about 50% of the crop being
ten years and below. The majority of the area of 10,040 Ha (90%) is planted with conifers (Pinus Caribeae, Pinus
Oocarpa, Pinus Patulla, Cypresus lustinica, and 1,116Ha (10%) are Eucalyptus, Maesopsis (Musizi), Terminalia,
Tectona grandis (teak) and other species.
Supply of seeds and seedlings
NFA manages 620 hectares of seed stands spread across the country for supply of quality seed and other planting
materials. In the interim NFA supplements its seed with imports of pine seed from Brazil and eucalyptus from
South Africa and Australia. However, NFA has to develop standard seed orchards to provide sustainable seed and
planting materials for both indigenous and exotic tree species for the country. NFA manages 34 nurseries across
the country (Fig.3) with a production capacity of about 10 million seedlings per season.
14 Boundary marking in Budongo-107.3 Km, Kanaga-13.22, Zirimiti-5 km, Nakalanga-19 km, Namanve CFR - 5.2km, Bugoma CFR - 8km and Achwa River (8 km).Katuugo _48 (Kabwika Mujwalanda) and Mbarara_5.77 (Ruti), ARR-9km(Awer-9),) KYR-18(Atigo),LSR-5.2km (Kalangalo-5.2km), MRR-27(Nfuka-Magoba), 20.5km-Nsowe CFR.7.5km-Angutawere CFR

Uganda Water and Environment Sector Performance Report 2020
178
Photo 10- 20: Raising of assorted seedlings from Mbarara Tree Nursery
Supply of 114, 528,770 assorted seedlings out of the target 175 million seedlings to increase forest cover (100million under the NRM Manifesto commitments , 15million NFA own planting, 10million for sale and 50million for community Tree planting during NDP II and NFA Strategic Plan 2015-2020 performed at 65%.
Figure 10- 5: NFA Nurseries and Plantation Management Areas
26,398,947 of the annual planned 31,400,000 assorted seedlings (84%) were produced and supplied for tree
planting from 12 NFA regional tree nurseries and 22 community nurseries for increasing tree cover across the

Uganda Water and Environment Sector Performance Report 2020
179
country.12,546,665 assorted seedlings (81%) were equitably supplied to the community for mass tree planting
under the community tree planting program in 16 regions in the country.13,852,282 (87%) assorted seedlings
were supplied for Sale and tree planting in refugee hosting communities-UNHCR and for road reserves-UNRA,
NFA own planting and the public. A total of 46,584.9kg (104%) assorted seed species were supplied to raise
seedlings for community Tree Planting, NFA and corporate planting with UNRA and UNHCR in refugees hosting
communities in Northern and western Uganda.8,477kg (170%) assorted seed species were sold to 933
beneficiaries from NFA Namanve Tree seed Centre (10.4%-Institutions, 75.6%-Males and 14%-Females).
10.3.3.4 Biological assets growth
NFA’s biological assets are the natural forest and plantations within the CFRs.
Photo 10- 21: NFA biological assets
The plantation biological asset has grown from UGX 104 billion in 2019 to UGX 106billion in 2020. Economic valuation of natural forest stock remained under development of the natural capital accounts.
10.3.2.6 Projects Development
The project for retooling of NFA code 1679 was submitted to MOFPED on the IBP system. In order to
establishment and development of efficient infrastructure for production of cultivated assets that contribute to
natural capital development, CORE project No.21 National Community Tree Planting Project under Program V
NDP III was also submitted to MOFPED for consideration by the Development committee. Mass tree planting and
survival of planted trees is expected to guarantee increase of both tree and forest cover to 15% -NDP III and 24%-
Vision 2040 targets. Restoration of degraded fragile landscapes will promote development of resilient mitigations
to negative effects of climate change, conservation of biodiversity and generation of income and wealth.
Farm Income Enhancement and Forestry Conservation project II
The Integrated natural Resource Management Component of the project achieved the following:
i. The capacity building task of training farmers and stakeholders in Natural Resource Based
Enterprises and Marketing as well as Agroforestry and Conservation farming is in advanced stages.
The Service Providers concluded the Inception phase, Training Needs Assessment, preparation of the
Training Manuals and IEC Materials. Due to COVID 19 restrictions, the trainings could not be
conducted in April to June 2020 and was rescheduled for Quarter 1 of FY 2020/21.
ii. Awareness raising engagements at national level as well as at catchment level for Agroforestry and
conservation farming were conducted with 250 people engaged.

Uganda Water and Environment Sector Performance Report 2020
180
iii. The contract for training in forestry planning and management was signed on 30th June 2020. The
Service provider was due to commence implementation in July 2020.
iv. A total of 1,310,352 seedlings of assorted tree seedlings were distributed to farmers in selected
districts in the 4 catchment areas of Ngenge, Manafwa, Tochi and Mubuku-II covering approximately
1,310 hectares.
v. 107ha (45kms) of rivers in Mubuku catchment were restored. Assessment of actual area restored in
the other catchments of Ngenge, Manafwa, Tochi, Wadelai is ongoing.
Reducing Emissions from Deforestation and Forest Degradation (REDD+) Readiness Project
i. Up to 792,000 assorted tree seedlings were distributed to the districts to offset carbon. This translates to
792ha planted.
ii. The Alternate National REDD+ Focal Point Officer represented Uganda at the Conference of the Parties
(COP 25) of the UNFCCC in Madrid (Spain) between 30th November to 16th December 2019.
iii. REDD+ Secretariat continued to spearhead the preparation of a 6 year USD 178.2 million “Investing in
Forest and Protected Areas for Climate Smart Development (IFPA-CD) project. The project funding was
approved by the Executive Board of the World Bank(WB) on 22 April 2020. The project awaits final
approval by cabinet and Parliament within FY 2020/21. The project is now in the Project Implementation
Plan(PIP) of the Ministry of Finance Planning and Economic Development beginning next FY 2020/21.
iv. The REDD+ Secretariat continued mobilising resources for the sector with the USD 30 Million GCF
component of the IFPA-CD project under preparation with the World Bank as the accredited entity as
requested by Government in 2018.
v. The REDD+ Strategy and Action Plan was updated, and the Strategic Environmental and Social
Assessment(SESA) as well as the Environment and Social Management Framework reports for REDD+ and
the projects were completed.
vi. The national Safeguards Information System (SIS) was completed.
vii. The task to develop at least two Emissions Reduction Programs (ER Programs) in (i) Albertine and (ii) Mt.
Elgon Region as grounded in the National REDD+ Strategy was advanced to the stage of preparing an
Inception Report for the Design and Documentation of two REDD+ Emission Reduction Programs in
Uganda and Action Plan for Establishment of Emission Reduction Programme in Kyoga and Albert WMZs.
The rest of the tasks could not be concluded due to the COVID 19 restrictions to travel by the
international service providers, and among these are the Emission Reduction Programs that shall be
finalised with funding from the WB during FY 2020/21.
viii. The task to improve the National Reference Scenario and undertake the national Inventory of Forest
Resources was concluded with (i) delivering a geographically representative National Forest Inventory
(NFI) with updated data to improve carbon measurements and other relevant information on forest use
and forest cover; ii) Updating data series to produce activity data for 2017/2018 (2018/2019); iii)
developing an improved forest reference level for REDD+ (including estimation of emissions from forest
degradation, inclusion of soil and litter pools) and, iv) Strengthened institutional capacities and systems
Uganda Water and Environment Sector Performance Report 2020
181
in order to institutionalize the National Forest Monitoring System/Monitoring Reporting and Verification
as well as carried out a pilot in the Budongo communities to explore the potential role of communities in
MRV (e.g. verifying NFI and AD results).
ix. The REDD+ Secretariat submitted a Technical Annex to the Biennual Update Report and Uganda become
the first African country to submit this annex, and this provided the momentum for Uganda to initiate the
mobilisation of resources under Result Based Payments working with International Private Sector entities
focussing on the GCF Simplified Application Procedure in conjunction with the UN Environment and UN
REDD Porgramme .
CITES Programme
A. Cites Tree Species Programme (CTSP)- Conservation and Sustainable Management of Osyris
Lanceolata for Economic Development of East Africa project
The National Museums of Kenya in collaboration with Ministry of Water and Environment, Forest Sector Support Department -Uganda (FSSD), Uganda Wildlife Authority (UWA), Kenya Wildlife Service (KWS), Kenya Forest Service (KFS), Tanzania Wildlife Division (TAWA)-CITES Desk, Tanzania Wildlife Research Institute (TAWIRI), Institute of Traditional Medicine-MUHAS, Tanzania Forest Services Agency (TFS) are implementing a project titled “Conservation and Sustainable Management of Osyris lanceolata (East African Sandalwood), for Economic Development in East Africa” for a period of 24 months. The objective of the project is to understand the management, ecological and exploitation status of the species to ensure that international trade and national utilization of the species is non-detrimental to its survival in the wild/forests.
Achievements for the financial year 2019/20 included the following:
The project managed to get the species listed in Appendix II at CoP16 in 2013, for the populations of the Eastern African Range States, and this was a key step towards conservation and management of the species to ensure it does not become extinct, due to international trade.
i. The project was launched in Uganda on February 2020.
ii. With technical support from NaFORRI, the project is currently conducting studies on the domestication and silviculture, ecology and biology of Osyris lanceolata.
B. Trade in Prunus africana
The FSSD, as part of its national mandate as the national Scientific Authority for plants under the Convention on International Trade in Endangered species of fauna and flora (CITES), is supposed to ensure that any trade in specimens of species listed under the Appendices of CITES is not detrimental to the continued survival of the species, as well as its general mandate in enforcement of the National Forestry and Tree Planting Act 2003, which among other things seeks to ensure sustainable use of forest resources.
Prunus africana is listed as an endangered species therefore there is need to ensure sustainable harvesting and trade in Prunus africana, but also position Prunus africana as a competitive livelihood option in ensuring sustainable community participation and growth as well as streamlining involvement of private sector players.
Achievements for the financial year 2019/2020
Uganda Water and Environment Sector Performance Report 2020
182
i. Export quota was maintained at 252,567kgs and the same amount was cleared for export during FY 2019/2020
ii. Cudwell, the authorized exporter of Prunus Africana has supported communities of Kyenjojo, Mukono, Bundibugyo, Kasese and Hoima with 110,000 seedlings of Prunus Africana
C. Saw Log Production Grant Scheme III (SPGS 3)
SPGS III is a Government of Uganda project with funding from the European Union. It was initiated to continue
supporting tree establishment in addition to processing of phase II mature tree plantations. The Sawlog
Production Grant Scheme (SPGS) Phase III Project targets to address the forest resource challenge and foster a
sustainable forestry sector in Uganda through undertakes various initiatives to support commercial tree planting
and development of the forestry value chain.
Achievements for the financial year 2019/20 included the following:
• By May 2020, the project had mapped an area of 25 685 hectares (ha) of planted forests, above the project target of 23 186ha (111percent performance).
• The project has supported 362 private tree growers; the majority being small and medium scale growers whose acreage ranges from 15-500ha.
• 103 nurseries were certified and awarded certificates to produce seedlings.
• Total area planted under woodlot support, by 80 institutions, is 1 531 ha. In addition, 70 institutions received technical training (mostly on-site) in basic plantation establishment.
• 800 beneficiaries (641males and 159 females) were trained in plantation establishment and maintenance, nursery management, standards development, forest inventory, timber grading, International Standards Organization (ISO), chain of custody, developing bankable business projects, FSC forest management, forest harvesting and roads wood preservation.
• Efforts to develop The Nursery Tree Planting standards were initiated in collaboration with FSSD and UNBS.
• Partnership with MWE also facilitated formation and launch of the National Forestry Consultative Forum- a platform for forestry sector stakeholders to independently and objectively discuss and recommend strategic measures for sustainable management of trees and forests in Uganda.
• The project also collaborated with the National Forest Resources Research Institute (NaFORRI) to develop the Pest and Disease Guidelines to help tree farmers identify and manage pests and diseases of commercial plantations. NaFORRI and SPGS have also established demo trial plots in semi-arid Karamoja sub-region, to monitor growth potential of dryland species.
• Collaboration with Nyabyeya Forestry College led to the establishment of a clonal demonstration nursery at the College and review of the latter’s curriculum, incorporating commercial forestry concepts.
• The Project worked with Uganda Timber Growers Association (UTGA) to promote commercial forestry by convening meetings for growers and holding annual public forestry fairs.
• SPGS III supported key studies to inform the sector on Wood Flow and Market Trends Analysis; and Identification of Appropriate Sawmills for Uganda, based on the available wood resource and projections.
• Training conducted in timber grading for structural purposes, forest roads and planning, International Standards Organization, Chain of Custody and Forest Stewardship Council (FSC).
• A spatial database for the verified plantations was developed and updated with the location data and respective attributes in both MS Excel formats and GIS standard formats.
• To support institutions to deliver practical-based forestry training: 28 final year students were attached to Delight Uganda Farm in Nwoya for one month practical training in commercial forestry aspects.

Uganda Water and Environment Sector Performance Report 2020
183
Another group of five students was attached to Devine Bamboo project in Luwero, to learn about commercial bamboo growing, harvesting and utilization. Two staff members were involved in supervision of this activity to ensure that students internalize best practices under this arrangement.
10.3.3 Nyabyeya Forestry College
a. Renovation of two(2) staff house and one wing of the guest house was completed.
Photo 10- 22: Renovated staff quarters at Nyabyeya College
b. 4.5ha of Pinus spp, Eucalyptus grandis, Clonal eucalypts, Meisopsis eminii, and Tectona grandis were
established c. 108.3 ha of planted forests were maintained d. 34,741 seedlings of varied species (Pinus spp, Eucalyptus grandis, Clonal eucalypts and Meisopsis eminii)
were raised in the college nursery, and of these, 29%were sold to the public, while 11.4%were planted by the college.
e. A total of 502 students graduated, with 294 with diplomas and 208 in certificates. Of these, 61% were males and 39% were females.
f. With support from the IFPA-CD project, initiated procurement of high technology sawmilling equipment to be used for skilling youth along the entire value chain of forestry products.
10.3.4 National Forestry Resources Research Institute-NaFORRI
NaFORRI is one of the 16 public agricultural research institutes of the National Agricultural Research Organisation
(NARO). NaFORRI is mandated to conduct research in all aspects of forestry in the country. Research in NaFORRI
aims at increasing the benefits derived from trees and forests through conservation and sustainable management
of forests and tree resources. During the FY 2019/20, NaFORRI achieved the following:
Introduced two biological control agents Psyllaephagus bliteus, (Fig 2 A & 2 B) in 2017 and Cleruchoidesi nockae
(Fig 2C) in 2019 for control of Red gum lerp psyllid and Bronze bug respectively( Fig. 1A and 1B respectively).

Uganda Water and Environment Sector Performance Report 2020
184
Fig. 2A Fig 2B
Studies made during the last FY 2019/20 showed that P.bliteus had established well in over 85% of the country
with dispersal rates of up to 250 Km from release sites and parasitism levels of 74%. The population of the Red
gum lerp psyllid was observed, to have declined from 45% to 15%) due to the action of P. bliteus. This is an
indication of a successful biological control agent P. bliteus in managing the red gum lerp psyllid in Uganda.
Studies of releases of egg parasitoid C.nockae in the field, in Uganda however, have shown evidence of
production of at least one generation of progeny but no conclusive evidence of establishment since the bio-
agents were only brought in the country in May 2019.
a. In collaboration with FAO’S SPGS III Project, research and species trials were conducted focused on
identifying suitable species for commercial timber and bio-energy plantations in Uganda’s drylands in
Kasagala, Kazo, Mbarara and Nabilatuk districts. Early growth performance results indicated that
Eucalyptus GC550, Melia volkensii, and Clonal Eucalyptus GC796 had good height growth, having attained
greater than 1.9 m by 11 months. The Kazo site registered the best height growth for most species.
Conversely, Gmelina arborea and Grevelia robusta had the lowest tree height growth over all the sites.
Although they had low tree height growth the two species had the highest average survival of 91.81%
and 89.96% respectively.
b. In a bid to build the capacity of key stakeholders to manage and control pests and diseases affecting
commercial plantation forests in Uganda, and to take care of emerging pests and diseases, NaFORRI has
Photo 10- 23: P.bliteus parasitizing Psyllid lerp
Photo 10- 26: : Red gum Lerp psyllid and symptoms Photo 10- 25: Bronze bug and symptoms
Photo 10- 24: Parasitised Lerps by P.bliteus

Uganda Water and Environment Sector Performance Report 2020
185
updated the pests and diseases guideline developed under SPGS II and trained 80 key stakeholders in the
forest sector in tree pests and diseases identification, recognition and management.
c. Research on the improvement of Vitelleria paradoxa (shea trees) as a genetic resource and
food/commercial product continued at NaFORRI. Shea tree fruits contain nuts that produce abundant
quantities of oil, which is used in cooking, for cosmetics and as a base for confectionery products. The
institute’s shea tree improvement programme is therefore aimed at selecting genotypes with high oil
yield. This can enhance Uganda’s production of shea oil, which currently stands at 38,571 metric tons
(equivalent to US$ 15 million) but with potential to go up to US$118 million per year, if there are no
fluctuations in yield and fruiting. A collection of germplasm from across the whole of the shea tree range
of Uganda (eastern lowlands of Teso, northern grasslands, Nakasongola woodlands and West Nile) has
been assembled and planted in two Breeding Seed Orchards at Ngetta Zonal Agricultural Research
Institute (NgeZARDI) in Lira and National Semi-Arid Resources Research Institute (NASARRI) in Serere.
These orchards are being managed for progeny testing, conservation and as sources of seed and
breeding material. These orchards also represent the first national shea tree germplasm collections in the
country. The genetic diversity of all the accessions in the breeding seed orchards has been documented.
A formal breeding programme for shea trees has also been initiated for shea trees in Uganda.
d. Production of 150,000 clonal eucalyptus seedlings (GC796, GC540, GC550, GC578, GU7, GU8) proceeded
throughout the year, supplying tree growers across the country.
e. The institute is managing a 2-ha avocado germplasm collection, established in three blocks with three
replications of each of the 11 cultivars planted (Hass, Nabal, Esther, Sheppard, Fuerte, Wilson, Rincon,
Reed, Ettinger, Semile 34 and Semile 43) with the aim to develop a systematic identification mechanism
as well as enhance genetic improvement of avocado cultivars, develop proper propagation techniques,
but also produce high-quality germplasm for multiplication. Current efforts during FGY 2019/20 were at
establishment of a fruit tree seedling platform, involving, especially Hass avocado.
f. Improvements in energy saving stoves, and stove lighting Improved on its energy saving cook stove
prototype earlier developed in late 2018/2019 into the NARO Green Charcoal saver Stove (GCS). The
stove uses charcoal and carbonised briquettes as fuel wood and is characterised with reducing biomass
fuel consumption by over 60% cf. conventional stoves (8%-12%) due to maximum heat insulation
incorporated in the new design; reducing on average expenditure on charcoal per household by over 50%
(from UGX 3,500 to UGX 1,500 per day), having an ash tray at the bottom of the stove for safe ash
disposal and being fast and clean in cooking with minimum smoke and heat loss to the surrounding, and
less burning accidents.
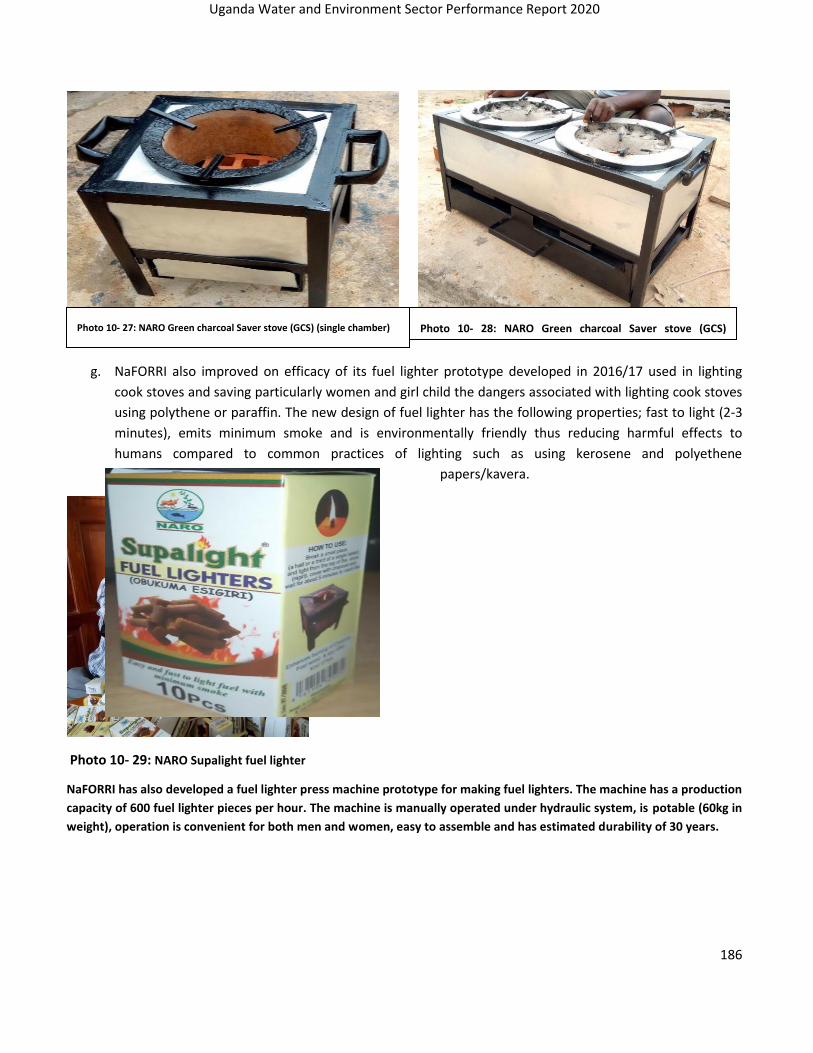
Uganda Water and Environment Sector Performance Report 2020
186
g. NaFORRI also improved on efficacy of its fuel lighter prototype developed in 2016/17 used in lighting
cook stoves and saving particularly women and girl child the dangers associated with lighting cook stoves
using polythene or paraffin. The new design of fuel lighter has the following properties; fast to light (2-3
minutes), emits minimum smoke and is environmentally friendly thus reducing harmful effects to
humans compared to common practices of lighting such as using kerosene and polyethene
papers/kavera.
Photo 10- 29: NARO Supalight fuel lighter
NaFORRI has also developed a fuel lighter press machine prototype for making fuel lighters. The machine has a production
capacity of 600 fuel lighter pieces per hour. The machine is manually operated under hydraulic system, is potable (60kg in
weight), operation is convenient for both men and women, easy to assemble and has estimated durability of 30 years.
Photo 10- 27: NARO Green charcoal Saver stove (GCS) (single chamber) Photo 10- 28: NARO Green charcoal Saver stove (GCS)
(double chamber)

Uganda Water and Environment Sector Performance Report 2020
187
10.3.3.7 Challenges and Recommendations for the Forestry Sector
The major challenges and recommendations are:
i) Lack of a coordination mechanism for forestry management in Uganda leading to increasing poor forest management practices, poorly planned and monitored investments. It is recommended that the Forestry Sector Support Department be supported to enhances its monitoring and supervision of all forestry initiatives including developing a dedicated monitoring framework and guidelines for both nursery management, certification and general forestry management. The Performance Contract between Government (hosted by FSSD) and NFA provide a good basis for monitoring Central Forest Reserve activities.
ii) Continued encroachment and issue of illegal titles in Central Forest Reserves and Local forest reserves. While
efforts have been made to open and demarcate boundaries, this is not adequate to counter the threats to
forest reserves. It is recommended that all titles irregularly issued in the reserves should be cancelled.
iii) While the regional entities were created, funding to the regional entities to support Monitoring, supervision,
coordination and backstopping roles is still lacking. This should be improved.
10.5 The National Environment Management Authority (NEMA)
10.5.1 Introduction
The National Environmental Management Authority (NEMA) is a principal Agency with the responsibility of coordinating, monitoring, and supervising environmental management in Uganda. It advises Government and spearheads the development of environmental policies, laws, regulations, standards, and guidelines for sound environmental management in Uganda. NEMA builds environment management capacity of government Ministries, Departments and Agencies (MDAs) and other stakeholders. It focuses on providing support to Government's main goal of ensuring sustainable development through the National Vision, the National Development Plan (NDP), regional and global commitments on sustainable development like the Sustainable Development Goals (SDGs). Its development objective is to create, establish, and maintain an efficient mechanism for sustainable environmental and natural resources management at the national, district, and community levels. As a regulatory Agency, NEMA draws authority which is embedded in the National Environment Act No. 5, 2019 available at http://www.nema.go.ug/.
10.5.2 Summary of Performance in FY2019/20
NEMA’s performance in FY2019/20 focused on implementation of its five year Strategic Plan under the following Key Results Areas (KRAs):
1) Environmental compliance, integrity, and productivity enhanced; 2) Green economy approach to Environment and Natural Resources (ENR) management developed and
promoted; 3) Strategic environment literacy, access to information and popular participation strengthened; 4) Human and financial capacity of NEMA strengthened to perform its mandate and statutory functions;
and 5) National, regional and international partnerships for sustainable development strengthened.
The achievements under each KRA were as follows: KRA 1: Environmental compliance, integrity, and productivity enhanced
(i) Support to Policy and legal framework

Uganda Water and Environment Sector Performance Report 2020
188
Below are the achievements in the FY 2019/20
• Six (6) districts were supported to develop bye-Law in Mbale (Wanale & Nyendo), Bulambuli (Bulageni & Sisiyi), and Manafwa (khabutoola & Nalondo) Mitoma, Ntungamo, and Buhweju.
• Arua District Environmental Officers were trained on drafting of Environmental ordinances and bye-laws.
• 112 cases comprising of challenges in eviction, restoration orders issue against encroachers on wetlands and forest reserves, noise pollution, impacts arising from stone quarry activities, breach of statutory duty, challenges of ESIA certificates of approval, termination of employment, breach of service contract and access to information were handled by the Authority and out of which, 16 were directly handled by the legal department and 96 were instituted as criminal cases by the EPF-NEMA.
• Finalization of reviews for the various laws, regulations, standards, and guidelines have been concluded. These various legal frameworks include; ESIA Regulations, Audit Regulations, Waste Management Regulations, Ozone Depleting Substances and Products) Regulations, 2019, Strategic Environment Assessment Regulation, Strategic Environment guidelines, Oil Spill Regulations, and the National Oil Spill Contingency Plan. Upon the commencement of the National Environment Act, Act No.5 of 2019 on 13th June 2019 (Photo 1), several regulations have been under review by the Authority, others were completed while a number of them are under review or yet to be initiated as seen in Table 10-7.
Photo 10- 30: NEMA ED, Dr. Tom Okurut, State Minister for Environment Beatrice Anywar, Onesimus Muhwezi, UNDP and NEMA
Deputy ED, Christine Akello Echookit Launched the newly regulation and NEA 2019 as part of the activity to mark World Environment
Day 2020
Table 10- 6: Status on development of environmental regulations
No. Name of document Status
Regulations finalized and signed by Minister
1 The National Environment (Environmental Impact and Social Assessment) Regulations 2020.
Pending finalization of the proposed Schedule for EIA fees. (Schedule 4) 2 The National Environment (Audit) Regulations 2020.

Uganda Water and Environment Sector Performance Report 2020
189
Finalized, printed, and are out for use and Implementation. Finalized, printed, and are out for use and Implementation. Finalized, printed, and are out for use and Implementation. Finalized, printed, and are out for use and Implementation. Pending printing at the Uganda Printing and Publishing Corporation (UPPC) Pending printing at the Uganda Printing and Publishing Corporation. (UPPC)
3 The National Environment (Management of Ozone Depleting Substances) Regulations 2020.
4 The National Environment (Waste Management) Regulations, 2020.
5 The National Environment (Strategic Environment Assessment) Regulations, 2020.
6 The National Environment (Oil Spill prevention, preparedness, and response) Regulations.
7 The National Environment (Standards for the discharge of Effluent into Water or on Land) Regulations.
Draft regulations pending review and completion
1 The National Environment (Air Quality) Regulations. These Regulations will be finalized by December 2020 however due to COVID-19, this deadline may not be met. Draft copy pending further review. Draft copy, pending further review.
2 The National Environment (Industrial and Consumer Chemicals Control) Regulations.
3 The National Environment (Landfill) guidelines.
4 The National Environment (Noise and Vibration Standards) Regulations.
Regulations yet to be reviewed
1 The National Environment (Mountainous and Hilly Areas Management) Regulations.
The Authority is yet to start drafting and consultations, due to resource constraints.
2 The National Environment (Conduct and Certification of Environmental practitioners) Regulations.
3 The National Environment (Access to Genetic Resources & Benefit Sharing) Regulations.
4 The National Environment (Minimum Standards for Management of soil Quality) Regulations.

Uganda Water and Environment Sector Performance Report 2020
190
5 The National Environment (Control of Smoking in Public Places) Regulations.
6 The National Environment (Delegation of Waste Discharge Functions) Regulations.
The National Environment Act No.5 of 2019 has new provisions to address current environmental challenges, thus the need to initiate Regulations in the following areas;
(i) Express penalties for various offenses under the Act; (ii) Economic instruments; (iii) Operationalization of the ban on the use of plastics; (iv) Access to information; (v) Payment for Ecosystem Services; and (vi) Administrative measures for quasi-judicial redress.
(ii) Environment Social Impact Assessment (ESIA)
• During the FY2019/20 Project Briefs (PBs) and Environmental Impact Statements (EISs) totaling 1,381 were submitted to NEMA. These were fewer than 1,618 PBs/EISs submitted during the FY2018/19. This was attributed to COVID-19 pandemic lockdown that led to reduced submission.
• 991 ESIA certificates were issued to the developers during FY2019/20 compared to 1,125 issued in FY2018/19. This was attributed to the COVID- 19 pandemic lockdown that affected the work timelines at the Authority between April and May 2020.
Figure 10- 6: Comparison between total number of PB and EISs submitted and total projects approved in FY 2019/20
• Projects approved by NEMA across the different sectors of the economy show five (5) leading categories; (i) Information Communication Technology (27%), (ii) Fuel Stations (25.2%), (iii) Infrastructure (19.4%), (iv) Industry (11.3%), and (v) Mining (6.5%). The five categories constitute 86.8% of the total projects approved by NEMA during the FY 2019/20 and FY2018/19.

Uganda Water and Environment Sector Performance Report 2020
191
Figure 10- 7: Projects approved during FY 2019/20 by sector category
These categories of projects have continued to impact on human health and environment, as well as socio-economic growth of the country. There is increased demand for construction materials as well as fuel, and considerable numbers of industries are being set up. The notable negative environmental impacts associated with the said categories of projects include: increase in atmospheric pollution caused by emission of different kinds of noxious (harmful) gases, fumes, and particulate matter into the atmosphere; while mining projects create residual impacts which include scarred landscape, degradation of the affected landscape including soil erosion and in some cases disruption of the local hydrology (which may affect the water catchment system), and un-restored mines and murram/gravel borrow-pits. To continue improving the ESIA process and enhance effectiveness in reviewing the ESIA's, eighty-five (85) spatial maps were prepared to guide decision-making and developments. Sensitivity mapping and assessment of floods and landslides was carried out in the districts of Katakwi, Amuria, Bulambuli & Butaleja in Eastern Uganda and Bundibugyo, Kasese, Kabale & Rubanda in Western Uganda. These critical undertakings will aid decision making for technical staff and lead agencies.
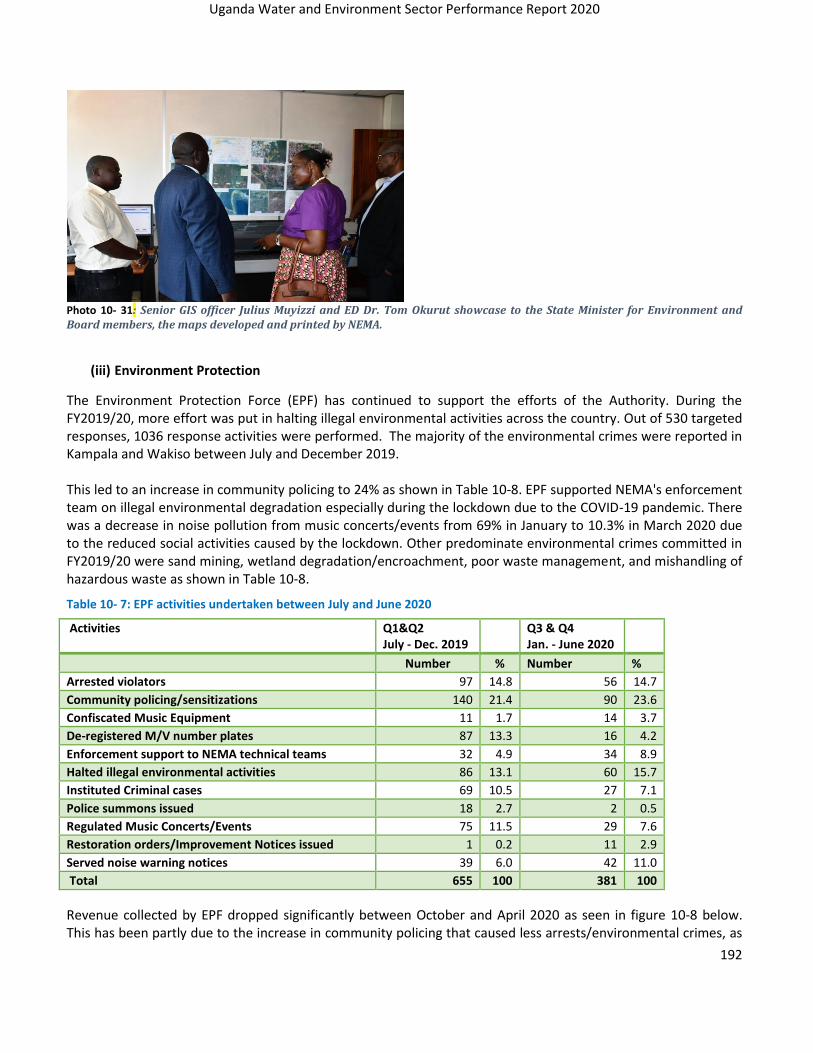
Uganda Water and Environment Sector Performance Report 2020
192
Photo 10- 31: Senior GIS officer Julius Muyizzi and ED Dr. Tom Okurut showcase to the State Minister for Environment and Board members, the maps developed and printed by NEMA.
(iii) Environment Protection
The Environment Protection Force (EPF) has continued to support the efforts of the Authority. During the FY2019/20, more effort was put in halting illegal environmental activities across the country. Out of 530 targeted responses, 1036 response activities were performed. The majority of the environmental crimes were reported in Kampala and Wakiso between July and December 2019. This led to an increase in community policing to 24% as shown in Table 10-8. EPF supported NEMA's enforcement team on illegal environmental degradation especially during the lockdown due to the COVID-19 pandemic. There was a decrease in noise pollution from music concerts/events from 69% in January to 10.3% in March 2020 due to the reduced social activities caused by the lockdown. Other predominate environmental crimes committed in FY2019/20 were sand mining, wetland degradation/encroachment, poor waste management, and mishandling of hazardous waste as shown in Table 10-8.
Table 10- 7: EPF activities undertaken between July and June 2020
Activities Q1&Q2 July - Dec. 2019
Q3 & Q4 Jan. - June 2020
Number % Number %
Arrested violators 97 14.8 56 14.7
Community policing/sensitizations 140 21.4 90 23.6
Confiscated Music Equipment 11 1.7 14 3.7
De-registered M/V number plates 87 13.3 16 4.2
Enforcement support to NEMA technical teams 32 4.9 34 8.9
Halted illegal environmental activities 86 13.1 60 15.7
Instituted Criminal cases 69 10.5 27 7.1
Police summons issued 18 2.7 2 0.5
Regulated Music Concerts/Events 75 11.5 29 7.6
Restoration orders/Improvement Notices issued 1 0.2 11 2.9
Served noise warning notices 39 6.0 42 11.0
Total 655 100 381 100
Revenue collected by EPF dropped significantly between October and April 2020 as seen in figure 10-8 below. This has been partly due to the increase in community policing that caused less arrests/environmental crimes, as

Uganda Water and Environment Sector Performance Report 2020
193
well as the partial lockdown that began towards the end of March 2020 hence affecting the total revenue collection projected revenue collection for FY2019/20 into the National Environment Fund.
Figure 10- 8: Revenue collection in Uganda shillings by EPF- NEMA in FY 2019/20
(iv) Inspections and audits
Eighty (80) environmental inspectors were trained in Environment integrity and sustainability of the green and brown environment following the gazette of 774 environmental inspectors in FY 2018/19. Training of the remaining environmental inspectors will be undertaken in a phased approach following the approved budgetary expenditures approved by MFPED in the subsequent financial years. In addition, eighty (80) Environmental Practitioners (EPs) were engaged to identify and seek clarity on issues related to EIS procedures that the Authority needs to address to improve the process regarding involvement of EPs in the review of the Regulations governing the conduct and certification of Environmental Practitioners and improving the review of documents submitted and provide timely feedback to clients. 1630 out of 1500 planned inspections were undertaken during FY2019/20. Complaints related to noise pollution and illegal dumping/discharge of waste dominated the FY 2019/20 and follow-up complaints brought to the attention of the Authority. Key findings from inspections noted more complaints related to air and noise pollution due to industrial facilities established around residential location Furthermore, the COVID- 19 lockdown that began towards the end of March 2020, led to a reduction in cases related to air and noise pollution.
(v) Air Quality Monitoring
The Authority particularly monitors air quality for particulate matter (PM2.5 and PM10), nitrogen dioxide, and ozone. To determine the impact of the COVID-19 lockdown on the air quality in Kampala City, Nitrogen dioxide, Ozone, and PM2.5 air quality parameters were considered and along with NEMA house, on Jinja road, nitrogen dioxide (NO2) concentrations level reduced by 41% during the COVID-19 lockdown while emissions reduced by 68.1%. This indicated that NO2 before the lockdown was higher than the WHO ambient air quality standard (40µg/m3) as observed in Figure 10-9 shown below.

Uganda Water and Environment Sector Performance Report 2020
194
Figure 10- 9: Nitrogen dioxide variations before and during COVID-19 lockdown
The air quality monitoring further analyzed the concentration of Particulate matter (PM2.5) for 4 months which revealed that there was an 83.9% decrease in PM2.5 concentration before the total lockdown and a 79 % decrease was achieved during the partial lockdown. This indicates that PM2.5 concentration (62.8µg/m3) before the COVID19 lockdown was way above the World Health Organization (WHO) ambient air quality standard (25µg/m3). However, after the partial and total lockdown, there was a reduction in the mean air quality PM2.5 concentration (11.7mg/m3) which was within WHO acceptable levels as seen in Figure 10-10 below.
Figure 10- 10: Particulate matter variations before and during COVID-19 lockdown
There have been small variations in the concentration upon lifting the lockdown due to reduced traffic flow, which indicated stable and close to consistent values of photochemical reactions between oxides of nitrogen (NOx) and volatile organic compounds (VOCs) in the presence of sunlight compared to high levels typically occur between noon and early evening with high traffic flows before the lockdown. These unprecedented reduction in air pollution, especially Nitrogen Oxides (NOx), and atmospheric particulate matter have a diameter of less than 2.5 micrometers (PM2.5) due to reduced economic activity as a result of measures to reduce the spread of COVID-19. The decrease and any short-term benefits that may be derived will come from health, economic and social costs, thus it is important for Government to support environmentally sound practices for waste management and maintain high environmental standards and enforcement.

Uganda Water and Environment Sector Performance Report 2020
195
(vi) Waste management
The Authority has continued to facilitate and coordinate the operation of the E-waste center and works have been completed as of November 2019 and its launch will soon be undertaken upon the conclusion of administrative matters. Furthermore, fifty (50) applications from various companies for consideration for issuance of licenses as shown in Table 10-9.
Table 10- 8: Number of applicants for waste handling
Licenses No. of Applicants
1 Domestic waste transportation 8
2 Hazardous waste transportation 19
3 Own/operate 10
4 Storage license 12
5 Transboundary movement of wastes 1
Total No of applications received 50
Multi-sectoral monitoring of high impact projects such as the Isimba Hydropower plant provided insights to impacts of infrastructural development on biodiversity and therefore one of the major impacts of the Isimba project was the impact on the Kalagala offset area which would affect the Bujagali indemnity agreement versus the partnership with World Bank to support development projects in Uganda. Mitigations were sought through the EIA process including public hearings and the offset area to be increased by 15.7km upstream of the Isimba dam and 100m buffer zone on either side of the River Nile between Bujagali HPP and Isimba HPP. The declaration of Kalagala- Itanda Falls offset Area as a Special Conservation Area has been the first of its kind putting Section 51 of the National Environment Act, No. 5, 2019 into force. The Statutory Instrument 2019 N0. 110 passed by Parliament on 27th December 2019 spelling out the total coverage of the area including the forest reserves therein, the purpose for the management and conservation of the Kalagala and Itanda falls area, permitted activities in the area among others.
Photo 10- 32: Natural Resources Manager (Biodiversity
and Rangelands) - Francis Ogwal briefing the PS Ministry
of Water and Environment - Alfred Okot Okidi during an
inspection to Kalagala -Itanda water falls
Photo 10- 33: Views of floating islands composed of suuds
that broke off the main land in Jinja City
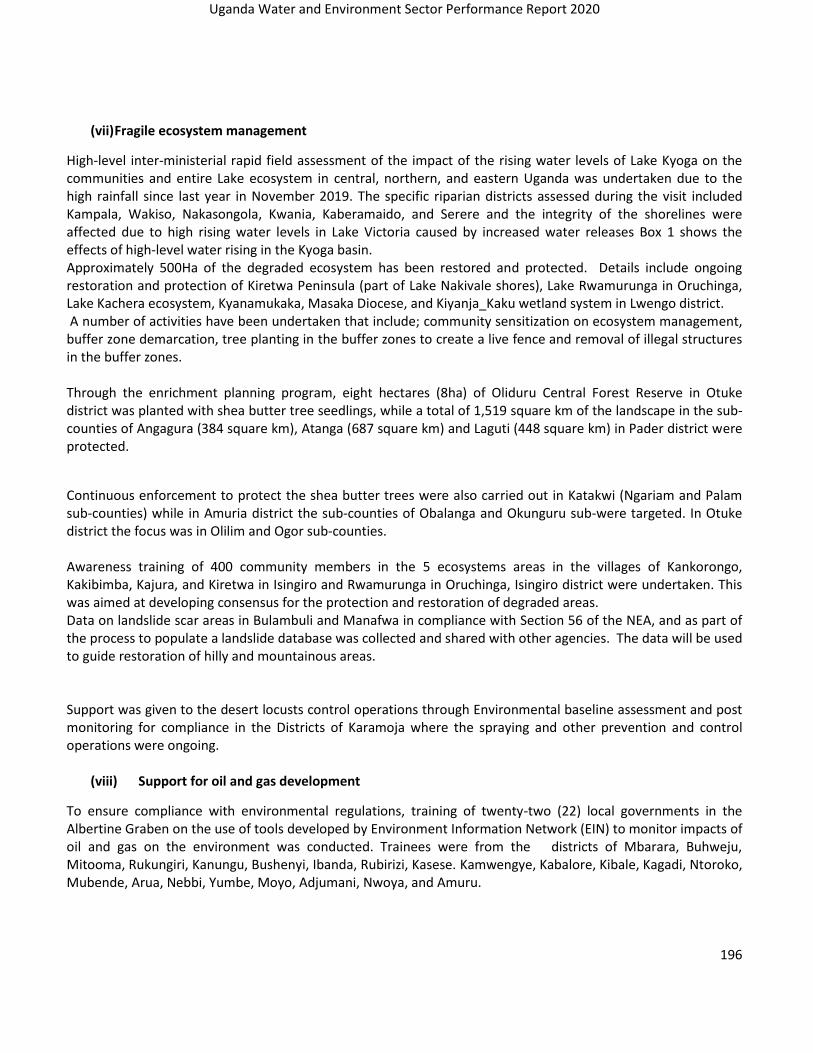
Uganda Water and Environment Sector Performance Report 2020
196
(vii) Fragile ecosystem management
High-level inter-ministerial rapid field assessment of the impact of the rising water levels of Lake Kyoga on the communities and entire Lake ecosystem in central, northern, and eastern Uganda was undertaken due to the high rainfall since last year in November 2019. The specific riparian districts assessed during the visit included Kampala, Wakiso, Nakasongola, Kwania, Kaberamaido, and Serere and the integrity of the shorelines were affected due to high rising water levels in Lake Victoria caused by increased water releases Box 1 shows the effects of high-level water rising in the Kyoga basin. Approximately 500Ha of the degraded ecosystem has been restored and protected. Details include ongoing restoration and protection of Kiretwa Peninsula (part of Lake Nakivale shores), Lake Rwamurunga in Oruchinga, Lake Kachera ecosystem, Kyanamukaka, Masaka Diocese, and Kiyanja_Kaku wetland system in Lwengo district. A number of activities have been undertaken that include; community sensitization on ecosystem management, buffer zone demarcation, tree planting in the buffer zones to create a live fence and removal of illegal structures in the buffer zones. Through the enrichment planning program, eight hectares (8ha) of Oliduru Central Forest Reserve in Otuke district was planted with shea butter tree seedlings, while a total of 1,519 square km of the landscape in the sub-counties of Angagura (384 square km), Atanga (687 square km) and Laguti (448 square km) in Pader district were protected.
Continuous enforcement to protect the shea butter trees were also carried out in Katakwi (Ngariam and Palam sub-counties) while in Amuria district the sub-counties of Obalanga and Okunguru sub-were targeted. In Otuke district the focus was in Olilim and Ogor sub-counties. Awareness training of 400 community members in the 5 ecosystems areas in the villages of Kankorongo, Kakibimba, Kajura, and Kiretwa in Isingiro and Rwamurunga in Oruchinga, Isingiro district were undertaken. This was aimed at developing consensus for the protection and restoration of degraded areas. Data on landslide scar areas in Bulambuli and Manafwa in compliance with Section 56 of the NEA, and as part of the process to populate a landslide database was collected and shared with other agencies. The data will be used to guide restoration of hilly and mountainous areas. Support was given to the desert locusts control operations through Environmental baseline assessment and post monitoring for compliance in the Districts of Karamoja where the spraying and other prevention and control operations were ongoing.
(viii) Support for oil and gas development
To ensure compliance with environmental regulations, training of twenty-two (22) local governments in the Albertine Graben on the use of tools developed by Environment Information Network (EIN) to monitor impacts of oil and gas on the environment was conducted. Trainees were from the districts of Mbarara, Buhweju, Mitooma, Rukungiri, Kanungu, Bushenyi, Ibanda, Rubirizi, Kasese. Kamwengye, Kabalore, Kibale, Kagadi, Ntoroko, Mubende, Arua, Nebbi, Yumbe, Moyo, Adjumani, Nwoya, and Amuru.

Uganda Water and Environment Sector Performance Report 2020
197
Photo 10- 34: NEMA board Chair Prof.Tickodri Togboa addressing residents of Kyotera during the EACOP public hearings. He explained
to the residents the steps NEMA has taken to support the sector including training of local governments
This training will build capacity and equip technical staff of the Local Governments with knowledge to monitor Oil and Gas developments in the Albertine Graben. Besides, seven (7) local governments (Mbarara, Buhweju, Mitooma and Rubirizi, Pallisa, Kibuuku, and Mbale) were trained on the use of mobile data collection application to establish and operationalize innovative mechanisms for community empowerment and involvement in environmental monitoring, enforcement and compliance.
The mobile data collection application will transform the previously paper-based data collection into an electronic data collection system with data transmitted directly to NEMA servers while the data collectors are still in the field (regardless of location in the country) as long as there is internet connectivity. Furthermore, the guiding tool – the Albertine Graben Environmental Monitoring Plan (AGEMP) for tracking the impacts of oil and gas-related developments in the Albertine Graben was reviewed and updated to enable the Authority and the lead agencies monitoring indicators, demonstrate progress and changes in the ecosystem components, signaling when environmental management in the petroleum sector is on track, or giving early warnings for when developments are heading in the wrong direction. KRA 2: DEVELOPING AND PROMOTING A GREEN APPROACH TO ENR MANAGEMENT
Support environmental sustainability and integration
Box 1: Effects of the high rising water levels around Lake Kyoga basin
a) Destruction of crops through flooding and failure to access land to cultivate and markets in Murem parish in
Kaberamaido district and in Mone and Kibuye landing in Nakasongola,
b) Displacement of communities and disruption of livelihood in Mone and Kibuye in Nakasongola, Murem and Okile
landing site in Kaberamaido,
c) Destruction of government infrastructure: Port/ferry docking sites and water monitoring points in Masindi and
Namasale; Kachung water works in Agwata and in Bugondo Serere; police post in Mone Nakasongola,
d) Loss of key flora and fauna across the entire shoreline in all districts, flooded roads which has led to
inaccessibility of key social & health services: in nearly all shoreline urban settings in Kaberamaido district,
Bugondo in Serere and Agwata –Kachung road,
e) Increase risk of reptile attracts like crocodiles and snakes observed in Okile and Murem sub counties in
Kaberamaido district and in Kasenyi in Nakasogola,
f) Collapsed sanitation facilities such as pit latrines/Toilets in nearly all the shoreline centres in all the districts.
There is a heightened risk of disease outbreaks of cholera, dysentery, bilharzia etc. and;
g) Limited awareness about lake and river shoreline regulations by the communities and some local leaders such as
the Local Council (LCs) leaders.

Uganda Water and Environment Sector Performance Report 2020
198
NEMA together with MWE coordinated the development of ENR mainstreaming guidelines and a total of 81 participants (25 women and 56 men) reviewed and validated the guidelines. Furthermore, all lead agencies appointed Focal point persons to ease communication and discussed modalities of implementing the ban on Polythene materials for effective environmental management. Fifteen (15) Lead Agencies presented their quarterly reports following the Lead Agency strategy guidelines and recommended that establishment of a national environment platform to provide an annual lead agency report. The national environment platform was proposed as a forum that brings together all actors in the environment, natural resources, and climate change fraternity. The discussions involved 20 participants (16 male and 4 females) from NEMA, National Planning Authority (NPA), Ministry of Water and Environment (MWE), Ministry of Finance, Planning and Economic Development (MFPED) and Environment CSO Network, Environmental Management for Livelihood Improvement – Bwaise facility (EMLI), International Union for Conservation and Nature (IUCN), and private sector foundation to debate new and emerging environmental related issues, engage in research and development, policy development and analysis, and support capacity building initiatives among others. (viii)Environmental information and research
Research undertaken on Tilapiine diversity in the Victoria Nile stretch indicates genetic variation and demographic the data indicates that Nile tilapia in the upper Murchison Falls water body of the Victoria Nile might have been introduced from Lake Albert at a time stocking were implemented in Lake Victoria and Kyoga. There also seems to be an indicator of genetic erosion in the same water stretch, which may be a result of confinements to the Nile tilapia population attributed to dams (e.g. Owen Fall Dam a.k.a Nalubale dam) as well founder effects from stocking or even overfishing. Notwithstanding these challenges, the natural barrier at Karuma and Murchison Falls seems to hinder the gene flow of Nile tilapia to the gene pool of the same populations below the falls. The study was carried out to ascertain the extent of tilapia diversity and propose policy recommendations in the subsequent reports to the sector. KRA 3: STRENGTHENING ENVIRONMENT LITERACY, ACCESS TO INFORMATION AND POPULAR PARTICIPATION
Support public education and inclusive participation in ENR management
To strengthen and have inclusive participation in ENR management four (4) awareness programs were conducted involving education managers and environment officers. There were 54 (fifty-four) participants (13 women and 41 men) from West Nile region from the districts and municipalities of Obongi, Adjumani, Arua, Maracha, Nebbi, Zombo, Moyo, Pakwach, Koboko, Madi-Okollo, Yumbe. In Albertine region, 37 (20 men, 17 women) participated from the districts of Kakumiro, Masindi, Hoima, Buliisa, Kibaale, Kiryadongo, Kagadi, Kikuube), while in Hoima district-this was specifically for headteachers, club patrons, members of senior management committee. A press statement was produced to create awareness and clarify issues concerning sand mining in the central region. Training and building capacity of staff in information and technology skills in disseminating public information, Unified Messaging system, EIA database, and system security was undertaken to introduce staff on how to use the new features. This in the long term will improve general utilization of the features and functionalities of the available IT systems in NEMA and reduce on damage imposed by users to the IT equipment because of a lack of technical user skills.
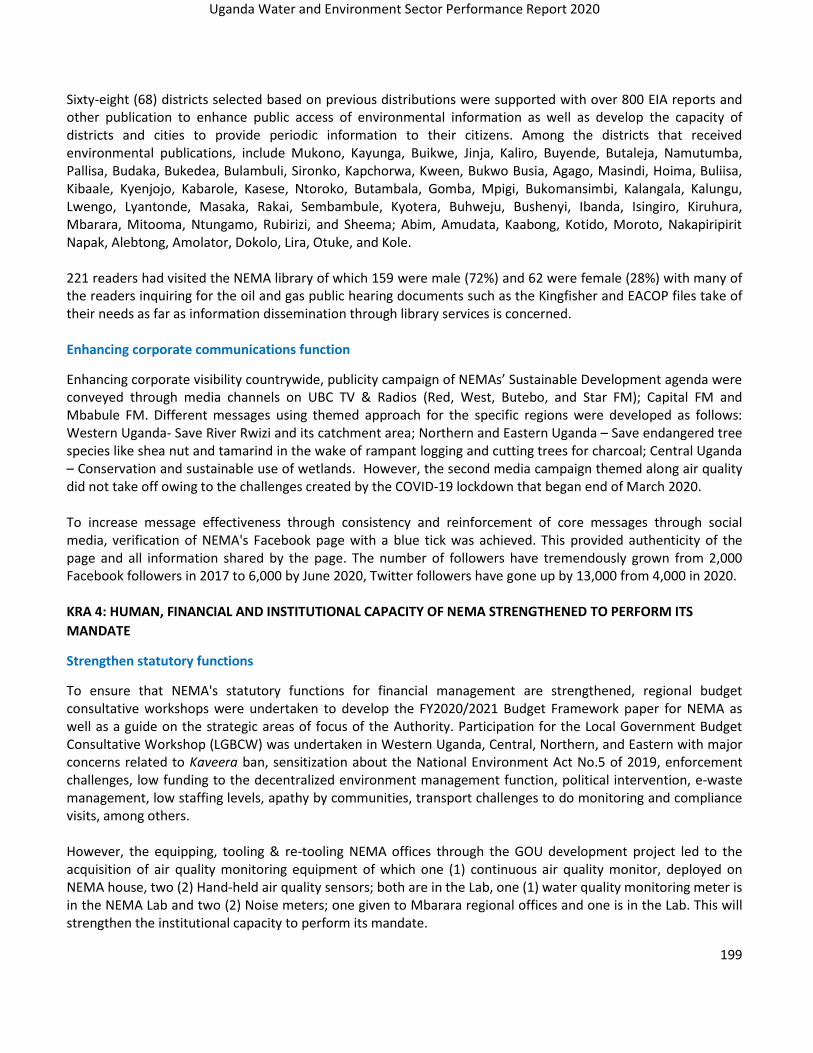
Uganda Water and Environment Sector Performance Report 2020
199
Sixty-eight (68) districts selected based on previous distributions were supported with over 800 EIA reports and other publication to enhance public access of environmental information as well as develop the capacity of districts and cities to provide periodic information to their citizens. Among the districts that received environmental publications, include Mukono, Kayunga, Buikwe, Jinja, Kaliro, Buyende, Butaleja, Namutumba, Pallisa, Budaka, Bukedea, Bulambuli, Sironko, Kapchorwa, Kween, Bukwo Busia, Agago, Masindi, Hoima, Buliisa, Kibaale, Kyenjojo, Kabarole, Kasese, Ntoroko, Butambala, Gomba, Mpigi, Bukomansimbi, Kalangala, Kalungu, Lwengo, Lyantonde, Masaka, Rakai, Sembambule, Kyotera, Buhweju, Bushenyi, Ibanda, Isingiro, Kiruhura, Mbarara, Mitooma, Ntungamo, Rubirizi, and Sheema; Abim, Amudata, Kaabong, Kotido, Moroto, Nakapiripirit Napak, Alebtong, Amolator, Dokolo, Lira, Otuke, and Kole. 221 readers had visited the NEMA library of which 159 were male (72%) and 62 were female (28%) with many of the readers inquiring for the oil and gas public hearing documents such as the Kingfisher and EACOP files take of their needs as far as information dissemination through library services is concerned. Enhancing corporate communications function
Enhancing corporate visibility countrywide, publicity campaign of NEMAs’ Sustainable Development agenda were conveyed through media channels on UBC TV & Radios (Red, West, Butebo, and Star FM); Capital FM and Mbabule FM. Different messages using themed approach for the specific regions were developed as follows: Western Uganda- Save River Rwizi and its catchment area; Northern and Eastern Uganda – Save endangered tree species like shea nut and tamarind in the wake of rampant logging and cutting trees for charcoal; Central Uganda – Conservation and sustainable use of wetlands. However, the second media campaign themed along air quality did not take off owing to the challenges created by the COVID-19 lockdown that began end of March 2020. To increase message effectiveness through consistency and reinforcement of core messages through social media, verification of NEMA's Facebook page with a blue tick was achieved. This provided authenticity of the page and all information shared by the page. The number of followers have tremendously grown from 2,000 Facebook followers in 2017 to 6,000 by June 2020, Twitter followers have gone up by 13,000 from 4,000 in 2020. KRA 4: HUMAN, FINANCIAL AND INSTITUTIONAL CAPACITY OF NEMA STRENGTHENED TO PERFORM ITS
MANDATE
Strengthen statutory functions
To ensure that NEMA's statutory functions for financial management are strengthened, regional budget consultative workshops were undertaken to develop the FY2020/2021 Budget Framework paper for NEMA as well as a guide on the strategic areas of focus of the Authority. Participation for the Local Government Budget Consultative Workshop (LGBCW) was undertaken in Western Uganda, Central, Northern, and Eastern with major concerns related to Kaveera ban, sensitization about the National Environment Act No.5 of 2019, enforcement challenges, low funding to the decentralized environment management function, political intervention, e-waste management, low staffing levels, apathy by communities, transport challenges to do monitoring and compliance visits, among others. However, the equipping, tooling & re-tooling NEMA offices through the GOU development project led to the acquisition of air quality monitoring equipment of which one (1) continuous air quality monitor, deployed on NEMA house, two (2) Hand-held air quality sensors; both are in the Lab, one (1) water quality monitoring meter is in the NEMA Lab and two (2) Noise meters; one given to Mbarara regional offices and one is in the Lab. This will strengthen the institutional capacity to perform its mandate.

Uganda Water and Environment Sector Performance Report 2020
200
By June 2020, the total number of staff was one hundred thirty-four (134) where 73 (54.5%) are male while 54 (40.3%) are female. Eleven (11) staff (9 females and 2 males) attended training within and outside the country. KRA 5: NATIONAL, REGIONAL AND INTERNATIONAL PARTNERSHIPS FOR SUSTAINABLE DEVELOPMENT
STRENGTHENED
Strengthen networks with CSOs and Private sector
Broad-based engagement with fifty (50) Civil Society Organizations (CSOs) and the private sector in the Eastern region on their role in supporting lead agencies ineffective environmental management raised a number of issues. These include; the need to form a network of environment defenders so that they can work together through the formation of social media platforms for CSOs, engage media and investigative journalists to bring out environment degraders and key occurrences, train CSOs on information and current laws particularly an extensive discussion on the NEA (2019), and sensitization of people on the importance of how to support the environment management function that NEMA spearheads and improve service delivery. The United Nations University (UNU) – Land Restoration Training program has had a longstanding collaboration with NEMA, Uganda, and Makerere University, which has seen several environment officers, from the Local Government, and academics, from Makerere University. The 3-year project has led to three (3) pieces of training and the recent training held in October 2019 of which 25 participants (19 male and 07 female) were trained in Sustainable Land Management, Land Restoration, and Linkages with Climate Change. Also, the Green Climate Fund accreditation process is ongoing with a gap analysis and preliminary form filling exercise completed. This has been coupled with continuous collaborations with the Global Green Growth Institute Uganda country office to attain accreditation under the Global Climate Fund (GCF).
Strengthen Multilateral Environment Agreements (MEAs) and enhance implementation
To increase domestication of Multilateral Environment Agreements (MEAs) several regional and international training workshops, conferences and meetings were attended to strengthen the capacity of countries in implementing MEAs these included capacities for national focal points to assume their primary responsibility for implementing the Basel and Rotterdam conventions within their respective national settings. This led to the Basel Ban Amendment entering into force but with critical issues still debated in regard to E-waste and plastics of which Uganda is currently addressing under its development agenda. Partnerships with development partners like UN Agencies such as UNEP, UNDP, UNOPS, regional/inter-continental blocks like EAC, SADC, COMESA and AU among others, other governments such as Germany, Norway, and Japan; International agencies such as the World Bank, International Monetary Fund (IMF), Global Environment Facility (GEF), European Union (EU) and the Global Climate Fund (GCF), among others; to implement the Sustainable Development Goals (SDGs) have led to access to financial and technical support to develop transformative projects that have led to the restoration of degraded fragile ecosystems, improvement of livelihoods with particular focus to women, youth and children, as well as economic development of the country through infrastructural development projects, hence contributing to national development and subsequent achievement of Vision 2040. To enhance MEAs through project coordination and implementation, the following projects are being coordinated as seen in Table 10-10 by NEMA through collaboration and partnership with other key stakeholders in government, CSOs, academia, district local governments, cities, IPLCs, and media.

Uganda Water and Environment Sector Performance Report 2020
201
Table 10- 9: MEAs projects under NEMA coordination in FY 2019/20
Projects under coordination by NEMA as of FY 2019/20
Development partner
Project investment portfolio – UGX/USD/ EURO
Timeline
Project key achievements FY2019-20
Status (on track, off track or ahead of schedule)
1 Mainstreaming Biodiversity into the heart of Government - CONNECT project
UNEP- WCMC
5 Million USD 2019/2020
Studies of three natural capitals being undertaken under the Natural Capital Accounting Project to inform sustainable development decision making namely: Fisheries Accounts, Tourism and Biodiversity Accounts, Land (soil), and Land (soil) Degradation Accounts. Communication Strategy for the NCA project finalized.
Project is at 85% progress and is currently on track.
2 Strengthening institutional capacity for effective implementation of RIO conventions in Uganda - RIO project
UNDP 1.9 Million USD 2019/2020
The following reports have been developed to guide RIO implementation in the country. a) A national and district capacity assessment for RIO conventions monitoring and reporting, b) a national negotiation strategy for the RIO conventions, c) a gender action plan for RIO implementation. Enhanced south-south cooperation through regional exchange visit by government agencies to learn and improve coordination and implementation of MEAs in Uganda.
Project is at 70% progress and is currently on track.
3 Integrating Natural Capital into Sustainable Development Decision-making in Uganda. - NCA project
Darwin Initiative
355,388 Euros 2019/2020
Needs assessment report for the project on Integrating Natural Capital into Sustainable Development Decision-making in Uganda completed.
Project is at 50% progress and is currently on track.
4 Institutional Capacity Strengthening for Implementation of the Nagoya Protocol on Access to Genetic Resources and Benefit Sharing in Uganda - ABS project
UNEP 2.9 Million USD 2019/2020
• Project has just been approved with no implementation
• Coordination finalized and approved by GEF.
• Expected implementation to begin in 2021.
0%

Uganda Water and Environment Sector Performance Report 2020
202
5 Promoting integrated landscape management approach for conservation of the Mount Elgon ecosystem in Eastern Uganda.
UNEP 10.5 Million USD
2019/2020
Ongoing completion of the Project Document (ProDoc) with other lead agencies and CSOs
0%
6 Biodiversity mapping of essential life support areas (ELSA project)
UNOPS/UNDP
30,000 USD 2019/2020
Virtual project Inception workshop held (13 May to 3rd June 2020). Secondary data collation has been initiated.
Project is at 20% progress and is currently on track.
7 Lake Kyoga Basin Integrated Environment Management and Climate Change Resilience Project.
GCF XXX????? 2019/2020
Project concept under review by GGGI – Uganda country office.
0%
8 Inclusive Green Growth for Poverty Reduction (IGGPR) Project
UNDP Ugx 476,000,000
2019/2020
• Restoration of the bare hills in Ntungamo district (community tree nurseries and tree planting for both conservation and income generation.
• 2 community groups in Katakwi district introduced to value addition on shea butter products to promote the conservation of the threatened shea tree and livelihoods).
• Development of community based environmental monitoring and reporting by use of internet and mobilize app. (sensitization and training of selected MDAs and local governments on the use of the digital tools and Apps.)
Project is at 70% progress and is currently on track.
9 Strengthening National Institutional Capacity in Sound Management of Chemicals and waste project
UN- Environment
250,000 USD 2019/2020
• Capacity building of government technical staff have been undertaken in chemical management.
• The chemical and waste database prototype has been developed and is under review.
Project is at 70% progress and is currently on track.

Uganda Water and Environment Sector Performance Report 2020
203
• Update of the chemical and waste profile in ongoing as of June 2020.
10.5.3 Challenges, Lessons Learnt and Recommendations
The key implementation challenges NEMA faced during the FY2019/20 include (i) The release of funds for quarter 3 was less than the first requested disbursement from MFPED with no
additional funds disbursed in Quarter 4 upon request. This affected performance targets of some planned activities.
(ii) Limited understanding of the new National Environment Act, No. 5 2019 where, some of the Lead Agencies are no aware of their responsibilities and roles to undertake in environment management.
(iii) A reduced internal human resource especially during the lockdown to undertake official work like field environment management activities especially inspections, audits, ESIA baseline verifications.
(iv) High levels of environmental encroachment were observed during the lockdown period. (v) Timelines for regulatory processes have been delayed due to the COVID-19 lockdown and gradual adaptive
capacity of staff to the new way of working with limited access to good internet bandwidth coverage affected many of the internal operations.
Lessons Learnt from COVID -19 Lockdown
(i) Removal of public transport (minibuses, motorbikes, and buses) reduced air pollution by above 50% will improve the air quality of Uganda as mentioned in the report with benefits of having improved health and quality of environment.
(ii) As observed, key internal tasks were fully undertaken with less external interruptions from other activities that require NEMA to participate as an entity/stakeholder.
Recommendations
(i) MFPED should shift investments and subsidies towards nature-based and climate-neutral strategies to reduce the after-effects/impacts from the COIVD-19 lockdown on the environment.
(ii) Promote control and prevention of air pollution through measures that are proven to be effective and equitable with a view of fostering public health and resilience.
(iii) Strengthen research on how changes in behavior and lifestyle impact on environment with a focus on teleworking, changes in mobility patterns, social distancing measures, and reduced consumption, etc. Further research into the linkages between air pollution exposure and COVID-19 impacts on health.
(iv) Need for government to expedite policy implementation on mass public transport system within Kampala metropolitan such as Light Rail Train (LRT), Bus Rapid Transport (BRT).
(v) More resources centers are needed across the country because 96% of the public accessing environmental information from the NEMA library are from the central region compared to other regions such as the East, West, and North.
(vi) Participation in the Multilateral Environmental Agreements (MEAs) is necessary for institutional capacity building and resource mobilization. However, this is constrained by inadequate funding.
(vii) Continuous environmental sensitization and public education are required to enable Ugandans to know their responsibilities towards protecting the environment and ensure they protect and conserve the fragile ecosystems, as well as access the benefits from natural resources through sustainable consumption and production.
(viii) Provide capacity building to the district local governments to enable them to manage the environment, undertake compliance monitoring, and inspections all the developments in the various districts.
(ix) Scale-up restoration efforts through continuous monitoring and enforcement of restoration efforts across the country, to realize the significant impact in the long term.
(x) Undertake awareness meetings to popularize the NEA, 2019 amongst the Lead Agencies.

Uganda Water and Environment Sector Performance Report 2020
204
10.6 METEOROLOGY
10.6.1 Introduction
UNMA undertakes the following functions:
• Provision of meteorological and climatological services to weather dependent sectors such as agriculture, forestry, water resources management, civil aviation, marine and the private sector including industry, commerce and public utilities for the better exploitation and utilization of natural resources for national development;
• Provision of tailored meteorological services to the aviation industry for the safety of the civil aviation operations in accordance to WMO and ICAO recommendations.
• Organization and administration of surface and upper air meteorological observations within our area of responsibility (Uganda geographical boundaries) and the publication of all relevant Climatological data;
• Maintenance of an efficient telecommunications system for rapid collection and dissemination of meteorological information required for national and international use in accordance with the World Meteorological Organization (WMO) and the International Civil Aviation Organization (ICAO) procedures;
• Co-ordination of research in the fields of meteorology and climatology including co-operation with other authorities in all aspects of applied meteorological research and the maintenance of the National Meteorological Library.
10.6.2 Achievement in the FY 2019/20
UNMA support to the Aviation sector provided through issuance of 2196 Terminal Aerodrome Forecasts and 13700 flight folders to enable air navigation in and outside the country. Four seasonal climate outlooks of July 2019-May 2020 issued for regions of Uganda and disseminated the seasonal forecasts of the September to December 2019 and the January to April 2020 season at Uganda media center as a kick off to increase the public awareness on weather patterns in those seasons supporting the different social economic activities, advisories for the different sectors and emerging climate issues expected. 36 Manual Weather Stations, 31 ADCON Automatic Weather Stations and 12 DAVIS Community Automatic Weather Stations' functionality improved across the country. Re-branding and visibility improved through electronic media which is most commonly used by majority of the stakeholders in rural and urban areas with 8 TV talk shows held on NTV, Delta, BBS, Spark and NBS in English mainly on the seasonal forecast, weather updates and interviews on emerging weather phenomenon like weather sprouts, raising water levels and disasters. BBS, Delta and also Spark TV covered these issues in Local Language mainly Luganda. 9 Radio talk shows were carried out in Luganda and Runyakitara on Bukedde, Pearl and English on UBC while Star TV translated to all local languages where UBC has coverage. Carried out a customer satisfaction survey whose main objective was to obtain feedback from stakeholders mainly consuming aeronautical meteorological services. This is aimed at continuous improvement UNMA products and services. The survey was taken at aerodromes of Entebbe, Kajansi, Gulu, Soroti and Arua which involved stakeholders like Civil Aviation Authority, Uganda People Defense Airforce Force and flying schools. It also had a component of seasonal forecast where farmers in those areas were sampled. The stakeholders in aeronautical meteorological services placed UNMA Terminal Aerodrome Forecasts at 85% while the farmers placed the seasonal forecasts accuracy at 80%.

Uganda Water and Environment Sector Performance Report 2020
205
State of the climate report for Uganda for 2019 was completed. The assessment of the state of climate of Uganda in 2019 reveals that the year 2019 was the warmest on record since 1950. The year was warmer than the record-breaking year 2009 over Uganda, with a warming level of 0.78°C above the WMO operational climatological period: 1981-2010. The year was warmer than 2018 by nearly 0.41°C. It is important to note with concern that western Uganda is warming faster than the rest of the regions. It exhibited a warming level of 1.70 °C, with warming rates of 0.60°C/decade and 0.63°C/decade over the periods: 1950-2019 and 1990-2019, respectively. It was further noted that for western Uganda, the year 2019 was warmer than 2018 by about 0.67°C. Year 2019 was characterized by above normal rainfall events in most regions of the country. The observed extreme rainfall events led to flooding and landslides that affected thousands of people across the country.
Trained users in interpreting and applying weather information in farming in Kacumbala, Akworo,Kawo, Kamutsya, Akera, Kidongole and Okirilira in Bukedea and Teso region through the setup village weather clinics. Accommodation at weather stations of Masindi and Ntusi was improved with 2 uniports installed to create office space for the stations with no offices. Awareness programs were conducted on importance of meteorology undertaken through the Popularization of meteorology in schools undertaken in 10 secondary and 10 primary schools in Jinja, Kayunga, and Mukono districts where students were sensitized on weather and climate change aspects and career pathways on how to become a meteorologist.
Below is the progress made in the implementation of the Weather RADAR Project to-date.
Table 10- 10: Progress of implementation of Radar project
Radar Site Implementation Status Remarks
1st Kigungu-Entebbe Fully installed and operational Awaiting support infrastructure
like an office block which has
remained an unfunded priority.
2nd Mwizi-Rwampara Land procured, radar equipment shipped and civil
works are ongoing.
The process was delayed due to the
long land acquisition process.
3rd Lira University-Lira Radar equipment shipped and civil works
ongoing at Lira University

Uganda Water and Environment Sector Performance Report 2020
206
Photo 10- 35: First weather radar fully installed and operational in Kigungu
Photo 10- 36: Radar tower works for the second weather radar at Mwizi hill in Rwampara
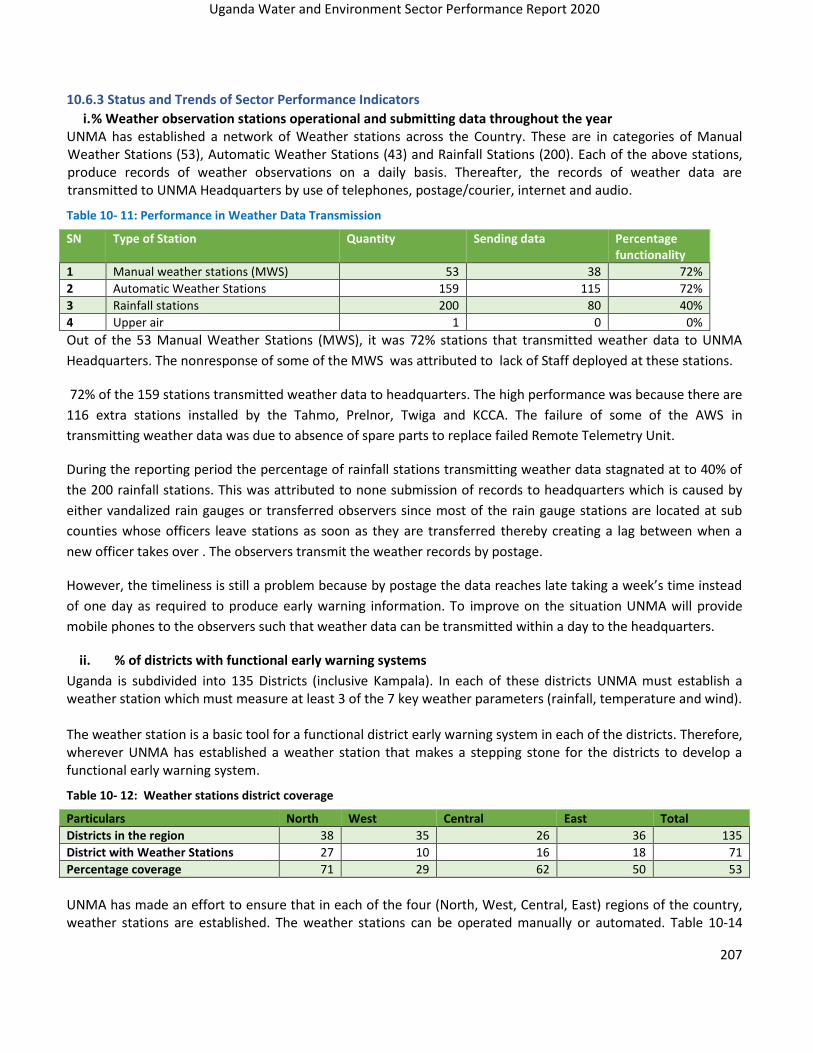
Uganda Water and Environment Sector Performance Report 2020
207
10.6.3 Status and Trends of Sector Performance Indicators
i. % Weather observation stations operational and submitting data throughout the year UNMA has established a network of Weather stations across the Country. These are in categories of Manual Weather Stations (53), Automatic Weather Stations (43) and Rainfall Stations (200). Each of the above stations, produce records of weather observations on a daily basis. Thereafter, the records of weather data are transmitted to UNMA Headquarters by use of telephones, postage/courier, internet and audio.
Table 10- 11: Performance in Weather Data Transmission
SN Type of Station Quantity Sending data Percentage functionality
1 Manual weather stations (MWS) 53 38 72%
2 Automatic Weather Stations 159 115 72%
3 Rainfall stations 200 80 40%
4 Upper air 1 0 0%
Out of the 53 Manual Weather Stations (MWS), it was 72% stations that transmitted weather data to UNMA
Headquarters. The nonresponse of some of the MWS was attributed to lack of Staff deployed at these stations.
72% of the 159 stations transmitted weather data to headquarters. The high performance was because there are
116 extra stations installed by the Tahmo, Prelnor, Twiga and KCCA. The failure of some of the AWS in
transmitting weather data was due to absence of spare parts to replace failed Remote Telemetry Unit.
During the reporting period the percentage of rainfall stations transmitting weather data stagnated at to 40% of
the 200 rainfall stations. This was attributed to none submission of records to headquarters which is caused by
either vandalized rain gauges or transferred observers since most of the rain gauge stations are located at sub
counties whose officers leave stations as soon as they are transferred thereby creating a lag between when a
new officer takes over . The observers transmit the weather records by postage.
However, the timeliness is still a problem because by postage the data reaches late taking a week’s time instead
of one day as required to produce early warning information. To improve on the situation UNMA will provide
mobile phones to the observers such that weather data can be transmitted within a day to the headquarters.
ii. % of districts with functional early warning systems
Uganda is subdivided into 135 Districts (inclusive Kampala). In each of these districts UNMA must establish a weather station which must measure at least 3 of the 7 key weather parameters (rainfall, temperature and wind). The weather station is a basic tool for a functional district early warning system in each of the districts. Therefore, wherever UNMA has established a weather station that makes a stepping stone for the districts to develop a functional early warning system.
Table 10- 12: Weather stations district coverage
Particulars North West Central East Total
Districts in the region 38 35 26 36 135
District with Weather Stations 27 10 16 18 71
Percentage coverage 71 29 62 50 53
UNMA has made an effort to ensure that in each of the four (North, West, Central, East) regions of the country, weather stations are established. The weather stations can be operated manually or automated. Table 10-14
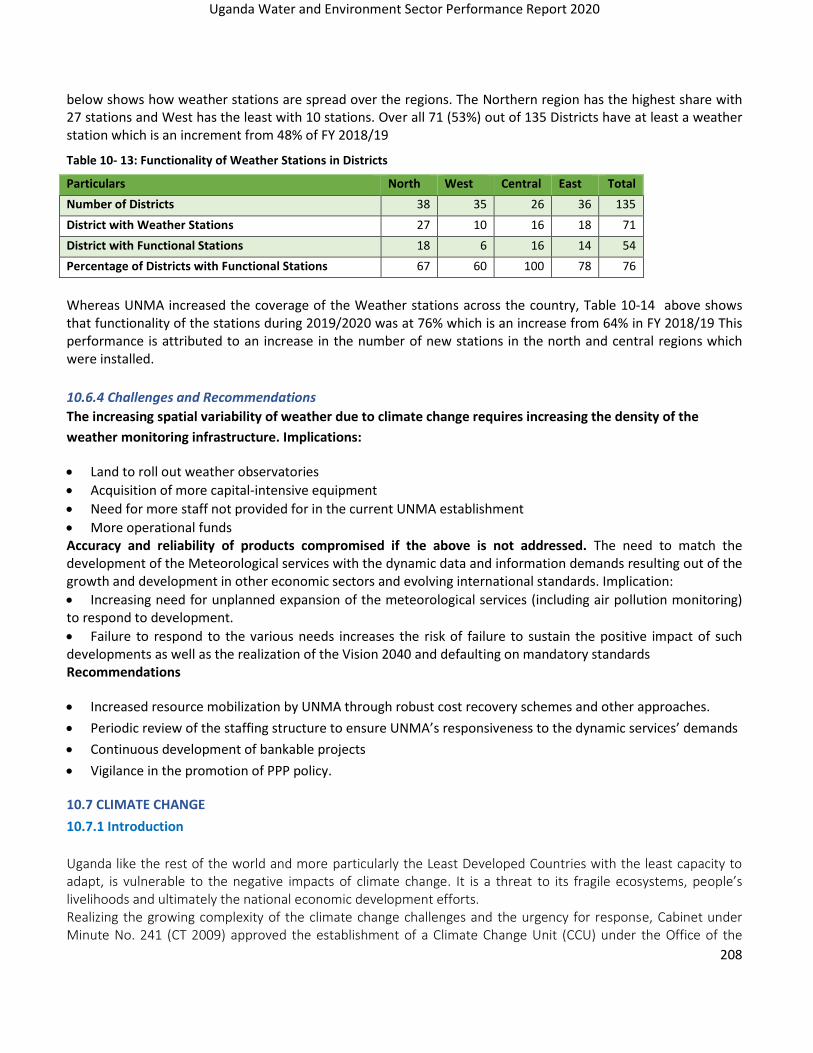
Uganda Water and Environment Sector Performance Report 2020
208
below shows how weather stations are spread over the regions. The Northern region has the highest share with 27 stations and West has the least with 10 stations. Over all 71 (53%) out of 135 Districts have at least a weather station which is an increment from 48% of FY 2018/19
Table 10- 13: Functionality of Weather Stations in Districts
Particulars North West Central East Total
Number of Districts 38 35 26 36 135
District with Weather Stations 27 10 16 18 71
District with Functional Stations 18 6 16 14 54
Percentage of Districts with Functional Stations 67 60 100 78 76
Whereas UNMA increased the coverage of the Weather stations across the country, Table 10-14 above shows that functionality of the stations during 2019/2020 was at 76% which is an increase from 64% in FY 2018/19 This performance is attributed to an increase in the number of new stations in the north and central regions which were installed.
10.6.4 Challenges and Recommendations
The increasing spatial variability of weather due to climate change requires increasing the density of the
weather monitoring infrastructure. Implications:
• Land to roll out weather observatories
• Acquisition of more capital-intensive equipment
• Need for more staff not provided for in the current UNMA establishment
• More operational funds Accuracy and reliability of products compromised if the above is not addressed. The need to match the development of the Meteorological services with the dynamic data and information demands resulting out of the growth and development in other economic sectors and evolving international standards. Implication:
• Increasing need for unplanned expansion of the meteorological services (including air pollution monitoring) to respond to development.
• Failure to respond to the various needs increases the risk of failure to sustain the positive impact of such developments as well as the realization of the Vision 2040 and defaulting on mandatory standards Recommendations
• Increased resource mobilization by UNMA through robust cost recovery schemes and other approaches.
• Periodic review of the staffing structure to ensure UNMA’s responsiveness to the dynamic services’ demands
• Continuous development of bankable projects
• Vigilance in the promotion of PPP policy.
10.7 CLIMATE CHANGE
10.7.1 Introduction
Uganda like the rest of the world and more particularly the Least Developed Countries with the least capacity to adapt, is vulnerable to the negative impacts of climate change. It is a threat to its fragile ecosystems, people’s livelihoods and ultimately the national economic development efforts. Realizing the growing complexity of the climate change challenges and the urgency for response, Cabinet under Minute No. 241 (CT 2009) approved the establishment of a Climate Change Unit (CCU) under the Office of the

Uganda Water and Environment Sector Performance Report 2020
209
Permanent Secretary, Ministry of Water and Environment, to specifically help with the coordination of implementation of the Climate Change Convention and its Kyoto Protocol in Uganda. Subsequently in July 2014, the Unit was upgraded to a fully-fledged stand-alone Climate Change Department (CCD) in the Ministry of Water and Environment. Uganda ratified the United Nations Framework Convention on Climate Change (UNFCCC) on 9th September 1993 and acceded to the Kyoto Protocol (KP) on 25th March 2002 and the Paris Agreement in June 2016. Climate Change Department (CCD) Objective: The main objective for the establishment of the CCD is to strengthen and provide overall coordination of Uganda’s climate actions and response. Key Functions of the Climate Change Department
a) To play the role of National Focal Point for the United Nations Framework Convention on Climate Change (UNFCCC), Kyoto Protocol (KP)and the Paris Agreement. Consequently, the department is responsible for providing leadership on all inter-governmental climate change policy processes including international negotiations.
b) Co-ordination of national climate change actions (Mitigation and Adaptation) in different sectors, including the creation of awareness among various stakeholders to enable them to internalize their roles and responsibilities under the Convention and its Kyoto Protocol.
c) Monitoring the implementation of mitigation and adaptation activities and progressively update Government, the Uganda population and the COP to the UNFCCC and its Kyoto Protocol.
d) Providing technical support to the Permanent Secretary, Ministry of Water and Environment to enable him/her coordinate climate change issues more effectively as part of the mandate of the Ministry.
e) To initiate the development and review of appropriate policies, laws and programmes necessary to ensure effective implementation of adaptation and mitigation activities in Uganda.
f) To implement and guide implementation of adopted policies as well as decisions made by the relevant bodies of government including the Policy Committee on the Environment and National Climate Change Advisory Committee (NACCC).
g) To establish and maintain the relationship with national, regional and international organizations, institutions and agencies as may be appropriate for facilitating the implementation of the relevant policies, programmes, projects and decisions.
h) To guide on precautionary measures to anticipate, prevent or minimize the causes of climate change and its adverse effects.
i) To be the Secretariat for all the carbon market instruments under the, Convention, KP and Paris Agreement.
j) Establishing and maintaining a register of all carbon market projects k) To promote and cooperate in the development, application and diffusion, including transfer of
technologies, practices and processes that control, reduce or prevent anthropogenic emissions of greenhouse gases in all the relevant sectors including energy, transport, industry, agriculture, forestry and waste management.
l) To prepare for adaptation to the adverse effects of climate change by guiding the development of elaborate, appropriate and integrated plans for key sectors as well as the rehabilitation of areas affected by drought, desertification and floods.
m) To coordinate and guide on the education, training and public awareness programmes on climate change, consistent with Article 6 of the Convention.

Uganda Water and Environment Sector Performance Report 2020
210
n) To guide public participation in addressing climate change and its effects and developing adequate responses.
o) Assisting in the identification and mobilization of sources of funds for climate change action.
Activities planned for financial year 2019/20 i. Dissemination of the National climate change Bill/ National climate change policy. ii. Climate adaptation interventions monitored across the country; iii. Establish, manage and disseminate Greenhouse Gas Inventory; operationalize/ popularize GHG inventory
through sectoral meetings iv. Monitor and Evaluate CDM Projects Baseline surveys conducted v. Vulnerability assessment conducted.one regional climate change vulnerability mapping conducted
1. Outline of activity implementation
Monitor the implementation of the Clean Development Projects (CDM) - GOU
5 CDM projects were monitored
Issues arising from activity.
● The projects generally exhibited community engagements in their activities and had consideration of
environmental impacts in their implementation.
● They faced challenges of low carbon prices and hence failure to meet emission reduction targets, this is due
to the low global Certified Emission Reduction prices.
● The projects need further technical and financial support from government to help improve project
management and implementation
● There is poor demonstration of additionality of climate change mitigation from the projects activities as
monitoring has been on adhoc basis hence a need to strengthen monitoring.
● There is need for annual support from GOU to implement nationwide Monitoring, Reporting and
Verification for all Climate change actions
Manage, collect data and compile a national greenhouse gas inventory; (GOU)
There is a need for an annual budget line to support compilation and management of the national greenhouse gas inventory.
2. Under the Capacity Building Initiative for Transparency project;
Output 1: Institutional arrangements for data collection and processing in 5 key sectors (agriculture and land use;
forestry, energy, transport and waste) strengthened.
● An inter-ministerial framework was developed. This will support the engagement of major line ministries in
the implementation of the national monitoring, reporting and verification of all climate change mitigation
and greenhouse gas initiatives.
● Memorandum of Understanding (MoUs) developed and signed between MWE, MEMD, NFA, MAAIF,
NEMA and MoWT. These agreements will ease the share and management of data and the process of
managing the national greenhouse gas inventory. The office of the Solicitor General supported the
development process of the MoUs.

Uganda Water and Environment Sector Performance Report 2020
211
● Gender focal points officers incorporated in all the sector hubs, the officers were nominated by the
respective institutions and will ensure that gender is mainstreamed and aligned in the greenhouse gas
inventory management process.
Output 2: Capacity of stakeholders built on s data collection and processing protocols; and procurement of
state‐of‐the-art equipment and tools
● Data collection tools for four sectors (Energy, transport, agriculture and waste) were developed, and the
update data collection tools will facilitate the collection and processing of greenhouse gas data from those
sectors. Support is needed from GOU to sustainably pilot the developed tools.
● Data processing equipment (computers) were procured for GHGI sectors, sectors received starter
equipment to support the processing, compilation and archiving of greenhouse gas data
● 50 staff from the key emitting sectors (waste, industry, energy, transport, agriculture and forestry) were
trained on compilation of GHG inventories and received certification as national GHG inventory experts.
This has come a long way in building national expertise for estimation of greenhouse gases.
Output 3: GHG inventory and MRV system functional
With support from the project, CCD updated sector GHG inventories for the years 2016 -2019, the sectors of
waste, industry, energy, transport, agriculture and forestry were covered. This was done using the IPCC guidelines
and methodologies for estimation and calculation of greenhouse gas emissions and removals.
3. First Biennial Update Report (FBUR)
With support from the Global Environment Facility (GEF) through the United Nations Environment Programme (UN
Environment), Uganda compiled the First Biennial Update Report (FBUR) to fulfil its obligations to the UNFCCC
(Article 12). The draft Biennial Update Report underwent external review before final submission to UNFCCC. The
report encompassed components of national circumstances, GHG inventory (2005 - 2015), Mitigation actions and
their cost benefit analysis, constraints and gaps, and the domestic Measuring, reporting and verification (MRV)
system.
The launch of the FBUR was carried out and the final report was submitted to the United Nations Convention
Framework Convention on Climate Change Executive Board on the 1st of October 2019.
4. Third National Communication
Uganda has embarked on the Third National Communication (TNC) compilation, the Project Implementation Plan
was developed and CCD carried out an inception workshop. The project started March 2019 and expected
completion June 2022. The TNC comprises the following, national circumstances and institutional arrangements,
national GHG inventory (1994 - 2017), national climate change actions, constraints and gaps, and other relevant
information.
The Inception workshop was carried out and an inception working and implementation roadmap and plan have
been developed.
Uganda Water and Environment Sector Performance Report 2020
212
5. Development of Uganda’s Long-term Climate Strategy
UNFCCC Decision 1/CP.21 invites countries to communicate, by 2020, a mid-century, long-term low greenhouse
gas emission development strategies, taking into account their common but differentiated responsibilities and
respective capabilities, in the light of different national circumstances. This is enshrined in Art 4.19 which stipulates
that all Parties should strive to formulate and communicate long-term low greenhouse gas emission development
strategies.
The development of an LTS is important to provide national direction with regard to : ; reaching national peaking
of greenhouse gas emissions, and undertaking rapid reductions thereafter in accordance with best available
science (Art 4.1); progression of the country’s successive NDCs and reflection of highest possible ambition (Art
4.3); informing the enhancement of mitigation efforts (Art 4.4); informing the preparation of strategies, plans and
actions for low greenhouse gas emissions development (Art 4.6); highlighting mitigation co-benefits resulting from
adaptation actions and/or economic diversification plans; enhancing adaptive capacity, strengthening resilience
and reducing vulnerability to climate change (Art 7.1); recognizing adaptation efforts (Art 7.3); understanding the
risk of loss and damage associated with the adverse effects of climate change, including extreme weather events
and slow onset events (Art 8.1) and facilitate the action (Art 8.3); information necessary for tracking of progress in
implementing and achieving NDCs, and adaptation actions (Art 13.5).
It’s against the above background that MWE/CCD with support from the GIZ has embarked on the process of
developing Uganda’s Long Term Climate Strategy (LTS).
A multidisciplinary working Team has been formed, virtual workshop was conducted and since an inception report
with comments from stakeholders being addressed, this will support the integrated development of the LTS
The inception report was reviewed and comments were provided to the consultants for incorporation into the
final strategy document.
10.7.2 Monitoring Adaptation projects:
Enhancing Resilience of Communities to Climate Change through Catchment Based Integrated Management of
Water and Related Resources in Uganda (EURECCCA project) in the Catchments of Awoja, Aswa and Maziba, and
Building Resilient Communities, Wetland Ecosystems and Associated Catchments in Uganda Project
● The respective projects were monitored and the implementation are on track
● There is also overwhelming due to community demand to be involved in project activities like fish farming,
bee keeping and climate smart agriculture, dissemination of weather and climate information was found
to be a useful tool for community planning on the aspect of resilience building.
● Provision of alternative livelihood opportunities could help to sustain catchment level protection for
unsustainable practices that leads to their degradation.
6. Design of Climate and Disaster Risk Screening Tools for the NDC Climate Mainstreaming
The MWE/CCD with support from the World Bank (WB) is currently supporting the Government of Uganda’s
Nationally Determined Contribution Partnership Plan to institutionalize climate considerations into planning and
budgetary processes.
Uganda Water and Environment Sector Performance Report 2020
213
The customization of offline and online Climate and Disaster Risk Screening (CDRS) tools for the Agriculture,
Energy, Transport, Water and Environment sectors is complete and currently with support from WB, CCD is
developing an online landing page for “Climate Change Mainstreaming Tools and Support”, to be hosted on the
Climate Change Department(CCD) website. The Department developed and piloted the climate information
platform for Uganda accessible through the link: Climate Change Knowledge Portal (CCKP), and updated
the Climate Risk Profile. This profile provides a comprehensive summary of the climate characteristics, climate and
geophysical disaster risks, vulnerabilities and sectoral impacts at national level to support risk screening. Together
with WB, a couple of training sessions were conducted on CDRS and Climate Change Budget Tagging (CCBT), for
Focal Points in the five pilot sectors. The Department together with WB intends to move on - assessing uptake of
the tools in the five initial sectors, scaling-up and rolling out the CDRS and CCBT tools to additional Ministries,
Departments, Agencies and Local Governments; http://182.74.217.210:8181/uat/cdrs_uganda/
7. Develop Concept Notes for Climate Financing
• The UNFCCC established the National Adaptation Plan (NAP) process under the Cancun Adaptation Framework
(CAF) NAP process (5/CP.17), to help countries conduct comprehensive Medium and Long term needs/actions
for adaptation and resilience.
• The CCD with technical support from UN Environment has worked on the NAP preparation grant for Uganda to
GCF. The Uganda NAP proposal was submitted to GCF, technical reviews and evaluation by the GCF approval
committee and now review of comments is in advanced stages. The proposal is at final stage of evaluation
after CCD’s response to three rounds of comments from the GCF. The proposal amount is USD 2.856,651 and
the Concept Note is undergoing Final review by the GCF.
Outcome 1
⮚ Develop a set of agreed national climate change scenarios; to help planners and investors in
the country to align their portfolios to adaptation objectives
⮚ Develop detailed climate risk assessments in 6 Districts and develop clarity on adaptation
targets for the country
⮚ Build widespread capacity among all Districts in Uganda and on the NAP based on the
improved evidence base
Outcome 2
⮚ mainstream adaptation into sectoral investment plans to enable financing for adaptation
from within regular development budgets,
⮚ Develop climate risk assessment tools and
⮚ Develop two concept notes for GCF.
Outcome 3
⮚ Terminal evaluation
⮚ Disseminate the results and agree recommendations for future NAP processes.
8. Strategic Programme on Climate Resilience (SPCR) Trainings on Climate Change and Disaster Risk Reduction.
The Government of Uganda through the Ministry of Water and Environment (Climate Change Department) is therefore implementing the Strategic Programme for Climate Resilience (SPCR). The SPCR project is being funded

Uganda Water and Environment Sector Performance Report 2020
214
through the Africa Development Bank with financing from the Climate Investment Fund (CIF) preparatory grant under the Pilot Programme for Climate Resilience (PPCR) and it seeks to provide guidance to developing countries like Uganda to mainstream climate resilience into core development planning for transformation at scale while complementing other on-going development initiatives. A portion of the grant was allocated for strengthening the capacity of local governments in responding to climate change related disasters through training and practical modules that can help them plan appropriately. In line with the SPCR objectives therefore, a training on climate change and disaster risk reduction was organized with the following objectives:
i. To increase community level understanding of climate change; the science, causes, effects, impacts and possible actions/options for mitigation and adaptation.
ii. To enhance stakeholders’ participation in climate change planning from community to lower and upper local governments.
iii. To draw community experiences on weather, climate variability and change impacts that affect their livelihoods and service sectors (Conduct a descriptive analysis)
Gomba District.
The sub counties that participated in the training were; Kyegonza, Maddu, Kabulasoke and Mpenjja. The areas of focus during the training were understanding climate change, weather and climate, climate change adaptation and mitigation. The training had 80 female and 40 male. Luwero district.
The sub counties that participated in the training were; Luwero, Katikamu, Makulubita and Kikyusa with areas of
cuss being, Understanding climate change, weather and climate, climate change adaptation and mitigation. 76
female and 44 male were trained.
Lira District.
The sub counties that participated in the training were; Adekokwok, Adyel, Aromo, Barr, Central, Ogur, Ojwina,
Railway, Ngetta with areas of focus being Understanding climate change, weather and climate, climate change
adaptation and mitigation.62 female and 58 were trained
Adjumani district.
Photo 10- 37: Discussions to understand community experiences on weather, climate variability and change impacts that
affect their livelihoods and service sectors

Uganda Water and Environment Sector Performance Report 2020
215
The sub counties that were trained include; Adropi, Pachara, Ciforo, ukusijoni, Dzaipi, Arinyapi, Ofua, Itirikwa,
Pakele with areas of focus being Understanding climate change, weather and climate, climate change adaptation
and mitigation. 72 female and 48 male were trained.
Recommendations from the four trainings.
● There’s needed to Continue sensitizing people and need financial support to be able to adopt the Climate
Smart Agriculture initiatives in communities.
● The government should encourage the use of model farmers in communities so that they pass on
environmentally friendly technologies and ideas to their communities.
● Formation of community level groups that can be supported by the climate change department with
continued sensitization.
● Encourage the use of media in the sensitization of farmers and communities
● Government institutions like NEMA need to get stricter of environmental protection personnel for
example enforcing the stopping of rice growing in swamps.
● The need for continuous training at community level was found very important since with climate change,
the actions start at community level.
9. Integrated Governance to deliver ambitious Nationally Determined Contributions(NDC) outcomes
● A gender analysis conducted, and a gender action plan developed to support the integration of gender in
NDC implementation process. This involved assessment the gender gaps in three key priority NDC sectors
which include energy agriculture and waste and development a gender action plan for integration of
gender in NDC implementation. In addition, training has been conducted for Ministries, Departments and
Agencies (MDAs), CSOs and the private sector to integrate gender in the implementation of climate
actions. The gender analysis will enhance the participation of women, youth and other vulnerable groups
in the implementation of climate actions.
● Capacity development on integration of gender in the implementation of acclimate actions. The training
was conducted the central region and was conducted for representatives from 10 districts who included
the District Community Development Officers, District National Resources Officers and District Planners
districts in the central region on Mainstreaming Gender and Climate change into their districts.
● Development of an integrated Monitoring Reporting and Verification (MRV) tool; Uganda is currently
developing the Country’s integrated MRV tool and database for the NDC. The integrated MRV tool and
database will assist in estimating the annual national GHG emissions and inventory from the GHG emission
Sectors; tracking and monitoring the climate actions, policies, programmes and most importantly climate
finance flow and relevant SDG impacts. The integrated MRV tool and database will also help in fulfilling
requirements of the Enhanced Transparency Framework under the Paris Climate Change Agreement and
potential use for market and non-market-based approaches under Article 6. In line with this output, a
virtual inception workshop for National Robust MRV tool/system to truck climate change actions was
carried out and an implementation roadmap developed for the implementation of the tool.
10. Evidence-based design and planning of mitigation actions delivered
Uganda Water and Environment Sector Performance Report 2020
216
● Key sector priorities defined for the development of NDC investment plans; through a stakeholder
consultation process, the National Planning Authority (NPA) has identified key priorities for the
development of gender responsive specific NDC investment action plans in sectors including energy,
transport, and agriculture. This involved a stock take of ongoing and planned mitigation actions in the
NDC, Nationally Appropriate Mitigation Actions (NAMAs), the Green Growth Development strategy and
climate change policy. Through this consultation, a consensus was built on specific actions for the
development of mitigation NDC investment plans. The development of the NDC investment planned is
expected to be undertaken by the project.
11. Capacities developed to design climate-friendly investments, address investor risk, and blend and catalyze
climate finance
● Sustainable financing mechanisms specifically the Climate action grants have been established; the climate
action grants have been established with an aim to finance projects that contribute to climate change
mitigation and adaptation with gender responsiveness to maximize impact of interventions for both
women, youth and other vulnerable groups. During the first call for proposals, Six women and youth led
organizations that are contributing to climate actions at the grassroot levels in different sectors including
renewable energy, forestry, climate smart agriculture and waste management have received small grants
to enhance implementation of climate actions. The second call for proposals for the climate action grants
can be accessed via this link.
● Accelerating climate finance through a National Financing Vehicle for Uganda; a training workshop was
organized on accelerating financing for NDC implementation through a National Financing Vehicles (NFV).
This was implemented in collaboration with UN Environment Programme (UNEP) Global Support Unit, the
Climate Change Department, Ministry of Water and Environment and the Ministry of Finance Planning and
Economic Development (MoFPED). Innovative financing approaches to accelerate financing for NDC
implementation were discussed during the event. Key outcome was the establishment of a National
financing facility for climate action. The facility will be hosted by UNDP on behalf of the government and
used as an instrument to mobilize resources from both public and private sources to enhance the
implementation of Uganda’s NDC.
12. Enhanced private sector engagement in climate action
● Developed a business case analysis for private sector to consider investments in climate actions that are
gender responsive. The business for private sector in Uganda to engage in climate action has been
developed based on a survey conducted in 35 companies. . This survey was supported by a study on the
enabling and regulatory framework to enable private sector investments, partnerships and initiatives at
international, regional and national levels to support these initiatives, opportunities to access climate
finance and access to technology and capacity development elements to enable private investments in
climate action. Areas of priority interest for companies in Uganda’s NDC for the private sector have been
identified to enhance participation of the private sector in NDC implementation process has been
enhanced. The reports on the key findings from this assessments and the report on the business case for
private sector engagement can be accessed via this link
Uganda Water and Environment Sector Performance Report 2020
217
● Training for the private sector on increasing green investments and access to climate finance has been
conducted ; in a bid to accelerate access to climate finance for the private sector. The training has been
conducted to enhance skills of companies in green investments, access to climate finance and business
management. 80 companies in sectors including energy, forestry, agriculture, waste management have
been trained including representatives from financing institutions.
● Digital reporting tool developed to enhance reporting on the contributions of the private sector towards
NDC and SDG implementation. An online digital platform has been developed to enhance reporting on the
contributions by the private sector towards climate action. This has been done through collaboration with
a tech company called Impact and the Private Sector Foundation Uganda. So far 53 companies have signed
up to use this online private sector improve their business operations and contribute more systematically
to the NDCs and SDGs. The tool helps businesses identify how actions that contribute to Uganda's NDC can
also help achieve various SDGs. Businesses received a personalized SDG business profile with their chosen
priorities at the end of the assessment. The tool will also enable the government to improve reporting on
NDC/SDG contributions from the private sector. In addition, the digital tool hosts an online network for
Ugandan companies to share news, updates and connect with like-minded businesses and partners to
improve their sustainability operations and grow their investments.
13. Strengthened platform for evidence-based learning, advocacy and exchange of knowledge and experiences
- South to South exchanges have been organized to enhance sharing of knowledge and best practice on the
NDC implementation. Project partners have been supported to participate in the NDC investment forum,
Africa climate week 2019, Global gender workshop and other online capacity building events.
- Visibility materials developed including concepts, project briefs and fact sheets prepared, disseminated at
several events organized at national and local level.
14. Uganda represented during the UNFCCC technical negotiations (Bonn Sessions and COP25
The Department facilitated eight (3female and 5 male) Ugandan delegation for the Bonn sessions (17-27 June
2019), the discussions were on the framework for international carbon markets, which can be a valuable tool to
help coordinate efforts to reduce greenhouse gas emissions between countries. Robust rules are needed to ensure
that international carbon markets operate without ‘double counting’ of emissions reductions and deliver credible
results. The discussions in Bonn deepened Parties’ understanding of the issues at hand, but further it was realized
that work is needed to conclude that particular final chapter of the Katowice rulebook.
The conference also agreed on a review of the Warsaw International Mechanism on Loss and Damage - a body
mandated to encourage action in support of Parties impacted by slow onset and extreme weather events – how
vulnerable communities can prepare and recover from climate related impacts. Progress was also achieved in the
design of detailed reporting formats for the Paris Agreement’s enhanced transparency framework, designed to
hold all Parties equally accountable for implementing their commitments.
Alongside the formal negotiations, the session was an opportunity for Parties and non-Party stakeholders to share
experience and exchange views on progress made in implementing the Paris Agreement. MWE/CCD also
organized and facilitated eleven (6 male and 5 female) Ugandan delegation to COP25 in Katowice, among

Uganda Water and Environment Sector Performance Report 2020
218
others were, CCD developed and disseminated the Uganda’s Position booklet, usually contains the
country’s agreed position plus follow up actions. A number of international communications and
engagements in regard to responses under the different instruments also have been conducted.

Uganda Water and Environment Sector Performance Report 2020
219
11. CROSS CUTTING ISSUES
Cross-cutting issues are matters that affect all aspects of a programme and therefore need special attention during the development process. There are many cross-cutting issues in the Water and Environment sector. This section focuses on some of the most important issues, namely: gender equality and women empowerment, HIV/AIDS and support to the vulnerable and marginalized groups. A number of activities were implemented to address cross cutting issues and are presented in the following subsections.
11.1 Gender Equality and Women Empowerment
The Uganda Gender Policy, 1997 (Revised 2007), and the Second National Development Plan (NDP 11) 2015/16 – 2019/20 mandate all development institutions to promote gender equality and women empowerment while executing programmes and activities. To this end, the Ministry of Water and Environment (MWE) developed a Water and Sanitation Gender Strategy in 2003 (revised in 2010 and 2017) and an Environment and Natural Resources Gender Strategy in 2015 to guide gender equality and women empowerment efforts in the sector. During the reporting period, a number of activities have been undertaken to promote gender mainstreaming as outlined below.
11.1.1 Performance Indicators on Gender
Rural water supply and sanitation
The performance indicator for gender mainstreaming in rural water interventions is “Percentage of Water and Sanitation Committees (WSC) with at least one woman holding a key position”. Key positions on WSCs include Chairperson, Vice Chairperson, Secretary and Treasurer. Data from the MWE water supply database as of June 2020, indicates that 86% of WSCs have women holding key positions. This is an improvement of from 85% reported last year.
Figure 11- 1: women in key positions
Uganda Water and Environment Sector Performance Report 2020
220
Water for Production
The performance indicator for gender mainstreaming in water for production interventions is “Percentage of Water User Committees (WUC) with at least one woman holding a key position”. Key positions on WUCs include Chairperson, Vice Chairperson, Secretary and Treasurer.
In FY 2019/20, 75% of the water user management committees have women in key positions and 49% dams have
women in key positions (Chairperson, Vice Chairperson, Secretary and Treasurer). The gender indicator has
remained the same as last year for both dams and valley tanks
Catchment Management Committees
The Performance indicator for Gender mainstreaming on Catchment Management Committees (CMCs) is the
Percentage of CMCs with women holding key positions. Key positions on CMCs include the position of
Chairperson, Vice Chairperson, Secretary and Vice Secretary.
Data from 14 CMCs15 from Aswa, Victoria, Albert and Kyoga Water Catchments indicates that 79% (11) CMCs
have women in key positions. This is a significant increment from 35% reported last year. The CMCs with no
women holding key positions include are located in Kyoga Water Management Zone and include Lokok, Victoria
Nile- Lumbuye and Lokere.
Within CMCs a number of lower level Sub Catchment Management Committees (SCMCs) have been developed to
operationalize the CMCs. Information from the management zones indicates that out of the 916 SCMCs formed,
100% have women occupying key positions.
11.1.2 Gender in staff Composition
MWE Permanent Staff
Data from the Human Resource Department indicates that MWE has 342 permanent staff a reduction of 5 staff from the 347 staff reported last year. A gender analysis of MWE employees indicates that 36% (124) of staff are female and 64% (218) staff are male. This is the same gender composition reported last year.
The gender analysis of permanent staff composition for a period of 5 years (2016 to 2020) indicates that the number of female staff members has not significantly improved over the last five ye ars and with the gender proportion of men to women remaining unchanged from last year.
The details are indicated in the figure 11-2 below.
15 Victoria/ Nile, Lumbuye, Mpologoma, Awoja, Lokok, Lokere, Aswa, Albert Nile, Rwizi, Katonga, Kagera-Maziba, Mpanga, Semiliki, Ruhezamyenda, Muzizi, Nkusi and Kiiha
16 Aswa 1, Agago, Pager Matidi, Kelim Taboki, Opeta Bisinia, Lake Kachobo, Upper Maziba, Middle Maziba and Lower Maziba.

Uganda Water and Environment Sector Performance Report 2020
221
Figure 11- 2: Gender staffing over years
Gender by Management Position Further analysis of staffing position by management position indicates that there are 39 staff members occupying senior management position17 out of which only 15% (6) are female This is a reduction from 16% that was reported last year (2019). For the middle management level18, the ministry has 114 staff members of which 26% (30) are female and 74% (84) male. The Percentage of female in this category has remained unchanged since last year. The operational level19 is well balanced with the number of female employees being equal to that of men. The gender analysis of the staffing by seniority is indicated in table11-1 below.
Table 11- 1: Gender analysis in MWE by seniority
Staff Level Female Male
NO. % No. %
Top Management 6 15% 33 85%
Middle level Management 30 26% 84 74%
Operational Level 50 50% 50 50%
Support Level 38 43% 51 57%
TOTAL 124 218
MWE Contract staff
Data from the Human Resource Department indicates that there are 685 staff employed under contract terms. The analysis of gender composition for contract staff indicates that 29% (197) of staff are female
17 Scale U1
18 Principal and Senior officers, scale U2 and U3
19 Officers in scale U4 and U5

Uganda Water and Environment Sector Performance Report 2020
222
and 71% (488) are male. This indicates a 1% increment in the proportion of females from 28% reported in 2019. The increment is attributed to a slight reduction in male staffing levels from 505 last year to 488. The trend of contract staff composition according to sex, over the last three years indicates that the sector has not made any significant progress towards increasing the level of female composition. The details are indicated in figure 11-3 below
Figure 11- 3: Gender Composition for Contract staff over the years
District Water Office Staffing
Data from 134 Districts in Uganda indicates that only 3% (4) of the districts have female District Water Officers.
The districts with female Water officers are Lamwo, Butambala, Kamwenge and Kabale.
National Water and Sewerage Staffing Composition The National Water and Sewerage Corporation (NWSC) gives due credibility to gender issues when recruiting staff. By the end of the Financial Year, the Corporation had nine Board members, five of these are women, three Deputy Managing Directors, two of which are female, seven Directorates, and Women head three of these Directorates. As at the end of June 2020, NWSC had total staff of 4,082 across all its areas of jurisdiction of which 31% are female.
Table 11- 2: NWSC Staff Composition
Gender Male Female Total % Female
Board of Directors 5 4 9 44%
Executive Management Team 6 5 11 45%
NWSC Staff 2,826 1,256 4,082 31%
11.1.3 Gender and equity Planning and budgeting
Section 13 (15) g (i) and (ii) of the Public Finance Management Act, 2015 (as amended), mandates all sector to undertake gender and equity budgeting. Gender and equity budgeting aims at ensuring that the different needs and interests of Men, Women, youth, Orphans and other Vulnerable Children, ethnic minorities, older persons, the rural poor, and disadvantaged locations among other marginalized groups are accommodated within the
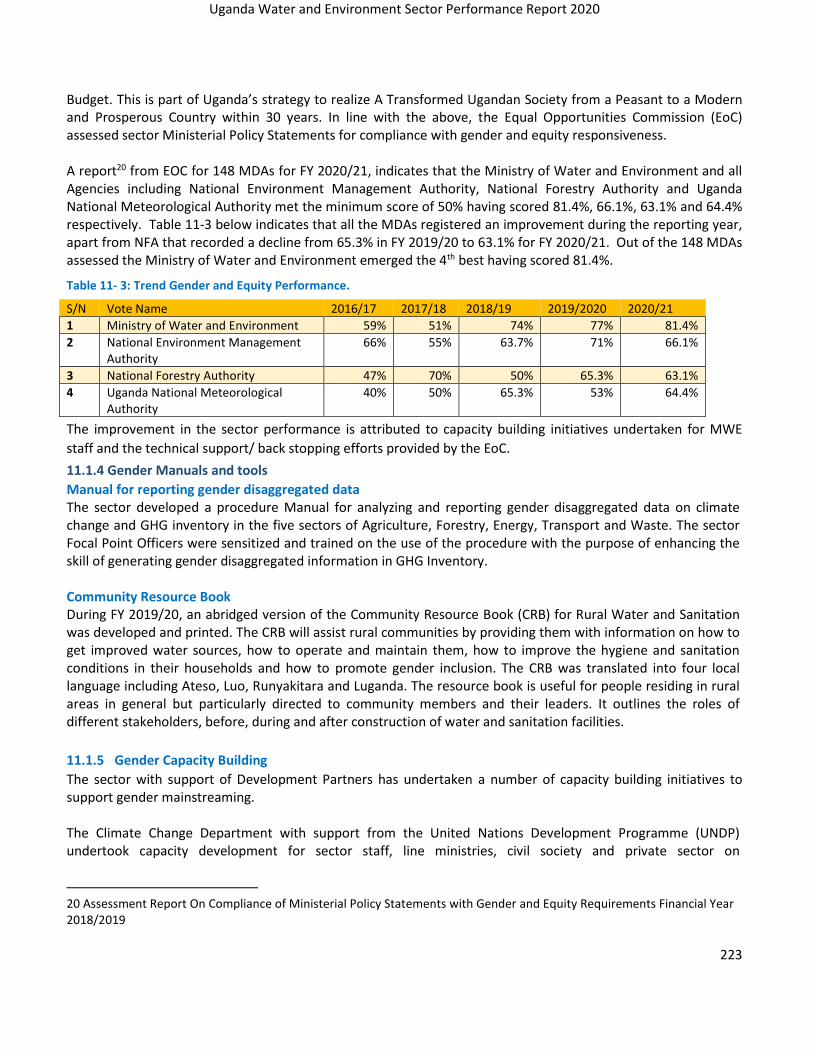
Uganda Water and Environment Sector Performance Report 2020
223
Budget. This is part of Uganda’s strategy to realize A Transformed Ugandan Society from a Peasant to a Modern and Prosperous Country within 30 years. In line with the above, the Equal Opportunities Commission (EoC) assessed sector Ministerial Policy Statements for compliance with gender and equity responsiveness. A report20 from EOC for 148 MDAs for FY 2020/21, indicates that the Ministry of Water and Environment and all Agencies including National Environment Management Authority, National Forestry Authority and Uganda National Meteorological Authority met the minimum score of 50% having scored 81.4%, 66.1%, 63.1% and 64.4% respectively. Table 11-3 below indicates that all the MDAs registered an improvement during the reporting year, apart from NFA that recorded a decline from 65.3% in FY 2019/20 to 63.1% for FY 2020/21. Out of the 148 MDAs assessed the Ministry of Water and Environment emerged the 4th best having scored 81.4%.
Table 11- 3: Trend Gender and Equity Performance.
S/N Vote Name 2016/17 2017/18 2018/19 2019/2020 2020/21
1 Ministry of Water and Environment 59% 51% 74% 77% 81.4%
2 National Environment Management Authority
66% 55% 63.7% 71% 66.1%
3 National Forestry Authority 47% 70% 50% 65.3% 63.1%
4 Uganda National Meteorological Authority
40% 50% 65.3% 53% 64.4%
The improvement in the sector performance is attributed to capacity building initiatives undertaken for MWE
staff and the technical support/ back stopping efforts provided by the EoC.
11.1.4 Gender Manuals and tools
Manual for reporting gender disaggregated data The sector developed a procedure Manual for analyzing and reporting gender disaggregated data on climate change and GHG inventory in the five sectors of Agriculture, Forestry, Energy, Transport and Waste. The sector Focal Point Officers were sensitized and trained on the use of the procedure with the purpose of enhancing the skill of generating gender disaggregated information in GHG Inventory. Community Resource Book During FY 2019/20, an abridged version of the Community Resource Book (CRB) for Rural Water and Sanitation was developed and printed. The CRB will assist rural communities by providing them with information on how to get improved water sources, how to operate and maintain them, how to improve the hygiene and sanitation conditions in their households and how to promote gender inclusion. The CRB was translated into four local language including Ateso, Luo, Runyakitara and Luganda. The resource book is useful for people residing in rural areas in general but particularly directed to community members and their leaders. It outlines the roles of different stakeholders, before, during and after construction of water and sanitation facilities.
11.1.5 Gender Capacity Building
The sector with support of Development Partners has undertaken a number of capacity building initiatives to support gender mainstreaming. The Climate Change Department with support from the United Nations Development Programme (UNDP) undertook capacity development for sector staff, line ministries, civil society and private sector on
20 Assessment Report On Compliance of Ministerial Policy Statements with Gender and Equity Requirements Financial Year 2018/2019
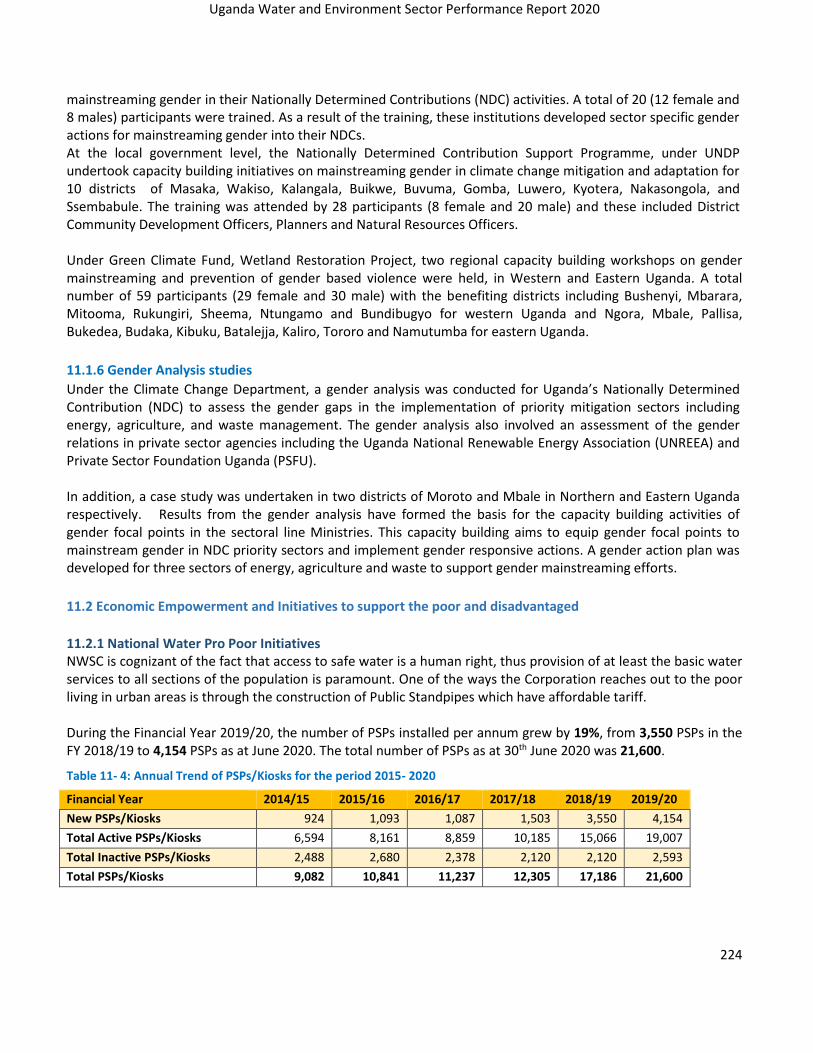
Uganda Water and Environment Sector Performance Report 2020
224
mainstreaming gender in their Nationally Determined Contributions (NDC) activities. A total of 20 (12 female and 8 males) participants were trained. As a result of the training, these institutions developed sector specific gender actions for mainstreaming gender into their NDCs. At the local government level, the Nationally Determined Contribution Support Programme, under UNDP undertook capacity building initiatives on mainstreaming gender in climate change mitigation and adaptation for 10 districts of Masaka, Wakiso, Kalangala, Buikwe, Buvuma, Gomba, Luwero, Kyotera, Nakasongola, and Ssembabule. The training was attended by 28 participants (8 female and 20 male) and these included District Community Development Officers, Planners and Natural Resources Officers. Under Green Climate Fund, Wetland Restoration Project, two regional capacity building workshops on gender mainstreaming and prevention of gender based violence were held, in Western and Eastern Uganda. A total number of 59 participants (29 female and 30 male) with the benefiting districts including Bushenyi, Mbarara, Mitooma, Rukungiri, Sheema, Ntungamo and Bundibugyo for western Uganda and Ngora, Mbale, Pallisa, Bukedea, Budaka, Kibuku, Batalejja, Kaliro, Tororo and Namutumba for eastern Uganda.
11.1.6 Gender Analysis studies
Under the Climate Change Department, a gender analysis was conducted for Uganda’s Nationally Determined Contribution (NDC) to assess the gender gaps in the implementation of priority mitigation sectors including energy, agriculture, and waste management. The gender analysis also involved an assessment of the gender relations in private sector agencies including the Uganda National Renewable Energy Association (UNREEA) and Private Sector Foundation Uganda (PSFU). In addition, a case study was undertaken in two districts of Moroto and Mbale in Northern and Eastern Uganda respectively. Results from the gender analysis have formed the basis for the capacity building activities of gender focal points in the sectoral line Ministries. This capacity building aims to equip gender focal points to mainstream gender in NDC priority sectors and implement gender responsive actions. A gender action plan was developed for three sectors of energy, agriculture and waste to support gender mainstreaming efforts.
11.2 Economic Empowerment and Initiatives to support the poor and disadvantaged
11.2.1 National Water Pro Poor Initiatives NWSC is cognizant of the fact that access to safe water is a human right, thus provision of at least the basic water services to all sections of the population is paramount. One of the ways the Corporation reaches out to the poor living in urban areas is through the construction of Public Standpipes which have affordable tariff. During the Financial Year 2019/20, the number of PSPs installed per annum grew by 19%, from 3,550 PSPs in the FY 2018/19 to 4,154 PSPs as at June 2020. The total number of PSPs as at 30th June 2020 was 21,600.
Table 11- 4: Annual Trend of PSPs/Kiosks for the period 2015- 2020
Financial Year 2014/15 2015/16 2016/17 2017/18 2018/19 2019/20
New PSPs/Kiosks 924 1,093 1,087 1,503 3,550 4,154
Total Active PSPs/Kiosks 6,594 8,161 8,859 10,185 15,066 19,007
Total Inactive PSPs/Kiosks 2,488 2,680 2,378 2,120 2,120 2,593
Total PSPs/Kiosks 9,082 10,841 11,237 12,305 17,186 21,600

Uganda Water and Environment Sector Performance Report 2020
225
11.2.2 Economic Empowerment/ Livelihood support initiatives in towns and gravity flow scheme areas
The Ministry with support from the African Development Bank has supported economic empowerment and skills
development initiatives for 12 women and youth groups in 11 districts through tree planting, waste recycling and
manufacturing of energy saving stoves and briquettes. The purpose of this initiative is to create employment
opportunities, boost income, improve health and hygiene in homesteads reduce cost of fuel and to contribute to
mitigation efforts for human induced climate change. Table 11-5 below shows a summary of beneficiary
communities and activities undertaken under this project.
Table 11- 5: Economic empowerment beneficiary Groups and activities supported
Name of Group District No. of Beneficiaries Support provided
1 Bugobero women Ramba Nabi group
Manafwa Total 39; (34 female and 5 males)
- Establishment of tree nurseries - Tree Seedlings - Fencing - Water Source/ Connection - Skills in seed sowing, pot filling, Pricking,
Root Pruning, Hardening and disease control and marketing)
- Demonstration of tree planting
2 Kikunyu A Buggaga Magezi Women’s Group
Butambala Total 15 (5 males and 10 females)
- Establishment of tree nurseries - Tree Seedlings - Fencing - Water Source/ Connection - Skills in seed sowing, pot filling, Pricking,
Root Pruning, Hardening and disease control and marketing)
- Demonstration of tree planting
3 Namasho Women group Bududa Total 15; (3 females and 12 females)
- Establishment of tree nurseries - Tree Seedlings - Fencing - Water Source/ Connection - Skills in seed sowing, pot filling, Pricking,
Root Pruning, Hardening and disease control and marketing)
- Demonstration of tree planting
4 Cheripei Women and Tree Nursery Bed Group
Bukwo Total 11; (4 males and 7 females)
- Establishment of tree nurseries - Tree Seedlings - Fencing - Water Source/ Connection - Skills in seed sowing, pot filling, Pricking,
Root Pruning, Hardening and disease control and marketing) and Demonstration of tree planting
5 Kasenyi Youth group Bukedea Total 30; (25 males and 5 females)
- Establishment of tree nurseries - Tree Seedlings - Fencing - Water Source/ Connection - Skills in seed sowing, pot filling, Pricking,
Root Pruning, Hardening and disease control and marketing) and demonstration of tree planting

Uganda Water and Environment Sector Performance Report 2020
226
6 PIDA West Village Group Agago Total 36; (16 males and 20 females)
- Establishment of tree nurseries - Tree Seedlings - Fencing - Water Source/ Connection - Skills in seed sowing, pot filling, Pricking,
Root Pruning, Hardening and disease control and marketing) and demonstration of tree planting
7 Kubbi Nursery bed group Nebbi Total 34; (25 males and 9 females)
- Establishment of tree nurseries - Tree Seedlings - Fencing - Water Source/ Connection - Skills in seed sowing, pot filling, Pricking,
Root Pruning, Hardening and disease control and marketing) and -Demonstration of tree planting
8 Masyoro Group Sheema Total 40; (15 males and 25 females).
- Establishment of tree nurseries - Tree Seedlings - Fencing - Water Source/ Connection - Skills in seed sowing, pot filling, Pricking,
Root Pruning, Hardening and disease control and marketing) and demonstration of tree planting
9 Igorora Nursery Bed Group
Ibanda Total 10; (4 males, 6 females)
- Establishment of tree nurseries - Tree Seedlings - Fencing - Water Source/ Connection - Skills in seed sowing, pot filling, Pricking,
Root Pruning, Hardening and disease control and marketing) and demonstration of tree planting
10 Karugutu Community Conservation Association
Ntoroko Total 36; (16 males and 20 females)
- Establishment of tree nurseries - Tree Seedlings - Fencing - Water Source/ Connection - Skills in seed sowing, pot filling, Pricking,
Root Pruning, Hardening and disease control and marketing) and demonstration of tree planting
11 Nabitalo Environment Protection Organization (NEPO)
Wakiso Total 39; (18 males, 21 females)
- Registration with Uganda Registration Service Bureau
- Manufacture of energy saving stoves - Provision of tools and machines - Manufacture of briquettes - Construction of workspace structure - Solar dryer for briquettes
12 St. Cecilia Choir. Wakiso Total 25; all female - Support in manufacture of soap - Provision of materials and tools for soap
manufacture

Uganda Water and Environment Sector Performance Report 2020
227
11.2.3 Empowerment Initiatives by Water for Production
Under water for production Women, men and the youth have equal access to the WfP facilities depending on their needs. For a long time, men have been the major users since they own livestock, farm land and are more mobile than the women.
The sector has made deliberate effort to promote equal access by men, women, children and people with disabilities. During FY 2019/20 the following initiatives have particularly been undertaken by the Water for Production Department:
• Targeted mobilization and sensitization of the District and end users on the benefits of gender inclusion and affirmative action.
• The installation of fuel driven and solar powered pumps at valley tanks and abstraction of water from dams by gravity to ease the burden of women and girls and to reduce the risks associated with collecting water directly from the valley tanks and dams.
• A total of 40 Farmer Field Schools (FFS) have been formed and at each formation, women were encouraged to participate in key positions of Chairperson, Vice chairperson, Secretary and Treasurer. The Farmer field schools approach has greatly encouraged women, youth and people with disabilities to participate in water for production activities such as; training in livestock nutrition, ghee handling, honey processing, pasture conservation, livestock disease management, improved management of poultry and small ruminants, integrated pest management of common crops, soil and water conservation, Climate smart technologies i.e. simple and cost effective irrigation methods, post-harvest handling and management, livelihood and entrepreneurial skills in farming as a business, savings mobilization and group marketing of their bulk products. This has led to improved livelihoods for the women and youth since they are able to produce and sell off their agricultural products.
11.2.4 Livelihood Restoration Plans
Under Green Climate Fund (GCF) wetland restoration project, a gender responsive livelihood restoration plan
(LRP) has been developed to guide wetland restoration efforts in the project areas. The project targets to give
alternative livelihoods to wetland beneficiaries who have voluntarily left the wetlands and this includes both on
farm and off farm alternatives. The restoration plan will help ensure that the disadvantages and marginalized
members of the community benefit during the restoration process.
11.3 HIV/ AIDS Mainstreaming
MWE Headquarters organized World AIDS 2019, during which guest speakers from Uganda AIDS Commission
(UAC) sensitized 250 staff (149 female and 101 male) about the latest information on HIV and AIDS including safe
testing and the presidential fast track initiative for ending HIV/AIDS.
MWE staff attended the Philly Lutaya Memorial Public Lecture organized by Uganda AIDS Commission at Imperial
Royal hotel. A total of 20 MWE (12 female and 8 male) staff attended the lecture which is a special event that
precedes the International Worlds AIDS day commemoration. The topic of the memorial lecture was ‘’Financing
Uganda’s HIV and AIDS response post -2020” in response to continuing decline in funding for HIV/AIDs activities
in Uganda. The lecture also provided an opportunity for participants/ stakeholders to discuss critical HIV/AIDS
topics in perspective in order to inform judicious decisions and policy for sustaining HIV/AIDS response from
external to domestic mechanisms.
A review of 30 district reports during the report period indicates that 13 District Water offices [43%]
implemented HIV and AIDS activities in close collaboration with partners. Table11-6 below shows the districts
and activities implemented.

Uganda Water and Environment Sector Performance Report 2020
228
Table 11- 6: This table should have a heading be updated with missing data
DISTRICT Sensitization Condom Distribution
Partnership/ Collaboration organizations
Capacity Building
1. Rwampara Done during meeting and trainings of WSC
- RHITES, TASO -
2. Rubirizi Done during meeting and training
- Health Department
-
3. Dokolo Targeted Youth, women PWD, Child headed Households/ orphans
Condoms provided in wash rooms of District Water Office
Heath Dept , TASO, RHITES – North Lango, MoH
-
4. Kyenjojo Sensitized 413 people Condoms provided at District Water Office
Health Department
-
5. Bunyangabo Done during advocacy meetings
Condoms distributed at Health Dept
Health Department
-
6. Kibaale HIV and AIDS and COVID 19 messages passed during advocacy and trainings
Condoms distributed in office and during meetings and training
Health Department
DWO attend training on HIV and AIDS and COVID 19 organized by IDI
7. Nakaseke Done during meetings and trainings
- - -
8. Kaliro Done during meetings, formation of WSC, training of Pump mechanics, soc mob and advocacy meetings
Condoms distributed at DWO’s Office
Health Department
-
9. Ntungamo Done during meetings and trainings
Condoms distributed by Red Cross
Red Cross -
10. Jinja Done during meetings and trainings
Condoms accessible at DWO
Health Department
-
11. Lira Done during advocacy meetings at district and subcounty level
Condoms distributed by contractors
Health Department
-
12. Kalungu Done during meetings and trainings
Condoms distributed at wash rooms and by Rakai Heath Science Programme
Health Department and Rakai Heath Science Programme
-
13. Kagadi Done During meetings and Trainings
- - -

Uganda Water and Environment Sector Performance Report 2020
229
11.4 Challenges for mainstreaming cross- cutting issues
i) Inadequate gender disaggregate data. This is a very big challenge for gender responsive programming and sustainable development agenda of leaving no one behind.
ii) Limited access to financing for gender sensitive climate change programming both at national and local government levels including civil society organizations that contribute to this sector. This has impacted negatively on mitigation and adaptation plans/ ambition that has been stated in Uganda’s Nationally Determined contributions.
iii) Limited skills for gender responsive mitigation and adaptation actions for example, Climate Smart Agricultural practices, transforming waste into alternative energy sources, such as making briquettes from waste materials, grass, leading to less use of charcoal and firewood, and hence preserving the forests/plant species with the precious genetic materials and maintaining the Greenhouse Gas (GHG) sequestration.
iv) The lack of sector specific gender and equity compact, to guide economists and planners in planning and budgeting.
v) Limited data on vulnerable and marginalized groups including elderly, youth, disabled, children and youth, who are usually most affected by inadequate service provision.
vi) Limited funding to support HIV/AIDS mainstreaming and the implementation of women and youth empowerment activities within the sector.

Uganda Water and Environment Sector Performance Report 2020
230
12. CIVIL SOCIETY ORGANISATIONS IN WATER AND SANITATION
12.1 Scope and structure of the report
This report documents contributions of Civil Society Organizations (CSOs) to the Uganda Water and Sanitation sub-sector. It is based on reports from 62 CSOs that made submissions to the Uganda Water and Sanitation Network (UWASNET). UWASNET, established in 2000, is the national umbrella organization for CSOs in the Water and Sanitation. Its mandate is to coordinate all CSOs and strengthen their contribution to the sector by facilitating learning and sharing, documentation of CSO’s work and promoting partnerships and collaborations with other sector stakeholders, including Government, development partners and the private sector. UWASNET’s operational structure includes a Secretariat assisted by 6 Thematic Working Groups (TWGs) and 10 regional coordinators selected from member organizations. The UWASNET regional structures were originally aligned to the Ministry of Water and Environment’s decentralized Technical Support Unit (TSU) structures. The TWGs, are aligned to the sector working groups and are advocacy platforms intended to strengthen CSOs participation in sector decision making processes by identifying and deliberating on key sector emerging issues to facilitate improved service deliver and for policy influence. The six thematic working groups are; (i) Good Governance, (ii) IWRM, Environment and Climate Change, (iii) Sanitation and Hygiene, (iv) Urban Water and Sanitation, (v) WASH technologies, as well as (vi) Women, Children and other Vulnerable Groups. This year, UWASNET revised the data collection form to better align it with the sector performance framework and piloted the use of online reporting. Performance reporting is aligned to the key sector thematic areas and includes relevant sector performance indicators.
12.2 UWASNET secretariat contribution
UWASNET’s contributions for 2019/20, are derived from the Strategic Plan 2017 -2022. The Strategic Objectives are aimed at revamping UWASNET’s image and visibility in order to better implement its mandate. The activities and achievements of 2019/20 are outlined below under the three strategic objectives: 1. Strategic Objective 1: Coordinated and Amplified CSOs’ Voice to Influence Policy and Practice within the
Water and Environment Sector UWASNET coordinated its members to influence policy and practice in the WASH and Environment sector. Key interventions included:
• Developed the non-state actors' issue paper to inform the development of NDP III. Key recommendations were incorporated in the overall Sector Issue Paper, which was submitted to the National Planning Authority, and contributed to the sector having a program incorporated in the NDP III.
• Quarterly meetings for all six Thematic Working Groups were held, which contributed information to the development of key sector guiding documents notably, the National Framework for Operation and Maintenance of Rural Water Infrastructure in Uganda, and the implementation of FY 2019/20 Sector undertakings.
• Coordinated CSOs’ contribution to the national response to Covid-19 in Uganda. Which has enabled stakeholders to know who is doing what and where regards COVID 19.
• Advocated for the prioritization of WASH through increased budget allocation in national planning and budgeting to effectively address Covid-19 and other WASH-related illnesses in Uganda.
• Conducted a national assessment of WASH services in research study of citizens' views and experiences on water, sanitation and hygiene to inform national policy

Uganda Water and Environment Sector Performance Report 2020
231
2. Strategic Objective 2: Enhanced Learning and Strategic Synergies Around Key Sector Issues
Part of the learning agenda
i. The regional coordination structures were re-established, to be used as platforms to coordinate learning and knowledge management. 10 regional meetings were held with support from GIZ-CUSP. The objectives of the meetings were to facilitate the election of the regional coordinators and identify regional advocacy issues to inform the development of the regional work-plan to be collaboratively implemented by regional partners.
ii. The six thematic working groups held quarterly meetings and contributed information to the development of key sector guiding documents notably, the National Framework for Operation and Maintenance of Rural Water Infrastructure in Uganda, and the implementation of FY 2019/20 Sector undertakings.
iii. Development of the UWASNET Directory. With support for GIZ-CUSP, UWASNET conducted a national wide physical mapping of CSOs operating in the Water and Sanitation sub-sector with support from Ministry of Water and Environment decentralized structures namely the District Water Officers and the Technical Support Units. The directory comprises of 198 CSOs, with key organizational information including thematic areas of focus, areas of operation, organizational vision, mission, and contacts to facilitate easy tracking of their contribution to the sector.
iv. Upgraded the UWASNET website - updating content for both the general public and profiling different members achievements in the sector. The website also incorporates an online directory for CSOs operating in the sector and a database for different stakeholders to know who is doing what and where.
v. Continued to share information with members to inform their operations and work.
3. Strategic Objective 3: Strengthened Institutional Capacity of UWASNET to Effectively, Efficiently and Sustainably Deliver on Its Mandate Under this objective, UWASNET focused on re-establishment of regional coordination units, resource
mobilization, and improving member reporting as detailed below:
i. Renewed the regional coordination structures - Elected new regional coordinators and developed regional work-plans and budgets.
ii. Developed the online data collection tool for annual assessment of CSOs performance, and oriented members on how to use the online platform to submit data for the annual CSO Performance Report. It is anticipated that once all members are well versed with the tool, data collection and analysis will be easier.
iii. Conducted a capacity needs assessment of members in mainstreaming social accountability in their programs with the aim of building their capacity and providing practical guidance to CSOs to effectively undertake and mainstream social accountability within their programs.
iv. Partnered with the Centre for Affordable Water and Sanitation Technology (CAWST) to develop tailor-made training workshops aimed at strengthening members’ capacities in identified WASH related areas including WASH technologies and approaches. The program is anticipated to commence in 2021.
Highlights of CSO COVID-19 response To manage the COVID-19 challenge, the Government of Uganda through the Ministry of Health has instituted several response measures and standard operating procedures, including hygiene and sanitation related measures like encouraging frequent hand washing with soap and water. Civil Society Organisations (CSOs) are key stakeholders contributing to the national response to Covid-19 through different initiatives as highlighted below and in the frame that follows. As the national coordination organization for CSOs in the Water and Sanitation sub-sector, UWASNET has been and continues to work collaboratively with its members and partners to mobilize

Uganda Water and Environment Sector Performance Report 2020
232
their contribution towards the national response to Covid-19. A monitoring tool to facilitate the documentation of WASH CSOs’ contribution. In addition, UWASNET is with the Ministry of Water and Environment through the National Hand Washing Secretariat to coordinate and mobilise related resources for hand washing promotion countrywide.
111 CSOs reported contributions towards Covid-19 response in 108 districts. The contributions were in form of
provision and installation of hand washing with soap facilities in transient areas including markets, and taxi parks,
sensitization and awareness creation of the general public through print and broadcast media, provision of
Personal Protective Equipment (PPE) to essential health workers, provision of food relief and provision of both
technical and financial support to the national and district task forces on Covid-19. A total of 1,745,790 and 2,707
households have benefitted, and based on reports from 19 of these CSOs, at least UGX 5,548,459,046 has spent
on Covid-19 related activities.
The Covid-19 Pandemic has had a negative impact on CSO operations. 22 CSOs reported no activity due to effects of the pandemic and limited emergency funding,
5. Katosi women - Community
awareness
6. Soap making training
8. Busoga Trust - BH repair
9. UWASNET - Budget
advocacy engagements
2. WVU – Arua District 3 Wells of Life - Mityana District
4. ACTS – Hand washing support
1. WAU - HWF to KCCA
7. SCF - Amudat support
Notes 1. Action Against Hunger - community sensitization in Kyangwali 2. Action for Human Rights and Education Initiative Uganda – community sensitization in Invempi , Arua on
COVID 3. AMREF Health Africa - National COVID task force member and providing support in form of community
awareness messaging, PPEs, providing HWFs soap and disinfectants in Kabarole, Bunyangabu and in all the
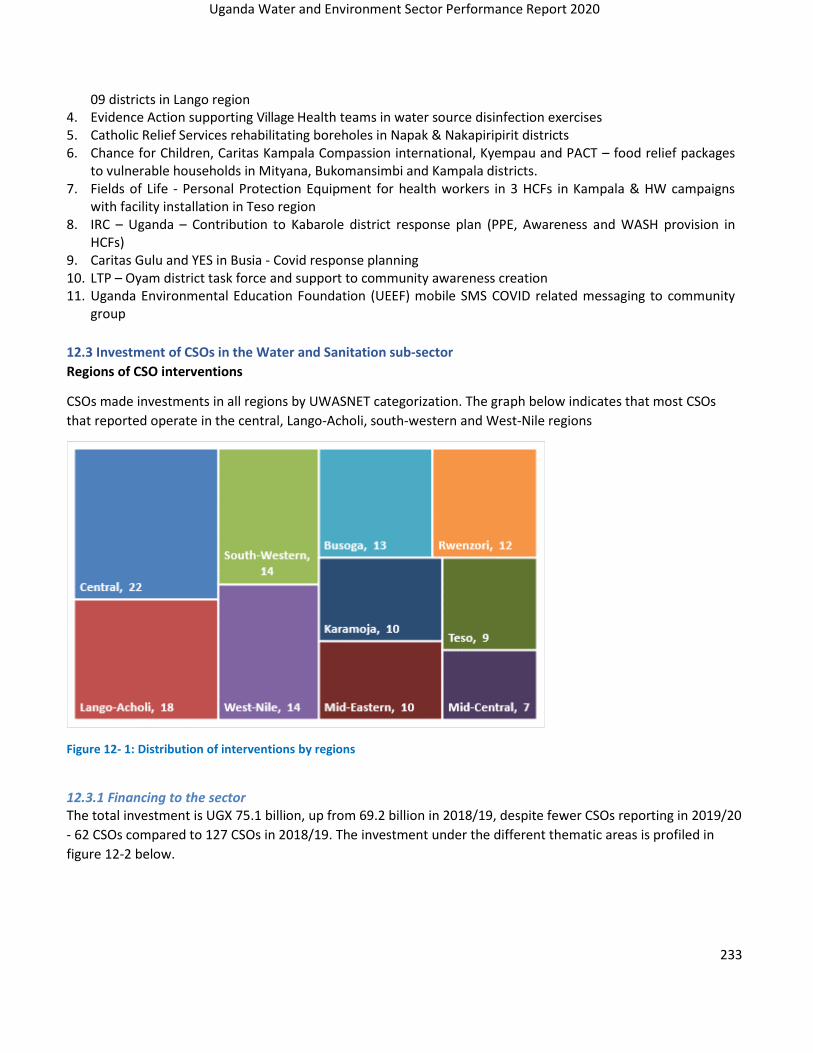
Uganda Water and Environment Sector Performance Report 2020
233
09 districts in Lango region 4. Evidence Action supporting Village Health teams in water source disinfection exercises 5. Catholic Relief Services rehabilitating boreholes in Napak & Nakapiripirit districts 6. Chance for Children, Caritas Kampala Compassion international, Kyempau and PACT – food relief packages
to vulnerable households in Mityana, Bukomansimbi and Kampala districts. 7. Fields of Life - Personal Protection Equipment for health workers in 3 HCFs in Kampala & HW campaigns
with facility installation in Teso region 8. IRC – Uganda – Contribution to Kabarole district response plan (PPE, Awareness and WASH provision in
HCFs) 9. Caritas Gulu and YES in Busia - Covid response planning 10. LTP – Oyam district task force and support to community awareness creation 11. Uganda Environmental Education Foundation (UEEF) mobile SMS COVID related messaging to community
group
12.3 Investment of CSOs in the Water and Sanitation sub-sector
Regions of CSO interventions
CSOs made investments in all regions by UWASNET categorization. The graph below indicates that most CSOs
that reported operate in the central, Lango-Acholi, south-western and West-Nile regions
Figure 12- 1: Distribution of interventions by regions
12.3.1 Financing to the sector The total investment is UGX 75.1 billion, up from 69.2 billion in 2018/19, despite fewer CSOs reporting in 2019/20
- 62 CSOs compared to 127 CSOs in 2018/19. The investment under the different thematic areas is profiled in
figure 12-2 below.
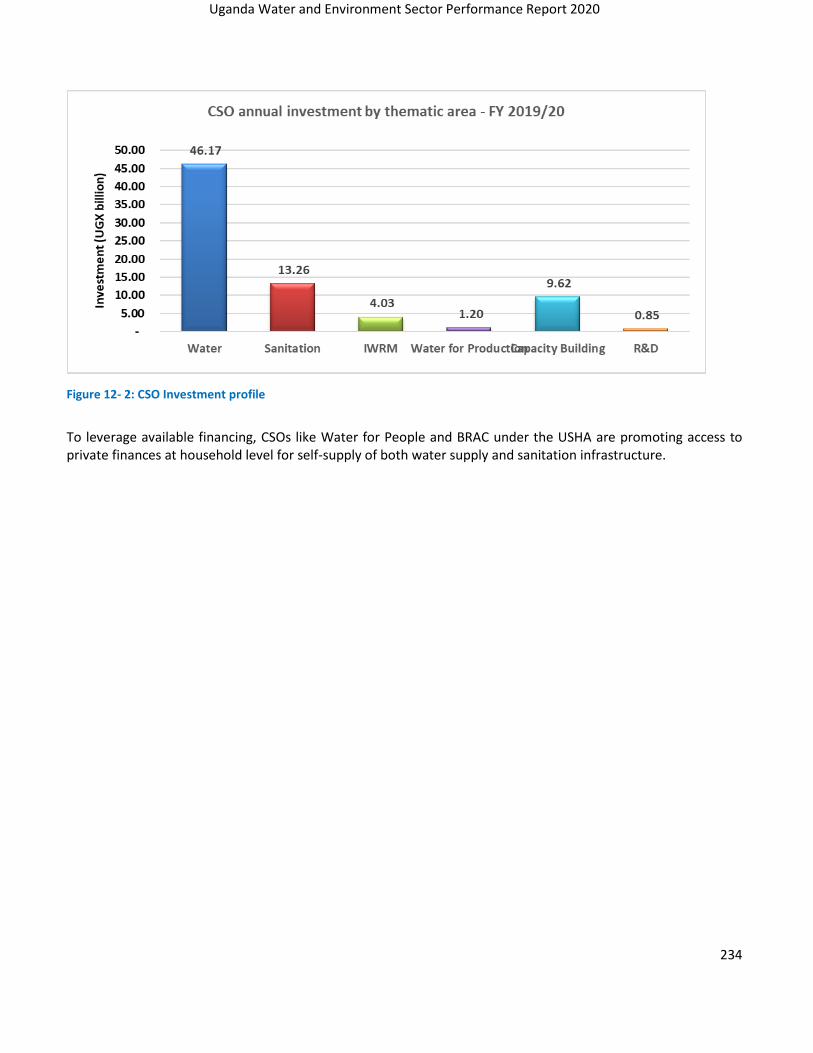
Uganda Water and Environment Sector Performance Report 2020
234
Figure 12- 2: CSO Investment profile
To leverage available financing, CSOs like Water for People and BRAC under the USHA are promoting access to private finances at household level for self-supply of both water supply and sanitation infrastructure.

Uganda Water and Environment Sector Performance Report 2020
235
Investment is highly skewed towards water supply as shown by figure 12-3. This level of investment is also
backed by the fact that the unit cost of investment in water infrastructure far outweighs that of other
Access to financing – community WASH self-supply loan
• Water for people, partnering with Post Bank Uganda, has facilitated access to a WASH loan product for construction, renovation, water extension, and equipment purchase, to improve WASH access, and promote inclusion in Kamwenge district. To ensure the intended use at household level, the loan amount is paid to an identified service provider and not directly to the customer. WASH contract financing loan product is also available Water for People, and sub-county extension staff use community engagement meetings to promote the product and has negotiated subsidised interest rates. Additional marketing is done by the bank through local media and bank staff, as part of customer relationship management. The Loan requirements are detailed in the schematic below:
•
•
• Loan Use • Customer base
• 2018 • 2019
• Sanitation (Latrine)
• 11 • 36
• Water (Connection)
• 9 • 8
• Total • 20 • 44
• The loan product has grown its customer base from 20 in 2018 to more than double (44) in 2019 as shown above. A total
of 1344 beneficiaries recorded over the 2-year period.
In addition, as part of its role under the Citywide Inclusive Sanitation (CWIS) program, Water for people, working with
KCCA, is facilitating access to finance for sanitation improvement in Kampala. Water for People’s related roles include
business support to local construction companies and masons offering sanitation products and services and incentivizing
households in upgrading sanitation facilities. Water for people has established partnerships with Postbank Uganda,
Housing Finance Bank and Opportunity Bank. The post bank loan product is well established and includes household
sanitation loan products under a guarantee fund arrangement and business loans for service providers. The
characteristics of the guarantee fund include subsidized Lending interest rates, minimal Collateral requirements for large
loans, waived requirement for Loan down payments for landlords and Support with marketing through a developed
marketing campaign targeting the middle-income cluster.
• Additional marketing - communication materials
• Equipping of CATS for market assessments
CATs and COs incentivized per loan disbursed
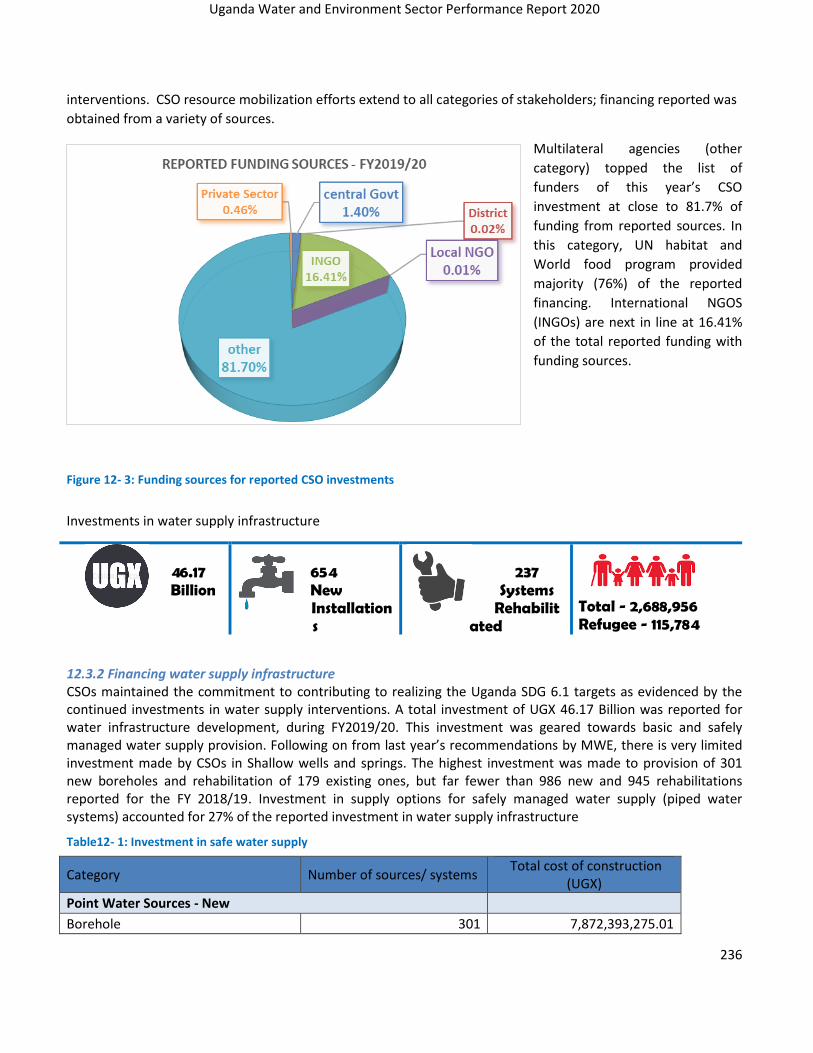
Uganda Water and Environment Sector Performance Report 2020
236
interventions. CSO resource mobilization efforts extend to all categories of stakeholders; financing reported was
obtained from a variety of sources.
Multilateral agencies (other
category) topped the list of
funders of this year’s CSO
investment at close to 81.7% of
funding from reported sources. In
this category, UN habitat and
World food program provided
majority (76%) of the reported
financing. International NGOS
(INGOs) are next in line at 16.41%
of the total reported funding with
funding sources.
Figure 12- 3: Funding sources for reported CSO investments
Investments in water supply infrastructure
46.17 Billion
654 New Installations
237
Systems Rehabilit
ated
1,100 Villages triggered
659,449 People in triggered villages
208 Villages Declared ODF
CLTS Total - 2,688,956 Refugee - 115,784
12.3.2 Financing water supply infrastructure CSOs maintained the commitment to contributing to realizing the Uganda SDG 6.1 targets as evidenced by the continued investments in water supply interventions. A total investment of UGX 46.17 Billion was reported for water infrastructure development, during FY2019/20. This investment was geared towards basic and safely managed water supply provision. Following on from last year’s recommendations by MWE, there is very limited investment made by CSOs in Shallow wells and springs. The highest investment was made to provision of 301 new boreholes and rehabilitation of 179 existing ones, but far fewer than 986 new and 945 rehabilitations reported for the FY 2018/19. Investment in supply options for safely managed water supply (piped water systems) accounted for 27% of the reported investment in water supply infrastructure
Table12- 1: Investment in safe water supply
Category Number of sources/ systems Total cost of construction
(UGX)
Point Water Sources - New
Borehole 301 7,872,393,275.01
31.22 Bn spent
1603 New Installations
1584 systems Rehabilitated
31.22 Bn spent
1603 New Installations
1584 systems Rehabilitated
31.22 Bn spent
1603 New Installations
1584 systems Rehabilitated

Uganda Water and Environment Sector Performance Report 2020
237
Category Number of sources/ systems Total cost of construction
(UGX)
RWH Tank < 6000 L 167 436,331,179.22
RWH Tank of 6000 to 10000L 102 121,097,467.09
RWH Tank > 10000L 12 666,497,000.00
shallow well 11 1,230,346,717.00
Total point sources - new 593 10,326,665,638.33
Point water sources - Rehabilitation
Borehole 179 4,325,892,284.74
Protected Spring 10 11,251,500.00
Shallow hand Dug Well 9 7,134,044.44
RWH Tank of 6000 to 10000L 6 36,906,539.00
Total point sources - Rehabilitation 204 797,913,938.00
Uncategorised/ Undefined (AEE) 5 73,000,000.00
Piped water systems
GFS - new 5 1,491,915,800.00
GFS - rehabilitation/ extension 5 866,100,500.00
Pumped - rehabilitation/ extension 31 1,894,237,448.00
pumped -new 48 19,122,411,274.00
Total piped water sources 89 23,374,665,022.00
Total Investment 34,572,244,598.33
12.3.3 Water supply infrastructure per-capita investment cost The sector seeks to promote value for money in its investments, with per-capita investment cost as one of the performance indicators. The per capita investment costs reported by CSOs in FY 2019/20, was obtained for borehole supply, as shown in table 12-2 below. The figures vary across the different districts, ranging from an average of USD 6.62 in Butaleja to USD24.19 in Mayuge district. The overall average per capita investment cost for borehole supply using hand pumps (non-motorized) is USD11.58, is lower than last year’s figure of USD 14.92.
Table12- 2: Per-capita investment costs
District No. of Boreholes Average cost of construction Average of Per capita investment cost (USD)
Amuru 22 8,762,634 7.14
Butaleja 10 23,500,000 6.62
Kakumiro 20 24,992,360 14.74
Kaliro 37 12,351,351 9.59
Kiryandongo 25 14,407,526 12.27
Kumi 10 23,500,000 8.91
Mayuge 15 23,455,551 24.19
Namutumba 18 23,500,000 9.22
Average 19,308,678 11.58

Uganda Water and Environment Sector Performance Report 2020
238
The resource mobilization initiatives of CSOs have leveraged partnerships with development partners and communities alike. The case of community partnerships profiled below, highlights the potential that exists and the strides taken in ensuring universal water access for residents in Uganda.
Photo12- 1: Kibande spring before
GFS construction.
Photo12- 2: Women trekking to
fetch water
Photo12- 3: one of Unprotected
water sources previously used by communities
The power of community partnerships
Katembe Parish is located in Rukiri Sub County in Buhweju District which is among the food baskets of Western
Uganda. This community, on the foothills of Rukiri (rock) comprises of mostly subsistence farmers. The communities
in Katembe Parish lacked access to safe water. The upper villages of Kibande I, Kibande II, Mugarama I and Bwahika
collected water from Kibande spring which was protected in 1992 but is now dilapidated. The lower villages
collected water from open streams and ponds within the Kibande catchment system and therefore had
unsafesupply.
The burden of water collection in Katembe was shouldered by women and children who walked long distances to
access safe water. This led to absenteeism and school dropouts. This lack of water also meant that the majority did
not practice adequate handwashing.
The need for safe water in Katembe had been overshadowed by the high percentage of water coverage in Rukiri
sub-county. The sub-County water board, aware of the water challenge in Butembe, requested Living Water
International (LWI), through the Woman Member of Parliament to fund a piped water system. A design of a gravity
flow scheme was made with an estimated construction cost of UGX 748 Million. However, the available budget from
LWI was UGX 640 Million leaving a funding gap of UGX.146.4 Million.
LWI engaged the district leadership and through a memorandum of understanding, the District Local Government
(DLG) and sub county were able to mobilize the additional resources including acquiring all land for major
installations, supply of unskilled labour and mobilizing locally available construction materials. The District
leadership embarked on massive community and stakeholder mobilization which enabled the communities to
accept, participate and contribute towards the construction of Kibande water system. This contributed to the
successful launch and implementation of the project as the roles of different stakeholders were spelt out and
mechanisms for coordination of different activities and parties were discussed to enable smooth implementation,
with all parties satisfied with the outcome.
Kibande Gravity Flow System (GFS) is fully functional and has enabled access to safe water to 6800 people in 10 of
the 12 villages in Katembe parish - Bwahika, Ryakatiri, Ihome, Kaijororonga, Kashari, Katembe, Kibande I, Kibande II,
Mugarama I and Mugarama II.

Uganda Water and Environment Sector Performance Report 2020
239
Photo12- 4: Children taking a break on the way to fetch water
Photo12- 5: The 30,000 Litre reservoir tank - serves the upper line
Photo12- 6: Beneficiary fetching water from one of the 40 tap stands
12.3.4 Access to Water supply – Beneficiaries The above detailed investment in new infrastructure served a total of 2,688,956 beneficiaries, of which at least 53%21 were female as detailed in table 12-3 below. A total of 10,111 villages were reported to have been provided with access to a least a basic water supply service.
Table12- 3: Beneficiaries - Access to water supply
Primary Beneficiary Category No. Of Villages
served Total
beneficiaries Female
Beneficiaries Refugee
Beneficiaries
Community 9,996 2,511,846 1,251,286 107,474
Health centre 4 122,625 114,451 0
School 11 54,485 46,706 8,310
Total 10,011 2,688,956 1,412,443 115,784
12.3.5 Water supply infrastructure functionality Proper planning and maintenance remained a major sector challenge that CSOs are contributing to address. Key investment in maintenance/ functionality and thus sustainability of infrastructure included rehabilitation of existing infrastructure, enhancing the development of management models to ensure sustainable service delivery. A total of 209-point water sources and 28 piped systems were rehabilitated, down from 945 and 92 in 2018/2019.
The Uganda Sanitation for Health Activity (USHA), profiled under section 2.3.1, also supports capacity
strengthening of operators that started with the Central and Northern Umbrella Authorities (UAs). The support
will involve water system improvements (network extensions) executed through output-based aid/ milestone
payments and capacity strengthening in scheme management and UA professionalization. These are intended to
result in improved access as well as related performance enhancement of the UAs. Four schemes (Matale WSS -
Buikwe District and Kamengo WSS - Mpigi under Central UA, and Namagera WSS- Jinja and Namwiwa WSS -
Kaliro under Eastern UA) are being supported and USHA is working to establish a geo-referenced customer
baseline to inform the system engineering design for network extensions and UA business planning
21 Reporting on beneficiaries for some investments was not gender disaggregated

Uganda Water and Environment Sector Performance Report 2020
240
CSOs continued to advance and improve on the O&M models that were reported on in the last two financial years. Key models that were reported on include: ➢ Concession contracts for maintenance support between Local governments, communities and local
service providers (mainly hand pump mechanics). WHAVE solutions are currently operating as pseudo utilities for borehole sources under “service maintenance contracts” with defined tariff structure (usually block) and performance indicators to ensure functionality. Whave, continued its operations as Area Service Provider under Preventive Maintenance and Continuous Rehabilitation agreements (PMCRA) in Mityana, Nakaseke, Kumi and Kamuli districts with new operations in Kaabong, Karenga and Kotido districts. These services are for point water supply through 395 boreholes and shallow wells that serve communities, schools, health centres. The key performance indicators summarised in the table 12-4 below. An average 98% functionality level with average response time of within 6 days - apart from in Kotido, has been achieved through this model.
Table12- 4: WHAVE solutions – performance data
District/ Indicator Kamuli Kumi Nakaseke Mityana Kaabong Karenga Kotido Total
Number of sources with PMCRA 98 80 37 50 55 30 45 395
Spot Functionality 98% 99% 97% 100% 95% 100% 98% Ave. 98%
Average breakdown duration 1 day 1 day 1 day 1 day 6 days 6 days 22 days
Number of beneficiaries 22,491 23,312 14,911 9,912 14,912 8,134 21,072
➢ Scheme management by private sector under the umbrella model. Most of the schemes under the umbrella model are managed by operators employed as part of the umbrella staffing structure. Water for people working with the Mid-Western Umbrella For Water And Sanitation (MWUWS) is developing the private operator system for running and managing the piped water systems in Biguli, Kamwenge district. Three operators have been engaged since 2015 and these include (i) The Biguli Traders Association managing the Biguli-Kirinda System and Kabuye extension (B. Kirinda Cluster), on a revenue sharing agreement of 55% (Operator): 45% (MWUWS), (ii) Power Technical Services-Ltd managing Malere, Rwebishahi, Bitojo-Byantumo, Kabale-Keishunga and Busingye Systems on a revenue sharing agreement of 45% (Operator): 55% (MWUWS) and (iii)Sole proprietors planned to manage the Kampala B and the greater Malere system on a revenue sharing that is yet to be agreed upon. MWUWS is responsible for fuel costs in operations, major repairs, mains expansions, resolving major leakages and other related costs. Both operators cover routine day-to-day expenses, scheme personnel, security expenses, and other operational costs. Key performance indicators show that the branch realised average Non revenue Water (NRW) of 17%, against a MWUWS target of 20%, and average collection efficiency of 98% for a total of 1568 connections. Preliminary indications seem to indicate the viability as a service delivery model; however, detailed assessment of the business model will be required to adequately inform the sector direction.
12.4 Investment in Sanitation and Hygiene
13.26
Billion
12.53 Bn
Invested
2365 Safely Mgd
Facilities 56,089 HWF
165 ODF
Villages
1850 School Stances
2,608
HWF
1,100 Villages triggered
659,449 People in triggered villages
208 Villages Declared ODF
CLTS Total - 852,069
CSOs continue to support interventions that are intended to improve service delivery along the faecal sludge management (FSM) chain. The main investments were towards improving the containment stage of the chain and some supporting services to improve emptying and re-use of faecal sludge as detailed below. The Uganda
31,350
Household
31.22 Bn spent
1603 New Installations
1584 systems Rehabilitated

Uganda Water and Environment Sector Performance Report 2020
241
Sanitation for Health Activity (USHA) is a key intervention facilitating CSO contribution to the sanitation and hygiene improvements in Uganda. The Uganda Sanitation for Health Activity (USHA)
USHA is a United States Agency for International Development (USAID) funded project aimed at increasing the number of people with access to improved and sustainable water, sanitation, and hygiene (WASH) services. USHA targets 2122 districts in Eastern, Mid-southern and Northern Uganda and is implemented by Tetra Tech ARD in collaboration with CSOs (SNV USA, BRAC, and FSG) and private sector (Sanitation Solutions Group - (SSG)). USHA commenced in 2018 and it employs different innovative models coupled with knowledge management / transfer towards attaining this goal. Sanitation social marketing is used as a key strategy/approach, to catalyze and accelerate sanitation access. To
this end, the USHA has pioneered the Market based sanitation implementation approach (MBSIA) model and the
integrated CHP – MBSIA model in its operational arrears. The MBSIA model is a network model that seeks to
facilitate forward and backward linkages all players in the sanitation/ toilet chain to ensure. These players include
Masons, community health promoters, financing institutions (Banks, and SACCOs) and material suppliers.
Sanitation Grants are also available for activities aimed at hygiene and sanitation improvements. This year
UGX1.5 billion has so far been utilized by the USHA sub-grantees, that include Water Compass Inc., Water
Mission Uganda, UMURDA, The Busoga Trust, Joy Initiatives Uganda and Villa Maria Hospital
Development of effective management models - USHA seeks to improve the FSM service chain through building capacity of providers of the emptying service. This activity focuses on urban sanitation in 3 districts and three providers. AWASO (Jinja), Central Umbrella (Kyotera), and Musoga (Masaka) have been engaged. Business plans including service solutions, standard operating procedures that promote occupational health and safety performance targets and monitoring framework have been developed. Monitoring data has been digitized with collection using mobile devices and analysis on the USHA ONA platform. In addition, USHA is negotiating finance for purchase of cesspool emptier trucks FY 2017/18 Financial Investment in Sanitation The reported investment in sanitation for FY2019/20 is UGX 13.26 Billion. This investment level represents the highest recorded in the last five years (ranging from UGX 9.86 billion in FY 2018/19 to UGX 12.53 billion in FY 2017/18) and a significant indicator of the importance of growing need to address the sanitation access gap. Relatedly, the Uganda sanitation for health activity (USHA), profiled in section 1.4, is noteworthy Investment in Fecal sludge containment Investment in containment solutions for fecal sludge followed similar patterns to previous reporting years. a) Household toilet technologies The drop and store technological options are still predominant as shown in table 12-5. There is still significant investment in traditional pit latrines (TPLs), as a household level toilet option. While this option is at the bottom
22 Buikwe, Kaliro, Jinja, Buyende, Namutumba, Kayunga, Luuka, Mpigi, Kyotera, Lwengo, Bukomansimbi, Gomba, Ssembabule, Lamwo, Kitgum, Gulu, Padar, Agago, Amoro, and Nwoya
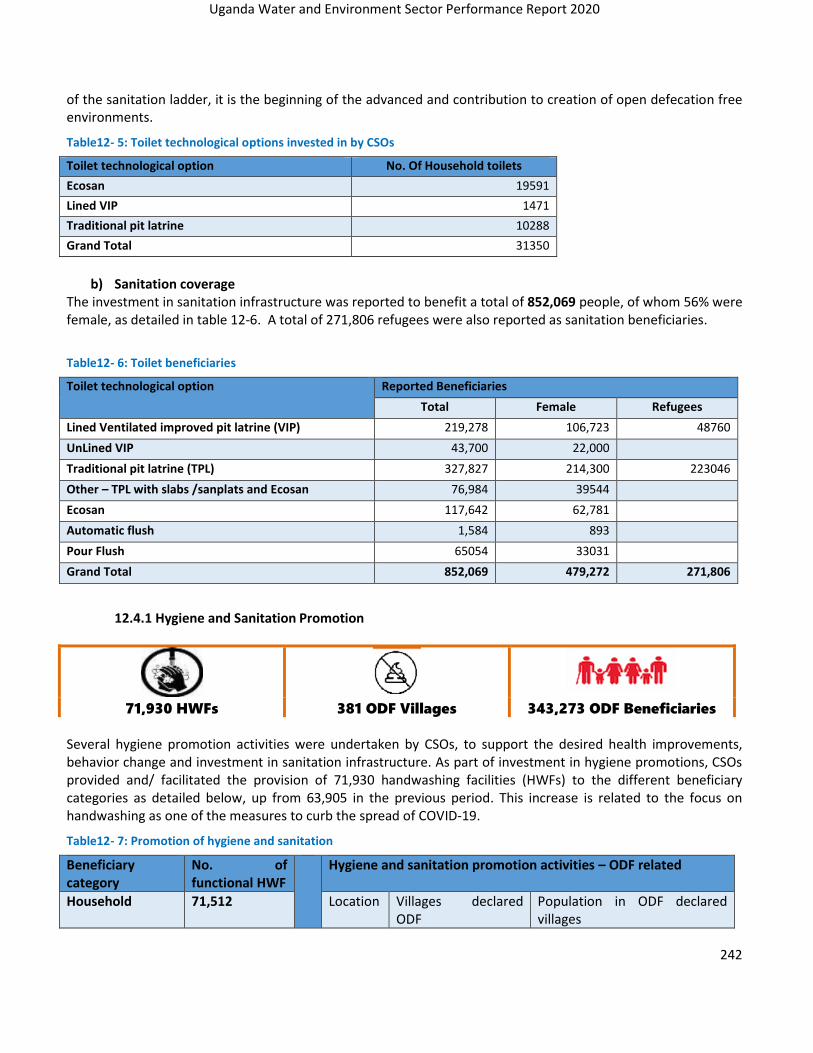
Uganda Water and Environment Sector Performance Report 2020
242
of the sanitation ladder, it is the beginning of the advanced and contribution to creation of open defecation free environments.
Table12- 5: Toilet technological options invested in by CSOs
Toilet technological option No. Of Household toilets
Ecosan 19591
Lined VIP 1471
Traditional pit latrine 10288
Grand Total 31350
b) Sanitation coverage
The investment in sanitation infrastructure was reported to benefit a total of 852,069 people, of whom 56% were female, as detailed in table 12-6. A total of 271,806 refugees were also reported as sanitation beneficiaries.
Table12- 6: Toilet beneficiaries
Toilet technological option Reported Beneficiaries
Total Female Refugees
Lined Ventilated improved pit latrine (VIP) 219,278 106,723 48760
UnLined VIP 43,700 22,000
Traditional pit latrine (TPL) 327,827 214,300 223046
Other – TPL with slabs /sanplats and Ecosan 76,984 39544
Ecosan 117,642 62,781
Automatic flush 1,584 893
Pour Flush 65054 33031
Grand Total 852,069 479,272 271,806
12.4.1 Hygiene and Sanitation Promotion
71,930 HWFs 381 ODF Villages 343,273 ODF Beneficiaries
Several hygiene promotion activities were undertaken by CSOs, to support the desired health improvements, behavior change and investment in sanitation infrastructure. As part of investment in hygiene promotions, CSOs provided and/ facilitated the provision of 71,930 handwashing facilities (HWFs) to the different beneficiary categories as detailed below, up from 63,905 in the previous period. This increase is related to the focus on handwashing as one of the measures to curb the spread of COVID-19.
Table12- 7: Promotion of hygiene and sanitation
Beneficiary category
No. of functional HWF
Hygiene and sanitation promotion activities – ODF related
Household 71,512 Location Villages declared ODF
Population in ODF declared villages

Uganda Water and Environment Sector Performance Report 2020
243
Public Places 15 Total 381 343,273
School 234 Arua 81 188,363
Health Centre 38 Yumbe 75 230,000
Other Institution 131
Total 71,930
Additionally, community engagement using different hygiene and sanitation promotion approaches was undertaken in 23 districts. These approaches include community led total sanitation (CLTS), follow up Mandona, PHAST, Home Improvement Campaigns (HIC), child-to-child (CtC), Sanitation marketing. These interventions resulted in a total of 381 villages with a corresponding population of 343,273, being declared open defecation free (ODF). The results recorded were mainly as a result of interventions in Arua and Yumbe districts that utilized a combination of CLTS, follow up Mandona, PHAST and HIC approaches. These engagements have contributed to increased sanitation access as highlighted in the case below that presents the power of community engagement and potential of many of the approaches used by CSOs.
The market for WASH service providers is not as developed in Karamoja as it is in other regions of Uganda. WASH products
such as slabs, soap, re-usable menstrual pads among others are not easily accessible, and the local traditional latrines do
not meet basic sanitation service standards.
Through the Apolou program, Save the Children Fund (SCF) identified, trained and supported community masons and
business entrepreneurs to start WASH related businesses in the districts of Amudat, Moroto, Kotido and Kaabong. The
activity involved both women and
men, motivating 21 business
entrepreneurs and 183 community
masons to engage in latrine
product making.
WASH marketing was used to
compliment CLTS and the Clean
household approach” activities to
motivate construction of latrines
that meet the SGD definition of
basic sanitation. Consultation were
held with women and girl’s groups,
and business entrepreneurs to
identify culturally acceptable products and have them produced. “Community experiential events were organized through
manyatta wagon vans in which key behaviours and practices were demonstrated. The events also provided a platform for
sales promotions by entrepreneurs - through the intervention 152 latrine slabs have been sold by entrepreneurs and
installed by community masons.
The initiative has provided opportunities for private sector companies to interact with consumer populations and for the
communities to purchase Sato pans, resulting a positive impact towards latrine improvement interventions in Karamoja
region. It has also exhibited the women masons and that culturally appropriate WASH products contribute significantly to
the decision to move up the sanitation ladder.
The above success is not without challenges, the services of female masons are under appreciated by the community; since
most community members still perceive male masons as superior to female masons. In addition, the low purchasing power
which was worsened by COVID 19 pandemic, which negatively affected household incomes, limited the progress in latrine
Women masons making toilet slabs - Katopoten village, Amudat district
Completed latrine using pre-cast slabs embedded with sato pans - Katopoten

Uganda Water and Environment Sector Performance Report 2020
244
numbers.
The private sector is key contributor to construction and improvement of latrines, and the social marketing, with women
playing a key role should be leveraged. This, along with appropriate and contextualized WASH products will go a long way in
increasing the percentage of people having access to improved latrines.
School Sanitation
CSO contribution to improvement of sanitation in school and thus the indicator on pupil stance ratio is summarized below
Table12- 8: School sanitation facilities and pupil stance ratio
Indicator Total toilet stances provided Pupil stance ratio (Average)
User category
Boys Only
Girls only
Both Boys & Girls
Male teachers
Female Teachers
PWDS Before After
Number 55 180 228 8 6 53 76 38
USHA is promoting the WASH friendliness approach to ensure holistic access in schools. Through its grantees, USHA is supporting 53 schools to become WASH friendly. To complement this, is the construction of WASH facilities in these and this year, construction was completed in 16 schools. WASH friendliness is assessed based on eight indicators23 and the progress as at March 2020 was as summarized in the table 12-9 below
Table12- 9: Rating of school WASH
WASH friendliness level WASH Friendly Intermediate Minimal
Score 8 points 5-7 points 1-4 points
Number of schools 4 49 0
WASH in health care facilities (HCFs)
The challenge of adequate access to WASH in HCFs is widely acknowledged including in the JMF where key monitoring indicators are assessed. Some CSOs are implementing some initiative to address this challenge, as shown in the case of Baruru Health centre that highlights the situation in most HCFs in the country. Uganda Health marketing group also continued distribution of life straw water filtration units including to Bwindi community hospital, this in addition to 3 Schools and 1 women’s organization / CBO. The COVID response initiatives by CSOS, including those by AMREF, IRC-Uganda, Fields of Life, Joint Effort to Save the Environment (JESE), Uganda Red Cross Society and VAD, also targeted HCFs.
Buraru Health Centre III (HCIII) is the nearest health facility for the 18 villages in Kyabagambire sub-county, Hoima District. For the more than 11,000 people serviced by this facility, they had to either walk 50 kilometers to the nearest hospital or endure the poor conditions at Buraru HCIII.
23 Use of WASH education materials, institutionalized WASH behaviors, functional segregated toilet facilities for boys and girls, basic access to drinking water from an improved water source, dedicated WASH attendant, and handwashing facilities with water and soap available for pupils

Uganda Water and Environment Sector Performance Report 2020
245
The facility lacked water and expectant mothers had to collect water from a faraway spring well. In addition, the structures were dilapidated, with no sanitation facilities and no water points. The centre depended on one 10,000-litre rain water harvesting tank to serve both the maternity and the outpatients’ wing (OPD), creating scarcity of water throughout the year, for the mothers and the health personnel resident in the area. The outpatient department (OPD) had a leaking ceiling and was a breeding habitat for bats. Rain water would mix with the waste from bats and produce a foul smell which made it difficult for health staff to work long hours, this forcing them to close the facility early. This limited access to medical care. In 2018, World Vision Uganda, engaged community leaders and the local government to improve services at the
centre through the Baby Wash Initiative. Among the interventions was the provision of constant, sufficient, clean
and safe water. A solar powered piped-water system was installed at the facility and running water was
connected to all points of care at the facility, including the laboratory, examination room, maternity ward,
treatment room, in the compound, staff quarters, and to the nearby community. The system pumps
approximately 6,000 litres of water daily, serving a population of 7,872 (4,250 male, 3,622 female). Of these,
4,014 are children below 18 years (2,014 girls, 2,000 boys).
Since the water system was installed, service delivery has improved. Attendance by health workers has improved,
patients and healthcare workers are better able to control secondary infections. The availability of water in the
labor suite makes it easy for the workers and patients to maintain good hygiene. Mothers now look forward to
deliver at the facility - 30 to 35 babies are now delivered every month
A midwife washing hands before examining mothers.
Health workers are now confident of their personal
Hygiene and that of the patients
Mothers during training sessions on the importance of
hand washing nutrition and antenatal care services
The Baby WASH project incorporated other interventions including rehabilitation of the OPD, construction of 6-
stance latrine for women with washrooms, 5 latrines for staff, a waste disposal pit and 1 incinerator. The project also built capacity of health facility staff on infection, prevention and control, and equipped them with personal
protective equipment. The upgrade of Buraru Health Centre III has created a conducive environment for staff and patients and repaired the facility’s reputation. Before the BABY WASH Project, there was a lot of open defecation at the facility which risked patients getting hygiene related infections due to lack of water and proper sanitation facilities. Today, this is no more.

Uganda Water and Environment Sector Performance Report 2020
246
12.5 Integrated Water Resources Management (IWRM)
4.03
Billion
8 sub-
catchmen
ts 56,437
beneficiaries
8161 Ha
under
restoration
12.5.1 Investment in Integrated Water Resources Management CSOs continue to align themselves with the sector policy on catchment-based water resources management as reflected by the investment in Integrated Water Resources Management (IWRM) activities. This year, UGX 4.03 Billion was reported from 15 CSOs, which gives a positive trend in CSO IWRM investment, when generally compared to investment over the last five years, albeit less than USD 4.55 billion reported in FY 2018/19.
12.5.2 IWRM activities during FY2019/20 CSOs invested in restoration, livelihood enhancement and other support activities in the Albert Nile, Aswa, Awoja, Kyoga, Lake Albert, Lake George, Okere, and Rwizi catchments aimed at ensuring proper water resource and environment management.
Figure 12- 4: Management activities undertaken Figure 12- 5: Presence of CMP in intervention areas
It is reported that majority (93%) of these activities are based on catchment management plans (CMPs). Restoration activities financed during the year targeted mainly riverbanks and wetlands, as key hot spots. These activities covered a total of 6181 hectares, most of which was wetlands (6062 Ha), river banks (438 Ha) and landing sites (337 Ha). Livelihood activities included Agro-forestry, briquettes, provision of cooking stoves, fruit and tree nursery growing, fishing and others like apiary, back yard gardening and Eco-tourism. Beneficiaries reported under catchment management/ IWRM activities are 56,437, of whom 28,343 (50.2%) were female. Water development activities, which for CSOs are mainly ground water based, present pressure on the water resource, thus requiring proper monitoring. This year, CSOs reported presence of 125 abstraction permits for the new sources and extensions made.
12.5.3 Water Quality Management CSOs contribution to the ensuring supply of adequate and safe water supplies as well as to the sector indicator on of water quality. Reporting indicates a high compliance rate to the water quality standards for drinking water
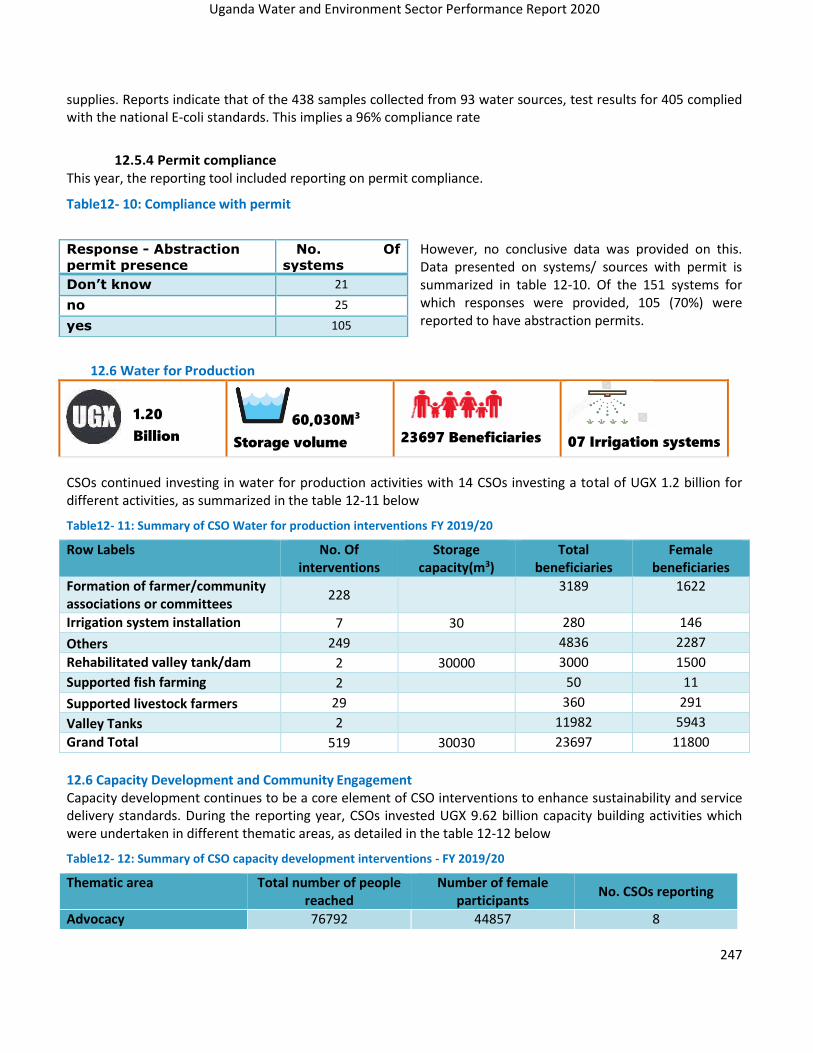
Uganda Water and Environment Sector Performance Report 2020
247
supplies. Reports indicate that of the 438 samples collected from 93 water sources, test results for 405 complied with the national E-coli standards. This implies a 96% compliance rate
12.5.4 Permit compliance This year, the reporting tool included reporting on permit compliance.
Table12- 10: Compliance with permit
However, no conclusive data was provided on this. Data presented on systems/ sources with permit is summarized in table 12-10. Of the 151 systems for which responses were provided, 105 (70%) were reported to have abstraction permits.
12.6 Water for Production
1.20
Billion 60,030M3
Storage volume
23697 Beneficiaries 07 Irrigation systems
CSOs continued investing in water for production activities with 14 CSOs investing a total of UGX 1.2 billion for different activities, as summarized in the table 12-11 below
Table12- 11: Summary of CSO Water for production interventions FY 2019/20
Row Labels No. Of interventions
Storage capacity(m3)
Total beneficiaries
Female beneficiaries
Formation of farmer/community associations or committees
228 3189 1622
Irrigation system installation 7 30 280 146
Others 249 4836 2287
Rehabilitated valley tank/dam 2 30000 3000 1500
Supported fish farming 2 50 11
Supported livestock farmers 29 360 291
Valley Tanks 2 11982 5943
Grand Total 519 30030 23697 11800
12.6 Capacity Development and Community Engagement Capacity development continues to be a core element of CSO interventions to enhance sustainability and service delivery standards. During the reporting year, CSOs invested UGX 9.62 billion capacity building activities which were undertaken in different thematic areas, as detailed in the table 12-12 below
Table12- 12: Summary of CSO capacity development interventions - FY 2019/20
Thematic area Total number of people reached
Number of female participants
No. CSOs reporting
Advocacy 76792 44857 8
Response - Abstraction
permit presence
No. Of
systems
Don’t know 21
no 25
yes 105

Uganda Water and Environment Sector Performance Report 2020
248
Good governance 215841 120706 30
Other 7982 5041 4
Policy influence 50 15 2
Sector coordination 2825 1896 5
Grand Total 303490 172515 49
49 CSOs reported interventions in capacity building, reaching out to 303,490 beneficiaries, of which 57% were female. The engagements focused on topics like of O&M of water and sanitation facilities, gender, catchment management, social accountability, HIV/AIDS, IWRM, and planning. Different stakeholders were involved in these activities including community members, refugees, religious leaders, school children and teachers, MWE regional staff from the WSDF, TSU and WMZ, training institutions, CSO staff, and District local government staff. Capacity Development and Community Engagement initiatives have facilitated several benefits and improvements in WASH service delivery. Notable among the impacts are:
• Good water, sanitation and hygiene practices including among others handwashing, safe disposal of excreta, safe water chain, clean and safe handling and use of water collection utensils, cleaning and maintenance of water sources, soak pits and drainage channels.
• Increased handwashing with soap and water, improved cleanliness of facilities, fewer incidences of diseases like diarrhea.
• Formation of school health clubs which contribute to better sanitation and hygiene behavior among children.
• Extended knowledge and acquired skills like making their own reusable sanitary pads gives the girl child more confidence during menstrual cycles thus reducing absenteeism and school dropouts.
• Increased appreciation and understanding of fragile ecosystems, and sustainable use of ecosystems. For example, through adoption of sustainable agricultural practices like soil and water conservation, resulting in restoration of degraded farmlands and improvements in wetland inventory.
• Advocacy efforts contributing to increase in WASH budgets including community self-supply.
• Changed attitudes on the role of the community in management of water sources and WASH improvement activities. Change of mindset and transition from reliance on government to community self-help. With improved participation, communities are empowered to own and maintain water sources, more women taking up leadership roles in WASH activities leading to better payment of user fees, service delivery, better social behavior in WASH.
During the financial year, the USHA disseminated eight education policies related to WASH in school and worked on reproduction of six policies guiding household sanitation and hygiene to support capacity building and adequate implementation of WASH at the household level. The dissemination was cascaded from Ministry of Education and Sports (MOES) to the district Inspectors of Schools and grantees, and then from grantees to school-level stakeholders. This has bridged the policy awareness gap, with tangible results in all USHA-supported schools - There is increasing awareness of minimum standards and requirements of WASH by School Management Committees, Parent-Teachers Associations, administrators, and teachers. There is also increased community outreach by the School health committees (SHCs) and increased attention to the development and implementation of WASH in schools (WiS) improvement plans.

Uganda Water and Environment Sector Performance Report 2020
249
12.7 Research and Development (R&D) CSOs are still involved in the knowledge management agenda through Research and development (R&D). During FY 2019/20, 13 CSOs invested UGX 597million, to undertake R&D in the areas of fecal sludge management, functionality of water supply system, innovative technologies and water quality. The topics were:
(i) Water point mapping and water quality testing by HEWASA (ii) Improving Hand pump reliability through provision of real time data that facilitates quick response from
stake holders by Fields of Life (iii) Participatory assessment and documentation of wash service sustainability monitoring (score card) in
Kamwokya parish, Kampala central division and Kansanga parish in Makindye division by Environmental Alert
(iv) Are the intervention to ensure that the excluded people are included effective? By AMREF (v) District WASH Integrity by NETWWAS (vi) Biogas use in Bugiri and Namutumba district by UMURDA (vii) Citizens experiences of WASH amid COVID 19 by TWAWEZA (viii) Briquette Production in Kampala and Gulper 4 by Water for people (ix) Improving child health through chickens in rural Uganda by International lifeline fund (x) Effective demand and willingness to pay by OXFAM
The USHA developed the National Sanitation Marketing Strategy and WASH in School Infrastructure O&M Manual to sector actors in effective service delivery and planning for school WASH respectively. Both documents are yet to be institutionalized and disseminated Some of the research is still ongoing, particularly those related to functionality of water supply systems. The research on COVID 19 experiences indicates an increase in hand washing practice at critical times. Further, existing results indicate the potential for feacal sludge re-use to make briquettes and bio-gas, the Gulper 4 is an improvement to existing semi-mechanized emptiers that is still under development. Dissemination of key sectoral policy documents and WASH Monitoring and Evaluation at lower local government is weak and needs attention.
12.8 Cross cutting issues
12.8.1 Coordination and Collaboration Collaboration UWASNET and its members have prioritized collaboration as a key strategy to ensure effective and efficient WASH service delivery. The activities of the secretariat in section 1 and different sources of CSO financing are evidence to this. In addition, formal collaboration arrangements in the form of Memorandum of Understanding (MoUs) and partnerships and service contracts were also reported by several CSOs, as summarized in table 12-13. Major partners include District Local Government, CSOs like SNV for service contracts, World Food Program, Central Government and Private Sector. The collaboration is majorly on aspects of resource mobilization, planning, and implementation of activities.
Table12- 13: Summary of Collaboration Arrangements
Nature of arrangement MOU partnership Service contract other
No. of CSOs 38 24 12 8
In line with the strategy, there are efforts by CSOs to ensure their activities are reflected in district budgets / work plans. Figure 12-6 that summarizes the related performance reported by CSOs, shows a wide array of
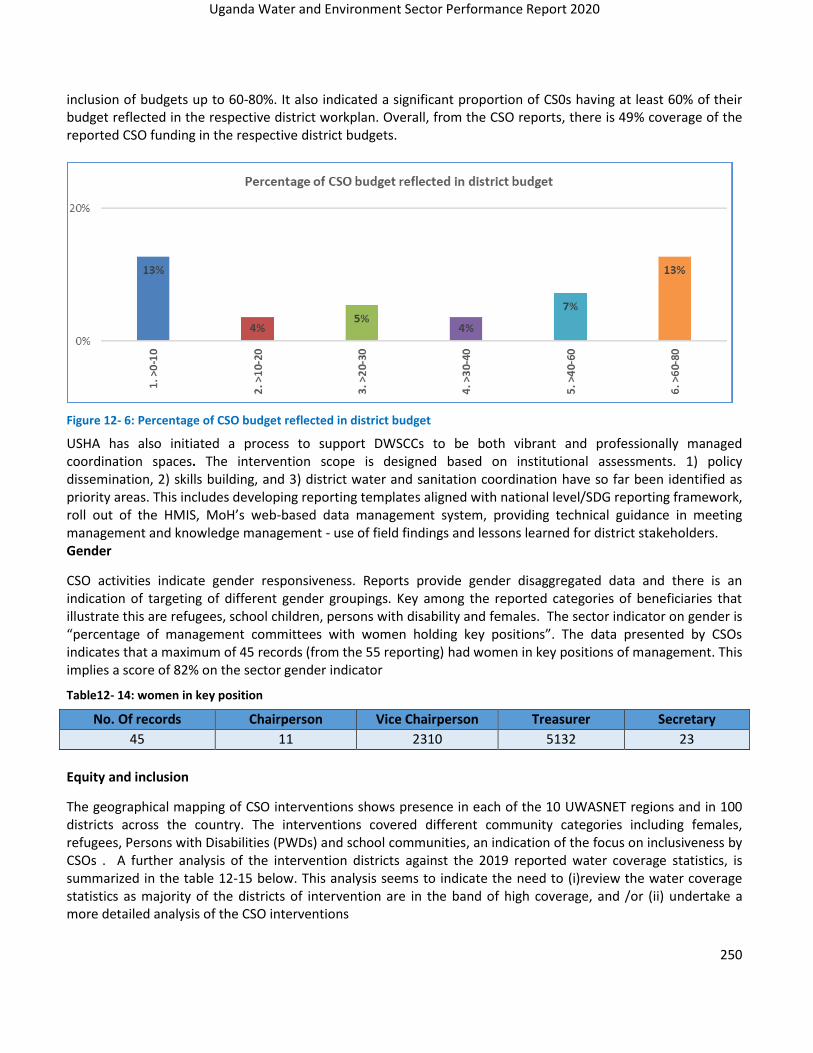
Uganda Water and Environment Sector Performance Report 2020
250
inclusion of budgets up to 60-80%. It also indicated a significant proportion of CS0s having at least 60% of their budget reflected in the respective district workplan. Overall, from the CSO reports, there is 49% coverage of the reported CSO funding in the respective district budgets.
Figure 12- 6: Percentage of CSO budget reflected in district budget
USHA has also initiated a process to support DWSCCs to be both vibrant and professionally managed coordination spaces. The intervention scope is designed based on institutional assessments. 1) policy dissemination, 2) skills building, and 3) district water and sanitation coordination have so far been identified as priority areas. This includes developing reporting templates aligned with national level/SDG reporting framework, roll out of the HMIS, MoH’s web-based data management system, providing technical guidance in meeting management and knowledge management - use of field findings and lessons learned for district stakeholders. Gender
CSO activities indicate gender responsiveness. Reports provide gender disaggregated data and there is an indication of targeting of different gender groupings. Key among the reported categories of beneficiaries that illustrate this are refugees, school children, persons with disability and females. The sector indicator on gender is “percentage of management committees with women holding key positions”. The data presented by CSOs indicates that a maximum of 45 records (from the 55 reporting) had women in key positions of management. This implies a score of 82% on the sector gender indicator
Table12- 14: women in key position
No. Of records Chairperson Vice Chairperson Treasurer Secretary
45 11 2310 5132 23
Equity and inclusion
The geographical mapping of CSO interventions shows presence in each of the 10 UWASNET regions and in 100 districts across the country. The interventions covered different community categories including females, refugees, Persons with Disabilities (PWDs) and school communities, an indication of the focus on inclusiveness by CSOs . A further analysis of the intervention districts against the 2019 reported water coverage statistics, is summarized in the table 12-15 below. This analysis seems to indicate the need to (i)review the water coverage statistics as majority of the districts of intervention are in the band of high coverage, and /or (ii) undertake a more detailed analysis of the CSO interventions

Uganda Water and Environment Sector Performance Report 2020
251
Table12- 15: Analysis of the intervention districts against 2019 reported safe water coverage
Coverage Color Code (%) No. Of Districts % of Total CSO intervention districts
Red (0 - 24) 0 0%
Orange (25-49) 11 11%
Yellow (50-74) 39 39%
Green (75-100) 50 50%
The formal collaborative arrangements (MoUs) with district Local governments are also expected to result in equitable service provision. Narrative under the different sections on CSO activities further illustrate the commitment to equity and inclusion, these include the gender disaggregated school and household latrines with provisions for persons with disability (PWD) and Menstrual hygiene management at school. Details in individual CSO reports reiterate this and note that, females are given leadership roles on management committees formed, for example for water sources (WUC), school health clubs, water source management, several household latrines were constructed for persons with special needs in Palabek settlement (Zone 1 &5B) and school latrine stances reported for PWDS, consideration of marginalised community categories like the disabled, elders, women during micro catchment committee formation. Use of participatory and inclusive planning approaches like the clustering approach (UMOJA) that ensures that no one is left behind in WASH service provision. HIV/AIDs
CSOs acknowledge the close link and inter-relationship between HIV/AIDs and WASH as illustrated from the reported training and advocacy events. The community engagement activities had a core focus on HIV/AIDs. It is reported that HIV-Aids was a topic of discussion in the Advocacy and good governance activities, undertaken by CSOs this year.
12.9 Progress on recommendations from last NGO report and identified critical sector issues
Below is a summary on progress made towards recommendations in CSO report for the FY2018/19, and further recommendations to be addressed by the Sector (i) Sector Financing
UWASNET advocated for increased support to UWASNET to enhance member coordination and to align their planning, implementation and reporting to sector priorities and guidelines. Significant progress has been made towards this as noted by the increasing resource mobilization to the UWASNET secretariat that has facilitated and more policy engagement especially during the COVID-19 pandemic response
(ii) Implementation models
CSOs continue to be key players in the development of models to improve WASH service delivery. The contribution by Whave solutions to functionality of point water sources through innovative approaches and Water for people’s interventions in sector financing and improved fecal sludge semi-mechanized emptying equipment (gulpers) are key examples
(iii) Refugee response
The recommended mainstreaming of comprehensive refugee response framework has started to take root with key sector actors involved in its realization. More support is called upon by sector players to support UWASNET effectively coordinate and promote sector guidelines amongst the CSOs implementing in the Refugee Context.

Uganda Water and Environment Sector Performance Report 2020
252
(iv) Access to Water
The need to address the gap in rural water access was prioritized with significant investment by CSOs and the MWE in boreholes and solar powered piped water systems.
(v) Addressing Equity gaps
CSOs recommended a reliable information base, to inform targeting of service delivery and thus address existing inequities. Several efforts in the sector are acknowledged and these include the Water atlas, with further assessment who are the underserved nationally to assist with the targeting and resource mobilization. UWASNET member mapping exercise also contributes to realization of this recommendation through it highlights areas that need more WASH service delivery/providers (including CSOs).
(vi) Institutional home for Sanitation
CSOs recommended definition of a clear and practical operational framework to allow for the desired improvements in school sanitation. Conversations to this end are ongoing in the sector
(vii) Subsidy for sanitation
The proposed review of the household sanitation subsidy policy in order to attain the NDP III goal of inclusive growth is yet to be addressed. This notwithstanding, sector players like USHA have tried through strengthening the sanitation market chain to make toilet construction affordable and thus address the sanitation coverage gaps
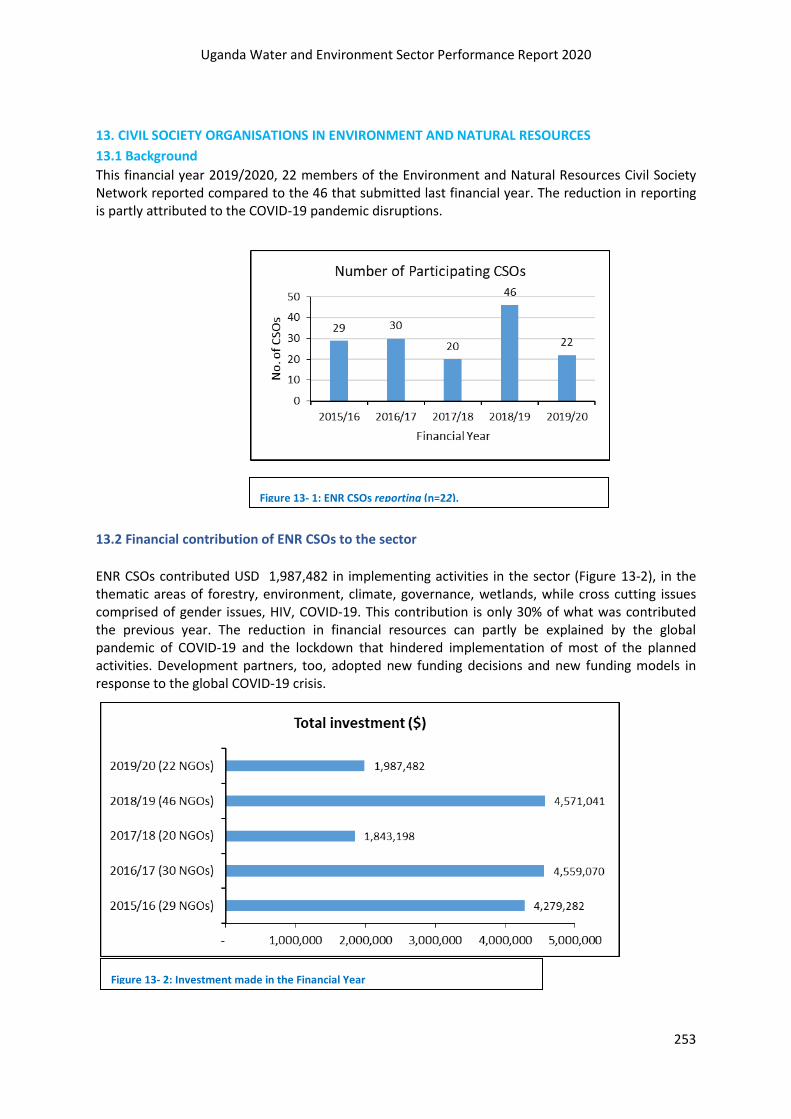
Uganda Water and Environment Sector Performance Report 2020
253
Figure 13- 1: ENR CSOs reporting (n=22).
13. CIVIL SOCIETY ORGANISATIONS IN ENVIRONMENT AND NATURAL RESOURCES
13.1 Background
This financial year 2019/2020, 22 members of the Environment and Natural Resources Civil Society Network reported compared to the 46 that submitted last financial year. The reduction in reporting is partly attributed to the COVID-19 pandemic disruptions.
13.2 Financial contribution of ENR CSOs to the sector
ENR CSOs contributed USD 1,987,482 in implementing activities in the sector (Figure 13-2), in the thematic areas of forestry, environment, climate, governance, wetlands, while cross cutting issues comprised of gender issues, HIV, COVID-19. This contribution is only 30% of what was contributed the previous year. The reduction in financial resources can partly be explained by the global pandemic of COVID-19 and the lockdown that hindered implementation of most of the planned activities. Development partners, too, adopted new funding decisions and new funding models in response to the global COVID-19 crisis.
Figure 13- 2: Investment made in the Financial Year
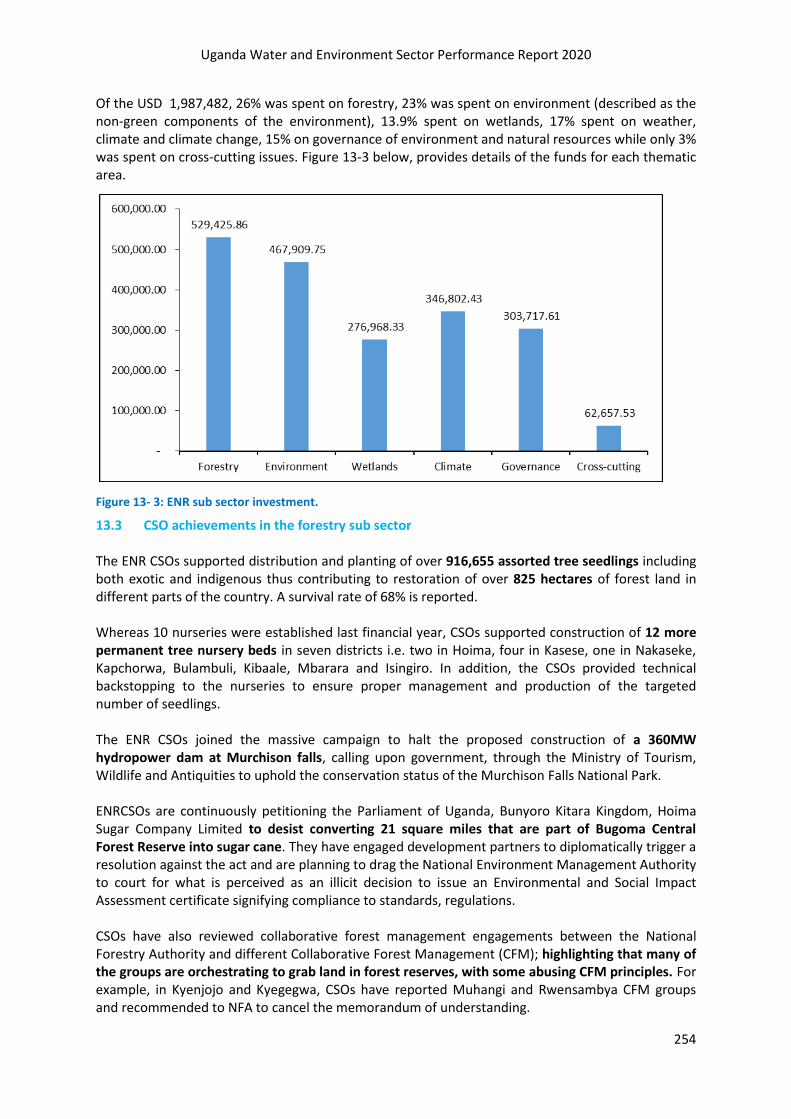
Uganda Water and Environment Sector Performance Report 2020
254
Of the USD 1,987,482, 26% was spent on forestry, 23% was spent on environment (described as the non-green components of the environment), 13.9% spent on wetlands, 17% spent on weather, climate and climate change, 15% on governance of environment and natural resources while only 3% was spent on cross-cutting issues. Figure 13-3 below, provides details of the funds for each thematic area.
Figure 13- 3: ENR sub sector investment.
13.3 CSO achievements in the forestry sub sector The ENR CSOs supported distribution and planting of over 916,655 assorted tree seedlings including both exotic and indigenous thus contributing to restoration of over 825 hectares of forest land in different parts of the country. A survival rate of 68% is reported. Whereas 10 nurseries were established last financial year, CSOs supported construction of 12 more permanent tree nursery beds in seven districts i.e. two in Hoima, four in Kasese, one in Nakaseke, Kapchorwa, Bulambuli, Kibaale, Mbarara and Isingiro. In addition, the CSOs provided technical backstopping to the nurseries to ensure proper management and production of the targeted number of seedlings. The ENR CSOs joined the massive campaign to halt the proposed construction of a 360MW hydropower dam at Murchison falls, calling upon government, through the Ministry of Tourism, Wildlife and Antiquities to uphold the conservation status of the Murchison Falls National Park. ENRCSOs are continuously petitioning the Parliament of Uganda, Bunyoro Kitara Kingdom, Hoima Sugar Company Limited to desist converting 21 square miles that are part of Bugoma Central Forest Reserve into sugar cane. They have engaged development partners to diplomatically trigger a resolution against the act and are planning to drag the National Environment Management Authority to court for what is perceived as an illicit decision to issue an Environmental and Social Impact Assessment certificate signifying compliance to standards, regulations. CSOs have also reviewed collaborative forest management engagements between the National Forestry Authority and different Collaborative Forest Management (CFM); highlighting that many of the groups are orchestrating to grab land in forest reserves, with some abusing CFM principles. For example, in Kyenjojo and Kyegegwa, CSOs have reported Muhangi and Rwensambya CFM groups and recommended to NFA to cancel the memorandum of understanding.
Uganda Water and Environment Sector Performance Report 2020
255
A number of capacity building initiatives have been undertaken as described below:
i) In the Mount Elgon region, Collaborative Forest Management (CFM) groups and Water and Sanitation Committees (WSC) have been supported with tree seedlings for river bank protection in Bukalasi and Bushiyi sub counties. The capacity building included understanding of gender, leadership and conflict management and their implications for forests and water resources management.
ii) Within the same region, 782 people (57% women) participated in training sessions on
selected Ecosystem based Adaptation (EBA) measures namely; soil and water conservation, river bank restoration in Sipi-Chebonet and Atari-Kaptokwoi micro catchments in Kapchorwa district, with the intention to enhance community resilience to Climate Change. As a result, 10,925 metres of contour bunds were established in Chema Sub County in Sipi-Chebonet micro catchment; 130 hectares of land has been covered with soil and water conservation structures.
iii) Community Based Monitors (CBMs), 32 males and 13 female, have been trained and
supported to conduct surveillance and report forestry related illegalities, particularly illegal harvesting of Vitellaria paradoxa (Shea nut) trees in Otuke district. At least 10 cases of illegal harvesting have been reported, and those involved prosecuted. Forestry Practitioners (300 vocational students, 6 teachers and 150 farmers) were offered a one-year training in basic agroforestry practices and as a result six (06) agroforestry test fields have been established for agroforestry related learning and research.
iv) v) Forty (40) ENR CSOs and Climate Action Network Uganda (CAN-U) members were trained in
forest valuation and certification; equipping them with skills to analyse the economic value of Uganda’s forest resources and utilising forest certification as a tool for forest resources management.
Communities managing three Community Forests of Rwentumba, Sibba and Sonso in Budongo Sub-county, Masindi District were supported to open boundaries, establish Communal Land Associations in a bid to secure tenure that guarantees their involvement in restoration. A total of 250ha of forest was secured for community forestry management. Forest Management Plans for the three forests were developed while validation of six (06) forest management plans Bineneza, Kaitampiisi, Kyamasuka, Rwentumba, Siiba and Sonso was also undertaken. A review process for Forest Management Plans for Ongo, Alimugonza, Tengele and Motokai which had reached the expiry stage has commenced. 13.4 CSO achievements in the environment sub sector The ENR CSOs established a platform for sustainable commercial agriculture focusing on tobacco and sugarcane value chains. A rapid assessment was undertaken to establish the status in respect to existing practices, community organization and engagement with the private sector. Over 30 selected out-growers (for sugar in Masindi) and 56 contract/licensed farmers (for tobacco in Nwoya) were trained on sustainable and green economy approaches to production. ENR CSOs facilitated a two day dialogue meeting on inclusive green growth for Albertine leaders, in Fort Portal. The meeting brought together 47 participants including 12 women to deliberate on green growth, including reflecting on Fort Portal as a potential candidate as a green tourism city.

Uganda Water and Environment Sector Performance Report 2020
256
Through their efforts to increase access to renewable energy alternatives, the ENR CSOs supported 2,650 households with charcoal briquettes and energy efficient Lorena cook stoves. In addition, the CSOs supported construction of over 740 energy saving cook-stoves for households in Lake Victoria basin. Traders in Otuke town were guided to improve waste management practices and supported to establish a dumping site for the first time and started to hold meetings with traders on waste management in urban areas. In addition, ENR CSOs supported the process of recycling 15 tons of plastic waste to explore opportunities for non-state actors in the waste management value chain in Uganda. As part of the waste management sensitization drive, CSOs participated in various general clean up exercise (such as in Kasokoso village) through sorted garbage collection The ENR CSOs supported the Directorate of Geological Survey and Mines to organize a Karamoja regional consultative meeting for the Mining and Minerals Bill 2019. The consultation involved 159 participants including 66 women and generated issues on formalization of artisanal small-scale miners and observation of environmental protection. The ENR CSOs supported five KCCA schools to organise writing competitions and establish talking compounds and toilet walls for purposes of advancing awareness creation on water, sanitation and hygiene among pupils and students. 13.5 CSO achievements in the wetlands sub sector Together with MWE, CSOs commemorated the annual Wetlands Celebrations on 2nd February 2020 in Pallisa District, highlighting best practices for wise use, creative use and sustainable use. ENR CSO have supported the process for the draft national wetlands policy and wetlands bill; holding stakeholder engagement and consultations in four regions of northern, central, south western and eastern Uganda. The two are at advanced stages of completion. Out of this engagement, MWE and MoLHUD have been able to cancel 300 land tiles located in wetlands. A study on the impacts of rising water levels on wetlands in Lake Victoria reinforced earlier views surrounding the fears on increased encroachment on wetlands. Similarly, CSOs advanced the inclusion of provisions for the protection of sacred natural sites into policy and bill Civil society have utilized the presidential directive to evict encroachers in wetlands to engage communities; supported communities to develop wetland management guidelines, form wetland management committees and demarcate wetlands. For example, Te abala wetland management committee demarcated 30 kilometers of the Te-abala wetland in Otuke district and refugee settlements marked boundaries of the wetland. CSOs facilitated the formation of five wetland management committees in the four wetland systems of Ogwette, Kapeta, Karenga and Unyama in Aswa catchment. As a result, 1,500 ha of degraded wetlands have been restored, with installation of concrete pillars at the highest water mark of the wetland, in some instances bamboo seedlings were planted at an interval of 5 meters in between the concrete pillars.

Uganda Water and Environment Sector Performance Report 2020
257
Photo13- 1: Refugees participating in the demarcation of Kakoni Wetland in Kyaka II refugee settlement.
13.6 Weather, Climate and Climate Change The ENR CSOs supported the process to fast track completion of the Climate Change Bill in a number of ways. Key among these were; dialogues with the Parliamentary Forum on Climate Change and the national and regional consultative meetings to solicit for input into the climate change bill. Over 200 institutions presented issues and recommendations for redress and consideration in bill. The Bill has been presented to parliament for the first reading.
CSOs participated in processes leading to COP 25. These included organizing the Pre-COP 25 meetings to inform the country on readiness of the negotiators and develop a CSOs position paper, including a joint CSO dossier for COP 25. The meeting served to reflect on implementation of the Green Growth Development Strategy.
CSOs undertook tracking of adaptation financial flows from 2013 to 2017. A total of 21 big projects were assessed and findings revealed that only 54 percent of reported climate finance flows from 2013 to 2017 was adaptation related. Throughout the whole assessment process, capacity of over 37 actors including 11 women was built in Adaptation Finance Tracking using the Multilateral Development Bank Tool and OECD Rio Makers.
CSOs organized a joint Climate Change Side Event at the 64th Commonwealth Parliamentary Conference resolving to plant 500 million trees, spearheaded by the Speaker of Parliament.
CSOs have negotiated increased adoption of climate indicators by sectors and prioritization of the Standard National Climate Change Indicators for Program Based Budgeting System (PBS).
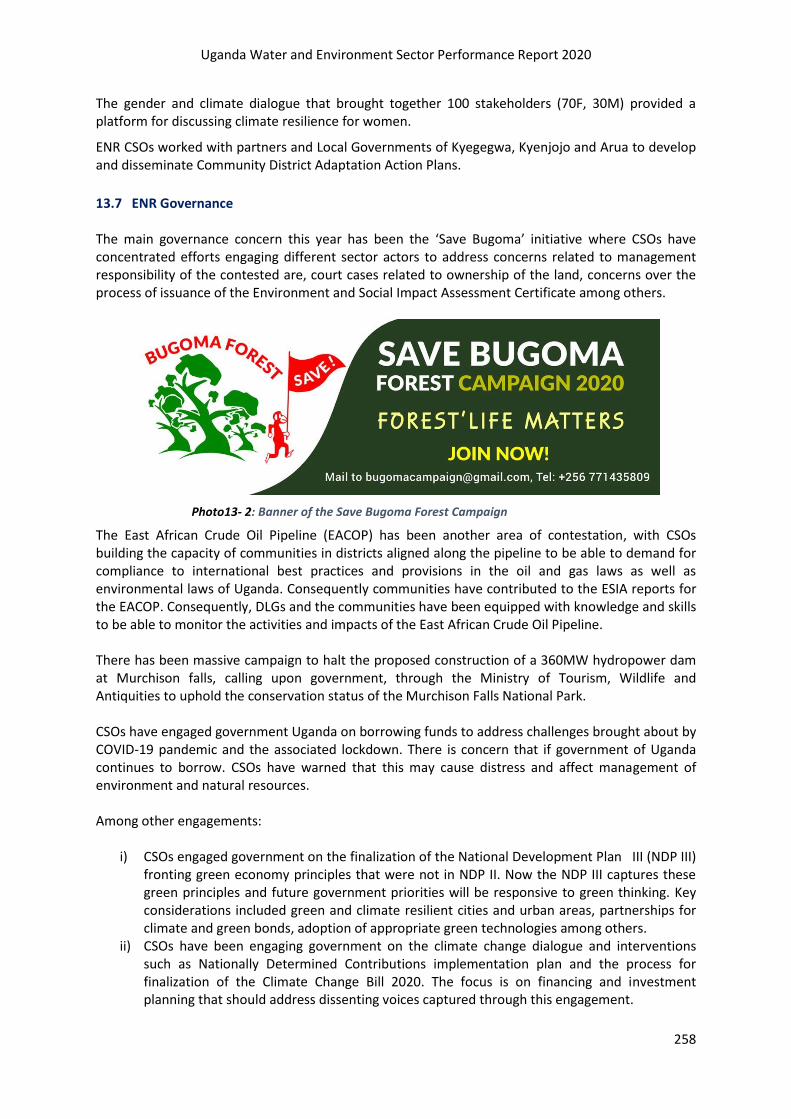
Uganda Water and Environment Sector Performance Report 2020
258
The gender and climate dialogue that brought together 100 stakeholders (70F, 30M) provided a platform for discussing climate resilience for women.
ENR CSOs worked with partners and Local Governments of Kyegegwa, Kyenjojo and Arua to develop and disseminate Community District Adaptation Action Plans.
13.7 ENR Governance The main governance concern this year has been the ‘Save Bugoma’ initiative where CSOs have concentrated efforts engaging different sector actors to address concerns related to management responsibility of the contested are, court cases related to ownership of the land, concerns over the process of issuance of the Environment and Social Impact Assessment Certificate among others.
Photo13- 2: Banner of the Save Bugoma Forest Campaign
The East African Crude Oil Pipeline (EACOP) has been another area of contestation, with CSOs building the capacity of communities in districts aligned along the pipeline to be able to demand for compliance to international best practices and provisions in the oil and gas laws as well as environmental laws of Uganda. Consequently communities have contributed to the ESIA reports for the EACOP. Consequently, DLGs and the communities have been equipped with knowledge and skills to be able to monitor the activities and impacts of the East African Crude Oil Pipeline. There has been massive campaign to halt the proposed construction of a 360MW hydropower dam at Murchison falls, calling upon government, through the Ministry of Tourism, Wildlife and Antiquities to uphold the conservation status of the Murchison Falls National Park. CSOs have engaged government Uganda on borrowing funds to address challenges brought about by COVID-19 pandemic and the associated lockdown. There is concern that if government of Uganda continues to borrow. CSOs have warned that this may cause distress and affect management of environment and natural resources. Among other engagements:
i) CSOs engaged government on the finalization of the National Development Plan III (NDP III) fronting green economy principles that were not in NDP II. Now the NDP III captures these green principles and future government priorities will be responsive to green thinking. Key considerations included green and climate resilient cities and urban areas, partnerships for climate and green bonds, adoption of appropriate green technologies among others.
ii) CSOs have been engaging government on the climate change dialogue and interventions such as Nationally Determined Contributions implementation plan and the process for finalization of the Climate Change Bill 2020. The focus is on financing and investment planning that should address dissenting voices captured through this engagement.

Uganda Water and Environment Sector Performance Report 2020
259
iii) CSOs had an opportunity to work with government to review the wetland policy and draft and associated wetlands bill.
iv) There is an opportunity to engage on the review process for forestry policy and the forest act. Current engagements on these policies and laws are in line with green economy responsiveness but also address new issues such as carbon credit tenure, forest certification, import and export of timber (and the associated standards).
v) There is mileage gained in terms of influencing political agenda, exemplified by presidential directive on eviction from wetlands. Law enforcement teams within the Ministry of Water and Environment have rolled out plans to implement the directive amidst contestation by the rich and politically positioned actors who have investments in areas reclaimed from wetland status. These will require further engagements.
vi) CSOs have engaged the directorate of budgets ministry of finance and there is willingness to increase the budget for green actions. There is expressed intention to strengthen expenditure tracking, inspection and accountability on green growth. Actualization of this willingness requires constant engagement as government priorities drift depending on situations. For example, there have been diversions of funds towards fighting the COVID-19 pandemic.
vii) On agro-commodities, CSOs continue to warn that Uganda is at a risk of losing its natural capital if concerns related to land uptake for agro-commodities is not addressed. Key among these commodities is oil palm (in Kalangala and Buvuma and the planned expansion into Mayuge), sugar cane (in Bugoma, Atiak and Lamwo), and tobacco in northern Uganda and tea in south western Uganda among others.
13.8 Research studies/ surveys ENR CSOs have participated in executing the following studies/ surveys and or publications.
Table 13- 1: ENR related studies executed
Sub sector Research study/ survey/ publication Organization
Forestry
Policies and practices for enhancing co-benefits from joint forest and water conservation”, observing the changes in qualities and quantities of natural resources.
AUPWAE
Developing Shea value chain for Wealth Creation in Aswa Catchment, Northern Uganda”, lessons and success in the Shea value chain.
IUCN
A review of the Agoro-Agu Sector CFRs Management Plan covering 17 CFRs uing a landscape approach
IUCN
Analyzing the current status, challenges and opportunities for advancing private sector investment in sustainable biomass production within the central forest reserves and forestry landscapes.
Environmental Alert
Development of Agroforestry curriculum for training vocational students in three pilot institutions and development of "Good Agroforestry Practices" (GAP) Training Manual for farmer and community trainings.
Fair ventures world wide
Unlocking the Rwizi Catchment Plan to support operationalization of the Catchment-based Water Resources Management (CbWRM) as well as Integrated Water Resources Management (IWRM).
ACODE and Tree Talk Plus
Weather, Climate, and climate change
Technical study on tracking adaptation finance in Uganda from 2013-2016. EMLI
A study on climate risk and vulnerability for women, girls and small holder farmers among pastoralist communities. A policy brief was developed and disseminated among the key stake holders.
CARE Uganda
Capacity Needs Assessment of District Local Governments, Sub-County Local Governments and non-state actors with respect to building climate resilience and strengthening women and youth inclusion in the governance of Uganda’s natural resources
ACODE and Environmental Alert
Strengthening Climate Resilience through Integration of Climate Change, Women and Youth Issues in Uganda's Agriculture Sector: Analysis of Agriculture Related Policies and Programme Study
ACODE
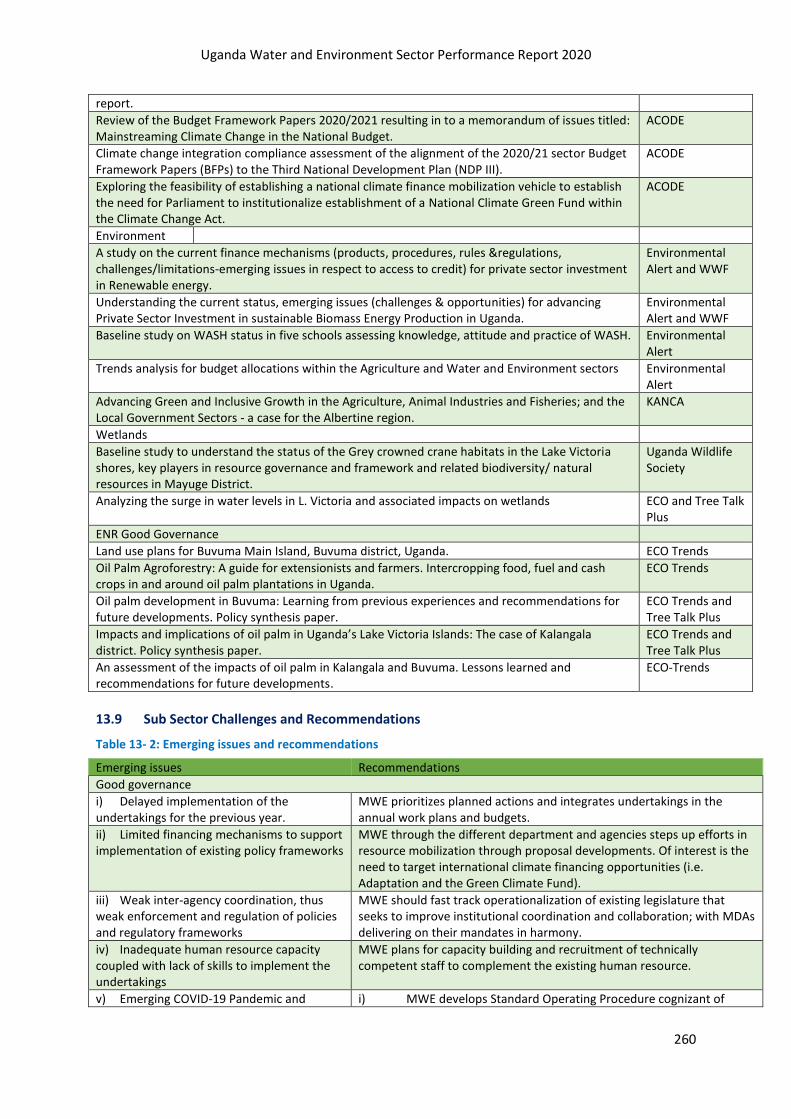
Uganda Water and Environment Sector Performance Report 2020
260
report.
Review of the Budget Framework Papers 2020/2021 resulting in to a memorandum of issues titled: Mainstreaming Climate Change in the National Budget.
ACODE
Climate change integration compliance assessment of the alignment of the 2020/21 sector Budget Framework Papers (BFPs) to the Third National Development Plan (NDP III).
ACODE
Exploring the feasibility of establishing a national climate finance mobilization vehicle to establish the need for Parliament to institutionalize establishment of a National Climate Green Fund within the Climate Change Act.
ACODE
Environment
A study on the current finance mechanisms (products, procedures, rules ®ulations, challenges/limitations-emerging issues in respect to access to credit) for private sector investment in Renewable energy.
Environmental Alert and WWF
Understanding the current status, emerging issues (challenges & opportunities) for advancing Private Sector Investment in sustainable Biomass Energy Production in Uganda.
Environmental Alert and WWF
Baseline study on WASH status in five schools assessing knowledge, attitude and practice of WASH. Environmental Alert
Trends analysis for budget allocations within the Agriculture and Water and Environment sectors Environmental Alert
Advancing Green and Inclusive Growth in the Agriculture, Animal Industries and Fisheries; and the Local Government Sectors - a case for the Albertine region.
KANCA
Wetlands
Baseline study to understand the status of the Grey crowned crane habitats in the Lake Victoria shores, key players in resource governance and framework and related biodiversity/ natural resources in Mayuge District.
Uganda Wildlife Society
Analyzing the surge in water levels in L. Victoria and associated impacts on wetlands ECO and Tree Talk Plus
ENR Good Governance
Land use plans for Buvuma Main Island, Buvuma district, Uganda. ECO Trends
Oil Palm Agroforestry: A guide for extensionists and farmers. Intercropping food, fuel and cash crops in and around oil palm plantations in Uganda.
ECO Trends
Oil palm development in Buvuma: Learning from previous experiences and recommendations for future developments. Policy synthesis paper.
ECO Trends and Tree Talk Plus
Impacts and implications of oil palm in Uganda’s Lake Victoria Islands: The case of Kalangala district. Policy synthesis paper.
ECO Trends and Tree Talk Plus
An assessment of the impacts of oil palm in Kalangala and Buvuma. Lessons learned and recommendations for future developments.
ECO-Trends
13.9 Sub Sector Challenges and Recommendations
Table 13- 2: Emerging issues and recommendations
Emerging issues Recommendations
Good governance
i) Delayed implementation of the undertakings for the previous year.
MWE prioritizes planned actions and integrates undertakings in the annual work plans and budgets.
ii) Limited financing mechanisms to support implementation of existing policy frameworks
MWE through the different department and agencies steps up efforts in resource mobilization through proposal developments. Of interest is the need to target international climate financing opportunities (i.e. Adaptation and the Green Climate Fund).
iii) Weak inter-agency coordination, thus weak enforcement and regulation of policies and regulatory frameworks
MWE should fast track operationalization of existing legislature that seeks to improve institutional coordination and collaboration; with MDAs delivering on their mandates in harmony.
iv) Inadequate human resource capacity coupled with lack of skills to implement the undertakings
MWE plans for capacity building and recruitment of technically competent staff to complement the existing human resource.
v) Emerging COVID-19 Pandemic and i) MWE develops Standard Operating Procedure cognizant of
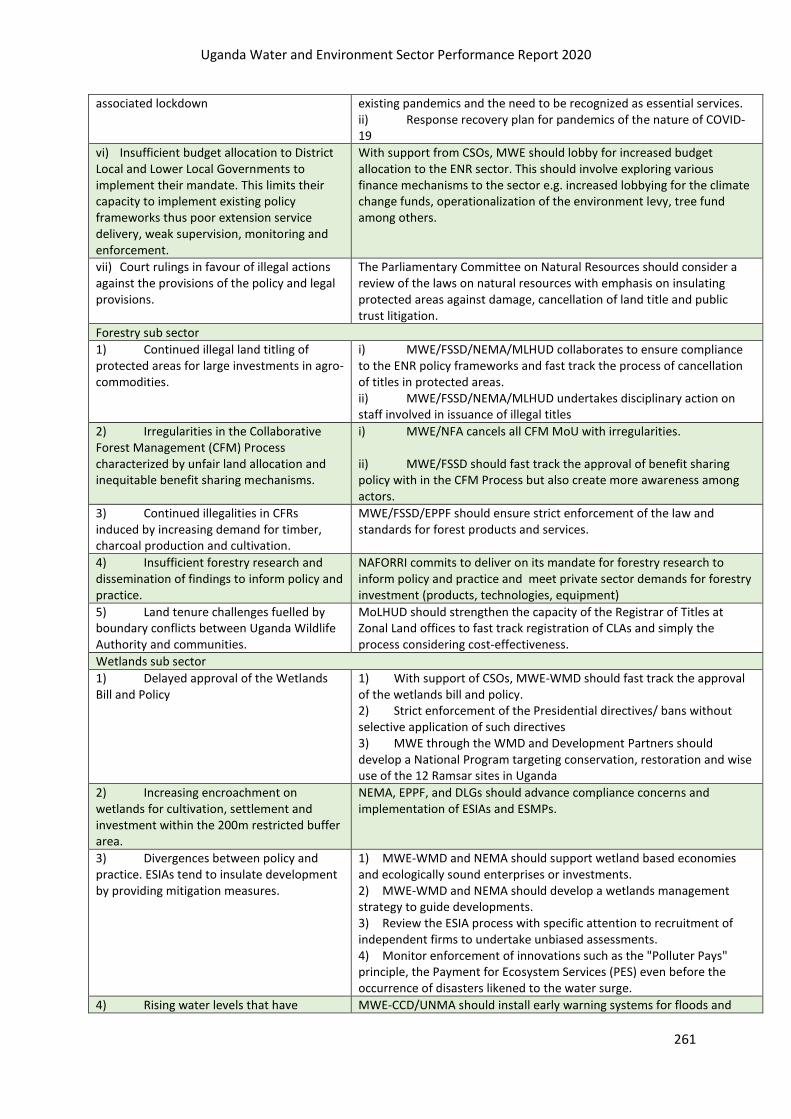
Uganda Water and Environment Sector Performance Report 2020
261
associated lockdown existing pandemics and the need to be recognized as essential services. ii) Response recovery plan for pandemics of the nature of COVID-19
vi) Insufficient budget allocation to District Local and Lower Local Governments to implement their mandate. This limits their capacity to implement existing policy frameworks thus poor extension service delivery, weak supervision, monitoring and enforcement.
With support from CSOs, MWE should lobby for increased budget allocation to the ENR sector. This should involve exploring various finance mechanisms to the sector e.g. increased lobbying for the climate change funds, operationalization of the environment levy, tree fund among others.
vii) Court rulings in favour of illegal actions against the provisions of the policy and legal provisions.
The Parliamentary Committee on Natural Resources should consider a review of the laws on natural resources with emphasis on insulating protected areas against damage, cancellation of land title and public trust litigation.
Forestry sub sector
1) Continued illegal land titling of protected areas for large investments in agro-commodities.
i) MWE/FSSD/NEMA/MLHUD collaborates to ensure compliance to the ENR policy frameworks and fast track the process of cancellation of titles in protected areas. ii) MWE/FSSD/NEMA/MLHUD undertakes disciplinary action on staff involved in issuance of illegal titles
2) Irregularities in the Collaborative Forest Management (CFM) Process characterized by unfair land allocation and inequitable benefit sharing mechanisms.
i) MWE/NFA cancels all CFM MoU with irregularities. ii) MWE/FSSD should fast track the approval of benefit sharing policy with in the CFM Process but also create more awareness among actors.
3) Continued illegalities in CFRs induced by increasing demand for timber, charcoal production and cultivation.
MWE/FSSD/EPPF should ensure strict enforcement of the law and standards for forest products and services.
4) Insufficient forestry research and dissemination of findings to inform policy and practice.
NAFORRI commits to deliver on its mandate for forestry research to inform policy and practice and meet private sector demands for forestry investment (products, technologies, equipment)
5) Land tenure challenges fuelled by boundary conflicts between Uganda Wildlife Authority and communities.
MoLHUD should strengthen the capacity of the Registrar of Titles at Zonal Land offices to fast track registration of CLAs and simply the process considering cost-effectiveness.
Wetlands sub sector
1) Delayed approval of the Wetlands Bill and Policy
1) With support of CSOs, MWE-WMD should fast track the approval of the wetlands bill and policy. 2) Strict enforcement of the Presidential directives/ bans without selective application of such directives 3) MWE through the WMD and Development Partners should develop a National Program targeting conservation, restoration and wise use of the 12 Ramsar sites in Uganda
2) Increasing encroachment on wetlands for cultivation, settlement and investment within the 200m restricted buffer area.
NEMA, EPPF, and DLGs should advance compliance concerns and implementation of ESIAs and ESMPs.
3) Divergences between policy and practice. ESIAs tend to insulate development by providing mitigation measures.
1) MWE-WMD and NEMA should support wetland based economies and ecologically sound enterprises or investments. 2) MWE-WMD and NEMA should develop a wetlands management strategy to guide developments. 3) Review the ESIA process with specific attention to recruitment of independent firms to undertake unbiased assessments. 4) Monitor enforcement of innovations such as the "Polluter Pays" principle, the Payment for Ecosystem Services (PES) even before the occurrence of disasters likened to the water surge.
4) Rising water levels that have MWE-CCD/UNMA should install early warning systems for floods and
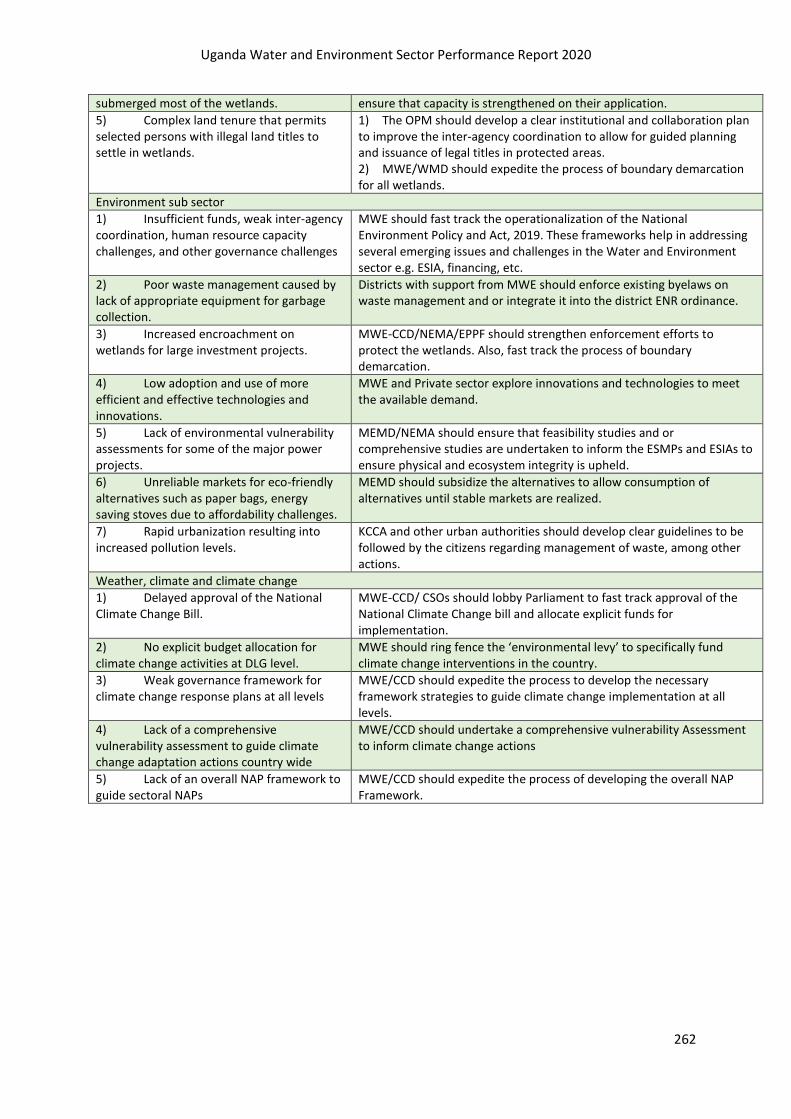
Uganda Water and Environment Sector Performance Report 2020
262
submerged most of the wetlands. ensure that capacity is strengthened on their application.
5) Complex land tenure that permits selected persons with illegal land titles to settle in wetlands.
1) The OPM should develop a clear institutional and collaboration plan to improve the inter-agency coordination to allow for guided planning and issuance of legal titles in protected areas. 2) MWE/WMD should expedite the process of boundary demarcation for all wetlands.
Environment sub sector
1) Insufficient funds, weak inter-agency coordination, human resource capacity challenges, and other governance challenges
MWE should fast track the operationalization of the National Environment Policy and Act, 2019. These frameworks help in addressing several emerging issues and challenges in the Water and Environment sector e.g. ESIA, financing, etc.
2) Poor waste management caused by lack of appropriate equipment for garbage collection.
Districts with support from MWE should enforce existing byelaws on waste management and or integrate it into the district ENR ordinance.
3) Increased encroachment on wetlands for large investment projects.
MWE-CCD/NEMA/EPPF should strengthen enforcement efforts to protect the wetlands. Also, fast track the process of boundary demarcation.
4) Low adoption and use of more efficient and effective technologies and innovations.
MWE and Private sector explore innovations and technologies to meet the available demand.
5) Lack of environmental vulnerability assessments for some of the major power projects.
MEMD/NEMA should ensure that feasibility studies and or comprehensive studies are undertaken to inform the ESMPs and ESIAs to ensure physical and ecosystem integrity is upheld.
6) Unreliable markets for eco-friendly alternatives such as paper bags, energy saving stoves due to affordability challenges.
MEMD should subsidize the alternatives to allow consumption of alternatives until stable markets are realized.
7) Rapid urbanization resulting into increased pollution levels.
KCCA and other urban authorities should develop clear guidelines to be followed by the citizens regarding management of waste, among other actions.
Weather, climate and climate change
1) Delayed approval of the National Climate Change Bill.
MWE-CCD/ CSOs should lobby Parliament to fast track approval of the National Climate Change bill and allocate explicit funds for implementation.
2) No explicit budget allocation for climate change activities at DLG level.
MWE should ring fence the ‘environmental levy’ to specifically fund climate change interventions in the country.
3) Weak governance framework for climate change response plans at all levels
MWE/CCD should expedite the process to develop the necessary framework strategies to guide climate change implementation at all levels.
4) Lack of a comprehensive vulnerability assessment to guide climate change adaptation actions country wide
MWE/CCD should undertake a comprehensive vulnerability Assessment to inform climate change actions
5) Lack of an overall NAP framework to guide sectoral NAPs
MWE/CCD should expedite the process of developing the overall NAP Framework.

Uganda Water and Environment Sector Performance Report 2020
263
14. GOOD GOVERNANCE IN WATER AND ENVIRONMENT
14.1 Monitoring governance in the water and sanitation sub-sector
There are 10 governance indicators whose analysis of performance focuses on the Governance principles of Accountability, Transparrency and Participation. The indicators are evaluated annually and measures that will aim at improving the results of these indicators will be drafted in the Updated Good Governance Action Plan and sector undertakings where necessary. This Monitoring Framework also supports the Civil Society and Development Partners in targeting their support to most critical areas of governance in the sector. The performance of the respective indicators monitored this FY2019/2020 is reported hereunder.
Table 14- 1: Performance of Governance Indicator
Indicator Principle Entity Target Performance
2019/20 2019/20 2018/19
2017/18
2016/17
1 % Implementation of the previous year´s audit recommendations of financial statements
Accountable to audit office and its recommendations
MWE 100% 86% 88% N/A N/A
NWSC 100% 95% 91% 85.7% 91.5%
2 % of pro-poor facilities that provide water at a price less than or equal to the household tariff of the service area
Equity and inclusive water provision to the poor
NWSC 100 37% Not yet reported on.
83 79
Small towns
31% 38 N/A
3 NWSC´s Customer Satisfaction Index
Transparency to customers
NWSC 86% 77% 86% 85% 84%
4 Percentage of gazetted water authorities and districts whose performance is published annually by the Regulation body
Transparency of gazetted water schemes and districts
WURD 100% 60% 41% 56 DNYF
5 % of water for production facilities with actively functioning Water User Committees
Participation of users in the management of WfP facilities
WFP facilities
100% 88% 84% 84% 82%
71% 70%
6 % of permit holders complying with permit conditions
Accountability of permit holders to permit conditions
WRM 100% 76.6 59% DNFY 72%
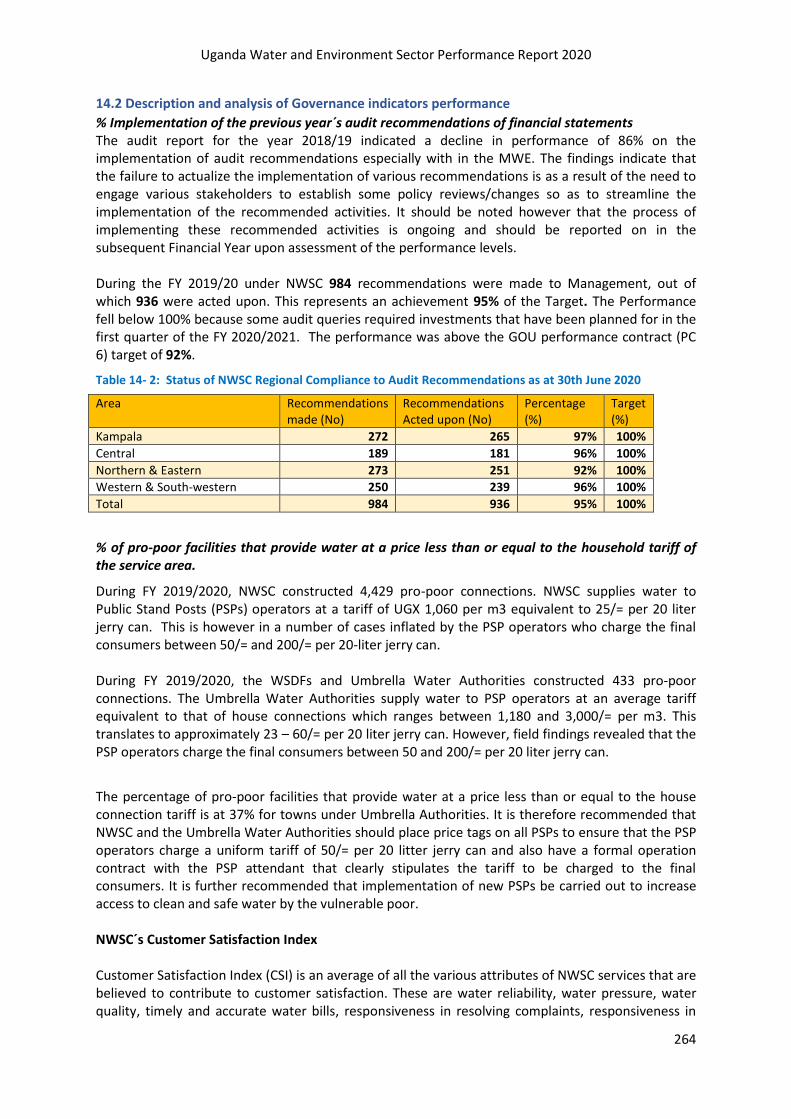
Uganda Water and Environment Sector Performance Report 2020
264
14.2 Description and analysis of Governance indicators performance
% Implementation of the previous year´s audit recommendations of financial statements The audit report for the year 2018/19 indicated a decline in performance of 86% on the implementation of audit recommendations especially with in the MWE. The findings indicate that the failure to actualize the implementation of various recommendations is as a result of the need to engage various stakeholders to establish some policy reviews/changes so as to streamline the implementation of the recommended activities. It should be noted however that the process of implementing these recommended activities is ongoing and should be reported on in the subsequent Financial Year upon assessment of the performance levels. During the FY 2019/20 under NWSC 984 recommendations were made to Management, out of which 936 were acted upon. This represents an achievement 95% of the Target. The Performance fell below 100% because some audit queries required investments that have been planned for in the first quarter of the FY 2020/2021. The performance was above the GOU performance contract (PC 6) target of 92%.
Table 14- 2: Status of NWSC Regional Compliance to Audit Recommendations as at 30th June 2020
Area Recommendations made (No)
Recommendations Acted upon (No)
Percentage (%)
Target (%)
Kampala 272 265 97% 100%
Central 189 181 96% 100%
Northern & Eastern 273 251 92% 100%
Western & South-western 250 239 96% 100%
Total 984 936 95% 100%
% of pro-poor facilities that provide water at a price less than or equal to the household tariff of the service area.
During FY 2019/2020, NWSC constructed 4,429 pro-poor connections. NWSC supplies water to Public Stand Posts (PSPs) operators at a tariff of UGX 1,060 per m3 equivalent to 25/= per 20 liter jerry can. This is however in a number of cases inflated by the PSP operators who charge the final consumers between 50/= and 200/= per 20-liter jerry can. During FY 2019/2020, the WSDFs and Umbrella Water Authorities constructed 433 pro-poor connections. The Umbrella Water Authorities supply water to PSP operators at an average tariff equivalent to that of house connections which ranges between 1,180 and 3,000/= per m3. This translates to approximately 23 – 60/= per 20 liter jerry can. However, field findings revealed that the PSP operators charge the final consumers between 50 and 200/= per 20 liter jerry can.
The percentage of pro-poor facilities that provide water at a price less than or equal to the house connection tariff is at 37% for towns under Umbrella Authorities. It is therefore recommended that NWSC and the Umbrella Water Authorities should place price tags on all PSPs to ensure that the PSP operators charge a uniform tariff of 50/= per 20 litter jerry can and also have a formal operation contract with the PSP attendant that clearly stipulates the tariff to be charged to the final consumers. It is further recommended that implementation of new PSPs be carried out to increase access to clean and safe water by the vulnerable poor. NWSC´s Customer Satisfaction Index Customer Satisfaction Index (CSI) is an average of all the various attributes of NWSC services that are believed to contribute to customer satisfaction. These are water reliability, water pressure, water quality, timely and accurate water bills, responsiveness in resolving complaints, responsiveness in
Uganda Water and Environment Sector Performance Report 2020
265
effecting new connections, customer care, convenience of bill payment process and office ambience. The Customer Satisfaction Index (CSI) for FY 2019/20 stood at 77%, which is a decline from 86% which was achieved in the FY 2018/19. Findings further revealed that the most satisfied customer category were the PSP customers at 83%, followed by domestic customers at 77%, Government & institutional customers at 76% and commercial customers at 75%. Comparison by the NWSC regions; Western and South Western region has the most satisfied customers at 79% followed by KW and Central regions at 77% respectively and North & North Eastern region had the least satisfied customers at 74%. The key areas of improvement as derived from the survey included; delays in complaint resolution, intermittent supply, delays in connections and client appreciation. The reduction in CSI from 86% as at end of June 2019 to 77% as at end of June 2020 is attributed to takeover of new towns which have staff from the private operators who are not well trained in handling of customers.
Percentage of gazetted water schemes and districts whose performance is published annually by the Regulation body Of the 498 gazetted schemes (Umbrellas and LG), 329 published performance reports. The performance achieved was 66% which was due to the numerous schemes gazetted to Umbrellas and not yet taken over. During the reporting period, all the 258 schemes gazetted to NWSC submitted/ published performance reports. The Water Utility Regulatory Department produced a report with analysis of 188 small towns’ performance out of the 458 small towns hence indicating 41% of the towns to have reported on their regular performance. In efforts to improve on the effective reporting by the small towns, a focal point person in NWSC has been trained on how to incorporate NWSC reporting into UPMIS.
% of water for production facilities with actively functioning Water User Committees The total number of facilities (dams and valley tanks) constructed from 2000 to 2020 is 1,391 for 121 districts so far covered in the WfP database. Out of 1,391, 491 facilities are under community management system with established Water User Committees, and 432 Water User Committees were still fully functional at the time of spot check. The rest of the facilities (959) are non-communal and managed by individual farmers (constructed using MWE equipment under Public Private Partnership (PPP) arrangement). Under this approach, MWE supports the Local Government to train the beneficiaries together with the management committees mainly on their roles and responsibilities and establishment of the by-laws to ensure sustainability of the facilities. Through the FFS approach farmers are trained on efficient and effective use of the created storage all aiming at Sustainability of the facilities.
% of permit holders complying with permit conditions Overall, 1,466 permits were monitored for compliance in FY 2019/20 and 1,091were found to be compliant representing 77.6% performance level. However, the following reasons were singled out for the failure of the permits to meet the approved compliance standards;
• The COVID pandemic affected the timely and routine implementation of the Compliance measures set by the Ministry.
• The biggest Wastewater Discharge institutions/ firms face a challenge of companies relate to inadequate and inefficient waste water treatment plants due to financial and human resource capacity in addition to operational inefficiency.

Uganda Water and Environment Sector Performance Report 2020
266
Based on the performance of compliance by the respective stakeholders in the sector the Ministry has taken on the following approaches to improve on the Water Resource through enforcement of the National standards of Compliance:
• 415 letters providing feedback, technical advice and indicating areas for improved compliance were written and dispatched to various permit holders and positive feedback continues to be received.
• In order to improve groundwater development and ensure value for money during borehole drilling, registration of private hydrogeologists and hydrogeological consulting companies initiated in FY 2015/16 continued. Thus 88 Hydrogeologists and 20 groundwater hydrogeological consultant firms were registered and issued with registration certificates that authorize them to undertake groundwater investigation and drilling supervision activities in the country.
• To regulate the increasing demand of drilling boreholes in urban/gazetted water supply areas, permission to drill boreholes are issued to those who submit their requests with sufficient evidence for a need of an alternative water supply source. In the current year, a total number of 42 requests related to the issue were received and out of this, 20 permissions were issued.

Uganda Water and Environment Sector Performance Report 2020
267
ANNEXES

1
ANNEX 1: Information Sources and References ...................................................................................................... 2
ANNEX 2: References ................................................................................................................................................ 3
ANNEX 3: Overview of the Sector Institutional Framework ................................................................................... 4
ANNEX 4: Formulas Used for Calculating Indicators in MIS .................................................................................. 10
ANNEX 5: NWSC Project and Financial Performance ............................................................................................ 14
ANNEX 6: District Water and Sanitation Development Conditional Grant Performance FY 2019/20 ................. 20
ANNEX 7: Access, Functionality and Equity per District, June 2020 ..................................................................... 24
ANNEX 8: Community Management of Water Sources and Gender June 2020 ................................................... 28
ANNEX 9: Status of Water Sources Constructed by District as of June 2020 ........................................................ 32
ANNEX 9: Coverage of Source per Village by District as of June 2020 .................................................................. 38
ANNEX 10: District Sanitation and Hygiene Benchmarking 2020 ......................................................................... 42
ANNEX 11: Location of TSUs and Umbrella of Water and Sanitation Authorities ............................................... 47
ANNEX 12 List of CSOS in Water and Sanitation that Reported in FY 2020/20 .................................................... 50
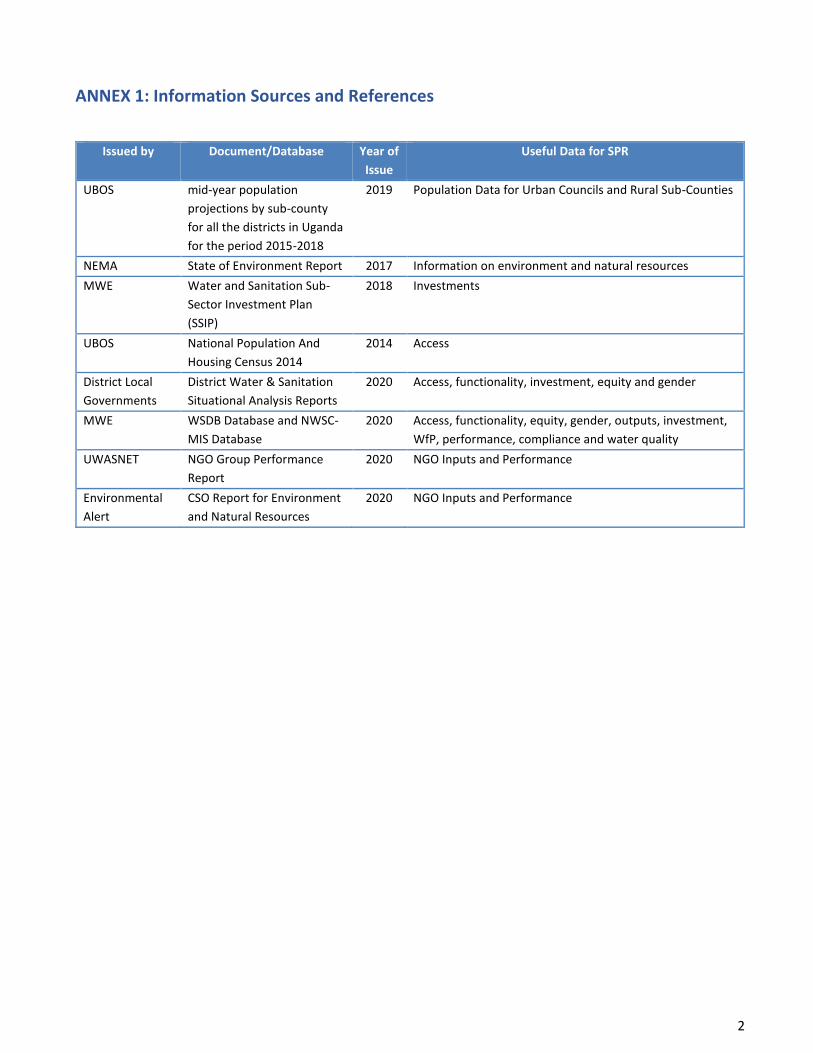
2
ANNEX 1: Information Sources and References
Issued by Document/Database Year of
Issue
Useful Data for SPR
UBOS mid-year population
projections by sub-county
for all the districts in Uganda
for the period 2015-2018
2019 Population Data for Urban Councils and Rural Sub-Counties
NEMA State of Environment Report 2017 Information on environment and natural resources
MWE Water and Sanitation Sub-
Sector Investment Plan
(SSIP)
2018 Investments
UBOS National Population And
Housing Census 2014
2014 Access
District Local
Governments
District Water & Sanitation
Situational Analysis Reports
2020 Access, functionality, investment, equity and gender
MWE WSDB Database and NWSC-
MIS Database
2020 Access, functionality, equity, gender, outputs, investment,
WfP, performance, compliance and water quality
UWASNET NGO Group Performance
Report
2020 NGO Inputs and Performance
Environmental
Alert
CSO Report for Environment
and Natural Resources
2020 NGO Inputs and Performance

3
ANNEX 2: References
Equal Opportunities Commission (Uganda), 2020. Assessment results on compliance of 149 MPS’s with Gender
and Equity for FY 2020/21
Ministry of Water and Environment, 2016. Contribution of Water Development and Environment Resources to
Uganda’s Economy.
Ministry of Water and Environment (MWE), 2016. Consultancy to Facilitate the Review Process of the Water and
Environment Sector Performance (Measurement) Monitoring Framework
Ministry of Water and Environment (MWE), 2017. Water and Environment Sector Development Plan 2015/16-
2019/20.
Ministry of Water and Environment (MWE), 2017. Development/Review and Update of a Strategic Investment
Plan for the Water and Environment Sector, Uganda (2015-2030), Inception Report.
National Planning Authority (2015) National Development Plan 2 (NDP2)
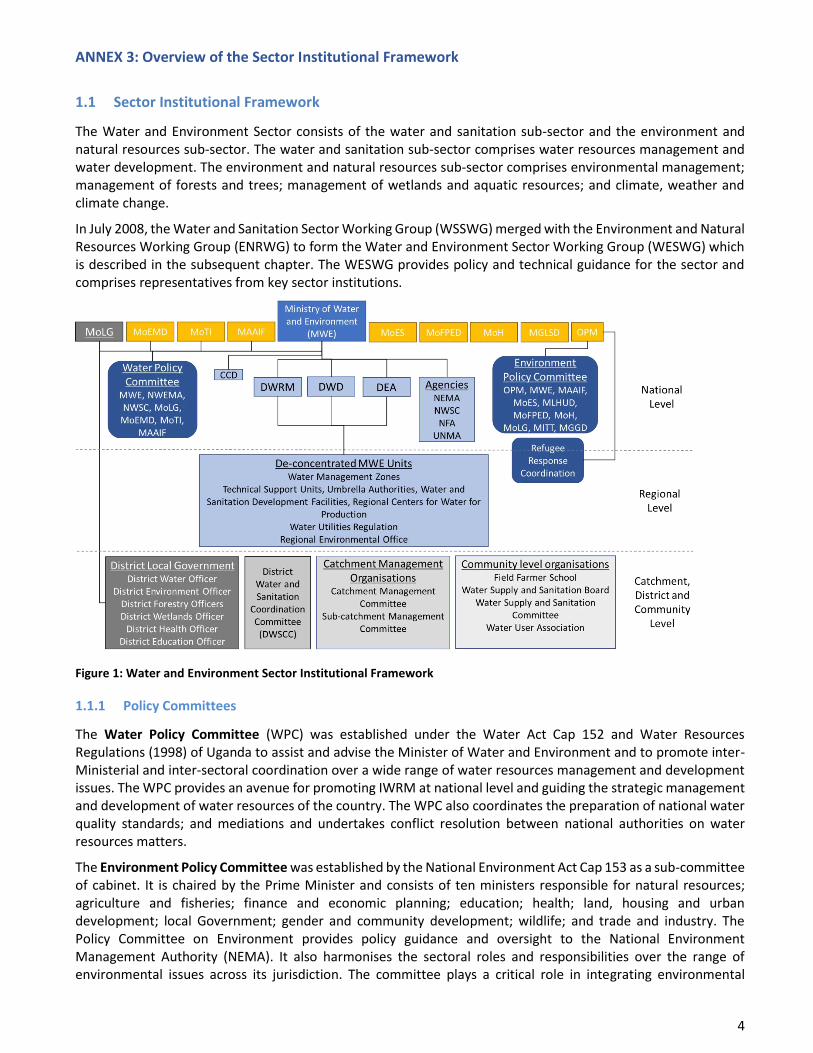
4
ANNEX 3: Overview of the Sector Institutional Framework
1.1 Sector Institutional Framework
The Water and Environment Sector consists of the water and sanitation sub-sector and the environment and natural resources sub-sector. The water and sanitation sub-sector comprises water resources management and water development. The environment and natural resources sub-sector comprises environmental management; management of forests and trees; management of wetlands and aquatic resources; and climate, weather and climate change.
In July 2008, the Water and Sanitation Sector Working Group (WSSWG) merged with the Environment and Natural Resources Working Group (ENRWG) to form the Water and Environment Sector Working Group (WESWG) which is described in the subsequent chapter. The WESWG provides policy and technical guidance for the sector and comprises representatives from key sector institutions.
Figure 1: Water and Environment Sector Institutional Framework
1.1.1 Policy Committees
The Water Policy Committee (WPC) was established under the Water Act Cap 152 and Water Resources Regulations (1998) of Uganda to assist and advise the Minister of Water and Environment and to promote inter-Ministerial and inter-sectoral coordination over a wide range of water resources management and development issues. The WPC provides an avenue for promoting IWRM at national level and guiding the strategic management and development of water resources of the country. The WPC also coordinates the preparation of national water quality standards; and mediations and undertakes conflict resolution between national authorities on water resources matters.
The Environment Policy Committee was established by the National Environment Act Cap 153 as a sub-committee of cabinet. It is chaired by the Prime Minister and consists of ten ministers responsible for natural resources; agriculture and fisheries; finance and economic planning; education; health; land, housing and urban development; local Government; gender and community development; wildlife; and trade and industry. The Policy Committee on Environment provides policy guidance and oversight to the National Environment Management Authority (NEMA). It also harmonises the sectoral roles and responsibilities over the range of environmental issues across its jurisdiction. The committee plays a critical role in integrating environmental

5
considerations into the policies, plans and programmes of the respective sectors and sub-sectors under its jurisdiction.
1.1.2 Ministry of Water and Environment
The Ministry of Water and Environment (MWE) has the responsibility for setting national policies and standards, managing and regulating water resources and determining priorities for water development and management. It also monitors and evaluates sector development programmes to keep track of their performance, efficiency and effectiveness in service delivery. MWE has three directorates: Directorate of Water Resources Management (DWRM), Directorate of Water Development (DWD) and the Directorate of Environmental Affairs (DEA). In response to the increasing number of districts and the need to provide support to local government, the MWE has established a number of de-concentrated entities which are outlined below.
The mandate of the MWE regarding sanitation and hygiene activities is stipulated in the Memorandum of Understanding that was signed by MoH, MoES, and MWE. The role of MWE is limited to development of public sanitary facilities and promotion of good practices of hygiene and sanitation in small towns and rural growth centres.
The current mandate for Water for Production facilities in Uganda is shared between MWE and other Ministries. With respect to water for agricultural development, MWE is responsible for “off-farm” activities while Ministry of Agriculture, Animal Industry and Fisheries (MAAIF) is responsible for “on-farm” activities. “Off-farm” refers to development of water sources and transmission (bulk transfer to farm gates) while “on-farm” refers to irrigation infrastructure, water use and management. Regarding water for energy, MWE works with Ministry of Energy and Mineral Development; for water for industry, MWE produces water to the industries’ premises, while Ministry of Tourism, Trade and Industry (MoTTI) is responsible for water use and management in the industries.
1.1.2.1 Directorate of Water Resources Management
The Directorate of Water Resources Management (DWRM) is responsible for developing and maintaining national water laws, policies and regulations; managing, monitoring and regulation of water resources through issuing water use, abstraction and wastewater discharge permits; Integrated Water Resources Management (IWRM) activities; coordinating Uganda’s participation in joint management of trans-boundary waters resources and peaceful cooperation with Nile Basin riparian countries.
While the traditional institutional arrangements for water resources management have been centralised, de-concentration of these functions to regional and local levels has been initiated. Thus, institutional arrangements for management of water resources in Uganda now exist at three levels, namely the national level (DWRM and WPC, mentioned above), the regional and trans-boundary level, and the local level.
Trans-boundary Level Institutions such as Lake Victoria Basin Commission (LVBC) and Nile Basin Initiative (NBI) under which parts of Ugandan fall. LVBC is a legal entity, linked to the East African Community (EAC), responsible for the sustainable management of the water resources of Lake Victoria basin. Similarly, the Nile Basin Initiative is a transitional institutional arrangement responsible for sustainable management and development of the Nile basin water resources. Some 98% of Uganda lies within the Nile basin and the active participation of Uganda in the Nile Basin Initiative activities is therefore key to the sustainable management and development of Uganda’s water resources.
Water Management Zone offices are operational in the 4 WMZs (Victoria, Albert, Kyoga and Upper Nile). The main purpose of the WMZs is to de-concentrate WRM closer to where action is needed in order to mobilise local community efforts and other stakeholders to achieve catchment-based IWRM and to ensure effective coordination with other water resources related activities being implemented at district level such as environment, forestry and water supply.
1.1.2.2 Directorate of Water Development
Directorate of Water Development (DWD) is responsible for providing overall technical oversight for planning, implementation and supervision of the delivery of urban and rural water and sanitation services across the country, including water for production. DWD is responsible for regulation of provision of water supply and

6
sanitation and the provision of capacity development and other support services to Local Governments, Private Operators and other service providers. DWD comprises three Departments; Rural Water Supply and Sanitation; Urban Water Supply and Sewerage and Water for Production. The Regulation Department of MWE ensures adherence to set standards of service established by the sector for water supply, currently restricted to piped water supplies in the country. The type of regulation being exercised by the department is “Regulation by Contract”. This is realised through Performance and Management Contracts with Water Authorities.is regulating urban water supply services.
Technical Support Units (TSUs) are established under the Rural Water and Sanitation Department in 10 locations to build capacity at the districts following decentralisation of rural water supply and sanitation and the channelling of government grants to the sub-sector via the DWSCG. The TSUs were intended to be temporary and to gradually withdraw from well performing districts. The TSU functions were originally contracted out to private sector companies and/or NGOs but more recently the staff have been hired on individual contracts by the MWE and paid through the JPF. Over time, TSU’s roles have also expanded to provide support to RGCs and also water resources and water for production.
The MWE, through its Urban Water and Sewerage Department, is responsible for overall coordination, policy formulation, setting standards, inspection, monitoring, technical back-up and initiating legislation. It also directly oversees and supports water supply and sanitation service delivery in in all water supply areas that are not gazetted for management by the National Water and Sewerage Corporation.
The National Water and Sewerage Corporation (NWSC), established as a Public Utility operating on a commercial basis, is traditionally responsible for water supply and sewerage services in the large towns. However, in recent years numerous small towns and rural growth centres have been gazetted for management by NWSC, with a further increase from 254 to 258 towns/supply areas during 2019/20.
Traditionally, the Urban Water and Sewerage Department (UWSD) takes care not only of gazetted urban areas but also of piped water systems supplying rural growth centres. For effective infrastructure development, operation and maintenance it has set up two sets of regional deconcentrated units:
• Water and Sanitation Development Facilities (WSDFs) for the implementation of new water
supply and sanitation schemes and major rehabilitations
• Umbrella Authorities for operation and maintenance
The four WSDF Branches plan, finance and implement new water and sanitation projects in Northern, Eastern, Central and South Western Uganda, from their headquarters located in Lira, Mbale, Wakiso and Mbarara, respectively. WSDFs have delegated procurement and accounting authorities and operate following a common Operations Manual. Mobilisation and design activities are partly contracted out and partly done by in-house staff, as appropriate, whereas construction works are always carried out by private contractors.
Since August 2017 the Ministry of Water and Environment has introduced a new management model that is tailored for piped water schemes supplying small towns and rural areas. The model builds on the structures and experience of the 6 regional “Umbrellas of Water and Sanitation” that were created between 2002 and 2014 to provide O&M backup support services for small water supply schemes. Under the new model the Umbrellas – now referred to as Umbrella Authorities – are appointed as Water Authorities. Instead of playing a supporting role as in the past they assume direct management responsibilities for the “gazetted” schemes. Umbrella Authorities continue to provide backstopping support to all piped water schemes outside NWSC regardless of their management arrangement and size.
The National Water and Sewerage Corporation (NWSC) is a parastatal that operates and provides water and sewerage services in more than 200 towns across the country including Kampala. NWSC’s activities are aimed at expanding service coverage within the water supply area while improving the quality and efficiency of service delivery. Key among its objectives is to plough back generated revenue surplus for infrastructure improvements and new investments.
The Water for Production Department has recently de-concentrated it´s services to 4 regions by creating Regional Centers for Water for Production.

7
1.1.2.3 Directorate of Environmental Affairs
Directorate of Environmental Affairs (DEA) is responsible for environmental policy, regulation, coordination, inspection, supervision and monitoring of the environment and natural resources as well as the restoration of degraded ecosystems and mitigating and adapting to climate change. DEA comprised the three departments of Environmental Support Services (DESS), Forestry Sector Support Department (FSSD), and Wetlands Management (WMD). DEA works in collaboration with the National Environmental Management Authority (NEMA), the Uganda National Meteorological Authority (UNMA), and the National Forestry Authority (NFA).
DEA has recently de-concentrated it´s services and created Regional Environment Offices.
Under the National Forestry and Tree Planting Act, 2003, NFA is mandated to manage Central Forest Reserves (CFR) in partnership with private sector and local communities; advisory, research and commercial services on contract; supply of quality seeds; and national forest inventory and other technical services. FSSD is charged with formulation and oversight of appropriate policies, standards, and legislation for the forest sector; coordination and supervision of technical support and training to local governments; inspection and monitoring of local governments; monitor NFA using a performance contract; coordination of the National Forest Plan (the sector’s investment plan) and cross-sectoral linkages; resource mobilisation for the sector; and promotion, public information and advocacy for the sector.
The National Environment Management Authority (NEMA) is responsible for the regulatory functions and activities that focus on compliance and enforcement of the existing legal and institutional frameworks on environmental management in Uganda. NEMA’s mandate covers both green and brown issues of environmental management. It oversees the implementation of all environment conservation programmes and activities of the relevant agencies both at the national and local Government level.
The National Forestry Authority (NFA) is responsible for sustainable management of Central Forest Reserves (CFRs), supply of seed and seedlings, and provision of technical support to stakeholders in the forestry sub-sector on contract. NFA is a semi-autonomous business entity and generates most of its own revenues and finances its activities, i.e. NFA’s support is contingent upon payment for its services.
1.1.2.4 Support or cross-cutting units outside Directorates
The Water and Environment Sector Liaison Department is mandated to ensure effective planning, coordination and management of the Water and Environment sector.
Climate Change Unit (CCU) was created in 2008, directly under the office of the Permanent Secretary within MWE. The main objective for the establishment of the CCU is to strengthen Uganda’s implementation of the United Nations Framework Convention on Climate Change (UNFCCC) and its Kyoto Protocol. In FY 2013/14, the Climate Change Unit has been upgraded to Climate Change Department.
1.1.3 Role of other Ministries in the Sector
A number of other line ministries have important roles in the sector as described briefly below.
The Ministry of Health (MoH) is responsible for hygiene and sanitation promotion for households through the Environmental Health Division (EHD).
The Ministry of Education and Sports (MoES) is responsible for hygiene education and provision of sanitation facilities in primary schools. It also promotes hand washing after latrine use in the schools.
The Ministry of Gender, Labour and Social Development (MGLSD) is responsible for gender responsiveness and community development/mobilisation. It assists the sector in gender responsive policy development and supports districts to build staff capacity to implement sector programmes.
The Ministry of Agriculture, Animal Industry and Fisheries (MAAIF) spearheads agricultural development. This includes the on-farm use and management of water for production (irrigation, animal production and aquaculture).

8
The Ministry of Lands, Housing and Urban Development was created in June 2006 and is responsible for the management of land affairs including physical planning, surveys and mapping, valuation, land registration, urban development and housing as well as the Uganda Land Commission.
Uganda Wildlife Authority under Ministry of Tourism, Trade and Industry (MTTI) manages the forests in National Parks and Wildlife Reserves, especially under the Uganda Wildlife Act, 1996 (CAP 200).
The Ministry of Finance, Planning and Economic Development (MOFPED), mobilises funds, allocates them to sectors and coordinates development partner inputs. MOFPED reviews sector plans as a basis for allocation and release of funds, and reports on compliance with sector and national objectives.
1.1.4 Non-Government Organisation Coordination
The Uganda Water and Sanitation NGO Network (UWASNET) is a national network organisation established in 2000 to strengthen the contribution of NGOs/CBOs in achieving the Water and Sanitation Sector goals. By June 2014, the Network had a membership of 235 NGOs and CBOs. There is a strategic framework for cooperation between local Governments and NGOs for water and sanitation. It guides Local Governments and NGOs on how
to jointly plan and implement community mobilisation/software activities with respect to water supply and
sanitation. It also provides guidance to districts on how to procure NGOs to undertake software activities.
ENR Civil Society Organisations (CSOs) are active in service delivery and advocacy for sustainable forest sector development. They work especially at the grassroots levels, mobilising and sensitising local people, supporting active local participation in managing forests and trees, providing forestry advisory services, and advocating for the concerns of the underprivileged in national development processes. Most of the local NGOs/CBOs working in the forestry sub-sector operate under an umbrella organisation, the Uganda Forestry Working Group (UFWG), with Environmental Alert housing UFWG’s Secretariat. An estimated 200 Civil Society Organisations (CSOs) are involved environment and natural resources. ENR CSOs are organised under a network that is hosted by Environment Alert.
1.1.5 District Level
Local Governments (Districts, Town Councils, sub-Counties) are empowered by the Local Governments Act (2000) to provide water services and manage the Environment and Natural Resource base. Local Governments, in consultation with MWE appoint and manage private operators for urban piped water schemes that are outside the jurisdiction of NWSC. The District Water Offices manage water and sanitation development and oversee the operation and maintenance of existing water supplies in the District.
The District Environment Office is responsible for the environment and natural resources. District Forest Services of local Governments (LGs/DFS) manage Local Forest Reserves (LFRs); carry out support and quality control of forest extension for private and community forests; develop and enforce bye-laws; strengthen forestry in production and environment committees and district development plans; as well as land administration, surveying, and approval of Community forests; among others.
The District Environment Committee coordinates the activities of the district councils relating to the management of the environment and natural resource base.
District Water and Sanitation Coordination Committees (DWSCCs) have been were established in all districts. The committee provides a platform for coordinating and overseeing the activities of the water and sanitation sector in the Local Governments and strengthens collaboration across sectors and between different players. The DWSCC comprises all political leaders, relevant district departments (District Water Office, the Planning Office, the District Directorate of Community Based Services, the District Finance Office, the District Directorate of Health Services, and the District Education Office), NGOs and development partners at the Local Government Level.
1.1.6 Community Level
Communities are responsible for demanding, planning, contributing a cash contribution to capital cost and for the O&M of rural water supply and sanitation facilities. A water user committee (WUC), which is sometimes referred to as a Water and Sanitation Committee (WSC) should be established at each water point. With respect to the environment and natural resources, over the years, community members have been encouraged to form user
9
groups at local level, i.e. Beach Management Units (BMUs), Forestry Resource User Group, Land Committees and Environment Committees. These structures are intended to enable oversight of the environment and natural resources at the lowest level.
1.1.7 Private Sector
Private sector firms undertake design and construction in water supply and sanitation under contract with local
and central Government. Private hand pump mechanics and scheme attendants provide maintenance services to
water users in rural and peri-urban areas. Private Operators manage piped water services in small towns and rural
growth centres. Private Forest Owners, including Local Communities with registered forests, are legal forest
management authorities. In addition, the private sector plays an important role in terms of commercial tree
plantation development as well as promoting wood based industries and trade.
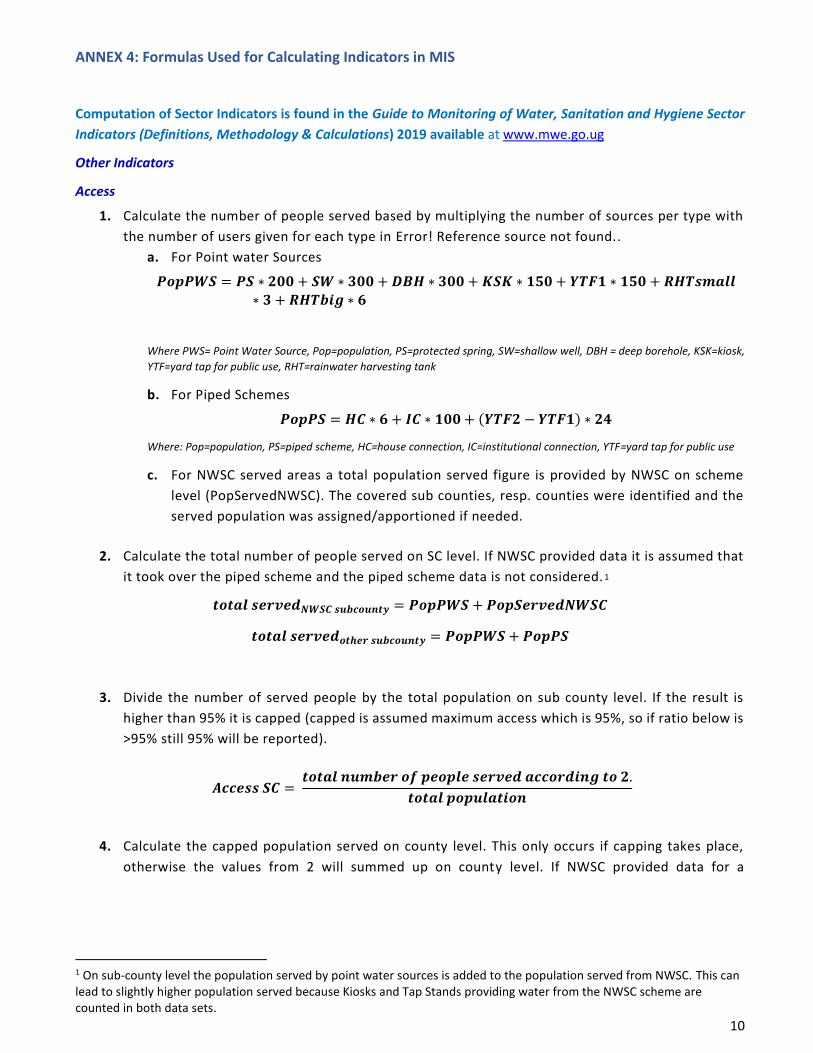
10
ANNEX 4: Formulas Used for Calculating Indicators in MIS
Computation of Sector Indicators is found in the Guide to Monitoring of Water, Sanitation and Hygiene Sector
Indicators (Definitions, Methodology & Calculations) 2019 available at www.mwe.go.ug
Other Indicators
Access
1. Calculate the number of people served based by multiplying the number of sources per type with
the number of users given for each type in Error! Reference source not found..
a. For Point water Sources
𝑷𝒐𝒑𝑷𝑾𝑺 = 𝑷𝑺 ∗ 𝟐𝟎𝟎 + 𝑺𝑾 ∗ 𝟑𝟎𝟎 + 𝑫𝑩𝑯 ∗ 𝟑𝟎𝟎 + 𝑲𝑺𝑲 ∗ 𝟏𝟓𝟎 + 𝒀𝑻𝑭𝟏 ∗ 𝟏𝟓𝟎 + 𝑹𝑯𝑻𝒔𝒎𝒂𝒍𝒍
∗ 𝟑 + 𝑹𝑯𝑻𝒃𝒊𝒈 ∗ 𝟔
Where PWS= Point Water Source, Pop=population, PS=protected spring, SW=shallow well, DBH = deep borehole, KSK=kiosk,
YTF=yard tap for public use, RHT=rainwater harvesting tank
b. For Piped Schemes
𝑷𝒐𝒑𝑷𝑺 = 𝑯𝑪 ∗ 𝟔 + 𝑰𝑪 ∗ 𝟏𝟎𝟎 + (𝒀𝑻𝑭𝟐 − 𝒀𝑻𝑭𝟏) ∗ 𝟐𝟒
Where: Pop=population, PS=piped scheme, HC=house connection, IC=institutional connection, YTF=yard tap for public use
c. For NWSC served areas a total population served figure is provided by NWSC on scheme
level (PopServedNWSC). The covered sub counties, resp. counties were identified and the
served population was assigned/apportioned if needed.
2. Calculate the total number of people served on SC level. If NWSC provided data it is assumed that
it took over the piped scheme and the piped scheme data is not considered. 1
𝒕𝒐𝒕𝒂𝒍 𝒔𝒆𝒓𝒗𝒆𝒅𝑵𝑾𝑺𝑪 𝒔𝒖𝒃𝒄𝒐𝒖𝒏𝒕𝒚 = 𝑷𝒐𝒑𝑷𝑾𝑺 + 𝑷𝒐𝒑𝑺𝒆𝒓𝒗𝒆𝒅𝑵𝑾𝑺𝑪
𝒕𝒐𝒕𝒂𝒍 𝒔𝒆𝒓𝒗𝒆𝒅𝒐𝒕𝒉𝒆𝒓 𝒔𝒖𝒃𝒄𝒐𝒖𝒏𝒕𝒚 = 𝑷𝒐𝒑𝑷𝑾𝑺 + 𝑷𝒐𝒑𝑷𝑺
3. Divide the number of served people by the total population on sub county level. If the result is
higher than 95% it is capped (capped is assumed maximum access which is 95%, so if ratio below is
>95% still 95% will be reported).
𝑨𝒄𝒄𝒆𝒔𝒔 𝑺𝑪 = 𝒕𝒐𝒕𝒂𝒍 𝒏𝒖𝒎𝒃𝒆𝒓 𝒐𝒇 𝒑𝒆𝒐𝒑𝒍𝒆 𝒔𝒆𝒓𝒗𝒆𝒅 𝒂𝒄𝒄𝒐𝒓𝒅𝒊𝒏𝒈 𝒕𝒐 𝟐.
𝒕𝒐𝒕𝒂𝒍 𝒑𝒐𝒑𝒖𝒍𝒂𝒕𝒊𝒐𝒏
4. Calculate the capped population served on county level. This only occurs if capping takes place,
otherwise the values from 2 will summed up on county level. If NWSC provided data for a
1 On sub-county level the population served by point water sources is added to the population served from NWSC. This can lead to slightly higher population served because Kiosks and Tap Stands providing water from the NWSC scheme are counted in both data sets.

11
Municipality it is assumed that it serves the entire county and the data calculated with the WSDB
is ignored.2
𝒕𝒐𝒕𝒂𝒍 𝒔𝒆𝒓𝒗𝒆𝒅𝑵𝑾𝑺𝑪 𝒄𝒐𝒖𝒏𝒕𝒚 = 𝒔𝒖𝒎(𝑺𝑪 𝒑𝒐𝒑𝒖𝒍𝒂𝒕𝒊𝒐𝒏) ∗ 𝟗𝟓%
𝒕𝒐𝒕𝒂𝒍 𝒔𝒆𝒓𝒗𝒆𝒅𝒐𝒕𝒉𝒆𝒓 𝒄𝒐𝒖𝒏𝒕𝒚 = 𝒔𝒖𝒎(𝑺𝑪 𝒑𝒐𝒑𝒖𝒍𝒂𝒕𝒊𝒐𝒏 ∗ 𝑨𝒄𝒄𝒆𝒔𝒔 𝑺𝑪)
5. On district level the population served based on capped access is summed up:
𝑨𝒄𝒄𝒆𝒔𝒔 𝑫𝒊𝒔𝒕𝒓𝒊𝒄𝒕 =𝒔𝒖𝒎(𝒕𝒐𝒕𝒂𝒍 𝒔𝒆𝒓𝒗𝒆𝒅𝒄𝒐𝒖𝒏𝒕𝒚)
𝒔𝒖𝒎(𝑺𝑪 𝒑𝒐𝒑𝒖𝒍𝒂𝒕𝒊𝒐𝒏)
Where: Pop=population, PS=piped scheme, HC=house connection, IC=institutional connection, YTF=yard tap for public use,
SC=sub county
Functionality
Functionality is the number of functioning improved water sources divided by the total number of improved water sources.
Only point water sources are considered (all beside of dams or valley tanks). A separate WfP Functionality is calculated
considering dams and valley tanks only. On district level the calculation is done twice counting sources from urban and rural
sub-counties separately. With this method a rural and an urban functionality on point sources is calculated. This urban
functionality as calculated through the WSDB is different from the golden indicator “urban functionality” which is described
and is provided by the urban department.
Formula
1. count all functional PWS
2. count all PWS
3. calculate ratio
𝑭𝒖𝒏𝒄𝒕𝒊𝒐𝒏𝒂𝒍𝒊𝒕𝒚 = 𝑺𝒖𝒎 𝒐𝒇 𝒇𝒖𝒏𝒄𝒕𝒊𝒐𝒏𝒂𝒍 𝒑𝒐𝒊𝒏𝒕 𝒘𝒂𝒕𝒆𝒓 𝒔𝒐𝒖𝒓𝒄𝒆𝒔
𝒔𝒖𝒎 𝒐𝒇 𝒇𝒖𝒏𝒄𝒕𝒊𝒐𝒏𝒂𝒍 + 𝒔𝒖𝒎 𝒐𝒇 𝒏𝒐𝒏 𝒇𝒖𝒏𝒄𝒕𝒊𝒐𝒏𝒂𝒍 𝒑𝒘𝒔
Sources marked as “Functional (not in use)” (Fniu) are considered as functional if the downtime is less than 5 years or not
specified.
Equity
Equity determines the deviation between the numbers of persons per improved water point at sub-county level.
Therefore the sub-county and district population is divided by the number of sources in that sub-county resp. district. The
equity is then the difference between the district and sub-county ratios.
National and district equity are also based on sub-county level and give the average of considered sub-counties.
Formula
◼ count all point water sources per rural SC
◼ count all point water sources in rural SC per district
◼ count all population of rural SC per district
◼ calculate sub-county equity
𝑬𝒒𝒖𝒊𝒕𝒚 𝑺𝑪 = |
𝒓𝑷𝒐𝒑𝑫𝒊𝒔𝒕𝒓𝒊𝒄𝒕
𝒔𝒖𝒎 𝒐𝒇 𝒅𝒊𝒔𝒕𝒓𝒊𝒄𝒕 𝑷𝑾𝑺−
𝑷𝒐𝒑𝑺𝑪
𝒔𝒖𝒎 𝒐𝒇 𝑺𝑪 𝑷𝑾𝑺|
2 This can lead to lower population served because there might be people in a county which still depend on rural water supply/point water sources. They are not counted here.

12
◼ calculate district equity
𝑬𝒒𝒖𝒊𝒕𝒚 𝒅𝒊𝒔𝒕𝒓𝒊𝒄𝒕 = 𝒔𝒖𝒎 𝒐𝒇 𝒂𝒍𝒍 𝒅𝒊𝒔𝒕𝒓𝒊𝒄𝒕′𝒔 𝒔𝒖𝒃 𝒄𝒐𝒖𝒏𝒕𝒚 𝒆𝒒𝒖𝒊𝒕𝒊𝒆𝒔
𝒕𝒐𝒕𝒂𝒍 𝒓𝒖𝒓𝒂𝒍 𝒔𝒖𝒃 𝒄𝒐𝒖𝒏𝒕𝒊𝒆𝒔 𝒊𝒏 𝒕𝒉𝒆 𝒅𝒊𝒔𝒕𝒓𝒊𝒄𝒕
◼ calculate national equity
𝑬𝒒𝒖𝒊𝒕𝒚 𝒏𝒂𝒕𝒊𝒐𝒏𝒂𝒍 = 𝒔𝒖𝒎 𝒐𝒇 𝒂𝒍𝒍 𝒔𝒖𝒃 𝒄𝒐𝒖𝒏𝒕𝒚 𝒆𝒒𝒖𝒊𝒕𝒊𝒆𝒔
𝒕𝒐𝒕𝒂𝒍 𝒓𝒖𝒓𝒂𝒍 𝒔𝒖𝒃 𝒄𝒐𝒖𝒏𝒕𝒊𝒆𝒔
Remarks
◼ Only rural sub-counties are considered, hence population and sources are only
counted from those sub-counties.
◼ Sub-counties with only one or two sources are not considered, these are new
sub-counties. The new sub counties are not yet part of the set of administrative
units that are being used in the database, and including these sub-counties
with very low number of sources (high equity) would create an unrealistic
picture.
◼ District Equity is the simple average of SC equity figures and not the difference from district average to
national ratios.
Management
The management indicator gives the percentage of communally managed water sources (PS, SW, and DBH) in rural areas
with a functioning Water Source Committee
Formula
1. count all springs, boreholes and shallow wells which are
a. functional
b. in a rural SC
c. communally managed
d. and where a WSC is established
2. of those sources count the ones which have a functioning WSC (the WSC collects fees or undertakes repairs
or holds meetings or cleans environment/sanitation around the source)
3. calculate the ratio
𝑴𝒂𝒏𝒂𝒈𝒆𝒎𝒆𝒏𝒕 = 𝒕𝒐𝒕𝒂𝒍 𝒄𝒐𝒎𝒎𝒖𝒏𝒂𝒍𝒍𝒚 𝒎𝒂𝒏𝒂𝒈𝒆𝒅 𝒔𝒐𝒖𝒓𝒄𝒆𝒔 𝒘𝒊𝒕𝒉 𝒂 𝒇𝒖𝒏𝒄𝒕𝒊𝒐𝒏𝒊𝒏𝒈 𝑾𝑺𝑪
𝒕𝒐𝒕𝒂𝒍 𝒄𝒐𝒎𝒎𝒖𝒏𝒂𝒍𝒍𝒚 𝒎𝒂𝒏𝒂𝒈𝒆𝒅 𝒔𝒐𝒖𝒓𝒄𝒆𝒔 𝒘𝒊𝒕𝒉 𝒆𝒔𝒕𝒂𝒃𝒍𝒊𝒔𝒉𝒆𝒅 𝑾𝑺𝑪
Remarks
◼ Only springs, boreholes and shallow wells are considered. RHT, PSP, KSK and
YTF1 were taken out in 2013 calculation.
◼ Only functional (in use) sources are considered
◼ Only rural sub-counties are considered
◼ Only communally managed sources are considered
◼ Only sources with a WSC are considered. In the 2010 Atlas all communally
managed sources were considered.
◼ As functional WSC only WSC were considered which collect fees, undertake
repairs or hold meeting. This was changed in 2015 to also consider WSC as
functional if they clean the environment/sanitation around the source only.
Gender
The gender indicator is restricted to communally managed water sources in rural areas and gives the ratio of WSCs with at
least one woman in a key position versus the total number of functional WSCs in the same area
Formula

13
1. count all springs, boreholes and shallow wells which are
a. functional
b. in a rural SC
c. communally managed
d. and where a WSC is functional
2. of those sources count the ones which have a women in a key position of the
WSC
3. calculate the ratio
𝑮𝒆𝒏𝒅𝒆𝒓 = 𝒕𝒐𝒕𝒂𝒍 𝒄𝒐𝒎𝒎𝒖𝒏𝒂𝒍𝒍𝒚 𝒎𝒂𝒏𝒂𝒈𝒆𝒅 𝒔𝒐𝒖𝒓𝒄𝒆𝒔 𝒘𝒊𝒕𝒉 𝒂 𝒘𝒐𝒎𝒂𝒏 𝒊𝒏 𝒂 𝒌𝒆𝒚 𝒑𝒐𝒔𝒊𝒕𝒊𝒐𝒏
𝒕𝒐𝒕𝒂𝒍 𝒄𝒐𝒎𝒎𝒖𝒏𝒂𝒍𝒍𝒚 𝒎𝒂𝒏𝒂𝒈𝒆𝒅 𝒔𝒐𝒖𝒓𝒄𝒆𝒔 𝒘𝒊𝒕𝒉 𝒂 𝒇𝒖𝒏𝒄𝒕𝒊𝒐𝒏𝒂𝒍 𝑾𝑺𝑪
Remarks
◼ Functional water sources that are not used are not considered.
◼ Gender was calculated from sources with any established WSC in 2010. This
was changed in 2013 to be calculated from sources with functioning WSC only.
Both gender indicators are calculated in the database.
◼ As functional WSC, only WSCs were considered which collect fees, undertake
repairs or hold meeting. This was changed in 2015 to also consider WSC as
functional if they clean the environment/sanitation around the source only.

14
ANNEX 5: NWSC Project and Financial Performance Table 1: Status of Implementation of Capital Development Projects as at 30th June 2020
PROJECT OBJECTIVE SCOPE STATUS
PROJECTS COMPLETED AND SUBSTANTIALLY COMPLETED DURING FY 2019/20
Kampala Sanitation Programme Phase 2 (KSP – LVP2)
▪ To provide improvements in the urban hygiene and sanitation services for Kampala city residents, and protection of Kampala’s natural Environment.
▪ Construction of Nakivubo Waste Water Treatment Plant with a capacity of 45,000 m3/day.
▪ Construction is currently at 99% completion. Liquid section of the plant (without digesters) is now operational, with Performance monitoring ongoing.
▪ The road and landscaping works at the plant is at 94% completion.
▪ Construction of Nakivubo and Kinawataka Sewers Project Network (29km)
▪ The project was completed and the sewers are now operational.
▪ Construction of Kinawataka Pre-treatment Plant and pumping station with a capacity of 9,000 m3/day
▪ The plant and pumping station were completed and are now operational.
Package Sewage Treatment Plants for Fort Portal and Kisoro towns
▪ To address wastewater disposal challenges in the towns of Fort Portal and Kisoro.
▪ It involved design, supply, installation and operation of sewage treatment plants for both towns
▪ The Plants have been completed and are operational.
Water Management and Development Project (WMDP)-Gulu Water Supply and Sanitation Project
▪ To improve Water Supply And Sewerage services in Gulu.
▪ Upgrading and expansion of the existing Water Treatment Plant from 4,000,000 to 10,000,000 litres of water per day.
▪ Upgrading of the existing water supply and distribution network by 27 km.
▪ Construction of a new intake at Oyitino II.
▪ Construction of a faecal sludge reception and treatment centre.
▪ Upgrading and expansion of the existing Wastewater Treatment Plant and Wastewater Collection System.
▪ Public and institutional sanitation works including water supply and sanitation to the pro poor clusters.
▪ The project is substantially completed and currently under defects liability period which is expected to end in September 2020.
Kapchorwa Water Supply Project
▪ Aimed at improving Water Supply Services in Kapchorwa Town.
▪ Construction of New Water Works with a capacity
3000m3/ day and laying of 4km DN 200mm Delivery main.
▪ The project was completed and is operational.

15
Kampala Water Lake Victoria WatSan Project 2
▪ To ensure sustainable expansion of water supply and sanitation services in Kampala and meet Kampala’s water demand by the year 2040.
▪ Upgrading and rehabilitation of the Ggaba Water Treatment Plant.
▪ The plant was completed and is operational.
PROJECTS STILL UNDER IMPLEMENTATION BY JUNE 2020
Kampala Water Lake Victoria WatSan Project 2
▪ To ensure sustainable expansion of water supply and sanitation services in Kampala and meet Kampala’s water demand by the year 2040.
▪ Construction of a New Water Treatment Plant East of Kampala with a capacity of
160,000 m3 per day.
▪ Overall progress of the plant is at 70%.
▪ Construction of the 52 Km Katosi – Kampala Drinking Water Transmission Main Project.
▪ Construction of a reservoir at Sonde hill,
▪ Construction of a pump station and a 600mm pumping main to Naguru as well as a booster station at Namugongo.
▪ 46Km already laid (88% of the works)
▪ Reservoir construction in progress. Concrete casting for columns and walls in progress
▪ Pumps for Namugongo booster station have been delivered on site and Installation will be done in FY 2020/21
▪ Improvement of Water Supply and Sanitation Services in Informal Settlements of Kampala.
▪ Procurement of works contractor for construction of Faecal Sludge Treatment Plant is ongoing. The delay in procurement of the contractor and succeeding project activities have been due to the Covid-19 pandemic
Upgrading of Kapeeka Water Supply System
▪ To address the current Water Supply and Wastewater Collection and Treatment challenges for the Kapeeka community and Industrial Park Status
▪ Construction of New Water Treatment Plant with a capacity of 4000m3/day.
▪ Modification of existing intake.
▪ Laying of 1.2 Km DN-250mm Raw Water Pumping main.
▪ Laying of 800mm DN 250mm Treated Water Pumping main.
▪ Construction of 600m3 reservoir
▪ Development of borehole based mini systems to produce 1000m3 /day
▪ Contractor is currently undertaking concrete works aerator, flocculator & reservoir base.
▪ Laying of the 2 Km bulk pipeline was completed.
Development of Water and Sanitation Infrastructure for the Isingiro, Mbarara- Masaka Areas- South Western Cluster
▪ To improve the living standards and productivity of the population in the project areas through provision of good quality water and improved sanitation
▪ Construction of a New Water Treatment Plant in Kagera and associated infrastructure to meet the demand for Mbarara town up to the year 2040.
▪ Rehabilitation and expansion of the existing
▪ The Program Management Support Consultancy Services for detailed design, tender preparation and construction supervision commenced and is in progress.

16
services. water supply and sanitation infrastructure in Mbarara Municipality and surrounding areas.
▪ Rehabilitation and expansion of the existing water supply and sanitation infrastructure in Masaka municipality and some towns along the Lukaya - Masaka highway.
Sembabule Water Supply Improvement Project
▪ Aimed at increasing Water Production by 3000m3/day, Upgrade and Extension of the Water Distribution Network
▪ Construction of New Intake and Water Treatment Line including; flocculator, coagulator, clarifier, filter and ancillary works.
▪ Upgrading entire distribution network, and extension to surrounding towns (100 Km length, 90-200mm)
▪ Construction works for the Project have commenced and currently ongoing.
Fort Portal Water Production Improvements
▪ Aimed at improving Water Quality and Increasing Water Production by 2500m3/day.
▪ Construction of flocculator, coagulator, clarifier, filter and ancillary works.
▪ Civil works for the clarifier, coagulator and flocculator completed.
▪ Works on the chemical dozing structure commenced and are ongoing.
PROJECTS AT PLANNING, PROCUREMENT AND INCEPTION STAGE AS AT JUNE 2020
Integrated Water Management and Development Project (IWMDP) –
Adjumani Water Supply and Sanitation Project.
▪ To improve Water Supply and Sewerage Services In Adjumani Urban Area Including support to Refugees and Refugee hosting communities
▪ Water supply and sanitation infrastructure improvements in Adjumani-Pakele and neighbouring towns.
▪ Secured contract committee approvals of Evaluation Reports for Technical and Financial Proposals.
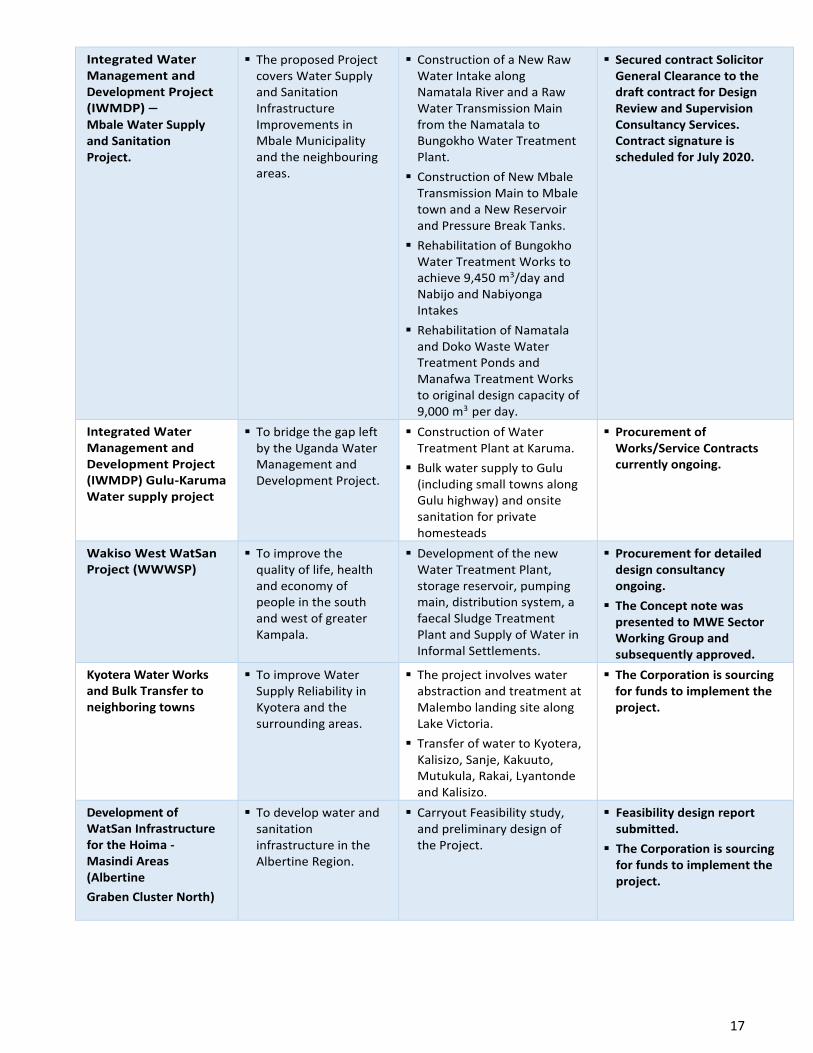
17
Integrated Water Management and Development Project (IWMDP) –
Mbale Water Supply and Sanitation Project.
▪ The proposed Project covers Water Supply and Sanitation Infrastructure Improvements in Mbale Municipality and the neighbouring areas.
▪ Construction of a New Raw Water Intake along Namatala River and a Raw Water Transmission Main from the Namatala to Bungokho Water Treatment Plant.
▪ Construction of New Mbale Transmission Main to Mbale town and a New Reservoir and Pressure Break Tanks.
▪ Rehabilitation of Bungokho Water Treatment Works to achieve 9,450 m3/day and Nabijo and Nabiyonga Intakes
▪ Rehabilitation of Namatala and Doko Waste Water Treatment Ponds and Manafwa Treatment Works to original design capacity of 9,000 m3 per day.
▪ Secured contract Solicitor General Clearance to the draft contract for Design Review and Supervision Consultancy Services. Contract signature is scheduled for July 2020.
Integrated Water Management and Development Project (IWMDP) Gulu-Karuma Water supply project
▪ To bridge the gap left by the Uganda Water Management and Development Project.
▪ Construction of Water Treatment Plant at Karuma.
▪ Bulk water supply to Gulu (including small towns along Gulu highway) and onsite sanitation for private homesteads
▪ Procurement of Works/Service Contracts currently ongoing.
Wakiso West WatSan Project (WWWSP)
▪ To improve the quality of life, health and economy of people in the south and west of greater Kampala.
▪ Development of the new Water Treatment Plant, storage reservoir, pumping main, distribution system, a faecal Sludge Treatment Plant and Supply of Water in Informal Settlements.
▪ Procurement for detailed design consultancy ongoing.
▪ The Concept note was presented to MWE Sector Working Group and subsequently approved.
Kyotera Water Works and Bulk Transfer to neighboring towns
▪ To improve Water Supply Reliability in Kyotera and the surrounding areas.
▪ The project involves water abstraction and treatment at Malembo landing site along Lake Victoria.
▪ Transfer of water to Kyotera, Kalisizo, Sanje, Kakuuto, Mutukula, Rakai, Lyantonde and Kalisizo.
▪ The Corporation is sourcing for funds to implement the project.
Development of WatSan Infrastructure for the Hoima - Masindi Areas (Albertine
Graben Cluster North)
▪ To develop water and sanitation infrastructure in the Albertine Region.
▪ Carryout Feasibility study, and preliminary design of the Project.
▪ Feasibility design report submitted.
▪ The Corporation is sourcing for funds to implement the project.
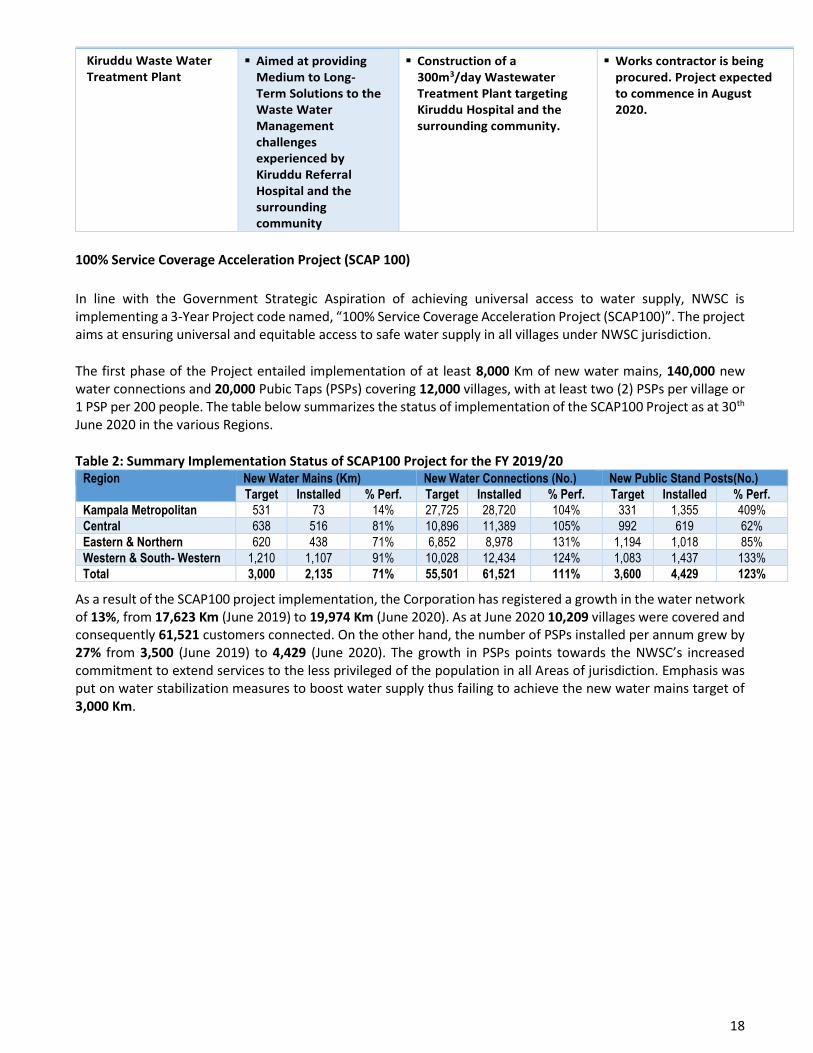
18
Kiruddu Waste Water Treatment Plant
▪ Aimed at providing Medium to Long-Term Solutions to the Waste Water Management challenges experienced by Kiruddu Referral Hospital and the surrounding community
▪ Construction of a 300m3/day Wastewater Treatment Plant targeting Kiruddu Hospital and the surrounding community.
▪ Works contractor is being procured. Project expected to commence in August 2020.
100% Service Coverage Acceleration Project (SCAP 100)
In line with the Government Strategic Aspiration of achieving universal access to water supply, NWSC is implementing a 3-Year Project code named, “100% Service Coverage Acceleration Project (SCAP100)”. The project aims at ensuring universal and equitable access to safe water supply in all villages under NWSC jurisdiction.
The first phase of the Project entailed implementation of at least 8,000 Km of new water mains, 140,000 new water connections and 20,000 Pubic Taps (PSPs) covering 12,000 villages, with at least two (2) PSPs per village or 1 PSP per 200 people. The table below summarizes the status of implementation of the SCAP100 Project as at 30th
June 2020 in the various Regions.
Table 2: Summary Implementation Status of SCAP100 Project for the FY 2019/20 Region New Water Mains (Km) New Water Connections (No.) New Public Stand Posts(No.)
Target Installed % Perf. Target Installed % Perf. Target Installed % Perf.
Kampala Metropolitan 531 73 14% 27,725 28,720 104% 331 1,355 409%
Central 638 516 81% 10,896 11,389 105% 992 619 62%
Eastern & Northern 620 438 71% 6,852 8,978 131% 1,194 1,018 85%
Western & South- Western 1,210 1,107 91% 10,028 12,434 124% 1,083 1,437 133%
Total 3,000 2,135 71% 55,501 61,521 111% 3,600 4,429 123%
As a result of the SCAP100 project implementation, the Corporation has registered a growth in the water network of 13%, from 17,623 Km (June 2019) to 19,974 Km (June 2020). As at June 2020 10,209 villages were covered and consequently 61,521 customers connected. On the other hand, the number of PSPs installed per annum grew by 27% from 3,500 (June 2019) to 4,429 (June 2020). The growth in PSPs points towards the NWSC’s increased commitment to extend services to the less privileged of the population in all Areas of jurisdiction. Emphasis was put on water stabilization measures to boost water supply thus failing to achieve the new water mains target of 3,000 Km.
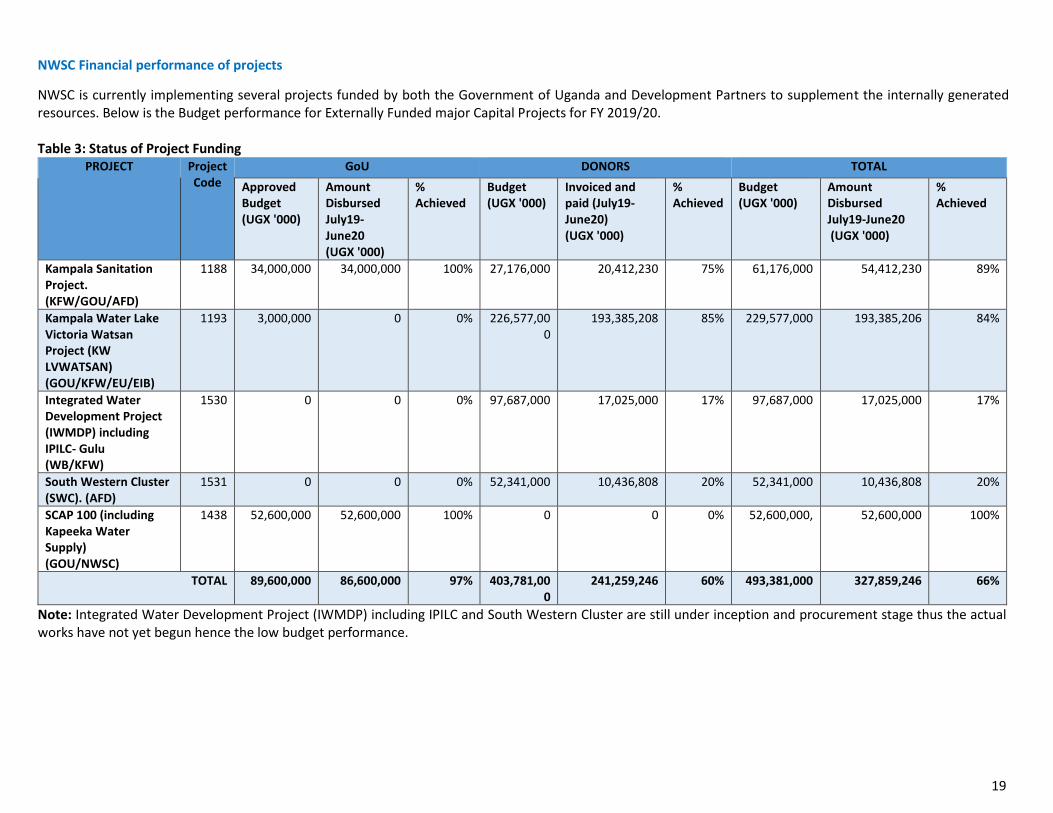
19
NWSC Financial performance of projects
NWSC is currently implementing several projects funded by both the Government of Uganda and Development Partners to supplement the internally generated resources. Below is the Budget performance for Externally Funded major Capital Projects for FY 2019/20. Table 3: Status of Project Funding
PROJECT Project Code
GoU DONORS TOTAL
Approved Budget (UGX '000)
Amount Disbursed July19-June20 (UGX '000)
% Achieved
Budget (UGX '000)
Invoiced and paid (July19-June20) (UGX '000)
% Achieved
Budget (UGX '000)
Amount Disbursed July19-June20 (UGX '000)
% Achieved
Kampala Sanitation Project. (KFW/GOU/AFD)
1188 34,000,000 34,000,000 100% 27,176,000 20,412,230 75% 61,176,000 54,412,230 89%
Kampala Water Lake Victoria Watsan Project (KW LVWATSAN) (GOU/KFW/EU/EIB)
1193 3,000,000 0 0% 226,577,000
193,385,208 85% 229,577,000 193,385,206 84%
Integrated Water Development Project (IWMDP) including IPILC- Gulu (WB/KFW)
1530 0 0 0% 97,687,000 17,025,000 17% 97,687,000 17,025,000 17%
South Western Cluster (SWC). (AFD)
1531 0 0 0% 52,341,000 10,436,808 20% 52,341,000 10,436,808 20%
SCAP 100 (including Kapeeka Water Supply) (GOU/NWSC)
1438 52,600,000 52,600,000 100% 0 0 0% 52,600,000, 52,600,000 100%
TOTAL 89,600,000 86,600,000 97% 403,781,000
241,259,246 60% 493,381,000 327,859,246 66%
Note: Integrated Water Development Project (IWMDP) including IPILC and South Western Cluster are still under inception and procurement stage thus the actual works have not yet begun hence the low budget performance.

20
ANNEX 6: District Water and Sanitation Development Conditional Grant Performance FY
2019/20 District Budget Expenditure Percent
1 Adjumani 275,387,753 - 0%
2 Agago 287,227,000 288,427,000 100%
3 Alebtong 304,682,800 216,503,839 71%
4 Amolatar 214,191,190 196,534,988 92%
5 Amuru 249,665,874 249,040,800 100%
6 Apac 409,162,000 409,572,600 100%
7 Arua 674,003,993 652,094,828 97%
8 Dokolo 87,971,000 271,735,000 309%
9 Gulu 589,356,889 6,209,000 1%
10 Kitgum 195,439,965 - 0%
11 Koboko 374,637,949 384,666,000 103%
12 Kole 505,459,732 64,819,482 13%
13 Kwania 466,774,219 - 0%
14 Lamwo 110,808,539 214,806,163 194%
15 Lira 359,637,928 359,044,699 100%
16 Madi-Okollo 370,220,887 32,765,000 9%
17 Maracha 244,949,000 244,649,719 100%
18 Moyo 186,114,902 186,614,902 100%
19 Nebbi 508,845,439 416,287,609 82%
20 Nwoya 481,808,232 460,031,619 95%
21 Obongi 181,843,768 - 0%
22 Omoro 247,353,459 245,517,756 99%
23 Otuke 230,760,396 230,760,396 100%
24 Oyam 606,570,347 559,779,182 92%
25 Pader 257,764,085 257,534,654 100%
26 Pakwach 434,983,975 224,708,942 52%
27 Yumbe 643,864,557 638,409,593 99%
28 Zombo 356,887,410 356,850,557 100%
29 Abim 213,338,593 114,585,781 54%
30 Amudat 341,107,605 340,415,605 100%
31 Amuria 323,510,196 - 0%
32 Bukedea 520,776,504 519,806,461 100%
33 Kaabong 296,408,471 267,443,761 90%

21
District Budget Expenditure Percent
34 Kaberamaido 249,898,498 249,239,682 100%
35 Kalaki 288,657,787 91,099,202 32%
36 Kapelebyong 209,636,649 209,636,649 100%
37 karenga 173,299,800 11,973,000 7%
38 Katakwi 230,283,509 230,283,525 100%
39 Kotido 336,849,685 - 0%
40 Kumi 471,925,068 464,582,635 98%
41 Moroto 297,997,155 297,997,155 100%
42 Nabilatuk 342,770,532 343,466,048 100%
43 Nakapiripirit 412,022,727 80,738,148 20%
44 Napak 73,451,794 12,921,966 18%
45 Ngora 213,605,693 14,597,260 7%
46 Serere 416,759,048 27,006,497 6%
47 Soroti 308,917,677 311,528,163 101%
48 Budaka 385,436,338 383,690,881 100%
49 Bududa 467,090,000 467,090,000 100%
50 Bugiri 615,566,360 615,566,359 100%
51 Bugweri 458,087,000 453,068,108 99%
52 Buikwe 1,141,256,164 50,421,924 4%
53 Bukwo 227,232,115 227,232,115 100%
54 Bulambuli 394,429,000 321,052,000 81%
55 Busia 473,853,930 350,423,313 74%
56 Butaleja 471,189,830 466,469,055 99%
57 Butebo 454,210,375 454,151,958 100%
58 Buvuma 424,368,353 424,044,176 100%
59 Buyende 447,666,340 20,402,500 5%
60 Iganga 461,871,549 461,871,549 100%
61 Jinja 557,369,120 560,529,120 101%
62 Kaliro 583,470,402 586,572,359 101%
63 Kamuli 620,440,467 602,677,038 97%
64 Kapchorwa 210,740,640 210,740,640 100%
65 Kayunga 523,436,790 - 0%
66 Kibuku 459,565,857 445,665,800 97%
67 Kween 221,269,080 - 0%
68 Luuka 474,252,834 474,252,834 100%

22
District Budget Expenditure Percent
69 Manafwa 370,400,104 19,500,450 5%
70 Mayuge 568,188,680 559,040,696 98%
71 Mbale 583,744,954 583,745,454 100%
72 Namayingo 560,015,193 567,501,968 101%
73 Namisindwa 410,436,499 384,015,938 94%
74 Namutumba 132,399,377 508,152,739 384%
75 Pallisa 471,496,995 468,123,281 99%
76 Sironko 142,577,785 350,957,350 246%
77 Tororo 680,802,100 617,009,050 91%
78 Bukomansimbi 284,758,608 291,814,941 102%
79 Butambala 193,879,409 193,878,832 100%
80 Gomba 304,562,595 301,761,746 99%
81 Kalangala 277,222,000 272,260,001 98%
82 Kalungu 217,484,278 151,449,696 70%
83 Kiboga 101,820,018 272,672,441 268%
84 Kiryandongo 423,048,898 20,394,700 5%
85 Kyankwanzi 541,433,059 534,466,179 99%
86 Kyotera 466,449,962 465,649,859 100%
87 Luweero 515,152,828 512,482,695 99%
88 Lwengo 528,542,108 528,542,108 100%
89 Masaka 432,968,010 432,928,010 100%
90 Mityana 486,854,373 573,829,195 118%
91 Mpigi 401,547,828 401,680,538 100%
92 Mukono 661,916,817 369,647,795 56%
93 Nakaseke 326,835,468 324,231,440 99%
94 Nakasongola 399,548,007 399,530,509 100%
95 Rakai 536,339,933 536,333,933 100%
96 Sembabule 551,954,803 550,753,531 100%
97 Wakiso 138,582,588 555,565,599 401%
98 Kabarole 477,723,533 482,714,298 101%
99 Buliisa 331,273,966 - 0%
100 Bundibugyo 472,700,652 423,139,269 90%
101 Bunyangabu 313,927,981 320,980,856 102%
102 Hoima 551,886,028 551,876,028 100%
103 Kagadi 449,361,856 467,242,562 104%

23
District Budget Expenditure Percent
104 Kakumiro 516,716,733 516,716,733 100%
105 Kamwenge 481,418,090 490,708,696 102%
106 Kasese 610,558,940 693,376,740 114%
107 Kassanda 477,949,734 477,940,451 100%
108 Kibaale 424,465,689 424,465,689 100%
109 Kikuube 515,553,697 508,278,200 99%
110 kitagwenda 244,341,649 - 0%
111 Kyegegwa 152,850,384 118,617,029 78%
112 Kyenjojo 485,349,740 484,352,940 100%
113 Masindi 239,208,892 235,395,397 98%
114 Mubende 501,335,740 492,651,328 98%
115 Ntoroko 169,985,044 110,669,294 65%
116 Isingiro 526,615,194 526,615,195 100%
117 Buhweju 111,127,930 26,000,149 23%
118 Bushenyi 200,327,086 214,527,086 107%
119 Ibanda 527,737,903 527,734,469 100%
120 Kabale 307,152,707 245,312,707 80%
121 Kanungu 252,502,834 249,077,967 99%
122 kazo 465,693,876 433,157,996 93%
123 Kiruhura 451,961,440 451,964,711 100%
124 Kisoro 527,084,908 457,064,908 87%
125 Lyantonde 453,761,709 437,519,208 96%
126 Mbarara 469,697,766 469,863,321 100%
127 Mitooma 221,690,494 221,890,494 100%
128 Ntungamo 577,046,289 519,518,779 90%
129 Rubanda 330,722,643 330,722,643 100%
130 Rubirizi 351,938,664 349,892,137 99%
131 Rukiga 160,699,790 40,722,185 25%
132 Rukungiri 337,964,350 390,897,168 116%
133 Rwampara 108,437,749 31,876,794 29%
134 Sheema 196,049,151 34,735,782 18%

24
ANNEX 7: Access, Functionality and Equity per District, June 2020
District Access Functionality Equity
Rural Urban Total Rural Urban WfP Rural
Abim 76% 89% 78% 75% 82% 0% 159
Adjumani 94% 95% 94% 87% 83% 100% 44
Agago 95% 95% 95% 77% 75% 86% 16
Alebtong 94% 95% 94% 70% 80% 83% 27
Amolatar 90% 77% 88% 77% 87% 36% 32
Amudat 47% 73% 50% 76% 84% 0% 42
Amuria 74% 63% 74% 93% 100% 71% 48
Amuru 88% 71% 87% 75% 76% 0% 48
Apac 74% 70% 73% 75% 81% 60% 29
Arua 75% 85% 76% 84% 0% 100% 72
Budaka 81% 75% 80% 93% 81% 50% 57
Bududa 70% 47% 70% 91% 71% 100% 81
Bugiri 67% 95% 68% 94% 100% 0% 112
Bugweri 65% 95% 67% 96% 100% 0% 97
Buhweju 60% 95% 62% 95% 97% 100% 61
Buikwe 77% 18% 58% 92% 86% 0% 78
Bukedea 68% 60% 68% 85% 92% 0% 58
Bukomansimbi 85% 95% 86% 87% 92% 83% 9
Bukwo 79% 67% 78% 73% 42% 0% 68
Bulambuli 74% 35% 71% 87% 69% 0% 86
Buliisa 68% 94% 70% 72% 98% 0% 131
Bundibugyo 59% 77% 63% 62% 84% 0% 90
Bunyangabu 75% 72% 75% 89% 86% 0% 45
Bushenyi 93% 58% 85% 77% 74% 80% 46
Busia 78% 66% 76% 94% 76% 100% 49
Butaleja 62% 60% 62% 91% 90% 0% 41
Butambala 95% 95% 95% 79% 76% 100% 26
Butebo 68% 0% 68% 93% 0% 0% 68
Buvuma 31% 83% 36% 89% 87% 0% 1,044
Buyende 37% 53% 38% 92% 95% 69% 135
Dokolo 88% 69% 86% 82% 92% 0% 48
Gomba 86% 95% 87% 62% 79% 96% 51
Gulu 93% 61% 76% 78% 100% 0% 35
Hoima 72% 25% 55% 87% 86% 0% 151
Ibanda 58% 37% 50% 74% 88% 0% 360
Iganga 68% 84% 70% 96% 0% 0% 51
Isingiro 44% 38% 43% 97% 97% 90% 84
Jinja 77% 48% 66% 85% 74% 0% 188
Kaabong 85% 95% 86% 79% 80% 100% 100
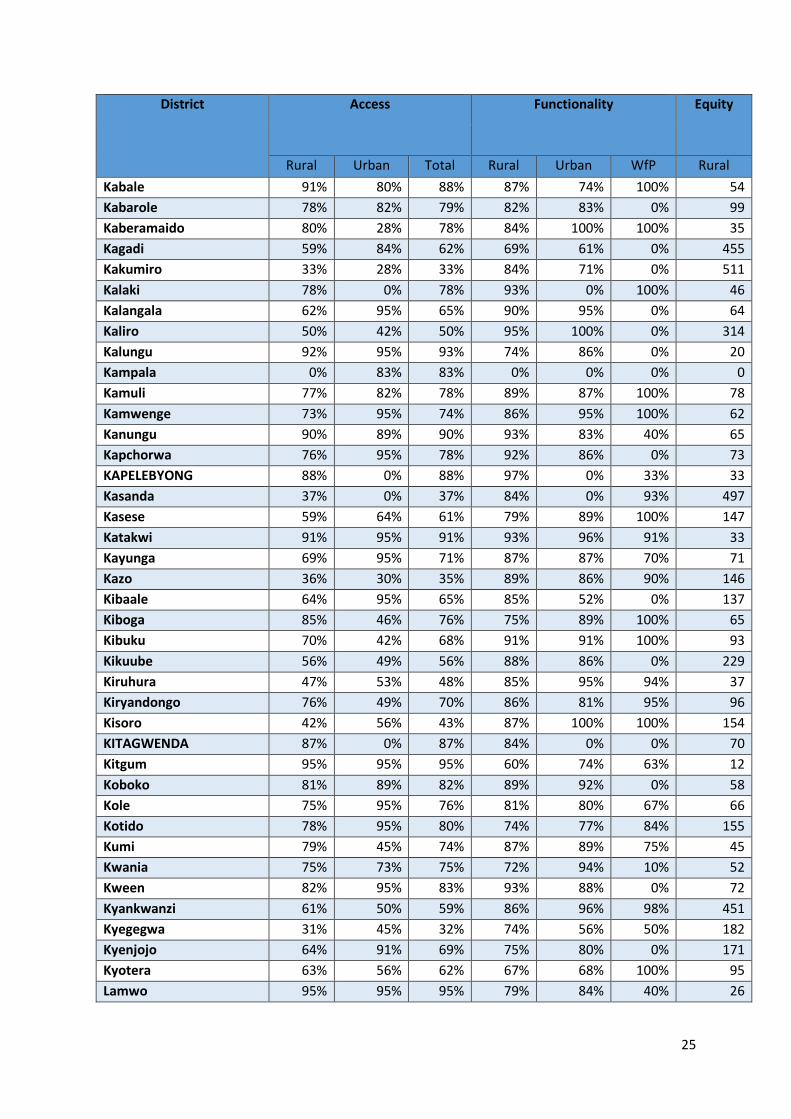
25
District Access Functionality Equity
Rural Urban Total Rural Urban WfP Rural
Kabale 91% 80% 88% 87% 74% 100% 54
Kabarole 78% 82% 79% 82% 83% 0% 99
Kaberamaido 80% 28% 78% 84% 100% 100% 35
Kagadi 59% 84% 62% 69% 61% 0% 455
Kakumiro 33% 28% 33% 84% 71% 0% 511
Kalaki 78% 0% 78% 93% 0% 100% 46
Kalangala 62% 95% 65% 90% 95% 0% 64
Kaliro 50% 42% 50% 95% 100% 0% 314
Kalungu 92% 95% 93% 74% 86% 0% 20
Kampala 0% 83% 83% 0% 0% 0% 0
Kamuli 77% 82% 78% 89% 87% 100% 78
Kamwenge 73% 95% 74% 86% 95% 100% 62
Kanungu 90% 89% 90% 93% 83% 40% 65
Kapchorwa 76% 95% 78% 92% 86% 0% 73
KAPELEBYONG 88% 0% 88% 97% 0% 33% 33
Kasanda 37% 0% 37% 84% 0% 93% 497
Kasese 59% 64% 61% 79% 89% 100% 147
Katakwi 91% 95% 91% 93% 96% 91% 33
Kayunga 69% 95% 71% 87% 87% 70% 71
Kazo 36% 30% 35% 89% 86% 90% 146
Kibaale 64% 95% 65% 85% 52% 0% 137
Kiboga 85% 46% 76% 75% 89% 100% 65
Kibuku 70% 42% 68% 91% 91% 100% 93
Kikuube 56% 49% 56% 88% 86% 0% 229
Kiruhura 47% 53% 48% 85% 95% 94% 37
Kiryandongo 76% 49% 70% 86% 81% 95% 96
Kisoro 42% 56% 43% 87% 100% 100% 154
KITAGWENDA 87% 0% 87% 84% 0% 0% 70
Kitgum 95% 95% 95% 60% 74% 63% 12
Koboko 81% 89% 82% 89% 92% 0% 58
Kole 75% 95% 76% 81% 80% 67% 66
Kotido 78% 95% 80% 74% 77% 84% 155
Kumi 79% 45% 74% 87% 89% 75% 45
Kwania 75% 73% 75% 72% 94% 10% 52
Kween 82% 95% 83% 93% 88% 0% 72
Kyankwanzi 61% 50% 59% 86% 96% 98% 451
Kyegegwa 31% 45% 32% 74% 56% 50% 182
Kyenjojo 64% 91% 69% 75% 80% 0% 171
Kyotera 63% 56% 62% 67% 68% 100% 95
Lamwo 95% 95% 95% 79% 84% 40% 26
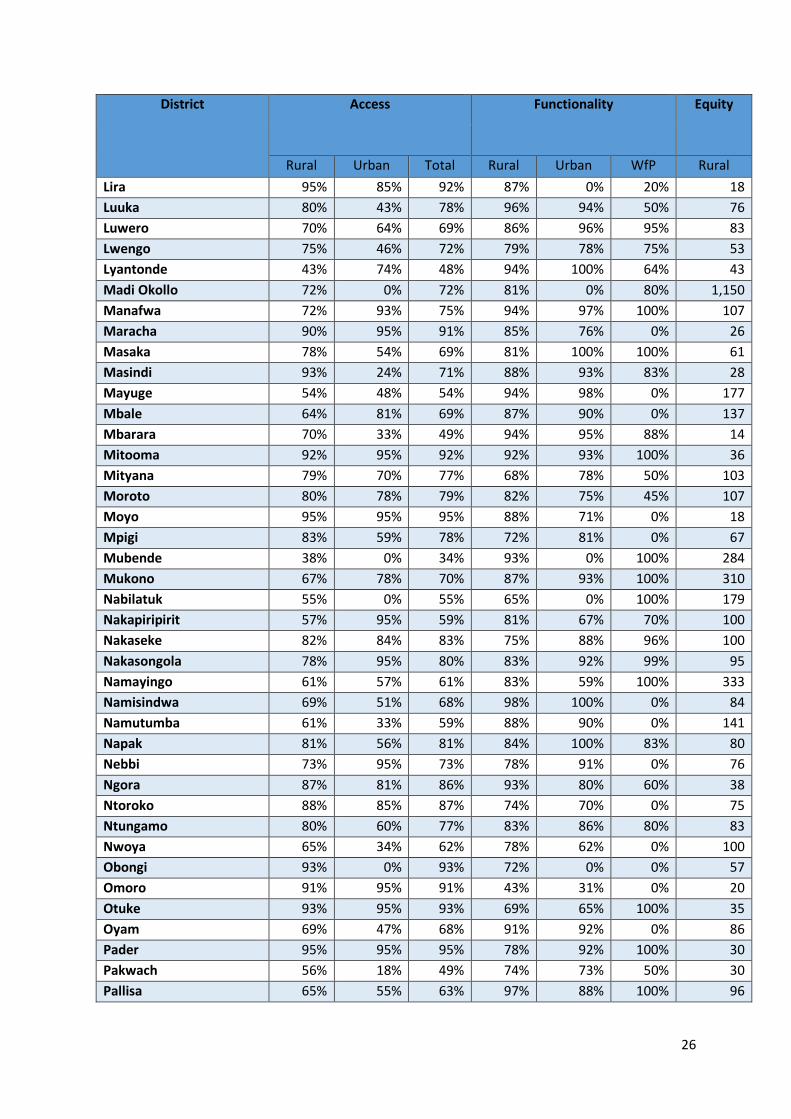
26
District Access Functionality Equity
Rural Urban Total Rural Urban WfP Rural
Lira 95% 85% 92% 87% 0% 20% 18
Luuka 80% 43% 78% 96% 94% 50% 76
Luwero 70% 64% 69% 86% 96% 95% 83
Lwengo 75% 46% 72% 79% 78% 75% 53
Lyantonde 43% 74% 48% 94% 100% 64% 43
Madi Okollo 72% 0% 72% 81% 0% 80% 1,150
Manafwa 72% 93% 75% 94% 97% 100% 107
Maracha 90% 95% 91% 85% 76% 0% 26
Masaka 78% 54% 69% 81% 100% 100% 61
Masindi 93% 24% 71% 88% 93% 83% 28
Mayuge 54% 48% 54% 94% 98% 0% 177
Mbale 64% 81% 69% 87% 90% 0% 137
Mbarara 70% 33% 49% 94% 95% 88% 14
Mitooma 92% 95% 92% 92% 93% 100% 36
Mityana 79% 70% 77% 68% 78% 50% 103
Moroto 80% 78% 79% 82% 75% 45% 107
Moyo 95% 95% 95% 88% 71% 0% 18
Mpigi 83% 59% 78% 72% 81% 0% 67
Mubende 38% 0% 34% 93% 0% 100% 284
Mukono 67% 78% 70% 87% 93% 100% 310
Nabilatuk 55% 0% 55% 65% 0% 100% 179
Nakapiripirit 57% 95% 59% 81% 67% 70% 100
Nakaseke 82% 84% 83% 75% 88% 96% 100
Nakasongola 78% 95% 80% 83% 92% 99% 95
Namayingo 61% 57% 61% 83% 59% 100% 333
Namisindwa 69% 51% 68% 98% 100% 0% 84
Namutumba 61% 33% 59% 88% 90% 0% 141
Napak 81% 56% 81% 84% 100% 83% 80
Nebbi 73% 95% 73% 78% 91% 0% 76
Ngora 87% 81% 86% 93% 80% 60% 38
Ntoroko 88% 85% 87% 74% 70% 0% 75
Ntungamo 80% 60% 77% 83% 86% 80% 83
Nwoya 65% 34% 62% 78% 62% 0% 100
Obongi 93% 0% 93% 72% 0% 0% 57
Omoro 91% 95% 91% 43% 31% 0% 20
Otuke 93% 95% 93% 69% 65% 100% 35
Oyam 69% 47% 68% 91% 92% 0% 86
Pader 95% 95% 95% 78% 92% 100% 30
Pakwach 56% 18% 49% 74% 73% 50% 30
Pallisa 65% 55% 63% 97% 88% 100% 96

27
District Access Functionality Equity
Rural Urban Total Rural Urban WfP Rural
Rakai 36% 36% 36% 82% 0% 75% 70
Rubanda 73% 89% 75% 95% 71% 25% 33
Rubirizi 68% 34% 64% 95% 96% 0% 46
Rukiga 95% 95% 95% 82% 92% 0% 28
Rukungiri 92% 35% 86% 86% 92% 100% 22
Rwampara 88% 0% 88% 97% 0% 33% 28
Serere 79% 84% 79% 94% 92% 100% 37
Sheema 83% 80% 82% 87% 84% 0% 78
Sironko 83% 55% 79% 90% 91% 50% 48
Soroti 88% 23% 77% 85% 0% 60% 35
Ssembabule 38% 41% 38% 85% 94% 86% 68
Tororo 60% 64% 61% 87% 100% 100% 89
Wakiso 43% 28% 37% 84% 76% 100% 244
Yumbe 48% 57% 48% 96% 98% 0% 82
Zombo 86% 74% 84% 75% 87% 100% 57
National Level 68% 71% 67% 85% 85% 84% 119
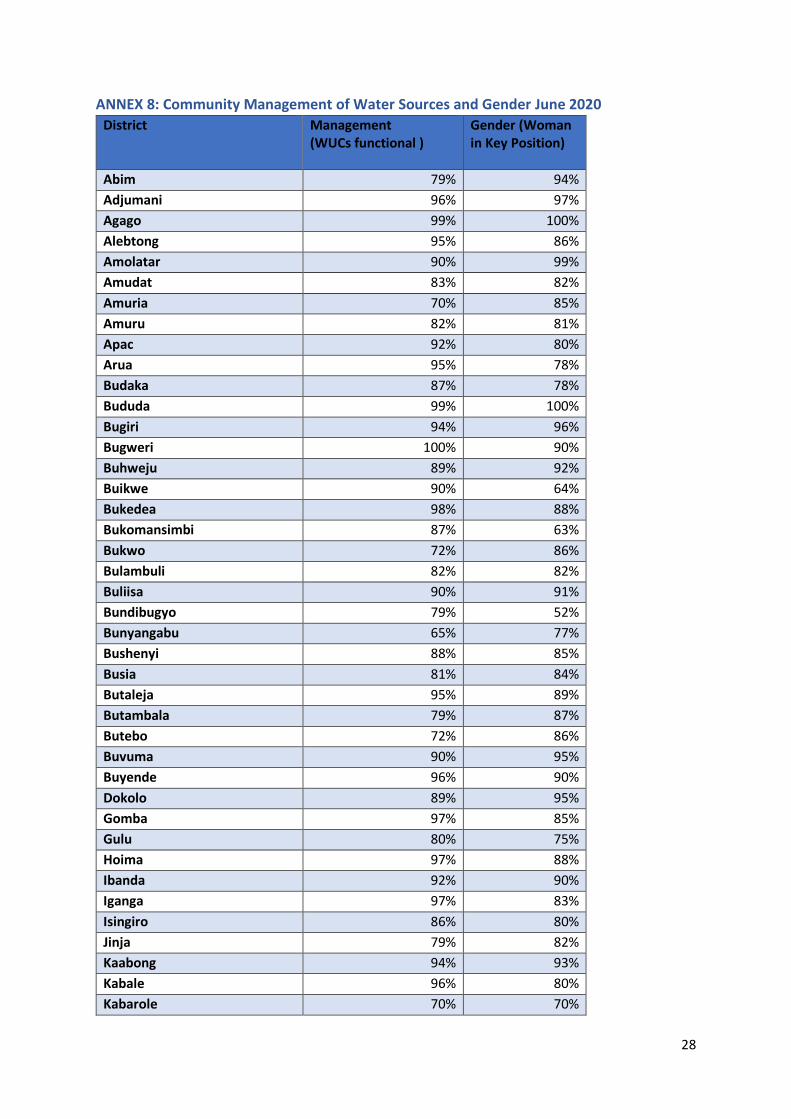
28
ANNEX 8: Community Management of Water Sources and Gender June 2020
District Management (WUCs functional )
Gender (Woman in Key Position)
Abim 79% 94%
Adjumani 96% 97%
Agago 99% 100%
Alebtong 95% 86%
Amolatar 90% 99%
Amudat 83% 82%
Amuria 70% 85%
Amuru 82% 81%
Apac 92% 80%
Arua 95% 78%
Budaka 87% 78%
Bududa 99% 100%
Bugiri 94% 96%
Bugweri 100% 90%
Buhweju 89% 92%
Buikwe 90% 64%
Bukedea 98% 88%
Bukomansimbi 87% 63%
Bukwo 72% 86%
Bulambuli 82% 82%
Buliisa 90% 91%
Bundibugyo 79% 52%
Bunyangabu 65% 77%
Bushenyi 88% 85%
Busia 81% 84%
Butaleja 95% 89%
Butambala 79% 87%
Butebo 72% 86%
Buvuma 90% 95%
Buyende 96% 90%
Dokolo 89% 95%
Gomba 97% 85%
Gulu 80% 75%
Hoima 97% 88%
Ibanda 92% 90%
Iganga 97% 83%
Isingiro 86% 80%
Jinja 79% 82%
Kaabong 94% 93%
Kabale 96% 80%
Kabarole 70% 70%

29
District Management (WUCs functional )
Gender (Woman in Key Position)
Kaberamaido 98% 98%
Kagadi 97% 75%
Kakumiro 63% 84%
Kalaki 99% 96%
Kalangala 65% 86%
Kaliro 97% 90%
Kalungu 92% 93%
Kampala 0% 0%
Kamuli 92% 89%
Kamwenge 88% 92%
Kanungu 90% 71%
Kapchorwa 98% 100%
KAPELEBYONG 84% 85%
Kasanda 85% 57%
Kasese 93% 98%
Katakwi 92% 83%
Kayunga 90% 81%
Kazo 81% 94%
Kibaale 74% 86%
Kiboga 92% 93%
Kibuku 94% 92%
Kikuube 98% 91%
Kiruhura 79% 91%
Kiryandongo 87% 74%
Kisoro 90% 94%
KITAGWENDA 97% 96%
Kitgum 93% 97%
Koboko 66% 76%
Kole 96% 97%
Kotido 88% 97%
Kumi 99% 88%
Kwania 95% 83%
Kween 85% 91%
Kyankwanzi 88% 84%
Kyegegwa 92% 96%
Kyenjojo 75% 73%
Kyotera 78% 66%
Lamwo 95% 92%
Lira 95% 90%
Luuka 81% 80%
Luwero 89% 74%
Lwengo 90% 77%

30
District Management (WUCs functional )
Gender (Woman in Key Position)
Lyantonde 91% 37%
Madi Okollo 83% 91%
Manafwa 91% 93%
Maracha 93% 97%
Masaka 77% 58%
Masindi 85% 86%
Mayuge 97% 69%
Mbale 90% 88%
Mbarara 98% 98%
Mitooma 95% 97%
Mityana 69% 81%
Moroto 66% 92%
Moyo 94% 90%
Mpigi 94% 86%
Mubende 83% 79%
Mukono 94% 80%
Nabilatuk 89% 93%
Nakapiripirit 96% 91%
Nakaseke 97% 84%
Nakasongola 95% 98%
Namayingo 89% 81%
Namisindwa 96% 69%
Namutumba 99% 85%
Napak 98% 100%
Nebbi 92% 92%
Ngora 99% 98%
Ntoroko 52% 75%
Ntungamo 77% 81%
Nwoya 92% 74%
Obongi 96% 93%
Omoro 72% 90%
Otuke 76% 68%
Oyam 95% 94%
Pader 92% 98%
Pakwach 88% 95%
Pallisa 83% 88%
Rakai 82% 77%
Rubanda 75% 71%
Rubirizi 89% 92%
Rukiga 93% 95%
Rukungiri 89% 90%
Rwampara 96% 92%

31
District Management (WUCs functional )
Gender (Woman in Key Position)
Serere 98% 98%
Sheema 95% 97%
Sironko 97% 96%
Soroti 89% 88%
Ssembabule 75% 92%
Tororo 83% 87%
Wakiso 91% 68%
Yumbe 98% 89%
Zombo 78% 75%
National Level 90% 86%

32
ANNEX 9: Status of Water Sources Constructed by District as of June 2020 District Point Water Sources Piped Water Systems
Protected Spring
Shallow well Deep boreholes Rainwater tank PSP/ Kiosk, Tap stands YT HH IC NWSC
F NF Tot F NF Tot F NF Tot F NF Tot F NF Tot
Abim 11 1 12 20 8 28 300 90 390 13 13 26 8 0 8 517 511 9 No
Adjumani 32 9 41 63 11 74 666 66 732 19 28 47 66 12 78 1,364 25 45 No
Agago 7 13 20 128 38 166 868 125 993 17 95 112 25 48 73 0 0 0 No
Alebtong 303 71 374 150 113 263 314 100 414 21 19 40 10 27 37 0 0 0 No
Amolatar 1 4 5 4 7 11 455 87 542 7 28 35 4 2 6 30 4 1 No
Amudat 1 1 2 8 1 9 163 49 212 0 0 0 8 1 9 13 0 4 No
Amuria 10 11 21 56 22 78 445 3 448 0 2 2 0 0 0 0 0 0 Yes
Amuru 123 10 133 40 42 82 410 112 522 11 11 22 3 25 28 0 0 0 No
Apac 9 2 11 34 33 67 393 58 451 56 59 115 8 1 9 0 0 0 Yes
Arua 881 166 1,047 88 42 130 807 53 860 52 65 117 39 37 76 7 0 1 Yes
Budaka 146 10 156 12 6 18 517 22 539 7 12 19 3 6 9 286 19 13 Yes
Bududa 581 16 597 3 1 4 15 5 20 50 3 53 330 83 413 4 0 1 No
Bugiri 197 16 213 152 14 166 714 24 738 126 14 140 40 3 43 784 32 109 Yes
Bugweri 39 2 41 106 0 106 268 8 276 6 9 15 111 0 111 753 5 12 No
Buhweju 283 8 291 26 3 29 1 0 1 42 3 45 159 14 173 0 0 0 No
Buikwe 858 29 887 147 47 194 192 48 240 71 4 75 112 1 113 320 3 13 Yes
Bukedea 222 13 235 102 47 149 230 29 259 6 11 17 12 1 13 350 7 19 No
Bukomansimbi 133 25 158 235 59 294 84 21 105 274 5 279 134 9 143 493 6 15 No
Bukwo 83 39 122 16 3 19 2 1 3 15 7 22 387 151 538 0 0 0 No
Bulambuli 283 31 314 59 10 69 114 10 124 16 1 17 265 74 339 0 0 0 No
Buliisa 27 10 37 70 39 109 114 48 162 9 7 16 114 12 126 45 3 11 No
Bundibugyo 198 58 256 1 0 1 8 4 12 31 13 44 546 281 827 438 50 60 No

33
District Point Water Sources Piped Water Systems
Protected Spring
Shallow well Deep boreholes Rainwater tank PSP/ Kiosk, Tap stands YT HH IC NWSC
F NF Tot F NF Tot F NF Tot F NF Tot F NF Tot
Bunyangabu 205 14 219 148 22 170 20 12 32 47 14 61 290 39 329 0 0 0 No
Bushenyi 623 210 833 122 38 160 20 10 30 56 13 69 200 42 242 36 62 0 Yes
Busia 228 19 247 95 8 103 564 32 596 36 10 46 51 9 60 1,490 102 87 Yes
Butaleja 3 1 4 32 9 41 527 47 574 15 0 15 0 1 1 307 6 12 Yes
Butambala 227 33 260 155 85 240 60 22 82 45 5 50 43 2 45 178 13 3 No
Butebo 171 9 180 13 7 20 245 16 261 8 3 11 0 0 0 0 0 0 No
Buvuma 26 1 27 46 8 54 44 6 50 17 2 19 23 2 25 216 3 12 No
Buyende 0 0 0 5 1 6 471 39 510 24 4 28 10 0 10 4 0 0 No
Dokolo 131 37 168 137 43 180 301 39 340 29 7 36 13 2 15 124 289 10 No
Gomba 98 27 125 224 187 411 169 67 236 83 21 104 26 25 51 5 44 10 No
Gulu 67 20 87 62 22 84 336 70 406 22 18 40 1 8 9 0 0 0 Yes
Hoima 359 3 362 240 55 295 227 33 260 27 42 69 36 1 37 49 17 7 Yes
Ibanda 147 36 183 136 27 163 35 10 45 51 4 55 298 107 405 1,712 197 80 Yes
Iganga 116 4 120 189 12 201 458 8 466 29 13 42 19 0 19 12 0 3 Yes
Isingiro 68 4 72 201 29 230 138 55 193 3,538 30 3,568 539 27 566 464 10 70 No
Jinja 340 11 351 277 100 377 377 53 430 38 16 54 7 6 13 3,870 1,012 1,054 Yes
Kaabong 2 1 3 38 3 41 456 134 590 2 0 2 9 0 9 1 0 0 No
Kabale 539 77 616 4 0 4 13 5 18 194 24 218 956 159 1,115 130 12 7 Yes
Kabarole 237 69 306 404 93 497 27 8 35 91 15 106 171 22 193 1,220 17 96 Yes
Kaberamaido 12 2 14 50 23 73 232 28 260 11 7 18 0 0 0 0 0 0 Yes
Kagadi 349 127 476 320 157 477 155 64 219 66 80 146 17 3 20 0 0 0 No
Kakumiro 124 14 138 178 17 195 175 43 218 40 24 64 0 0 0 0 0 0 No
Kalaki 23 3 26 17 5 22 290 17 307 11 3 14 8 0 8 20 2 1 Yes

34
District Point Water Sources Piped Water Systems
Protected Spring
Shallow well Deep boreholes Rainwater tank PSP/ Kiosk, Tap stands YT HH IC NWSC
F NF Tot F NF Tot F NF Tot F NF Tot F NF Tot
Kalangala 26 0 26 50 20 70 1 1 2 121 6 127 98 3 101 286 6 31 No
Kaliro 1 1 2 33 1 34 509 16 525 10 10 20 1 0 1 414 69 0 Yes
Kalungu 83 50 133 303 126 429 88 32 120 130 8 138 145 4 149 1,132 123 37 Yes
Kampala 0 0 0 0 0 0 0 0 0 0 0 0 0 0 0 0 0 0 Yes
Kamuli 19 2 21 427 68 495 838 72 910 36 24 60 26 9 35 2,237 62 107 Yes
Kamwenge 214 72 286 303 71 374 114 20 134 103 16 119 638 15 653 592 0 10 Yes
Kanungu 1,000 59 1,059 45 8 53 31 32 63 103 15 118 562 61 623 234 40 23 Yes
Kapchorwa 325 1 326 0 0 0 1 1 2 7 6 13 269 51 320 504 121 72 No
KAPELEBYONG 0 0 0 10 9 19 294 2 296 1 0 1 4 0 4 0 0 0 No
Kasanda 19 21 40 165 44 209 143 10 153 57 10 67 69 4 73 27 0 2 Yes
Kasese 642 120 762 57 9 66 57 25 82 75 27 102 1,900 402 2,302 1,356 4 93 Yes
Katakwi 2 0 2 65 4 69 523 34 557 12 10 22 50 0 50 212 37 30 No
Kayunga 73 7 80 227 53 280 511 63 574 34 5 39 81 11 92 1,223 46 88 No
Kazo 4 0 4 97 30 127 83 34 117 581 30 611 0 0 0 0 0 0 Yes
Kibaale 146 43 189 197 44 241 73 8 81 71 14 85 4 0 4 399 7 70 No
Kiboga 66 28 94 88 73 161 125 27 152 111 11 122 114 10 124 112 10 11 No
Kibuku 41 1 42 30 7 37 426 28 454 8 7 15 5 6 11 795 330 34 No
Kikuube 309 4 313 224 40 264 194 31 225 27 26 53 15 0 15 0 0 0 No
Kiruhura 1 0 1 38 26 64 130 54 184 653 58 711 150 5 155 224 159 68 Yes
Kiryandongo 15 6 21 235 57 292 378 36 414 3 6 9 7 0 7 1,096 24 28 Yes
Kisoro 402 85 487 0 0 0 1 1 2 423 25 448 263 42 305 1,324 742 81 Yes
KITAGWENDA 185 43 228 269 35 304 17 3 20 52 11 63 284 62 346 0 0 7 No
Kitgum 4 0 4 14 11 25 761 295 1,056 56 221 277 6 4 10 511 168 244 Yes

35
District Point Water Sources Piped Water Systems
Protected Spring
Shallow well Deep boreholes Rainwater tank PSP/ Kiosk, Tap stands YT HH IC NWSC
F NF Tot F NF Tot F NF Tot F NF Tot F NF Tot
Koboko 218 33 251 90 14 104 304 28 332 9 4 13 33 2 35 198 9 5 No
Kole 176 43 219 209 25 234 300 39 339 17 54 71 12 8 20 8 1 2 No
Kotido 0 0 0 1 1 2 361 157 518 34 4 38 74 4 78 397 9 29 No
Kumi 197 1 198 133 42 175 351 47 398 28 16 44 12 1 13 430 90 52 No
Kwania 12 14 26 77 42 119 348 68 416 26 51 77 9 1 10 292 0 9 Yes
Kween 262 13 275 2 0 2 56 10 66 12 1 13 144 14 158 10 4 5 Yes
Kyankwanzi 22 1 23 139 33 172 284 21 305 86 28 114 66 0 66 359 0 0 No
Kyegegwa 49 25 74 171 42 213 94 43 137 24 47 71 64 0 64 56 0 0 No
Kyenjojo 421 88 509 495 167 662 140 77 217 94 25 119 100 31 131 319 422 30 No
Kyotera 54 13 67 100 71 171 73 49 122 111 36 147 14 1 15 1,290 73 101 Yes
Lamwo 25 0 25 9 5 14 733 180 913 6 17 23 2 2 4 32 0 2 No
Lira 538 67 605 433 69 502 429 50 479 40 30 70 21 10 31 10 0 1 Yes
Luuka 125 4 129 192 11 203 421 17 438 12 1 13 7 0 7 7 0 0 No
Luwero 15 1 16 384 80 464 578 47 625 91 33 124 53 3 56 2,503 145 157 Yes
Lwengo 64 45 109 283 163 446 148 81 229 630 8 638 29 4 33 915 9 29 No
Lyantonde 0 0 0 21 5 26 80 27 107 468 6 474 30 0 30 0 0 0 Yes
Madi Okollo 9 0 9 12 6 18 282 63 345 37 9 46 8 1 9 0 0 0 No
Manafwa 318 6 324 5 0 5 216 21 237 32 3 35 52 4 56 0 0 0 No
Maracha 384 49 433 67 11 78 241 55 296 46 19 65 61 18 79 251 1 26 No
Masaka 116 16 132 304 109 413 57 11 68 104 4 108 3 0 3 0 0 0 Yes
Masindi 437 16 453 506 65 571 221 61 282 69 12 81 18 2 20 14 466 12 Yes
Mayuge 272 7 279 316 35 351 448 31 479 11 0 11 60 0 60 53 0 3 Yes
Mbale 584 34 618 38 7 45 295 45 340 33 10 43 400 101 501 0 0 0 Yes

36
District Point Water Sources Piped Water Systems
Protected Spring
Shallow well Deep boreholes Rainwater tank PSP/ Kiosk, Tap stands YT HH IC NWSC
F NF Tot F NF Tot F NF Tot F NF Tot F NF Tot
Mbarara 136 27 163 59 19 78 131 33 164 1,925 19 1,944 223 54 277 8 0 0 Yes
Mitooma 833 95 928 119 7 126 9 11 20 83 0 83 274 4 278 49 11 10 Yes
Mityana 87 31 118 214 259 473 298 100 398 412 56 468 169 31 200 2,136 0 84 Yes
Moroto 2 1 3 2 0 2 317 69 386 3 6 9 0 0 0 0 0 0 No
Moyo 22 12 34 22 5 27 305 33 338 48 12 60 141 23 164 666 88 38 No
Mpigi 256 17 273 349 195 544 66 44 110 70 27 97 25 2 27 1,190 483 148 Yes
Mubende 36 5 41 228 24 252 223 9 232 58 1 59 9 1 10 245 0 0 Yes
Mukono 593 57 650 247 55 302 365 54 419 158 14 172 99 39 138 290 339 22 Yes
Nabilatuk 0 0 0 2 10 12 95 42 137 7 4 11 20 10 30 5 0 14 No
Nakapiripirit 5 4 9 19 3 22 143 36 179 8 3 11 51 13 64 0 0 0 No
Nakaseke 9 1 10 238 99 337 332 76 408 154 36 190 66 1 67 324 10 16 Yes
Nakasongola 1 0 1 11 35 46 461 34 495 98 60 158 440 28 468 599 32 31 No
Namayingo 24 12 36 114 46 160 286 31 317 81 32 113 19 2 21 192 0 8 No
Namisindwa 529 4 533 12 0 12 87 7 94 36 3 39 117 3 120 676 16 32 No
Namutumba 63 0 63 98 11 109 403 67 470 18 3 21 2 0 2 342 642 29 No
Napak 6 0 6 1 0 1 411 80 491 36 6 42 16 0 16 13 0 4 Yes
Nebbi 126 61 187 39 20 59 486 97 583 41 18 59 45 0 45 3 0 0 Yes
Ngora 6 1 7 147 7 154 275 15 290 12 12 24 14 9 23 285 13 52 No
Ntoroko 67 21 88 83 40 123 60 26 86 15 14 29 109 22 131 0 0 0 No
Ntungamo 764 83 847 375 95 470 159 115 274 110 23 133 439 55 494 550 30 63 Yes
Nwoya 71 9 80 19 26 45 338 72 410 8 11 19 8 11 19 0 0 0 No
Obongi 0 0 0 2 3 5 127 67 194 24 3 27 36 1 37 0 0 0 No
Omoro 10 98 108 5 83 88 276 196 472 2 39 41 1 6 7 0 0 0 No
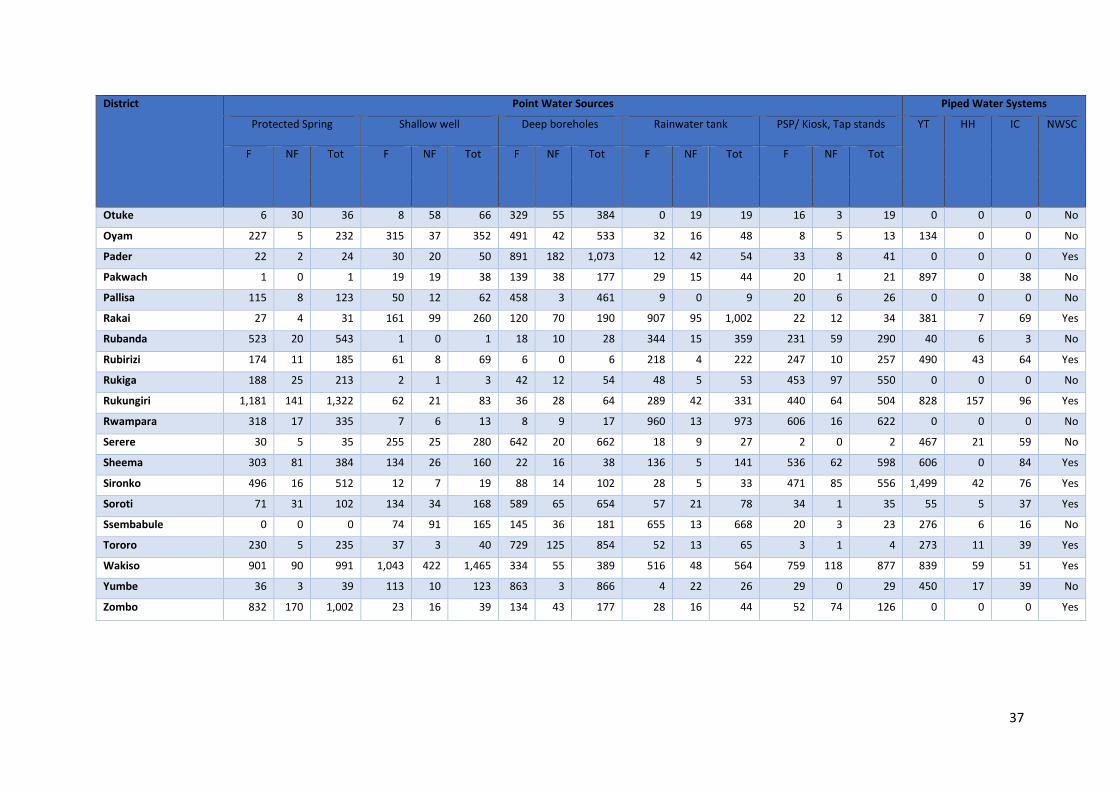
37
District Point Water Sources Piped Water Systems
Protected Spring
Shallow well Deep boreholes Rainwater tank PSP/ Kiosk, Tap stands YT HH IC NWSC
F NF Tot F NF Tot F NF Tot F NF Tot F NF Tot
Otuke 6 30 36 8 58 66 329 55 384 0 19 19 16 3 19 0 0 0 No
Oyam 227 5 232 315 37 352 491 42 533 32 16 48 8 5 13 134 0 0 No
Pader 22 2 24 30 20 50 891 182 1,073 12 42 54 33 8 41 0 0 0 Yes
Pakwach 1 0 1 19 19 38 139 38 177 29 15 44 20 1 21 897 0 38 No
Pallisa 115 8 123 50 12 62 458 3 461 9 0 9 20 6 26 0 0 0 No
Rakai 27 4 31 161 99 260 120 70 190 907 95 1,002 22 12 34 381 7 69 Yes
Rubanda 523 20 543 1 0 1 18 10 28 344 15 359 231 59 290 40 6 3 No
Rubirizi 174 11 185 61 8 69 6 0 6 218 4 222 247 10 257 490 43 64 Yes
Rukiga 188 25 213 2 1 3 42 12 54 48 5 53 453 97 550 0 0 0 No
Rukungiri 1,181 141 1,322 62 21 83 36 28 64 289 42 331 440 64 504 828 157 96 Yes
Rwampara 318 17 335 7 6 13 8 9 17 960 13 973 606 16 622 0 0 0 No
Serere 30 5 35 255 25 280 642 20 662 18 9 27 2 0 2 467 21 59 No
Sheema 303 81 384 134 26 160 22 16 38 136 5 141 536 62 598 606 0 84 Yes
Sironko 496 16 512 12 7 19 88 14 102 28 5 33 471 85 556 1,499 42 76 Yes
Soroti 71 31 102 134 34 168 589 65 654 57 21 78 34 1 35 55 5 37 Yes
Ssembabule 0 0 0 74 91 165 145 36 181 655 13 668 20 3 23 276 6 16 No
Tororo 230 5 235 37 3 40 729 125 854 52 13 65 3 1 4 273 11 39 Yes
Wakiso 901 90 991 1,043 422 1,465 334 55 389 516 48 564 759 118 877 839 59 51 Yes
Yumbe 36 3 39 113 10 123 863 3 866 4 22 26 29 0 29 450 17 39 No
Zombo 832 170 1,002 23 16 39 134 43 177 28 16 44 52 74 126 0 0 0 Yes

38
ANNEX 9: Coverage of Source per Village by District as of June 2020 District Total Admin Units in Analysis
Village without a source Village with a source
County Sub-county Parishes Villages Total % Total %
Abim 1 8 35 311 163 52% 148 48%
Adjumani 1 10 54 208 16 8% 192 92%
Agago 1 16 78 935 328 35% 607 65%
Alebtong 1 9 45 618 135 22% 483 78%
Amolatar 1 11 58 435 121 28% 314 72%
Amudat 1 4 13 169 69 41% 100 59%
Amuria 1 11 64 404 234 58% 170 42%
Amuru 1 5 32 67 0 0% 67 100%
Apac 2 8 31 339 50 15% 289 85%
Arua 4 19 126 1,090 260 24% 830 76%
Budaka 1 13 59 268 34 13% 234 87%
Bududa 1 16 96 956 506 53% 450 47%
Bugiri 1 11 71 396 51 13% 345 87%
Bugweri 1 6 32 134 7 5% 127 95%
Buhweju 1 9 37 227 50 22% 177 78%
Buikwe 1 12 65 485 134 28% 351 72%
Bukedea 1 6 71 156 10 6% 146 94%
Bukomansimbi 1 5 25 255 28 11% 227 89%
Bukwo 1 12 66 525 242 46% 283 54%
Bulambuli 1 19 109 1,209 753 62% 456 38%
Buliisa 1 7 30 131 42 32% 89 68%
Bundibugyo 2 23 83 615 276 45% 339 55%
Bunyangabu 1 10 36 254 50 20% 204 80%
Bushenyi 2 13 64 570 211 37% 359 63%
Busia 2 16 63 543 77 14% 466 86%
Butaleja 1 12 64 423 111 26% 312 74%
Butambala 1 6 25 159 28 18% 131 82%
Butebo 1 7 32 238 54 23% 184 77%
Buvuma 1 9 36 192 122 64% 70 36%
Buyende 1 6 38 351 51 15% 300 85%
Dokolo 1 11 60 466 113 24% 353 76%
Gomba 1 5 37 271 50 18% 221 82%
Gulu 2 10 41 141 57 40% 84 60%
Hoima 2 10 42 338 222 66% 116 34%
Ibanda 2 17 60 648 436 67% 212 33%
Iganga 2 10 51 231 46 20% 185 80%
Isingiro 2 18 91 765 250 33% 515 67%
Jinja 3 12 58 418 150 36% 268 64%
Kaabong 1 19 82 518 238 46% 280 54%
Kabale 2 13 65 684 196 29% 488 71%

39
District Total Admin Units in Analysis
Village without a source Village with a source
County Sub-county Parishes Villages Total % Total %
Kabarole 2 18 56 494 171 35% 323 65%
Kaberamaido 1 6 20 232 48 21% 184 79%
Kagadi 1 18 82 715 236 33% 479 67%
Kakumiro 1 9 47 406 270 67% 136 33%
Kalaki 1 6 20 220 47 21% 173 79%
Kalangala 2 7 17 103 24 23% 79 77%
Kaliro 1 12 39 307 36 12% 271 88%
Kalungu 1 7 39 281 30 11% 251 89%
Kampala 1 5 96 870 870 100% 0 0%
Kamuli 2 16 82 699 86 12% 613 88%
Kamwenge 1 9 43 368 83 23% 285 77%
Kanungu 1 17 71 518 80 15% 438 85%
Kapchorwa 2 15 86 673 382 57% 291 43%
KAPELEBYONG 1 5 32 237 172 73% 65 27%
Kasanda 1 9 77 569 364 64% 205 36%
Kasese 3 32 152 758 253 33% 505 67%
Katakwi 2 10 55 343 48 14% 295 86%
Kayunga 2 9 61 387 50 13% 337 87%
Kazo 1 8 46 314 107 34% 207 66%
Kibaale 1 8 36 259 105 41% 154 59%
Kiboga 1 8 39 240 64 27% 176 73%
Kibuku 1 15 41 245 46 19% 199 81%
Kikuube 1 6 21 256 94 37% 162 63%
Kiruhura 1 10 45 264 60 23% 204 77%
Kiryandongo 1 8 23 237 21 9% 216 91%
Kisoro 1 16 38 400 94 24% 306 77%
KITAGWENDA 1 6 33 254 33 13% 221 87%
Kitgum 1 10 56 538 100 19% 438 81%
Koboko 1 7 49 394 68 17% 326 83%
Kole 1 7 42 569 199 35% 370 65%
Kotido 1 6 26 201 28 14% 173 86%
Kumi 2 8 83 170 60 35% 110 65%
Kwania 1 6 34 399 85 21% 314 79%
Kween 1 12 71 490 233 48% 257 52%
Kyankwanzi 1 12 75 349 113 32% 236 68%
Kyegegwa 1 8 42 463 209 45% 254 55%
Kyenjojo 1 19 99 656 163 25% 493 75%
Kyotera 1 8 38 214 46 21% 168 79%
Lamwo 1 11 55 384 63 16% 321 84%
Lira 2 13 93 775 206 27% 569 73%
Luuka 1 8 43 270 69 26% 201 74%
Luwero 2 13 91 596 167 28% 429 72%

40
District Total Admin Units in Analysis
Village without a source Village with a source
County Sub-county Parishes Villages Total % Total %
Lwengo 1 8 39 458 146 32% 312 68%
Lyantonde 1 7 28 220 61 28% 159 72%
Madi Okollo 1 9 40 283 81 29% 202 71%
Manafwa 1 17 81 616 316 51% 300 49%
Maracha 1 8 42 414 67 16% 347 84%
Masaka 2 9 39 356 98 28% 258 72%
Masindi 3 9 32 317 83 26% 234 74%
Mayuge 1 14 72 493 98 20% 395 80%
Mbale 2 26 121 960 458 48% 502 52%
Mbarara 2 13 59 534 216 40% 318 60%
Mitooma 1 12 62 553 110 20% 443 80%
Mityana 3 14 89 639 227 36% 412 64%
Moroto 2 6 26 154 44 29% 110 71%
Moyo 1 6 27 160 14 9% 146 91%
Mpigi 1 7 56 370 91 25% 279 75%
Mubende 2 10 76 597 420 70% 177 30%
Mukono 3 15 80 631 173 27% 458 73%
Nabilatuk 1 3 15 55 9 16% 46 84%
Nakapiripirit 2 5 19 123 39 32% 84 68%
Nakaseke 1 15 70 372 98 26% 274 74%
Nakasongola 1 11 57 319 55 17% 264 83%
Namayingo 1 9 43 275 62 23% 213 77%
Namisindwa 1 16 83 829 443 53% 386 47%
Namutumba 1 9 37 361 96 27% 265 73%
Napak 1 8 32 251 61 24% 190 76%
Nebbi 1 10 58 530 150 28% 380 72%
Ngora 1 5 64 138 8 6% 130 94%
Ntoroko 1 10 47 209 99 47% 110 53%
Ntungamo 4 21 107 981 241 25% 740 75%
Nwoya 1 5 24 72 11 15% 61 85%
Obongi 1 3 17 69 9 13% 60 87%
Omoro 1 7 29 150 3 2% 147 98%
Otuke 1 8 39 462 181 39% 281 61%
Oyam 1 12 63 978 387 40% 591 60%
Pader 1 12 52 634 139 22% 495 78%
Pakwach 1 5 25 356 166 47% 190 53%
Pallisa 1 12 52 350 66 19% 284 81%
Rakai 2 14 67 545 147 27% 398 73%
Rubanda 1 9 46 460 170 37% 290 63%
Rubirizi 1 11 53 297 71 24% 226 76%
Rukiga 1 6 28 293 52 18% 241 82%
Rukungiri 3 12 80 832 177 21% 655 79%

41
District Total Admin Units in Analysis
Village without a source Village with a source
County Sub-county Parishes Villages Total % Total %
Rwampara 1 4 25 242 17 7% 225 93%
Serere 2 12 51 248 18 7% 230 93%
Sheema 2 14 55 574 350 61% 224 39%
Sironko 1 21 130 1,329 732 55% 597 45%
Soroti 2 10 50 407 115 28% 292 72%
Ssembabule 2 8 39 431 124 29% 307 71%
Tororo 3 21 88 836 218 26% 618 74%
Wakiso 5 23 146 725 150 21% 575 79%
Yumbe 1 13 102 673 153 23% 520 77%
Zombo 1 13 46 599 61 10% 538 90%
Total 188 1,454 7,427 58,020 19,235 33% 38,785 67%

42
ANNEX 10: District Sanitation and Hygiene Benchmarking 2020
Max 10 10 15 25 15 10 15 100
N at 'l T arget / A vg 2.5% 10,000 UGX 01:40 77% 50% Required Required
>=3% = 10 T o p 10 - 10 <=40, 15 >70% = 25 >=50% = 15 >=51 = 10 >=51 = 15 >=76
2% = 5 11th to 20th - 7 41-50 = 10 50-69% = 20 23-49% = 10 21 to 50 = 8 21 to 50 = 10 51-75
1% = 3 21st to 30th - 3 51-60 = 5 25-49% = 15 10-22% = 5 1 to 20 = 5 1 to 20 = 5 26-50
<1% = 0 >=31 - 0 >61 = 0 <24% = 0 <9% = 0 Nil = 0 Nil = 0 0-25
# District
Re
po
rtin
g
Submitt
ing
Annual
Report
Avg
Increase in
HH San
Cvg (2017-
18)
SC
OR
E Financial
Efficiency:S
oftware
Cost per HH
Toilet
Financial
Efficiency
Rank
SC
OR
E
Pupil:Latr
ine
Stance
Ratio
SC
OR
E
% HH San
Cvge
SC
OR
E
% HW
Coverage
SC
OR
E
# of
ODF
villages
SC
OR
E %age of
worked in
villages
that are
ODF
SC
OR
E
GRAND
SCORE 1 Abim NO 0 0 0 47 0 15 71.0 25 0.0 0 0 0% 0 40
2 Adjumani NO 0 0 0 12 3 15 88.6 25 72.0 15 0 0% 0 58
3 Agago NO 0 0 0 1 10 15 66.5 20 0.0 0 0 0% 0 45
4 Alebtong YES 6 10 1965254 48 0 67 0 89.9 25 76.3 15 50 8 0% 0 58
5 Amolatar YES -1 0 6938462 49 0 74 0 85.0 25 71.4 15 20 5 17% 5 50
6 Amudat NO -1 0 0 11 3 15 27.0 15 0.0 0 0 0% 0 33
7 Amuria NO 0 0 0 9 7 15 86.5 25 0.0 0 0 0% 0 47
8 Amuru YES 9 10 393650 130 0 51 5 73.2 25 17.1 5 6 5 0% 0 50
9 Apac YES 0 0 4596125 50 0 58 5 86.0 25 37.2 10 21 8 0% 0 48
10 Arua YES -2 0 0 42 0 15 75.0 25 36.1 10 0 0% 0 50
11 Budaka YES -3 0 0 51 0 15 71.0 25 12.0 5 0 0% 0 45
12 Bududa YES 0 0 0 31 0 15 76.8 25 8.7 0 0 0% 0 40
13 Bugiri NO 0 0 0 52 0 15 81.7 25 0.0 0 0 0% 0 40
14 Bugweri YES 0 0 0 53 0 83 0 93.0 25 33.2 10 0 0 0% 0 35
15 Buhweju YES 0 0 0 3 10 15 87.9 25 21.9 5 0 0% 0 55
16 Buikwe NO 0 0 0 54 0 15 75.0 25 0.0 0 0 0% 0 40
17 Bukedea YES 5 10 1279989 55 0 60 5 93.7 25 59.0 15 30 8 100% 15 78
18 Bukomansimbi YES 0 0 0 56 0 15 63.2 20 22.2 5 0 0% 0 40
19 Bukwo YES 0 0 0 4 10 80 0 75.0 25 14.6 5 4 5 20% 5 50
20 Bulambuli YES 0 0 3226624 29 0 84 0 84.0 25 39.4 10 139 10 11% 5 50
21 Buliisa NO -3 0 0 57 0 15 58.7 20 46.9 10 0 0% 0 45
22 Bundibugyo NO -4 0 0 58 0 15 68.7 20 0.0 0 0 0% 0 35
23 Bunyangabu NO 0 0 0 46 0 15 57.0 20 0.0 0 0 0% 0 35
24 Bushenyi YES 2 5 1829439 59 0 50 5 98.4 25 51.3 15 120 10 48% 10 70
25 Busia NO 0 0 0 60 0 15 89.0 25 0.0 0 0 0% 0 40
26 Butaleja NO 0 0 0 61 0 15 63.2 20 0.0 0 0 0% 0 35
27 Butambala YES 0 0 0 62 0 15 67.0 20 60.2 15 0 0% 0 50
28 Butebo YES 0 0 0 63 0 72 0 83.0 25 26.7 10 0 0 0% 0 35
29 Buvuma YES -3 0 0 64 0 15 38.0 15 8.2 0 0 0% 0 30
30 Buyende YES 0 0 349457 35 0 132 0 86.3 25 32.6 10 2 5 10% 5 45
31 Dokolo YES 0 0 0 65 0 180 0 92.0 25 88.3 15 0 0% 0 40
32 Gomba NO -1 0 0 8 7 15 53.5 20 16.0 5 0 0% 0 47
33 Gulu Yes -2 0 -4850149 38 0 60 5 79.0 25 23.7 10 8 5 40% 10 55
34 Hoima Yes 1 0 0 30 0 15 89.0 25 13.9 5 0 0% 0 45
PROCESS INTERMEDIATE OUTCOME OUTCOME
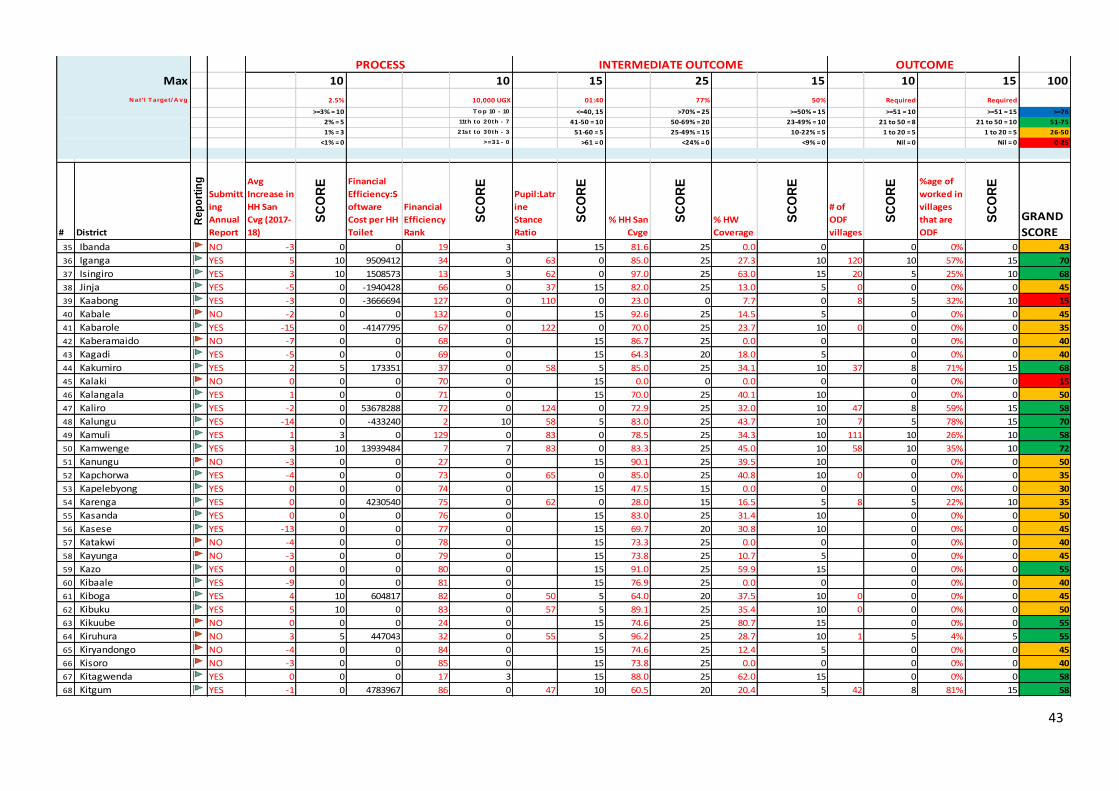
43
Max 10 10 15 25 15 10 15 100
N at 'l T arget / A vg 2.5% 10,000 UGX 01:40 77% 50% Required Required
>=3% = 10 T o p 10 - 10 <=40, 15 >70% = 25 >=50% = 15 >=51 = 10 >=51 = 15 >=76
2% = 5 11th to 20th - 7 41-50 = 10 50-69% = 20 23-49% = 10 21 to 50 = 8 21 to 50 = 10 51-75
1% = 3 21st to 30th - 3 51-60 = 5 25-49% = 15 10-22% = 5 1 to 20 = 5 1 to 20 = 5 26-50
<1% = 0 >=31 - 0 >61 = 0 <24% = 0 <9% = 0 Nil = 0 Nil = 0 0-25
# District
Re
po
rtin
g
Submitt
ing
Annual
Report
Avg
Increase in
HH San
Cvg (2017-
18)
SC
OR
E Financial
Efficiency:S
oftware
Cost per HH
Toilet
Financial
Efficiency
Rank
SC
OR
E
Pupil:Latr
ine
Stance
Ratio
SC
OR
E
% HH San
Cvge
SC
OR
E
% HW
Coverage
SC
OR
E
# of
ODF
villages
SC
OR
E %age of
worked in
villages
that are
ODF
SC
OR
E
GRAND
SCORE 35 Ibanda NO -3 0 0 19 3 15 81.6 25 0.0 0 0 0% 0 43
36 Iganga YES 5 10 9509412 34 0 63 0 85.0 25 27.3 10 120 10 57% 15 70
37 Isingiro YES 3 10 1508573 13 3 62 0 97.0 25 63.0 15 20 5 25% 10 68
38 Jinja YES -5 0 -1940428 66 0 37 15 82.0 25 13.0 5 0 0 0% 0 45
39 Kaabong YES -3 0 -3666694 127 0 110 0 23.0 0 7.7 0 8 5 32% 10 15
40 Kabale NO -2 0 0 132 0 15 92.6 25 14.5 5 0 0% 0 45
41 Kabarole YES -15 0 -4147795 67 0 122 0 70.0 25 23.7 10 0 0 0% 0 35
42 Kaberamaido NO -7 0 0 68 0 15 86.7 25 0.0 0 0 0% 0 40
43 Kagadi YES -5 0 0 69 0 15 64.3 20 18.0 5 0 0% 0 40
44 Kakumiro YES 2 5 173351 37 0 58 5 85.0 25 34.1 10 37 8 71% 15 68
45 Kalaki NO 0 0 0 70 0 15 0.0 0 0.0 0 0 0% 0 15
46 Kalangala YES 1 0 0 71 0 15 70.0 25 40.1 10 0 0% 0 50
47 Kaliro YES -2 0 53678288 72 0 124 0 72.9 25 32.0 10 47 8 59% 15 58
48 Kalungu YES -14 0 -433240 2 10 58 5 83.0 25 43.7 10 7 5 78% 15 70
49 Kamuli YES 1 3 0 129 0 83 0 78.5 25 34.3 10 111 10 26% 10 58
50 Kamwenge YES 3 10 13939484 7 7 83 0 83.3 25 45.0 10 58 10 35% 10 72
51 Kanungu NO -3 0 0 27 0 15 90.1 25 39.5 10 0 0% 0 50
52 Kapchorwa YES -4 0 0 73 0 65 0 85.0 25 40.8 10 0 0 0% 0 35
53 Kapelebyong YES 0 0 0 74 0 15 47.5 15 0.0 0 0 0% 0 30
54 Karenga YES 0 0 4230540 75 0 62 0 28.0 15 16.5 5 8 5 22% 10 35
55 Kasanda YES 0 0 0 76 0 15 83.0 25 31.4 10 0 0% 0 50
56 Kasese YES -13 0 0 77 0 15 69.7 20 30.8 10 0 0% 0 45
57 Katakwi NO -4 0 0 78 0 15 73.3 25 0.0 0 0 0% 0 40
58 Kayunga NO -3 0 0 79 0 15 73.8 25 10.7 5 0 0% 0 45
59 Kazo YES 0 0 0 80 0 15 91.0 25 59.9 15 0 0% 0 55
60 Kibaale YES -9 0 0 81 0 15 76.9 25 0.0 0 0 0% 0 40
61 Kiboga YES 4 10 604817 82 0 50 5 64.0 20 37.5 10 0 0 0% 0 45
62 Kibuku YES 5 10 0 83 0 57 5 89.1 25 35.4 10 0 0 0% 0 50
63 Kikuube NO 0 0 0 24 0 15 74.6 25 80.7 15 0 0% 0 55
64 Kiruhura NO 3 5 447043 32 0 55 5 96.2 25 28.7 10 1 5 4% 5 55
65 Kiryandongo NO -4 0 0 84 0 15 74.6 25 12.4 5 0 0% 0 45
66 Kisoro NO -3 0 0 85 0 15 73.8 25 0.0 0 0 0% 0 40
67 Kitagwenda YES 0 0 0 17 3 15 88.0 25 62.0 15 0 0% 0 58
68 Kitgum YES -1 0 4783967 86 0 47 10 60.5 20 20.4 5 42 8 81% 15 58
PROCESS INTERMEDIATE OUTCOME OUTCOME

44
Max 10 10 15 25 15 10 15 100
N at 'l T arget / A vg 2.5% 10,000 UGX 01:40 77% 50% Required Required
>=3% = 10 T o p 10 - 10 <=40, 15 >70% = 25 >=50% = 15 >=51 = 10 >=51 = 15 >=76
2% = 5 11th to 20th - 7 41-50 = 10 50-69% = 20 23-49% = 10 21 to 50 = 8 21 to 50 = 10 51-75
1% = 3 21st to 30th - 3 51-60 = 5 25-49% = 15 10-22% = 5 1 to 20 = 5 1 to 20 = 5 26-50
<1% = 0 >=31 - 0 >61 = 0 <24% = 0 <9% = 0 Nil = 0 Nil = 0 0-25
# District
Re
po
rtin
g
Submitt
ing
Annual
Report
Avg
Increase in
HH San
Cvg (2017-
18)
SC
OR
E Financial
Efficiency:S
oftware
Cost per HH
Toilet
Financial
Efficiency
Rank
SC
OR
E
Pupil:Latr
ine
Stance
Ratio
SC
OR
E
% HH San
Cvge
SC
OR
E
% HW
Coverage
SC
OR
E
# of
ODF
villages
SC
OR
E %age of
worked in
villages
that are
ODF
SC
OR
E
GRAND
SCORE 69 Koboko NO -6 0 0 87 0 15 74.5 25 2.4 0 0 0% 0 40
70 Kole YES 2 5 1059069 126 0 69 0 81.3 25 31.9 10 0 0% 0 40
71 Kotido YES 49 10 134812 5 10 67 0 53.0 20 2.5 0 0 0 0% 0 40
72 Kumi YES 0 0 19403578 88 0 74 0 89.3 25 63.7 15 0 0 0% 0 40
73 Kwania NO 0 0 0 44 0 15 87.4 25 0.0 0 0 0% 0 40
74 Kween NO -4 0 0 89 0 15 71.8 25 21.7 5 0 0% 0 45
75 Kyankwanzi YES -8 0 -1795124 25 0 57 5 51.3 20 4.7 0 4 5 50% 10 40
76 Kyegegwa YES 3 10 0 36 0 15 86.0 25 38.6 10 0 0% 0 60
77 Kyenjojo YES 9 10 0 90 0 15 98.0 25 37.9 10 0 0% 0 60
78 Kyotera YES 0 0 0 91 0 56 5 78.0 25 28.9 10 16 5 64% 15 60
79 Lamwo YES 0 0 0 92 0 15 59.0 20 35.0 10 0 0% 0 45
80 Lira NO -5 0 0 18 3 15 81.9 25 0.0 0 0 0% 0 43
81 Luuka YES 0 0 1591906 43 0 113 0 69.0 20 33.2 10 4 5 20% 5 40
82 Luwero NO -4 0 0 93 0 15 95.1 25 19.0 5 0 0% 0 45
83 Lwengo NO -11 0 -324798 94 0 60 5 65.0 20 19.8 5 7 5 35% 10 45
84 Lyantonde YES 1 3 1715071 95 0 54 5 90.0 25 65.4 15 4 5 16% 5 58
85 Madi-Okollo YES 0 0 0 22 0 99 0 52.5 20 19.5 5 102 10 67% 15 50
86 Manafwa YES 7 10 570688 20 3 150 0 88.3 25 17.8 5 6 5 30% 10 58
87 Maracha YES -3 0 40056364 131 0 122 0 87.4 25 45.2 10 14 5 5% 5 45
88 Masaka YES 0 0 0 96 0 42 10 84.0 25 31.7 10 4 5 20% 5 55
89 Masindi YES 1 3 473497 97 0 45 10 72.0 25 12.9 5 0 0 0% 0 43
90 Mayuge YES 15 10 0 98 0 15 82.6 25 89.6 15 0 0% 0 65
91 Mbale NO -4 0 0 10 7 15 61.1 20 0.0 0 0 0% 0 42
92 Mbarara YES 0 0 0 99 0 15 99.0 25 41.6 10 0 0% 0 50
93 Mitooma YES -2 0 0 100 0 15 92.7 25 0.0 0 0 0% 0 40
94 Mityana YES 1 3 694680 101 0 40 15 77.1 25 22.2 5 0 0% 0 48
95 Moroto YES -2 0 0 6 7 15 43.6 15 0.0 0 0 0% 0 37
96 Moyo YES 3 10 -1828633 15 3 43 10 96.0 25 56.3 15 30 8 18% 5 76
97 Mpigi YES -4 0 0 102 0 40 15 66.0 20 27.9 10 3 5 20% 5 55
98 Mubende YES 1 0 0 39 0 15 84.0 25 35.7 10 0 0% 0 50
99 Mukono YES 0 0 0 103 0 55 5 83.0 25 25.8 10 6 5 35% 10 55
### Nabilatuk NO 0 0 0 104 0 15 0.0 0 0.0 0 0 0% 0 15
### Nakapiripirit YES 3 5 6929359 125 0 15 49.0 15 75.0 15 5 5 10% 5 60
### Nakaseke NO -4 0 0 128 0 15 70.6 25 9.6 0 0 0% 0 40
### Nakasongola YES -5 0 0 28 0 15 67.1 20 37.3 10 0 0% 0 45
PROCESS INTERMEDIATE OUTCOME OUTCOME

45
Max 10 10 15 25 15 10 15 100
N at 'l T arget / A vg 2.5% 10,000 UGX 01:40 77% 50% Required Required
>=3% = 10 T o p 10 - 10 <=40, 15 >70% = 25 >=50% = 15 >=51 = 10 >=51 = 15 >=76
2% = 5 11th to 20th - 7 41-50 = 10 50-69% = 20 23-49% = 10 21 to 50 = 8 21 to 50 = 10 51-75
1% = 3 21st to 30th - 3 51-60 = 5 25-49% = 15 10-22% = 5 1 to 20 = 5 1 to 20 = 5 26-50
<1% = 0 >=31 - 0 >61 = 0 <24% = 0 <9% = 0 Nil = 0 Nil = 0 0-25
# District
Re
po
rtin
g
Submitt
ing
Annual
Report
Avg
Increase in
HH San
Cvg (2017-
18)
SC
OR
E Financial
Efficiency:S
oftware
Cost per HH
Toilet
Financial
Efficiency
Rank
SC
OR
E
Pupil:Latr
ine
Stance
Ratio
SC
OR
E
% HH San
Cvge
SC
OR
E
% HW
Coverage
SC
OR
E
# of
ODF
villages
SC
OR
E %age of
worked in
villages
that are
ODF
SC
OR
E
GRAND
SCORE ### Namayingo NO 5 10 0 105 0 15 78.2 25 45.3 10 0 0% 0 60
### Namisindwa NO 0 0 0 106 0 15 62.7 20 24.2 10 0 0% 0 45
### Namutumba NO -5 0 0 107 0 15 78.8 25 0.0 0 0 0% 0 40
### Napak YES 0 0 0 14 3 48 10 30.6 15 15.5 5 0 0% 0 33
### Nebbi YES -5 0 0 108 0 15 75.8 25 29.4 10 0 0% 0 50
### Ngora YES 3 5 3929827 109 0 60 5 90 25 50 15 9 5 0.6 15 70
### Ntoroko NO -3 0 0 110 0 15 65 20 72 15 0 0 0 50
### Ntungamo NO -3 0 0 111 0 15 92 25 0 0 0 0 0 40
### Nwoya YES -10 0 1706641 112 0 65 0 67 20 50 10 11 5 0.55 15 50
### Obongi YES 0 0 0 23 0 53 5 87 25 70 15 6 5 0.3 10 60
### Omoro YES 10 10 938902 113 0 72 0 81 25 70 15 0 0 0 50
### Otuke YES -4 0 10606117 114 0 70 0 67 20 17 5 4 5 0.031746 5 35
### Oyam YES 9 10 0 115 0 15 91 25 72 15 0 0 0 65
### Pader YES 10 10 402133 116 0 68 0 69 20 71 15 8 5 0.32 10 60
### Pakwach NO 0 0 0 16 3 15 0 0 0 0 0 0 0 18
### Pallisa YES -7 0 0 124 0 15 77 25 20 5 0 0.0 0 45
### Rakai YES 5 10 387450 133 0 121 0 59 20 34 10 0 0.0 0 40
### Rubanda YES -2 0 0 33 0 15 90 25 17 5 0 0 0 45
### Rubirizi YES 0 0 0 21 0 15 93 25 28 10 0 0.0 0 50
### Rukiga YES 0 0 0 117 0 15 93 25 16 5 0 0.0 0 45
### Rukungiri NO -2 0 0 118 0 15 97 25 0 0 0 0 0 40
### Rwampara NO 0 0 0 119 0 15 0 0 0 0 0 0.0 0 15
### Sembabule NO 5 10 628853 120 0 57 5 75 25 16 5 4 5 0.2 5 55
### Serere NO -7 0 0 121 0 15 82 25 0 0 0 0 0 40
### Sheema NO -2 0 0 122 0 15 93 25 21 5 0 0.0 0 45
### Sironko YES 12 10 0 40 0 15 84 25 97 15 0 0.0 0 65
### Soroti YES -6 0 0 41 0 62 0 82 25 57 15 0 0 0 40
### Tororo YES 19 10 176052 45 0 15 75 25 49 10 0 0 0.0 0 60
### Wakiso YES -18 0 0 26 0 70 0 72 25 10 0 0 0.0 0 25
### Yumbe YES -3 0 0 26 0 84 0 78 25 52 15 0 0.0 0 40
### Zombo YES -3 0 7352394 123 0 15 85 25 51 15 13 5 0.1 5 65
PROCESS INTERMEDIATE OUTCOME OUTCOME

46
District Sanitation Coverage Benchmarking
78
76
72
70
70
70
70
68
68
65
65
65
65
60
60
60
60
60
60
60
60
58
58
58
58
58
58
58
58
55
55
55
55
55
55
55
55
55
50
50
50
50
50
50
50
50
50
50
50
50
50
50
50
50
50
50
48
48
47
47
45
45
45
45
45
45
45
45
45
45
45
45
45
45
45
45
45
45
45
45
45
45
43
43
43
42
40
40
40
40
40
40
40
40
40
40
40
40
40
40
40
40
40
40
40
40
40
40
40
40
40
40
40
40
37
35
35
35
35
35
0
10
20
30
40
50
60
70
80
90 B
uke
dea
Dis
tric
t
Kam
we
nge
Dis
tric
t
Igan
ga D
istr
ict
Ngo
ra D
istr
ict
Kak
um
iro
Dis
tric
t
Oya
m D
istr
ict
Zo
mb
o D
istr
ict
Kye
njo
jo D
istr
ict
Nak
apir
ipir
it…
Ob
on
gi D
istr
ict
To
roro
Dis
tric
t
Ale
bto
ng
Dis
tric
t
Kam
uli
Dis
tric
t
Kit
gum
Dis
tric
t
Man
afw
a D
istr
ict
Gu
lu D
istr
ict
Kik
uu
be
Dis
tric
t
Mas
aka
Dis
tric
t
Mu
kon
o D
istr
ict
Am
ola
tar
Dis
tric
t
Aru
a D
istr
ict
Bu
lam
bu
li D
istr
ict
Kal
anga
la D
istr
ict
Kas
and
a D
istr
ict
Mad
i-O
kollo
Mu
ben
de
Dis
tric
t
Nto
roko
Dis
tric
t
Om
oro
Dis
tric
t
Ap
ac D
istr
ict
Am
uri
a D
istr
ict
Aga
go D
istr
ict
Bu
liisa
Dis
tric
t
Ho
ima
Dis
tric
t
Kab
ale
Dis
tric
t
Kay
un
ga D
istr
ict
Kir
yan
do
ngo
…
Lam
wo
Dis
tric
t
Lw
engo
Dis
tric
t
Nak
aso
ngo
la…
Pal
lisa
Dis
tric
t
Ru
kiga
Dis
tric
t
Iban
da
Dis
tric
t
Mas
ind
i Dis
tric
t
Ab
im D
istr
ict
Bu
giri
Dis
tric
t
Bu
kom
ansi
mb
i…
Do
kolo
Dis
tric
t
Kag
adi D
istr
ict
Kib
aale
Dis
tric
t
Ko
bo
ko D
istr
ict
Ko
tid
o D
istr
ict
Kw
ania
Dis
tric
t
Lu
uka
Dis
tric
t
Nak
asek
e D
istr
ict
Ntu
nga
mo
Dis
tric
t
Ru
kun
giri
Dis
tric
t
So
roti
Dis
tric
t
Mo
roto
Dis
tric
t
Bu
nd
ibu
gyo
Dis
tric
t
Bu
tale
ja D
istr
ict
Pe
rfo
rman
ce S
core
Weak Critical
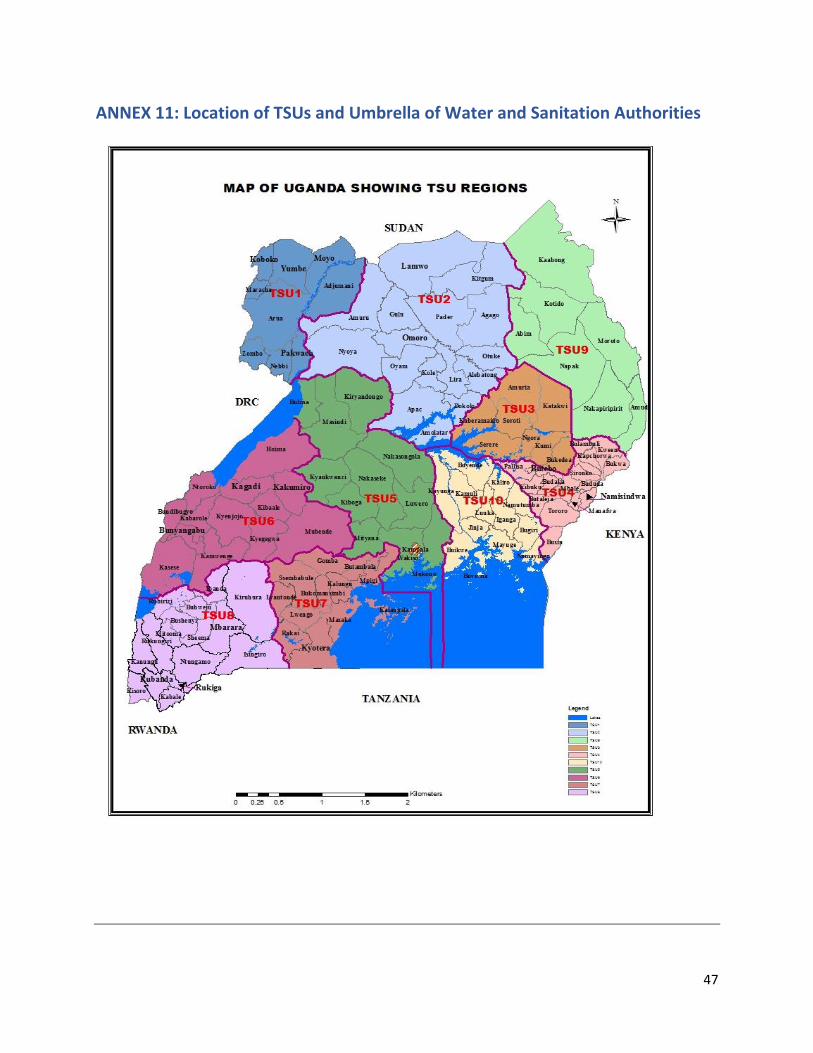
47
ANNEX 11: Location of TSUs and Umbrella of Water and Sanitation Authorities

48
MAP SHOWING REGIONAL UMBRELLA FOR WATER AND SANITATION
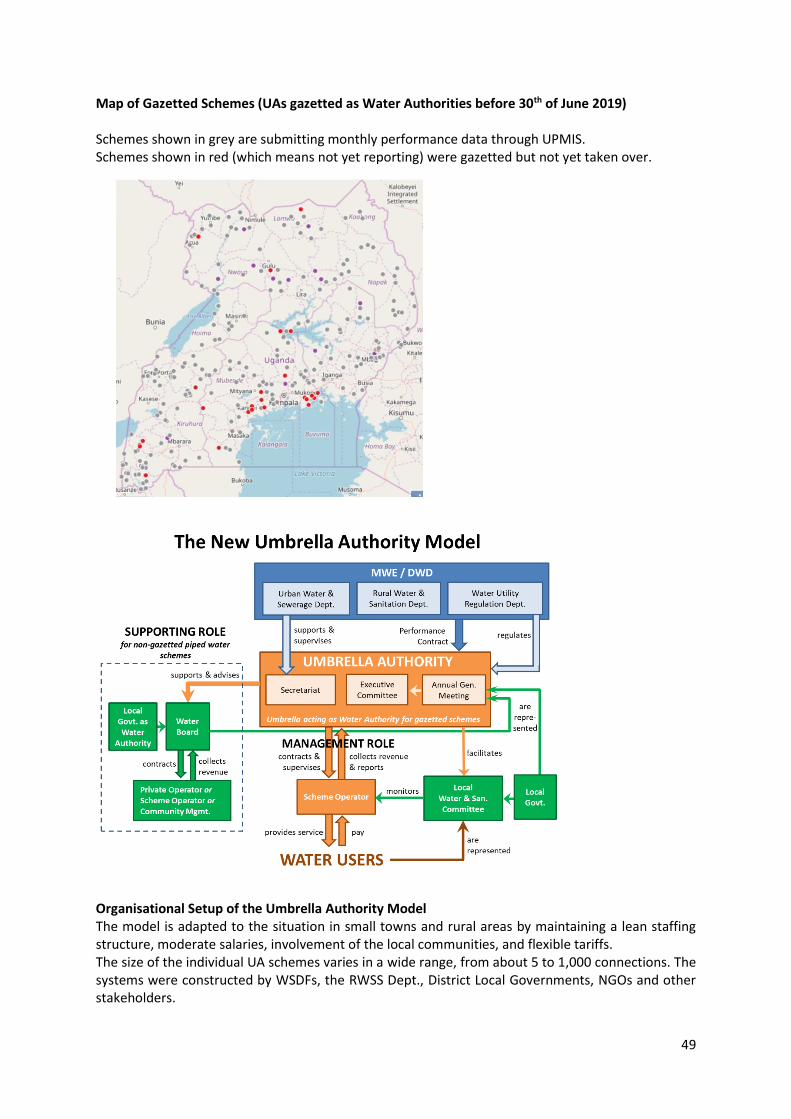
49
Map of Gazetted Schemes (UAs gazetted as Water Authorities before 30th of June 2019) Schemes shown in grey are submitting monthly performance data through UPMIS. Schemes shown in red (which means not yet reporting) were gazetted but not yet taken over.
Organisational Setup of the Umbrella Authority Model The model is adapted to the situation in small towns and rural areas by maintaining a lean staffing structure, moderate salaries, involvement of the local communities, and flexible tariffs. The size of the individual UA schemes varies in a wide range, from about 5 to 1,000 connections. The systems were constructed by WSDFs, the RWSS Dept., District Local Governments, NGOs and other stakeholders.
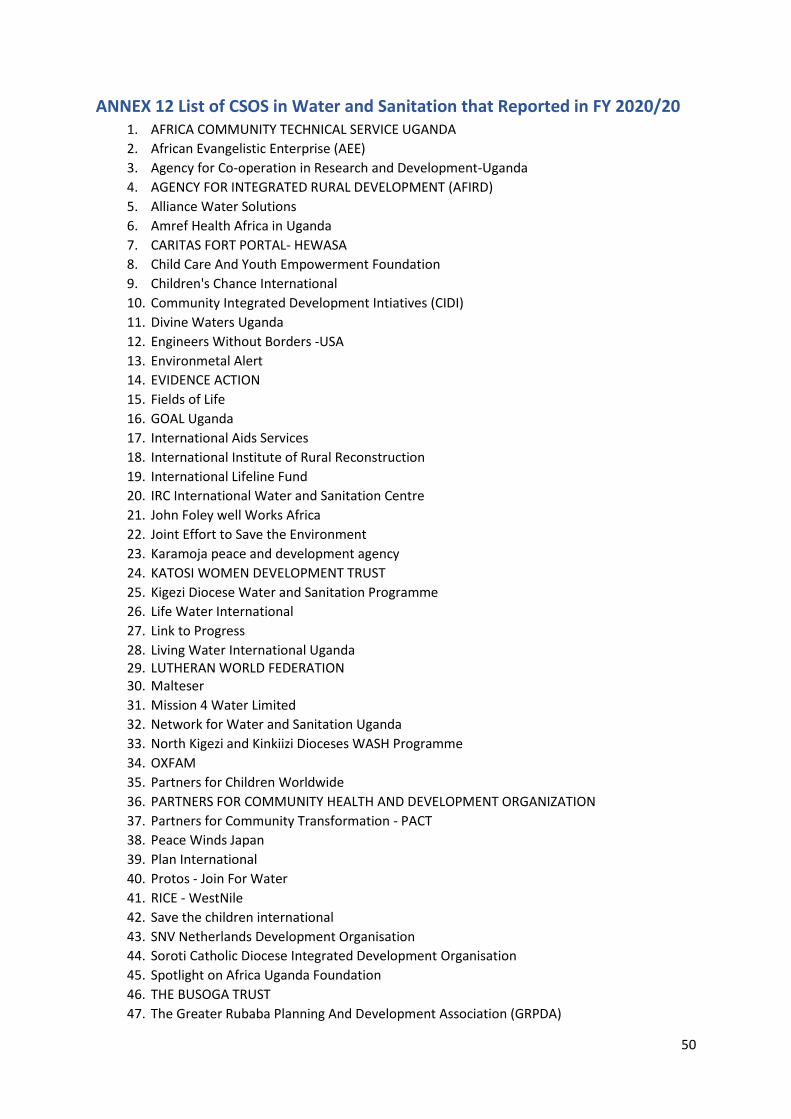
50
ANNEX 12 List of CSOS in Water and Sanitation that Reported in FY 2020/20 1. AFRICA COMMUNITY TECHNICAL SERVICE UGANDA
2. African Evangelistic Enterprise (AEE)
3. Agency for Co-operation in Research and Development-Uganda
4. AGENCY FOR INTEGRATED RURAL DEVELOPMENT (AFIRD)
5. Alliance Water Solutions
6. Amref Health Africa in Uganda
7. CARITAS FORT PORTAL- HEWASA
8. Child Care And Youth Empowerment Foundation
9. Children's Chance International
10. Community Integrated Development Intiatives (CIDI)
11. Divine Waters Uganda
12. Engineers Without Borders -USA
13. Environmetal Alert
14. EVIDENCE ACTION
15. Fields of Life
16. GOAL Uganda
17. International Aids Services
18. International Institute of Rural Reconstruction
19. International Lifeline Fund
20. IRC International Water and Sanitation Centre
21. John Foley well Works Africa
22. Joint Effort to Save the Environment
23. Karamoja peace and development agency
24. KATOSI WOMEN DEVELOPMENT TRUST
25. Kigezi Diocese Water and Sanitation Programme
26. Life Water International
27. Link to Progress
28. Living Water International Uganda 29. LUTHERAN WORLD FEDERATION 30. Malteser
31. Mission 4 Water Limited
32. Network for Water and Sanitation Uganda
33. North Kigezi and Kinkiizi Dioceses WASH Programme
34. OXFAM
35. Partners for Children Worldwide
36. PARTNERS FOR COMMUNITY HEALTH AND DEVELOPMENT ORGANIZATION
37. Partners for Community Transformation - PACT
38. Peace Winds Japan
39. Plan International
40. Protos - Join For Water
41. RICE - WestNile
42. Save the children international
43. SNV Netherlands Development Organisation
44. Soroti Catholic Diocese Integrated Development Organisation
45. Spotlight on Africa Uganda Foundation
46. THE BUSOGA TRUST
47. The Greater Rubaba Planning And Development Association (GRPDA)

51
48. The Water Trust
49. TWAWEZA EAST AFRICA
50. Uganda Health Marketing Group LTD
51. Uganda Muslim Rural Development Association
52. Uganda Sanitation for Health Activity (USHA)
53. Union of Community Development Volunteers
54. Unite for the Environment
55. Voluntary Action for Development
56. Water for People Uganda
57. Water Mission Uganda
58. Wateraid - Uganda
59. Wells Of Life
60. WHAVE SOLUTIONS
61. World Vision Uganda
62. Youth Environment Service