Indonesia Energy Sector Assessment and Priorities, 2020–2024
78
Project Number: 46380-023 TA Number: 9511 May 2020 Indonesia: Sustainable Infrastructure Assistance Program Subproject 14: Indonesia Energy Sector Assessment and Priorities, 2020–2024 This report does not necessarily reflect the views of ADB or the Government concerned, and neither the ADB nor the Government shall be held liable for its contents.
-
Upload
khangminh22 -
Category
Documents
-
view
1 -
download
0
Transcript of Indonesia Energy Sector Assessment and Priorities, 2020–2024
Project Number: 46380-023 TA Number: 9511 May 2020
Indonesia: Sustainable Infrastructure Assistance Program Subproject 14: Indonesia Energy Sector Assessment and Priorities, 2020–2024 This report does not necessarily reflect the views of ADB or the Government concerned, and neither the ADB nor the Government shall be held liable for its contents.


Full Report
Independent Assessment of Indonesia’s Energy Infrastructure Sector
Disclaimer: The views expressed in this publication are those of the review team and do not necessarily reflect the views and policies of the Government.
ii
Photo by Lester Ledesma/ADB
Foreword
Independent Assessment of Indonesia's Energy Infrastructure Sector

iiiIndependent Assessment of Indonesia's Energy Infrastructure Sector
Energy is critical to economic development. But energy policy needs to balance multiple
objectives—security of supply, affordability of access to energy services and sustainability. The tensions between these are readily apparent. The investments required to deliver secure supplies, particularly in a country such as Indonesia with inadequate existing infrastructure and rapid economic growth, make affordability harder to achieve. And an emphasis on minimising prices may work against sustainability—encouraging the use of lower-cost fossil fuels despite their environmental and health damages.Identifying the appropriate policy mix to meet these multiple objectives plays a critical part in the formulation of the energy components of the Rencana Pembangunan Jangka Menengah Nasional, 2020-2024. To assist in this, the Ministry of National Development Planning (Bappenas) has been working closely with the Asian Development Bank and its team of consultants to assess the major challenges facing the energy sector over the next five years and to develop policy proposals responding to these. This White Paper represents the conclusions of this assessment and the proposals that result from it.The proposals set out here emerge from a rigorous evidence-based process. They cover the spectrum of the energy sector, including institutional reforms, support for clean energy, expanding access to modern energy to unserved areas and addressing subsidies while protecting affordability. While some of the policy proposals may be controversial and not all may finally enter into the RPJMN 2024, the process of their development and, particularly, the use of supporting economic analysis of costs and benefits, provides a model for future policy development and appraisal. This publication was produced with funding from the Sustainable Infrastructure Assistance Program (SIAP). SIAP is financed by the Government of Australia and administered by the Asian Development Bank to support sustainable infrastructure development in Indonesia. I would like to thank our partners and the generous financial support that has made this White Paper possible. We welcome the discussion that we expect this White Paper to generate and the comments and feedback that we expect to receive from its readers.
BappenasJakarta, January 2020

iv
Photo by AIan Taylor/ADB
Summary of Policy Recommendations
Independent Assessment of Indonesia's Energy Infrastructure Sector

vIndependent Assessment of Indonesia's Energy Infrastructure Sector
Issues• Unreliable data (e.g.
downward revisions in energy consumption of 34%) hinders policy analysis.
• Data revisions and poor forecasting mean NDC targets in volume terms are excessive and can be achieved without new actions, so do not guide policymaking.
Designed by rawpixel.com & macrovector / Freepik
Issues • A cap (of $70/ton) is currently applied to coal sales to PLN. This
artificially encourages PLN to focus on coal-fired generation while not helping low-income households, as the benefits go to the largest consumers.
• A complex mix of allocation processes and caps also exist in natural gas, leading to inefficiencies in use and lower returns for exploration and development.
• Meanwhile, those local communities adversely affected by fossil fuel production, transport or utilization receive few if any compensating benefits. The central government shares resource production revenues with provinces and regencies, but these funds are not specifically earmarked for the communities that bear the brunt of production activities, and there is currently no funding mechanism to compensate communities or local governments for adverse impacts of fossil fuel transport or utilization.
Policy recommendations1. Improve Data Management and Policy Analysis• ESDM Pusdatin becomes the energy sector data hub, responsible for
verifying and publishing statistics.• Pusdatin advises on the impacts of proposed policies and
annually publishes reports on progress and achievements against targets.
2. Establish a Meaningful Carbon Target• BAU forecasts for emissions are updated annually for data
corrections and revised GDP forecasts. NDC volume targets are recalculated using current percentage commitments and updated
BAU forecasts (19% unconditional and 24% conditional below BAU).
Policy recommendations1. Replace the PLN Coal Price Cap• PLN pays market prices for coal, leading to more efficient planning
and operational decisions.• A price-linked levy is applied to coal exports which is then used to
help fund electricity subsidies for low-income households.
2. Transition to a Single Weighted Average Price for Gas• All new gas is sold as part of a single “pool” with a common price.
Allocation is on the basis of who is willing to pay at this price.• Existing gas contracts are gradually transitioned to the pool and
weighted gas price as they expire.
3. Compensate Affected Communities• Coal mines, transporters and power plants are required to pay
compensation to local communities at the desa level, under supervision of a national program administrator.
• Indicative compensation amounts would be Rp 1 billion per year per desa, equivalent to around Rp 5/kWh for coal power and Rp 4,300/ton of coal produced.
Overall Sector Management
Primary Energy

vi Independent Assessment of Indonesia's Energy Infrastructure Sector
Designed by studiogstock & gstudioimagen / Freepik
Issues • has made impressive progress
in recent years, adding 32 million new customers between 2009 and 2018, increasing electrification rates from 66.3% to 98.3%, and being able to access international capital markets.
• However, there remain major challenges going forward:
> Unrealistic planning leading to excessive reserve margins and costs;
> Poor reliability of supply in certain areas; > An inability to meet renewable energy targets and
continuing dependence on coal; > Increasing subsidy payments to PLN, together with poor subsidy
targeting: only 24% of households with subsidized 450 VA connections are in the bottom 20% of incomes;
> A significant number of households remain without electricity (2.3 million at end-2018 with many in the most remote and highest-cost areas, but 721,000 of which cannot afford connections where the grid already exists);
> PLN's revenue is inadequate to maintain its long-term financial health.
>• These challenges share a number of common root causes:
> A lack of strong oversight of PLN’s planning and operations; > Conflicts of interest over PLN’s multiple roles as planner, buyer,
operator, generator, network business and supplier; > A reluctance by government to adjust tariffs, increase subsidies
or otherwise cause PLN’s cost of supply to increase.
Policy recommendations1. Strengthen Regulation• Create a new regulator, initially working through existing agencies
but ultimately as a new body.• This regulator would recommend tariffs, review investments, oversee
PLN procurement and operations and provide policy advice. A key role would be to recommend a balance of subsidies, tariffs, investment plans and other utility performance targets that are collectively consistent.
• In addition to strong technical competency, the regulator would conduct these tasks transparently and with opportunities for public participation.
• The legal route for establishment and whether this should be a Presidential Regulation, Government Regulation or amendment to the Electricity Law requires further examination.
2. Separate the System Planner, Single Buyer & System Operator Functions• Create a separate system planner + system operator + system
operator entity, in the form of a non-profit government company (a perum, akin to AirNav for air traffic control).
• The new entity will contract with and pay PLN for transmission, distribution and retail services, and purchase bulk power from both PLN and IPPs on a commercial, arms-length basis.
• This separation of functions should be carried out in conjunction with regulatory strengthening described above as well as the transition of tariffs to full cost recovery and the direct delivery of subsidies to targeted customers.
3. Accelerate Use of Renewable Energy• In addition to the above regulatory, planning and procurement reforms,
other barriers to renewable energy need to be addressed, notably removal of price caps, introduction of auctions in place of direct selections, streamlined procurement and negotiations, more balanced risk allocation in PPAs, and relaxation of overly restrictive local content and local ownership requirements.
4. Implement Non-PLN Off -Grid Supply• PLN should be relieved of the costs and difficulties of off-grid electrification,
for which it is not well-suited, by operationalizing existing ESDM regulations (38/2016) that allows for private participation in off-grid supply.
• There are a number of business models that may be considered for private participation, including PLN outsourcing, community-based approaches, and establishing a new ESDM off-grid agency.
5. Optimize Delivery of Electricity Subsidies• Rollout of targeted subsidies using the Unified Poverty Database
should be accelerated, replacing the current blanket 450 VA subsidy.• Previous national programs for connection subsidies should be reinstated.
Electricity
Issues• The potential of energy efficiency is not
being realized: > IEA estimates minimum energy
performance standards (MEPS) for electric motors alone could reduce electricity use by 1%;
> JICA estimates the energy efficiency of commercial buildings in Jakarta is 30-80% worse than Japanese equivalents;
> Imposing best available technology requirements for electrical appliances could reduce peak demand by 25% (with half of this coming from air-conditioners).
• Existing regulations and programs are proving ineffective: > Requirements for mandatory energy
audits for large industrial users under PP 70/2009 are not being enforced;
> Green building codes exist for Jakarta and Bandung but are voluntary with low compliance (an estimated 16 buildings in 2015);
> Various draft MEPS for appliances have not been implemented;
> ESCOs are few in number and no financing market exists.
Policy recommendations1. Enforce and Expand Industrial Energy Effi ciency• Enforce existing PP 70/2009 regulation on energy audit and
introduce MEPS for electric motors.• Establish a dedicated industrial energy efficiency financing facility
within PT SMI.
2. Implement a National Building Effi ciency Program• Create a market for ESCOs by mandating all government facilities to
reduce energy use by a given percentage and making this a KPI. • Roll out green building codes nationally and introduce financial
incentives for compliance.
3. Expand Energy Performance Standards for Appliances• Implement existing but not issued draft MEPS and review and
update all MEPS on a regular basis to bring these closer to best available technology standards.
End-Use Energy Effi ciency

viiIndependent Assessment of Indonesia's Energy Infrastructure Sector
Policy recommendations1. Expand LPG Access• The LPG switching program should continue as should the
expansion of infrastructure and distribution networks in eastern Indonesia. Concerns over subsidy costs should be addressed by better targeting. Concerns about the current account deficit should be addressed by focusing on imports that make a significant contribution to the deficit, and measures that can help increase foreign direct investment and other foreign inflows.
2. Optimize Delivery of LPG Subsidies• The use of blanket subsidies should end. Instead, access to
subsidized LPG should be limited to low-income households verified, for example, by demonstrated access to subsidized electricity, assuming that electricity subsidies are targeted better, as recommended above.
3. Promote Clean Cookstoves as a Transitional Measure• LPG supply infrastructure will take time to extend throughout
Indonesia. As a transitional measure while this infrastructure is developed, improved clean cookstoves should be provided to all households without LPG access.
4. Focus City Gas Expansion for Households• Given the higher costs and risks of large future subsidy
requirements of greenfield city gas supply to households, all such project proposals should be subject to rigorous economic cost-benefit analysis as a basis for selecting target areas.
Designed by studiogstock & macrovector / Freepik
Issues• Explicit subsidies remain for diesel but are poorly targeted.
Government has also created implicit subsidies for gasoline by not fully implementing the market price adjustment formula. The benefits of both these subsidies largely go to richer households.
• The One-Price-Policy requires non-transparent cross subsidies and, because it is linked to RON 88 fuel, is a barrier to phasing out this high-sulfur and polluting fuel that also lowers vehicle efficiency.
• Little has been done to prepare for the introduction of electric vehicles (EVs).
• Domestic fuel products production and storage is inadequate to meet demand and potential supply disruptions, creating fuel security risks
Policy recommendations1. Optimize Delivery of Transport Fuel Subsidies• End existing subsidies and replace them with targeted cash
payments to vulnerable groups. A Petroleum Fund should be created as a “buffer” fund to manage price shocks rather than ad hoc suspension of the adjustment mechanism.
• The One-Price-Policy should be retained but defined as a public service obligation, funded accordingly from the state budget and delinked from RON 88 fuel.
2. Phase-Out RON 88• With the change in the application of the One-Price-Policy, RON 88
fuel should be rapidly phased out and replaced by RON 92.
3. Prepare for Electric Vehicles• Rapid expansion of EVs does not appear economically viable at
this time due to the high costs and low benefits, especially given Indonesia’s carbon-intensive electricity grid.
• However, preparations should be made for expansion including piloting EVs in selected fleet uses and regulatory changes to encourage low-powered electric motorcycles (e.g. relaxing licensing requirements).
4. Establish Fuel Buffer Stocks• Existing requirements on fuel wholesalers to hold 30 days of
operational stocks should be enforced, to protect against shocks, and consideration given to requiring an additional 30 days of stock to be held as Energy Buffer Reserves in government-owned storage facilities in Indonesia.
5. Upgrade and Expand Refinery Capacity• Existing policies to upgrade and expand refining capacity should be
fully implemented to improve security and allow refineries to move away from low-grade fuel production, facilitating its phase-out.
Road Transportation
CookingIssues• The success of the LPG switching program, with over 70% of
households using this as their primary cooking fuel, has raised concerns over rising subsidy costs and increasing imports, thereby increasing Indonesia’s current account deficit.
• However, Indonesia’s current account deficit is not excessive, and in 2018 LPG accounted for only 1.2% of foreign payments. Reducing LPG imports would only have a negligible impact on the current account deficit.
• Existing subsidies, based on 3-kg cylinders, are poorly targeted with, for
example, 70% of households in the top 10% of incomes using subsidized LPG cylinders.• Expansion of city gas to households is being implemented as a means of reducing subsidies
and imports, but this comes at a higher cost than LPG unless large cross
subsidies and low-cost gas supplies are provided, exacerbating problems of
inefficient gas use. • Despite this, 12.7 million households are still
dependent on traditional biomass fuels for cooking, with the consequent health damages and costs in
women’s time.
Summary of Policy Recommendations
Table Of Contents
viii
Photo by Aiko Konishi/Flickr (CC BY 2.0)
Independent Assessment of Indonesia's Energy Infrastructure Sector

ixIndependent Assessment of Indonesia's Energy Infrastructure Sector
Foreword ....................................................................... ii
Summary of Policy Recommendations ...........................iv
Table Of Contents .......................................................viii
1. Introduction ............................................................................................ 2
1.1 Purpose of This White Paper ................................................................................................................ 3
1.2 How This White Paper Was Prepared ................................................................................................. 3
2. Principal Policy Themes ........................................................................... 4
2.1 Energy Efficiency: The First Fuel ......................................................................................................... 5
2.2 Improved Sector Governance ............................................................................................................. 5
2.3 Optimizing Subsidy Delivery ............................................................................................................... 6
2.4 Ensuring Access for All to Modern Sources of Energy ...................................................................... 7
2.5 Assessing Impacts – the Energy Trilemma ........................................................................................ 7
3. Overall Sector Management ..................................................................... 8
3.1 Current Conditions ............................................................................................................................. 9
3.1.1 Data unreliability and planning inconsistencies ........................................................................ 9
3.1.2 Unclear carbon targets ...........................................................................................................10
3.2 Improve Data Management and Policy Analysis .............................................................................. 12
3.3 Establish a Meaningful Carbon Target .............................................................................................. 13
4. Primary Energy .......................................................................................14
4.1 Current Conditions ............................................................................................................................. 15

x Independent Assessment of Indonesia's Energy Infrastructure Sector
4.2 Replace the PLN Coal Price Cap ........................................................................................................ 15
4.3 Transition to a Single Weighted Average Price for Gas .................................................................... 15
4.4 Compensate Affected Communities ................................................................................................16
5. Electricity ...............................................................................................18
5.1 Current Conditions .............................................................................................................................19
5.1.1 Unrealistic planning and excessive reserve margins ................................................................19
5.1.2 Inequitable and inadequate supply quality ..............................................................................19
5.1.3 Lagging renewable uptake and increasing dependence on coal ............................................ 20
5.1.4 Electricity subsidies .................................................................................................................. 20
5.1.5 Achieving universal access ........................................................................................................ 21
5.1.6 Adequacy of PLN revenue ......................................................................................................... 21
5.2 Strengthen Regulation ..................................................................................................................... 22
5.3 Separate the System Planner, Single Buyer &System Operator Functions .................................... 23
5.4 Accelerate Use of Renewable Energy ............................................................................................... 25
5.5 Implement Non-PLN Off-Grid Supply ............................................................................................. 28
5.6 Optimize Delivery of Electricity Subsidies ....................................................................................... 28
5.6.1 Targeting of subsidized 450 VA connections .......................................................................... 29
5.6.2 Automatic tariff adjustments and update of base tariffs ..................................................... 29
5.6.3 Connection subsidies .............................................................................................................. 29
6. End-Use Energy Efficiency ...................................................................... 30
6.1 Current Conditions ............................................................................................................................. 31
6.2 Enforce and Expand Industrial Energy Efficiency .............................................................................33
6.3 Implement a National Building Efficiency Program .........................................................................33

xiIndependent Assessment of Indonesia's Energy Infrastructure Sector
Table Of Contents
6.4 Expand Energy Performance Standards for Appliances ..................................................................33
7. Road Transportation .............................................................................. 34
7.1 Current Conditions ............................................................................................................................. 35
7.1.1 Transport fuel subsidies ............................................................................................................ 35
7.1.2 Electric vehicle readiness .......................................................................................................... 35
7.2 Optimize Delivery of Transport Fuel Subsidies ................................................................................ 35
7.3 Phase Out RON 88 ............................................................................................................................ 36
7.4 Prepare for Electric Vehicles ..............................................................................................................37
7.5 Establish Fuel Buffer Stocks ............................................................................................................. 38
7.6 Upgrade and Expand Refinery Capacity ........................................................................................... 39
8. Cooking .................................................................................................40
8.1 Current Conditions ............................................................................................................................41
8.1.1 Uneven access to modern cooking fuels ..................................................................................41
8.1.2 Large and poorly targeted LPG subsidies ................................................................................ 42
8.2 Expand LPG Access ........................................................................................................................... 42
8.3 Optimize Delivery of LPG Subsidies ................................................................................................. 43
8.4 Promote Clean Cookstoves as a Transitional Measure ................................................................... 43
8.5 Focus City Gas Expansion for Households ......................................................................................44
APPENDIX A : Trilemma Assessment ........................... 48
Endnotes ................................................................................................... 58
Glossary ................................................................................................... 62

2
1. Introduction
Photo by Lester Ledesma/ADB
Independent Assessment of Indonesia's Energy Infrastructure Sector

3Independent Assessment of Indonesia's Energy Infrastructure Sector
1.1 Purpose of This White PaperThe National Medium-Term Development Plan (Rencana Pembangunan Jangka Menengah Nasional, RPJMN) 2020-2024 will guide Indonesia’s central and regional government planning and spending over the coming five years. The Ministry of National Development Planning (Bappenas) compiles the RPJMN through stakeholder consultation and applies a sectoral, technocratic approach to formulate RPJMN policies and programs.
Effective planning, management and operation of the energy sector is key for accelerating economic growth, ensuring the prosperity of all citizens, and preserving our environment. Because of the importance and complexity of the sector, Bappenas has issued this Energy Infrastructure Assessment and Priorities as a “White Paper” to document independent research conducted to inform the formulation of the policies included in the RPJMN. Consequently, recommendations set out in this White Paper do not represent approved policy and may not necessarily align with the final RPJMN 2020-2024.
This White Paper focuses on energy infrastructure and utilization. It does not encompass natural resource utilization and management. Consequently the White
Paper does not discuss topics such as oil and gas exploration and development, or biofuel exploitation.
1.2 How This White Paper Was Prepared
This White Paper has been prepared through a consultative process. An initial series of focus group discussions reviewed past energy sector performance relative to government targets and identified key issues of concern in the sector going forward.
Candidate policies were formulated to address these concerns and assessed based on their expected economic and fiscal impacts. Particular attention was given to how candidate policies balance the often competing objectives of energy security, environmental sustainability and social equity, as reflected by the “energy trilemma” presented in Appendix A.
Policies warranting further consideration were presented at another set of focus group discussions to solicit stakeholder feedback. In addition, a nationwide survey was carried out to gather perceptions and desires of the public at large with respect to the policy issues considered within this White Paper.
4
2. Principal Policy Themes
The recommended policies in this White Paper address
four main themes as shown in Exhibit 1. These themes align with the United Nations Sustainable Development Goals and the RPJMN 2020-2024 agenda.
Photo by Ariel D. Javellana/ADB
Independent Assessment of Indonesia's Energy Infrastructure Sector

5Independent Assessment of Indonesiaís Energy Infrastructure Sector
2.1 Energy Efficiency: The First Fuel
Energy efficiency offers a vast, low-cost energy resource that remains largely untapped in Indonesia. Efficiency measures yield multiple benefits; they can simultaneously and cost-effectively reduce emissions, increase economic competitiveness, reduce fuel imports, and enhance energy security. As just one example, over the past 45 years, it is estimated that reductions in energy intensity in the U.S. have “met” over half of all demand growth, a contribution 30 times that of renewable energy1.
Efficiency measures are particularly important and effective at this stage of Indonesia’s economic development as institutions are being strengthened and capital stocks are growing rapidly. This provides Indonesia the opportunity to rapidly achieve efficiency benefits, in effect leapfrogging more mature economies in terms of efficiency gains.
This White Paper recognizes that energy efficiency goes far beyond those activities normally associated with it, for example building improvements; opportunities exist throughout the energy value chain from production through transformation to consumption and can be realized through a wide range of mechanisms. Critical, and a guiding principle of the recommended policies, is “getting the prices right” so that consumers’ decisions on energy use reflect its “true” value to the nation
2.2 Improved Sector GovernanceGovernance is the process of interaction and decision-making among stakeholders to achieve collectively held objectives. It is the way rules and actions are structured, conducted, maintained, and supervised so as to drive accountability and improve performance. Improved sector governance leads to systemic benefits through a better balance of the trilemma objectives of security, sustainability and equity.
Improved governance directly supports the RPJMN agenda items for environmental protection and climate resilience; ensuring the efficient and timely identification and development of infrastructure needed for economic growth and delivery of basic services; and for transforming public service to achieve better outcomes more quickly.
Improved governance is particularly important as state-owned enterprises (SOEs) are strengthened to undertake functions that the private sector might otherwise avoid, such as implementation of the one-price fuel policy or rural electrification. Strong governance is required to ensure that stronger SOEs do not exercise monopoly power that inhibits private sector investment, particularly foreign direct investment (FDI). In addition, improved governance can help prevent short-term or ad hoc policy flip-flops that might jeopardize the investment climate.
Policies recommended in this White Paper that aim to improve governance include:
• Improving data reporting and policy analysis, since good decisions require good data and comprehensive analysis of the long-term impacts of policy options;
• Redefining and clarifying emissions targets, since emissions have to be measured and targets set if emissions are to be managed;
• Establishing mechanisms to ensure that communities negatively impacted by energy production, transformation or consumption are compensated;
• Strengthening power sector regulation;
• Separating power system planning, generation procurement and system operation from state electricity company PLN; and
• Accelerating renewable energy utilization. Most of the prevailing impediments to increased utilization in Indonesia are regulatory in nature, and hence under control of the government.
Exhibit 1: Key Energy Policy Themes
Realize thepotential of energy
efficency
Deliver access to modern energy
for allImprove sector
governanceOptimize subsidy
delivery

6 Independent Assessment of Indonesia's Energy Infrastructure Sector
2.3 Optimizing Subsidy DeliveryThe RPJMN agenda calls for reducing economic disparities and transforming public services. Ensuring that subsidies are delivered to the right people at the right time in the right amount contributes to both of these goals.
Energy subsidies peaked in 2014 at Rp 341.8 trillion or 19.3% of all state expenditure that year. Energy subsidies were scaled back drastically in 2015 but have started to increase again, and in 2020 are budgeted to reach Rp 125.3 trillion, or 4.9% of the state budget. Much of this subsidy goes to high-income households, implying that better targeting can free up trillions of rupiah for other social or infrastructure spending priorities.
In addition, there are various price controls that result in certain consumers such as fertilizer producers and PLN paying less than market prices for fuels such as natural gas and coal, as discussed in subsequent sections of this White Paper. Suppressing fuel prices below their market value results in inefficient use, and to the extent these price controls result in higher prices to other consumers, can stifle utilization of these fuels for purposes that would otherwise be economically beneficial.
Specific subsidy and pricing reforms recommended in this White Paper include:
• Limiting electricity subsidies to low-income residential consumers as identified through the Unified Poverty Database;
• Restricting access to liquefied petroleum gas (LPG) subsidies to households eligible for electricity subsidies;
• Improving the administration of both implicit and explicit subsidies for Premium (RON 88) gasoline and Solar (2,500 ppm sulfur) diesel fuel;
• Revising the administration of natural gas prices, which are currently set in part according to the consumer’s business;
• Replacing the price cap on the coal benchmark price for sales of domestic coal to PLN with a levy on coal exports to fund targeted electricity subsidies;
• Eliminating general fuel subsidies but retaining the One-Price-Policy, explicitly funding this subsidy from the state budget and replacing subsidized RON 88 gasoline and 2,500 ppm sulfur diesel with higher-quality fuels to improve efficiency and reduce pollution.
EXHIBIT 2: The Energy Trilemma Illustrates How a Policy Balances Fundamental Objectives
Effective management of primary energy supply from domestic and external sources, reliability of energy infrastructure, and ability of energy providers to meet current and future demand.*
Encompasses achievement of supply-and demand-side energy efficiencies and development of energy supply from renewable and other low-carbon sources.*
Accessibility and affordability of energy supply across the population.*
Additionally, fair distribution of costs and benefits of energy supply, for both present and future generations, and open and transparent processes for sector management.
* Definition from World Energy Council, “World Energy Trilemma Index 2017”
SECURITY
SUSTAINABILITY
ACCESS & EQUITY
7Independent Assessment of Indonesia's Energy Infrastructure Sector
Principal Policy Themes
2.4 Ensuring Access for All to Modern Sources of Energy
The state has a constitutional obligation to ensure that natural resources are utilized for the greatest public benefi t. Ensuring that all citizens enjoy the benefi ts of clean, modern fuels refl ects this obligation and contributes to national unity. With respect to the RPJMN agenda, this theme supports the provision of basic services and equitable development.
Despite the remarkable progress Indonesia has made over the past decade in expanding household access to fuels like electricity and LPG, signifi cant geographic disparities remain. Lack of access to these modern fuels either forces households to rely on dirtier fuels like fi rewood, or denies them the economic and welfare benefi ts associated with cleaner fuels like electricity.
This White Paper recommends the following policies under this theme:
• Continuing the rollout of modern fuels such as LPG and electricity to all households;
• For electricity, providing for non-PLN supply to off-grid areas, and improving reliability on-grid;
• Adopting clean cookstoves as an interim measure where supply of modern cooking fuels like LPG is
not yet feasible;
• Phasing out low-quality vehicle fuels such as RON 88 gasoline and high-sulfur content diesel; and
• Addressing concerns over subsidy costs and import levels by better targeting of subsidies, rather than planning widespread rollout of higher-cost substitutes such as city gas without due consideration of the economic costs and benefits of particular projects.
2.5 Assessing Impacts – the Energy Trilemma
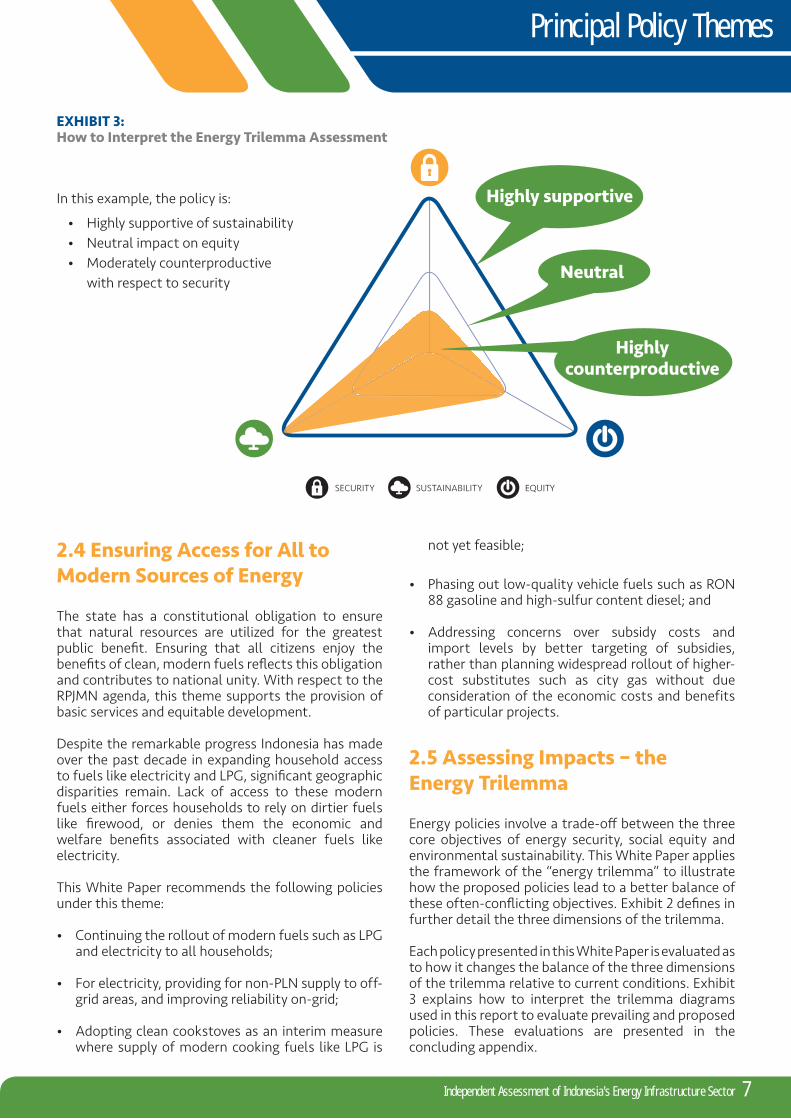
Energy policies involve a trade-off between the three core objectives of energy security, social equity and environmental sustainability. This White Paper applies the framework of the “energy trilemma” to illustrate how the proposed policies lead to a better balance of these often-confl icting objectives. Exhibit 2 defi nes in further detail the three dimensions of the trilemma.
Each policy presented in this White Paper is evaluated as to how it changes the balance of the three dimensions of the trilemma relative to current conditions. Exhibit 3 explains how to interpret the trilemma diagrams used in this report to evaluate prevailing and proposed policies. These evaluations are presented in the concluding appendix.
EXHIBIT 3: How to Interpret the Energy Trilemma Assessment
Highly supportiveIn this example, the policy is:
• Highly supportive of sustainability • Neutral impact on equity• Moderately counterproductive
with respect to security
Highly counterproductive
EQUITYSECURITY SUSTAINABILITY
Neutral

3. Overall Sector Management
Current energy sector data is unreliable due to large
and frequent revisions and inconsistencies. This weakens policymaking and planning, particularly with respect to understanding how to apply Indonesia’s NDC commitments, which are derived from erroneously high estimates of energy demand. Recommended policy responses are: (1) Pusdatin to become a central data hub, to provide analysis of proposed policies and to monitor sector performance; and (2) update BAU forecasts and consequent emissions reductions required under the NDC on an annual basis.
8
Photo by UN Women/Flickr (CC BY-NC-ND 2.0)
Independent Assessment of Indonesia's Energy Infrastructure Sector

9Independent Assessment of Indonesia's Energy Infrastructure Sector
EXHIBIT 4: Final energy consumption – ESDM Handbook of Energy and Economic Statistics
Source: ESDM Handbook of Energy and Economic Statistics, various editions. In each case, data shown is from Table 3.3 (Final Energy Consumption by Type).
3.1 Current Conditions 3.1.1 Data unreliability and planning inconsistencies
Effective policy and planning depends on access to reliable data as a basis to understand trends, forecast impacts and monitor performance. However, this is sadly lacking in Indonesia at present. Most notably, estimates of energy demand have been subject to major revisions over time. To take one example, as illustrated below in Exhibit 4, estimated 2014 final energy consumption (FEC) as reported in the 2015 Handbook of Energy and Economic Statistics (HEES) published by the Ministry of Energy and Mineral Resources (Kementerian Energi dan Sumber Daya Mineral, ESDM) was 1,293 million barrels of oil equivalent (BOE). By the 2018 HEES, this had become 856 million BOE, a downward revision of 34%. If using the 2015 HEES, energy intensity2 fell by 0.9% annually
between 2010 and 2014. If using the 2019 HEES, it fell by 3.1% annually. Clearly, it is impossible to understand the true performance of the energy sector with such contradictory data.
The impacts of these data weaknesses can be seen in the inconsistencies across energy sector plans. Exhibit 5 shows electricity demand forecasts to 2025 under the National Energy Plan (Rencana Umum Energi Nasional, RUEN) 2015-2050, the National Electricity Plan (Rencana Umum Ketenagalistrikan Nasional, RUKN) 2019-2038, and PLN’s Electricity Supply Business Plan (Rencana Usaha Penyediaan Tenaga Listrik, RUPTL) 2019-2028. Exhibit 6 shows the corresponding projections for renewable energy capacity additions3. Evident are the large differences in demand forecasts and corresponding requirements for renewable energy investment. Assessments of whether performance is on track and whether further policy support is required are exceedingly difficult to make with such a wide range of policy targets.
1,400,000
1,200,000
1,000,000
800,000
600,000
400,000
200,000
0
thou
sand
BO
E
2000
2001
2002
2003
2004
2005
2006
2007
2008
2009
2010
2011
2012
2013
2014
2015
2016
2017
2018
2018 edition 2016 edition 2015 edition
2014 FEC (thousand BOE)2015 HEES : 1,292,796 2016 HEES : 1,114,003 (-14%)2018 HEES : 855,552 (-34%)

10 Independent Assessment of Indonesia's Energy Infrastructure Sector
EXHIBIT 5: Electricity demand forecasts to 2025 (alternative plans)
Source: RUEN 2015-50, RUKN 2019-38 and RUPTL 2019-28.
800
700
600
500
400
300
200
100
0
Dem
and
(TW
h)
2014
2015
2016
2017
2018
2019
2020
2021
2022
2023
2024
2025
RUPTL 2019-28RUKN 2019-38 (medium case)
RUEN 2015-50Actual
3.1.2 Unclear carbon targets
Data problems also feed through into a lack of clarity over Indonesia’s emissions targets. Under its Nationally Determined Contribution (NDC) to reduce emissions under the Paris climate agreement, Indonesia has made the following commitments:
• Unconditional (energy sector): Reduce total greenhouse gas (GHG) emissions by 29% by 2030 from the Business-As-Usual (BAU) level.
• Conditional (energy sector): Reduce total GHG emissions by 38% by 2030 from the BAU level.
The NDC converts these targets into reductions in the volumes of emissions from each sector. For the energy sector, the targets contained in the NDC are:
• Unconditional (energy sector): Reduce energy sector GHG emissions by 314 million tons of carbon dioxide equivalent (MtCO2e) by 2030 from a BAU projection of 1,669 MtCO2e. This corresponds to
a reduction in energy sector emissions relative to BAU levels of 19%.
• Conditional (energy sector): Reduce energy sector GHG emissions by 398 MtCO2e by 2030, corresponding to a reduction of 24% relative to BAU levels.
The most recent official projections for emissions under a BAU pathway are those prepared in 2016 by the Center for Data and Information Technology (Pusat Data dan Teknologi Informasi, Pusdatin) within ESDM4. These show a much lower level of emissions by 2030 than those projected under the BAU pathway contained in the NDC. The differences arise from:
• The baseline value in 2010 used in the NDC exceeding ESDM’s estimate of emissions in the same year by 67 MtCO2e.
• A downward revision in estimated emissions in 2014, corresponding to revisions to estimated final energy consumption in Indonesia to remove double

11Independent Assessment of Indonesia's Energy Infrastructure Sector
Overall Sector Management
counting of fuel stocks. This reduces emissions by 45 MtCO2e in 2014.
• A slower projected rate of economic growth, which translates into slower growth in energy consumption and emissions. The BAU pathway in the NDC projects energy sector emissions as growing by 6.7% annually. By contrast, the updated 2016 estimates from Pusdatin project average annual growth of 5.7% annually.
The combined impacts are that, by 2025, energy sector emissions under the updated BAU pathway are some 457 MtCO2e or 38% below those under the BAU pathway in the NDC. By 2030, the difference reaches 671 MtCO2e or 40% (see Exhibit 7).
The implication of this is that Indonesia could actually increase the rate of growth in carbon intensity and emissions very significantly and still achieve the absolute reductions targeted under the NDC. The relationship between emissions growth and changes
in population, income, energy intensity and carbon intensity is given by the Kaya Identity, as below:
Kaya Identity5
Δ Emissions (%) = Δ Population (%) + Δ GDP Per Capita (%) + Δ Energy Intensity (%) + Δ Carbon Intensity (%)
Indonesia’s population growth is projected at around 1% annually on average to 2030. GDP per capita growth is projected as averaging 5.4% annually6. Energy intensity is assumed to decline by 1% annually in line with existing macro-level targets. Applying these inputs in the Kaya identity, Indonesia would be able to increase carbon intensities by 2.4% annually and still reduce emissions by 2030 by 341 MtCO2e (19%) from the BAU forecast in its NDC. For comparison, over the last 10 years, carbon intensity has risen by an average of 0.1% annually7, implying a large acceleration in carbon intensity growth would still be consistent with the NDC target. This is clearly not a desirable target but is the one that results from the combination of data revisions and the NDC targets as expressed.
EXHIBIT 6: Cumulative renewable energy capacity additions to 2025 (alternative plans)
Source: RUEN 2015-50, RUKN 2019-38 and RUPTL 2019-28.
30
25
20
15
10
5
0
Capc
ity (M
W)
2019
2020
2021
2022
2023
2024
2025
RUPTL 2019-28 RUKN 2019-38 (medium case) RUEN 2015-50

EXHIBIT 7: Estimated BAU emissions pathways for Indonesia
Source: NDC (2016), ESDM (2016) and BP Statistical Review (2019)
3.2 Improve Data Management and Policy Analysis
The multiple inconsistencies across different published plans and the frequent and large revisions to data as highlighted above make clear the weaknesses of the current arrangements for sector oversight and analysis. In turn, these will undermine the development of future policy, the setting of meaningful targets, and the monitoring of performance against these targets.
To address this, the following key actions should be undertaken:
• Pusdatin should be given a mandate and budget to consolidate and ensure the consistency of all energy sector data prepared by state agencies and enterprises and to publish this on a central website. This does not prevent agencies publishing their own statistics—but these should be confirmed with Pusdatin first and any divergences and inconsistencies identified and resolved.
Photo by Hermitianta Prasetya Putra/Flickr (CC BY-ND 2.0)
1,800
1,600
1,400
1,200
1000
800
600
400
200
0
mill
ion
tCO
2
0 1 2 3 4 5 6 7 8 9 10 11 12 13 14 15 16 17 18 19 20
Reported ActualPusdatin – BAU
NDC – UnconditionalNDC – BAU
12 Independent Assessment of Indonesia's Energy Infrastructure Sector

Overall Sector Management
• Pusdatin should also be given a mandate as well as the necessary budget and staff to review and advise on the impacts of proposed energy sector policies in terms of their expected outcomes relative to overall sector objectives and targets and on their consistency with existing policies. This will enable contradictory and ineffective policies to be identified at an early stage and consequent amendments made.
• Building on these two functions, Pusdatin should annually publish reports on progress in implementing key policies and achievements against targets and plans to enable monitoring of performance by stakeholders and the identification within government of areas for improvement.
Giving Pusdatin the role of policy analysis does not imply that it makes policy. Such a role would be advisory only, in order to improve the information available to policymakers and, in turn, to improve the overall quality of policymaking. This is a similar role to that of the various fiscal and budget responsibility agencies seen in other countries, but in the energy sector. An Indonesian equivalent would be the Fiscal Policy Agency (Badan Kebijakan Fiskal, BKF), whose functions include analysis of fiscal and financial sector policies and monitoring and evaluation of their implementation.
As Pusdatin is an agency within ESDM, it would be inappropriate for it to publicly deviate from or be perceived as criticizing ESDM policies. Therefore, the final advice and analysis should be provided internally. However, this does not prevent Pusdatin from conducting stakeholder consultations as part of the process of policy analysis to share its findings and solicit feedback. In future, if the function of electricity regulation is strengthened as advocated elsewhere in this White Paper, the regulator should also take on some of these review and advisory responsibilities
13
with respect to the power sector and should publish its findings as a basis for public input.
3.3 Establish a Meaningful Carbon Target
On current trends, given recent data revisions and lower rates of economic growth, Indonesia will comfortably exceed its targeted emissions reductions in the energy sector under its NDC with no change in current policies. The consequence of this is that the NDC target is no longer useful as a guide to policymaking and planning for the sector.
By default, therefore, policies and plans are now guided by input measures, such as the oft-quoted 23% share for renewable energy generation by 2025, rather than by output measures, such as the volume of emissions reductions. This is an inefficient approach: it fails to assess what is the least-cost means of reducing emissions and what levels of emissions reductions are achievable at an acceptable cost. In particular, this tends to further reinforce the existing bias in energy sector planning against measures designed to curb energy demand and to use energy more efficiently. If energy demand is already well below the levels assumed in the published NDC BAU case, then this weakens the argument for further efficiency measures.
To address this, the recommended policy is to update the BAU forecasts on an annual basis to reflect the impacts of revisions in underlying energy sector supply, demand and emissions data. The unconditional target will remain as reducing emissions by 2030 to 19% below their BAU level. However, the translation of this into absolute emissions reductions (in tons of carbon dioxide equivalent) and, therefore, into energy planning will be recalculated annually using the updated BAU forecasts.
Independent Assessment of Indonesia's Energy Infrastructure Sector
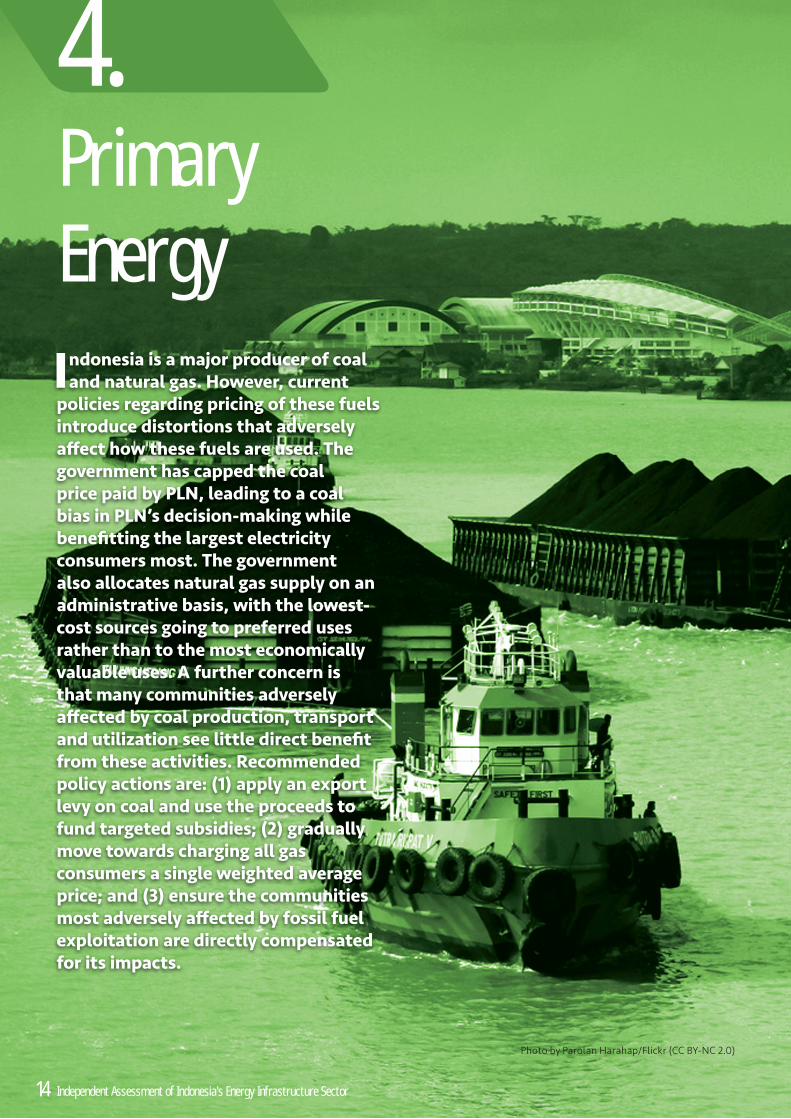
4. Primary EnergyIndonesia is a major producer of coal
and natural gas. However, current policies regarding pricing of these fuels introduce distortions that adversely aff ect how these fuels are used. The government has capped the coal price paid by PLN, leading to a coal bias in PLN’s decision-making while benefi tting the largest electricity consumers most. The government also allocates natural gas supply on an administrative basis, with the lowest-cost sources going to preferred uses rather than to the most economically valuable uses. A further concern is that many communities adversely aff ected by coal production, transport and utilization see little direct benefi t from these activities. Recommended policy actions are: (1) apply an export levy on coal and use the proceeds to fund targeted subsidies; (2) gradually move towards charging all gas consumers a single weighted average price; and (3) ensure the communities most adversely aff ected by fossil fuel exploitation are directly compensated for its impacts.
14
Photo by Parolan Harahap/Flickr (CC BY-NC 2.0)
Independent Assessment of Indonesia's Energy Infrastructure Sector

15Independent Assessment of Indonesia's Energy Infrastructure Sector
4.1 Current ConditionsIndonesia is one of the largest coal exporters in the world. In 2018, the country produced 548.6 million tons (mt) of coal8, of which 429 mt were exported9. In addition to requiring miners to dedicate a portion of their production (currently 25%) to the domestic market, the government has also capped the price that PLN pays for this coal at a benchmark price of USD 70/t. The largest electricity consumers receive the largest benefit of this price control, making this a regressive subsidy. Moreover, PLN plans its generation capacity expansion based on this artificial price, which locks in a reliance on coal for decades to come without due consideration of the potential future economic costs.
Indonesia is also among the top 10 gas exporters globally. In 2018 the country produced 73 billion cubic meters (bcm) of natural gas, of which 39 bcm were consumed domestically10. However, this gas production is stagnant: domestic consumption has flattened since 2012 while exports have declined.
While, on average, Indonesian gas prices appear to be competitive with regional peers, the pricing for any particular consumer is both complex and opaque. Prices are negotiated on a field-by-field basis between buyer and seller, but multiple limitations exist on what prices can be charged.
The government also intervenes through an allocation process under which it decides which customers receive gas from which fields – a mechanism whereby lower-priced gas is directed to preferred uses such as fertilizer production – providing an implicit subsidy to those users. This creates dependency of preferred users on cheap gas, which is unsustainable in the long run as demand will ultimately exceed available low-cost supply. At the same time, other industrial users and power generation are left with higher-priced gas. This pricing policy also tends to deter investment in upstream exploration and development due to concerns over what prices will be permitted depending on the allocation of gas supply.
The domestic extraction, transport and utilization of fossil fuels can both benefit and damage the local communities where these activities take place. This mixed impact on local communities is reflected in a survey of households living near coal-fired power plants. These households expressed mixed feelings about the plants: just over 70% of respondents said it created economic opportunities, but nearly 60% said it had a bad impact on health and approximately 50% said it had a bad impact on the environment.
While Indonesia has a mechanism that reallocates a portion of funds received by the central government
from natural resource extraction to those provinces and regencies where the extraction takes place (Natural Resource Profit Sharing Funds or Dana Bagi Hasil – Sumber Daya Alam, DBH-SDA), there is no mechanism that ensures that these funds directly benefit the local communities that bear the brunt of these activities. Moreover, this mechanism only redistributes government revenues earned from natural resource production, and does not provide compensation for adverse effects of transport or utilization or natural resources like coal.
4.2 Replace the PLN Coal Price CapThe near-term objective of the prevailing coal price cap policy on sales to PLN is to minimize electricity prices. However, this arrangement incentivizes PLN to utilize coal more extensively than if it were priced economically, locks in coal-fired generating capacity for decades to come, and benefits the largest electricity consumers the most.
An alternative is to establish a mechanism analogous to the Oil Palm Plantation Fund Management Agency (Badan Pengelola Dana Perkebunan Kelapa Sawit, BPDPKS), which imposes a levy on palm oil exports and uses the proceeds for a number of initiatives to sustainably support the palm oil industry. A similar mechanism could be applied to coal to better reflect the economic costs and benefits of coal utilization while directing proceeds for subsidies to targeted electricity consumers.
Under this mechanism PLN would pay the market price for the coal it uses. PLN would base its generation expansion planning on a forecast of future market prices for coal with differences between these forecasts and actual prices being picked up by the tariff adjustment mechanism (assuming the current suspension is lifted). Coal exports would then be subject to a levy that would fund subsidies to vulnerable electricity consumers.
This mechanism would greatly contribute to the sustainability of the electricity sector by removing artificial incentives for PLN to use coal. It would enhance equity by creating a pool of funds for a more targeted electricity subsidy. Finally, it would improve security by forcing PLN to plan for a future with uncertain and potentially volatile coal prices.
4.3 Transition to a Single Weighted Average Price for Gas
Over time the current mix of individually negotiated and regulated gas prices and the policy of giving

preference to selected users should be replaced by a policy of selling at a single production weighted average price (WAP, a “‘pooled” price). This will:
• Reduce the risk of “locking in” unsustainably low prices that, in future, must be covered by state subsidies. If prices recover the average cost of gas purchases, then, by definition, they remain sustainable without the need for such subsidies.
• Allows for the “rolling-in” of higher gas prices from new fields in a way that increases costs to all users slightly, rather than increasing costs to a small number of users by a large amount. This helps address disincentives working against increased exploration and development and against increased sales to the domestic market.
• Reduces demand from “lower value-added” uses where gas consumption is only viable at below-market prices. In the longer run, this will lead to a more efficient allocation of gas supplies.
A single aggregator would buy gas under new contracts and sell it on to users at WAP plus infrastructure charges and a trading margin. For practical reasons, the aggregator will most likely need to be part of state gas company Pertagas/PGN given its existing market dominance and role as counterparty to existing gas sales and purchase agreements. The aggregator would be established as a legally separate but wholly owned subsidiary to allow ring-fencing of its accounts and
facilitate monitoring of its performance.
Existing gas contracts would remain in force but, as these expire, replacement contracts would be signed with the aggregator. Existing customers of Pertagas/PGN would be gradually moved to WAP from current contract prices over time, the transition period allowing users currently receiving gas at below-average prices to adjust to the change.
Subsidies delivered through gas pricing at present, such as to fertilizer production and city gas for households, would need to either be gradually removed or replaced by direct subsidies from the state budget to these consumers. As with other subsidy reforms, this is generally desirable as a means of increasing transparency in subsidy provision and oversight of subsidies. There would be potentially offsetting benefits from lower gas prices to power and, hence, lower electricity subsidies and increased access for industrial customers to competitively priced gas supplies, reducing their needs for indirect support and subsidies.
4.4 Compensate Affected Communities
As a matter of equity, communities that suffer from the negative externalities of fuel production, transport and utilization should be compensated for these impacts.
16
Photo by Gerhard Joren/ADB
Independent Assessment of Indonesia's Energy Infrastructure Sector

Primary Energy
This compensation goes beyond any initial compensation paid for land access or right-of-way to include continuing impacts arising from operation of these facilities.
For example, communities located near coal-fired power plants suffer the adverse impacts of coal utilization but are not compensated from resource revenues or electricity sales. This in turn increases opposition to such plants and can delay their development, even where economically justified. As noted above, a survey of households in the vicinity of two coal-fired power plants (one in Banten province, the other in East Java province) revealed mixed feelings about the plants: just over 70% of respondents said it created economic opportunities, but nearly 60% said it had a bad impact on health and approximately 50% said it had a bad impact on the environment.
A model for such a program is Thailand’s Power Development Fund (PDF), which, among other things, funds development activities in communities affected by power plants. These needs are determined through surveys of conditions in the communities and in consultation with community committees with the majority of their membership coming from citizens in the community. A similar arrangement could be established in Indonesia to address negative impacts of domestic fuel extraction and transport and electricity generation, starting with coal. Power plants could be charged according to the quantity of non-carbon dioxide emissions (e.g. sulfur dioxide, nitrogen oxides, particulates, and other hazardous air pollutants) each
produces per year. Transporters could be charged based on the tons of fuel per year they send through a particular location. And miners could be charged based on their total acreage under production. Organization of committees and distribution of funds would be at the level of affected desa, or village, with desa eligibility determined by proximity to the location of production, transport or utilization.
Given the fragmented nature of permitting for coal mines, it is difficult to determine the exact number of coal mining companies and concessions in operation. It is assumed here that there are approximately 300 coal mining companies in Indonesia operating about 1,300 concessions. It is also assumed there are approximately 200 coal-fired power plants across the country. Transport is not considered at this time. If each of these coal-fired power plants and coal mining concessions was eligible for funding at half the level of that provided in Thailand by the PDF for each eligible area (approximately Rp 1.8 billion per area, which may could cover multiple desa), the total cost would be Rp 2.7 trillion (USD 191 million) per year. This compares to an average annual allocation of about Rp 1 billion per desa.
In the event the government did not want to fund any of this from the state budget and assuming coal production of 450 million tons per year and coal-fired generation of 150 terawatt-hours (TWh), this amount could be recovered through a levy of approximately Rp 5 per kilowatt-hour (kWh) on electricity and Rp 4,300/t of coal produced.
17Independent Assessment of Indonesia's Energy Infrastructure Sector

5. Electricity
PLN has made remarkable progress in recent years
extending supply, streamlining connection processes and securing capital in global fi nancial markets. However, Indonesia is failing to meet its renewable energy targets, electricity subsidies have increased, electricity access and reliability varies greatly by region, defi ciencies in system planning have resulted in excess capacity and increased cost of supply, and PLN’s fi nancial position is precarious. Recommended policy measures are: (1) strengthening of regulatory oversight with an emphasis on transparency and participation; (2) restructuring of PLN to improve transparency and reduce confl icts of interest; (3) removing the multitude of barriers to renewable energy expansion; (4) implementing regulations opening up off -grid supply to non-PLN entities; and (5) improving the targeting of subsidies while also restoring tariff adjustment mechanisms.
18
Photo by Sean Crowley/ADB
Independent Assessment of Indonesia's Energy Infrastructure Sector

19Independent Assessment of Indonesiaís Energy Infrastructure Sector
5.1 Current ConditionsTotal electricity consumption in Indonesia in 2018 was 271 TWh, of which 235 TWh was consumed by PLN customers and the remaining 36 TWh by self-generators and customers of private power utilities (PPUs). In terms of installed nameplate capacity, PLN and its subsidiaries represented 40,815 megawatts (MW), independent power producers (IPPs) selling to PLN 15,023 MW, self-generators 5,459 MW, and PPUs 3,582 MW11. Given the dominance of PLN, policies proposed here focus on the supply of power from PLN.
The Indonesian power sector has made impressive progress in several key areas:
• In the 10 years from 2009 through 2018, PLN connected nearly 32 million new consumers. By the end of 2018, PLN had 71.9 million customers, placing it among the largest electricity utilities in the world. The electrification ratio over this period increased from 66.3% to 98.3%12;
• From 2014 to 2019, Indonesia moved up from 101st place to 33rd among 190 countries in terms of the ease of getting electricity, as reported by The World Bank in its Ease of Doing Business report13;
• PLN has been able to go to international capital markets for its financing needs and enjoys the same investment-grade rating as Indonesia’s sovereign rating.
However, frequent changes in policy directions result in a lack of regulatory certainty in the Indonesian power sector. For example, there have been eight different geothermal pricing regulations over the past 11 years14. Given that geothermal development typically requires five to seven years, it is surprising that the sector has achieved what it has. Against this background of policy and regulatory instability, there are a number of specific challenges:
i. Unrealistic planning leading to excessive reserve margins and higher costs;
ii. Poor reliability of supply in certain areas;
iii. An inability to meet renewable energy targets and continuing dependence on coal;
iv. Increasing subsidy payments to PLN;
v. A significant number of households remaining without electricity; and
vi. Inadequacy of PLN’s revenue to maintain its long-term financial health given its investment plans and other performance targets.
These issues are discussed in further detail below.
5.1.1 Unrealistic planning and excessive reserve margins
PLN has demonstrated a chronic inability to achieve its generation and transmission capacity expansion plans as presented in its Electricity Supply Business Plan (Rencana Usaha Penyediaan Tenaga Listrik, RUPTL). The principal causes of this divergence between plan and reality are twofold: (i) load forecasts are unrealistically high, triggering the planning of capacity additions that are not actually needed, and (ii) generation and transmission projects face delays not considered when planning the projects. The lack of transparency in the process precludes identification of the source of unrealistic inputs, but responsibility ultimately rests with ESDM, which approves the RUPTL.
Unrealistic economic growth assumptions resulted in a load forecast prepared in 2015 that by 2018 exceeded actual load by 21%. Because of the long lead times needed for generation development, PLN started committing to new generation far in advance only to see demand growth fail to materialize at projected levels, resulting in excess capacity today. An estimate of the additional costs from premature development of new capacity is as high as USD 1.4 billion or Rp 19.5 trillion.
5.1.2 Inequitable and inadequate supply quality
PLN applies and ESDM approves a generation planning reliability criterion of up to 24 hours of power supply interruption per year. However, there are multiple regions where interruptions (measured by the System Average Interruption Duration Index, SAIDI) exceed 36 hours per year (Exhibit 8). The PLN region encompassing the provinces of South Sumatra, Jambi and Bengkulu (S2JB) had an average of 74 hours of outage per customer in 2018. In comparison, Jakarta had 2.6 hours of outage in 2018.
ESDM has issued regulations that require it to set service quality standards at the start of every year and oblige PLN to compensate consumers by stated amounts if PLN fails to meet these standards. While this mechanism introduces ex-post accountability for PLN’s performance, there is no apparent ex-ante ESDM review of reliability criteria to guide PLN investment planning or any certainty that PLN will receive sufficient revenue to fund the measures required to meet desired levels of reliability.

20 Independent Assessment of Indonesia's Energy Infrastructure Sector
5.1.3 Lagging renewable uptake and increasing dependence on coal
Geothermal and hydro are the predominant sources of renewable energy at present and as planned. Over the past fi ve years, Indonesia has added an annual average of 171 MW of hydro capacity and 134 MW of geothermal capacity. To achieve the end-of-year 2025 targets enumerated in the RUPTL 2019-2028, this rate would need to increase by more than fi ve times. PLN plans an implausible 34% increase (nearly 4,300 MW) in renewable capacity between 2024 and 2025.
The unrealistic nature of this plan highlights the inherent bias at present against renewables, due to concerns that these will increase PLN’s costs without any compensating increase in tariff revenues. Meanwhile, PLN continues to plan signifi cant increases in coal-fi red generation capacity, as shown in Exhibit 9. Coal represented 44% of total energy production on PLN systems in 2011 and is planned to account for 63% in 2019 and 54% in 2028. Total coal-fi red capacity has grown from 14.8 gigawatts (GW) in 2011 to 28.0 GW in 2019 and is planned to reach 47.8 GW by 2028. Coal IPPs are locked in through 30-year power purchase agreements (PPAs).
Awareness of renewable and coal-fi red power is generally low among the public. Only 15% are aware of renewable energy and only 11% aware of coal-fi red power generation. But among those who are aware of
these technologies, 91% feel renewable power is a good idea compared to only 58% for coal-fi red generation. Still, only 19% of the public would be willing to pay more for electricity in order to encourage greater use of renewables.
5.1.4 Electricity subsidies
Electricity subsidies reached a peak of Rp 101.2 trillion in 2013, accounting for 8.8% of national government spending. Starting in 2014 the tariff classes eligible for subsidies were reduced and an automatic adjustment mechanism was re-introduced, indexing tariff s to the Indonesian Crude Price (ICP), the USD/IDR exchange rate and infl ation. By 2017 the subsidy had fallen to Rp 45.7 trillion. However, starting that year the government suspended the adjustment mechanism and the subsidy has crept up to Rp 54.8 trillion as budgeted for 2020. In addition, the government has had to pay additional compensation to PLN outside of the established subsidy mechanism to keep it operating, such as the Rp 23.2 trillion paid in 2018 as “compensation revenue.”
All residential customers with a 450 volt-ampere (VA) connection receive a heavily subsidized tariff . However, this appears to be poorly targeted. Exhibit 10 shows that 76.3% of all households with an R-1 450 VA connection, i.e. 17.7 million households, are in the third through tenth expenditure deciles. Assuming that only the bottom two expenditure deciles should
EXHIBIT 8: SAIDI Reported by PLN by Region, 2018
SAIDI [hours/year]< 6 Highly Satisfactory6 - 12 Satisfactory12 - 24 Marginally Satisfactory24 - 36 Unsatisfactory> 36 Highly Unsatisfactory Source: Processed based on Statistik PLN 2018
Papua
Maluku Utara
Papua Barat
Maluku
Gorontalo
Sulawesi Tengah
Sulawesi Tenggara
Sulawesi Utara
Nusa Tenggara Timur
Nusa Tenggara Barat
Jawa Timur BaliJawa Tengah
D.I Yogyakarta
Jawa BaratBanten
DKI Jakarta
Lampung
Jambi
Riau
Kep. Riau
Aceh
Bengkulu Sumatera Selatan
Sumatera Barat
Sumatera Utara
Kep. Bangka Belitung
Kalimantan Barat
Kalimantan Tengah
Kalimantan Timur
Kalimantan Utara
Kalimantan Selatan
Sulawesi Selatan
Sulawesi Barat
Kep. Riau

21Independent Assessment of Indonesia's Energy Infrastructure Sector
Electricity
be subsidized, then PLN forgoes approximately Rp 19.7 trillion of revenue15. The opinion survey supported the view that subsidies are poorly targeted, with 80% of households considering that no more than half of current government subsidies to energy and other uses reach their intended targets.
5.1.5 Achieving universal access
The government has enacted a range of laws and regulations intended to support the achievement of universal access, and together with PLN has made good progress towards this target. However, by the end of 2018 approximately 2.3 million households remained without electricity or with only limited intermittent supply, e.g. solar home systems. Exhibit 11 shows the provincial distribution of households without PLN electricity. Such households are found throughout Indonesia, but the provinces of East Nusa Tenggara and Papua have the most, together accounting for about one-third of all such households.
As experience in other countries demonstrates, the last few percent of households are the most diffi cult and costly to supply. Grid extension becomes excessively costly compared to options such as hybrid or renewable mini-grids which PLN is poorly placed to deliver. It is also estimated that approximately 721,000 households cannot aff ord a connection to PLN16. The central government stopped subsidizing connections
in 2016 and has instead appealed to provincial governments and corporate social responsibility (CSR) programs of both the private sector and state-owned enterprises to subsidize connections for low-income households. ESDM sought PLN’s CSR program to fund 45,000 connections, other state-owned enterprises to fund 13,139 connections, provincial governments to fund 23,259 connections, and CSR from private sector companies operating in the energy and minerals sector to fund 639,610 connections by the end of 201917.
5.1.6 Adequacy of PLN revenue
As shown in Exhibit 12, Indonesia’s electricity tariff s are currently among the lowest in Southeast Asia. However, this should not be taken as an indication either that PLN is operating at maximum effi ciency or that it is more effi cient than its regional peers. Electricity tariff s in Indonesia are held below actual costs through a mix of explicit and hidden subsidies.
As shown in Exhibit 13, tariff s have consistently been below operating costs with the diff erence being made up by a government subsidy (although the signifi cance of the subsidy has been falling over time). Even with this subsidy, PLN in most years fails to earn an adequate return on its assets. Assuming that PLN should earn a return at least equivalent to government borrowing costs (currently at 7.8% for a 10-year sovereign bond) then its average tariff would need to rise to USD 0.12/
EXHIBIT 9: PLN Generation Mix by Source of Energy Production
100%
90%
80%
70%
60%
50%
40%
30%
20%
10%
0%
60,000
50,000
40,000
30,000
20,000
10,000
-
Port
ion
of E
nerg
y Pr
oduc
tion
Installed Coal-Fired Capacity, MW
2011 2019 2028
Geothermal
Coal
Other Renewables
Import
Gas
Coal Capacity
Hydro
Oil

22 Independent Assessment of Indonesia's Energy Infrastructure Sector
kWh to fully recover costs in the absence of subsidies. This would move it above the average seen in Thailand, Malaysia and Vietnam.
5.2 Strengthen RegulationPrevailing regulatory arrangements are weak and a contributing root cause of the problems that threaten the power sector. Security has been compromised by higher supply costs resulting from unrealistic load forecasts, sustainability by the continuing reliance on coal, and equity by the persistent regional differences in electricity access and reliability. There is a lack of rigorous assessment of PLN’s justified costs and revenue requirements, leading to the combination of inadequate revenues and poor investment efficiency. Prevailing investment planning and tariff setting processes are opaque, creating an environment susceptible to vested interests.
Stronger power sector regulation is required, initially working through existing agencies but ultimately leading to creation of a regulator (in the form of an agency or a commission) with the following principal functions:
• Recommend tariffs for government and
parliamentary approval. In doing so the regulator would take into account government policies and requirements for protection of vulnerable consumers and the funds available for such subsidies;
• Review investment plans. The regulator would examine the assumptions and analysis upon which PLN prepares its investment plan, and critically assess whether the plan is least-cost (or meets other policy objectives of the government), is consistent with target reliability criteria, and whether each new generation capacity addition should be built by PLN or an independent power producer;
• Formulate and supervise PLN procurement procedures, to help ensure effective use of competition and least-cost investment and operations;
• Review PLN operations, particularly with respect to the efficiency of system operations and dispatch as well as quality of service, and take these findings into account when reviewing investment plans and recommending tariffs;
• Recommend licensing conditions, including
EXHIBIT 10: Portion of Households with 450 VA Connections by Expenditure Decile
14%
12%
10%
8%
6%
4%
2%
0%
Shar
e of
tota
l cus
tom
ers
1 2 3 4 5 6 7 8 9 10
Expenditure decile (1 = lowest 10%)
12.3%
11.0%10.6% 10.2%
9.8% 9.5% 9.2% 9.2% 9.1%

23Independent Assessment of Indonesia's Energy Infrastructure Sector
Electricity
regulatory data reporting requirements; and
• Provide inputs to government policymaking. The regulator would provide advice and analysis to government to help inform policymaking.
A key function would be to assess whether tariff levels, subsidies, investment plans and other performance targets are collectively consistent and mutually supportive.
The regulator should conduct these functions transparently, making its recommendations and supporting analysis available to the public. Moreover, the public should be given the opportunity to provide inputs or comments on key approvals or recommendations before they are taken.
The institutional arrangements for the regulator, including whether it reports to the Minister of Energy and Mineral Resources, to a small group of ministries (e.g. ESDM as the policymaker, Ministry of Finance [MoF] as the subsidy agent, and Ministry of State-Owned Enterprises [MSOE] representing government ownership, to help ensure consistency of performance targets and investment plans with revenues and subsidies), or to the president (so as to ensure continued “state control” as stipulated by the Constitution), its composition and funding will depend on the legal route used for its establishment. This requires further exploration, in particular whether to create an agency outside ESDM, which would require a government regulation to transfer existing functions currently
allocated to ESDM under Government Regulation (PP) 14/2012 on Business Activities for Electricity Supply18,19. Otherwise, a presidential regulation would suffi ce to establish an advisory body that would conduct analysis and make recommendations in a transparent and participatory manner. In the longer term, a new law or amendment of the existing Law 30/2009 on Electricity would help to establish a comprehensive and enduring legal basis for more eff ective regulation.
Regardless of the legal basis adopted, a key requirement will be transparency of regulatory recommendations and decisions, with the opportunity for meaningful public input. Both transparency and participation are required to drive justifi ed decisions and challenge vested interests. One without the other will not achieve the desired outcomes. The public recognizes the need for greater transparency and participation for energy sector regulation and policymaking. While 63% of respondents to a national survey rated PLN’s performance as “good” or “very good,” 83% said that some form of public participation should be introduced for energy sector planning and regulation.
5.3 Separate the System Planner, Single Buyer &System Operator Functions
Regulation works best when it is applied to an industry structure that promotes clear accountability,
EXHIBIT 11: Provincial Distribution of Households Without PLN Electricity
HH Without PLNctricity< 10.00010.000 - 50.00050.000 - 100.000100.000 - 200.000> 200.000 Source: Processed based on BPS Statistik Indonesia 2019 - source of lighting
Papua
Maluku Utara
Papua Barat
Maluku
Gorontalo
Sulawesi Tengah
Sulawesi Tenggara
Sulawesi Utara
Nusa Tenggara Timur
Nusa Tenggara Barat
Jawa Timur BaliJawa Tengah
D.I Yogyakarta
Jawa BaratBanten
DKI Jakarta
Lampung
Jambi
Riau
Kep. Riau
Aceh
Bengkulu Sumatera Selatan
Sumatera Barat
Sumatera Utara
Kep. Bangka Belitung
Kalimantan Barat
Kalimantan Tengah
Kalimantan Timur
Kalimantan Utara
Kalimantan Selatan
Sulawesi Selatan
Sulawesi Barat
Kep. Riau

24 Independent Assessment of Indonesia's Energy Infrastructure Sector
contributes to financial transparency, and minimizes the potential for conflicts of interest among players. Effective regulation and a proper industry structure are mutually reinforcing.
Under present arrangements PLN simultaneously plans the system, procures bulk power capacity from IPPs, is itself a bulk power generator, determines which generators are dispatched, and by default is the monopoly seller of electricity throughout the country. Consolidating all of these functions within a single group of companies concentrates power, impedes transparency, complicates regulation, and creates conflicts of interest.
Opacity and conflicts of interest are root causes of dysfunction in Indonesia’s power sector. Separating the system planning (SP), single buyer (SB) and system operator (SO) functions from PLN would help mitigate these conflicts of interest and lead to more transparent, arms-length transactions that could be more effectively regulated. Along these lines, the National Electricity Plan (RUKN) 2019-2038 proposes the establishment of an independent system operator. In addition, PLN should ensure that distribution, transmission and generation accounts are ring-fenced to facilitate regulatory supervision.
Exhibit 14 shows the recommended industry structure, which would be achieved through a phased transition.
PLN and its subsidiaries (the “PLN Group”) will continue to be responsible for the four commercial activities that constitute the electricity supply business as defined by Law 30/2009 on Electricity: generation, transmission, distribution, and sales. There is no transfer of these functions or assets (ownership unbundling) to entities outside of the PLN Group, although PLN will move its generating assets into subsidiaries to facilitate arms-length commercial arrangements for bulk power purchases20.
This transition process will require a clear time-bound roadmap that takes into account dependencies and clarifies responsibilities, with implementation subject to strengthened regulatory supervision as recommended above. The effectiveness of this restructuring also depends on a concurrent transition towards full-cost recovery tariffs in conjunction with direct subsidies by the government for targeted customers. This is necessary to ensure the financial viability of electricity companies throughout the supply value chain as well as affordability to consumers.
The prevailing Law No. 30/2009 on Electricity stipulates that power sales may be conducted by only one company in any given business area. In the absence of an amendment to the law, a mechanism would be required to accommodate both PLN serving as power retailer and the system planner + single buyer + system operator (SP+SB+SO) serving as bulk power
EXHIBIT 12: Comparative ASEAN electricity tariffs by category (June 2018)
Source: ESDM (link). An exchange rate of US$1:Rp13,342 is used.
25.00
20.00
15.00
10.00
5.00
0.00
Usc/
kWh
Singapore Philipines Thailand Malaysia Indonesia Vietnam
19.9
7
18.6
7
12.4
1
10.0
0
11.0
0
10.5
912.2
3
11.0
0 13.5
8
11.0
0 13.4
4
11.9
8
11.0
0
9.60
8.36
12.3
6
11.6
9
8.36
8.26
8.36
7.81
11.6
3
8.36
7.76
7.47
7.41
14.3
014
.02
13.0
512
.72
Residential Commercial - LT Commercial - MT Industrial - MT Industrial - HT

25Independent Assessment of Indonesia's Energy Infrastructure Sector
Electricity
seller wherever this new structure is implemented. Potential solutions include differentiating business areas by voltage level as well as geographic coverage, or by a strict interpretation of the law’s definition of “power sales” as being the business of selling to end-use consumers. In any case, this is not an issue until the final stage is reached in the structural transition of the industry; many of the benefits of this reform can be achieved through intermediate stages
PLN should, however, transfer the following functions to a separate national SP+SB+SO entity:
• Least-cost generation and transmission system planning;
• Procurement of all new generation on a competitive basis, and subsequent generation contracting;
• Generation dispatch; and
• Transaction/cash management for bulk power services and transactions.
The SP+SB+SO should be established as a perum, so that it could function commercially but not be expected to earn a profit. There is an analogous precedent for this in Indonesia with the establishment
of AirNav as a perum responsible for air traffic control.
The government would provide the capitalization and credit enhancements necessary to facilitate assignment of existing power purchase agreements (PPAs). The SP+SB+SO will also be responsible for paying PLN generation subsidiaries and IPPs under their PPAs and for paying PLN for providing distribution and transmission services under distribution service agreements (DSAs) and transmission service agreements (TSAs).
Transition to this future industry structure will take time. Legal, technical, financial, and organizational changes must be coordinated in a phased manner. This restructuring can be initiated under existing laws and should be undertaken along with the strengthening of regulation, and the implementation of cost recovery tariffs and direct subsidies.
5.4 Accelerate Use of Renewable Energy
ndonesia’s failure to make satisfactory progress against its renewable energy targets results from many factors. Root causes include the lack of effective
EXHIBIT 13: PLN average revenues and costs (2008-17)
1,800
1,600
1,400
1,200
1,000
800
600
400
200
0
Rp/k
Wh
2008 2009 2010 2011 2012 2013 2014 2015 2016 2017
Government subsidySales revenues
Operating costs Return @ 7.8%
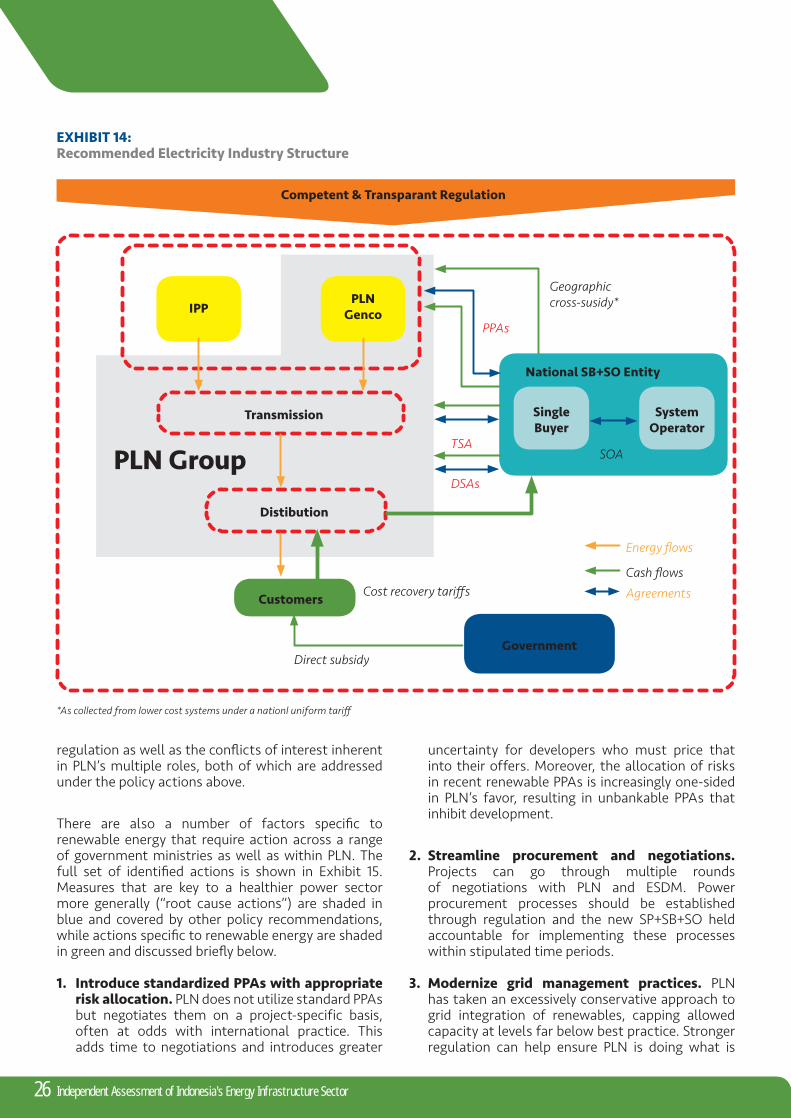
26 Independent Assessment of Indonesia's Energy Infrastructure Sector
regulation as well as the confl icts of interest inherent in PLN’s multiple roles, both of which are addressed under the policy actions above.
There are also a number of factors specifi c to renewable energy that require action across a range of government ministries as well as within PLN. The full set of identifi ed actions is shown in Exhibit 15. Measures that are key to a healthier power sector more generally (“root cause actions”) are shaded in blue and covered by other policy recommendations, while actions specifi c to renewable energy are shaded in green and discussed briefl y below.
1. Introduce standardized PPAs with appropriate risk allocation. PLN does not utilize standard PPAs but negotiates them on a project-specific basis, often at odds with international practice. This adds time to negotiations and introduces greater
uncertainty for developers who must price that into their offers. Moreover, the allocation of risks in recent renewable PPAs is increasingly one-sided in PLN’s favor, resulting in unbankable PPAs that inhibit development.
2. Streamline procurement and negotiations. Projects can go through multiple rounds of negotiations with PLN and ESDM. Power procurement processes should be established through regulation and the new SP+SB+SO held accountable for implementing these processes within stipulated time periods.
3. Modernize grid management practices. PLN has taken an excessively conservative approach to grid integration of renewables, capping allowed capacity at levels far below best practice. Stronger regulation can help ensure PLN is doing what is
EXHIBI T 14: Recommended Electricity Industry Structure
Competent & Transparant Regulation
IPPPLN
Genco
Geographiccross-susidy*
National SB+SO Entity
SingleBuyer
SystemOperator
PPAs
Transmission
PLN Group
Distibution
Customers
DSAs
TSA
Cost recovery tariff s
Direct subsidy
Agreements
Energy fl ows
Cash fl ows
*As collected from lower cost systems under a nationl uniform tariff
SOA
Government
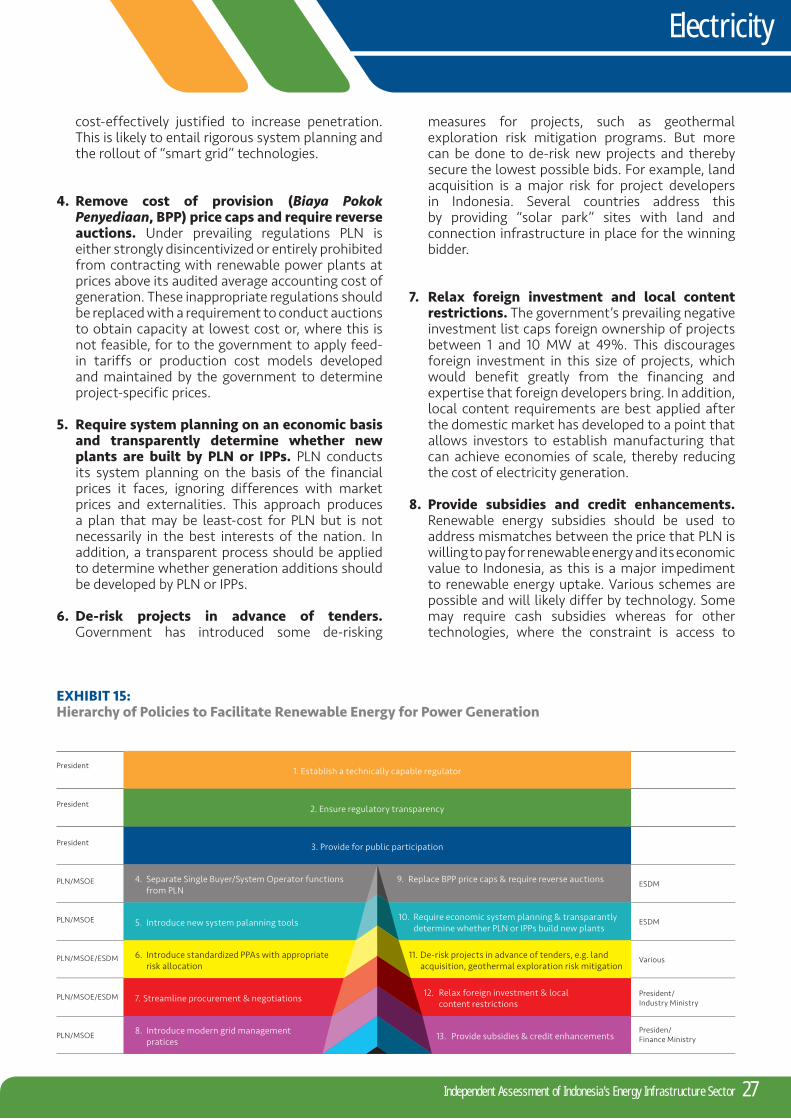
27Independent Assessment of Indonesia's Energy Infrastructure Sector
cost-effectively justified to increase penetration. This is likely to entail rigorous system planning and the rollout of “smart grid” technologies.
4. Remove cost of provision (Biaya Pokok Penyediaan, BPP) price caps and require reverse auctions. Under prevailing regulations PLN is either strongly disincentivized or entirely prohibited from contracting with renewable power plants at prices above its audited average accounting cost of generation. These inappropriate regulations should be replaced with a requirement to conduct auctions to obtain capacity at lowest cost or, where this is not feasible, for to the government to apply feed-in tariffs or production cost models developed and maintained by the government to determine project-specific prices.
5. Require system planning on an economic basis and transparently determine whether new plants are built by PLN or IPPs. PLN conducts its system planning on the basis of the financial prices it faces, ignoring differences with market prices and externalities. This approach produces a plan that may be least-cost for PLN but is not necessarily in the best interests of the nation. In addition, a transparent process should be applied to determine whether generation additions should be developed by PLN or IPPs.
6. De-risk projects in advance of tenders. Government has introduced some de-risking
measures for projects, such as geothermal exploration risk mitigation programs. But more can be done to de-risk new projects and thereby secure the lowest possible bids. For example, land acquisition is a major risk for project developers in Indonesia. Several countries address this by providing “solar park” sites with land and connection infrastructure in place for the winning bidder.
7. Relax foreign investment and local content restrictions. The government’s prevailing negative investment list caps foreign ownership of projects between 1 and 10 MW at 49%. This discourages foreign investment in this size of projects, which would benefit greatly from the financing and expertise that foreign developers bring. In addition, local content requirements are best applied after the domestic market has developed to a point that allows investors to establish manufacturing that can achieve economies of scale, thereby reducing the cost of electricity generation.
8. Provide subsidies and credit enhancements. Renewable energy subsidies should be used to address mismatches between the price that PLN is willing to pay for renewable energy and its economic value to Indonesia, as this is a major impediment to renewable energy uptake. Various schemes are possible and will likely differ by technology. Some may require cash subsidies whereas for other technologies, where the constraint is access to
EXHIBIT 15: Hierarchy of Policies to Facilitate Renewable Energy for Power Generation
Electricity
1. Establish a technically capable regulator
2. Ensure regulatory transparency
3. Provide for public participation
4. Separate Single Buyer/System Operator functions from PLN
5. Introduce new system palanning tools
6. Introduce standardized PPAs with appropriate risk allocation
7. Streamline procurement & negotiations
8. Introduce modern grid management pratices
12. Relax foreign investment & local content restrictions
13. Provide subsidies & credit enhancements
9. Replace BPP price caps & require reverse auctions
10. Require economic system planning & transparantly determine whether PLN or IPPs build new plants
11. De-risk projects in advance of tenders, e.g. land acquisition, geothermal exploration risk mitigation
President
President
President
PLN/MSOE
PLN/MSOE
PLN/MSOE/ESDM
PLN/MSOE/ESDM
PLN/MSOE
ESDM
ESDM
Various
President/ Industry Ministry
Presiden/ Finance Ministry

financing by smaller developers rather than the technology cost, credit enhancements such as guarantees may be sufficient21.
5.5 Implement Non-PLN Off-Grid Supply
Although PLN has extended supply to tens of millions of households over the past decade, innovative technological solutions are now required to deliver affordable supplies to the remaining unelectrified remote settlements. These go beyond conventional grid extension or diesel mini-grids as traditionally implemented by PLN. For example, a recent study for Maluku and Papua concludes that hybrid mini-grids or solar home systems (SHS) would be least-cost to supply 41% of households (a total of 729,000 households) outside the coverage of the existing grid22.
Opening up these remaining remote areas to non-PLN suppliers can help Indonesia achieve universal access more quickly and cheaply given the financial constraints on PLN and its high costs and limited flexibility in serving such areas. A mechanism already exists for this in the form of ESDM Regulation 38/2016, which established a framework for off-grid electrification by entities other than PLN, but this needs to be operationalized. Specific measures required for this include:
• Establishing a transparent mechanism to determine areas that should be opened to non-PLN supply and awarding these on a competitive basis;
• Building institutional capacity in national and regional governments to tender supply areas and to set and enforce performance terms; and
• Establishing subsidy mechanisms from the Ministry
of Finance to address gaps between cost and affordable prices and to offer credit enhancements to address the absence of creditworthy and long-term off-takers.
There are various business models that may be considered for non-PLN supply. These models should be assessed in terms of their ability to be: (i) scaled up in a timely manner, (ii) subsidized by the central government, as this will be key for maintaining affordability in these typically poor areas with high supply costs, and (iii) facilitate the selection of least-cost solutions by qualified suppliers with continuing supervision of their performance.
Models worthy of consideration include:
• PLN outsourcing of off-grid supply through competitive procurement, but this depends on PLN’s willingness and ability to take on this new and potentially heavy role;
• Community-based solutions, but these are challenging to scale up and are not amenable to any existing subsidy mechanisms; and
• Establishing a new public service unit (Badan Layanan Umum, BLU) under ESDM to manage off-grid areas and competitively tender for contractors to design, build and operate remote mini-grids on a fee-for-service basis. This would remove demand and consumer credit risk from contractors, making these opportunities more attractive and enabling them to offer lower costs, but still enable incentives to be created for efficient delivery. The BLU would receive customer payments as well as provide a conduit for government subsidies.
5.6 Optimize Delivery of Electricity Subsidies
28
Photo by Anton Muhajir (CC BY-NC 2.0)
Independent Assessment of Indonesia's Energy Infrastructure Sector

Electricity
5.6.1 Targeting of subsidized 450 VA connections
Similar to the subsidized 900 VA meter tariff before the 2017 reforms, the subsidized 450 VA meter tariff is poorly targeted. Over 90% of households on the subsidized 450 VA tariff have household expenditure per capita above Statistics Indonesia’s (Badan Pusat Statistik, BPS) poverty line. This suggests there is scope for reducing the burden of subsidies by taking subsidies away from households that should not be receiving them.
As the apparently successful transition from a subsidized to a non-subsidized 900 VA tariff shows, this can be done while still maintaining a significant, well-targeted subsidy for the poorest of households, with the help of the (still developing) Unified Poverty Database.23 Utilizing the new Unified Poverty Database, households with a 450 VA connection that do not meet the criteria for subsidized supply should be moved to the 900 VA unsubsidized class. This policy change would reduce electricity subsidies and disincentivize excessive electricity consumption, while still maintaining a well-targeted electricity subsidy for the poorest households.
5.6.2 Automatic tariff adjustments and update of base tariffs
The indexation of unsubsidized tariffs should be reapplied following its suspension in recent years. This avoids the nominally unsubsidized tariffs from becoming de facto subsidized rates and thereby helps address concerns over PLN’s financial viability and the cost of subsidies to the government, and encourages the efficient use of electricity. In doing so, the indexation formula should be updated to better
reflect the current composition of PLN’s costs. It is also essential to reset the underlying base tariffs which were last calculated using 2013 BPP cost data; this reset should take into explicit account PLN’s rate of return or cash flow requirements for financial viability.
Public concerns can be addressed through improved regulation, with a particular emphasis on increasing the transparency of the process and opportunities for public participation. Opportunities should also be taken to highlight when indexation leads to tariff reductions (e.g. due to rupiah appreciation or declining market prices for fuels). Interviews conducted as part of the opinion survey also identified a willingness to pay more for higher-quality electricity supplies—suggesting a potentially virtuous circle exists with higher revenues allowing improvements in quality and leading to acceptance of higher tariffs.
5.6.3 Connection subsidies
While attention is focused on extending supply to unelectrified areas, there also remain large numbers of households within grid-supplied areas but without connections. The National Team for Acceleration of Poverty Reduction (Tim Nasional Percepatan Penganggulangan Kemisikinan, TNP2K) has estimated there are approximately 721,000 poor households that cannot afford grid connection costs. The opinion survey conducted for this White Paper found that 70% of households living in grid-served areas but without connections cited the connection fee as a barrier.
In past years ESDM financed household connections and interior wiring under the Program Listrik Hemat dan Murah (“low-cost and efficient electrification program”). This program should be reinstated, funded by a capital injection into PLN specifically for this purpose (with accompanying performance targets set and monitored).
29Independent Assessment of Indonesia's Energy Infrastructure Sector

6. End-Use Energy Efficiency
Indonesia’s energy effi ciency performance is poor relative
to best practice. Causes include inadequate coverage and enforcement of regulations, an under-developed ESCO industry, and a lack of fi nance. Recommended policy measures are to: (1) strengthen and expand existing energy auditing requirements and minimum effi ciency performance standards; (2) catalyze the ESCO market by mandating government facilities to achieve target energy effi ciency reductions working with ESCOs; and (3) establish a new dedicated energy effi ciency fi nancing facility under PT SMI.
30
Photo by Jes/Flickr (CC BY-NC-ND 2.0)
Independent Assessment of Indonesia's Energy Infrastructure Sector

31Independent Assessment of Indonesia's Energy Infrastructure Sector
6.1 Current ConditionsAssessment of Indonesia’s energy efficiency performance over time and relative to other countries is challenging. One source of difficulty lies in the data inconsistencies highlighted earlier. Another lies in the impossibility of disentangling changes in energy efficiency from changes in energy use driven by the growth of incomes and the changing structure of the economy.
Nevertheless, the micro-level data that is available does suggest that there is major potential for improvement. For example:
• Industrial: The International Energy Agency (IEA) estimates that less energy-intensive industries (such as food and beverages, tobacco and textile manufacturing) could reduce their energy intensity by 40% by 204024. Imposing minimum energy performance standards (MEPS) for electric motors equivalent to those in China could save 2.2 TWh of electricity use by 203025, equivalent to about 1% of PLN’s total sales in 2018, assuming that failed
motors are replaced rather than rewound.
• Commercial and public buildings: Indonesian buildings remain, on average, relatively inefficient relative to best practice. A 2012 analysis of six major government and commercial buildings (both retrofits and new builds) found that energy savings from 18% to 56% were possible, with the greatest level of savings being realized in government offices26. A 2009 study by the Japan International Cooperation Agency (JICA) of commercial buildings in Jakarta found that energy efficiencies were 30% to 80% worse than for comparable buildings in Japan (see Exhibit 16). A 2011 study by the World Bank’s International Finance Corporation (IFC), ahead of the introduction of a green building code in Jakarta, estimated that it should be possible to achieve an efficiency improvement of 30% in energy use by new buildings.
• Residential: A recent study27 estimates that adoption of best available technology (BAT) for lighting, refrigerators, air conditioners, fans, televisions and standby power needs could deliver
EXHIBIT 16: Energy Consumption of Commercial Buildings In Japan and Indonesia
Source: IECES (2016). Indonesian Market Potentials for Energy Efficient Buildings. 5 April 2016, Nuremberg. Data is reported as being from JICA (2009).
350
300
250
200
150
100
50
0
kWh/
m3 /y
ear
Shopping Mall Hotel Hospital Office
JapanIndonesia297
225
293270
240
160175
140

32 Independent Assessment of Indonesia's Energy Infrastructure Sector
EXHIBIT 17: Estimated savings from adopting best-available technology for appliances (2025)
Source: LBL (2019)
a combined reduction in peak demand in 2025 of 15.2 GW or 25% relative to the BAU case (see Exhibit 17). The largest benefits come from improving the efficiency of air conditioners (7.3 GW) and lighting (4.0 GW). The savings in energy use come to 69.8 TWh in 2025 and reductions in carbon emissions28 to 55.2 MtCO2 in the same year.
Multiple incentives and support regulations to increase energy efficiency already exist. These include:
• Mandatory energy management programs for major users, defined as those using in excess of 6,000 tons of oil equivalent (TOE) annually, under Government Regulation (PP) 70/200929. This includes appointing energy managers, conducting regular energy audits, implementing energy conservation, and reporting to the government.
• A certification program for energy managers and energy auditors and government-funded energy audits for buildings and industries under the Partnership Program on Energy Conservation, the recommendations of which must be implemented. By 2014, 1,274 audits had been carried out.
• Minimum standards for buildings under Government Regulation 36/2005, which includes four energy standards (Indonesian National
Standards, SNI) covering: building envelopes; air-conditioning; lighting; and building energy auditing. The SNI standards applied are 2000 vintage. Within Jakarta, Governor’s Decree 38/2012 introduced a green building code for larger commercial buildings with effect from April 2013. A green building code was issued for Bandung in 2016.
• Draft Minimum Energy Performance Standards (MEPS) and labeling schemes for appliances including compact fluorescent lamps (CFLs), air conditioners, refrigerators, fans, rice cookers and motors were prepared with support from the United Nations Development Programme (UNDP) in 2013 and the Asian Development Bank (ADB) in 2016.
• Some financing for low-carbon energy investments, including energy efficiency, is available from PT Sarana Multi Infrastruktur (PT SMI), the MoF-owned enterprise responsible for accelerating infrastructure development.
However, the effectiveness of these measures is severely constrained by a number of factors, including:
• Ineffective enforcement. For example, of the estimated 265 companies covered by PP 70/2009, only 101, as of 2015, had reported their energy
BAU
90
80
70
60
50
40
30
20
10
0
Savi
ng in
BAT
Sce
nario
in 2
025
(GW
)
Saving from Air conditioners
Saving from Refrigerator
Saving from Standby power
Saving from Lighting
Saving from Televisions
Saving from Fans
1:00
2:00
3:00
4:00
5:00
6:00
7:00
8:00
9:00
10:0
011:
0012
:00
13:0
014
:00
15:0
016
:00
17:00
18:0
019
:00
20:0
021
:00
22:0
023
:00
0:00
BAT

33Independent Assessment of Indonesiaís Energy Infrastructure Sector
End-Use Energy Efficiency
consumption30. A 2015 JICA report31 stated that only 16 buildings complied with the Jakarta green building code, although more recent media reports suggest the number of compliant buildings now exceeds 30032.
• A lack of public funds to trigger and leverage private investments. Government budget allocations for energy conservation programs averaged only USD 8 million annually in 2012-14 and have been cut significantly since then. While PT SMI has access to large funds, their use for energy efficiency investments is principally intended to improve the efficiency of infrastructure rather than industrial, commercial and residential facilities33.
• The limited scope of the existing MEPS and their failure to include industrial equipment. Only two of the multiple MEPS that have been drafted have, to date, become regulations—those covering CFLs (2014) and air conditioners (2015).
• A nascent energy auditing and energy service company (ESCO) industry. There were just 182 certified managers and 115 certified auditors as of 2015. This contributes to both the failure to enforce existing regulations and to an inability to take advantage of identified efficiency improvements.
• Lack of awareness. The opinion survey found that 82% of respondents had either not heard of existing energy efficiency programs or had heard but knew little about them. This is despite high levels of support for improved energy efficiency.
6.2 Enforce and Expand Industrial Energy Efficiency
Proposed policy measures as regards promoting industrial energy efficiency largely relate to building on existing incentives rather than creating new ones. Notably, they include:
• Effective enforcement of the existing PP 70/2009 including fines for non-compliance. This can be expected to increase energy conservation efforts by the largest industrial users.
• Expansion of MEPS to include industrial equipment, starting with electric motors as recommended by the IEA.
These should be accompanied by the creation of a dedicated energy efficiency financing facility, administered by PT SMI but with a wider mandate to finance efficiency improvements in industry. This would help address the current limitations on
access to finance while ensuring that the facility is professionally managed. Funding should be sought from bilateral and multilateral sources to support the initial capitalization of this facility which, thereafter, can operate on a revolving fund basis.
6.3 Implement a National Building Efficiency Program
The key policy measure proposed with respect to energy efficiency in commercial and public buildings is the implementation of a national government mandate to reduce energy consumption in all government-owned facilities, including those of state-owned enterprises (SOEs). Achievements should form part of the key performance indicators for facility managers and correspondingly be incorporated into performance-related pay elements.
As well as delivering efficiency savings in itself, the creation of such a large and creditworthy market is expected to kick-start the rapid growth of ESCOs and accompanying financing mechanisms for energy efficiency. To further support this, government facilities should be encouraged to make use of ESCOs in achieving their target and the current PP 70/2009 should be revised to remove the barriers created for ESCOs to implement energy efficiency projects in government facilities through public-private partnership (PPP) arrangements.
This might be accompanied by measures to improve the energy efficiency in commercial buildings, including:
• The national rollout of a green building code using the Jakarta and Bandung codes as a model with potential financial incentives for compliance such as tax exemptions.
• Implementation of more stringent building standards by updating the existing SNI and government regulation.
6.4 Expand Energy Performance Standards for Appliances
The strengthening and expansion of MEPS provides a means to rapidly improve energy efficiency at relatively low cost. The requirements for appliances covered by existing MEPS should be gradually strengthened, bringing these closer to BAT. The coverage of residential appliances by MEPS should also be expanded by implementing those standards already developed or currently being developed, but not yet issued as regulations.

7. Road Transportation
Explicit transport fuel subsidies have been greatly reduced in
Indonesia, but “hidden” subsidies persist. These contribute to a continued reliance on poor-quality and polluting RON 88 gasoline. Electric vehicles have high potential environmental and fuel savings, but a rapid transition today would be premature. Security of fuel supplies remains a concern. Recommended policy measures are: (1) improve on the delivery of transport fuel subsidies; (2) accelerate the phase-out of RON 88 fuel; (3) roll out electric vehicle infrastructure initially through electric taxi and bus fl eets in preparation for a wider rollout of electric vehicles in the future; (4) establish fuel buff er stocks; and (5) upgrade and expand refi nery capacity.
34
Photo by basibanget/Flickr (CC BY 2.0)
Independent Assessment of Indonesia's Energy Infrastructure Sector

35Independent Assessment of Indonesia's Energy Infrastructure Sector
7.1 Current Conditions
7.1.1 Transport fuel subsidies
As part of wider efforts to reduce energy subsidies, Indonesia eliminated most transport fuel subsidies in 2014-15 with retail prices now indexed to Singapore benchmarks. The remaining formal subsidies are:
• A fixed subsidy for diesel, equal to Rp 2,000/liter. This is paid from the state budget. In April 2019, a further subsidy was introduced by setting diesel prices for favored groups (farmers and small fishermen) at 95% rather than 100% of the market benchmark. However, this subsidy is already being targeted for removal with the proposed 2020 budget cutting it to Rp 1,500/liter.
• An indirect subsidy for RON 88 gasoline outside of the Java-Madura-Bali region under the One-Price-Policy. This requires state oil company Pertamina to sell RON 88 at a uniform price nationally. The additional distribution costs in more remote regions are recovered through an uplift in the RON 88 price calculation formula, creating a cross subsidy from Java-Madura-Bali RON 88 consumers to those in other regions.
Evidence is that the diesel subsidy, supposedly intended to keep public transport costs lower and to help smaller fishermen and poor farmers, is poorly targeted. Estimates by MoF are that, among the poorest 20% of households, only 121,000 received diesel subsidies while, among the richest 20%, 534,000 households did so34. In 2015, the poorest 10% of households received an average benefit from diesel subsidies of $3 per month compared to $20 per month for the richest 10%.
The official fuel price adjustment mechanism has not been consistently followed. The government committed to adjusting fuel prices every three months in early 2015, but this guidance has been flouted during Ramadan periods35 and in the lead-up to the April 2019 election.36 For October 2019, if the formula was being followed, it is estimated that Pertamina should be charging Rp 7,642/liter of RON 88. However, the retail price remains at Rp 6,400/liter.
n turn, this failure to adjust prices has imposed losses on Pertamina and means it is no longer able to recover the costs of the One-Price-Policy. These costs were estimated at Rp 24 trillion in 2018, with commentators suggesting that Pertamina has been handed expiring production-sharing contracts as indirect compensation.37
7.1.2 Electric vehicle readiness
Electric vehicle (EV) adoption is being explored as a policy goal given the expected environmental and fuel cost savings and the global trend towards EVs.38 Indonesia also perceives opportunities to develop an EV manufacturing industry, taking advantage of its nickel deposits.
The use of EVs may be viable for specific fleet uses such as rapid transit buses, where routes are known and usage is high. However, in general, the higher costs of EVs relative to internal combustion engine (ICE) vehicles, due primarily to the costs of batteries, outweigh their benefits in terms of lower pollution and emissions (see Exhibit 18). This is particularly so in Indonesia, given the dominance of coal power in electricity generation which means the electricity itself is relatively “dirty.” This situation may change in future as battery costs fall and economies of scale are realized with, for example, projections of near parity by 202539. However, at this time, large-scale subsidies would be needed for any widespread rollout of privately owned EVs, and the costs of these subsidies are likely to outweigh the economic benefits to Indonesia.
The rather surprising conclusion in Exhibit 18 that EVs currently have higher environmental costs than gasoline vehicles (diesel costs are higher due to NOX and PM2.5 emissions) is due to the high carbon intensity of the electricity grid. Falling grid emissions would improve the environmental case for EV, but this is dependent on other policy actions being taken to address the current coal dominance.
7.2 Optimize Delivery of Transport Fuel Subsidies
The remaining diesel fuel subsidy should be eliminated as being poorly targeted. The impacts on low-income households can be expected to be minimal given that most of the benefits are captured by higher-income households, and the resulting budget savings can be redirected to more efficient subsidies. The opinion survey also found that there is a willingness to pay more for higher-quality fuels, if these can be made more widely available outside central regions.
Conversely, the One-Price-Policy should be retained given its importance in supporting regional equity and development. However, this should be decoupled from RON 88 sales and applied to RON 92 and, potentially, diesel by being made an explicit public service obligation with the additional costs imposed on Pertamina recovered through a budget subsidy. This will make the costs of the policy more transparent and

36 Independent Assessment of Indonesia's Energy Infrastructure Sector
EXHIBIT 18: The reduced pollution of EVs does not offset their higher costs
Passenger cars
reduce risks to Pertamina and facilities that proposed phase-out of RON 88.
The price adjustment mechanism should be reinstated. Concerns over excessive fuel price volatility, which creates uncertainty for consumers and costs in managing this, should be addressed by establishing an Indonesian Petroleum Fund. Provisions for such a fund are included already in the latest draft of the new oil and gas law.40 The fund would act as a “buffer,” collecting extra revenue when international oil prices drop below domestic prices and then covering part or all of the difference as international prices rise. By doing so, it avoids the imposition of large costs onto Pertamina, which are then recovered, if at all, through non-transparent and delayed compensation measures.
The governance of such a fund would clearly be a matter of importance. Clear guidance would need to be developed to define the fund’s rules and funding structure within Indonesia’s idiosyncratic public finances. The fund would also need to be closely monitored and transparently regulated to ensure that
its use is not subject to political pressure and that its financial integrity is maintained.
7.3 Phase Out RON 88Indonesia is a global outlier in the continued use of low-quality RON 88 gasoline41. The phasing-out of RON 88 has been a long-standing objective, but one which has still not been implemented although there has been increasing substitution by higher-quality gasoline42. The overriding reason for this appears to be concerns that ending sales of RON 88 will raise gasoline prices. These concerns are overstated. The basic price difference between RON 88 and RON 92 gasoline, assuming a full application of current market price mechanisms, is around USD 2.50 per barrel (bbl) or approximately Rp 300/liter representing a price increase of less than 5% even at current capped Premium (RON 88) gasoline prices43. The effective increase is likely to be lower, as higher-octane fuels improve fuel consumption efficiency by up to 4% if moving from RON 88 to RON 9244. The greater efficiency of high-octane fuels and reduced
40,000
35,000
30,000
25,000
20,000
15,000
10,000
5,000
0
Net
Pre
sent
Val
ue ($
)
Gasoline Electric
Fuel costs (inc. electricity)
Emissions (CO2, inc. embedded)
Purchase cost (inc. battery replacement)
Pullutants (SO2, NOx, PM2.5)
20,163
37,169

37Independent Assessment of Indonesia's Energy Infrastructure Sector
Road Transportation
consumption also reduces emissions of pollutants, with resulting health and environmental benefits.
The significant difference in retail prices across Indonesia between RON 92 and RON 88 does not arise from the higher market price of the former but from the application of the One-Price-Policy to RON 88 but not RON 92. This can be addressed through the conversion of the One-Price-Policy subsidy mechanism from a cross subsidy to a budget subsidy applied to designated fuels including RON 92. Pertamina would be able to sell higher grades of gasoline in remote regions at the same price as in central Indonesia and recover the additional distribution costs of doing so. Consumers currently dependent on RON 88 would see a small increase in prices given the higher price of RON 92 on international markets, but this would be limited and, for those in remote areas, mitigated by the extension of the One-Price-Policy to higher-quality fuels.
Separately to the proposed phase-out of RON 88, Pertamina is currently planning to replace its existing Solar-brand high-sulfur diesel (cetane 48 with sulfur concentrations of 2,500 parts per million, ppm)
with Euro-2 equivalent diesel (cetane 51 with sulfur concentrations of 500 ppm) from January 1, 2021. Any delays to this planned phase-out should be avoided.
7.4 Prepare for Electric VehiclesIn the longer-term, a wider rollout of EVs may become attractive given expected declines in battery costs45 and the carbon intensity of the Indonesian grid. However, in the short term, the costs of subsidies required to promote rapid expansion of privately owned vehicles seems likely in most instances to exceed the benefits to Indonesia. Therefore, any financial incentives or other support provided should be limited in nature and targeted to uses where the benefits of EVs are maximized (such as public intracity bus services). Accompanying transport regulatory reforms to support EVs should also be considered—for example, smaller e-motorcycles have proven very popular in countries where these have lower licensing requirements46.
Current policy goals to turn Indonesia into a future EV manufacturing hub should be pursued with
Motorcycles (note different y-axis scale)
3,2303,500
3,000
2,500
2,000
1,500
1,000
5,00
0
Net
Pre
sent
Val
ue ($
)
Gasoline (60cc / 6kW) Gasoline (125cc / 12kW) Electric (Gogoro 6.4kW)
Fuel costs (inc. electricity)
Emissions (CO2, inc. embedded)
Purchase cost (inc. battery replacement)
Pullutants (SO2, NOx, PM2.5)
1,716
2,487
Source: Consultant calculations. Embedded’ carbon costs arising from the manufacture of vehicles are included in the costs shown above—these are higher for EVs due to the battery. Carbon and pollutants emitted in electricity generation as estimated using the projected trend of carbon intensity on the Indonesian power grid as in RUPTL 2019-28 (0.809 gCO2/kWh today; 0.737 gCO2/kWh by 2028) is used. The Gogoro e-motorcycle uses swappable batteries, the costs of which are included under the ‘fuel’ component.

caution. It is understandable that the government fears missing out on the expected worldwide shift to EVs, but Indonesia will be competing with other countries in the region that already have significant, well-integrated exporting vehicle industries (Japan and South Korea) or can be expected to shift to EVs at massive scale (China and India). The success of any such efforts depends in part on pre-existing integration with global automotive supply chains, an area where Indonesia has lagged47. Policies also appear to be contradictory in this regard, both imposing local content requirements on EVs to encourage domestic manufacture and planning to lower the luxury goods sales tax and import duties on EV imports.48
7.5 Establish Fuel Buffer StocksIndonesia currently maintains limited buffer stocks to protect against large swings in oil products availability
and international fuel prices due to supply disruptions. Pertamina and other wholesalers hold their own reserves, the level of which varies by product and over time but is generally significantly less than 30 days, with the majority being understood to be held offshore in Singapore and other locations.
This vulnerability to supply shocks is already recognized. The existing Law 20/2001 on Oil and Gas states, in Article 8, that the government “has a duty to provide a strategic reserve of crude oil to support the supply of domestic Petroleum Fuel” which shall be further regulated. It also states in Article 46 that the regulatory body, BPHMIGAS, will be responsible for the “National Petroleum Fuel Reserves Stock.” Government Regulation 79/2014 on National Energy Policy elaborates on this requirement, defining, in Article 13, requirements to establish energy buffer reserves (EBR) to meet national needs when an energy crisis has been declared, and operational stocks, which
38
Photo by Ignatius Win Tanuwidjaja/Flickr (CC BY 2.0)
Independent Assessment of Indonesia's Energy Infrastructure Sector

Road Transportation
are to be held by all entities supplying energy to ensure continuity of supply. To date, a draft implementing regulation on the maintenance of operational stocks was prepared in 2016 by BPHMIGAS for consultation but no actual regulation has resulted. Development of EBR has been stalled due, in large part, to a lack of state funds.
Requirements to hold operational stocks should be implemented to address immediate concerns over supply security at limited cost (given that this represents an extension and formalization of existing practice among wholesalers). Consideration should also be given to adopting existing proposals on building up EBR at limited direct cost to government. Under these proposals49, government will establish storage facilities and lease these to wholesalers who will be obliged to maintain a 30-day EBR in these facilities. This transfers the financing of the costs of the facilities and stocks to wholesalers, removing
these from the government budget.
7.6 Upgrade and Expand Refinery Capacity
ndonesia’s refining capacity is both unable to meet domestic demand and aging. It is not possible, due to data inconsistencies, to determine either import dependency or how dependent existing refineries are on RON 88 production, but it is likely that the inability of older facilities to produce higher grades of fuel is one of the barriers to the RON 88 phase-out50.
This concern over refining capacity has been noted for many years and current policies are to expand capacity and update existing refineries. These policies should remain unchanged, helping improve security of supplies and facilitating the RON 88 phase-out.
39Independent Assessment of Indonesia's Energy Infrastructure Sector
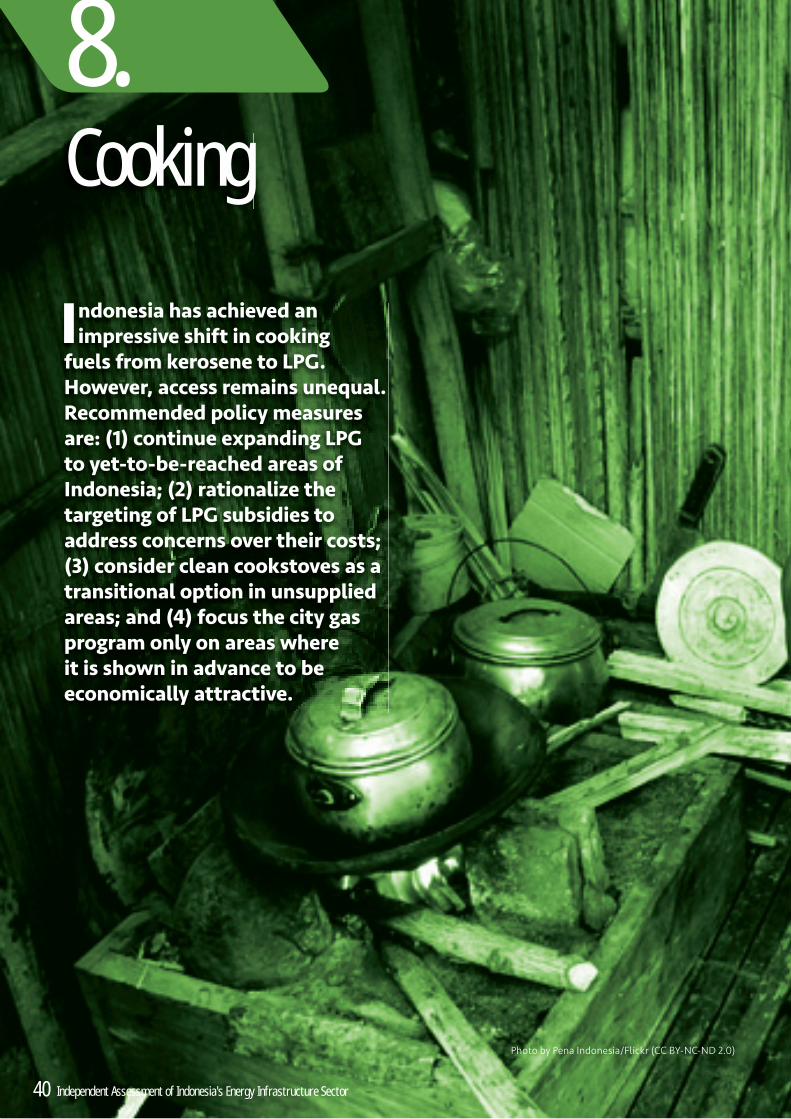
8. Cooking
Indonesia has achieved an impressive shift in cooking
fuels from kerosene to LPG. However, access remains unequal. Recommended policy measures are: (1) continue expanding LPG to yet-to-be-reached areas of Indonesia; (2) rationalize the targeting of LPG subsidies to address concerns over their costs; (3) consider clean cookstoves as a transitional option in unsupplied areas; and (4) focus the city gas program only on areas where it is shown in advance to be economically attractive.
40
Photo by Pena Indonesia/Flickr (CC BY-NC-ND 2.0)
Independent Assessment of Indonesia's Energy Infrastructure Sector

41Independent Assessment of Indonesia's Energy Infrastructure Sector
EXHIBIT 19: Households’ reported primary cooking fuel, 2001 to 2017
Source: BPS data 2001 to 2017. Note there are data gaps between 2001 and 2007 and 2015 and 2017. ‘Other’ includes electricity, charcoal, biogas, and briquettes.
8.1 Current Conditions
8.1.1 Uneven access to modern cooking fuels
The shift to using liquefied petroleum gas (LPG) for cooking in Indonesia has been impressive, with over 70% of households now reporting using LPG as their primary cooking fuel (see Exhibit 19). This mainly came at the expense of kerosene, which was the original target of the LPG switching campaign. The percentage of households reporting firewood as their primary cooking fuel has also been declining steadily, dropping below 20% in 2017.
These aggregate trends are positive, but there are still gaps to be addressed. The geographic picture of cooking fuel usage reveals a severe divide (see Exhibit 20 and Exhibit 21). The LPG switching program was a success in many provinces, but it is yet to reach eastern Indonesia where households are still largely reliant on firewood or kerosene. For example, 89.1% of Maluku households still report using kerosene versus only 0.7% doing so in Java.
Household fuel stacking is still prevalent: 30% of households still report some usage of firewood for cooking (see Exhibit 21) with 12.7 million remaining reliant on it. Over half of these are located in Java-Bali, where price rather than access appears to be the main barrier to LPG use.51 The opinion survey found that three-quarters of households currently not using LPG would combine it with firewood if switching, rather than rely on LPG alone, in order to manage costs.
Continued reliance on firewood comes at high costs in terms of health and inconvenience. The World Health Organization’s (WHO) Global Burden of Disease (GBD) Study 2017 attributes over 68,000 annual premature deaths in Indonesia to household air pollution from the burning of solid fuels.52 Progress has been made since the 2012 GBD study, where the estimated annual premature death toll was 165,000,53 but much remains to be done. When also factoring the time spent collecting firewood, longer cooking times and time spent cleaning, a traditional stove using firewood imposes economic and social costs on a family double those of LPG (see Exhibit 22). That the greater convenience of LPG is an important benefit for households can be seen in the opinion survey results,
2017
Kercsene OtherFirewood
80.0%
70.0%
60.0%
50.0%
40.0%
30.0%
20.0%
10.0%
-
2001
2002
2003
2004
2005
2006
2007
2008
2009
2010
2011
2012
2013
2014
2015
2016
LPG

42 Independent Assessment of Indonesiaís Energy Infrastructure Sector
EXHIBIT 20: LPG usage by Kabupaten 2017
where over 90% identified as a reason for switching to LPG the faster cooking times, over 60% the reduced need for cleaning of kitchens, and over 50% the greater ease of using LPG.
8.1.2 Large and poorly targeted LPG subsidies
The LPG conversion was partially enabled by selling 3-kg LPG cylinders at a subsidized rate of IDR 4,250 per kg (larger 5.5-kg and 12-kg cylinders are officially not subsidized). This subsidized rate has remained unchanged since 2007. In comparison, the full cost of LPG is IDR 8,529 per kg.54 This difference has inevitably fueled a significant LPG subsidy, which has been about IDR 30-40 trillion in recent years, or 1.5-2.0% of the Indonesian state budget (see Exhibit 23). Despite this, most consumers pay substantially more than the subsidized price, due to their reliance on small retailers who impose large mark-ups on the subsidized prices available from ‘authorized dealers’. Regional governments also add transport costs in more remote locations.55
As with electricity, but even more so, LPG subsidies are poorly targeted. Even among the top 10% of households, 70% report using the subsidized 3-kg cylinders (see Exhibit 24).
A growing concern has been the increase in LPG
imports and their contribution to Indonesia’s trade deficit. However, their importance should not be overstated. In 2018, LPG imports amounted to 1.2% of foreign payments compared to 5.0% for crude oil and oil products.56
8.2 Expand LPG AccessLPG expansion should continue in order to further promote modern cooking fuels in Indonesia. LPG’s health and convenience benefits relative to traditional cookstoves are clear. The LPG conversion program has yet to reach Indonesia’s eastern provinces, which undermines equitable development principles. It is estimated that there are 14.9 million households in Java-Bali, Sumatra, Kalimantan, and Sulawesi that are currently cooking with biomass. Assuming LPG starter kits cost Rp 300,000 per household (and this is subsidized), the initial conversion cost would be Rp 4.5 trillion. Assuming a yearly LPG consumption subsidy of Rp 594,000 per household, the annual additional subsidy cost would be Rp 8.9 trillion.
Concerns about the fiscal burden of LPG subsidies can be managed by improving the targeting of the subsidies. Policymakers should not overreact to changes in LPG import costs—these are volatile in nature as with other resource-based imports and exports. Policies aimed at short-term reductions in imports may well have unintended long-term consequences (see the city gas expansion discussion below).
% of HH Used LPG
Source: BPS Susenas 2017
0 - 1920 - 3940 - 5960 - 7980 - 100No Data

43Independent Assessment of Indonesiaís Energy Infrastructure Sector
8.3 Optimize Delivery of LPG Subsidies
LPG subsidies need to be better targeted in order to improve economic efficiency and lower the overall LPG subsidy cost alongside continued LPG expansion. While this has been recognized for some time, measures to do so through smart technology have stalled. In 2018, the government planned to improve the targeting program that used the Unified Poverty Database and an “e-cash” system through “smartcard” technology integrated with Sejahtera Family Cards.57 However, this effort appears to have stalled. In March 2019, the then-minister for energy and mineral resources said the possibility of distributing subsidized LPG cylinders through e-cash was still being discussed.58
As a short- to medium-term practical alternative, to enable rapid improvements in targeting, LPG subsidies might instead be linked to access to subsidized electricity. The targeting of electricity subsidies has proven easier than that of LPG, as recently demonstrated by the 900 VA meter retargeting using the Unified Poverty Database. There will of course remain a need for systems to enable verification of eligibility (e.g. using electricity bills). There may also be some households using LPG but without access to PLN electricity, but these are likely to be small in number and diminishing rapidly with growing electrification.
The opinion survey found that LPG subsidies are generally seen as less important than electricity subsidies and, therefore, there is more acceptance of changes and reductions to these. A key reason is the perceived greater ability of households to control cooking expenditures through planning and the use of alternative fuels in some cases.
8.4 Promote Clean Cookstoves as a Transitional Measure
The high economic costs imposed by traditional cookstoves mean that transitioning households to clean, modern cooking fuels should be a policy priority. However, it may not be practical to reach all Indonesian households with modern cooking fuels in the short to medium term and particularly those located in the remotest areas.
For these households, cleaner improved cookstoves (ICS) can serve as a transitional measure while LPG supply and distribution infrastructure is improved. Purchases of ICS should be subsidized, building on the successful rollout model piloted by the World Bank. The costs will be relatively small. Converting 3.5 million households in the provinces of West Nusa Tenggara, East Nusa Tenggara, Maluku, and Papua to ICSs at a subsidy cost of Rp 145,000 per household, would incur a one-time subsidy of Rp 0.5 trillion.
Cooking
EXHIBIT 21: Firewood usage by kabupaten
% of HH Used Firewood
Source: BPS Susenas 2017
0 - 1920 - 3940 - 5960 - 7980 - 100No Data

44 Independent Assessment of Indonesiaís Energy Infrastructure Sector
EXHIBIT 22: 10-year economic costs of cooking by fuel type
Source: Consultant team calculations. Purchase costs for electric stoves include the cost of upgrading from 450/900 VA connection to a 1,300 VA
connection.
8.5 Focus City Gas Expansion for Households
Expanding the city gas network to households has taken a high priority in recent years, being perceived as a means of reducing LPG subsidies and imports. ESDM Regulation 4/2018 stipulates that any recipient of a gas distribution area is obliged to provide household gas connections within that area. However, these arguments should be treated with great care. City gas expansion to households may be financially viable, if bundled with industrial and commercial (I&C) customers, so allowing for cross subsidies, and giving city gas concessions priority access to low-cost gas supplies.
However, the economic case for expansion to households is poor. The high costs of connections, estimated at Rp 12 million per household59, mean that required subsidies exceed those for LPG. For city gas, these subsidies are hidden in the form of gas supplies priced below market levels and through cross subsidies from other customers. However, these
hidden subsidies still incur economic costs:
• As a result of being required to cross-subsidize households, I&C customers do not get the full benefits of access to lower-cost gas, reducing their competitiveness and increasing prices for users of their products.
• Gas consumed in city gas networks could, alternatively be allocated to higher-value uses including exports60. Choosing not to do so implies that government is forgoing tax and royalty income that could otherwise pay for subsidies, and is reducing the potential for increased gas exports to offset LPG imports61.
• In the longer term, a subsidy mechanism based on low-priced gas supplies may well not be sustainable. If the volume of supplies falls below demand as one declines and the other rises, the government will face the unpalatable choice of increasing household gas prices or starting to allocate budget subsidies to city gas supplies.
4,500
4,000
3,500
3,000
2,500
2,000
1,500
1,000
500
0
NPV
(USD
)
Traditional Improved LPG Electric stovecookstove cookstove
Health costs
Maintenance costs
Carbon costs
Purchase/intial costs
Cost of time
Tree replacement costs
Fuel costs
4,235
3,076
2,504
3,537

45Independent Assessment of Indonesiaís Energy Infrastructure Sector
EXHIBIT 23: LPG subsidies in Indonesia
Source: Indonesia state budgets.
60,000
50,000
40,000
30,000
20,000
10,000
-
3.0%
2.5%
2.0%
1.5%
1.0%
0.5%
-
billi
on R
p
2010 2011 2012 2013 2014 2015 2016 2017 2018
Cooking
Government officials have often said that reining in LPG imports is critical to reducing the current account deficit. However, in 2018 LPG imports accounted for only about 1.2% of total foreign payments, compared to about 5.0% for gasoline imports. Moreover, a current account deficit is not bad in and of itself. Indonesia’s current account deficit has not reached extreme levels. In any case, it may be better to focus on promoting foreign direct investment than reducing LPG imports in order to improve the current account deficit.
Future city gas expansion projects should be rigorously assessed from an economic perspective prior to embarking on each project, particularly where these include obligations for large numbers of household connections. New concessions might be limited to higher-paying I&C customers, where they use gas that would otherwise be stranded or left unutilized or where local conditions would allow household connections on the order of Rp 5 million per connection.
Electric cookstoves have also been suggested as an alternative to LPG. However, the much higher costs of these stoves and the need for many households to upgrade their electricity connections imply a large cost for such conversions, pushing it above the subsidies required for ongoing LPG supply.
As opposed to thinking that domestic gas in an expanded city gas network could be used to displace LPG imports, the perspective should be that liquefied natural gas (LNG) exports are used to pay for LPG imports, while avoiding the cost of building out the city gas network. Any city gas expansion should be limited to “infill” around existing gas distribution networks and subject to economic analysis. New residential connections could be intermingled with existing connections to I&C consumers, which should be much less costly than new greenfield developments. However, even if this expansion would be economically preferable to greenfield city gas network developments, any such expansions should still be justified by economic analysis.
LPG subsidies as % of state expenditure (RHS)LPG subsidies (billion Rp) (LHS)

EXHIBIT 24: Primary cooking fuel by household expenditure per capita decile
Source: SUSENAS 2017. ‘Other’ includes biogas, briquettes, and charcoal, which are minimally used.
46
Photo by Stephanus Riosetiawan/Flickr (CC BY-SA 2.0)
5.5/12 kg LPG
100.0%
90.0%
80.0%
70.0%
60.0%
50.0%
40.0%
30.0%
20.0%
10.0%
0.0%1 2 3 4 5 6 7 8 9 10
Firewood
City gas
3 kg LPG
Electricity
Does not cook
Other
Kerosene
Independent Assessment of Indonesia's Energy Infrastructure Sector

EXHIBIT 25: Economic cost of city gas versus LPG
Source: SUSENAS 2017. ‘Other’ includes biogas, briquettes, and charcoal, which are minimally used.
Cooking
47
2,500
2,000
1,500
1,000
500
0
Rp00
0s p
er h
ouse
hol
d pe
r yea
r
City gas LPG
Gas transmission / LPG distribution Base fuel
City gas network and connetion / LPG starter kit Trading margin
1,168
628 988
84
171
44
69
11
Independent Assessment of Indonesia's Energy Infrastructure Sector
A. APPENDIX A : Trilemma Assessment
This appendix presents the impacts of key policy
proposals on the trilemma set out in Section 2. It highlights the improvements that these policies are expected to deliver for Indonesia relative to the current position.
48
Photo by Ariel D. Javellana/ADB
Independent Assessment of Indonesia's Energy Infrastructure Sector

49Independent Assessment of Indonesia's Energy Infrastructure Sector
EQUITYSECURITY SUSTAINABILITY
A.1 Overall Sector ManagementImproving Data Reporting and Policy Analysis
The poor quality of existing data makes eff ective policy design far more diffi cult than it needs to be. This is compounded by the lack of a rigorous process of analysis of the impacts of proposed policies. Addressing these weaknesses is expected to deliver improvements on all dimensions of the trilemma as better policymaking results in better outcomes.
Establishing a Meaningful Carbon Target
Indonesia’s current carbon targets, as expressed in its NDC, are essentially meaningless given that data and forecasting errors mean they can easily be met with little or no action. Addressing this by establishing a meaningful revised target based on the NDC will greatly improve sustainability by creating pressure for the necessary measures.

50 Independent Assessment of Indonesia's Energy Infrastructure Sector
A.2 Primary Energy
Replacing the PLN Coal Price Cap with an Export Levy
The existing cap on prices for coal sales to PLN reduces security and sustainability, by promoting the use of a single fuel, coal, over alternatives, but with little compensating improvement in equity given that the benefi ts are mostly to larger consumers. Replacing the cap with an export levy used to fund targeted subsidies for vulnerable customers will improve all aspects of the trilemma, with sustainability gaining the most.
Moving to a Weighted Average Price for Gas
Current administrative rules on the allocation of gas and capped prices which prevent suppliers realizing its full value deter new investment and contribute to the challenges faced in increasing gas production. Introducing a weighted average price mechanism, under which new production can be introduced at higher prices while only marginally aff ecting existing customers, will increase incentives for exploration and development and, by doing so, increase energy security.
EQUITYSECURITY SUSTAINABILITY

51Independent Assessment of Indonesia's Energy Infrastructure Sector
Compensating Aff ected Communities
Currently, the benefi ts of access to lower-cost domestic fuels are realized by all energy consumers, while the adverse environmental, social and health impacts are concentrated in local aff ected communities. Introducing compensation mechanisms directly targeting these communities and funded by all energy consumers, directly or indirectly, will greatly improve the equity of energy supply.
A.3 Electricity
Stronger Power Sector Regulation
The current situation of weak and ineff ective regulation is a root cause of many other sector issues including a reluctance to promote more sustainable energy sources, a focus on blanket rather than targeted subsidies, and excessive investment relative to demand. Strengthening regulation through legal and institutional reforms will improve performance on all aspects of the trilemma giving this cross-cutting impact.
APPENDIX A: Trilemma Assessment
EQUITYSECURITY SUSTAINABILITY

52 Independent Assessment of Indonesia's Energy Infrastructure Sector
EQUITYSECURITY SUSTAINABILITY
Separating System Planning, Single Buyer and System Operator Functions from PLN
Alongside ineff ective regulation, another root cause of the current excess investment, ineffi cient generation operations and institutional bias against renewables are the confl icts of interest inherent in PLN’s roles as planner, buyer, operator, generator and supplier. Separating out responsibilities for planning, procurement and system operation from PLN’s roles as generator, network company and supplier, will help overcome these confl icts, increasing transparency and independence of decision-making and, thereby, improving performance on all dimensions of the trilemma.
A More Supportive Environment for Renewable Energy Development
As well as the institutional barriers posed by ineff ective regulation and PLN’s internal confl icts of interest, the expansion of renewable energy faces multiple other constraints including a failure to recognize its wider benefi ts in prices, restrictive rules on local content and ownership, long delays in obtaining approvals and acquiring land, and protracted negotiations. Addressing these other barriers will support a far more rapid expansion of renewables which, in turn, contributes to improving energy security and, in particular, sustainability.
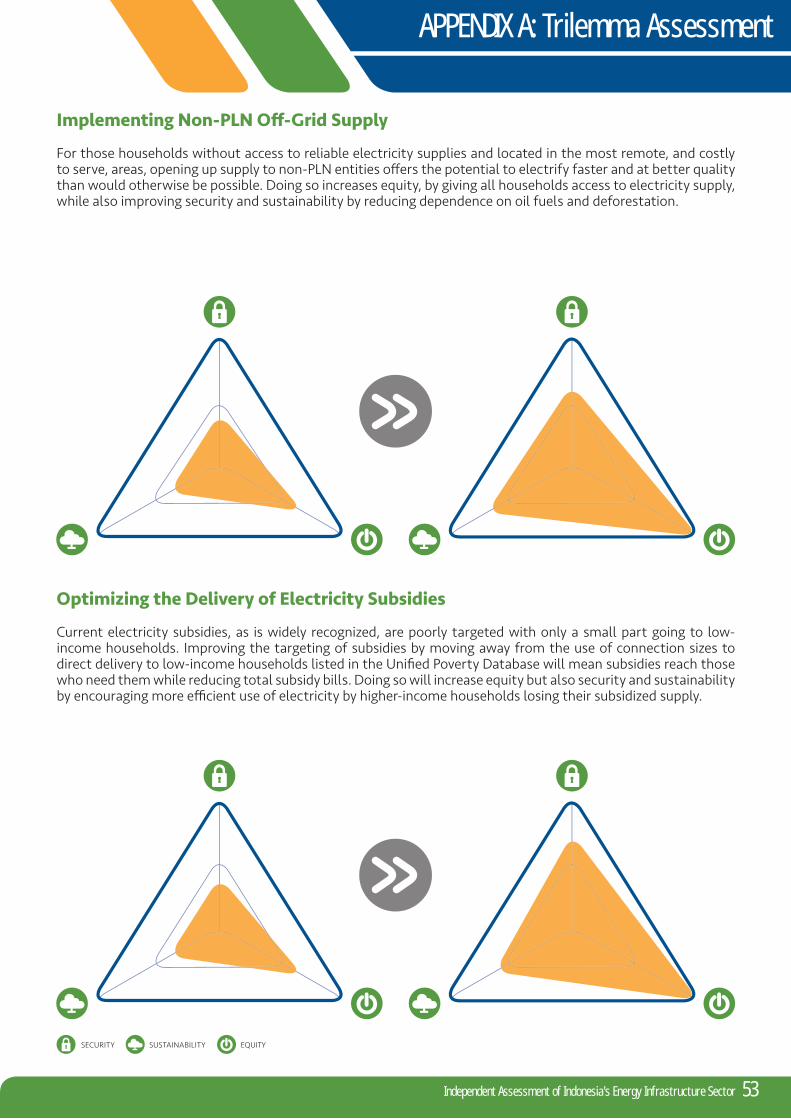
53Independent Assessment of Indonesia's Energy Infrastructure Sector
Implementing Non-PLN Off -Grid Supply
For those households without access to reliable electricity supplies and located in the most remote, and costly to serve, areas, opening up supply to non-PLN entities off ers the potential to electrify faster and at better quality than would otherwise be possible. Doing so increases equity, by giving all households access to electricity supply, while also improving security and sustainability by reducing dependence on oil fuels and deforestation.
Optimizing the Delivery of Electricity Subsidies
Current electricity subsidies, as is widely recognized, are poorly targeted with only a small part going to low-income households. Improving the targeting of subsidies by moving away from the use of connection sizes to direct delivery to low-income households listed in the Unifi ed Poverty Database will mean subsidies reach those who need them while reducing total subsidy bills. Doing so will increase equity but also security and sustainability by encouraging more effi cient use of electricity by higher-income households losing their subsidized supply.
APPENDIX A: Trilemma Assessment
EQUITYSECURITY SUSTAINABILITY

54 Independent Assessment of Indonesia's Energy Infrastructure Sector
EQUITYSECURITY SUSTAINABILITY
A.4 End-Use Energy Effi ciency
Improving End-Use Energy Effi ciency
A recurrent theme of this White Paper is the huge and unrealized potential for energy effi ciency in Indonesia. Increased emphasis on improving end-use energy effi ciency, starting with better regulations, pilot programs and incentives, will trigger large benefi ts through greater security and sustainability as the quantities of energy supply required to meet demand falls.
A.5 Road Transportation
Optimizing Transport Fuel Subsidies
As with electricity and LPG subsidies, current blanket transport fuel subsidies based on fuel type and uses rather than need are poorly targeted to low-income households and promote ineffi ciency and, in transport specifi cally, the use of low-quality and polluting fuels. Replacing them with targeted subsidies and a petroleum fund to protect against large price shocks, while retaining the One-Price-Policy but making it a budget subsidy, will improve equity through better targeting and security and sustainability through encouraging more effi cient fuel use and helping end the use of RON 88 gasoline as a fuel.

55Independent Assessment of Indonesia's Energy Infrastructure Sector
APPENDIX A: Trilemma Assessment
EQUITYSECURITY SUSTAINABILITY
Prepare for Electric Vehicles
At this time, benefi ts from a large-scale shift to EVs are limited due to their higher cost and the high carbon intensity of grid electricity. However, in the longer term, they will become more attractive. At this time, various initial steps can be taken to prepare for their future rollout including piloting in selected fl eet uses and encouraging the use of low-powered electric motorcycles by adapting regulations on licensing requirements. Doing so will pave the way for future improvements in sustainability and security as EV use expands.
A.6 Cooking
Expanding Access to Clean Cooking Fuels
Addressing this by continuing to roll out LPG and, where lack of distribution infrastructure makes this currently infeasible, clean cookstoves as an interim option, will address this inequitable position, giving all households the benefi ts of access to clean fuels.

56 Independent Assessment of Indonesia's Energy Infrastructure Sector
EQUITYSECURITY SUSTAINABILITY
Optimizing Delivery of LPG Subsidies Strengthens Energy Security and Equity
Similar to other existing subsidies, the blanket subsidy for small-sized LPG cylinders is poorly targeted towards low-income households while encouraging ineffi cient and excessive consumption. Improving targeting through measures such as linking to eligibility for subsidized electricity will improve equity while also improving security through more effi cient LPG use.

Foto oleh Gerhard Joren/ADB
APPENDIX A: Trilemma Assessment
57Independent Assessment of Indonesia's Energy Infrastructure Sector
58 Independent Assessment of Indonesia's Energy Infrastructure Sector
Endnotes
Photo by Ariel D. Javellana/ADB

59Independent Assessment of Indonesia's Energy Infrastructure Sector
1 Amory Lovins, Asia Clean Energy Forum 2019. Primary energy use in 2018 was ~100 quadrillion BTU compared to an estimated ~225 quadrillion BTU if the 1975 energy efficiency and structure had remained unchanged or a saving of 125 quadrillion BTU. Renewable energy in 2018 contributed ~10 quadrillion BTU. Between 1975 and 2018, the total energy consumption avoided due to reduced energy intensity is estimated as 2,589 quadrillion BTU compared to total renewable energy supply over the same period of 87 quadrillion BTU.
2 Estimated as BOE/Rp billion (constant prices). As well as revisions to FEC estimates, the base year for real GDP values was also revised from 2000 to 2010 between the 2015 and 2018 editions of the HEES. The GDP time series are, therefore, inconsistent between the two editions.
3 Includes hydro and pumped storage (all sizes), wind, solar and waste-to-energy.
4 ESDM. 2016. Data Inventory Emisi GRK Sektor Energi. Jakarta
5 The Kaya Identity is used as a way of decomposing changes in greenhouse gas emissions so as to identify the contribution of different drivers. It has been applied by the Intergovernmental Panel on Climate Change (IPCC), among others, in reviews of historical causes of emissions increases and in formulating scenarios.
See, for example: Blanco G et al. 2014: Drivers, Trends and Mitigation. In Climate Change 2014: Mitigation of Climate Change. Contribution of Working Group III to the Fifth Assessment Report of the Intergovernmental Panel on Climate Change.
6 Estimates are obtained from PLN’s most recent investment plan, approved by ESDM in February 2019. Rencana Usaha Penyediaan Tenaga Listrik (RUPTL) 2019-28.
7 Calculated using data from BP (2018).
8 Directorate General of Minerals and Coal, Laporan Kinerja Tahun 2018, https://www.minerba.esdm.go.id/show/show _pdf?link _ file=95. However, as noted elsewhere in this White Paper, energy statistics are often inconsistent or unreliable. In this case, the Indonesian Coal Mining Association reported a revised 2018 production figure of 557 mt. http://www.apbi-icma.org/en/news/1348/2018-coal-production-reached-557-million-tons-the-highest-in-the-last-five-years. These figures exclude any illegal mining.
9 Bank Indonesia, Statistik Ekonomi dan Keuangan Indonesia (SEKI), https://www.bi.go.id/id/statistik/seki/terkini/eksternal/Contents/Default.aspx, Sektor Eksternal, Table V.14.
10 BP Statistical Review of World Energy 2019, https://www.bp.com/content/dam/bp/business-sites/en/global/corporate/pdfs/energy-economics/statistical-review/bp-
stats-review-2019-indonesia-insights.pdf.
11 RUKN 2019-2038
12 Statistik Ketenagalistrikan dan Energi Tahun 2009 (Direktorat Jendral Listrik dan Pemanfataan Energi) and Statistik Ketenagalistrikan Tahun 2018 (Direktorat Jendral Ketenagalistrikan).
13 RUKN 2019-2038
14 Permen ESDM 14/2008, 5/2009, 32/2009, 2/2011, 22/2012,17/2014, 12/2017 and 50/2017. Another new pricing regulation is expected later this year.
15 Based on a subsidized tariff of Rp 375/kWh, an unsubsidized tariff of Rp 1,467/kWh and average R-1 450 VA consumption in 2018 of 1,017 kWh per year.
16 https://www.esdm.go.id/id/media-center/arsip-berita/capaian-ditjen-ketenagalistrikan-semester-i-2019-rasio-elektrifikasi-meningkat-tarif-listrik-tetap-kemudahan-berbisnis-listrik-membaik-1
17 https://www.esdm.go.id/id/media-center/arsip-berita/pemerintah-siapkan-strategi-melistriki-1592990-rumah-belum-berlistrik-
18 These functions include approval of retail tariffs (after approval by the DPR) and tariff adjustments; approval of wheeling charges and bulk supply tariffs, and rules for pricing of these services; preparation of open access rules; designation of supply activities open to parties other than state-owned enterprises; issuance of supply licenses; designation of business areas; approval of electricity supply business plans; stipulation of electricity supply standards; approval of international interconnections; stipulation of rules and issuance of licenses for captive generation; approval of excess power sales from captive generation; stipulation of compensation for network rights-of-way; issuance of safety regulations and standards; appointment of inspectors; and supervision of electricity supply and utilization.
19 However, because Law 30/2009 does not explicitly provide for creation of a regulator, establishment of one under a government regulation may be difficult. In that case it could be established by presidential regulation, ESDM would retain its authorities under PP 14/2012.
20 At present PLN does not pay its subsidiaries a commercially viable bulk power tariff. Doing so would allow the PLN generation subsidiaries to secure their own financing and evolve as a credible alternative to IPPs.
21 Rakhmadi, R. and Sudirman, M. “Developing a Guarantee Instrument to Catalyze Renewable Energy Investment in Indonesia”, Climate Policy Institute, June 2019. https://climatepolicyinitiative.org/publication/developing-a-

60 Independent Assessment of Indonesia's Energy Infrastructure Sector60
Photo by Ariel D. Javellana/ADB
Independent Assessment of Indonesia's Energy Infrastructure Sector
guarantee-instrument-to-catalyze-renewable-energy-investments-in-indonesia/.
22 Massachusetts Institute of Technology and Instituto Investigacion Tecnologica, “Least-Cost Electrification Planning for the Maluku-Papua Region of Indonesia”, a presentation under ADB TA No. 8858-INO: Strengthening Knowledge Sharing in Indonesia, 18 July 2019.
23 A cautionary note is provided by a September 2018 World Bank presentation, which suggests that while much progress has been made with the UDB, much work remains in developing and maintaining the database: http://pubdocs.worldbank.org/en/740391538412427316/5-Indonesia-UDB-Said-Mirza-Pahlevi.pdf
24 IEA (2018). Energy Efficiency 2018: Analysis and Outlooks to 2040. Paris
25 Ibid. This is the estimated improvement from moving to no standard to IE2 standards for electric motors. The estimated savings of 8 PJ represent around 0.5% of final energy consumption in industry.
26 EECCHI (2012). Energy Efficiency Guidelines for Building Design in Indonesia: Vol 3 – Case Studies. Jakarta. The two government buildings included in the case studies were the retrofitting of the EECCHI Office located within the ESDM office complex (energy savings >50%) and the design of the Ministry of Public Works office building (energy savings of 56%).
27 McNeill M et al (2019). “Forecasting Indonesia’s electricity load during 2030 and peak demand reductions from appliance and lighting efficiency”. Energy for Sustainable Development 49: 65-77. Berkeley CA
28 Estimated using an average grid emission factor of 0.79 kgCO2/kWh.
29 Peraturan Pemerintah Nomor 70 Tahun 2009 Tentang Konservasi Energi
30 Zed F (2015). “Indonesia Energy Efficiency and Conservation Status, Gaps and Opportunities”. Global Workshop to Accelerate Energy Efficiency. Copenhagen 9-12 November 2015
31 JICA (2015). Research on Green Urban Development: Final Report. Technical Cooperation Project for Capacity Development for Green Economy Policy in Indonesia
32 A total of 339 buildings with floor space of 221 million m2 are now reported to comply with the code in Jakarta and more than 3,000 buildings with floor space of 880,000 m3 in Bandung. However, these remain a very small part of total building numbers and floor space. Source: Rahman R (2019). “Poor customer awareness holds back green building projects”. Jakarta Post. 20 February 2019
33 The most recent example project financed by PT SMI is a concession to install and maintain energy-efficient street lighting in Surakarta. PT SMI (2019). Annual Report 2018
34 ESDM and MoF. 2019. Indonesia’s Effort to Phase Out and Rationalise its Fossil Fuel Subsidies. Self-report on the G20 peer review
35 GSI, September 2015, Indonesia Energy Subsidy News Briefing.
36 https://www.asiatimes.com/2019/02/article/fuel-prices-drive-indonesias-election-debate/
37 Braithwaite, D. and I. Gerasimchuk, 2019, ‘Beyond Fossil Fuels: Indonesia’s fiscal transition’. Winnipeg/Geneva: IISD/GSI. https://www.iisd.org/sites/default/files/publications/beyond-fossil-fuels-indonesia-fiscal-transition.pdf
38 Forecasts vary widely, but EV sales are projected to reach 9.5 to 32% of the world’s passenger vehicles by 2040: https://qz.com/1620614/electric-car-forecasts-are-all-over-the-map/
39 McKinsey & Co. 2019. Making Electric Vehicles Profitable
40 https://www.reuters.com/article/us-indonesia-energy-lawmaking/indonesia-embarks-on-overhaul-of-oil-gas-law-to-halt-output-slide-idUSKCN1PI1L8
41 Other identified countries using RON 88 or lower quality gasoline include: Bangladesh, Bolivia, Colombia, Guatemala, Honduras, Kyrgyzstan, Mongolia, Nicaragua, Senegal and Uzbekistan. All ASEAN countries other than Indonesia use higher grade regular gasoline.
IEA. 2019. World Energy Prices (2019 Edition): Database Documentation
42 In 2015, sales of RON 88 were 28.1 million liters and of RON 90 were 0.4 million liters, compared to 3.0 million liters combined for RON 92 and RON 95. By 2018, sales of RON 88

61Independent Assessment of Indonesiaís Energy Infrastructure Sector
Endnotes
61Independent Assessment of Indonesia's Energy Infrastructure Sector
had fallen to 10.7 million liters whilst those of RON 90 had risen to 17.7 million liters and combined sales of RON 92, RON 95 and RON 98 to 6.0 million liters.
Tomo R. 2019. Global Fuel Technology: PT Pertamina (Persero). Gaikindo International Conference. 24 July 2019
43 https://www.spglobal.com/platts/en/market-insights/latest-news/oil/031918-indonesia-plans-to-import-9-mil-barrels-of-gasoline-in-apr-flat-from-mar-traders
44 Estimates are that the fuel economy of modern gasoline engines increases by approximately 1% per octane number increase.
Shuai, S., Wang, Y., Li, X., Fu, H. et al., "Impact of Octane Number on Fuel Efficiency of Modern Vehicles". SAE Int. J. Fuels Lubr. 6(3):702-712, 2013,
45 The U.S. Department of Energy has recently forecast battery costs to fall by 12% per annum: https://energy.gov/sites/prod/files/2017/02/f34/67089%20EERE%20LIB%20cost%20vs%20price%20metrics%20r9.pdf
46 In Vietnam, for example, 2017 sales of e-motorcycles were estimated at 400,000 units or over 10% of the motorcycle market. One reason is that smaller e-motorcycles (under 250 W) are classified as bicycles and do not require a driver’s license, making them very popular with students (over 70% of e-motorcycles are reported to be owned by teenagers).
Nguyen X and Q Nguyen. 2015. Service Issues: Overview of Electric Vehicles Use in Vietnam. 3rd Electromobility Challenging Issues Conference. 1st – 4th December 2015.
NNA Business News. 2018. “Electric scooters sparking interest in Vietnam’s two-wheeler market”. NNA Business News. 28 December 2018
47 https://www.thejakartapost.com/news/2019/11/29/technology-regulation-key-driving-ev-adoption.html
48 https://theinsiderstories.com/indonesias-govt-prepares-electric-motorbike-regulations/
49 Synergy Downstream Solutions. 2018. Realising Downstream Energy Security at No Cost to Government. Presentation to DEN, 26th March 2018. Unpublished
50 ESDM’s Handbook of Energy and Economic Statistics 2018 shows domestic production of RON 88 as declining from 12.4 billion litres in 2008 to 9.3 billion litres in 2018, with its share of domestic consumption rising over the same period from 43% to 89% as RON 88 sales fell sharply (from a peak of 28.8 billion litres in 2014 to 10.4 billion litres in 2018). However, the data also shows large mismatches between the sum of supply (refinery production plus imports) and consumption, implying these figures are unreliable.
51 BPS SUSENAS 2017.
52 GBD 2017 Risk Factors Collaborators, ‘Global, regional, and national comparative risk assessment of 84 behavioural, environmental, and occupational, and metabolic risks or clusters of risks for 195 countries and territories, 1990-2017: a systematic analysis for the Global Burden of Disease Study 2017’, Lancet 2018; 392: 1923-94.
53 Lim, et al, 2012, ‘A comparative risk assessment of burden of disease and injury attributable to 67 risk factors and risk factor clusters in 21 regions, 1990-2010: a systematic analysis for the Global Burden of Disease Study 2010’, Lancet 2012; 380: 2224-60.
54 Bank Indonesia, Statistik Ekonomi dan Keuangan Indonesia (SEKI), “Sektor Eksternal” tables V.1, V.10 and V.19, https://www.bi.go.id/id/statistik/seki/terkini/eksternal/Contents/Default.aspx.
55 Kompas, 2017, Subsidi Elpiji Diganti Transfer. Available online here: https://www.pressreader.com/indonesia/kompas/20170608/281943132854760
56 S. R. Sulaiman, ‘Distribution issues persist for low-cost 3 kg gas canisters’, The Jakarta Post, 1 March 2019.
57 PGN, Jaringan Gas Rumah Tangga: Melalui Skema KPBU assumption
58 The average landed LNG price in Japan for the period September 2018 – August 2019 was USD 7.5/MMBtu.
59 The opportunity cost argument is the same even for smaller gas fields where liquefaction and export is not feasible. The gas, if not used as city gas, would otherwise be used in power generation or industry, which would reduce the need for internal LNG shipments (e.g. into Java), freeing up internal LNG consumption for export.
Glossary
Photo by Ariel D. Javellana/ADB
62 Independent Assessment of Indonesia's Energy Infrastructure Sector

63Independent Assessment of Indonesia's Energy Infrastructure Sector
ADB: Asian Development BankBappenas: Ministry of National Development Planning (Badan Perencanaan Pembangunan Nasional)BAT: Best available technologyBAU: Business as usualbcm: Billion cubic metersBKF: Fiscal Policy Agency (Badan Kebijakan Fiskal)BLU: Public service unit (Badan layanan umum)BOE: Barrels of oil equivalentBPHMIGAS: Downstream Oil And Gas Regulatory Agency (Badan Pengatur Hilir Minyak dan Gas Bumi)BPS: Statistics Indonesia (Badan Pusat Statistik)BPDPKS: Oil Palm Plantation Fund Management Agency (Badan Pengelola Dana Perkebunan Kelapa Sawit)CFL: Compact fluorescent lampCSR: Corporate social responsibilityDBH-SDA: Natural Resource Profit Sharing Funds (Dana Bagi Hasil – Sumber Daya Alam)DFAT: Australian Department of Foreign Affairs and TradeDSA: Distribution service agreementEBR: Energy buffer reserveESCO: Energy service companyESDM: Ministry of Energy and Mineral Resources (Kementerian Energi dan Sumber Daya Mineral)EV: Electric vehicleFDI: Foreign direct investmentFEC: Final energy consumptionGBD: Global Burden of DiseaseGDP: Gross Domestic ProductGHG: Greenhouse gasI&C: Industrial and commercialICP: Indonesian Crude PriceICS: Improved cookstovesIEA: International Energy AgencyIFC: International Finance CorporationIPF: Indonesian Petroleum FundIPP: Independent power producerJICA: Japan International Cooperation AgencykW, MW, GW: Kilowatt, Megawatt, GigawattkWh: Kilowatt-hourLNG: Liquefied natural gasLPG: Liquefied petroleum gasMEPS: Minimum energy performance standardsMoF: Ministry of Finance (Kementerian Keuangan)MSOE: Ministry of State-Owned Enterprises (Kementerian Badan Usaha Milik Negara)MtCO2e: Million tons of carbon dioxide equivalentNDC: Nationally Determined ContributionNOx: Nitrous oxidePLN: State Electricity Company (Perusahaan Listrik Negara)PM: Particulate matterPP: Government regulationPPA: Power purchase agreementppm: Parts per millionPPP: Public-private partnershipPPU: Private power utilityPT SMI: PT Sarana Multi InfrastrukturPusdatin: Center for Data and Information Technology (Pusat Data dan Teknologi Informasi)RON: Research octane numberRPJMN: National Medium-Term Development Plan (Rencana Pembangunan Jangka Menengah Nasional)RUEN: National Energy Plan (Rencana Umum Energi Nasional)RUKN: National Electricity Plan (Rencana Umum Ketenagalistrikan Nasional)RUPTL: Electricity Supply Business Plan (Rencana Usaha Penyediaan Tenaga Listrik)SAIDI: System Average Interruption Duration IndexSB: Single buyerSHS: Solar home systemSNI: Indonesian National Standards (Standar Nasional Indonesia)SO: System operatorSP: System plannerSOE: State-owned enterpriseTNP2K: National Team for Acceleration of Poverty Reduction (Tim Nasional Percepatan Penganggulangan Kemisikinan)TOE: Tons of oil equivalentTSA: Transmission service agreementUNDP: United Nations Development ProgrammeVA: Volt-ampereWAP: Weighted average priceWB: World BankWHO: World Health Organization

Photo by Ikhlasul Amal/Flickr (CC BY-NC 2.0)
64 Independent Assessment of Indonesia's Energy Infrastructure Sector

65Independent Assessment of Indonesia's Energy Infrastructure Sector

Photo by Ian Taylor/ADB