SECToR REwiEw
60
DECEMBER 2012 The Consulting Engineering and Architectural Groups A Swedish and International survey The Danish Association of Consulting Engineers Association of Consulting Engineers, Norway The Icelandic Association of Consulting Engineers The Finnish Association of Consulting Firms The Association of Finnish Architects’ Offices SECTOR REWIEW IN CO-OPERATION WITH The Swedish Federation of Consulting Engineers and Architects
-
Upload
khangminh22 -
Category
Documents
-
view
4 -
download
0
Transcript of SECToR REwiEw

1Sector Review • The Swedish Federation of Consulting Engineers and Architects • December 2012
december 2012
The consulting engineering and Architectural Groups A Swedish and International survey
The danish Association of consulting engineers
Association of consulting engineers, Norway
The Icelandic Association of consulting engineers
The Finnish Association of consulting Firms
The Association of Finnish Architects’ Offices
SECToR REwiEw
R Å D G I V E N D E I N G E N I Ø R E R S F O R E N I N G
IN cO-OperATION wITh
The Swedish Federation of Consulting Engineers and Architects

2 Sector Review • The Swedish Federation of Consulting Engineers and Architects • December 2012

3Sector Review • The Swedish Federation of Consulting Engineers and Architects • December 2012
Contents
The inTernaTional markeT 47
international development 48
The world’s 10 largest groups 48
Listed consultancies in the west – a comparison 49
Europe’s 50 largest architectural groups 50
Europe’s 300 largest groups 51
Foreword 5
The SwediSh markeT 6
An economic downturn for industry will also affect the service sector 6
Sector development 2011 and 2012 8
Swedish corporate events 13
Key business ratios for the largest Swedish consulting firms 14
The 50 largest architectural groups 16
The 50 largest groups in industrial engineering 17
Sweden’s 300 largest groups 19
The photo on the front cover shows the winning entry in the Stora Samhällsbyggarpriset 2012 (a competition to select the best major built environment project for the year). According to the rules of the competition, the prize shall be awarded to a building or facility of high quality, produced as a result of model cooperation between the different players in the built environment process. The winner of the Stora Samhällsbyggarpriset 2012 was Messingenhuset in Upplands Väsby, designed by white Architects AB, with the following motivation: ”for an effective use of society’s resources that resulted in a major contribution to a living, instructive and sustainable urban environment”.
other entries included Kulturhuset Spira in Jönköping, with culture in the very centre of the townscape and integrated in urban life through its accessibility, the Clarion Hotel Post in Gothenburg, with its impressive preservation of the qualities that characterise the historical building Centralposthuset, and Gravitationsdestilleriet in Gävle, a functional and easily managed industrial facility offering major business potential.
Facts and information on Stora Samhällsbyggarpriset and the nominated entries can be found at: www.samhallsbyggardagen.se
Front cover photo:Messingenhuset, Upplands Väsby (Photographer Torbjörn Larsson)
The nordic markeT 25
Nordisk jämförelse av nyckeltal 26
The 100 largest architectural groups in the Nordic area 27
FRi – The Danish market 29
Denmark’s 100 largest groups 32
RiF – The Norwegian market 34
Norway’s 100 largest groups 37
FRV & FSSA – The icelandic market 39
iceland’s 18 largest groups 41
SKoL – The Finnish market 42
ATL – The Finnish architect market 44
Finland’s 100 largest groups 45
Frankfeldt Grafisk Form ABJNG Ainscough HB, translationsineko Stockholm 2012

4 Sector Review • The Swedish Federation of Consulting Engineers and Architects • December 2012
The Sector Review has been published by the Swedish Federation of Consulting Engineers and Architects (STD-företagen) since 1995. It is a compilation of the architectural, engineering consultancy and industrial consultancy sectors in Sweden, the Nordic countries and Europe. The Review presents ranking lists of the largest corporate groups on the respective markets, interesting key business ratios, news about structural transactions and information on the development and economy within the sector over the past year.
Since 2005, STD-företagen’s counterparts in the neighbouring Nordic countries have contributed to the review. STD-företagen represents architects, engineering consultants and industrial engineering consult-ants, whereas the Nordic organisations only represent engineering consultants and, in certain cases, industrial engineering consultants. In Finland and Iceland, architectural firms also take part in collaboration on the Sector Review. The organisations that participate in this cooper-ation are FRI in Denmark, RIF in Norway, SKOL & ATL (architects) in Finland and FRV & FSSA (architects) in Iceland.
The figures in the Review are based on the latest available data that we have been able to find on the respective firms. For just over half the firms the review is equivalent to a calendar closing for 2011. The re-maining firms have split financial years. In most cases, we have received their annual reports for 2011/12. However, some annual accounts were not ready when work on the collection of basic data came to an end, for example for those companies whose annual accounts close at the end of August. In these cases, we have retained the same figures as for 2010/11. For the sake of simplicity, we refer to the compiled figures that applied for 2011.
The corporate information in the Review has been acquired via the databases Soliditet (Sweden) and Dow Jones Companies & Executives (Europe), from the Nordic organisations, direct from companies or via the companies’ home pages. The monitoring covers some 1 500 companies in Sweden, the Nordic Area and Europe. Collecting the in-formation is an extensive and time-consuming task, and in some cases it is impossible to obtain reliable information. The information on the international companies is more difficult to access. In Sweden, annual reports are public documents. This is not the case in all countries, and many firms are loath to disclose their figures. In these cases, we use the most recent material we can find. Consequently, all companies that appear in – or should appear in – the Review are requested to contact STD-företagen (Swedish Federation of Consulting Engineers and Architects) and to submit their details in order to make sure that the information published on them is correct.
We would in particular like to thank those companies that have helped us by submitting their annual reports.
Swedish Federation of Consulting Engineers and Architects
The Sector Review

5Sector Review • The Swedish Federation of Consulting Engineers and Architects • December 2012
Foreword
Svenska Teknik&Designföretagen (the Swedish Federation of Consulting Engineers and Architects) – referred to in this Sector Review as STD-företagen – is the trade and employers’ organisation for some 700 architectural, engineering and industrial consulting firms within the building and industrial sector. With a total of approxi-mately 32 500 members, STD-företagen represents just over two-thirds of the sector’s resources. STD-företagen’s member firms develop society physically and play key roles in the overall development of society through the design and construc-tion of a wide variety of buildings and urban developments, important infrastructure, environment and climate systems, energy and nature as well as new products and processes for industry, etc. The work of the member firms includes innovation, new construction, conversion, maintenance and efficiency improvement.
Project managers, architects, engineering and industrial consultants investigate, plan, design and take part on the Swedish market in the development of real investments and products for some SEK 330 billion per year. The sector thus influences the development of over 10 per cent of Sweden’s GNP and STD-företagen’s member firms are involved in creating lasting values.
In 2010, STD-företagen – with its predecessors SKIF, SPA, AI-företagen – celebrated its 100-year anniversary. We are now well on the way into a new century with numer-ous opportunities and challenges. Globalisation in particular is having a major impact on the members, offering the potential for an increase in the export of services and at the same time creating challenges on the domestic market in the form of growing foreign competition.
In Almega’s October/November report on the economy, it is concluded that the economic downturn in the world around us has also affected the service sector during the year; employment levels are rising at an increasingly slower rate and growth is only being sustained by a limited number of sectors. A large part of the business world has experienced slower growth during the autumn and recovery is being pushed further into the future. A weaker euro coupled with the lack of interest on the part of banks to invest and the new capital cover requirements from 2013 onwards, will probably have an impact on our sector. Exactly how and to what extent, however, remains to be seen.
The sector will also continue to be faced with new challenges in connection with both the recruitment of personnel as well as procurement and project forms. Competition, not least from abroad, is growing and thus also the demand for efficiency improve-ment in all types of production. The ability of the sector to improve efficiency will be a decisive factor. Companies must focus on client benefit and a high level of cooperation with the players on the market. STD-företagen’s member firms are an important part of the continued growth of both the community development sector and industry. Through their knowledge, consultants contribute towards research, development and rationalisation work. STD-företagen is endeavouring to ensure that the sector will increase its efforts to create a society that is sustainable in the long term.
The Sector Review is distributed to the member companies of STD-företagen as well as to the other companies that take part in the survey. It is also distributed to influential client companies, journals, economic forecasters, corporate analysts, etc. as well as to Swedish embassies and export offices. This English version of the review is distributed to other Nordic organisations and to those foreign companies that take part in our survey, as well as to international development banks, development organi-sations and administrations within the EU and to international journals.
The Sector Review is dependent for its existence on participation from a large number of companies both within and outside Sweden. We should therefore like to especially thank all those contributors who have helped to make this review possible.
Stockholm, December 2012
Inger Lindberg Bruce
Scheiwiller Svensson Arkitektkontor AB Chairman of the Swedish Federation of Consulting Engineers and Architects

6 Sector Review • The Swedish Federation of Consulting Engineers and Architects • December 2012
An economic downturn for manufacturing will also affect the service sector
Almega has concluded that the majority of the service sector has during 2012 been affected to an increasing extent by a weaker business climate. Growth within most service industries has slowed down, particularly during the second half of the year. Even those industries that have been able to hold up demand longer than others, such as engineering consultancy and architecture, have during the autumn experienced a rapid shift towards a weaker demand for their services. Companies appear to have been somewhat surprised by the rapid downturn in demand. In October, only about a third of those firms making up the entire engineering consultancy and archi-tectural sector were reckoning on an increase in demand during the coming six-month period, but above all it is a larger proportion than previously, 20 %, that are expect-ing a decrease in demand.
The fact that architects and engineer-ing consultants are affected later than a number of other industries is normal. The export industry is usually posi-tioned early in the business cycle, and the demand from export markets began to decline as early as in the summer of 2011. Capital investments by the manu-facturing industry in Sweden began to fall during the third quarter of 2012, and have grown with only about 4 % so far in 2012, compared with 10 % during the corresponding period in 2011, i.e. during the 1st-3d quarter. There are in addition only a few industries that have contributed to the increase in 2012, primarily the motor vehicle industry and the chemical industry. The down-turn in the economy during the second half of 2012 suggests the likelihood of even weaker investments ahead. During 2013, the investment plans of manu-facturing companies show a reduction of 3 %, according to Statistics Sweden’s investment questionnaire from October.
Forecasts for an upswing in Sweden’s most important export markets have been postponed until sometime next year, 2013, and the recovery is further-more expected to be sluggish. The back-ground to this is the austerity measures
that will have to be implemented in a number of countries in order to reduce government budget deficits and to pay instalments on record high national debts. Questions also remain concern-ing developments in several countries, for example as to whether Greece will be able to cut spending and increase in-come in order to be granted further cri-sis borrowing from EU, ECB and IMF, and remain a member of the Euro zone. Another question is whether or not the US will be able to avoid falling down into the so-called fiscal cliff, if the US Congress will fail to reach an agreement on preventing the withdrawal of exten-sive tax reliefs and incentive measures at year-end. Otherwise, a major economic tightening can be expected in the US economy and a return to recession.
The Swedish economy has slowed down significantly towards the end of 2012, when even the service sector has almost come to a standstill. Almega anticipates weak growth in the service sector next year, of approximately 1.5 %. Sweden’s total production, GDP, is forecast to increase by only 0.8 % during 2012 and by 1.2 % in 2013, despite the fact that exports are expected to recover dur-ing the course of the year, although at

7Sector Review • The Swedish Federation of Consulting Engineers and Architects • December 2012
a slow rate. Real household income is expected to increase, but Almega reck-ons that the household savings ratio will increase in step with rising unemploy-ment, and households will therefore be more cautious in their consumption.
Weak growth coupled with the uncer-tainty regarding developments in the world economy mean that the invest-ment plans within the business sector will be restrained. Almega anticipates a major slow-down of the investment rate within the service sector, from an increase of just over 10 % last year to an increase of 2.5 % in 2012.
Investments in the construction industry and dwellings are expected to drop in 2012 and undergo a weak recovery next year. There was a significant decrease in new investments in one and two family houses and apartment buildings during the third quarter of 2012. The downturn was softened by encouraging growth within other construction, for example road constructions. However, next year, in 2013, the growth in this type of investment will decrease. The money to be spent on infrastructure that was announced in the government’s autumn budget is not expected to have any real impact on the investment rate
over the next two years. The appropria-tion for infrastructure will in fact be reduced during 2013.
Almega’s forecast for Sweden’s total fixed gross capital formation is now showing a longer investment period with weak development and a recovery not until 2014. Then, Almega’s forecast indicates a growth of 3.2 % following an increase of just over 2 % in 2013.
Despite a lowering of expectations regarding the level of demand for en-gineering consultancy and architectural services, engineering consultants plan to recruit more personnel in the near future. At the same time, some 60 % of the firms are experiencing staff short-ages. During the third quarter this year, 2012, over half the firms within these industries were of the opinion that the principal restraint on their growth was a shortage of manpower. This is an impending problem that will have a key influence on the growth within this im-portant part of the service sector, once the economy again starts to recover.
Lena HagmanSenior Economist, Almega, November 2012
Gross fixed capital formation, % change, annual rate, fixed prices, outcome til the 3d quarter 2012
2000 2001 2002 2003 2004 2005 2006 2007 2008 2009 2010 2011 2012
30
20
10
0
-10
-20
-30
Per
cent
age
chan
ge
Housing investments Other buildings and installations
”“Sweden’s GDP is expected to grow by only 0.8 % in 2012 and 1.2 % in 2013”

8 Sector Review • The Swedish Federation of Consulting Engineers and Architects • December 2012
Sector development in 2011 and 2012
Turnover in the Sector, mSek
average number of employees in the Sector
Source: The Swedish Federation of Consulting Engineers and Architects
no. of employees no. of firms
501 – 14 101 – 500 38 51 – 100 40 21 – 50 110 11 – 20 111 3 – 10 1 447 0 – 2 10 200
*) “of the building/construction-oriented consultancies architects represent SEK 6 800 million in turnover and 6 300 employees in 2011.”
2011 was a strong year, and profitability in the sector continued to improve. The profit margin for the 300 largest groups increased to 8.1 % from 7.9 % the year before. Development continued in the same direction during the first half of 2012. However, at the end of the summer the recession in the surrounding countries finally reached Sweden too. The service sector and the engineering consultancy, industrial consultancy and architectural firms have felt its effects. Towards the end of the autumn, the slackening of the economy has become noticeable and the prospects for 2013 are significantly more dismal than they were at the beginning of 2012.
Sector size and key business ratiosA full review of the sector was conducted during the spring, so the figures on the size of the sector – in terms of number of employees and turnover – have been re-vised. The sector consists of some 12 000 firms. Of these, approximately 50 have over 100 employees. 10 200 of the firms have between zero and two employees.
The distribution according to size is as follows:
The sector had a turnover of some SEK 53 billion during 2011/12 and employed 46 000 staff. The turnover per employee throughout the entire sector was SEK 1 052 000. The average operating margin for the sector as a whole was 8.2 %. The profit margin was also 8.2 %.
The 300 largest firms in the sector, which are presented in a list on page 19, repre-sent a large part of the total sector. Together, they billed for a total of SEK 48 billion and had 43 000 employees. The 300 largest firms in the sector reported a joint operating result of SEK 3 976 million and a joint profit after financial items of SEK 3 950 million. This gives an average operating margin of 8.2 %, compared with 8.1 % the previous year. The profit margin was 8.1 %, com-pared with 7.9 % the year before. The turnover per employee among the 300 largest firms was SEK 1 130 000.
The architectural firms had an average turnover per employee of SEK 1 132 000, compared with SEK
12,2
005,
300
13,3
006,
400
14,5
007,
400
15,8
008,
400
17,1
009,
800
17,4
009,
800
12,1
004,
200
12,0
003,
500
11,4
003,
100
10,7
002,
500
10,4
001,
600
11,8
001,
200
13,2
001,
100
14,7
001,
200
14,4
001,
400
13,8
001,
500
19,0
0011
,200
21,0
0012
,600
24,2
0013
,800
0
5,000
10,000
15,000
20,000
25,000
30,000
40,000
06050403020100999897969594939291908988 07
26,7
0014
,900
08
28,0
0015
,600
35,000
45,000
0928
,200
13,2
0031
,700
1114
,300
50,000
33,0
0020
,000
10 12p
32,5
0019
,500
55,000
32,0
0019
,000
13p
MSEKIndustrial consultancies Building/Construction oriented consultancies and architects
21,5
0021
,000
9,50
0
21,8
0010
,500
23,1
0011
,600
8,50
0
23,0
0012
,400
22,1
0012
,100
22,0
006,
300
21,6
005,
400
21,5
004,
500
21,2
003,
300
20,3
002,
500
23,0
002,
000
25,2
001,
800
28,2
001,
800
27,5
002,
400
26,0
002,
600
22,7
0013
,500
23,1
0014
,600
20,1
00
20,4
00
20,5
00
21,7
00
21,5
50
21,3
00
8,30
0
9,25
0
10,0
00 10,6
00
11,1
00
21,5
00
21,8
00
25,1
0016
,500
23,4
00
0
5,000
10,000
15,000
20,000
25,000
30,000
35,000
40,000
06050403020100999897969594939291908988 07
12,6
0024
,000
26,1
0016
,700
12,7
00
27,4
0017
,500
08
45,000
09
10,7
00
10,9
00
11,7
00
14,7
0012
,500
28,0
00
26,1
00
50,000
30,2
00
11
24,5
00
14,5
0012
,800
24,9
0013
,200
24,5
0027
,500
18,5
0016
,000
10 12p
24,8
0028
,000
18,3
0015
,500
24,7
0027
,800
18,1
0015
,400
13p
Number
Industrial consultanciesBuilding/ Construction oriented consultancies and architects
Marking the average number of employees in Sweden
9Sector Review • The Swedish Federation of Consulting Engineers and Architects • December 2012
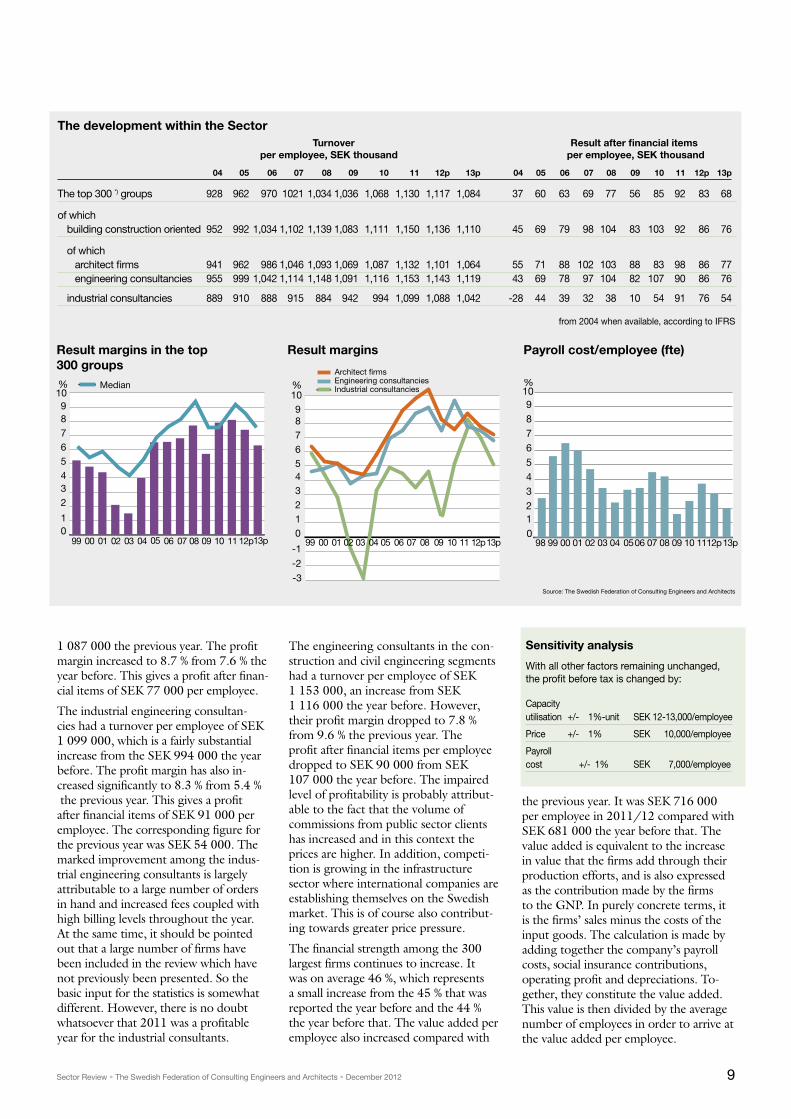
The development within the Sector
from 2004 when available, according to iFRS
result marginsresult margins in the top 300 groups
Payroll cost/employee (fte)
Turnover result after financial items per employee, Sek thousand per employee, Sek thousand
04 05 06 07 08 09 10 11 12p 13p 04 05 06 07 08 09 10 11 12p 13p
The top 300 *) groups 928 962 970 1021 1,034 1,036 1,068 1,130 1,117 1,084 37 60 63 69 77 56 85 92 83 68
of which building construction oriented 952 992 1,034 1,102 1,139 1,083 1,111 1,150 1,136 1,110 45 69 79 98 104 83 103 92 86 76
of which architect firms 941 962 986 1,046 1,093 1,069 1,087 1,132 1,101 1,064 55 71 88 102 103 88 83 98 86 77 engineering consultancies 955 999 1,042 1,114 1,148 1,091 1,116 1,153 1,143 1,119 43 69 78 97 104 82 107 90 86 76
industrial consultancies 889 910 888 915 884 942 994 1,099 1,088 1,042 -28 44 39 32 38 10 54 91 76 54
1 087 000 the previous year. The profit margin increased to 8.7 % from 7.6 % the year before. This gives a profit after finan-cial items of SEK 77 000 per employee.
The industrial engineering consultan-cies had a turnover per employee of SEK 1 099 000, which is a fairly substantial increase from the SEK 994 000 the year before. The profit margin has also in-creased significantly to 8.3 % from 5.4 % the previous year. This gives a profit after financial items of SEK 91 000 per employee. The corresponding figure for the previous year was SEK 54 000. The marked improvement among the indus-trial engineering consultants is largely attributable to a large number of orders in hand and increased fees coupled with high billing levels throughout the year. At the same time, it should be pointed out that a large number of firms have been included in the review which have not previously been presented. So the basic input for the statistics is somewhat different. However, there is no doubt whatsoever that 2011 was a profitable year for the industrial consultants.
The engineering consultants in the con-struction and civil engineering segments had a turnover per employee of SEK 1 153 000, an increase from SEK 1 116 000 the year before. However, their profit margin dropped to 7.8 % from 9.6 % the previous year. The profit after financial items per employee dropped to SEK 90 000 from SEK 107 000 the year before. The impaired level of profitability is probably attribut-able to the fact that the volume of commissions from public sector clients has increased and in this context the prices are higher. In addition, competi-tion is growing in the infrastructure sector where international companies are establishing themselves on the Swedish market. This is of course also contribut-ing towards greater price pressure.
The financial strength among the 300 largest firms continues to increase. It was on average 46 %, which represents a small increase from the 45 % that was reported the year before and the 44 % the year before that. The value added per employee also increased compared with
01
23456789
10% Median
05040302010099 06 07 08 09 10 11 12p13p0123456789
10%
-2
-1
-3
05040302010099 06 07
08 09 10 11 12p13p
Architect �rmsEngineering consultanciesIndustrial consultancies
0123456789
10
13p12p1110090807060504030201009998
%
the previous year. It was SEK 716 000 per employee in 2011/12 compared with SEK 681 000 the year before that. The value added is equivalent to the increase in value that the firms add through their production efforts, and is also expressed as the contribution made by the firms to the GNP. In purely concrete terms, it is the firms’ sales minus the costs of the input goods. The calculation is made by adding together the company’s payroll costs, social insurance contributions, operating profit and depreciations. To-gether, they constitute the value added. This value is then divided by the average number of employees in order to arrive at the value added per employee.
Sensitivity analysis
with all other factors remaining unchanged, the profit before tax is changed by:
Capacity utilisation +/- 1%-unit SEK 12-13,000/employee
Price +/- 1% SEK 10,000/employee
Payroll cost +/- 1% SEK 7,000/employee
Source: The Swedish Federation of Consulting Engineers and Architects

10 Sector Review • The Swedish Federation of Consulting Engineers and Architects • December 2012
The expectations regarding how manpower will develop show net figures between the proportion of firms which believe their working force will increase minus those who believe it will decrease over the coming six-month period.
manpower development
The billing level among the listed firms in 2011 was 74.4 %. During the period January to September 2012, the level was 75.4 %. It was even higher during the first six months of the year but declined dur-ing the summer.
investments within the sectorBuilding investments increased by almost 10 % in 2011, to just under SEK 300 billion in fixed prices. It was above all the investments in housing that increased, but at the same time the investments in premises and industrial buildings also rose. The housing investments corre-sponded to SEK 130.2 billion, of which SEK 64.2 billion was for new builds. The investments in premises increased to a total of SEK 97 billion, of which some SEK 5.8 billion was for industrial build-ings. On the other hand, investments in the infrastructure and facilities declined by approximately 1 % to about SEK 72 billion.
However, these figures are expected to increase again by almost 7 % as early as 2012. At the same time, the investments in housing will decline by some 9 % in 2012, in order later to increase somewhat in 2013. Investments in infrastructure and facilities, as well as investments in premises, will offset the downturn in the housing sector and keep the sector employed throughout the whole of 2012. The incentive packages in the infra-structure area are keeping the volume of commissions up, and many projects that do not start in 2011 will be initiated in 2012, which means that most of the impact generated by the incentive pack-ages will not be noticed until this year. A number of major infrastructure projects will come to an end in 2012 and 2013, and it could be several years before any really large projects are started up, since they first of all have to be planned and designed. This creates a certain amount of uncertainty concerning how large the investments will in fact be during 2013 and 2014.
The investments made by industry in machinery and equipment increased by 7 % in 2011 to SEK 45 billion and are expected to continue to increase in 2012. It is difficult to know how things will turn out in 2013, but development will in all probability be weaker once industry again puts a restraint on investments at the same time as the volume of export orders is low.
Price level trendsThe weak development of the build-ing sector during 2012 has increased the price pressure on the market. Even
though there are segments that continue to thrive, such as infrastructure and power and energy installations, the level of competition in the area is at the same time increasing. The price levels have therefore not been positively influenced to any great extent. In general, the price pressure is highest in connection with public procurement. Lowest price is more frequently chosen as the evaluation crite-rion rather than quality or life-cycle costs. During 2013, the price pressure is likely to increase once the downswing in the building economy begins to make itself really felt, there is a temporary decline in infrastructure investments and private investments in facilities decrease.
The volume of orders in hand among industrial engineering consultants has been very healthy during 2012 and the sub-sector has been able to raise its prices somewhat since there continues to be a shortage of engineering competence within the field of product and produc-tion development. The prices are again likely to be depressed in 2013, when the order situation among industrial engineering consultants is expected to become worse as a consequence of the decrease in demand on the part of the export industry. On-going investments in product development, however, are a precondition for the survival of the in-dustrial consultancies. Consequently, the investments will never cease entirely and a reasonable level of demand for engineer-ing competence will remain, which will probably contribute towards maintaining the price level.
Age and gender structureThe STD member firms have some 33 000 employees, which corresponds to 72 % of the entire sector. According to the Confederation of Swedish Enterprise salary statistics, 28.3 % of all employees in STD member firms are women, and the trend is increasing. The year before, the proportion was 27.8 % and the year be-fore that 27.6 %. The percentage of wom-en with leading positions is approximately 26 % and the proportion of women on boards of directors is about 19 %. On the other hand, the proportion of female managing directors is considerably lower. Among the 300 largest firms, 9.1 % of all managing directors are women.
The average age of STD-företagen em-ployees is 41.4. This is somewhat lower than in the last survey when the average age was 44. The measuring methods dif-fer, however. In the past, use was made of
annual billing ratio
66
68
70
72
74
76
78
80
98 00 02 04 06 08 10 12
-40
-20
0
20
40
60
80
100
T208
T308
T109
T209
T309
T110
T210
T207
T307
T108
T310
T111
T211
T311
T112
T212
T312
Architect �rms Engineering consultancies Industrial consultancies
Source: The Swedish Federation of Consulting Engineers and Architects

11Sector Review • The Swedish Federation of Consulting Engineers and Architects • December 2012
The Group’s opinion about the development of the price situation
The price trend graphs show net figures for the proportion of firms that have raised their prices minus those that have lowered their prices over the past six-month period.
Backlog of orders – index compared with orderforecast in six month´s time
Architects and Consulting Engineers weighted togeth industrial Consultants
age ranges whereas now the ages used are exact. This means that the figures are not fully comparable. The conclusion that can be reached, however, is that the women in the member firms are somewhat younger than the men. The average age of the women employed in STD member firms is 39.9, while it is 42.1 in the case of men.
Anticipated development – 2012 onwardsThe year began well with a high level of employment and a healthy order situa-tion. The engineering consultants contin-ued to ride on the wave of infrastructure investments and the industrial consult-ants were fully employed with industry’s investments in machinery, equipment and product development. Profitability during the first six months of the year was therefore on a par with the levels in 2011. However, during and after the summer the trend swung downwards. A slowdown in the construction sector and a downturn in the demand for exports led to a weakening in the trend for engineer-ing consultants, architects and industrial consultants during the second half of 2012. All segments are sending the same signals for a worsening of their order situ-ation over the coming period.
The profitability for architects, engineer-ing consultants and industrial consultants has been good over the past two years. As a result of the healthy demand, and despite the current shortage of engineers, the consulting firms have increased their
productivity and supply volumes to their clients. A weakening trend in incoming orders, lower billing levels and depressed prices could, however, lead to a lower lev-el of profitability during the coming year. Investments in Swedish infrastructure are experiencing a temporary downturn due to the slow initiation of planned projects. But for the engineering consultants, there will continue to be a large number of projects to design as part of the coming investments, not least in the transport sector. Competition in the infrastructure sector will increase in the coming period as a growing number of large multina-tional engineering consultancies turn their attention to Sweden and Norway.
In October, Almega’s Economic Report – which gauges the overall development of the service sector – reported the likeli-hood of a generally weaker economy in Sweden during 2013. The forecast for the growth in GNP for 2012 has been raised after the first six months of the year were stronger than expected. The GNP is ex-pected to increase by 0.8 % during 2012 and by 1.2 % in 2013. During 2014, the growth level is expected to be approxi-mately 2 %, provided that the recovery in some of Sweden’s export markets begins in 2013. These assumptions are based on continued incentive measures from the central banks and on the fact that the rescue actions continue in Greece and the
-100
-80
-60
-40
-20
020
40
60
80
100
T1-301
T1-300
T1-302
T1-303
T1-304
T1-305
T1-306
T1-307
T1-308
T1-309
T1-310
T1-311
T1-312
Industrial Consultants Architects and Consulting Engineers %
-40
-20
0
20
40
60
80
100
70
80
90
100
110
120
130
140
T1-301
T1-300
T1-302
T1-303
T1-304
T1-305
T1-306
T1-307
T1-308
T1-309
T1-310
T1-311
T1-312
70
80
90
100
110
120
130
140Order forecast (left) Backlog of orders-index (right)
-40
-20
0
20
40
60
80
100
70
80
90
100
110
120
130
140
T1-301
T1-300
T1-302
T1-303
T1-304
T1-305
T1-306
T1-307
T1-308
T1-309
T1-310
T1-311
T1-312
70
80
90
100
110
120
130
140Order forecast (left) Backlog of orders-index (right)
Source: The Swedish Federation of Consulting Engineers and Architects
Source: The Swedish Federation of Consulting Engineers and Architects
The order backlog index is based on questionnaire surveys among STD member firms, and is calculated by weighing between the orders in hand per employee and the order level in 2, 3, 6 and 12 months’ time. The
confidence curve represents net figures for the proportion of firms that anticipate an improved order situation minus those that expect a worse order situation in 6 months’ time.

12 Sector Review • The Swedish Federation of Consulting Engineers and Architects • December 2012
equity ratio, %The top 30 Swedish groups
Source: The Swedish Federation of Consulting Engineers and Architects
result after fin. Turnover per employee, kSek items/employee, kSek
05 06 07 08 09 10 11 05 06 07 08 09 10 11
The top 30 groups 956 949 1,009 1,016 1,030 1,057 1,101 61 54 58 69 50 84 87
of which
building/ construction oriented 1,010 998 1,106 1,101 1,087 1,105 1,110 81 75 87 101 81 104 84
industrial 902 905 908 912 950 984 1,088 41 34 28 34 7 53 91
other European countries that are bur-dened by debt, which are assumed to lead to stabilization and a gradual recovery. The export industry is also influenced by a strong krona, even though the histori-cal correlation between the exchange rate for the krona and the demand for exports no longer has the same importance. This is because the import of services and components has increased in the manu-facturing of Swedish industry produc-tion. What is lost in lower selling prices as a consequence of a strong krona can be partially compensated for by lower production costs when the input goods become less expensive.
The service sector, which has been the driving force in the Swedish economy during recent years, has undergone a decline in growth rate since the begin-ning of 2011. The productivity trend in the service sector is slowing down as a result of weak investments for several years, not least within the field of research and development. One restraining factor for productivity development is the lack of available competence in a number of knowledge-intensive sectors.
The recruitment demand in the vari-ous sub-sectors will, however, decrease during the coming years. The percentage of firms stating that they need to recruit nearly always reaches high levels when the supply of available competence is lower than the demand. In the normal situa-tion, all firms basically report that they need to recruit. Now, however, a larger proportion indicate that they have a lower recruitment demand. This is a clear sign of growing uncertainty on the market.
Architectural firmsTowards the end of 2012, the order status among architectural firms has become
worse. It is in particular the employ-ment level in the longer term that has been affected. In general, architectural firms have negative expectations regard-ing developments in the order situation during 2013. In the construction sector, a slowing down is anticipated during 2013 and this, of course, has an impact on architectural firms. Projects in con-nection with housing and other types of building represented 69 % of the turnover among architectural firms in 2011. The two sub-sectors are extremely important for the architects. Architectural firms believe that the order situation for other buildings/premises will become worse in the coming period, at the same time as they believe the situation will improve for housing-related projects. Investments in premises have increased during 2011 and the beginning of 2012. This development is now expected to slacken off.
Investments in premises and facilities have helped to balance the significant down-swing that has taken place in the housing sector. Housing construction began to decline as early as 2011, and has contin-ued to drop throughout 2012. The num-ber of flats on which work had started in 2010 was 26 700 and during 2011 the figure decreased to 25 500. During 2012, work is only expected to start on some 21 500 flats. There may even turn out to be fewer in the end. Preliminary statistics show that only 9 350 flats were started in the first six months of 2012. The invest-ments in housing construction are being held back by spiralling construction costs at the same time as the mortgage ceiling is inhibiting the capacity to pay. At the same time, the negative attitude being shown by households to future economic development is reducing the willingness to pay. Now, however, housing invest-
ments are expected to recover somewhat in 2013. The demand for new housing units continues to be very high in the major city areas.
Engineering consultantsThe engineering consultants have once again been fully employed during 2012, primarily as a result of investments in the infrastructure and facilities, and projects for other types of premises. The three sub-sectors represented approximately 70 % of the engineering consultants’ turnover during 2011. Towards the end of 2012, there are reports, however, of a slackening of incoming orders and sub-dued expectations for 2013. The invest-ments in premises have developed well during 2012, with a 19 % increase during the first six months. Both private and public investments have increased. How-ever, development is expected to slacken off during 2013. It is above all the private investments that are expected to flatten off, since a number of major projects will be completed and other planned projects are being postponed. Those sub-sectors that have made good progress are trade, industrial premises, the experience industry and hotel projects. Public sector investments in premises are expected to be high during 2012 and continue to increase in 2013, not least within medical care and nursing.
There is expected to be a temporary downturn in infrastructure investments over the next two years when on-going projects are completed and new projects are to be designed. The government, in its latest infrastructure bill, has proposed investments of over SEK 500 billion for the period 2014-2025 in order to improve Sweden’s transport system. So, even though it may take a few years
0
10
20
30
40
501-30 31-200 201-300
0504030201
%
06 07 08 09 10 11
Company Size
Source: The Swedish Federation of Consulting Engineers and Architects

13Sector Review • The Swedish Federation of Consulting Engineers and Architects • December 2012
added value for the 300 largest groups
it is interesting to make a comparison with other knowledge sectors with highly qualified staff. The following comparative figures from 30-50 largest companies in several sectors are taken mainly from the magazines Affärsvärlden.
Turnover/employee
Source: The Swedish Federation of Consulting Engineers and Architects
before new infrastructure projects are started, there is nevertheless a large market both now and in the future in the infrastructure area.
Sweden has been a fairly protected mar-ket, with relatively few foreign players. During recent years, some of the large Danish groups have strengthened their positions in Sweden. Now, considerable interest is being shown on the part of non-Nordic companies. Competition on the Swedish engineering consultancy market will increase since even more in-ternational organisations are expected to establish operations in both Sweden and Norway. Competition will be particularly keen in the infrastructure and facility markets. Both Sweden and Norway have major infrastructure investments under way and are experienced as being stable countries with secure economies. In addition, the profitability for engineer-ing consultants in both countries is good when viewed in an international perspec-tive. The increase in competition will probably lower the level of profitability somewhat, but they are still attractive markets for many international groups. Even if new investments are perhaps not made in 2013, it will still be possible to start work on a certain amount of design activity, which will fall to the engineering consultancies.
Investments in facilities have also contin-ued to increase during 2012. The num-ber of private investments has increased for energy and power utilities, the trans-port area and in the post and telecom sector. Growth, however, is expected to
start flattening off during the second half of 2012 and on into 2013. In the public sector, investments have continued to increase in the transport sector whereas they have declined somewhat for power and energy utilities. The public sector in-vestments will also flatten out at the end of 2012 and decrease still more in 2013.
industrial consultantsThe industrial consultancies experienced continued sound development during the first half of 2012. During the autumn, however, the development changed and the volume of incoming orders decreased. The industrial consultancies enjoyed a healthy employment level long into 2012 despite the fact that the export industry has declined. The investments made by industry in machinery, equipment and product development have helped to keep the industrial consultancies in employment. The uncertainty in the export industry has contributed towards the postponement of investments, which reduces the demand among industrial consultants. This trend will probably not change until the export industry has been able to conduct its rationalisation meas-ures or there is once again an increase in the demand for export orders. The profit-ability, which has been good in 2011 and throughout the greater part of 2012, will probably decline during 2013.
Structural dealsThere have been a number of structural transactions during the course of the year, in particular among the larger groups – which have grown even larger. The sector is becoming increasingly consolidated
and the group of medium-sized firms is shrinking as the larger groups acquire many of the players. One clear trend is that the Swedish corporate groups are establishing their operations to an increasing extent abroad – primarily in the Nordic countries but also in the Baltic region, Germany, Great Britain and other countries. Another trend is that a grow-ing number of international organisations have established themselves in Sweden through either acquisitions or corporate establishment. Over the next few years we are likely to encounter a considerable number of major transactions in which large international groups buy up Swed-ish companies. An account is given below of some of the deals that have taken place during the course of the year among the Swedish groups. More about the busi-ness transactions that have taken place between the international groups can be found in the international section.
New faces in Sweco’s managementMats Wäppling is leaving Sweco at his own initiative and is succeeded as Manag-ing Director and CEO by Tomas Carls-son on 1 December, who comes from NCC Construction Sweden. In addition, Sweco has a new Managing Director for operations within Sweden, namely Åsa Bergman, who was previously responsible for Sweco’s project management activi-ties and succeeded Eva Nygren, who has moved to Rejlers.
Sweco expands in FinlandJanuary saw the acquisition of the FMC Group in Finland. The group, with 1 100 employees and EUR 80 million
400
450
500
550
600
650
700
750
1110090807060504030201
kSEK/employee
(in Sek thousand) 2011 2010 2009 2008 2007 2006 2005 2004 2003 2002
Management consultants 1,906 1,880 1,890 2,015 2,075 1,800 1,820 1,720 1,630 1,600
iT consultants (adm.) 1,545 1,480 1,290 1,270 1,440 1,135 1,170 1,140 1,000 1,130
Lawyers’ offices 1,840 1,770 1,690 1,730 1,750 1,655 1,595 1,485 1,485 1,480
Market surveyors 1,465 1,445 1,295 1,355 1,280 1,085 1,070 985 895 900
Public relations and communication 1,295 1,235 1,260 1,320 1,285 1,265 1,170 1,120 1,020 1,020
Auditors *) 1,320 1,280 1,275 1,230 1,250 1,250 1,135 1,050 970 880
and as per our table on page 12
industrial engineering consultants 1,088 980 941 912 908 905 902 893 866 823
Architects/building engineering consultants 1,110 1,040 1,084 1,101 1,106 998 1,010 939 850 897
Source: The Swedish Federation of Consulting Engineers and Architects

14 Sector Review • The Swedish Federation of Consulting Engineers and Architects • December 2012
The top 30 Swedish groups result margins in the top 30 groups
Group no. 31-50 Group no. 51-100
Group no. 101-150 Group no. 151-200 Group no. 201-300
Source: The Swedish Federation of Consulting Engineers and Architects
600
700
500
400
300
200
100
86 88 90 94 96 98
60
70
50
40
30
20
10
800 80
00
900 90
0292 04
1,000 100
06 08 10
1,100 110
11
kSEK kSEK
Turnover/employee
Balance Sheet total/employee Result after �nancial items/employees
-1
0
1
2
3
4
5
6
7
8
9
10%
0604020098969492908886 08 10 12p13p
600
700
500
400
300
200
100
86 88 90 94 96 98
60
70
50
40
30
20
10
800 80
00
900 90
0292 04
1000 100
06 08 10
1100 110
11
kSEK kSEK
Turnover/employee
Balance Sheet total/employee Result after �nancial items/employees
600
700
500
400
300
200
100
86 88 90 94 96 98
60
70
50
40
30
20
10
800 80
00
900 90
0292 04
1,000 100
06 08 10
1,100 110
11
kSEK kSEK
Turnover/employee
Balance Sheet total/employee Result after �nancial items/employees
91 92 93 94 95 96 97 98 99 00 01 02 03 04
600
700
500
400
300
200
100
60
70
50
40
30
20
10
800 80
900 90
1,000 100
05 06 07
110
120
1,100
1,200
08 09 10 11
kSEK kSEK
Turnover/employee
Balance Sheet total/employee Result after �nancial items/employees
94 95 96 97 98 99 00 01 02 03 04
600
700
500
400
300
200
100
60
70
50
40
30
20
10
800 80
900 90
1,000 100
05 06 07
110
120
1,100
1,200
08 09 10 11
kSEK kSEK
Turnover/employee
Balance Sheet total/employeeResult after �nancial items/employees
600
700
500
400
300
200
100
86 87 88 89 90 91 93 94 95 96 97 98
60
70
50
40
30
20
10
Omsättning/anställd
Balansomslutning/anställd
800 80
Resultat e fin poster/anställd
99
Bokslutsår 00 01
900 90
02 92 03 04 05
1,000 100
Turnover/employee
Balance Sheet total/employeeResult after �nancial items/employees
110
120
1,100
1,200
00 01 02 03 04 05 06 07 08 09 10 11
kSEK kSEK

15Sector Review • The Swedish Federation of Consulting Engineers and Architects • December 2012
in turnover, was Finland’s second largest technical engineering consultancy group. The group is strong in structural design, installation and industrial engineering. The value of the acquisition amounts to EUR 65 million. As a result of the FMC acquisition, Sweco now has approxi-mately 1 600 employees in Finland at the same time as the Sweco Group has now passed the 7 000 mark in terms of the total number of employees. In April, the Finnish architectural firm Brunow & Maunula, with 18 employees, was also acquired.
In March, Sweco and ÅF signed a joint agreement with Skanska Healthcare AB for the design of Nya Karolinska Solna. The value of the agreement is in the region of SEK 580 million and is divided equally between the two companies in the consortium.
ÅF – Acquisition and expansionIn October, ÅF AB acquired Epsilon Holding AB in one of the largest business transactions on the Swedish engineer-ing consultancy market in recent years. Epsilon had a turnover in 2011 of almost SEK 1.8 billion and reported an operat-ing result of SEK 178 million. The ÅF Group has grown by just over 1 400 employees. Epsilon supplements ÅF’s competence in the industrial engineering area and will be integrated to 80 % into the Technology Division. The remain-ing 20 % will be incorporated in the Industry Division. Epsilon’s Managing Director, Mats Boström, will take over as head of the Technology Division and be a member of ÅF’s Group management. The purchase sum consists of an initial purchase price of approximately SEK 1 700 million comprising a cash pay-ment of SEK 850 million and 5 985 915 newly-issued B-shares in ÅF. There is also a supplementary purchase amount that is maximised to SEK 1 100 million.
ÅF has also acquired engineering consult-ants Bygganalys, with a turnover of approximately SEK 70 million and 52 employees. Bygganalys is primarily active in the Stockholm region within the areas of building economy, project manage-ment and construction management. October also saw the acquisition of the Malmö company Demikon AB with 16 employees and a turnover of SEK 25 million. Demikon augments ÅF’s capacity in the environmental survey area. In M ay, Piteå-based Kaarle Industrikonsult AB was acquired in order to meet the grow-ing demand for consulting services within pipe design and mechanics in Norrland.
In Norway, ÅF acquired the project man-agement firm of Advansia, which is fo-cused on infrastructure projects. Advansia has 120 employs and a turnover of some NOK 285 million. The purchase price was NOK 300 million in combination with a variable sum based on the financial result over the period 2013-2015.
During the course of the year, ÅF has in addition opened new offices in Ostham-mar and Pajala.
ÅF is also adjusting its corporate struc-ture. The International North and International South divisions are being integrated and will together form the new International Division. International North included ÅF in Finland, Russia, the Czech Republic, Lithuania and Esto-nia, with a total of 750 employees. In-corporated into International South were Switzerland and Spain with subsidiaries in India, Thailand, Turkey, Vietnam, Nige-ria, Italy, Brazil and Great Britain with a total of 350 employees. ÅF now consists of the four divisions Industry, Infrastruc-ture, International and Technology.
ÅF has entered into an agreement for design, 3D-modelling and technical support for the construction of a nuclear power plant in Brazil. The project will be conducted by ÅF Finland. The agree-ment with Electrobrás is worth SEK 600 million. ÅF has also been awarded a framework agreement in cooperation with Combitech and Sjöland&Thyselius with Försvarets Materielverk (the Swedish Defence Materiel Administration), which is worth SEK 700 million, for the supply of consultancy services to Försvarsmak-tens Ledningssystem (Swedish Defence Command System).
wSP business developments WSP has merged with Canadian en-gineering consultants Genivar. More information on this can be found in the international section.
WSP has been commissioned to design the new bus terminal at Slussen that is to be built in Katarinaberget. The terminal is planned to be operational in 2018. WSP has been awarded another assignment on behalf of Spårväg City for the new light-rail system depot at AGA Station, Lidingö. The firm has also been com-missioned to draw up basic input for coordinated contingency planning for dam rupturing and high flows in the riv-ers Ångermanälven and Umeälven. The study includes over 70 dams and calcula-tions are made with various combinations of flows and dam failure. The client is
Vattenregleringsföretagen, with support from Svenska Kraftnät.
Semcon continues to expand in GermanyIn October, Semcon announced its acquisition of the German firm Comet, which is active in the product informa-tion area. Comet had a turnover of 2.4 million Euro in 2011 and 40 employees. The acquisition complements Semcon’s operations on the German market, which currently employ 1 000 personnel. Dur-ing the course of the year, Semcon has also expanded its activities in Trollhättan through the employment of 25 engineers who previously worked for Saab Auto-mobile Powertrain AB. During the year, Kjell Nilsson has also been succeeded by Markus Granlund as the Group’s CEO. Kjell Nilsson is now Chairmen of the Board.
Semcon has signed an order with a German motor vehicle manufacturer comprising the development of a new car model, a commission worth a total of EUR 15 million.
Ramböll has entered into a framework agreement with Boliden Mineral for services within Ramböll’s entire range of engineering services from environment to planning and design. Ramböll has signed a further framework agreement within the mining industry; the standard agreement with LKAB has been extended and now covers services such as planning, design, project management, engineering responsibility and specialist services within the fields of dam construction and steel design.
Ramböll Management Consulting AB has acquired SANN & Partners Management Consulting AB with the aim of creating a strong consultancy operation with advice to the public sector and companies in deregulated sectors.
Vectura to be privatised?The government declares in its budget proposal for 2013 that Parliament should authorise the government to sell the whole or parts of Vectura Consulting AB. A decision on this will be made in December. The outcome is not known at the time of writing.
Vectura has acquired Ledningskompaniet i Sverige AB, Falun, a company active in the fields of project management, construction management, quality and organisational development. Vectura has also opened a subsidiary in Norway with Tone Manum as Managing Director with
16 Sector Review • The Swedish Federation of Consulting Engineers and Architects • December 2012
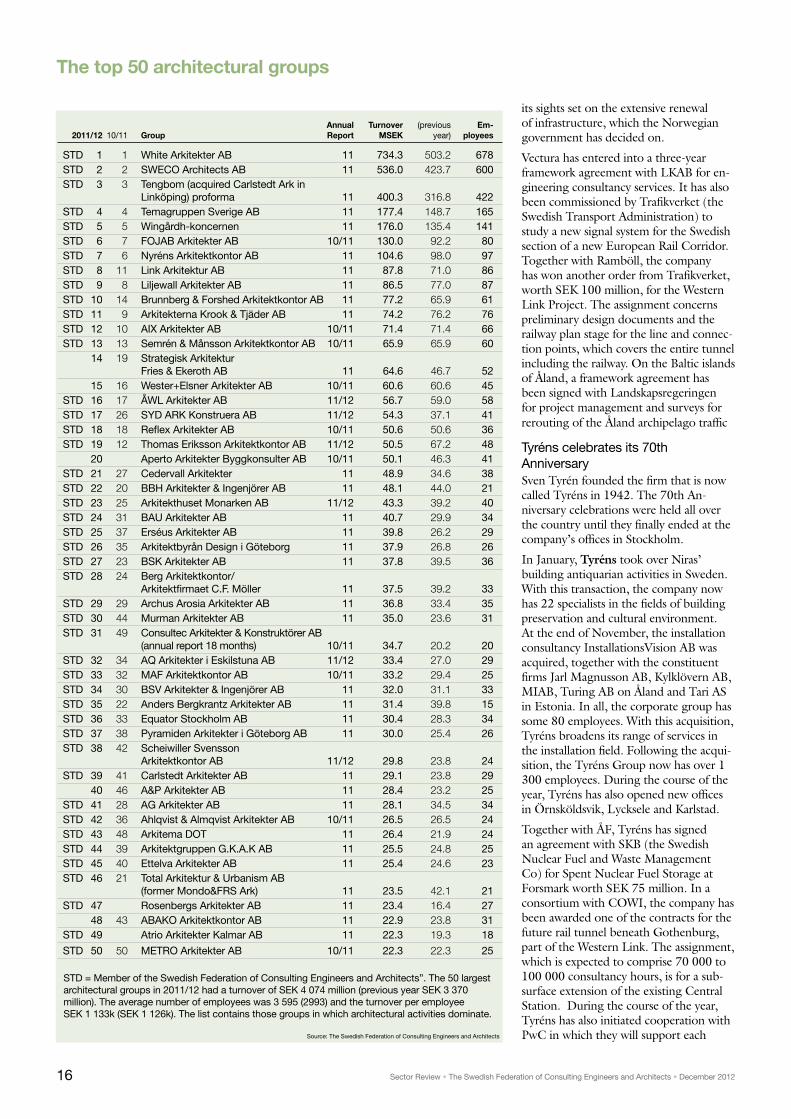
The top 50 architectural groups
annual Turnover (previous em- 2011/12 10/11 Group report mSek year) ployees
STD 1 1 white Arkitekter AB 11 734.3 503.2 678STD 2 2 SwECo Architects AB 11 536.0 423.7 600STD 3 3 Tengbom (acquired Carlstedt Ark in Linköping) proforma 11 400.3 316.8 422STD 4 4 Temagruppen Sverige AB 11 177.4 148.7 165STD 5 5 wingårdh-koncernen 11 176.0 135.4 141STD 6 7 FoJAB Arkitekter AB 10/11 130.0 92.2 80STD 7 6 Nyréns Arkitektkontor AB 11 104.6 98.0 97STD 8 11 Link Arkitektur AB 11 87.8 71.0 86STD 9 8 Liljewall Arkitekter AB 11 86.5 77.0 87STD 10 14 Brunnberg & Forshed Arkitektkontor AB 11 77.2 65.9 61STD 11 9 Arkitekterna Krook & Tjäder AB 11 74.2 76.2 76STD 12 10 AiX Arkitekter AB 10/11 71.4 71.4 66STD 13 13 Semrén & Månsson Arkitektkontor AB 10/11 65.9 65.9 60 14 19 Strategisk Arkitektur Fries & Ekeroth AB 11 64.6 46.7 52 15 16 wester+Elsner Arkitekter AB 10/11 60.6 60.6 45STD 16 17 ÅwL Arkitekter AB 11/12 56.7 59.0 58STD 17 26 SYD ARK Konstruera AB 11/12 54.3 37.1 41STD 18 18 Reflex Arkitekter AB 10/11 50.6 50.6 36STD 19 12 Thomas Eriksson Arkitektkontor AB 11/12 50.5 67.2 48 20 Aperto Arkitekter Byggkonsulter AB 10/11 50.1 46.3 41STD 21 27 Cedervall Arkitekter 11 48.9 34.6 38STD 22 20 BBH Arkitekter & ingenjörer AB 11 48.1 44.0 21STD 23 25 Arkitekthuset Monarken AB 11/12 43.3 39.2 40STD 24 31 BAU Arkitekter AB 11 40.7 29.9 34STD 25 37 Erséus Arkitekter AB 11 39.8 26.2 29STD 26 35 Arkitektbyrån Design i Göteborg 11 37.9 26.8 26STD 27 23 BSK Arkitekter AB 11 37.8 39.5 36STD 28 24 Berg Arkitektkontor/ Arkitektfirmaet C.F. Möller 11 37.5 39.2 33STD 29 29 Archus Arosia Arkitekter AB 11 36.8 33.4 35STD 30 44 Murman Arkitekter AB 11 35.0 23.6 31STD 31 49 Consultec Arkitekter & Konstruktörer AB (annual report 18 months) 10/11 34.7 20.2 20STD 32 34 AQ Arkitekter i Eskilstuna AB 11/12 33.4 27.0 29STD 33 32 MAF Arkitektkontor AB 10/11 33.2 29.4 25STD 34 30 BSV Arkitekter & ingenjörer AB 11 32.0 31.1 33STD 35 22 Anders Bergkrantz Arkitekter AB 11 31.4 39.8 15STD 36 33 Equator Stockholm AB 11 30.4 28.3 34STD 37 38 Pyramiden Arkitekter i Göteborg AB 11 30.0 25.4 26STD 38 42 Scheiwiller Svensson Arkitektkontor AB 11/12 29.8 23.8 24STD 39 41 Carlstedt Arkitekter AB 11 29.1 23.8 29 40 46 A&P Arkitekter AB 11 28.4 23.2 25STD 41 28 AG Arkitekter AB 11 28.1 34.5 34STD 42 36 Ahlqvist & Almqvist Arkitekter AB 10/11 26.5 26.5 24STD 43 48 Arkitema DoT 11 26.4 21.9 24STD 44 39 Arkitektgruppen G.K.A.K AB 11 25.5 24.8 25STD 45 40 Ettelva Arkitekter AB 11 25.4 24.6 23STD 46 21 Total Arkitektur & Urbanism AB (former Mondo&FRS Ark) 11 23.5 42.1 21STD 47 Rosenbergs Arkitekter AB 11 23.4 16.4 27 48 43 ABAKo Arkitektkontor AB 11 22.9 23.8 31STD 49 Atrio Arkitekter Kalmar AB 11 22.3 19.3 18
STD 50 50 METRo Arkitekter AB 10/11 22.3 22.3 25
STD = Member of the Swedish Federation of Consulting Engineers and Architects”. The 50 largest architectural groups in 2011/12 had a turnover of SEK 4 074 million (previous year SEK 3 370 million). The average number of employees was 3 595 (2993) and the turnover per employee SEK 1 133k (SEK 1 126k). The list contains those groups in which architectural activities dominate.
its sights set on the extensive renewal of infrastructure, which the Norwegian government has decided on.
Vectura has entered into a three-year framework agreement with LKAB for en-gineering consultancy services. It has also been commissioned by Trafikverket (the Swedish Transport Administration) to study a new signal system for the Swedish section of a new European Rail Corridor. Together with Ramböll, the company has won another order from Trafikverket, worth SEK 100 million, for the Western Link Project. The assignment concerns preliminary design documents and the railway plan stage for the line and connec-tion points, which covers the entire tunnel including the railway. On the Baltic islands of Åland, a framework agreement has been signed with Landskapsregeringen for project management and surveys for rerouting of the Åland archipelago traffic
Tyréns celebrates its 70th Anniversary Sven Tyrén founded the firm that is now called Tyréns in 1942. The 70th An-niversary celebrations were held all over the country until they finally ended at the company’s offices in Stockholm.
In January, Tyréns took over Niras’ building antiquarian activities in Sweden. With this transaction, the company now has 22 specialists in the fields of building preservation and cultural environment. At the end of November, the installation consultancy InstallationsVision AB was acquired, together with the constituent firms Jarl Magnusson AB, Kylklövern AB, MIAB, Turing AB on Åland and Tari AS in Estonia. In all, the corporate group has some 80 employees. With this acquisition, Tyréns broadens its range of services in the installation field. Following the acqui-sition, the Tyréns Group now has over 1 300 employees. During the course of the year, Tyréns has also opened new offices in Örnsköldsvik, Lycksele and Karlstad.
Together with ÅF, Tyréns has signed an agreement with SKB (the Swedish Nuclear Fuel and Waste Management Co) for Spent Nuclear Fuel Storage at Forsmark worth SEK 75 million. In a consortium with COWI, the company has been awarded one of the contracts for the future rail tunnel beneath Gothenburg, part of the Western Link. The assignment, which is expected to comprise 70 000 to 100 000 consultancy hours, is for a sub-surface extension of the existing Central Station. During the course of the year, Tyréns has also initiated cooperation with PwC in which they will support each Source: The Swedish Federation of Consulting Engineers and Architects

17Sector Review • The Swedish Federation of Consulting Engineers and Architects • December 2012
annual Turnover (previous em- 2011/12 10/11 Group report mSek year) ployees
STD 1 1 ÅF (divisions energy, engineering, technology and Epsilon) proforma 11 5,498.0 3,215.1 4,440STD 2 2 Semcon AB 11 2,451.9 2,090.9 2,727 3 HiQ international AB 11 1,239.5 1,108.4 1,107 4 Combitech AB 11 992.6 900.9 853STD 5 5 Rejlerkoncernen AB 11 770.0 585.0 790 6 8 Xdin AB 11 653.4 466.0 741STD 7 7 SwECo industry 11 649.4 536.6 653STD 8 6 Etteplan Sverige (proforma) 11 472.2 276.2 486STD 9 10 wSP Systems 11 405.0 350.0 400STD 10 12 Knightec AB 11/12 308.1 223.9 298STD 11 11 Cowi AB 11 240.0 240.0 270STD 12 GVA Consultants AB 11 282.4 277.4 123STD 13 Ansaldo STS Sweden AB 11 268.2 172.8 40 14 14 Altran Technologies 11 254.8 184.3 208STD 15 13 Avalon innovation AB 11 237.9 189.0 207STD 16 15 i3tex AB 11 206.6 182.6 235STD 17 Sigma Kudos AB 11 200.4 223.0 240STD 18 16 Consat Engineering AB 11 190.3 156.9 175STD 19 18 PRC Group 11 165.4 134.5 137STD 20 17 Eurocon Consulting AB 11 163.7 132.6 151STD 21 26 Goodtech Solutions Karlstad 11 156.1 64.1 88 22 19 infotiv AB 11 131.1 111.8 154 23 24 FS Dynamics AB 11/12 116.2 79.8 115STD 24 20 Condesign AB 11 115.8 106.2 162STD 25 27 Benteler Engineering Services (former Fasitet PDE AB) 11 115.8 61.8 66STD 26 25 HRM Engineering AB 11/12 105.8 72.2 95STD 27 21 Rücker Nord AB 11 101.4 94.9 97STD 28 22 iKG - Group 11/12 98.1 89.4 129STD 29 Bassoe Technology AB 11 86.7 77.4 41STD 30 Core Link AB 11 83.7 75.9 46STD 31 23 Automations Partner AB 11 82.8 88.0 50STD 32 34 Engineeringpartner Automotive Nordic AB 11 80.6 42.0 102 33 QRTECH AB 11 77.9 59.1 60 34 Conmore ingenjörsbyrå AB 11 66.7 45.9 82STD 35 Devport AB 11 64.8 21.2 55 36 31 Veryday AB (fd Ergonomidesign) 10/11 64.7 53.0 53STD 37 29 Centaur Segula Tech AB 11 64.2 54.8 84STD 38 Vicura AB 11 61.5 52STD 39 Ansys Sweden 11 61.1 50.7 18STD 40 30 Cross Design i Göteborg AB 11 59.9 53.9 72STD 41 38 Tüv Nord Sweden AB 11 58.0 37.3 20STD 42 Elajo Engineering AB 11 55.0 50.1 57STD 43 33 Citec Engineering AB (fd KPA ) 11 54.1 46.5 58STD 44 28 Creator Teknisk Utveckling AB 11 52.0 59.6 54STD 45 Tricab 2.0 AB 10/11 46.1 23.1 40STD 46 32 AcobiaFlux AB 11 44.6 51.2 39 47 40 TKG Teknikkonsultgruppen AB 11 43.6 34.5 27STD 48 45 Järnvågen AB (Bergström, BEKAB. indautomat ...) Proforma 11/12 43.0 27.0 42STD 49 Nne Pharmaplan AB 11 40.8 62.4 28STD 50 47 Koteko AB 11 40.5 25.0 26
The top 50 groups within industrial engineering
STD = Member of the Swedish Federation of Consulting Engineers and Architects”. The 50 largest groups within industrial engineering 2011/12 had a turnover of SEK 17 842 million (previous year SEK 13 007 million). The average number of employees was 16 293 (13 079) and the turnover per employee SEK 1 095k (SEK 995k).
other with their cutting-edge competence. Tyréns may, for example, support PwC with specific skills in conjunction with its transaction involving advice focused on the built environment sector (both the municipal and private sectors).
In April, Xdin completed its acquisition of Enea Experts, with 221 employees, which strengthens its range of services within built-in systems, testing and quality assur-ance, and system development.
At Hifab, Jeanette Saveros has succeeded Jan Skoglund as Managing Director. Jan relinquished the post at his own request but will remain within the company as a senior project manager. Jeanette was previously a business area manager within the Group. In April, Hifab opened a new office in Eskilstuna and is now represented in16 places in Sweden, from Malmö in the south to Luleå in the north.
Peter Rejler voted European CEo of the yearPeter Rejler was voted “European CEO of the year” in the ACE’s (Association for Consultancy and Engineering) prestig-ious annual competition. The motivation was: “The prize is a recognition of the fantastic efforts made by Peter in manag-ing Rejlers, which was founded by his grandfather, through a period of sig-nificant growth from approximately 200 employees in 1999 to some 1 500 in the Nordic countries today. Leadership can be a difficult quality to define. This may be the case, but the impact of a visionary managing director is always clear. We are blessed with a large number of proficient leaders in our sector, and this distinction is well deserved,” said Dr Nelson Ogun-shakin OBE, Managing Director of ACE.
Other nominees were: Ernst Ebert, Ingenieure, Germany; Jonas Wiström, ÅF; Stephen Weber and Martin Steger, COPLAN, Germany and Harrie Noy, Arcadis, The Netherlands.
At Rejler’s AGM in May, Eva Nygren, formerly the Managing Director of Sweco Sweden, was appointed the new Manag-ing Director and CEO of Rejlers. Peter Rejler was nominated as the new execu-tive Chairman of the Board.
In June, Rejler acquired the Norwegian consultancy SEEN Nordic with 10 employees. SEEN conducts technical and economic energy analyses and audits. Earlier in the year, Rejler’s associated company Nettkonsult changed its name to Rejlers Consulting AS in order to clarify Rejler’s presence on the Norwegian market. Rejlers currently owns 49 % of Source: The Swedish Federation of Consulting Engineers and Architects
18 Sector Review • The Swedish Federation of Consulting Engineers and Architects • December 2012
the company. The remaining 51 % will be acquired during the first six months of 2014. In Finland, Rejlers has acquired Ramböll Finland’s consulting opera-tions within the fields of automation and electricity. The operations acquired had a turnover of EUR 5.5 million in 2011 and 70 employees. With this transaction, Rejlers now has some 430 employees in Finland.
inspecta signs an agreement with Tetra PakInspecta Sweden AB has signed an agree-ment with Tetra Pak for the packaging group’s worldwide operations. Together with other parts of the Group, they will conduct design review, manufacturing in-spection, installation inspection, monitor-ing and test pressurising, destructive and non-destructive testing, the qualification of welders and welding procedures, and training.
white opens offices in London and osloDuring recent years, White has won a number of major assignments in Great Britain and Norway and, as a result of growing international demand, is now opening offices in London and Oslo.
Messingenhuset, designed by White Arkitekter in Upplands Väsby, won the Stora Samhällsbyggarpriset 2012 (a prize that is awarded annually for major built environment projects). The prize is awarded to White together with the Municipality of Upplands Väsby, Hemsö and Peab. The building is a multifunc-tional meeting place in which two sixth form colleges are integrated with a music school, library, premises for sports activities, events and various cultural performances together with a café and a restaurant.
In January, Tengbom acquired Carlstedt Arkitekter in Linköping, with 12 employ-ees, thereby strengthening its operations in the region around Norrköping and Linköping. Tengbom has entered into a cooperation agreement with the Cambo-dian Room Design Studio. The company has 15 employees and is run by Swedish architects. Tengbom has an option to acquire The Room Design Studio, which is also the company’s intention, as a move in strengthening its presence in Asia.
New managing director at Faveo In April, Lise Langseth became the new Managing Director of Faveo Projektledn-ing, a subsidiary of Faveo Management
AS. Previously, Lise held a Managing Director ’s post at Svensk Betong.
Norconsult has taken over Rockstore Engineering’s operations in Gothenburg and is broadening its competence in the field of fuel and chemical depots.
Midroc Engineering has changed its name to Midroc Project Management AB and has gathered competence from what was formerly Midroc Engineering, Midroc Project Management and Midroc Project CM.
Avalon Innovation is expanding in Den-mark and broadening its scope of activi-ties to include the business area Product Development, with services in Innovation Management, Industrial Design, Me-chanical Engineering and Simulation. The company now has 12 employees working at three offices in Denmark. The goal is to increase the number of employees to 50 within a period of two years and shortly to introduce the business area Information Systems in Denmark.
Projektengagemang is gaining groundProjektgaranti has during the course of the year acquired a number of companies, including GeoSupport Skandinavien AB, GMKI Elkonsult, Vattenpartner AB, ISS Projektledning and Arkitektur, and has initiated cooperation with KNSS. With these new acquisitions, the Group will have 400 employees and aims to be one of the ten largest engineering consultancy groups in Sweden by 2016.
GeoSupport, with 20 employees in Ly-cksele, strengthens Projektengagemang’s service areas GIS and Geographical IT. With the acquisition of GMKI, the com-pany is augmenting its position ine lectri-cal services. The company consists of 20 employees and is based in Malmö, Örebro and Eskilstuna. Gmki Elkonsult AB sup-plies engineering services and solutions in the areas of lighting, inspection, fire alarms, lifts and transport, power supply, selective plans and safety facilities. Vatten-partner forms the new company Projek-tengagemang Vattenpartner AB and at the same time augments the Group’s presence in Southern Sweden. In conjunction with the acquisition of ISS Facility Services’ business unit Project Management and Architecture, an agreement has been entered into with ISS that aims to develop the company’s cooperation in the area of consultancy support in ISS management operations.
Projektengagemang and the KNSS Group are merging to create PE-KNSS Grup-
pen AB, which strengthens Projekten-gagemang’s competence within heating, ventilation and sanitation, electrical engineering and automation, design, fire surveys and project/construction man-agement. KNSS-Gruppen has 45 employ-ees with a 50/50 ownership structure.
Pöyry PLC has acquired parts of Vatten-fall Power Consultant AB within the fields of hydropower, wind power, electricity grids and combined power and heat. Altogether, the company has some 360 employees at 22 offices in Sweden, Nor-way and Great Britain who are affected. The transaction is a result of Vattenfall’s new strategic direction that entails a focus on the core business and the Swedish, German and Dutch markets. For Pöyry, it is an important step towards increasing business in the energy area in Sweden.
Combitech In January, Combitech acquired the consulting firm Sörman Information AB, which provides services in the field of ad-vanced technical information management. The purchase forms part of Combitech’s strategy for broadening the range of ser-vices offered and expanding on the Nordic market. As a further step in the strategy, July marked the acquisition of 70 % of the shares in the Norwegian firm Bayes Risk Management AS. Bayes provides services in the area of risk analysis for the oil and gas sector, as well as the finance market. The company, which is based in Stavanger, has some 30 employees.
In June, Combitech opened a develop-ment centre in Trollhättan which is to offer complete development projects within Nordic industry, primarily within the aircraft and vehicle sectors. The goal is for the centre to have 200 employees. Cooperation has been initiated with Lean-Nova Engineering with the aim of selling the centre’s services to customers in the vehicle sector.
Ergonomidesign becomes VerydayIndustrial engineering consultants Ergonomidesign is changing its name to Veryday. The change of name is a step in the company’s internationalisation and Ergonomidesign was experienced as being a difficult name to use internationally. The company has during recent years been awarded a large number of projects from clients in Asia and North America. Recently, a studio has been opened in New York and the new name makes it easier to communicate the range of ser-vices that Veryday offers.

19Sector Review • The Swedish Federation of Consulting Engineers and Architects • December 2012
The top 300 Swedish consulting engineering and architectural groups
STD 1 2 ÅF (acquired Kaarle industrikonsult, Epsilon & Bygganalys) proforma MD 11 6,979.8 5,596.0 5,868 598.11 749 5,037.3 Jonas wiström
STD 2 1 SwECo AB (acquired Finnish FMC Group, Feb-12) proforma MD 11 6,698.8 5,272.4 6,872 610.50 679 3,256.8
Tomas Carlsson (group CEo) Åsa Bergman (CEo Sweden))
STD 3 3 wSP Sverige AB MD 11 2,553.3 2,337.8 2,239 213.60 744 1,678.3 Rikard Appelgren
STD 4 4 Semcon AB i 11 2,451.9 2,090.9 2,727 100.40 617 1,152.3 Markus Granlund
STD 5 5 Rambøll AB MD 11 1,417.5 1,406.6 1,215 112.92 745 657.3 Bent Johannesson
STD 6 7 Vectura CE 11 1,249.0 1,156.0 1,111 48.00 713 677.0 Jan Colliander
7 HiQ international AB i 11 1,239.5 1,108.4 1,107 186.00 842 963.5 Lars Stugemo
STD 8 8 Tyréns AB acquired installations Vision) proforma CE,PM 11 1,176.5 1,001.6 1,080 61.25 712 611.3 Ulrika Francke
STD 9 10 Rejlerkoncernen AB E,i 11 1,139.7 898.9 1,222 97.57 654 643.5 Eva Nygren
10 Combitech AB i 11 992.6 900.9 853 91.06 709 398.1 Marie Bredberg
STD 11 11 Grontmij Sweden MD 11 832.0 770.0 713 52.00 766 376.0 Leif Bertilsson
STD 12 12 Cowi AB MD 11 808.5 726.4 763 40.80 673 417.9 Anders Rydberg
STD 13 14 white Arkitekter AB A,PM, Env 11 734.3 503.2 678 38.60 761 322.0 Monica von Schmalensee
STD 14 13 inspecta Sweden AB CT 11 703.2 606.1 590 87.67 785 404.9 Nils olof Hagberg
15 15 Xdin AB i 11 653.4 466.0 741 96.20 683 294.0 Fredrik Nyberg
STD 16 55 Midroc Project Management AB (former Midroc Engineering AB) CE,i 11 526.1 128.5 135 2.40 976 162.8 Stefan Kronman
STD 17 22 Etteplan Sweden (proforma) i 11 472.2 276.2 486 8.30 610 128.6 Mikael Vatn
STD 18 17 Dekra Sweden CT 11 407.9 398.9 382 10.42 671 580.0 Jörgen Backersgård (industrial) & Frank Schubert (Automotive)
STD 19 18 Tengbom (aquired Carlstedt Ark i Linköping) proforma A,iA 11 400.3 316.8 422 24.56 528 152.3 Magnus Meyer
STD 20 16 Hifab Group AB PM, 11 387.7 423.6 334 19.30 615 161.8 Jeanette Saveros
STD 21 29 Projektengagemang AB (joint venture with KNSS and acquired GMKi) proforma MD 11 370.6 268.7 324 34.90 684 172.6 Per-Arne Gustavsson
22 9 Vattenfall Research&Development AB Enr,E, CE 11 363.4 947.9 272 -27.79 655 185.5 Martin Sjölund
STD 23 19 Structor – Group CE,PM, Env 11 338.7 305.3 256 48.31 975 151.6 Fladvad, Hulthén, Texte
STD 24 21 Bengt Dahlgren AB M,Enr, Env 11/12 321.7 278.9 311 27.60 731 127.2 Åke Rautio
STD 25 20 Pöyry Sweden AB MD,i 11 311.7 280.4 265 12.00 724 99.6 Håkan wessel
STD 26 26 Knightec AB i 11/12 308.1 223.9 298 26.72 655 102.3 Dimitris Gioulekas
STD 27 Force Technology Sweden CT 11 290.4 230.2 241 40.46 798 122.0 Hans ole olsen
STD 28 GVA Consultants AB i 11 282.4 277.4 123 37.90 1202 191.4 Mats Lindén
STD 29 23 Norconsult AB CE, Env, A 11 276.6 257.8 256 0.91 672 137.8 Ljot Strömseng
STD 30 Ansaldo STS Sweden AB i 11 268.2 172.8 40 45.56 1849 382.4 Gilles Pascault
31 33 Altran Technologies i 11 254.8 184.3 208 18.16 794 131.2 Hans Johansson
STD 32 30 Reinertsen Sverige AB MD 11 247.5 207.0 230 15.30 720 113.7 David Hellström
STD 33 24 Faveo Projektledning AB PM 11 246.5 256.2 142 6.70 914 74.6 Lise Langseth
STD 34 32 Avalon innovation AB i 11 237.9 189.0 207 2.00 631 158.9 Atle Andersen
STD 35 28 Atkins Sverige AB CE 11/12 237.8 215.3 154 11.30 721 76.3 Johannes Erlandsson
STD 36 25 VA-ingenjörerna AB Env 11 228.2 225.2 61 3.60 782 77.3 Anders Haarbo
STD 37 35 Bjerking AB CE,M,A 11 225.1 181.8 206 7.00 704 90.0 Anders wärefors
STD 38 36 ELU Konsult AB CE 11/12 207.0 172.4 134 24.41 953 77.2 Sten-Åke Torefeldt
STD 39 34 i3tex AB i 11 206.6 182.6 235 1.50 169 88.6 Ulf Aiff
STD 40 27 Sigma Kudos AB i 11 200.4 223.0 240 37.27 695 131.0 Carl Vikingsson
STD 41 38 Consat Engineering AB i 11 190.3 156.9 175 13.80 707 66.7 Jan Bertil Johansson
STD 42 39 Temagruppen A,PM 11 177.4 148.7 165 9.40 677 55.9 Håkan Persson
STD 43 42 wingårdh-group A 11 176.0 135.4 141 26.80 857 41.3 Gert wingårdh
2012 11 Group ceo/managing directorServ
ices
annu
al
rep
ort
Turn
over
m
Sek
(Pre
viou
s ye
ar)
ave
rage
nu
mbe
r of
em
ploy
ees
res
ult a
fter
fin
anci
al it
ems
mSe
k
add
ed
valu
e/em
pl.
kSek
Tota
l bal
ance
sh
eet
mSe
k
STD = Member of the Swedish Federation of Consulting Engineers and Architects. (*) = lack of conforming figure/proforma/assumed – = missing figure PM = Project Management, A = Architecture, CE = Civil/Structural Engineering, CT = Certification and testing, Env = Environment, Enr = Energy, E = Electrical, M = Mechanical/HEVAC, I = Industrial, MD = Multi Disciplinary

20 Sector Review • The Swedish Federation of Consulting Engineers and Architects • December 2012
STD 44 orbion Consulting AB E, Enr, Env 11 175.5 181 28.11 599 71.9 Mats Rönnlund
STD 45 45 PRC Group i 11 165.4 134.5 137 15.14 642 58.6 Peter Bräck
STD 46 43 Eurocon Consulting AB i 11 163.7 132.6 151 20.70 707 91.3 Peter Johansson
STD 47 37 Golder Associates AB CE, Env 11 158.7 165.4 120 3.20 687 74.2 Jan Hermansson
STD 48 74 Goodtech Solutions Karlstad i 11 156.1 64.1 88 2.50 633 56.0 Anders Larsson
49 40 EBAB i Stockholm AB PM 11 156.0 163.8 120 9.45 833 88.7 Kaarel Lehiste
STD 50 31 Niras AB PM 11 151.0 189.1 108 -1.76 1234 140.0 Jan Leife
51 41 Forsen Projekt AB PM 11 136.7 142.8 90 12.20 831 36.3 Jan Thelander
52 46 infotiv AB i 11 131.1 111.8 154 11.10 618 59.5 Alf Berntsson
STD 53 54 FoJAB Arkitekter AB A 10/11 130.0 92.2 80 31.80 1240 49.0 Daniel Nord
STD 54 53 Projektbyrån Stockholm AB PM 11/12 128.6 93.1 61 17.00 1171 42.2 Jonas Hellström
55 60 FS Dynamics AB i 11/12 116.2 79.8 115 11.00 714 42.7 Ulf Mårtensson
STD 56 47 Condesign AB i,E 11 115.8 106.2 162 -1.10 515 33.6 Fredrik Bromander
STD 57 78 Benteler Engineering Services (former Fasitet PDE AB) i 11 115.8 61.8 66 5.20 599 54.9 ingrid Bergqvist
STD 58 49 Nitro Consult AB CE 10/11 109.8 104.6 70 18.30 997 144.5 Donald Jonson
STD 59 58 iNCooRD AB M 11 108.6 87.9 70 17.20 972 35.2 olle Edberg
STD 60 66 HRM Engineering AB i 11/12 105.8 72.2 95 9.40 695 39.4 Mats Rogbrandt
STD 61 48 TM-Konsult AB CE, i 10/11 105.7 105.7 96 11.41 608 94.7 Kennet Holmbom
STD 62 50 Nyréns Arkitektkontor AB A 11 104.6 98.0 97 6.42 690 53.6 tf VD Bengt isling
STD 63 51 Rücker Nord AB i 11 101.4 94.9 97 15.15 732 47.2 wolfgang Rücker
STD 64 55 iKG – Group i 11/12 98.1 89.4 129 3.20 616 40.8 Mathias ohlson
STD 65 69 VBK Konsult CE 11/12 88.7 69.4 74 6.17 830 30.7 Ulf Kjellberg
66 56 FVB Sverige AB Enr 11 88.5 88.6 89 5.70 711 46.0 Leif Breitholtz
STD 67 61 HJR Projekt-el AB E 11 88.4 79.6 71 2.90 715 35.1 Lennart Harging
STD 68 68 Link Arkitektur AB A 11 87.8 71.0 86 5.40 709 35.0 Elisabeth Berglund
STD 69 Bassoe Technology AB i 11 86.7 77.4 41 8.68 1137 26.6 Lars Felix
STD 70 63 Liljewall Arkitekter AB A 11 86.5 77.0 87 6.60 664 30.0 Per-Henrik Johansson
STD 71 Core Link AB i 11 83.7 75.9 46 -2.42 528 103.6 Jörgen Jensen
STD 72 73 Kadesjös ingenjörsbyrå AB CE,M 11/12 83.4 65.7 54 10.09 876 40.9 Birgitta Lindblad
STD 73 57 Automations Partner AB i 11 82.8 88.0 50 3.60 632 22.0 Urban widén
STD 74 59 Geosigma AB CE,Env 11 81.6 83.0 70 6.10 747 30.1 Camilla Sjöstrand
STD 75 103 Engineeringpartner Automotive Nordic AB i 11 80.6 42.0 102 16.30 667 30.2 Fredrik Blomberg
76 QRTECH AB i 11 77.9 59.1 60 12.92 846 42.7 Bengt Norén (Lars-Åke Johansson)
STD 77 72 Brunnberg & Forshed Arkitektkontor AB A 11 77.2 65.9 61 8.80 849 30.0 Bengt Hellström
STD 78 64 Arkitekterna Krook & Tjäder AB A 11 74.2 76.2 76 6.36 644 31.3 Mats Bergstrand
STD 79 65 Riba koncernen AB M,Enr 10/11 73.1 72.8 54 0.30 564 24.9 Micael Andersson
STD 80 67 AiX Arkitekter AB A 10/11 71.4 71.4 66 11.93 760 25.7 Gunilla Persson
STD 81 84 integra Engineering AB PM,CE 11 70.7 55.0 76 8.00 692 29.4 Anders Skoglund
82 Conmore ingenjörsbyrå AB i 11 66.7 45.9 82 12.69 622 22.4 Joakim olsson
STD 83 88 Vega-Energi AB Enr, M, i 11 66.5 53.4 35 2.01 607 16.5 Max JanssonSTD 84 71 Semrén&Månsson Arkitektkontor AB A 10/11 65.9 65.9 60 0.16 601 39.2 Adelina Mehra
Magnus MånssonSTD 85 191 Devport AB i 11 64.8 21.2 55 3.30 698 26.5 Bertil Nordenberg
86 89 Veryday AB (former Ergonomidesign) i 10/11 64.7 53.0 53 6.50 779 45.2 Krister Torssell
87 95 Strategisk Arkitektur Fries & Ekeroth AB A 11 64.6 46.7 52 5.80 709 24.0 John Lydholm
STD 88 85 Centaur Segula Tech AB i 11 64.2 54.8 84 -0.50 520 27.4 Jean Pierre Bordon
STD 89 75 PQR Consult AB M,E 10/11 64.0 64.0 57 4.90 785 15.8 Karl-Fredrik Liljestrand
STD 90 Vicura AB i 11 61.5 52 2.38 656 41.0 Dennis Lundgren
91 86 Brandskyddslaget AB M 11 61.2 53.9 41 10.90 952 34.5 Martin olander
STD 92 Ansys Sweden i 11 61.1 50.7 18 13.87 1660 93.9 James Cashman
93 79 wester+Elsner Arkitekter AB A 10/11 60.6 60.6 45 10.31 857 20.7 Lars wester
94 93 AB Teknoplan E 11/12 60.3 50.4 37 9.50 926 19.4 Svante Lundqvist
STD 95 87 Cross Design i Göteborg AB i 11 59.9 53.9 72 4.10 487 24.7 Tommy Bergh
STD 96 123 Tüv Nord Sweden AB i 11 58.0 37.3 20 10.02 1362 22.2 Anders Egerbo
The top 300 Swedish consulting engineering and architectural groups
2012 11 Group ceo/managing directorServ
ices
annu
al
rep
ort
Turn
over
m
Sek
(Pre
viou
s ye
ar)
ave
rage
nu
mbe
r of
em
ploy
ees
res
ult a
fter
fin
anci
al it
ems
mSe
k
add
ed
valu
e/em
pl.
kSek
Tota
l bal
ance
sh
eet
mSe
k

21Sector Review • The Swedish Federation of Consulting Engineers and Architects • December 2012
STD 97 83 BERGAB Berggeologiska Undersökningar AB CE 11 57.9 57.4 35 4.10 895 26.7 Örjan wolff
STD 98 81 ÅwL Arkitekter AB A 11/12 56.7 59.0 58 5.31 683 25.3 Jacob Haas
STD 99 107 Projektgaranti AB PM 10/11 55.9 41.1 37 6.64 858 24.5 Helen olausson
STD 100 62 Bergsäker AB CE 11 55.7 77.9 39 3.65 622 19.5 Göran Karlsson
101 91 HoAB-gruppen AB PM 11 55.7 53.3 43 4.00 722 26.4 Per olsson, Th. Liljenberg, L.Turesson, R.Nordin
STD 102 168 Evomatic AB E 11/12 55.7 24.9 47 3.09 604 35.1 Jonas Persson
STD 103 Elajo Engineering AB i 11 55.0 50.1 57 11.16 883 19.4 Anders Lindh
STD 104 100 LEB Consult AB M 11/12 54.6 42.3 42 8.10 836 25.0 Lars Mohlin
STD 105 124 SYD ARK Konstruera AB A,CE 11/12 54.3 37.1 41 8.56 748 29.0 Ulf Larsson
STD 106 96 Citec Engineering AB (former KPA ) i 11 54.1 46.5 58 2.20 605 25.0 Michael Smirnoff
STD 107 99 Helenius ingenjörsbyrå AB M 11 53.8 43.7 35 9.70 889 24.9 Arne wallström
108 52 URS Nordic AB (Norden) Env 11 52.4 94.1 42 -4.50 416 32.0 Jesper Kildegaard
STD 109 80 Creator Teknisk Utveckling AB i 11 52.0 59.6 54 4.60 643 81.6 Allan Salåker
STD 110 92 Reflex Arkitekter AB A 10/11 50.6 50.6 36 8.86 880 26.9 Johan Linnros
STD 111 70 Thomas Eriksson Arkitektkontor AB A 11/12 50.5 67.2 48 0.57 546 17.3 Thomas Eriksson
STD 112 82 Envac AB Env 11 50.3 58.4 21 0.04 991 3.4 Crhister Öjdemark
113 Aperto Arkitekter Byggkonsulter AB A,CE 10/11 50.1 46.3 41 4.81 692 17.5 Per Gyllhammar
STD 114 127 Cedervall Arkitekter A 11 48.9 34.6 38 2.70 582 14.2 Björn Stillefors
STD 115 111 Centerlöf & Holmberg AB CE 11 48.5 45.2 49 9.90 717 36.8 Bengt Andersson
116 104 Brandkonsulten Kjell Fallqvist AB M 11 48.2 41.9 28 8.60 1261 19.8 Kjell Fallqvist
STD 117 97 BBH Arkitekter & ingenjörer AB A,CE 11 48.1 44.0 21 1.50 703 1.2 Rolf Nilsson
118 110 Konkret Rådgivande ingenjörer AB CE 11 47.9 40.2 35 7.90 871 18.3 olle Norrman
STD 119 94 TQi koncernen M 10/11 47.6 47.6 43 7.45 619 17.1 Kenneth Thunvall
STD 120 102 Mats Strömberg ingenjörsbyrå AB E 11 46.4 42.1 33 6.50 785 14.1 Mats Strömberg
STD 121 Tricab 2.0 AB i 10/11 46.1 23.1 40 1.77 538 16.0 Erik Fogelberg
STD 122 90 AcobiaFlux AB i 11 44.6 51.2 39 0.12 555 17.5 Mikael Nilsson
STD 123 229 ELE Engineering AB E 11/12 44.6 15.9 53 0.12 631 13.6 Henrik Eriksson
124 129 TKG Teknikkonsultgruppen AB i, E 11 43.6 34.5 27 7.10 957 16.7 Annika Nylund
STD 125 118 Arkitekthuset Monarken AB A 11/12 43.3 39.2 40 5.67 652 29.6 Per Sandkvist
STD 126 154 Järnvågen AB (Bergström, BEKAB, indautomat m fl) Proforma i 11/12 43.0 27.0 42 6.04 792 20.0 Tord Hägglund (chairman)
STD 127 121 Andersson & Hultmark AB M 11 42.3 38.0 46 6.50 729 20.5 Tobias Bodén
STD 128 106 Projektledarhuset i Stockholm AB PM 11/12 42.2 41.3 29 3.13 905 19.2 Örjan Kjellström
STD 129 Besiktningsföretaget Ansvars- besiktning AB CE 10/11 42.2 30.4 31 4.71 633 22.9 John widmark
STD 130 98 wikström VVS-Kontroll AB M 11/12 42.0 44.0 37 2.50 727 17.9 Annika Aarthun
STD 131 Nne Pharmaplan AB i 11 40.8 62.4 28 0.92 653 13.6 Morten Nielsen
STD 132 141 BAU Arkitekter AB A 11 40.7 29.9 34 6.00 747 19.6 Per-Eric Sundby
STD 133 167 Koteko AB i 11 40.5 25.0 26 2.40 785 12.1 Lars Nyström
STD 134 125 ingenjörsprojekt i Karlshamn i 11/12 40.1 36.2 35 8.93 775 13.4 Anders Johansson
STD 135 159 Erséus Arkitekter AB A 11 39.8 26.2 29 5.50 846 14.9 Peter Erséus
STD 136 115 Dacat AB i 11 39.6 39.5 48 0.70 544 11.1 Kenneth Magnusson
STD 137 108 Fagerström industrikonsult AB i 11/12 39.4 40.4 21 0.62 737 16.4 Per Fagerström
STD 138 Sundsvalls Mätcenter AB CE 11 39.4 32.9 30 7.91 892 28.7 Fredrik Landqvist
139 Triathlon AB i 10/11 39.1 25.4 24 2.58 822 22.3 Per-olof Sverlinger
STD 140 120 FLK Sverige AB M 11 38.8 38.0 51 2.00 552 23.4 Nils Zinn
141 116 Solvina AB i 10/11 38.5 39.5 38 6.80 771 21.0 Niclas Krantz
STD 142 122 VAP VA-Projekt AB Env 11/12 38.3 37.4 29 5.46 853 29.3 Mikael Melin
143 131 Camatec industriteknik AB i 11/12 38.3 34.2 43 4.00 582 13.6 Peter Mikael wigarthsson
STD 144 130 BK Beräkningskonsulter AB CE,i 11/12 38.0 34.4 31 4.02 811 20.1 Tomas Carlsäng
STD 145 156 Arkitektbyrån Design i Göteborg A 11 37.9 26.8 26 3.23 802 9.0 Jan Åkerblad
STD 146 114 BSK Arkitekter AB A 11 37.8 39.5 36 0.80 609 23.8 Ulf Mangefors
2012 11 Group ceo/managing directorServ
ices
annu
al
rep
ort
Turn
over
m
Sek
(Pre
viou
s ye
ar)
ave
rage
nu
mbe
r of
em
ploy
ees
res
ult a
fter
fin
anci
al it
ems
mSe
k
add
ed
valu
e/em
pl.
kSek
Tota
l bal
ance
sh
eet
mSe
k
STD = Member of the Swedish Federation of Consulting Engineers and Architects. (*) = lack of conforming figure/proforma/assumed – = missing figure PM = Project Management, A = Architecture, CE = Civil/Structural Engineering, CT = Certification and testing, Env = Environment, Enr = Energy, E = Electrical, M = Mechanical/HEVAC, I = Industrial, MD = Multi Disciplinary

22 Sector Review • The Swedish Federation of Consulting Engineers and Architects • December 2012
STD 147 148 inhouse Tech Gruppen PM,CE 11 37.8 28.2 23 6.60 998 19.0 Fredrik Thunström, Anders Sundberg, Marcus Dahlström
STD 148 150 installation & Kraftkonsulterna i Borås AB M, CE, Enr 11 37.6 27.9 31 3.70 836 15.5 Stefan Svan
STD 149 135 Alteco AB E 11 37.5 32.0 25 3.50 811 17.5 Andreas Lundström
STD 150 117 Berg Arkitektkontor/Arkitektfirmaet C.F. Möller A 11 37.5 39.2 33 1.49 565 16.3
Jan-Erik Mattsson/Lars Kirkegaard (CFM)
STD 151 Altair Engineering i 11 37.4 30.0 19 0.31 806 10.7 Håkan Ekman
STD 152 132 Archus Arosia Arkitekter AB A 11 36.8 33.4 35 5.39 753 20.8 Johnnie Pettersson
STD 153 138 EVU Energi & VVS Utveckling AB Enr, M 11 36.1 30.6 36 1.60 683 12.0 Per-otto Bengtsson
STD 154 MoRe Research Örnsköldsvik AB i 11 35.7 32.4 40 2.60 559 24.2 Carl Kempe
STD 155 144 DHi Sverige AB Env, M 11 35.2 29.3 27 1.50 783 8.5 Cecilia wennberg
STD 156 177 Murman Arkitekter AB A 11 35.0 23.6 31 3.80 669 12.6 wivian EidsaunetSTD 157 197 Consultec Arkitekter & Konstruktörer
AB (Annual Report 18 months) A,CE 10/11 34.7 20.2 20 3.40 1020 8.3 Allan ForslundSTD 158 134 Konsultgruppen i Bergslagen AB i 11/12 34.2 32.4 15 2.26 1041 9.7 ove Larsson
STD 159 153 AQ Arkitekter i Eskilstuna AB A 11/12 33.4 27.0 29 3.95 637 16.6 Magnus Parkler
STD 160 143 MAF Arkitektkontor AB A 10/11 33.2 29.4 25 1.40 728 14.2 Mats Jakobsson
STD 161 140 P o Andersson Konstruktionsbyrå AB M 11 33.2 30.1 20 9.80 1154 38.9 Arne Berggren
162 192 Clinton Mätkonsult AB CE 10/11 33.2 21.2 30 2.15 623 10.0 Johan Nyström
STD 163 162 SweRoad AB CE 11 32.6 25.9 17 -2.60 694 29.2 Gunnar Tunkrans
STD 164 139 Sören Lundgren Byggkonsult AB CE,PM 11/12 32.5 30.1 21 4.15 958 13.4 Anders Harlin
STD 165 182 KLT Konsult AB i 11 32.1 23.1 35 4.50 694 14.3 Jonas Kroll
STD 166 136 BSV Arkitekter & ingenjörer AB A,CE 11 32.0 31.1 33 0.75 617 12.5 Johnny Grauengaard
167 152 PB-Teknik AB M 11/12 31.7 27.1 30 2.46 556 14.8 Patrik Bergström
STD 168 112 Anders Bergkrantz Arkitekter AB A 11 31.4 39.8 15 0.27 628 8.5 Anders Bergkrantz
169 142 KFS Anläggningskonstruktörer AB CE,PM 10/11 31.0 29.7 22 4.90 988 20.4 Patrik Påhlsson
STD 170 Aerodynamics Research Center STARCS AB i 10/11 31.0 15.1 22 -0.71 700 13.9 Michael Tjernlund
STD 171 190 Deva Mecaneyes AB i 11 30.7 21.9 30 3.10 724 16.1 Magnus welén
STD 172 147 Equator Stockholm AB A 11 30.4 28.3 34 0.30 698 11.5 Annica Carlsson
STD 173 119 Rockstore Engineering AB CE 11 30.4 38.7 21 2.66 832 12.1 Johnny Samuelsson
STD 174 160 Electro Engineering koncernen AB E 11/12 30.3 26.0 29 2.95 693 19.7 Bo Andersson
STD 175 200 Crabat AB CE 11/12 30.3 19.9 23 2.71 920 10.5 Martin Lundström
STD 176 Byggnadstekniska Byrån i Stockholm AB CE 11 30.1 17.9 28 5.46 775 14.8 Erik Löb
STD 177 165 Pyramiden Arkitekter i Göteborg AB A 11 30.0 25.4 26 2.60 749 12.4 Dan Nyström
STD 178 149 Pidab instrumentdesign AB i 11/12 29.9 28.1 29 0.40 669 10.9 Björn Magnusson
STD 179 174 Scheiwiller Svensson Arkitektkontor AB A 11/12 29.8 23.8 24 2.33 748 13.5 Ari Leinonen
STD 180 126 Projektbyggaren i Blekinge AB PM,A 11 29.8 36.1 20 3.70 880 14.0 Christer Lennartsson, Mats Persson (chairman)
STD 181 145 TEAM TSP Konsult AB E 11 29.6 28.8 21 6.60 1070 18.1 Göran Berg
STD 182 173 Carlstedt Arkitekter AB A 11 29.1 23.8 29 4.90 717 17.7 Kerstin Eken
183 179 A&P Arkitekter AB A 11 28.4 23.2 25 1.54 599 10.2 Per Ahrbom (chairman), Gunnar Hellman (CEo)
STD 184 128 AG Arkitekter AB A 11 28.1 34.5 34 -0.12 575 5.2 Anders Gunnedal
185 151 Ågrenkonsult Sverige AB PM 11/12 27.9 29.6 19 2.77 945 10.2 Anders Röstlund
STD 186 193 Prodelox AB i 11/12 27.4 21.1 23 1.05 679 8.3 Johannes walfridsson
STD 187 164 EQC Group CE 11 27.0 17 2.58 868 10.7 Pär opard, Magnus Trollius
STD 188 158 Ahlqvist & Almqvist Arkitekter AB A 10/11 26.5 26.5 24 3.07 618 7.6 Britt Almqvist
STD 189 DGE Mark och Miljö AB Env 11 26.5 24.0 23 1.09 608 7.6 Johnny Sjögren
STD 190 189 Arkitema DoT A 11 26.4 21.9 24 -0.29 563 10.9 Urban Blomberg
STD 191 172 STiBA AB CE 11 26.3 24.3 21 7.50 1064 16.6 Rune Dalmyr
STD 192 163 Tecnet Nordic AB i 11/12 26.0 25.8 24 1.11 798 8.0 Göte Nordmark
193 161 Creanova AB M,Enr 10/11 25.9 25.9 22 4.40 781 12.6 Göran olsson
194 146 Hedström & Taube Projektledning AB PM 11 25.6 28.5 16 5.90 1148 9.8 Göran Melin
STD 195 169 Arkitektgruppen G.K.A.K AB A 11 25.5 24.8 25 0.50 551 9.1 Bo Johansson
STD 196 170 Ettelva Arkitekter AB A 11 25.4 24.6 23 3.30 709 9.1 Anders Lindh
197 184 Kemakta Konsult AB Env 11 25.2 22.6 17 0.65 774 8.1 Bertil Grundfelt
STD 198 188 Rördesign i Göteborg AB i,M 11/12 24.8 22.2 27 1.26 722 13.5 Jan Karlsson
The top 300 Swedish consulting engineering and architectural groups
2012 11 Group ceo/managing directorServ
ices
annu
al
rep
ort
Turn
over
m
Sek
(Pre
viou
s ye
ar)
ave
rage
nu
mbe
r of
em
ploy
ees
res
ult a
fter
fin
anci
al it
ems
mSe
k
add
ed
valu
e/em
pl.
kSek
Tota
l bal
ance
sh
eet
mSe
k

23Sector Review • The Swedish Federation of Consulting Engineers and Architects • December 2012
STD 199 181 Creacon Halmstads Konsult AB CE 11,0 24.7 23.1 28 0.60 559 11.1 Göran Feldt
STD 200 206 Knut Jönsson Byggadministration-gruppen PM 11/12 24.1 19.7 9 2.79 1014 6.6 Tom Ågstrand
STD 201 185 Alfakonsult AB PM, MA 11 24.0 22.5 20 0.29 739 7.5 Henning Jensen
STD 202 180 CA Consult PM 11 23.8 23.2 24 1.70 660 15.1 Lennart olsson
STD 203 101 Total Arkitektur & Urbanism AB (former Mondo&FRS Ark) A 11 23.5 42.1 21 4.40 767 10.9 Johan Granqvist
STD 204 227 Rosenbergs Arkitekter AB A 11 23.4 16.4 27 2.70 619 11.3 inga Varg
STD 205 249 Addiva Engineering E,i 10/11 23.4 13.8 19 -0.62 753 5.9 Timo Tirkkonen
STD 206 194 Mekaniska Prövningsanstalten MPA AB M 11 23.4 20.8 12 5.40 1500 10.5 Torbjörn ohlsson
STD 207 171 ACNL Elteknik AB E 11,0 23.2 24.4 24 1.20 596 9.3 Kenneth Eriksson
STD 208 187 Elektrotekniska Byrån i Karlstad AB E,i 11/12 23.0 22.3 21 1.62 681 9.8 Jonas BjuresäterSTD 209 QE Quality Engineering Group AB
(annual report 16 months) i 10/12 23.0 12 2.98 1285 6.6 Fredrik Lundström210 175 ABAKo Arkitektkontor AB A 11,0 22.9 23.8 31 0.70 515 10.4 olof Hallberg (chairman)
STD 211 155 Profu - Projektinriktad Forskning o Utveckling i Göteborg Enr, Env 11/12 22.7 26.8 15 1.59 986 8.1 Håkan Sköldberg (chairman)
212 166 HillStatik AB S,CE 11,0 22.5 25.1 19 6.60 950 17.2 Conny Höggren
STD 213 207 Atrio Arkitekter Kalmar AB A 11,0 22.3 19.3 18 2.70 742 10.9 olof Utterback
STD 214 204 JoLiARK AB (Johanson Linnman Arkitekter) A 10/11 22.0 19.6 24 4.70 705 10.5 Malin olsson
STD 215 216 HMXw Arkitekter AB A 11 21.6 17.8 21 2.70 700 7.3 Ragnar widegren
STD 216 218 Contekton Arkitekter Fyrstad AB A 10/11 21.6 17.7 19 3.70 805 15.4 no CEo
STD 217 233 Lindberg Stenberg Arkitekter AB A 11 21.6 15.5 19 4.80 826 11.3 Annette LindbergSTD 218 228 Rolf Tellstedt i Göteborg AB CE 11,0 20.8 16.4 21 1.30 2238 25.2 Björn Tellstedt, Thomas
ÖstergrenSTD 219 215 Jais Arkitekter A 11/12 20.8 17.9 18 4.69 795 10.8 Nils-Erik Landén
220 oxyma innovation AB i 10/11 20.7 17.5 22 3.01 721 10.0 Johan Norelius
STD 221 205 Svenska Teknikingenjörer AB i 10/11 20.6 19.5 13 1.20 705 2.2 Per Sikström
STD 222 186 Fredblad Arkitekter AB A 11/12 20.5 22.3 23 3.74 695 7.7 Leif JönssonSTD 223 198 Knut Jönson ingenjörsbyrå AB
(proforma) CE 11/12 20.5 20.6 19 6.50 871 48.0 Per Arne NäsströmSTD 224 247 ingenjörsfirman Rörkraft AB i 11/12 20.5 14.3 22 2.16 618 5.1 Clas wollberg
STD 225 195 Co-Pilot Bygg & Projektledning AB CE 10/11 20.1 20.8 16 -1.20 667 9.3 Nils Johansson
STD 226 219 Umeå industri & Kraft Konsult AB i,E 11 20.1 17.6 15 1.80 983 9.1 Bertil Rönnlund
STD 227 Foran Sverige AB Env 11 20.1 25.6 18 -2.94 502 9.1 Helge Urströmmen
STD 228 199 METRo Arkitekter AB A 10/11 22.3 22.3 25 0.42 502 9.0 Claes R. Jansson
STD 229 200 Jelmtech Produktutveckling AB i 10/11 19.9 15.4 19 1.97 686 8.5 Staffan Viebke
230 212 Svea Teknik AB i 11,0 19.8 18.3 18 4.60 948 12.9 Johan Lindberg
STD 231 225 Relitor AB i 11,0 19.5 16.8 13 0.76 734 6.3 Mikael Nilsson
232 240 Arkitekter Engstrand och Speek AB A 10/11 19.2 14.8 15 3.00 803 12.9 olle Dahlkild
STD 233 211 KwD Automation & Engineering AB i 11 19.2 18.3 12 0.47 748 7.1 Dan Nilsson
234 202 Brandgruppen i Sverige AB M 11/12 19.1 19.7 15 1.99 837 11.1 Johan Renvall
STD 235 Metlab Miljö AB Env 11 18.9 17.3 15 1.88 761 9.1 Lars Månsson
236 208 MRM Konsult AB CE,Env 10/11 18.8 18.9 21 -0.06 501 2.5 Mikael Nilsson
STD 237 252 ingenjörsbyrå Forma i 10/11 18.6 13.4 20 1.30 678 7.5 Anders Grahm
STD 238 262 Landskapslaget AB A 11 18.6 12.7 17 1.80 725 6.8 Soon Hammarström
STD 239 241 Neste Jacobs AB i 11 18.6 14.8 15 -2.40 555 14.8 Johan Bengtsson
STD 240 217 Vatten och Samhällsteknik AB Env 11/12 18.6 17.8 18 0.63 664 9.0 Stefan Ljung
STD 241 209 Markstyrkan AB CE 10/11 15.5 15.5 9 3.85 1050 7.8 Thomas wolf
242 246 Teknikfunktion G Clemensson AB CE 11/12 18.3 14.3 12 3.90 1004 9.5 Gösta Clemensson
243 234 Projektidé i Uppsala AB PM 10/11 18.3 15.5 11 2.50 957 8.7 Henrik Billing (chairman)
244 386 Bertrandt Sweden AB i 10/11 18.2 6.7 15 -4.58 211 4.9 Markus Ruf
STD 245 Säkerhetspartner i Norden AB CE 11/12 18.2 18.5 7 4.61 1497 13.7 Thomas Berggren
STD 246 220 Marktema AB CE 10/11 18.0 17.4 14 0.60 684 8.5 Johan Gréen
247 213 Visby Arkitektgrupp AB A,CE 11 17.8 18.0 21 0.61 614 6.1 Annalena Mosséen (chairman)
STD 248 222 Provab AB CE 10/11 17.7 17.2 16 1.80 656 4.8 Ulf Andersson
2012 11 Group ceo/managing directorServ
ices
annu
al
rep
ort
Turn
over
m
Sek
(Pre
viou
s ye
ar)
ave
rage
nu
mbe
r of
em
ploy
ees
res
ult a
fter
fin
anci
al it
ems
mSe
k
add
ed
valu
e/em
pl.
kSek
Tota
l bal
ance
sh
eet
mSe
k
STD = Member of the Swedish Federation of Consulting Engineers and Architects. (*) = lack of conforming figure/proforma/assumed – = missing figure PM = Project Management, A = Architecture, CE = Civil/Structural Engineering, CT = Certification and testing, Env = Environment, Enr = Energy, E = Electrical, M = Mechanical/HEVAC, I = Industrial, MD = Multi Disciplinary

24 Sector Review • The Swedish Federation of Consulting Engineers and Architects • December 2012
STD 249 251 Vcon VVS-Konsult AB M 11/12 17.6 13.6 16 5.25 873 16.5 Nicklas Andersson
STD 250 256 Yngve Lundh Arkitekt AB A 11 17.6 12.9 10 2.60 797 11.4 Börje Glamheden
251 210 Megaron Arkitekter AB A 11 17.6 18.4 9 3.30 991 8.5 Anders Högberg
STD 252 283 mCUB AB i 10/11 17.5 11.5 25 1.92 565 5.7 Marcus Blomberg
STD 253 Calluna AB Env 10/11 17.4 15.0 10 0.80 1065 7.1 John Askling
254 226 Uulas Arkitekter AB A 11 17.2 16.5 17 3.60 725 9.7 Jerker Edfast
STD 255 231 Komab industriteknik AB i 11/12 17.2 15.6 10 1.58 755 10.3 Tommy olsson
STD 256 248 TiBi Stockholm AB PM 10/11 17.0 14.3 12 1.70 718 6.3 Per Eriksson
STD 257 401 Nordprojektering El + VVS AB E 11/12 16.9 14.9 16 3.19 786 11.0 Mikael Fredriksson
STD 258 254 Landskapsgruppen AB CE 10/11 16.8 13.0 19 1.70 653 8.7 Tomas Hagström
STD 259 High Vision Engineering Sweden AB i 11 16.7 7.4 19 0.99 590 6.2 Peter weston
STD 260 Eco Konsult i Stockholm AB (Annual Report 18 months) i 11/12 16.5 10 2.49 1107 5.7 Jan Strömberg
STD 261 263 Arkitektlaget i Skåne AB A 11 16.2 12.7 12 2.70 885 8.0 Jan Tellving
STD 262 238 KUB Arkitekter AB A 1 15.9 15.0 16 1.13 601 6.4 no CEo
STD 263 314 Gajd Arkitekter AB A 11/12 15.8 9.6 12 4.18 942 10.0 Mikael Nädele
264 287 otec Elkonsult AB CE,PM 11 15.8 11.2 10 3.40 1234 15.2 Peter olin
STD 265 243 Johan Celsing Arkitektkontor AB A 11 15.6 14.3 13 1.10 669 6.1 Johan Celsing
STD 266 275 Danewids ingenjörsbyrå AB CE 11/12 15.6 12.0 10 3.09 925 9.1 Göran Bäckström
267 273 Epsilon Byggkonsult AB CE 10/11 15.4 12.1 12 2.40 926 5.3 Jimmy Bredstenslien
STD 268 236 Vinga Elprojektering AB E 10/11 15.4 15.4 19 -0.58 652 4.9 Mats Svengård
STD 269 224 wickenberg Bygganalys AB PM 11 15.3 16.9 10 0.90 771 6.4 Peter widding
STD 270 267 Larsson Arkitekter i Stockholm AB A 11/12 15.2 12.5 12 2.26 793 11.0 Jerker Larsson
271 264 Procema Energi & Miljöteknik i 11 15.2 12.6 12 1.20 713 5.0 Lars ingvar olsson
STD 272 237 Arkitekthuset Jönköping AB A 10/11 15.1 15.1 15 3.16 765 7.8 Thomas Hultegård
STD 273 239 Storköksbyrån i Stockholm AB S 10/11 15.0 15.0 1 4.68 6611 22.4 Peggie Ulle
STD 274 250 Seveko VVS Konsult AB M 11,0 14.9 13.7 15 1.90 719 5.7 Henrik Sandén
STD 275 266 Södergruppen Arkitekter AB A 11 14.8 12.5 15 0.17 526 5.4 Jens Deurell
STD 276 221 Kåver & Mellin AB CE 11 14.7 17.3 17 2.10 635 5.4 Anders Hedberg
STD 277 Nordcert AB CT 11 14.3 13.5 10 0.92 811 20.6 Douglas wallding
STD 278 223 Akila Konsulting AB CE 11 14.2 16.9 18 5.70 644 61.4 Tor Ökvist
279 214 Rundquist Arkitekter AB A 11 14.1 18.0 12 1.70 708 8.7 Henrik Rundquist
STD 280 274 Saltech Consultants AB i 11 14.1 12.0 9 3.30 1150 8.0 olov Lindström
STD 281 284 Sprängkonsult i Göteborg AB CE 11 14.0 11.5 9 1.92 889 6.9 Thomas Dahl
STD 282 293 Rekogit AB CE 10/11 13.8 10.7 13 1.32 678 3.7 Sven Åsling
283 269 Acad international AB CE 10/11 13.8 12.3 11 2.30 845 3.4 Anders Schönbeck
STD 284 281 Österjärn AB CE 10/11 13.7 11.7 11 1.61 747 6.0 Tommy Johansson
STD 285 280 Midvatten AB 11 13.7 11.7 9 1.40 778 8.4 Per-Arne Ryttar
286 308 Logiksystem i Skövde AB E,i 11 13.7 9.8 8 0.90 580 4.7 Ulf Nilsson
STD 287 270 EPG Konsult Samordnad VVS-Teknik AB M 11/12 13.6 12.2 12 1.36 600 4.9 Gillis wendtSTD 288 230 Pantektor AB / SKAPi
Projektutveckling AB A,CE,PM 11 13.6 15.6 10 0.40 683 4.5 Bertil HäggSTD 289 255 AGERA VVS-Design AB M 11 13.5 12.9 15 0.60 576 4.1 Matthias Larsson
STD 290 282 Prevecon Brand & Riskkonsult AB CE 10/11 13.5 11.6 13 1.26 718 4.8 Fredrik Hellgren
STD 291 242 Atumo AB CE 11 13.5 14.5 12 -0.40 644 3.5 Michael Marklund
STD 292 244 Projectpartner AB PM 11 13.4 14.3 8 2.60 1042 8.9 Tommy Backman
STD 293 289 Lindstam Broman Elgström arkitekt AB A 11 13.2 11.1 16 1.40 663 9.5 Mats Elgström
STD 294 397 Contec Byggprojektering AB CE 10/11 13.2 6.3 9 2.70 1190 7.2 Lars Erik Jonsson
STD 295 253 Müller-BBM Scandinavia AB CE 11 13.1 13.3 12 -0.20 693 7.9 william Easterling
STD 296 353 Arkitektgruppen i Malmö AB A 11 13.1 7.8 12 5.40 886 7.2 Lars Karud (chairman)297 268 Mårtensson & Håkanson Byggråd-
givare AB PM 11/12 13.0 12.4 9 0.76 860 6.8 no CEoSTD 298 296 CH Arkitekter A 11 13.0 10.5 12 2.30 765 8.0 Hans olof Carlson
299 258 Lincona Byggkonsult AB CE 10/11 12.9 12.9 15 2.32 695 7.4 Dan Johansson
STD 300 261 optronic i Norden AB i 11/12 12.7 12.7 8 -4.23 295 52.0 Joacim Lindström
The top 300 Swedish consulting engineering and architectural groups
2012 11 Group ceo/managing directorServ
ices
annu
al
rep
ort
Turn
over
m
Sek
(Pre
viou
s ye
ar)
ave
rage
nu
mbe
r of
em
ploy
ees
res
ult a
fter
fin
anci
al it
ems
mSe
k
add
ed
valu
e/em
pl.
kSek
Tota
l bal
ance
sh
eet
mSe
k
STD = Member of the Swedish Federation of Consulting Engineers and Architects. (*) = lack of conforming figure/proforma/assumed – = missing figure PM = Project Management, A = Architecture, CE = Civil/Structural Engineering, CT = Certification and testing, Env = Environment, Enr = Energy, E = Electrical, M = Mechanical/HEVAC, I = Industrial, MD = Multi Disciplinary

25Sector Review • The Swedish Federation of Consulting Engineers and Architects • December 2012
The Nordic market

26 Sector Review • The Swedish Federation of Consulting Engineers and Architects • December 2012
nordic comparison of key business ratios
Sweden Denmark Finland Norway iceland
0
25
50
75
100
125
150
175
200
11100908070605040302010099989796959493
Euro
0
3
6
9
12
15
11100908070605040302010099989796959493
Euro
0
20
40
60
80
100
11100908070605040302010099989796959493
Euro
0
3
6
9
12
15
11100908070605040302010099989796959493
%
Turnover/employee Result after financial items/employee
Total assets/employee Profitmargin
The figures are calculated with the conversion rates below, representing average currency rates in 2011.
1 Euro = 9.0335 SEK 7.4500 DKK 5.9457 FiM 7.7965 NoK 171.3031 iSK
The Nordic market
The Nordic section in the Sector Review is produced in cooperation with our colleagues in Finland, Norway, Denmark and Iceland. FRI presents develop-ments on the Danish market and RIF developments on the Norwegian mar-ket. SKOL provides an account of the Finnish market for engineering consult-ants and ATL presents the Finnish architectural market. The Icelandic market is presented jointly by FRV and the architects’ association FSSA.
Comparison of key business ratiosA comparison is made below of some of the key business ratios for the Nordic countries in the form of four graphs which – as far as the Sector Review is concerned – are new. The figures are calculated on the basis of the 30 largest firms in each country, and translated
into Euro based on average currency exchange rates during 2011. Norway has the highest turnover per employee – EUR 158 000. In Finland, the cor-responding figure is EUR 91 000. The highest profitability for the year was achieved in Iceland, where the profit margin was 10.5 %. In other countries,
the profit margins were as follows: Sweden – 7.9 %, Finland – 3.1 %, Den-mark – 3.5 % and Norway – 6.6 %. It should, however, be noted that we have comprehensive input data for all firms in Sweden, Norway and Iceland, whereas the figures for Finland and Denmark are lacking somewhat.

27Sector Review • The Swedish Federation of Consulting Engineers and Architects • December 2012
The top 100 nordic architectural groups
STD 1 1 white Arkitekter AB 11 SE 678 442 734.3 MSEK
STD 2 2 SwECo Architects AB 11 SE 600 345 536.0 MSEK
STD 3 3 Tengbom 11 SE 422 272 400.3 MSEK
4 4 Arkitektfirmaet C.F. Møller 11 DK 296 262 289.8 MDKK
5 7 LiNK Signatur Gruppen 11 No 249 147 264.1 MNoK
RiF 6 Ramböll Architects Norway 11 No 180 215.0 MNoK
7 5 Henning Larsen Architects 11/12 DK 170 165 179.6 MDKK
STD 8 8 Temagruppen Sverige AB 11 SE 165 142 177.4 MSEK
9 6 Arkitema K/S 10 DK 163 163 168.5 MDKK
10 10 Narud-Stokke-wiig A/S 11 No 141 121 195.0 MNoK
STD 11 11 wingårdh-koncernen 11 SE 141 121 176.0 MSEK
12 9 DARK Gruppen Arkitekter AS 11 No 131 129 205.0 MNoK
13 12 Schmidt, Hammer & Lassen Architects K/S 11 DK 120 113 105.0 MDKK
STD 14 14 Nyréns Arkitektkontor AB 11 SE 97 98 104.6 MSEK
STD 15 17 Liljewall Arkitekter AB 11 SE 87 75 86.5 MSEK
STD 16 21 FoJAB Arkitekter AB 10/11 SE 80 69 130.0 MSEK
STD 17 22 Arkitekterna Krook & Tjäder AB 11 SE 76 68 74.2 MSEK
18 15 Årstiderne Arkitekter A/S 10/11 DK 75 97 69.3 MDKK
19 16 BiG / Bjarke ingels Group 11 DK 75 96 76.3 MDKK
20 19 JJw Arkitekter A/S 11 DK 75 75 35.3 MDKK
21 20 Creo Arkitekter A/S 11 DK 75 75 N/A MDKK
ATL 22 45 Arkkitehtitoimisto Pekka Helin & Co oy 11 FiN 70 44 5.6 MEUR
SKoL/ATL 23 33 innovarch Architects oy 11 FiN 68 55 7.0 MEUR
24 25 Mangor & Nagel Arkitektfirma A/S 11/12 DK 67 62 48.2 MDKK
STD 25 24 AiX Arkitekter AB 11/12 SE 66 66 71.4 MSEK
26 23 KPF Arkitekter A/S 11 DK 62 67 42.8 MDKK
STD 27 31 Brunnberg & Forshed Arkitektkontor AB 11 SE 61 56 77.2 MSEK
STD 28 26 Semrén & Månsson Arkitektkontor AB 10/11 SE 60 60 65.9 MSEK
STD 29 32 ÅwL Arkitekter AB 11/12 SE 58 56 56.7 MSEK
30 27 Tegn3 AS (Reinertsen) 11 No 57 59 58.0 MNoK
31 29 Erik Møller Arkitekter A/S 10/11 DK 56 56 63.0 MDKK
32 18 3XNielsen A/S 10/11 DK 55 75 68.9 MDKK
FRi 33 40 Ai-Gruppen A/S 11 DK 54 50 47.5 MDKK
ATL 34 28 Arkkitehtitoimisto Larkas & Laine oy 11 FiN 53 58 4.9 MEUR
35 50 Strategisk Arkitektur Fries & Ekeroth AB 11 SE 52 41 64.6 MSEK
36 34 Lpo Arkitekter As 11 No 51 53 59.5 MNoK
37 42 Niels Torp AS Arkitekter 11 No 51 47 65.2 MNoK
38 39 Vilhelm Lauritzen AS 11 DK 50 50 40.5 MDKK
FRi 39 30 DAi Gruppen A/S 11 DK 49 56 37.5 MDKK
40 46 CUBo Arkitekter A/S 11/12 DK 49 44 63.9 MDKK
41 35 Medplan AS arkitekter 11 No 48 51 56.0 MNoK
42 36 BGo Arkitekter AS 11 No 48 51 56.0 MNoK
43 41 Aarhus Arkitekterne A/S 10/11 DK 48 48 54.0 MDKK
STD 44 48 Thomas Eriksson Arkitektkontor AB 11/12 SE 48 41 50.5 MSEK
ATL 45 56 Arkkitehtitoimisto Sigge oy 11 FiN 46 37 2.6 MEUR
46 44 wester+Elsner Arkitekter AB 10/11 SE 45 45 60.6 MSEK
ATL 47 49 Arkkitehtitoimisto SARC oy 10/11 FiN 44 41 5.0 MEUR
FSSA 48 141 Batteríið ehf. 11 iS 44 20 244.0 MiSK
49 51 Lund Hagem Arkitekter AS 11 No 42 40 50.8 MNoK
50 43 Arkitektkontoret Hille+Melbye A/S 11 No 41 46 50.5 MNoK
annual (Previous 2011/12 10/11 Group report country employees year) Turnover

28 Sector Review • The Swedish Federation of Consulting Engineers and Architects • December 2012
STD 51 53 SYD ARK Konstruera AB 11/12 SE 41 38 54.3 MSEK
52 Aperto Arkitekter Byggkonsulter AB 10/11 SE 41 50.1 MSEK
STD 53 54 Arkitekthuset Monarken AB 11/12 SE 40 38 43.3 MSEK
54 52 Lund & Slaatto Arkitekter AS 11 No 39 39 46.2 MNoK
ATL 55 75 Pes-Arkkitehdit oy (Pekka Salminen) 11 FiN 38 34 2.8 MEUR
STD 56 82 Cedervall Arkitekter 11 SE 38 31 48.9 MSEK
57 86 AMB Arkitekter AS 11 No 37 30 37.5 MNoK
58 101 Dyrvik Arkitekter A/S 11 No 37 21 30.7 MNoK
STD 59 55 BSK Arkitekter AB 11 SE 36 37 37.8 MSEK
STD 60 57 Reflex Arkitekter AB 10/11 SE 36 36 50.6 MSEK
61 38 Dissing + weitling Arkitektfirma A/S 11 DK 35 50 14.1 MDKK
62 47 Solem Hartmann Arkitekter AS 11 No 35 44 36.3 MNoK
63 58 Gottlieb & Paludan A/S Arkitekter 11 DK 35 36 24.9 MDKK
64 59 PLH Arkitekter AS 11 DK 35 35 48.2 MDKK
65 61 Peter Jahn & Partnere A/S 10/11 DK 35 35 36.2 MDKK
66 62 Arkitektfirmaet Kjaer & Richter A/S 10/11 DK 35 35 54.7 MDKK
67 63 Lundgaard & Tranberg Arkitekter A/S 10/11 DK 35 35 50.5 MDKK
68 64 KHR Arkitekter AS 10 DK 35 35 33.6 MDKK
69 65 Gehl Architects A/S 10/11 DK 35 35 23.1 MDKK
70 66 Hou & Partnere A/S 11 DK 35 35 23.8 MDKK
71 67 RUMarkitekter A/S 11/12 DK 35 35 38.4 MDKK
72 68 Tegnestuen Vandkunsten ApS 11 DK 35 35 30.6 MDKK
73 69 wiTRAZ Arkitekter K/S *11 DK 35 35 24.5 MDKK
STD 74 70 Archus Arosia Arkitekter AB 11 SE 35 35 36.8 MSEK
75 78 Kullegaard Arkitekter A/S 10/11 DK 35 32 40.0 MDKK
76 79 SAHL Arkitekter A/S *11/12 DK 35 31 MDKK
77 88 Aart A/S 10/11 DK 35 29 60.8 MDKK
78 100 DoMUS arkitekter A/S 11 DK 35 27 25.9 MDKK
79 117 C&w Arkitekter A/S (Clausen & weber ) 11 DK 35 28 32.0 MDKK
80 148 Juul Frost Arkitekter A/S 11 DK 35 20 32.5 MDKK
81 149 SLA Arkitekter A/S 11 DK 35 20 32.0 MDKK
82 Rubow Arkitekter A/S 11 DK 35 44.7 MDKK
83 Friis & Moltke A/S 11 DK 35 36.0 MDKK
STD 84 60 BAU Arkitekter AB 11 SE 34 35 40.7 MSEK
85 73 Rørbaek og Møller Arkitekter ApS 10/11 DK 34 34 26.6 MDKK
STD 86 74 AG Arkitekter AB 11 SE 34 34 28.1 MSEK
STD 87 76 Equator Stockholm AB 11 SE 34 33 30.4 MSEK
ATL 88 85 Uki Arkkitehdit oy 11 FiN 34 30 2.5 MEUR
89 94 Solheim + Jacobsen Arkitekter AS 11 No 34 29 31.7 MNoK
90 PiR ii architects AS * (proforma) 11 No 34 27 31.2 MNoK
STD 91 77 BSV Arkitekter & ingenjörer AB 11 SE 33 33 32.0 MSEK
92 87 Arcasa Arkitekter AS 11 No 32 30 44.8 MNoK
93 83 Arkitektkontoret Børve og Borchsenius 11 No 31 31 36.9 MNoK
94 91 ABAKo Arkitektkontor AB 11 SE 31 29 22.9 MSEK
STD 95 92 Murman Arkitekter AB 11 SE 31 29 35.0 MSEK
96 93 Heggelund & Koxvold Arkitekter AS 11 No 31 29 28.3 MNoK
97 103 PKA Per Knudsen Arkitektkontor AS 11 No 31 29 27.0 MNoK
SKoL/ATL 98 96 Eriksson Arkkitehdit oy 11 FiN 30 28 2.4 MEUR
STD 99 98 AQ Arkitekter i Eskilstuna AB 11/12 SE 29 27 33.4 MSEK
STD 100 126 Erséus Arkitekter AB 11 SE 29 22 39.8 MSEK
The top 100 nordic architectural groups
annual (Previous 2011/12 10/11 Group report country employees year) Turnover

29Sector Review • The Swedish Federation of Consulting Engineers and Architects • December 2012
THE DANiSH MARKET
about FriThe Danish Association of Consulting Engineers (FRi), founded in 1904, is a trade association for Danish consul-tancy firms providing independent con-sultancy services on market terms. FRi is a part of the Confederation of Danish industries (Di).
Approximately 350 firms are members of FRi and they employ together more than 22,000 people in Denmark and abroad. The association is the only trade association for independent technical consultants in Denmark.
The objective of FRi is to support its member firms by contributing to improving their business conditions, strengthening the industry’s framework conditions, profiling the industry and increasing its recognition on the national and international levels.
FRi is an association for firms. it focuses on business matters and has estab-lished good liaisons with authorities and other partners. The association attempts as far as possible to gain influence on the drafting of framework conditions and legislation affecting market condi-tions in the industry.
internationally, the association is a member of FiDiC and, in Europe it is a member of EFCA.
Address: Sundkrogskaj 20 P.o. Box 2604 DK-2100 Copenhagen Ø
Tel: +45-35 25 37 37 Fax: +45-35 25 37 38 E-mail: [email protected] www.frinet.dk
increase in both domestic and foreign turnover
In 2011 the total gross revenue in the domestic market for the Danish consulting engineering firms showed a minor increase from DKK 11 billion in 2010 to DKK 11.2 billion in 2011. An increase of 1.3 %. The export revenue accounted for approximately 17 % of the total gross revenue. By comparison, the international subsidiaries of Danish consulting engineering firms have shown considerable growth in 2011 and generated revenue of DKK 7.6 billion, which is an increase of more than 15 % compared to 2010. Approximately 11.200 people are employed abroad in subsidiaries. For the first time since 2007 the industry experienced rising profit margins from 4.0 % in 2010 to 4.6 % in 2011.
outlookThe Danish government expects a growth of 0.9 % in GDP in 2012 and projects the growth to increase to 1.7 % in 2013. In 2012 the residential invest-ments are estimated to have declined by 4 %. Low interest rates and an improv-ing market leads to an expected increase in residential investments by 5 % in 2013. Public investments have seen
for the consulting engineering industry in Denmark. The revenue generated by exports and in the foreign subsidiaries amounted to 51 % of the total gross rev-enue in the industry. The development in these markets is expected to be of increasing importance for the industry in the coming years.
Sector market performanceThe performance of the Danish consul-tancy industry is still dominated by the two primary sectors Building and Infra-structure which account for 27 % and 31 %, respectively, of the total revenue. Other distinctive sectors are Environ-ment, which have seen a slight decline from 15 % to 14 % while Energy, has risen from 10 % to 14 % of the industry revenue.
Declining investments in infrastructureIn the proposed National Budget for 2013 the Danish government plans to steadily reduce the appropriations for infrastructure from DKK 16 billion in 2012 to DKK 8 billion in 2016. The investment cuts will primarily target the road sector, where as railroads will see a small increase in allocated funds. The proposal will likely lead to nega-tive growth in the general infrastructure sector for the consulting engineering industry over several years. There are however still several major projects in the pipeline such as the Copenhagen and Odense light rail and a new Stor-strømsbro to replace the old one.
Tax exemption for employees stationed abroad – to be or not to be?In May 2012 the Danish government started negotiations with the opposition on a new tax reform. Here it was deci-ded to abolish Ligningslovens §33A, which gives employees stationed abroad for more than six months, exemption for paying taxes in Denmark. This deci-sion would hurt a lot of Danish compa-nies working abroad, and diminish the Danish consulting engineering firms’ global competitiveness. The past six months, since the negotiations began, the industry has already seen a decline in exports, the first decline since 2007, where FRI began measuring export orders. The decline was primarily due
an increase of 7.5 % in 2012, but are estimated to drop by 11.5 % in 2013. For the remainder of 2012 and in 2013 the industry expects the workforce to stay near its current level as 38 % of the companies expect to increase their work-force, while 30 % expects to decrease it. The weak economic growth in Denmark and continued uncertainty in the global economy threatens the growth prospects
Henrik Garver, FRi David Hedegaard Meyer, FRi

30 Sector Review • The Swedish Federation of Consulting Engineers and Architects • December 2012
THE DANiSH MARKET
to companies, having to factor in the possibility of their employees loosing the tax exemption, when bidding on international projects. FRI and a large number of Danish businesses have been adamantly opposed to abolishing the tax exemption, and after months of coordi-nated pressure, the Government decided to retract the changes to Ligningsloven § 33A in November 2012.
Ambitious energy plansIn March 2012 the Danish parliament agreed upon a very ambitious plan for reducing carbon emissions by 34 % and increasing the production of renewable energy towards 2020. The plans aim for a 60 % reduction in coal consumption at the major powerplants, which instead will use biomass. The electrical supply is supposed to consist of 49.5 % wind power by 2020. This will probably lead to large investments in the power-supply infrastructure as well as new wind farms. The overall ambition is to have a carbon emission free society by 2050. With that in mind, the energy sector is expected to be of increasing importance to the industry, especially with infrastructure on the decline.
New CEo in Ramboll GroupIn March 2012 Jens-Peter Saul com-menced his position as CEO of the Ramboll Group based in Copenhagen, Denmark. He will be replacing former CEO, Flemming Bligaard Pedersen, who has headed the company for the past 20 years. He will be leading a company that in 2011 saw a 13 percent increase in turnover and grew by more than 550 employees and is now nearing 10.000 worldwide. In 2012 Ramboll won several major projects. Among those were the role as planning advi-sor for the newest branch extension for the Copenhagen Metro, which entails three kilometers of track and two new stations. In July Ramboll was appointed client advisor for Nordea, which plans to move its Danish headquarters to a new building able to accommodate between 1,800 and 2,200 employees. Ramboll was also awarded the contract to develop the Master Plan for the Emirate of Fujairah in the United Arab Emirates. Ramboll will be working
closely with the Government of Fujairah to develop a strategic master plan for the development of the Emirate for the next 30 years. In Russia Ramboll has won a contract for the design of airport facilities for Nizhny Novgorod Interna-tional, Russia’s fastest growing regional airport. The project includes a new pas-senger terminal, a new access road and a parking area. In India another large scale project is underway with Ramboll breaking new ground with a major pro-ject for transport giant, Scania. The de-velopment of a 22,000 m2 facility is seen as a stepping stone for other Nordic companies, who consider making India part of their business setup. In 2012 Ramboll acquired the Finnish transport planning specialists, Liidea Ltd, which made Ramboll the largest engineering consultancy in northern Finland. Ram-boll also acquired Danish wind energy consultancy LAC engineering, Danish consultancy Stig Jørgensen and Partners ans Swedish SANN & Partners Manage-ment Consulting AB.
Growth for Cowi despite a difficult yearWith a strong presence in the Middle east COWI was affected by the re-gional unrest during the Arab Spring. Despite an operating loss COWI still managed to increase the turnover in 2011 by 5 percent compared to 2010. In 2012 COWI has won several major international projects. In collaboration with Danfoss, COWI will be work-ing on a vast district heating project in Anshan, China. The goal is to increase the energy efficiency for the city’s 1.8 million inhabitants. COWI also won a contract that covers the assessment and construction of a new local station at the Central Station in Gothenburg, Sweden, enabling regional and local commuter trains to pass through and on to other new, local stations in the city. In September COWI signed a contract to design an Iraqi expressway from Baghdad to Turkey, a road sec-tion of nearly 700 km from Baghdad to the Turkish border, including access roads to six regional cities. In Denmark COWI will be in charge of the technical consultancy for the Odense Light Rail project in Denmark, which among other
things will provide access to the new university hospital and service the some 60,000 persons who will be using the new campus area. COWI is also help-ing an idealistic team of Danish farmers make the innovative Pig City project a reality. In a greenhouse right above the pigs’ heads, tomato plants soak up the CO2 and excess body heat filtering up from their first-floor neighbors. This is a revolutionary way of organizing and planning food production that could change the way large-scale farming is conducted in Denmark – and the rest of the world. In 2012 COWI continued their Nordic expansion with the acquisi-tion of Stormorken & Hamre and A-tek in Norway, as well as LMI Borrteknik in Sweden.
NiRAS relocates to accommodate growth In 2011 NIRAS achieved a 6 percent growth in revenue and a 21 percent growth in earnings. A combination of organic growth and acquisitions led to a 5 percent increase in employees and expansions in several countries. In May 2012 more than 500 guests partici-pated in the grand reception to cel-ebrate NIRAS new domicile. This was also a year where NIRAS won several large projects. NIRAS was appointed as primary advisor on Denmark’s first biorefinery, which is expected to provide a CO2 reduction of 434,000 tons in the local area. NIRAS was also selected as main advisor within design and visualisation of the new Odense Light Rail in Denmark and will be advising on the new VIA University campus in Aarhus, Denmark, which will house 400 employees and 5000 students. Abroad NIRAS will be working on a new bridge in Greenland, a biogas plant in Malay-sia and several other projects. In 2012 NIRAS acquired 4 new companies in Denmark, Norway and Germany with a combined turnover of more than DDK 126 million.
Grontmij A/S is working on green projects home and abroadIn 2011 Grontmij A/S delivered a con-siderably stronger financial result com-pared with 2010, with a slight increase in overall revenue and an increase of

31Sector Review • The Swedish Federation of Consulting Engineers and Architects • December 2012
THE DANiSH MARKET
164 % in profits. In 2012 Grontmij A/S was involved in several large projects both in Denmark and abroad. Gront-mij A/S will be advising on Denmark’s largest biogas plant, which will be able to process 700.000 tons of manure and 200.000 tons of miscellaneous biomass per year. In Hanstholm, Denmark, Grontmij A/S will be advising on the DDK 1 billion expansion of the harbor. Grontmij A/S also won a project in Odense, Denmark, where they will help transform a busy main street into an attractive part of the city. In another part of the world Grontmij A/S is working on one of the world’s larg-est water treatment plants, which will provide clean water to 4 million people in Dhaka, Bangladesh.
ALECTiA moves forward in the dairy sectorALECTIA will in 2012 be providing both engineering and architect services for the new production facility at Mam-men dairy as well as the new 14.000 m2 expansion at Taulev dairy, which will is set to increase production by 60 %. In another sector of the Danish food industry ALECTIA has been acting as client advisor for Danish Crown on their new high-tech slaughterhouse at Holsted, Denmark, which will be the largest single investment in the sector ever. ALECTIA was also involved in designing a new high security laboratory for Statens Serums Institut.
New CEo at Atkins DanmarkAfter 5 years as director of Atkins Dan-mark’s railway division, Eva Rindom took the reins as CEO of Atkins Dan-mark, as the previous CEO Palle Beck Thomsen went into retirement. She will be leading a company, which has seen remarkable growth since 2006. In 2012 Atkins Danmark won the project of electrification of the 56 km railway line between Lunderskov and Esbjerg. Atkins Danmark also won a bid for a new 500 meter double freeway bridge running across a forest near Silkeborg, as part of large scale freeway project. In Norway Atkins Danmark won the pro-jecting of the renovation and replace-ment of railway components and bridges on Lambertseterbanen from Brattlikol-len to Karlsrud in southern Oslo.
orbicon prepares for climate changesIn 2012 Orbicon won several projects, such as the new 5.000 m2 low energy laboratory building for Roskilde Uni-versity, the renovation of 910 apart-ments in Ladegårdsparken at Holbæk and a new 21.000 m2 parking house at Ørestaden. It was also the year when Orbicon entered a partnership with the municipality of Aarhus to tackle future climate challenges, and started work on a new master plan for the 1.5 km area along the canal in Albertslund. In 2012 Orbicon acquired Korsbæk og Partnere and thus considerably expanded their Aalborg division.
Moe & Brødsgaard helps construct a new skiing hill in CopenhagenMoe & Brødsgaard will be managing the project design for Amager Bakke, which is the renovation of the 40 year old incinerator plant Amagerforbrænd-ingen to include new clean technologies and a skiing hill on top of the construc-tion. Moe & Brødsgaard will also be consultning on a new global headquar-ters for the transport- and logistics company DSV, which will include a 15.000 m2 main building and a 15.000 m2 terminal. In 2012 Moe & Brødsgaard acquired Skude & Jacobsen consulting engineers a company with 55 emloyees.
Signs of improvement among architectsWhile the economic crisis has taken it’s toll on the Danish architects, 2011 shows clear signs of improvement in the industry, with an increase in turnover by 16.4 % compared to 2010 and an im-pressive 26 % increase in foreign turno-ver, which now accounts for 17 % of the industry’s total turnover. Danish archi-tects won several prominent projects in 2012 where Bjarke Ingels Group was selected to design a new 500m financial tower in China and Henning Larsen Architects won the competition for a new research building for the Center for Solar Energy and Hydrogen Research in Stuttgart. Back in Denmark C.F. Møller won the competition to design the new Copenhagen Arena, which will be able to seat 15.000 spectators and
Schmidt Hammer Lassen Architects will be designing the new DDK 4.1 billion Aalborg University Hospital as par of a consortium.
David Hedegaard Meyer and Henrik Garver, FRI

32 Sector Review • The Swedish Federation of Consulting Engineers and Architects • December 2012
The top 100 danish consulting engineering and architectural groups
FRi 1 1 Rambøll Gruppen A/S MD 11 6,891.3 6,074.9 9,439 3,749.5 Jens-Peter SaulFRi 2 2 Cowi Koncernen A/S MD 11 5,054.9 4,461.5 6,164 2,390.9 Lars-Peter SøbyeFRi 3 3 Grontmij A/S MD 11 1,132.2 1,076.8 1,165 771.4 Søren LarsenFRi 4 4 NiRAS-Gruppen A/S MD 11 958.0 757.6 1,472 462.0 Carsten Toft BoesenFRi 5 5 Alectia A/S CE,PM 11 621.8 488.8 663 333.2 Jens MobergFRi 6 7 Atkins Danmark A/S MD 11/12 587.2 333.0 542 206.9 Eva RindomFRi 7 6 orbicon A/S MD 11 387.6 410.0 425 186.0 Jesper Nybo Andersen
8 8 Arkitektfirmaet C.F. Møller A 11 289.8 239.2 296 118.5 Susanne T NielsenFRi 9 9 Moe & Brødsgaard A/S MD 11 281.1 236.4 357 150.5 Christian Listov-Saabye
10 11 Henning Larsen Architects A 11/12 179.6 145.7 170 109.5 Mette Kynne Frandsen11 10 Arkitema K/S A,PM 10 168.5 168.5 163 78.8 Peter Hartmann Berg 12 12 iSC Rådgivende ingeniører A/S MD 11 150.5 126.7 150 152.4 Kjeld Thomsen
FRi 13 21 Kuben Management A/S (Merged with NRGi Rådgivning A/S in 2012) proforma Enr,E,i 11 136.6 130.8 136 130.7 Ulf Christensen
FRi 14 13 EKJ Rådgivende ingeniorer A/S MD 11/12 124.7 125.2 163 109.8 Jørgen Nielsen 15 15 Midtconsult A/S MD *10/11 120.0 120.0 140 Jens Lauritsen
FRi 16 14 oBH-Gruppen A/S MD 11 117.4 123.3 139 49.6 Børge Danielsen17 19 Schmidt, Hammer & Lassen Architects K/S
*proforma A 11 105.0 88.6 120 68.8 Bente Damgaard FRi 18 18 Bascon Arkitekt-og ingeniørfirma A/S PM,CE, A, 11/12 97.2 96.6 115 52.8 Lars SvenningsenFRi 19 17 Balslev Rådgivende ingeniører A/S MD 10/11 89.2 98.5 130 66.0 Bo MemhaveFRi 20 22 Søren Jensen A/S Rådgivende ingeniører MD 10/11 77.0 74.9 99 50.2 Erik V. Jensen
21 20 BiG / Bjarke ingels Group A 11 76.3 78.9 75 29.1 Sheela Maini Søgaard (CEo)22 16 Årstiderne Arkitekter A/S A 10/11 69.3 105.0 75 44.0 Per Laustsen23 23 3XNielsen A/S A 10/11 68.9 69.3 55 29.2 Bo Boje Larsen24 Niels Torp as Arkitekter A 11 65.2 59.6 48 39.2 Niels A Torp25 27 CUBo Arkitekter A/S *proforma A 11/12 63.9 56.5 49 14.1 Peter Dalsgaard26 26 Erik Møller Arkitekter A/S A 10/11 63.0 63.0 56 29.4 Kirsten Anker Sørensen27 73 Aart A/S A 10/11 60.8 21.2 35 22.8 Anders Strange28 24 ÅF Hansen & Henneberg, København A/S PM 11 55.1 67.7 75 35.1 Per Seidelin29 71 Arkitektfirmaet Kjaer & Richter A/S A 10/11 54.7 22.1 35 22.7 Arne Egeskjold30 30 Aarhus Arkitekterne A/S A 10/11 54.0 54.0 48 32.1 Tommy Falch
FRi 31 35 Dines Jørgensen & Co A/S CE, M, PM 10/11 52.2 43.8 58 21.6 ole Rasmussen32 67 Lundgaard & Tranberg Arkitekter A/S A 10/11 50.5 23.8 35 43.1 Lene Tranberg
FRi 33 28 Brix & Kamp A/S CE,E,i 11 49.0 55.4 51 29.1 ole Thomen34 36 PLH Arkitekter AS A 11 48.2 43.2 35 21.4 Steen Enrico Andersen35 40 Mangor & Nagel Arkitektfirma A/S A 11/12 48.2 50.6 67 28.0 Torben Nagel
FRi 36 39 Ai-Gruppen A/S A,CE 11 47.5 41.4 54 26.3 Jan Bruus SørensenFRi 37 68 Nielsen & Risager A/S MD 11 46.1 23.6 35 14.6 ib Rasmussen
38 166 Rubow Arkitekter A/S A 11 44.7 35 15.2 Lars Bo Lindblad FRi 39 32 Dominia AS (Rådgivende ingeniører) CE, E, M, PM 11 43.6 47.8 43 23.4 Kjeld Christiansen
40 51 white Arkitekter A/S A 11 42.9 29.0 35 13.8 Frans Andersen41 38 KPF Arkitekter A/S A 11 42.8 41.4 62 37.3 Michael Reventlow-Mourier
FRi 42 33 DGE Group A/S Env 11 42.2 46.1 49 17.1 Poul Erik Jensen43 52 Vilhelm Lauritzen AS A 11 40.5 28.7 50 46.0 Søren Daugbjerg44 31 Proinvent Gruppen A/S i 11/12 40.4 46.3 32 17.5 Leif Dalum45 85 Kullegaard Arkitekter A/S A 10/11 40.0 16.2 35 17.2 Thomas Kullegaard
FRi 46 61 Esbensen Rådgivende ingeniører A/S CE, Enr E, M 11 38.5 26.1 50 82.0 Torben Esbensen47 88 RUM Arkitekter A/S A 11/12 38.4 14.1 35 13.2 Hanne Flo Stig
FRi 48 37 d.a.i. Gruppen A/S A, MD 11 37.5 42.9 49 26.8 Jørgen H. Therkelsen49 48 GPP Arkitekter A/S A 11 37.4 30.5 25 21.5 Carsten Gjørtz50 77 Peter Jahn & Partnere A/S CE, A 10/11 36.2 19.7 35 14.2 Peter Jahn, Claus Dam
FRi 51 45 Skude & Jacobsen A/S MD 11 36.0 32.0 50 20.3 Peter islevFRi 52 55 Lyngkilde A/S Rådgivende ingeniørfirma A/S CE 10/11 36.0 27.5 35 19.2 Claus H. Larsen
53 126 Friis & Moltke A/S A 11 36.0 8.8 35 17.4 Palle Hurwitz54 41 JJw Arkitekter A/S A 11 35.3 37.7 75 20.1 Anders Holst Jensen
FRi 55 42 Hundsbaek & Henriksen A/S MD 10/11 35.3 36.5 46 13.3 Niels Lerbech SørensenFRi 56 49 wessberg A/S Rådgivende ingeniører CE,M,E 11 33.9 30.2 27 43.9 Stig wessberg
57 44 KHR Arkitekter AS A 10 33.6 33.6 35 30.3 Henrik DanielsenFRi 58 53 Sloth-Møller Rådgivende ingeniører A/S CE 11 33.2 28.4 60 25.2 Jørn PlauborgFRi 59 47 wissenberg A/S CE 11 33.0 31.1 37 13.6 Lars Bendix ChristensenFRi 60 150 oSK -Ship Tech A/S i 10/11 33.0 30 15.7 Anders Ørgård Hansen
61 91 Juul Frost Arkitekter A/S A 11 32.5 14.0 35 7.2 Helle Juul, Fleming Frost62 43 C&w Arkitekter A/S (Clausen & weber)
*proforma A 11 32.0 35.0 35 17.7 Michael Petersen63 100 SLA Arkitekter A/S A 11 32.0 12.0 35 6.7 Mette Skjold64 75 Tegnestuen Vandkunsten ApS A 11 30.6 20.7 35 18.7 Steffen Kragh65 79 AN Group A/S i 11 30.0 18.7 22 9.3 ole okkels, Aksel Nielsen
FRi 66 Cunningham Lindsey 11 30.0 N/A 20 16.3 Christian Leif Hansen
Turn average Tot. Balance annual over (Previous number of sheet ceo/managing director 11/12 10/11 Group Services report mdkk year) employees mdkk (december 2012)
FRI = Member of FRI, the Danish Association of Consulting Engineers (*) = lack of conforming figure/proforma/assumed – = missing figure PM = Project Management, A = Architecture, CE = Civil/Structural Engineering, Env = Environment, Enr = Energy, E = Electrical,M = Mechanical/HEVAC, I = Industrial, MD = Multi Disciplinary

33Sector Review • The Swedish Federation of Consulting Engineers and Architects • December 2012
key business ratio 30 largest groups (previous year)
Turnover per employee DKK 805k dKK 749kProfit after financial items per employee DKK 28k dKK 26kBalance sheet total per employee DKK 424k dKK 468k
The turnover for the 30 largest groups increased by 13 % to approximately DKK 18 147 million (DKK 15 992 million in 2010). Using the same method of calculation, the average number of employees grew by 6 % to 22 551 (21 337). The profit before tax was DKK 28k per employee (DKK 26k the previous year). The profit margin for the 30 largest groups in 2011 remained at 3.5 %, same as the year before.
Generally speaking, it is risky business making direct comparisons between key business ratios for the largest firms and corresponding figures for the medium and small-sized firms. in the case of the latter firms, the extensive efforts of the often many partners has a relatively significant impact on the companies’ turnover and profit level per employee.
For firms 31-100 in the above list, turnover in 2011 increased by 24 % to approximately DKK 2 205 million (DKK 1 783 million in 2010). The number of employees grew by 3 % to 2 363 (2300). The turnover per employee consequently increased to DKK 993k (DKK 775k). The profit before tax increased to DKK 61k per employee (DKK 21k). Calculated in terms of profit margin, this gives 6.5 % (2.7 %). The average balance per employee was approximately DKK 528k (DKK 482k).
THE DANiSH MARKET
67 124 Nova 5 Arkitekter A/S A 11 29.2 9.0 20 15.3 Anders Dragheim m.flFRi 68 83 K2 Management A/S PM*10/11 29.2 17.4 15 6.8 Henrik StamerFRi 69 69 Tri-Consult A/S MD 10/11 27.6 23.2 36 13.4 Søren ibsen
70 57 SwECo Architects A/S A, PM 10 26.9 26.9 35 9.8 Lone Busk FRi 71 89 Holmsgaard a/s Rådgivende ingeniører
(Eibye & Holmsgaard ApS) CE,PM,E,M 11 26.6 14.0 15 6.1 Henrik Holmsgaard72 58 Rørbaek og Møller Arkitekter ApS A 10/11 26.6 26.6 34 17.0 Anders wesley Hansen m.fl73 86 DoMUS arkitekter A/S A, PM 11 25.9 15.3 35 7.0 Jørgen Skaaning Trolle 74 63 Viegand & Maagöe Aps i 10 25.5 25.5 22 11.8 Jan Viegand/Peter Maagöe
PetersenFRi 75 82 ingeniørne A/S CE,E,M 11 25.3 17.9 25 19.3 Finn Moe Bojsen
76 132 Gottlieb & Paludan A/S Arkitekter A, PM, CE 11 24.9 7.4 35 22.5 Jesper GottliebFRi 77 64 Lemming & Eriksson Rådgivende ingeniører A/S CE 11/12 24.7 25.1 32 9.5 Knud Bay
78 60 wiTRAZ Arkitekter K/S A *11 24.5 26.3 35 Per Zwinge79 72 Hou & Partnere A/S A 11 23.8 22.1 35 7.9 ib Jensen Hou
FRi 80 76 Viborg ingeniørerne A/S CE,PM,Enr 11 23.8 20.1 23 14.5 Erik S. DamgaardFRi 81 66 NTU CE,PM 11 23.7 24.2 39 25.8 Lars Bentzen
82 59 Gehl Architects A/S A 10/11 23.1 26.4 35 10.3 Helle SöholtFRi 83 34 oluf Jørgensen Gruppen *proforma M,E,Enr 10/11 23.0 45.1 29 15.0 Brian Th. Andreasen
84 74 AK 83 Arkitektkontoret A/S A 10/11 22.6 20.8 19 14.7 Lars Levin FRi 85 70 Consia Consultants A/S Env 10 22.5 22.5 12 12.4 Erling Rask
86 56 Emcon A/S PM,CE 11 22.4 27.5 N/A 10.8 Niels Anker Jørgensen 87 110 Fogh & Følner Arkitektfirmaet A/S A 11 21.6 9.8 15 8.4 Johan Fogh88 122 KANT Arkitekter A/S A 11 21.2 9.2 15 9.6 Klaus Holm Jensen
FRi 89 97 Johansson & Kalstrup A/S MD 10/11 20.0 13.5 22 7.9 Henrik LadefogedFRi 90 Gaihede A/S CE,E,PM 11 19.9 N/A 22 8.6 Ragn GaihedeFRi 91 65 Henrik Larsen Rådgivende ingeniörer A/S CE 11 19.8 25.0 25 12.0 Henriette Dybdal CajarFRi 92 oluf Jørgensen A/S Horsens CE 10/11 19.3 15.6 22 14.7 Brian Th. Andreasen
93 90 TNT Arkitekter A/S A,PM,CE,Env 11 19.1 14.0 22 5.2 Flemming Dahl m.flFRi 94 80 Damgaard Rådgivende ingeniører A/S CE *09 18.3 18.3 35 Mogens Damgaard NielsenFRi 95 78 Henneby Nielsen Rådgivende ingeniörer A/S CE 11 18.3 18.7 35 7.3 Jörn Henneby Nielsen
96 81 Claus Bjarrum Arkitekter A/S A *11 18.0 18.0 14 Claus BjarrumFRi 97 151 Arbeidsmiljöcentret A/S 11 17.6 28 5.0 Tommy Gilkou
98 101 Arkitektfirmaet TKT A/S A 10/11 17.4 11.9 15 11.5 Sören Vestergaard99 121 LB-Consult A/S CE,M,E 11 17.3 9.2 15 6.5 Lars Bager
FRi 100 Andreasen & Elmgaard A/S i 10/11 17.0 17 5.8 Per Elmgaard Rasmussen
03020100999897969594930
1
2
3
4
5
6
7
8
9
%
04 05 06 07 08
10
09 10 11
kDKK
600
700
500
400
300
200
100
kDKK
60
70
50
40
30
20
10
800 80
900 90
1,000 100
92 93 94 95 96 97 98 99 00 01 02 0403 05 06 07 0908 10 11
Turnover/employeeBalance Sheet total/employee Result after �nancial items/employees
Turn average Tot. Balance annual over (Previous number of sheet ceo/managing director 11/12 10/11 Group Services report mdkk year) employees mdkk (december 2012)
The top 30 danish groups result margins
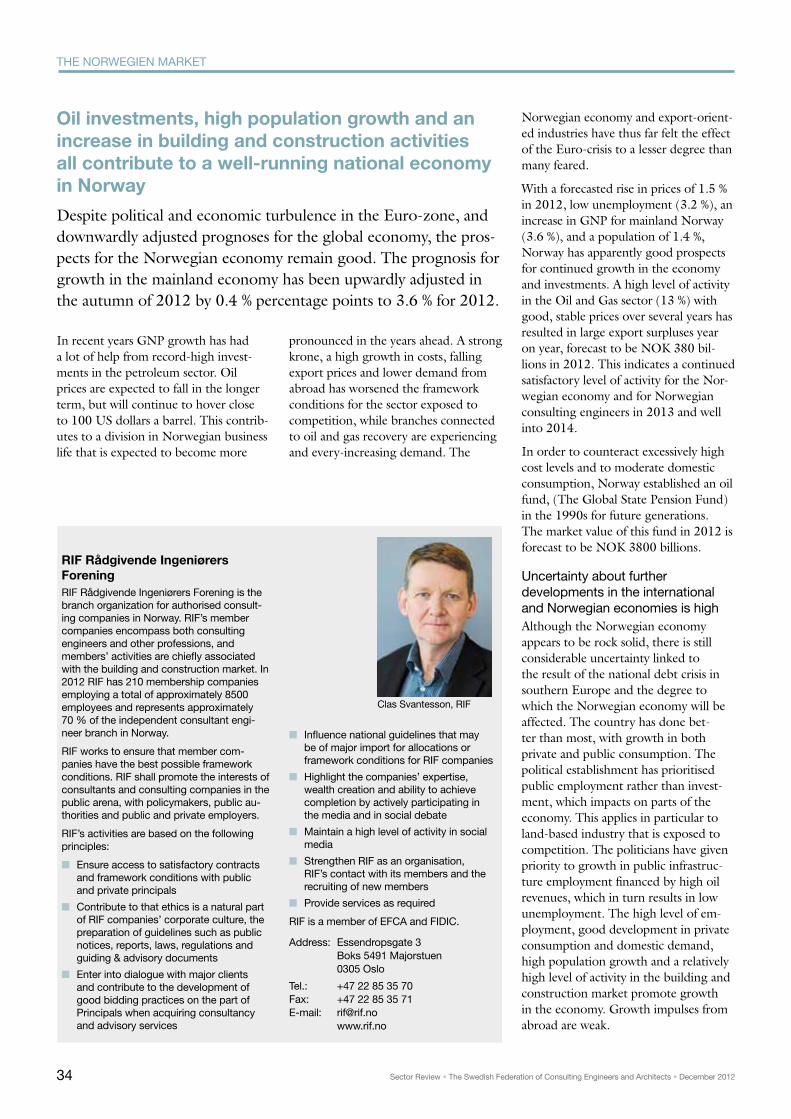
34 Sector Review • The Swedish Federation of Consulting Engineers and Architects • December 2012
riF rådgivende ingeniørers ForeningRiF Rådgivende ingeniørers Forening is the branch organization for authorised consult-ing companies in Norway. RiF’s member companies encompass both consulting engineers and other professions, and members’ activities are chiefly associated with the building and construction market. in 2012 RiF has 210 membership companies employing a total of approximately 8500 employees and represents approximately 70 % of the independent consultant engi-neer branch in Norway.
RiF works to ensure that member com-panies have the best possible framework conditions. RiF shall promote the interests of consultants and consulting companies in the public arena, with policymakers, public au-thorities and public and private employers.
RiF’s activities are based on the following principles:
■ Ensure access to satisfactory contracts and framework conditions with public and private principals
■ Contribute to that ethics is a natural part of RiF companies’ corporate culture, the preparation of guidelines such as public notices, reports, laws, regulations and guiding & advisory documents
■ Enter into dialogue with major clients and contribute to the development of good bidding practices on the part of Principals when acquiring consultancy and advisory services
■ influence national guidelines that may be of major import for allocations or framework conditions for RiF companies
■ Highlight the companies’ expertise, wealth creation and ability to achieve completion by actively participating in the media and in social debate
■ Maintain a high level of activity in social media
■ Strengthen RiF as an organisation, RiF’s contact with its members and the recruiting of new members
■ Provide services as required
RiF is a member of EFCA and FiDiC.
Address: Essendropsgate 3 Boks 5491 Majorstuen 0305 oslo
Tel.: +47 22 85 35 70Fax: +47 22 85 35 71E-mail: [email protected] www.rif.no
Clas Svantesson, RiF
THE NoRwEGiEN MARKET
oil investments, high population growth and an increase in building and construction activities all contribute to a well-running national economy in norway
Despite political and economic turbulence in the Euro-zone, and downwardly adjusted prognoses for the global economy, the pros-pects for the Norwegian economy remain good. The prognosis for growth in the mainland economy has been upwardly adjusted in the autumn of 2012 by 0.4 % percentage points to 3.6 % for 2012.
Norwegian economy and export-orient-ed industries have thus far felt the effect of the Euro-crisis to a lesser degree than many feared.
With a forecasted rise in prices of 1.5 % in 2012, low unemployment (3.2 %), an increase in GNP for mainland Norway (3.6 %), and a population of 1.4 %, Norway has apparently good prospects for continued growth in the economy and investments. A high level of activity in the Oil and Gas sector (13 %) with good, stable prices over several years has resulted in large export surpluses year on year, forecast to be NOK 380 bil-lions in 2012. This indicates a continued satisfactory level of activity for the Nor-wegian economy and for Norwegian consulting engineers in 2013 and well into 2014.
In order to counteract excessively high cost levels and to moderate domestic consumption, Norway established an oil fund, (The Global State Pension Fund) in the 1990s for future generations. The market value of this fund in 2012 is forecast to be NOK 3800 billions.
Uncertainty about further developments in the international and Norwegian economies is high Although the Norwegian economy appears to be rock solid, there is still considerable uncertainty linked to the result of the national debt crisis in southern Europe and the degree to which the Norwegian economy will be affected. The country has done bet-ter than most, with growth in both private and public consumption. The political establishment has prioritised public employment rather than invest-ment, which impacts on parts of the economy. This applies in particular to land-based industry that is exposed to competition. The politicians have given priority to growth in public infrastruc-ture employment financed by high oil revenues, which in turn results in low unemployment. The high level of em-ployment, good development in private consumption and domestic demand, high population growth and a relatively high level of activity in the building and construction market promote growth in the economy. Growth impulses from abroad are weak.
In recent years GNP growth has had a lot of help from record-high invest-ments in the petroleum sector. Oil prices are expected to fall in the longer term, but will continue to hover close to 100 US dollars a barrel. This contrib-utes to a division in Norwegian business life that is expected to become more
pronounced in the years ahead. A strong krone, a high growth in costs, falling export prices and lower demand from abroad has worsened the framework conditions for the sector exposed to competition, while branches connected to oil and gas recovery are experiencing and every-increasing demand. The

35Sector Review • The Swedish Federation of Consulting Engineers and Architects • December 2012
THE NoRwEGiEN MARKET
Stable and good market – high level of activity in infrastructure development In 2010 activities in building and construction were noticeably affected by the financial crisis of 2008, with a fall in production of 7 % between 2007– 2010, which in turn affected consulting engineers. This trend reversed in 2011 and 2012, with a comparable increase, and the expectation of the branch as of October 2012 is continued growth in the market and employment in 2013 and well into 2014.
Production in the building and con-struction market is expected to rise by 20 % during the period 2010 – 2014. The number of employees in the build-ing and construction sector will increase by 25,000 to 215,000. The pre-condi-tion for these prognoses is that develop-ments abroad do not result in a total meltdown of the economies resulting from the Euro crisis and a depression in the USA and Asia.
The market for consulting engineers is also expected to show positive develop-ment in the period 2012 - 2014. Growth in the building and construc-tion sector is anticipated to be 5 % in 2012. The figures for 2013 and 2014 show a further increase of 5 % and 2 % respectively. The number of employees in RIF companies has increased by 20 % from 2010 to 2012.
Consulting engineers – forecast growth in 2012 and 2013Financial freedom is dependent on that the national priorities are carried for-ward into 2012 and 2013, and that one will promote policies based on justice and community. National prioritising during the period 2012 – 2013 means jobs for all and a fair division of ben-efits and burdens. This entails ensur-ing continued low unemployment in Norway, improving health, care, schools and kindergartens. The difference in living standards must be lessened, and the ground must be prepared for the continued high level of immigration of workers. Efforts in public transport, energy and the environment will be car-ried forward. These efforts are carried forward and concretised in the budgets for 2013. For consulting engineers, the
budgets indicate a moderate increase in levels of activity in public building, with a marked increase in investments in public infrastructure.
Total planning needs and investments in the building market are expected to increase by 6 % in 2012. Activities are expected to even out in 2013 and 2014. This applies in particular to private com-mercial buildings where a slight down-turn is expected. A moderate increase in public building works will however maintain activity at a good level. Hous-ing construction is expected to show growth in 2012, 2013 and 2014 due to strong centralisation and high popula-tion growth.
There has been a high level of activity in the construction market for consult-ing engineers, and a large number of in part major projects are in the planning stage. The increase in investments in this market is expected to be in the region of 9 % in 2012. In 2013 investments are expected to increase by 6 % before again flattening out in 2014. The most stable section of this market is roads, which are increasingly financed by toll systems. This has resulted in that one has been able to maintain a stable level of activ-ity. Investments in roads have increased by 10 % in 2012, but are expected to remain at the same level in 2013 and 2014. Rail and tramway plant is prior-ity area. Investments in the years ahead will show a considerable increase. RIF companies are now increasing capacity and expertise to meet with the future demands of this market. The energy market is also in a growth phase, in par-ticular in connection with the refurbish-ing and modernisation as well as new building of hydroelectric power plants, infrastructure for power cables, distribu-tion and the export of energy.
The backlog in refurbishing and modernisation of existing buildings and infrastructureThere is a major backlog in public build-ings and plant investments, in particular the rehabilitation of existing buildings and infrastructure.
In March 2010 RIF published a Norwe-gian State of the Nation (SotN) based on the format used for similar reports
published in the USA, Finland, Denmark and Great Britain. Railways and drain-age/sewage plant were awarded a ‘2’ in the report, which means that both are in such an extremely poor state of repair that functionality is under threat. In the mid-zone, with 3 points, we find municipal buildings, health institution buildings, national/county roads, municipal roads and water supply infrastructure. The report was followed up in 2011 and it transpires that there is an increase in will on the part of the authorities and developers to increase investments in these sectors. Public transport came out as a “budget win-ner” in 2011 and 2012. RIF takes some of the credit for this since we made the political powers aware, in no uncertain terms, of the enormous challenges this lack of maintenance have cansed.
RIF now finds that the report is being used, and has contributed to that the authorities seek dialogue with us and wish to co-operate in practical areas such as the lack of capacity and expertise and for increased efficiency in the implemen-tation of projects. In this process RIF is focussed on achieving the best possible contract and framework conditions for our members and following up budget processes. This notwithstanding, there appears to be no limits to creativity when it comes to the financing of new projects, but to set aside funds and prioritise necessary maintenance and rehabilitation appears to be difficult exercise.
A number of exciting projectsRoad and Rail: The largest individual projects in public transport in the years ahead will be the railway running to the south from Oslo, the so-called Follo Railway. Together with other projects and the refurbishment of existing railways, means that major investments will be made in Norway’s railways over the coming 10 – 20 years. The authori-ties and the branch are now intensively engaged in work to increase capacity and improve expertise to meet these challenges. In addition, investments are being made in tramways and rail tracks with the objective of improving punc-tuality and increasing capacity in order to better serve an ever-growing popula-

36 Sector Review • The Swedish Federation of Consulting Engineers and Architects • December 2012
THE NoRwEGiEN MARKET
tion in and around the major towns and cities. Bybanen and a new Ulriken tunnel in Bergen, a new railway, Eidsv-oll – Hamar and Sandbuka – Onsøy are examples of major projects.
A number of major motorway projects in and around the major towns and cities are also in the planning stage, with focus on major road, bridge and tunnel projects designed to link regions and reduce threats posed by avalanches and land/rock slides. Examples of larger projects are several stretches of the European standard roads E6 and E18, which are being improved, new bridges such as the Hardanger Bridge and Nordland Bridge, are under construc-tion and there are several projects that are currently in the planning stage and under construction. These projects nevertheless take time, and far too little construction is being done, and even then in bits and pieces.
Energy. The need to develop trade and industry, increased energy prices and the demand for sustainable renewable energy has resulted in that several excit-ing projects are in the planning phase. Investments are being made in new wa-ter supply plant; elderly generating plant is being refurbished and new microgen-eration plant is being constructed. Grid capacity for the transport of power is being increased. Several alternative en-ergy projects are being planned, includ-ing offshore wind, onshore wind, Biogas and power and thermal solar plants.
The new Oslo – Gardermoen airport and Bergen - Flesland terminals are in the planning and construction stage. Necessary expansion of capacity at the airports requires the planning and construction of new terminal buildings, taxiways and aircraft stands and the accompanying technical infrastructure, together with access roads, front traffic area, parking facilities and technical infrastructure. Work is also under way on the merging and relocation of the smaller short-haul regional airports.
Cultural buildings: Major investments are being made in new cultural build-ings. New projects are under planning such as the new National Museum and other new cultural buildings in Oslo and other towns and municipalities.
Hospitals: New construction and rehabilitation of hospitals in all health regions in Norway. The largest projects in this sector are Haukeland Hospital in Bergen, Nordlands Hospital in Bodø, the new Østfold Hospital, the new Buskerud Hospital and several re-loca-tions of local hospitals that are in the planning phase.
International projects. An attractive domestic market with lower ethical and commercial risks has resulted in that Norwegian consulting engineering companies have changed their strategies with regard to international activities. This has in turn resulted in that interna-tional activities have turned away from mainly aid-related projects and are now focussed more investments in the more developed countries and on purely com-mercial projects with a low risk profile. Activities abroad have a particular focus on energy projects such as hydroelectric power developments and oil and gas. The export share in 2004 was around 10 %, but is forecast to be in the region of 5 % in 2012.
Concentration and restructuring in the branchRestructuring of the Norwegian market is characterised by the fact that large companies purchase smaller local enterprises to serve a local market and to create an inter-disciplinary resource base “in-house”, in order to meet the manpower requirements of major national projects. These developments have resulted in that we now have an extremely intense concentration in the branch around 6 major consultancy companies. These now have over 70 % of all employees in RIF. We have seen only a few acquisitions in 2012. Growth in 2012 is more typically organics, and RIF companies have showed willingness to engage newly qualified engineers and architects. The average age of employees in RIF companies has sunk by several years since 2000.
Of acquisitions and mergers in 2012 we can mention:
In September ÅF purchased the Nor-wegian project management company Advansia with 120 employees and activi-ties in Norway and Sweden.
Norconsult AS, which is the largest consultancy company in Norway with a total turnover of more than NOK 2.7 billions, has thus far in 2012 purchased Riss Arkitekter.
In 2012 SWECO Norge AS purchased the Project Management Company Pyramide AS in Stavanger
In September Cowi AS purchased the company A-Tek Ingeniørfirma, the company works in the fields of industry and energy.
Asplan Viak AS purchased the compa-nies Pro Nor AS and VVS–Norplan AS.
Clas Svanteson, RIF

37Sector Review • The Swedish Federation of Consulting Engineers and Architects • December 2012
The top 100 norwegian consulting engineering and architectural groups
RiF 1 1 Norconsult AS-group MD 11 2,765.6 2,233.7 2,170 1,486.1 John Nyheim RiF 2 2 Multiconsult MD 11 1,470.5 1,256.6 1,237 904.7 Christian Nørgaard MadsenRiF 3 3 Rambøll Norway MD 11 1,379.1 1,090.2 1,298 593.4 ole Petter ThunesRiF 4 4 SwECo Norway MD 11 1,203.6 1,089.4 1,198 691.6 Tron Kjølhamar
5 5 Reinertsen Engineering MD 11 1,106.0 1,019.7 987 Torkild Reime ReinertsenRiF 6 6 Cowi AS MD 11 1,038.1 899.5 922 569.3 Terje Bygland NikolaisenRiF 7 7 Asplan Viak koncernen CE,Env,A 11 707.3 585.8 692 337.6 Øyvind MorkRiF 8 8 Dr. ing. Aas-Jacobsen A/S - group CE, PM 11 349.1 314.0 144 161.8 Trond A. Hagen
9 12 LiNK Signatur Group A, PM 11 264.1 238.9 249 100.9 Siri LegernesRiF 10 9 Faveo Prosjektledelse (PTL, Prosjekt- og
Teknologiledelse AS) PM 11 252.4 251.6 166 82.0 Sven Erik Nørholm RiF 11 10 Hjellnes Consult AS MD 11 228.9 203.0 163 114.9 Geir Knudsen
12 11 DARK Gruppen Arkitekter AS proforma* A 11 205.0 197.0 131 120.0 Kjell Østlie 13 13 Techconsult AS PM,i 11 200.1 165.3 93 68.3 Ronny Meyer14 16 Narud-Stokke-wiig A/S proforma* A 11 195.0 140.0 141 85.2 Jon Arne Bjerknes/ole wiig/
Narud Jörn15 15 optimo Prosjekt as PM 11 194.1 144.2 22 53.2 Björn Grepperud16 17 oPAK A/S PM,Env,Enr,E 11 147.0 135.6 136 40.9 Jan-Henry Hansen
RiF 17 18 ÅF Norway M,E,Enr, i 11 143.3 131.5 130 49.1 ove Guttormsen 18 14 oEC Consulting AS Enr,i,PM 11 141.3 144.8 68 73.5 Knut Hegge19 99 Atkins Norge AS (former Poyry Energy AS) Enr 11/12 120.8 19.2 13 42.8 Håkon Dragsund
RiF 20 22 HolteConsulting AS PM,CE,Enr 11 117.0 97.5 65 47.8 Trygve Sagen
21 19Kongsberg Devotek AS (partly owned by Semcon, Swe)
i 11 115.6 103.8 100 46.2 Per Håvard Kleven
RiF 22 25 ViaNova Plan og Trafikk AS CE,PM 11 108.1 84.9 55 50.9 Per SkotteRiF 23 20 Dr. techn. olav olsen A.S CE, Enr,Env, 11 103.1 101.5 75 48.7 olav weiderRiF 24 36 Høyer Finseth AS (former A.L. Høyer AS) PM, CE 11 98.7 53.6 85 52.1 Aashild BaasenRiF 25 21 Barlindhaug Consult AS MD 11 98.5 97.6 89 46.5 Arnor J. Jensen RiF 26 23 Erichsen & Horgen A/S M 11 97.9 94.5 96 53.8 Leif Øie
27 24 Teleplan Consulting AS E 11 97.2 91.5 45 47.9 Mette Solstrand28 34 Eliassen og Lambertz-Nilssen Ark. AS A 11 87.4 54.6 28 39.0 Borghild Marie Rambech
RiF 29 ViaNova Systems AS CE,M,E 11 87.4 87.4 56 47.7 Merete Tøndel30 33 ECT AS E,PM 11 67.0 55.1 72 33.2 Jan Henning Quist31 29 Niels Torp AS Arkitekter A 11 65.2 59.6 51 39.2 Niels A. Torp32 27 Rambøll oil & Gas AS (dt Ramböll Danmark) Enr,i 11 62.8 78.1 50 28.5 Gro M Baade-Mathiesen33 37 Lpo Arkitekter As A 11 59.5 53.1 51 28.8 Ørjan Høyer-Farstad34 30 Kåre Hagen konsernen PM 11 57.7 59.5 57 21.9 Hans Hagby35 31 BGo Arkitekter AS A 11 56.0 57.3 51 25.7 Sverre Svendsen36 32 Bgo og Medplan AS arkitekter A 11 56.0 57.3 48 25.7 Randi Mandt37 39 Lund Hagem Arkitekter AS A 11 50.8 45.3 42 19.4 Svein Lund38 38 Hille Melbye Arkitekter AS A,PM 11 50.5 50.2 41 16.5 Melvin Eiesland
RiF 39 40 RG-prosjekt AS CE,Env, PM 11 48.3 43.5 40 19.4 Atle Jørund RomstadRiF 40 42 Dimensjon Rådgivning AS Env, CE, PM 11 47.2 39.4 34 19.0 Jon Halvar Eiane
41 46 Lund & Slaatto Arkitekter AS A 11 46.2 35.6 39 20.2 Pål Biørnstad42 48 HRTB AS (Arkitekter) A 11 45.9 34.9 28 25.3 ola Mowe 43 45 Arcasa Arkitekter AS A 11 44.8 35.7 32 21.1 Per Erik Martinussen
RiF 44 41 Sjåtil & Fornæss AS CE,A,PM 11 42.9 41.4 37 15.9 Dag FornaessRiF 45 55 Nordplan AS CE,A 11 42.5 31.2 42 16.7 ivar Bjarte NordRiF 46 47 Brekke & Strand AS Env 11 41.4 34.9 32 19.3 ingjerd Elise Aaraas
47 43 Arkitektfirmaet C.F. Møller Norge AS A 11 40.6 39.2 35 14.0 Christian Kaare Dahle48 53 AMB Arkitekter AS A 11 37.5 32.4 37 16.1 Michael Bowe49 52 Arkitektkontoret Børve og Borchsenius A, PM,CE 11 36.9 33.6 31 20.7 Jan olav Horgmo50 49 Solem Arkitektur AS A 11 36.3 34.6 35 19.9 Roger Snustad51 56 Poyry Forest industry AS i 11 35.4 31.2 36 14.1 Espen Christian Huth
RiF 52 54 Bygganalyse AS PM 11 34.3 32.1 26 20.1 Frank Henry Roberg 53 51 Arkitekterne Astrup & Hellern AS A 11 33.0 33.6 28 19.2 Åke Letting54 79 4B Arkitekter AS A 11 32.7 22.7 26 14.9 ole Stoveland
RiF 55 60 ingeniør Per Rasmussen AS E 11 32.3 28.3 20 17.6 Per H. Rasmussen56 58 Solheim + Jacobsen Arkitekter AS A 11 31.7 28.8 34 16.9 Anne Sudbø
RiF 57 61 Prosjektutvikling Midt-Norge AS PM,CE,E,M 11 31.3 28.2 25 12.8 odd J. Tillerli58 159 PiR ii architects AS * (proforma) A 11 31.2 11.7 34 8.7 Hanne Marit Rimer59 82 Dyrvik Arkitekter A/S A 11 30.7 21.5 37 10.7 Halvor Bergan
RiF 60 50 PABAS ingeniør P.A. Bakkejord A.S CE,PM,A 11 30.7 33.8 14 15.5 Ketil Bakkejord61 57 Rambøll Arkitekter AS A 10 30.1 30.1 31 16.1 ingeborg Hovland62 62 industriConsult AS i,MD 11 29.7 27.9 17 18.0 Jörgen Andersen63 65 Abo Plan & Arkitektur As A 11 29.6 27.3 23 18.0 Lars Christensen64 59 Techni AS i 11 29.3 28.5 35 13.2 Torun Degnes65 84 ingeniørfirmaet Malnes og Endresen AS E 11 29.3 21.4 24 10.4 Roger Malnes66 80 Heggelund & Koxvold AS A, PM 11 28.3 22.6 31 14.2 Jon Heggelund
Turn average Tot. Balance annual over (Previous number of sheet ceo/managing director 11/12 10/11 Group Services report mdkk year) employees mdkk (december 2012)
RIF = Member of RIF, the Association of Consulting Engineers, Norway (*) = lack of conforming figure/proforma/assumed – = missing figure PM = Project Management, A = Architecture, CE = Civil/Structural Engineering, Env = Environment, Enr = Energy, E = Electrical,M = Mechanical/HEVAC, I = Industrial, MD = Multi Disciplinary

38 Sector Review • The Swedish Federation of Consulting Engineers and Architects • December 2012
THE NoRwEGiEN MARKET
key business ratio 30 largest groups (previous year))
Turnover per employee NoK 1 230k NOK 1 222kProfit after financial items per employee NoK 81k NOK 81kBalance sheet total per employee NoK 568k NOK 582k
The turnover for the 30 largest groups increased by 17.8 % to approximately NoK 13 189 million (NoK 11 208 million in 2010). Using the same method of calculation, the average number of employees grew by 16.9 % to 10 726 (9175). The profit before tax was NoK 81k per employee (same as the previous year). The profit margin for the 30 largest groups in 2011 thereby remained unchanged, at 6.6 %.
Generally speaking, it is risky business making direct comparisons between key business ratios for the largest firms and corresponding figures for the medium and small-sized firms. in the case of the latter firms, the extensive efforts of the often many partners has a relatively significant impact on the companies’ turnover and profit level per employee.
For firms 31-100 in the above list, turnover in 2011 increased by 7 % to approximately NoK 2 668 million (NoK 2 117 million in 2010). The number of employees fell marginally to 1 919 (1 934). The turnover per employee consequently increased to NoK 1 182k (NoK 1 095 k). The profit before tax increased to NoK 129k per employee (NoK 93k). Calculated in terms of profit margin, this gives 10.9 % (8.5%). The average balance per employee was approximately NoK 557k (NoK 524k).
67 75 Voll Arkitekter AS A 11 28.0 23.8 26 11.6 Sigbjørn Berstad68 109 Hus Arkitekter Trondheim AS A 11 27.8 16.5 20 19.2 Tom Forsberg
RiF 69 63 Planstyring AS PM, CE 11 27.8 27.8 28 12.4 Reidar Grande70 71 PKA - Per Knudsen Arkitektkontor AS A 11 27.0 25.3 31 11.7 Reidar Klegseth71 69 Halvorsen & Reine AS (Arkitekterne ) A 11 26.8 26.0 21 19.9 Kjell Reine
RiF 72 87 Siv.ing Stener Sørensen AS CE 11 26.3 20.9 22 15.7 Bo Gunsell73 83 Arkitektkontoret GASA AS A 11 26.2 21.5 19 7.8 Martin Baggerud
RiF 74 77 Karl Knudsen As PM, CE 11 25.9 23.5 16 12.3 Arnstien Garli75 66 L2 Arkitekter AS (former Lunde & Løvseth
arkitekter A/S ) A 11 25.8 27.1 18 12.6 Jon FlatebøRiF 76 93 Unionconsult Boro Vvs og Miljø As M 11 25.6 19.8 20 16.1 odd Einar AndersenRiF 77 90 SBV Consult AS CE 11 25.5 20.3 21 14.7 Per Arne SögårdRiF 78 76 Stærk & Co as PM 11 25.1 23.6 26 12.7 Jan LindlandRiF 79 78 ViaNova Kristiansand AS CE 11 24.8 22.8 15 8.6 Trygve Håland
80 73 Space Group Arkitekter A/S A 10 24.7 24.7 18 19.1 Gary Bates81 86 Meinich Arkitekter AS A 11 24.3 21.0 18 9.0 Kristian Fodstad82 67 Arkitektgruppen CUBUS A/S A 11 24.0 26.5 23 8.5 Erik wald-Jacobsen
RiF 83 85 Artec Prosjekt Team As CE, PM 11 23.7 21.1 26 9.1 Per Steffen Reigstad 84 110 Enerhaugen Arkitektkontor As A 11 23.1 16.5 25 10.1 Bente Nygård85 95 ØKAw AS Arkitekter A 11 23.0 19.7 25 11.4 oystein Mitdbö86 133 Spor Arkitekter AS A 11 22.9 14.1 16 10.2 Aashild Maurissen
RiF 87 89 ElectroNova AS E 11 22.3 20.6 17 16.0 Trond Einar KristiansenRiF 88 94 Sinus AS CE, Env 11 22.3 19.8 19 9.9 Tønnes Andreas ognedal
89 91 Kristiansen & Bernhardt Arkitektur interiør AS A 11 22.2 20.2 27 9.9 Thorvald Veire BernhardtRiF 90 68 itech AS M,E 11 22.2 26.4 14 9.0 Håvard olsen wiger
91 105 Kristin Jarmund Arkitekter AS A 11 22.1 17.1 16 9.1 Kristin Jarmund92 96 Eggen Arkitekter AS A 11 22.0 19.5 22 13.9 iver Corneil93 123 LoF Arkitekter AS A 11 21.0 14.6 18 9.0 Sverre Jorgen olsen94 130 Dyrø og Moen AS A 11 21.0 14.3 17 11.9 Lars olav Moen
RiF 95 128 CoNova AS CE 11 20.0 14.4 11 10.8 Arne H. wintherRiF 96 Løvlien Georåd AS CE, PM 11 19.9 16.9 9 9.0 Per Løvlien
97 92 ottar Arkitekter AS A 11 19.4 20.1 16 8.5 Geir Egil Paulsen98 139 Arkitektkontoret Vest AS (Arkvest) A 11 19.3 13.9 18 9.8 Åshild Slettebo
RiF 99 T-2 Prosjekt AS CE 11 19.0 22.7 7 7.4 Magne olav TorsæterRiF 100 102 Roar Jørgensen AS PM,CE 11 18.2 18.4 20 7.6 John Dæhli
92 93 94 95 96 97 98 99 00 01 02 0403
kNOK
600
700
500
400
300
200
100
kNOK
60
70
50
40
30
20
10
800 80
900 90
1,000 100
05 06 07 09
1,100 110
08 10 11
1,200 120
Turnover/employeeBalance Sheet total/employee Result after �nancial items/employees
0
1
2
3
4
5
6
7
8
9
%10
0302010099989796959493 04 05 06 07 08 09 10 11
Turn average Tot. Balance annual over (Previous number of sheet ceo/managing director 11/12 10/11 Group Services report mdkk year) employees mdkk (december 2012)
The top 30 norwegian groups result margins

39Sector Review • The Swedish Federation of Consulting Engineers and Architects • December 2012
The association of consulting engineers, FrVThe Association of Consulting Engineers (FRV) is the trade and employers’ organi-zation for consulting engineering firms in iceland. FRV is a negotiating body that engages in negotiations with engineer-ing and technicians’ labor unions. FRV’s member firms number 24 with a total of around 1100 employees. FRV represents about 85 % of the available resources in the sector. FRV aims to support its member firms by contributing to the improvement of its members’ general business and working conditions and by improving the profile of the industry and its recognition in general. FRV attempts to increase the visibility of engineering consultants and keep attention focused on the importance of good consul-tancy and quality design.
FRV is working to improve the working con-ditions of engineering consultants by having influence on standard agreement terms, insurance, etc., as well as disseminating information to the member companies.
FRV is a member of FiDiC (Fédération inter-nationale des ingénieurs-Conseils).
Magnús Baldursson, FRV
The Trade and employers’ organisation for architectural Firms, FSSaFSSA is the trade and employers’ organiza-tion for architectural firms in iceland. FSSA is a negotiating body that engages in ne-gotiations with the architects’ labor union. FSSA’s member firms number 28. FSSA represents about 80 % of the available resources in the sector.
FSSA’s aim is to support its member firms by contributing to the improvement of its members’ general business, increase the visibility of the member firms and improve the profile of the industry and its recognition in general.
FSSA works in close relation with FRV. The Associations share office space and FRV services the Association on a daily basis.
FSSA’s Address: Engjateigur 9 iS-105 Reykjavik iceland
Tel: +354 553 4200Fax: +354 553 9480E-mail: [email protected] www.fssa.is
FRV’s Address: Engjateigur 9 iS-105 Reykjavik iceland
Tel: +354 553 4200Fax: +354 553 9480E-mail: [email protected] www.frv.is
THE iCELANDiC MARKET
The icelandic market
Icelandic consultancy firms have adapted to changed circumstances in the last four years. Many of them have pursued new markets abroad and some have had positive results. The turnover from engineering consultancy abroad has increased considerably the last several years – from being 3-5 % of total turnover to about 11-12 % of total turnover in 2011. Some of the firms receive up to 1/3 of their income from abroad. Norway has been the biggest contributor in this respect.
There are no comparable figures for architecture firms. It is evident that the recession has not affected the larger engineering consultancy firms as much as the smaller ones. This outcome can probably be attributed to the larger companies providing consultancy in the field of industry and energy production more than the smaller firms. Projects have been on-going in heavy industry even though they have been slowed down because of general global reces-
either the private or the public sector in the last four years.
It is predicted that the general building industry will gain some momentum in 2013, but it will be a slow recovery. A survey conducted by FSSA amongst its member companies in October 2012 showed that 55 % of the firms pursued work in other markets than the domes-tic, but these firms do not see signifi-cant increase in their foreign income in 2013. 36 % of the firms foresee down-sizing over the next six months. Only 27 % of the firms believe that the market situation will improve in 2013.
The engineering companies Verkís and Almenna verkfræðistofan have decided to merge. Verkis is the second biggest engineering firm in Iceland with 310 employees and Almenna verkfræðistofan is a medium sized firm with 60 employ-ees. The merger is being evaluated by the competition authorities and hope-fully their decision will be known in the early months of 2013.
The design of a new hospital in Reykja-vik is in its final stages. A new prison building near Reykjavík will be on the
sion. Rio Tinto Alcan, owner of the aluminum smelter in Straumsvík, has for example in the last four years, from 2009–2012, purchased design and con-sultancy work from Icelandic engineer-ing firms for 11 billion Icelandic króna.
On average the recession has been worse for the architecture firms in Iceland than the engineering firms since the general building and infrastructure industry has been nearly at a standstill. There has not been much investment and build-up in

40 Sector Review • The Swedish Federation of Consulting Engineers and Architects • December 2012
THE iCELANDiC MARKET
drawing board in 2013 and some other smaller public projects. Both Mannvit and Verkís, are designing two geo-thermal power stations in Northeast Iceland, each of them 90 MW for the state owned Landsvirkjun. They also are both on the design team for the new prison building with the architectural firm Arkís.
Verkís with Landsvirkjun Power are working on hydro power plants in Georgia. EFLA is working on number of projects in Norway as is Almenna verkfræðistofan, and VSÓ Ráðgjöf. The architectural firms are also seeking work on foreign soil. Many of them are look-ing at the Nordic market and the Baltic countries. Arkís has for example projects in Vilnius. Batteríið has several projects in Sweden and Norway and the com-pany now has 90 % of it´s income from abroad. Many other architectural firms now have permits to offer their services in these countries.
This focus on foreign markets has had a positive influence on the sector. Although seeking work abroad is costly compared to working on the domestic market, this has in many cases helped the firms maintain their staff and know-how.
operating performance of FRV’s member companies in 2011According to a survey carried out by FRV the total turnover for 2011 can be
estimated MISK 14.492, a significant increase from the year before and also higher than in 2005. The average profit among member firms is 8 % of turnover for 2011, as opposed to 5,4 % in 2010. No similar survey is made by FSSA for the architecture firms.
Economic growth in Iceland reached 2.6 % in 2011 due to increasing private consumption as well as investment. The forecast for 2012–2017 made by Icelandic Statistics assumes that gradual economic recovery will continue with 2.7 % growth in 2012. Positive growth is expected over the next years, although changes to the planned large scale in-dustrial investments may affect the fore-cast. Economic growth will be driven by investment and consumption.
Inflation increased during the second half of 2011 caused by increases in services and commodity prices as well as salary increases. The rate of inflation is expected to be 5.3 % on average in 2012 and 4.1 % in 2013. The Icelandic króna is expected to be somewhat stable dur-ing the forecast period.
The price of Iceland’s main export goods, aluminum and fish, increased during 2010 and 2011. This year the price of Icelandic fish products has remained high but the price of Icelan-dic aluminum decreased. A surplus in trade is expected in coming years. Even though the economic outlook for the Euro area has worsened it is not expect-
ed to have a major impact on Iceland’s terms of trade.
Unemployment is still historically high, 7.4 % in 2011, predicted to be below 6 % in 2012 and to decline as economic recovery continues and to be below 5 % by 2014. Wages are expected to increase faster than inflation, thus generating positive growth in real disposable income. Consequently private consump-tion is expected to grow during the forecast period. Public consumption will still decline in 2012 and is forecast to grow very little in real terms during next years. Public investment will also decline in 2012 but start to grow from 2013.
Iceland has applied for membership to the European Union and discussions are undergoing. If an agreement is reached between the EU and Iceland there will be a national referendum on the issue. It is a very controversial issue and the nation is divided, as could be expected. The referendum could be in about one or two years time if everything goes as planned. Whether Iceland becomes a member of the EU or not the govern-ment has to establish a policy regarding Iceland’s currency. The Krona is now sheltered by capital controls (restrictions on capital movements). The current plan is to liberalize capital movements in the near future but that seems to be un-likely to happen over the next few years.
Magnús Baldursson, FRV
ProfitTotal turnover (estimated)
FrV memberfirms
0
2
4
6
8
10
12
14
16
1110090807060504
%
0
2000
4000
6000
8000
10000
12000
14000
16000
18000
1110090807060504
MISK
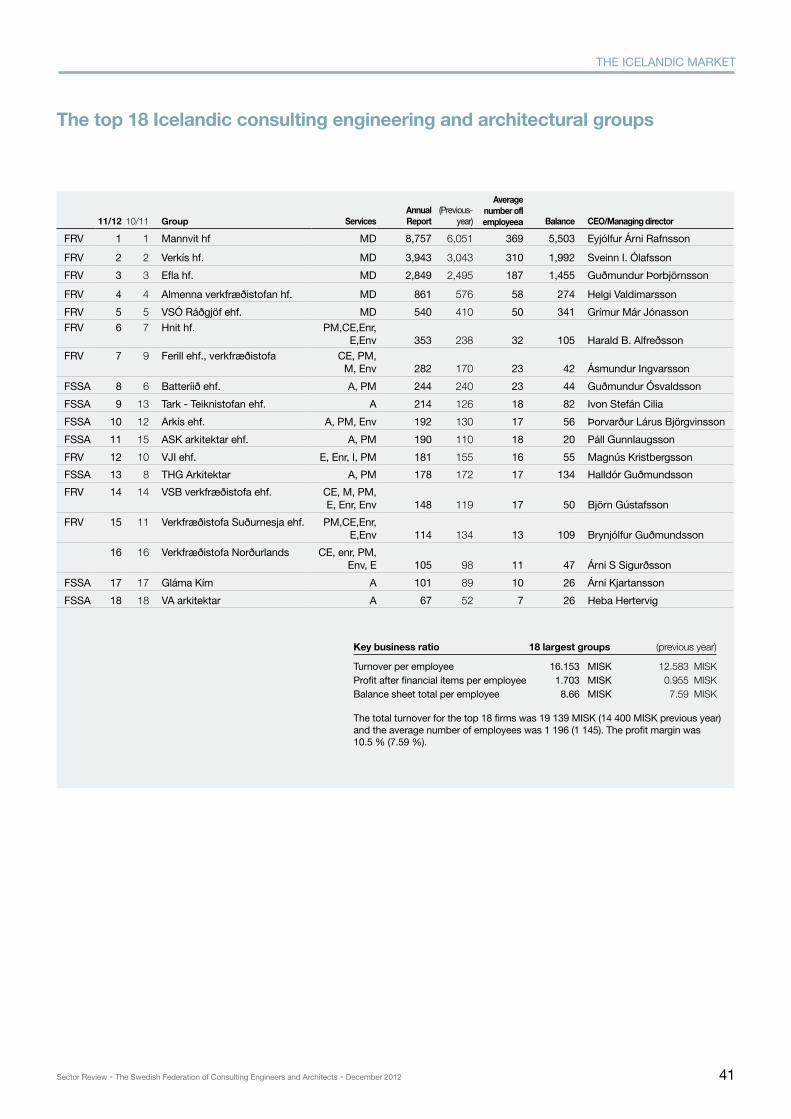
41Sector Review • The Swedish Federation of Consulting Engineers and Architects • December 2012
THE iCELANDiC MARKET
key business ratio 18 largest groups (previous year)
Turnover per employee 16.153 MiSK 12.583 mISKProfit after financial items per employee 1.703 MiSK 0.955 mISKBalance sheet total per employee 8.66 MiSK 7.59 mISK
The total turnover for the top 18 firms was 19 139 MiSK (14 400 MiSK previous year) and the average number of employees was 1 196 (1 145). The profit margin was 10.5 % (7.59 %).
The top 18 icelandic consulting engineering and architectural groups
11/12 10/11 Group Servicesannualreport
(Previous- year)
averagenumber ofl employeea Balance ceo/managing director
FRV 1 1 Mannvit hf MD 8,757 6,051 369 5,503 Eyjólfur Árni Rafnsson
FRV 2 2 Verkís hf. MD 3,943 3,043 310 1,992 Sveinn i. Ólafsson
FRV 3 3 Efla hf. MD 2,849 2,495 187 1,455 Guðmundur Þorbjörnsson
FRV 4 4 Almenna verkfræðistofan hf. MD 861 576 58 274 Helgi Valdimarsson
FRV 5 5 VSÓ Ráðgjöf ehf. MD 540 410 50 341 Grímur Már JónassonFRV 6 7 Hnit hf. PM,CE,Enr,
E,Env 353 238 32 105 Harald B. AlfreðssonFRV 7 9 Ferill ehf., verkfræðistofa CE, PM,
M, Env 282 170 23 42 Ásmundur ingvarsson
FSSA 8 6 Batteríið ehf. A, PM 244 240 23 44 Guðmundur Ósvaldsson
FSSA 9 13 Tark - Teiknistofan ehf. A 214 126 18 82 ivon Stefán Cilia
FSSA 10 12 Arkís ehf. A, PM, Env 192 130 17 56 Þorvarður Lárus Björgvinsson
FSSA 11 15 ASK arkitektar ehf. A, PM 190 110 18 20 Páll Gunnlaugsson
FRV 12 10 VJi ehf. E, Enr, i, PM 181 155 16 55 Magnús Kristbergsson
FSSA 13 8 THG Arkitektar A, PM 178 172 17 134 Halldór Guðmundsson
FRV 14 14 VSB verkfræðistofa ehf. CE, M, PM, E, Enr, Env 148 119 17 50 Björn Gústafsson
FRV 15 11 Verkfræðistofa Suðurnesja ehf. PM,CE,Enr, E,Env 114 134 13 109 Brynjólfur Guðmundsson
16 16 Verkfræðistofa Norðurlands CE, enr, PM, Env, E 105 98 11 47 Árni S Sigurðsson
FSSA 17 17 Gláma Kím A 101 89 10 26 Árni Kjartansson
FSSA 18 18 VA arkitektar A 67 52 7 26 Heba Hertervig

42 Sector Review • The Swedish Federation of Consulting Engineers and Architects • December 2012
THE FiNNiSH MARKET
Timo Myllys, SKoL
The Finnish association of consulting Firms Skol in brief
SKoL is the industry and employers’ organization for independent and private consulting firms. SKoL has 206 member companies, which are mainly consulting engineering firms, although they also include a certain number of management consulting and architectural firms. The member firms have approximately14 200 employees in Finland and their foreign subsidiaries employ some 8000 people abroad. Many SKoL members belong to international groups, which together employ some 50 000 staff globally.
SKoL promotes professional and independent consulting engineering, improves the preconditions for consulting and monitors the interests of the member firms in both Finland and abroad.
The strategic themes of the SKoL action plan are:
■ SKoL members have skilled, educated and developing resources.
■ The SKoL sector is visible, appreciated and has a good image.
■ Consulting engineering markets are functional and competition is fair.
■ Labour markets and conditions are flexible and encouraging.
■ SKoL member firms are competitive, progressive and profitable.
During the action plan period 2011-2013, SKoL aims to:
■ strengthen the operating conditions of SKoL members
■ invest in knowledge, responsibility and customer value in communications within the consulting sector
■ support the renewal of member firms and the sector as a whole
■ help predict future challenges and opportunities
SKoL capacity represents over half the total consulting engineering capacity in Finland. Currently, the annual invoicing of SKoL’s member firms in Finland amounts to approximately EUR 1 200 million. Building-construction accounts for 43 %, municipal engineering for 27 %, and industrial projects for 30 % of the member firms’ domestic turnover. Some 20 % of the turnover comes from foreign operations. Finnish consulting engineers have references in more than 130 countries in all continents.
Personnel in SKoL member companies have a high level of education, and some 70 % of all personnel in the member firms have a university or technical college degree. The 25 largest companies with over 100 employees have a total staff of 11 300 employees, another 21 medium-size companies with
30-100 employees have a staff of 1100 and 160 small-sized companies with less than 30 staff employ another 1 800 employees.
Address: P.o. Box 10 (Eteläranta 10) FiN-00131 Helsinki
Tel: +358 9 19 231Fax: +358 9 624 462E-mail: [email protected] www.skolry.fi
Growth for Skol members in domestic market 2011
The results in turnover among SKOL member firms in 2011 show 5 % growth compared to 2010. The number of staff employed by SKOL member companies totalled 14 200 in spring 2012, which is 4 % more than the year before.
The total turnover of SKOL member firms in 2011 was EUR 1 210 million. The total invoicing in the industrial sector grew by 13 %, in the building design sector the growth was 2 % and in the infrastructural sector 5 %. Both the industrial sector and the building construction sector accounted for 36 %, the infrastructural sector for 24 % and the other sectors for 4 % of the overall invoicing by SKOL member firms.
Domestic turnover amounted to EUR 980 million, which represented an increase of 9 %. In the industrial sector, domestic volume grew by 23 %, in the building sector by 5 % and only by 1 % in infrastructural engineering.
The financial results achieved by SKOL member firms underwent a major downturn in 2009 and remained at the same low level throughout 2010 and 2011. Last year, the average profit level among SKOL member firms was 4.0 %
and the operating margin ratio 7.2 %. The overall result was mainly held down by the growing salary expenses as well as the decrease in financial income.
Russia, China and 120 other countries for export The foreign turnover of SKOL mem-ber firms was EUR 230 million, which represented a decrease of 8 % compared with the year before. Foreign invoicing increased by 30 % in the infrastructure sector, but fell by 30 % in building de-sign and 3 % in industrial engineering.
The major exporters were industrial engineering firms, which invoiced EUR 150 million representing a 65 % share of the total. Building engineering firms worked on projects abroad worth EUR 21 million and civil engineering projects worth EUR 44 million. The remaining foreign income, EUR 15 million, came from development projects in education, health, the social sector and other areas.

43Sector Review • The Swedish Federation of Consulting Engineers and Architects • December 2012
THE FiNNiSH MARKET
The top 10 target countries for Finnish consulting exports in 2011 were Russia, China, Uruguay, Sweden, Estonia, Poland, Great Britain, The Netherlands, Norway and Nepal. Finnish design pro-jects were conducted in a total of 122 countries last year.
in Finland, GDP growth remains at 0.5 % in 2012 The Euro crisis escalated in the summer of 2012 and the global economic recov-ery has been delayed. Finland’s GDP will grow by 0.5 % in 2012 but is next year forecasted to growe by 1 % due to weak exports and low consumption. The unemployment rate will be 7.7 % in 2012 and is forecast to be 8.0 % in 2013.
The total volume of other new build-ing construction in Finland is expected to decrease in 2013. It is predicted that construction work will only start on a limited number of new commercial and business premises during the year. In the future, industrial construction will focus on energy production. New housing builds in 2013 are estimated to remain at the current level. A continued steady rise in the volume of renovation work is expected.
The total volume of infrastructure construction is not anticipated to grow either this year or in 2013. A potential upswing is prevented by factors such as slow economic growth and the financial challenges in the public sector. Rising input costs are expected to cut down basic transport infrastructure mainte-nance and further weaken the condition of roads.
The demand for special contracting in infrastructure construction is being retained at a good level by underground urban construction, demanding city-centre projects and new mining projects. The demand for building repair works is also estimated to be good, although competition is tightening significantly.
Consulting market outlook for 2013 worrying SKOL member firms see the market situation deteriorating due to the con-tinuing decrease in domestic investment in building construction and infrastruc-
ture. Industrial engineering firms are, in addition, also worried about a potential reduction in export projects.
SKOL´s trend report in October 2012 shows that new orders received by infra-structure engineering companies have been subject to continuous decline over the past 18 months. Industrial engineer-ing projects have decreased in terms of exports. To date, building design com-panies have a large volume of orders in hand, due more to domestic renovation works than to new building works.
The total volume of orders in hand among SKOL member firms in October 2012 is on average at almost the same 6-month level as it was a year ago, but expectations for the coming year are worrying. Increased price competition, particularly in public procurement, has slowed down the development of incoming orders and weakened profit-ability.
The share of export turnover has de-clined. Export orders accounted for only a third of the volume of industrial engi-neering orders in hand, compared with a long-term average level of exports of over 50 %. Furthermore, the export vol-ume for building design has decreased and now only accounts for 3 per cent of the orders in hand. Some firms never-theless see a certain potential for growth in building exports to Russia.
Despite the concern, the personnel of SKOL member firms have increased in number by 3 % during the first half of the year and growth is expected to continue at a rate of 2 % over the next 6-month period. Some of the member firms have a shortage of engineers, espe-cially in building services and structural design.
Timo Myllys, SKOL

44 Sector Review • The Swedish Federation of Consulting Engineers and Architects • December 2012
aTl in briefThe Association of Finnish Architects’ offices (ATL) is an independent organization monitoring and promoting the interests of the architectural industry. its mission is to develop architectural services and thus improve the quality of construction and the environment. The professional membership requirements of the association are strict.
An ATL member office is professional. To be accepted as a member, the management of the office must have the highest professional architectural training and solid experience of working in the industry. The management is required to work on a full-time basis in the fields of planning, design or related consultation.
Experience is an important quality for an ATL member office, and prior to applying for membership, the office is expected to have provided independent design and consultation services for a minimum of three years. To further guarantee professional competence, the senior designers of the company must have a
minimum of seven years’ experience in the field.
An ATL member office is committed, and key personnel are required to own a majority of the firm and hold managerial positions.
Construction has become an increasingly complicated industry, with the need to meet increasingly demanding challenges. Because of the long supply chains securing the quality of the end result requires intensive effort. This is why competent leadership is vital for construction and building design. The member firms of the Association of Finnish Architects’ offices have demonstrated through their training, experience and professional ethics that they have the necessary competence and resources to meet these new challenges.
Construction and building design require skilled and professional management.
The average size of an ATL member firm is 7.5 employees. it is fairly normal for offices to have more than one partner – the average number being two partners per office. 150 of the offices have more than one partner.
Vesa Juola, ATL
THE FiNNiSH MARKET
overview of the market in 2012 for architectural design in Finland
Focus on residential building design and the construction of public buildings. Export is growing.
Approximately 1 900 persons were employed by the 250 member firms of the Association of Finnish Architects’ Offices (ATL) at the end of 2012. The turnover generated by the member offices in Finland in 2011 grew by over 13 % during the year to EUR 159.7 million. Domestic turnover was EUR 150.4 million, which represented an increase of 13 %. The best invoicing fields are; public construction 35 %, commercial construction 27 % and apartment construction 22 %.
ATL in in figures: Number of member firms: 250Number of people employed by member firms: 1366 employees + 504 partners = totally 1870 Total invoicing in 2011: EUR 159.7 million
Address: Runeberginkatu 5 FiN - 00100 HelsinkiTel: +358 9 5844 4218Email: [email protected] www.atl.fi
The Confederation of Finnish Construc-tion Industries, RT, estimates that the growth is now over and that in 2013 the construction industry will decrease in size by 3 %. Also, Statistics Finland reports that the cubic volume covered by granted building permits fell by 18 % in the third quarter of 2012 compared with last year. According to the prelimi-nary data on building and dwelling pro-duction, over the period July-September 2012 building permits were granted
for a total of 7.3 million cubic metres, which is 17.7 % less than a year ago. The cubic volume covered by permits granted for residential buildings fell by 9.7 % over the same period.
The volume of new builds in 2012 is ex-pected to decrease from 38.0 million m3 to 33.5 million m3. In 2013, the de-crease is expected to continue down to 33.0 million m3.
Zero growth is anticipated in residential buildings and public buildings. The cur-
rent level of activity in construction is estimated to decrease by 1 %.
Housing production has for the past few years been the major driving force sustaining financial performance by architects’ offices. Because the housing production forecasts are bleaker than before, the architects have to rethink their position in the design markets. This is despite the fact that there is still quite a high level of construction because of the demands in connection with renovation works, energy efficiency projects, migration and demographic changes.
The form and development of architec-turally-related business activities, are to a wide extent dependent on the economy. When business thrives, buildings are constructed in large numbers at great speed, and in this situation hardly any-one has time to develop. An economic downturn, however, makes it necessary to reconsider matters, and it is often in a recession that architecture and ways of conducting business are renewed. For example, the origins of the currently popular interest in timber construction can be traced back to the slump in the early 1990s.
Vesa Juola, ATL

45Sector Review • The Swedish Federation of Consulting Engineers and Architects • December 2012
de 100 största finska arkitekt-, teknikkonsult- och industrikonsultkoncernerna
SKoL 1 1 Pöyry Group MD 11 796.1 682.6 6,952 641.6 Alexis Fries2 2 inspecta oy i 11 169.0 150.0 1,369 Kari Aulasmaa
SKoL 3 8SwECo Group (acquired FMC Group, Feb-12) proforma i,MD 11 123.0 38.8 1,500 71.0 Kari Harsunen, Markku Varis
SKoL 4 3 Etteplan oy i 11 119.5 106.0 1,659 65.6 Juha Näkki
SKoL 5 4Ramböll Finland (acquired Magnus Malmberg oy)
MD 11 88.9 84.1 1,286 Markku Moilanen
SKoL 6 5 Neste Jacobs group i 11 76.7 74.1 584 45.5 Jarmo SuominenSKoL 7 6 FCG Finnish Consulting Group MD 11 50.3 66.6 660 33.0 Ari KolehmainenSKoL 8 17 Elomatic Group oy i, MD 11 38.0 27.3 512 olli MannerSKoL 9 13 Vahanen Group oy CE 11 33.2 29.5 455 Veijo KomulainenSKoL 10 18 A-insinöörit Group S,CE, PM 11 30.8 25.5 341 Petri LaurikkaSKoL 11 11 Citec Group (proforma) i, Env 11 30.5 22.5 270 24.3 Martin StrandSKoL 12 9 Destia Consulting CE 11 30.0 35.0 317 Jukka RaudasojaSKoL 13 16 ÅF Consult Finland i, Enr 11 27.6 27.5 205 21.2 Jari Leskinen SKoL 14 12 wSP Finland MD 11 27.0 30.0 342 11.1 Kirsi HautalaSKoL 15 10 SiTo Group oy CE, Env, PM 11 26.5 30.6 354 Kimmo FischerSKoL 16 15 Granlund oy E,M 11 22.6 28.0 350 15.1 Pekka MetsiSKoL 17 19 Dekra industrial oy Enr 11 22.2 19.6 197 10.4 Matti AnderssonSKoL 18 20 Rejlers Finland oy i, E, M, Env 11 21.7 17.6 297 Seppo SorriSKoL 19 14 Deltamarin oy i 11 21.0 28.6 252 11.6 Mika Laurilehto
20 22 insinööritoimisto Comatec Group i, PM 11 20.9 16.7 293 10.7 Aulis AsikainenSKoL 21 25 FM-international oy CE 11 15.5 9.7 33 Timo SääskiSKoL 22 21 iSS Proko Group MD 11 15.2 16.6 154 7.3 Harri Väänänen, Ari TuuttiSKoL 23 26 CTS Engtec oy i,CE 11 13.1 9.5 152 5.4 Antti Lukka SKoL 24 23 Suomen Talokeskus oy MD 11 13.0 12.7 163 14.5 Karri Virtanen
25 24 Raksystems oy PM, CE, S 11 11.4 10.2 100 3.6 Marko MalmivaaraSKoL 26 27 Ahma insinöörit oy PM 11 11.1 9.0 98 Jyri MäkeläSKoL 27 28 optiplan oy MD 11 10.3 8.9 151 5.3 Tommi VaisaloSKoL 28 29 Protacon koncernen oy i, E, PM 11 8.6 8.0 86 Kari PellinenSKoL 29 30 indufor oy i 11 7.8 7.7 25 Suvi AntillaSKoL 30 31 Projectus Team oy E,M 11 7.8 7.1 101 Juha PihlajamäkiSKoL/ATL 31 33 innovarch Architects oy A 11 7.0 5.8 68 Jukka KautoSKoL 32 43 NiRAS Finland oy (NiRAS Group A/S) Env 11 6.9 4.2 24 Tor LundströmSKoL 33 40 oy omnitele AB PM(tele) 11 6.1 4.5 45 3.4 Tomi PaatsilaSKoL 34 37 AX-Konsultit oy Env,Enr,i,E,M 11 6.0 4.8 76 Urpo KoivulaSKoL 35 34 Rakennuttajatoimisto HTJ oy PM 11 5.9 4.9 54 2.4 Martti ReijonenSKoL 36 32 Golder Associates oy CE,Env 11 5.8 6.4 54 2.6 Kim BranderSKoL 37 38 Rapal oy PM 11 5.7 4.6 50 3.2 Tuomas KaarlehtoATL 38 42 Arkkitehtitoimisto Pekka Helin & Co oy A 11 5.6 4.4 70 Pekka HelinSKoL 39 41 insinööritoimisto Ylimäki & Tinkanen oY CE 11 5.6 4.5 60 Harri TinkanenSKoL 40 36 Saanio & Riekkola oy CE, Env 11/12 5.1 4.8 49 Reijo RiekkolaATL 41 46 Arkkitehtitoimisto SARC oy A 10/11 5.0 3.3 44 Sarlotta NarjusATL 42 35 Arkkitehtitoimisto Larkas & Laine oy A 11 4.9 4.9 53 Robert TrappSKoL 43 59 TSS Group oy (Atle Group) E 11/12 4.3 2.5 56 2.2 Kari KallioSKoL 44 45 Kontermo oy E,M 11 4.1 3.5 46 Jukka Hyttinen
45 47 insinööritoimisto Enmac oy i 11 4.1 3.2 51 1.5 Juha RitalaSKoL 46 48 Hepacon oy M,E 10/11 3.9 3.2 37 1.7 Matti RemesSKoL 47 49 insinööritoimisto Lausamo oy E 11 3.8 3.2 37 2.3 Timo TenninenSKoL 48 57 YSP-Consulting Engineers oy E,i 11 3.7 2.7 25 3.5 Juha PykälinenSKoL 49 55 Finnmap infra oy CE 11 3.5 2.7 65 3.2 Harri LinnaSKoL 50 39 Chematur Ecoplanning oy i 11 3.1 4.6 10 2.9 Timo Kuusisto
51 53 indepro oy PM, CE 11 3.0 2.8 23 3.0 Seppo KivilaaksoATL 52 52 Pes-Arkkitehdit oy (Pekka Salminen) A 11 2.8 2.8 38 Jarkko SalminenSKoL 53 56 Kalliosuunnittelu oy (Rockplan Ltd) CE 11 2.8 2.7 33 Jarmo RoinistoSKoL 54 51 insinööritoimisto Pontek oy CE 10/11 2.7 2.8 27 2.0 Keijo Saloviin
SKoL 55 60insinööritoimisto Grundteknik (Pohjatekniikka oy) CE 11 2.7 2.5 37 1.4 Seppo Rämö
SKoL 56 61 Contria oy CE 11 2.7 2.5 31 0.6 Tom ErikssonSKoL 57 68 Yhtyneet insinöörit oy Enr,E 11 2.7 2.2 29 1.2 Keijo MäkinenSKoL 58 73 Geopalvelu oy CE 11 2.6 2.1 25 1.4 Toivo Ali-RunkkaSKoL 59 Maveplan oy MD 11 2.6 2.4 36 Mika Mikkola
ATL60 58
Architecture office Sigge Ltd/ Viiva arkkitehtuuri (Arkkitehtitoimisto Sigge oy) A 11 2.6 2.6 46 Pekka Mäki
SKoL 61 54 Hifab oy PM 11 2.5 2.8 11 0.8 Vesa KurkelaSKoL 62 78 Roadscanners oy CE 11 2.5 2.0 21 1.3 Timo SaarenketoSKoL 63 82 Plaana oy Env 11 2.5 1.9 28 1.7 Pekka MosorinATL 64 80 Uki Arkkitehdit oy A 11 2.5 1.9 34 Mikko HeikkinenSKoL 65 71 insinööritoimisto Lauri Mehto oy CE 11 2.4 2.1 23 1.3 Simo-Pekka ValtonenSKoL/ATL 66 75 Eriksson Arkkitehdit oy A 11 2.4 2.1 30 Patrick ErikssonSKoL 67 77 insinööritoimisto Leo Maaskola oy M 11 2.4 2.0 23 1.3 Kari SeitaniemiSKoL 68 90 Geotek oy Env 11 2.4 1.7 38 1.8 Matti Huokuna
Turn average Tot. Balance Verk- annual over (Previous- number of sheet ceo/managing director 11/12 10/11 Group Services report meUr year) employees meUr (december 2012)
SKOL = Member of SKOL, the Finnish Association of Consulting Frms (*) = lack of conforming figure/proforma/assumed – = missing figure PM = Project Management, A = Architecture, CE = Civil/Structural Engineering, Env = Environment, Enr = Energy, E = Electrical,M = Mechanical/HEVAC, I = Industrial, MD = Multi Disciplinary

46 Sector Review • The Swedish Federation of Consulting Engineers and Architects • December 2012
30 largest groups Previous yearkey business ratio (excl. Pöyry) (excl. Pöyry)
Turnover per employee €98.5k (€90.5k) €89.4k (€87.2k)Profit after financial items per employee €3.1k (€2.9k) €3.7k (€2.2k)Balance sheet total per employee €71.3k (€61.4k) €50.6k (€58.4k)
The turnover for the 30 largest groups increased by 23% to approximately €1,889 million (€1,529 million in 2010). Using the same method of calculation, the average number of employees grew by 12 % to 19,185 (17,163). The profit before tax was €3.1k per employee (€2.9k the previous year). The profit margin for the 30 largest groups in 2011 dropped to 3.1 % (5.9 %). The average balance per employee was €71.3k (€48.9k).
Generally speaking, it is risky business making direct comparisons between key business ratios for the largest firms and corresponding figures for the medium and small-sized firms. in the case of the latter firms, the extensive efforts of the often many partners has a relatively significant impact on the companies’ turnover and profit level per employee.
For firms 31-100 in the above list, turnover in 2011 increased by 13 % to approximately €213 million (€213 million in 2010). The number of employees grew by 11 % to 2 275 (2 073). The turnover per employee consequently increased to €94k (€91k). The profit before tax dropped to €10.5k per employee (€11.2k). Calculated in terms of profit margin, this gives 11.3 % (12.3 %). The average balance per employee was approximately €50.6k (€60.6k).
SKoL 69 97 Kva Arkkitehdit oy A, PM 11 2.4 1.6 24 0.9 Jean AnderssonSKoL 70 67 Carement oy CE 11/12 2.4 2.4 33 0.8 Alpo MänttäriATL 71 50 Arkkitehtitoimisto HKP oy A 11 2.4 3.0 22 Mikko SuvistoSKoL 72 69 Asitek oy E 11 2.3 2.2 18 1.4 Rauno MäkeläSKoL 73 63 RAMSE Consulting oy PM 11 2.3 2.4 29 0.8 Jaakko TenniläSKoL 74 72 Geounion oy CE 11 2.3 2.1 30 0.9 Matti MäntysaloATL 75 65 Arkkitehtitoimisto Hannu Jaakkola oy
(Jaakkola Architects) A 11 2.3 2.3 18 Hannu JaakkolaATL 76 88 Arkkitehtitoimisto CJN oy A 11 2.3 1.8 19 Eero ValtialaATL 77 Cederqvist & Jäntti Architects A 11 2.3 1.3 22 1.2 Tom CederqvistSKoL/ATL 78 62 Aihio Arkkitehdit oy A 11 2.2 2.4 26 1.7 Timo MeuronenSKoL 79 64 insinööritoimisto Akukon oy CE 11 2.2 1.9 23 0.6 Ari LepoluotoSKoL 80 83 Arkins Suunnittelu oy M 11 2.2 1.9 26 0.6 Mika KaitonenSKoL 81 87 insinööritoimisto Äyräväinen oy CE 11 2.2 1.8 25 1.2 Mikko ÄyräväinenSKoL 82 LiNK design and development oy i 11 2.2 2.0 36 0.8 Jaakko AnttilaATL 83 111 Schauman Arkkitehdit oy A 11 2.1 1.4 22 Jussi KaikkonenATL 84 Arkkitehtitoimisto Pekka Lukkaroinen oy A 11 2.1 1.4 17 Pekka LukkaroinenATL 85 94 Arkkitehtitoimisto JKMM oy A 11 2.0 1.6 17 Samuli MiettinenSKoL 86 76 insinööritoimisto Srt oy CE 11/12 2.0 1.9 20 1.0 Pauli oksmanSKoL 87 86 insinööritoimisto Tauno Nissinen oy E,Enr 11 2.0 1.8 27 0.7 Antti DanskaSKoL 88 102 insinööritoimisto Controlteam oy PM, CE, S 11 2.0 1.5 22 Petri SeppänenSKoL/ 89 105 Parviainen Arkkitehdit oy A 11 2.0 1.5 25 1.0 Juha PostiSKoL 90 110 Focusplan oy i 11 2.0 1.4 26 0.8 Vesa Ranta SKoL 91 133 Entop oy i 11 2.0 1.6 25 1.5 Kimmo MäättänenATL 92 95 Arkkitehdit NRT oy A 11 1.9 1.6 27 Teemu TuomiSKoL 93 85 ingenjörsbyrå oy Avecon PM, M, CE 11 1.9 1.8 24 0.6 Peter Jakobsson
94 70 K2S Architects A 11 1.9 2.2 20 1.2 Kimmo LintulaATL 95 81 Arkkitehtuuritoimisto B & M oy A 11 1.8 1.9 22 Jussi MuroleATL 96 89 Arkkitehditoimisto Helamaa & Heiskanen oY A 11 1.8 1.8 20 Juha SaarijärviATL 97 108 Arkkitehtitoimisto Ala oy A 11 1.8 1.4 20 Antti NousjokiATL 98 92 Arkkitehtiryhmä A6 oy A 11 1.8 1.7 20 Eija KarimaaATL 99 99 Sisustusarkkitehdit Gullstén & inkinen oy A 11 1.7 1.5 27 Jari inkinenSKoL 100 93 EP-Logistics oy CE, PM, A 11 1.7 1.7 21 0.46 Pekka Korpiharju
THE FiNNiSH MARKET
kEuro
60
70
50
40
30
20
10
kEuro
6
7
5
4
3
2
1
80 8
90 9
100 10
92 93 94 95 96 97 98 99 00 01 02 0403 05 06 07 0908 10 11
Turnover/employeeBalance Sheet total/employee Result after �nancial items/employees
0
1
2
3
4
5
6
7
8
9
%10
0302010099989796959493 04 05 06 07 08 09 10 11
The top 30 Finnish groups result margins
Turn average Tot. Balance Verk- annual over (Previous- number of sheet ceo/managing director 11/12 10/11 Group Services report meUr year) employees meUr (december 2012)

47Sector Review • The Swedish Federation of Consulting Engineers and Architects • December 2012
The international market

48 Sector Review • The Swedish Federation of Consulting Engineers and Architects • December 2012
The world’s top 10
1 2 AECoM USA 11/12 46.800 45,000 8,218.2
2 1 URS Corporation USA 11 46.000 47,000 9,545.0
3 4 CH2M Hill Companies. inc. USA 11 30,000 23,000 5,555.2
4 3 SNC-Lavalin Group Canada 11 28,000 23,900 7,286.3
5 7 Arcadis Group Netherlands 11 18,427 14,963 2,805.0
6 6 Altran Technologies France 11 17,261 17,038 1,973.7
7 5 wS Atkins plc England 11/12 16,263 17,522 2,742.1
8 11 Alten Group France 11 14,800 12,678 1,481.7
9 15 wSP & Genivar. proforma Canada 11 14,500 9,060 1,152.1
10 9 Fugro N.V Netherlands 11 13,876 13,463 3,584.2
average annual number of (Last Turnover 11/12 10/11 Group country report employees year) m USd
international development
The profit margins for the 300 largest European firms in the sector rose to 5.9 % during 2011, from 5.5 % in 2010 and 5.3 % in 2009. The mean profit margin fell, however, to 1.6 % during 2011 compared with 3.2 % in 2010.
Structural eventsThe consolidation trend within the sec-tor has continued during 2012. North American groups continue to make acquisitions and expand in Europe. The European corporate groups are also becoming larger and many of them are looking to set up operations in Asia where numerous major projects are planned to be implemented over the coming years. Some of the structural transactions that have taken place dur-ing the course of the year are presented below together with examples of various projects that major European groups have been commissioned to conduct during 2012.
Atkins and Assystem cooperate in the British nuclear power sectorAtkins and Assystem have extended their alliance cooperation within nuclear
power services. The alliance supports the French energy supplier EDF in its development of new pressurised water-cooled reactors in Great Britain. EDF plans to construct four new pressurised water-cooled reactors in Great Britain that will together supply 6.4 GW. EDF and Assystem has a long-standing cooperation relationship since Assystem supported EDF during the design and construction of nuclear power reactors in France and continued to provide consultancy services during produc-tion and for maintenance purposes. Assystem’s background with EDF and Atkins’ local know-how and knowledge of the British nuclear power programme mean that the two groups complement each other well.
Atkins signs a cooperation agreement in the USAAtkins has initiated cooperation with Merrick & Company and Nuclear Safety Associates (NSA) for the supply of services for the North American nuclear power market. The three companies intend through the alliance to be able to supply a wide range of engineering consultancy, safety and environmental services. Together, they form a team of 1 200 consultants with experience of the nuclear power area. The alliance will support existing and future nuclear power facilities.
Atkins has entered into a joint venture with the French company Areva for assignments in the nuclear fuel man-agement sector in Great Britain. The joint venture between Atkins and Ausy Group, E2A, has been appointed pre-ferred supplier of engineering consul-tancy services to the European defence and aircraft group EADS.
Atkins has been awarded a 4.5-year commission to manage the design work for the Hong Kong Link Road (HKLR) that will link Hong Kong-Zhuhai-Ma-caobridge and the region’s international airport. The entire project is calculated to cost GBP 750 million and is planned to be finished during 2017. The group has also won a contract for the design of a signal system for Network Rail, the UK equivalent of the Swedish Rail Administration, in the ongoing upgrad-ing of the signal system for Cardiff and the South Wales Region. The project is expected to continue up to and includ-ing 2015 and is expected to be worth GBP 64 million. In Abu Dhabi, At-kins has been commissioned to design the infrastructure in the major urban development project North Wathba Urban Development. The new urban area is being built in a 42 km2 area and includes housing and commercial premises. The entire project is expected to cost somewhere in the region of GBP 1.3 billion and will accommodate 130 000 residents when it is finished. The assignment also includes the design of roads and other infrastructure, built environment, landscape design, energy distribution, water supply and wastewa-ter, and telecommunications.
Altran celebrates its 30th anniversary The French engineering consultancy Altran celebrates its 30th anniversary this year. To mark the celebrations, the firm has published a book entitled “30 years of innovation for a brighter future”, which describes the company’s history and achievements.
Altran will extend its operations in India over the next few years. India is expect-ed to be a key market for Altran’s ser-vices in the aircraft, vehicle railway and energy sectors. The growth is planned to take place both organically and
▼
in the case of the European firms the average number of employees per year is reported, whereas for the North American firms it is the total number of employees that is reported. Therefore, although the figures are not fully comparable, they at least give an idea of how the European groups stand in a global perspective.
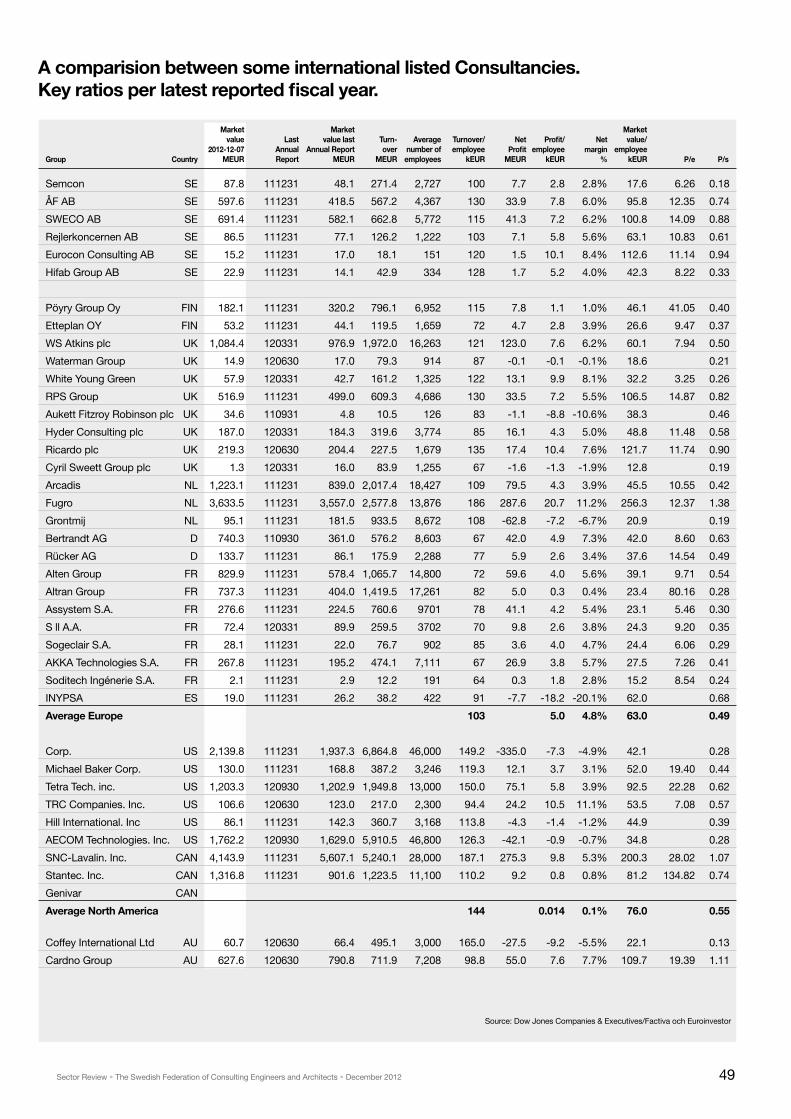
49Sector Review • The Swedish Federation of Consulting Engineers and Architects • December 2012
a comparision between some international listed consultancies. key ratios per latest reported fiscal year.
Source: Dow Jones Companies & Executives/Factiva och Euroinvestor
market market market value last value last Turn- average Turnover/ net Profit/ net value/ 2012-12-07 annual annual report over number of employee Profit employee margin employee
Group country meUr report meUr meUr employees keUr meUr keUr % keUr P/e P/s
Semcon SE 87.8 111231 48.1 271.4 2,727 100 7.7 2.8 2.8% 17.6 6.26 0.18
ÅF AB SE 597.6 111231 418.5 567.2 4,367 130 33.9 7.8 6.0% 95.8 12.35 0.74
SwECo AB SE 691.4 111231 582.1 662.8 5,772 115 41.3 7.2 6.2% 100.8 14.09 0.88
Rejlerkoncernen AB SE 86.5 111231 77.1 126.2 1,222 103 7.1 5.8 5.6% 63.1 10.83 0.61
Eurocon Consulting AB SE 15.2 111231 17.0 18.1 151 120 1.5 10.1 8.4% 112.6 11.14 0.94
Hifab Group AB SE 22.9 111231 14.1 42.9 334 128 1.7 5.2 4.0% 42.3 8.22 0.33
Pöyry Group oy FiN 182.1 111231 320.2 796.1 6,952 115 7.8 1.1 1.0% 46.1 41.05 0.40
Etteplan oY FiN 53.2 111231 44.1 119.5 1,659 72 4.7 2.8 3.9% 26.6 9.47 0.37
wS Atkins plc UK 1,084.4 120331 976.9 1,972.0 16,263 121 123.0 7.6 6.2% 60.1 7.94 0.50
waterman Group UK 14.9 120630 17.0 79.3 914 87 -0.1 -0.1 -0.1% 18.6 0.21
white Young Green UK 57.9 120331 42.7 161.2 1,325 122 13.1 9.9 8.1% 32.2 3.25 0.26
RPS Group UK 516.9 111231 499.0 609.3 4,686 130 33.5 7.2 5.5% 106.5 14.87 0.82
Aukett Fitzroy Robinson plc UK 34.6 110931 4.8 10.5 126 83 -1.1 -8.8 -10.6% 38.3 0.46
Hyder Consulting plc UK 187.0 120331 184.3 319.6 3,774 85 16.1 4.3 5.0% 48.8 11.48 0.58
Ricardo plc UK 219.3 120630 204.4 227.5 1,679 135 17.4 10.4 7.6% 121.7 11.74 0.90
Cyril Sweett Group plc UK 1.3 120331 16.0 83.9 1,255 67 -1.6 -1.3 -1.9% 12.8 0.19
Arcadis NL 1,223.1 111231 839.0 2,017.4 18,427 109 79.5 4.3 3.9% 45.5 10.55 0.42
Fugro NL 3,633.5 111231 3,557.0 2,577.8 13,876 186 287.6 20.7 11.2% 256.3 12.37 1.38
Grontmij NL 95.1 111231 181.5 933.5 8,672 108 -62.8 -7.2 -6.7% 20.9 0.19
Bertrandt AG D 740.3 110930 361.0 576.2 8,603 67 42.0 4.9 7.3% 42.0 8.60 0.63
Rücker AG D 133.7 111231 86.1 175.9 2,288 77 5.9 2.6 3.4% 37.6 14.54 0.49
Alten Group FR 829.9 111231 578.4 1,065.7 14,800 72 59.6 4.0 5.6% 39.1 9.71 0.54
Altran Group FR 737.3 111231 404.0 1,419.5 17,261 82 5.0 0.3 0.4% 23.4 80.16 0.28
Assystem S.A. FR 276.6 111231 224.5 760.6 9701 78 41.1 4.2 5.4% 23.1 5.46 0.30
S ll A.A. FR 72.4 120331 89.9 259.5 3702 70 9.8 2.6 3.8% 24.3 9.20 0.35
Sogeclair S.A. FR 28.1 111231 22.0 76.7 902 85 3.6 4.0 4.7% 24.4 6.06 0.29
AKKA Technologies S.A. FR 267.8 111231 195.2 474.1 7,111 67 26.9 3.8 5.7% 27.5 7.26 0.41
Soditech ingénerie S.A. FR 2.1 111231 2.9 12.2 191 64 0.3 1.8 2.8% 15.2 8.54 0.24
iNYPSA ES 19.0 111231 26.2 38.2 422 91 -7.7 -18.2 -20.1% 62.0 0.68
average europe 103 5.0 4.8% 63.0 0.49
Corp. US 2,139.8 111231 1,937.3 6,864.8 46,000 149.2 -335.0 -7.3 -4.9% 42.1 0.28
Michael Baker Corp. US 130.0 111231 168.8 387.2 3,246 119.3 12.1 3.7 3.1% 52.0 19.40 0.44
Tetra Tech. inc. US 1,203.3 120930 1,202.9 1,949.8 13,000 150.0 75.1 5.8 3.9% 92.5 22.28 0.62
TRC Companies. inc. US 106.6 120630 123.0 217.0 2,300 94.4 24.2 10.5 11.1% 53.5 7.08 0.57
Hill international. inc US 86.1 111231 142.3 360.7 3,168 113.8 -4.3 -1.4 -1.2% 44.9 0.39
AECoM Technologies. inc. US 1,762.2 120930 1,629.0 5,910.5 46,800 126.3 -42.1 -0.9 -0.7% 34.8 0.28
SNC-Lavalin. inc. CAN 4,143.9 111231 5,607.1 5,240.1 28,000 187.1 275.3 9.8 5.3% 200.3 28.02 1.07
Stantec. inc. CAN 1,316.8 111231 901.6 1,223.5 11,100 110.2 9.2 0.8 0.8% 81.2 134.82 0.74
Genivar CAN
average north america 144 0.014 0.1% 76.0 0.55
Coffey international Ltd AU 60.7 120630 66.4 495.1 3,000 165.0 -27.5 -9.2 -5.5% 22.1 0.13
Cardno Group AU 627.6 120630 790.8 711.9 7,208 98.8 55.0 7.6 7.7% 109.7 19.39 1.11

50 Sector Review • The Swedish Federation of Consulting Engineers and Architects • December 2012
The top 50 european architectural groups
1 1 AEDAS Architects Group England 10 2,031 2,031 254.7
2 3 Foster & Partners Ltd England 10/11 1,036 794 183.6
3 8 white Arkitekter AB Sweden 11 678 442 81.3
4 SwECo Architects AB Sweden 11 600 345 59.3
5 4 Gmp Von Gerkan Marg U. Partner Architekten * Germany 10 500 500 N/A
6 7 ATP Architects and Engineers Group Austria 11 450 450 47.5
7 10 Benoy Architects Ltd England 11 426 339 44.3
8 14 Tengbom Sweden 11 422 272 44.3
9 5 Broadway Malyan Ltd England 11 368 496 36.9
10 Zaha Hadid Architects England 10/11 357 49.6
11 9 RKw Architekten & Co. KG * Germany 10 350 350 38.5
12 13 Herzog & de Meuron Architekten AG * Switzerland 11 334 300 29.8
13 12 HKR Architects * ireland 11 300 300
14 17 Arkitektfirmaet C.F. Møller Denmark 11 296 262 38.9
15 11 PRP Architects Ltd England 11/12 292 308 23.5
16 22 Allies and Morrison Architects Ltd * England 11 270 247 8.5
17 6 Archial Group (ingenium Group. Canada) England 11 266 457 20.6
18 18 HENN Architekten GmbH Germany 10 260 260 28.7
19 16 Burckhardt+Partner AG Architekten Generalplaner Switzerland 11 256 263 61.6
20 19 Sheppard Robson England 11 250 250
21 27 Heinle. wischer und Partner * Germany 11 250 200 18.0
22 15 Stride Treglown Group Ltd England 11 249 264 14.9
23 20 Barton willmore Group England 11/12 249 248 26.0
24 39 LiNK Signatur Gruppen Norway 11 249 147 33.9
25 21 Chapman Taylor LLP England 11/12 227 247 25.7
26 24 Austin Smith Lord Architects Ltd England 09/10 223 223 19.0
27 23 Nightingale Associates England 10 213 224 17.1
28 HPP Hentrich -Petschnigg & Partner GmbH&co KG Germany 11 210 200 23.8
29 25 3DReid Architects Ltd England 11/12 182 209 17.2
30 31 iNBo Architects/Consultants Netherlands 11 180 188 15.6
31 43 o.M.A. office for Metropolitan Architecture Netherlands 11 180 130
32 Ramböll Architects Norway Norway 11 180 27.6
33 42 Rogers Stirk Harbour & Partners (fd Rickard Rogers) England 11 177 136 30.7
34 32 Llewelyn-Davies -Yeang Ltd England 09/10 170 170
35 34 Henning Larsen Architects Denmark 11/12 170 165 24.1
36 41 Temagruppen Sverige AB Sweden 11 165 142 19.6
37 29 Scott Brownrigg Architects England 11/12 164 195 14.3
38 35 Arkitema K/S Denmark 10 163 163 22.6
39 36 Purcell Miller Tritton England 11 157 158 12.1
40 33 JSK Architekten GmbH * Germany 11 150 170 16.5
41 37 HLM Architects England *11 150 150
42 Narud-Stokke-wiig A/S Norway 11 141 121 25.0
43 45 wingårdh-koncernen Sweden 11 141 121 19.5
44 38 Lewis & Hickey Architects England 11/12 140 149 7.7
45 30 Keppie Design Scotland 10/11 139 191 8.5
46 44 DARK Gruppen Arkitekter AS Norway 11 131 129 26.3
47 40 Aukett Fitzroy Robinson plc England 11/12 126 146 10.5
48 47 Schmidt. Hammer & Lassen Architects K/S Denmark 11 120 113 14.1
49 Nyréns Arkitektkontor AB Sweden 11 97 98 11.6
50 Liljewall Arkitekter AB Sweden 11 87 75 9.6
average annual number of (Last Turnover 2012 2011 Group country report employees year) meUr
through acquisition aimed at acquir-ing a labour force of 2 000 engineering consultants within a period of two years. Peugeot Citroën have appointed Altran as their strategic partner for services in the areas of product and process design within the vehicle industry.
Arcadis changes its CEo…Harrie Noy has left his position as CEO for Arcadis after 37 years in the com-pany’s service and 18 years in the Group management. Noy is succeeded by Neil McArthur.
…and makes a number of corporate acquisitions In April, an announcement was made of Arcadis’ acquisition of project man-agement group Davis Langdon & Seah (DLS), with 2 800 employees in 10 countries, primarily in Asia. In 2011, DLS had a turnover of over USD 125 million. With this deal, the Arcadis Group now has over 21 000 employees and a turnover of EUR 2.4 billion. DLS complements Arcadis’ existing services in Asia. In future, DLS will be known as Langdon & Seah.
August saw the acquisition of ETEP Consultoria, Gerenciamento e Servicos Ltda, Brazil’s largest consultancy in the area of water supply and water treat-ment. ETEP has 300 employees and a turnover of approximately EUR 20 mil-lion. With the acquisition, Arcadis aims at becoming the foremost engineering consultancy on the growing Brazilian water supply market.
Previously, the firm had also purchased Swiss engineering consultants BMG Engineering AG, with 50 employees and a turnover of EUR 8 million. BMG is primarily active in the environmental area.
Arcadis-owned EC Harris has in a joint venture with the British firm Mace been awarded a commission in Ashghal, Qatar’s building authority, comprising a number of social infrastructure projects situated throughout the country. EC Harris & Mace will plan, design and manage the construction of several different types of project, including schools, medical care centres, harbours
▼

51Sector Review • The Swedish Federation of Consulting Engineers and Architects • December 2012
The european top 300 consulting engineering and architectural groups
average annual number of (Previous- Turnover ceo/managing director 2012 2011 Group Services country report employees year) meUr (december 12)
1 3 Arcadis Group MD Netherlands 11 18,427 14,963 2,017.4 Neil McArthur
2 2 Altran Technologies i France 11 17,261 17,038 1,419.5 Philippe Salle
3 1 wS Atkins plc MD England 11/12 16,263 17,522 1,972.0 Uwe Kreuger
4 7 Alten Group i France 11 14,800 12,678 1,065.7 Simon Azoulay
5 5 Fugro N.V CE Netherlands 11 14,000 13,500 2,577.8 Arnold Steenbakker
6 6 Mott MacDonald Group MD England 11 13,162 13,013 1,238.3 Keith Howells
7 8 Groupe Egis MD France 11 12,000 11,000 858.3 Augustine de Romanet
8 10 ARUP Group MD England 10/11 10,135 9,852 1,143.0 Philip Dilley (chairman), David whittleton (CEo)
9 15 Assystem Group S.A i France 11 9,701 8,560 760.6 Dominique Louis
10 13 Rambøll Group MD Denmark 11 9,439 8,970 925.0 Jens-Peter Saul11 11 oranjewoud group (Member of
Anthea Group) MD Netherlands 11 9,369 9,171 1,743.4 Menno Smits, Rob van Dongen12 12 wSP Group Limited (Genivar iNC
20120801)MD England 11 8,882 9,060 826.7 Pierre Shoiry (President&CEo
Genivar)
13 9 Grontmij Group MD Netherlands 11 8,672 9,898 933.5 Michiel Jaski
14 14 Mouchel Group MD England 10/11 8,645 8,645 635.5 Grant Rumbles
15 19 Bertrandt AG i Germany 11/12 8,603 6,523 576.2 Dietmar Bichler16 16 URS Europe (fd URS Scott wilson Europe
(proforma)) * MD England 10 7,500 7,500 512.9 Simon Hindshaw17 Royal Haskoning DHV (merger finished by
end of 2012) MD Netherlands 11 7,451 7,943 737.2 Bertrand M. van Ee 18 21 AKKA Technologies S.A i France 11 7,111 5,710 474.1 Maurice Ricci
19 17 Segula Technologies Engineering Group * i France 11 7,000 7,000 480.0 Franck Ghrenassia
20 18 Pöyry Group MD Finland 11 6,952 6,801 796.1 Alexis Fries
21 23 SwECo AB proforma MD Sweden 11 6,872 4,966 741.6 Tomas Carlsson
22 20 Cowi Group MD Denmark 11 6,164 6,031 678.5 Lars Peter Söbye
23 27 ÅF-Group proforma i,E,M,Enr Sweden 11 5,868 5,211 772.7 Jonas wiström
24 22 Sener Group MD Spain 11 5,165 5,094 1,145.6 Jorge Sendagorta Gomendlo
25 26 RPS Group plc Env England 11 4,686 4,372 609.3 Alan S. Hearne
26 25 Halcrow Group Ltd (CM2Hill Group) MD England 10 4,617 4,617 380.9 Peter G. Gammie
27 28 Hyder Consulting Group Ltd MD England 11/12 3,774 3,695 319.6 ivor Catto
28 34 Mace Group Ltd PM England 11 3,602 2,781 1,069.5 Stephen Pycroft
29 30 Tractebel Engineering A.S. (GDF Suez) MD Belgium 11 3,500 3,300 523.6 Georges Cornet
30 42 SYSTRA Group MD France 11 3,400 2,470 416.0 Pierre Verzat
31 29 S ii S.A i France 11/12 3,194 3,402 259.3 Bernard Huvé
32 36 Tebodin, Consultants & Engineers MD Netherlands 11 3,186 2,699 223.0 Pieter Koolen
33 33 SNC-Lavalin Europe SA MD France 10 2,900 2,900 740.0 Christian Jacqui (2012, Europe)
34 35 Ayesa MD Spain 11 2,776 2,776 216.0 José Luis Manzanares Japón
35 39 Artelia (fusion Coteba & Sogreah) PM France 11 2,759 2,597 317.3 Jacques Gaillard
36 41 Semcon AB i Sweden 11 2,727 2,474 271.4 Markus Granlund
37 38 Turner & Townsend Group PM,QS England 11/12 2,484 2,250 316.5 Vincent Clancy
38 32 Capita Symonds MD England 11 2,300 2,966 318.1 Jonathan Goring
39 44 Rücker AG i Germany 11 2,288 2,188 175.9 wolfgang Rücker
40 40 AECoM Ltd (former FaberMaunsell Ltd) MD England 11 2,252 2,559 195.3 John M Dionisio
41 61 Norconsult AS MD Norway 11 2,170 1,498 354.7 John Nyheim
42 53 EPTiSA Grupo EP MD Spain 11 2,157 1,650 150.0 Luis Villarroya Alonso43 43 iDoM Group MD Spain 11 2,110 2,441 297.0 Luis Rodriquez Llopis; Fernando
Querejeta44 47 SETEC Group (Setec TPi) MD France 11 2,068 1,665 219.6 Gérard MASSiN
45 45 AEDAS Architects Group *A England 10 2,031 2,031 254.7
Malcolm Ellis (MD), Brian Johnson (chairman)
46 51 TPF Group MD Belgium 11 2,000 1,700 114.5 Thomas Spitaels 47 46 Davis Langdon & Seah international LLP PM, QS England/
Switzerland 11/12 1,985 1,985 116.9 John Lewis (Director) 48 48 TYPSA Group MD Spain 11 1,849 1,889 158.7 Pablo Bueno Tomás (CEo)49 50 iLF Group MD Germany/
Austria 11 1,810 1,757 192.0 Klaus Lässer
PM = Project Management, A = Architecture, CE = Civil-/S = Structural Engineering, CT = Certification and testing, Env = Environment, Enr = Energy, E = Electrical, M = Mechanical/HEVAC, I = Industrial, MD = Multi Disciplinary – (*) = lack of conforming figure/proforma/assumed

52 Sector Review • The Swedish Federation of Consulting Engineers and Architects • December 2012
50 52 MwH Europe MD, Env England 11 1,805 1,661 176.4 Ken Farrer
51 55 Fichtner Group Enr, MD Germany 11 1,800 1,600 229.0 Georg Fichtner
52 57 Etteplan oy i Finland 11 1,659 1,569 119.5 Juha Näkki
53 54 PM Group (Pm Project Management Group) PM, MD ireland 11 1,655 1,635 175.8 David Murphy
54 59 Kema Group BV (DNV KEMA) Enr Netherlands 11 1,624 1,528 258.1 David walker
55 58 Ricardo plc i England 11/12 1,512 1,530 227.5 Dave Shemmans
56 63 Lahmeyer international GmbH Enr Germany 11 1,500 1,352 147.0 Dr. Bernd Kordes
57 86 NiRAS Group A/S MD Denmark 11 1,472 883 128.6 Carsten Toft Boesen
58 62 ingérop S.A MD France 11 1,470 1,437 165.7 Yves Metz
59 49 Dorsch Gruppe MD Germany 11 1,400 1,800 69.6 olaf Hoffmann
60 64 inspecta oY i Finland 11 1,400 1,400 169.0 Kari Aulasmaa
61 78 Gleeds * PM England 11 1,400 1,000 Richard Steer
62 75 Drees & Sommer-Gruppe PM Germany 11 1,350 1,125 150.5 Hans Sommer
63 92 Safege Consulting Engineers Env,S,CE France 11 1,350 1,200 108.0 Benoît Clocheret
64 56 white Young Green MD England 11/12 1,325 1,587 161.2 Paul Hamer
65 60 Movares Group BV CE,E Netherlands 11 1,311 1,515 185.8 Johan van den Elzen
66 68 RLE international Gruppe GmbH i, PM Germany 11 1,300 1,200 95.0 Ricardo Arau Mussons m.fl
67 74 obermeyer Planen+Beraten GmbH * MD Germany 11 1,300 1,153 105.0 Maximilian Grauvogl
68 4 PB Parsons Brinckerhoff, Europe (Balfour Beatty group) MD England 11 1,267 192.2 George J Pierson
69 65 Cyril Sweett Group (Sweett Group PLC) PM England 11/12 1,255 1,213 83.9 Dean webster
70 79 ABMi-groupe S.A * i France 11 1,250 950 71.0 Philippe Chatron
71 72 Multiconsult-group MD Norway 11 1,237 1,173 188.6 Christian Nørgaard Madsen
72 77 Rejler Group E,i Sweden 11 1,222 1,038 126.2 Eva Nygren
73 70 Buro Happold MD England 11/12 1,192 1,190 118.3 Paul westbury
74 73 Tauw Group bv MD Netherlands 11 1,131 1,156 117.5 Bram de Borst
75 76 Vectura CE Sweden 11 1,111 1,061 138.3 Jan Colliander
76 HiQ international AB i Sweden 11 1,107 945 137.2 Lars Stugemo
77 93 Foster & Partners Ltd A England 10/11 1,036 794 183.6 Mouzhan Majidi
78 66 waterman Group plc MD England 11/12 1,020 1,207 79.3 Nicholas Taylor
79 89 Tyréns AB CE,PM Sweden 11 1,020 847 125.0 Ulrika Francke
80 83 Reinertsen Engineering MD Norway 11 987 931 141.9 Torkild Reime Reinertsen
81 81 GFA Consulting Group * MD Germany 12 974 910 76.0 Klaus Altemeier
82 67 Prointec S.A MD Spain 11 938 1,200 72.0 Cesar Cañedo-Argüelles
83 87 Sogeclair SA i France 11 902 881 76.7 Phillippe Robardey84 85 Golder Associates Europe Ltd * Env,CE,
PM,Enr England 10 900 900 Gyorgy Vamos85 91 SLR Group (SLR Management) Env England 10/11 857 833 96.0 Neil Penhall (MD-Europe)
86 88 witteveen+Bos Consulting Engineers MD Netherlands 11 856 869 98.1 H A A M webers, H E Nieboer
87 Combitech AB i Sweden 11 853 774 109.9 Marie Bredberg
88 82 RMJM Hillier Group CE,A England 11 840 939 82.5 Peter Morrison
89 84 BDP Building Design Partnership MD England 11 817 980 77.9 Peter Drummond
90 96 iV-Groep b.v. MD Netherlands 11 785 747 118.1 Rob van de waal
91 90 PCG-Profabril Consulplano Group MD Portugal 11 783 834 62.3 ilidio de Ayala Serôdio
92 100 Gruner-Gruppe AG MD Switzerland 11 749 700 84.6 Flavio Casanova
93 102 Xdin AB i Sweden 11 741 700 72.3 Fredrik Nyberg
94 98 RSK Group Env England 11/12 729 729 69.9 Alan Ryder
95 103 ingenieurbüro Dipl.-ing. H. Vössing GmbH MD Germany 11 720 682 67.5 Hans-Theo Kühr
96 101 Bonifica Group MD italy 09 700 700 38.4 Romina Boldrini97 94 Payma Cotas, S.A. CE,S Spain/France 10 699 775 53.2 Jose Luis Manglano Borso di
Carminati
98 104 Asplan Viak Group MD Norway 11 692 652 90.7 Øyvind Mork
99 124 white Architects AB A,PM, Env Sweden 11 678 442 81.3 Monica von Schmalensee
100 97 Pell Frischmann Group MD England 11/12 649 731 36.3 Sudho Prabhu
101 95 Alectia Group MD Denmark 11 639 750 77.3 Jens Moberg102 119 SKM Europe (Sinclair Knight Merz) fd
Enviros Env,Enr England 11/12 601 456 55.8 Santo Rizzuto
The european top 300 consulting engineering and architectural groups
average annual number of (Previous- Turnover ceo/managing director 2012 2011 Group Services country report employees year) meUr (december 12)

53Sector Review • The Swedish Federation of Consulting Engineers and Architects • December 2012
103 106 Amstein + walthert AG E,M Switzerland 11 600 550 Christian Appert
104 105 Neste Jacobs Group i Finland 11 574 624 76.7 Jarmo Suominen, Tom Främling
105 Acciona ingenieria Sa i Spain 11 559 79.0 N/A
106 108 Noble Denton Group Ltd i,E England 10 528 528 Lutz Hugo otto wittenberg
107 107 FCG Finnish Consulting Group MD Finland 11 522 532 49.6 Ari Kolehmainen
108 109 Elomatic Group oy i,MD Finland 11 512 502 38.0 olli Manner
109 Euroestudios S.L. CE,PM Spain 11 501 656 48.8 Juan Santamaría Fullana
110 110 Fairhurst * MD Scotland 11 500 500 Robert Mc Cracken111 111 Gmp Von Gerkan Marg U. Partner
Architekten * A Germany 10 500 500 N/A Meinhard von Gerkan,Volkwin Marg112 113 Basler & Hofmann AG * MD Switzerland 10 500 500 Dominik Courtin
113 116 Hoare Lea & Partners E,M,Enr England 11/12 482 482 54.2 Brian Clargo (Partner) mfl.
114 120 iNRoS LACKNER Group MD Germany 11 469 456 36.5 Uwe Lemcke
115 122 Emch + Berger Gruppe * MD Switzerland 11 450 450 60.2 Urs Schneider
116 123 ATP Architects and Engineers Group A,CE, PM Austria 11 450 450 47.5 Christoph M. Achammer
117 114 BG Bonnard & Gardel Groupe SA MD Switzerland 11 449 500 68.0 Laurent Vulliet (CEo)
118 117 NET Engineering S.p.A MD italy 11 443 462 45.1 Giovanni Battista Furlan
119 149 Benoy Architects Ltd A England 11 426 339 44.3 Graham Cartledge
120 orbicon A/S MD Denmark 11 425 427 52.0 Jesper Nybo Andersen
121 128 iNYPSA informes y Projectos SA MD Spain 11 422 406 38.2 Valentin Estefanell
122 125 Auditorias E ingenierias Sa MD Spain 09 419 419 N/A Joan Lluís Quer Cumsille123 144 CSD Group Env, PM,
CE,S Switzerland 11 413 348 48.5 Jean-Pascal Gendre124 177 Tengbom Architects proforma A Sweden 11 410 272 42.0 Magnus Meyer125 137 HPC AG (previously: HPC HARRESS
PiCKEL CoNSULT Group)Env,PM,
CE Germany 11 405 365 40.2 Josef Klein-Reesink126 112 Deerns Consulting Engineers BV E, M,
PM, i Netherlands 11 402 500 52.0 Alexander Jansen (MD)...127 130 Amberg Group * CE,S,PM Switzerland 10 400 400 69.1 Felix Amberg
128 148 CDM Gruppe (part of CDM Group) CE Germany 10 400 340 42.5 Stefan oevermann
129 147 Pick Everard Ltd MD England 11 397 340 David Brunton
130 155 Vahanen oy CE Finland 11 382 326 33.1 Veijo Komulainen
131 138 RAPP-Gruppe AG, ingenieure+Planer MD Switzerland 11 374 364 54.9 Bernhard Berger
132 126 wardell Armstrong LLP MD England 11/12 371 330 28.8 Colin w. Brown
133 132 Cundall Johnston & Partners (Cundall LTD) CE,S,Env England 11 371 391 29.6 David Dryden
134153 iNoCSA ingeniera, S.L. (Aecom, May
2010) MD Spain 10/11 371 335 24.1 Antonio Lorente 135 135 Antea S.A (acquired by orangewoud NV
october 2009) Env France 10 370 371 50.9 Jean-Philippe Loiseau 136 139 Mannvit hf. (merger of Hönnun-VGK
hf in 2007) MD iceland 11 369 355 43.6 Eyjólfur Árni Rafnsson137 115 Broadway Malyan Ltd A England 11 368 496 36.9 Gary whittle138 134 Peter Brett Associates MD England 11 366 376 29.8 Stephen Capel-Davies w
co-directors139 140 Moe & Brødsgaard A/S MD Denmark 11 357 323 37.7 Christian Listov-Saabye
140 Zaha Hadid Architects A England 10/11 357 49.6 Zaha Hadid, Patrik Schumacher141 146 SiTo Group oy CE, Env,
PM Finland 11 354 347 26.5 Kimmo Fischer142 142 RKw Architekten & Co, KG * A Germany 10 350 350 38.5 wojtek Grabianowski
143 194 Granlund oy E,M Finland 11 350 245 22.6 Pekka Metsi
144 141 FAVEo Projektledelse (Norway & Sweden) PM Norway 11 350 350 58.5 Sven Erik Nørholm
145 145 Krebs und Kiefer Beratende ingenieure * CE,S, PM Germany 11 348 347 Hans- Gerd Lindlar m.fl
146151 PBR Planungsbüro Rohling AG Architekten
u ingenieure MD Germany 11 346 339 31.5 Heinz Eustrup147 156 A-insinöörit Group S, CE, PM Finland 11 341 323 30.8 Petri Laurikka
148 150 GETiNSA S.A CE, Env, PM Spain 10 339 339 26.1 Pedro D. Gomez
149 143 Hifab Group PM Sweden 11 334 348 42.9 Jan Skoglund
150 165 Herzog & de Meuron Architekten AG * A Switzerland 11 334 300 29.8 Pierre de Meuron; Jacques Herzog
average annual number of (Previous- Turnover ceo/managing director 2012 2011 Group Services country report employees year) meUr (december 12)
PM = Project Management, A = Architecture, CE = Civil-/S = Structural Engineering, CT = Certification and testing, Env = Environment, Enr = Energy, E = Electrical, M = Mechanical/HEVAC, I = Industrial, MD = Multi Disciplinary – (*) = lack of conforming figure/proforma/assumed

54 Sector Review • The Swedish Federation of Consulting Engineers and Architects • December 2012
151 158 D'Appolonia S.p.A MD italy 11/12 332 319 50.5 Roberto Carpaneto
152 174 Müller-BBM GmbH MD Germany 11 332 279 35.1 H. Gass m.fl
153 154 italconsult S.p.A PM italy 10 331 331 25.5 Giovanni A. Torelli
154 244 Projektengagemang-gruppen proforma PM Sweden 11 324 223 41.0 Per-Arne Gustavsson
155 157 Ernst Basler & Partner Ltd MD Switzerland 11 320 320 15.7 Daniel Schläpfer
156 186 Temelsu international Engineering Services inc. MD Turkey 11 320 250 13.1 Demir inözü
157 Destia Consulting oy CE Finland 11 317 342 30.0 Jukka Raudasoja
158 159 Assmann Beraten + Planen MD Germany 11 315 315 28.7 Jochen Scheuermann
159 160 FASE-Estudos e Projectos S.A MD Portugal 11 314 315 16.1 Manuel Quinaz
160 171 Bengt Dahlgren AB M,Enr Sweden 11/12 311 285 35.6 Åke Rautio
161 167 Verkís hf MD iceland 11 310 293 23.0 Sveinn ingi Ólafsson
162 127 Consulgal Group, SA. MD Portugal 11 306 406 28.8 Rogério Monteiro Nunes
163 152 Steer Davies Gleave Ltd CE England 11/12 304 337 33.3 Hugh Jones, Steve Hewitt164 163 DRi investment Management, Company
for Development of infrastructure Ltd PM Slovenia 10 301 301 24.0 Rajko Siro165 173 Technital SpA CE italy 11 301 280 54.4 Alberto Scotti166 133 Ebert-ingenieure GdbR.mbH
E, M, Env,
Enr Germany 10 300 390 21.0 Ernst Ebert m.fl167 164 HKR Architects * A ireland 11 300 300 Jerry Ryan
168 189 Knightec AB i Sweden 11/12 298 248 34.1 Dimitris Gioulekas
169 180 Arkitektfirmaet C.F.Møller A Denmark 11 296 262 38.9 Susanne T Nielsen
170 166 insinööritoimisto Comatec Group i, Enr Finland 11 293 331 20.9 Aulis Asikainen
171 162 PRP Architects Ltd A England 11/12 292 308 23.5 Andy von Bradsky
172 170 GPo ingenieria, S.A. MD Spain 10 289 289 24.1 Alvaro Palao Llopis
173 184 A.R.E.P. Groupe MD France 11 283 253 38.2 Jean-Marie Duthilleul
174 172 Steinbacher-Consult GmbH * CE, PM Germany 11 280 280 Stefan Steinbacher175 168 Dolsar Engineering Ltd PM,CE,
Env, E,M, MD Turkey 11 279 291 6.8 H. Îrfan Aker
176 99 Vattenfall Research&Development AB Enr,E, CE Sweden 11 272 700 40.2 Magnus Hemmingsson
177 169 Citec Group (proforma) i, Env Finland 11 270 290 30.5 Martin Strand
178 193 Allies and Morrison Architects Ltd * A England 11 270 247 8.5 Bob Allies
179 199 Goudappel Coffeng B.V MD Netherlands 11 270 239 24.9 Jos van Kleef
180 182 Gauff Gruppe MD Germany 11 267 260 30.7 Gerhard H. Gauff
181 118 Archial Group (ingenium Group, Canada) A England 11 266 457 20.6 Christopher Littlemore
182 161 Bartels Engineering B.V. CE,S,PM Netherlands 11 261 313 19.8 Taco Klevering
183 183 HENN Architekten GmbH A Germany 10 260 260 28.7 Gunter Henn184 179 Burckhardt+Partner AG Architekten
Generalplaner A Switzerland 11 256 263 61.6 Peter Epting185 197 Structor Group CE,PM Sweden 11 256 243 37.5 Fladvad, Hulthén, Texte
186 181 Deltamarin oy i Finland 11 252 262 21.0 Mika Laurilehto
187 185 Sheppard Robson A England 11 250 250 Andrew German
188187 DSSR Consulting Engineers (form Donald
Smith Seymour & Rooley) E,M Scotland 09/10 250 250 Hugh Currie189 219 Heinle, wischer und Partner * A,PM Germany 11 250 200 18.0 Dr. Alexander Galakoy/ Monica
wurfbaum 190 221 Consitrans S.R.L. CE,S, Env,
PM Romania 11 250 193 20.5 Gabriel Valentin Teodorescu191 178 Stride Treglown Group Ltd A England 11 249 264 14.9 Kevin McDonald
192 190 Barton willmore Group A,PM England 11/12 249 248 26.0 ian Mellor
193 260 LiNK Signatur Gruppen A Norway 11 249 224 33.9 Siri Legernes194 201 Dopravoprojekt, a.s. CE, S, A,
PM Slovakia 11 246 233 13.4 Gabriel Koczkás195 175 JMP Consultants Ltd CE England 11/12 244 278 19.8 Gordon Baker
196 131 ABT Holding BV MD Netherlands 11 242 397 24.6 walter Spangenberg
197 Force Technology Sweden CE Sweden 11 241 229 32.1 Hans ole olsen
198 Sigma Kudos AB i Sweden 11 240 290 22.2 Carl Vikingsson
199 203 JBA Consulting (Jeremy Benn Associates Ltd) CE, Env England 11/12 239 230 13.7 Jeremy Benn
200 196 SC Metroul S.A. * MD Romania 11 237 244 George Rozorea
201 210 Uvaterv Engineering Consultants Ltd MD Hungary 11 236 210 9.3 Bretz Gyula
202 i3tex AB i Sweden 11 235 227 22.9 Ulf Aiff
The european top 300 consulting engineering and architectural groups
average annual number of (Previous- Turnover ceo/managing director 2012 2011 Group Services country report employees year) meUr (december 12)

55Sector Review • The Swedish Federation of Consulting Engineers and Architects • December 2012
203 192 Pragoprojekt a.s CE Czech Republ. 11 234 247 17.0 R. Jirikova
204 204 Kling Consult ingenieur GmbH CE Germany 10 229 229 20.0 Markus Daffner
205 191 Chapman Taylor LLP A England 11/12 227 247 25.7 Chris Lanksbury
206 207 Austin Smith Lord Architects Ltd A England 09/10 223 223 19.0 Alistar Sunderland207 206 Nightingale Associates A England 10 213 224 17.1 Richard Harrington, Executive
Chairman208 215 HPP Hentrich -Petschnigg & Partner
GmbH&co KG A Germany 11 210 200 23.8 Joachim Faust, G. Feldmeyer...209 256 wTM Engineers MD Germany 11 210 150 22.5 Karl Morgen
210 202 Avalon innovation AB (previously Avalon Enterprise AB) i Sweden 11 207 231 26.3 Atle Andersen
211 229 Bjerking ingenjörsbyrå AB CE,M Sweden 11 206 182 24.9 Anders wärefors
212 212 Adviesbureau Peutz & Associés B.V Env,CE, i Netherlands 11 203 208 17.9 w.J.F.w. Koopmans213 208 ibe D.D, Svetovanje Projektiranje in
inzeniring (iBE consulting Engineers) MD Slovenia 11 202 221 15.3 Uroš Mikoš214 213 Frankham Consultancy Group MD England 10/11 202 202 17.1 S J Frankham 215 224 Metroprojekt Praha A.S MD Czech
Republ. 11 201 188 23.6 Jiri Pokorny216 205 Baurconsult (Baur, Kitz, Kuhn) * MD Germany 11 200 200 11.4 Andreas Baur m.fl
217 216 Aveco de Bondt BV CE Netherlands 10 200 200 12.3 Gerrit Paalman
218218 o.T.E. ingenerie SA (omnium Technique
Européen) MD France 09/10 200 200 16.3 Jean-Ernest Keller219 227 Planungsgruppe M+M AG , PGMM * E,M,PM,
Enr Germany 10 200 183 17.7 Hermann ott220 198 Transprojekt Gdanski Spolka A, CE Poland 11 198 240 29.5 Marek Piotr Rytlewski
221 303 Dekra industrial oy (Polartest) Enr Finland 11 197 189 22.2 Matti Andersson222 225 Leonhardt, Andrä und Partner Beratende
ing. GmbH S Germany 11 195 187 16.9 wolfgang Eilzer223 209 Advin B.V. - Adviseurs en ingenieurs MD Netherlands 11 192 216 23.5 John walraven
224 249 Soditech ingenerie S.A i France 11 191 154 12.2 Maurice Caillé
225 242 opus Joynes Pike (opus international) CE,S,Env England 11 190 161 22.7 David Prentice
226 228 PDM Group i Netherlands 10 187 182 20.5 H.J.P.M. Mesterom
227 235 Efla hf MD iceland 11 187 172 16.6 Guðmundur Þorbjörnsson
228 200 JG ingenieros SA M,E, Enr, i Spain 11 185 235 12.6 Josep Túnica Buira
229 69 olajterv Group * CE, Enr Hungary 11 184 184 9.3 Balázs Tóth
230 211 3DReid Architects Ltd A England 11/12 182 209 17.2 Charles Graham-Marr
231 236 GoPA-Consultants Group * PM,i,Env Germany 11 182 170 59.9 Martin Güldner, Berthold Averweg
232 304 Kragten B.V * CE, Env Netherlands 11 181 100 12.0 Steef Stevens
233 orbion Consulting AB E, Enr, Env Sweden 11 181 19.4 Mats Rönnlund
234 223 iNBo Architects/Consultants A,PM Netherlands 11 180 188 15.6 Bert van Breugel/Tako Postma/ Jeanet van Antwerpen
235 265 Troup Bywaters + Anders * E,M England 11 180 142 13.8 Neil weller
236 279 o.M.A. office for Metropolitan Architecture A Netherlands 11 180 130 Victor van der Chijs
237298 CES Consulting Engineers Salzgitters
GmbH * MD Germany 11 179 107 11.0 Ralf Meyerhoff238 273 Rogers Stirk Harbour & Partners
(former Rickard Rogers) A England 11 177 136 30.7 Rickard Rogers239 264 Cauberg-Huygen CE, Env Netherlands 11 176 145 18.1 A.R Hanlo
240 254 Consat Engineering AB i Sweden 11 175 150 21.1 Jan Bertil Johansson
241 226 Hulley & Kirkwood Consulting Engineers Ltd E,M Scotland 11/12 174 184 13.1 Sommerville Telfer
242 230 Curtins Group CE,PM England 11 173 181 12.3 Rob Melling
243 233 SD ingénierie Holding SA MD Switzerland 11 173 173 24.0 J. D. Girard244 322 Greisch (Bureau D'études) CE,S, A,
PM Belgium 11 171 151 18.1 Clément Counasse 245 237 Llewelyn-Davies -Yeang Ltd A,iA England 09/10 170 170 Stephen Featherstone
246 239 Henning Larsen Architects A Denmark 11/12 170 165 24.1 Mette Kynne Frandsen247 232 Prokon Muhendislik Ve Musavirlik A S
(Prokon Engineering Ltd) * MD Turkey 11 165 179 Hasan Özdemir, ismail Salici248 266 Temagroup Sweden AB A,PM Sweden 11 165 142 19.6 Håkan Persson
249 220 Scott Brownrigg Architects A England 11/12 164 195 14.3 Darren Comber
average annual number of (Previous- Turnover ceo/managing director 2012 2011 Group Services country report employees year) meUr (december 12)
PM = Project Management, A = Architecture, CE = Civil-/S = Structural Engineering, CT = Certification and testing, Env = Environment, Enr = Energy, E = Electrical, M = Mechanical/HEVAC, I = Industrial, MD = Multi Disciplinary – (*) = lack of conforming figure/proforma/assumed

56 Sector Review • The Swedish Federation of Consulting Engineers and Architects • December 2012
250 234 EKJ Rådgivende ingeniorer A/S MD Denmark 11/12 163 172 16.7 Jørgen Nielsen
251 240 Arkitema K/S A,PM Denmark 10 163 163 22.6 Peter Hartmann Berg
252 250 SiNA Group (dt ASTM Group) CE,MD italy 11 163 153 46.7 Agostino Spoglianti
253 262 Hjellnes Consult AS MD Norway 11 163 147 29.4 Geir Knudsen
254 299 Suomen Talokeskus oy MD Finland 11 163 107 13.0 Karri Virtanen
255 243 o.B.H-Group MD Denmark 11 163 161 15.8 Borge G Danielsen256 241 Clarke Bond Group Ltd S,CE,
Env,PM England 09 162 162 12.0 Andrew whitehead257 251 Condesign AB i Sweden 11 162 153 12.8 Fredrik Bromander
258 246 SGi Consulting SA * MD Luxemburg 10 160 160 Laurent NiLLES
259 247 B+S ingenieur AG * MD Switzerland 11 160 160 walter Shaufelberger
260 248 Purcell Miller Tritton A England 11 157 158 12.1 Mark Goldspink
261 274 infotiv AB i Sweden 11 154 136 14.5 Alf Berndtsson
262 267 CTS Engtec oy i Finland 11 152 147 13.1 Antti Lukka
263 275 Eurocon Consulting AB i Sweden 11 151 136 18.1 Peter Johansson
264 276 optiplan oy MD Finland 11 151 135 10.3 Tommi Vaisalo
265 238 JSK Architekten GmbH * A Germany 11 150 170 16.5 Helmut w. Joos
266 252 iSC Group (iSC Rådgivende ingeniører A/S) MD Denmark 11 150 150 20.2 Kjeld Thomsen
267 253 HLM Architects A England *11 150 150 Christopher Liddle268 255 Politecnica- ingegneria e Architettura
Soc. Coop MD italy 11 150 150 13.0 Gabriele Giacobazzi269 Coplan AG i Germany 11 150 16.5 Martin Steger
270 231 DGMR Raadgevende ingenieurs BV Env Netherlands 11/12 147 155 14.2 ir. P.J. van Bergen
271 261 Transprojekt- warszawa Sp. Z o. o CE Poland 10 147 147 7.6 Tadeusz Suwara
272 295 Geodata S.p.A CE italy 11 146 117 31.3 Cesare Salvadori
273 283 TCPM (TC Project Management B.V) i Netherlands 11 145 129 12.0 Rudie Veenendaal
274 290 wingårdh-koncernen A Sweden 11 141 121 19.5 Gert wingårdh275 Narud-Stokke-wiig A/S * proforma A Norway 11 141 121 25.0 Jon Arne Bjerknes/ole wiig/
Narud Jörn276 259 Lewis & Hickey Architects A,PM England 11/12 140 149 7.7 Paul Miele
277 268 Midtconsult A/S MD Denmark 10/11 140 140 16.1 Jens Lauritsen
278 222 Keppie Design A Scotland 10/11 139 191 8.5 Martin English
279 269 iPRoPLAN Planungs GmbH MD Germany 10 139 139 10.0 Jörg Thiele (President)
280 271 Studio Altieri S.p.A CE; A italy 11 138 139 18.5 Guido Zanovello 281 272 Punch Consulting Engineers * S,CE, Env,
PM ireland 10 137 137 8.0 John Pollock282 PRC Group i Sweden 11 137 96 18.3 Peter Bräck283 281 oPAK AS PM,Enr,
E,M Norway 11 136 132 18.9 Jan Henry Hansen284 Kuben Management A/S (Merged with
NRGi Rådgivning A/S in 2012) proforma Enr,E,i Denmark 11 136 72 18.3 Ulf Christensen
285 245 The BwB Partnership CE,S, Env England 11 135 130 10.7 Steven wooler
286 288 ELU Konsult AB S,CE Sweden 11/12 134 128 22.9 Sten Åke Torefeldt
287 284 Dark Group Architects A Norway 11 131 129 26.3 Kjell Eek Østlie
288 280 Clancy Consulting MD England 10/11 130 130 9.4 Alan Bramwell
289 296 iKG AB i Sweden 11/12 129 116 10.9 Mathias ohlson290 258 Balslev Rådgivende ingeniører A/S
(Mogens Balslev) MD Denmark 10/11 128 150 12.0 Bo Memhave291 285 Uticon Dynatherm i,Env, PM Netherlands 11 128 128 9.3 Simon Bruijnooge
292 263 Aukett Fitzroy Robinson plc A England 11/12 126 146 10.5 J. Nicholas Thompson
293 286 Utiber Transport Consulting Management Ltd * CE,PM Hungary 11 126 128 György Lányi
294 293 Proger SpA MD italy 11 126 118 31.6 Umberto Sgambati
295 289 JJM Sp Z o o * PM,i Poland 10 125 125 Marek Poncyljusz
296 291 Henry J. Lyons & Partners Architects A ireland *11 125 120 Richard Doorly
297 287 Verebus Engineers B.V MD Netherlands 11 124 128 10.9 Kees Aling
298 GVA Consultants AB i Sweden 11 123 114 31.3 Mats Lindén
299 278 C.Lotti & Associati - Soc. di ingegneria SpA MD italy 11 122 132 14.3 Patrizia Lotti
300 277 wRc plc Env England 11/12 121 134 9.4 Mark Smith
The european top 300 consulting engineering and architectural groups
average annual number of (Previous- Turnover ceo/managing director 2012 2011 Group Services country report employees year) meUr (december 12)

57Sector Review • The Swedish Federation of Consulting Engineers and Architects • December 2012
and waterfront developments, tourist facilities, sports arenas factories, parks and leisure complexes. With Qatar’s economic and population growth, in a national vision for 2030 there is a substantial demand for municipal and public buildings and premises in various parts of the country. The contracts in this project are worth GBP 72 million and the works are expected to continue for five years, with an option to extend the commission by another two years.
FugroFugro has together with its long-term partner, Constructora Subacuatica Diavaz S.A., won a major order for offshore geological and geotechnical investigations on behalf of Mexico’s national oil company PEMEX. The assignment will continue throughout 2012 and 2013 and is worth EUR 50 million. In Malaysia, Fugro has been awarded a “Life of Field support” com-mission by Murphy Oil worth USD 140 million. The commission is for project management, design and underwater inspections and underwater installations for an offshore oil platform.
In May, Fugro acquired French geo-technical consultants GEOTER, with 30 employees. The firm has expert competence in the fields of geology, earthquake risk assessment and GIS, and has a strong client base in the nuclear power sector, and the mining industry and engineering consultancy sectors.
Mott MacDonald has been awarded a number of major projects during the course of the year. In Belgium, the firm has been appointed as the lender’s technical adviser for a motorway project. The calculated cost of the project, EUR 101 million, is being financed by a private/public partnership (PPP). Mott MacDonald’s role is to monitor the construction process and submit regular progress reports to the lenders.
In Norway, Mott MacDonald has been awarded a second assignment for Bergen’s light-rail transit project. The first assignment was for the planning and detailed design of 7.2 km of double tracks with 2.8 km of tunnels. The new assignment is for the planning and de-tailed design of a depot and workshops
for 50-70 tramcars. The facility will cost EUR 90 million and is due to be finished at the end of 2015. Mott Mac-Donald has also been awarded a major motorway project in India for the 127 km-long four-lane motorway between Raipur and Bilaspur. The assignment comprises design of the entire motor-way, including four large and 19 smaller bridges as well as a railway bridge.
The Alten Group has acquired the Indi-an firm Calsoft Labs, thereby strength-ening its capacity to provide consulting services for the telecom markets and cloud computing in India. The acquisi-tion is also part of the strategic plan to expand from 800 to 2 500 employees in India by 2016. Alten India will help its global clients to improve their research and development activities my making use of local Indian engineers.
Groupe Egis has acquired Brazilian en-gineering consultants Autoservice in São Paulo, who provide specialist engineer-ing services at airports. With this deal and the acquisition of railway consult-ants Vega 2011, Egis has strengthened its position on the Brazilian market.
Mouchel Group has in a joint venture with Enterprise been awarded a major contract by the London transport au-thority for major infrastructure improve-ments and maintenance on motorways over the coming 8-year period. The assignment, which is worth GBP 400 million, is part of a larger programme of economy measures that is being conducted in the London region for motorways and infrastructure invest-ments. The contract is one of four simi-lar contracts that the region has been divided into.
wSP and Genivar mergeWSP Group has merged with Canadian engineering consultants GENIVAR and formed a group of 14 500 employees in 35 countries with a turnover of approxi-mately SEK 13 billion (CAD 171 mil-lion). The merger means that Genivar acquires all the shares in WSP. The firms complement each other both geographi-cally and in terms of competence, which gives the group a strong global presence with a wide range of services for both private and public clients. The CEO of the new group is Pierre Shoiry.
URS Scott Wilson is now known as URS. Since URS’ acquisition of Scott Wilson in 2010, the group’s divisions in Great Britain, Europe and the Middle East have operated under the name URS Scott Wilson, but the group has now chosen to focus its operations on one brand name, URS. The group has almost 48 000 employees and offices in over 40 countries.
Segula Group has appointed Olivier Baujard as its new CEO. Baujard has a background in Deutsche Telekom and Alcatel-Lucent. He succeeds Franck Ghrenassia, who is now Chairman of the Board.
Sener Group has won a major commis-sion in Morocco together with Acciona and TSK in a Spanish consortium, from the Moroccan Office for Solar Energy. The assignment entails the design, con-struction management and operation of a new, solar energy plant in the vicinity of Ouarzazate, a town situated at the foot of the Atlas Mountains facing the Sahara Desert. The investment will be in the region of EUR 500 million.
The Dutch engineering consultancies DHV and Royal Haskoning have an-nounced that they intend to merge and form Royal Haskoning DHV Group (RHDHV) with almost 8000 employees in over 35 countries.
Grontmij back on trackGrontmij is launching a new strategy called “Back on track”, which is based
0
1
2
3
4
5
6
7
1110090807060504030201009998
%8
EBT Median
result margin: european top 300
Source: The Swedish Federation of Consulting Engineers and Architects

58 Sector Review • The Swedish Federation of Consulting Engineers and Architects • December 2012
on the concept of restructuring and generating profit through organic growth. During 2012, the focus has been on restructuring in order to achieve savings in costs, improved efficiency and better management and control. During the period 2013 to 2015, the focus will be on improving profitability. In England, Grontmij has during the year sold Trett Consulting with 70 employees to Driver Group for EUR 3.6 million. The sale of Trett Consulting, which is active in dispute resolution and contractual advice, is a step in the “Back on track” plan in which the focus on core business is a clearly expressed choice of strategy.
Statistics, corporate information and stock rates have been obtained with the help of DowJonesCompanies&Executives, Euroinvestor.co.uk, Creditsafe (Swe), Soliditet Nordic Business Key (Swe), corporate websites and through direct correspondence with companies.
Grontmij is designing the new Mall of Scandinavia in Solna, the largest shop-ping centre in the Nordic area. The project is worth approximately SEK 47 million.
David Cramér
Market Analyst, Swedish Federation of Consulting Engineers and Architects

59Sector Review • The Swedish Federation of Consulting Engineers and Architects • December 2012

60 Sector Review • The Swedish Federation of Consulting Engineers and Architects • December 2012
The Swedish Federation of consulting engineers and Architects
Visiting address: Sturegatan 11postal address: box 55545 • Se-102 04 Stockholm • SwedenTelephone +46 8 762 67 00 • Fax +46 8 762 67 10 e-mail: [email protected] • www.std.se
The Swedish Federation of Consulting Engineers and Architects, STD-företagen, works in the best interests of the member firms with the aim of strengthening their competitiveness and long-term profitability.
STD-företagen wishes to promote high quality, sound development, a high level of profitability and modern working conditions within the member companies.
Our activities are based on three areas of focus:
● profiling
● consultancy business
● competence provision
since we judge these areas to be especially valuable for continued development. Procurement/purchasing and salary conditions/terms of employment are also important features, and within these areas we conduct development based on a long-term plan.
STD-företagen is part of Almega, which is the organisation that represents service companies in Sweden. Almega is the largest federa-tion in the Confederation of Swedish Enterprises. STD-företagen is also a member of both the European (EFCA) and the international (FIDIC) consult ing organisations. On the employer side, Almega is a member of UNICE.
www.std.se