APPENDIX 5 EDUCATION SECTOR
37
Lao Health Master Planning Study Final Report Volume 4: Sector Review A5-1 APPENDIX 5 EDUCATION SECTOR In this section, the current education system, education statistics, and the future vision of the education sector in Lao PDR are reviewed. A5.1 EDUCATION SYSTEM IN LAO PDR The system of formal education in Lao PDR is divided into 4 levels: primary (5 years); lower secondary (3 years); upper secondary (3 years); and tertiary education (3-7 years). Children are supposed to enter primary school at the age of 6. Non-formal education comprises short- term literacy training for adult and skill training. Specialisation begins at the end of lower secondary level. Students can remain within general/academic education for the 3years of upper secondary school, or they can move to vocational training, also for 3 years, which focuses on skill development. Technical training is offered to graduates of either upper secondary school (= grade 11) or vocational training (8 + 3). The technical training school aims at producing the middle- and high-level technical and managerial workforce. The graduates obtain a diploma. The organisation of vocational and technical education is in a transitional stage. Technical training is to be shortened from 3 to 2 years according to a national decree on vocational education development and training issued in October 1998, which will end the current distinction between schools offering courses of different lengths. Some schools are under the jurisdiction of the Ministry of Education, but some are under the other Ministries such as Health, Agriculture and Forestry, and others. In general, vocational training, which consists of technical, nursing and art, dance, and music subjects, confers low-level qualifications (“santon” in Lao) whereas technical training, including technical, paramedical, agricultural, financial, art, -dance and music subjects, confer middle- or high-level qualifications (“sankang”). Teacher training has a separate system. To become a pre-primary teacher, students enrol in a one-year programme after completing upper secondary school. To become a primary school teacher, students take a 1-year training course after completion of upper secondary school. Lower secondary school teachers receive 3 years of training after finishing upper secondary
-
Upload
khangminh22 -
Category
Documents
-
view
1 -
download
0
Transcript of APPENDIX 5 EDUCATION SECTOR

Lao Health Master Planning Study
Final Report Volume 4: Sector Review
A5-1
APPENDIX 5
EDUCATION SECTOR
In this section, the current education system, education statistics, and the future vision of the
education sector in Lao PDR are reviewed.
A5.1 EDUCATION SYSTEM IN LAO PDR
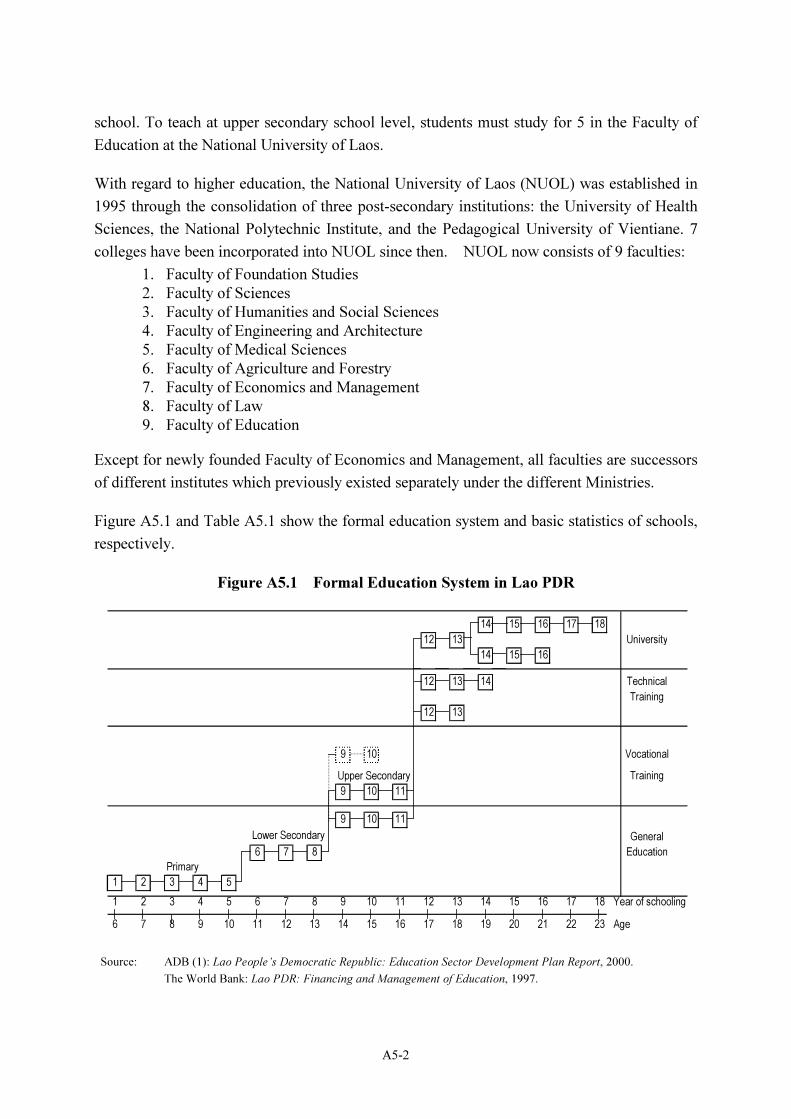
The system of formal education in Lao PDR is divided into 4 levels: primary (5 years); lower
secondary (3 years); upper secondary (3 years); and tertiary education (3-7 years). Children
are supposed to enter primary school at the age of 6. Non-formal education comprises short-
term literacy training for adult and skill training.
Specialisation begins at the end of lower secondary level. Students can remain within
general/academic education for the 3years of upper secondary school, or they can move to
vocational training, also for 3 years, which focuses on skill development. Technical training is
offered to graduates of either upper secondary school (= grade 11) or vocational training (8 +
3). The technical training school aims at producing the middle- and high-level technical and
managerial workforce. The graduates obtain a diploma. The organisation of vocational and
technical education is in a transitional stage. Technical training is to be shortened from 3 to 2
years according to a national decree on vocational education development and training issued
in October 1998, which will end the current distinction between schools offering courses of
different lengths. Some schools are under the jurisdiction of the Ministry of Education, but
some are under the other Ministries such as Health, Agriculture and Forestry, and others.
In general, vocational training, which consists of technical, nursing and art, dance, and music
subjects, confers low-level qualifications (“santon” in Lao) whereas technical training,
including technical, paramedical, agricultural, financial, art, -dance and music subjects, confer
middle- or high-level qualifications (“sankang”).
Teacher training has a separate system. To become a pre-primary teacher, students enrol in a
one-year programme after completing upper secondary school. To become a primary school
teacher, students take a 1-year training course after completion of upper secondary school.
Lower secondary school teachers receive 3 years of training after finishing upper secondary
A5-2
school. To teach at upper secondary school level, students must study for 5 in the Faculty of
Education at the National University of Laos.
With regard to higher education, the National University of Laos (NUOL) was established in
1995 through the consolidation of three post-secondary institutions: the University of Health
Sciences, the National Polytechnic Institute, and the Pedagogical University of Vientiane. 7
colleges have been incorporated into NUOL since then. NUOL now consists of 9 faculties:
1. Faculty of Foundation Studies
2. Faculty of Sciences
3. Faculty of Humanities and Social Sciences
4. Faculty of Engineering and Architecture
5. Faculty of Medical Sciences
6. Faculty of Agriculture and Forestry
7. Faculty of Economics and Management
8. Faculty of Law
9. Faculty of Education
Except for newly founded Faculty of Economics and Management, all faculties are successors
of different institutes which previously existed separately under the different Ministries.
Figure A5.1 and Table A5.1 show the formal education system and basic statistics of schools,
respectively.
Figure A5.1 Formal Education System in Lao PDR
Source: ADB (1): Lao People’s Democratic Republic: Education Sector Development Plan Report, 2000.
The World Bank: Lao PDR: Financing and Management of Education, 1997.
14 15 16 17 18
12 13 University
14 15 16
12 13 14 Technical
Training
12 13
9 10 Vocational
Upper Secondary Training
9 10 11
9 10 11
Lower Secondary General
6 7 8 Education
Primary
1 2 3 4 5
1 2 3 4 5 6 7 8 9 10 11 12 13 14 15 16 17 18 Year of schooling
6 7 8 9 10 11 12 13 14 15 16 17 18 19 20 21 22 23 Age
Lao Health Master Planning Study
Final Report Volume 4: Sector Review
A5-3
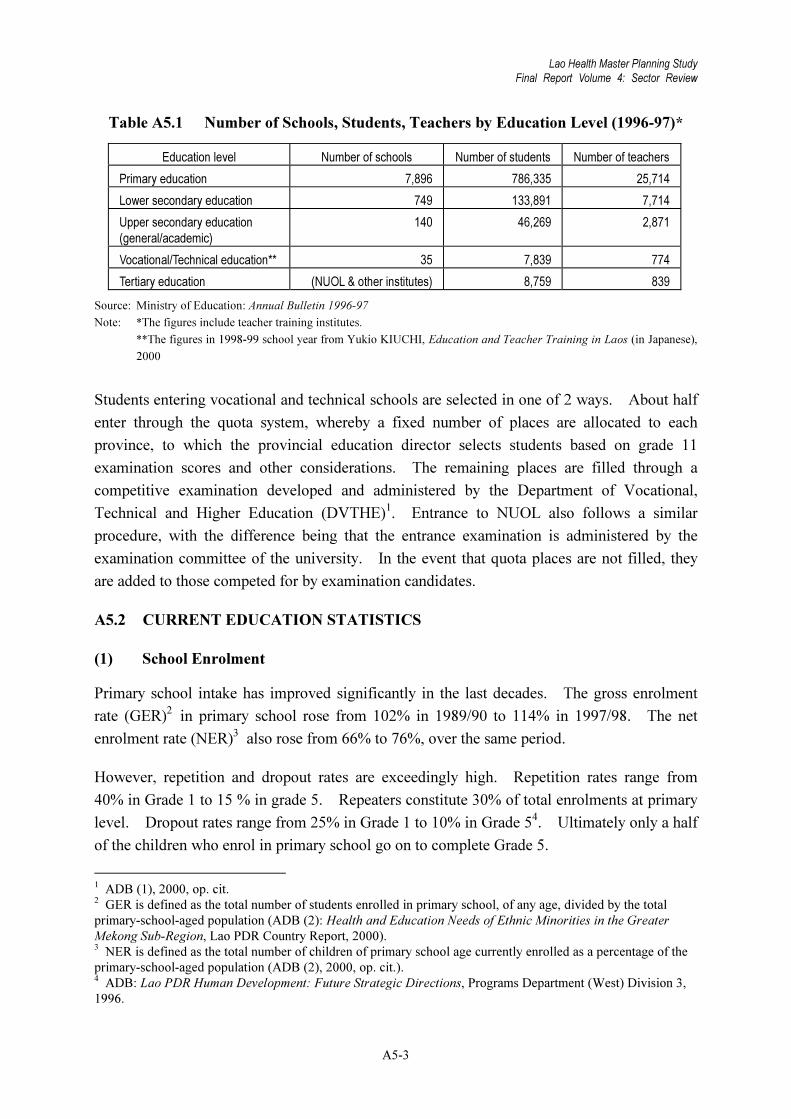
Table A5.1 Number of Schools, Students, Teachers by Education Level (1996-97)*
Education level Number of schools Number of students Number of teachers
Primary education 7,896 786,335 25,714
Lower secondary education 749 133,891 7,714
Upper secondary education
(general/academic)
140 46,269 2,871
Vocational/Technical education** 35 7,839 774
Tertiary education (NUOL & other institutes) 8,759 839
Source: Ministry of Education: Annual Bulletin 1996-97
Note: *The figures include teacher training institutes.
**The figures in 1998-99 school year from Yukio KIUCHI, Education and Teacher Training in Laos (in Japanese),
2000
Students entering vocational and technical schools are selected in one of 2 ways. About half
enter through the quota system, whereby a fixed number of places are allocated to each
province, to which the provincial education director selects students based on grade 11
examination scores and other considerations. The remaining places are filled through a
competitive examination developed and administered by the Department of Vocational,
Technical and Higher Education (DVTHE)1. Entrance to NUOL also follows a similar
procedure, with the difference being that the entrance examination is administered by the
examination committee of the university. In the event that quota places are not filled, they
are added to those competed for by examination candidates.
A5.2 CURRENT EDUCATION STATISTICS
(1) School Enrolment
Primary school intake has improved significantly in the last decades. The gross enrolment
rate (GER)2 in primary school rose from 102% in 1989/90 to 114% in 1997/98. The net
enrolment rate (NER)3 also rose from 66% to 76%, over the same period.
However, repetition and dropout rates are exceedingly high. Repetition rates range from
40% in Grade 1 to 15 % in grade 5. Repeaters constitute 30% of total enrolments at primary
level. Dropout rates range from 25% in Grade 1 to 10% in Grade 54. Ultimately only a half
of the children who enrol in primary school go on to complete Grade 5.
1 ADB (1), 2000, op. cit. 2 GER is defined as the total number of students enrolled in primary school, of any age, divided by the total
primary-school-aged population (ADB (2): Health and Education Needs of Ethnic Minorities in the Greater
Mekong Sub-Region, Lao PDR Country Report, 2000). 3 NER is defined as the total number of children of primary school age currently enrolled as a percentage of the
primary-school-aged population (ADB (2), 2000, op. cit.). 4 ADB: Lao PDR Human Development: Future Strategic Directions, Programs Department (West) Division 3,
1996.
A5-4
Dropout rate is high at secondary level too. Forty-four of each 100 children who enrol in
lower secondary school will enter upper secondary school. Of those, only 23 will complete
upper secondary school. Of every100 children who enrol in Grade 1 of primary school, only
6 will complete secondary education (Table A5.2.).
Table A5.2 Student Progression Rates for Grades 1-11
Grade 1 2 3 4 5 6 7 8 9 10 11 Graduate
Progression Rate (%) 100 86 78 87 85 80 94 61 77 72 72 91
Cohort of 100 100 86 67 58 50 39 37 23 18 13 9 6
Cohort of 100 100 94 57 44 32 23 21
Source: ADB (1), 2000, op. cit.
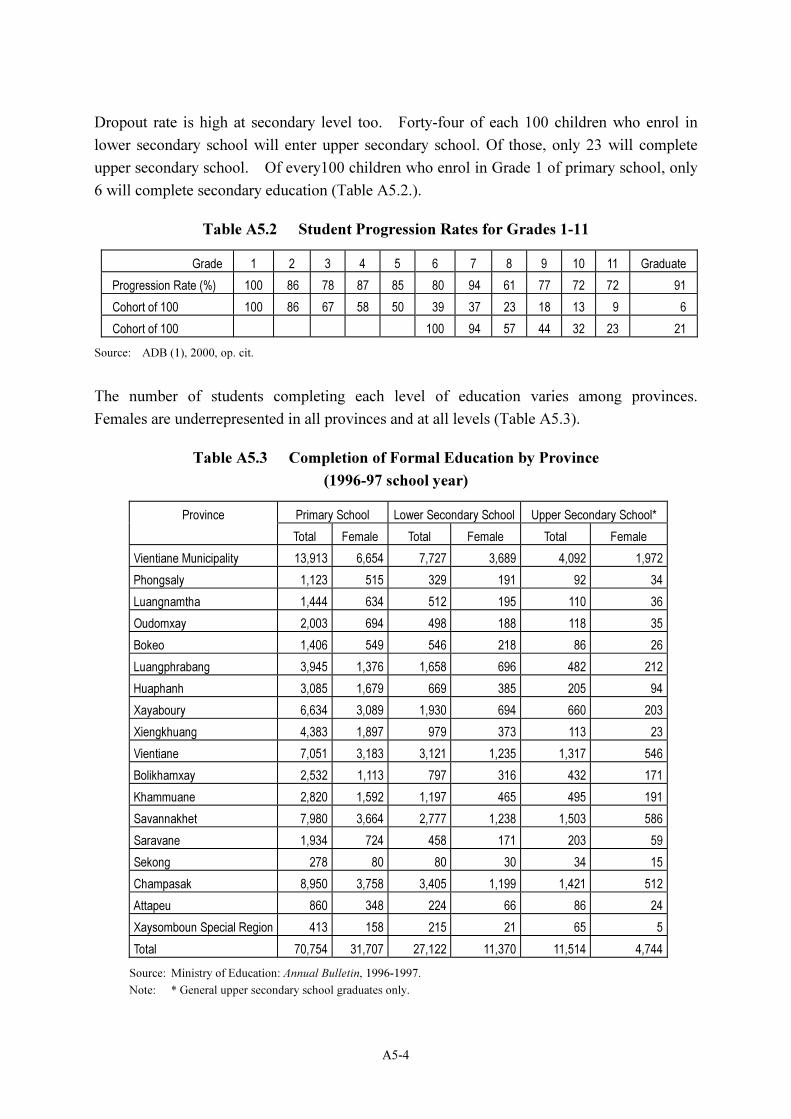
The number of students completing each level of education varies among provinces.
Females are underrepresented in all provinces and at all levels (Table A5.3).
Table A5.3 Completion of Formal Education by Province
(1996-97 school year)
Province Primary School Lower Secondary School Upper Secondary School*
Total Female Total Female Total Female
Vientiane Municipality 13,913 6,654 7,727 3,689 4,092 1,972
Phongsaly 1,123 515 329 191 92 34
Luangnamtha 1,444 634 512 195 110 36
Oudomxay 2,003 694 498 188 118 35
Bokeo 1,406 549 546 218 86 26
Luangphrabang 3,945 1,376 1,658 696 482 212
Huaphanh 3,085 1,679 669 385 205 94
Xayaboury 6,634 3,089 1,930 694 660 203
Xiengkhuang 4,383 1,897 979 373 113 23
Vientiane 7,051 3,183 3,121 1,235 1,317 546
Bolikhamxay 2,532 1,113 797 316 432 171
Khammuane 2,820 1,592 1,197 465 495 191
Savannakhet 7,980 3,664 2,777 1,238 1,503 586
Saravane 1,934 724 458 171 203 59
Sekong 278 80 80 30 34 15
Champasak 8,950 3,758 3,405 1,199 1,421 512
Attapeu 860 348 224 66 86 24
Xaysomboun Special Region 413 158 215 21 65 5
Total 70,754 31,707 27,122 11,370 11,514 4,744
Source: Ministry of Education: Annual Bulletin, 1996-1997.
Note: * General upper secondary school graduates only.
Lao Health Master Planning Study
Final Report Volume 4: Sector Review
A5-5
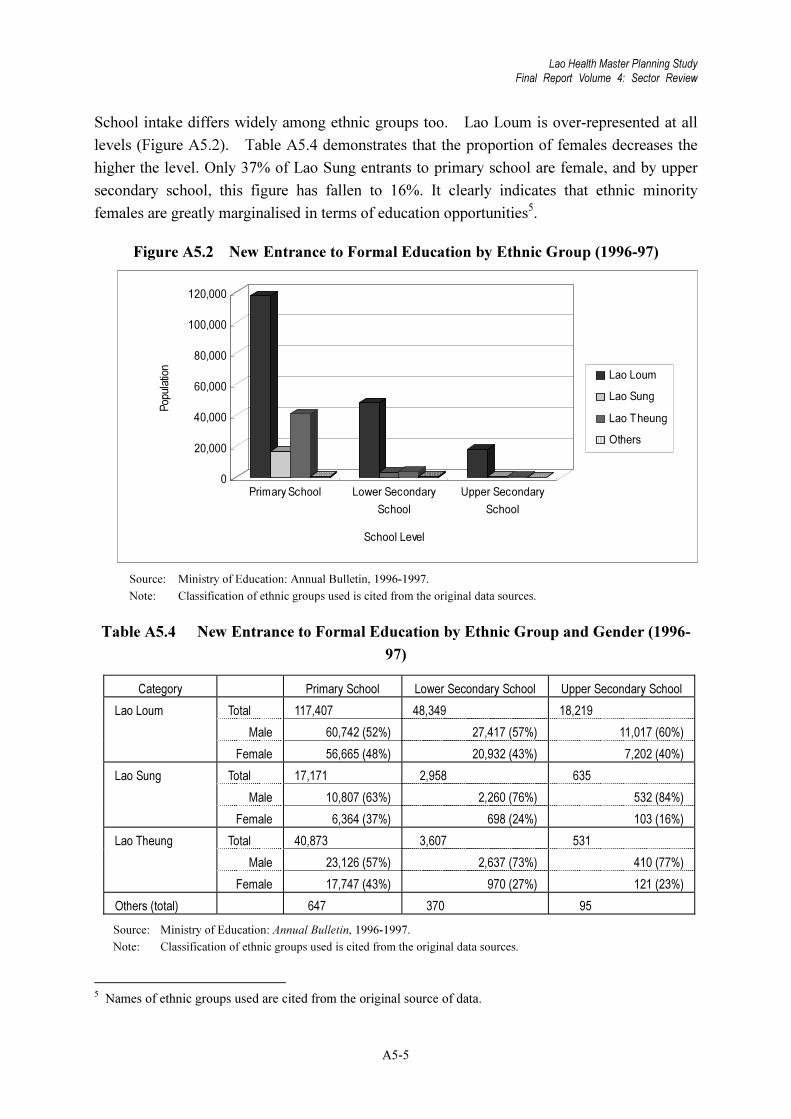
School intake differs widely among ethnic groups too. Lao Loum is over-represented at all
levels (Figure A5.2). Table A5.4 demonstrates that the proportion of females decreases the
higher the level. Only 37% of Lao Sung entrants to primary school are female, and by upper
secondary school, this figure has fallen to 16%. It clearly indicates that ethnic minority
females are greatly marginalised in terms of education opportunities5.
Figure A5.2 New Entrance to Formal Education by Ethnic Group (1996-97)
Source: Ministry of Education: Annual Bulletin, 1996-1997.
Note: Classification of ethnic groups used is cited from the original data sources.
Table A5.4 New Entrance to Formal Education by Ethnic Group and Gender (1996-
97)
Category Primary School Lower Secondary School Upper Secondary School
Lao Loum Total 117,407 48,349 18,219
Male 60,742 (52%) 27,417 (57%) 11,017 (60%)
Female 56,665 (48%) 20,932 (43%) 7,202 (40%)
Lao Sung Total 17,171 2,958 635
Male 10,807 (63%) 2,260 (76%) 532 (84%)
Female 6,364 (37%) 698 (24%) 103 (16%)
Lao Theung Total 40,873 3,607 531
Male 23,126 (57%) 2,637 (73%) 410 (77%)
Female 17,747 (43%) 970 (27%) 121 (23%)
Others (total) 647 370 95
Source: Ministry of Education: Annual Bulletin, 1996-1997.
Note: Classification of ethnic groups used is cited from the original data sources.
5 Names of ethnic groups used are cited from the original source of data.
0
20,000
40,000
60,000
80,000
100,000
120,000
Population
Primary School Lower Secondary
School
Upper Secondary
School
School Level
Lao Loum
Lao Sung
Lao Theung
Others

A5-6
(2) Literacy
Compared to the achievements in school enrolment, less has been achieved in literacy over the
last decade. The literacy rate only increased from 56% in 1987 to 60.2% in 1995, and this rise
is mostly attributed to the increase in school enrolment rather than progress in adult literacy.
Literacy rates vary between males and females and among ethnic groups. Over 65% of
women nationwide are illiterate. Rates are much higher in rural areas and among ethnic
minorities. Table A5.5 breaks literacy rates down by gender and major ethnic group. For
all ethnic groups, female literacy is substantially lower than male. Lao-Phutai ethno-
linguistic groups achieve much higher literacy rates for both male and female than other
groups. The literacy rates for both males and females are lowest in the Tibeto-Burman and the
Hmong-Yao ethno-linguistic group6. This fact clearly indicates that ethnic minority females
are most disadvantaged in terms of Lao language communication.
Regional disparities in literacy rates are also significant (Table A5.6). It appears that females
in rural areas are the most marginalised section of the population.
6 The names of linguistic and ethnic groups used are cited from the original data sources.

Lao Health Master Planning Study
Final Report Volume 4: Sector Review
A5-7
Table A5.5 Literacy Rates for the Population Aged 15 and above by Gender and
Major Ethnic Group
Language Group Ethnic Group Literacy Rate (%)
Male Female Total
Lao-Phutai 84.4 62.3 72.9
Lao 86.0 65.1 75.2
Phutai 77.2 50.1 63.0
Leu 73.9 46.6 59.7
Nhuane 71.2 48.7 59.4
Mon-Khmer 55.6 19.9 36.9
Khmu 60.8 22.7 40.9
Katang 49.3 12.8 30.3
Makong 39.1 12.3 25.0
Xuay 55.7 20.5 36.8
Taoey 54.8 20.3 36.6
Talieng 58.4 25.0 40.4
Lavae 52.2 18.7 34.4
Katu 43.0 10.6 26.2
Lamed 49.0 10.2 28.0
Thin 40.6 20.0 29.6
Alack 54.6 21.3 37.1
Oey 69.4 34.2 50.2
Ngae 52.3 15.6 33.5
Jeng 56.9 19.9 36.8
Yae 45.9 17.9 30.8
Hmong-Yao 45.7 8.1 26.5
Hmong 45.7 8.1 26.5
Tibeto-Burman 22.3 12.0 17.0
Phounoy 58.8 36.2 46.8
Musir 2.9 0.4 1.6
Kor 7.0 0.7 3.8
Others 60.8 32.9 46.8
Total 73.5 47.9 60.2
Source: ADB (2): Health and Education Needs of Ethnic Minorities in the Greater Mekong Sub-Region, Lao PDR Country
Report, 2000. State Planning Committee and National Statistical Centre: Results from the Population Census
1995, 1997.
Note: Names of language and ethnic groups used in the table are as per the original data sources.

A5-8
Table A5.6 Literacy Rates for the Population Aged 15 years and above by Gender and
Province
Province Literacy rate (%)
Male Female Total
Vientiane Municipality 92.2 78.9 85.5
Phongsaly 44.8 25.0 34.6
Luangnamtha 46.6 19.6 32.5
Oudomxay 59.8 24.3 41.6
Bokeo 56.8 27.3 41.6
Luangphrabang 68.3 38.5 52.9
Huaphanh 71.0 40.8 55.5
Xayaboury 75.2 54.8 64.9
Xiengkhuang 73.7 47.1 60.0
Vientiane 83.6 60.7 72.2
Bolikhamxay 77.6 52.6 64.9
Khammuane 70.7 43.1 56.0
Savannakhet 70.2 43.6 56.2
Saravane 65.7 35.2 49.4
Sekong 55.9 24.0 39.4
Champasak 84.7 59.4 71.3
Attapeu 69.2 37.2 52.1
Xaysomboun Special Region 69.5 30.9 50.0
Average 73.5 47.9 60.2
Urban 92.4 78.1 85.2
Rural 69.0 41.2 54.5
Source: State Planning Committee and National Statistical Centre, 1997, op. cit.
A5.3 SCHOOL GROUP SYSTEM OF PRIMARY EDUCATION
At primary level, there are complete schools which are staffed and sized to provide instruction
for the full range of primary grades and incomplete schools which offer often only the first
two or three grades of primary education. Around 90% of households are in villages with a
primary school, but only 55% of households have access to a complete primary school. It is
estimated that half of all complete schools in the country are located in Vientiane Municipality
and Vientiane Province. By contrast, as shown in Table A5.7, only about 15% of primary
schools in Phongsaly, Oudomxay, Luangnamtha and Sekong are complete.

Lao Health Master Planning Study
Final Report Volume 4: Sector Review
A5-9
Table A5.7 Primary School Coverage by Provinces 1997-98
Province Percentage of villages
with primary school
Percentage of villages with
complete primary school
Lao PDR 85 43
Urban 69 60
Rural 87 42
Vientiane Municipality 88 76
Phongsaly 63 14
Luangnamtha 63 16
Oudomxay 66 13
Bokeo 64 20
Luangphrabang 97 37
Huaphanh 100 50
Xayaboury 99 64
Xiengkhuang 91 52
Vientiane 89 58
Bolikhamxay 88 45
Khammuane 88 36
Savannakhet 82 52
Saravane 91 52
Sekong 68 16
Champasak 98 56
Attapeu 85 55
Xaysomboun Special Region 90 54
Source: State Planning Committee, National Statistical Centre: The Households of Lao PDR: Social and
economic indicators, Lao Expenditure and Consumption Survey 1997/98, 1999.
In practice, most primary school students go to the incomplete school in their own village up
to 2nd or 3rd year, and then move to the nearest complete school to continue their schooling,
so that one complete school must take care of the students from several incomplete schools,
constituting a school group as depicted in Figure A5.3. Nationally, the gross catchment area
per complete primary school is more than 100 square km, but variations between provinces
are enormous. In densely-populated Vientiane Municipality for example, a complete primary
school can be found in, on average, every 14 square km.; in Phongsaly, the average catchment
area is 1500 square km7. In remote rural areas, complete primary schools are often too far to
go for students from incomplete primary schools. This contributes, therefore, to the high
dropout rate.
7 The World Bank: Lao PDR: Financing and Management of Education, 1997.

A5-10
Figure A5.3 Image of School Group
A5.4 Development Vision and Plan8
According to the Education Strategic Vision up to the Year 2020, the general goals for
education are as follows:
1. To continue to work towards compulsory education at primary level and
subsequently lower secondary level;
2. To continue to eradicate illiteracy among target groups and upgrade their level of
education;
3. To continue to improve the quality of education with a focus on moral,
intellectual, arts, physical and labour education;
4. To raise the internal efficiency of the national education system by gradually
reducing the dropout and repetition rates;
5. To develop vocational, technical and higher education to meet the needs of the
labour market;
6. To select and introduce appropriate science and technologies in teaching and
learning and pay more attention to scientific research to serve development;
7. To expand education widely, and reduce disparities between localities, provinces,
genders and ethnic groups; and
8. To pay more attention to talented students and handicapped people.
In order to achieve these goals, the objectives of the 5-Year Education Development Plan
2001-2005 are as follows:
(Equitable Access)
• Expansion of school provision, particularly in remote areas,
• Rehabilitation and renovation of existing schools,
8 Ministry of Education: The Education Strategic Vision Up To the Year 2020, Vientiane, 2000.
School Group
Complete Primary School( = Core School)
Incomplete Primary School

Lao Health Master Planning Study
Final Report Volume 4: Sector Review
A5-11
• Facilitation of the role of the private sector,
• Specific programmes aimed at improving access for disadvantaged groups,
• Conducting a feasibility study for open learning,
• Increased access to non-formal education,
• Conducting a feasibility study for distance education
(Quality)
• Improving the quality of teachers at all levels through pre-service and in-service
training programmes,
• Improving the curricula at all levels of education,
• Providing teaching-learning materials, equipment and promoting local production
of low cost materials.
(Relevance)
• Linkage between education and society,
• Revising and adapting the curriculum to respond to changes in society,
• Establishing guidance system for students on schooling in vocational and
technical fields,
• Strengthening the linkages between educational institutions, industry and the
private sector.
(Planning and Management)
• Strengthening operational and human resource development planning,
• Strengthening the existing network of EMIS at central, provincial, district and
school levels,
• Strengthening budget and finance capacity,
• Developing investment programme management and monitoring and improving
aid co-ordination capacity within MOE,
• Establishing an endowment fund for promoting private sector participation.

Lao Health Master Planning Study
Final Report Volume 4: Sector Review
A6-1
APPENDIX 6
THE SITUATION OF ETHNIC MINORITIES IN LAOS
A6.1 CLASSIFICATION OF ETHNIC MINORITIES
In Laos, the following three categories have long been used to classify ethnic minorities: Lao
Lum, Lowlander’ (Tai-Kadai ethno-linguistic family); Lao Thoeng, Midlander’ or Uplander’
(Mon-Khmer ethno-linguistic family); and Lao Sung, Highlander’ (Sino-Tibetan and Hmong-
Mien ethno-linguistic families). This classification is said to be based on: ethno-linguistic
family, customary habitat (and altitude especially), and customary types of agricultural
production (paddy or swidden cultivation). However, these distinctions have ceased to be
used in official parlance1 since the Conference on Ethnic Minorities in 1981. Among the
major reasons for this are those: 1) the Government has been promoting solidarity and unity
among all the people of the nation; and 2) these distinctions do not reflect changes that have
taken place in habitat and agricultural production.
At the moment, the system of 47 groupings developed by the Lao Front for National
Construction (LFNC) is the official classification of ethnic minorities in Laos. This system
was adopted for the Lao census in 1995 and a variety of categories of information by ethnic
group was provided. However, the LFNC reviewed this ethno-linguistic system and a new
system of 49 groupings was proposed at the Conference held in August 2000. The Lao
government is now legislating to incorporate the 49 groupings as the official system of
classification (Table A6.1).
What should be noted here is the fact that an ethno-linguistic system of classification has been
used, and that official ethnic names have been established based on what groups prefer to call
themselves. Changes were made to all the ethnic names for which requests for change were
made by ethnic minorities.
1 However, these three categories are still found in official documents.

A6-2
Table A6.1 Classification of Ethnic Minorities Based on Ethno-Linguistic Families
by LFNC
Ethno-linguistic
Family
Ethnic Name (20001) Comparisons to 1995 Census
1. Tai-Kadai 1 Lao
2 Phuthai
3 Tai Branched from Phuthai group
4 Lue
5 Nhouan
6 Nhang
7 Xek
8 Thai Neua Branched from Lue group
2. Mon-Khmer 9 Kammou
10 Pray Changed name from Thin
11 Xingmoun
12 Phong
13 Then
14 Eudou Not found in 1995 Census
15 Bit
16 Lamet
17 Sam Tao
18 Katang
19 Makong
20 Tri
21 Jru Changed name from Laven
22 Talieng
23 Ta Ooy
24 Jeh
25 Brau Changed name from Lavae
26 Katou
27 Halak Changed name from Alak
28 Ooy
29 Kriang Changed name from Ngeh
30 Cheng
31 Sadang
32 Xouey
33 Nhahoen
34 Lavi
35 Pako
36 Khmer

Lao Health Master Planning Study
Final Report Volume 4: Sector Review
A6-3
Ethno-linguistic
Family
Ethnic Name (20001) Comparisons to 1995 Census
37 Toum
38 Ngouan
39 Meuang Changed name from Mone
40 Kri
3. Sino-Tibetan 41 Akha Changed name from Ko, and integrated Kheu into
Akha
42 Singsili Changed name from Phou Noy
43 Lahu Integrated Muxoe and Kouy, and changed name to
Lafu
44 Sila Changed name from Sida
Source: (1) Lao Front for National Construction: Conference on Agreement of Ethnic Name in Lao PDR, 2000.
(2) State Planning Committee: Results from the Population Census 1995, 1997.
Note: Some official ethnic names which are obviously misspelled in National Census 1995 have been changed by
the JICA Study Team.
A6.2 DISTRIBUTION OF ETHNIC MINORITY POPULATIONS
The ethnic composition of each province is shown in Table A.6.2. Only the three largest
ethnic groups are listed in the data. While many provinces are dominated by the Tai-Kadai
family (Lao, Phutai and Lue) which constitutes 65 percent of the total Lao population, it is of
some interest that the subgroups of the Mon-Khmer family (Kammou and Katou) dominate in
some northern provinces and Sekong, and that the Hmong, belonging to the Hmong-Mien
family, constitutes the majority in Xaysomboun Special Region. No ethnic groups of the Tai-
Kadai family arelisted among the top three in Phongsaly and Sekong. In Luangnamtha and
Oudomxay, whilst the Lue in the Tai-Kadai ethno-linguistic family comes the third, the Lao,
the largest ethnic group, is absent from the list.
The degree of ethnic mixture can be seen from the Table A6.2. The share of the 3 major
ethnic groups of Phongsaly, Luangnamtha, Bokeo and Sekong only amounts to around 60
percent of the total population in these provinces. This means either there is less of a gap
between the top three and other groups compared to other provinces or that there are
numerous ethnic groups in these provinces. As there is only a slight gap between the first and
second most populous groups in these provinces, it is also difficult to infer from this data
which ethnic group is socially dominant. This highlights the need to examine other indicators
to analyse the ethnic situation in each province.

A6-4
Table A6.2 Ethnic Constitution by Province
Province Population
(1995)
1st group (%) 2nd group (%) 3rd group (%) Total percentage of
the 3 major groups
(%)
Vientiane Municipality 524107 Lao (92.6) Phutai (3.1) Hmong (1.4) 97.1
Phongsaly 152848 Kammou (24.4) Akha (20.0) Singsili (19.4) 63.8
Luangnamtha 114741 Kammou (24.7) Akha (23.9) Lue (15.8) 64.4
Oudomxay 210207 Kammou (57.7) Hmong (13.1) Lue (12.2) 83.0
Bokeo 113612 Kammou (23.8) Lue (20.6) Lao (13.4) 57.8
Luangphrabang 364840 Kammou (45.9) Lao (28.6) Hmong (15.2) 89.7
Huaphanh 244651 Phutai (31.5) Lao (30.0) Hmong (20.3) 81.8
Xayaboury 291764 Lao (63.4) Kammou (9.0) Lue (8.1) 80.5
Xiengkhuang 200619 Lao (44.3) Hmong (34.2) Phutai (10.2)? 88.7
Vientiane 286564 Lao (63.8) Phutai (14.0) Kammou (12.5) 90.3
Bolikhamxay 163589 Phutai (41.0) Lao (40.2) Hmong (9.2) 90.4
Khammuane 272463 Lao (59.4) Phutai (21.7) Makong (13.4) 94.5
Savannakhet 671758 Lao (57.5) Phutai (18.9) Katang (8.7) 85.1
Saravane 256231 Lao (60.0) Katang (13.3) Xouey (8.1) 81.4
Sekong 64170 Katou (24.3) Talieng (21.8) Halack (15.5) 61.6
Champasak 501387 Lao (84.8) Lavi (4.9) Xouey (2.4) 92.1
Attapeu 87229 Lao (36.9) Lavi (17.4) Ooy (16.4) 70.7
Xaysomboun Special
Region
54068 Hmong (53.7) Lao (19.4) Kammou (16.7) 89.8
Source: National Statistical Centre, 1995, Census 1995
A6.3 LINGUISTIC CHARACTERISTICS AND SIMILARITIES AMONG ETHNIC
MINORITIES2
Although a variety of means can be used to classify ethnic minorities, the below provides a
brief examination of the level of communication within the same ethno-linguistic families
based on the 49 groupings.
(1) Tai-Kadai Group
8 Lao-speaking groups3 belonging to the Tai-Kadai Group share approximately 90 percent of
their vocabulary and thus communication within this Tai-Kadai group is relatively easy.
(2) Mon-Khmer Group
These 32 ethnic groups are Austro-Asiatic speakers. They can be further divided into 8
subgroups based on linguistic similarities. Communication between the different subgroups is
2 Based on the findings from an interview with an anthropologist working for the Department of Ethnic Groups
and Social Class, Lao Front for National Construction. 3 The Lao language contains many words derived from Sanskrit and Pali.
Lao Health Master Planning Study
Final Report Volume 4: Sector Review
A6-5
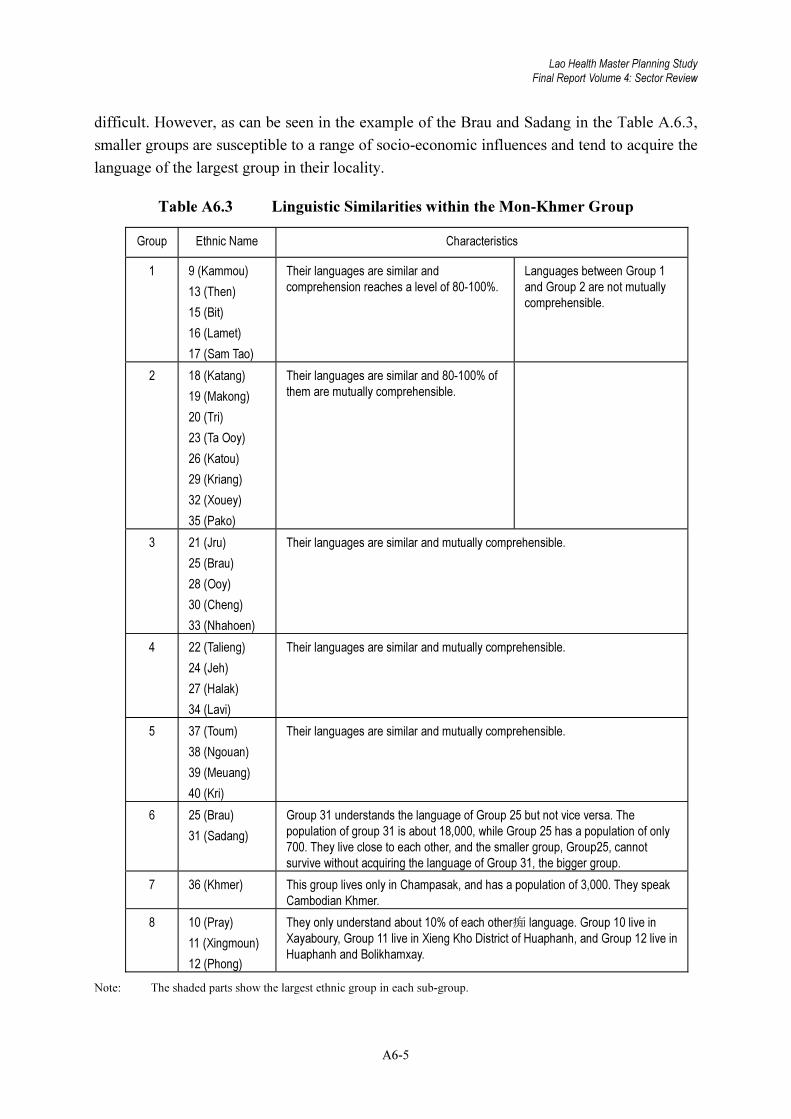
difficult. However, as can be seen in the example of the Brau and Sadang in the Table A.6.3,
smaller groups are susceptible to a range of socio-economic influences and tend to acquire the
language of the largest group in their locality.
Table A6.3 Linguistic Similarities within the Mon-Khmer Group
Group Ethnic Name Characteristics
1 9 (Kammou)
13 (Then)
15 (Bit)
16 (Lamet)
17 (Sam Tao)
Their languages are similar and
comprehension reaches a level of 80-100%.
Languages between Group 1
and Group 2 are not mutually
comprehensible.
2 18 (Katang)
19 (Makong)
20 (Tri)
23 (Ta Ooy)
26 (Katou)
29 (Kriang)
32 (Xouey)
35 (Pako)
Their languages are similar and 80-100% of
them are mutually comprehensible.
3 21 (Jru)
25 (Brau)
28 (Ooy)
30 (Cheng)
33 (Nhahoen)
Their languages are similar and mutually comprehensible.
4 22 (Talieng)
24 (Jeh)
27 (Halak)
34 (Lavi)
Their languages are similar and mutually comprehensible.
5 37 (Toum)
38 (Ngouan)
39 (Meuang)
40 (Kri)
Their languages are similar and mutually comprehensible.
6 25 (Brau)
31 (Sadang)
Group 31 understands the language of Group 25 but not vice versa. The
population of group 31 is about 18,000, while Group 25 has a population of only
700. They live close to each other, and the smaller group, Group25, cannot
survive without acquiring the language of Group 31, the bigger group.
7 36 (Khmer) This group lives only in Champasak, and has a population of 3,000. They speak
Cambodian Khmer.
8 10 (Pray)
11 (Xingmoun)
12 (Phong)
They only understand about 10% of each other痴 language. Group 10 live in
Xayaboury, Group 11 live in Xieng Kho District of Huaphanh, and Group 12 live in
Huaphanh and Bolikhamxay.
Note: The shaded parts show the largest ethnic group in each sub-group.
A6-6
(3) Sino-Tibetan Group
The Sino-Tibetan Group consists of 6 ethnic groups in Laos. 41 (Akha), 42 (Sengsili), 43
(Lahu), 44 (Sila), 45 (Hayi), and 46 (Lolo) speak similar languages and can thus communicate
easily with one another. 47 (Ho) immigrated from China and speak a language derived from
Chinese.
(4) Hmong-Mien Group
This Group consists of two ethnic groups. They are highlanders living in the centre and north
of Laos. As they are originally from China, they speak a language derived from Chinese. 48
(Hmong) traditionally inhabits highlands in the north of Khammuane, while 49 (Iu Mien)
inhabits the north of Bolikhamxay. Although 48 (Hmong) has no script, 49 (Iu Mien) uses
Chinese characters. Communication between these two ethnic groups is difficult.
A6.4 ETHNIC MINORITY POLICY AND ORGANISATION
(1) Ethnic Minority Policy
The Resolution of the Political Bureau Concerning the Affairs of Various Minorities,
Especially the Hmong Minority (Hmong Policy 1981)’ adopted in 1981 was the first explicit
statement of policy on ethnic minorities since the founding the People’s Democratic Republic
in 1975. The Government had little political presence in the areas inhabited by the Hmong,
and thus had limited understanding of and attention to the needs of the Hmong population.
With this policy, the Government aimed at building political foundations in Hmong areas,
improving their living conditions (especially, health and education), and strengthening
national security and defence after a prolonged conflict with the Hmong since 19754.
The Hmong Policy 1981 was later developed into The Resolution of the Central
Administration Committee of the Party Regarding Ethnic Minorities in a New Phase
(Resolution 1992)’ and its scope was expanded to cover other ethnic minorities as well as the
Hmong. The first section of the Resolution, evaluating the implementation of ethnic minority
policy since 1981, contains many self-critical statements such as “not enough attention has
been paid to the ethnic minority issue”, and “measures taken so far have not been so
satisfactory as they should have been”, and “even some of the central organisations concerned
have neglected this issue of importance”. Providing a strong critique of past efforts, it showed
the strong commitment and determination of the Government in tackling the minority-related
problems, setting forth the following essential tasks.
1. Strengthening the political foundations;
4 ILO: Policy Study on Ethnic Minority Issues in Rural Development, 2000.
Lao Health Master Planning Study
Final Report Volume 4: Sector Review
A6-7
2. Encouraging production and opening channels of distribution in order to shift
from a subsistence economy into a productive economy; promoting and
developing the potential of the mountainous areas; improving the quality of life;
3. Expanding education, culture, health and social welfare;
4. Improving national defence and peacekeeping; and
5. Strengthening the Party’s leadership in ethnic minority affairs.
For tasks 2 and 3 especially, a detailed action plan (see Table A6.4) has been developed with a
strong focus on issues of basic human needs, such as occupation, education, culture, health
and social welfare.
Table A6.4 Tasks for Implementation of Ethnic Minority Policy
Task Contents
Economic Affairs • Continue programmes to halt shifting cultivation
• Allocate land for cultivation and raising livestock
• Introduce policies on taxation and credit
• LFNC is in charge of the development of mountainous areas to reduce socio-economic
disparities between urban and rural areas.
Education • Increase the literacy rate
• Expand the primary education network
• Improve access to education for all children of school age
• Improve the system of schools for ethnic minority children
• Develop training programmes for teachers of ethnic minority schools in rural mountainous
areas
Culture • Research Hmong and Khammu scripts using Lao alphabet, and introduce these alphabets
to schools simultaneously with the Lao language
• Promote traditional arts, literature and their heritage to foster the rich cultural diversity of the
nation
• Educate ethnic minorities to eradicate those traditional customs which are backward and
have negative effects on production, life and the state of unity
Health • Promote hygiene, prevent diseases, and eliminate serious epidemics for better health and
longer life expectancy
• Make appropriate investments in the health sector, combining modern and traditional
medicines
Social welfare • Collect data on ethnic retirees, handicapped persons and families of those who died for the
nation to give them special services
Others • Set up information systems in mountainous ethnic areas, for example, radio broadcasts in
minority languages
Source: Central Administration Committee of the Party: The Resolution of Central Administration Committee of the Party
Regarding Ethnic Minority in a New Phase, 1992.
A6-8
(2) Organisation
There are three principal agencies working with ethnic minorities.
The first is the Lao Front for National Construction (LFNC)5, whose main aim is to promote a
sense of solidarity and equality among the population irrespective of social status, ethnicity
and religion. The LFNC currently has overall charge of the planning and implementation of
ethnic minority programmes. The LFNC co-ordinates with the Party, the ministries and
relevant committees.
The second agency is the Ethnic Minorities Committee of the National Assembly. Its
obligations are principally legal in nature, including drafting legislation, bills and budgets.
Thirdly, and in addition to the research section of the LFNC, within the Ministry of
Information and Culture, there are two institutes engaging in research on ethnic minorities: the
Institute for Cultural Research conducting anthropological studies, and the Institute for
Linguistic Research carrying out linguistic research6.
5 The forerunner of the LFNC was Neo Lao Hak Xat (Lao Patriotic Front) which served as the major
governmental organisation until the founding of the People痴 Democratic Republic. In 1987, two Offices were
combined to form a Central Committee which is placed at the same level as the ministries. 6 ILO: Policy Study on Ethnic Minority Issues in Rural Development, 2000
Lao Health Master Planning Study Progress Report 1
A7-1
APPENDIX 7
WATER SUPPLY AND SANITATION
A7.1 BACKGROUND
The National Clean Water Project in Laos was established in 1981 as part of the Water Decade
initiated by the United Nations. The purpose of the project was to supply clean water to urban
and rural areas; it was managed by two different institutions : the clean water supply for urban
areas (Nampapa) was under the Committee of International Cooperation (CIC), while the clean
water supply for rural areas (Nam Saat) was under the National Institute of Hygiene and
Epidemiology.
From 1981 to 1992, Nam Saat followed very much a donor-driven approach. WHO and UNDP
supported national capacity building, while UNICEF and EU were supporting the hardware
component of the project. In 1989-90 AusAID funded a Nam Saat project implemented by
UNICEF. Some NGOs (Mennonites, Quakers Service in Laos) assisted district authorities
(Savannakhet, Oudomxay, Phongsaly) with technical training, and the supply of materials and
equipment necessary for the installation of water schemes.
A7.2 RURAL WATER SUPPLY AND SANITATION SECTOR STRATEGY
From 1994 to 1997, SIDA, UNDP-World Bank, and UNICEF provided joint support to Nam
Saat in formulating the Rural Water Supply and Sanitation Strategy (RWSS Sector Strategy).
The strategy was launched in November 1997, and Nam Saat as an institution established units
in all provinces and districts.
The RWSS Sector Strategy begins with the statement: "Water and Environment Health have a
well acknowledged importance in Lao PDR, where they are seen as important components in
ensuring the wellbeing of Lao people and as important preconditions for rapid development.
Access to water and sanitation is recognised as a major component for improving primary
health care in rural areas, and as such, is an essential link in the process of rural
development"1.
The Sector Strategy set up a long-term goal: Every rural person of the Lao PDR has access to
safe and adequate water supply and sanitation facilities and lives in a hygienic environment.
1 Concept Paper of Nam Saat, October 1994

A7-2
The specific objectives of the RWSS strategy are to:
1) Improve personal and community hygiene practices, and
2) Increase people's access to clean water supplies and use of latrines in an effective and
sustainable manner.
The strategic directions of RWSS show a significant shift from the past approach driven by
external support to a Lao owned (Lao-led, Lao-management) approach. The main strategic
points are:
• bottom-up planning from community to district, province and centre , guided by
Lao-led strategic principles
• hygiene awareness (behaviour change), provision of latrines and water supply in an
effective and sustainable manner.
• concentration on under-served, poor and remote areas
• after Nam Saat informs entire community about technical options (informed
choice), everyone participates in decisions (community demand)
• community contributes to cost of construction (in labour, local resources, and
sometimes cash) and complement government technical assistance and external
funds. User fee system becomes universal.
• Community Water and Sanitation Committees (WATSANS) collect user fees for
maintenance, repairs, and future extensions.
• Many government offices and mass organizations (LWU, LYU, Rural
Development Office, Education, Health and others) involved through District and
Provincial Co-ordination Units.
• Strengthen collaboration and co-ordinate efforts.
• District Nam Saat work directly with communities on all aspects, Provincial Nam
Saat provides back-up support on planning, technical training, management and
dissemination of learning with support from Nam Saat Central.
• Encouraged to expand services, especially to accessible well-off areas.
• Central level sets standards and enforcement process.
• Women and minorities actively recruited into all types of work
The guiding principles for the RWSS Programme Planning and Operations are:
1. Equity of service
2. Partnership
3. Bottom-up, decentralised planning
4. Learning process

Lao Health Master Planning Study Progress Report 1
A7-3
5. Gender and Cultural Sensitivity
6. Accountability and Transparency
7. National Policies and Standards
The launching of the RWSS Sector Strategy (Nam Saat) was followed by a transitional period
from the donor-driven approach to the Lao owned approach.
In the second phase of SIDA's support, bilateral funds were directly channelled from SIDA to
support the transitional programme. This support programme was expected to bring all
activities in line with the principles of the sector strategy, and to accelerate the process through
which Nam Saat will ultimately take full responsibility for all aspects of the national
programme. Three provinces (Huaphanh, Bolikhamxay, Sekong) were selected to be the
spearhead provinces for the implementation of RWSS funded by SIDA.
Although the national Programme as a whole will be under the responsibility and management
of Nam Saat from the outset, supporting inputs will still be necessary from UNICEF and the
UNDP-World Bank Water and Sanitation Supply (WB WSP), Nam Saat's traditional partners.
The SIDA support for Nam Saat is to be channelled in three linked ways:
• through Nam Saat directly;
• through UNICEF (for implementing the school latrine programme and for the
RWSS implementation in 3 spearhead provinces, regarded as a SIDA Project);
• through the UNDP-World Bank Water and Sanitation Program (for facilitating the
institutional learning process and its documentation, and for a small number of
training activities).
The support of UNICEF and the UNDP- World Bank Programme focus on aspects of
personnel, applying the Strategy Framework, and helping establish the Water Resources
Council. In order to make the transition successful, Nam Saat staff of all levels require vigilant
support, guidance and training development. The central office staff should perform primarily
policy-making, national level planning, investing, training, learning/researching, advising and
supporting functions, while the province and district staff should concentrate on assisting and
advising the communities, and regulation and monitoring efforts. A key aspect will be the
further development of management skills at all Nam Saat levels, especially in
accountability-related tasks (account-keeping, written and oral reporting, and monitoring and
evaluating).
A World Bank Loan is provided for the implementation of RWSS in Oudomxay and Phongsaly
as a pilot programme applying the sector strategic directions, where the WB WSP is closely
working with the institutional learning process.
A7-4
After the end of SIDA's Phase II support, SIDA will continue to provide funding support to the
sector for a short transition period, but will reduce its contribution to zero, while Nam Saat, the
Government and others progressively increasing their share of investment in order to keep total
sector investment at the same level.
The RWSS schemes are: gravity fed system, bore-holes, protected dugwells, water spring
protection, family latrines, and school latrines.
A7.3 PRESENT SITUATION OF RWSS IMPLEMENTATION
Since the start of the transitional period Nam Saat has been able to maintain its capacity to
support and promote implementation activities under the national programme.
Project activities have been implemented throughout the country in spite of the fact that Nam
Saat have had to devote considerable management attention and staff time to the introduction of
new methodologies and to creating learning processes, and the slow pace of the SIDA project
due project specific problem not related to the Nam Saat capacity as an institution. NGOs (more
than 40), and other donor agencies’ projects (AusAid, GTZ, EU) have compensated for this by
implementing other activities in the sector.
The RWSS implementation is being carried out by a large of number of actors, which creates a
strong dynamic of its own. In some reviews and evaluations of Nam Saat, it is suggested that the
number of RWSS actors seems to be too large to be controlled by a single institution; and the
growth of the sector i.e. the rate at which water supply and sanitation coverage is increased, will
be contingent on how efficiently the RWSS functions.
The annual reports on the implementation of Nam Saat show that water coverage is consistently
greater than latrine coverage, that implementation is mainstreaming on scheme construction /
installation and repairs; while there seem to be fewer hygiene activities related to the activities
of water and sanitation supply, which would ensure more effective and sustainable impacts.
Some review reports point out the increasing involvement of the private sector in water and
sanitation construction. It is evident that the private sector has been involved in the RWSS
implementation for two reasons:
1. Water is a basic need. In rural areas where roads have been constructed and where
people can afford it, the private sector competes with the Nam Saat national
programme and other projects; road construction attracts people to live along the
roadside, and this creates a need for latrines.
2. Nam Saat national programme has devoted much of its time to staff capacity building
(training and processes for interaction learning) and strengthening the institution (and
its management). This has led to a slow pace in implementation and providing
technical service for construction / installation to many projects, including the

Lao Health Master Planning Study Progress Report 1
A7-5
SIDA/UNICEF project in 3 spearhead provinces. In order to perform the work on time,
some donor-agencies and NGOs have invited the private sector to become involved in
water and latrine construction.
The large number of RWSS actors and the involvement of the private sector leads the author of
the mid-term review report of Nam Saat (April 2001) to suggest that Nam Saat as an institution
and as a national programme needs to review its Goals and Roles.
It is proposed that Nam Saat should:
• for keeping in line the existing rapid development of the RWSS regardless the
national standard of the technical process for the implementation performance.
• increase back-stopping support on planning, monitoring, coordinating experience
of technical construction design, and facilitating projects for the equity of service
(since the most inaccessible areas are less likely to be served by other projects or
the private sector) 2
• promote and support improved hygiene behaviour change in parallel with the
expansion of coverage of water systems and latrines, which will lead to achieving
the long-term goal of Nam Saat as per the Sector Strategy paper.
A statement at the annual meeting of NAG noted that the campaign for latrine use is done with
dispersion. Many national programmes and projects are working actively at the rural village
level to promote the use of family and school latrines. But when rural people, both adults and
children, come to some health centres and hospitals, the latrines are unusable because they are
either closed or too dirty to contemplate using. This fact pushes them back to their old
behaviour; this shows that hygiene awareness and behaviour of health staff at local health
facilities is also of some concern.
The monitoring of primary health care education (including hygiene and sanitation) is needed
not only for rural villagers and schoolchildren, but also for health staff at rural health facilities
in order that health worker's behaviour is a proper model for people (latrine use, latrine
cleaning, encouraging patients to use latrines and keeping latrines clean at the health facilities).
There are some suggestions that health sector investment should focus more on malaria control
and prevention of diarrhoeal diseases, but there is no doubt that basic disease prevention is
related very much to personal hygiene behaviour and maintenance of a safe environment.
Nam Saat as an institution still has many challenges to overcome before it achieves the
long-term goal stated in the Concept paper of October 1994:
2 statement given at the annual meeting of NAG (National Advisory Group for RWSS
supported by WB WSP)

A7-6
Mentioned in the National Work Plan of Nam Saat, reviewed in October 2000 as Nam Saat's
Programme Goals:
• To improve access, use and sustainability of new and existing water supply and
sanitation facilities in rural areas
• To maximise the health and socio-economic impact of water and sanitation
facilities in the context of rural development and water resource management.
• To reduce infant mortality and morbidity rates in rural areas.
Table A7.1 Implementation in Coverage of water and sanitation
% of population covered % of increase
on previous year
No
Areas
1999 - 2000 2000 - 2001 1999 - 2000 2000 - 2001
Expected
coverage by year
2005
1. Water Supply 55.06 5.74 3.06 66.51
2. Sanitation 35.9 39.72 1.43 2.12 47.18
3. School Latrines 8.19 4.62 1.65 21.00
Table A7.2 Planned and actual implementation, Oct 2000 – June 2001
new construction repairs No
..
scheme planned implemented planned implemented
1 Gravity fed system 200 164 80 8
2. Bore-holes 897 714 0 145
3. Dug well 303 172 0 24
4. water jar 14 30 - -
5. community water supply 14 2 1 0
6. water spring protection 2 1 - -
7. Sanitation (family latrine) 14.088 16.547 - -
8. School latrine 150 135 - -
Table A7.3 Proportion of investment by the funding partners (%)
No
. Scheme Government Community Funding agency
(international)
1. Gravity fed system 12.64 20.52 66.83
2. Bore-hole 1.97 19.42 78.59
3. Dug well 0.29 27.01 72.69
4. water jar no information no information no information
5. community water supply no information no information no information
6. water spring protection 0 18.79 81.20
7. sanitation (family latrine) 2.70 85.12 12.17
Lao Health Master Planning Study Progress Report 1
A7-7
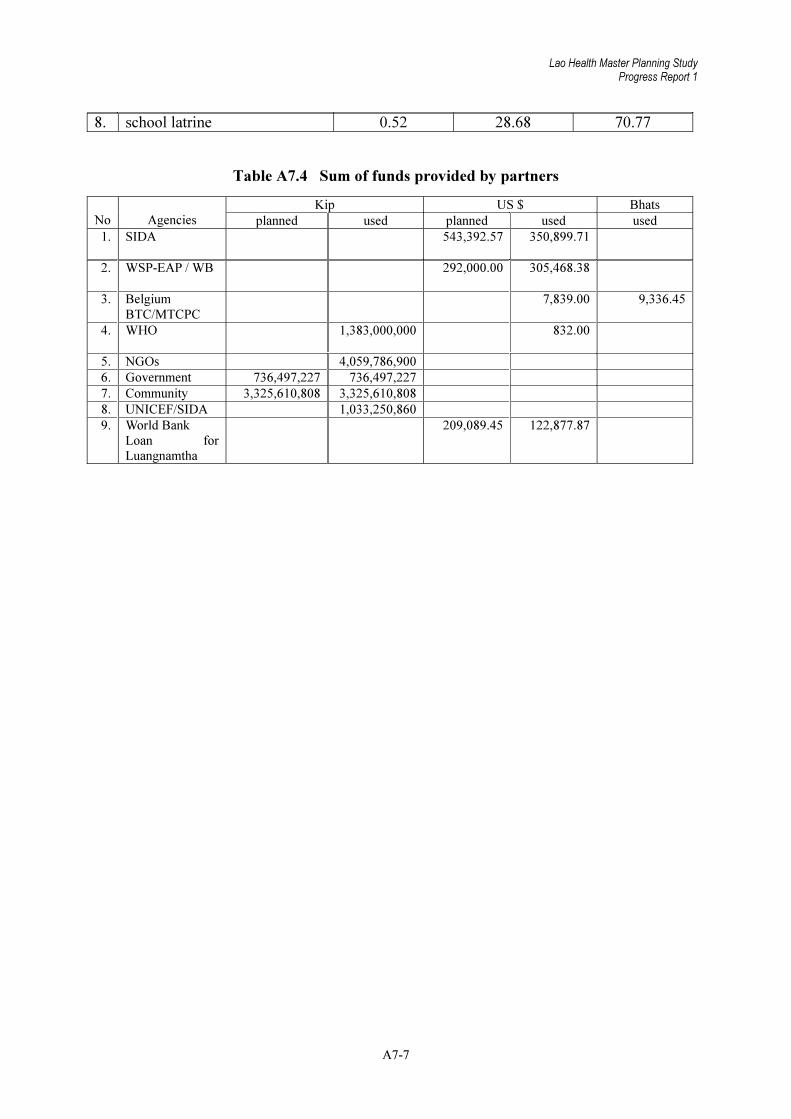
8. school latrine 0.52 28.68 70.77
Table A7.4 Sum of funds provided by partners
Kip US $ Bhats No
Agencies planned used planned used used
1. SIDA 543,392.57 350,899.71
2. WSP-EAP / WB 292,000.00 305,468.38
3. Belgium BTC/MTCPC
7,839.00 9,336.45
4. WHO
1,383,000,000 832.00
5. NGOs 4,059,786,900
6. Government 736,497,227 736,497,227
7. Community 3,325,610,808 3,325,610,808
8. UNICEF/SIDA 1,033,250,860
9. World Bank Loan for Luangnamtha
209,089.45 122,877.87
Lao Health Master Planning Study Final Report Volume 4: Sector Review
A8-1
APPENDIX 8
GENDER
A8.1 COMMITMENT OF THE GOVERNMENT ON GENDER EQUALITY
The Lao Constitution of 1991 defines the equal rights of men and women through the following
points:
• Husband and wife enjoy equal rights to property.
• Both men and women can inherit property.
• A husband and a wife have an equal right to all family property, regardless of who
is the actual wage earner.
• Marriage is monogamous.
• Family surname can be from the husband, the wife, or both can retain their own
names.
• Men and women have an equal right to vote after 18 years of age.
• Men and women have an equal right concerning political, socio-economic, cultural
and familial activities.
• There is not any discrimination with regards to salaries, wages, bonuses and
pensions.
• Working age for men is from 16 to 60, and that for women is from 16 to 55.
The government also signed the Convention on the Elimination of all forms of Discrimination
Against Women (CEDAW) in 1980, initiated by the United Nations.
In 1995, the government ratified the “Platform for Action” from the Fourth UN Conference on
Women in Beijing.
A8.2 GENDER SITUATION IN LAO PDR
Lao PDR has a population of 5,218,300, of which males make up 49.4% (2,579,000) and
females 50.6% (2,639,300)1.
1 NSC, Basic Statistics of Lao PDR 2000
Lao Health Master Planning Study Final Report Volume 4: Sector Review
A8-2
Lao women represent 10% of the total workforce. Lao women represent 49% of public health
employees, 57% of medical doctors, 25% of public employees and 40% of schoolteachers2.
In the productive sectors, women represent 60% of handicraft workers, 50% of traders and 20%
of factory workers.
Adult literacy is estimated at 50%, but the literacy rate among female is estimated at 35 %
compared to 65%. among men
A8.3 INSTITUTIONAL MECHANISM: LAO WOMEN’S UNION
The Lao Revolutionary Party established the Lao women’s association in 1954 in the half of the
country they controlled at the time. The Lao Women’s association was set up for the purpose of
participating in the war for national liberation. The association's members were mainly patriotic
women living in rural areas.
After 1975, the Association of Lao Women became the national organisation for women. Its
membership was expanded to include women working in the government system and village
women.
Presently the purpose of the Lao Women Union's (LWU)is to protect the rights and interests of
Women and Children of all Lao ethnic groups.
The supreme organ of the LWU is the Central Committee, which is elected every four years.
Each province has a LWU Office whose head who is a member of the central committee. The
Provincial LWU, on behalf of the central union, is responsible for co-ordinating with the
district Lao Women’s Union, which in turn co-ordinates with the Village LWU.
In each institution of the government system there is also a LWU committee. The committee's
head is a member of the Central Committee of the LWU.
The central LWU coordinates with its committee vertically (provincial and district) for
implementing all kinds of development activities and for social-political education.
The central LWU co-ordinates with LWU in the ministries and in state institutions only for
social-political education.
The LWU’s main funding source is from the National Budget, since the amount collected from
membership fees is very modest.
The LWU was the first institution to work with external aid agencies because:
2 MOH: Country Report of the Council of Medical Science, 1995

Lao Health Master Planning Study Final Report Volume 4: Sector Review
A8-3
• it was recognised that Lao women, like other women in the less developed world,
perform most productive activities in the family, including caring for the health of
family members; and
• members of CEDAW were allowed to give foreign aid to Lao women.
Collaboration with foreign agencies has allowed the LWU to gain the technical knowledge and
management skills needed for development work.
The women who gained these skills are only those who are working the vertical institutional
line(?) of the LWU, since existing working procedures in the country do not give opportunities
to LWU members in the ministries and institutions to share their knowledge and experience.
However, many ministries and institutions also work with outside agencies as well as Lao
Women Union.
Supported by international financial and technical aid, the Gender Resource Information for
Development Centre (GRID Centre) was established in 1997 for gender development.
At present, based on the availability of resources, the GRID Centre is working:
• To introduce basic gender awareness to members of the LWU and its partners in
development work (local Agriculture, Education and Health offices);
• To develop the capacity of the gender resource group (gender trainers) for the LWU
and its network.
• To disseminate information on gender aspects of socio-economic development.
The main activities of the GRID Centre are:
• To carry out Training on Basic Gender Awareness;
• To carry out Training on Gender Sensitive Planning; and
• To provide Gender Research Assistants to donors’ projects.
The GRID Centre is assisting the central Lao Women Union to train groups of trainers for
promoting basic gender awareness around the country.
Supported by the government committee for Planning and Co-operation, the GRID Centre is
preparing to provide training on Gender Sensitive Planning to local planning divisions
throughout the country.
Beside the GRID Centre, the National Statistics Centre has also incorporated gender-related
data categories into the national census.
Lao Health Master Planning Study Final Report Volume 4: Sector Review
A8-4
A8.4 GENDER-RELATED ACTIVITIES OF MINISTRIES
In the line ministries and technical institutions, there has been some gender development
activities courtesy of development projects and programmes supported by donor agencies, but
these have not been integrated with existing LWU activities or ministry policy. ACTIVITIES
of Donors and NGOs for Gender Development
Mainly the donor agencies are developing gender awareness through programmes with:
Ministry of Agriculture and Forestry, mainly with programme on farming systems, irrigation,
forest and land allocation, watershed conservation, livestock. For example, in the Department
of Forestry, Sida has worked for gender mainstreaming, but a substantial impact on policies and
action plans has not yet been seen.
The Ministry of Education has introduced programmes such as Women's Education Project,
Basic Education (Girls) Project, Strategies for the Promotion of Basic Education for Women
and Girls, Non-Formal Education, Illiteracy Elimination for Adults, programme for Writing
and Reading Materials for Women with limited reading skills.
The LWU within the Ministry of Education has achieved more in the process of gender
development, in that a Gender Team has been established to study the feasibility of
incorporating Gender into the curricula of various Education programmes.
Ministry of Health;
As well as the input of LWU and donor agencies in gender development, many NGOs are also
making efforts to introduce gender issues to people in project villages and to local counterparts
at province and district level.
All gender development activities carried out can be classified as aiming at:
• introducing Basic Gender Awareness; or
• Understanding Gender, which differs from sex. Gender refers to the economic,
social and cultural attributes and opportunities associated with being male and
female:
Understanding Gender, which refers to the differences between men and women in what they
do, means:
• To encourage men and women to participate in equal numbers in project and
programme activities.
• Organising equal numbers of women and men to also plan and evaluate
programmes.

Lao Health Master Planning Study Final Report Volume 4: Sector Review
A8-5
These two topics do not imply the impact to the changes for the Gender Equality. It is visible
that women participating in equal number with men in any program activities at any level are
under-represented at policy making, management and decision-making.(?don’t understand this
paragraph?)
It is recognized theoretically that the crucial aspects in making changes for the gender equality
are:
• The empowerment of women to influence what is valued and to share
decision-making about society’s development priorities and directions;
• The motivation of more men to participate as equal partners of women in the
process of defining the visions and strategies for a more gender-equal society;
The crucial step for more advanced gender development in the country will not happen unless
there is a country-wide perspective and policy for Gender development announced by the Party
and Lao Government.
Presently a Lao project supported by the ADB (Asian Development Bank) is being
implemented to strengthen the capacity of LWU staff in the area of Gender Development. It is
expected that the outcome of this project will be a Proposal for a country perspective and
policy.

Lao Health Master Planning Study Final Report Volume 4: Sector Review
A9-1
APPENDIX 9
POVERTY ALLEVIATION
A9.1 POVERTY STATUS IN LAOS
In Laos, poverty is measured by per capita real consumption of food and non-food items
based on a poverty line. The poverty line was officially set at 2,000kcal per person per day.
The percentage of those who fall below this line was 45 percent of the total Lao PDR
population in 1992/93 and 38.6 percent in 1997/98.
Looking at the data in 1997/98 by province, the top four provinces were all in the northern
region: Houaphanh (74.6%), Oudomxay (73.2%), Phongsaly (64.2%) and Luangnamtha
(57.5%).
Table A9.1 Percentage of the Poor by Region and Province - 1992/93 and 1997/98
Region/Province 1992/93 1997/98 Growth Rate
Vientiane Municipality 24.4 12.2 -13.9 Northern Region 58.4 52.5 -2.1
Phongsaly 68.7 64.2 -1.3 Luangnamtha 60.3 57.5 -1.0 Oudomxay 51.1 73.2 7.2 Bokeo 63.5 37.4 -10.6 Luangphrabang 62.7 49.4 -4.8 Huaphanh 78.4 74.6 -1.0 Xayaboury 30.1 21.2 -7.0
Central Region 39.5 34.9 -2.5
Xiengkhuang 57.3 34.9 -9.9 Vientiane 28.1 24.3 -2.9 Bolikhamxay 10.6 25.8 17.8 Khammuane 43.7 41.6 -1.0 Savannakhet 45.7 37.1 -4.2 Xaysomboun S R 55.0
Southern Region 45.9 38.4 -3.6
Saravane 36.7 39.6 1.5 Sekong 65.9 45.7 -7.3 Champasak 43.6 35.6 -4.1 Attapeu 72.2 45.3 -9.3 All Laos 45.0 38.6 -3.1
Source: ADB, 2001, Participatory Poverty Assessment1
1 The original source of the data is Laos Expenditure and Consumption Survey 1992/93 and 1997/98.
A9-2
A comparison of data between 1992/93 and1997/98 demonstrates a growing disparity
between the urban and rural areas. Vientiane Municipality showed a 13.9 percent decline,
whilst all other provinces a slight decline between 2.1 and 3.6 percent. An increase in poverty
was seen in Oudomxay (+7.2%), Bolikhamxay (+17.8%) and Saravane (+1.5%).
A9.2 POVERTY DISTRIBUTION
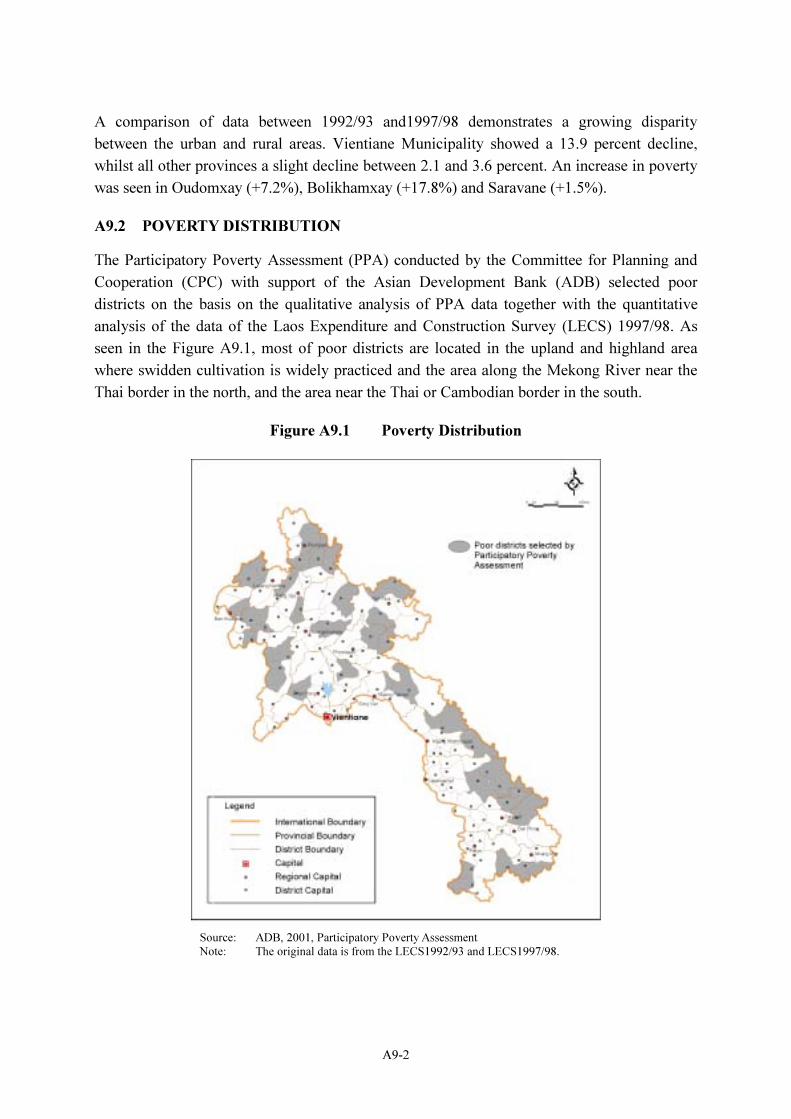
The Participatory Poverty Assessment (PPA) conducted by the Committee for Planning and
Cooperation (CPC) with support of the Asian Development Bank (ADB) selected poor
districts on the basis on the qualitative analysis of PPA data together with the quantitative
analysis of the data of the Laos Expenditure and Construction Survey (LECS) 1997/98. As
seen in the Figure A9.1, most of poor districts are located in the upland and highland area
where swidden cultivation is widely practiced and the area along the Mekong River near the
Thai border in the north, and the area near the Thai or Cambodian border in the south.
Figure A9.1 Poverty Distribution
Source: ADB, 2001, Participatory Poverty Assessment
Note: The original data is from the LECS1992/93 and LECS1997/98.

Lao Health Master Planning Study Final Report Volume 4: Sector Review
A9-3
A9.3 MAJOY UNDERLYING CAUSES OF POVERTY
(1) Background
The below briefly analyses the major problems the Lao PDR poor populations currently faces
based on the findings of the village survey by the joint MOH/JICA Survey Team, together
with those of the PPA surveying 84 villages. These problems appeared to underlie poverty in
Laos.
1) Poverty caused by decreased productivity: implications of the resettlement
programmes and the policies to reduce swidden cultivation
Decreased rice productivity is the biggest problem raised by the farmers affected by the
government policies and programmes to reduce swidden cultivation and encourage
resettlement into lowland areas: (1) absence of the knowledge and skills on paddy cultivation
together with non-workable irrigation systems in the resettled area caused lower rice
productivity than expected; and (2) due to a decrease of land available for swidden
cultivation, the fallow period was reduced from 7-8 years to once 2-3 years resulting in soil
depletion and thus productivity per hector was decreased more than by half. Decreased rice
production has serious effects on livelihoods as well as the physical and mental health of the
people. With increasing mistrust to the present administration and a sense of uncertainty for
the future resulted in increasing opium addiction2.
2) Poverty caused by livestock losses: the vaccination service does not reach into poor
villages
The livestock is very important to livelihood of farmers in Laos. Not only plays it an
important role in agricultural production but also is an important household asset functioning
as insurance in case of poor harvests or as merchandise to generate cash when necessary.
Many farmers have experienced losses of livestock, such as water buffalo, cattle and chicken
because of infectious animal diseases. Although the governmental system to provide the
vaccination service for livestock through the provincial livestock and fishery offices3 is
already in place, it is not put into full operation and the vaccination is, in many cases, beyond
the reach of most of the poor villages.
3) Poverty caused by the exhaustion of natural resources
Many farming households rely heavily on the forests and river for supplemental foods, such
as mushrooms, bamboos, fish and frogs. However, wild foods are becoming increasingly
scarce due to recent population pressure, disafforestation, and its over-exploitation for market
2 Opium is widely used in the north and it is commonly used at 55 percent of the villages surveyed in the north.
By ethnic group, 62 percent was Tibeto-Burman, 31 percent is Hmong-Myan and 21 percent is Mon-Khmer. 3 The Provincial Livestock and Fishery Offices train vaccination technique, provide necessary tools and
equipment. Trained VHVs conduct vaccination at the villages.
A9-4
sale. Likewise, wood for fuel is becoming scarce. The increasing scarcity of the natural
resources results in impoverishing the farming households.
4) Poverty caused by illness amongst the family
The major epidemics in Lao farming societies are malaria, diarrhoeal diseases, and acute
respiratory infections. There is a close association between these epidemics and poverty, as
illness of a member costs the entire family a great deal. It leads to decreasing labour inputs for
agricultural and other farmwork and thus decreased productivity. The family also loses
livestock as they are sacrificed to appease the spirits. Moreover, the family is unable to
attend to the field as they should be, customary, in mourning for 30 days after the death of its
member and during this time they are not allowed to work in the field.
5) Poverty caused by lack of cash: infrastructure, such as roads, schools and health
facilities will be of little use if it does not generate cash
In the past, most people lived on a subsistence economy and barter rice surplus and food and
non-foods items from the forests with clothes and salt. Once roads were constructed and
people started going out to the cities. Whilst choices of commodities have increased, people
are unable to purchase the necessities as income generated from the surplus of rice and forest
products has decreased. People know that health and education is the key to get out of
poverty. However, they do not have enough money to go to school or hospital. What is
needed now is to generate income by improving agricultural techniques and making use of the
existing skills and knowledge. Even if roads, schools and health facilities are constructed,
poor people and people living far from those facilities will not be benefited4.
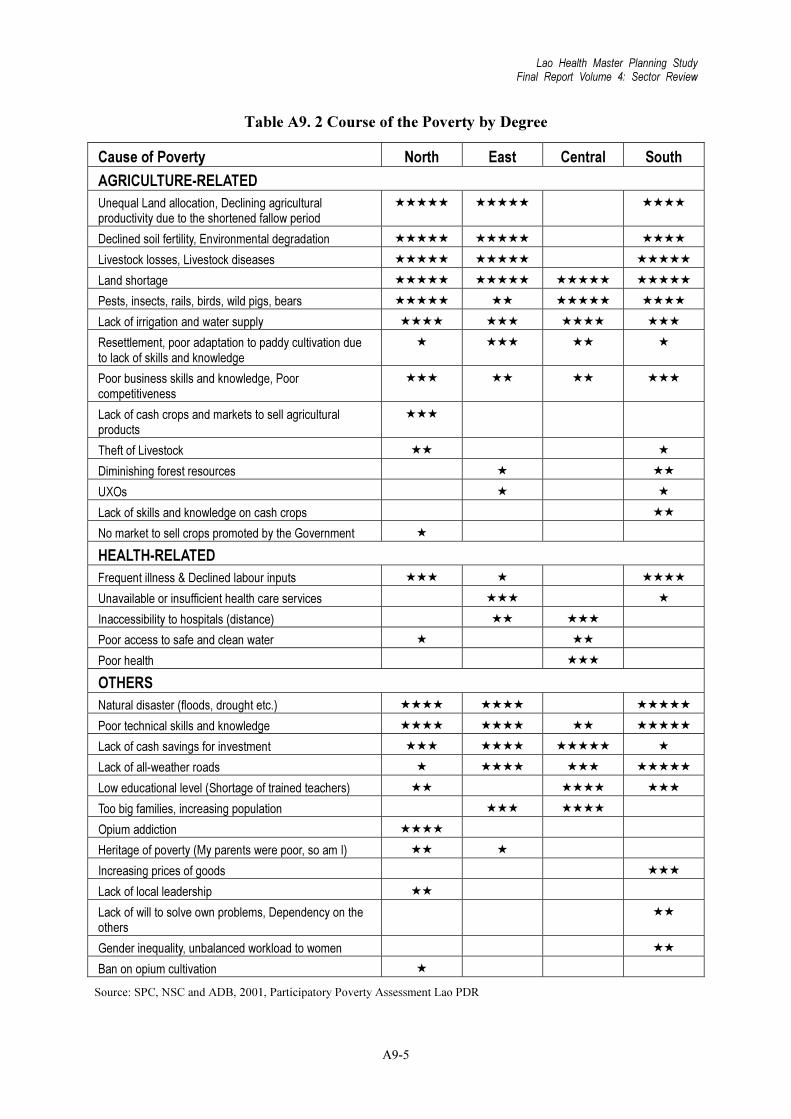
A9.4 CAUSES OF POVERTY BY REGION5
The causes of poverty by region and by degree were given in Table A9.2. The biggest cause
of poverty is agricultural-related and this applies to all regions. In this category, land shortage,
poor soil fertility and livestock diseases ranks the top three (except in the central region),
followed by lack of irrigation, lack of cash crops and lack of business opportunity in the
stated order. Under the health category, a decreased labour due to illness came first in the
north and south. Access to health facilities was not mentioned. It is unclear whether this
reflects lack of trust to health facilities. In contrast, poor access to hospitals was named,
reflecting a desire for health care services.
4 In addition to lack of cash, there are other reasons for poor people being unable to benefit from these services
include ‘too busy with farm work’, ‘ far from these facilities’, ‘childcare’, ‘language barrier’, ‘untrained
teachers’ and ‘health centres without drugs’. 5 Source: SPC, NSC and ADB, 2001, Participatory Poverty Assessment Lao PDR
Lao Health Master Planning Study Final Report Volume 4: Sector Review
A9-5
Table A9. 2 Course of the Poverty by Degree
Cause of Poverty North East Central South
AGRICULTURE-RELATED
Unequal Land allocation, Declining agricultural productivity due to the shortened fallow period
★★★★★ ★★★★★
★★★★
Declined soil fertility, Environmental degradation ★★★★★ ★★★★★
★★★★
Livestock losses, Livestock diseases ★★★★★ ★★★★★
★★★★★
Land shortage ★★★★★ ★★★★★ ★★★★★ ★★★★★
Pests, insects, rails, birds, wild pigs, bears ★★★★★ ★★ ★★★★★ ★★★★
Lack of irrigation and water supply ★★★★ ★★★ ★★★★ ★★★
Resettlement, poor adaptation to paddy cultivation due to lack of skills and knowledge
★ ★★★ ★★ ★
Poor business skills and knowledge, Poor competitiveness
★★★ ★★ ★★ ★★★
Lack of cash crops and markets to sell agricultural products
★★★
Theft of Livestock ★★
★
Diminishing forest resources ★
★★
UXOs ★
★
Lack of skills and knowledge on cash crops ★★
No market to sell crops promoted by the Government ★
HEALTH-RELATED
Frequent illness & Declined labour inputs ★★★ ★
★★★★
Unavailable or insufficient health care services ★★★
★
Inaccessibility to hospitals (distance) ★★ ★★★
Poor access to safe and clean water ★
★★
Poor health ★★★
OTHERS
Natural disaster (floods, drought etc.) ★★★★ ★★★★
★★★★★
Poor technical skills and knowledge ★★★★ ★★★★ ★★ ★★★★★
Lack of cash savings for investment ★★★ ★★★★ ★★★★★ ★
Lack of all-weather roads ★ ★★★★ ★★★ ★★★★★
Low educational level (Shortage of trained teachers) ★★
★★★★ ★★★
Too big families, increasing population ★★★ ★★★★
Opium addiction ★★★★
Heritage of poverty (My parents were poor, so am I) ★★ ★
Increasing prices of goods ★★★
Lack of local leadership ★★
Lack of will to solve own problems, Dependency on the others
★★
Gender inequality, unbalanced workload to women ★★
Ban on opium cultivation ★
Source: SPC, NSC and ADB, 2001, Participatory Poverty Assessment Lao PDR

A9-6
A9.5 GOVERNMRNT’S POVERTY ALLEVIATION MEASURES
At the Round Table Meeting VI held in June 1997, ‘eight priority programmes’ was proposed
as part of the National Socio-Economic Development Plan 1996-2000. Eight priority
programmes are: 1) food production; 2) commercial production; 3) shifting cultivation
stabilization; 4) rural development; 5) infrastructure development; 6) external economic
relations; 7) human resources development; and 8) services development. Poverty alleviation
programmes should be implemented within the framework of eight priority programmes.
However, eight priority programmes did not set a clear strategic plan or the implementing
agency for each programme. As a result, most of the major targets in the Plan have not been
implemented. At the Round Table Meeting VII held in November 2000, a more detailed
action plan was presented and 4 key sectors, agriculture/forestry, education, health and road
infrastructure, were identified as the key pillars for poverty alleviation. According to the
Interim Poverty Reduction Strategy Paper (I-PRSP) issued in March 2001, the Government
set the following targets for 2001-2003:
1. Expand health care service network at grassroots level (village, zone) and
rehabilitate building and operational laboratory equipment to central, provincial,
regional and district hospitals;
2. Ensure the existence of health care providers and improve their skills including
village health volunteers in villages;
3. Improve the quality of services delivered;
4. Extend and improve the quality of maternal and child health care to reduce
maternal and child morbidity and mortality;
5. Achieve universal child immunization and neonatal tetanus;
6. Reduce risks of disease outbreaks, particularly for cholera, malaria and dengue
hemorrhage fever through improved clean water supply, information education
communication (IEC) and social mobilization; and
7. Improve quality standards and monitoring of food and drug supply to ensure
adequate quality and reasonable costs through new food and drug regulations and
enhanced inspections.
The strategies for poverty alleviation include the strategic use of the findings of the
Participatory Poverty Assessment as well as the use of other indicators for measuring poverty,
such as education and health.

![Appendix 5 A Snapshot of Child -5 [Manini] - ActionResearch.net](https://static.fdokumen.com/doc/165x107/6333cd59a6138719eb0ac86a/appendix-5-a-snapshot-of-child-5-manini-actionresearchnet.jpg)