Waser, J., H. Ribicic, R. Fuchs, C. Hirsch, B. Schindler, G. Blöschl, E. Gröller (2011) Nodes on...
10
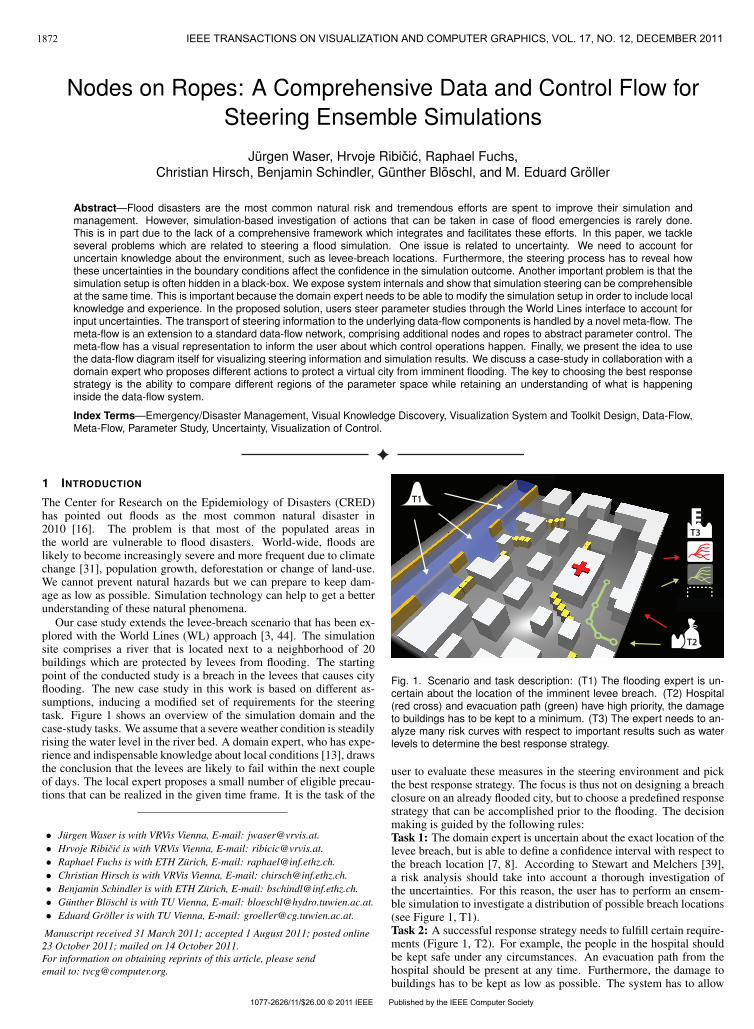
Nodes on Ropes: A Comprehensive Data and Control Flow for Steering Ensemble Simulations J¨ urgen Waser, Hrvoje Ribiˇ ci´ c, Raphael Fuchs, Christian Hirsch, Benjamin Schindler, G¨ unther Bl ¨ oschl, and M. Eduard Gr ¨ oller Abstract—Flood disasters are the most common natural risk and tremendous efforts are spent to improve their simulation and management. However, simulation-based investigation of actions that can be taken in case of flood emergencies is rarely done. This is in part due to the lack of a comprehensive framework which integrates and facilitates these efforts. In this paper, we tackle several problems which are related to steering a flood simulation. One issue is related to uncertainty. We need to account for uncertain knowledge about the environment, such as levee-breach locations. Furthermore, the steering process has to reveal how these uncertainties in the boundary conditions affect the confidence in the simulation outcome. Another important problem is that the simulation setup is often hidden in a black-box. We expose system internals and show that simulation steering can be comprehensible at the same time. This is important because the domain expert needs to be able to modify the simulation setup in order to include local knowledge and experience. In the proposed solution, users steer parameter studies through the World Lines interface to account for input uncertainties. The transport of steering information to the underlying data-flow components is handled by a novel meta-flow. The meta-flow is an extension to a standard data-flow network, comprising additional nodes and ropes to abstract parameter control. The meta-flow has a visual representation to inform the user about which control operations happen. Finally, we present the idea to use the data-flow diagram itself for visualizing steering information and simulation results. We discuss a case-study in collaboration with a domain expert who proposes different actions to protect a virtual city from imminent flooding. The key to choosing the best response strategy is the ability to compare different regions of the parameter space while retaining an understanding of what is happening inside the data-flow system. Index Terms—Emergency/Disaster Management, Visual Knowledge Discovery, Visualization System and Toolkit Design, Data-Flow, Meta-Flow, Parameter Study, Uncertainty, Visualization of Control. 1 I NTRODUCTION The Center for Research on the Epidemiology of Disasters (CRED) has pointed out floods as the most common natural disaster in 2010 [16]. The problem is that most of the populated areas in the world are vulnerable to flood disasters. World-wide, floods are likely to become increasingly severe and more frequent due to climate change [31], population growth, deforestation or change of land-use. We cannot prevent natural hazards but we can prepare to keep dam- age as low as possible. Simulation technology can help to get a better understanding of these natural phenomena. Our case study extends the levee-breach scenario that has been ex- plored with the World Lines (WL) approach [3, 44]. The simulation site comprises a river that is located next to a neighborhood of 20 buildings which are protected by levees from flooding. The starting point of the conducted study is a breach in the levees that causes city flooding. The new case study in this work is based on different as- sumptions, inducing a modified set of requirements for the steering task. Figure 1 shows an overview of the simulation domain and the case-study tasks. We assume that a severe weather condition is steadily rising the water level in the river bed. A domain expert, who has expe- rience and indispensable knowledge about local conditions [13], draws the conclusion that the levees are likely to fail within the next couple of days. The local expert proposes a small number of eligible precau- tions that can be realized in the given time frame. It is the task of the • J¨ urgen Waser is with VRVis Vienna, E-mail: [email protected]. • Hrvoje Ribiˇ ci´ c is with VRVis Vienna, E-mail: [email protected]. • Raphael Fuchs is with ETH Z¨ urich, E-mail: [email protected]. • Christian Hirsch is with VRVis Vienna, E-mail: [email protected]. • Benjamin Schindler is with ETH Z¨ urich, E-mail: [email protected]. • G¨ unther Bl¨ oschl is with TU Vienna, E-mail: [email protected]. • Eduard Gr¨ oller is with TU Vienna, E-mail: [email protected]. Manuscript received 31 March 2011; accepted 1 August 2011; posted online 23 October 2011; mailed on 14 October 2011. For information on obtaining reprints of this article, please send email to: [email protected]. T1 T2 T3 Fig. 1. Scenario and task description: (T1) The flooding expert is un- certain about the location of the imminent levee breach. (T2) Hospital (red cross) and evacuation path (green) have high priority, the damage to buildings has to be kept to a minimum. (T3) The expert needs to an- alyze many risk curves with respect to important results such as water levels to determine the best response strategy. user to evaluate these measures in the steering environment and pick the best response strategy. The focus is thus not on designing a breach closure on an already flooded city, but to choose a predefined response strategy that can be accomplished prior to the flooding. The decision making is guided by the following rules: Task 1: The domain expert is uncertain about the exact location of the levee breach, but is able to define a confidence interval with respect to the breach location [7, 8]. According to Stewart and Melchers [39], a risk analysis should take into account a thorough investigation of the uncertainties. For this reason, the user has to perform an ensem- ble simulation to investigate a distribution of possible breach locations (see Figure 1, T1). Task 2: A successful response strategy needs to fulfill certain require- ments (Figure 1, T2). For example, the people in the hospital should be kept safe under any circumstances. An evacuation path from the hospital should be present at any time. Furthermore, the damage to buildings has to be kept as low as possible. The system has to allow 1872 1077-2626/11/$26.00 © 2011 IEEE Published by the IEEE Computer Society IEEE TRANSACTIONS ON VISUALIZATION AND COMPUTER GRAPHICS, VOL. 17, NO. 12, DECEMBER 2011
Transcript of Waser, J., H. Ribicic, R. Fuchs, C. Hirsch, B. Schindler, G. Blöschl, E. Gröller (2011) Nodes on...
Nodes on Ropes: A Comprehensive Data and Control Flow forSteering Ensemble Simulations
Jurgen Waser, Hrvoje Ribicic, Raphael Fuchs,Christian Hirsch, Benjamin Schindler, Gunther Bloschl, and M. Eduard Groller
Abstract—Flood disasters are the most common natural risk and tremendous efforts are spent to improve their simulation andmanagement. However, simulation-based investigation of actions that can be taken in case of flood emergencies is rarely done.This is in part due to the lack of a comprehensive framework which integrates and facilitates these efforts. In this paper, we tackleseveral problems which are related to steering a flood simulation. One issue is related to uncertainty. We need to account foruncertain knowledge about the environment, such as levee-breach locations. Furthermore, the steering process has to reveal howthese uncertainties in the boundary conditions affect the confidence in the simulation outcome. Another important problem is that thesimulation setup is often hidden in a black-box. We expose system internals and show that simulation steering can be comprehensibleat the same time. This is important because the domain expert needs to be able to modify the simulation setup in order to include localknowledge and experience. In the proposed solution, users steer parameter studies through the World Lines interface to account forinput uncertainties. The transport of steering information to the underlying data-flow components is handled by a novel meta-flow. Themeta-flow is an extension to a standard data-flow network, comprising additional nodes and ropes to abstract parameter control. Themeta-flow has a visual representation to inform the user about which control operations happen. Finally, we present the idea to usethe data-flow diagram itself for visualizing steering information and simulation results. We discuss a case-study in collaboration with adomain expert who proposes different actions to protect a virtual city from imminent flooding. The key to choosing the best responsestrategy is the ability to compare different regions of the parameter space while retaining an understanding of what is happeninginside the data-flow system.
Index Terms—Emergency/Disaster Management, Visual Knowledge Discovery, Visualization System and Toolkit Design, Data-Flow,Meta-Flow, Parameter Study, Uncertainty, Visualization of Control.
1 INTRODUCTION
The Center for Research on the Epidemiology of Disasters (CRED)has pointed out floods as the most common natural disaster in2010 [16]. The problem is that most of the populated areas inthe world are vulnerable to flood disasters. World-wide, floods arelikely to become increasingly severe and more frequent due to climatechange [31], population growth, deforestation or change of land-use.We cannot prevent natural hazards but we can prepare to keep dam-age as low as possible. Simulation technology can help to get a betterunderstanding of these natural phenomena.
Our case study extends the levee-breach scenario that has been ex-plored with the World Lines (WL) approach [3, 44]. The simulationsite comprises a river that is located next to a neighborhood of 20buildings which are protected by levees from flooding. The startingpoint of the conducted study is a breach in the levees that causes cityflooding. The new case study in this work is based on different as-sumptions, inducing a modified set of requirements for the steeringtask. Figure 1 shows an overview of the simulation domain and thecase-study tasks. We assume that a severe weather condition is steadilyrising the water level in the river bed. A domain expert, who has expe-rience and indispensable knowledge about local conditions [13], drawsthe conclusion that the levees are likely to fail within the next coupleof days. The local expert proposes a small number of eligible precau-tions that can be realized in the given time frame. It is the task of the
• Jurgen Waser is with VRVis Vienna, E-mail: [email protected].• Hrvoje Ribicic is with VRVis Vienna, E-mail: [email protected].• Raphael Fuchs is with ETH Zurich, E-mail: [email protected].• Christian Hirsch is with VRVis Vienna, E-mail: [email protected].• Benjamin Schindler is with ETH Zurich, E-mail: [email protected].• Gunther Bloschl is with TU Vienna, E-mail: [email protected].• Eduard Groller is with TU Vienna, E-mail: [email protected].
Manuscript received 31 March 2011; accepted 1 August 2011; posted online23 October 2011; mailed on 14 October 2011.For information on obtaining reprints of this article, please sendemail to: [email protected].
T1
T2
T3
Fig. 1. Scenario and task description: (T1) The flooding expert is un-certain about the location of the imminent levee breach. (T2) Hospital(red cross) and evacuation path (green) have high priority, the damageto buildings has to be kept to a minimum. (T3) The expert needs to an-alyze many risk curves with respect to important results such as waterlevels to determine the best response strategy.
user to evaluate these measures in the steering environment and pickthe best response strategy. The focus is thus not on designing a breachclosure on an already flooded city, but to choose a predefined responsestrategy that can be accomplished prior to the flooding. The decisionmaking is guided by the following rules:Task 1: The domain expert is uncertain about the exact location of thelevee breach, but is able to define a confidence interval with respect tothe breach location [7, 8]. According to Stewart and Melchers [39],a risk analysis should take into account a thorough investigation ofthe uncertainties. For this reason, the user has to perform an ensem-ble simulation to investigate a distribution of possible breach locations(see Figure 1, T1).Task 2: A successful response strategy needs to fulfill certain require-ments (Figure 1, T2). For example, the people in the hospital shouldbe kept safe under any circumstances. An evacuation path from thehospital should be present at any time. Furthermore, the damage tobuildings has to be kept as low as possible. The system has to allow
1872
1077-2626/11/$26.00 © 2011 IEEE Published by the IEEE Computer Society
IEEE TRANSACTIONS ON VISUALIZATION AND COMPUTER GRAPHICS, VOL. 17, NO. 12, DECEMBER 2011
Har
dwire
d, h
idde
n se
tup
par mpar l
par n
Para
met
er s
pace
nav
igat
ion
view
parpar
lm
Q1
Q3 Q2
Track
Frames
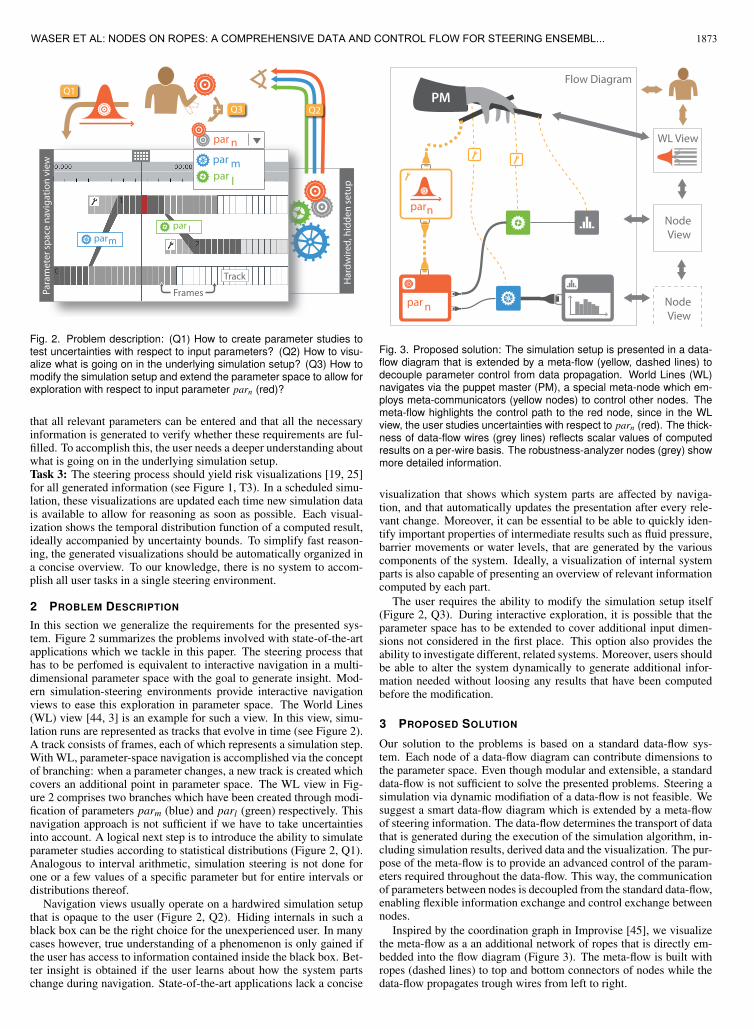
Fig. 2. Problem description: (Q1) How to create parameter studies totest uncertainties with respect to input parameters? (Q2) How to visu-alize what is going on in the underlying simulation setup? (Q3) How tomodify the simulation setup and extend the parameter space to allow forexploration with respect to input parameter parn (red)?
that all relevant parameters can be entered and that all the necessaryinformation is generated to verify whether these requirements are ful-filled. To accomplish this, the user needs a deeper understanding aboutwhat is going on in the underlying simulation setup.Task 3: The steering process should yield risk visualizations [19, 25]for all generated information (see Figure 1, T3). In a scheduled simu-lation, these visualizations are updated each time new simulation datais available to allow for reasoning as soon as possible. Each visual-ization shows the temporal distribution function of a computed result,ideally accompanied by uncertainty bounds. To simplify fast reason-ing, the generated visualizations should be automatically organized ina concise overview. To our knowledge, there is no system to accom-plish all user tasks in a single steering environment.
2 PROBLEM DESCRIPTION
In this section we generalize the requirements for the presented sys-tem. Figure 2 summarizes the problems involved with state-of-the-artapplications which we tackle in this paper. The steering process thathas to be perfomed is equivalent to interactive navigation in a multi-dimensional parameter space with the goal to generate insight. Mod-ern simulation-steering environments provide interactive navigationviews to ease this exploration in parameter space. The World Lines(WL) view [44, 3] is an example for such a view. In this view, simu-lation runs are represented as tracks that evolve in time (see Figure 2).A track consists of frames, each of which represents a simulation step.With WL, parameter-space navigation is accomplished via the conceptof branching: when a parameter changes, a new track is created whichcovers an additional point in parameter space. The WL view in Fig-ure 2 comprises two branches which have been created through modi-fication of parameters parm (blue) and parl (green) respectively. Thisnavigation approach is not sufficient if we have to take uncertaintiesinto account. A logical next step is to introduce the ability to simulateparameter studies according to statistical distributions (Figure 2, Q1).Analogous to interval arithmetic, simulation steering is not done forone or a few values of a specific parameter but for entire intervals ordistributions thereof.
Navigation views usually operate on a hardwired simulation setupthat is opaque to the user (Figure 2, Q2). Hiding internals in such ablack box can be the right choice for the unexperienced user. In manycases however, true understanding of a phenomenon is only gained ifthe user has access to information contained inside the black box. Bet-ter insight is obtained if the user learns about how the system partschange during navigation. State-of-the-art applications lack a concise
PM
parnNode View
Node View
Flow Diagram
par n
WL View
Fig. 3. Proposed solution: The simulation setup is presented in a data-flow diagram that is extended by a meta-flow (yellow, dashed lines) todecouple parameter control from data propagation. World Lines (WL)navigates via the puppet master (PM), a special meta-node which em-ploys meta-communicators (yellow nodes) to control other nodes. Themeta-flow highlights the control path to the red node, since in the WLview, the user studies uncertainties with respect to parn (red). The thick-ness of data-flow wires (grey lines) reflects scalar values of computedresults on a per-wire basis. The robustness-analyzer nodes (grey) showmore detailed information.
visualization that shows which system parts are affected by naviga-tion, and that automatically updates the presentation after every rele-vant change. Moreover, it can be essential to be able to quickly iden-tify important properties of intermediate results such as fluid pressure,barrier movements or water levels, that are generated by the variouscomponents of the system. Ideally, a visualization of internal systemparts is also capable of presenting an overview of relevant informationcomputed by each part.
The user requires the ability to modify the simulation setup itself(Figure 2, Q3). During interactive exploration, it is possible that theparameter space has to be extended to cover additional input dimen-sions not considered in the first place. This option also provides theability to investigate different, related systems. Moreover, users shouldbe able to alter the system dynamically to generate additional infor-mation needed without loosing any results that have been computedbefore the modification.
3 PROPOSED SOLUTION
Our solution to the problems is based on a standard data-flow sys-tem. Each node of a data-flow diagram can contribute dimensions tothe parameter space. Even though modular and extensible, a standarddata-flow is not sufficient to solve the presented problems. Steering asimulation via dynamic modifiation of a data-flow is not feasible. Wesuggest a smart data-flow diagram which is extended by a meta-flowof steering information. The data-flow determines the transport of datathat is generated during the execution of the simulation algorithm, in-cluding simulation results, derived data and the visualization. The pur-pose of the meta-flow is to provide an advanced control of the param-eters required throughout the data-flow. This way, the communicationof parameters between nodes is decoupled from the standard data-flow,enabling flexible information exchange and control exchange betweennodes.
Inspired by the coordination graph in Improvise [45], we visualizethe meta-flow as a an additional network of ropes that is directly em-bedded into the flow diagram (Figure 3). The meta-flow is built withropes (dashed lines) to top and bottom connectors of nodes while thedata-flow propagates trough wires from left to right.
1873WASER ET AL: NODES ON ROPES: A COMPREHENSIVE DATA AND CONTROL FLOW FOR STEERING ENSEMBL...
The interactive visualization of the data-flow and the meta-flowenables straightforward manipulation of the computations performedduring simulation. The idea is to add novel types of meta-nodes whichdo not perform computations but which control other nodes. Sucha node operates on a complex flow network in a way comparable toa puppet master pulling the strings. Therefore we call these controlnodes puppet masters (PM). A puppet master utilizes special helpernodes (meta-communicators) to gain fine-grained control over nodes,enabling interaction, visualization and steering inside large parameterspaces. WL employ a puppet master to steer a user-defined subset ofnodes. In the flow diagram, users can modify the explorable parameterspace by configuring the meta-flow.
The meta-flow enables modification of control paths within the flowdiagram. Still, the behavior of the underlying flow network and of in-dividual nodes remains difficult to grasp. We believe that the behaviorof individual system parts is best understood in the place where userscreate them, namely in the flow diagram directly. We suggest the ex-tension of the flow diagram with emphasis techniques from visualiza-tion such as levels-of-detail (LOD). The goal is to dynamically high-light important per-node information about the meta-flow and compu-tational results. The flow diagram in Figure 3 modifies the thickness ofropes and the LOD of nodes to identify the most relevant parts in thecurrent steering process. With this technique, it can be seen that theuser mainly modifies parameter parn, provided by the red node. In thismanner, the meta-flow visualization can be regarded as a concrete ex-ample for automatically storing knowledge gathered during interactiveexploration [17].
In addition, we create direct visualizations of computed data in-side the flow diagram. Figure 3 gives examples for such visualiza-tions. Statistical quantities are displayed on data-flow wires and insiderobustness-analyzer nodes. The thickness of the wires encodes scalarvalues like mean or standard deviation. The diagram itself becomesa dynamic view that is an integral part of a system of multiple linkedviews associated with certain nodes. This constellation improves thelinkage between nodes in the data-flow and the resulting data that isshown in the associated views. The contributions of this work can besummarized as follows:
• Configurable meta-flow as an abstraction for information andcontrol exchange between nodes.
• Puppet masters for centralized navigation in parameter spacespanned by nodes.
• Dynamic visualization inside the flow diagram. The ropes andnodes of the meta-flow depict the control-flow between nodes,the work-flow and inherent knowledge. The wires and nodes ofthe data-flow dynamically indicate the computed data per nodeand connection.
• Parameter studies in the World Lines navigation view to evaluateuncertainties through calculating with intervals and distributions.
4 RELATED WORK
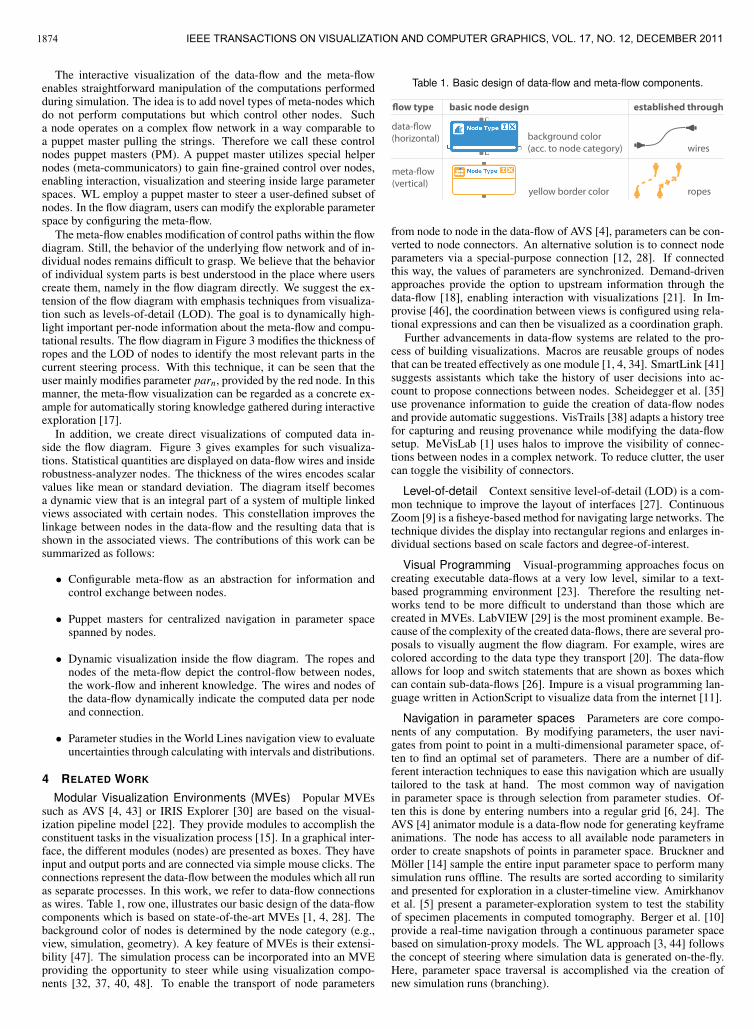
Modular Visualization Environments (MVEs) Popular MVEssuch as AVS [4, 43] or IRIS Explorer [30] are based on the visual-ization pipeline model [22]. They provide modules to accomplish theconstituent tasks in the visualization process [15]. In a graphical inter-face, the different modules (nodes) are presented as boxes. They haveinput and output ports and are connected via simple mouse clicks. Theconnections represent the data-flow between the modules which all runas separate processes. In this work, we refer to data-flow connectionsas wires. Table 1, row one, illustrates our basic design of the data-flowcomponents which is based on state-of-the-art MVEs [1, 4, 28]. Thebackground color of nodes is determined by the node category (e.g.,view, simulation, geometry). A key feature of MVEs is their extensi-bility [47]. The simulation process can be incorporated into an MVEproviding the opportunity to steer while using visualization compo-nents [32, 37, 40, 48]. To enable the transport of node parameters
Table 1. Basic design of data-flow and meta-flow components.
data-�ow(horizontal)
meta-�ow(vertical)
background color (acc. to node category) wires
ropesyellow border color
�ow type basic node design established through
from node to node in the data-flow of AVS [4], parameters can be con-verted to node connectors. An alternative solution is to connect nodeparameters via a special-purpose connection [12, 28]. If connectedthis way, the values of parameters are synchronized. Demand-drivenapproaches provide the option to upstream information through thedata-flow [18], enabling interaction with visualizations [21]. In Im-provise [46], the coordination between views is configured using rela-tional expressions and can then be visualized as a coordination graph.
Further advancements in data-flow systems are related to the pro-cess of building visualizations. Macros are reusable groups of nodesthat can be treated effectively as one module [1, 4, 34]. SmartLink [41]suggests assistants which take the history of user decisions into ac-count to propose connections between nodes. Scheidegger et al. [35]use provenance information to guide the creation of data-flow nodesand provide automatic suggestions. VisTrails [38] adapts a history treefor capturing and reusing provenance while modifying the data-flowsetup. MeVisLab [1] uses halos to improve the visibility of connec-tions between nodes in a complex network. To reduce clutter, the usercan toggle the visibility of connectors.
Level-of-detail Context sensitive level-of-detail (LOD) is a com-mon technique to improve the layout of interfaces [27]. ContinuousZoom [9] is a fisheye-based method for navigating large networks. Thetechnique divides the display into rectangular regions and enlarges in-dividual sections based on scale factors and degree-of-interest.
Visual Programming Visual-programming approaches focus oncreating executable data-flows at a very low level, similar to a text-based programming environment [23]. Therefore the resulting net-works tend to be more difficult to understand than those which arecreated in MVEs. LabVIEW [29] is the most prominent example. Be-cause of the complexity of the created data-flows, there are several pro-posals to visually augment the flow diagram. For example, wires arecolored according to the data type they transport [20]. The data-flowallows for loop and switch statements that are shown as boxes whichcan contain sub-data-flows [26]. Impure is a visual programming lan-guage written in ActionScript to visualize data from the internet [11].
Navigation in parameter spaces Parameters are core compo-nents of any computation. By modifying parameters, the user navi-gates from point to point in a multi-dimensional parameter space, of-ten to find an optimal set of parameters. There are a number of dif-ferent interaction techniques to ease this navigation which are usuallytailored to the task at hand. The most common way of navigationin parameter space is through selection from parameter studies. Of-ten this is done by entering numbers into a regular grid [6, 24]. TheAVS [4] animator module is a data-flow node for generating keyframeanimations. The node has access to all available node parameters inorder to create snapshots of points in parameter space. Bruckner andMoller [14] sample the entire input parameter space to perform manysimulation runs offline. The results are sorted according to similarityand presented for exploration in a cluster-timeline view. Amirkhanovet al. [5] present a parameter-exploration system to test the stabilityof specimen placements in computed tomography. Berger et al. [10]provide a real-time navigation through a continuous parameter spacebased on simulation-proxy models. The WL approach [3, 44] followsthe concept of steering where simulation data is generated on-the-fly.Here, parameter space traversal is accomplished via the creation ofnew simulation runs (branching).
1874 IEEE TRANSACTIONS ON VISUALIZATION AND COMPUTER GRAPHICS, VOL. 17, NO. 12, DECEMBER 2011
b
a
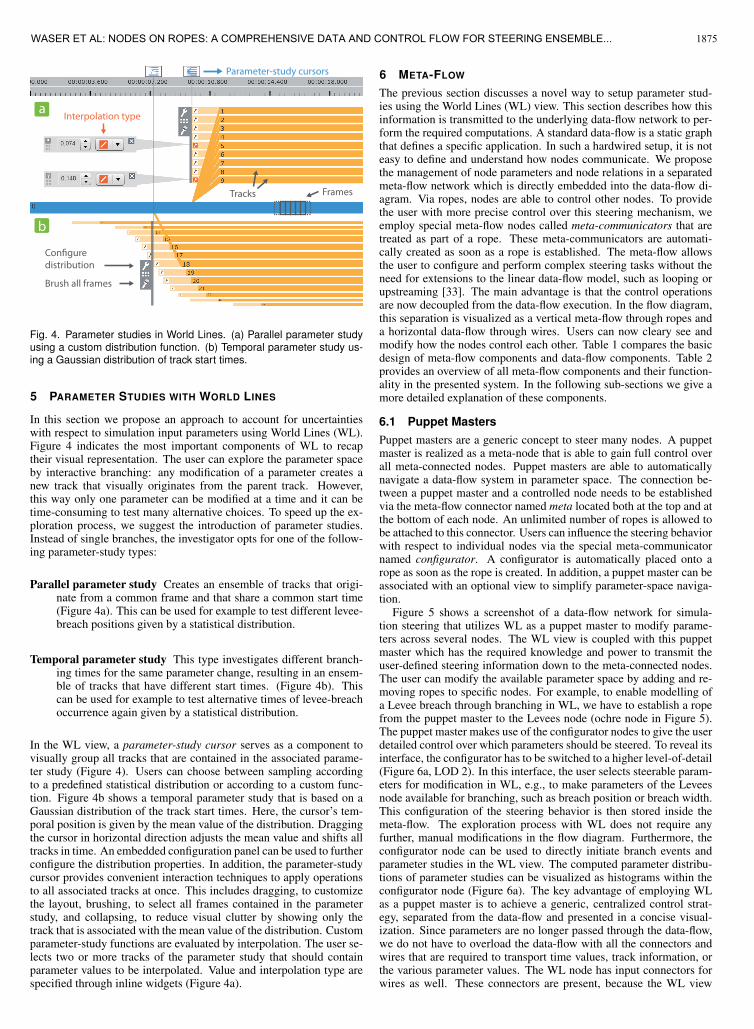
Parameter-study cursors
Con�gure distribution
Brush all frames
FramesTracks
Interpolation type
Fig. 4. Parameter studies in World Lines. (a) Parallel parameter studyusing a custom distribution function. (b) Temporal parameter study us-ing a Gaussian distribution of track start times.
5 PARAMETER STUDIES WITH WORLD LINES
In this section we propose an approach to account for uncertaintieswith respect to simulation input parameters using World Lines (WL).Figure 4 indicates the most important components of WL to recaptheir visual representation. The user can explore the parameter spaceby interactive branching: any modification of a parameter creates anew track that visually originates from the parent track. However,this way only one parameter can be modified at a time and it can betime-consuming to test many alternative choices. To speed up the ex-ploration process, we suggest the introduction of parameter studies.Instead of single branches, the investigator opts for one of the follow-ing parameter-study types:
Parallel parameter study Creates an ensemble of tracks that origi-nate from a common frame and that share a common start time(Figure 4a). This can be used for example to test different levee-breach positions given by a statistical distribution.
Temporal parameter study This type investigates different branch-ing times for the same parameter change, resulting in an ensem-ble of tracks that have different start times. (Figure 4b). Thiscan be used for example to test alternative times of levee-breachoccurrence again given by a statistical distribution.
In the WL view, a parameter-study cursor serves as a component tovisually group all tracks that are contained in the associated parame-ter study (Figure 4). Users can choose between sampling accordingto a predefined statistical distribution or according to a custom func-tion. Figure 4b shows a temporal parameter study that is based on aGaussian distribution of the track start times. Here, the cursor’s tem-poral position is given by the mean value of the distribution. Draggingthe cursor in horizontal direction adjusts the mean value and shifts alltracks in time. An embedded configuration panel can be used to furtherconfigure the distribution properties. In addition, the parameter-studycursor provides convenient interaction techniques to apply operationsto all associated tracks at once. This includes dragging, to customizethe layout, brushing, to select all frames contained in the parameterstudy, and collapsing, to reduce visual clutter by showing only thetrack that is associated with the mean value of the distribution. Customparameter-study functions are evaluated by interpolation. The user se-lects two or more tracks of the parameter study that should containparameter values to be interpolated. Value and interpolation type arespecified through inline widgets (Figure 4a).
6 META-FLOW
The previous section discusses a novel way to setup parameter stud-ies using the World Lines (WL) view. This section describes how thisinformation is transmitted to the underlying data-flow network to per-form the required computations. A standard data-flow is a static graphthat defines a specific application. In such a hardwired setup, it is noteasy to define and understand how nodes communicate. We proposethe management of node parameters and node relations in a separatedmeta-flow network which is directly embedded into the data-flow di-agram. Via ropes, nodes are able to control other nodes. To providethe user with more precise control over this steering mechanism, weemploy special meta-flow nodes called meta-communicators that aretreated as part of a rope. These meta-communicators are automati-cally created as soon as a rope is established. The meta-flow allowsthe user to configure and perform complex steering tasks without theneed for extensions to the linear data-flow model, such as looping orupstreaming [33]. The main advantage is that the control operationsare now decoupled from the data-flow execution. In the flow diagram,this separation is visualized as a vertical meta-flow through ropes anda horizontal data-flow through wires. Users can now cleary see andmodify how the nodes control each other. Table 1 compares the basicdesign of meta-flow components and data-flow components. Table 2provides an overview of all meta-flow components and their function-ality in the presented system. In the following sub-sections we give amore detailed explanation of these components.
6.1 Puppet MastersPuppet masters are a generic concept to steer many nodes. A puppetmaster is realized as a meta-node that is able to gain full control overall meta-connected nodes. Puppet masters are able to automaticallynavigate a data-flow system in parameter space. The connection be-tween a puppet master and a controlled node needs to be establishedvia the meta-flow connector named meta located both at the top and atthe bottom of each node. An unlimited number of ropes is allowed tobe attached to this connector. Users can influence the steering behaviorwith respect to individual nodes via the special meta-communicatornamed configurator. A configurator is automatically placed onto arope as soon as the rope is created. In addition, a puppet master can beassociated with an optional view to simplify parameter-space naviga-tion.
Figure 5 shows a screenshot of a data-flow network for simula-tion steering that utilizes WL as a puppet master to modify parame-ters across several nodes. The WL view is coupled with this puppetmaster which has the required knowledge and power to transmit theuser-defined steering information down to the meta-connected nodes.The user can modify the available parameter space by adding and re-moving ropes to specific nodes. For example, to enable modelling ofa Levee breach through branching in WL, we have to establish a ropefrom the puppet master to the Levees node (ochre node in Figure 5).The puppet master makes use of the configurator nodes to give the userdetailed control over which parameters should be steered. To reveal itsinterface, the configurator has to be switched to a higher level-of-detail(Figure 6a, LOD 2). In this interface, the user selects steerable param-eters for modification in WL, e.g., to make parameters of the Leveesnode available for branching, such as breach position or breach width.This configuration of the steering behavior is then stored inside themeta-flow. The exploration process with WL does not require anyfurther, manual modifications in the flow diagram. Furthermore, theconfigurator node can be used to directly initiate branch events andparameter studies in the WL view. The computed parameter distribu-tions of parameter studies can be visualized as histograms within theconfigurator node (Figure 6a). The key advantage of employing WLas a puppet master is to achieve a generic, centralized control strat-egy, separated from the data-flow and presented in a concise visual-ization. Since parameters are no longer passed through the data-flow,we do not have to overload the data-flow with all the connectors andwires that are required to transport time values, track information, orthe various parameter values. The WL node has input connectors forwires as well. These connectors are present, because the WL view
1875WASER ET AL: NODES ON ROPES: A COMPREHENSIVE DATA AND CONTROL FLOW FOR STEERING ENSEMBLE...
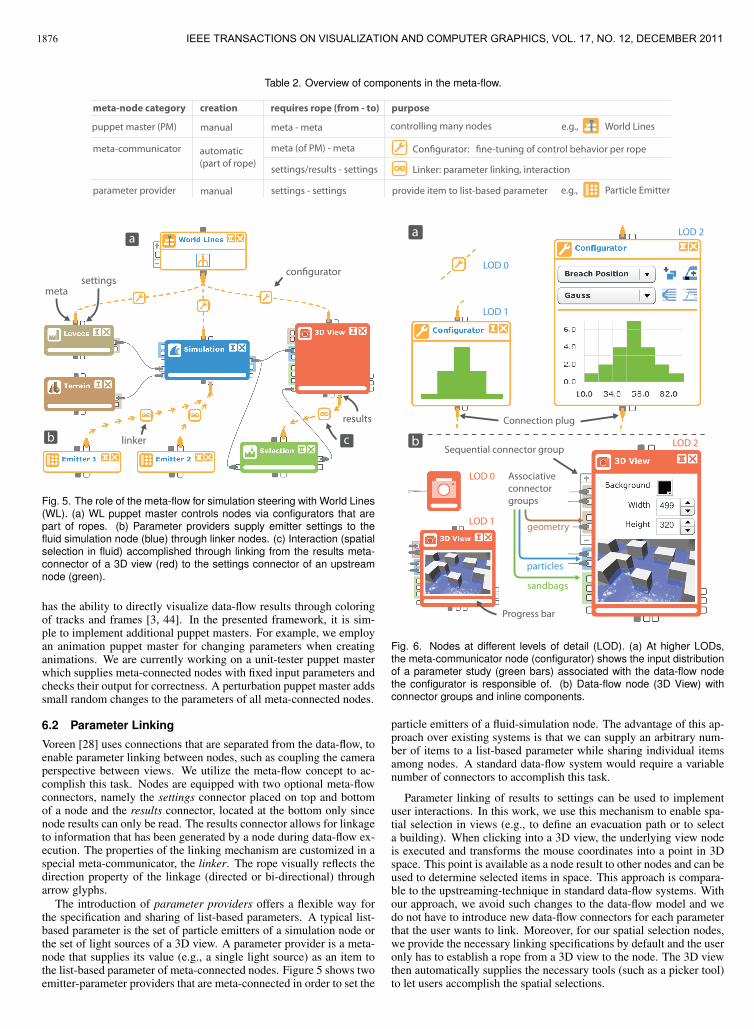
Table 2. Overview of components in the meta-flow.
parameter provider
puppet master (PM) controlling many nodes
provide item to list-based parameter
settings/results - settings
settings - settings
meta (of PM) - meta
meta - metamanual
manual
automatic(part of rope)
World Linese.g.,
Particle Emittere.g.,
meta-communicator
Linker: parameter linking, interaction
Con�gurator: �ne-tuning of control behavior per rope
meta-node category creation requires rope (from - to) purpose
con�gurator
c
a
b linker
metasettings
results
Fig. 5. The role of the meta-flow for simulation steering with World Lines(WL). (a) WL puppet master controls nodes via configurators that arepart of ropes. (b) Parameter providers supply emitter settings to thefluid simulation node (blue) through linker nodes. (c) Interaction (spatialselection in fluid) accomplished through linking from the results meta-connector of a 3D view (red) to the settings connector of an upstreamnode (green).
has the ability to directly visualize data-flow results through coloringof tracks and frames [3, 44]. In the presented framework, it is sim-ple to implement additional puppet masters. For example, we employan animation puppet master for changing parameters when creatinganimations. We are currently working on a unit-tester puppet masterwhich supplies meta-connected nodes with fixed input parameters andchecks their output for correctness. A perturbation puppet master addssmall random changes to the parameters of all meta-connected nodes.
6.2 Parameter Linking
Voreen [28] uses connections that are separated from the data-flow, toenable parameter linking between nodes, such as coupling the cameraperspective between views. We utilize the meta-flow concept to ac-complish this task. Nodes are equipped with two optional meta-flowconnectors, namely the settings connector placed on top and bottomof a node and the results connector, located at the bottom only sincenode results can only be read. The results connector allows for linkageto information that has been generated by a node during data-flow ex-ecution. The properties of the linking mechanism are customized in aspecial meta-communicator, the linker. The rope visually reflects thedirection property of the linkage (directed or bi-directional) througharrow glyphs.
The introduction of parameter providers offers a flexible way forthe specification and sharing of list-based parameters. A typical list-based parameter is the set of particle emitters of a simulation node orthe set of light sources of a 3D view. A parameter provider is a meta-node that supplies its value (e.g., a single light source) as an item tothe list-based parameter of meta-connected nodes. Figure 5 shows twoemitter-parameter providers that are meta-connected in order to set the
Connection plug
Sequential connector group
Progress bar
Associative connectorgroups
b
a
LOD 0
LOD 0
LOD 1
LOD 1
LOD 2
LOD 2
geometry
particles
sandbags
Fig. 6. Nodes at different levels of detail (LOD). (a) At higher LODs,the meta-communicator node (configurator) shows the input distributionof a parameter study (green bars) associated with the data-flow nodethe configurator is responsible of. (b) Data-flow node (3D View) withconnector groups and inline components.
particle emitters of a fluid-simulation node. The advantage of this ap-proach over existing systems is that we can supply an arbitrary num-ber of items to a list-based parameter while sharing individual itemsamong nodes. A standard data-flow system would require a variablenumber of connectors to accomplish this task.
Parameter linking of results to settings can be used to implementuser interactions. In this work, we use this mechanism to enable spa-tial selection in views (e.g., to define an evacuation path or to selecta building). When clicking into a 3D view, the underlying view nodeis executed and transforms the mouse coordinates into a point in 3Dspace. This point is available as a node result to other nodes and can beused to determine selected items in space. This approach is compara-ble to the upstreaming-technique in standard data-flow systems. Withour approach, we avoid such changes to the data-flow model and wedo not have to introduce new data-flow connectors for each parameterthat the user wants to link. Moreover, for our spatial selection nodes,we provide the necessary linking specifications by default and the useronly has to establish a rope from a 3D view to the node. The 3D viewthen automatically supplies the necessary tools (such as a picker tool)to let users accomplish the spatial selections.
1876 IEEE TRANSACTIONS ON VISUALIZATION AND COMPUTER GRAPHICS, VOL. 17, NO. 12, DECEMBER 2011
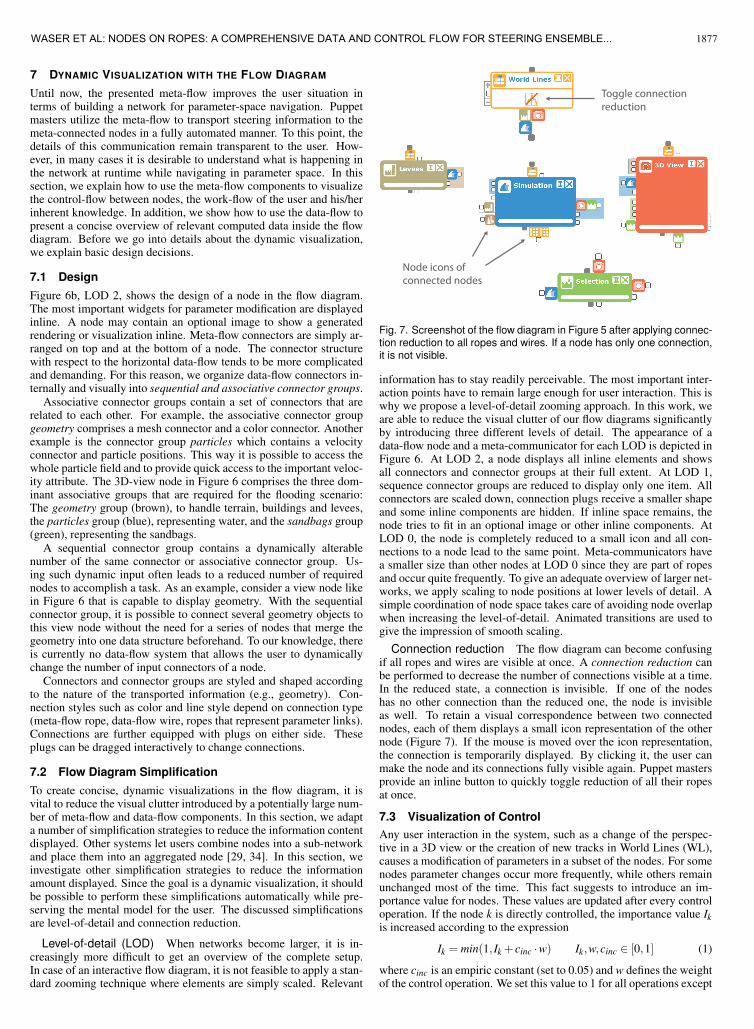
7 DYNAMIC VISUALIZATION WITH THE FLOW DIAGRAM
Until now, the presented meta-flow improves the user situation interms of building a network for parameter-space navigation. Puppetmasters utilize the meta-flow to transport steering information to themeta-connected nodes in a fully automated manner. To this point, thedetails of this communication remain transparent to the user. How-ever, in many cases it is desirable to understand what is happening inthe network at runtime while navigating in parameter space. In thissection, we explain how to use the meta-flow components to visualizethe control-flow between nodes, the work-flow of the user and his/herinherent knowledge. In addition, we show how to use the data-flow topresent a concise overview of relevant computed data inside the flowdiagram. Before we go into details about the dynamic visualization,we explain basic design decisions.
7.1 DesignFigure 6b, LOD 2, shows the design of a node in the flow diagram.The most important widgets for parameter modification are displayedinline. A node may contain an optional image to show a generatedrendering or visualization inline. Meta-flow connectors are simply ar-ranged on top and at the bottom of a node. The connector structurewith respect to the horizontal data-flow tends to be more complicatedand demanding. For this reason, we organize data-flow connectors in-ternally and visually into sequential and associative connector groups.
Associative connector groups contain a set of connectors that arerelated to each other. For example, the associative connector groupgeometry comprises a mesh connector and a color connector. Anotherexample is the connector group particles which contains a velocityconnector and particle positions. This way it is possible to access thewhole particle field and to provide quick access to the important veloc-ity attribute. The 3D-view node in Figure 6 comprises the three dom-inant associative groups that are required for the flooding scenario:The geometry group (brown), to handle terrain, buildings and levees,the particles group (blue), representing water, and the sandbags group(green), representing the sandbags.
A sequential connector group contains a dynamically alterablenumber of the same connector or associative connector group. Us-ing such dynamic input often leads to a reduced number of requirednodes to accomplish a task. As an example, consider a view node likein Figure 6 that is capable to display geometry. With the sequentialconnector group, it is possible to connect several geometry objects tothis view node without the need for a series of nodes that merge thegeometry into one data structure beforehand. To our knowledge, thereis currently no data-flow system that allows the user to dynamicallychange the number of input connectors of a node.
Connectors and connector groups are styled and shaped accordingto the nature of the transported information (e.g., geometry). Con-nection styles such as color and line style depend on connection type(meta-flow rope, data-flow wire, ropes that represent parameter links).Connections are further equipped with plugs on either side. Theseplugs can be dragged interactively to change connections.
7.2 Flow Diagram SimplificationTo create concise, dynamic visualizations in the flow diagram, it isvital to reduce the visual clutter introduced by a potentially large num-ber of meta-flow and data-flow components. In this section, we adapta number of simplification strategies to reduce the information contentdisplayed. Other systems let users combine nodes into a sub-networkand place them into an aggregated node [29, 34]. In this section, weinvestigate other simplification strategies to reduce the informationamount displayed. Since the goal is a dynamic visualization, it shouldbe possible to perform these simplifications automatically while pre-serving the mental model for the user. The discussed simplificationsare level-of-detail and connection reduction.
Level-of-detail (LOD) When networks become larger, it is in-creasingly more difficult to get an overview of the complete setup.In case of an interactive flow diagram, it is not feasible to apply a stan-dard zooming technique where elements are simply scaled. Relevant
Node icons of connected nodes
Toggle connectionreduction
Fig. 7. Screenshot of the flow diagram in Figure 5 after applying connec-tion reduction to all ropes and wires. If a node has only one connection,it is not visible.
information has to stay readily perceivable. The most important inter-action points have to remain large enough for user interaction. This iswhy we propose a level-of-detail zooming approach. In this work, weare able to reduce the visual clutter of our flow diagrams significantlyby introducing three different levels of detail. The appearance of adata-flow node and a meta-communicator for each LOD is depicted inFigure 6. At LOD 2, a node displays all inline elements and showsall connectors and connector groups at their full extent. At LOD 1,sequence connector groups are reduced to display only one item. Allconnectors are scaled down, connection plugs receive a smaller shapeand some inline components are hidden. If inline space remains, thenode tries to fit in an optional image or other inline components. AtLOD 0, the node is completely reduced to a small icon and all con-nections to a node lead to the same point. Meta-communicators havea smaller size than other nodes at LOD 0 since they are part of ropesand occur quite frequently. To give an adequate overview of larger net-works, we apply scaling to node positions at lower levels of detail. Asimple coordination of node space takes care of avoiding node overlapwhen increasing the level-of-detail. Animated transitions are used togive the impression of smooth scaling.
Connection reduction The flow diagram can become confusingif all ropes and wires are visible at once. A connection reduction canbe performed to decrease the number of connections visible at a time.In the reduced state, a connection is invisible. If one of the nodeshas no other connection than the reduced one, the node is invisibleas well. To retain a visual correspondence between two connectednodes, each of them displays a small icon representation of the othernode (Figure 7). If the mouse is moved over the icon representation,the connection is temporarily displayed. By clicking it, the user canmake the node and its connections fully visible again. Puppet mastersprovide an inline button to quickly toggle reduction of all their ropesat once.
7.3 Visualization of ControlAny user interaction in the system, such as a change of the perspec-tive in a 3D view or the creation of new tracks in World Lines (WL),causes a modification of parameters in a subset of the nodes. For somenodes parameter changes occur more frequently, while others remainunchanged most of the time. This fact suggests to introduce an im-portance value for nodes. These values are updated after every controloperation. If the node k is directly controlled, the importance value Ikis increased according to the expression
Ik = min(1, Ik + cinc ·w) Ik,w,cinc ∈ [0,1] (1)
where cinc is an empiric constant (set to 0.05) and w defines the weightof the control operation. We set this value to 1 for all operations except
1877WASER ET AL: NODES ON ROPES: A COMPREHENSIVE DATA AND CONTROL FLOW FOR STEERING ENSEMBLE...

for changes to the camera perspective in the 3D view, where we assigna value of 0.01. This operation occurs very often and should have asmaller impact to the layout of the flow diagram. All other nodes, i.e.,the nodes that are not directly affected by the control operation, receivea small decrease of their importance value Ik according to
Ik = max(0, Ik · (cdec +(1−w)1−cdec)) Ik,w,cdec ∈ [0,1] (2)
where cdec is a constant we set to 0.95. While interacting, the flowdiagram automatically changes shape to direct the user attention to themost important parts. To accomplish this, the aforementioned simpli-fications are automatically applied according to the importance valuesusing the following lookup:
• Ik < 0.1: node k receives LOD 0; apply connection reduction toall ropes connected to node k
• Ik ∈ [0.1,0.5): node k receives LOD 0
• Ik ∈ [0.5,0.8]: node k receives LOD 1
• Ik > 0.8: node k receives LOD 2
Meta-communicators are excluded from these automatic LOD modi-fications. If any LOD value changes a re-layout of the node networkis necessary. We try to move a subset of the nodes, if possible, to fillthe gained space and if required, to provide the missing space. Theseautomatic movements respect the relative node positioning of the lay-out to retain the mental model. We apply animated transitions to letusers more easily perceive the modifications. If the flow diagram doesnot fit into the screen space of the containing window, we change thewindow-scroll positions to put the focus on the center of importance~SI , which is determined as
~SI =1
∑n Ik·∑
nIk · ~pk (3)
where n is the number of nodes and ~pk is the screen position of the k-thnode. In addition, we alter the thickness of ropes to further emphasizethe control-flow. If a meta-connected node is not controlled at all,we apply connection reduction. With the proposed course of action,the meta-flow supports the user in understanding the internal controloperations. Moreover, the importance based display of the meta-flowoffers a way to record and visualize work-flow and knowledge of thecurrent user. The window layout in the presented tool is configurable,allowing the user to show or hide the flow diagram.
7.4 Visualization per WireIn the WL view, we can visualize information on a per-time and per-track level. However, this information is restricted to the output ofa single connector in the data-flow, or at most, to a derived quantitythat describes many outputs. For example the frames can be coloredby the number of flooded buildings at the given simulation step. WLcannot provide a comprehensive overview of results from several nodeoutputs. We believe that such an overview is best shown in the flowdiagram itself. However, the components of the flow diagram can onlygive restricted information on a per-time and per-track level. Figure 8illustrates how WL and the flow diagram can compensate each othersshortcomings. In this example, we show progress information in bothviews: the WL view displays which tracks are already simulated, theprogress bars of the nodes display which portions of every attribute inthe simulation are already computed.
Progress monitoring The presented system utilizes the data-flowprocessing-algorithms as described by Schindler et al. [36]. By thismeans, we have important frame information about the data elementseach node can compute. More specifically, we know for what frames(i.e., time steps and tracks), a node can generate data. If we comparethis information to the data that a node has already computed, we candefine the progress per node. Figure 8 shows how the WL view indi-cates the processed frames by coloring them in yellow. The progress isassociated with one node in the data-flow. To give an overview on the
Progress of simulation node (Sim) Terrain (1/1) Sim (16/40)
Water Levels (16/40)Breach positions (3/4)
Fig. 8. Progress visualization with World Lines (WL) vs. inside the flowdiagram. WL comprise 4 tracks for 4 different breach positions. WLshow progress on a per-frame level, the flow diagram on a per-nodelevel. The figure labels depict (calculated frames/frames to calculate).
system progress, each data-flow node in the diagram is equipped witha progress bar. It is straightforward to display the progress with respectto time. To also give a hint on progress related to tracks, we employtransparency inside the progress bar. This means each track is repre-sented by a semi-transparent rectangular area which are all blendedtogether to give the resulting progress bar.
Robustness analysis In a simulation-steering environment, werequire the ability to verify whether a solution, i.e., a choice of param-eters, is stable with respect to uncertain input. A robust solution isgiven, if the variation in the output is smaller than the variation in theinput. In Section 5 we have discussed how to enter a distribution of in-put values. Via the configurator node, we display the input distributioninside the flow diagram. Now, to evaluate the robustness of a solution,we compute the resulting distributions for all simulation attributes theuser selects to be included in the robustness analysis. These outputdistributions are then visualized inside the flow diagram.
The outputs that have to be included in the robustness analysis, aredefined interactively by selecting output-connectors. This interactionautomatically creates and connects a special data-flow node that weterm robustness analyzer (grey nodes in Figure 9). Initially, this nodeis only visible through the small icon at the selected output connector(i.e., its connections are reduced to LOD 0). The robustness analyz-ers are in charge of computing the output distributions. The results ofthese calculations are visualized in several ways. To get an overview,the thickness of each data-flow wire is changed to reflect the relativestandard deviation of the data which flows through the wire. If thisvariation is very small, the wire remains reduced and the correspond-ing robustness analyzer hidden. The higher the standard deviation, thethicker the wire and the higher the LOD of the associated analyzernode. At LOD 1, the analyzer displays a visualization of the distri-bution of data which flows through the respective wire. This can bedone using an information-visualization technique such as a histogramor an ensemble line graph. At LOD 2, this information visualizationprovides even more details. We point out that this flow-diagram visu-alization itself is updated during the ensemble simulation.
8 EVALUATION
In this section we demonstrate the approach on the flooding scenariointroduced in Figure 1. For details on the simulation setup, we referto the WL case study [44]. For this paper, we have rearranged thebuildings and increased the size of the terrain to 140×140 m2.
8.1 Case Study TasksAs a preliminary task, the domain expert defines three alternative pre-cautions to protect the neighborhood from flooding. We employ WLto create a track for each of these multi-barrier arrangments. Figure 9acontains images to show the difference between the arrangments.
Before we can create a parameter study with respect to uncertainlevee-breach locations as demanded by task T1 (Figure 1, T1), we haveto extend the parameter space of WL. This is accomplished by estab-lishing a rope from the related puppet master to the levees node. In theauto-created configurator of the rope, we select the breach-positionparameter and add it to the parameter space. Now it is possible to
1878 IEEE TRANSACTIONS ON VISUALIZATION AND COMPUTER GRAPHICS, VOL. 17, NO. 12, DECEMBER 2011
PS Grey
WL PS Green
PS Red
a b
ce
f
g
f
d
h
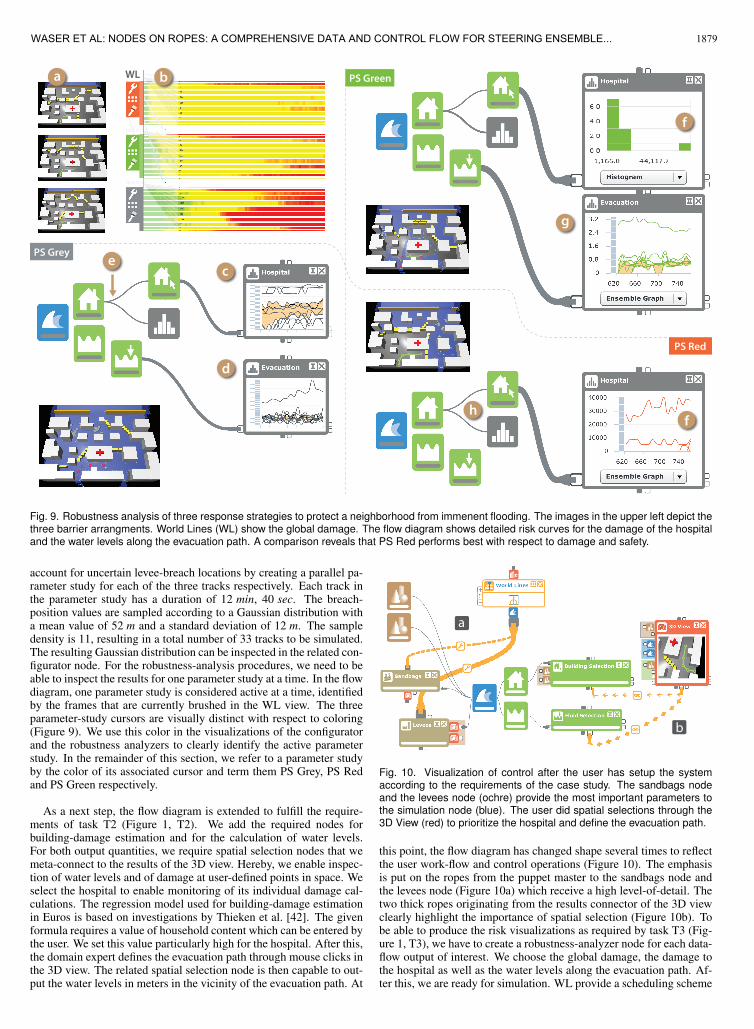
Fig. 9. Robustness analysis of three response strategies to protect a neighborhood from immenent flooding. The images in the upper left depict thethree barrier arrangments. World Lines (WL) show the global damage. The flow diagram shows detailed risk curves for the damage of the hospitaland the water levels along the evacuation path. A comparison reveals that PS Red performs best with respect to damage and safety.
account for uncertain levee-breach locations by creating a parallel pa-rameter study for each of the three tracks respectively. Each track inthe parameter study has a duration of 12 min, 40 sec. The breach-position values are sampled according to a Gaussian distribution witha mean value of 52 m and a standard deviation of 12 m. The sampledensity is 11, resulting in a total number of 33 tracks to be simulated.The resulting Gaussian distribution can be inspected in the related con-figurator node. For the robustness-analysis procedures, we need to beable to inspect the results for one parameter study at a time. In the flowdiagram, one parameter study is considered active at a time, identifiedby the frames that are currently brushed in the WL view. The threeparameter-study cursors are visually distinct with respect to coloring(Figure 9). We use this color in the visualizations of the configuratorand the robustness analyzers to clearly identify the active parameterstudy. In the remainder of this section, we refer to a parameter studyby the color of its associated cursor and term them PS Grey, PS Redand PS Green respectively.
As a next step, the flow diagram is extended to fulfill the require-ments of task T2 (Figure 1, T2). We add the required nodes forbuilding-damage estimation and for the calculation of water levels.For both output quantities, we require spatial selection nodes that wemeta-connect to the results of the 3D view. Hereby, we enable inspec-tion of water levels and of damage at user-defined points in space. Weselect the hospital to enable monitoring of its individual damage cal-culations. The regression model used for building-damage estimationin Euros is based on investigations by Thieken et al. [42]. The givenformula requires a value of household content which can be entered bythe user. We set this value particularly high for the hospital. After this,the domain expert defines the evacuation path through mouse clicks inthe 3D view. The related spatial selection node is then capable to out-put the water levels in meters in the vicinity of the evacuation path. At
a
b
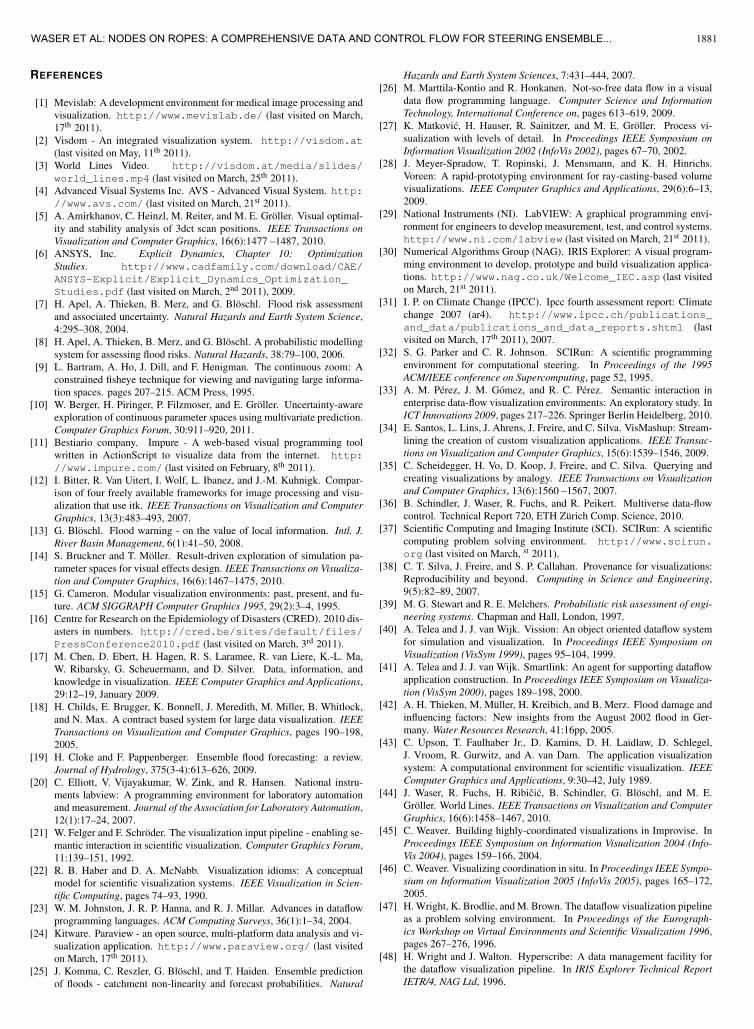
Fig. 10. Visualization of control after the user has setup the systemaccording to the requirements of the case study. The sandbags nodeand the levees node (ochre) provide the most important parameters tothe simulation node (blue). The user did spatial selections through the3D View (red) to prioritize the hospital and define the evacuation path.
this point, the flow diagram has changed shape several times to reflectthe user work-flow and control operations (Figure 10). The emphasisis put on the ropes from the puppet master to the sandbags node andthe levees node (Figure 10a) which receive a high level-of-detail. Thetwo thick ropes originating from the results connector of the 3D viewclearly highlight the importance of spatial selection (Figure 10b). Tobe able to produce the risk visualizations as required by task T3 (Fig-ure 1, T3), we have to create a robustness-analyzer node for each data-flow output of interest. We choose the global damage, the damage tothe hospital as well as the water levels along the evacuation path. Af-ter this, we are ready for simulation. WL provide a scheduling scheme
1879WASER ET AL: NODES ON ROPES: A COMPREHENSIVE DATA AND CONTROL FLOW FOR STEERING ENSEMBLE...

that allows for real-time monitoring of results. During simulation, therisk curves in the flow diagram are regularly updated. Thus, we canreason as soon as simulation data is available. The total simulationtime is approximately 50% of real-time.
To produce the visualizations in the flow diagram, we brush allframes of a parameter study that lie within the time interval of 620 secto 760 sec. For each track in the distribution, the robustness analyzeraverages results across this time interval to calculate the standard de-viation and the histogram. The ensemble graphs plot the temporalevolutions of quantities for each track and display a confidence inter-val (light orange area, see Figure 9c). The final results are shown inFigure 9. In the following, we use the letters a-h to direct the read-ers attention to the relevant parts in the Figure. PS Grey clearly failswith respect to all requirements. The damage to the hospital is highin most of the tracks (c). The evacuation path cannot be consideredsafe, no matter where the levee-breach takes place (d). The standarddeviation with respect to the global damage estimation is low (e) sincein all cases, the neighborhood suffers from severe flooding. For thisreason, the related robustness analyzer shows no detailed information.A quick peek into the visualization in the WL view (b) verifies thefound results. Here, frames are colored according to the global dam-age (green=low, red=high). Through the WL visualization alone, wecannot say whether the solution tested with PS Red or the one testedwith PS Green is more robust. In both cases, the damage to the com-plete neighborhood is high at breach locations that are farther off themost likely one. The hospital-damage visualizations in both flow di-agrams comprise an outlier that puts the hospital in danger (f). How-ever, the precautionary measures tested with PS Green are incapableof keeping the evacuation path water free (g). On the other hand, theflow diagram of PS Red (h) does not show an output distribution forthe water levels at the evacuation path at all. This is due to the factthat the related barrier arrangement protects the evacuation path withrespect to each value in the parameter study. Even though we need tochoose a response strategy that puts the hospital in danger in case of anunlikely outcome, we are able to keep the people in the hospital safe.
8.2 Domain Expert FeedbackThe case study was assessed by an expert with experience in floodforecasting and management systems [13]. It was immediately clearto him that the main strength of Nodes on Ropes (NR) is the ability toaccount for the uncertainty in the forecasts and management implica-tions. Uncertainty can come from weather predictions and uncertainlocations of levee breaches, among other factors. Having an under-standing of the uncertainty is a key criterion in flood managementdecisions as one usually chooses robust flood management designs.One attempts to minimize the risk of making a poor decision that maypossibly aggravate the adverse effects of a flood on infrastructure andpeople. NR allows the user to monitor the evolution of the uncertaintyin time with respect to different outputs (such as the accessibility ofthe evacuation path) which makes it ideally suited for the uncertaintyassessment by flood managers. NR is more flexible than WL as onecan assign boundary conditions (such as the potential levee-breach po-sition) as well as a range of other parameters. This is important forreal-world applications as they always differ on a case by case basis.Another advantage over WL is that the data and control-flow has nowbecome transparent. The modular design makes it easy for the floodmanager to change parameters related to the inundation in real time.Also, the flow of uncertainty has become transparent which helps todetect the sources of uncertainties in the decision making. The sys-tem could be used for real-time application during a flood event. Thereal-time updating of the ensemble forecasts in a separate window isan interesting feature that helps keep track of the evolution of the fore-casts and their uncertainty.
9 IMPLEMENTATION
Nodes on Ropes is part of the Visdom [2] system, comprising WL andthe presented approach. The separation of meta-flow and data-flowis reflected by the client-server architecture of the system. The meta-flow is completely evaluated on the client, the data-flow on the server.
Parameters are represented in XML, enabling a flexible and genericimplementation of all meta-flow responsibilities. When a control op-eration on the client side is initiated (e.g., due to a user interaction), themeta-flow is executed first. During this process, a global synchronizerinstance bundles the changed data-flow parameters into one XML re-quest structure. When the meta-flow is complete, this request is sentto the server. The server is in charge of executing the data-flow whichinvolves the compute-intensive parts of the process such as simulationor rendering. We leverage GPU power to perform these processes inreal-time. Only images and results are sent back to the client. Theresults are then available for further processing through the meta-flowconnector results. The client is a light-weight application implementedin Actionscript that runs in a browser. Hereby, we are working towardsour vision for the future to provide mobile decision support on-site.
10 CONCLUSION
So far simulations have been predominantly concerned with the data-flow. The control-flow was often simple and/or hardwired. Increas-ingly complex simulations are characterized by an intricate interplayof various heterogeneous components. The elaborate and dynamic na-ture of the evolving control-flow requires novel visualization and inter-action functionality. The goal of this paper is to tackle three importantquestions related to interactive simulation steering: How can we inves-tigate uncertainties with respect to input parameters? How can we vi-sualize what is going on in a simulation? How can the user modify thesimulation setup and extend the explored parameter space? To answerthese questions we suggest the extension of the classical data-flow con-cept by four novel schemes: First, we propose to add a configurablemeta-flow as an abstraction for control- and information-flow betweennodes. Second, based on the meta-flow, we suggest interactive pa-rameter studies through World Lines. One benefit of this approach isthe possibility to create customized steering mechanisms which com-bine visualization, simulation design, and parameter-space navigation.Hereby, the generic data-flow approach can become as user friendly asspecial purpose turn-key systems. In the general setup we retain theconcept of the data-flow in a consistent manner, even though complexnode interactions are possible using the meta-flow. Third, we suggestpuppet-master nodes which can control other nodes via ropes. Theconcept of puppet masters is our answer to the rising complexity wheninteractive steering comes into play. System complexity involves atrade-off between simplicity and power of the system. At one end ofthe spectrum, using a programming language like C++, one can set upa complete dynamical system and control any detail of its behavior.At the other end of the spectrum, there are ready-made tools for sim-ulation and visualization which are easier to handle than a program-ming language. In this paper, we suggest a system which minimizesthe capabilities required from the user while retaining complex systembehavior at the same time. This is possible by allowing the user toperform modifications via puppet masters. Fourth, we suggest to usethe flow diagram itself for visualization. The diagram can highlightimportant system components and display relevant information aboutstatistical distributions in a parameter study which are difficult to showusing World Lines alone.
For future work, we consider the automatic analysis of simulationsteps as an important tool to control which simulations can be keptrunning and which should be stopped. For large parameter studies,early simulation termination can save a lot of computational resources.
The contributions of this paper are guided by the basic insight thata more complex framework needs smarter tools to control its features.By augmenting the data-flow by an elaborate meta-flow, it becomespossible to not only use the data-flow for building the application, butto learn from it as well.
ACKNOWLEDGMENTS
This work was supported by grants from the Austrian Science Fund(FWF): P 22542-N23 (Semantic Steering) and P 21695-N23 (ViMal),and a grant from the Future and Emerging Technologies (FET) pro-gramme of the European Commision: 226042 (SemSeg).
1880 IEEE TRANSACTIONS ON VISUALIZATION AND COMPUTER GRAPHICS, VOL. 17, NO. 12, DECEMBER 2011
REFERENCES
[1] Mevislab: A development environment for medical image processing andvisualization. http://www.mevislab.de/ (last visited on March,17th 2011).
[2] Visdom - An integrated visualization system. http://visdom.at(last visited on May, 11th 2011).
[3] World Lines Video. http://visdom.at/media/slides/world_lines.mp4 (last visited on March, 25th 2011).
[4] Advanced Visual Systems Inc. AVS - Advanced Visual System. http://www.avs.com/ (last visited on March, 21st 2011).
[5] A. Amirkhanov, C. Heinzl, M. Reiter, and M. E. Groller. Visual optimal-ity and stability analysis of 3dct scan positions. IEEE Transactions onVisualization and Computer Graphics, 16(6):1477 –1487, 2010.
[6] ANSYS, Inc. Explicit Dynamics, Chapter 10: OptimizationStudies. http://www.cadfamily.com/download/CAE/ANSYS-Explicit/Explicit_Dynamics_Optimization_Studies.pdf (last visited on March, 2nd 2011), 2009.
[7] H. Apel, A. Thieken, B. Merz, and G. Bloschl. Flood risk assessmentand associated uncertainty. Natural Hazards and Earth System Science,4:295–308, 2004.
[8] H. Apel, A. Thieken, B. Merz, and G. Bloschl. A probabilistic modellingsystem for assessing flood risks. Natural Hazards, 38:79–100, 2006.
[9] L. Bartram, A. Ho, J. Dill, and F. Henigman. The continuous zoom: Aconstrained fisheye technique for viewing and navigating large informa-tion spaces. pages 207–215. ACM Press, 1995.
[10] W. Berger, H. Piringer, P. Filzmoser, and E. Groller. Uncertainty-awareexploration of continuous parameter spaces using multivariate prediction.Computer Graphics Forum, 30:911–920, 2011.
[11] Bestiario company. Impure - A web-based visual programming toolwritten in ActionScript to visualize data from the internet. http://www.impure.com/ (last visited on February, 8th 2011).
[12] I. Bitter, R. Van Uitert, I. Wolf, L. Ibanez, and J.-M. Kuhnigk. Compar-ison of four freely available frameworks for image processing and visu-alization that use itk. IEEE Transactions on Visualization and ComputerGraphics, 13(3):483–493, 2007.
[13] G. Bloschl. Flood warning - on the value of local information. Intl. J.River Basin Management, 6(1):41–50, 2008.
[14] S. Bruckner and T. Moller. Result-driven exploration of simulation pa-rameter spaces for visual effects design. IEEE Transactions on Visualiza-tion and Computer Graphics, 16(6):1467–1475, 2010.
[15] G. Cameron. Modular visualization environments: past, present, and fu-ture. ACM SIGGRAPH Computer Graphics 1995, 29(2):3–4, 1995.
[16] Centre for Research on the Epidemiology of Disasters (CRED). 2010 dis-asters in numbers. http://cred.be/sites/default/files/PressConference2010.pdf (last visited on March, 3rd 2011).
[17] M. Chen, D. Ebert, H. Hagen, R. S. Laramee, R. van Liere, K.-L. Ma,W. Ribarsky, G. Scheuermann, and D. Silver. Data, information, andknowledge in visualization. IEEE Computer Graphics and Applications,29:12–19, January 2009.
[18] H. Childs, E. Brugger, K. Bonnell, J. Meredith, M. Miller, B. Whitlock,and N. Max. A contract based system for large data visualization. IEEETransactions on Visualization and Computer Graphics, pages 190–198,2005.
[19] H. Cloke and F. Pappenberger. Ensemble flood forecasting: a review.Journal of Hydrology, 375(3-4):613–626, 2009.
[20] C. Elliott, V. Vijayakumar, W. Zink, and R. Hansen. National instru-ments labview: A programming environment for laboratory automationand measurement. Journal of the Association for Laboratory Automation,12(1):17–24, 2007.
[21] W. Felger and F. Schroder. The visualization input pipeline - enabling se-mantic interaction in scientific visualization. Computer Graphics Forum,11:139–151, 1992.
[22] R. B. Haber and D. A. McNabb. Visualization idioms: A conceptualmodel for scientific visualization systems. IEEE Visualization in Scien-tific Computing, pages 74–93, 1990.
[23] W. M. Johnston, J. R. P. Hanna, and R. J. Millar. Advances in dataflowprogramming languages. ACM Computing Surveys, 36(1):1–34, 2004.
[24] Kitware. Paraview - an open source, multi-platform data analysis and vi-sualization application. http://www.paraview.org/ (last visitedon March, 17th 2011).
[25] J. Komma, C. Reszler, G. Bloschl, and T. Haiden. Ensemble predictionof floods - catchment non-linearity and forecast probabilities. Natural
Hazards and Earth System Sciences, 7:431–444, 2007.[26] M. Marttila-Kontio and R. Honkanen. Not-so-free data flow in a visual
data flow programming language. Computer Science and InformationTechnology, International Conference on, pages 613–619, 2009.
[27] K. Matkovic, H. Hauser, R. Sainitzer, and M. E. Groller. Process vi-sualization with levels of detail. In Proceedings IEEE Symposium onInformation Visualization 2002 (InfoVis 2002), pages 67–70, 2002.
[28] J. Meyer-Spradow, T. Ropinski, J. Mensmann, and K. H. Hinrichs.Voreen: A rapid-prototyping environment for ray-casting-based volumevisualizations. IEEE Computer Graphics and Applications, 29(6):6–13,2009.
[29] National Instruments (NI). LabVIEW: A graphical programming envi-ronment for engineers to develop measurement, test, and control systems.http://www.ni.com/labview (last visited on March, 21st 2011).
[30] Numerical Algorithms Group (NAG). IRIS Explorer: A visual program-ming environment to develop, prototype and build visualization applica-tions. http://www.nag.co.uk/Welcome_IEC.asp (last visitedon March, 21st 2011).
[31] I. P. on Climate Change (IPCC). Ipcc fourth assessment report: Climatechange 2007 (ar4). http://www.ipcc.ch/publications_and_data/publications_and_data_reports.shtml (lastvisited on March, 17th 2011), 2007.
[32] S. G. Parker and C. R. Johnson. SCIRun: A scientific programmingenvironment for computational steering. In Proceedings of the 1995ACM/IEEE conference on Supercomputing, page 52, 1995.
[33] A. M. Perez, J. M. Gomez, and R. C. Perez. Semantic interaction inenterprise data-flow visualization environments: An exploratory study. InICT Innovations 2009, pages 217–226. Springer Berlin Heidelberg, 2010.
[34] E. Santos, L. Lins, J. Ahrens, J. Freire, and C. Silva. VisMashup: Stream-lining the creation of custom visualization applications. IEEE Transac-tions on Visualization and Computer Graphics, 15(6):1539–1546, 2009.
[35] C. Scheidegger, H. Vo, D. Koop, J. Freire, and C. Silva. Querying andcreating visualizations by analogy. IEEE Transactions on Visualizationand Computer Graphics, 13(6):1560 –1567, 2007.
[36] B. Schindler, J. Waser, R. Fuchs, and R. Peikert. Multiverse data-flowcontrol. Technical Report 720, ETH Zurich Comp. Science, 2010.
[37] Scientific Computing and Imaging Institute (SCI). SCIRun: A scientificcomputing problem solving environment. http://www.scirun.org (last visited on March, st 2011).
[38] C. T. Silva, J. Freire, and S. P. Callahan. Provenance for visualizations:Reproducibility and beyond. Computing in Science and Engineering,9(5):82–89, 2007.
[39] M. G. Stewart and R. E. Melchers. Probabilistic risk assessment of engi-neering systems. Chapman and Hall, London, 1997.
[40] A. Telea and J. J. van Wijk. Vission: An object oriented dataflow systemfor simulation and visualization. In Proceedings IEEE Symposium onVisualization (VisSym 1999), pages 95–104, 1999.
[41] A. Telea and J. J. van Wijk. Smartlink: An agent for supporting dataflowapplication construction. In Proceedings IEEE Symposium on Visualiza-tion (VisSym 2000), pages 189–198, 2000.
[42] A. H. Thieken, M. Muller, H. Kreibich, and B. Merz. Flood damage andinfluencing factors: New insights from the August 2002 flood in Ger-many. Water Resources Research, 41:16pp, 2005.
[43] C. Upson, T. Faulhaber Jr., D. Kamins, D. H. Laidlaw, D. Schlegel,J. Vroom, R. Gurwitz, and A. van Dam. The application visualizationsystem: A computational environment for scientific visualization. IEEEComputer Graphics and Applications, 9:30–42, July 1989.
[44] J. Waser, R. Fuchs, H. Ribicic, B. Schindler, G. Bloschl, and M. E.Groller. World Lines. IEEE Transactions on Visualization and ComputerGraphics, 16(6):1458–1467, 2010.
[45] C. Weaver. Building highly-coordinated visualizations in Improvise. InProceedings IEEE Symposium on Information Visualization 2004 (Info-Vis 2004), pages 159–166, 2004.
[46] C. Weaver. Visualizing coordination in situ. In Proceedings IEEE Sympo-sium on Information Visualization 2005 (InfoVis 2005), pages 165–172,2005.
[47] H. Wright, K. Brodlie, and M. Brown. The dataflow visualization pipelineas a problem solving environment. In Proceedings of the Eurograph-ics Workshop on Virtual Environments and Scientific Visualization 1996,pages 267–276, 1996.
[48] H. Wright and J. Walton. Hyperscribe: A data management facility forthe dataflow visualization pipeline. In IRIS Explorer Technical ReportIETR/4, NAG Ltd, 1996.
1881WASER ET AL: NODES ON ROPES: A COMPREHENSIVE DATA AND CONTROL FLOW FOR STEERING ENSEMBLE...