W I R E I S E V E R Y W H E R E office 703.299.4434 I email info ...
147
American Wire Producers Association PO Box 151387 Alexandria, VA 22315 WIRE IS EVERYWHERE office 703.299.4434 I email [email protected] I www.awpa.org September 23, 2015 CHINA’S WTO COMPLIANCE DOCKET NO. USTR-2015-0010 VIA ELECTRONIC SUBMISSION Mr. Edward Gresser Acting Chair, Trade Policy Staff Committee Office of the United States Trade Representative 600 Seventeenth Street, NW Washington, DC 20508 Re: Comments concerning China’s Compliance with WTO Commitments (Docket Number USTR-2015-0010) Dear Mr. Chairman: The American Wire Producers Association (“AWPA”) appreciates the opportunity to submit these written comments in connection with the Trade Policy Staff Committee’s review of China’s compliance with the commitments it made during its accession to the World Trade Organization (“WTO”) in 2001. 1 The members of the AWPA remain firmly convinced that the United States Government must insist that China abide by its WTO commitments and immediately stop its illegal trade policies and practices on several fronts, including: (1) Mercantilist export tax and value added tax (“VAT”) rebate schemes which restrict the exportation of basic products from China and promote the exportation of downstream value-added products by China; 1 See Office of the United States Trade Representative, Request for Comments and Notice of Public Hearing Concerning China’s Compliance With WTO Commitments, 80 Fed. Reg. 47,985 (August 10, 2015).
-
Upload
khangminh22 -
Category
Documents
-
view
1 -
download
0
Transcript of W I R E I S E V E R Y W H E R E office 703.299.4434 I email info ...
American Wire Producers Association
PO Box 151387
Alexandria, VA 22315
W I R E I S E V E R Y W H E R E
office 703.299.4434 I email [email protected] I www.awpa.org
September 23, 2015CHINA’S WTO COMPLIANCE
DOCKET NO. USTR-2015-0010
VIA ELECTRONIC SUBMISSION
Mr. Edward GresserActing Chair, Trade Policy Staff CommitteeOffice of the United States Trade Representative600 Seventeenth Street, NWWashington, DC 20508
Re: Comments concerning China’s Compliance withWTO Commitments (Docket Number USTR-2015-0010)
Dear Mr. Chairman:
The American Wire Producers Association (“AWPA”) appreciates the opportunity to
submit these written comments in connection with the Trade Policy Staff Committee’s review of
China’s compliance with the commitments it made during its accession to the World Trade
Organization (“WTO”) in 2001.1
The members of the AWPA remain firmly convinced that the United States Government
must insist that China abide by its WTO commitments and immediately stop its illegal trade
policies and practices on several fronts, including:
(1) Mercantilist export tax and value added tax (“VAT”) rebate schemes whichrestrict the exportation of basic products from China and promotethe exportation of downstream value-added products by China;
1 See Office of the United States Trade Representative, Request for Comments and Notice ofPublic Hearing Concerning China’s Compliance With WTO Commitments, 80 Fed. Reg. 47,985(August 10, 2015).
MR. EDWARD GRESSER
TRADE POLICY STAFF COMMITTEE
OFFICE OF THE UNITED STATES TRADE REPRESENTATIVE
September 23, 2015Page 2
(2) Widespread subsidization of Chinese production for export marketsby every level of the Chinese governmental system;
(3) Actions of many Chinese manufacturers and exporters to evade applicableantidumping and countervailing duty orders through transshipment, mis-classification, falsification of country of origin, and other illegal schemes; and
(4) Currency manipulation which protects and promotes China’s export-drivenindustries.
American manufacturers of wire and wire products have been seriously and adversely impacted
by these WTO-inconsistent practices, making it extremely difficult and often impossible for
the U.S. industry to compete with unfairly-traded imports from China.
I. BACKGROUND
The AWPA is a trade association which represents companies that collectively produce
more than 80 percent of all carbon, alloy, and stainless steel wire and wire products
manufactured in the United States. The 88 member companies of the AWPA employ
22,000 workers in over 215 plants and facilities located in 35 states. Sales of these companies
exceeded $11 billion in 2014.
American manufacturers of steel wire and wire products are entrepreneurial and
committed to maintaining their competitive market position despite heavy import pressure in
their product sectors. They pride themselves on their high productivity and constant
reinvestment in the latest technology and equipment, keeping the American wire industry one of
the most globally competitive segments of the steel industry. They are equally proud of
MR. EDWARD GRESSER
TRADE POLICY STAFF COMMITTEE
OFFICE OF THE UNITED STATES TRADE REPRESENTATIVE
September 23, 2015Page 3
the thousands of good-paying jobs that they provide to hard-working Americans in hundreds of
communities throughout the United States.
The member companies of the AWPA firmly believe that the continued failure by
the U.S. Government to halt China’s unfair trade practices—including the Chinese
Government’s artificial suppression of the value of the Chinese renminbi, distortion of export
patterns through manipulation of China’s export taxes and VAT rebate programs, subsidization
of Chinese manufacturers, and evasion of applicable U.S. duties by Chinese exporters—threatens
the jobs of thousands of American workers in the domestic wire and wire products industry.
II. MAJOR TRADE PROBLEMS WITH CHINA
A. CURRENCY MANIPULATION
The Chinese renminbi (“RMB”) or yuan remains significantly undervalued against
the U.S. dollar and other major currencies. At the same time, Chinese industries have achieved
major increases in production capability and quality, productivity, foreign direct investment, and
other factors that would normally be expected to cause a currency to appreciate. China has
repeatedly stated that it may be willing to consider restraining its manipulation of the RMB, but
the Chinese Government has fallen woefully short of adequately realigning its currency in
accordance with free market principles. Our country cannot continue to accept half measures
and token gestures when the U.S. manufacturing sector is suffering so severely as a direct result
of the Chinese Government’s deliberate and willful manipulation of its currency.
MR. EDWARD GRESSER
TRADE POLICY STAFF COMMITTEE
OFFICE OF THE UNITED STATES TRADE REPRESENTATIVE
September 23, 2015Page 4
Under current law, the Department of the Treasury (“Treasury”) is required to identify
countries that manipulate their currencies for purposes of gaining an unfair competitive trade
advantage.2 In recent years, Treasury has found that certain countries’ currencies are
undervalued. However, despite overwhelming evidence, Treasury has refused to cite
such countries—including China—as currency manipulators.3 Treasury’s April 2015 Report
identified the many benefits that appreciation of the value of the RMB would have on
the Chinese and global economies, and it recited the numerous protestations and undertakings by
Chinese authorities of their intention to liberalize their economic policies and permit
their currency to appreciate in accordance with market principles.4 However, as
Treasury recently reported, despite some progress in 2014 and early 2015, China’s
RMB exchange rate “remains significantly undervalued.”5 Moreover, Treasury noted that:
“fundamental factors point to the need for further RMB appreciation over the medium-term.”6
Further, although China has agreed to subscribe to the International Monetary Fund’s Special
Data Dissemination Standard for reporting foreign exchange reserves and other economic data,
2 Omnibus Trade and Competitiveness Act of 1988, 22 U.S.C. § 5305.
3 See, e.g., U.S. Department of the Treasury, Office of International Affairs: Report to Congress onInternational Economic and Exchange Rate Policies (April 9, 2015) (“April 2015 Report”).
4 Id. at 3–4, 11–14.
5 Id. at 3 (emphasis added).
6 Id. at 14.
MR. EDWARD GRESSER
TRADE POLICY STAFF COMMITTEE
OFFICE OF THE UNITED STATES TRADE REPRESENTATIVE
September 23, 2015Page 5
China still does not publish its foreign exchange interventions—in contrast to other economies
with major international currencies.7 Despite all evidence to the contrary, Treasury again
incredulously claimed that China has not manipulated the exchange rate of the RMB.8 Instead,
Treasury reported that it:
. . . continues to push for comprehensive adherence . . . to moverapidly toward market-determined exchange rate systems andexchange rate flexibility, to avoid persistent exchange ratemisalignments, to refrain from competitive devaluation, and to nottarget exchange rates for competitive purposes.9
We respectfully urge the United States Government to reverse its hitherto unsupportable
position and identify China as a currency manipulator and initiate the remedial actions provided
by law.
B. BORDER TAX SCHEMES—EXPORT TAXES AND VAT REBATE INCENTIVES
AWPA members and many other American manufacturers must contend with
an extraordinary distortion of trade patterns caused by the border tax regime manipulated by
the Chinese Government. In violation of its international trade obligations, China has imposed
export taxes on carbon steel wire rod while granting VAT rebates on many finished downstream
wire products manufactured from wire rod, creating distortions that directly and adversely
impact U.S. manufacturers of these downstream products.
7 Id. at 12–13.
8 Id. at 4.
9 Id.
MR. EDWARD GRESSER
TRADE POLICY STAFF COMMITTEE
OFFICE OF THE UNITED STATES TRADE REPRESENTATIVE
September 23, 2015Page 6
The Chinese Government’s use of export taxes and licenses to limit exports of wire rod is
a violation of China’s Protocol of Accession to the WTO. At the same time, China’s VAT
rebates subsidize the exportation of downstream wire products and severely distort the trade in
these products. The imposition of export taxes on wire rod encourages the retention of this basic
material input in China, resulting in greater availability and lower input costs for
Chinese manufacturers of wire and wire products. Together, these tax and rebate practices favor
Chinese industries which export higher value downstream products to the United States and
other countries. These clear manipulations of China’s border tax schemes violate
the commitments made by the Chinese Government when it joined the WTO.
The specific violations of China’s international obligations are as follows:
(1) China’s export taxes on wire rod violate Section 11.3 of China’s Protocolof Accession to the WTO;10
(2) China’s export licensing requirements on wire rod violate Article XI:1 ofthe General Agreement on Tariffs and Trade (“GATT”) and Part I,Section 7.2 of China’s Protocol of Accession to the WTO;
(3) China’s differential tax scheme is a prohibited export subsidy that violatesArticle 3 of the Subsides and Countervailing Measures Agreement,Articles VI and XVI of the GATT, and Part I, Section 10.3 ofChina’s Protocol of Accession to the WTO;
10 World Trade Organization: Accession of the People’s Republic of China, WT/L/432(November 23, 2001)—“China shall eliminate all taxes and charges applied to exports unlessspecifically provided for in Annex 6 of this Protocol or applied in conformity with the provisionsof Article VIII of the GATT 1994.” Steel wire rod is not listed in Annex 6 as a product subject toexport duties.
MR. EDWARD GRESSER
TRADE POLICY STAFF COMMITTEE
OFFICE OF THE UNITED STATES TRADE REPRESENTATIVE
September 23, 2015Page 7
(4) China’s discriminatory, steel-specific border measures are having adverseeffects on the interests of the United States and as such also constitutean actionable subsidy under Articles 5 and 6.3 of the Agreement onSubsidies and Countervailing Measures; and
(5) China’s differential export tax scheme, export taxes on wire rod, andexport licensing requirements for wire rod further nullify or impairbenefits of the United States within the meaning of Article XXIII:1(b) ofthe GATT.
The member companies of the AWPA have worked with U.S. officials to try to address
the problems resulting from China’s noncompliance with its obligations under the WTO.
Discussions with the Office of the United States Trade Representative (“USTR”) culminated in
the participation of an AWPA member company representative in the meeting of the U.S.-China
Steel Dialogue which was held in Beijing, China, in October 2008. The USTR agreed that
our industry had a unique story to tell and encouraged the AWPA to become an active participant
in this government-industry initiative.
During the 2008 Steel Dialogue meeting, the AWPA representative made a presentation
regarding trends in exports of wire rod and representative wire products from China. He pointed
out that, while wire rod exports to the United States dropped significantly from 2007 to 2008, at
the same time exports of wire and wire products—already sizeable—increased substantially.
Additionally, the average unit values of the Chinese wire products were below the average unit
values of imports from all other countries. These trade patterns were the direct result of China’s
border tax policies. In 2007, the Chinese Government deliberately eliminated VAT rebates on
exports of wire rod, but it continued to provide VAT rebates on exports of a range of steel wire
MR. EDWARD GRESSER
TRADE POLICY STAFF COMMITTEE
OFFICE OF THE UNITED STATES TRADE REPRESENTATIVE
September 23, 2015Page 8
and wire products. These steps dampened the financial incentive to export wire rod but
encouraged the exportation of downstream wire and wire products. On January 1, 2008, China
increased the export tax on wire rod from 10 to 15 percent, which further diminished
the financial return for exporters of wire rod. The AWPA is aware of no similar export taxes to
discourage the exportation of downstream wire products.
During the October 2008 meeting in Beijing, the Chinese Government acknowledged that
a distortion did exist but claimed that it had the right to limit exports of wire rod due to
an allegedly adverse impact of increased wire rod production on China’s environment.
USTR officials countered that this argument is not plausible because domestic rod production
within China was not being reduced as a result of the limits on wire rod exports. Following
the Beijing meeting, there was some optimism by both U.S. officials and the AWPA’s represent-
ative that the Chinese Government would modify its export tax scheme. Two weeks after
the meeting in Beijing, the Chinese Government did announce the removal of export taxes on
many steel products, but it did not remove or reduce the export tax on wire rod. Moreover, in
2009, the Chinese Government actually raised the amount of VAT rebates on a number of
downstream wire and wire products, including galvanized wire, silicon-manganese wire, and
other alloy steel wire—further encouraging the export of these wire products.
It is the AWPA’s position that the Chinese Government’s disparate treatment of wire rod
in relation to other steel products undermines any potential legal defense based on environmental
concerns. If the Chinese authorities were motivated by such concerns, why did they remove
MR. EDWARD GRESSER
TRADE POLICY STAFF COMMITTEE
OFFICE OF THE UNITED STATES TRADE REPRESENTATIVE
September 23, 2015Page 9
the export taxes on other steel products which present the same environmental concerns and, in
fact, are likely to have an even greater adverse impact on the environment than the production of
wire rod? Moreover, wire rod continues to be produced in China—it just remains in China,
rather than being available for export. It appears that China’s actions are driven not by concerns
about the environment but by a commercial calculation to promote the production and
exportation of downstream wire and wire products manufactured from wire rod.
These downstream products have higher added values than wire rod, and the Chinese companies
that make these downstream products employ large numbers of workers.
The USTR raised these issues more than five years ago in its 2009 Report to Congress on
China’s WTO Compliance, stating that “China maintains numerous export restraints that raise
serious concerns under WTO rules,” noting that export restraints by the Chinese Government
create disadvantages for competing industries in the United States and other countries and that
these “widespread” export restraints “can significantly distort trade.”11 Further, the 2009 Report
observed that “China’s economic planners also attempt to manage the export of
many intermediate and downstream products, often by raising or lowering the value-added tax
(“VAT”) rebate available upon export and sometimes by imposing or retracting export duties.”12
Following the 2008 Steel Dialogue meeting, mentioned above, the USTR reported that, in
11 United States Trade Representative, 2009 Report to Congress on China’s WTO Compliance(December 2009) (“2009 Report”) at 38–39.
12 Id. at 39.
MR. EDWARD GRESSER
TRADE POLICY STAFF COMMITTEE
OFFICE OF THE UNITED STATES TRADE REPRESENTATIVE
September 23, 2015Page 10
December 2008, China responded to the global economic downturn “by seeking to boost
its exports through changes to its VAT export rebate and export duty regimes”—which were
intended again to increase exports of downstream steel products.13
The USTR returned to these issues in its 2011 Report to Congress on China’s WTO
Compliance, reiterating that:
As in prior years, China maintains numerous export restraints thatappear to violate WTO rules, including specific commitments thatChina made in its Protocol of Accession. These export restraintsdistort trade in raw materials as well as intermediate anddownstream products.14
As the 2011 Report explained:
Typically, the objective of China’s border tax adjustments is tomake larger quantities of primary and intermediate products ina particular sector available domestically at lower prices thanthe rest of the world, giving China’s downstream producers offinished products using these inputs a competitive advantage overforeign producers. To accomplish this objective, Chinadiscourages the export of the relevant primary and intermediateproducts by reducing or eliminating VAT rebates and perhaps alsoimposing export duties on them, resulting in increased domesticsupply and lower domestic prices. China’s downstream producers,in turn, benefit from these lower input prices as well as full VATrebates on export of their finished products.15
13 Id. at 40.
14 United States Trade Representative, 2011 Report to Congress on China’s WTO Compliance(December 2011) (“2011 Report”) at 37.
15 Id. at 39. This is precisely what the Chinese Government has done with respect to steel wire rod,the primary raw material for the production of wire and wire products.
MR. EDWARD GRESSER
TRADE POLICY STAFF COMMITTEE
OFFICE OF THE UNITED STATES TRADE REPRESENTATIVE
September 23, 2015Page 11
In particular, the 2011 Report addressed the effect of these export restraint schemes on
steel wire products:
In some situations, China has also used its border taxes toencourage the export of certain finished products over otherfinished products within a sector. For example, China reduced oreliminated VAT export rebates in November 2006 and April 2007and imposed export duties in May and July 2007 and January 2008on a wide range of semi-finished and finished steel products,seeking to discourage further unneeded creation of productioncapacity for these products. At the same time, these changes didnot target all steel products, and the result was that Chinese steelproducers shifted their production to value-added steel products forwhich full or partial VAT export rebates were still available,particularly wire products and steel pipe and tube products,causing a surge in exports of these products, many of which endedup in the U.S. market.16
The USTR’s 2012 Report to Congress on China’s WTO Compliance reads like a reprint
of the 2011 Report. Once again the 2012 Report found:
As in prior years, China maintains numerous export restraints thatappear to violate WTO rules, including specific commitments thatChina made in its accession agreement. These export restraintsdistort trade in raw materials as well as intermediate anddownstream products.17
As the USTR noted, these types of export restraints significantly distort trade by artificially
increasing China’s export prices for these inputs but at the same time artificially lowering
China’s domestic prices for these inputs, thus enabling Chinese producers of
16 Id. (emphasis supplied).
17 United States Trade Representative, 2012 Report to Congress On China’s WTO Compliance(December 2012) (“2012 Report”) at 43.
MR. EDWARD GRESSER
TRADE POLICY STAFF COMMITTEE
OFFICE OF THE UNITED STATES TRADE REPRESENTATIVE
September 23, 2015Page 12
downstream products to produce lower-priced merchandise for competition in global markets.18
Thus, Chinese manufacturers of steel wire and wire products benefit from the artificial restraints
on exports of wire rod—the basic input for wire and wire products—to the detriment of
the companies and workers in the U.S. wire and wire products industry.
In addition, the 2012 Report addressed China’s continuing manipulation of its border
tax policies to promote the exportation of value-added downstream products in virtually
the same language as the 2011 Report, reflecting the lack of progress on eliminating this abuse:
Typically, the objective of China’s border tax adjustments is tomake larger quantities of primary and intermediate products ina particular sector available domestically at lower prices thanthe rest of the world, giving China’s downstream producers offinished products using these inputs a competitive advantage overforeign producers. To accomplish this objective, Chinadiscourages the export of the relevant primary and intermediateproducts by reducing or eliminating VAT rebates and perhaps alsoimposing export duties on them, resulting in increased domesticsupply and lower domestic prices. China’s downstream producers,in turn benefit not only from these lower input prices but also fromfull VAT rebates when they export their finished products.19
Again, as in 2011, the 2012 Report specifically noted the damaging impact of China’s
illegal practices on American wire drawers and their employees:
. . . China has also used its border taxes to encourage the export ofcertain finished products over other finished products withina particular sector. For example, in the past, China has targetedvalue-added steel products, particularly wire products and
18 Id. at 43–44.
19 Id.
MR. EDWARD GRESSER
TRADE POLICY STAFF COMMITTEE
OFFICE OF THE UNITED STATES TRADE REPRESENTATIVE
September 23, 2015Page 13
steel pipe and tube products, causing a surge in exports ofthese products, many of which ended up in the U.S. market.20
The USTR’s 2013 Report to Congress On China’s WTO Compliance repeated
the concerns expressed in previous reports, noting in particular “the Chinese government’s
interventionist policies and practices and the large role of state-owned enterprises in
China’s economy.”21 Reciting word for word its findings in the 2012 Report, the USTR stated:
As in prior years, China maintains numerous export restraints thatappear to violate WTO rules, including specific commitments thatChina made in its accession agreement. These export restraintsdistort trade in raw materials as well as intermediate anddownstream products.22
Further, “{t}hese types of export restraints can significantly distort trade,” adversely and
unfairly affecting U.S. and other foreign producers of a wide range of downstream products,
such as steel.23 Specifically, the Chinese Government’s export restraints artificially
increase China’s export prices for raw material inputs, which also drive up world prices.
The same export restraints have the effect of artificially lowering raw material prices in
the Chinese market because they increase the amount of domestic supply.24 The end result is
20 Id. (emphasis supplied).
21 United States Trade Representative, 2013 Report to Congress On China’s WTO Compliance(December 2013) (“2013 Report”) at 2.
22 Id. at 42.
23 Id.
24 See id. at 42–43.
MR. EDWARD GRESSER
TRADE POLICY STAFF COMMITTEE
OFFICE OF THE UNITED STATES TRADE REPRESENTATIVE
September 23, 2015Page 14
that Chinese manufacturers of downstream products—such as steel wire and wire products—
have a significant government-sponsored cost advantage over their competitors in
the United States and elsewhere who operate on market-based principles.
The 2013 Report also reiterated the USTR’s concern about the Chinese Government’s
manipulation of border taxes to create artificial advantages for its domestic industries in violation
of WTO rules:
China’s economic planners attempt to manage the export ofmany primary, intermediate and downstream products by raising orlowering the value-added tax (VAT) rate available upon export andsometimes by imposing or retracting export duties. . . .{T}hese border tax practices have caused tremendous disruption,uncertainty and unfairness in global markets for the affectedproducts—particularly when these practices operate to incentivizethe export of downstream products for which China is a leadingworld producer or exporter such as steel . . . .25
Unfortunately, there appears to have been little progress in eliminating this widespread
abuse on the part of the Chinese Government, and American companies and their workers have
paid the price for the failure to end these trade-distorting practices. As the 2013 Report
recognized:
In some situations, China has also used its border taxes toencourage the export of certain finished products over otherfinished products within a particular sector. For example, in thepast, China has targeted value-added steel products, particularlywire products and steel pipe and tube products, causing a surge in
25 Id. at 44.
MR. EDWARD GRESSER
TRADE POLICY STAFF COMMITTEE
OFFICE OF THE UNITED STATES TRADE REPRESENTATIVE
September 23, 2015Page 15
exports of these products, many of which ended up inthe U.S. market.26
The most recent report submitted to Congress again chronicled the Chinese
Government’s manipulation of exports through border tax mechanisms.27 Echoing
its predecessors, the 2014 Report noted:
As in prior years, in 2014, the Chinese government attempted tomanage the export of many primary, intermediate and downstreamproducts by raising or lowering the value-added tax rebateavailable upon export. China sometimes reinforces its objectivesby imposing or retracting export duties. These practices havecaused tremendous disruption, uncertainty and unfairness inthe global markets for some products, particularly downstreamproducts where China is a leading world producer or exporter, suchas products made by the steel, aluminum and soda ash industries.These practices, together with other policies, such as excessivegovernment subsidization, also have contributed to severe excesscapacity in these same industries.28
The 2014 Report once again noted that the Chinese Government’s objective in
manipulating its border tax regime is “to make larger quantities of primary and intermediate
products . . . available domestically at lower prices than the rest of the world,” resulting in
a competitive advantage for China’s downstream producers of finished products.29 The Chinese
26 Id. at 45 (emphasis supplied).
27 United States Trade Representative, 2014 Report to Congress On China’s WTO Compliance(December 2014) (“2014 Report”) at 11–12; 53–54.
28 Id. at 11–12.
29 Id. at 53.
MR. EDWARD GRESSER
TRADE POLICY STAFF COMMITTEE
OFFICE OF THE UNITED STATES TRADE REPRESENTATIVE
September 23, 2015Page 16
Government discourages exports of primary and intermediate products by reducing or
eliminating VAT rebates and also in some cases by imposing export duties, and at the same time
it extends full VAT refunds on exports of the finished products.30 This manipulation of
border taxes leads to increased domestic supplies of these primary and intermediate inputs at
lower prices for Chinese downstream manufacturers that benefit from VAT rebates when
they export.31 Thus, as the 2014 Report concluded:
China has . . . used its border taxes to encourage the export ofcertain finished products over other finished products withina particular sector. For example, in the past, China has targetedvalue-added steel products, particularly wire products and steelpipe and tube products, causing a surge in exports ofthese products, many of which ended up in the U.S. market.32
Despite repeated complaints from the United States and other WTO members
about the trade-distortive effects of its border tax practices, “China has been unwilling to commit
to abandon its trade-distortive export rebates.”33 Although China has apparently acknowledged
that its eventual goal is to conform its VAT rebate system to WTO norms,34 it has not
yet done so. We respectfully urge the United States Government to continue to press
the Chinese Government to abide by its international agreements and achieve this objective.
30 Id.
31 Id.
32 Id. (emphasis supplied). See also Exhibit 3.
33 Id.
34 Id.
MR. EDWARD GRESSER
TRADE POLICY STAFF COMMITTEE
OFFICE OF THE UNITED STATES TRADE REPRESENTATIVE
September 23, 2015Page 17
C. CHINESE GOVERNMENT’S POLICY OF SUBSIDIZATION
The Chinese Government’s continued intervention in its domestic manufacturing sector
in ways that promote the creation of excess capacity to produce wire and wire products is of
great concern to the AWPA. China’s productive capacity far exceeds its domestic demand for
these products. Thus, Chinese manufacturers have a strong incentive to export wire products to
the United States at prices far below the market-determined prices of American companies.
In several recent countervailing duty investigations involving steel wire and
wire products, the U.S. Department of Commerce (“Commerce”) has made final determinations
that the Chinese Government has bestowed subsidies on local industries which then exported
merchandise to the United States at unfair prices. Specifically, Commerce found countervailing
duty margins ranging from 7.85 percent to 264.09 percent on wire shelving for kitchen
appliances; countervailing duty margins ranging from 9.42 percent to 45.85 percent on
prestressed concrete steel wire strand; and a countervailing duty margin of 62.46 percent on
steel wire grating.35
We believe that the U.S. wire and wire products industry can compete with
any manufacturer whose practices are governed by free market principles. We cannot compete,
35 Commerce also found countervailing duty margins ranging from 1.52 percent to 437.11 percenton steel wire decking and from 19.06 percent to 223.27 percent on galvanized steel wire, althoughthe U.S. International Trade Commission made negative injury determinations inthose investigations.
MR. EDWARD GRESSER
TRADE POLICY STAFF COMMITTEE
OFFICE OF THE UNITED STATES TRADE REPRESENTATIVE
September 23, 2015Page 18
however, with the pervasive and substantial subsidies given by various levels of
the Chinese Government to force otherwise noncompetitive products into the U.S. market.
D. WIDESPREAD SCHEMES TO EVADE APPLICABLE ANTIDUMPING AND
COUNTERVAILING DUTIES
Many export-oriented companies in China have engaged—and continue to engage—
in a variety of schemes to evade the collection of applicable antidumping (“AD”) and
countervailing (“CVD”) duties by U.S. Customs and Border Protection (“CBP”). These schemes
include:
(1) Transshipment of Goods through Third Countries. Chinese-origin goodssubject to AD and/or CVD orders are shipped to a third country which isnot subject to such orders. Sales and import documents are falsified toindicate that the third country is the source of the goods, and the goodssubsequently enter the United States without the payment of applicableAD and/or CVD duties.
(2) Falsification of the Country of Origin without Transshipment. This brazenscheme is similar to transshipment except that the goods are shippeddirectly from China to the United States. Sales and import documentsfalsely indicate origination in a third country in order to avoidthe assessment of applicable AD and/or CVD duties.
(3) Misclassification of Goods Subject to AD and CVD Orders. The tariffcodes and/or descriptions of the goods are falsified to indicatemerchandise which is not subject to AD or CVD orders. Again, the goodsenter the United States without the payment of applicable AD and/orCVD duties.
(4) Undervaluation of Goods Subject to AD and CVD Orders. This schemeunlawfully reduces an importer’s liability because AD and CVD duties arecalculated on the reported value of the goods generally on an ad valorem(percentage) basis.
MR. EDWARD GRESSER
TRADE POLICY STAFF COMMITTEE
OFFICE OF THE UNITED STATES TRADE REPRESENTATIVE
September 23, 2015Page 19
(5) Attribution of Goods to Companies with a Low or No AD/CVD Rate.This scheme involves either shipping goods through a Chinese companywith an AD/CVD rate which is lower than the Chinese producer’s rate orsimply falsifying the documents to reflect the name of a company witha lower or no AD/CVD rate. In either case, the United States is defraudedof the applicable duties.
U.S. manufacturers have submitted information about such evasion schemes
to CBP through the e-Allegation program, as well as in meetings with officials at
CBP Headquarters in Washington and CBP’s Center of Excellence and Expertise for
Base Metals in Chicago, and in visits with CBP inspectors at the ports. For example,
the domestic industry which manufactures steel wire garment hangers has submitted
30 e-Allegations to CBP with documentary support, showing transshipment of hangers from
China via third countries and misclassification of Chinese hangers as nonsubject merchandise in
order to evade the assessment of applicable AD duties.36 The most egregious scheme involved
the transshipment of hundreds of millions of Chinese-origin hangers through Taiwan even
though an in-country investigation showed that there was no production of these hangers in
Taiwan. In another case, the largest American producer of uncovered innerspring units used in
the manufacture of mattresses filed and won an AD case against China but was deprived of
effective relief when imports of Chinese-origin innerspring units were transshipped through
36 In a 2013 report to Congress, CBP noted that “{p}ort operations targeting wire hangers fromChina led to the discovery of misclassifications and transshipments of this merchandise at severalports of entry, and a loss of revenue of more than $2 million.” U.S. Customs and BorderProtection, Fiscal Year 2013 Report to Congress, Antidumping and Countervailing DutyEnforcement Actions and Compliance Initiatives: FY 2012 (July 19, 2013) at 5.
MR. EDWARD GRESSER
TRADE POLICY STAFF COMMITTEE
OFFICE OF THE UNITED STATES TRADE REPRESENTATIVE
September 23, 2015Page 20
Hong Kong to the United States. A report prepared by a private investigator confirmed that
there was no evidence of any production of these units in Hong Kong. In addition, during
the course of its administrative reviews of AD and CVD orders on products from China,
the U.S. Department of Commerce often finds evidence of apparent violations of the trade laws,
and it routinely furnishes this information to CBP for further investigation and enforcement
action.37
The pervasiveness of these evasion schemes was illustrated by a report prepared in late
2010 by the staff of Senator Ron Wyden (D-OR), who was at that time Chairman of the Trade
Subcommittee of the Senate Finance Committee.38 The Senator’s staff created a fictitious
company and set up a company profile on a Chinese business-to-business website “in order to
37 Memorandum to James C. Doyle, Director, Office V, Antidumping and Countervailing DutyOperations, U.S. Department of Commerce, from Julia Hancock, Senior Case Analyst, Office V,Antidumping and Countervailing Duty Operations, U.S. Department of Commerce, regardingFifth Administrative Review of Certain Steel Threaded Rod from the People’s Republic of China:Respondent Selection (July 10, 2014) at 5 (“To address the misclassification concern raised byPetitioner, . . . the Department will provide to CBP any relevant information, as appropriate, toassist that agency in fulfilling its statutory mission relating to AD/CVD administration andenforcement.”). See also Certain Steel Threaded Rod From the People's Republic of China:Preliminary Results of the First Administrative Review and Preliminary Rescission, in Part,76 Fed. Reg. 26,696 (May 9, 2011) at 26,697 (“{T}he Department referred this matter to CBP forpossible further investigation and enforcement action”); Steel Wire Garment Hangers Fromthe People’s Republic of China: Preliminary Results and Preliminary Rescission, in Part, ofthe Second Antidumping Duty Administrative Review, 76 Fed. Reg. 66,903 (October 28, 2011) at66,905 (“{W}e intend to refer this matter to CBP to investigate whether this entry was enteredproperly.”); Certain Steel Threaded Rod From the People’s Republic of China: PreliminaryResults of Antidumping Duty Administrative Review; 2011-2212, 78 Fed. Reg. 21,101 (April 9,2013) at 21,102 (“{W}e intend to refer this matter to CBP to investigate whetherJiaxing Xinyue’s entries were entered improperly”).
38 Senator Wyden is currently Ranking Member of the Finance Committee.
MR. EDWARD GRESSER
TRADE POLICY STAFF COMMITTEE
OFFICE OF THE UNITED STATES TRADE REPRESENTATIVE
September 23, 2015Page 21
find companies willing to cheat and evade AD/CVD orders.”39 The results were dismaying.
In less than two weeks, staff obtained written confirmation from ten Chinese companies that
they were willing to engage or assist in illegal evasion schemes in order to avoid the payment of
applicable AD and/or CVD duties.40 These schemes included transshipment of the subject
merchandise through third countries and falsification of the country of origin, undervaluation of
the merchandise to reduce the amount of AD or CVD duties, minor assembly operations in
a third country, and shipping subject merchandise under the name of a Chinese company which
had a lower AD or CVD rate.
While the Chinese Government may not be complicit in the execution of these evasion
schemes, it does have the means to curtail, if not entirely eliminate, their operation.
For example, export documentation submitted to the Chinese Government which shows
a country of origin other than China is clear evidence of fraudulent activity, and surging
Chinese exports of large quantities of merchandise destined for relatively small markets such as
Malaysia or Vietnam are indications that the merchandise is a likely candidate for
transshipment. Other irregularities or abnormalities with respect to Chinese exports—
particularly of products subject to AD or CVD orders in the United States—raise the prospect
that evasion schemes are at work. Just as the Chinese Government has apparently taken steps
39 Staff Report Prepared for Senator Ron Wyden, Duty Evasion: Harming U.S. Industry andAmerican Workers (November 8, 2010) at 5. The report is attached as Exhibit 1.
40 Id.
MR. EDWARD GRESSER
TRADE POLICY STAFF COMMITTEE
OFFICE OF THE UNITED STATES TRADE REPRESENTATIVE
September 23, 2015Page 22
to curtail the exportation of counterfeit or otherwise illegal goods to other markets,41
Chinese authorities can monitor exports to insure that they are in compliance with international
trade norms.
E. THE REALITY AND CONTINUATION OF CHINA’S DISTORTIVE TRADE
PRACTICES
The cumulative effect of the Chinese Government’s schemes to promote exports of
downstream, value-added products—such as steel wire and wire products—while restraining
the export of inputs—such as steel wire rod—can be seen in the import statistics of
the United States. As Exhibit 3 shows, U.S. imports of wire and wire products from China have
surged since China became a member of the WTO in 2001. While the impact of the great reces-
sion resulted in a general decline of imports in 2009, the Chinese export machine returned with
a vengeance in 2010, and shipments of wire products again reached high levels in 2012, 2013,
and 2014.42 During much of the same time, imports of steel wire rod—the basic input for
wire and wire products—plummeted, largely as the result of the implementation of
China’s discriminatory border tax schemes.43
41 See Exhibit 2.
42 Certain wire products, such as wire strand, nails, and steel wire garment hangers, did not followthis general trend because the U.S. industries producing these products in those cases pursuedsuccessful trade actions against Chinese imports under our antidumping and countervailing dutylaws. The resulting orders on strand, nails, and hangers had a dampening effect on imports fromChina—at least temporarily.
43 It should be noted that wire rod imports from China fell dramatically beginning in 2007 despitethe fact that the U.S. industry’s antidumping case against wire rod from China failed in
(Continued)
MR. EDWARD GRESSER
TRADE POLICY STAFF COMMITTEE
OFFICE OF THE UNITED STATES TRADE REPRESENTATIVE
September 23, 2015Page 23
In some instances, the wire products that have flooded into the United States from China
are not even consumed in the Chinese home market. For example, although China became
the world’s largest producer of steel wire garment hangers, China has virtually no domestic
market for garment hangers. Instead, with its vast capacity and predatory pricing schemes,
China targeted the U.S. market, and imports of steel wire garment hangers from China nearly
destroyed a once-vibrant and competitive American industry, driving seven companies out of
business and forcing unemployment on hundreds of American families. When the U.S. hanger
industry turned to the U.S. trade laws to redress the imbalance, the effectiveness of
the antidumping remedy was—and continues to be—undermined by the pervasive falsification
(Continued)
early 2006. One would normally expect that, under these circumstances, imports of wire rodfrom China would continue at historic levels or even increase. However, in 2007—the yearfollowing the termination of the antidumping case—imports of Chinese wire rod fell by56.5 percent. By 2008, imports amounted to 11.8 percent of 2006 levels and fell further tosix-tenths of one percent of 2006 levels in 2009. Imports of Chinese wire rod were virtuallynonexistent in 2010 and 2011, and imports in 2012 and 2013 remained far below 2008 levels.See Exhibit 3. An unintended consequence of the Chinese Government’s manipulation ofits border tax regime was the substantial increase of alloy steel wire rod exports from Chinato the United States in 2012 and 2013. The vast majority of this alloy product was essentiallycarbon steel wire rod with the addition of trace amounts of boron in order to qualifyas an alloy product, eligible for preferential treatment under China’s border tax regime.However, the increasing level of these exports resulted in the U.S. wire rod industry’s filingantidumping and countervailing duty petitions on Chinese carbon and alloy wire rod inJanuary 2014, which resulted in the imposition of antidumping and countervailing duty orders inJanuary 2015. Carbon and Certain Alloy Steel Wire Rod From the People’s Republic of China:Antidumping Duty Order, 80 Fed. Reg. 1,015 (January 8, 2015); Carbon and Certain Alloy SteelWire Rod From the People’s Republic of China: Amended Final Affirmative Countervailing DutyDetermination and Countervailing Duty Order, 80 Fed. Reg. 1,018 (January 8, 2015).
MR. EDWARD GRESSER
TRADE POLICY STAFF COMMITTEE
OFFICE OF THE UNITED STATES TRADE REPRESENTATIVE
September 23, 2015Page 24
of commercial and customs documents, transshipment of Chinese-made hangers through
third countries, and other forms of circumvention and duty evasion.
The devastating impact of the Chinese Government’s distortive monetary, regulatory, and
fiscal policies to promote exports to the United States is chronicled in the Economic Policy
Institute’s briefing paper entitled “The China Toll.” According to this report, the trade deficit
with China—fueled by currency manipulation, border tax schemes, and subsidy programs—
eliminated or displaced more than 2.7 million American jobs, including 2.1 million lost jobs in
the manufacturing sector, during the decade from 2001 through 2011.44 Virtually
every industrial sector has been damaged by China’s failure to comply with
its WTO commitments, resulting in job losses in every state.45
III. RECOMMENDED ACTIONS
A. TRADE STRATEGY
The AWPA respectfully urges the United States to develop a national economic and trade
strategy to address effectively and comprehensively the challenges posed by these unfair trade
practices of the Chinese Government.
44 Economic Policy Institute, EPI Briefing Paper on The China Toll: Growing U.S. trade deficitwith China cost more than 2.7 million jobs between 2001 and 2011, with job losses in every state(August 23, 2012). A copy of the briefing paper is attached as Exhibit 4.
45 See id. at Tables 3 and 4.
MR. EDWARD GRESSER
TRADE POLICY STAFF COMMITTEE
OFFICE OF THE UNITED STATES TRADE REPRESENTATIVE
September 23, 2015Page 25
B. CONSTRUCTIVE DIALOGUE WITH ACTION
The AWPA respectfully urges the United States to continue to engage China in
constructive dialogue, but at the same time we must use all available means to ensure
the effective enforcement of international trade obligations—including China’s Accession
Agreement to the WTO and all other WTO trade rules. Many of these recommendations are
supported by the U.S.-China Economic and Security Review Commission in its 2011, 2012,
2013, and 2014 Annual Reports to Congress.46
C. COUNTERVAILING DUTY CASES AGAINST SUBSIDIZED PRODUCTS
Commerce now has explicit statutory authority to impose countervailing duties on
subsidized imports from nonmarket economies—including China. The United States must meet
and defeat any challenges to Commerce’s enforcement of the countervailing duty laws.
D. REMEDIES AT THE WTO
The United States should continue aggressively to pursue the enforcement of its rights at
the WTO regarding China’s unfair trade practices, including China’s border tax schemes.
46 See 2011 Report to Congress of the U.S.-China Economic and Security Review Commission(November 2011) at 129–130; 2012 Report to Congress of the U.S.-China Economic and SecurityReview Commission (November 2012) at 109–110; 2013 Report to Congress of the U.S.-ChinaEconomic and Security Review Commission (November 2013) at 1–2, 7–8, 48, and 79;2014 Report to Congress of the U.S.-China Economic and Security Review Commission(November 2014) at 30 and 227–228.
MR. EDWARD GRESSER
TRADE POLICY STAFF COMMITTEE
OFFICE OF THE UNITED STATES TRADE REPRESENTATIVE
September 23, 2015Page 26
E. EFFECTIVE ENFORCEMENT OF TRADE REMEDIES AT THE BORDER
To date, it appears that U.S. Customs and Border Protection (“CBP”) and its sister
agency, Immigration and Customs Enforcement (“ICE”), have been overwhelmed by the sheer
magnitude of the transshipment and circumvention schemes which have often characterized
the response of Chinese exporters and their complicit U.S. importers to the imposition of
antidumping and countervailing duty orders. We respectfully urge the USTR, CBP, and ICE to
press their counterparts in the Chinese Government for greater cooperation in stopping
these illegal activities.
The United States also can take unilateral action consistent with the WTO to deal with
the illicit duty evasion schemes of certain Chinese producers and exporters. First, passage of
the Enforcing Orders and Reducing Customs Evasion (ENFORCE) Act would enhance
the ability of CBP to investigate and take enforcement action against imports which avoid
the payment of the applicable AD and CVD duties. By establishing transparency, accountability,
and deadlines in CBP’s duty evasion investigations, the ENFORCE Act would encourage
both U.S. manufacturers and U.S. importers to provide information and to cooperate in CBP’s
proceedings. Second, the President should direct the U.S. Department of Commerce to exercise
its authority to investigate evidence of transshipment during its administrative reviews and
scope inquiries of AD and CVD orders on products from China. The Department of Commerce
has the expertise, experience, and authority to conduct on-site audits of foreign producers and
MR. EDWARD GRESSER
TRADE POLICY STAFF COMMITTEE
OFFICE OF THE UNITED STATES TRADE REPRESENTATIVE
September 23, 2015Page 27
exporters in order to verify information regarding the actual country of origin of
the merchandise.
* * *
The AWPA member companies have been losing ground in competition
with Chinese producers who have flooded the U.S. market with unprecedented volumes of wire
and wire products, and we expect further losses as long as the Chinese Government continues
manipulating its border tax regime, turning a blind eye to transshipment and other illegal
schemes of duty evasion, subsidizing its export-oriented industries, and manipulating
its currency. China must be held accountable and required to comply with its obligations under
the WTO.
We look forward to continuing to work with the Administration as it takes effective steps
to ensure that China fulfills its international commitments.
Sincerely,
Milton M. Magnus, IIIAWPA PresidentPresident, M&B Metal Products Co., Inc.
Attachments
Exhibit 1
Staff Report Preparedfor Senator Ron Wyden
“Duty Evasion: Harming U.S. Industryand American Workers”
(November 8, 2010)
BEFORE THE TRADE POLICY STAFF COMMITTEE
OFFICE OF THE UNITED STATES TRADE REPRESENTATIVE
AMERICAN WIRE PRODUCERS ASSOCIATION
COMMENTS CONCERNING CHINA'S COMPLIANCE WITH WTO COMMITMENTS
(DOCKET NUMBER USTR-2015-0010)
SEPTEMBER 23, 2015
Public Version
STAFF REPORT
DUTY EVASION:
HARMING U.S. INDUSTRY AND AMERICAN
WORKERS
Prepared for Senator Ron Wyden
November 8, 2010

2
Public Version
3
Public Version
Table of Contents
Introduction ...................................................................................................................................... 5
Part I: Email Correspondence Showcasing Companies’ Willingness to Evade AD/CV Duties ................. 7
Certain Steel Nails from China ........................................................................................................ 9
Companies Willing to Evade U.S. AD/CV Duties on Steel Nails. ......................................................... 10
Certain Lined Paper School Supplies from China ............................................................................ 19
Companies Willing to Evade U.S. AD/CV Duties on Paper Products ................................................... 20
Light-Walled Rectangular Pipe and Tube from China ..................................................................... 27
Companies Willing to Evade U.S. AD/CV Duties on Light-Walled Rectangular Pipe and Tube ........... 28
Uncovered Innersprings Units from China ..................................................................................... 31
Companies Willing to Evade U.S. AD/CV Duties on Uncovered Innersprings Units. .......................... 32
Natural Bristle Paint Brushes from China ....................................................................................... 35
Companies Willing to Evade U.S. AD/CV Duties on Natural Bristle Paint Brushes ............................ 36
Oil Country Tubular Goods (OCTG) from China .............................................................................. 41
Companies Willing to Evade U.S. AD/CV Duties on OCTG from China Company ............................... 42
Diamond Sawblades from China .................................................................................................. 45
Companies Willing to Evade U.S. AD/CV Duties on Diamond Sawblades from China ........................ 46
Steel Wire Garment Hangers from China ..................................................................................... 49
Companies Willing to Evade U.S. AD/CV Duties on Steel Wire Garment Hangers from China .......... 50
Steel Grating from China ............................................................................................................. 53
Companies Willing to Evade U.S. AD/CV Duties on Steel Grating ..................................................... 54
Part II: Foreign Logistics Companies Willing to Evade U.S. AD/CV Duties ........................................... 55
Eversky International Forwarding Agency ..................................................................................... 57
H&T International Logistics Ningbo Ltd ......................................................................................... 57
Ninbo Star International Freight Forwarding Co., Ltd ..................................................................... 58
Pulinktrans China, Ltd. .................................................................................................................. 58
Shenzen Sunpower International Logistics, Ltd .............................................................................. 59
Wintrans Logistics and Investment & Management Co., Ltd ........................................................... 59
Gateway Container Line Co., Ltd ................................................................................................... 60
Global Success International Transportation (Shenzen) Ltd ............................................................ 61
Dyna International Shipping Ltd .................................................................................................... 61
4
Public Version
Table of Contents (cont’d)
Part II: Foreign Logistics Companies Willing to Evade U.S. AD/CV Duties (cont’d)
Hanhen Shipping (China) Co., Ltd .................................................................................................. 62
Suzhou Yuncheng Ex/Im Co., Ltd ................................................................................................... 62
L’Assurex International Logistic Ltd. .............................................................................................. 63
Part III: Examples of Companies Advertising Illegal Transshipment Services on the Internet .............. 65
References ....................................................................................................................................... 79
5
Public Version
Introduction U.S. antidumping and countervailing duty (AD/CVD) laws form U.S. industry’s protective backbone against injury from unfair trade. These laws provide American producers the ability to counter injuri-ous unfair trade practices and ultimately allow for the imposition of additional duties on unfair im-ports. Each year, U.S. companies collectively spend millions of dollars to initiate and litigate AD/CVD cases to keep illegally dumped or subsidized imports from entering the U.S. market and injuring them. Unfortu-nately, many U.S. producers believe that the evasion of America’s unfair trade laws is increasingly per-vasive. The circumvention of U.S. AD/CVD laws, either by foreign producers or importers, negatively affects industries throughout the United States, resulting in continued injury to U.S. industry, the loss of American jobs, and the loss of federal revenue. Foreign suppliers subject to AD/CVD orders and their U.S. importers avoid paying AD/CV duties by a number of unscrupulous schemes, including illegal transshipment and falsified country of origin mark-ings, undervalued invoices to pay less duty, and misclassification of goods. In sum, they cheat. Staff set out to determine just how easy it is to find these trade cheats and determine the ease at which an importer could identify a foreign supplier willing to engage in circumvention schemes. In Au-gust 2010, staff created a fictitious company called AvisOne Traders, Inc. and set up a company profile on China’s largest business-to-business e-commerce website, Alibaba.com, in order to find companies willing to cheat and evade AD/CVD orders. (AvisOne is an anagram for “evasion.”) The results are alarming and illustrative of how widespread the problem of duty evasion appears to be. In under two weeks and for as little as 30 minutes a day, one staff person, acting as a “purchasing manager” for AvisOne Traders, Inc., contacted roughly 120 companies through Alibaba.com and re-ceived 47 responses. Of these 47, this staff person received written confirmation from 10 Chinese companies that were willing to evade duties on five different products subject to U.S. AD/CVD or-ders. These products include uncovered innersprings units, lined paper school supplies, steel nails, natural bristle paint brushes, and light-walled rectangular pipe and tube. The AD/CVD orders on this merchandise, which represents just a small fraction of all AD/CVD orders currently in place, were put in place to protect over 120 businesses and 12,000 workers from unfairly traded imports. This report is a compilation of information obtained by staff over a two-week period, and is organized into three parts. Part I presents e-mail correspondence between staff, acting under the auspices of AvisOne Traders, and Chinese producers. In a couple of additional examples, staff obtained from the counsel of U.S. industry non-solicited e-mails from Chinese producers offering to facilitate the evasion of AD/CVD orders. Part II presents a list of publically identified Chinese companies that advertise—in English—their ability to facilitate the evasion of AD/CVD laws. Part III includes snap shots of company websites that offer services designed to evade AD/CVD laws (in one instance, a website operated by the Chinese government itself and which advertises the services of a Chinese firm that facilitates eva-sion). In the event that staff corresponded with a Chinese firm that is of interest to U.S. law enforcement, two versions of this report were prepared. A confidential version containing comprehensive informa-tion about the firms with which staff corresponded was provided to U.S. Customs and Border Patrol and Immigration and Customs Enforcement. This version, a public redacted version, was prepared in order to be shared with Members of Congress and their staff.

6
Public Version
7
Public Version
Part I: Email Correspondence Showcasing Companies’ Willingness to Evade AD/CVD Orders

8
Public Version
9
Public Version
Certain Steel Nails from China
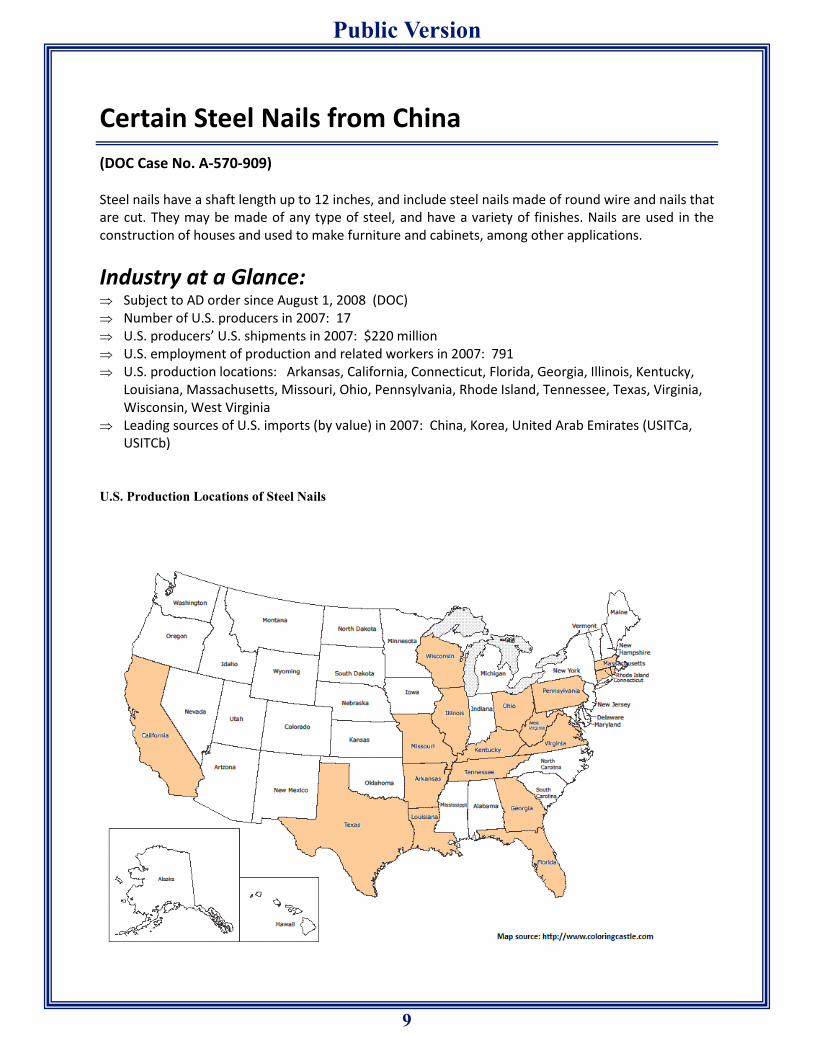
(DOC Case No. A-570-909) Steel nails have a shaft length up to 12 inches, and include steel nails made of round wire and nails that are cut. They may be made of any type of steel, and have a variety of finishes. Nails are used in the construction of houses and used to make furniture and cabinets, among other applications.
Industry at a Glance: Subject to AD order since August 1, 2008 (DOC) Number of U.S. producers in 2007: 17 U.S. producers’ U.S. shipments in 2007: $220 million U.S. employment of production and related workers in 2007: 791 U.S. production locations: Arkansas, California, Connecticut, Florida, Georgia, Illinois, Kentucky,
Louisiana, Massachusetts, Missouri, Ohio, Pennsylvania, Rhode Island, Tennessee, Texas, Virginia, Wisconsin, West Virginia
Leading sources of U.S. imports (by value) in 2007: China, Korea, United Arab Emirates (USITCa, USITCb)
U.S. Production Locations of Steel Nails
10
Public Version
Companies Willing to Evade U.S. AD/CV Duties on Steel Nails
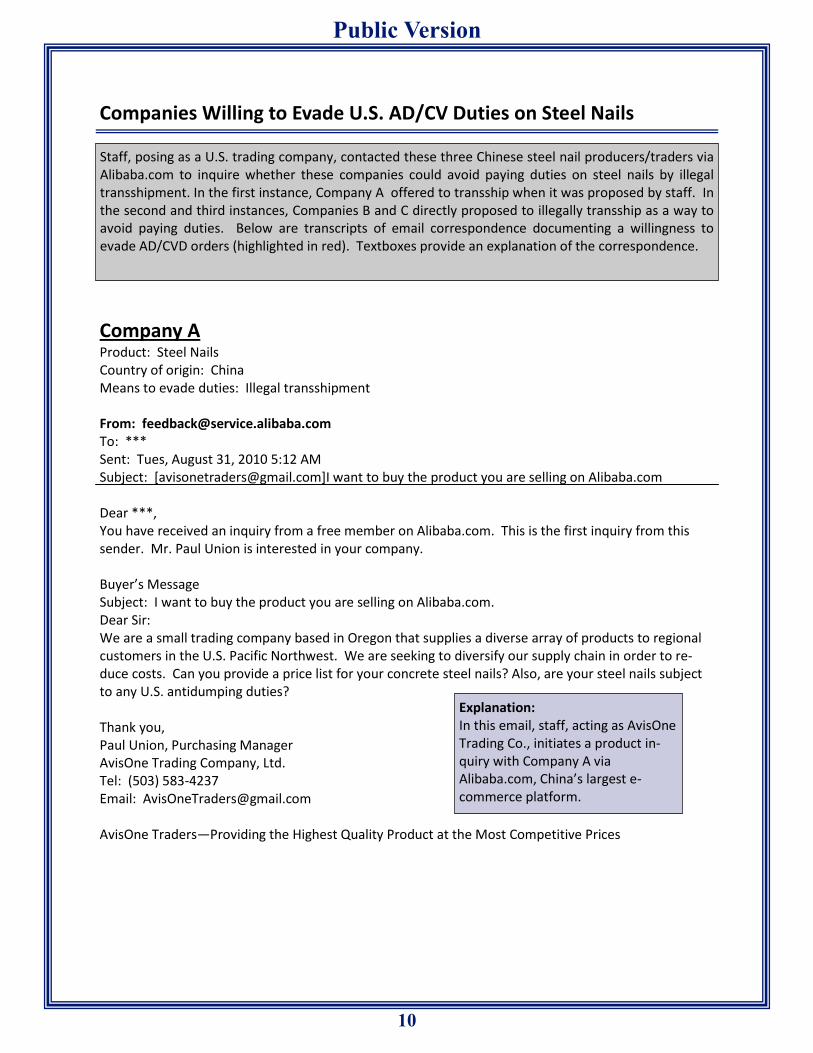
Company A Product: Steel Nails Country of origin: China Means to evade duties: Illegal transshipment From: [email protected] To: *** Sent: Tues, August 31, 2010 5:12 AM Subject: [[email protected]]I want to buy the product you are selling on Alibaba.com Dear ***, You have received an inquiry from a free member on Alibaba.com. This is the first inquiry from this sender. Mr. Paul Union is interested in your company. Buyer’s Message Subject: I want to buy the product you are selling on Alibaba.com. Dear Sir: We are a small trading company based in Oregon that supplies a diverse array of products to regional customers in the U.S. Pacific Northwest. We are seeking to diversify our supply chain in order to re-duce costs. Can you provide a price list for your concrete steel nails? Also, are your steel nails subject to any U.S. antidumping duties? Thank you, Paul Union, Purchasing Manager AvisOne Trading Company, Ltd. Tel: (503) 583-4237 Email: [email protected] AvisOne Traders—Providing the Highest Quality Product at the Most Competitive Prices
Staff, posing as a U.S. trading company, contacted these three Chinese steel nail producers/traders via Alibaba.com to inquire whether these companies could avoid paying duties on steel nails by illegal transshipment. In the first instance, Company A offered to transship when it was proposed by staff. In the second and third instances, Companies B and C directly proposed to illegally transship as a way to avoid paying duties. Below are transcripts of email correspondence documenting a willingness to evade AD/CVD orders (highlighted in red). Textboxes provide an explanation of the correspondence.
Explanation: In this email, staff, acting as AvisOne Trading Co., initiates a product in-quiry with Company A via Alibaba.com, China’s largest e-commerce platform.
11
Public Version
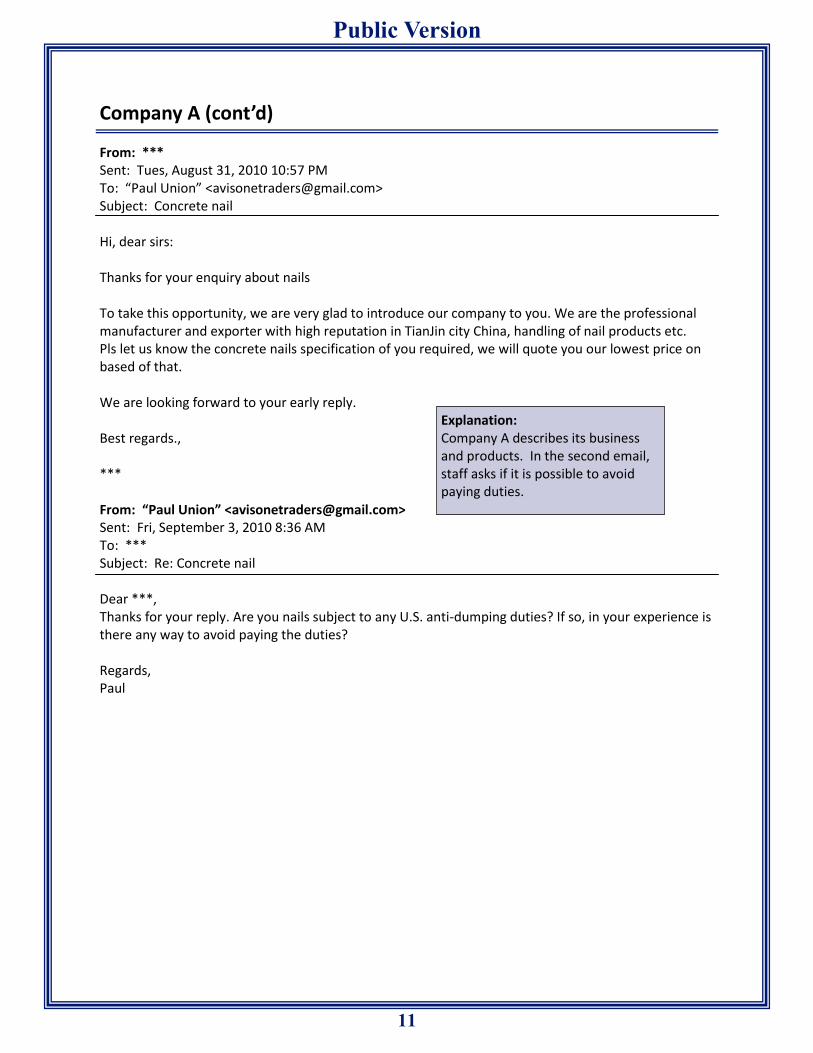
Company A (cont’d) From: *** Sent: Tues, August 31, 2010 10:57 PM To: “Paul Union” <[email protected]> Subject: Concrete nail Hi, dear sirs: Thanks for your enquiry about nails To take this opportunity, we are very glad to introduce our company to you. We are the professional manufacturer and exporter with high reputation in TianJin city China, handling of nail products etc. Pls let us know the concrete nails specification of you required, we will quote you our lowest price on based of that. We are looking forward to your early reply. Best regards., *** From: “Paul Union” <[email protected]> Sent: Fri, September 3, 2010 8:36 AM To: *** Subject: Re: Concrete nail Dear ***, Thanks for your reply. Are you nails subject to any U.S. anti-dumping duties? If so, in your experience is there any way to avoid paying the duties? Regards, Paul
Explanation: Company A describes its business and products. In the second email, staff asks if it is possible to avoid paying duties.
12
Public Version
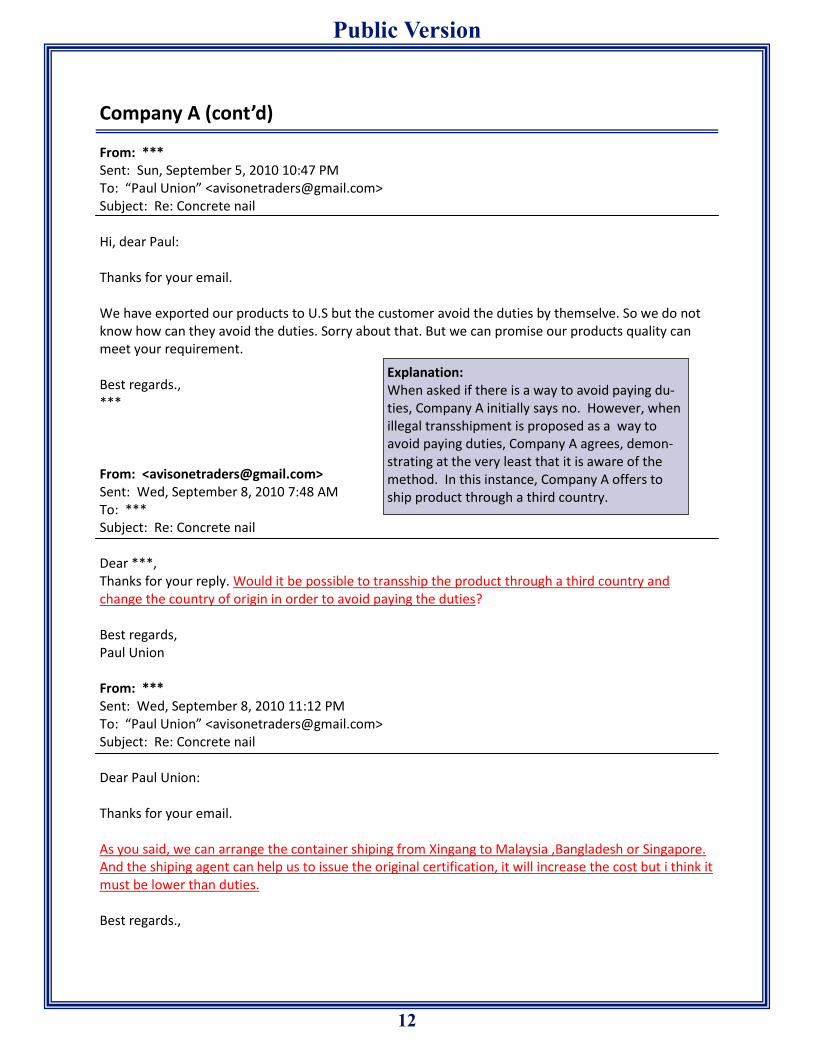
Company A (cont’d) From: *** Sent: Sun, September 5, 2010 10:47 PM To: “Paul Union” <[email protected]> Subject: Re: Concrete nail Hi, dear Paul: Thanks for your email. We have exported our products to U.S but the customer avoid the duties by themselve. So we do not know how can they avoid the duties. Sorry about that. But we can promise our products quality can meet your requirement. Best regards., *** From: <[email protected]> Sent: Wed, September 8, 2010 7:48 AM To: *** Subject: Re: Concrete nail Dear ***, Thanks for your reply. Would it be possible to transship the product through a third country and change the country of origin in order to avoid paying the duties? Best regards, Paul Union From: *** Sent: Wed, September 8, 2010 11:12 PM To: “Paul Union” <[email protected]> Subject: Re: Concrete nail Dear Paul Union: Thanks for your email. As you said, we can arrange the container shiping from Xingang to Malaysia ,Bangladesh or Singapore. And the shiping agent can help us to issue the original certification, it will increase the cost but i think it must be lower than duties. Best regards.,
Explanation: When asked if there is a way to avoid paying du-ties, Company A initially says no. However, when illegal transshipment is proposed as a way to avoid paying duties, Company A agrees, demon-strating at the very least that it is aware of the method. In this instance, Company A offers to ship product through a third country.

13
Public Version
Company B Product: Steel Nails Country of origin: China Means to evade duties: Illegal transshipment From: [email protected] To: *** Sent: Tues, August 31, 2010 Subject: [[email protected]]Inquiry about your product Dear ***, You have received an inquiry from a free member on Alibaba.com. This is the first inquiry from this sender. Mr. Paul Union is interested in your company. Buyer’s Message Subject: Inquiry about your product Dear sir: We are a small trading company based in Oregon that supplies a diverse array of products to regional customers in the U.S. Pacific Northwest. We are seeking to diversify our supply chain in order to re-duce costs. Can you provide a price list for your concrete nails? Also, are your steel nails subject to any U.S. antidumping duties? Thank you, Paul Union, Purchasing Manager AvisOne Trading Company, Ltd. Tel: (503) 583-4237 Email: [email protected] AvisOne Trades - Providing the Highest Quality Product at the Most Competitive Prices
Explanation: In this email, staff, acting as AvisOne Trading Co., initiates a product in-quiry with Company B via Alibaba.com, China’s largest e-commerce platform.
14
Public Version
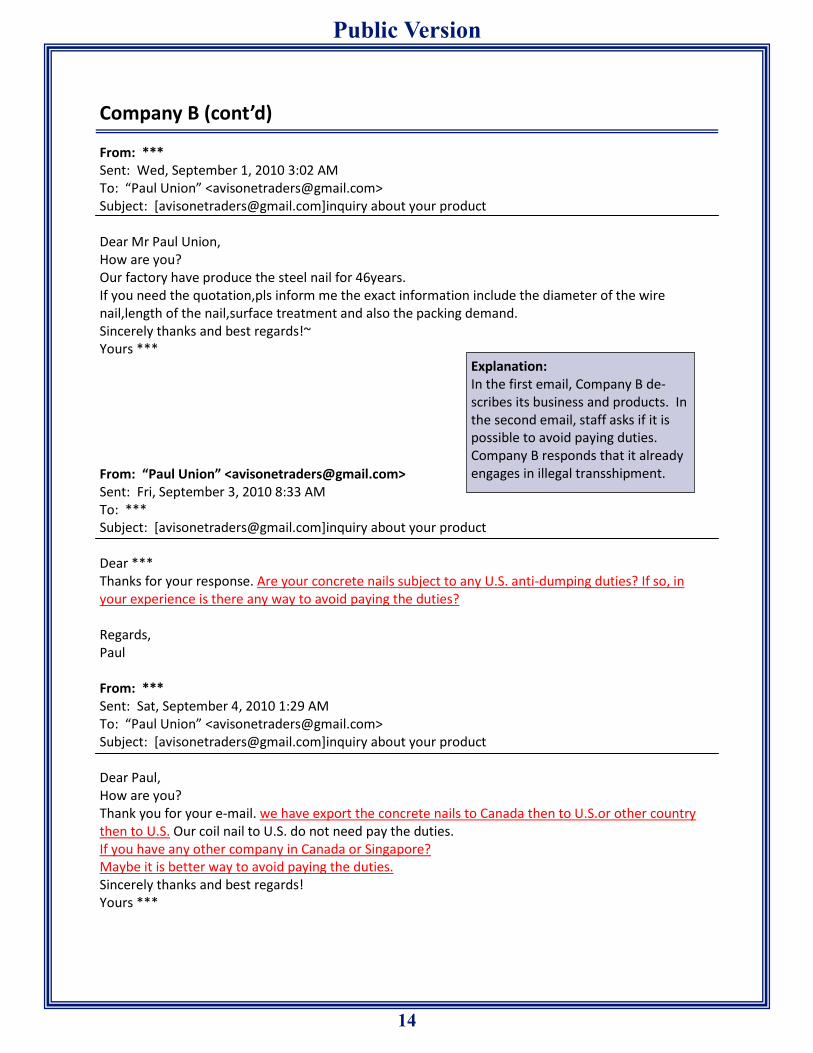
Company B (cont’d) From: *** Sent: Wed, September 1, 2010 3:02 AM To: “Paul Union” <[email protected]> Subject: [[email protected]]inquiry about your product Dear Mr Paul Union, How are you? Our factory have produce the steel nail for 46years. If you need the quotation,pls inform me the exact information include the diameter of the wire nail,length of the nail,surface treatment and also the packing demand. Sincerely thanks and best regards!~ Yours *** From: “Paul Union” <[email protected]> Sent: Fri, September 3, 2010 8:33 AM To: *** Subject: [[email protected]]inquiry about your product Dear *** Thanks for your response. Are your concrete nails subject to any U.S. anti-dumping duties? If so, in your experience is there any way to avoid paying the duties? Regards, Paul From: *** Sent: Sat, September 4, 2010 1:29 AM To: “Paul Union” <[email protected]> Subject: [[email protected]]inquiry about your product Dear Paul, How are you? Thank you for your e-mail. we have export the concrete nails to Canada then to U.S.or other country then to U.S. Our coil nail to U.S. do not need pay the duties. If you have any other company in Canada or Singapore? Maybe it is better way to avoid paying the duties. Sincerely thanks and best regards! Yours ***
Explanation: In the first email, Company B de-scribes its business and products. In the second email, staff asks if it is possible to avoid paying duties. Company B responds that it already engages in illegal transshipment.
15
Public Version
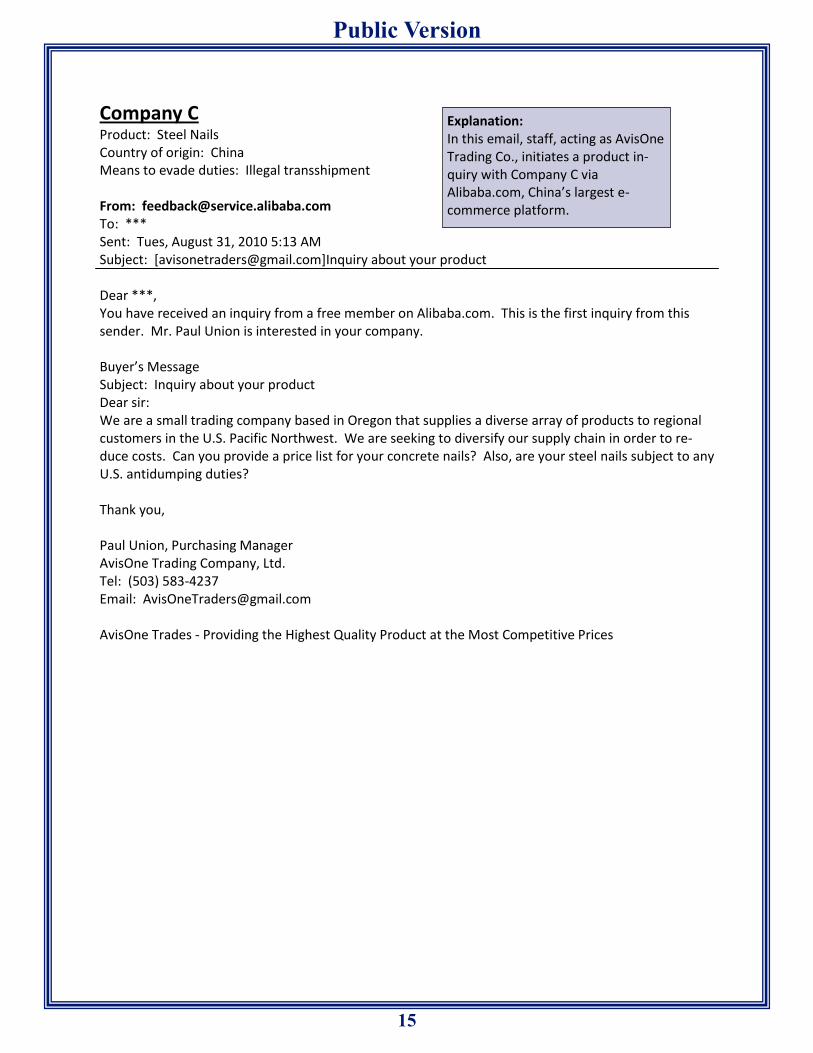
Company C Product: Steel Nails Country of origin: China Means to evade duties: Illegal transshipment From: [email protected] To: *** Sent: Tues, August 31, 2010 5:13 AM Subject: [[email protected]]Inquiry about your product Dear ***, You have received an inquiry from a free member on Alibaba.com. This is the first inquiry from this sender. Mr. Paul Union is interested in your company. Buyer’s Message Subject: Inquiry about your product Dear sir: We are a small trading company based in Oregon that supplies a diverse array of products to regional customers in the U.S. Pacific Northwest. We are seeking to diversify our supply chain in order to re-duce costs. Can you provide a price list for your concrete nails? Also, are your steel nails subject to any U.S. antidumping duties? Thank you, Paul Union, Purchasing Manager AvisOne Trading Company, Ltd. Tel: (503) 583-4237 Email: [email protected] AvisOne Trades - Providing the Highest Quality Product at the Most Competitive Prices
Explanation: In this email, staff, acting as AvisOne Trading Co., initiates a product in-quiry with Company C via Alibaba.com, China’s largest e-commerce platform.
16
Public Version
Company C (cont’d) From: *** Sent: Tue, August 31, 2010 10:23 PM To: “Paul Union” <[email protected]> Subject: concrete steel nails Dear sir , Good day ! I am *** ,from *** . I got your message on alibaba . so if you have any need ,please contact me . Best regard . *** From: “Paul Union” <[email protected]> Sent: Fri, September 3, 2010 8:37 AM To: *** Subject: Re: concrete steel nails Thanks for your reply. I'm looking for concrete steel nails. Are these products subject to U.S. anti-dumping duties? If so, is there any way to avoid paying the duties? Regards, Paul From: *** Sent: Tue, August 31, 2010 10:23 PM To: “Paul Union” <[email protected]> Subject: concrete steel nails Dear sir , Yes . you want concrete steel nails? if you want to avoid paying the duties ,there is the way is send the goods to Malaysia and change a box ,then send to U.S so what do you think about it . Best regard .
Explanation: In this series of emails, staff ask Company C whether their nails are subject to U.S. antidumping duties and whether there is a way to avoid paying the duties. Company C proposes shipping product to Malaysia, changing containers, and then sending the new container with a different country of origin certificate to the United States.
17
Public Version
Company C (cont’d) From: “Paul Union” <[email protected]> Sent: Wed, September 8, 2010 7:19 AM To: *** Subject: Re: concrete steel nails Thank you for your reply. So you can transship through Malaysia and change the country of origin to avoid paying the anti-dumping duties? Can your company do that? Regards, Paul From: *** Sent: Wed, September 8, 2010 8:43 PM To: “Paul Union” <[email protected]> Subject: concrete steel nails Dear sir , Thanks for your reply . Yes .our company can do this .but in this way ,the cost will increase . and just tell me your details product information . Best regard .
Explanation: Staff respond to Company C to confirm that it can transship product through Malaysia and change the country of ori-gin of the product. Company C confirms its ability to illegally transship.

18
Public Version
19
Public Version
Certain Lined Paper School Supplies from China
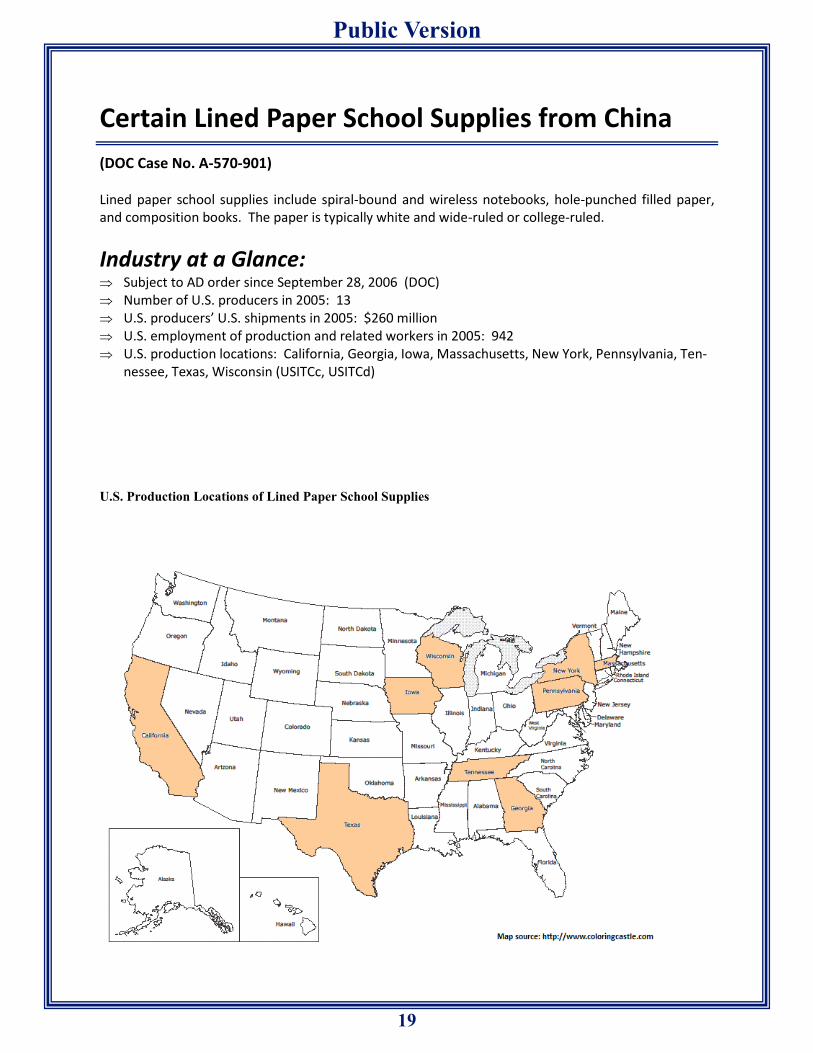
(DOC Case No. A-570-901) Lined paper school supplies include spiral-bound and wireless notebooks, hole-punched filled paper, and composition books. The paper is typically white and wide-ruled or college-ruled.
Industry at a Glance: Subject to AD order since September 28, 2006 (DOC) Number of U.S. producers in 2005: 13 U.S. producers’ U.S. shipments in 2005: $260 million U.S. employment of production and related workers in 2005: 942 U.S. production locations: California, Georgia, Iowa, Massachusetts, New York, Pennsylvania, Ten-
nessee, Texas, Wisconsin (USITCc, USITCd)
U.S. Production Locations of Lined Paper School Supplies
20
Public Version
Companies Willing to Evade U.S. AD/CV Duties on Paper Products
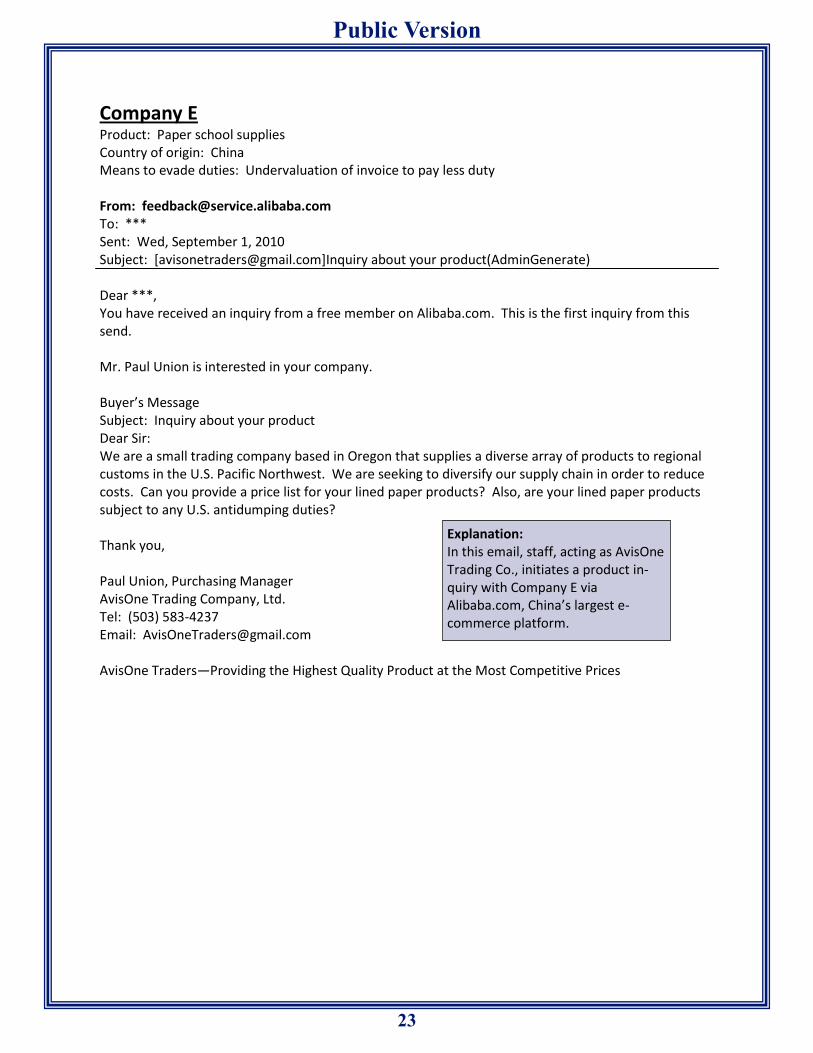
Company D Product: Paper school supplies Country of origin: China Means to evade duties: Illegal transshipment through Malaysia From: [email protected] To: *** Sent: Wed, September 1, 2010 Subject: [[email protected]]I want to buy the product you are selling on Alibaba.com Dear ***, You have received an inquiry from a free member on Alibaba.com. This is the first inquiry from this send. Mr. Paul Union is interested in your company. Buyer’s Message Subject: Inquiry about your product Dear Sir: We are a small trading company based in Oregon that supplies a diverse array of products to regional customs in the U.S. Pacific Northwest. We are seeking to diversify our supply chain in order to reduce costs. Can you provide a price list for your lined paper products? Also, are your lined paper products subject to any U.S. antidumping duties? Thank you, Paul Union, Purchasing Manager AvisOne Trading Company, Ltd. Tel: (503) 583-4237 Email: [email protected] AvisOne Traders—Providing the Highest Quality Product at the Most Competitive Prices
Staff, posing as a U.S. trading company, contacted Companies D and E via Alibaba.com to inquire whether they could avoid paying duties on paper school supplies. In the first instance, Company D pro-poses illegal transshipment through Malaysia to avoid paying duties. In the second instance, Company E professes that it does not know how to avoid paying antidumping duties. However, it states that it deliberately undervalues the value of its products, which is another form of duty evasion. Below are transcripts of email correspondence documenting a willingness to evade AD/CVD orders (highlighted in red). Textboxes provide an explanation of the correspondence.
Explanation: In this email, staff, acting as AvisOne Trading Co., initiates a product in-quiry with Company D via Alibaba.com, China’s largest e-commerce platform.
21
Public Version
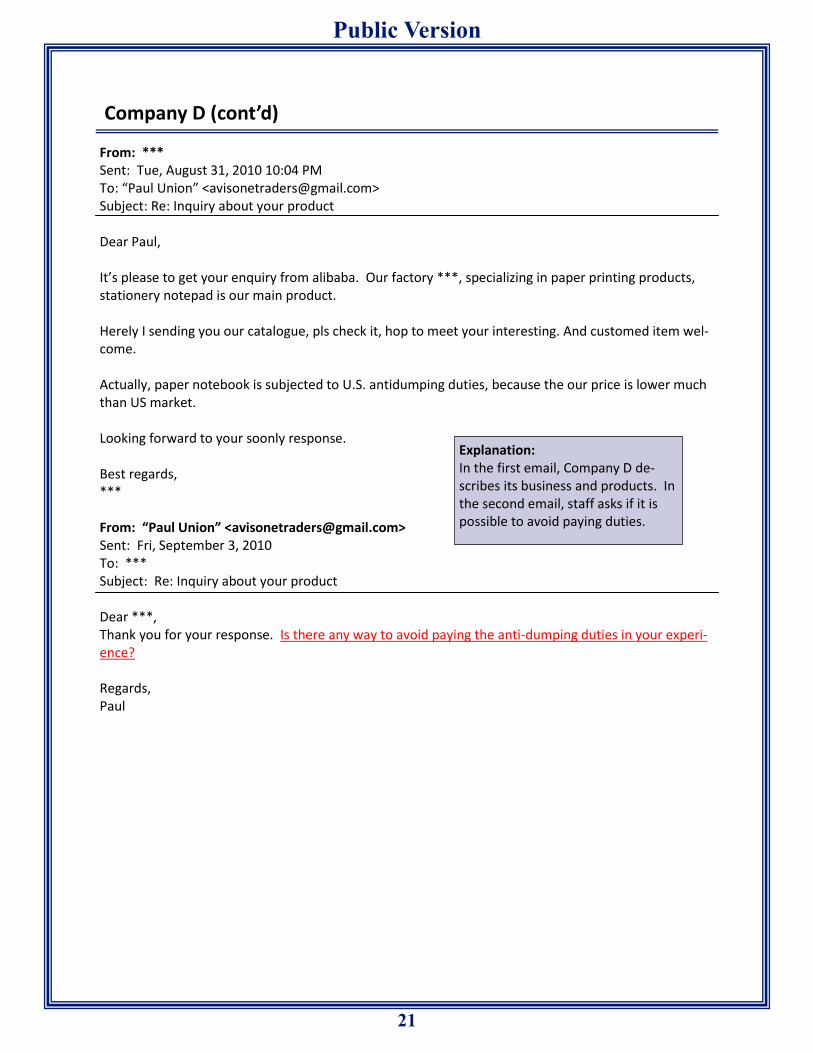
Company D (cont’d) From: *** Sent: Tue, August 31, 2010 10:04 PM To: “Paul Union” <[email protected]> Subject: Re: Inquiry about your product Dear Paul, It’s please to get your enquiry from alibaba. Our factory ***, specializing in paper printing products, stationery notepad is our main product. Herely I sending you our catalogue, pls check it, hop to meet your interesting. And customed item wel-come. Actually, paper notebook is subjected to U.S. antidumping duties, because the our price is lower much than US market. Looking forward to your soonly response. Best regards, *** From: “Paul Union” <[email protected]> Sent: Fri, September 3, 2010 To: *** Subject: Re: Inquiry about your product Dear ***, Thank you for your response. Is there any way to avoid paying the anti-dumping duties in your experi-ence? Regards, Paul
Explanation: In the first email, Company D de-scribes its business and products. In the second email, staff asks if it is possible to avoid paying duties.
22
Public Version
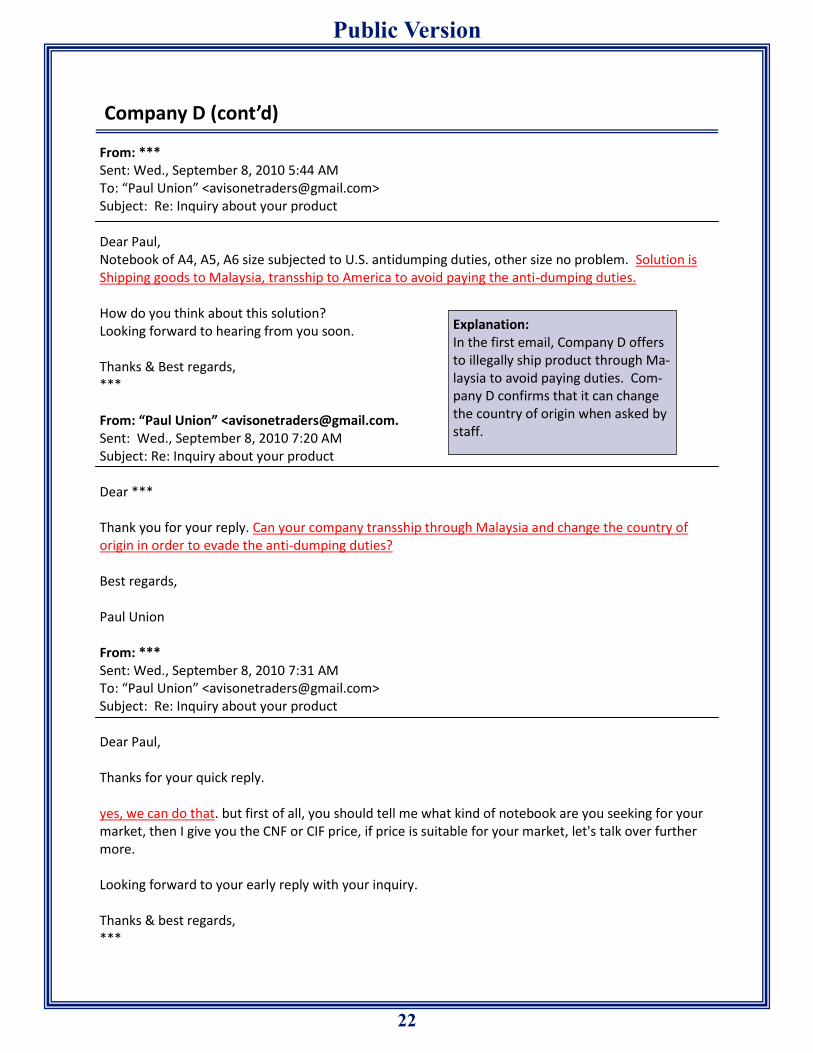
Company D (cont’d) From: *** Sent: Wed., September 8, 2010 5:44 AM To: “Paul Union” <[email protected]> Subject: Re: Inquiry about your product Dear Paul, Notebook of A4, A5, A6 size subjected to U.S. antidumping duties, other size no problem. Solution is Shipping goods to Malaysia, transship to America to avoid paying the anti-dumping duties. How do you think about this solution? Looking forward to hearing from you soon. Thanks & Best regards, *** From: “Paul Union” <[email protected]. Sent: Wed., September 8, 2010 7:20 AM Subject: Re: Inquiry about your product Dear *** Thank you for your reply. Can your company transship through Malaysia and change the country of origin in order to evade the anti-dumping duties? Best regards, Paul Union From: *** Sent: Wed., September 8, 2010 7:31 AM To: “Paul Union” <[email protected]> Subject: Re: Inquiry about your product Dear Paul, Thanks for your quick reply. yes, we can do that. but first of all, you should tell me what kind of notebook are you seeking for your market, then I give you the CNF or CIF price, if price is suitable for your market, let's talk over further more. Looking forward to your early reply with your inquiry. Thanks & best regards, ***
Explanation: In the first email, Company D offers to illegally ship product through Ma-laysia to avoid paying duties. Com-pany D confirms that it can change the country of origin when asked by staff.
23
Public Version
Company E Product: Paper school supplies Country of origin: China Means to evade duties: Undervaluation of invoice to pay less duty From: [email protected] To: *** Sent: Wed, September 1, 2010 Subject: [[email protected]]Inquiry about your product(AdminGenerate) Dear ***, You have received an inquiry from a free member on Alibaba.com. This is the first inquiry from this send. Mr. Paul Union is interested in your company. Buyer’s Message Subject: Inquiry about your product Dear Sir: We are a small trading company based in Oregon that supplies a diverse array of products to regional customs in the U.S. Pacific Northwest. We are seeking to diversify our supply chain in order to reduce costs. Can you provide a price list for your lined paper products? Also, are your lined paper products subject to any U.S. antidumping duties? Thank you, Paul Union, Purchasing Manager AvisOne Trading Company, Ltd. Tel: (503) 583-4237 Email: [email protected] AvisOne Traders—Providing the Highest Quality Product at the Most Competitive Prices
Explanation: In this email, staff, acting as AvisOne Trading Co., initiates a product in-quiry with Company E via Alibaba.com, China’s largest e-commerce platform.
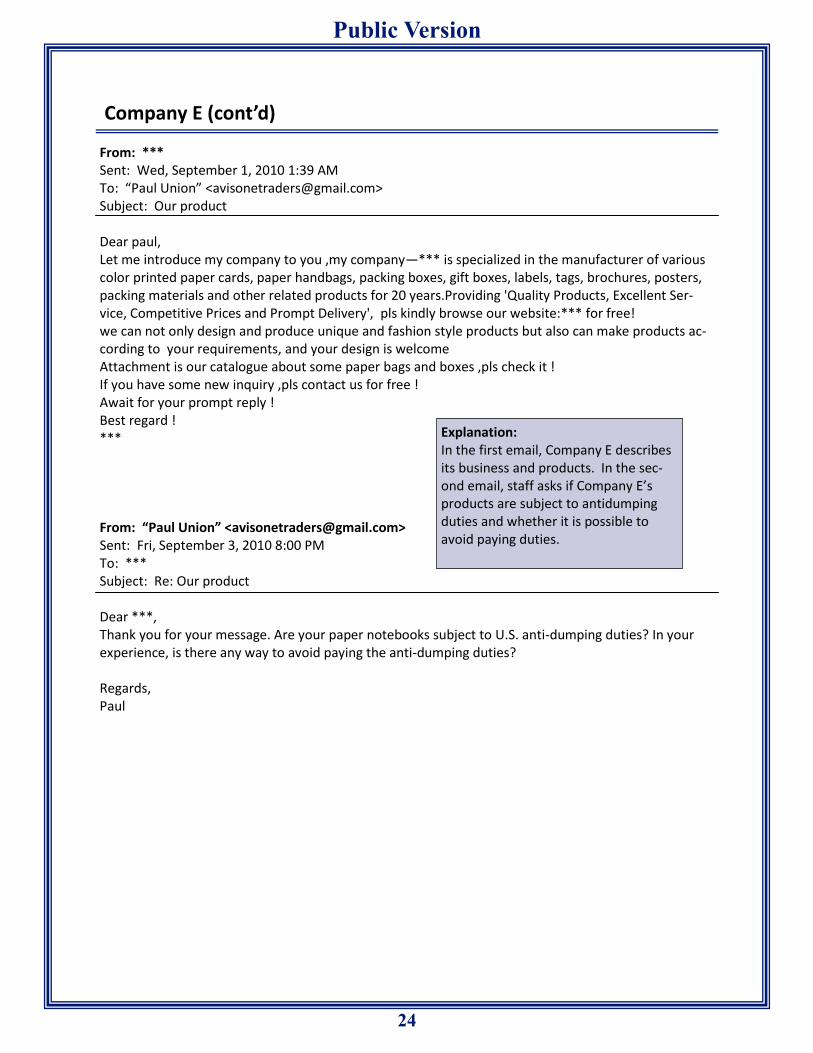
24
Public Version
Company E (cont’d) From: *** Sent: Wed, September 1, 2010 1:39 AM To: “Paul Union” <[email protected]> Subject: Our product Dear paul, Let me introduce my company to you ,my company—*** is specialized in the manufacturer of various color printed paper cards, paper handbags, packing boxes, gift boxes, labels, tags, brochures, posters, packing materials and other related products for 20 years.Providing 'Quality Products, Excellent Ser-vice, Competitive Prices and Prompt Delivery', pls kindly browse our website:*** for free! we can not only design and produce unique and fashion style products but also can make products ac-cording to your requirements, and your design is welcome Attachment is our catalogue about some paper bags and boxes ,pls check it ! If you have some new inquiry ,pls contact us for free ! Await for your prompt reply ! Best regard ! *** From: “Paul Union” <[email protected]> Sent: Fri, September 3, 2010 8:00 PM To: *** Subject: Re: Our product Dear ***, Thank you for your message. Are your paper notebooks subject to U.S. anti-dumping duties? In your experience, is there any way to avoid paying the anti-dumping duties? Regards, Paul
Explanation: In the first email, Company E describes its business and products. In the sec-ond email, staff asks if Company E’s products are subject to antidumping duties and whether it is possible to avoid paying duties.
25
Public Version
Company E (cont’d) From: *** Sent: Wed, September 15, 2010 4:26 AM To: “Paul Union” <[email protected]> Subject: Our product Dear Paul, Thank you for your reply ! I am sorry so late reply you ! we have no experience to avoid paying the anti-dumping duties ,besides we make the commerical invoice , we write that the value of products is less than the factual cost . Await for your prompt reply ! Best regard ! ***
Explanation: In this email, Company E states that it does not know how to avoid pay-ing antidumping duties, but pro-fesses that it undervalues products on commercial invoices, which is a form of duty evasion.

26
Public Version
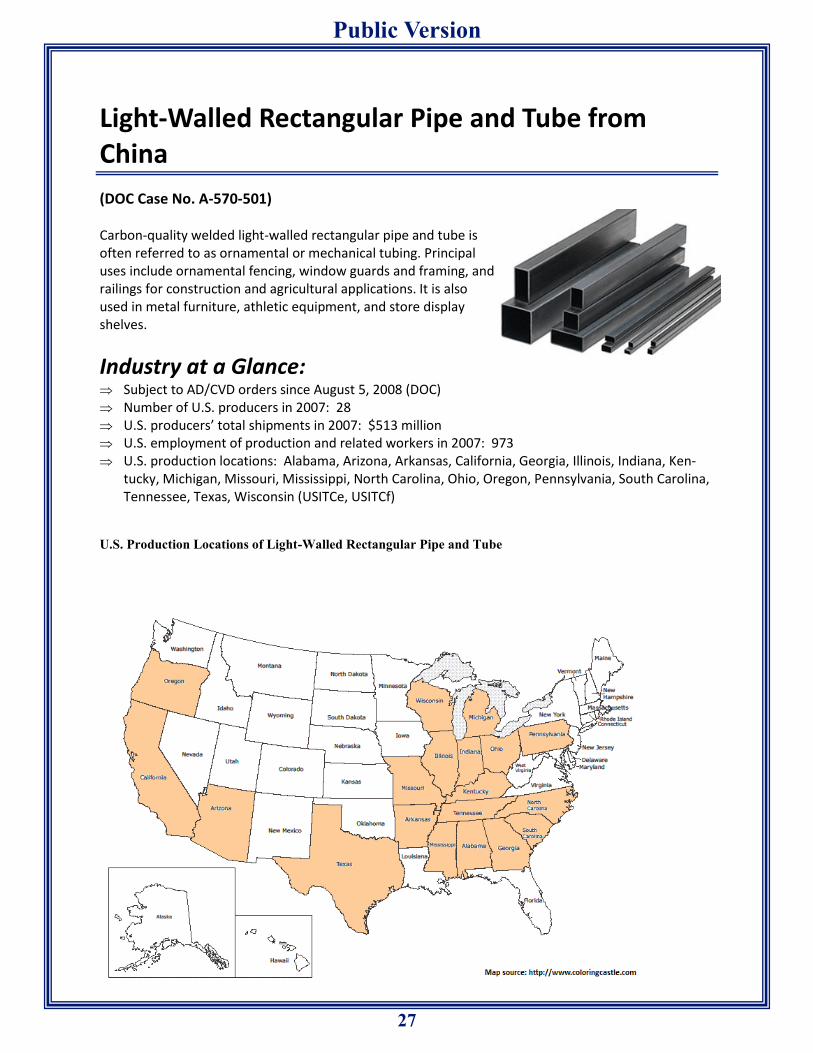
27
Public Version
Light-Walled Rectangular Pipe and Tube from China
(DOC Case No. A-570-501) Carbon-quality welded light-walled rectangular pipe and tube is often referred to as ornamental or mechanical tubing. Principal uses include ornamental fencing, window guards and framing, and railings for construction and agricultural applications. It is also used in metal furniture, athletic equipment, and store display shelves.
Industry at a Glance: Subject to AD/CVD orders since August 5, 2008 (DOC) Number of U.S. producers in 2007: 28 U.S. producers’ total shipments in 2007: $513 million U.S. employment of production and related workers in 2007: 973 U.S. production locations: Alabama, Arizona, Arkansas, California, Georgia, Illinois, Indiana, Ken-
tucky, Michigan, Missouri, Mississippi, North Carolina, Ohio, Oregon, Pennsylvania, South Carolina, Tennessee, Texas, Wisconsin (USITCe, USITCf)
U.S. Production Locations of Light-Walled Rectangular Pipe and Tube
28
Public Version
Companies Willing to Evade U.S. AD/CV Duties on Light-Walled Rectangular Pipe and Tube from China
Company F Product: Pipe and tubular products Country of origin: China Means to evade duties: Illegal transshipment, also known as “entrepot” trade From: [email protected] To: *** Sent: Tues, August 31, 2010 5:52 AM Subject: [[email protected]]I want to buy the product you are selling on Alibaba.com Dear ***: You have received an inquiry from a free member on Alibaba.com. This is the first inquiry from this sender. Mr. Paul Union is interested in your company. Buyer’s Message Subject: I want to buy the product you are selling on Alibaba.com. Dear Sir: We are a small trading company based in Oregon that supplies a diverse array of products to regional customers in the U.S. Pacific Northwest. We are seeking to diversify our supply chain in order to re-duce costs. Can you provide a price list for your rectangular tubular products? Also, are your light-walled rectangular tubular products subject to any U.S. antidumping duties? Thank you, Paul Union, Purchasing Manager AvisOne Trading Company, Ltd. Tel: (503) 583-4237 Email: [email protected]
Staff, posing as a U.S. trading company, contacted Company F via Alibaba.com to inquire whether its rectangular pipe and tube products are subject to U.S. antidumping duties and whether it could avoid paying such duties. Below is a transcript of email correspondence documenting a willingness to evade AD/CVD orders (highlighted in red). Textboxes provide an explanation of the correspondence.
Explanation: In this email, staff, acting as AvisOne Trading Co., initiates a product in-quiry with Company F via Alibaba.com, China’s largest e-commerce platform.
29
Public Version
Company F (cont’d) From: *** Sent: Fri, September 3, 2010 4:42 AM To: “Paul Union” <[email protected]> Subject: To Paul Union Dear Paul Union HAPPY WEEKEND. and hope you received my qoutation of *** rectangular pipes . About the antidumping duties .I check up alots of information on the net .I still can't sure if rectangular tubular products subject to any U.S. antidumping duties. Many informations said that On May 3rd, the InternationalTradeCommission voted for Chinese steel 99.14% at the tax anti-dumping tariffs on imports.Are you clear about this ?? Hope you can tell me more about . Yours *** From: “Paul Union” <[email protected]> Sent: Fri, September 3, 2010 7:37 AM To: *** Subject: Re: To Paul Union ***, Thank you for your message. I am not sure if rectangular tubing is subject to U.S. anti-dumping duties. Is there any way to avoid paying the anti-dumping duties? Would it be possible to modify the country of origin certificate? Regards, Paul
Explanation: In the first email, Company F is not sure whether rectangular pipe and tube is subject to antidumping duties. In the second email, staff ask if it is possible to change the country of origin to avoid pay-ing duties.
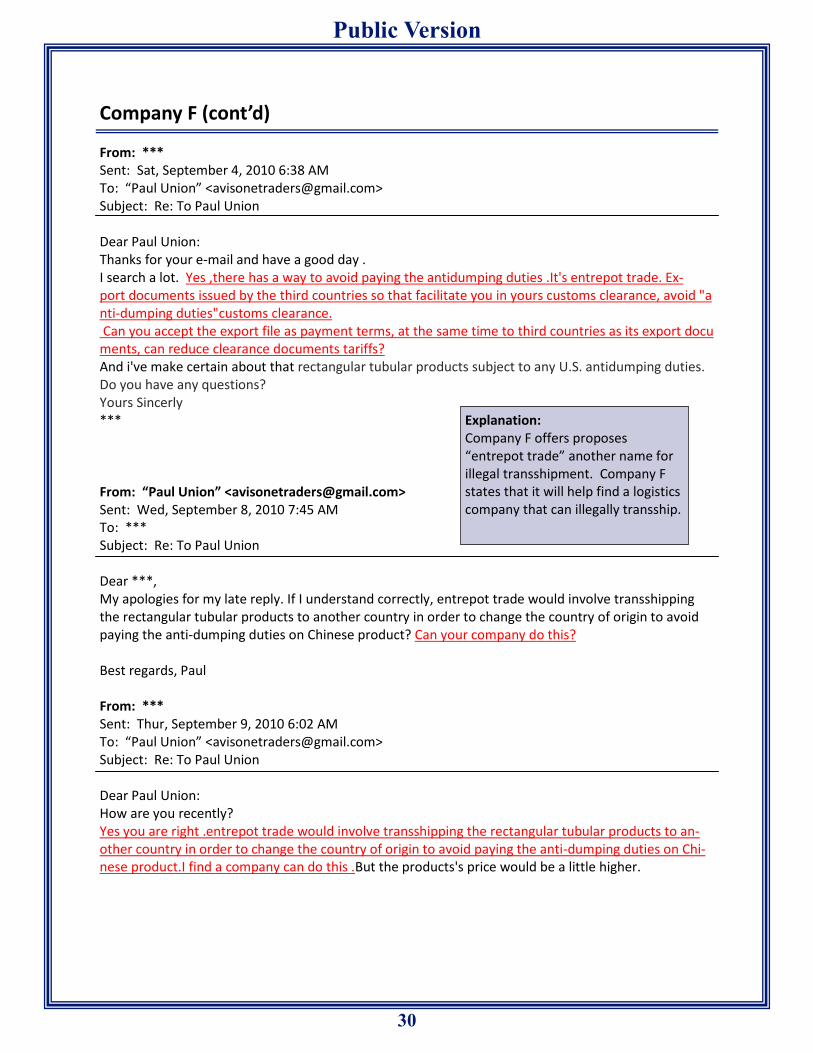
30
Public Version
Company F (cont’d) From: *** Sent: Sat, September 4, 2010 6:38 AM To: “Paul Union” <[email protected]> Subject: Re: To Paul Union Dear Paul Union: Thanks for your e-mail and have a good day . I search a lot. Yes ,there has a way to avoid paying the antidumping duties .It's entrepot trade. Ex-port documents issued by the third countries so that facilitate you in yours customs clearance, avoid "anti-dumping duties"customs clearance. Can you accept the export file as payment terms, at the same time to third countries as its export documents, can reduce clearance documents tariffs?And i've make certain about that rectangular tubular products subject to any U.S. antidumping duties. Do you have any questions? Yours Sincerly *** From: “Paul Union” <[email protected]> Sent: Wed, September 8, 2010 7:45 AM To: *** Subject: Re: To Paul Union Dear ***, My apologies for my late reply. If I understand correctly, entrepot trade would involve transshipping the rectangular tubular products to another country in order to change the country of origin to avoid paying the anti-dumping duties on Chinese product? Can your company do this? Best regards, Paul From: *** Sent: Thur, September 9, 2010 6:02 AM To: “Paul Union” <[email protected]> Subject: Re: To Paul Union Dear Paul Union: How are you recently? Yes you are right .entrepot trade would involve transshipping the rectangular tubular products to an-other country in order to change the country of origin to avoid paying the anti-dumping duties on Chi-nese product.I find a company can do this .But the products's price would be a little higher.
Explanation: Company F offers proposes “entrepot trade” another name for illegal transshipment. Company F states that it will help find a logistics company that can illegally transship.
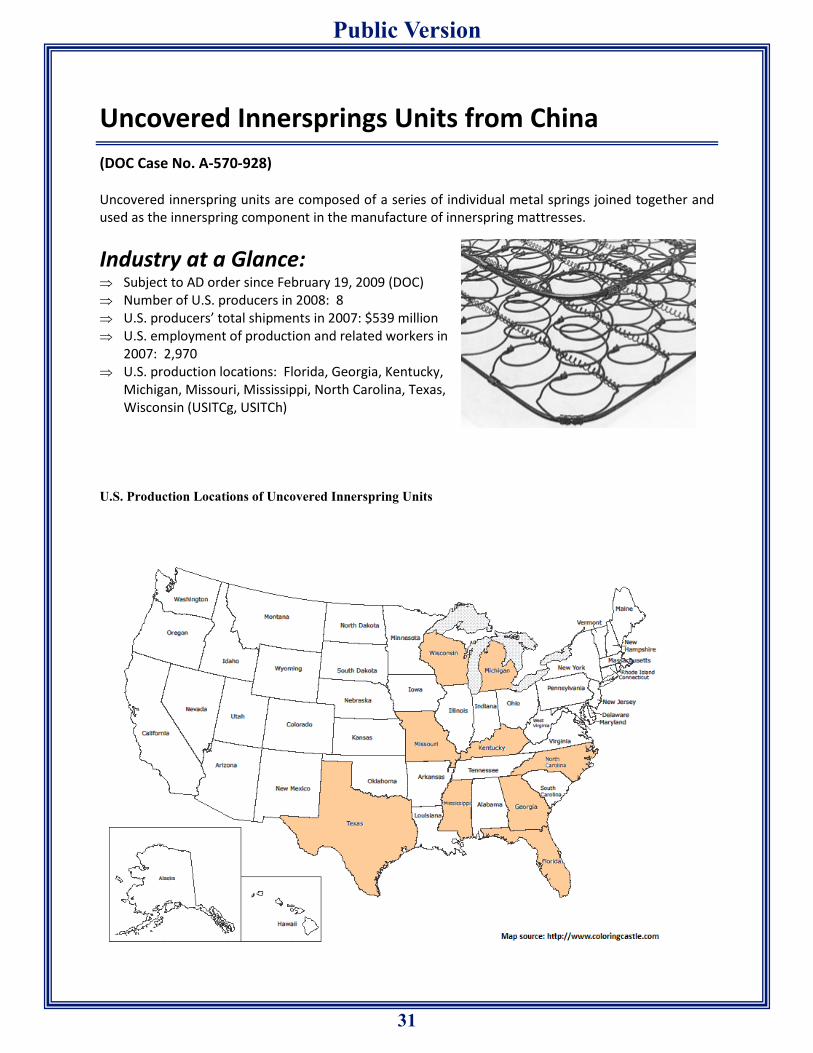
31
Public Version
Uncovered Innersprings Units from China
(DOC Case No. A-570-928) Uncovered innerspring units are composed of a series of individual metal springs joined together and used as the innerspring component in the manufacture of innerspring mattresses.
Industry at a Glance: Subject to AD order since February 19, 2009 (DOC) Number of U.S. producers in 2008: 8 U.S. producers’ total shipments in 2007: $539 million U.S. employment of production and related workers in
2007: 2,970 U.S. production locations: Florida, Georgia, Kentucky,
Michigan, Missouri, Mississippi, North Carolina, Texas, Wisconsin (USITCg, USITCh)
U.S. Production Locations of Uncovered Innerspring Units
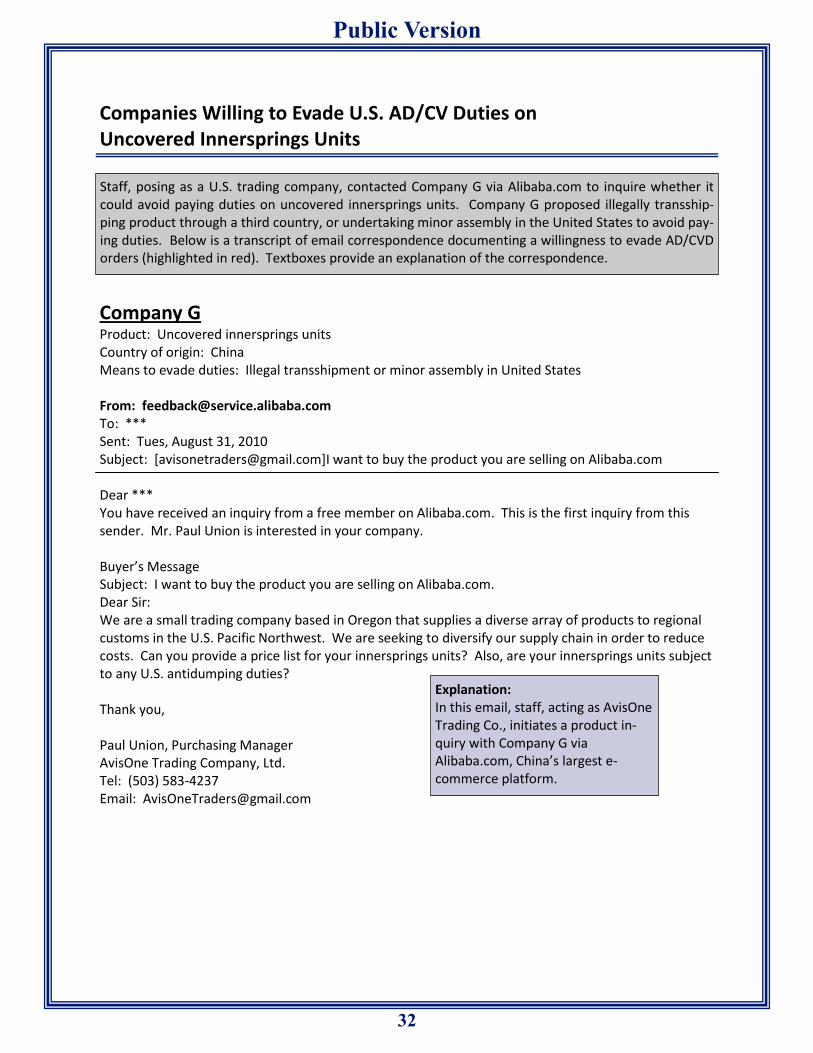
32
Public Version
Companies Willing to Evade U.S. AD/CV Duties on Uncovered Innersprings Units
Company G Product: Uncovered innersprings units Country of origin: China Means to evade duties: Illegal transshipment or minor assembly in United States From: [email protected] To: *** Sent: Tues, August 31, 2010 Subject: [[email protected]]I want to buy the product you are selling on Alibaba.com Dear *** You have received an inquiry from a free member on Alibaba.com. This is the first inquiry from this sender. Mr. Paul Union is interested in your company. Buyer’s Message Subject: I want to buy the product you are selling on Alibaba.com. Dear Sir: We are a small trading company based in Oregon that supplies a diverse array of products to regional customs in the U.S. Pacific Northwest. We are seeking to diversify our supply chain in order to reduce costs. Can you provide a price list for your innersprings units? Also, are your innersprings units subject to any U.S. antidumping duties? Thank you, Paul Union, Purchasing Manager AvisOne Trading Company, Ltd. Tel: (503) 583-4237 Email: [email protected]
Staff, posing as a U.S. trading company, contacted Company G via Alibaba.com to inquire whether it could avoid paying duties on uncovered innersprings units. Company G proposed illegally transship-ping product through a third country, or undertaking minor assembly in the United States to avoid pay-ing duties. Below is a transcript of email correspondence documenting a willingness to evade AD/CVD orders (highlighted in red). Textboxes provide an explanation of the correspondence.
Explanation: In this email, staff, acting as AvisOne Trading Co., initiates a product in-quiry with Company G via Alibaba.com, China’s largest e-commerce platform.
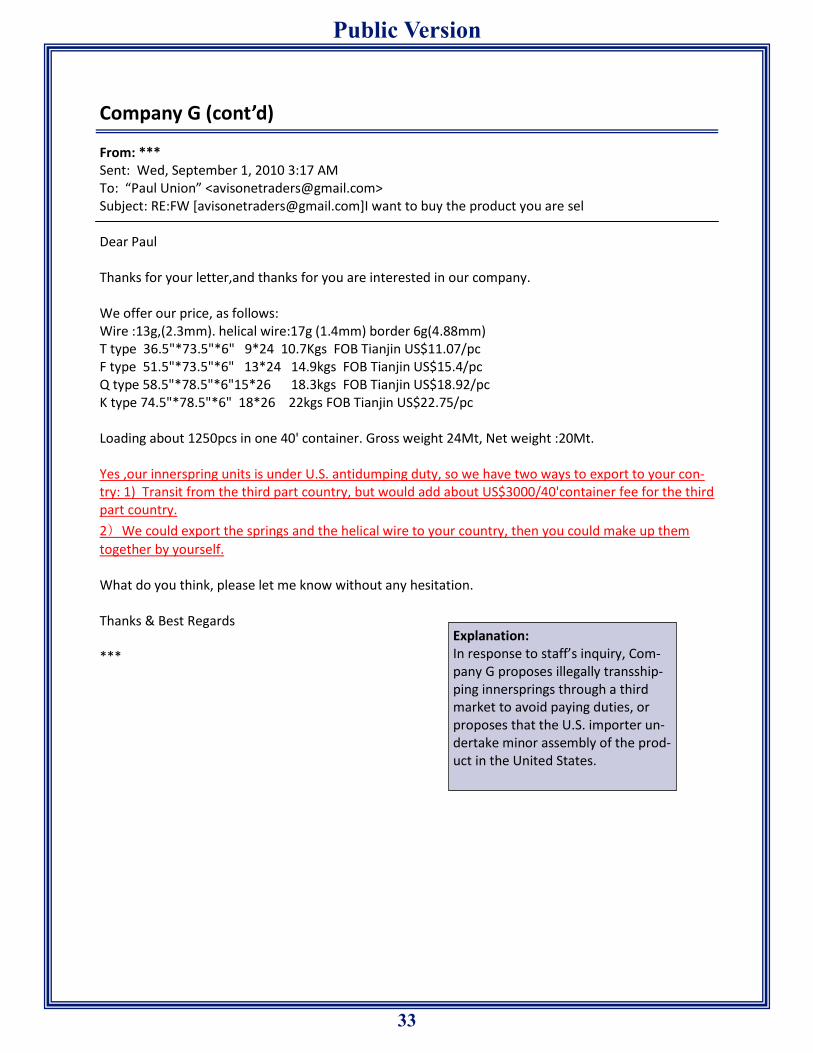
33
Public Version
Company G (cont’d) From: *** Sent: Wed, September 1, 2010 3:17 AM To: “Paul Union” <[email protected]> Subject: RE:FW [[email protected]]I want to buy the product you are sel Dear Paul Thanks for your letter,and thanks for you are interested in our company. We offer our price, as follows: Wire :13g,(2.3mm). helical wire:17g (1.4mm) border 6g(4.88mm) T type 36.5"*73.5"*6" 9*24 10.7Kgs FOB Tianjin US$11.07/pc F type 51.5"*73.5"*6" 13*24 14.9kgs FOB Tianjin US$15.4/pc Q type 58.5"*78.5"*6"15*26 18.3kgs FOB Tianjin US$18.92/pc K type 74.5"*78.5"*6" 18*26 22kgs FOB Tianjin US$22.75/pc Loading about 1250pcs in one 40' container. Gross weight 24Mt, Net weight :20Mt. Yes ,our innerspring units is under U.S. antidumping duty, so we have two ways to export to your con-try: 1) Transit from the third part country, but would add about US$3000/40'container fee for the third part country.
2)We could export the springs and the helical wire to your country, then you could make up them
together by yourself. What do you think, please let me know without any hesitation. Thanks & Best Regards ***
Explanation: In response to staff’s inquiry, Com-pany G proposes illegally transship-ping innersprings through a third market to avoid paying duties, or proposes that the U.S. importer un-dertake minor assembly of the prod-uct in the United States.

34
Public Version
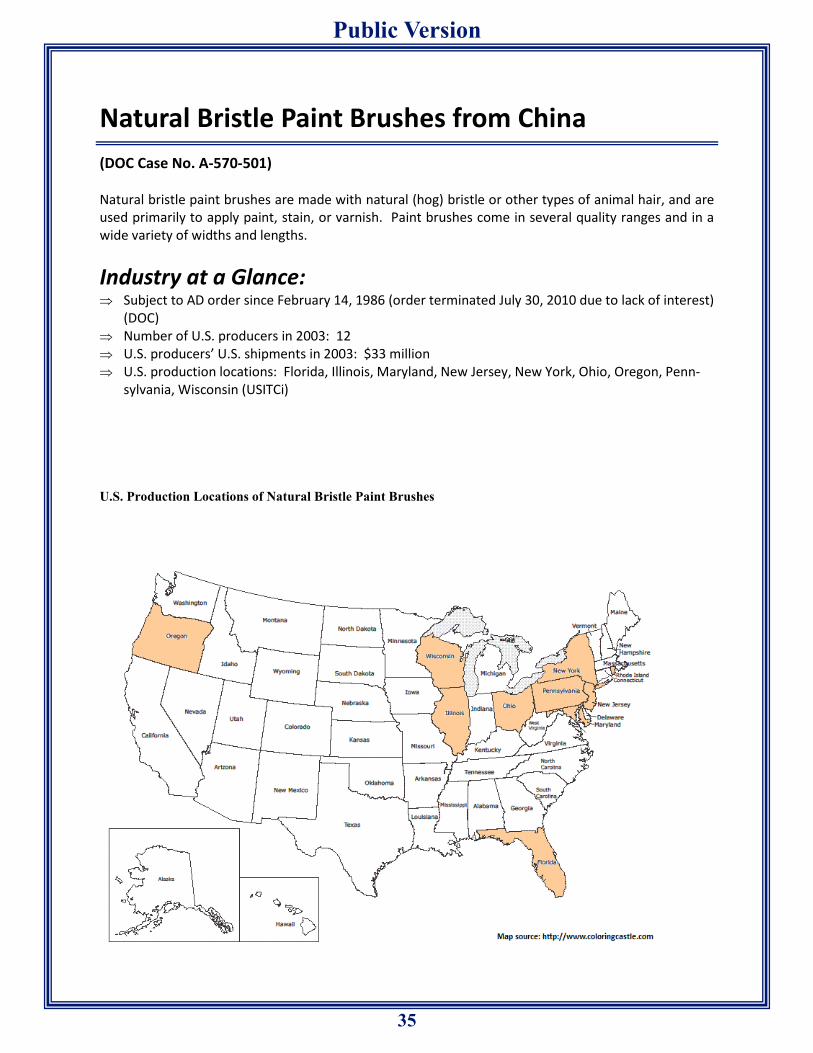
35
Public Version
Natural Bristle Paint Brushes from China
(DOC Case No. A-570-501) Natural bristle paint brushes are made with natural (hog) bristle or other types of animal hair, and are used primarily to apply paint, stain, or varnish. Paint brushes come in several quality ranges and in a wide variety of widths and lengths.
Industry at a Glance: Subject to AD order since February 14, 1986 (order terminated July 30, 2010 due to lack of interest)
(DOC) Number of U.S. producers in 2003: 12 U.S. producers’ U.S. shipments in 2003: $33 million U.S. production locations: Florida, Illinois, Maryland, New Jersey, New York, Ohio, Oregon, Penn-
sylvania, Wisconsin (USITCi)
U.S. Production Locations of Natural Bristle Paint Brushes
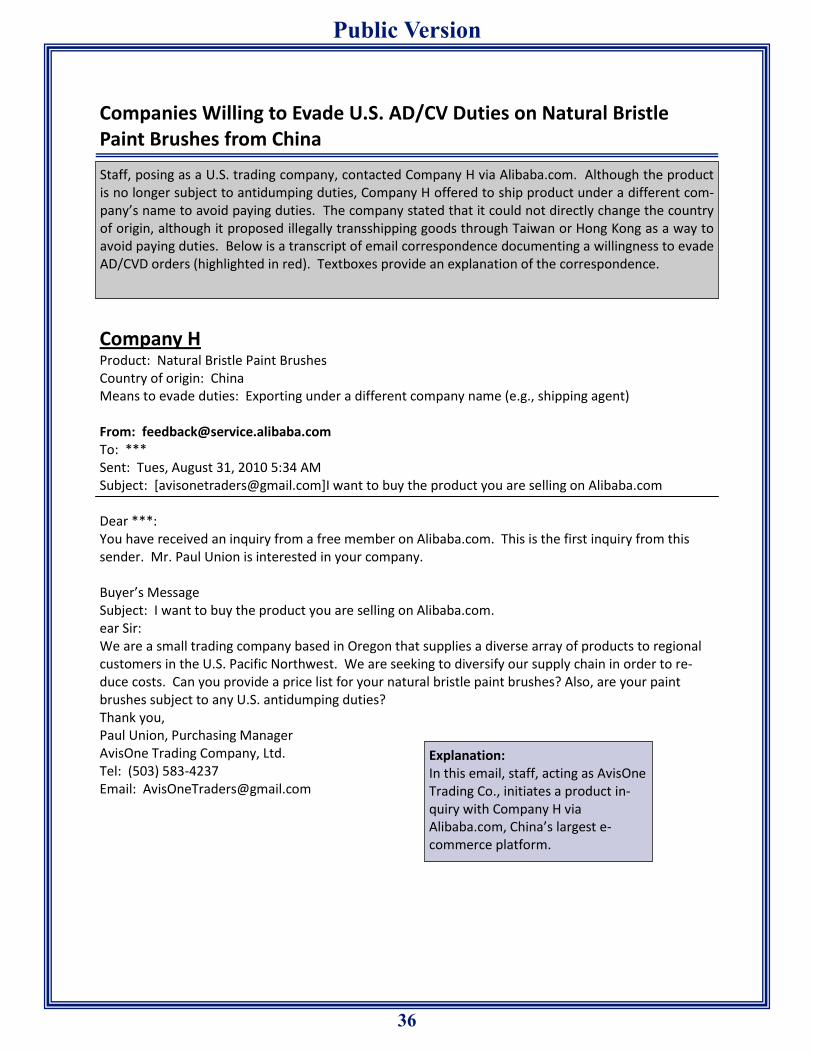
36
Public Version
Companies Willing to Evade U.S. AD/CV Duties on Natural Bristle Paint Brushes from China
Company H Product: Natural Bristle Paint Brushes Country of origin: China Means to evade duties: Exporting under a different company name (e.g., shipping agent) From: [email protected] To: *** Sent: Tues, August 31, 2010 5:34 AM Subject: [[email protected]]I want to buy the product you are selling on Alibaba.com Dear ***: You have received an inquiry from a free member on Alibaba.com. This is the first inquiry from this sender. Mr. Paul Union is interested in your company. Buyer’s Message Subject: I want to buy the product you are selling on Alibaba.com. ear Sir: We are a small trading company based in Oregon that supplies a diverse array of products to regional customers in the U.S. Pacific Northwest. We are seeking to diversify our supply chain in order to re-duce costs. Can you provide a price list for your natural bristle paint brushes? Also, are your paint brushes subject to any U.S. antidumping duties? Thank you, Paul Union, Purchasing Manager AvisOne Trading Company, Ltd. Tel: (503) 583-4237 Email: [email protected]
Staff, posing as a U.S. trading company, contacted Company H via Alibaba.com. Although the product is no longer subject to antidumping duties, Company H offered to ship product under a different com-pany’s name to avoid paying duties. The company stated that it could not directly change the country of origin, although it proposed illegally transshipping goods through Taiwan or Hong Kong as a way to avoid paying duties. Below is a transcript of email correspondence documenting a willingness to evade AD/CVD orders (highlighted in red). Textboxes provide an explanation of the correspondence.
Explanation: In this email, staff, acting as AvisOne Trading Co., initiates a product in-quiry with Company H via Alibaba.com, China’s largest e-commerce platform.
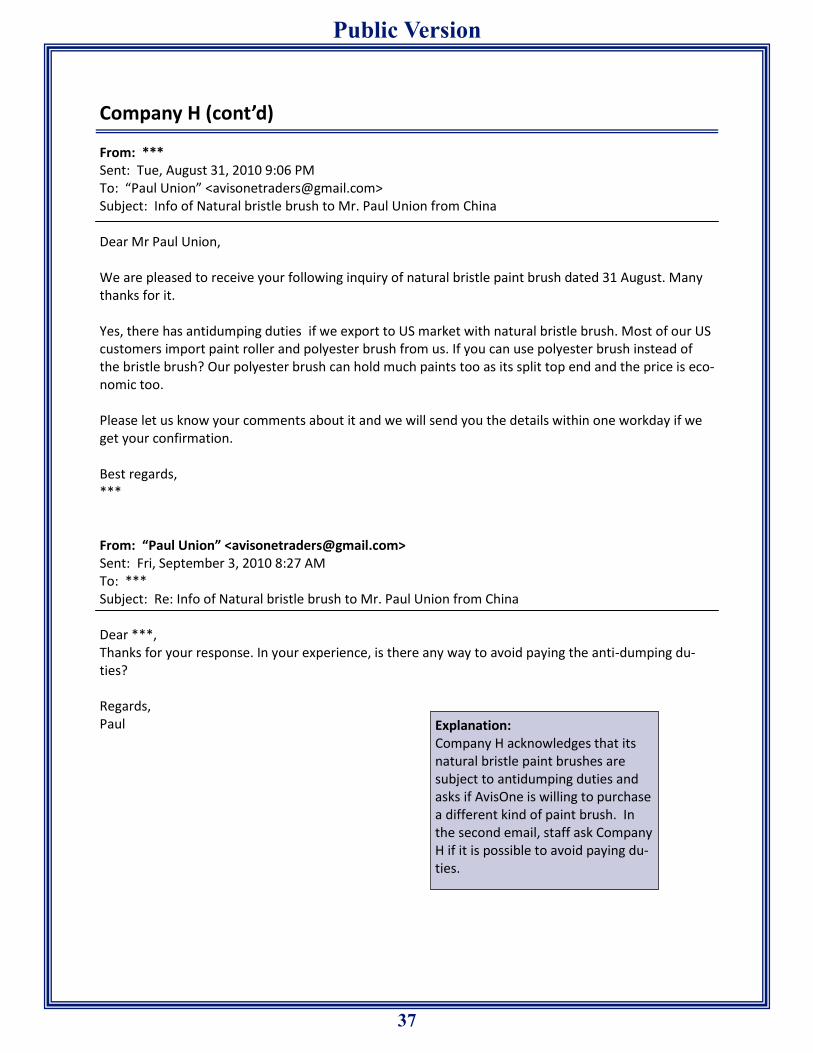
37
Public Version
Company H (cont’d) From: *** Sent: Tue, August 31, 2010 9:06 PM To: “Paul Union” <[email protected]> Subject: Info of Natural bristle brush to Mr. Paul Union from China Dear Mr Paul Union, We are pleased to receive your following inquiry of natural bristle paint brush dated 31 August. Many thanks for it. Yes, there has antidumping duties if we export to US market with natural bristle brush. Most of our US customers import paint roller and polyester brush from us. If you can use polyester brush instead of the bristle brush? Our polyester brush can hold much paints too as its split top end and the price is eco-nomic too. Please let us know your comments about it and we will send you the details within one workday if we get your confirmation. Best regards, *** From: “Paul Union” <[email protected]> Sent: Fri, September 3, 2010 8:27 AM To: *** Subject: Re: Info of Natural bristle brush to Mr. Paul Union from China Dear ***, Thanks for your response. In your experience, is there any way to avoid paying the anti-dumping du-ties? Regards, Paul
Explanation: Company H acknowledges that its natural bristle paint brushes are subject to antidumping duties and asks if AvisOne is willing to purchase a different kind of paint brush. In the second email, staff ask Company H if it is possible to avoid paying du-ties.
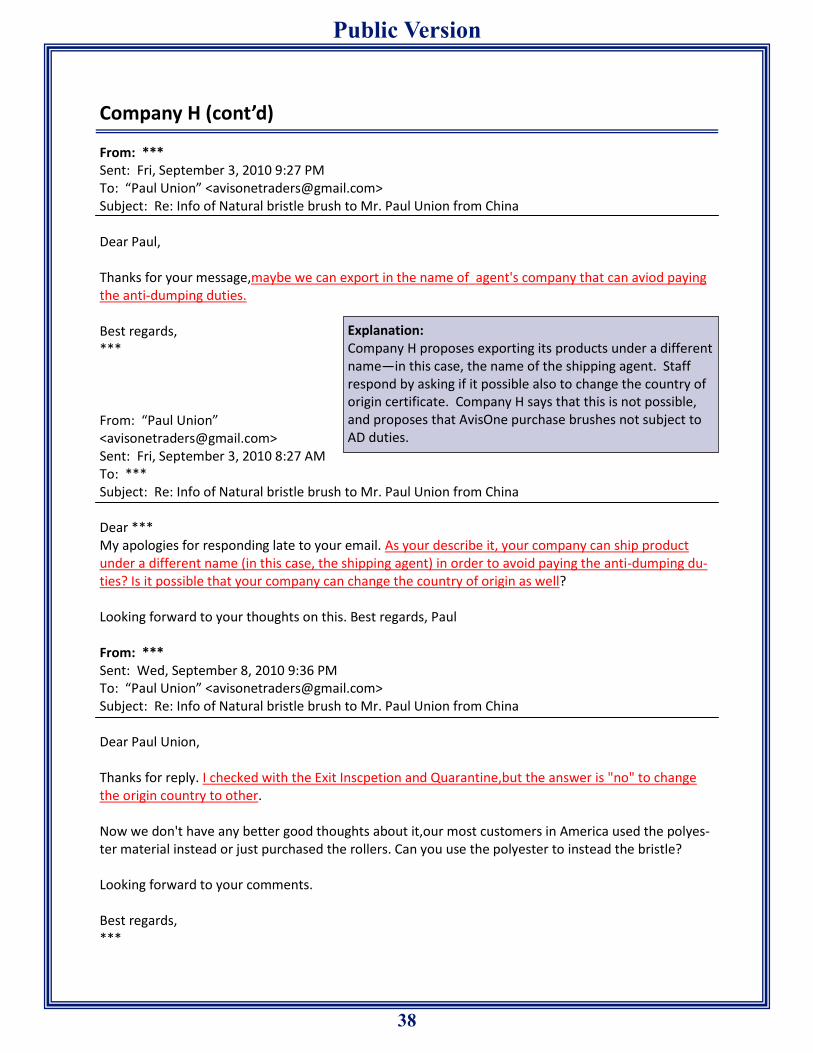
38
Public Version
Company H (cont’d) From: *** Sent: Fri, September 3, 2010 9:27 PM To: “Paul Union” <[email protected]> Subject: Re: Info of Natural bristle brush to Mr. Paul Union from China Dear Paul, Thanks for your message,maybe we can export in the name of agent's company that can aviod paying the anti-dumping duties. Best regards, *** From: “Paul Union” <[email protected]> Sent: Fri, September 3, 2010 8:27 AM To: *** Subject: Re: Info of Natural bristle brush to Mr. Paul Union from China Dear *** My apologies for responding late to your email. As your describe it, your company can ship product under a different name (in this case, the shipping agent) in order to avoid paying the anti-dumping du-ties? Is it possible that your company can change the country of origin as well? Looking forward to your thoughts on this. Best regards, Paul From: *** Sent: Wed, September 8, 2010 9:36 PM To: “Paul Union” <[email protected]> Subject: Re: Info of Natural bristle brush to Mr. Paul Union from China Dear Paul Union, Thanks for reply. I checked with the Exit Inscpetion and Quarantine,but the answer is "no" to change the origin country to other. Now we don't have any better good thoughts about it,our most customers in America used the polyes-ter material instead or just purchased the rollers. Can you use the polyester to instead the bristle? Looking forward to your comments. Best regards, ***
Explanation: Company H proposes exporting its products under a different name—in this case, the name of the shipping agent. Staff respond by asking if it possible also to change the country of origin certificate. Company H says that this is not possible, and proposes that AvisOne purchase brushes not subject to AD duties.
39
Public Version
Company H (cont’d) From: *** Sent: Thur, September 9, 2010 2:00 AM To: “Paul Union” <[email protected]> Subject: Re: Info of Natural bristle brush to Mr. Paul Union from China Dear Paul Union, Do you know any companies in Taiwan or HK who can help you to export the brushes to your com-pany? We send the brushes to them and then they export to you with their name.
Explanation: In this last email, Company H pro-poses exporting its brushes to com-panies in Taiwan or Hong Kong that can then re-export the brushes un-der those companies’ names.

40
Public Version
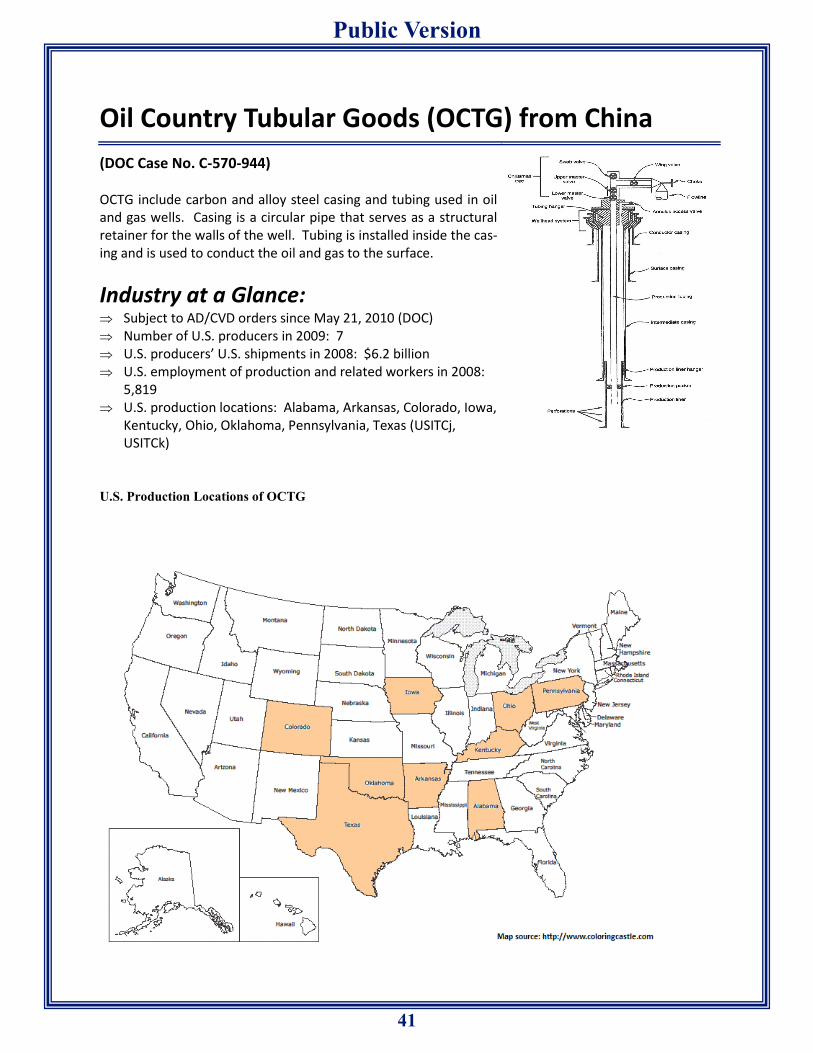
41
Public Version
Oil Country Tubular Goods (OCTG) from China
(DOC Case No. C-570-944) OCTG include carbon and alloy steel casing and tubing used in oil and gas wells. Casing is a circular pipe that serves as a structural retainer for the walls of the well. Tubing is installed inside the cas-ing and is used to conduct the oil and gas to the surface.
Industry at a Glance: Subject to AD/CVD orders since May 21, 2010 (DOC) Number of U.S. producers in 2009: 7 U.S. producers’ U.S. shipments in 2008: $6.2 billion U.S. employment of production and related workers in 2008:
5,819 U.S. production locations: Alabama, Arkansas, Colorado, Iowa,
Kentucky, Ohio, Oklahoma, Pennsylvania, Texas (USITCj, USITCk)
U.S. Production Locations of OCTG
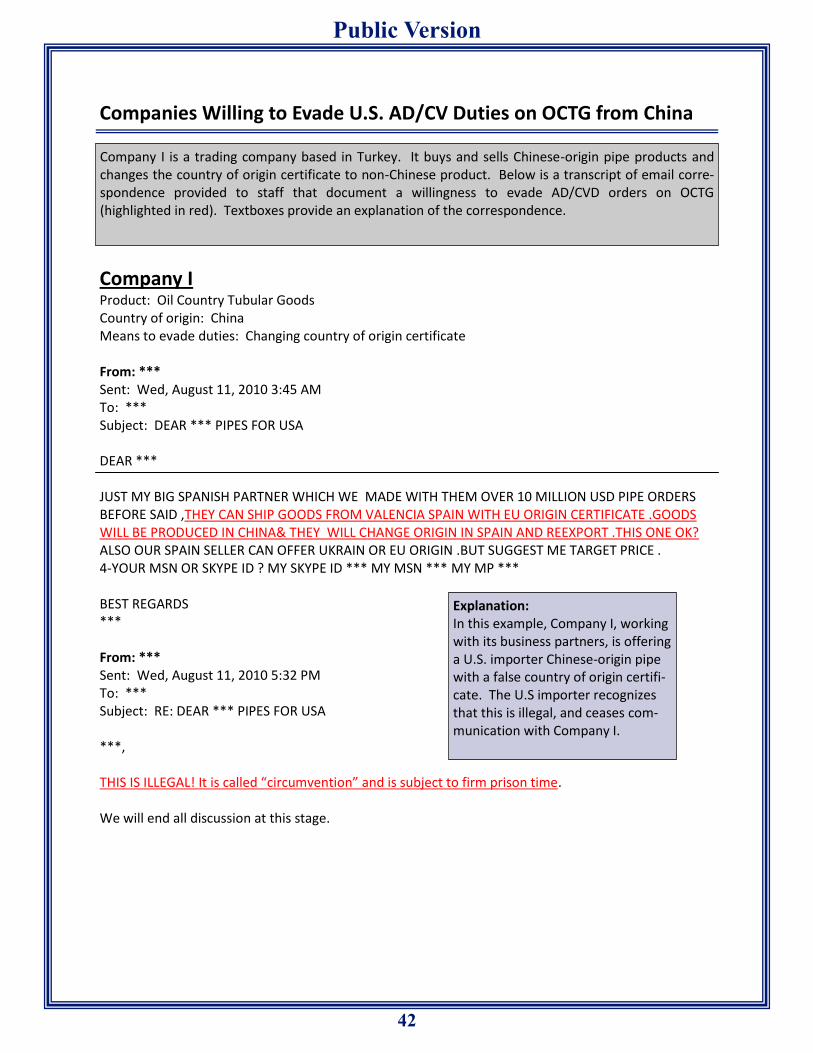
42
Public Version
Companies Willing to Evade U.S. AD/CV Duties on OCTG from China
Company I Product: Oil Country Tubular Goods Country of origin: China Means to evade duties: Changing country of origin certificate From: *** Sent: Wed, August 11, 2010 3:45 AM To: *** Subject: DEAR *** PIPES FOR USA DEAR *** JUST MY BIG SPANISH PARTNER WHICH WE MADE WITH THEM OVER 10 MILLION USD PIPE ORDERS BEFORE SAID ,THEY CAN SHIP GOODS FROM VALENCIA SPAIN WITH EU ORIGIN CERTIFICATE .GOODS WILL BE PRODUCED IN CHINA& THEY WILL CHANGE ORIGIN IN SPAIN AND REEXPORT .THIS ONE OK? ALSO OUR SPAIN SELLER CAN OFFER UKRAIN OR EU ORIGIN .BUT SUGGEST ME TARGET PRICE . 4-YOUR MSN OR SKYPE ID ? MY SKYPE ID *** MY MSN *** MY MP *** BEST REGARDS *** From: *** Sent: Wed, August 11, 2010 5:32 PM To: *** Subject: RE: DEAR *** PIPES FOR USA ***, THIS IS ILLEGAL! It is called “circumvention” and is subject to firm prison time. We will end all discussion at this stage.
Company I is a trading company based in Turkey. It buys and sells Chinese-origin pipe products and changes the country of origin certificate to non-Chinese product. Below is a transcript of email corre-spondence provided to staff that document a willingness to evade AD/CVD orders on OCTG (highlighted in red). Textboxes provide an explanation of the correspondence.
Explanation: In this example, Company I, working with its business partners, is offering a U.S. importer Chinese-origin pipe with a false country of origin certifi-cate. The U.S importer recognizes that this is illegal, and ceases com-munication with Company I.
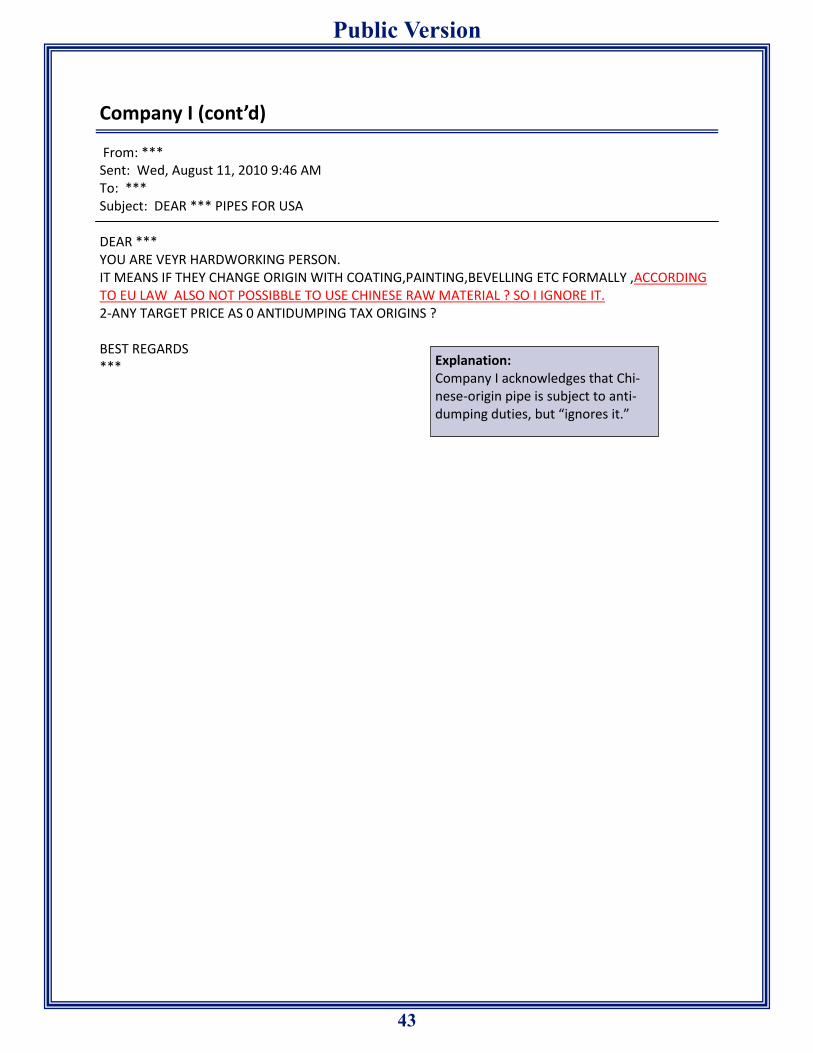
43
Public Version
Company I (cont’d) From: *** Sent: Wed, August 11, 2010 9:46 AM To: *** Subject: DEAR *** PIPES FOR USA DEAR *** YOU ARE VEYR HARDWORKING PERSON. IT MEANS IF THEY CHANGE ORIGIN WITH COATING,PAINTING,BEVELLING ETC FORMALLY ,ACCORDING TO EU LAW ALSO NOT POSSIBBLE TO USE CHINESE RAW MATERIAL ? SO I IGNORE IT. 2-ANY TARGET PRICE AS 0 ANTIDUMPING TAX ORIGINS ? BEST REGARDS *** Explanation:
Company I acknowledges that Chi-nese-origin pipe is subject to anti-dumping duties, but “ignores it.”

44
Public Version
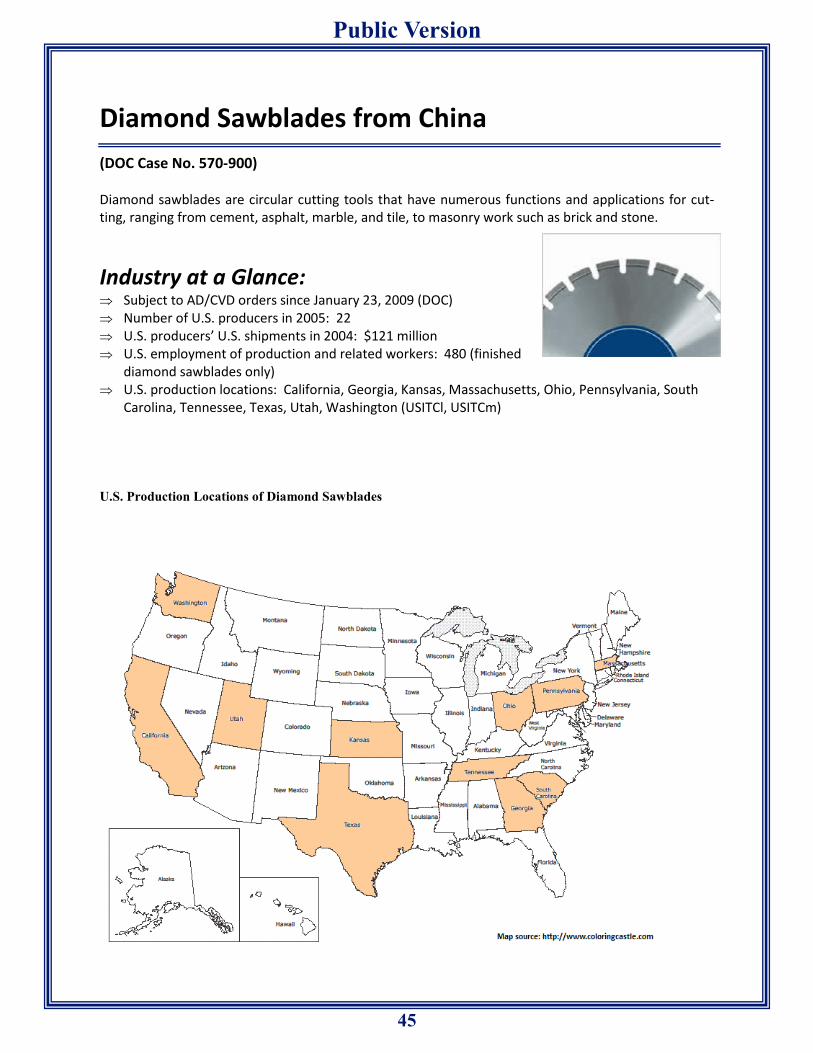
45
Public Version
Diamond Sawblades from China
(DOC Case No. 570-900) Diamond sawblades are circular cutting tools that have numerous functions and applications for cut-ting, ranging from cement, asphalt, marble, and tile, to masonry work such as brick and stone.
Industry at a Glance: Subject to AD/CVD orders since January 23, 2009 (DOC) Number of U.S. producers in 2005: 22 U.S. producers’ U.S. shipments in 2004: $121 million U.S. employment of production and related workers: 480 (finished
diamond sawblades only) U.S. production locations: California, Georgia, Kansas, Massachusetts, Ohio, Pennsylvania, South
Carolina, Tennessee, Texas, Utah, Washington (USITCl, USITCm)
U.S. Production Locations of Diamond Sawblades
46
Public Version
Companies Willing to Evade U.S. AD/CV Duties on Diamond Sawblades from China
Company J Product: Diamond sawblades Country of origin: China Means to evade duties: Undervaluing invoices and misclassifying goods to avoid paying duties From: *** Sent: Thur, December 10, 2009 6:54 AM To: Sales email account Subject: Diamond tools and cutting machineries Dear Sir or Madam, We are a Chinese company specialized in manufacturing various diamond tools which are widely used in Europe and USA. Best ratio of quality to price could be achieved with the help of our diamond tools. I’d like to offer you below tools for a reference in hope that we could be your competent and reliable partner in China. Once got your requests, I’d like to send you our whole catalogue and pricelist. Your prompt reply would be mostly appreciated. Regards ***
Companies J and K are Chinese trading companies that import and export diamond sawblades. Com-pany J characterizes antidumping duties as a “political game,” while Company K admits that it engages in illegal transshipment to avoid paying antidumping duties. Below are transcripts of email correspon-dence documenting a willing to evade AD/CVD orders (highlighted in red). Textboxes provide an expla-nation of the correspondence.
Explanation: In this email, Company J describes its business and products.
47
Public Version
Company J (cont’d) From: *** Sent: Thur, December 10, 2009 9:47 PM To: *** Subject: Re: Diamond tools and cutting machineries Are your saw blades subject to antidumping duties? From: *** Sent: Thur, December 10, 2009 To: *** Subject: Diamond tools and cutting machineries Hi Sir, Thanks for your prompt reply. I don’t think it’s a big problem for us. We have 3 solutions to help you out of this high duty---it’s just a political game: anti-dumping duty.
1. We can change the actual value of products in the Invoice a little bit.(as for small quantity such as trial order )
2. Our factory has responded to the lawsuit and will only be charged with 20% duty. When you order large quantity, it’s no big deal.
3. We could ship the blades as the category of core. Moreover, if you have any solutions, we would like to cooperate your actions from our side. Regards ***
Explanation: The U.S. importers asks if Company J’s sawblades are subject to anti-dumping duties. Company J re-sponds that antidumping is a “political game.” Company J offers to undervalue the company invoice or misclassify the goods to avoid paying duties.
48
Public Version
Company K Product: Diamond sawblades Country of origin: China Means to evade duties: Illegal transshipment From: *** Sent: Thur, August 5, 2010 9:28 PM To: *** Subject: Re: Diamond Blades Hi ***, Thanks for getting back to me. No, we are not affected by the anti-dumping as we can do trans-shipment. Regards, ***
Explanation: Company K engages in illegal trans-shipment to avoid paying duties.
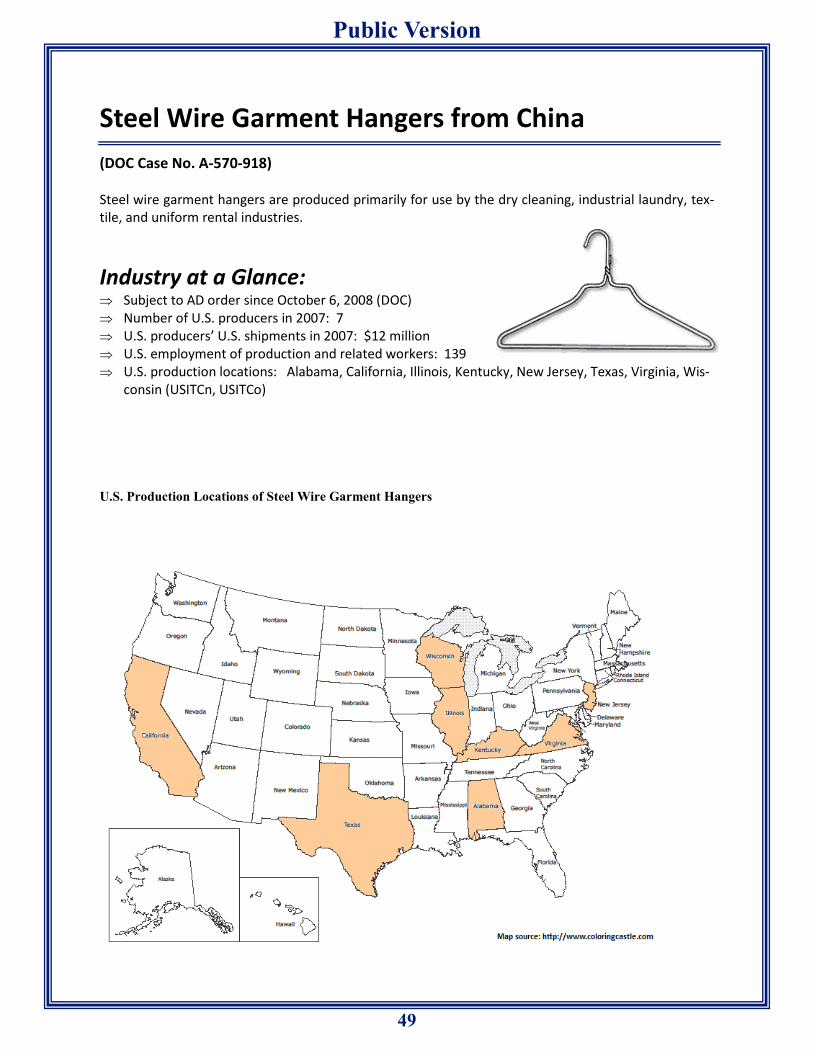
49
Public Version
Steel Wire Garment Hangers from China
(DOC Case No. A-570-918) Steel wire garment hangers are produced primarily for use by the dry cleaning, industrial laundry, tex-tile, and uniform rental industries.
Industry at a Glance: Subject to AD order since October 6, 2008 (DOC) Number of U.S. producers in 2007: 7 U.S. producers’ U.S. shipments in 2007: $12 million U.S. employment of production and related workers: 139 U.S. production locations: Alabama, California, Illinois, Kentucky, New Jersey, Texas, Virginia, Wis-
consin (USITCn, USITCo)
U.S. Production Locations of Steel Wire Garment Hangers
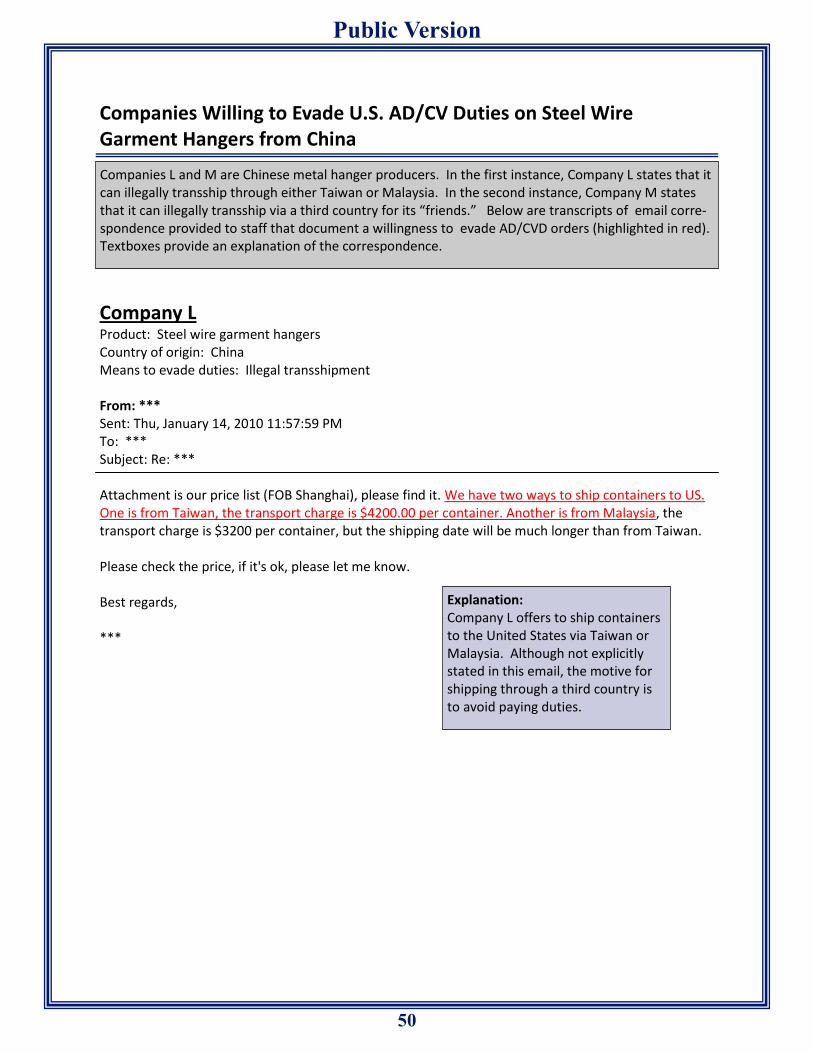
50
Public Version
Companies Willing to Evade U.S. AD/CV Duties on Steel Wire Garment Hangers from China
Company L Product: Steel wire garment hangers Country of origin: China Means to evade duties: Illegal transshipment From: *** Sent: Thu, January 14, 2010 11:57:59 PM To: *** Subject: Re: *** Attachment is our price list (FOB Shanghai), please find it. We have two ways to ship containers to US. One is from Taiwan, the transport charge is $4200.00 per container. Another is from Malaysia, the transport charge is $3200 per container, but the shipping date will be much longer than from Taiwan. Please check the price, if it's ok, please let me know. Best regards, ***
Companies L and M are Chinese metal hanger producers. In the first instance, Company L states that it can illegally transship through either Taiwan or Malaysia. In the second instance, Company M states that it can illegally transship via a third country for its “friends.” Below are transcripts of email corre-spondence provided to staff that document a willingness to evade AD/CVD orders (highlighted in red). Textboxes provide an explanation of the correspondence.
Explanation: Company L offers to ship containers to the United States via Taiwan or Malaysia. Although not explicitly stated in this email, the motive for shipping through a third country is to avoid paying duties.
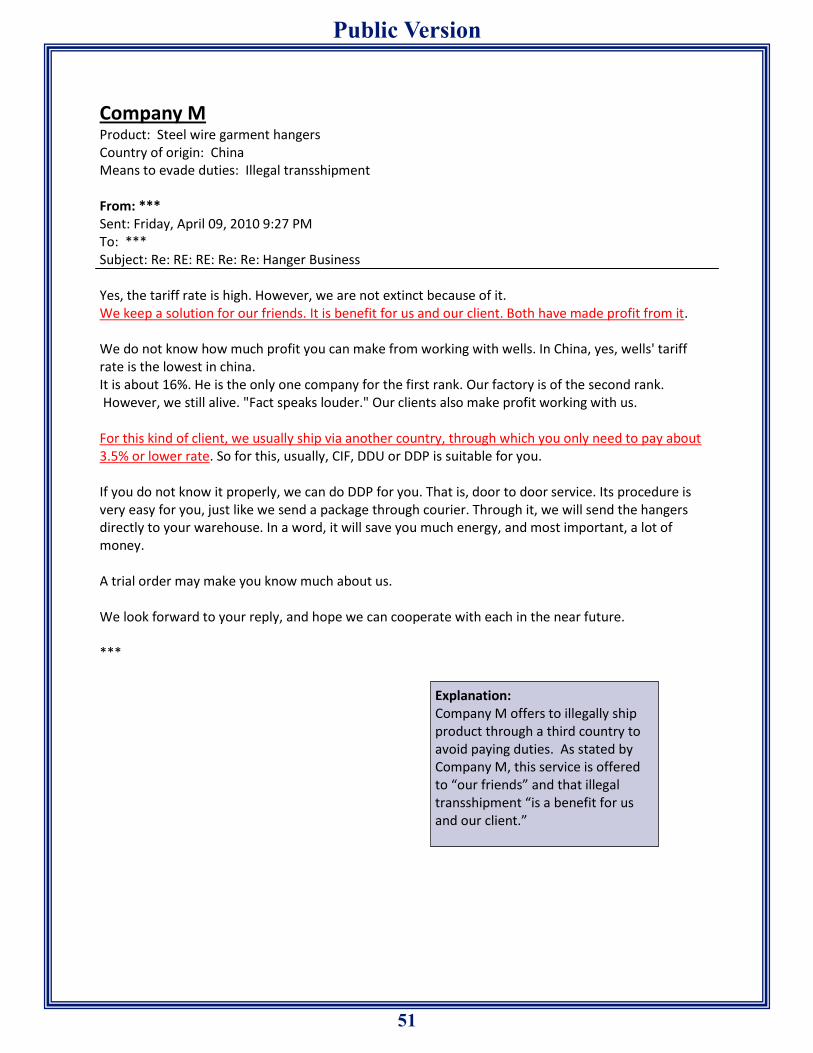
51
Public Version
Company M Product: Steel wire garment hangers Country of origin: China Means to evade duties: Illegal transshipment From: *** Sent: Friday, April 09, 2010 9:27 PM To: *** Subject: Re: RE: RE: Re: Re: Hanger Business Yes, the tariff rate is high. However, we are not extinct because of it. We keep a solution for our friends. It is benefit for us and our client. Both have made profit from it. We do not know how much profit you can make from working with wells. In China, yes, wells' tariff rate is the lowest in china. It is about 16%. He is the only one company for the first rank. Our factory is of the second rank. However, we still alive. "Fact speaks louder." Our clients also make profit working with us. For this kind of client, we usually ship via another country, through which you only need to pay about 3.5% or lower rate. So for this, usually, CIF, DDU or DDP is suitable for you. If you do not know it properly, we can do DDP for you. That is, door to door service. Its procedure is very easy for you, just like we send a package through courier. Through it, we will send the hangers directly to your warehouse. In a word, it will save you much energy, and most important, a lot of money. A trial order may make you know much about us. We look forward to your reply, and hope we can cooperate with each in the near future. ***
Explanation: Company M offers to illegally ship product through a third country to avoid paying duties. As stated by Company M, this service is offered to “our friends” and that illegal transshipment “is a benefit for us and our client.”

52
Public Version
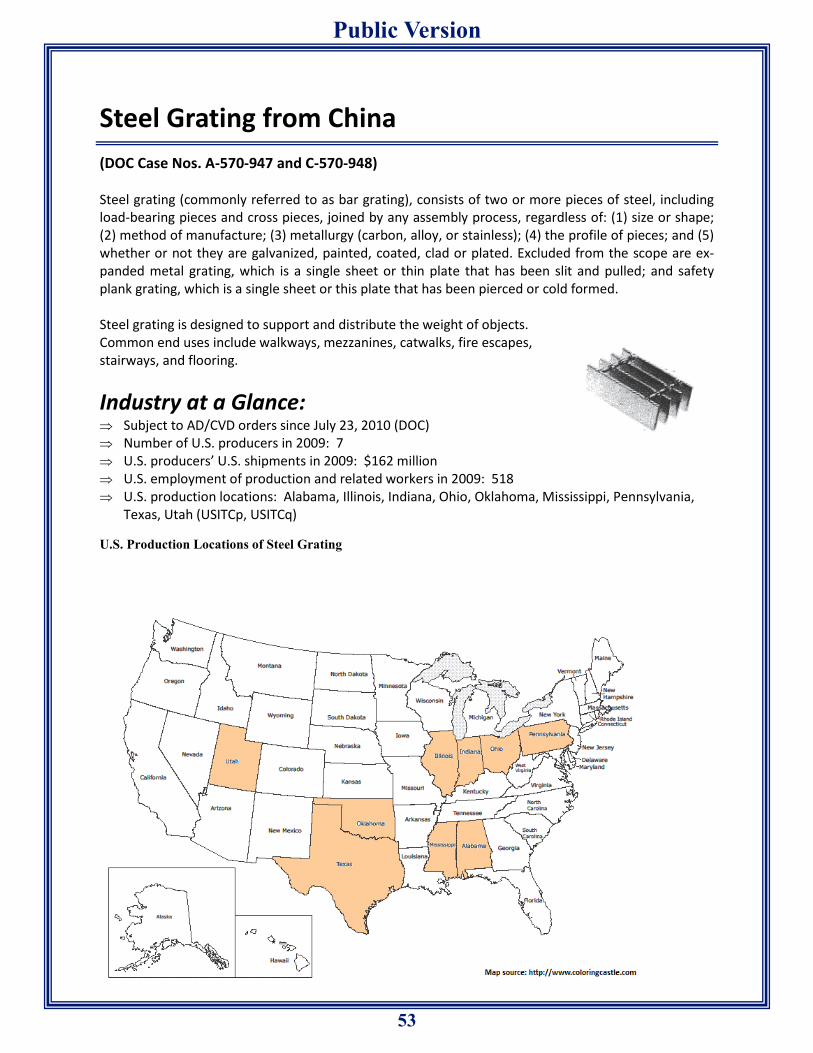
53
Public Version
Steel Grating from China
(DOC Case Nos. A-570-947 and C-570-948) Steel grating (commonly referred to as bar grating), consists of two or more pieces of steel, including load-bearing pieces and cross pieces, joined by any assembly process, regardless of: (1) size or shape; (2) method of manufacture; (3) metallurgy (carbon, alloy, or stainless); (4) the profile of pieces; and (5) whether or not they are galvanized, painted, coated, clad or plated. Excluded from the scope are ex-panded metal grating, which is a single sheet or thin plate that has been slit and pulled; and safety plank grating, which is a single sheet or this plate that has been pierced or cold formed. Steel grating is designed to support and distribute the weight of objects. Common end uses include walkways, mezzanines, catwalks, fire escapes, stairways, and flooring.
Industry at a Glance: Subject to AD/CVD orders since July 23, 2010 (DOC) Number of U.S. producers in 2009: 7 U.S. producers’ U.S. shipments in 2009: $162 million U.S. employment of production and related workers in 2009: 518 U.S. production locations: Alabama, Illinois, Indiana, Ohio, Oklahoma, Mississippi, Pennsylvania,
Texas, Utah (USITCp, USITCq)
U.S. Production Locations of Steel Grating
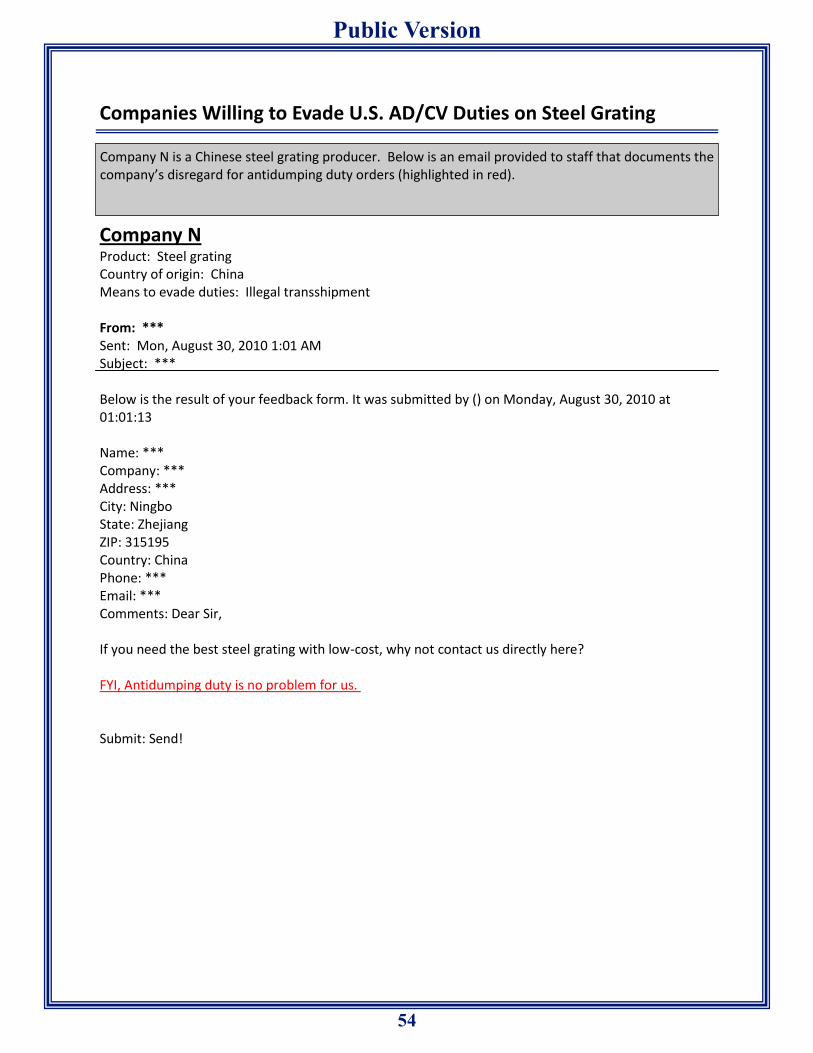
54
Public Version
Companies Willing to Evade U.S. AD/CV Duties on Steel Grating
Company N Product: Steel grating Country of origin: China Means to evade duties: Illegal transshipment From: *** Sent: Mon, August 30, 2010 1:01 AM Subject: *** Below is the result of your feedback form. It was submitted by () on Monday, August 30, 2010 at 01:01:13 Name: *** Company: *** Address: *** City: Ningbo State: Zhejiang ZIP: 315195 Country: China Phone: *** Email: *** Comments: Dear Sir, If you need the best steel grating with low-cost, why not contact us directly here? FYI, Antidumping duty is no problem for us. Submit: Send!
Company N is a Chinese steel grating producer. Below is an email provided to staff that documents the company’s disregard for antidumping duty orders (highlighted in red).
55
Public Version
Part II: Foreign Logistics Companies Willing to Evade U.S. AD/CV Duties

56
Public Version
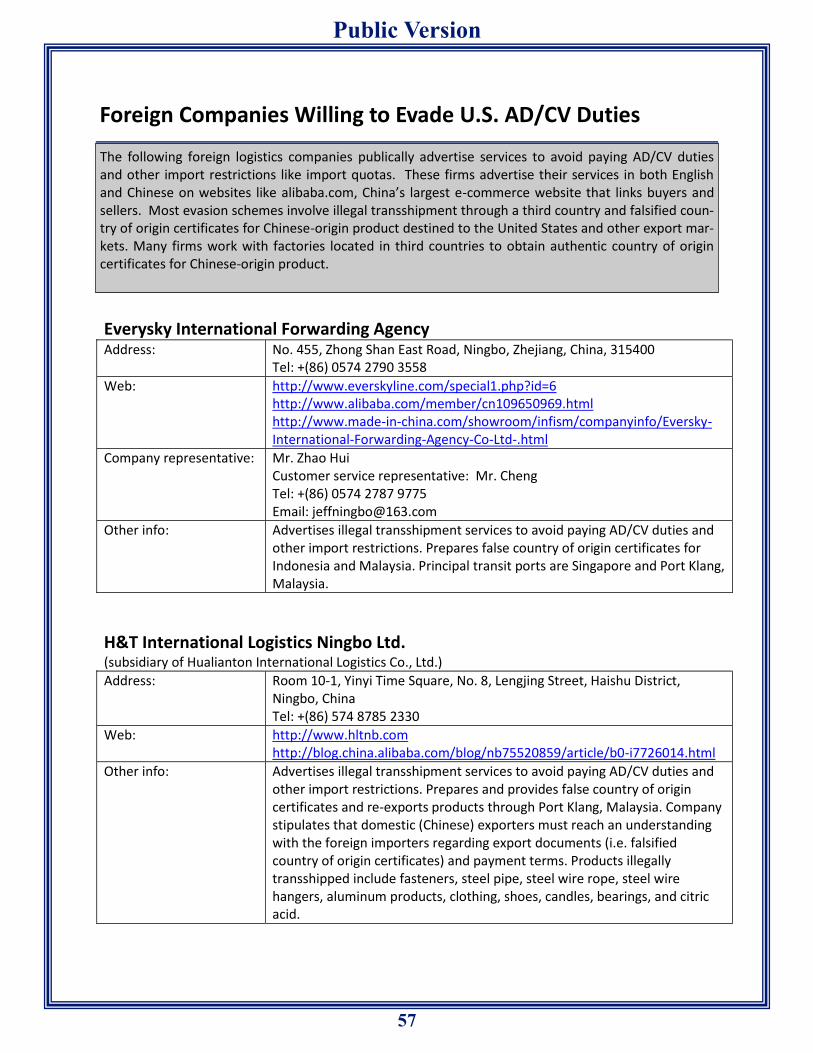
57
Public Version
Foreign Companies Willing to Evade U.S. AD/CV Duties
Everysky International Forwarding Agency Address: No. 455, Zhong Shan East Road, Ningbo, Zhejiang, China, 315400
Tel: +(86) 0574 2790 3558
Web: http://www.everskyline.com/special1.php?id=6 http://www.alibaba.com/member/cn109650969.html http://www.made-in-china.com/showroom/infism/companyinfo/Eversky-International-Forwarding-Agency-Co-Ltd-.html
Company representative: Mr. Zhao Hui Customer service representative: Mr. Cheng Tel: +(86) 0574 2787 9775 Email: [email protected]
Other info: Advertises illegal transshipment services to avoid paying AD/CV duties and other import restrictions. Prepares false country of origin certificates for Indonesia and Malaysia. Principal transit ports are Singapore and Port Klang, Malaysia.
H&T International Logistics Ningbo Ltd. (subsidiary of Hualianton International Logistics Co., Ltd.)
Address: Room 10-1, Yinyi Time Square, No. 8, Lengjing Street, Haishu District, Ningbo, China Tel: +(86) 574 8785 2330
Web: http://www.hltnb.com http://blog.china.alibaba.com/blog/nb75520859/article/b0-i7726014.html
Other info: Advertises illegal transshipment services to avoid paying AD/CV duties and other import restrictions. Prepares and provides false country of origin certificates and re-exports products through Port Klang, Malaysia. Company stipulates that domestic (Chinese) exporters must reach an understanding with the foreign importers regarding export documents (i.e. falsified country of origin certificates) and payment terms. Products illegally transshipped include fasteners, steel pipe, steel wire rope, steel wire hangers, aluminum products, clothing, shoes, candles, bearings, and citric acid.
The following foreign logistics companies publically advertise services to avoid paying AD/CV duties and other import restrictions like import quotas. These firms advertise their services in both English and Chinese on websites like alibaba.com, China’s largest e-commerce website that links buyers and sellers. Most evasion schemes involve illegal transshipment through a third country and falsified coun-try of origin certificates for Chinese-origin product destined to the United States and other export mar-kets. Many firms work with factories located in third countries to obtain authentic country of origin certificates for Chinese-origin product.
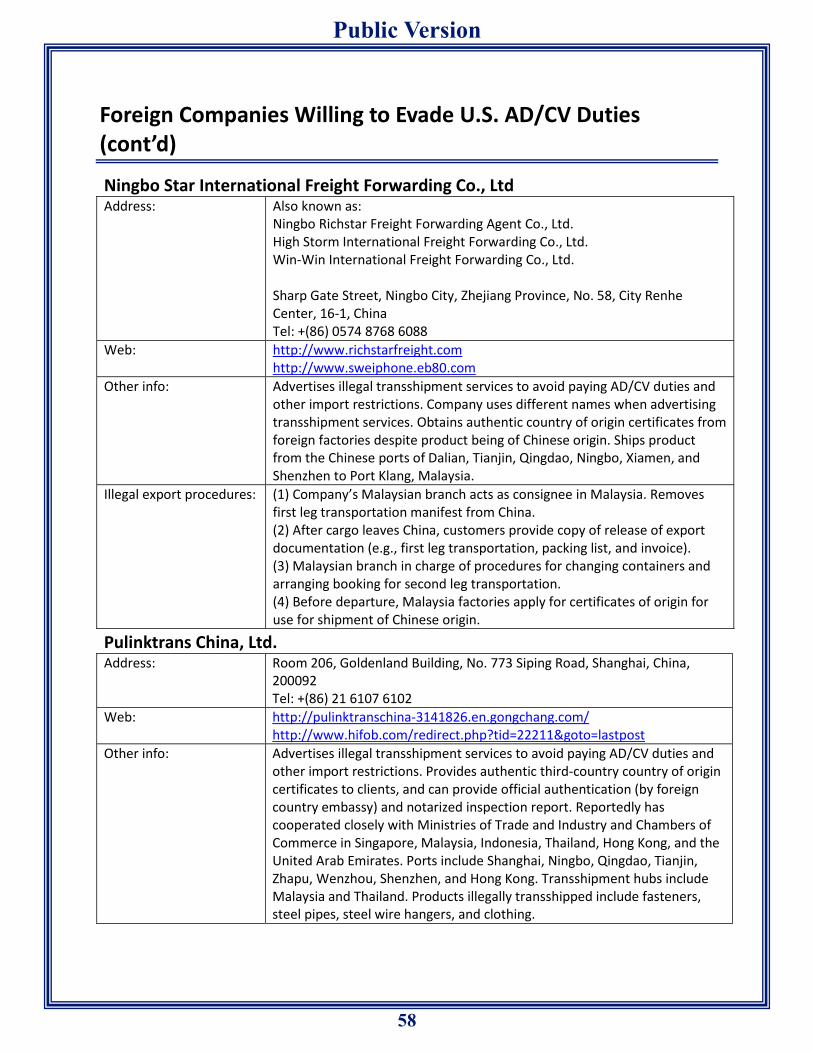
58
Public Version
Foreign Companies Willing to Evade U.S. AD/CV Duties (cont’d)
Ningbo Star International Freight Forwarding Co., Ltd Address: Also known as:
Ningbo Richstar Freight Forwarding Agent Co., Ltd. High Storm International Freight Forwarding Co., Ltd. Win-Win International Freight Forwarding Co., Ltd. Sharp Gate Street, Ningbo City, Zhejiang Province, No. 58, City Renhe Center, 16-1, China Tel: +(86) 0574 8768 6088
Web: http://www.richstarfreight.com http://www.sweiphone.eb80.com
Other info: Advertises illegal transshipment services to avoid paying AD/CV duties and other import restrictions. Company uses different names when advertising transshipment services. Obtains authentic country of origin certificates from foreign factories despite product being of Chinese origin. Ships product from the Chinese ports of Dalian, Tianjin, Qingdao, Ningbo, Xiamen, and Shenzhen to Port Klang, Malaysia.
Illegal export procedures: (1) Company’s Malaysian branch acts as consignee in Malaysia. Removes first leg transportation manifest from China. (2) After cargo leaves China, customers provide copy of release of export documentation (e.g., first leg transportation, packing list, and invoice). (3) Malaysian branch in charge of procedures for changing containers and arranging booking for second leg transportation. (4) Before departure, Malaysia factories apply for certificates of origin for use for shipment of Chinese origin.
Pulinktrans China, Ltd. Address: Room 206, Goldenland Building, No. 773 Siping Road, Shanghai, China,
200092 Tel: +(86) 21 6107 6102
Web: http://pulinktranschina-3141826.en.gongchang.com/ http://www.hifob.com/redirect.php?tid=22211&goto=lastpost
Other info: Advertises illegal transshipment services to avoid paying AD/CV duties and other import restrictions. Provides authentic third-country country of origin certificates to clients, and can provide official authentication (by foreign country embassy) and notarized inspection report. Reportedly has cooperated closely with Ministries of Trade and Industry and Chambers of Commerce in Singapore, Malaysia, Indonesia, Thailand, Hong Kong, and the United Arab Emirates. Ports include Shanghai, Ningbo, Qingdao, Tianjin, Zhapu, Wenzhou, Shenzhen, and Hong Kong. Transshipment hubs include Malaysia and Thailand. Products illegally transshipped include fasteners, steel pipes, steel wire hangers, and clothing.
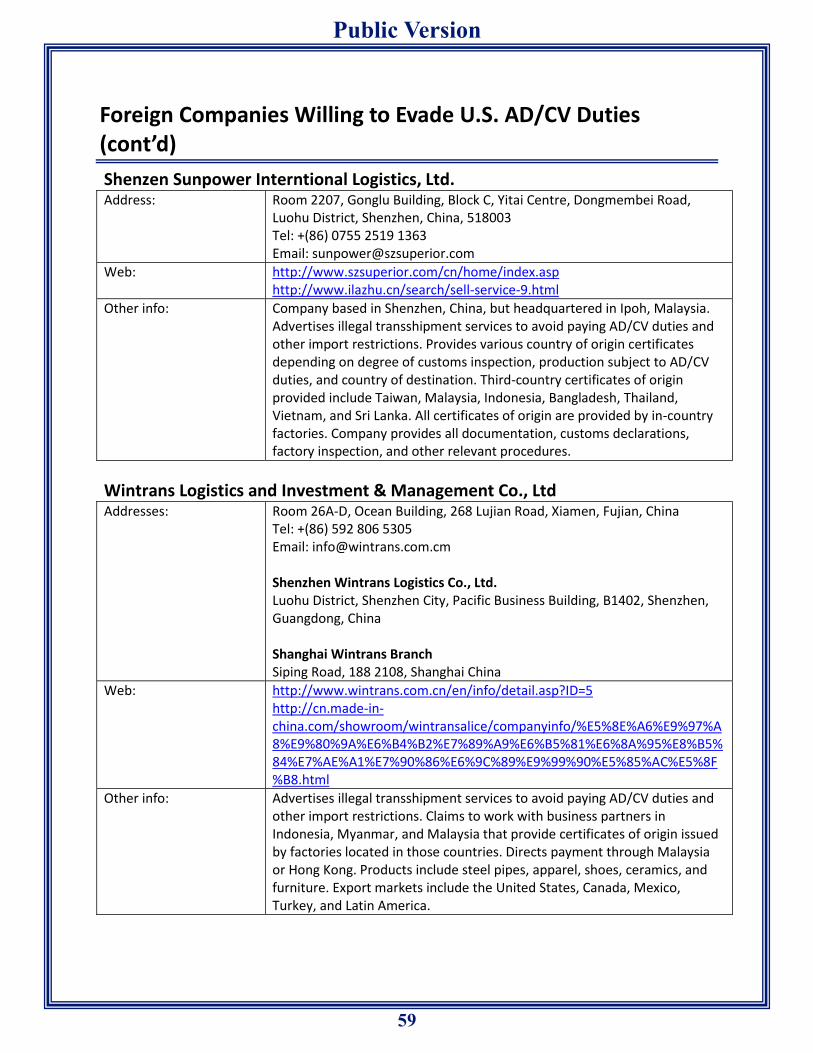
59
Public Version
Foreign Companies Willing to Evade U.S. AD/CV Duties (cont’d)
Shenzen Sunpower Interntional Logistics, Ltd. Address: Room 2207, Gonglu Building, Block C, Yitai Centre, Dongmembei Road,
Luohu District, Shenzhen, China, 518003 Tel: +(86) 0755 2519 1363 Email: [email protected]
Web: http://www.szsuperior.com/cn/home/index.asp http://www.ilazhu.cn/search/sell-service-9.html
Other info: Company based in Shenzhen, China, but headquartered in Ipoh, Malaysia. Advertises illegal transshipment services to avoid paying AD/CV duties and other import restrictions. Provides various country of origin certificates depending on degree of customs inspection, production subject to AD/CV duties, and country of destination. Third-country certificates of origin provided include Taiwan, Malaysia, Indonesia, Bangladesh, Thailand, Vietnam, and Sri Lanka. All certificates of origin are provided by in-country factories. Company provides all documentation, customs declarations, factory inspection, and other relevant procedures.
Wintrans Logistics and Investment & Management Co., Ltd Addresses: Room 26A-D, Ocean Building, 268 Lujian Road, Xiamen, Fujian, China
Tel: +(86) 592 806 5305 Email: [email protected] Shenzhen Wintrans Logistics Co., Ltd. Luohu District, Shenzhen City, Pacific Business Building, B1402, Shenzhen, Guangdong, China Shanghai Wintrans Branch Siping Road, 188 2108, Shanghai China
Web: http://www.wintrans.com.cn/en/info/detail.asp?ID=5 http://cn.made-in-china.com/showroom/wintransalice/companyinfo/%E5%8E%A6%E9%97%A8%E9%80%9A%E6%B4%B2%E7%89%A9%E6%B5%81%E6%8A%95%E8%B5%84%E7%AE%A1%E7%90%86%E6%9C%89%E9%99%90%E5%85%AC%E5%8F%B8.html
Other info: Advertises illegal transshipment services to avoid paying AD/CV duties and other import restrictions. Claims to work with business partners in Indonesia, Myanmar, and Malaysia that provide certificates of origin issued by factories located in those countries. Directs payment through Malaysia or Hong Kong. Products include steel pipes, apparel, shoes, ceramics, and furniture. Export markets include the United States, Canada, Mexico, Turkey, and Latin America.
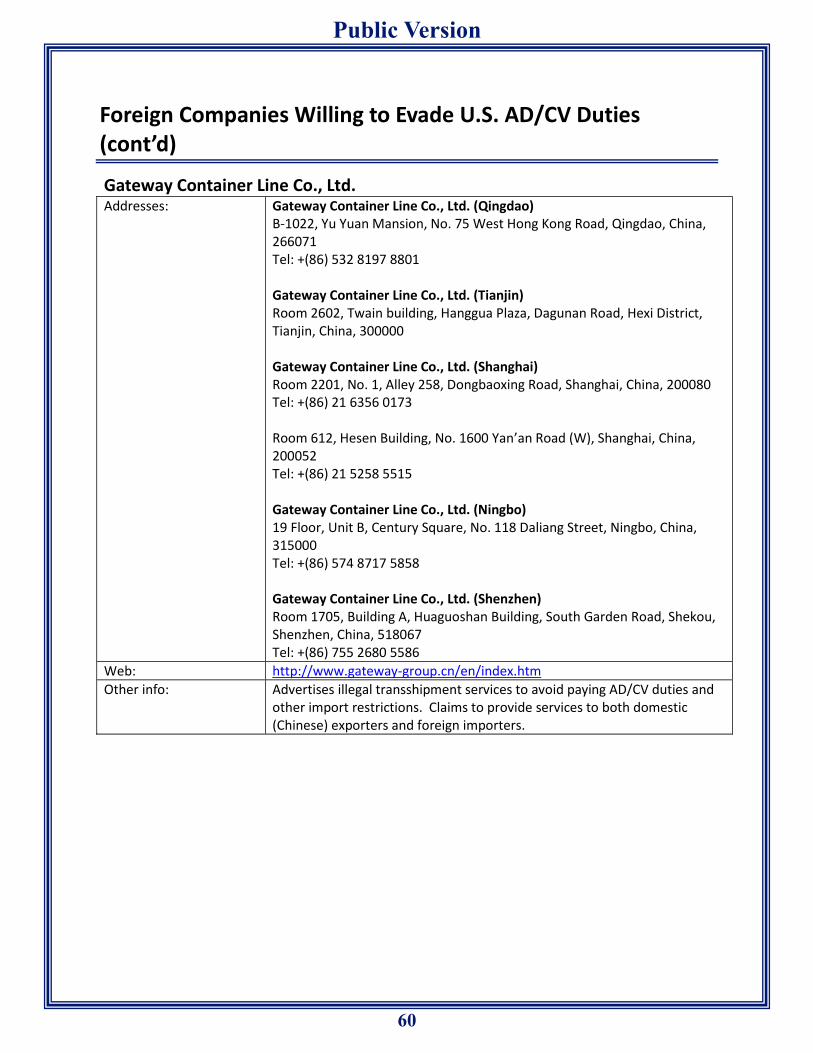
60
Public Version
Foreign Companies Willing to Evade U.S. AD/CV Duties (cont’d)
Gateway Container Line Co., Ltd. Addresses: Gateway Container Line Co., Ltd. (Qingdao)
B-1022, Yu Yuan Mansion, No. 75 West Hong Kong Road, Qingdao, China, 266071 Tel: +(86) 532 8197 8801 Gateway Container Line Co., Ltd. (Tianjin) Room 2602, Twain building, Hanggua Plaza, Dagunan Road, Hexi District, Tianjin, China, 300000 Gateway Container Line Co., Ltd. (Shanghai) Room 2201, No. 1, Alley 258, Dongbaoxing Road, Shanghai, China, 200080 Tel: +(86) 21 6356 0173 Room 612, Hesen Building, No. 1600 Yan’an Road (W), Shanghai, China, 200052 Tel: +(86) 21 5258 5515 Gateway Container Line Co., Ltd. (Ningbo) 19 Floor, Unit B, Century Square, No. 118 Daliang Street, Ningbo, China, 315000 Tel: +(86) 574 8717 5858 Gateway Container Line Co., Ltd. (Shenzhen) Room 1705, Building A, Huaguoshan Building, South Garden Road, Shekou, Shenzhen, China, 518067 Tel: +(86) 755 2680 5586
Web: http://www.gateway-group.cn/en/index.htm
Other info: Advertises illegal transshipment services to avoid paying AD/CV duties and other import restrictions. Claims to provide services to both domestic (Chinese) exporters and foreign importers.
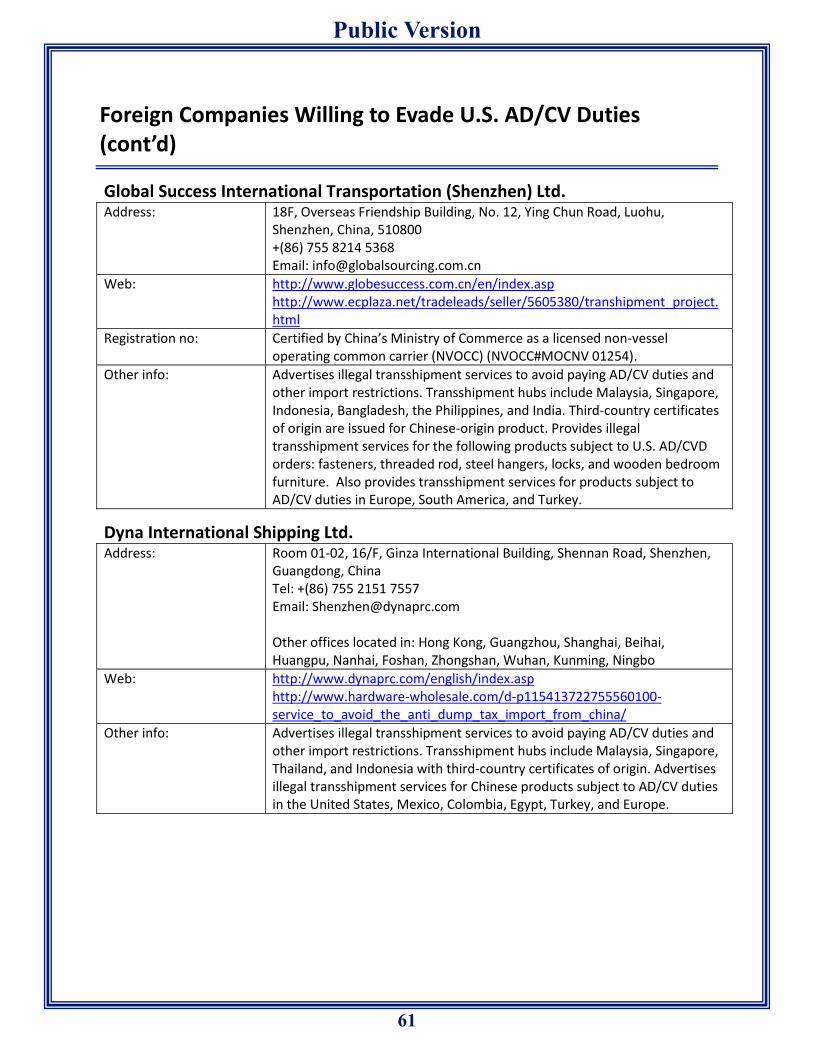
61
Public Version
Foreign Companies Willing to Evade U.S. AD/CV Duties (cont’d)
Global Success International Transportation (Shenzhen) Ltd. Address: 18F, Overseas Friendship Building, No. 12, Ying Chun Road, Luohu,
Shenzhen, China, 510800 +(86) 755 8214 5368 Email: [email protected]
Web: http://www.globesuccess.com.cn/en/index.asp http://www.ecplaza.net/tradeleads/seller/5605380/transhipment_project.html
Registration no: Certified by China’s Ministry of Commerce as a licensed non-vessel operating common carrier (NVOCC) (NVOCC#MOCNV 01254).
Other info: Advertises illegal transshipment services to avoid paying AD/CV duties and other import restrictions. Transshipment hubs include Malaysia, Singapore, Indonesia, Bangladesh, the Philippines, and India. Third-country certificates of origin are issued for Chinese-origin product. Provides illegal transshipment services for the following products subject to U.S. AD/CVD orders: fasteners, threaded rod, steel hangers, locks, and wooden bedroom furniture. Also provides transshipment services for products subject to AD/CV duties in Europe, South America, and Turkey.
Dyna International Shipping Ltd. Address: Room 01-02, 16/F, Ginza International Building, Shennan Road, Shenzhen,
Guangdong, China Tel: +(86) 755 2151 7557 Email: [email protected] Other offices located in: Hong Kong, Guangzhou, Shanghai, Beihai, Huangpu, Nanhai, Foshan, Zhongshan, Wuhan, Kunming, Ningbo
Web: http://www.dynaprc.com/english/index.asp http://www.hardware-wholesale.com/d-p115413722755560100-service_to_avoid_the_anti_dump_tax_import_from_china/
Other info: Advertises illegal transshipment services to avoid paying AD/CV duties and other import restrictions. Transshipment hubs include Malaysia, Singapore, Thailand, and Indonesia with third-country certificates of origin. Advertises illegal transshipment services for Chinese products subject to AD/CV duties in the United States, Mexico, Colombia, Egypt, Turkey, and Europe.
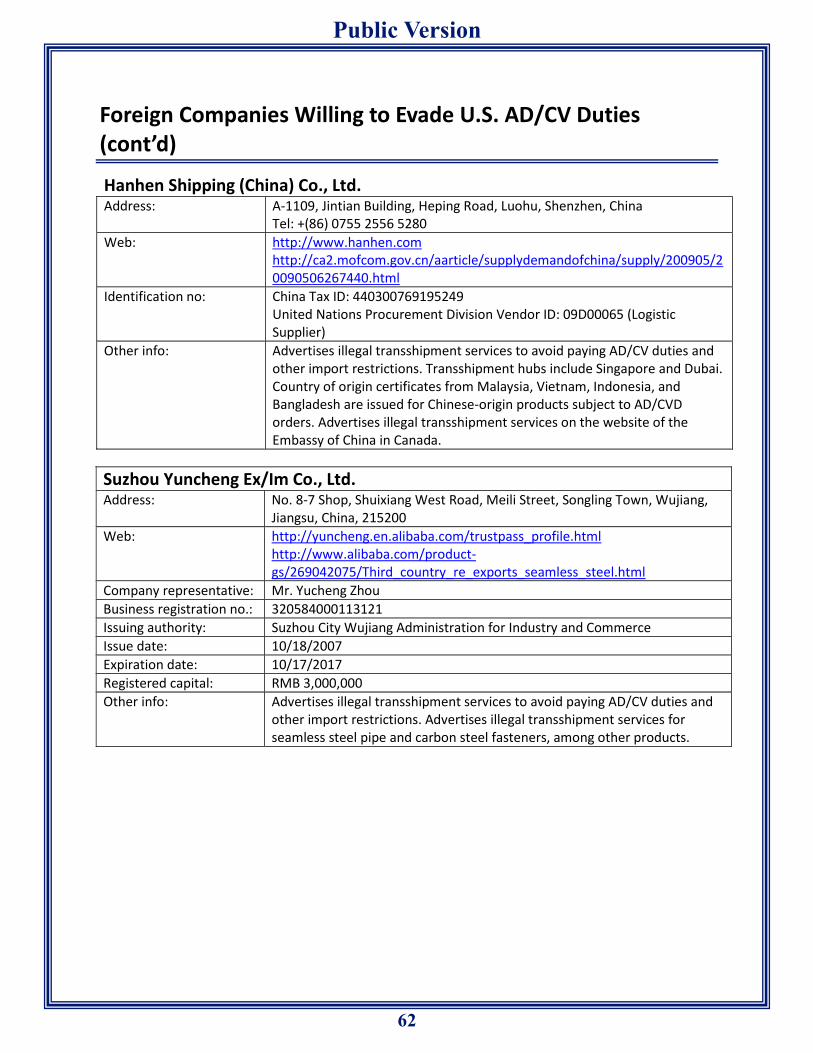
62
Public Version
Foreign Companies Willing to Evade U.S. AD/CV Duties (cont’d)
Hanhen Shipping (China) Co., Ltd. Address: A-1109, Jintian Building, Heping Road, Luohu, Shenzhen, China
Tel: +(86) 0755 2556 5280
Web: http://www.hanhen.com http://ca2.mofcom.gov.cn/aarticle/supplydemandofchina/supply/200905/20090506267440.html
Identification no: China Tax ID: 440300769195249 United Nations Procurement Division Vendor ID: 09D00065 (Logistic Supplier)
Other info: Advertises illegal transshipment services to avoid paying AD/CV duties and other import restrictions. Transshipment hubs include Singapore and Dubai. Country of origin certificates from Malaysia, Vietnam, Indonesia, and Bangladesh are issued for Chinese-origin products subject to AD/CVD orders. Advertises illegal transshipment services on the website of the Embassy of China in Canada.
Suzhou Yuncheng Ex/Im Co., Ltd. Address: No. 8-7 Shop, Shuixiang West Road, Meili Street, Songling Town, Wujiang,
Jiangsu, China, 215200
Web: http://yuncheng.en.alibaba.com/trustpass_profile.html http://www.alibaba.com/product-gs/269042075/Third_country_re_exports_seamless_steel.html
Company representative: Mr. Yucheng Zhou
Business registration no.: 320584000113121
Issuing authority: Suzhou City Wujiang Administration for Industry and Commerce
Issue date: 10/18/2007
Expiration date: 10/17/2017
Registered capital: RMB 3,000,000
Other info: Advertises illegal transshipment services to avoid paying AD/CV duties and other import restrictions. Advertises illegal transshipment services for seamless steel pipe and carbon steel fasteners, among other products.
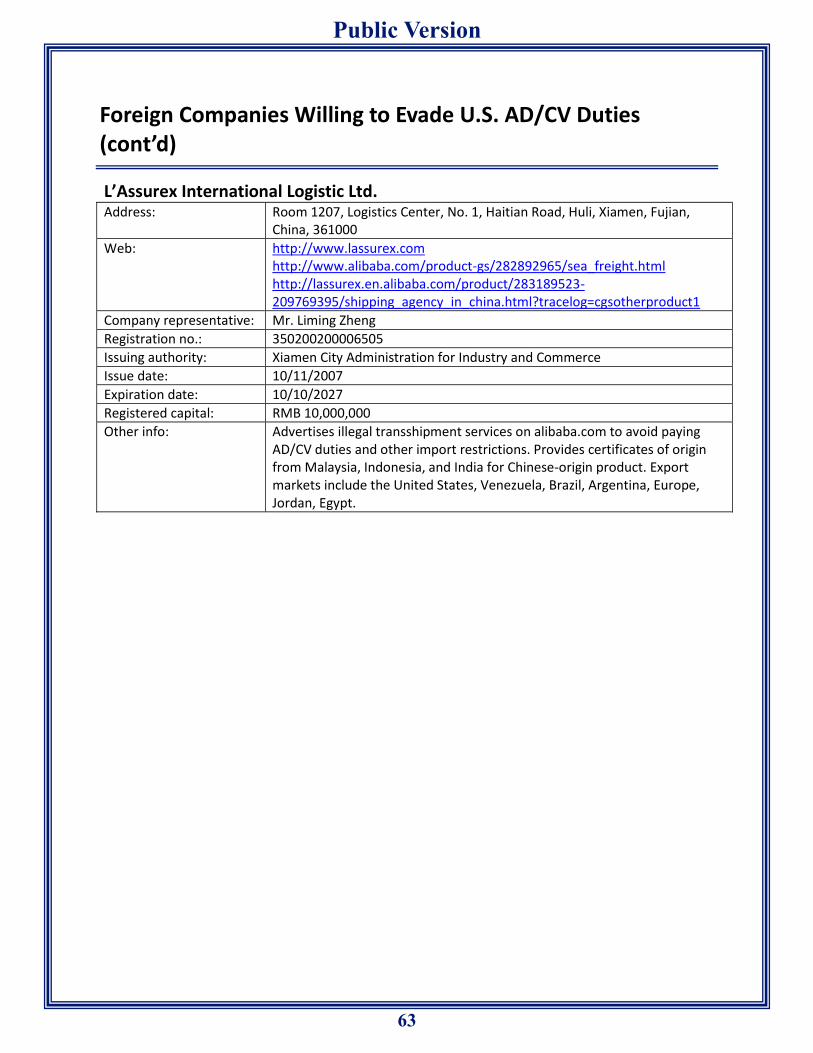
63
Public Version
Foreign Companies Willing to Evade U.S. AD/CV Duties (cont’d)
L’Assurex International Logistic Ltd. Address: Room 1207, Logistics Center, No. 1, Haitian Road, Huli, Xiamen, Fujian,
China, 361000
Web: http://www.lassurex.com http://www.alibaba.com/product-gs/282892965/sea_freight.html http://lassurex.en.alibaba.com/product/283189523-209769395/shipping_agency_in_china.html?tracelog=cgsotherproduct1
Company representative: Mr. Liming Zheng
Registration no.: 350200200006505
Issuing authority: Xiamen City Administration for Industry and Commerce
Issue date: 10/11/2007
Expiration date: 10/10/2027
Registered capital: RMB 10,000,000
Other info: Advertises illegal transshipment services on alibaba.com to avoid paying AD/CV duties and other import restrictions. Provides certificates of origin from Malaysia, Indonesia, and India for Chinese-origin product. Export markets include the United States, Venezuela, Brazil, Argentina, Europe, Jordan, Egypt.

64
Public Version
65
Public Version
Part III: Examples of Companies Advertising Illegal Transshipment Services on the Internet

66
Public Version
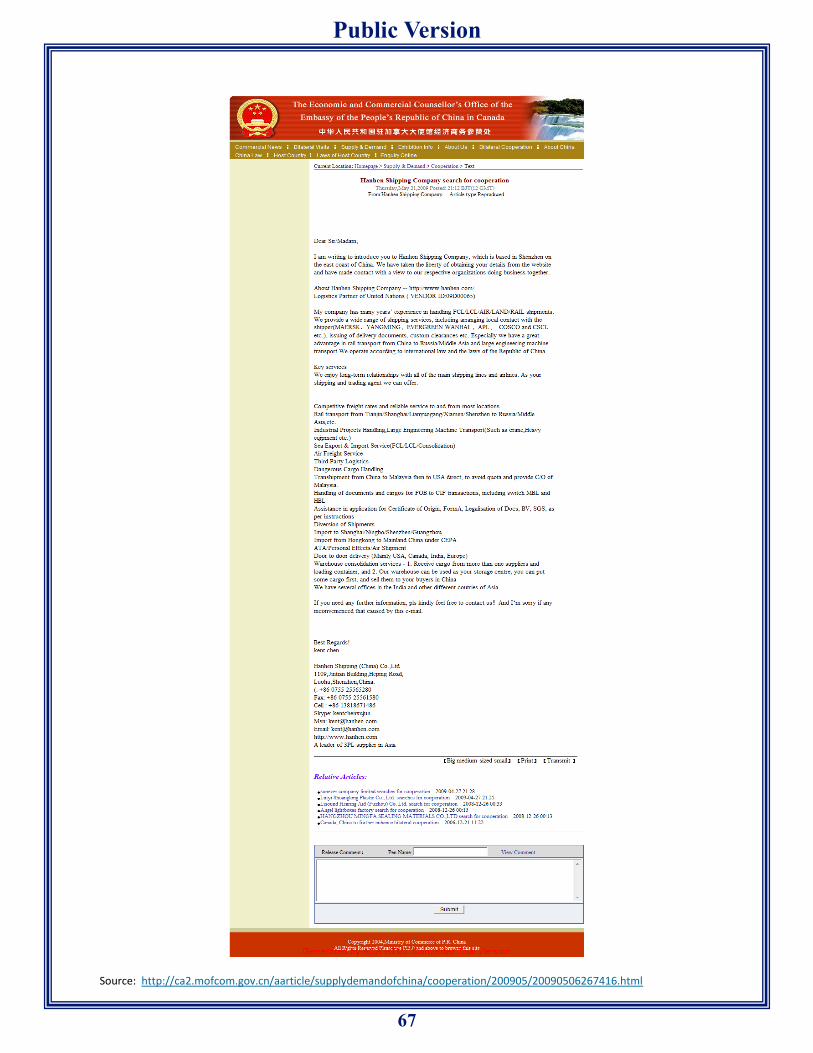
67
Public Version
Source: http://ca2.mofcom.gov.cn/aarticle/supplydemandofchina/cooperation/200905/20090506267416.html
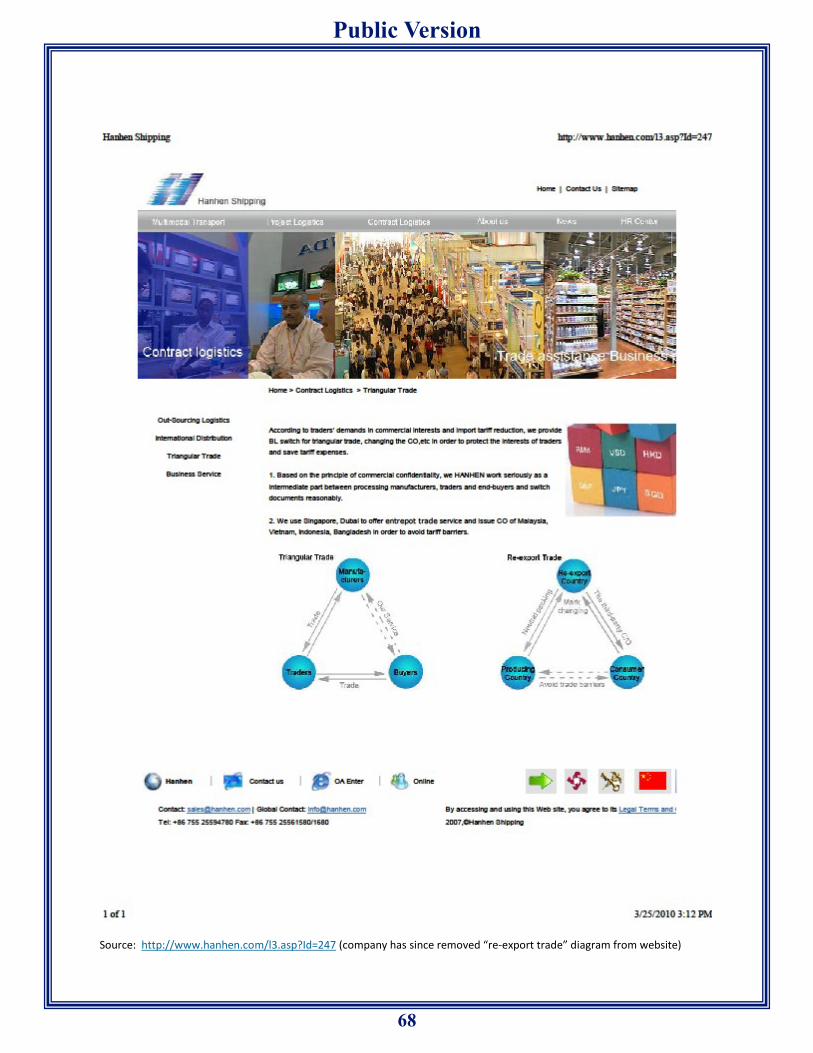
68
Public Version
Source: http://www.hanhen.com/l3.asp?Id=247 (company has since removed “re-export trade” diagram from website)
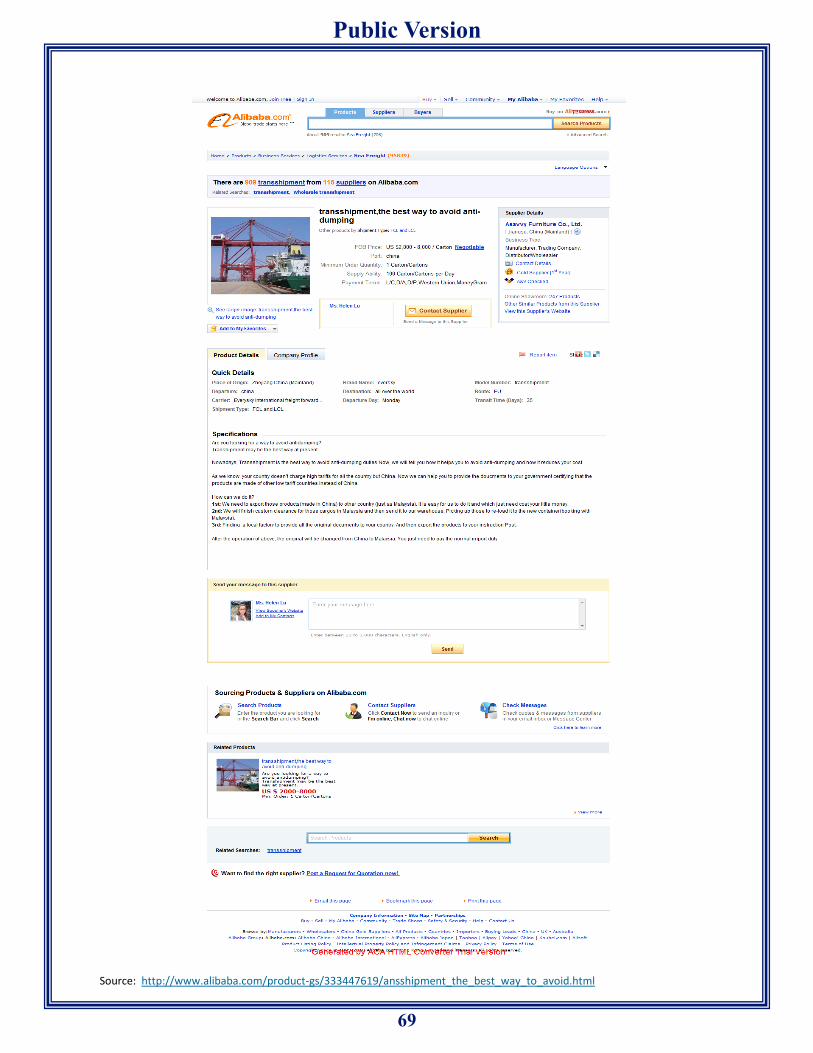
69
Public Version
Source: http://www.alibaba.com/product-gs/333447619/ansshipment_the_best_way_to_avoid.html
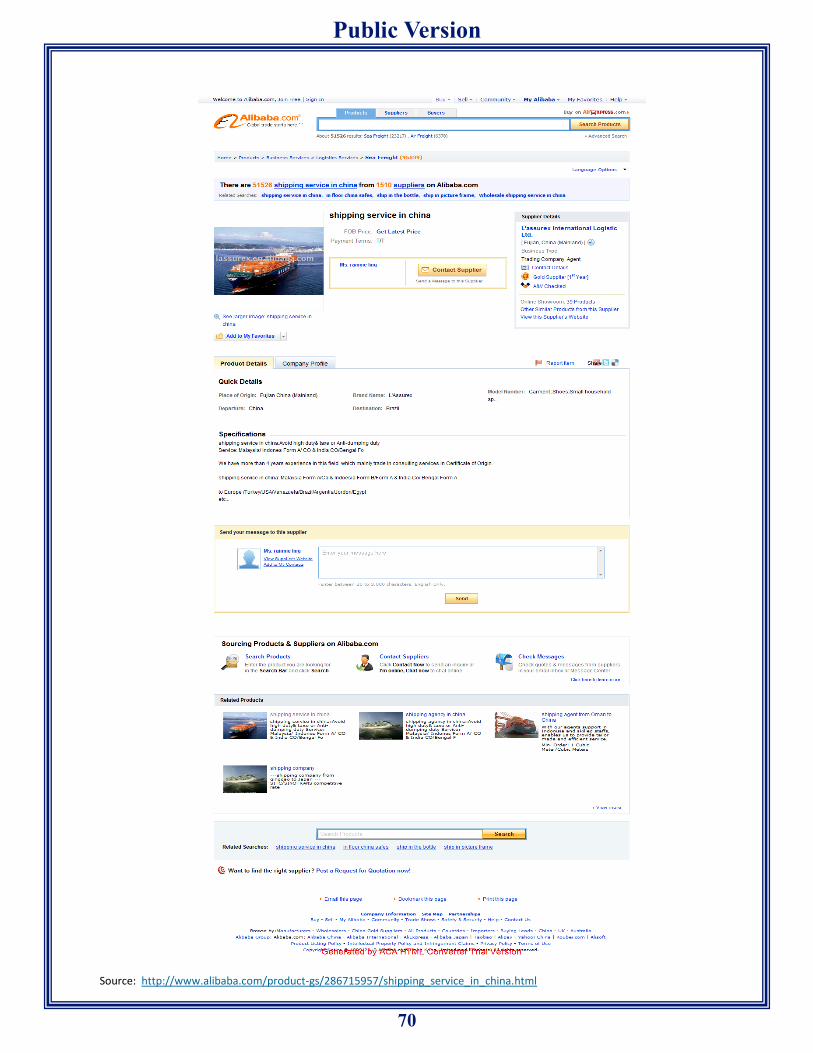
70
Public Version
Source: http://www.alibaba.com/product-gs/286715957/shipping_service_in_china.html
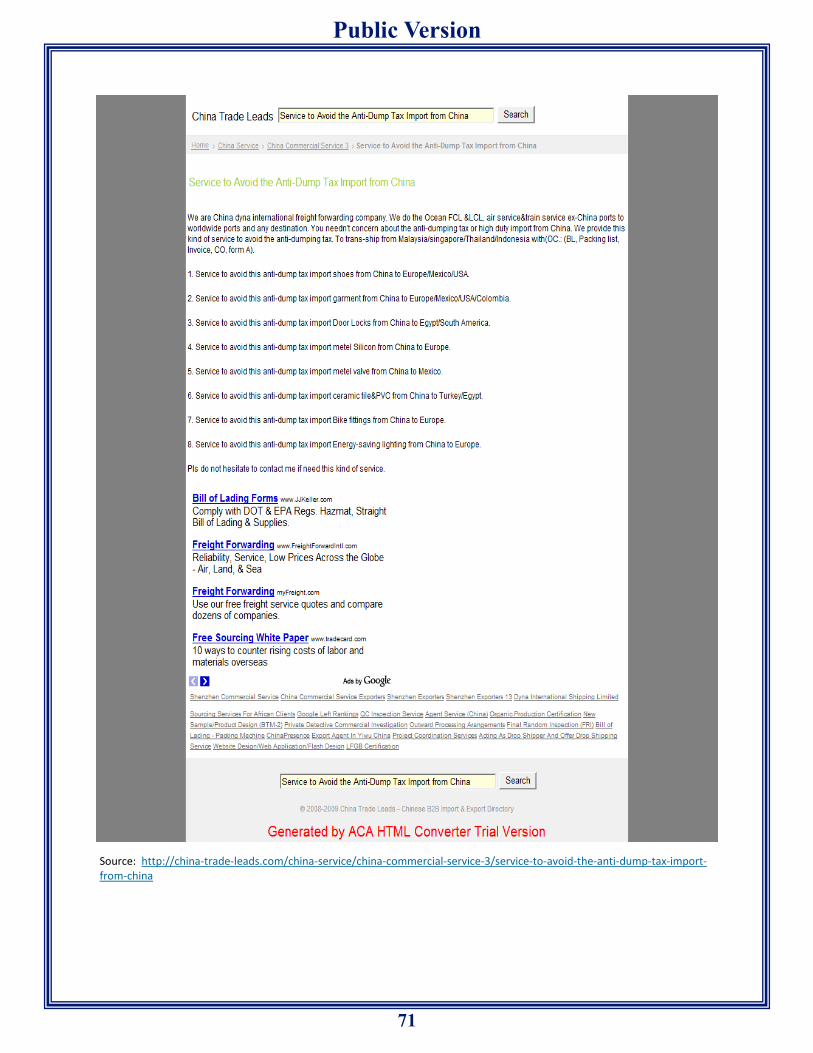
71
Public Version
Source: http://china-trade-leads.com/china-service/china-commercial-service-3/service-to-avoid-the-anti-dump-tax-import-from-china
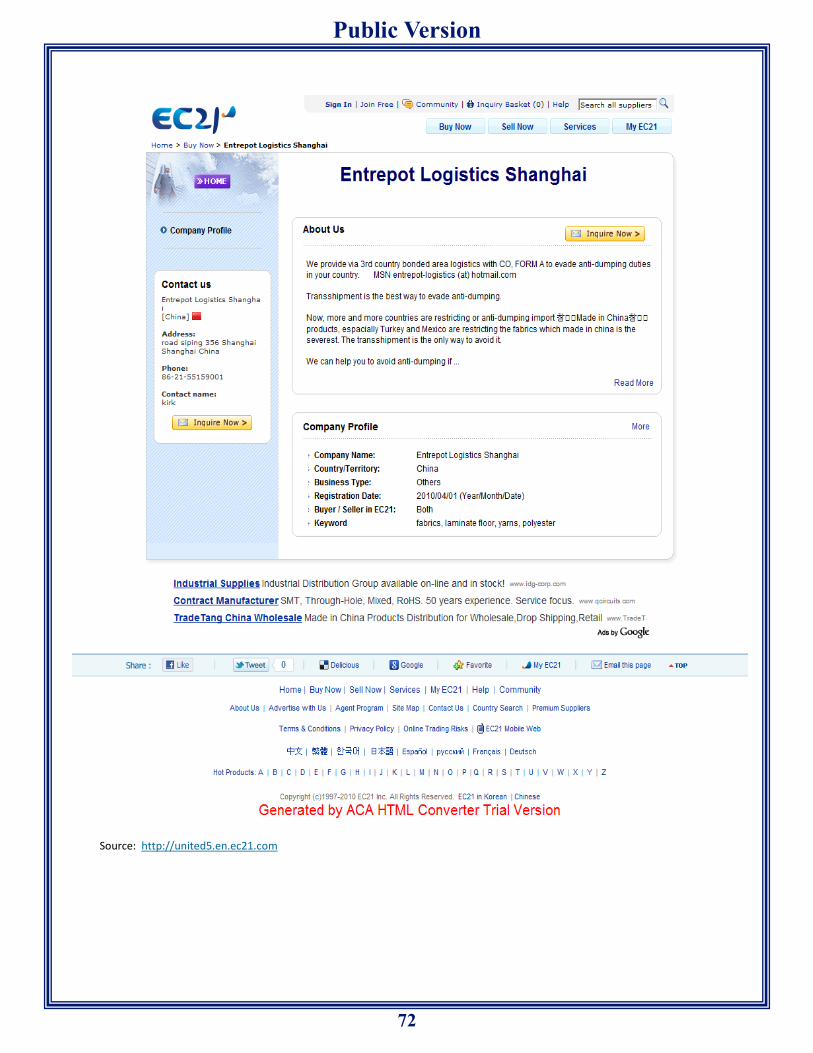
72
Public Version
Source: http://united5.en.ec21.com
73
Public Version
Source: http://nudeal.com/selling-lead/transshipmenthelp-you-avoid-anti-dumping-duties
74
Public Version
Source: http://www.gateway-group.cn/en/related.htm
75
Public Version
Source: http://www.ecplaza.net/tradeleads/seller/5605380/transhipment_project.html
76
Public Version
Source: http://www.made-in-china.com/showroom/realsh
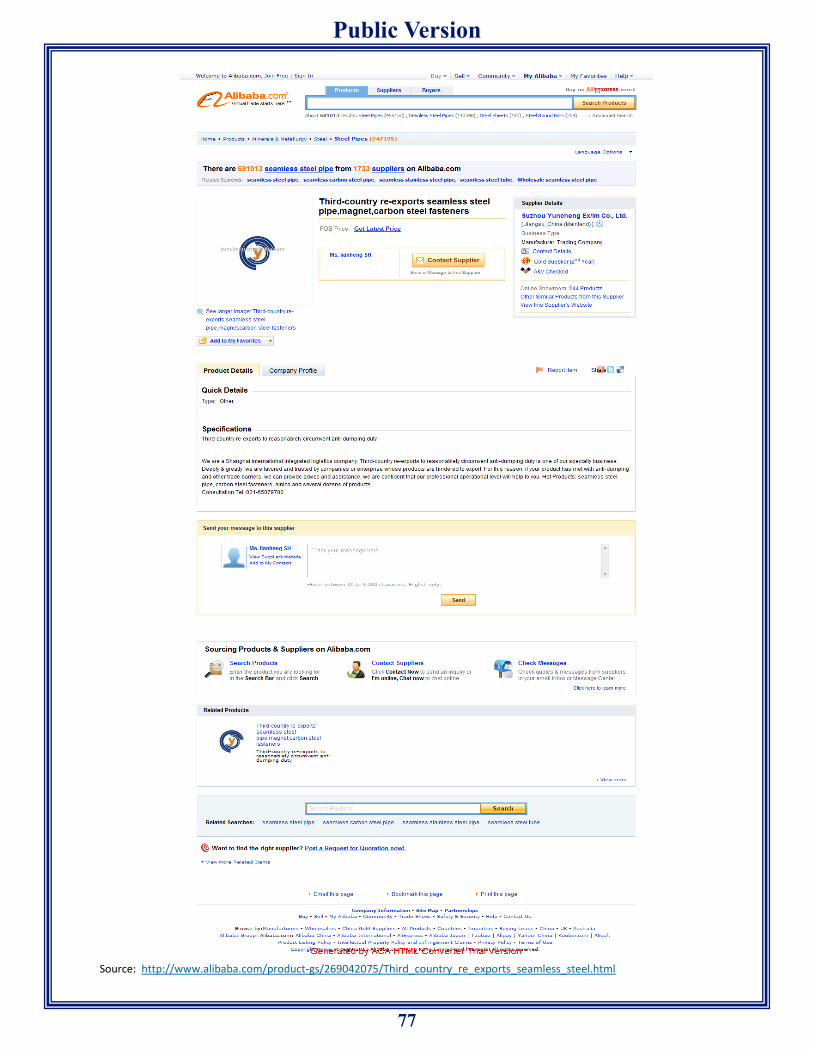
77
Public Version
Source: http://www.alibaba.com/product-gs/269042075/Third_country_re_exports_seamless_steel.html
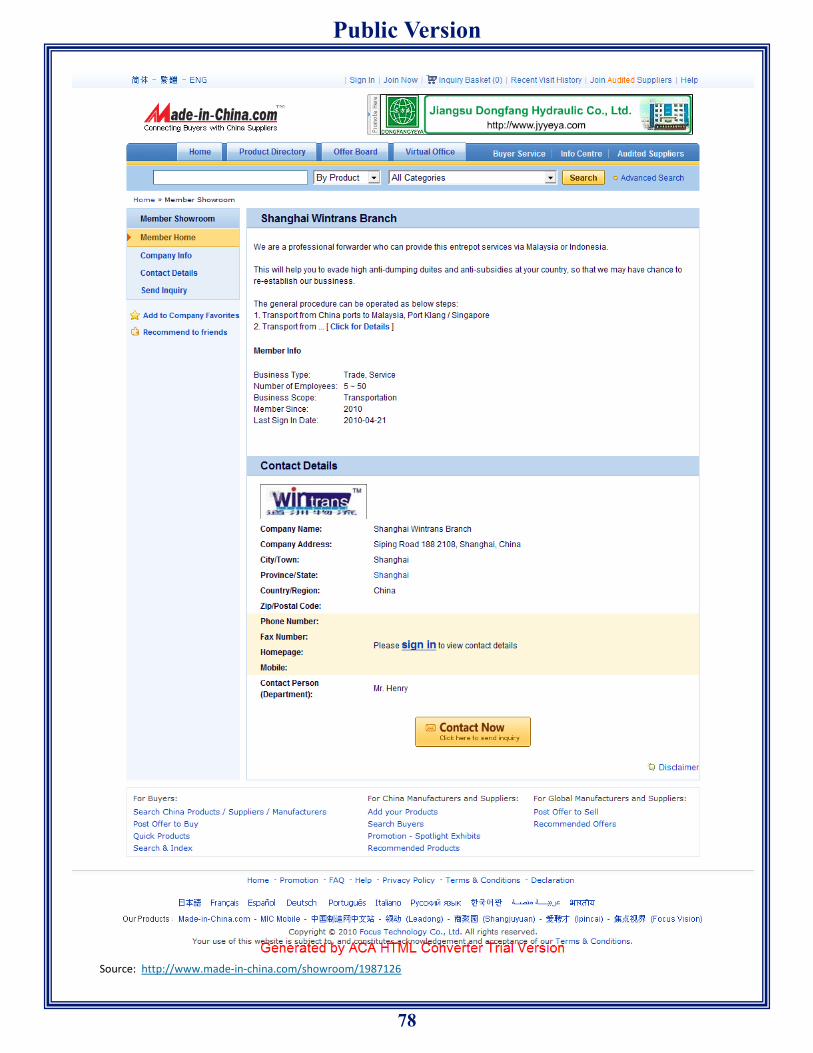
78
Public Version
Source: http://www.made-in-china.com/showroom/1987126
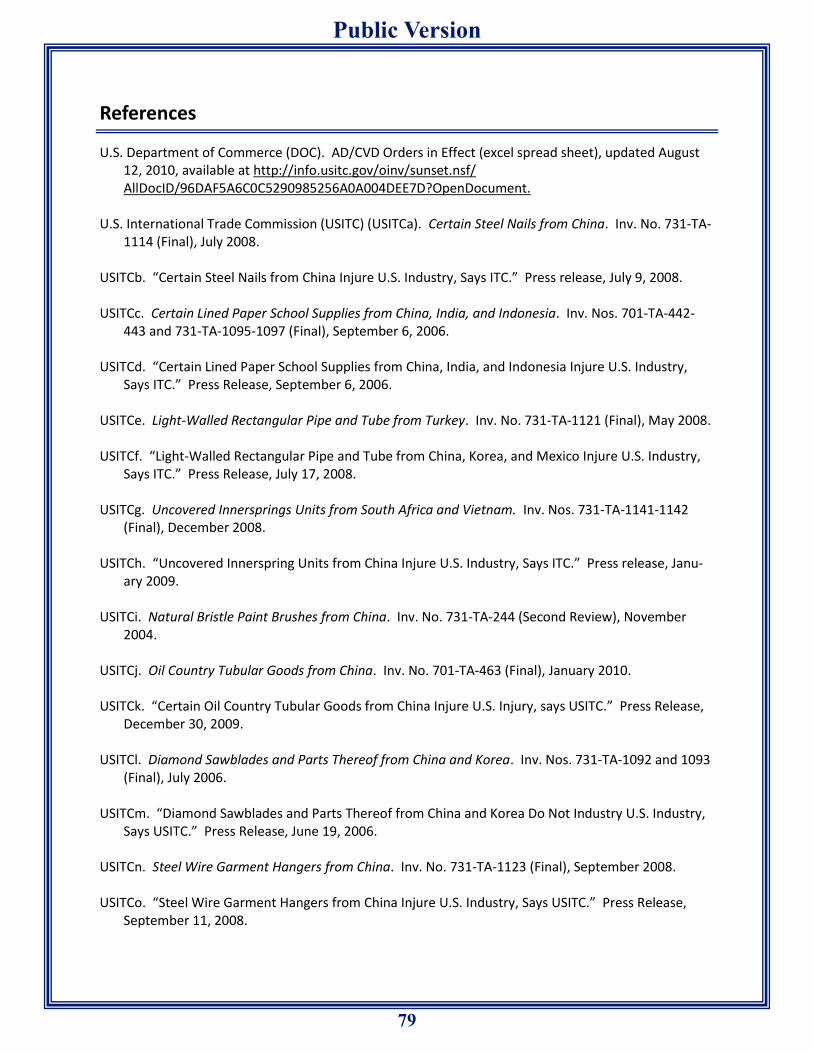
79
Public Version
References U.S. Department of Commerce (DOC). AD/CVD Orders in Effect (excel spread sheet), updated August
12, 2010, available at http://info.usitc.gov/oinv/sunset.nsf/AllDocID/96DAF5A6C0C5290985256A0A004DEE7D?OpenDocument.
U.S. International Trade Commission (USITC) (USITCa). Certain Steel Nails from China. Inv. No. 731-TA-
1114 (Final), July 2008. USITCb. “Certain Steel Nails from China Injure U.S. Industry, Says ITC.” Press release, July 9, 2008. USITCc. Certain Lined Paper School Supplies from China, India, and Indonesia. Inv. Nos. 701-TA-442-
443 and 731-TA-1095-1097 (Final), September 6, 2006. USITCd. “Certain Lined Paper School Supplies from China, India, and Indonesia Injure U.S. Industry,
Says ITC.” Press Release, September 6, 2006. USITCe. Light-Walled Rectangular Pipe and Tube from Turkey. Inv. No. 731-TA-1121 (Final), May 2008. USITCf. “Light-Walled Rectangular Pipe and Tube from China, Korea, and Mexico Injure U.S. Industry,
Says ITC.” Press Release, July 17, 2008. USITCg. Uncovered Innersprings Units from South Africa and Vietnam. Inv. Nos. 731-TA-1141-1142
(Final), December 2008. USITCh. “Uncovered Innerspring Units from China Injure U.S. Industry, Says ITC.” Press release, Janu-
ary 2009. USITCi. Natural Bristle Paint Brushes from China. Inv. No. 731-TA-244 (Second Review), November
2004. USITCj. Oil Country Tubular Goods from China. Inv. No. 701-TA-463 (Final), January 2010. USITCk. “Certain Oil Country Tubular Goods from China Injure U.S. Injury, says USITC.” Press Release,
December 30, 2009. USITCl. Diamond Sawblades and Parts Thereof from China and Korea. Inv. Nos. 731-TA-1092 and 1093
(Final), July 2006. USITCm. “Diamond Sawblades and Parts Thereof from China and Korea Do Not Industry U.S. Industry,
Says USITC.” Press Release, June 19, 2006. USITCn. Steel Wire Garment Hangers from China. Inv. No. 731-TA-1123 (Final), September 2008. USITCo. “Steel Wire Garment Hangers from China Injure U.S. Industry, Says USITC.” Press Release,
September 11, 2008.

80
Public Version
References USITCp. Certain Steel Grating from China. Inv. Nos. 701-TA-465 and 731-TA-1161 (Final), July 2010. USITCq. “Certain Steel Grating from China Injures U.S. Industry, Says USITC.” Press release, June 24,
2010.
Exhibit 2
Daily News Online Edition e-Article
“Local importersto blame for fake Chinese products”
(August 19, 2014)
BEFORE THE TRADE POLICY STAFF COMMITTEE
OFFICE OF THE UNITED STATES TRADE REPRESENTATIVE
AMERICAN WIRE PRODUCERS ASSOCIATION
COMMENTS CONCERNING CHINA'S COMPLIANCE WITH WTO COMMITMENTS
(DOCKET NUMBER USTR-2015-0010)
SEPTEMBER 23, 2015
!(&#%"&&
"/%#, *-0/13'12 3/ $,#-' (/1 (#+' !)*.'2' 01/&4%32
>-8B-84-^= RQUUKDKNKV[ QH TGXGTUKPI HTQO KORQTVU QH EJGCR CPF EQWPVGTHGKV IQQFU HTQO /JKPC NC[U QP EJCPIKPI VJG DGJCXKQWT QH
VJG YC[ NQECN VTCFGTU CTG FQKPI DWUKPGUU#
>JG VTCFGTU! OQUVN[ QYPKPI DTKGHECUG EQORCPKGU! CTG VQ DNCOG HQT VJG EJGCR KORQTVU CPF EQWPVGTHGKV IQQFU HTQO /JKPC#
>JG ]0CKN[ 8GYU^ JCU GUVCDNKUJGF JGTG VJCV HCEVQTKGU KP /JKPC CTG RTQFWEKPI CEEQTFKPI VQ VJG XCTKQWU UVCPFCTFU QH HKPCN
FGUVKPCVKQPU# 3QYGXGT! VJGTG CTG DCEM[CTF OCPWHCEVWTGTU HCOQWU HQT EQWPVGTHGKV RTQFWEVU#
>JGTG CTG FKHHGTGPV NGXGN QH UVCPFCTFU HQT RTQFWEVU VJCV UWKV ?=! 1WTQRGCP! <WUUKC CPF -HTKEC OCTMGVU# .WV! UQOG VTCFGTU! OQUVN[
HTQO -HTKEC! IQ HQT EJGCR UVWHH#
>JG[ NQQM HQT UQOG WPUETWRWNQWU OCPWHCEVWTGTU CPF OCMG QTFGT HQT EJGCR RTQFWEVU CV VJG GZRGPUG QH SWCNKV[# >KCPLKP -DNG
4ORQTV CPF 1ZRQTV >TCFKPI /QORCP[ 7T =VGRJGP 5GVW UCKF DTKGHECUG EQORCP[ VTCFGTU JCXG PQ CDKNKV[ VQ DW[ KP DWNM VJWU GPFKPI
EQNNGEVKPI VJGKT OGTEJCPFKUGU CV DCEM[CTF HCEVQTKGU#
_/JKPC HCEVQTKGU RTQFWEG SWCNKV[ IQQFU! CPF GXGP CEEQTFKPI VQ DW[GT^U URGEKHKECVKQP DWV OQUV VJGUG EQORCPKGU FQ PQV JCXG VJG
CDKNKV[ VQ QTFGT C EQPVCKPGT HWNN QH IQQFU!` 7T 5GVW UCKF#
7T 5GVW! C 2JCPCKCP! JCU DGGP KP KORQTV CPF GZRQTV DWUKPGUU HQT %) [GCTU! QRGTCVKPI HTQO .GKLKPI CPF >KCPLKCP UGTXKPI C
PWODGT QH ENKGPVU HTQO -HTKEC#
_/JKPC RTQFWEG HQT VJG HKTUV YQTNF YJ[ HCMG CTG ENQIIKPI -HTKEC, 4U KV DGECWUG VTCFGTU CTG DW[KPI IQQFU UQOGVKOG UWKVCDNG HQT
NQECN OCTMGVU CPF PQV -HTKEC,` JG SWGGTGF#
-EEQTFKPI VQ JKO! VJG DGUV RTCEVKEG KU HQT VTCFGTU VQ LQKP JCPFU CPF RWV VQIGVJGT VJGKT QTFGTU CPF DG CDNG VQ RTQEWTG KP DWNM UQ
VJCV VJG[ JCXG VJG CDKNKV[ VQ EQPVTQN SWCNKV[ CPF RTKEG CU YGNN#
/JKPC^U 7KPKUVT[ QH /QOOGTEG! 0GRCTVOGPV QH @GUV -UKCP CPF -HTKECP -HHCKTU! 0GRWV[ 0KTGEVQT! 7T /JGP 3CQ UCKF .GKLKPI
QDUGTXGU C \GTQ VQNGTCPEG QP KNNGICN CPF EQWPVGTHGKV GZRQTVU VQ >CP\CPKC KP UCHGIWCTFKPI EQPUWOGTU^ TKIJV# _>JGTG CTG UQOG
RTQDNGOU! YG JCXG VQ CFOKV CPF HCEG KV!` 7T /JGP UCKF GCTNKGT#
_- UOCNN PWODGT QH RGQRNG CTG OCPWHCEVWTKPI UWDUVCPFCTF CPF KNNGICN RTQFWEVU HQT GZRQTV CPF UQOG CTG UQNF CV /JKPC OCTMGV CU
YGNN#`
4P QTFGT VQ IWCTCPVGG SWCNKV[ QH IQQFU! JG UCKF! KP &$%& CPF &$%' JKU OKPKUVT[ QTICPKUGF URGEKCN ECORCKIPU VQ ETCEM"FQYP CPF
TQQV"QWV KNNGICN CPF UWDUVCPFCTF GZRQTVU QH IQQFU HTQO /JKPC VQ -HTKEC# >JKU KPXQNXGF OWNVKRNG OGCUWTGU! UWEJ CU RTKQT"VQ"
UJKRRKPI SWCNKV[ GZCOKPCVKQP HQT KPFWUVTKCN RTQFWEVU VJCV YGTG FGUVKPGF VQ -HTKEC#
>JG ECORCKIPU KPXQNXGF VJG RCTVKEKRCVKQP QH VJG OKPKUVT[ QH EQOOGTEG! DWTGCW QH SWCNKV[ KPURGEVKQP! EWUVQOU CFOKPKUVTCVKQP CPF
NQECN IQXGTPOGPVU#
>JG ECORCKIP! JG UCKF! UJQWNF PQV DG HQT /JKPC CNQPG DWV CNUQ HQT -HTKECP UVCVGU VQ KORTQXG VJGKT RQKPV QH GPVT[ KPURGEVKQPU QP
SWCNKV[ CPF UVCPFCTFU# 3G UCKF C ITQWR QH WPGVJKECN VTCFGTU UJQWNF PQV NGHV VQ VCMG EQPUWOGTU HQT C TKFG D[ UWRRN[KPI VJGO EJGCR
=KIP ?R VQ UGG YJCV [QWT HTKGPFU NKMG#$,-* &+).*
'0**/ $
$
0GVCKNU 9WDNKUJGF QP >WGUFC[! %* -WIWUV &$%( $$+(* @TKVVGP D[ -.0?16 1648-B- KP .GKLKPI!/JKPC
3KVU+ ((%
34;8 % B9 &.4=?J18HE 2A?=A8 /7=F=BA ! 0B64? =@CBDF8DE FB 5?4@8 9BD 94>8 -<=A8E8 CDB7G6FE
+#%$#&$%(<FFC,##HHH"74=?JA8HE"6B"FK#=A78I"C<C#5=K#')$%*!?B64?!=@CBDF8DE!FB!5?4@8!9BD!94>8!6<=A8E8!CDB7G"""
CPF UWDUVCPFCTF IQQFU UJKRRGF HTQO /JKPC#
_>JKU UJQWNF DG VJG TGURQPUKDKNKV[ HQT DQVJ /JKPC CPF -HTKEC CU OQUV -HTKECP EQWPVTKGU JCXG TGRTGUGPVCVKXGU KP 2WCPI\JQW CPF
AKYW# 6GV^U TGIWNCVG VJG OCTMGV D[ VJG TWNG QH VJG OCTMGT!` JG UCKF#
1CTN[ VJKU [GCT /JKPC CODCUUCFQT VQ >CP\CPKC UCKF QYPGTU QH EQORCPKGU QRGTCVKPI KP VJG EQWPVT[ VJCV CTG HQWPF VQ DG KORQTVGF
UWDUVCPFCTF IQQFU YQWNF PQV DG IKXGP XKUC VQ /JKPC CU OGCUWTGU VQ HKIJV VJG XKEG#
DNQI EQOOGPVU RQYGTGF D[ 04=;?= DCEM VQ VQR
34;8 & B9 &.4=?J18HE 2A?=A8 /7=F=BA ! 0B64? =@CBDF8DE FB 5?4@8 9BD 94>8 -<=A8E8 CDB7G6FE
+#%$#&$%(<FFC,##HHH"74=?JA8HE"6B"FK#=A78I"C<C#5=K#')$%*!?B64?!=@CBDF8DE!FB!5?4@8!9BD!94>8!6<=A8E8!CDB7G"""
Exhibit 3
U.S. Importsof
Steel Wire, Wire Products,and Wire Rod from China
Calendar Years 2001—2014
BEFORE THE TRADE POLICY STAFF COMMITTEE
OFFICE OF THE UNITED STATES TRADE REPRESENTATIVE
AMERICAN WIRE PRODUCERS ASSOCIATION
COMMENTS CONCERNING CHINA'S COMPLIANCE WITH WTO COMMITMENTS
(DOCKET NUMBER USTR-2015-0010)
SEPTEMBER 23, 2015
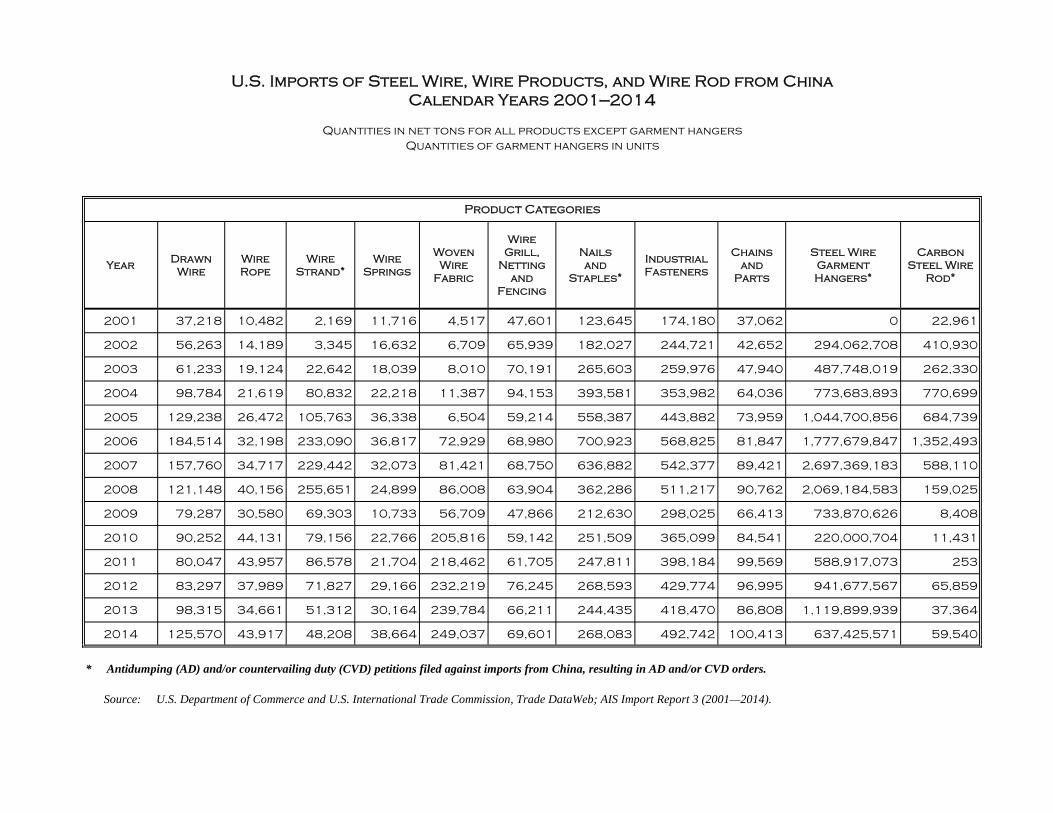
YearDrawn
WireWireRope
WireStrand*
WireSprings
WovenWire
Fabric
WireGrill,
Nettingand
Fencing
Nailsand
Staples*
IndustrialFasteners
Chainsand
Parts
Steel WireGarmentHangers*
CarbonSteel Wire
Rod*
2001 37,218 10,482 2,169 11,716 4,517 47,601 123,645 174,180 37,062 0 22,961
2002 56,263 14,189 3,345 16,632 6,709 65,939 182,027 244,721 42,652 294,062,708 410,930
2003 61,233 19,124 22,642 18,039 8,010 70,191 265,603 259,976 47,940 487,748,019 262,330
2004 98,784 21,619 80,832 22,218 11,387 94,153 393,581 353,982 64,036 773,683,893 770,699
2005 129,238 26,472 105,763 36,338 6,504 59,214 558,387 443,882 73,959 1,044,700,856 684,739
2006 184,514 32,198 233,090 36,817 72,929 68,980 700,923 568,825 81,847 1,777,679,847 1,352,493
2007 157,760 34,717 229,442 32,073 81,421 68,750 636,882 542,377 89,421 2,697,369,183 588,110
2008 121,148 40,156 255,651 24,899 86,008 63,904 362,286 511,217 90,762 2,069,184,583 159,025
2009 79,287 30,580 69,303 10,733 56,709 47,866 212,630 298,025 66,413 733,870,626 8,408
2010 90,252 44,131 79,156 22,766 205,816 59,142 251,509 365,099 84,541 220,000,704 11,431
2011 80,047 43,957 86,578 21,704 218,462 61,705 247,811 398,184 99,569 588,917,073 253
2012 83,297 37,989 71,827 29,166 232,219 76,245 268,593 429,774 96,995 941,677,567 65,859
2013 98,315 34,661 51,312 30,164 239,784 66,211 244,435 418,470 86,808 1,119,899,939 37,364
2014 125,570 43,917 48,208 38,664 249,037 69,601 268,083 492,742 100,413 637,425,571 59,540
* Antidumping (AD) and/or countervailing duty (CVD) petitions filed against imports from China, resulting in AD and/or CVD orders.
Source: U.S. Department of Commerce and U.S. International Trade Commission, Trade DataWeb; AIS Import Report 3 (2001—2014).
Product Categories
U.S. Imports of Steel Wire, Wire Products, and Wire Rod from ChinaCalendar Years 2001—2014
Quantities in net tons for all products except garment hangers
Quantities of garment hangers in units
Exhibit 4
EPI Briefing Paper
“The China Toll”
by
Robert E. Scott(AUGUST 23, 2012)
BEFORE THE TRADE POLICY STAFF COMMITTEE
OFFICE OF THE UNITED STATES TRADE REPRESENTATIVE
AMERICAN WIRE PRODUCERS ASSOCIATION
COMMENTS CONCERNING CHINA'S COMPLIANCE WITH WTO COMMITMENTS
(DOCKET NUMBER USTR-2015-0010)
SEPTEMBER 23, 2015
EPI BRIEFING PAPERE C O N O M I C P O L I C Y I N S T I T U T E • A U G U S T 2 3 , 2 0 1 2 • B R I E F I N G P A P E R # 3 4 5
THE CHINA TOLLGrowing U.S. trade deficit with China
cost more than 2.7 million jobsbetween 2001 and 2011, with job
losses in every stateB Y R O B E R T E . S C O T T
S ince China entered the World Trade Organization
in 2001, the extraordinary growth of trade
between China and the United States has had a
dramatic effect on U.S. workers and the domestic eco-
nomy, though in neither case has this effect been benefi-
cial. The United States is piling up foreign debt and losing
export capacity, and the growing trade deficit with China
has been a prime contributor to the crisis in U.S. manu-
facturing employment. Between 2001 and 2011, the
trade deficit with China eliminated or displaced more
than 2.7 million U.S. jobs, over 2.1 million of which
(76.9 percent) were in manufacturing. These lost manu-
facturing jobs account for more than half of all U.S. man-
ufacturing jobs lost or displaced between 2001 and 2011.
The more than 2.7 million jobs lost or displaced in all
sectors include 662,100 jobs from 2008 to 2011
alone—even though imports from China and the rest of
the world plunged in 2009. (Imports from China have
since recovered and surpassed their peak of 2008.) The
growing trade deficit with China has cost jobs in all 50
states and the District of Columbia and Puerto Rico, as
well as in each congressional district.
Among specific industries, the trade deficit in the com-
puter and electronic products industry grew the most,
and 1,064,800 jobs were displaced, 38.8 percent of the
2001–2011 total. As a result, many of the hardest-hit
congressional districts were in California, Texas, Oregon,
Massachusetts, Colorado, and Minnesota, where jobs in
that industry are concentrated. Some districts in North
Carolina, Georgia, and Alabama were also especially hard-
hit by job displacement in a variety of manufacturing
industries, including computers and electronic products,
textiles and apparel, and furniture.
ECONOMIC POLICY INSTITUTE • 1333 H STREET, NW • SUITE 300, EAST TOWER • WASHINGTON, DC 20005 • 202.775.8810 • WWW.EPI.ORG
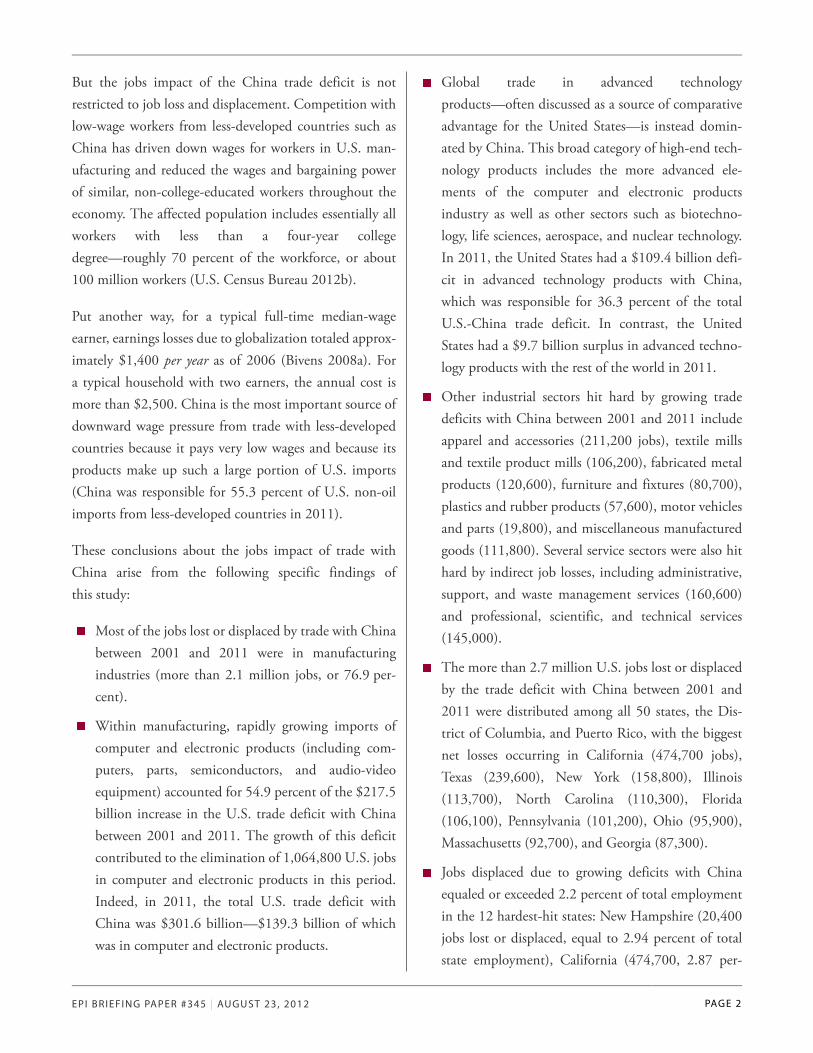
But the jobs impact of the China trade deficit is not
restricted to job loss and displacement. Competition with
low-wage workers from less-developed countries such as
China has driven down wages for workers in U.S. man-
ufacturing and reduced the wages and bargaining power
of similar, non-college-educated workers throughout the
economy. The affected population includes essentially all
workers with less than a four-year college
degree—roughly 70 percent of the workforce, or about
100 million workers (U.S. Census Bureau 2012b).
Put another way, for a typical full-time median-wage
earner, earnings losses due to globalization totaled approx-
imately $1,400 per year as of 2006 (Bivens 2008a). For
a typical household with two earners, the annual cost is
more than $2,500. China is the most important source of
downward wage pressure from trade with less-developed
countries because it pays very low wages and because its
products make up such a large portion of U.S. imports
(China was responsible for 55.3 percent of U.S. non-oil
imports from less-developed countries in 2011).
These conclusions about the jobs impact of trade with
China arise from the following specific findings of
this study:
Most of the jobs lost or displaced by trade with China
between 2001 and 2011 were in manufacturing
industries (more than 2.1 million jobs, or 76.9 per-
cent).
Within manufacturing, rapidly growing imports of
computer and electronic products (including com-
puters, parts, semiconductors, and audio-video
equipment) accounted for 54.9 percent of the $217.5
billion increase in the U.S. trade deficit with China
between 2001 and 2011. The growth of this deficit
contributed to the elimination of 1,064,800 U.S. jobs
in computer and electronic products in this period.
Indeed, in 2011, the total U.S. trade deficit with
China was $301.6 billion—$139.3 billion of which
was in computer and electronic products.
Global trade in advanced technology
products—often discussed as a source of comparative
advantage for the United States—is instead domin-
ated by China. This broad category of high-end tech-
nology products includes the more advanced ele-
ments of the computer and electronic products
industry as well as other sectors such as biotechno-
logy, life sciences, aerospace, and nuclear technology.
In 2011, the United States had a $109.4 billion defi-
cit in advanced technology products with China,
which was responsible for 36.3 percent of the total
U.S.-China trade deficit. In contrast, the United
States had a $9.7 billion surplus in advanced techno-
logy products with the rest of the world in 2011.
Other industrial sectors hit hard by growing trade
deficits with China between 2001 and 2011 include
apparel and accessories (211,200 jobs), textile mills
and textile product mills (106,200), fabricated metal
products (120,600), furniture and fixtures (80,700),
plastics and rubber products (57,600), motor vehicles
and parts (19,800), and miscellaneous manufactured
goods (111,800). Several service sectors were also hit
hard by indirect job losses, including administrative,
support, and waste management services (160,600)
and professional, scientific, and technical services
(145,000).
The more than 2.7 million U.S. jobs lost or displaced
by the trade deficit with China between 2001 and
2011 were distributed among all 50 states, the Dis-
trict of Columbia, and Puerto Rico, with the biggest
net losses occurring in California (474,700 jobs),
Texas (239,600), New York (158,800), Illinois
(113,700), North Carolina (110,300), Florida
(106,100), Pennsylvania (101,200), Ohio (95,900),
Massachusetts (92,700), and Georgia (87,300).
Jobs displaced due to growing deficits with China
equaled or exceeded 2.2 percent of total employment
in the 12 hardest-hit states: New Hampshire (20,400
jobs lost or displaced, equal to 2.94 percent of total
state employment), California (474,700, 2.87 per-
EPI BRIEFING PAPER #345 | AUGUST 23, 2012 PAGE 2
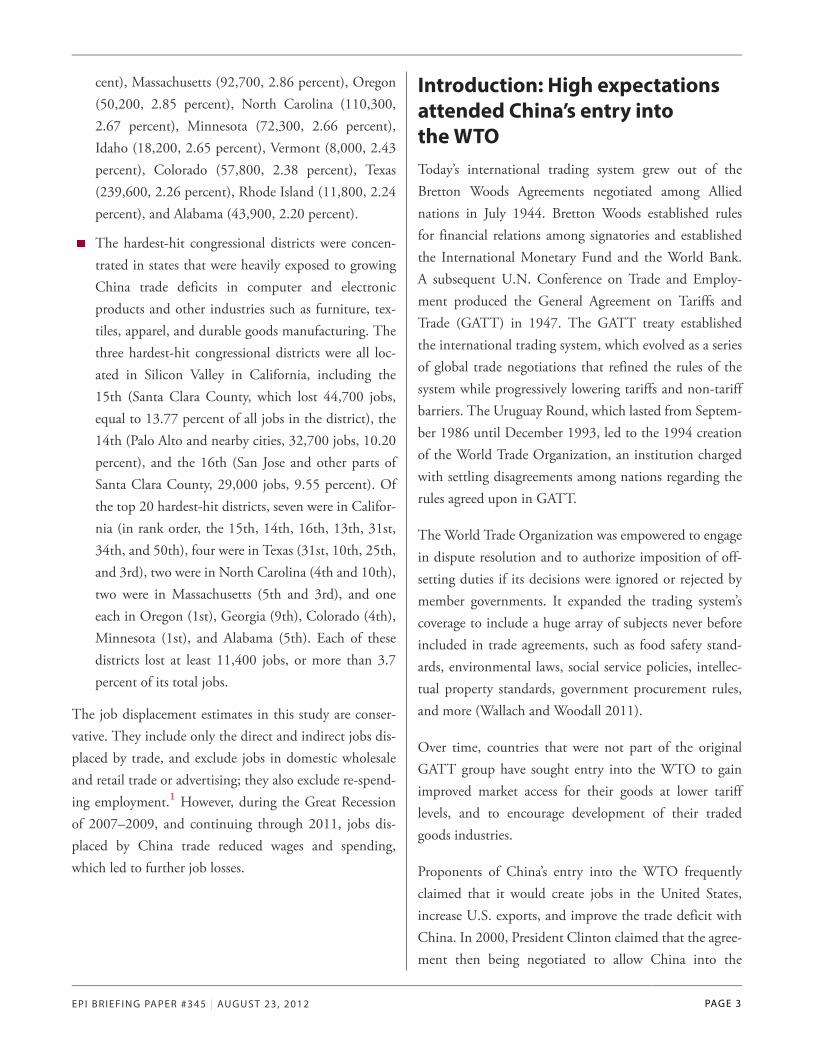
cent), Massachusetts (92,700, 2.86 percent), Oregon
(50,200, 2.85 percent), North Carolina (110,300,
2.67 percent), Minnesota (72,300, 2.66 percent),
Idaho (18,200, 2.65 percent), Vermont (8,000, 2.43
percent), Colorado (57,800, 2.38 percent), Texas
(239,600, 2.26 percent), Rhode Island (11,800, 2.24
percent), and Alabama (43,900, 2.20 percent).
The hardest-hit congressional districts were concen-
trated in states that were heavily exposed to growing
China trade deficits in computer and electronic
products and other industries such as furniture, tex-
tiles, apparel, and durable goods manufacturing. The
three hardest-hit congressional districts were all loc-
ated in Silicon Valley in California, including the
15th (Santa Clara County, which lost 44,700 jobs,
equal to 13.77 percent of all jobs in the district), the
14th (Palo Alto and nearby cities, 32,700 jobs, 10.20
percent), and the 16th (San Jose and other parts of
Santa Clara County, 29,000 jobs, 9.55 percent). Of
the top 20 hardest-hit districts, seven were in Califor-
nia (in rank order, the 15th, 14th, 16th, 13th, 31st,
34th, and 50th), four were in Texas (31st, 10th, 25th,
and 3rd), two were in North Carolina (4th and 10th),
two were in Massachusetts (5th and 3rd), and one
each in Oregon (1st), Georgia (9th), Colorado (4th),
Minnesota (1st), and Alabama (5th). Each of these
districts lost at least 11,400 jobs, or more than 3.7
percent of its total jobs.
The job displacement estimates in this study are conser-
vative. They include only the direct and indirect jobs dis-
placed by trade, and exclude jobs in domestic wholesale
and retail trade or advertising; they also exclude re-spend-
ing employment.1 However, during the Great Recession
of 2007–2009, and continuing through 2011, jobs dis-
placed by China trade reduced wages and spending,
which led to further job losses.
Introduction: High expectationsattended China’s entry intothe WTO
Today’s international trading system grew out of the
Bretton Woods Agreements negotiated among Allied
nations in July 1944. Bretton Woods established rules
for financial relations among signatories and established
the International Monetary Fund and the World Bank.
A subsequent U.N. Conference on Trade and Employ-
ment produced the General Agreement on Tariffs and
Trade (GATT) in 1947. The GATT treaty established
the international trading system, which evolved as a series
of global trade negotiations that refined the rules of the
system while progressively lowering tariffs and non-tariff
barriers. The Uruguay Round, which lasted from Septem-
ber 1986 until December 1993, led to the 1994 creation
of the World Trade Organization, an institution charged
with settling disagreements among nations regarding the
rules agreed upon in GATT.
The World Trade Organization was empowered to engage
in dispute resolution and to authorize imposition of off-
setting duties if its decisions were ignored or rejected by
member governments. It expanded the trading system’s
coverage to include a huge array of subjects never before
included in trade agreements, such as food safety stand-
ards, environmental laws, social service policies, intellec-
tual property standards, government procurement rules,
and more (Wallach and Woodall 2011).
Over time, countries that were not part of the original
GATT group have sought entry into the WTO to gain
improved market access for their goods at lower tariff
levels, and to encourage development of their traded
goods industries.
Proponents of China’s entry into the WTO frequently
claimed that it would create jobs in the United States,
increase U.S. exports, and improve the trade deficit with
China. In 2000, President Clinton claimed that the agree-
ment then being negotiated to allow China into the
EPI BRIEFING PAPER #345 | AUGUST 23, 2012 PAGE 3
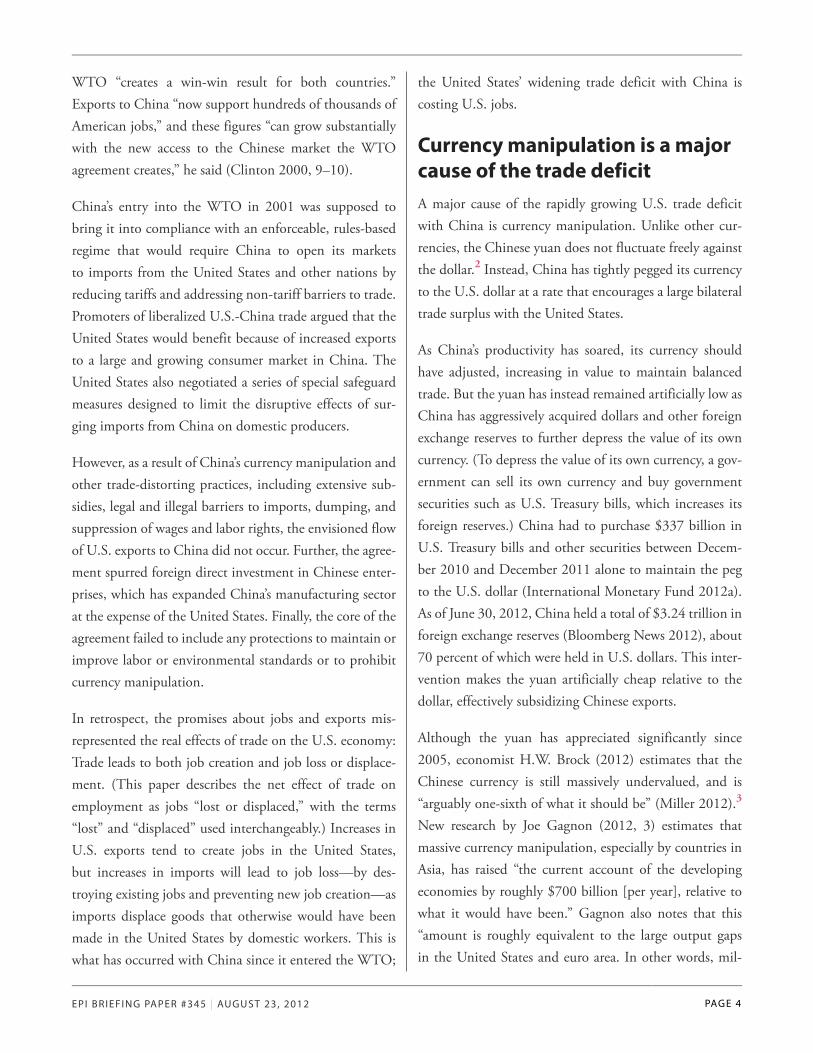
WTO “creates a win-win result for both countries.”
Exports to China “now support hundreds of thousands of
American jobs,” and these figures “can grow substantially
with the new access to the Chinese market the WTO
agreement creates,” he said (Clinton 2000, 9–10).
China’s entry into the WTO in 2001 was supposed to
bring it into compliance with an enforceable, rules-based
regime that would require China to open its markets
to imports from the United States and other nations by
reducing tariffs and addressing non-tariff barriers to trade.
Promoters of liberalized U.S.-China trade argued that the
United States would benefit because of increased exports
to a large and growing consumer market in China. The
United States also negotiated a series of special safeguard
measures designed to limit the disruptive effects of sur-
ging imports from China on domestic producers.
However, as a result of China’s currency manipulation and
other trade-distorting practices, including extensive sub-
sidies, legal and illegal barriers to imports, dumping, and
suppression of wages and labor rights, the envisioned flow
of U.S. exports to China did not occur. Further, the agree-
ment spurred foreign direct investment in Chinese enter-
prises, which has expanded China’s manufacturing sector
at the expense of the United States. Finally, the core of the
agreement failed to include any protections to maintain or
improve labor or environmental standards or to prohibit
currency manipulation.
In retrospect, the promises about jobs and exports mis-
represented the real effects of trade on the U.S. economy:
Trade leads to both job creation and job loss or displace-
ment. (This paper describes the net effect of trade on
employment as jobs “lost or displaced,” with the terms
“lost” and “displaced” used interchangeably.) Increases in
U.S. exports tend to create jobs in the United States,
but increases in imports will lead to job loss—by des-
troying existing jobs and preventing new job creation—as
imports displace goods that otherwise would have been
made in the United States by domestic workers. This is
what has occurred with China since it entered the WTO;
the United States’ widening trade deficit with China is
costing U.S. jobs.
Currency manipulation is a majorcause of the trade deficit
A major cause of the rapidly growing U.S. trade deficit
with China is currency manipulation. Unlike other cur-
rencies, the Chinese yuan does not fluctuate freely against
the dollar.2 Instead, China has tightly pegged its currency
to the U.S. dollar at a rate that encourages a large bilateral
trade surplus with the United States.
As China’s productivity has soared, its currency should
have adjusted, increasing in value to maintain balanced
trade. But the yuan has instead remained artificially low as
China has aggressively acquired dollars and other foreign
exchange reserves to further depress the value of its own
currency. (To depress the value of its own currency, a gov-
ernment can sell its own currency and buy government
securities such as U.S. Treasury bills, which increases its
foreign reserves.) China had to purchase $337 billion in
U.S. Treasury bills and other securities between Decem-
ber 2010 and December 2011 alone to maintain the peg
to the U.S. dollar (International Monetary Fund 2012a).
As of June 30, 2012, China held a total of $3.24 trillion in
foreign exchange reserves (Bloomberg News 2012), about
70 percent of which were held in U.S. dollars. This inter-
vention makes the yuan artificially cheap relative to the
dollar, effectively subsidizing Chinese exports.
Although the yuan has appreciated significantly since
2005, economist H.W. Brock (2012) estimates that the
Chinese currency is still massively undervalued, and is
“arguably one-sixth of what it should be” (Miller 2012).3
New research by Joe Gagnon (2012, 3) estimates that
massive currency manipulation, especially by countries in
Asia, has raised “the current account of the developing
economies by roughly $700 billion [per year], relative to
what it would have been.” Gagnon also notes that this
“amount is roughly equivalent to the large output gaps
in the United States and euro area. In other words, mil-
EPI BRIEFING PAPER #345 | AUGUST 23, 2012 PAGE 4
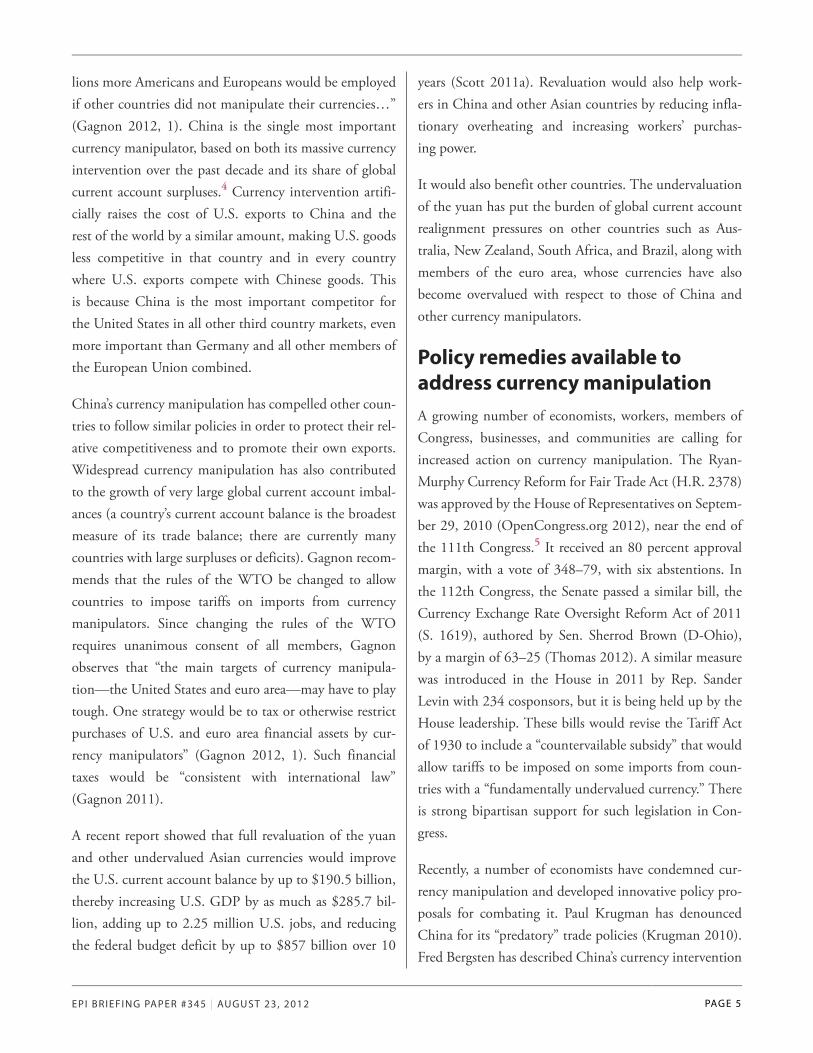
lions more Americans and Europeans would be employed
if other countries did not manipulate their currencies…”
(Gagnon 2012, 1). China is the single most important
currency manipulator, based on both its massive currency
intervention over the past decade and its share of global
current account surpluses.4 Currency intervention artifi-
cially raises the cost of U.S. exports to China and the
rest of the world by a similar amount, making U.S. goods
less competitive in that country and in every country
where U.S. exports compete with Chinese goods. This
is because China is the most important competitor for
the United States in all other third country markets, even
more important than Germany and all other members of
the European Union combined.
China’s currency manipulation has compelled other coun-
tries to follow similar policies in order to protect their rel-
ative competitiveness and to promote their own exports.
Widespread currency manipulation has also contributed
to the growth of very large global current account imbal-
ances (a country’s current account balance is the broadest
measure of its trade balance; there are currently many
countries with large surpluses or deficits). Gagnon recom-
mends that the rules of the WTO be changed to allow
countries to impose tariffs on imports from currency
manipulators. Since changing the rules of the WTO
requires unanimous consent of all members, Gagnon
observes that “the main targets of currency manipula-
tion—the United States and euro area—may have to play
tough. One strategy would be to tax or otherwise restrict
purchases of U.S. and euro area financial assets by cur-
rency manipulators” (Gagnon 2012, 1). Such financial
taxes would be “consistent with international law”
(Gagnon 2011).
A recent report showed that full revaluation of the yuan
and other undervalued Asian currencies would improve
the U.S. current account balance by up to $190.5 billion,
thereby increasing U.S. GDP by as much as $285.7 bil-
lion, adding up to 2.25 million U.S. jobs, and reducing
the federal budget deficit by up to $857 billion over 10
years (Scott 2011a). Revaluation would also help work-
ers in China and other Asian countries by reducing infla-
tionary overheating and increasing workers’ purchas-
ing power.
It would also benefit other countries. The undervaluation
of the yuan has put the burden of global current account
realignment pressures on other countries such as Aus-
tralia, New Zealand, South Africa, and Brazil, along with
members of the euro area, whose currencies have also
become overvalued with respect to those of China and
other currency manipulators.
Policy remedies available toaddress currency manipulation
A growing number of economists, workers, members of
Congress, businesses, and communities are calling for
increased action on currency manipulation. The Ryan-
Murphy Currency Reform for Fair Trade Act (H.R. 2378)
was approved by the House of Representatives on Septem-
ber 29, 2010 (OpenCongress.org 2012), near the end of
the 111th Congress.5 It received an 80 percent approval
margin, with a vote of 348–79, with six abstentions. In
the 112th Congress, the Senate passed a similar bill, the
Currency Exchange Rate Oversight Reform Act of 2011
(S. 1619), authored by Sen. Sherrod Brown (D-Ohio),
by a margin of 63–25 (Thomas 2012). A similar measure
was introduced in the House in 2011 by Rep. Sander
Levin with 234 cosponsors, but it is being held up by the
House leadership. These bills would revise the Tariff Act
of 1930 to include a “countervailable subsidy” that would
allow tariffs to be imposed on some imports from coun-
tries with a “fundamentally undervalued currency.” There
is strong bipartisan support for such legislation in Con-
gress.
Recently, a number of economists have condemned cur-
rency manipulation and developed innovative policy pro-
posals for combating it. Paul Krugman has denounced
China for its “predatory” trade policies (Krugman 2010).
Fred Bergsten has described China’s currency intervention
EPI BRIEFING PAPER #345 | AUGUST 23, 2012 PAGE 5
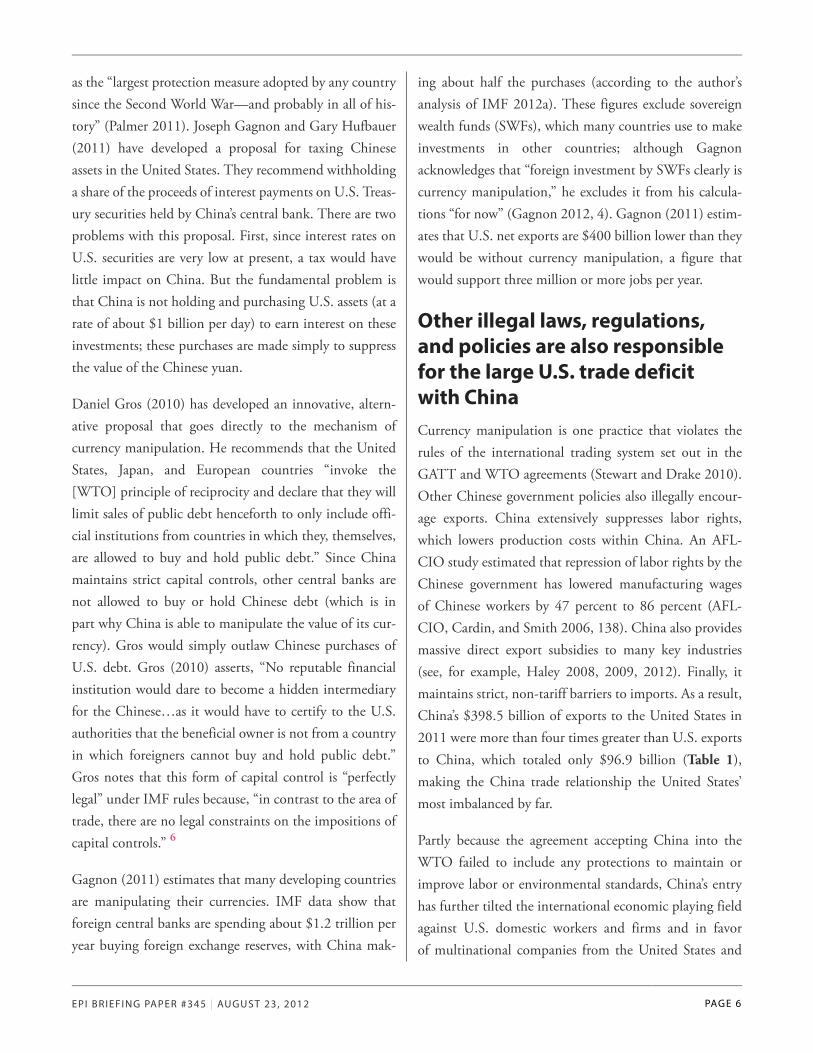
as the “largest protection measure adopted by any country
since the Second World War—and probably in all of his-
tory” (Palmer 2011). Joseph Gagnon and Gary Hufbauer
(2011) have developed a proposal for taxing Chinese
assets in the United States. They recommend withholding
a share of the proceeds of interest payments on U.S. Treas-
ury securities held by China’s central bank. There are two
problems with this proposal. First, since interest rates on
U.S. securities are very low at present, a tax would have
little impact on China. But the fundamental problem is
that China is not holding and purchasing U.S. assets (at a
rate of about $1 billion per day) to earn interest on these
investments; these purchases are made simply to suppress
the value of the Chinese yuan.
Daniel Gros (2010) has developed an innovative, altern-
ative proposal that goes directly to the mechanism of
currency manipulation. He recommends that the United
States, Japan, and European countries “invoke the
[WTO] principle of reciprocity and declare that they will
limit sales of public debt henceforth to only include offi-
cial institutions from countries in which they, themselves,
are allowed to buy and hold public debt.” Since China
maintains strict capital controls, other central banks are
not allowed to buy or hold Chinese debt (which is in
part why China is able to manipulate the value of its cur-
rency). Gros would simply outlaw Chinese purchases of
U.S. debt. Gros (2010) asserts, “No reputable financial
institution would dare to become a hidden intermediary
for the Chinese…as it would have to certify to the U.S.
authorities that the beneficial owner is not from a country
in which foreigners cannot buy and hold public debt.”
Gros notes that this form of capital control is “perfectly
legal” under IMF rules because, “in contrast to the area of
trade, there are no legal constraints on the impositions of
capital controls.” 6
Gagnon (2011) estimates that many developing countries
are manipulating their currencies. IMF data show that
foreign central banks are spending about $1.2 trillion per
year buying foreign exchange reserves, with China mak-
ing about half the purchases (according to the author’s
analysis of IMF 2012a). These figures exclude sovereign
wealth funds (SWFs), which many countries use to make
investments in other countries; although Gagnon
acknowledges that “foreign investment by SWFs clearly is
currency manipulation,” he excludes it from his calcula-
tions “for now” (Gagnon 2012, 4). Gagnon (2011) estim-
ates that U.S. net exports are $400 billion lower than they
would be without currency manipulation, a figure that
would support three million or more jobs per year.
Other illegal laws, regulations,and policies are also responsiblefor the large U.S. trade deficitwith China
Currency manipulation is one practice that violates the
rules of the international trading system set out in the
GATT and WTO agreements (Stewart and Drake 2010).
Other Chinese government policies also illegally encour-
age exports. China extensively suppresses labor rights,
which lowers production costs within China. An AFL-
CIO study estimated that repression of labor rights by the
Chinese government has lowered manufacturing wages
of Chinese workers by 47 percent to 86 percent (AFL-
CIO, Cardin, and Smith 2006, 138). China also provides
massive direct export subsidies to many key industries
(see, for example, Haley 2008, 2009, 2012). Finally, it
maintains strict, non-tariff barriers to imports. As a result,
China’s $398.5 billion of exports to the United States in
2011 were more than four times greater than U.S. exports
to China, which totaled only $96.9 billion (Table 1),
making the China trade relationship the United States’
most imbalanced by far.
Partly because the agreement accepting China into the
WTO failed to include any protections to maintain or
improve labor or environmental standards, China’s entry
has further tilted the international economic playing field
against U.S. domestic workers and firms and in favor
of multinational companies from the United States and
EPI BRIEFING PAPER #345 | AUGUST 23, 2012 PAGE 6
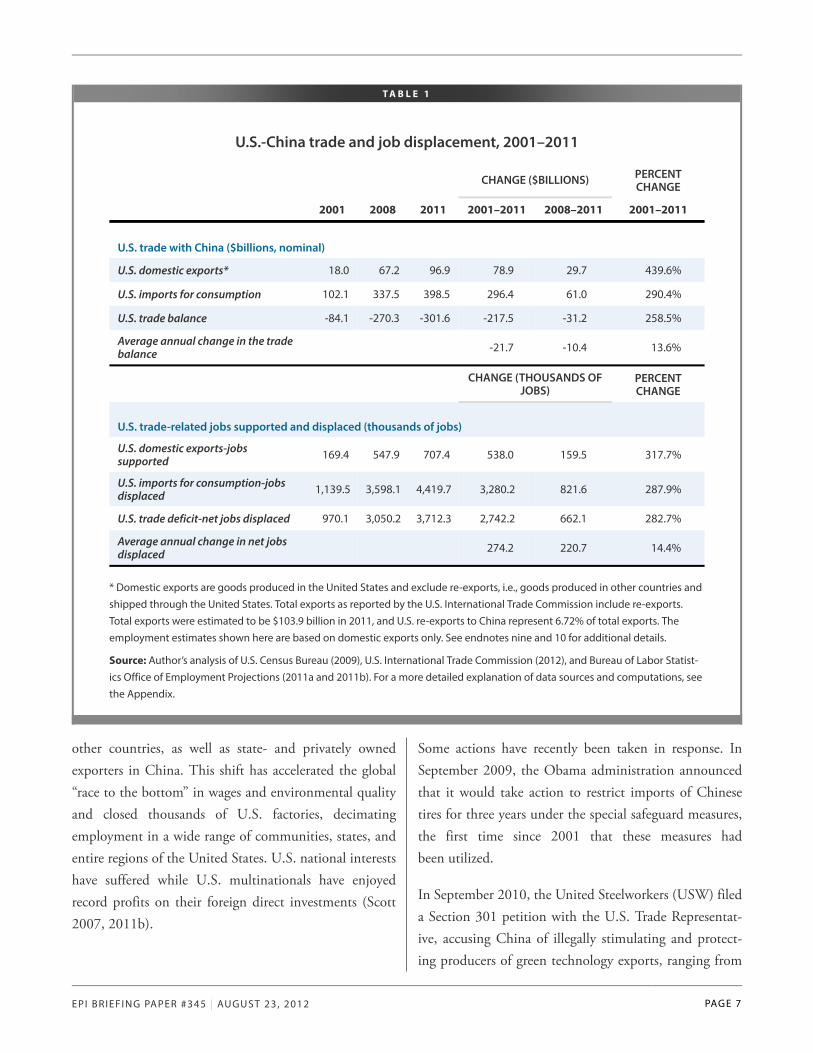
T A B L E 1
U.S.-China trade and job displacement, 2001–2011
CHANGE ($BILLIONS) PERCENTCHANGE
2001 2008 2011 2001–2011 2008–2011 2001–2011
U.S. trade with China ($billions, nominal)
U.S. domestic exports* 18.0 67.2 96.9 78.9 29.7 439.6%
U.S. imports for consumption 102.1 337.5 398.5 296.4 61.0 290.4%
U.S. trade balance -84.1 -270.3 -301.6 -217.5 -31.2 258.5%
Average annual change in the tradebalance -21.7 -10.4 13.6%
CHANGE (THOUSANDS OFJOBS)
PERCENTCHANGE
U.S. trade-related jobs supported and displaced (thousands of jobs)
U.S. domestic exports-jobssupported 169.4 547.9 707.4 538.0 159.5 317.7%
U.S. imports for consumption-jobsdisplaced 1,139.5 3,598.1 4,419.7 3,280.2 821.6 287.9%
U.S. trade deficit-net jobs displaced 970.1 3,050.2 3,712.3 2,742.2 662.1 282.7%
Average annual change in net jobsdisplaced 274.2 220.7 14.4%
* Domestic exports are goods produced in the United States and exclude re-exports, i.e., goods produced in other countries and
shipped through the United States. Total exports as reported by the U.S. International Trade Commission include re-exports.
Total exports were estimated to be $103.9 billion in 2011, and U.S. re-exports to China represent 6.72% of total exports. The
employment estimates shown here are based on domestic exports only. See endnotes nine and 10 for additional details.
Source: Author’s analysis of U.S. Census Bureau (2009), U.S. International Trade Commission (2012), and Bureau of Labor Statist-
ics Office of Employment Projections (2011a and 2011b). For a more detailed explanation of data sources and computations, see
the Appendix.
other countries, as well as state- and privately owned
exporters in China. This shift has accelerated the global
“race to the bottom” in wages and environmental quality
and closed thousands of U.S. factories, decimating
employment in a wide range of communities, states, and
entire regions of the United States. U.S. national interests
have suffered while U.S. multinationals have enjoyed
record profits on their foreign direct investments (Scott
2007, 2011b).
Some actions have recently been taken in response. In
September 2009, the Obama administration announced
that it would take action to restrict imports of Chinese
tires for three years under the special safeguard measures,
the first time since 2001 that these measures had
been utilized.
In September 2010, the United Steelworkers (USW) filed
a Section 301 petition with the U.S. Trade Representat-
ive, accusing China of illegally stimulating and protect-
ing producers of green technology exports, ranging from
EPI BRIEFING PAPER #345 | AUGUST 23, 2012 PAGE 7
wind and solar energy products to advanced batteries and
energy-efficient vehicles. Indeed, the U.S. trade deficit in
clean energy products had more than doubled between
2008 and 2010, displacing more than 8,000 U.S. jobs in
2010 alone (Scott 2010). The 2010 USW petition details
more than 80 Chinese laws, regulations, and practices
that violate international trade agreements and have hurt
U.S. clean energy manufacturing and green technology
industries.
In July 2012, the Obama administration filed a WTO
complaint against China over its tariffs on large vehicles
exported from the United States to China. This was the
seventh complaint filed by the administration against
China, and the previous six have all been successful
(Scott 2012).
Another crucial missing link:Foreign direct investment andoutsourcing
Proponents of trade deals such as the agreement to
endorse China’s admission to the World Trade Organiza-
tion usually focus on the impacts of these deals on tariff
and non-tariff barriers to trade.7 China agreed to make
major tariff reductions as a condition of entry into the
WTO. President Clinton and many others argued that
since U.S. tariff barriers were already low, the agreement
would have a much larger effect on U.S. exports to China
than on U.S. imports.
But proponents failed to consider the effect of China’s
entry on foreign direct investment (FDI) and out-
sourcing. FDI has played a key role in the growth of
China’s manufacturing sector. China is the largest recip-
ient of FDI of all developing countries (Xing 2010) and
is the third-largest recipient of FDI over the past three
decades, trailing only the United States and the United
Kingdom. Foreign-invested enterprises (both joint ven-
tures and wholly owned subsidiaries) were responsible for
52.4 percent of China’s exports and 84.1 percent of its
trade surplus in 2011 (Ministry of Commerce, China
2012). Outsourcing—through foreign direct investment
in factories that make goods for export to the United
States—has played a key role in the shift of manufacturing
production and jobs from the United States to China
since it entered the WTO in 2001. Foreign invested
enterprises were responsible for the vast majority of
China’s global trade surplus in 2011.
Failed expectations of a growingChinese market for U.S. goods
Another critically important promise made by the pro-
moters of liberalized U.S.-China trade was that the
United States would benefit because of increased exports
to a large and growing consumer market in China.
However, despite widespread reports of the rapid growth
of the Chinese middle class, this growth has not resulted
in a significant increase in U.S. consumer exports to
China. The most rapidly growing exports to China are
bulk commodities such as grains, scrap, and chemicals;
intermediate products such as semiconductors; and pro-
ducer durables such as aircraft and non-electrical
machinery (see the discussion of Table 2 later in this
paper, and Supplemental Table C to this report at
http://www.epi.org/publication/bp345-china-growing-
trade-deficit-cost/). Furthermore, the increase in U.S.
exports to China since 2001 has been overwhelmed by the
growth of U.S. imports, as discussed next.
Trade-distorting policies andunplanned-for investment shiftshave combined to radicallyincrease China’s share of the U.S.trade deficit
The bottom line of the influences discussed above is this:
As a result of China’s currency manipulation and other
trade-distorting practices (including extensive subsidies,
legal and illegal barriers to imports, dumping, and sup-
pression of wages and labor rights), the increase in foreign
direct investment in China and related growth of its man-
EPI BRIEFING PAPER #345 | AUGUST 23, 2012 PAGE 8
ufacturing sector, and the absence of a growing market
for U.S. consumer goods in China, the U.S. trade deficit
with China rose from $84.1 billion in 2001 to $301.6 bil-
lion in 2011, an increase of $217.5 billion, as shown in
Table 1. Since China entered the WTO in 2001, this defi-
cit has increased annually by $21.7 billion, or 13.6 per-
cent, on average.
Despite the collapse in world trade between 2008 and
2009 caused by the Great Recession, the U.S. trade deficit
with China increased $31.2 billion between 2008 and
2011. China’s share of the overall U.S. trade deficit
increased from 32.6 percent to 40.8 percent, and its share
of the total U.S. non-oil trade deficit jumped from 69.6
percent in 2008 to 77.7 percent in 2011 (according to
the author’s analysis of U.S. International Trade Commis-
sion 2012).
Unless China raises the real value of the yuan by at least
a third and eliminates these other trade distortions, the
U.S. trade deficit and related job losses will continue to
grow rapidly. (Although China did respond to interna-
tional pressure in the late 2000s and allowed some appre-
ciation in the yuan, it was too little and too late to help
arrest the widening U.S.-China trade gap.8)
Growing trade deficits andjob losses
Each $1 billion in exports to China from the United
States supports some American jobs. However, each $1
billion in imports from China displaces the American
workers who would have been employed making these
products in the United States. The net employment effect
of trade depends on the changes in the trade balance.
An improving trade balance can support job creation, but
growing trade deficits usually result in growing net U.S.
job displacement. The United States has had large trade
deficits with China since 2001, which increased in every
year except 2009, when U.S. trade with all countries col-
lapsed due to the recession of 2007–2009.
The employment impacts of the growing U.S. trade defi-
cit with China are estimated in this paper using an input-
output model that estimates the direct and indirect labor
requirements of producing output in a given domestic
industry. The model includes 195 U.S. industries, 77
Trade and employment models
The Economic Policy Institute and other researchers have examined the job impacts of trade in recent years
by netting the job opportunities lost to imports against those gained through exports. This report uses stand-
ard input-output models and data to estimate the jobs displaced by trade. Many reports by economists in the
public and private sectors have used an “all-but-identical” methodology to estimate jobs gained or displaced
by trade, including Groshen, Hobijn, and McConnell (2005) of the Federal Reserve Bank of New York, and
Bailey and Lawrence (2004) in the Brookings Papers on Economic Activity. The U.S. Department of Com-
merce recently published estimates of the jobs supported by U.S. exports (Tschetter 2010). That study used
input-output and “employment requirements” tables from the Bureau of Labor Statistics Office of Employ-
ment Projections (2011a), the same source used to develop job displacement estimates in this report. The
Tschetter report represents the work of a panel of experts from 20 federal agencies, including Mark Doms,
chief economist at the U.S. Department of Commerce, and David Walters, chief economist at the Office of
the U.S. Trade Representative.
EPI BRIEFING PAPER #345 | AUGUST 23, 2012 PAGE 9
of which are in the manufacturing sector (see the box
titled “Trade and employment models,” as well as the
Appendix, for details on model structure and data
sources). The Bureau of Labor Statistics Office of
Employment Projections (BLS–OEP) revised and
updated its labor requirements model and related data in
December 2011 (a; b). Our models have been completely
revised and updated using the newest, best available data
for this report.
The model estimates the amount of labor (number of
jobs) required to produce a given volume of exports and
the labor displaced when a given volume of imports is
substituted for domestic output.9 The difference between
these two numbers is essentially the jobs displaced by
growing trade deficits, holding all else equal.
Jobs displaced by the growing China trade deficit are
a net drain on employment in trade-related industries,
especially those in manufacturing. Even if increases in
demand in other sectors absorb all the workers displaced
by trade (which is unlikely), job quality will likely suffer
because many non-traded industries such as retail and
home health care pay lower wages and have less compre-
hensive benefits than traded-goods industries.
U.S. exports to China in 2001 supported 169,400 jobs,
but U.S. imports displaced production that would have
supported 1,139,500 jobs, as shown in the bottom half of
Table 1. Therefore, the $84.1 billion trade deficit in 2001
displaced 970,100 jobs in that year. Job displacement rose
to 3,050,200 jobs in 2008 and 3,712,300 jobs in 2011.
Since China’s entry into the WTO in 2001 and through
2011, the increase in U.S.-China trade deficits eliminated
or displaced 2,742,200 U.S. jobs, as shown in the bottom
half of Table 1. Rising trade deficits have displaced a
growing number of jobs every year since China joined
the WTO, with the exception of 2009 (during the Great
Recession), as shown in Figure A. The U.S. trade deficit
with China increased by $31.2 billion (or 11.6 percent)
between 2008 and 2011, and the number of jobs dis-
placed increased by 21.7 percent. Meanwhile, the U.S.
trade deficit with the rest of the world declined 19.3 per-
cent between 2008 and 2011 (according to the author’s
analysis of U.S. International Trade Commission 2012).
These figures illustrate the damage done when China
took advantage of the Great Recession to expand its
beggar-thy-neighbor trade policies through currency
manipulation and other illegal and unfair trade policies,
which undermined job creation in the U.S. economy
throughout the downturn.
Between 2008 and 2011 alone 662,100 jobs were lost,
either by the elimination of existing jobs or by the preven-
tion of new job creation (Figure A). On average, 274,200
jobs per year have been lost or displaced since China’s
entry into the WTO (Table 1). The continuing growth
of job displacement between 2008 and 2011 despite the
relatively small increase in the trade deficit reflects the
relatively rapid growth of U.S. imports of computer and
electronics products from China, and the fact that the
price index for most of these products fell continuously
throughout the study period, as noted later in this paper.
The share of U.S. imports from China accounted for by
computer and electronic products (in current, nominal
dollars) increased from 32.9 percent in 2008 to 37.4
percent in 2011 (according to the author’s analysis of
USITC 2012).
Trade and jobs, by industry
The composition of imports from China is changing in
fundamental ways, with serious implications for certain
kinds of high-skill, high-wage jobs once thought to be
the hallmark of the U.S. economy. China is moving rap-
idly “upscale,” from low-tech, low-skilled, labor-intensive
industries such as apparel, footwear, and basic electronics
to more capital- and skills-intensive sectors such as com-
puters, electrical machinery, and motor vehicle parts. It
has also developed a rapidly growing trade surplus in
high-technology products.
EPI BRIEFING PAPER #345 | AUGUST 23, 2012 PAGE 10
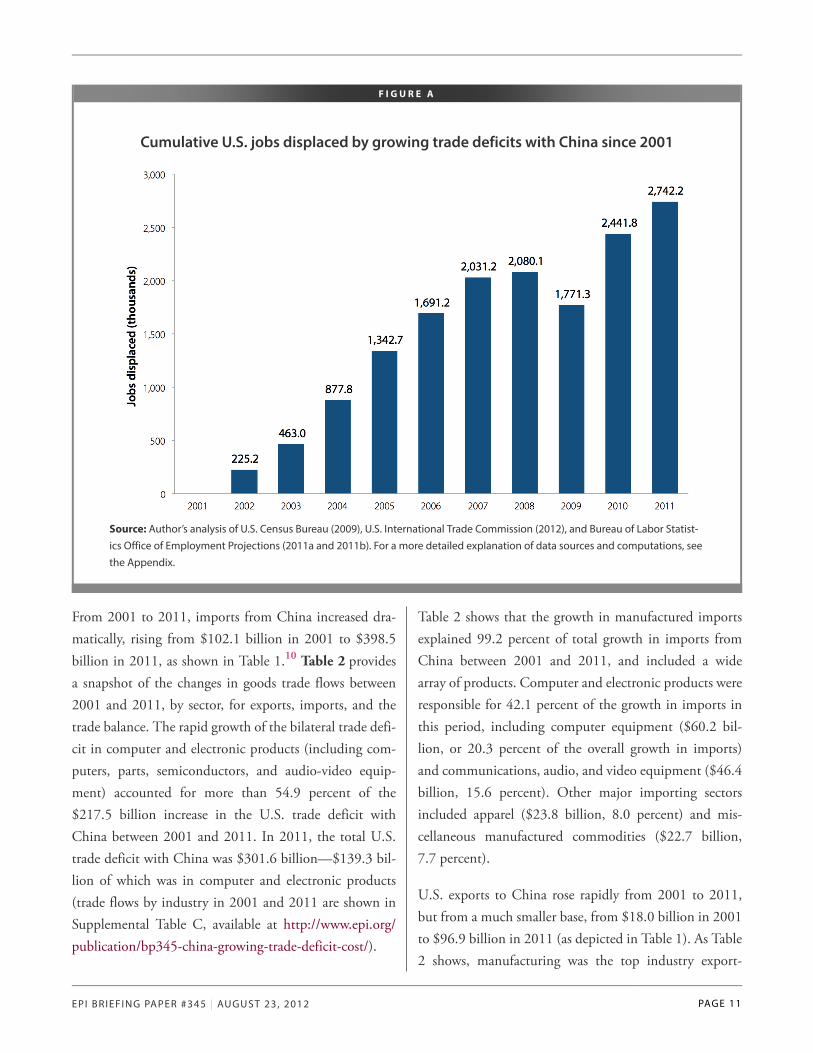
F I G U R E A
Cumulative U.S. jobs displaced by growing trade deficits with China since 2001
Source: Author’s analysis of U.S. Census Bureau (2009), U.S. International Trade Commission (2012), and Bureau of Labor Statist-
ics Office of Employment Projections (2011a and 2011b). For a more detailed explanation of data sources and computations, see
the Appendix.
From 2001 to 2011, imports from China increased dra-
matically, rising from $102.1 billion in 2001 to $398.5
billion in 2011, as shown in Table 1.10 Table 2 provides
a snapshot of the changes in goods trade flows between
2001 and 2011, by sector, for exports, imports, and the
trade balance. The rapid growth of the bilateral trade defi-
cit in computer and electronic products (including com-
puters, parts, semiconductors, and audio-video equip-
ment) accounted for more than 54.9 percent of the
$217.5 billion increase in the U.S. trade deficit with
China between 2001 and 2011. In 2011, the total U.S.
trade deficit with China was $301.6 billion—$139.3 bil-
lion of which was in computer and electronic products
(trade flows by industry in 2001 and 2011 are shown in
Supplemental Table C, available at http://www.epi.org/
publication/bp345-china-growing-trade-deficit-cost/).
Table 2 shows that the growth in manufactured imports
explained 99.2 percent of total growth in imports from
China between 2001 and 2011, and included a wide
array of products. Computer and electronic products were
responsible for 42.1 percent of the growth in imports in
this period, including computer equipment ($60.2 bil-
lion, or 20.3 percent of the overall growth in imports)
and communications, audio, and video equipment ($46.4
billion, 15.6 percent). Other major importing sectors
included apparel ($23.8 billion, 8.0 percent) and mis-
cellaneous manufactured commodities ($22.7 billion,
7.7 percent).
U.S. exports to China rose rapidly from 2001 to 2011,
but from a much smaller base, from $18.0 billion in 2001
to $96.9 billion in 2011 (as depicted in Table 1). As Table
2 shows, manufacturing was the top industry export-
EPI BRIEFING PAPER #345 | AUGUST 23, 2012 PAGE 11
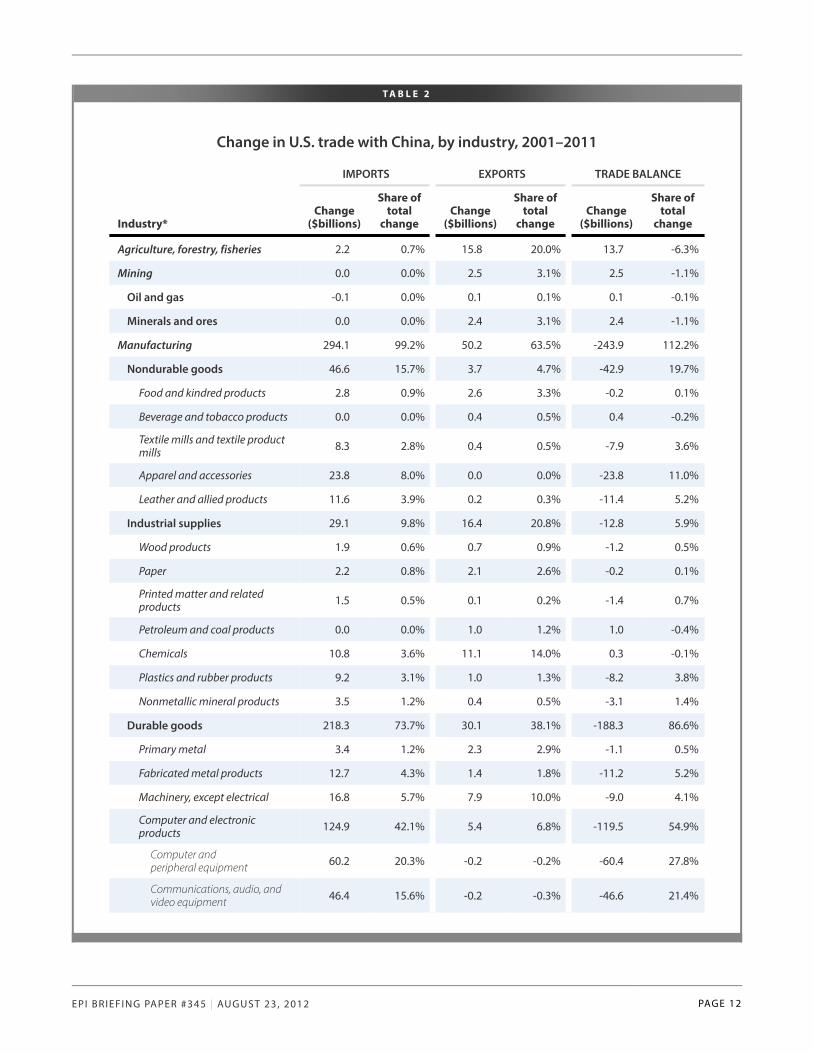
T A B L E 2
Change in U.S. trade with China, by industry, 2001–2011
IMPORTS EXPORTS TRADE BALANCE
Industry*Change
($billions)
Share oftotal
changeChange
($billions)
Share oftotal
changeChange
($billions)
Share oftotal
change
Agriculture, forestry, fisheries 2.2 0.7% 15.8 20.0% 13.7 -6.3%
Mining 0.0 0.0% 2.5 3.1% 2.5 -1.1%
Oil and gas -0.1 0.0% 0.1 0.1% 0.1 -0.1%
Minerals and ores 0.0 0.0% 2.4 3.1% 2.4 -1.1%
Manufacturing 294.1 99.2% 50.2 63.5% -243.9 112.2%
Nondurable goods 46.6 15.7% 3.7 4.7% -42.9 19.7%
Food and kindred products 2.8 0.9% 2.6 3.3% -0.2 0.1%
Beverage and tobacco products 0.0 0.0% 0.4 0.5% 0.4 -0.2%
Textile mills and textile productmills 8.3 2.8% 0.4 0.5% -7.9 3.6%
Apparel and accessories 23.8 8.0% 0.0 0.0% -23.8 11.0%
Leather and allied products 11.6 3.9% 0.2 0.3% -11.4 5.2%
Industrial supplies 29.1 9.8% 16.4 20.8% -12.8 5.9%
Wood products 1.9 0.6% 0.7 0.9% -1.2 0.5%
Paper 2.2 0.8% 2.1 2.6% -0.2 0.1%
Printed matter and relatedproducts 1.5 0.5% 0.1 0.2% -1.4 0.7%
Petroleum and coal products 0.0 0.0% 1.0 1.2% 1.0 -0.4%
Chemicals 10.8 3.6% 11.1 14.0% 0.3 -0.1%
Plastics and rubber products 9.2 3.1% 1.0 1.3% -8.2 3.8%
Nonmetallic mineral products 3.5 1.2% 0.4 0.5% -3.1 1.4%
Durable goods 218.3 73.7% 30.1 38.1% -188.3 86.6%
Primary metal 3.4 1.2% 2.3 2.9% -1.1 0.5%
Fabricated metal products 12.7 4.3% 1.4 1.8% -11.2 5.2%
Machinery, except electrical 16.8 5.7% 7.9 10.0% -9.0 4.1%
Computer and electronicproducts 124.9 42.1% 5.4 6.8% -119.5 54.9%
Computer andperipheral equipment 60.2 20.3% -0.2 -0.2% -60.4 27.8%
Communications, audio, andvideo equipment 46.4 15.6% -0.2 -0.3% -46.6 21.4%
EPI BRIEFING PAPER #345 | AUGUST 23, 2012 PAGE 12
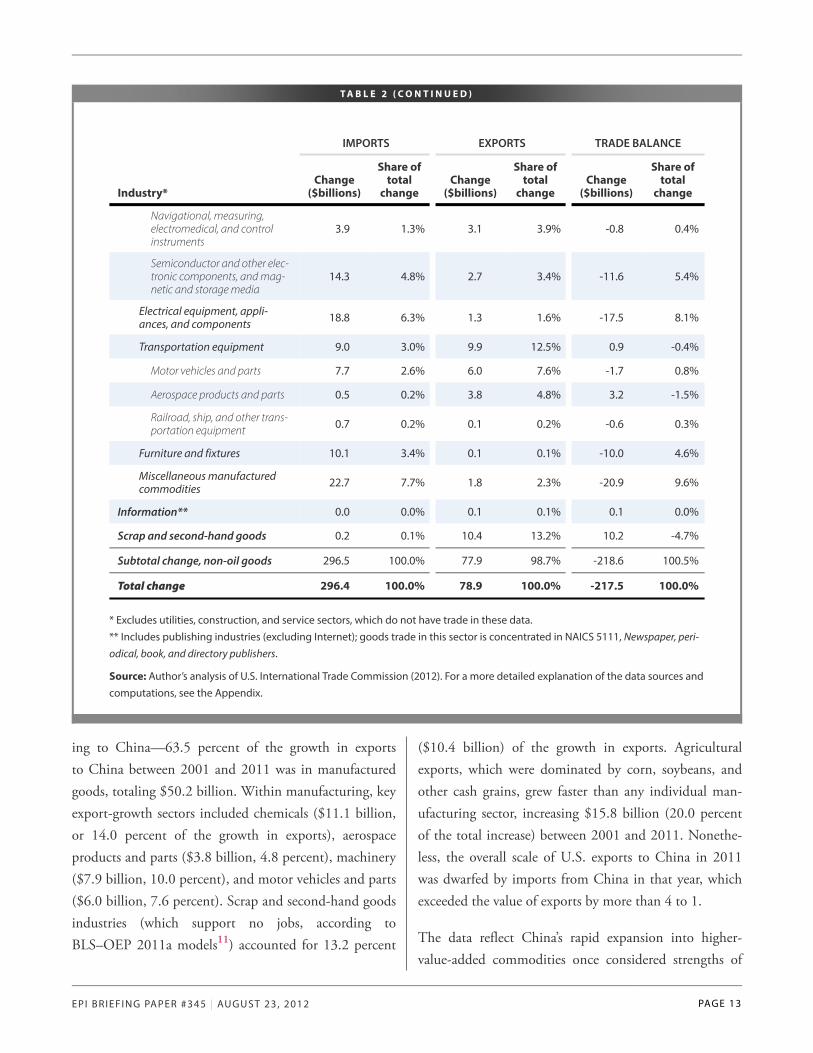
T A B L E 2 ( C O N T I N U E D )
IMPORTS EXPORTS TRADE BALANCE
Industry*Change
($billions)
Share oftotal
changeChange
($billions)
Share oftotal
changeChange
($billions)
Share oftotal
change
Navigational, measuring,electromedical, and controlinstruments
3.9 1.3% 3.1 3.9% -0.8 0.4%
Semiconductor and other elec-tronic components, and mag-netic and storage media
14.3 4.8% 2.7 3.4% -11.6 5.4%
Electrical equipment, appli-ances, and components 18.8 6.3% 1.3 1.6% -17.5 8.1%
Transportation equipment 9.0 3.0% 9.9 12.5% 0.9 -0.4%
Motor vehicles and parts 7.7 2.6% 6.0 7.6% -1.7 0.8%
Aerospace products and parts 0.5 0.2% 3.8 4.8% 3.2 -1.5%
Railroad, ship, and other trans-portation equipment 0.7 0.2% 0.1 0.2% -0.6 0.3%
Furniture and fixtures 10.1 3.4% 0.1 0.1% -10.0 4.6%
Miscellaneous manufacturedcommodities 22.7 7.7% 1.8 2.3% -20.9 9.6%
Information** 0.0 0.0% 0.1 0.1% 0.1 0.0%
Scrap and second-hand goods 0.2 0.1% 10.4 13.2% 10.2 -4.7%
Subtotal change, non-oil goods 296.5 100.0% 77.9 98.7% -218.6 100.5%
Total change 296.4 100.0% 78.9 100.0% -217.5 100.0%
* Excludes utilities, construction, and service sectors, which do not have trade in these data.
** Includes publishing industries (excluding Internet); goods trade in this sector is concentrated in NAICS 5111, Newspaper, peri-
odical, book, and directory publishers.
Source: Author’s analysis of U.S. International Trade Commission (2012). For a more detailed explanation of the data sources and
computations, see the Appendix.
ing to China—63.5 percent of the growth in exports
to China between 2001 and 2011 was in manufactured
goods, totaling $50.2 billion. Within manufacturing, key
export-growth sectors included chemicals ($11.1 billion,
or 14.0 percent of the growth in exports), aerospace
products and parts ($3.8 billion, 4.8 percent), machinery
($7.9 billion, 10.0 percent), and motor vehicles and parts
($6.0 billion, 7.6 percent). Scrap and second-hand goods
industries (which support no jobs, according to
BLS–OEP 2011a models11) accounted for 13.2 percent
($10.4 billion) of the growth in exports. Agricultural
exports, which were dominated by corn, soybeans, and
other cash grains, grew faster than any individual man-
ufacturing sector, increasing $15.8 billion (20.0 percent
of the total increase) between 2001 and 2011. Nonethe-
less, the overall scale of U.S. exports to China in 2011
was dwarfed by imports from China in that year, which
exceeded the value of exports by more than 4 to 1.
The data reflect China’s rapid expansion into higher-
value-added commodities once considered strengths of
EPI BRIEFING PAPER #345 | AUGUST 23, 2012 PAGE 13
the United States, such as computer and electronic
products, which accounted for 37.4 percent ($149.2 bil-
lion) of U.S. imports from China in 2011. This growth
is apparent in the shifting trade balance in advanced tech-
nology products (ATP), a broad category of high-end
technology goods trade tracked by the U.S. Census Bur-
eau.12 ATP includes the more advanced elements of the
computer and electronic products industry as well as
other sectors such as biotechnology, life sciences,
aerospace, nuclear technology, and flexible manufactur-
ing. The ATP sector includes some auto parts; China
is now one of the top suppliers of auto parts to the
United States, having recently surpassed Germany (Scott
and Wething 2012).
In 2011, the United States had a $109.4 billion trade defi-
cit with China in ATP, reflecting a nine-fold increase from
$11.8 billion in 2002. This ATP deficit was responsible
for 36.3 percent of the total U.S.-China trade deficit in
2011. It dwarfs the $9.7 billion surplus in ATP that the
United States had with the rest of the world in 2011,
the result of a 5.1 percent annual increase in U.S. ATP
exports to the rest of the world between 2002 and 2011.
As a result of the U.S. ATP deficit with China, the United
States ran an overall deficit in ATP products in 2011 (of
$99.6 billion), as it has in every year since 2002 (U.S.
Census Bureau 2012c).
Trade deficits are highly correlated with job loss or dis-
placement by industry, as shown in Table 3. Growing
trade deficits with China eliminated 2,109,700 manufac-
turing jobs between 2001 and 2011, more than three-
quarters (76.9 percent) of the total. By far the largest job
displacements occurred in the computer and electronic
products sector, which lost 1,064,800 jobs (38.8 per-
cent of the more than 2.7 million jobs displaced overall).
This sector includes computer and peripheral equipment
(620,700 jobs, 22.6 percent of the overall jobs displaced),
semiconductors and components (235,000 jobs, 8.6 per-
cent), and communications, audio, and video equipment
(203,500 jobs, 7.4 percent). Other hard-hit sectors
included apparel and accessories (211,200 jobs displaced,
equal to 7.7 percent of the total), textile mills and textile
product mills (106,200, 3.9 percent), fabricated metal
products (120,600, 4.4 percent), furniture and fixtures
(80,700, 2.9 percent), plastics and rubber products
(57,600, 2.1 percent), motor vehicles and parts (19,800,
0.7 percent), and miscellaneous manufacturing (111,800
jobs, 4.1 percent). Several service industries, which
provide key inputs to traded-goods production, exper-
ienced significant job displacement, including adminis-
trative, support, and waste management services (160,600
jobs, 5.9 percent) and professional, scientific, and tech-
nical services (145,000 jobs, 5.3 percent).
These job displacement estimates are based on changes
in the real value of exports and imports. For example,
while the share of U.S. imports accounted for by com-
puter and electronic products from China rose from 23.8
percent in 2001 to 37.4 percent in 2011 (to $149.2 bil-
lion), the average price indexes (deflators) for most of
these products fell sharply between 2001 and 2011—28.9
percent on a trade-weighted basis. Thus, the real value
of computer and electronic imports increased more than
10-fold in this period, rising from $19.5 billion to $198.5
billion in 2011 in constant 2005 dollars.13
Job losses by state
Growing trade deficits with China have reduced demand
for goods produced in every region of the United States
and led to job displacement in all 50 states, Puerto Rico,
and the District of Columbia, as shown in Table 4
and Figure B. (Appendix Table 1 ranks the states by the
number of net jobs displaced, while Appendix Table 2
presents the same data but sorts the states alphabetically.)
Table 4 shows that jobs displaced from 2001 to 2011 due
to growing deficits with China equaled or exceeded 2.2
percent of total state employment in states such as New
Hampshire, California, Massachusetts, Oregon, North
Carolina, Minnesota, Idaho, Vermont, Colorado, Texas,
Rhode Island, and Alabama. As shown in Appendix
Tables 1 and 2, nearly 475,000 jobs were lost in Cali-
EPI BRIEFING PAPER #345 | AUGUST 23, 2012 PAGE 14
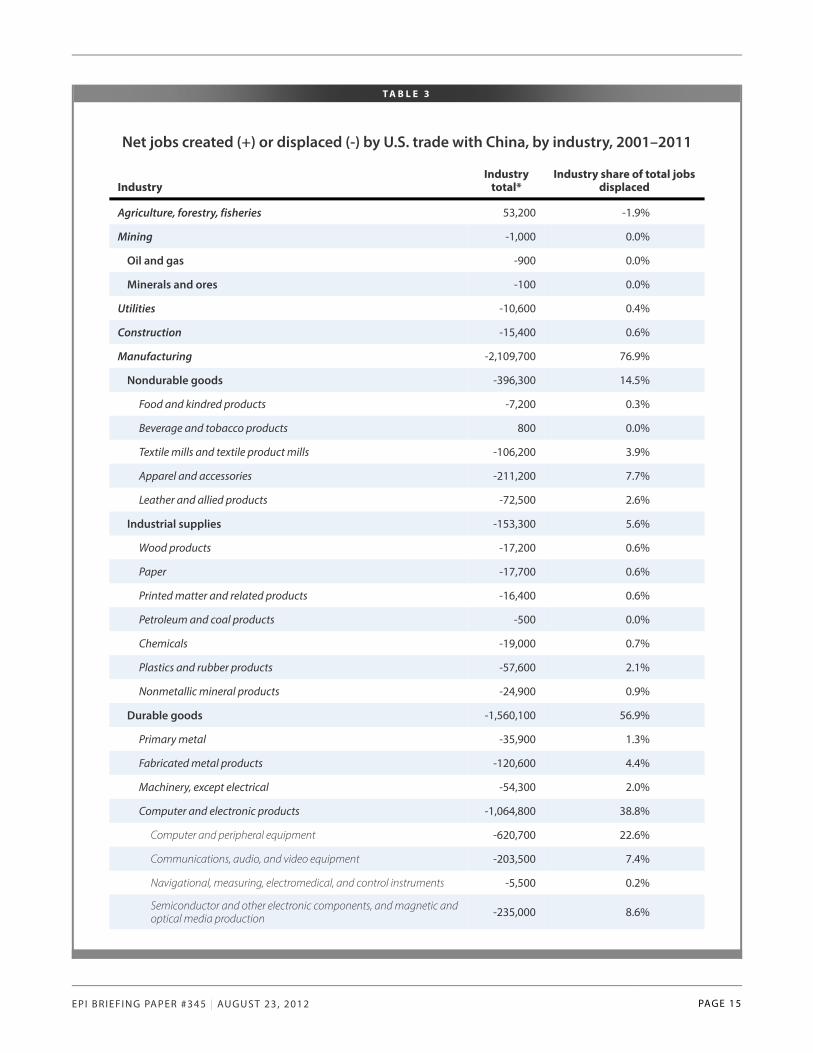
T A B L E 3
Net jobs created (+) or displaced (-) by U.S. trade with China, by industry, 2001–2011
IndustryIndustry
total*Industry share of total jobs
displaced
Agriculture, forestry, fisheries 53,200 -1.9%
Mining -1,000 0.0%
Oil and gas -900 0.0%
Minerals and ores -100 0.0%
Utilities -10,600 0.4%
Construction -15,400 0.6%
Manufacturing -2,109,700 76.9%
Nondurable goods -396,300 14.5%
Food and kindred products -7,200 0.3%
Beverage and tobacco products 800 0.0%
Textile mills and textile product mills -106,200 3.9%
Apparel and accessories -211,200 7.7%
Leather and allied products -72,500 2.6%
Industrial supplies -153,300 5.6%
Wood products -17,200 0.6%
Paper -17,700 0.6%
Printed matter and related products -16,400 0.6%
Petroleum and coal products -500 0.0%
Chemicals -19,000 0.7%
Plastics and rubber products -57,600 2.1%
Nonmetallic mineral products -24,900 0.9%
Durable goods -1,560,100 56.9%
Primary metal -35,900 1.3%
Fabricated metal products -120,600 4.4%
Machinery, except electrical -54,300 2.0%
Computer and electronic products -1,064,800 38.8%
Computer and peripheral equipment -620,700 22.6%
Communications, audio, and video equipment -203,500 7.4%
Navigational, measuring, electromedical, and control instruments -5,500 0.2%
Semiconductor and other electronic components, and magnetic andoptical media production -235,000 8.6%
EPI BRIEFING PAPER #345 | AUGUST 23, 2012 PAGE 15
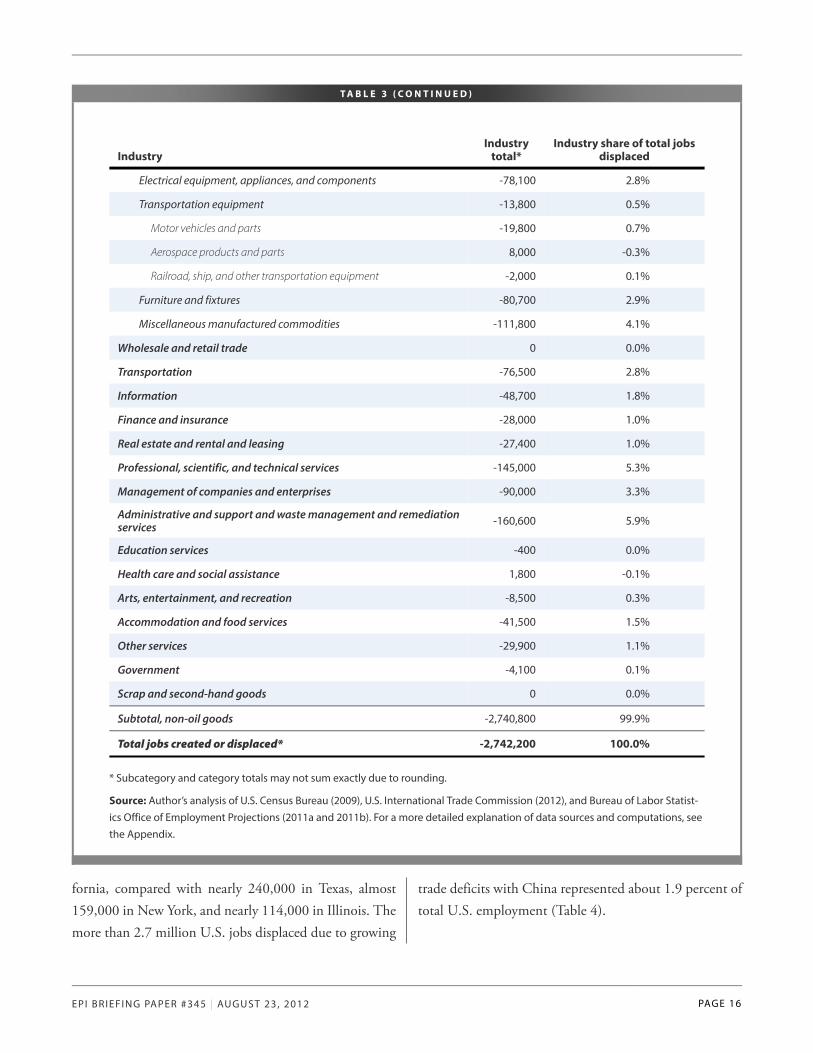
T A B L E 3 ( C O N T I N U E D )
IndustryIndustry
total*Industry share of total jobs
displaced
Electrical equipment, appliances, and components -78,100 2.8%
Transportation equipment -13,800 0.5%
Motor vehicles and parts -19,800 0.7%
Aerospace products and parts 8,000 -0.3%
Railroad, ship, and other transportation equipment -2,000 0.1%
Furniture and fixtures -80,700 2.9%
Miscellaneous manufactured commodities -111,800 4.1%
Wholesale and retail trade 0 0.0%
Transportation -76,500 2.8%
Information -48,700 1.8%
Finance and insurance -28,000 1.0%
Real estate and rental and leasing -27,400 1.0%
Professional, scientific, and technical services -145,000 5.3%
Management of companies and enterprises -90,000 3.3%
Administrative and support and waste management and remediationservices -160,600 5.9%
Education services -400 0.0%
Health care and social assistance 1,800 -0.1%
Arts, entertainment, and recreation -8,500 0.3%
Accommodation and food services -41,500 1.5%
Other services -29,900 1.1%
Government -4,100 0.1%
Scrap and second-hand goods 0 0.0%
Subtotal, non-oil goods -2,740,800 99.9%
Total jobs created or displaced* -2,742,200 100.0%
* Subcategory and category totals may not sum exactly due to rounding.
Source: Author’s analysis of U.S. Census Bureau (2009), U.S. International Trade Commission (2012), and Bureau of Labor Statist-
ics Office of Employment Projections (2011a and 2011b). For a more detailed explanation of data sources and computations, see
the Appendix.
fornia, compared with nearly 240,000 in Texas, almost
159,000 in New York, and nearly 114,000 in Illinois. The
more than 2.7 million U.S. jobs displaced due to growing
trade deficits with China represented about 1.9 percent of
total U.S. employment (Table 4).
EPI BRIEFING PAPER #345 | AUGUST 23, 2012 PAGE 16
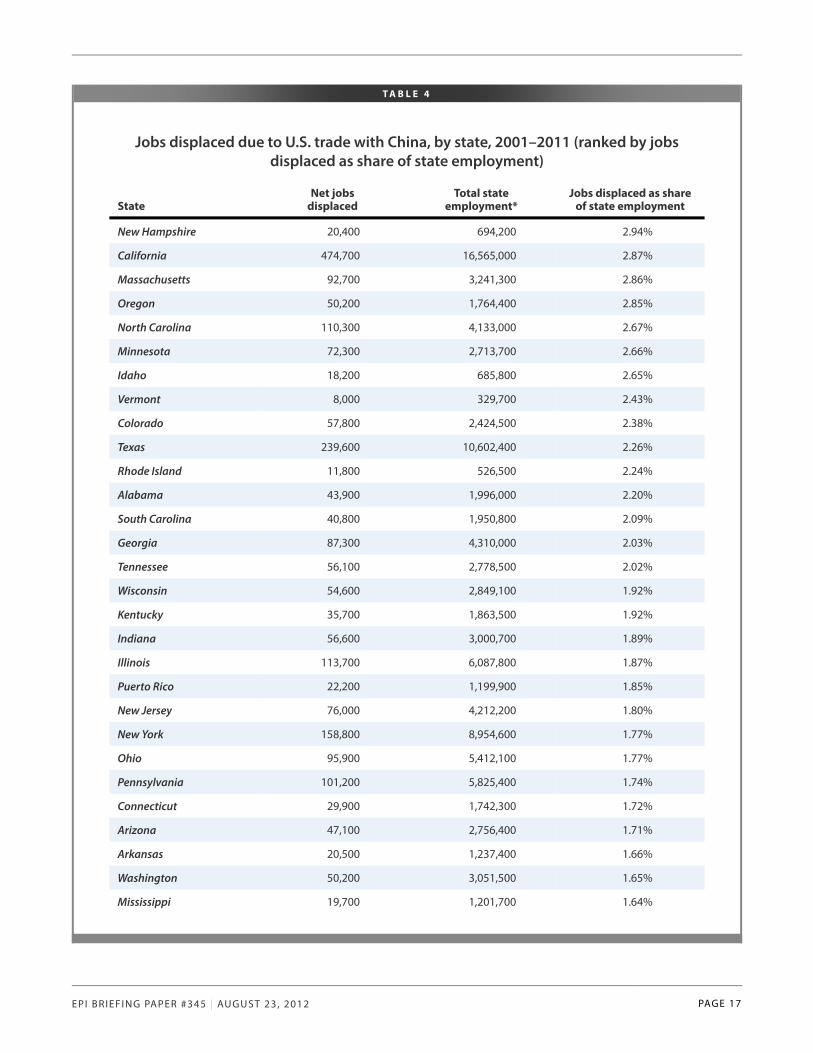
T A B L E 4
Jobs displaced due to U.S. trade with China, by state, 2001–2011 (ranked by jobsdisplaced as share of state employment)
StateNet jobs
displacedTotal state
employment*Jobs displaced as share
of state employment
New Hampshire 20,400 694,200 2.94%
California 474,700 16,565,000 2.87%
Massachusetts 92,700 3,241,300 2.86%
Oregon 50,200 1,764,400 2.85%
North Carolina 110,300 4,133,000 2.67%
Minnesota 72,300 2,713,700 2.66%
Idaho 18,200 685,800 2.65%
Vermont 8,000 329,700 2.43%
Colorado 57,800 2,424,500 2.38%
Texas 239,600 10,602,400 2.26%
Rhode Island 11,800 526,500 2.24%
Alabama 43,900 1,996,000 2.20%
South Carolina 40,800 1,950,800 2.09%
Georgia 87,300 4,310,000 2.03%
Tennessee 56,100 2,778,500 2.02%
Wisconsin 54,600 2,849,100 1.92%
Kentucky 35,700 1,863,500 1.92%
Indiana 56,600 3,000,700 1.89%
Illinois 113,700 6,087,800 1.87%
Puerto Rico 22,200 1,199,900 1.85%
New Jersey 76,000 4,212,200 1.80%
New York 158,800 8,954,600 1.77%
Ohio 95,900 5,412,100 1.77%
Pennsylvania 101,200 5,825,400 1.74%
Connecticut 29,900 1,742,300 1.72%
Arizona 47,100 2,756,400 1.71%
Arkansas 20,500 1,237,400 1.66%
Washington 50,200 3,051,500 1.65%
Mississippi 19,700 1,201,700 1.64%
EPI BRIEFING PAPER #345 | AUGUST 23, 2012 PAGE 17
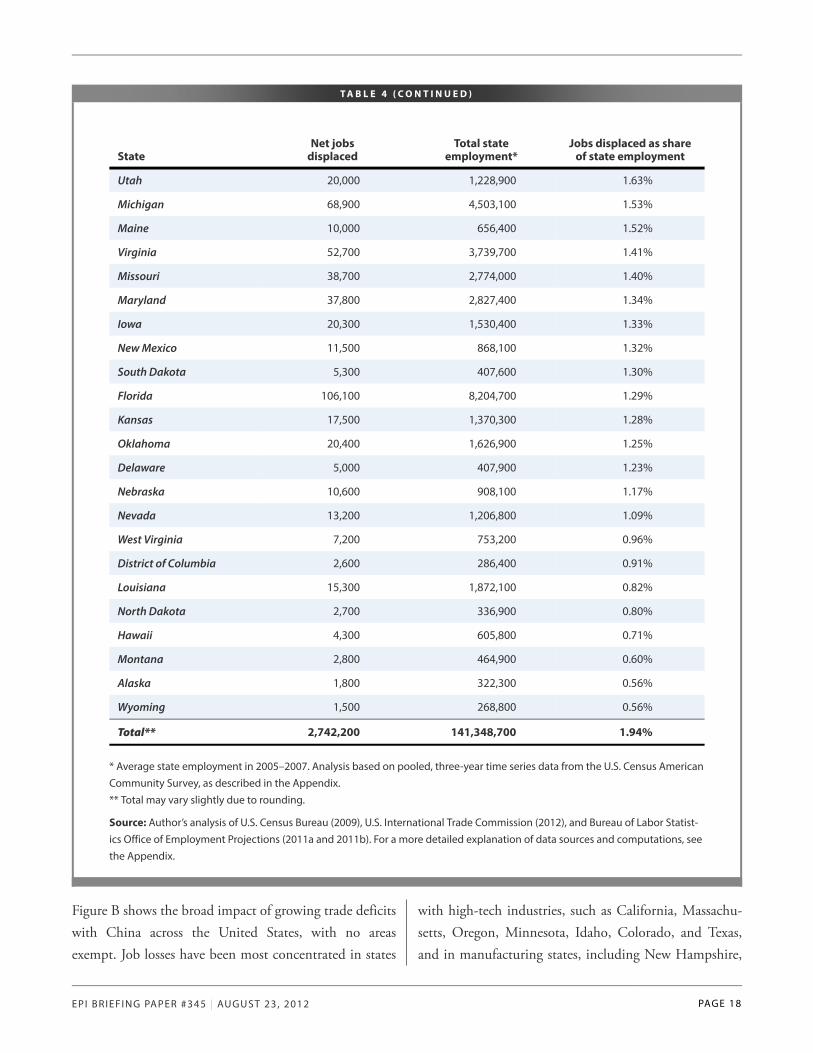
T A B L E 4 ( C O N T I N U E D )
StateNet jobs
displacedTotal state
employment*Jobs displaced as share
of state employment
Utah 20,000 1,228,900 1.63%
Michigan 68,900 4,503,100 1.53%
Maine 10,000 656,400 1.52%
Virginia 52,700 3,739,700 1.41%
Missouri 38,700 2,774,000 1.40%
Maryland 37,800 2,827,400 1.34%
Iowa 20,300 1,530,400 1.33%
New Mexico 11,500 868,100 1.32%
South Dakota 5,300 407,600 1.30%
Florida 106,100 8,204,700 1.29%
Kansas 17,500 1,370,300 1.28%
Oklahoma 20,400 1,626,900 1.25%
Delaware 5,000 407,900 1.23%
Nebraska 10,600 908,100 1.17%
Nevada 13,200 1,206,800 1.09%
West Virginia 7,200 753,200 0.96%
District of Columbia 2,600 286,400 0.91%
Louisiana 15,300 1,872,100 0.82%
North Dakota 2,700 336,900 0.80%
Hawaii 4,300 605,800 0.71%
Montana 2,800 464,900 0.60%
Alaska 1,800 322,300 0.56%
Wyoming 1,500 268,800 0.56%
Total** 2,742,200 141,348,700 1.94%
* Average state employment in 2005–2007. Analysis based on pooled, three-year time series data from the U.S. Census American
Community Survey, as described in the Appendix.
** Total may vary slightly due to rounding.
Source: Author’s analysis of U.S. Census Bureau (2009), U.S. International Trade Commission (2012), and Bureau of Labor Statist-
ics Office of Employment Projections (2011a and 2011b). For a more detailed explanation of data sources and computations, see
the Appendix.
Figure B shows the broad impact of growing trade deficits
with China across the United States, with no areas
exempt. Job losses have been most concentrated in states
with high-tech industries, such as California, Massachu-
setts, Oregon, Minnesota, Idaho, Colorado, and Texas,
and in manufacturing states, including New Hampshire,
EPI BRIEFING PAPER #345 | AUGUST 23, 2012 PAGE 18
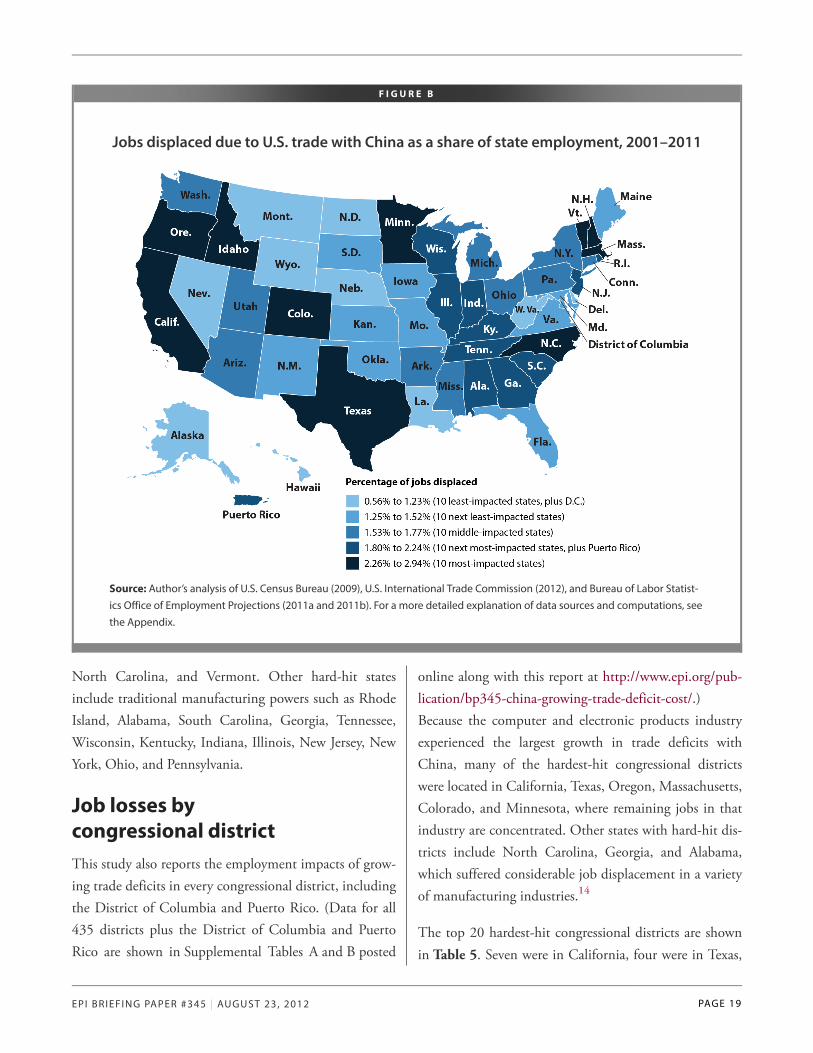
F I G U R E B
Jobs displaced due to U.S. trade with China as a share of state employment, 2001–2011
Source: Author’s analysis of U.S. Census Bureau (2009), U.S. International Trade Commission (2012), and Bureau of Labor Statist-
ics Office of Employment Projections (2011a and 2011b). For a more detailed explanation of data sources and computations, see
the Appendix.
North Carolina, and Vermont. Other hard-hit states
include traditional manufacturing powers such as Rhode
Island, Alabama, South Carolina, Georgia, Tennessee,
Wisconsin, Kentucky, Indiana, Illinois, New Jersey, New
York, Ohio, and Pennsylvania.
Job losses bycongressional district
This study also reports the employment impacts of grow-
ing trade deficits in every congressional district, including
the District of Columbia and Puerto Rico. (Data for all
435 districts plus the District of Columbia and Puerto
Rico are shown in Supplemental Tables A and B posted
online along with this report at http://www.epi.org/pub-
lication/bp345-china-growing-trade-deficit-cost/.)
Because the computer and electronic products industry
experienced the largest growth in trade deficits with
China, many of the hardest-hit congressional districts
were located in California, Texas, Oregon, Massachusetts,
Colorado, and Minnesota, where remaining jobs in that
industry are concentrated. Other states with hard-hit dis-
tricts include North Carolina, Georgia, and Alabama,
which suffered considerable job displacement in a variety
of manufacturing industries.14
The top 20 hardest-hit congressional districts are shown
in Table 5. Seven were in California, four were in Texas,
EPI BRIEFING PAPER #345 | AUGUST 23, 2012 PAGE 19
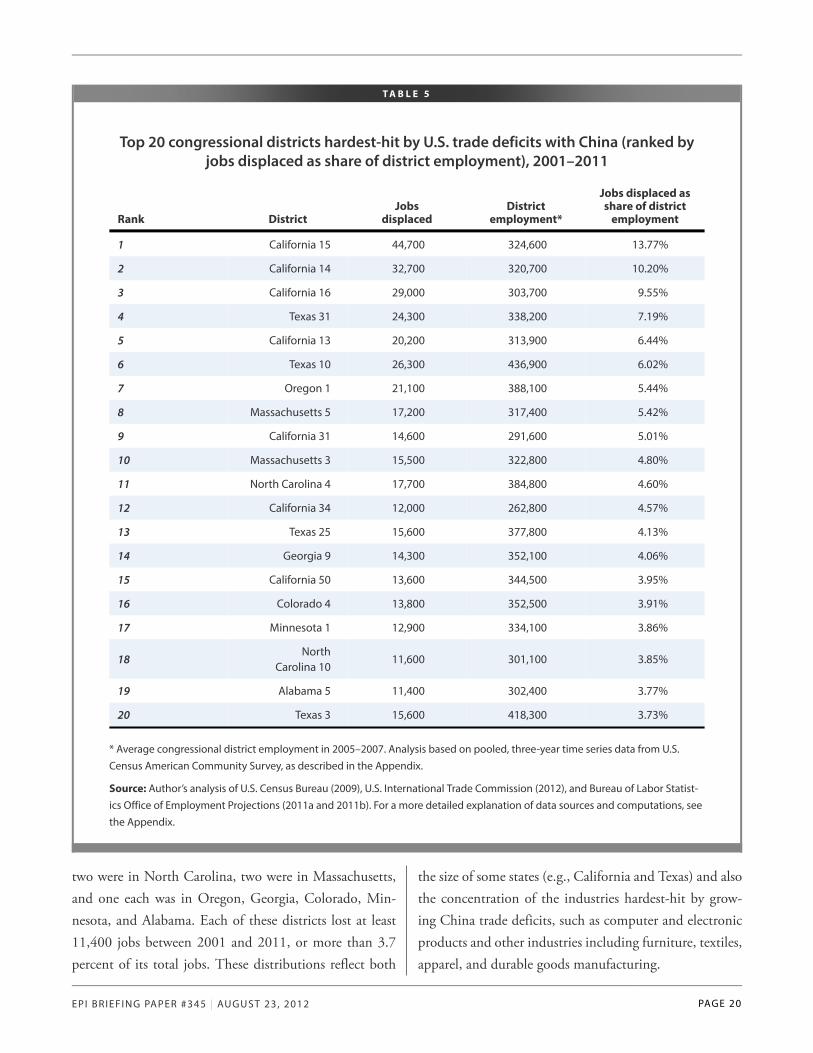
T A B L E 5
Top 20 congressional districts hardest-hit by U.S. trade deficits with China (ranked byjobs displaced as share of district employment), 2001–2011
Rank DistrictJobs
displacedDistrict
employment*
Jobs displaced asshare of district
employment
1 California 15 44,700 324,600 13.77%
2 California 14 32,700 320,700 10.20%
3 California 16 29,000 303,700 9.55%
4 Texas 31 24,300 338,200 7.19%
5 California 13 20,200 313,900 6.44%
6 Texas 10 26,300 436,900 6.02%
7 Oregon 1 21,100 388,100 5.44%
8 Massachusetts 5 17,200 317,400 5.42%
9 California 31 14,600 291,600 5.01%
10 Massachusetts 3 15,500 322,800 4.80%
11 North Carolina 4 17,700 384,800 4.60%
12 California 34 12,000 262,800 4.57%
13 Texas 25 15,600 377,800 4.13%
14 Georgia 9 14,300 352,100 4.06%
15 California 50 13,600 344,500 3.95%
16 Colorado 4 13,800 352,500 3.91%
17 Minnesota 1 12,900 334,100 3.86%
18North
Carolina 1011,600 301,100 3.85%
19 Alabama 5 11,400 302,400 3.77%
20 Texas 3 15,600 418,300 3.73%
* Average congressional district employment in 2005–2007. Analysis based on pooled, three-year time series data from U.S.
Census American Community Survey, as described in the Appendix.
Source: Author’s analysis of U.S. Census Bureau (2009), U.S. International Trade Commission (2012), and Bureau of Labor Statist-
ics Office of Employment Projections (2011a and 2011b). For a more detailed explanation of data sources and computations, see
the Appendix.
two were in North Carolina, two were in Massachusetts,
and one each was in Oregon, Georgia, Colorado, Min-
nesota, and Alabama. Each of these districts lost at least
11,400 jobs between 2001 and 2011, or more than 3.7
percent of its total jobs. These distributions reflect both
the size of some states (e.g., California and Texas) and also
the concentration of the industries hardest-hit by grow-
ing China trade deficits, such as computer and electronic
products and other industries including furniture, textiles,
apparel, and durable goods manufacturing.
EPI BRIEFING PAPER #345 | AUGUST 23, 2012 PAGE 20
The three hardest-hit congressional districts were all loc-
ated in Silicon Valley in California, including the 15th
(Santa Clara County), the 14th (Palo Alto and nearby
cities), and the 16th (San Jose and other parts of Santa
Clara County).
Summing up trade’s overallemployment and wage impact
Growing trade deficits with China have clearly reduced
domestic employment in traded-goods industries, espe-
cially in the manufacturing sector, which has been
pummeled by plant closings and job losses. Workers from
the manufacturing sector displaced by trade have had par-
ticular difficulty securing comparable employment else-
where in the economy. Many have not been reemployed,
and more than half of those reemployed have experienced
a decline in wages. One-third experienced a wage decline
of more than 20 percent, according to the most recent
Bureau of Labor Statistics survey covering workers dis-
placed from January 2007 to December 2009 (BLS
2010). Nearly two-thirds (61.3 percent) of displaced
workers in manufacturing remained unemployed, includ-
ing 16.7 percent who were not in the labor force. The
average wage decline for those who were reemployed was
17.5 percent (Farber 2011, 21). The lost output of unem-
ployed workers, especially that of labor force dropouts,
can never be regained and is one of the largest costs of dis-
placement to the economy as a whole.
Some economists and others have argued that job loss
numbers extrapolated from trade flows are uninformative
because aggregate employment levels in the United States
are set by a broad range of macroeconomic influences, not
just by trade flows.15 However, while the trade balance is
but one of many variables affecting aggregate job creation,
it plays a much larger role in explaining structural change
in employment, especially in the manufacturing sector.
Between December 2001 and December 2011, 3.9 mil-
lion U.S. manufacturing jobs were lost (Bureau of Labor
Statistics 2012a). The growth of U.S. trade deficits with
China was responsible for the displacement of more than
2.1 million manufacturing jobs in this period, or about
54 percent of manufacturing jobs lost.16
The employment impacts of trade identified in this paper
can be interpreted as the “all else equal” effect of trade on
domestic employment. The Federal Reserve, for example,
may decide to cut interest rates to make up for job losses
stemming from deteriorating trade balances (or any other
economic influence), leaving net employment
unchanged. This, however, does not change the fact that
trade deficits by themselves are a net drain on employ-
ment.
Many of the mechanisms that could offset employment
losses caused by growing trade deficits are not operating
in the current downturn. The Federal Reserve cannot cut
interest rates any further than it already has, and interest-
rate-sensitive industries such as residential construction
are not experiencing employment gains from lower rates.
In short, in today’s economy with its high unemployment
rate, jobs displaced due to trade deficits with China are
much more likely to be actual net, economy-wide losses
than simply job reallocations.
Conclusion
The growing U.S. trade deficit with China has displaced
millions of jobs in the United States and contributed
heavily to the crisis in U.S. manufacturing employment,
which has heightened over the last decade largely due to
trade with China. Moreover, the United States is piling
up foreign debt, losing export capacity, and facing a more
fragile macroeconomic environment.
Is America’s loss China’s gain? The answer is not clearly
affirmative. China has become dependent on the U.S.
consumer market for employment generation, suppressed
the purchasing power of its own middle class with a weak
currency, and, most important, now holds over $3 tril-
lion in hard currency reserves instead of investing them
in public goods that could benefit Chinese households.
EPI BRIEFING PAPER #345 | AUGUST 23, 2012 PAGE 21
Although economic growth in China has been rapid, it is
unbalanced and unsustainable. Its vast purchases of for-
eign exchange reserves have led to the overheating of its
domestic economy, and inflation in China has accelerated
rapidly in the recent past. Its repression of labor rights has
suppressed wages, thereby artificially subsidizing exports.
China’s economy is teetering on the edge between infla-
tion and a growth slump, and a soft landing is nowhere
in sight. China needs to rebalance its economy by becom-
ing less dependent on exports and more dependent on
domestic demand led by higher wages and infrastruc-
ture spending.
The U.S.-China trade relationship needs a fundamental
change. Addressing the exchange rate policies and labor
standards issues in the Chinese economy is an important
first step. It is time for the administration to respond to
the growing chorus of calls from economists, workers,
businesses, and Congress and take action to stop illegal
currency manipulation by China and other countries.
—The author thanks Ross Eisenbrey for comments, Hilary
Wething for research assistance, Michael McCarthy and
Patrick Watson for editing, and Dan Essrow for graphic
design assistance.
—This research was made possible by support from
the Alliance for American Manufacturing.
Appendix
Methodology
The trade and employment analyses in this report are
based on a detailed, industry-based study of the relation-
ships between changes in trade flows and employment
for each of approximately 195 individual industries of
the U.S. economy, specially grouped into 53 custom sec-
tors17 and using the North American Industry Classific-
ation System (NAICS) with data obtained from the U.S.
Census Bureau (2009) and the U.S. International Trade
Commission (USITC 2012).
This study separates exports produced domestically from
foreign exports—which are goods produced in other
countries, exported to the United States, and then re-
exported from the United States. Because only domestic-
ally produced exports generate jobs in the United States,
employment calculations here are based only on domestic
exports. The measure of the net impact of trade used
here to calculate the employment content of trade is the
difference between domestic exports and consump-
tion imports.
The number of jobs supported by $1 million of exports
or imports for each of 195 different U.S. industries is
estimated using a labor requirements model derived from
an input-output table developed by the BLS–OEP
(2011a).18 This model includes both the direct effects of
changes in output (for example, the number of jobs sup-
ported by $1 million in auto assembly) and the indirect
effects on industries that supply goods used in the manu-
facture of cars. The indirect impacts include jobs in auto
parts, steel, and rubber, as well as service industries such
as accounting, finance, and computer programming. This
model estimates the labor content of trade using empirical
estimates of labor content and trade flows between U.S.
industries in a given base year (an input-output table for
the year 2001 was used in this study) that were developed
by the U.S. Department of Commerce and the BLS–OEP.
It is not a statistical survey of actual jobs gained or lost in
individual companies, or the opening or closing of partic-
ular production facilities (Bronfenbrenner and Luce 2004
is one of the few studies based on news reports of indi-
vidual plant closings).
Nominal trade data used in this analysis were converted
to constant 2005 dollars using industry-specific deflators
(see next section for further details). This was necessary
because the labor requirements table was estimated using
price levels in that year. Data on real trade flows were
converted to constant 2005 dollars using industry-specific
price deflators from the BLS–OEP (2011b). These price
deflators were updated using Bureau of Labor Statistics
EPI BRIEFING PAPER #345 | AUGUST 23, 2012 PAGE 22
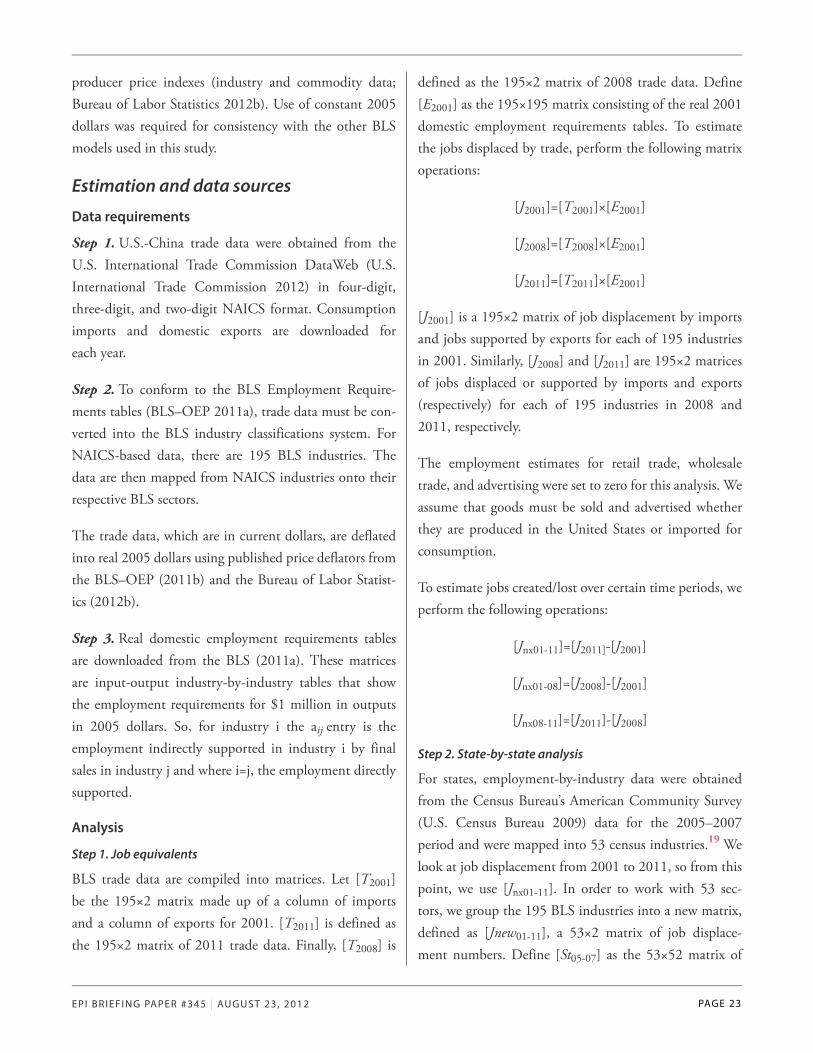
producer price indexes (industry and commodity data;
Bureau of Labor Statistics 2012b). Use of constant 2005
dollars was required for consistency with the other BLS
models used in this study.
Estimation and data sources
Data requirements
Step 1. U.S.-China trade data were obtained from the
U.S. International Trade Commission DataWeb (U.S.
International Trade Commission 2012) in four-digit,
three-digit, and two-digit NAICS format. Consumption
imports and domestic exports are downloaded for
each year.
Step 2. To conform to the BLS Employment Require-
ments tables (BLS–OEP 2011a), trade data must be con-
verted into the BLS industry classifications system. For
NAICS-based data, there are 195 BLS industries. The
data are then mapped from NAICS industries onto their
respective BLS sectors.
The trade data, which are in current dollars, are deflated
into real 2005 dollars using published price deflators from
the BLS–OEP (2011b) and the Bureau of Labor Statist-
ics (2012b).
Step 3. Real domestic employment requirements tables
are downloaded from the BLS (2011a). These matrices
are input-output industry-by-industry tables that show
the employment requirements for $1 million in outputs
in 2005 dollars. So, for industry i the aij entry is the
employment indirectly supported in industry i by final
sales in industry j and where i=j, the employment directly
supported.
Analysis
Step 1. Job equivalents
BLS trade data are compiled into matrices. Let [T2001]
be the 195×2 matrix made up of a column of imports
and a column of exports for 2001. [T2011] is defined as
the 195×2 matrix of 2011 trade data. Finally, [T2008] is
defined as the 195×2 matrix of 2008 trade data. Define
[E2001] as the 195×195 matrix consisting of the real 2001
domestic employment requirements tables. To estimate
the jobs displaced by trade, perform the following matrix
operations:
[J2001]=[T2001]×[E2001]
[J2008]=[T2008]×[E2001]
[J2011]=[T2011]×[E2001]
[J2001] is a 195×2 matrix of job displacement by imports
and jobs supported by exports for each of 195 industries
in 2001. Similarly, [J2008] and [J2011] are 195×2 matrices
of jobs displaced or supported by imports and exports
(respectively) for each of 195 industries in 2008 and
2011, respectively.
The employment estimates for retail trade, wholesale
trade, and advertising were set to zero for this analysis. We
assume that goods must be sold and advertised whether
they are produced in the United States or imported for
consumption.
To estimate jobs created/lost over certain time periods, we
perform the following operations:
[Jnx01-11]=[J2011]-[J2001]
[Jnx01-08]=[J2008]-[J2001]
[Jnx08-11]=[J2011]-[J2008]
Step 2. State-by-state analysis
For states, employment-by-industry data were obtained
from the Census Bureau’s American Community Survey
(U.S. Census Bureau 2009) data for the 2005–2007
period and were mapped into 53 census industries.19 We
look at job displacement from 2001 to 2011, so from this
point, we use [Jnx01-11]. In order to work with 53 sec-
tors, we group the 195 BLS industries into a new matrix,
defined as [Jnew01-11], a 53×2 matrix of job displace-
ment numbers. Define [St05-07] as the 53×52 matrix of
EPI BRIEFING PAPER #345 | AUGUST 23, 2012 PAGE 23
state employment shares (with the addition of the District
of Columbia and Puerto Rico) of employment in each
industry. Calculate:
[Stjnx01-11]=[St05-07]T [Jnew01-11]
where [Stjnx01-11] is the 53×52 matrix of job displace-
ment/support by state by industry. To get state total job
displacement, we add up the subsectors in each state.
Step 3. Congressional district analysis
Employment by congressional district, by industry, by
state is obtained from the ACS data from 2005–2007. In
order to calculate job displacement in each congressional
district, we use each column in [Stjnx01-11], which repres-
ent individual state job-displacement-by-industry estim-
ates, and define them as [Stj01], [Stj02], [Stji]…[Stj52],
with i representing the state number and each matrix
being 53×1.
Each state has Y congressional districts, so [Cdi] is defined
as the 53xY matrix of congressional district employment
shares for each state. Congressional district shares are cal-
culated thus:
[Cdj01]=[Stj01]T [Cd01]
[Cdji]=[Stji]T [Cdi]
[Cdj52]=[Stj52]T Cd52]
where [Cdji] is defined as the 53xY job displacement in
state i by congressional district by industry.
Congressional districts are estimated for the 110th Con-
gress, which met from January 2007 through January
3, 2009 (including a lame duck session) (Beth and
Soltis 2009).
To get total job displacement by congressional district,
we add up the subsectors in each congressional district in
each state.
Endnotes1. Direct jobs displaced refer to jobs displaced within a given
industry, such as motor vehicles and parts. Indirect jobs
displaced are those displaced in industries that supply inputs
into that sector, such as primary metal (e.g., steel), plastics
and rubber products (e.g., tires and hoses), transportation,
and information. Re-spending employment results from the
spending of wages by employed workers. It is one form of a
macroeconomic multiplier.
2. The official name of the Chinese currency is the renminbi
(RMB) and the units of value are yuan, the term used to
describe the currency throughout this paper.
3. Over the past two decades, China first massively devalued its
currency (in 1994) and then gradually increased its value,
especially after 2005. While the yuan gained 31 percent in
nominal terms between 2005 and 2011 (IMF 2012a), its
nominal, 2011 value (at year end) remained 17 percent
below the par value in 1990. As Gagnon notes, “In many
developing countries, manipulation prevented the normal
trend appreciation associated with rapid economic growth
rather than causing any outright depreciation. The point is
that without trend appreciation, such countries experience
growing trade and currency account surpluses” (Gagnon
2012, 3, note 2). Such countries would normally experience
trend appreciation due to rapid productivity growth,
especially in manufacturing (the sector that generates most
exports). Between 1995 and 2009 China experienced
manufacturing productivity growth that ranged between 6.7
percent and 9.6 percent per year
(FutureofUSChinaTrade.com 2012). Over the same period,
productivity growth in U.S. manufacturing averaged only
2.4 percent per year (BLS 2012c).
4. China’s accumulation of total foreign exchange reserves
(minus gold) between 2001 and 2011 accounted for more
than one-third (36.6 percent) of total world accumulation of
reserves, exceeding the next largest accumulator (Saudi
Arabia) by 466 percent. As a result, China’s current account
surplus was the largest, by far, of the 20 top currency
manipulators identified by Gagnon (2012, 7, Table 1). In
2010 China’s current account surplus was a self-reported
$305.3 billion, which was 31 percent of the current account
surpluses of the top 20 currency manipulators (IMF 2012b).
EPI BRIEFING PAPER #345 | AUGUST 23, 2012 PAGE 24
The IMF conservatively projects that China’s share of the
global current account surplus of these 20 countries will rise
to 53 percent in 2017, assuming continuation of
current policies.
5. The Senate failed to consider a companion measure to H.R.
2378 in the 111th Congress.
6. Jeanne, Subramanian, and Williamson (2012) have recently
published a book questioning the need for open capital
accounts, especially for central bank purchases of
government debt securities (such as U.S. Treasuries). They
note that the economic literature has shown that such
transfers make no contribution to economic growth. While
they call for the use of price regulation (through taxes on
foreign capital inflows), their arguments also support the case
for outright restrictions on certain types of foreign capital
movement, such as systematic foreign exchange intervention
by central banks.
7. China’s admission to the WTO was endorsed by the United
States in domestic legislation that offered China permanent
normal trade relations status.
8. Beginning in 2002, the dollar declined more than 30 percent
against several major currencies such as the euro and the
Canadian dollar. However, yuan appreciation was largely
delayed until late 2007 and 2008—too little to be of any
help in slowing the current U.S.-China trade gap to date.
The appreciation of the yuan has had little effect on the
prices of U.S. imports from China, which rose only 2.5
percent between July 2005 (when the yuan was first
adjusted) and May 2008, much less than the 19 percent
appreciation of the yuan in that period (Congressional
Budget Office 2008, 2). Furthermore, given the continuing
rapid growth in manufacturing labor productivity in China
relative to the United States and other developed countries,
there must be trend appreciation in the yuan for China to
simply maintain its global trade surplus, as noted by Gagnon
(2012, 3, note 2).
9. The analysis in this report is based on domestic exports, as
shown in Table 1, and excludes re-exports—which are goods
produced in other countries, imported into the United
States, and then re-exported to China. Since re-exports are
not produced domestically, their production does not
support domestic employment, and they are excluded from
the model used here.
10. Tables 1 and 2 report U.S. imports for consumption and
domestic exports to China. These flows were chosen to
emphasize goods produced and consumed in the United
States. News reports from the Census Bureau and the
Commerce Department usually emphasize general imports
and total exports. Total exports as reported by the Census
Bureau include re-exports, i.e., goods produced in other
countries and shipped through the United States. For 2011,
general imports from China were $399.3 billion, total
exports were $103.9 billion, and the reported trade balance
was -$295.5 billion (U.S. International Trade
Commission 2012).
11. Scrap and used or second-hand goods are industries 192
and 193, respectively, in the BLS model, and there are no
jobs supported or displaced by trade in these sectors,
according to the BLS model.
12. ATPs are an amalgamation of products from a variety of
industries and subsectors within the broad NAICS-based
categories shown in Table 2. They consist of 10 categories of
products including biotechnology, life science,
opto-electronics, information and communications,
electronics, flexible manufacturing, advanced materials,
aerospace, weapons, and nuclear technology (U.S. Census
Bureau 2012a). In total ATP trade with the world, the
United States had exports of $286.8 billion and imports of
$386.4 billion in 2011, and a trade deficit of $99.6 billion.
The United States had total ATP exports to China in 2011
of $20.1 billion and imports of $129.5 billion, and a trade
deficit of $109.4 billion. This exceeded the overall U.S. ATP
deficit of $99.6 billion. Thus, the United States had an ATP
trade surplus with the rest of the world in 2011 of $9.7
billion (U.S. Census Bureau 2012c).
13. Deflators for many sectors in the computer and electronics
products industry fell sharply between 2001 and 2011 due to
rapid productivity growth in those sectors. For example, the
price index for computer and peripheral products fell from
1,695.8 in 2001 to 620 in 2011, a decline of 63.4 percent
(the price index is set at 1000 in 2005, the base year). In
order to convert from nominal to real values for 2011, for
example, the nominal value is multiplied by 1000/620 (the
price index in year 2011) = 1.61. Thus, the real value of
EPI BRIEFING PAPER #345 | AUGUST 23, 2012 PAGE 25
computers and peripheral products is at least 50 percent
greater than the nominal value in 2011. The average price
deflator in computer and electronic products declined 22.2
percent between 2001 and 2011, and real values exceeded
nominal values by 33.0 percent on a trade-weighted basis.
14. California, Colorado, Idaho, Massachusetts, Minnesota,
Oregon, and Texas, all hard-hit states in Figure B, were
especially hard-hit in the computer and electronic products
industries. The shares of jobs lost in this sector ranged from
54.7 percent in Texas to 71.1 percent in Idaho, compared
with the national average of 38.8 percent of jobs displaced in
this industry (unpublished research results available upon
request). Other hard-hit states with a concentration in
manufacturing were New Hampshire (86.7 percent of jobs
displaced in manufacturing), North Carolina (84.8 percent),
and Vermont (86.9 percent), versus the national average of
76.9 percent. New Hampshire and Vermont also saw heavy
displacements in computer and electronic products within
manufacturing, with shares of 56.6 percent and 60.0
percent, respectively.
15. One frequently repeated criticism of trade and employment
studies is that the growth of imports does not displace
domestic production. Some assert that if imports from
China fell, they would be replaced by imports from some
other low-wage country (see, for example, U.S.-China
Business Council 2011). However, important new empirical
research by Autor, Dorn, and Hanson (2012, 4) has shown
that “increased exposure to low-income country imports is
associated with rising unemployment, decreased labor-force
participation, and increased use of disability and other
transfer benefits, as well as with lower wages…” The bottom
line is that “trade creates new jobs in exporting industries
and destroys jobs when imports replace the output of
domestic firms. Because trade deficits have risen over the past
decade, more jobs have been displaced by imports than
created by exports” (Bivens 2008b, 1).
16. An additional 1.4 million manufacturing jobs were lost or
displaced between January and December 2001, prior to
China’s entry into the WTO. Thus, a total of 5.3 million
manufacturing jobs were lost between 2001 and 2011. From
the depths of the downturn in manufacturing employment,
in February 2010, through July 2012, 528,000 jobs were
recovered (Bureau of Labor Statistics 2012a). Thus,
structural factors were likely responsible for the bulk of
manufacturing job loss between 2001 and 2011. See Autor,
Dorn, and Hanson (2012) for additional research on the
impact of China trade on U.S. manufacturing employment
and wages.
17. The previous edition of this research used data for 56
industries provided by the ACS (Scott 2011c). The
BLS–OEP consolidated several industries, including textiles
and apparel, which required us to consolidate data for these
sectors in our ACS state and congressional district models.
Other “not elsewhere classified” industries were consolidated
with other sectors (e.g., “miscellaneous manufacturing”) or
deleted (“not specified metal industries”) to update and
refine the crosswalk from BLS–OEP to ACS industries. As a
result of these consolidations, there are 53 industries in the
ACS dataset used for this study.
18. The model includes 195 NAICS industries. The trade data
include only goods trade. Goods trade data are available for
85 commodity-based industries, plus software, waste and
scrap, used or second-hand merchandise, and goods traded
under special classification provisions (e.g., goods imported
from and returned to Canada; small, unclassified shipments).
Trade in scrap, used, and second-hand goods has no impacts
on employment in the BLS model. Some special
classification provision goods are assigned to miscellaneous
manufacturing.
19. The Census Bureau uses its own table of definitions of
industries. These are similar to NAICS-based industry
definitions, but at a somewhat higher level of aggregation.
For this study, we developed a crosswalk from NAICS to
Census industries, and used population estimates from the
ACS for each cell in this matrix.
ReferencesAFL-CIO, Benjamin L. Cardin, and Christopher H. Smith.
2006. “Section 301 Petition [on China’s repression of workers’
rights].” June 8.
Autor, David H., David Dorn, and Gordon H. Hanson. 2012.
The China Syndrome: Local Labor Market Effects of Import
Competition in the United States. National Bureau of Economic
Research, Working Paper #18054. http://www.nber.org/papers/
w18054
EPI BRIEFING PAPER #345 | AUGUST 23, 2012 PAGE 26
Bailey, Martin N., and Robert Z. Lawrence. 2004. “What
Happened to the Great U.S. Jobs Machine: The Role of Trade
and Electronic Offshoring.” Brookings Papers on Economic
Activity, vol. 35, no. 2, pp. 211–284.
http://www.brookings.edu/~/media/Files/Programs/ES/BPEA/
2004_2_bpea_papers/2004b_bpea_baily.pdf
Beth, Richard S., and Momoko Soltis. 2009. Lame Duck
Sessions of Congress, 1935-2008 (74th–110th Congresses).
Congressional Research Service. RL33677.
http://www.senate.gov/reference/resources/pdf/RL33677.pdf
Bivens, L. Josh. 2008a. Everybody Wins, Except for Most of Us:
What Economics Teaches About Globalization. Washington,
D.C.: EPI.
Bivens, L. Josh. 2008b. Trade, Jobs, and Wages: Are the Public’s
Worries About Globalization Justified? Economic Policy Institute,
Issue Brief #244. http://www.epi.org/publication/ib244/
Bloomberg News. 2012. “China New Yuan Loans Top Forecasts:
Forex Reserves Shrink,” July 12. http://www.bloomberg.com/
news/2012-07-12/china-new-yuan-loans-top-forecasts-forex-
reserves-decline-1-.html
Brock, H. Woody. 2012. American Gridlock: Why the Right and
Left Are Both Wrong: Commonsense 101 Solutions to the
Economic Crises. Hoboken, N.J.: John Wiley & Sons.
Bronfenbrenner, Kate, and Stephanie Luce. 2004. The
Changing Nature of Corporate Global Restructuring: The Impact
of Production Shifts on Jobs in the U.S., China, and Around the
Globe. Commissioned research paper for the U.S. Trade Deficit
Review Commission. http://www.uscc.gov/researchpapers/
2004/cornell_u_mass_report.pdf.
Bureau of Labor Statistics (BLS). 2010. “Displaced Workers
Summary: Worker Displacement: 2007–2009.”
http://www.bls.gov/news.release/disp.nr0.htm
Bureau of Labor Statistics (BLS). 2012a. “Employment, Hours,
and Earnings from the Current Employment Statistics Survey
(National): Manufacturing Employment [Excel file].”
http://data.bls.gov/cgi-bin/surveymost?ce
Bureau of Labor Statistics (BLS). 2012b. “Producer Price
Indexes: Industry and Commodity data [Excel files].”
http://stats.bls.gov/ppi/
Bureau of Labor Statistics (BLS). 2012c. “Major Sector
Productivity and Costs: Manufacturing-(Output Per Hour),
Present Change From Previous Quarter [Excel file].”
http://data.bls.gov/cgi-bin/surveymost?pr
Bureau of Labor Statistics, Office of Employment Projections
(BLS–OEP). 2011a. “Special Purpose Files—Employment
Requirements; Chain-Weighted (2005 dollars) Real Domestic
Employment Requirements Table for 2001 [DAT file,
converted to Excel sheet and Stata data file].”
http://www.bls.gov/emp/ep_data_emp_requirements.htm
Bureau of Labor Statistics, Office of Employment Projections
(BLS–OEP). 2011b. “Special Purpose Files—Industry Output
and Employment – Industry Output [DAT File, converted to
Excel sheet and Stata data file].” http://www.bls.gov/emp/ep_
data_industry_out_and_emp.htm
Clinton, Bill. 2000. “Expanding Trade, Protecting Values: Why
I’ll Fight to Make China’s Trade Status Permanent.” New
Democrat, vol. 12, no. 1, pp. 9–11.
Congressional Budget Office (CBO). 2008. How Changes in the
Value of the Chinese Currency Affect U.S. Imports.
http://www.cbo.gov/publication/41713
Farber, Henry S. 2011. Job Loss in the Great Recession: Historical
Perspective From the Displaced Workers Survey, 1984–2010.
Working Paper #17040. National Bureau of Economic
Research. http://www.nber.org/papers/w17040
FutureofUSChinaTrade.com. 2012. “Labor Productivity
Growth: Emerging Economies” (graph).
http://www.chinaglobaltrade.com/fact/labor-productivity-
growth-emerging-economies-graph. Accessed July 31, 2012.
Gagnon, Joseph E. 2011. “For a Serious Impact, Tax Chinese
Assets in the United States.” U.S. News and World Report,
October 13. http://iie.com/publications/opeds/
oped.cfm?ResearchID=1954
Gagnon, Joseph E. 2012. Combating Widespread Currency
Manipulation. Policy Brief #PB12-19. Peterson Institute for
International Economics. http://iie.com/publications/
interstitial.cfm?ResearchID=2166
Gagnon, Joseph E., and Gary Clyde Hufbauer. 2011. “Taxing
China’s Assets: How to Increase U.S. Employment Without
EPI BRIEFING PAPER #345 | AUGUST 23, 2012 PAGE 27
Launching a Trade War.” Foreign Affairs, April 25.
http://iie.com/publications/opeds/oped.cfm?ResearchID=1818
Gros, Daniel. 2010. “How to Avoid a Trade War: A Reciprocity
Requirement.” VoxEU.org, October 8. http://www.voxeu.org/
article/how-avoid-trade-war-reciprocity-requirement
Groshen, Erica L., Bart Hobijn, and Margaret M. McConnell.
2005. “U.S. Jobs Gained and Lost Through Trade: A Net
Measure.” Current Issues in Economics and Finance, vol. 11, no.
8, pp. 1–7. http://www.newyorkfed.org/research/current_
issues/ci11-8.html
Haley, Usha C.V. 2008. Shedding Light on Energy Subsidies in
China: An Analysis of China’s Steel Industry From 2000–2007.
Alliance for American Manufacturing.
http://www.americanmanufacturing.org/wordpress/wp-
content/uploads/2008/01/energy-subsidies-in-china-jan-8-
08.pdf
Haley, Usha C.V. 2009. Through China’s Looking Glass:Subsidies
to the Chinese Glass Industry From 2004-08. Economic Policy
Institute, Briefing Paper #242. http://www.epi.org/
publications/entry/bp242/
Haley, Usha C.V. 2012. Putting the Pedal to the Metal: Subsidies
to China’s Auto-Parts Industry from 2001 to 2011. Economic
Policy Institute, Briefing Paper #316. http://www.epi.org/
publication/bp316-china-auto-parts-industry/
International Monetary Fund (IMF). 2012a. “International
Financial Statistics CD-ROM.” Washington, D.C.: IMF.
International Monetary Fund (IMF). 2012b. “World Economic
Outlook Database.” April 2012 edition [Excel file].
http://www.imf.org/external/pubs/ft/weo/2012/01/weodata/
index.aspx
Jeanne, Olivier, Arvind Subramanian, and John Williamson.
2012. Who Needs to Open the Capital Account? Washington
D.C.: Peterson Institute for International Economics.
http://bookstore.piie.com/book-store//5119.html
Krugman, Paul. 2010. “Chinese New Year.” New York Times.
January 1. http://www.nytimes.com/2010/01/01/opinion/
01krugman.html
Miller, Matt. 2012. “Who Will Get Tough on China?”
Washington Post. July 25. http://www.washingtonpost.com/
opinions/who-will-get-tough-on-china/2012/07/25/
gJQA8Y6w8W_story.html
Ministry of Commerce, China, Foreign Direct Investment
Department—Invest in China. 2012. “Import & Export
Statistics by FIEs From Jan to Dec 2011.”
http://www.fdi.gov.cn/pub/FDI_EN/Statistics/FDIStatistics/
IEStatisticsbyFIEs/t20120119_140577.htm
OpenCongress.org. 2012. “H.R. 2378—Currency Reform for
Fair Trade Act.” http://www.opencongress.org/bill/111-h2378/
show
Palmer, Doug. 2011. “China May be Worst Protectionist Ever:
U.S. Analyst.” Reuters.com, August 12.
http://www.reuters.com/article/2011/08/12/us-usa-china-
currency-idUSTRE77B4VB20110812
Scott, Robert E. 2007. The Hidden Costs of Insourcing: Higher
Trade Deficits and Job Losses for U.S. Workers. Economic Policy
Institute, Issue Brief #236. http://www.epi.org/publication/
ib236/
Scott, Robert E. 2010. China’s Subsidies to Green Industries Lead
to Growing Trade Deficits in Clean Energy Products. Economic
Policy Institute, Issue Brief #287. http://www.epi.org/
publications/entry/ib287/
Scott, Robert E. 2011a. The Benefits of Revaluation: Full
Revaluation of the Chinese Yuan Would Increase U.S. GDP and
Employment, Reduce the Federal Budget Deficit and Help Workers
in China and Other Asian Countries. Economic Policy Institute,
Briefing Paper #318. http://www.epi.org/publications/entry/
revaluing_chinas_currency_could_boost_us_economic_
recovery/
Scott, Robert E. 2011b. “Hearing on State-Owned Enterprises
and U.S.-China Bilateral Investment: U.S. Investments in
China.” Testimony before the U.S. China Economic and
Security Review Commission, March 30.
Scott, Robert E. 2011c. Growing U.S. Trade Deficit With China
Cost 2.8 Million Jobs Between 2001 and 2010: Hundreds to
Thousands Displaced in Every U.S. Congressional District.
Economic Policy Institute, Briefing Paper #323.
http://www.epi.org/publication/growing-trade-deficit-china-
cost-2-8-million/
EPI BRIEFING PAPER #345 | AUGUST 23, 2012 PAGE 28
Scott, Robert E. 2012. “Obama Gets Tough on China’s Unfair
Tariffs on U.S. Auto Exports.” Working Economics (Economic
Policy Institute blog), July 6. http://www.epi.org/blog/obama-
tough-chinas-unfair-tariffs-auto-exports/
Scott, Robert E., and Hilary Wething. 2012. Jobs in the U.S.
Auto Parts Industry Are at Risk Due to Subsidized and Unfairly
Traded Chinese Auto Parts. Economic Policy Institute, Briefing
Paper #336. http://www.epi.org/publication/bp336-us-china-
auto-parts-industry/
Stewart, Terence P., and Elizabeth J. Drake. 2010. Written
testimony for Committee on Ways and Means hearing on
China’s Exchange Rate Policy, U.S. House of Representatives,
March 24.
Thomas, Library of Congress. 2012. “Bill Status and Summary:
H.R. 639.” http://thomas.loc.gov
Tschetter, John. 2010. Exports Support American Jobs: Updated
Measure Will Quantify Progress as Global Economy Recovers. U.S.
Department of Commerce, International Trade
Administration. International Trade Research Report #1, April.
http://trade.gov/publications/pdfs/exports-support-american-
jobs.pdf
U.S. Census Bureau. 2009. “American Community Survey:
Custom Tabulation, Employment by State and 110th
Congressional District by Industry, Using Pooled 2005–2007
Data” [Excel file]. http://www.census.gov/acs/www/data_
documentation/custom_tabulations/
U.S. Census Bureau. 2012a. “ATP Code Descriptions.”
http://www.census.gov/foreign-trade/reference/codes/atp/
index.html
U.S. Census Bureau. 2012b. “Current Population Survey,
Historical Time Series, Table A-2: Percent of People 25 Years
and Over Who Have Completed High School or College, by
Race, Hispanic Origin and Sex: Selected Years 1940 to 2011”
[Excel file]. http://www.census.gov/hhes/socdemo/education/
data/cps/historical/tabA-2.xls
U.S. Census Bureau. 2012c. “Monthly Balance, Exports and
Imports of ATP, January 1989–Present.”
http://www.census.gov/foreign-trade/statistics/country/
U.S.-China Business Council. 2011. “USCBC: Flawed Study
on China Jobs and Currency Once Again Distracts from Real
Issues.” U.S.-China Business Council, September 20.
https://www.uschina.org/public/documents/2011/09/china-
jobs-currency.html
U.S. International Trade Commission (USITC). 2012.
“USITC Interactive Tariff and Trade DataWeb” [Excel files].
http://dataweb.usitc.gov/scripts/user_set.asp
Wallach, Lori, and Patrick Woodall. 2011. Whose Trade
Organization: A Comprehensive Guide to the WTO. Washington,
D.C.: Public Citizen.
Xing, Yuqing. 2010. “Facts About and Impacts of FDI on
China and the World Economy.” China: An International
Journal, vol. 8, no. 2, pp. 309–327.
BESbswyBESbswyBESbswyBESbswyBESbswyBESbswyBESbswyBESbswyBESbswyBESbswyBESbswyBESbswyBESbswyBESbswyBESbswyBESbswyBESbswyBESbswyBESbswyBESbswyBESbswyBESbswyBESbswyBESbswyBESbswyBESbswyBESbswyBESbswyBESbswyBESbswyBESbswyBESbswyBESbswyBESbswyBESbswyBESbswyBESbswyBESbswyBESbswyBESbswyBESbswyBESbswyBESbswyBESbswyBESbswyBESbswyBESbswyBESbswyBESbswyBESbswyBESbswyBESbswyBESbswyBESbswyBESbswyBESbswyBESbswyBESbswyBESbswyBESbswyBESbswyBESbswyBESbswyBESbswyBESbswyBESbswyBESbswyBESbswyBESbswyBESbswy
EPI BRIEFING PAPER #345 | AUGUST 23, 2012 PAGE 29
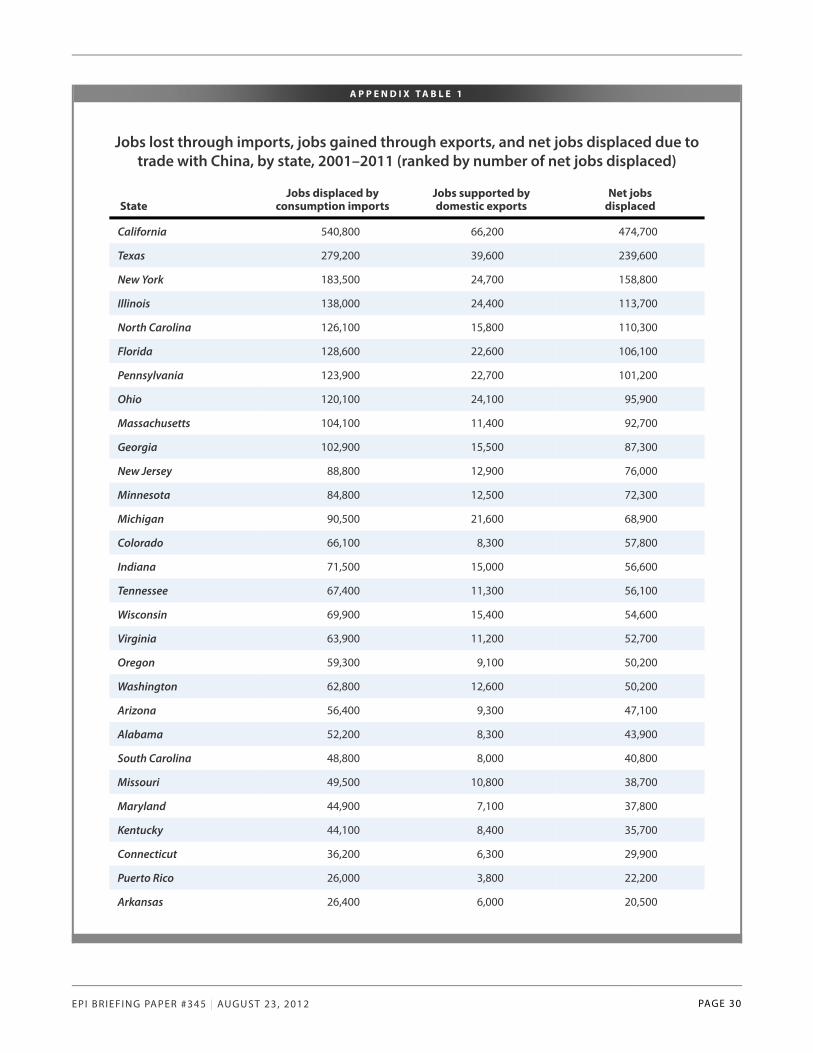
A P P E N D I X T A B L E 1
Jobs lost through imports, jobs gained through exports, and net jobs displaced due totrade with China, by state, 2001–2011 (ranked by number of net jobs displaced)
StateJobs displaced by
consumption importsJobs supported bydomestic exports
Net jobsdisplaced
California 540,800 66,200 474,700
Texas 279,200 39,600 239,600
New York 183,500 24,700 158,800
Illinois 138,000 24,400 113,700
North Carolina 126,100 15,800 110,300
Florida 128,600 22,600 106,100
Pennsylvania 123,900 22,700 101,200
Ohio 120,100 24,100 95,900
Massachusetts 104,100 11,400 92,700
Georgia 102,900 15,500 87,300
New Jersey 88,800 12,900 76,000
Minnesota 84,800 12,500 72,300
Michigan 90,500 21,600 68,900
Colorado 66,100 8,300 57,800
Indiana 71,500 15,000 56,600
Tennessee 67,400 11,300 56,100
Wisconsin 69,900 15,400 54,600
Virginia 63,900 11,200 52,700
Oregon 59,300 9,100 50,200
Washington 62,800 12,600 50,200
Arizona 56,400 9,300 47,100
Alabama 52,200 8,300 43,900
South Carolina 48,800 8,000 40,800
Missouri 49,500 10,800 38,700
Maryland 44,900 7,100 37,800
Kentucky 44,100 8,400 35,700
Connecticut 36,200 6,300 29,900
Puerto Rico 26,000 3,800 22,200
Arkansas 26,400 6,000 20,500
EPI BRIEFING PAPER #345 | AUGUST 23, 2012 PAGE 30
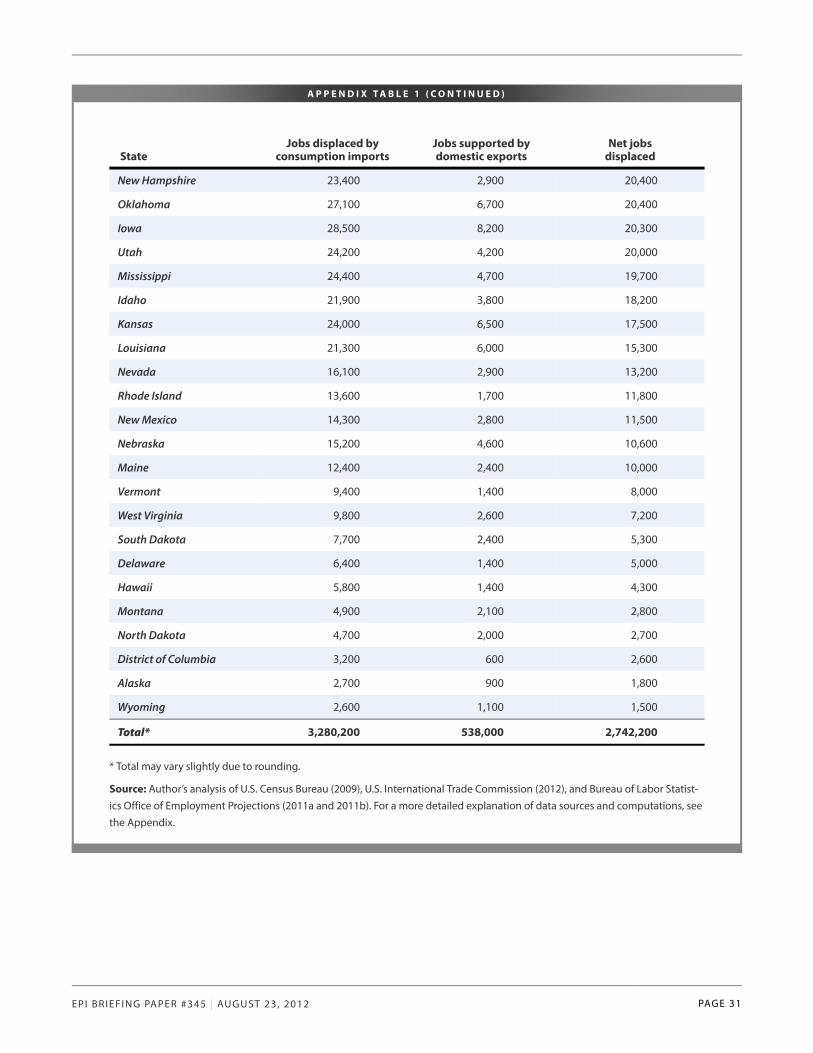
A P P E N D I X T A B L E 1 ( C O N T I N U E D )
StateJobs displaced by
consumption importsJobs supported bydomestic exports
Net jobsdisplaced
New Hampshire 23,400 2,900 20,400
Oklahoma 27,100 6,700 20,400
Iowa 28,500 8,200 20,300
Utah 24,200 4,200 20,000
Mississippi 24,400 4,700 19,700
Idaho 21,900 3,800 18,200
Kansas 24,000 6,500 17,500
Louisiana 21,300 6,000 15,300
Nevada 16,100 2,900 13,200
Rhode Island 13,600 1,700 11,800
New Mexico 14,300 2,800 11,500
Nebraska 15,200 4,600 10,600
Maine 12,400 2,400 10,000
Vermont 9,400 1,400 8,000
West Virginia 9,800 2,600 7,200
South Dakota 7,700 2,400 5,300
Delaware 6,400 1,400 5,000
Hawaii 5,800 1,400 4,300
Montana 4,900 2,100 2,800
North Dakota 4,700 2,000 2,700
District of Columbia 3,200 600 2,600
Alaska 2,700 900 1,800
Wyoming 2,600 1,100 1,500
Total* 3,280,200 538,000 2,742,200
* Total may vary slightly due to rounding.
Source: Author’s analysis of U.S. Census Bureau (2009), U.S. International Trade Commission (2012), and Bureau of Labor Statist-
ics Office of Employment Projections (2011a and 2011b). For a more detailed explanation of data sources and computations, see
the Appendix.
EPI BRIEFING PAPER #345 | AUGUST 23, 2012 PAGE 31
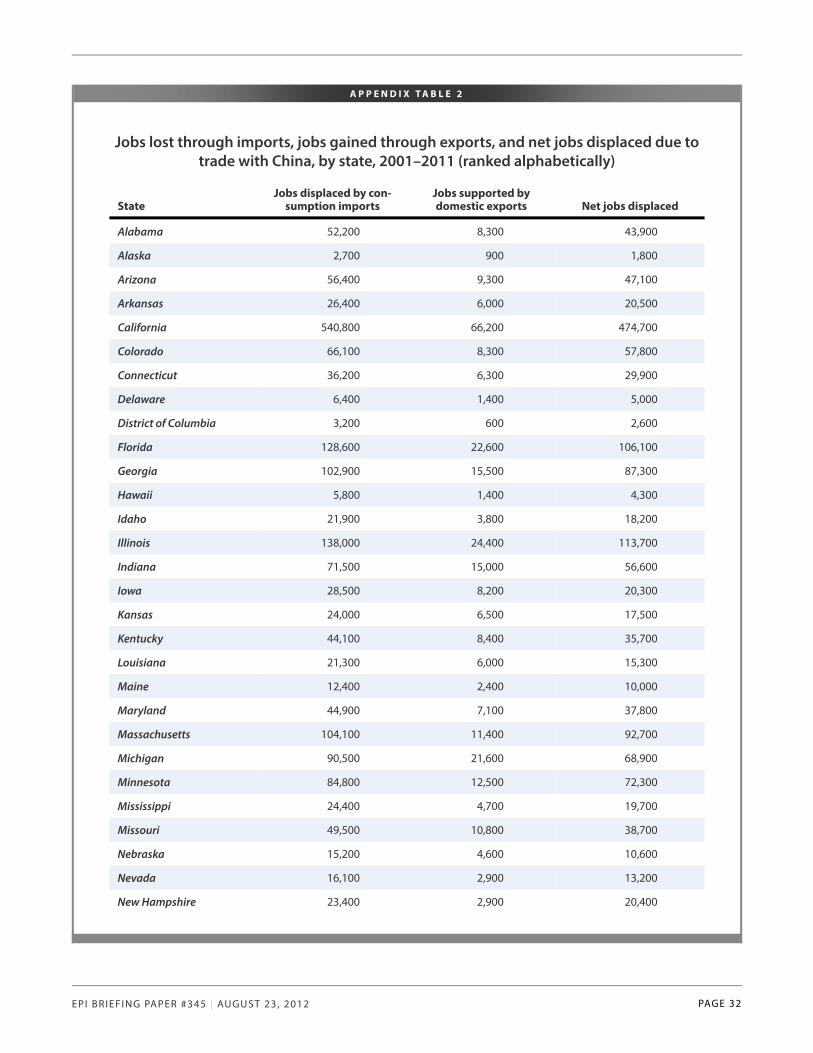
A P P E N D I X T A B L E 2
Jobs lost through imports, jobs gained through exports, and net jobs displaced due totrade with China, by state, 2001–2011 (ranked alphabetically)
StateJobs displaced by con-
sumption importsJobs supported bydomestic exports Net jobs displaced
Alabama 52,200 8,300 43,900
Alaska 2,700 900 1,800
Arizona 56,400 9,300 47,100
Arkansas 26,400 6,000 20,500
California 540,800 66,200 474,700
Colorado 66,100 8,300 57,800
Connecticut 36,200 6,300 29,900
Delaware 6,400 1,400 5,000
District of Columbia 3,200 600 2,600
Florida 128,600 22,600 106,100
Georgia 102,900 15,500 87,300
Hawaii 5,800 1,400 4,300
Idaho 21,900 3,800 18,200
Illinois 138,000 24,400 113,700
Indiana 71,500 15,000 56,600
Iowa 28,500 8,200 20,300
Kansas 24,000 6,500 17,500
Kentucky 44,100 8,400 35,700
Louisiana 21,300 6,000 15,300
Maine 12,400 2,400 10,000
Maryland 44,900 7,100 37,800
Massachusetts 104,100 11,400 92,700
Michigan 90,500 21,600 68,900
Minnesota 84,800 12,500 72,300
Mississippi 24,400 4,700 19,700
Missouri 49,500 10,800 38,700
Nebraska 15,200 4,600 10,600
Nevada 16,100 2,900 13,200
New Hampshire 23,400 2,900 20,400
EPI BRIEFING PAPER #345 | AUGUST 23, 2012 PAGE 32
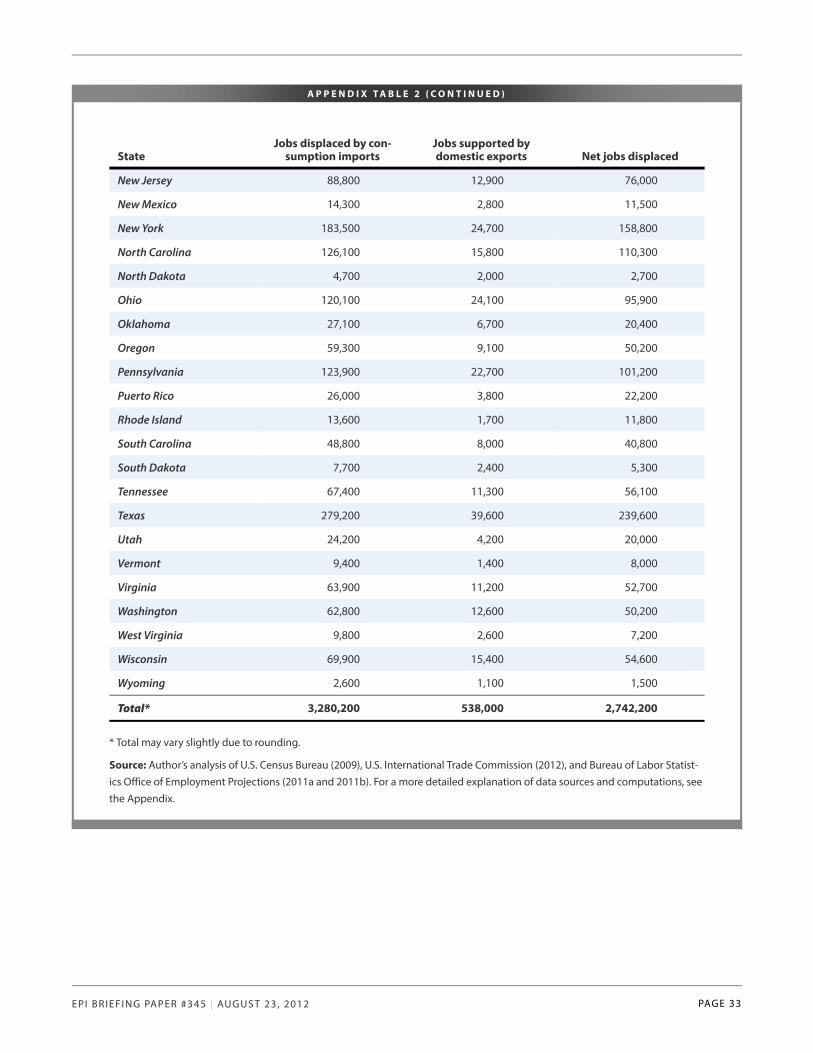
A P P E N D I X T A B L E 2 ( C O N T I N U E D )
StateJobs displaced by con-
sumption importsJobs supported bydomestic exports Net jobs displaced
New Jersey 88,800 12,900 76,000
New Mexico 14,300 2,800 11,500
New York 183,500 24,700 158,800
North Carolina 126,100 15,800 110,300
North Dakota 4,700 2,000 2,700
Ohio 120,100 24,100 95,900
Oklahoma 27,100 6,700 20,400
Oregon 59,300 9,100 50,200
Pennsylvania 123,900 22,700 101,200
Puerto Rico 26,000 3,800 22,200
Rhode Island 13,600 1,700 11,800
South Carolina 48,800 8,000 40,800
South Dakota 7,700 2,400 5,300
Tennessee 67,400 11,300 56,100
Texas 279,200 39,600 239,600
Utah 24,200 4,200 20,000
Vermont 9,400 1,400 8,000
Virginia 63,900 11,200 52,700
Washington 62,800 12,600 50,200
West Virginia 9,800 2,600 7,200
Wisconsin 69,900 15,400 54,600
Wyoming 2,600 1,100 1,500
Total* 3,280,200 538,000 2,742,200
* Total may vary slightly due to rounding.
Source: Author’s analysis of U.S. Census Bureau (2009), U.S. International Trade Commission (2012), and Bureau of Labor Statist-
ics Office of Employment Projections (2011a and 2011b). For a more detailed explanation of data sources and computations, see
the Appendix.
EPI BRIEFING PAPER #345 | AUGUST 23, 2012 PAGE 33