
Voting-Based Cancer Module Identification by Combining Topological and Data-Driven Properties
17
Voting-Based Cancer Module Identification by Combining Topological and Data-Driven Properties A. K. M. Azad, Hyunju Lee* School of Information and Communications, Gwangju Institute of Science and Technology, Gwangju, South Korea Abstract Recently, computational approaches integrating copy number aberrations (CNAs) and gene expression (GE) have been extensively studied to identify cancer-related genes and pathways. In this work, we integrate these two data sets with protein-protein interaction (PPI) information to find cancer-related functional modules. To integrate CNA and GE data, we first built a gene-gene relationship network from a set of seed genes by enumerating all types of pairwise correlations, e.g. GE-GE, CNA-GE, and CNA-CNA, over multiple patients. Next, we propose a voting-based cancer module identification algorithm by combining topological and data-driven properties (VToD algorithm) by using the gene-gene relationship network as a source of data-driven information, and the PPI data as topological information. We applied the VToD algorithm to 266 glioblastoma multiforme (GBM) and 96 ovarian carcinoma (OVC) samples that have both expression and copy number measurements, and identified 22 GBM modules and 23 OVC modules. Among 22 GBM modules, 15, 12, and 20 modules were significantly enriched with cancer-related KEGG, BioCarta pathways, and GO terms, respectively. Among 23 OVC modules, 19, 18, and 23 modules were significantly enriched with cancer-related KEGG, BioCarta pathways, and GO terms, respectively. Similarly, we also observed that 9 and 2 GBM modules and 15 and 18 OVC modules were enriched with cancer gene census (CGC) and specific cancer driver genes, respectively. Our proposed module-detection algorithm significantly outperformed other existing methods in terms of both functional and cancer gene set enrichments. Most of the cancer-related pathways from both cancer data sets found in our algorithm contained more than two types of gene-gene relationships, showing strong positive correlations between the number of different types of relationship and CGC enrichment q-values (0.64 for GBM and 0.49 for OVC). This study suggests that identified modules containing both expression changes and CNAs can explain cancer-related activities with greater insights. Citation: Azad AKM, Lee H (2013) Voting-Based Cancer Module Identification by Combining Topological and Data-Driven Properties. PLoS ONE 8(8): e70498. doi:10.1371/journal.pone.0070498 Editor: Dongxiao Zhu, Wayne State University, United States of America Received November 9, 2012; Accepted June 19, 2013; Published August 5, 2013 Copyright: ß 2013 Azad, Lee. This is an open-access article distributed under the terms of the Creative Commons Attribution License, which permits unrestricted use, distribution, and reproduction in any medium, provided the original author and source are credited. Funding: This work (No. 2011-0029447) was supported by the Mid-career Researcher Program through a National Research Foundation grant funded by the Ministry of Education, Science and Technology. The funders had no role in study design, data collection and analysis, decision to publish, or preparation of the manuscript. Competing Interests: The authors have declared that no competing interests exist. * E-mail: [email protected] Introduction Cancer is a common genetic disease and a worldwide leading cause of death. Cancer genomics identifies changes of genes that play important roles in cancer initiation and progression. Decades of research have revealed that cancer is closely related to abnormal changes in regulatory and signaling pathways during its growth and malignance [1,2]; such dysregulations in key pathways occur due to combinations of genetic alterations and expression changes of oncogenes or tumor suppressor genes [3–5]. Therefore, many algorithms have been developed to identify pathways related to cancer [6–9] using DNA CNAs, GE changes, PPIs, and so on. Extensive uses of GE for studying molecular pathways have helped in classifying cancer subtypes, predicting prognosis, and developing drugs for cancer. However, using only GE data for identifying cancer-related genes is not enough because some important genes in cancer-related pathways might not be differentially expressed and some differentially expressed genes might not be relevant to cancer. CNAs are structural variations of DNA sequences that represent abnormal copies of DNA segments in a form of deletion or amplification in the cell [10]. CNAs are known to be a hallmark of cancer, and methods including GISTIC [11], RAE [12], and WIFA [13] have been used to detect cancer- driver genes in aberrant genomic regions. A recent large-scale analysis of GBM samples from The Cancer Genome Atlas (TCGA) [8] showed genetic alterations including mutations, deletions, and amplifications of DNA in 78%, 87%, and 88% of 206 GBM samples in the core components of RB, TP53, and RTK/PI3K pathways, respectively. Several studies have recently reported the importance of integrating CNAs and GE data sets for the identification of cancer-related pathways. TCGA research on ovarian cancer showed that genetic alterations and gene expression changes simultaneously occur in the retinoblastoma signaling pathway [14]. Jo ¨rnsten et al. [15] developed a model that explains the effects of CNAs on GE in a large-scale network. Based on the model, prognostic scores were calculated and cancer-related genes were identified. Akavia et al. [16] employed an integrative Bayesian approach to identify biologically and therapeutically important driver genes in genetically altered regions by associating candidate driver genes with differentially expressed genes. They applied the proposed method to a melanoma data set and identified known driver genes in melanoma, along with novel cancer driver genes TBC1D16 and RAB27A. An important PLOS ONE | www.plosone.org 1 August 2013 | Volume 8 | Issue 8 | e70498
Transcript of Voting-Based Cancer Module Identification by Combining Topological and Data-Driven Properties

Voting-Based Cancer Module Identification byCombining Topological and Data-Driven PropertiesA. K. M. Azad, Hyunju Lee*
School of Information and Communications, Gwangju Institute of Science and Technology, Gwangju, South Korea
Abstract
Recently, computational approaches integrating copy number aberrations (CNAs) and gene expression (GE) have beenextensively studied to identify cancer-related genes and pathways. In this work, we integrate these two data sets withprotein-protein interaction (PPI) information to find cancer-related functional modules. To integrate CNA and GE data, wefirst built a gene-gene relationship network from a set of seed genes by enumerating all types of pairwise correlations, e.g.GE-GE, CNA-GE, and CNA-CNA, over multiple patients. Next, we propose a voting-based cancer module identificationalgorithm by combining topological and data-driven properties (VToD algorithm) by using the gene-gene relationshipnetwork as a source of data-driven information, and the PPI data as topological information. We applied the VToD algorithmto 266 glioblastoma multiforme (GBM) and 96 ovarian carcinoma (OVC) samples that have both expression and copynumber measurements, and identified 22 GBM modules and 23 OVC modules. Among 22 GBM modules, 15, 12, and 20modules were significantly enriched with cancer-related KEGG, BioCarta pathways, and GO terms, respectively. Among 23OVC modules, 19, 18, and 23 modules were significantly enriched with cancer-related KEGG, BioCarta pathways, and GOterms, respectively. Similarly, we also observed that 9 and 2 GBM modules and 15 and 18 OVC modules were enriched withcancer gene census (CGC) and specific cancer driver genes, respectively. Our proposed module-detection algorithmsignificantly outperformed other existing methods in terms of both functional and cancer gene set enrichments. Most of thecancer-related pathways from both cancer data sets found in our algorithm contained more than two types of gene-generelationships, showing strong positive correlations between the number of different types of relationship and CGCenrichment q-values (0.64 for GBM and 0.49 for OVC). This study suggests that identified modules containing bothexpression changes and CNAs can explain cancer-related activities with greater insights.
Citation: Azad AKM, Lee H (2013) Voting-Based Cancer Module Identification by Combining Topological and Data-Driven Properties. PLoS ONE 8(8): e70498.doi:10.1371/journal.pone.0070498
Editor: Dongxiao Zhu, Wayne State University, United States of America
Received November 9, 2012; Accepted June 19, 2013; Published August 5, 2013
Copyright: � 2013 Azad, Lee. This is an open-access article distributed under the terms of the Creative Commons Attribution License, which permitsunrestricted use, distribution, and reproduction in any medium, provided the original author and source are credited.
Funding: This work (No. 2011-0029447) was supported by the Mid-career Researcher Program through a National Research Foundation grant funded by theMinistry of Education, Science and Technology. The funders had no role in study design, data collection and analysis, decision to publish, or preparation of themanuscript.
Competing Interests: The authors have declared that no competing interests exist.
* E-mail: [email protected]
Introduction
Cancer is a common genetic disease and a worldwide leading
cause of death. Cancer genomics identifies changes of genes that
play important roles in cancer initiation and progression. Decades
of research have revealed that cancer is closely related to abnormal
changes in regulatory and signaling pathways during its growth
and malignance [1,2]; such dysregulations in key pathways occur
due to combinations of genetic alterations and expression changes
of oncogenes or tumor suppressor genes [3–5]. Therefore, many
algorithms have been developed to identify pathways related to
cancer [6–9] using DNA CNAs, GE changes, PPIs, and so on.
Extensive uses of GE for studying molecular pathways have
helped in classifying cancer subtypes, predicting prognosis, and
developing drugs for cancer. However, using only GE data for
identifying cancer-related genes is not enough because some
important genes in cancer-related pathways might not be
differentially expressed and some differentially expressed genes
might not be relevant to cancer. CNAs are structural variations of
DNA sequences that represent abnormal copies of DNA segments
in a form of deletion or amplification in the cell [10]. CNAs are
known to be a hallmark of cancer, and methods including GISTIC
[11], RAE [12], and WIFA [13] have been used to detect cancer-
driver genes in aberrant genomic regions. A recent large-scale
analysis of GBM samples from The Cancer Genome Atlas
(TCGA) [8] showed genetic alterations including mutations,
deletions, and amplifications of DNA in 78%, 87%, and 88% of
206 GBM samples in the core components of RB, TP53, and
RTK/PI3K pathways, respectively.
Several studies have recently reported the importance of
integrating CNAs and GE data sets for the identification of
cancer-related pathways. TCGA research on ovarian cancer
showed that genetic alterations and gene expression changes
simultaneously occur in the retinoblastoma signaling pathway
[14]. Jornsten et al. [15] developed a model that explains the
effects of CNAs on GE in a large-scale network. Based on the
model, prognostic scores were calculated and cancer-related genes
were identified. Akavia et al. [16] employed an integrative
Bayesian approach to identify biologically and therapeutically
important driver genes in genetically altered regions by associating
candidate driver genes with differentially expressed genes. They
applied the proposed method to a melanoma data set and
identified known driver genes in melanoma, along with novel
cancer driver genes TBC1D16 and RAB27A. An important
PLOS ONE | www.plosone.org 1 August 2013 | Volume 8 | Issue 8 | e70498

progress in combining CNAs and GE is analyzing genes as a
module rather than as individual genes. Witten et al. [17] applied
canonical correlation analysis for integrating CNAs and GE. This
method links CNA modules with GE modules and optimizes
CNA-GE interactions.
In constructing modules or subnetworks, PPIs have been used as
prior information to incorporate connectivity among genes.
Cerami et al. [9] proposed a method to construct subnetworks
containing a significant number of mutated genes using human
PPIs and to identify pathways that are related to GBM. Chuang
et al. [6] proposed an approach of integrating PPIs and GE data
sets to identify subnetwork markers that classify metastatic and
non-metastatic tumors.
We propose a computational framework to incorporate CNA-
CNA, CNA-GE, and GE-GE relationships to protein interaction
network to identify cancer-related modules in which genetic
changes of genes are explained by these relationships. Although
the GE-GE relationship has been studied for decades [18–20],
CNA-CNA [21–23] and CNA-GE [7,24–27] relationships have
only been recently studied. It is observed that amplifications and
deletions of DNA segments can affect expression levels of genes in
the same location, as well as distantly located genes [25]. This
trans-located association between CNA and GE can be one of the
mechanisms explaining complicated relationships between genes
in the signaling and regulatory pathways. To incorporate these
complex relationships, we construct a gene-gene relationship
network using differentially expressed and significantly copy
number altered genes in paired data sets containing both DNA
and RNA data on the same set of patients. Then, we also
incorporate PPI information to exploit prior functional depen-
dencies between genes. We used a voting approach to find
representative genes that are strongly related to other genes
through associations among CNAs, GE, and PPIs. These
representative genes are used to construct pre-modules by
including strongly related genes. Then, pre-modules are merged
with other pre-modules that have statistically significant associa-
tions through CNAs, GE, and PPI relationships, and final modules
are generated.
The proposed approach was applied to GE and CNAs data of
GBM and OVC samples from TCGA to identify cancer-related
modules. The identified modules were assessed in two aspects:
their functional coherence and relevance to cancer. To test that
the modules are composed of functionally coherent genes, we
applied functional enrichment tests using KEGG [28], BioCarta
pathways [29], and GO biological process [30]. To test that the
generated modules are related to cancer, we first selected cancer-
related pathways from these three categories of pathways. Since
there is still no consensus about which pathways or functional
terms are related to cancer, we consider that a pathway is related
to cancer if it is significantly enriched with cancer-related genes
from a cancer gene census (CGC) [31]. Then, we applied
enrichment tests using these cancer-related pathways. Our results
showed that cancer-related pathways were enriched with our
identified modules in both GBM and OVC data sets, and that a
significant number of genes in the modules were associated with
others through CNA-CNA, CNA-GE, and GE-GE relationships.
Results
A Framework for Combining Topological and Data-driven Properties
We developed the VToD approach to construct modules that
are composed of a set of functionally coherent and cancer-related
genes. VToD was developed based on four main ideas; (i) genes
with similar gene expression profiles and copy number changes are
more likely to be in the same module, (ii) genes can be assigned
into multiple modules to reflect the biological knowledge that some
genes are involved in multiple pathways, (iii) genes in a short
distance in the PPI network are more likely to belong to the same
module, and (iv) hub genes in the PPI network are more likely to
be included in the modules since many hub genes having a large
number of interacting partners may contribute to cancer
development. The former two ideas consider data-driven proper-
ties and the latter two reflect topological properties of genes within
the PPI network.
The schematic diagram of our proposed VToD method is
shown in Figure 1. VToD constructs a gene-gene relationship
network, GGR : ~(S,R) by integrating GE and CNA data sets,
where S is a set of seed genes and R is a set of gene-gene
relationships. Seed genes are selected by combining differentially
expressed (DE) genes and CNA genes, where CNA genes are
obtained from TCGA [8,14] and listed in Table S1. For GBM,
4,821 seed genes were selected by combining 2,976 DE genes and
2,073 CNA genes. For OVC, 6,649 seed genes were constructed
by 710 DE genes and 6,510 CNA genes. Note that some seed
genes are both differentially expressed and copy number altered.
The gene-gene relationships R were constructed, where two genes
have strong correlation in at least one of three types of
relationships: GE-GE, CNA-GE, and CNA-CNA. Then, VToD
integrates a PPI data set with the gene-gene relationship network
GGR by following four major steps.
1. Calculate the association between genes: For every two genes g and m,
an association value from gene m to gene g is calculated by
combining the gene-gene relationship and the PPI data set.
The association value is called a vote-value in this study, since
we assume that gene m votes for gene g to represent the
strength of the association between two genes.
2. Select representative genes of each gene: For gene g, vote-values from
all other genes are sorted in descending order, and genes
located within the top vote th% of the vote-values are selected
as the representative genes of the gene g.
3. Form pre-modules: If a gene m is selected as a representative gene
from multiple genes, other genes selecting the gene m as the
representative gene along with the gene m itself form a pre-
module.
4. Merge pre-modules: Two pre-modules are merged if pairwise
members of the two pre-modules are highly related in the gene-
gene relationship network and are closely connected in the PPI
network.
The VToD algorithm is inspired by a dynamic signal
transduction system (STM) algorithm [32] in which, for each
gene, the most associated genes are selected to form pre-modules
based on the PPI topology only. However, the clear distinction lies
between STM and VToD in the process of (i) calculating the
association between two genes and (ii) merging pre-modules, since
our approach integrates GE, CNAs, and PPI data sets.
The constructed modules were assessed in two aspects; (i) we
measured functional relevance of the identified modules by testing
whether genes in a module were enriched for KEGG, BioCarta
pathways, and biological processes in GO terms (called a
functional enrichment test), and (ii) we assessed the relevance of
the modules to cancer by applying an enrichment test to the
cancer-related pathways or cancer-related biological functions,
which are subsets of the above three categories of pathways/GO
terms enriched with cancer-related genes from CGC [31] (called a
cancer-related pathway enrichment test). Further, we tested
Voting-Based Cancer Module Identification
PLOS ONE | www.plosone.org 2 August 2013 | Volume 8 | Issue 8 | e70498

Voting-Based Cancer Module Identification
PLOS ONE | www.plosone.org 3 August 2013 | Volume 8 | Issue 8 | e70498

whether genes in the identified modules were enriched with cancer
genes from CGC, GBM driver genes [33], and OVC-related genes
[34]. In these assessments, the hypergeometric statistics were used
for the enrichment test.
Modules from the VToD AlgorithmThe distributions of all enumerated pairwise gene-gene
relationships (GE-GE, CNA-GE, and CNA-CNA) among seed
genes are shown in Figure S1, and the distributions of all vote-
values for GBM and OVC data sets are shown in Figure S2. Since
the number of pre-modules depends on the vote th% values in
Step 2 of the VToD algorithm, we tried three vote th values to
examine how vote th values affect on the constructed pre-
modules. Vote-values of the top 1%, 0.25%, and 0.1% eventually
yielded 100, 68, and 43 pre-modules for GBM, and 138, 53, and
34 pre-modules for OVC. Then, we applied the functional
enrichment tests and cancer-related pathway enrichment tests to
pre-modules generated using the three threshold values above.
Figure 2 shows the fraction of enriched pre-modules; although
many pre-modules have significant overlaps with known pathways
across all three thresholds, pre-modules from vote th = 0.25% and
0.1% have more overlaps with the pathways compared to vote th= 1%, showing that higher vote-values generate higher fraction of
functionally relevant and cancer-related modules.
We also tested the importance of considering both topological
and data-driven properties for pairwise vote calculation. We
generated pre-modules using only topological and only data-
driven properties. When the single property was used, the same
number of gene pairs was selected with that of gene pairs selected
by combining both properties for each value of vote th. Across all
three values for the vote th threshold, the fraction of functionally
enriched modules was higher when topological and data-driven
properties were combined than when only a single property was
used for both GBM and OVC, as shown in Figure 2.
We chose vote th = 0.1% as a threshold for further analysis.
Using this threshold, for GBM, 43 pre-modules were obtained. By
merging these pre-modules, 22 modules were generated, and the
average number of genes in the modules was 24. For OVC, using
the same threshold, 34 pre-modules were generated, and 23
modules were obtained after merging pre-modules, where the
average of number of genes is 57. All genes in the modules are
listed in Table S2 and Table S3. The statistical significance of the
identified modules is shown in Figure S3.
Since the VToD algorithm allows multiple appearances of genes
in several modules, we calculated the average ratio of common
genes between modules. For GBM, the ratio of common gene was
16.07%, which was similar to those of the KEGG and BioCarta
pathways. Also, the distribution of ratios of common genes was
calculated. Around half of the modules had ƒ 10% of common
genes, which indicates that final modules will be enriched with
distinct functional pathways or terms (Figures S4A and S4B). We
also investigated three different types of direct relationships (GE-
GE, CNA-GE, and CNA-CNA) between the gene pairs within
each of these 22 GBM modules (Figure S5A). Around 64% of the
modules contained at least two types of relationships, showing (i)
that genes with similar gene expression and DNA copy number
changes are more likely to be in the same module, and (ii) that the
activity of the genes in these identified modules can be explained
by different molecular mechanisms (Table S4).
For 23 OVC modules, the average ratio of common genes was
11.68%, which was also lower than those from KEGG and
BioCarta, and more than half of the 23 OVC modules had ƒ
10% of common genes (Figures S4C and S4D). Around 83% of all
23 OVC modules (Figure S5B) contained at least two types of
direct relationships.
Cancer-related modules identified by the VToD
algorithm for GBM. We applied functional and cancer gene
set enrichment tests to 22 GBM modules. We found that 19
(86.36%), 14 (63.63%), and 20 (90.9%) modules were significantly
enriched (FDR q-value v 0.05) with at least one KEGG,
BioCarta, or GO terms, respectively, showing that identified
modules are functionally coherent. Also, 15 (68.18%), 12
(54.55%), and 20 (90.9%) GBM modules were significantly
enriched with cancer-related KEGG, BioCarta pathways, and
GO terms, respectively. In the case of the cancer gene set
enrichment test, 9 and 2 GBM modules had significant overlap
(FDR q-value v 0.05) with CGC [31] and GBM-related genes
[33], respectively. These results show that our modules are related
to cancer development. Table 1 shows the summary of the top five
selected modules ordered by GBM-related gene enrichment q-
values; these modules contain many GBM-related genes. All
enrichment results for the GBM data set are shown in Tables S4,
S5, S6, and S7.
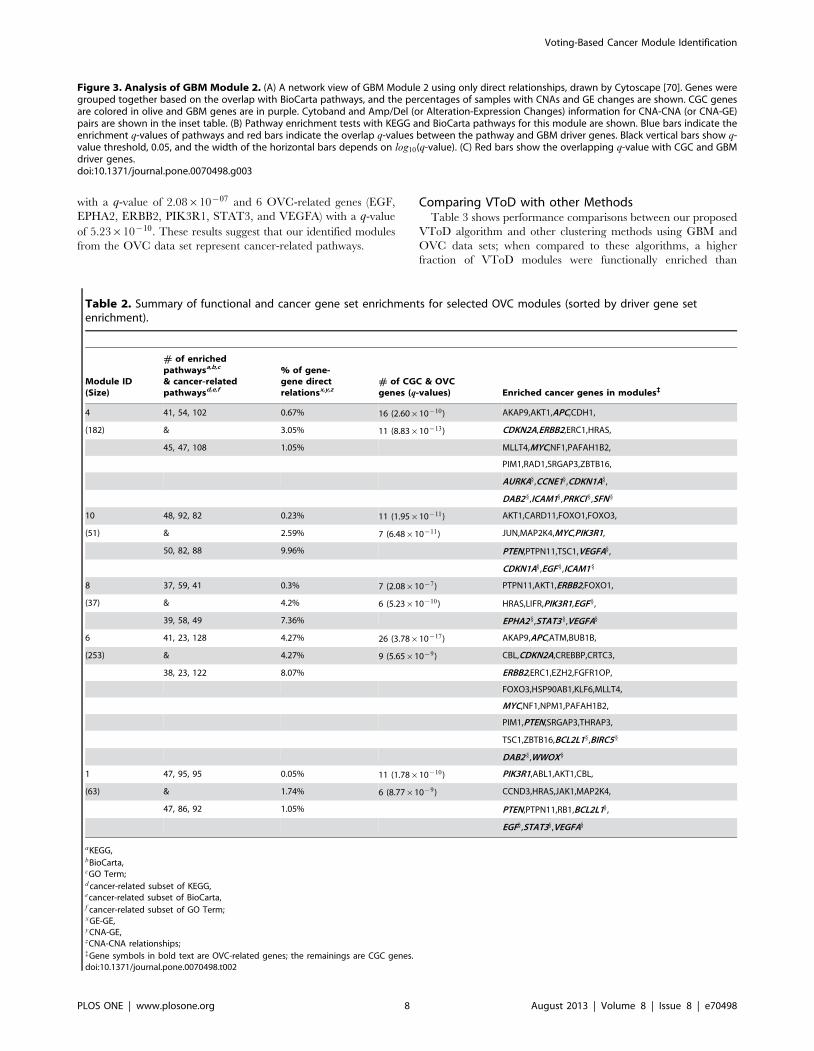
We selected GBM Module 2 to explain in detail how genes are
interacting with other genes and are involved in biological
pathways in modules. We selected this module for further
explanation since it has a low enrichment q-value with cancer
gene sets, and contains gene pairs with strong correlations in three
types of direct relationships. This module contains 1,080 gene
pairs from 48 genes, and among them there were 300 GE-GE, 9
CNA-GE, and 8 CNA-CNA direct relationships. Figure 3A shows
the network view of the GBM Module 2 with direct relationships
only. There were three types of edges in this network: i) red edges
for CNA-CNA, ii) blue edges for CNA-GE, and iii) green edges for
GE-GE relationships between two genes. Genes belonging to
significantly enriched pathways/terms were grouped together.
Information for DNA CNAs and/or expression changes for genes
were also labeled with them within each group. Frequencies of
copy number changes were presented as a percentage of 206 GBM
samples with either focal amplification or homozygous deletion in
[8]. To count the fraction of tumor samples with gene expression
changes for genei, we considered that a tumor sample s is over- or
under-expressed if the value of Dri,sD in Equation (1) belongs to the
top 10% of Dri,sD values of all tumor samples, where ts is the
expression value of a tumor sample s and �cci is the mean expression
of all control samples for the genei. Based on the distributions of
Dri,sD for GBM and OVC data sets, 0.4 was selected for GBM and
0.365 for OVC.
ri,s~log2
ts
�cci
� �ð1Þ
A manual literature survey provided supportive evidence for the
direct relationships in GBM Module 2. Genes in MAPK1-
MAPK3, MAPK3-MAPK9, and MAPK1-MAPK9 pairs are
involved in various cancer- and GBM-related pathways, including
MAPK signaling, ERBB signaling, focal adhesion, and Toll-like
Figure 1. A schematic of our approach. (A) Gene expressions and their paired CNA data are collected. (B) A gene-gene relationship network, GGR,is constructed using direct and indirect relationships of GE-GE, CNA-GE, and CNA-CNA. (C) A novel algorithm, VToD, finds overlapping modulescombining the GGR network and PPI information. (D) Functional and cancer gene set enrichments are tested for identified modules.doi:10.1371/journal.pone.0070498.g001
Voting-Based Cancer Module Identification
PLOS ONE | www.plosone.org 4 August 2013 | Volume 8 | Issue 8 | e70498

receptor signaling. In BRCA2-ING1, both genes play critical roles
in cell cycle control [35,36]; ING1 is a tumor suppressor gene and
interacts with TP53, and its under-expression and genetic
rearrangement have been observed in several cancers, including
GBM [37]; and BRCA2, a tumor suppressor gene, has recently
been targeted for sensitizing glioma cells for killing by anti-cancer
drugs [38]. In BTBD2-TEP1, TEP1 is a well-known GBM
suppressor gene, and the deletion/mutation of this gene has been
observed in many cancers, including GBM [39]; polymorphism of
BTBD2 is involved in the double-strand break repair pathway that
can be useful for GBM survival [40]. In ING1-HMGB1, both
genes are located in chromosome 13q, where copy number loss
has been reported [41–43], suggesting co-occurring deletion of
these two genes. In APEX1-HIF1A and HIF1A-TEP1 having the
CNA-CNA relationship, APEX1 and HIF1A directly interact with
each other in vitro [44]; and, in GBM, copy number loss at
14q11.1-q13.1, 14q23.2-q23.3, and 14q32.33, where these genes
are located, has been reported by Donovan et al. [45]. The
relationship between 14q11.1–11.2 and 14q23.1–31.3 are also
shown in our findings of CNA-GE relationships (APEX1-BRCA1,
BRCA1-HIF1A, and BRCA1-TEP1) within this module. In
BTBD2-BARD1, BARD1 was suggested as a mediator of
apoptosis since its over-expression induces cell death [46]; and
high LOH has been detected in human carcinoma metastases to
the brain at chromosome 19p13.3 for BTBD2 [47].
Figure 3B shows enrichment tests using KEGG and BioCarta
pathways for the GBM Module 2. To find GBM-related pathways,
we also calculated the q-values for the enrichment of GBM-related
genes in these pathways, respectively. In Figure 3B, the top 15 of
37 enriched KEGG and the top 15 of 49 enriched BioCarta
pathways are shown for the GBM Module 2, along with their
corresponding overlapping q-values, sorted by those q-values.
GBM Module 2 contains many previously known GBM-related
KEGG pathways including Glioma, P53 signaling, MAPK
signaling, ERBB signaling, mTOR signaling, and VEGF signaling,
and GBM-related BioCarta pathways, including ATM, G2, G1,
RB, P53, PTEN, and MET pathways [48]. GBM Module 2 is also
enriched with cancer-related 40 KEGG, 48 BioCarta pathways,
and 92 GO terms.
We also tested the relevance of GBM Module 2 with cancer
using CGC and GBM-related genes, as shown in Figure 3C. GBM
Module 2 contained 10 CGC genes of TP53, BRCA1, BRCA2,
DAXX, DDX5, MDM2, MDM4, NPM1, TEP1, and WRN,
resulting in a q-value of 1.05|10{09, and 2 GBM-related genes of
TP53 and TEP1, resulting in a q-value of 1.02|10{02.
Cancer-related modules identified by the VToD
algorithm for ovarian cancer. Among 23 OVC modules, 22
(95.65%), 18 (78.26%), 23 (100%), 15 (65.22%), and 18 (78.26%)
modules were significantly enriched (FDR q-value v 0.05) with at
least one KEGG, BioCarta pathways, GO terms, CGC [31], or
OVC-related gene sets [34], respectively. Also, 19 (82.61%), 18
Figure 2. Comparative functional enrichments of pre-modules generated using different vote thresholds. (A) is for GBM and (B) is forOVC. Bars represent fractions of modules enriched with KEGG, BioCarta, GO biological process, cancer-related KEGG, cancer-related BioCarta, cancer-related GO biological process, and cancer gene census (CGC) for three different vote thresholds. Additionally, in each case, vote-values werecomputed using only topological properties, using only data-driven properties, and by combining them to compare their individual effects onperformance. The numbers of genes (nGS) in each pre-module set are shown correspondingly.doi:10.1371/journal.pone.0070498.g002
Voting-Based Cancer Module Identification
PLOS ONE | www.plosone.org 5 August 2013 | Volume 8 | Issue 8 | e70498

(78.26%), and 23 (100%) OVC modules were significantly
enriched with cancer-related KEGG, BioCarta, and GO terms,
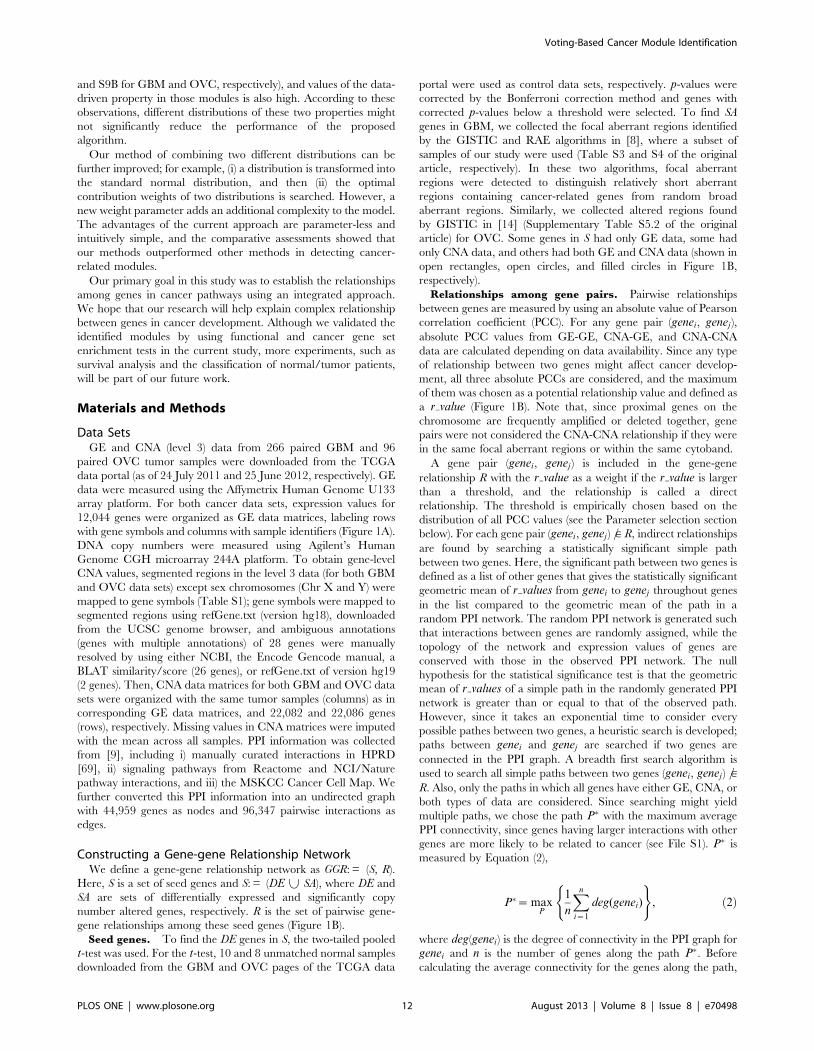
respectively. Table 2 shows the summary of five selected modules
ordered by OVC-related gene set enrichment q-values. All
enrichment results for the OVC data set are shown in Tables
S8, S9, S10, and S11.
We investigated OVC Module 8 in detail, as shown in Figure 4;
it contains 629 gene pairs of 37 genes, and among them there were
2 GE-GE, 28 CNA-GE, and 49 CNA-CNA direct relationships. In
OVC Module 8, STAT5B-STAT3 gene pair is activated in
ovarian cancer [49], interacts with each other [50], and is involved
in many pathways including Jak-STAT signaling, RAS signaling,
Chemokine signaling, EGF, IL10, PDGF, and TPO pathways. In
STAT5B-PRLR, both genes are involved in Jak-STAT signaling,
a signal transduction pathway with key control over proliferation,
differentiation, and survival of mammary cells [51]. Recently, it
has been shown that PRLR and its downstream STAT5B are
acetylated by CREB-binding protein (CBP) [52]. In EGF-STAT1
and EGF-STAT3, both gene pairs are involved in pancreatic
cancer, EGF pathway, and signal transduction pathway; both
STAT1 and STAT3 are activated by the Jak kinase in response to
EGF [53–55], where JAK2/STAT3 signaling is required for EGF-
driven ovarian cancer [55]. In PIK3R1-IGF1R, these genes
interact with each other [56] and are involved in many functional
pathways, including the IGF1, IGF1R, HDAC, BAD,
IGF1MTOR, and focal adhesion pathways. In ERBB2-STAT,
these genes are involved in pancreatic cancer and signal
transduction pathways; the correlation between the activation of
ERBB2 and STAT3 has been observed in many human tumors
[57,58]. In ERBB2-STAT5B, both genes interact with JAK2
[59,60] and are involved in ERBB signaling and signal transduc-
tion pathways. In EGF-ERBB2, these genes directly interact with
each other [61] and are involved in many cancers, including
pancreatic, endometrial, prostate, bladder and ovarian cancers.
They are also involved in ERBB signaling and focal adhesion
pathways. In HRAS-FYN, these genes interact with each other
in vitro [62] and are involved in many pathways, such as focal
adhesion, axon guidance, T-cell receptor signaling, and FC epsilon
RI signaling, ECM, TCR, and integrin pathways.
The top 15 of 37 enriched KEGG and top 15 of 59 enriched
BioCarta pathways are also shown for OVC Module 8 in
Figure 4B. It includes known OVC-related KEGG pathways,
such as focal adhesion, JAK-STAT signaling, ERBB signaling,
cytokine-cytokine receptor interaction, chemokine signaling and
VEGF signaling, and OVC-related BioCarta pathways, such as
AKT signaling, IL6, RAS, EGF, IGF1, PDGF, VEGF, CXCR4,
and HER2 pathways [34]. We also tested the relevance of the
OVC Module 8 to cancer. OVC Module 8 was enriched with 39
KEGG, 58 BioCarta pathways, and 49 GO terms, which were
cancer-related subsets of the original pathways/terms. Also, as
shown in Figure 4C, the OVC Module 8 contained 7 CGC genes
(PTPN11, AKT1, ERBB2, FOXO1, HRAS, LIFR, and PIK3R1)
Table 1. Summary of functional and cancer gene set enrichments for selected GBM modules (sorted by driver gene setenrichment).
Module ID(Size)
# of enrichedpathways a,b,c
& cancer-relatedpathwaysd,e,f
% of gene-gene directrelationsx,y,z
# of CGC & GBMgenes (q-values) Enriched cancer genes in modules `
12 31, 40, 51 26.67% 4 (9.15|10{06) EGFR,RB1,SMAD4,
(10) & 6.67% 3 (2.0|10{06) TP53
34, 37, 57 6.67%
2 37, 49, 73 26.59% 10 (1.05|10{09) TP53,BRCA1,BRCA2,
(48) & 0.79% 2 (1.02|10{02) DDX5,MDM2,MDM4,NPM1,
40, 48, 92 0.71% DAXX,TEP1,WRN
17 29, 54, 26 41.82% 3 (4.98|10{04) JAK2,EGFR,RAF1
(11) & 3.64% 1 (5.61|10{02)
37, 52, 38 1.82%
8 30, 39, 42 30.64% 6 (4.95|10{06) EGFR,CBLC,FAS,JAK2,
(33) & 1.33% 1 (1.32|10{01) MET,MYC
34, 37, 52 3.79%
1 30, 49, 21 24.51% 6 (6.91|10{05) APC,BRAF,EGFR,
(55) & 1.62% 1 (1.8|10{01) PPP2R1A,RAF1,WT1
37, 37, 24 0.54%
aKEGG,bBioCarta,cGO Term;d cancer-related subset of KEGG,ecancer-related subset of BioCarta,f cancer-related subset of GO Term;xGE-GE,yCNA-GE,zCNA-CNA relationships;{Gene symbols in bold text are GBM-related genes; the remainings are CGC genes.doi:10.1371/journal.pone.0070498.t001
Voting-Based Cancer Module Identification
PLOS ONE | www.plosone.org 6 August 2013 | Volume 8 | Issue 8 | e70498

Voting-Based Cancer Module Identification
PLOS ONE | www.plosone.org 7 August 2013 | Volume 8 | Issue 8 | e70498
with a q-value of 2.08|10{07 and 6 OVC-related genes (EGF,
EPHA2, ERBB2, PIK3R1, STAT3, and VEGFA) with a q-value
of 5.23|10{10. These results suggest that our identified modules
from the OVC data set represent cancer-related pathways.
Comparing VToD with other MethodsTable 3 shows performance comparisons between our proposed
VToD algorithm and other clustering methods using GBM and
OVC data sets; when compared to these algorithms, a higher
fraction of VToD modules were functionally enriched than
Figure 3. Analysis of GBM Module 2. (A) A network view of GBM Module 2 using only direct relationships, drawn by Cytoscape [70]. Genes weregrouped together based on the overlap with BioCarta pathways, and the percentages of samples with CNAs and GE changes are shown. CGC genesare colored in olive and GBM genes are in purple. Cytoband and Amp/Del (or Alteration-Expression Changes) information for CNA-CNA (or CNA-GE)pairs are shown in the inset table. (B) Pathway enrichment tests with KEGG and BioCarta pathways for this module are shown. Blue bars indicate theenrichment q-values of pathways and red bars indicate the overlap q-values between the pathway and GBM driver genes. Black vertical bars show q-value threshold, 0.05, and the width of the horizontal bars depends on log10(q-value). (C) Red bars show the overlapping q-value with CGC and GBMdriver genes.doi:10.1371/journal.pone.0070498.g003
Table 2. Summary of functional and cancer gene set enrichments for selected OVC modules (sorted by driver gene setenrichment).
Module ID(Size)
# of enrichedpathwaysa,b,c
& cancer-relatedpathwaysd,e,f
% of gene-gene directrelationsx,y,z
# of CGC & OVCgenes (q-values) Enriched cancer genes in modules`
4 41, 54, 102 0.67% 16 (2.60|10{10) AKAP9,AKT1,APC,CDH1,
(182) & 3.05% 11 (8.83|10{13) CDKN2A,ERBB2,ERC1,HRAS,
45, 47, 108 1.05% MLLT4,MYC,NF1,PAFAH1B2,
PIM1,RAD1,SRGAP3,ZBTB16,
AURKA} ,CCNE1} ,CDKN1A} ,
DAB2 } ,ICAM1} ,PRKCI } ,SFN }
10 48, 92, 82 0.23% 11 (1.95|10{11) AKT1,CARD11,FOXO1,FOXO3,
(51) & 2.59% 7 (6.48|10{11) JUN,MAP2K4,MYC,PIK3R1,
50, 82, 88 9.96% PTEN,PTPN11,TSC1,VEGFA} ,
CDKN1A} ,EGF } ,ICAM1 }
8 37, 59, 41 0.3% 7 (2.08|10{7) PTPN11,AKT1,ERBB2,FOXO1,
(37) & 4.2% 6 (5.23|10{10) HRAS,LIFR,PIK3R1,EGF } ,
39, 58, 49 7.36% EPHA2 } ,STAT3 } ,VEGFA}
6 41, 23, 128 4.27% 26 (3.78|10{17) AKAP9,APC,ATM,BUB1B,
(253) & 4.27% 9 (5.65|10{9) CBL,CDKN2A,CREBBP,CRTC3,
38, 23, 122 8.07% ERBB2,ERC1,EZH2,FGFR1OP,
FOXO3,HSP90AB1,KLF6,MLLT4,
MYC,NF1,NPM1,PAFAH1B2,
PIM1,PTEN,SRGAP3,THRAP3,
TSC1,ZBTB16,BCL2L1} ,BIRC5 }
DAB2 } ,WWOX }
1 47, 95, 95 0.05% 11 (1.78|10{10) PIK3R1,ABL1,AKT1,CBL,
(63) & 1.74% 6 (8.77|10{9) CCND3,HRAS,JAK1,MAP2K4,
47, 86, 92 1.05% PTEN,PTPN11,RB1,BCL2L1} ,
EGF} ,STAT3} ,VEGFA}
aKEGG,bBioCarta,cGO Term;d cancer-related subset of KEGG,ecancer-related subset of BioCarta,f cancer-related subset of GO Term;xGE-GE,yCNA-GE,zCNA-CNA relationships;{Gene symbols in bold text are OVC-related genes; the remainings are CGC genes.doi:10.1371/journal.pone.0070498.t002
Voting-Based Cancer Module Identification
PLOS ONE | www.plosone.org 8 August 2013 | Volume 8 | Issue 8 | e70498

Voting-Based Cancer Module Identification
PLOS ONE | www.plosone.org 9 August 2013 | Volume 8 | Issue 8 | e70498

modules from other algorithms. Although the functional enrich-
ment of DFM-CIN modules is comparable to those of VToD,
VToD identified a higher fraction of modules encriched with
cancer-related pathways than DFM-CIN. Note that, since
algorithms were designed for different data types, they were
compared using data types in the original paper. For a hierarchical
clustering method, GE, CNAs, and PPI data sets were integrated.
N Hierarchical clustering: To find modules by the hierarchical
clustering algorithm, we converted our gene-gene relationship
network GGR into a distance matrix using the topological
overlap metric [63] of the WCGNA tool in the R
computational suite. This distance matrix was then used for
hierarchical clustering with the average linkage. The dendro-
gram of the cluster was cut by a dynamic tree-cut [64]
algorithm, finally producing 216 modules when the GBM data
set was used. We applied functional and cancer gene set
enrichment tests with these 216 modules. We found 14, 0, and
13 modules having significant overlaps with KEGG, BioCarta
pathways, and GO terms, respectively, and 4, 0, and 4
enriched modules with cancer-related subsets of KEGG,
BioCarta, and GO terms, respectively. Also, 5 and 1 modules
were enriched with CGC- and GBM-related genes (Table
S12). Table 3 shows the comparative performance between
hierarchical clustering and VToD algorithms, showing that
VToD identified more pathway-enriched modules than the
hierarchical clustering algorithm (Table S13). Moreover,
Figure S6A shows the box plot of CGC and GBM driver
gene enrichment q-values, indicating higher cancer gene
enrichments in VToD compared to hierarchical clustering.
Also, the pie charts in Figure S6B show different combinations
of three types of direct relationships (CNA-CNA, GE-CNA,
GE-GE). Here, VToD produced a larger fraction of modules
containing more than one type of direct relationships
compared to hierarchical clustering.
N Cerami et. al.: Cerami et al. [9] developed an algorithm to
integrate DNA copy numbers, somatic mutation, and PPI data
sets, and applied it to 84 TCGA GBM data [8]. In their study,
altered genes were identified using RAE [12], and a network of
genes were constructed based on PPI information using an
edge-betweenness algorithm [65], resulting in 10 overlapping
modules. When functional and cancer gene set enrichment
tests were conducted for these modules, one, one, and three
modules were significantly enriched with at least one KEGG,
BioCarta pathways, and GO terms, respectively, and 2, 1, and
2 modules were significantly enriched with cancer-related
subsets of these three categories of pathways. Also, 2 and 2
modules were significantly enriched with CGC- and GBM-
related gene sets, respectively.
N MATISSE: MATISSE [66] integrates gene expression and
PPI data sets to find modules, where the apprearance of genes
im multiple modules is allowed. We applied MATISSE to both
GBM and OVC data sets. Front nodes were filtered based on
maximum/minimum fold changes with the 1,000 highest-
ranking patterns. Parameters were set as follows: ‘best
neighbor seeds’,‘logistics priors as prior regulation’, beta
= 0.95 (default), minimum seed size = 5 (default), maximum
seed size = 50 (default), and CC = Dot Product (Pearson); and
the maximum/minimum sizes of the final clusters were set to
ensure that similar numbers of genes were found in the final
clusters as those from VToD. Thereupon, we found 34 GBM
and 15 OVC modules using the MATISSE method, where 14,
12, 12, 3, and 0 GBM modules and 9, 8, 4, 7, and 2 OVC
modules were significantly enriched with KEGG, BioCarta
pathways, GO terms, CGC, and cancer type specific gene sets,
respectively. Also, enrichment tests of these 34 GBM and 15
OVC modules showed that 4, 1, and 1 GBM modules, and 3,
1, and 0 OVC modules were significantly enriched with
cancer-related subsets of KEGG, BioCarta pathways, and GO
terms, respectively.
N DFM-CIN: The DFM-CIN [67] method identifies protein
complexes and functional modules by combining gene
expression and PPI data sets. In their paper, DFM-CIN was
compared to and outperformed five other clustering algo-
rithms. Using GBM and OVC data sets, we first applied a
TSN-PCD method (sub-method) to find subnetworks using the
expression threshold = 0.7, l = 1.0 and a minimum complex
size of 3 for both GBM and OVC data sets. Next, we applied a
DFM-CIN method to detect functional modules based on
those subnetworks using similarity threshold = 0.4, a mini-
mum module size of 3 (for GBM) and of 15 (for OVC), and a
maximum module size of 69 (for GBM) and of 252 (for OVC).
These parameters were set to produce modules comparable to
VToD in terms of the number and size of the modules. Finally,
we found 24 GBM and 27 OVC modules. Out of these
modules, 21, 15, and 24 GBM modules, and 24, 17, and 27
OVC modules had significant overlap with KEGG, BioCarta
pathways, and GO terms, respectively. Also, out of these
modules, 5, 4 and 13 GBM modules, and 9, 5 and 10 OVC
modules were significantly enriched with cancer-related
subsets of these three categories of pathways. Also, 7 GBM
modules and 8 OVC modules were enriched with CGC genes,
and no modules were enriched with GBM- or OVC-related
gene sets.
N ClusterONE: ClusterONE [68] detects clusters in PPI
networks with the expansion of overlapping neighborhoods.
We applied ClusterONE over our PPI data set with default
parameter settings and found 210 clusters of genes. The similar
enrichment tests yielded 114, 74, 119, 38, 7, and 17 clusters
with significant overlaps with KEGG, BioCarta pathways, GO
terms, CGC, GBM- and OVC-related genes, respectively.
Also, 100, 72, and 116 clusters were significantly enriched with
cancer-related subsets of KEGG, BioCarta pathways, and GO
terms, respectively.
DFM-CIN [67] was comparable to VToD and outperformed
other competing methods in functional enrichment tests for both
GBM and OVC data sets. However, VToD outperformed all
other methods in terms of cancer gene set enrichment tests and
cancer-related pathway enrichment tests for both GBM and OVC
data sets, indicating that identified modules were more likely to be
related to the cancer. The numbers of distinct pathways or
functional terms enriched for VToD modules were comparable to
DFM-CIN and greater than those of other methods, showing the
convincing performance of our algorithm. All distinct enriched
pathways or terms found by the above methods, including VToD
Figure 4. Analysis of OVC Module 8, with a description similar to that of Figure 3. (A) A network view of OVC Module 8 using only directrelationships. CGC genes are colored in olive and OVC-related genes are in purple. (B) Pathway enrichment tests tests were similar to those inFigure 3(B), but here, red bars indicate the overlapping q-values between the pathway and OVC-related genes. (C) Red bars show the q-values thatoverlap with those of the CGC- and OVC-related genes.doi:10.1371/journal.pone.0070498.g004
Voting-Based Cancer Module Identification
PLOS ONE | www.plosone.org 10 August 2013 | Volume 8 | Issue 8 | e70498

for both GBM and OVC data sets, are shown in Tables S13 and
S14, respectively.
Discussion and Conclusions
We proposed the voting-based module construction approach
by integrating three direct relationships (GE-GE, CNA-GE, and
CNA-CNA), along with indirect relationships and PPI informa-
tion. We have shown that our relationship network by integrating
GE-GE, CNA-GE, and CNA-CNA types can be useful for giving
explainable relationships between genes in identified modules
since most of the modules contained different types of relation-
ships; by observing CGC enrichment result, all 9 GBM modules
and 14 of 15 OVC modules constructed by the VToD algorithm
contain at least two types of direct relationships, implying that GE
changes and CNAs occur simultaneously in cancer modules. This
conclusion was further confirmed when we found that the
numbers of different types of direct relationships in modules had
strong a positive correlation with CGC enrichment q-values (0.64
for GBM and 0.49 for OVC) and module sizes (0.67 for GBM and
0.52 for OVC).
In this study, we combined both data-driven and topological
properties throughout the whole algorithm, from constructing pre-
modules to merging pre-modules. However, our approach has
limitations in combining these two properties. When we combined
the data-driven and topological properties to calculate vote-values
among gene pairs, we integrated them using the same weights (see
Equation (4) in the Methods section), although the distribution and
the contribution of each property might be different. For further
investigation, we drew distributions of topological values and data-
driven values of gene pairs contained in the pre-modules of GBM,
as shown in Figures S7A and S7C, respectively. The distributions
of these two values were different; a Kolmogorov-Smirnov (K-S)
test under the null hypothesis that two distributions are identical
gives a p-value of 2.2e-16. Similar results were observed in OVC,
as shown in Figures S7B and S7D. However, when we drew
scatter plots of data-driven property values and topological
property values of gene pairs included in the GBM and OVC
pre-modules (Figures S7E and S7F), one property was not
dominated by the other property. In many gene pairs, one of
two properties had a relatively larger value while the other had
relatively smaller value, showing negative correlations between
them (20.550 for GBM and 20.259 for OVC). This observation
showed that both properties were significantly contributing to
constructing pre-modules.
When we combined the data-driven and topological properties
to merge two pre-modules, we also integrated them using the same
weights (see Equation (5) in the Methods section). Distributions of
topological values and data-driven values of all pairs of pre-
modules are different (Figure S8). One interesting observation is
that most pairs of pre-modules have value one for the topological
property for both GBM and OVC data sets, as shown in Figures
S8A and S8C, respectively. Consequently, most merged pre-
modules have value one for the topological property (Figures S9A
Table 3. Comparing VToD to other methods.
MethodsData setsused
Cancertypes
# ofmodules
# of functionallyenriched modulesa,b,c
# of enriched moduleswith subset ofpathways or termsd,e,f
# of # distinctpathways orfunctional terms"
# of cancer geneenrichedmodules{,`
HierarchicalClustering
GE,CNA,PPI GBM 216 14 (6.48%), 0,13 (6.02%)
4 (1.85%), 0, 4 (1.85%) 51 5 (2.31%), 1 (0.46%)
VToD GE,CNA,PPI GBM 22 19 (86.36%), 14 (63.63%),20 (90.90%)
15 (68.18%), 12(54.55%),20 (90.90%)
380 9 (40.9%), 2(9.09%)
OVC 23 22 (95.65%), 18 (78.26%),23 (100%)
19 (82.61%), 18(78.26%),23 (100%)
508 15 (65.22%), 18(78.26%)
Cerami et. al. Mutation,CNA,PPI
GBM 10 1 (10%), 1 (10%),3 (30%)
2 (20%), 1 (10%), 2 (20%) 68 2 (20%), 2 (20%)
MATISSE GE,PPI GBM 34 14 (41.18%), 12 (35.29%),12 (35.29%)
4 (11.77%), 1 (2.9%),1 (2.9%)
129 3 (8.82%), 0
OVC 15 9 (60%), 8 (53.33%),4 (26.67%)
3 (20%), 1 (6.7%), 0 78 7 (46.67%), 2(13.33%)
DFM-CIN GE,PPI GBM 24 21 (87.5%), 15 (62.5%),24 (100%)
5 (20.8%), 4 (1.67%),13 (54.17%)
429 7 (29.17%), 0
OVC 27 24 (88.89%),17 (62.96%),27 (100%)
9 (33.33%), 5 (18.52%),10 (37.04%)
476 8 (29.63%), 0
ClusterONE PPI Only – 210 114 (54.29%), 74 (35.24%),119 (56.67%)
100 (47.62%), 72 (34.29%),116 (55.24%)
454 38 (18.09%), 7
(3.33%)a 17 (8.09%)b
aKEGG,bBioCarta,cGO Term;d cancer-related subset of KEGG,ecancer-related subset of BioCarta,f cancer-related subset of GO Term;}Distinct enriched pathways or terms within all modules were found depending on key terminologies; modules enriched significantly (q-value v 0.05) with {CGC genes
and {specific cancer-related genes;awith GBM-related genes and bwith OVC-related genes.doi:10.1371/journal.pone.0070498.t003
Voting-Based Cancer Module Identification
PLOS ONE | www.plosone.org 11 August 2013 | Volume 8 | Issue 8 | e70498
and S9B for GBM and OVC, respectively), and values of the data-
driven property in those modules is also high. According to these
observations, different distributions of these two properties might
not significantly reduce the performance of the proposed
algorithm.
Our method of combining two different distributions can be
further improved; for example, (i) a distribution is transformed into
the standard normal distribution, and then (ii) the optimal
contribution weights of two distributions is searched. However, a
new weight parameter adds an additional complexity to the model.
The advantages of the current approach are parameter-less and
intuitively simple, and the comparative assessments showed that
our methods outperformed other methods in detecting cancer-
related modules.
Our primary goal in this study was to establish the relationships
among genes in cancer pathways using an integrated approach.
We hope that our research will help explain complex relationship
between genes in cancer development. Although we validated the
identified modules by using functional and cancer gene set
enrichment tests in the current study, more experiments, such as
survival analysis and the classification of normal/tumor patients,
will be part of our future work.
Materials and Methods
Data SetsGE and CNA (level 3) data from 266 paired GBM and 96
paired OVC tumor samples were downloaded from the TCGA
data portal (as of 24 July 2011 and 25 June 2012, respectively). GE
data were measured using the Affymetrix Human Genome U133
array platform. For both cancer data sets, expression values for
12,044 genes were organized as GE data matrices, labeling rows
with gene symbols and columns with sample identifiers (Figure 1A).
DNA copy numbers were measured using Agilent’s Human
Genome CGH microarray 244A platform. To obtain gene-level
CNA values, segmented regions in the level 3 data (for both GBM
and OVC data sets) except sex chromosomes (Chr X and Y) were
mapped to gene symbols (Table S1); gene symbols were mapped to
segmented regions using refGene.txt (version hg18), downloaded
from the UCSC genome browser, and ambiguous annotations
(genes with multiple annotations) of 28 genes were manually
resolved by using either NCBI, the Encode Gencode manual, a
BLAT similarity/score (26 genes), or refGene.txt of version hg19
(2 genes). Then, CNA data matrices for both GBM and OVC data
sets were organized with the same tumor samples (columns) as in
corresponding GE data matrices, and 22,082 and 22,086 genes
(rows), respectively. Missing values in CNA matrices were imputed
with the mean across all samples. PPI information was collected
from [9], including i) manually curated interactions in HPRD
[69], ii) signaling pathways from Reactome and NCI/Nature
pathway interactions, and iii) the MSKCC Cancer Cell Map. We
further converted this PPI information into an undirected graph
with 44,959 genes as nodes and 96,347 pairwise interactions as
edges.
Constructing a Gene-gene Relationship NetworkWe define a gene-gene relationship network as GGR: = (S, R).
Here, S is a set of seed genes and S: = (DE | SA), where DE and
SA are sets of differentially expressed and significantly copy
number altered genes, respectively. R is the set of pairwise gene-
gene relationships among these seed genes (Figure 1B).
Seed genes. To find the DE genes in S, the two-tailed pooled
t-test was used. For the t-test, 10 and 8 unmatched normal samples
downloaded from the GBM and OVC pages of the TCGA data
portal were used as control data sets, respectively. p-values were
corrected by the Bonferroni correction method and genes with
corrected p-values below a threshold were selected. To find SA
genes in GBM, we collected the focal aberrant regions identified
by the GISTIC and RAE algorithms in [8], where a subset of
samples of our study were used (Table S3 and S4 of the original
article, respectively). In these two algorithms, focal aberrant
regions were detected to distinguish relatively short aberrant
regions containing cancer-related genes from random broad
aberrant regions. Similarly, we collected altered regions found
by GISTIC in [14] (Supplementary Table S5.2 of the original
article) for OVC. Some genes in S had only GE data, some had
only CNA data, and others had both GE and CNA data (shown in
open rectangles, open circles, and filled circles in Figure 1B,
respectively).
Relationships among gene pairs. Pairwise relationships
between genes are measured by using an absolute value of Pearson
correlation coefficient (PCC). For any gene pair (genei, genej ),
absolute PCC values from GE-GE, CNA-GE, and CNA-CNA
data are calculated depending on data availability. Since any type
of relationship between two genes might affect cancer develop-
ment, all three absolute PCCs are considered, and the maximum
of them was chosen as a potential relationship value and defined as
a r value (Figure 1B). Note that, since proximal genes on the
chromosome are frequently amplified or deleted together, gene
pairs were not considered the CNA-CNA relationship if they were
in the same focal aberrant regions or within the same cytoband.
A gene pair (genei, genej ) is included in the gene-gene
relationship R with the r value as a weight if the r value is larger
than a threshold, and the relationship is called a direct
relationship. The threshold is empirically chosen based on the
distribution of all PCC values (see the Parameter selection section
below). For each gene pair (genei , genej ) =[ R, indirect relationships
are found by searching a statistically significant simple path
between two genes. Here, the significant path between two genes is
defined as a list of other genes that gives the statistically significant
geometric mean of r values from genei to genej throughout genes
in the list compared to the geometric mean of the path in a
random PPI network. The random PPI network is generated such
that interactions between genes are randomly assigned, while the
topology of the network and expression values of genes are
conserved with those in the observed PPI network. The null
hypothesis for the statistical significance test is that the geometric
mean of r values of a simple path in the randomly generated PPI
network is greater than or equal to that of the observed path.
However, since it takes an exponential time to consider every
possible pathes between two genes, a heuristic search is developed;
paths between genei and genej are searched if two genes are
connected in the PPI graph. A breadth first search algorithm is
used to search all simple paths between two genes (genei, genej ) =[R. Also, only the paths in which all genes have either GE, CNA, or
both types of data are considered. Since searching might yield
multiple paths, we chose the path P� with the maximum average
PPI connectivity, since genes having larger interactions with other
genes are more likely to be related to cancer (see File S1). P� is
measured by Equation (2),
P�~ maxP
1
n
Xn
i~1
deg(genei)
( ), ð2Þ
where deg(genei) is the degree of connectivity in the PPI graph for
genei and n is the number of genes along the path P�. Before
calculating the average connectivity for the genes along the path,
Voting-Based Cancer Module Identification
PLOS ONE | www.plosone.org 12 August 2013 | Volume 8 | Issue 8 | e70498

the connectivity of each gene genei is normalized with the global
maximum PPI connectivity (Equation (3)) to make the value in the
range of [0, 1].
norm deg(genei)~deg (genei )
global maxð3Þ
Then, the statistical significance of the path P* between genei and
genej is assessed based on the randomly generated PPI network. In
the null hypothesis mentioned above, the observed value is the
geometric mean of all pairwise r values along the path P*. If p-
value of the path P* obtained by comparing to Nrand random PPI
networks is below a threshold, the gene pair (genei, genej ) is
included in the gene-gene relationship network R as the indirect
relationship.
Module Detection: VToDThe proposed algorithm is described in Table 4, and source
codes of the VToD algorithm is provided in http://www.gcancer.
org/VToD/VToD.html.
Step 1: Calculate the association between genes. In
VToD, pairwise votes are first calculated for every pair of genes
fg,mg [ S, as shown in Equation (4), where norm deg(m) is the
normalized PPI connectivity of m using Equation (3), SPL(g,m) is
the shortest path length between two genes in the PPI graph, and
r value(g,m) is the relationship value used from our constructed
network GGR.
vote(g,m)~ norm deg(m)SPL(g,m)
zr value(g,m) ð4Þ
Equation (4) calculates the score when a gene g chooses a gene
m as a representative gene; the score increases if (i) a gene pair
fg,mg has a high relationship r value, denoting data-driven
property, or (ii) the gene m with a high topological value is closely
interacting with the gene g in the PPI network. Hub genes in the
PPI network have more chances to be selected as representative
genes due to norm deg(m), but are controlled by the length of the
shortest path between g and m to produce functional modules
related to the gene g. We apply constraints to the shortest path
length value ƒ path th to increase the compactness of a pre-
module, and to reduce the time-complexity for searching the
shortest path. If the shortest path length between the gene g and
the gene m is larger than path th, the topological information is
not considered and the vote-value is defined using only the data-
driven value between them. Note that vote(g,m) has values
between 0 and 2 since both terms have values between 0 and 1.
Step 2: Select representative genes of each gene. After
the vote calculation, a gene m is selected as a representative gene
of a given gene g based on a local rank and a global rank. In
calculating the local rank of the gene m for the gene g, all genes in
S are ranked by descending order of vote-values to the gene g.
Then, the cumulated vote-value from the largest vote-value to the
vote-value of the gene m is calculated. If the cumulated vote-value
is within the top k% of all cumulative vote-values, the gene m is
considered a candidate representative gene of the gene g. For the
global rank, if the vote(g,m) value is located within the top
vote th% of vote-values between all gene pairs in S, the gene m is
selected as the representative gene of the given gene g. This
approach allows multiple representative genes for the gene g, and
one gene can be selected as a representative gene for multiple
genes.
Step 3: Forming pre-modules. Each representative gene m
(from Step 2) starts forming a pre-module including only itself.
Then, each module is enlarged by aggregating all genes that
selected the gene m as the representative gene. A redundant pre-
module is removed when it is a subset of other pre-modules.
Smaller pre-modules are also removed if they contain either only
two genes (including the representative gene) or all the genes
except the representative gene in the pre-module are located in the
same focal region of chromosomes.
Step 4: Merging pre-modules. In this step, two pre-modules
are merged if pairwise members of the two pre-modules are highly
related in the gene-gene relationship network and are closely
connected in the PPI network. A pairwise merging value MV(Cl ,
Cm) between any two pre-modules Cl and Cm is calculated by
Equation (5). Let the sizes of Cl and Cm be nl and nm, respectively,
and let nl ƒ nm. In the equation, the topological property between
two pre-modules (or modules) is given as the ratio of genes in Cl
having at least one protein interaction partner in Cm (inter-
connectivity: IC(Cl , Cm)). Data-driven properties are calculated as
the average of gene-gene relationship values between two pre-
modules (or modules).
MV (Cl ,Cm)~IC(Cl ,Cm)
nlz 1
nl|nm
Pgi[Cl
Pgj[Cm
r value(gi,gj) ð5Þ
At every merging step, two modules having the maximum
pairwise merging value, denoted as MaxPair:Value in Step 4 of
Table 4, are merged and replaced by the newly merged module in
the module set. Such merging processes continue until the
MaxPair:Value is below the threshold merging th that is decided
by comparing the merging values generated by randomized
modules (see the next section for generating a randomized
module).
Statistical Significance of the Identified ModulesThe statistical significance of the identified modules is validated
by comparing them to randomized modules. To generate
randomized modules, r values of gene pairs in the gene-gene
relationship network GGR are shuffled, while the PPI network
remains unchanged, so that the topological property is discon-
nected from the data-driven property; then, using this shuffled
relationship network GGR, the whole VToD algorithm from Step
1 to Step 4 runs until a single pre-module is left. This generation of
randomized modules were repeated 100 times. Concurrently, the
observed pre-modules were merged until a single pre-module is
left. At each merging step, a pre-module pair that yields the
maximum merging value is selected, and these values for both
observed and random cases are plotted in Figures S3A and S3C,
for GBM and OVC, respectively. At each merging step, the
observed value was significantly greater than the average of the
maximum merging values in random cases, confirming that the
modules identified by the VToD algorithm are statistically
significant.
Next, to find the merging threshold merging th, the stopping
criteria of merging pre-modules, for each merging step, we
compared the maximum merging value of the observed case with
the maximum merging values of the first merging step in all 100
random cases and measured the empirical p-value (Figures S3B
and 3D for GBM and OVC data sets, respectively).
Voting-Based Cancer Module Identification
PLOS ONE | www.plosone.org 13 August 2013 | Volume 8 | Issue 8 | e70498

Functional and Cancer Gene Set EnrichmentWe tested whether constructed modules from both GBM and
OVC data sets were enriched with known signaling pathways or
biological functions. We used 186 KEGG pathways, 217 BioCarta
pathways, and 751 biological processes in GO downloaded from
the Molecular Signature Database (MsigDB) at the Broad Institute
(http://www.broad.mit.edu/gsea/msigdb/msigdb_index.html).
We excluded GO terms with sizes ƒ 5 and § 250 to omit too-
specific or too-general terms. Next, we selected cancer-related
subsets of pathways/terms from all pathways/terms. To find such
pathways/terms, we measured statistically significant enrichment
of cancer genes from CGC [31] in pathways/terms by applying a
hypergeometric test and by correcting the p-values using the FDR
multiple comparison correction, giving q-values. By applying q-
Table 4. The VToD algorithm.
VToD (GGR,PPI)
= ? Step1 ? =
1 for each gene g [ S
2 for each gene m [ S \ {g}
3 SPL / the shortest path length between gene g and m
4 if(SPLƒpath th) then
5 vote(g,m)~ norm deg(m)SPL(g,m)
zr value(g,m)
6 else
7 vote(g,m)~r value(g,m)
8 end if
9 end for
10 end for
= ? Step2 ? =
11 for each gene g [ S
12 for each gene m [ S
13 Calculate a local rank and a global rank for vote(g,m)
14 rep gene listg /Select gene m whose local rank and global rank of vote(g,m) are within k% and vote th%, respectively.
15 end for
16 end for
= ? Step3 ? =
17 All PreModules / 1
18 for each gene g [ S
19 rep gene listg / List of representative genes for ‘g’
20 for each gene rep [ rep gene listg
21 if(modulerep~1) then
22 modulerep / Make a new pre-module
23 modulerep / modulerep | fgg
24 All PreModules / All PreModules | fmodulerepg
25 else
26 modulerep / modulerep | fgg
27 end if
28 end for
29 end for
30 All PreModules� / Remove Redundancy
= ? Step4 ? =
31 MaxPair / FindMaxPair(All PreModules�)
32 while(MaxPair:Value § merging th)
33 new Module / Merge two modules in MaxPair:modules
34 All PreModules� / All PreModules� \ fMaxPair:modulesg35 All PreModules� / All PreModules� | fnew Moduleg36 MaxPair / FindMaxPair(All PreModules�)
37 end while
doi:10.1371/journal.pone.0070498.t004
Voting-Based Cancer Module Identification
PLOS ONE | www.plosone.org 14 August 2013 | Volume 8 | Issue 8 | e70498
values ƒ 0.05, 83, 139, and 338 cancer-related pathways/terms
were selected from KEGG, BioCarta pathways, and GO
biological process terms, respectively; they are listed in Table
S15. Also, cancer genes from CGC [31], GBM-related genes [33],
and OVC-related genes [34] were used to measure the cancer
gene enrichment of the identified modules.
For the enrichment analysis, a hypergeometric test was applied
to each module using the above all pathways/terms, cancer-
related pathways/terms, and cancer gene sets, giving p-values, and
q-values were obtained by the FDR multiple comparison
correction. The q-values v 0.05 was used for an enrichment
threshold. Note that q-values depend on the number of
comparisons and p-values of comparisons in the enrichment test.
Therefore, it may happen that although a module is enriched for a
pathway when the multiple comparison correction was performed
using the cancer-related subset of pathways, the module is not
enriched for the same pathway when the correction was done
using all pathways, and vice versa.
Parameter SelectionOur algorithm has following parameters: thresholds for selecting
differentially expressed genes, thresholds for r value, path th for
searching indirect relationships, k% and vote th% for selecting
representative genes, and merging th for merging pre-modules.
We used q-value v 0.05 for selecting differentially expressed genes
(Bonferroni corrected) and merging th. vote th were tested for
three different values, as shown in the Results section. However,
path th, thresholds for r value, and k% were empirically chosen
since these parameters affect the intermediate steps and are not
critical for final modules. Here, we explain these parameters in
detail.
From the distribution of three different direct relationships (GE-
GE, CNA-GE, and CNA-CNA), the top 10% of all corresponding
PCC values were selected as thresholds: 0.38, 0.165, and 0.435 for
GE-GE, CNA-GE, and CNA-CNA relationships, respectively, for
GBM (Figure S1A). By applying corresponding thresholds to the
r values between any pair of genes, 2,617,259 direct relationships
were included in the gene-gene relationship R, which was 22.53%
of 11,618,610 total gene pairs consisting of 4,821 seed genes in S.
To search indirect relationships for any pair (genei, genej ) =[ R,
the most relevant path P� was chosen after exploring all simple
paths in the PPI graph with path th = 2. The geometric mean of
pairwise r values along P� was calculated and the statistical
significance was measured over Nrand ( = 50) randomly generated
PPI networks. A gene pair (genei, genej ) having a p-value ƒ 0.05
was considered an indirect relationship and added to the gene-
gene relationship R. The 42,532 total pairs updated by indirect
relationships were 0.47% of all 9,001,351 ( = 11,618,610–
2,617,259) gene pairs.
Using an experimental setup similar to the one above, we
selected 0.295, 0.19, and 0.19 as thresholds for GE-GE, CNA-GE,
and CNA-CNA direct relationships, respectively, for OVC (Figure
S1B). Applying these thresholds to r values, we defined 5,681,333
(25.71% of all pairs) direct relationships in R, followed by updating
52,969 pairs (0.32% of all remaining pairs in R) as indirect
relationships.
To select representative genes for each gene, we needed to
decide two thresholds, k% and vote th%; the vote(g,m) value is
located (i) within the top k% of local vote-values and (ii) within the
top vote th% of global vote-values. We used k = 1 and tested three
values for vote th of the top 1%, 0.25%, and 0.1%, as mentioned
in the Results section. The distributions of all votes for the GBM
and OVC data sets are shown in Figure S2.
Supporting Information
Figure S1 Distributions of all enumerated pairwisedirect relationships among the genes in S. (A) is for
GBM data set and (B) is for OVC data set. X-axis indicates the
absolute Pearson correlation coefficient (PCC) for GE-GE, CNA-
GE and CNA-CNA relationships. For each distributions, y-axis
indicates the proportion of gene-pairs among the total number of
pair-wise relationships (GE-GE, CNA-GE, and CNA-CNA)
having corresponding PCC values. Here, we show the selection
of individual thresholds in the distribution using the arrows. For
both data sets, several peaks were observed, but we did not find
any particular reason for these peaks. Since we used a binning
approach to draw distributions, the observed peaks depend on the
bin size. For our convenience, we used the bin size of 0.01.
(EPS)
Figure S2 Distribution of pairwise voting values amonggenes. (A) is for the GBM data set and (B) for OVC data set. X-
axis and y-axis show the vote-values and their corresponding
frequencies among all gene pairs.
(EPS)
Figure S3 Statistical validation of the identified mod-ules and selection of merging th. (A) and (C) show comparison
between merging values between the observed case and 100
random cases, for GBM and OVC data sets, respectively. (B) and
(D) show p-values for merging values at each merging step, for
GBM and OVC data sets, respectively.
(EPS)
Figure S4 Module overlaps in terms of common genes.In (A) and (C), the ratios of the number of common (overlapping)
genes among the number of genes in the module are shown in x-
axis, for GBM and OVC data sets, respectively. Frequencies of
modules with the corresponding overlapping ratio in x-axis is
shown in y-axis. In (B) and (D), the average ratios of overlapping
genes in KEGG, BioCarta, and VToD are shown for GBM and
OVC data sets, respectively.
(EPS)
Figure S5 Representation of fractions of gene pairshaving direct relationships in modules. The x-axis shows
the module ID and the y-axis shows the fractions of gene pairs
having each type of direct relationships out of all possible gene
pairs for 22 GBM modules (A) and 23 OVC modules (B). For a
particular module, there are three vertical bars; a blue vertical bar
shows the fraction for the GE-GE relationship, a red bar for the
CNA-GE relationship, and a green bar for the CNA-CNA
relationship. For a gene pair, all three types of direct relationships
can be above their corresponding thresholds. Therefore, the
fraction of each individual vertical bar in a module is at most 1.
For example, GBM module 2 has 48 genes, indicating 1,128 gene
pairs. Among 1,128 gene pairs, there are 300 (300/
1,128 = 0.2659) gene-pairs with the GE-GE relationship, 9 (9/
1,128 = 0.0079) gene pairs with the CNA-GE relationship, and 8
(8/1,128 = 0.007092) gene pairs with the CNA-CNA relationship.
(EPS)
Figure S6 Comparison between hierarchical clusteringand the VToD algorithm. (A) Box charts of CGC and GBM
driver gene set enrichments for both the hierarchical clustering
and the VToD algorithm. (B) Percentages of modules in the
hierarchical clustering and the VToD algorithm that contain
different combinations of all three types of direct relationships.
(EPS)
Voting-Based Cancer Module Identification
PLOS ONE | www.plosone.org 15 August 2013 | Volume 8 | Issue 8 | e70498
Figure S7 Topological and data-driven properties usedin the vote calculation. (A) and (B) show the distributions of
topological property values of gene-pairs included in pre-modules,
for GBM and OVC, respectively. (C) and (D) show the distributions
of data-driven property values of gene-pairs included in pre-
modules, for GBM and OVC, respectively. In the inset panel, the
distribution of each property (both topological and data-driven)
values of all gene-pairs is shown. (E) and (F) are scatter plots of data-
driven property values versus topological property values of gene-
pairs included in the pre-modules, for GBM and OVC, respectively.
(EPS)
Figure S8 Distributions of topological and data-drivenproperties in merging pre-modules. (A) and (C) are
distributions of topological property values of all pairs of pre-
modules, and (B) and (D) are distributions of data-driven property
values of all pairs of pre-modules, for GBM and OVC, respectively.
(EPS)
Figure S9 Topological and data-driven property valueswhile merging pre-modules. (A) and (B) show contributions of
both properties to calculate merging-values while merging pre-
modules for GBM and OVC data sets, respectively. Topological
properties are colored in black and data-driven properties are in
blue.
(EPS)
Table S1 CNA genes and locations.(XLSX)
Table S2 List of identified modules for GBM.(XLSX)
Table S3 List of identified modules for OVC.(XLSX)
Table S4 Summary of enrichment test results for GBMmodules (VToD algorithm).(XLSX)
Table S5 Enrichment test results of KEGG pathways forGBM modules (VToD algorithm).(XLSX)
Table S6 Enrichment test results of BioCarta pathwaysfor GBM modules (VToD algorithm).(XLSX)
Table S7 Enrichment test results of GO biologicalprocesses for GBM modules (VToD algorithm).
(XLSX)
Table S8 Summary of enrichment test results for OVCmodules (VToD algorithm).
(XLSX)
Table S9 Enrichment test results of KEGG pathways forOVC modules (VToD algorithm).
(XLSX)
Table S10 Enrichment test results of BioCarta path-ways for OVC modules (VToD algorithm).
(XLSX)
Table S11 Enrichment test results of GO biologicalprocesses for OVC modules (VToD algorithm).
(XLSX)
Table S12 Summary of enrichment test results for GBMmodules (Hierarchical clustering).
(XLSX)
Table S13 Comparison of distinct enriched pathwaysbetween other methods and VToD for GBM data set.
(XLSX)
Table S14 Comparison of distinct enriched pathwaysbetween other methods and VToD for OVC data set.
(XLSX)
Table S15 Cancer-related KEGG pathways, BioCartapathways, and GO biological processes.
(XLSX)
File S1 Descriptions about finding indirect relation-ships, and topological and data-driven properties inmerging pre-modules.
(PDF)
Author Contributions
Conceived and designed the experiments: HL AA. Performed the
experiments: AA. Analyzed the data: HL AA. Contributed reagents/
materials/analysis tools: AA. Wrote the paper: HL AA.
References
1. Hahn WC, Weinberg RA (2002) Modelling the molecular circuitry of cancer.
Nat Rev Cancer 2: 331–341.
2. Vogelstein B, Kinzler KW (2004) Cancer genes and the pathways they control.
Nat Med 10: 789–799.
3. Davies H, Bignell GR, Cox C, Stephens P, Edkins S, et al. (2002) Mutations of
the BRAF gene in human cancer. Nature 417: 949–954.
4. Wan PTC, Garnett MJ, Roe SM, Lee S, Niculescu-Duvaz D, et al. (2004)
Mechanism of Activation of the RAF-ERK Signaling Pathway by Oncogenic
Mutations of B-RAF. Cell 116: 855–867.
5. Santarosa M, Ashworth A (2004) Haploinsufficiency for tumour suppressor
genes: when you don’t need to go all the way. Biochimica et Biophysica Acta
(BBA) - Reviews on Cancer 1654: 105–122.
6. Chuang HY, Lee E, Liu YT, Lee D, Ideker T (2007) Network-based
classification of breast cancer metastasis. Mol Syst Biol 3: 140.
7. Vaske CJ, Benz SC, Sanborn JZ, Earl D, Szeto C, et al. (2010) Inference of
patient-specific pathway activities from multi-dimensional cancer genomics data
using PARADIGM. Bioinformatics 26: i237–i245.
8. TCGA (2008) Comprehensive genomic characterization defines human
glioblastoma genes and core pathways. Nature 455: 1061–1068.
9. Cerami E, Demir E, Schultz N, Taylor BS, Sander C (2010) Automated
Network Analysis Identifies Core Pathways in Glioblastoma. PLoS ONE 5:
e8918.
10. Feuk L, Carson AR, Scherer SW (2006) Structural variation in the human
genome. Nat Rev Genet 7: 85–97.
11. Beroukhim R, Getz G, Nghiemphu L, Barretina J, Hsueh T, et al. (2007)
Assessing the significance of chromosomal aberrations in cancer: Methodology
and application to glioma. Proceedings of the National Academy of Sciences104: 20007–20012.
12. Taylor BS, Barretina J, Socci ND, DeCarolis P, Ladanyi M, et al. (2008)
Functional Copy-Number Alterations in Cancer. PLoS ONE 3: e3179.
13. Hur Y, Lee H (2011) Wavelet-based identification of DNA focal genomic
aberrations from single nucleotide polymorphism arrays. BMC Bioinformatics12: 146.
14. TCGA (2011) Integrated genomic analyses of ovarian carcinoma. Nature 474:
609–615.
15. Jornsten R, Abenius T, Kling T, Schmidt L, Johansson E, et al. (2011) Networkmodeling of the transcriptional effects of copy number aberrations in
glioblastoma. Mol Syst Biol 7.
16. Akavia UD, Litvin O, Kim J, Sanchez-Garcia F, Kotliar D, et al. (2010) An
Integrated Approach to Uncover Drivers of Cancer. Cell 143: 1005–1017.
17. Witten DM, Tibshirani R, Hastie T (2009) A penalized matrix decomposition,with applications to sparse principal components and canonical correlation
analysis. Biostatistics 10: 515–534.
18. Horvath S, Zhang B, Carlson M, Lu KV, Zhu S, et al. (2006) Analysis of
oncogenic signaling networks in glioblastoma identifies ASPM as a moleculartarget. Proceedings of the National Academy of Sciences 103: 17402–17407.
19. Choi JK, Yu U, Yoo OJ, Kim S (2005) Differential coexpression analysis using
microarray data and its application to human cancer. Bioinformatics 21: 4348–
4355.
Voting-Based Cancer Module Identification
PLOS ONE | www.plosone.org 16 August 2013 | Volume 8 | Issue 8 | e70498

20. Mo W, Fu X, Han X, Yang G, Zhang J, et al. (2009) A stochastic model for
identifying differential gene pair co-expression patterns in prostate cancerprogression. BMC Genomics 10: 340.
21. Gorringe KL, George J, Anglesio MS, Ramakrishna M, Etemadmoghadam D,
et al. (2010) Copy Number Analysis Identifies Novel Interactions BetweenGenomic Loci in Ovarian Cancer. PLoS ONE 5: e11408.
22. Klijn C, Bot J, Adams DJ, Reinders M, Wessels L, et al. (2010) Identification ofNetworks of Co-Occurring, Tumor-Related DNA Copy Number Changes
Using a Genome-Wide Scoring Approach. PLoS Comput Biol 6: e1000631.
23. Cui Q (2010) A Network of Cancer Genes with Co-Occurring and Anti-Co-Occurring Mutations. PLoS ONE 5: e13180.
24. Masica DL, Karchin R (2011) Correlation of Somatic Mutation and ExpressionIdentifies Genes Important in Human Glioblastoma Progression and Survival.
Cancer Research 71: 4550–4561.25. Lee H, Kong SW, Park PJ (2008) Integrative analysis reveals the direct and
indirect interactions between DNA copy number aberrations and gene
expression changes. Bioinformatics 24: 889–896.26. Solvang H, Lingjaerde O, Frigessi A, Borresen-Dale AL, Kristensen V (2011)
Linear and non-linear dependencies between copy number aberrations andmRNA expression reveal distinct molecular pathways in breast cancer. BMC
Bioinformatics 12: 197.
27. Xu C, Liu Y, Wang P, Fan W, Rue T, et al. (2010) Integrative analysis of DNAcopy number and gene expression in metastatic oral squamous cell carcinoma
identifies genes associated with poor survival. Molecular Cancer 9: 143.28. Kanehisa M, Goto S, Sato Y, Furumichi M, Tanabe M (2012) KEGG for
integration and interpretation of large-scale molecular data sets. Nucleic AcidsRes 40: D109–14.
29. BioCarta. Available: http://www.biocarta.com/. Accessed 2011 Oct 19.
30. Ashburner M, Ball C, Blake J, Botstein D, Butler H, et al. (2000) Gene ontology:tool for the unification of biology. The Gene Ontology Consortium. Nat Genet
25: 25–9.31. Futreal PA, Coin L, Marshall M, Down T, Hubbard T, et al. (2004) A census of
human cancer genes. Nat Rev Cancer 4: 177–183.
32. Hwang W, Cho YR, Zhang A, Ramanathan M (2006) A novel functionalmodule detection algorithm for protein-protein interaction networks. Algorithms
for Molecular Biology 1: 24.33. Parsons DW, Jones S, Zhang X, Lin JCH, Leary RJ, et al. (2008) An Integrated
Genomic Analysis of Human Glioblastoma Multiforme. Science 321: 1807–1812.
34. Bast RC, Hennessy B, Mills GB (2009) The biology of ovarian cancer: new
opportunities for translation. Nat Rev Cancer 9: 415–428.35. Sarela A, Farmery S, Markham A, Guillou P (1999) The candidate tumour
suppressor gene, ing1, is retained in colorectal carcinomas. European Journal ofCancer 35: 1264–1267.
36. Nakanishi A, Han X, Saito H, Taguchi K, Ohta Y, et al. (2007) Interference
with brca2, which localizes to the centrosome during s and early m phase, leadsto abnormal nuclear division. Biochemical and Biophysical Research Commu-
nications 355: 34–40.37. Tallen G, Farhangi S, Tamannai M, Holtkamp N, Mangoldt D, et al. (2009)
The inhibitor of growth 1 (ING1) proteins suppress angiogenesis anddifferentially regulate angiopoietin expression in glioblastoma cells. Oncol Res
18: 95–105.
38. Quiros S, Roos WP, Kaina B (2011) Rad51 and brca2 - new molecular targetsfor sensitizing glioma cells to alkylating anticancer drugs. PLoS ONE 6: e27183.
39. Li DM, Sun H (1998) Pten/mmac1/tep1 suppresses the tumorigenicity andinduces g1 cell cycle arrest in human glioblastoma cells. Proceedings of the
National Academy of Sciences 95: 15406–15411.
40. Liu Y, Shete S, Etzel CJ, Scheurer M, Alexiou G, et al. (2010) Polymorphisms oflig4, btbd2, hmga2, and rtel1 genes involved in the double-strand break repair
pathway predict glioblastoma survival. Journal of Clinical Oncology 28: 2467–2474.
41. Watanabe A, Ogiwara H, Ehata S, Mukasa A, Ishikawa S, et al. (2011)
Homozygously deleted gene dach1 regulates tumor-initiating activity of gliomacells. Proceedings of the National Academy of Sciences 108: 12384–12389.
42. del Mar Inda M, Fan X, Munoz J, Perot C, Fauvet D, et al. (2003)Chromosomal abnormalities in human glioblastomas: Gain in chromosome 7p
correlating with loss in chromosome 10q. Molecular Carcinogenesis 36: 6–14.43. Henson J, Schnitker B, Correa K, von Deimling A, Fassbender F, et al. (1994)
The retinoblastoma gene is involved in malignant progression of astrocytomas.
Ann Neurol 36: 714–21.44. Carrero P, Okamoto K, Coumailleau P, O’Brien S, Tanaka H, et al. (2000)
Redox-regulated recruitment of the transcriptional coactivators creb-bindingprotein and src-1 to hypoxia-inducible factor 1. Molecular and Cellular Biology
20: 402–415.
45. Donovan L, Potter N, Warr T, Pilkington G (2012) A Prominin-1-Rich Pediatric
Glioblastoma: Biologic Behavior Is Determined by Oxygen Tension-ModulatedCD133 Expression but Not Accompanied by Underlying Molecular Profiles.
Transl Oncol 5: 141–54.
46. Irminger-Finger I, Leung WC, Li J, Dubois-Dauphin M, Harb J, et al. (2001)Identification of bard1 as mediator between proapoptotic stress and p53-
dependent apoptosis. Molecular Cell 8: 1255–1266.
47. Sobottka S, Haase M, Fitze G, Hahn M, Schackert H, et al. (2000) Frequent loss
of heterozygosity at the 19p13.3 locus without lkb1/stk11 mutations in humancarcinoma metastases to the brain. Journal of Neuro-Oncology 49: 187–195.
48. Kanu OO, Hughes B, Di C, Lin N, Fu J, et al. (2009) Glioblastoma Multiforme
Oncogenomics and Signaling Pathways. Clinical Medicine Insights: Oncology 3:
39.
49. Chen H, Ye D, Xie X, Chen B, Lu W (2004) Vegf, vegfrs expressions andactivated stats in ovarian epithelial carcinoma. Gynecologic Oncology 94: 630–
635.
50. Rosenthal LA, Winestock KD, Finbloom DS (1997) Il-2 and il-7 induceheterodimerization of stat5 isoforms in human peripheral blood t lymphoblasts.
Cellular Immunology 181: 172–181.
51. Hennighausen L, Robinson G (2005) Information networks in the mammary
gland. Nat Rev Mol Cell Biol 6: 715–25.
52. Bouilly J, Sonigo C, Auffret J, Gibori G, Binart N (2012) Prolactin signalingmechanisms in ovary. Molecular and Cellular Endocrinology 356: 80–87.
53. Grandis JR, Drenning SD, Chakraborty A, Zhou MY, Zeng Q, et al. (1998)Requirement of stat3 but not stat1 activation for epidermal growth factor
receptor- mediated cell growth in vitro. The Journal of Clinical Investigation102: 1385–1392.
54. Guren T, Abrahamsen H, Thoresen G, Babaie E, Berg T, et al. (1999) EGF-
induced activation of Stat1, Stat3, and Stat5b is unrelated to the stimulation of
DNA synthesis in cultured hepatocytes. Biochem Biophys Res Commun 258:565–71.
55. Colomiere M, Ward A, Riley C, Trenerry M, Cameron-Smith D, et al. (2009)
Cross talk of signals between EGFR and IL-6R through JAK2/STAT3 mediateepithelial-mesenchymal transition in ovarian carcinomas. Br J Cancer 100: 134–
44.
56. Benito M, Valverde A, Lorenzo M (1996) IGF-I: a mitogen also involved in
differentiation processes in mammalian cells. Int J Biochem Cell Biol 28: 499–510.
57. Ren Z, Schaefer T (2002) ErbB-2 activates Stat3 alpha in a Src- and JAK2-
dependent manner. J Biol Chem 277: 38486–93.
58. Jones R, Gordus A, Krall J, MacBeath G (2006) A quantitative protein
interaction network for the ErbB receptors using protein microarrays. Nature439: 168–74.
59. Fujitani Y, Hibi M, Fukada T, Takahashi-Tezuka M, Yoshida H, et al. (1997)
An alternative pathway for STAT activation that is mediated by the directinteraction between JAK and STAT. Oncogene 14: 751–61.
60. Barahmand-Pour F, Meinke A, Groner B, Decker T (1998) Jak2-Stat5interactions analyzed in yeast. J Biol Chem 273: 12567–75.
61. Stortelers C, Souriau C, van Liempt E, van de Poll M, van Zoelen E (2002) Role
of the N-terminus of epidermal growth factor in ErbB-2/ErbB-3 binding studiedby phage display. Biochemistry 41: 8732–41.
62. Thornton C, Yaka R, Dinh S, Ron D (2003) H-Ras modulates N-methyl-D-aspartate receptor function via inhibition of Src tyrosine kinase activity. J Biol
Chem 278: 23823–9.
63. Yip A, Horvath S (2007) Gene network interconnectedness and the generalizedtopological overlap measure. BMC Bioinformatics 8: 22.
64. Langfelder P, Zhang B, Horvath S (2008) Defining clusters from a hierarchical
cluster tree: the Dynamic Tree Cut package for R. Bioinformatics 24: 719–720.
65. Girvan M, Newman MEJ (2002) Community structure in social and biological
networks. Proceedings of the National Academy of Sciences 99: 7821–7826.
66. Ulitsky I, Shamir R (2007) Identification of functional modules using networktopology and highthroughput data. BMC Systems Biology 1: 8.
67. Li M, Wu X, Wang J, Pan Y (2012) Towards the identification of protein
complexes and functional modules by integrating ppi network and gene
expression data. BMC Bioinformatics 13: 109.
68. Nepusz T, Yu H, Paccanaro A (2012) Detecting overlapping protein complexesin protein-protein interaction networks. Nat Meth 9: 471–472.
69. Keshava Prasad TS, Goel R, Kandasamy K, Keerthikumar S, Kumar S, et al.
(2009) Human protein reference database?2009 update. Nucleic Acids Research
37: D767–D772.
70. Shannon P, Markiel A, Ozier O, Baliga NS, Wang JT, et al. (2003) Cytoscape: ASoftware Environment for Integrated Models of Biomolecular Interaction
Networks. Genome Research 13: 2498–2504.
Voting-Based Cancer Module Identification
PLOS ONE | www.plosone.org 17 August 2013 | Volume 8 | Issue 8 | e70498