Volumetric Change of Selected Organs at Risk During IMRT for Oropharyngeal Cancer
8
CLINICAL INVESTIGATION Head and Neck VOLUMETRIC CHANGE OF SELECTED ORGANS AT RISK DURING IMRT FOR OROPHARYNGEAL CANCER FRANCESCO RICCHETTI, M.D.,* BINBIN WU,PH.D.,* TODD MCNUTT,PH.D.,* JOHN WONG,PH.D.,* ARLENE FORASTIERE, M.D., y SHANTHI MARUR, M.D., y HEATHER STARMER, M.A., CCC-SLP, z AND GIUSEPPE SANGUINETI, M.D.* From the Departments of *Radiation Oncology and Molecular Radiation Sciences, y Oncology, and z Speech Therapy, Johns Hopkins University, Baltimore, MD, USA Purpose: To assess volumetric changes of selected organs at risk (OAR) during intensity-modulated radiotherapy (IMRT) for oropharyngeal carcinoma. Materials and Methods: Twenty-six consecutive patients that were treated with definitive IMRT ± chemotherapy between November 2007 and November 2008 were selected for the present study. As part of an internal quality assurances program, a repeat kilovolt (KV) computed tomography was planned weekly during the 7-week treat- ment course. On each available scan, a single observer contoured the parotid submandibular, and thyroid glands (PG/SMG/TG), larynx (L), and constrictor, masticatory, and sternocleidomastoid muscles (CM/MM/SCM) as ap- propriate. The volume at each scan was compared with the one at planning CT in a pair-wise fashion. p values <0.05 after correction for multiple testing were considered significant. Results: A total of 159 scans was obtained during treatment for a total of 185 scans, including the baseline imaging. All OARs showed statistically significant changes over baseline by week 5. At week 7, the PG showed the largest absolute change with an average reduction of 10 mL followed by both the SCM and MM (-5 mL). The largest (-30%) relative change was observed for the salivary glands. L and CM showed a 15% increase in volume during treatment. Conclusion: All selected OAR undergo significant volumetric changes during a course of IMRT for oropharyngeal squamous cell carcinoma. Ó 2011 Elsevier Inc. Volumetric change, Oropharyngeal cancer, IMRT. INTRODUCTION Fractionated radiotherapy is based on the assumption that the dose distribution obtained at planning is delivered during each treatment session. Unfortunately, both setup errors and tissue changes can modify the dose distribution on a ran- dom—occasional or repeated—systematic basis. Shifts in the location of the isodose levels become critical for techniques that are highly conformal to the target(s), such as intensity- modulated radiotherapy (IMRT), justifying the interest in im- age guidance and adaptive radiotherapy (1). Because of the sharp dose gradient around the targets, subtle changes in the relative position or volume of organs at risk (OAR) may alter the planned amount of volume that receives a given dose as it has been shown for the parotid glands (2–4). The head and neck (H&N) district is particularly complex because it contains a variety of tissues in close proximity, if not embedded, within the targets and thus exposed to signif- icant doses of radiation. Moreover, the dose reduction to specified structures during IMRT planning may lead to an in- creased beam path dose to nontarget structures that may reach a level of clinical relevance (5). The patient with H&N cancer treated with (chemo)radiotherapy is also at particular risk for significant quantitative and qualitative changes in body mass composition during the course of treatment that are only partially counteracted by adequate nutritional support (6, 7). Therefore, it is not surprising that some studies have docu- mented parotid gland shrinkage in most patients undergoing radiotherapy for H&N cancer (2–4, 8, 9). However, based on the considerations discussed previously, we suspect that many other soft-tissue OAR may change in volume as well. As part of a larger H&N cancer project aimed at quantify- ing both volumetric and dosimetric changes in selected OAR Reprint requests: Giuseppe Sanguineti, M.D., Department of Ra- diation Oncology & Molecular Radiation Sciences, The Sidney Kimmel Comprehensive Cancer Center at Johns Hopkins, 401 N. Broadway, Suite 1440, Baltimore, MD 21231-2410. Tel: 410- 502-3877; Fax: 410-502-1419; E-mail: [email protected] Conflict of interest: none. Acknowledgment—The authors would like to thank Maria Pia Sormani, Ph.D., John Christodouleas, M.D., and Claudio Fiorino, Ph.D., for insights about the analysis and the interpretation of the data. Received Dec 2, 2009, and in revised form Jan 24, 2010. Accepted for publication Jan 28, 2010. 161 Int. J. Radiation Oncology Biol. Phys., Vol. 80, No. 1, pp. 161–168, 2011 Copyright Ó 2011 Elsevier Inc. Printed in the USA. All rights reserved 0360-3016/$–see front matter doi:10.1016/j.ijrobp.2010.01.071
-
Upload
ucriverside -
Category
Documents
-
view
4 -
download
0
Transcript of Volumetric Change of Selected Organs at Risk During IMRT for Oropharyngeal Cancer
Int. J. Radiation Oncology Biol. Phys., Vol. 80, No. 1, pp. 161–168, 2011Copyright � 2011 Elsevier Inc.
Printed in the USA. All rights reserved0360-3016/$–see front matter
jrobp.2010.01.071
doi:10.1016/j.iCLINICAL INVESTIGATION Head and Neck
VOLUMETRIC CHANGE OF SELECTED ORGANS AT RISK DURING IMRT FOROROPHARYNGEAL CANCER
FRANCESCO RICCHETTI, M.D.,* BINBIN WU, PH.D.,* TODD MCNUTT, PH.D.,* JOHN WONG, PH.D.,*
ARLENE FORASTIERE, M.D.,y SHANTHI MARUR, M.D.,y HEATHER STARMER, M.A., CCC-SLP,z
AND GIUSEPPE SANGUINETI, M.D.*
From the Departments of *Radiation Oncology and Molecular Radiation Sciences, y Oncology, and zSpeech Therapy, Johns HopkinsUniversity, Baltimore, MD, USA
Reprindiation OKimmel CBroadway502-3877
Conflic
Purpose: To assess volumetric changes of selected organs at risk (OAR) during intensity-modulated radiotherapy(IMRT) for oropharyngeal carcinoma.Materials and Methods: Twenty-six consecutive patients that were treated with definitive IMRT ± chemotherapybetween November 2007 and November 2008 were selected for the present study. As part of an internal qualityassurances program, a repeat kilovolt (KV) computed tomography was planned weekly during the 7-week treat-ment course. On each available scan, a single observer contoured the parotid submandibular, and thyroid glands(PG/SMG/TG), larynx (L), and constrictor, masticatory, and sternocleidomastoid muscles (CM/MM/SCM) as ap-propriate. The volume at each scan was compared with the one at planning CT in a pair-wise fashion. p values <0.05after correction for multiple testing were considered significant.Results: A total of 159 scans was obtained during treatment for a total of 185 scans, including the baseline imaging.All OARs showed statistically significant changes over baseline by week 5. At week 7, the PG showed the largestabsolute change with an average reduction of �10 mL followed by both the SCM and MM (�-5 mL). The largest(�-30%) relative change was observed for the salivary glands. L and CM showed a �15% increase in volumeduring treatment.Conclusion: All selected OAR undergo significant volumetric changes during a course of IMRT for oropharyngealsquamous cell carcinoma. � 2011 Elsevier Inc.
Volumetric change, Oropharyngeal cancer, IMRT.
INTRODUCTION
Fractionated radiotherapy is based on the assumption that the
dose distribution obtained at planning is delivered during
each treatment session. Unfortunately, both setup errors
and tissue changes can modify the dose distribution on a ran-
dom—occasional or repeated—systematic basis. Shifts in the
location of the isodose levels become critical for techniques
that are highly conformal to the target(s), such as intensity-
modulated radiotherapy (IMRT), justifying the interest in im-
age guidance and adaptive radiotherapy (1). Because of the
sharp dose gradient around the targets, subtle changes in
the relative position or volume of organs at risk (OAR)
may alter the planned amount of volume that receives a given
dose as it has been shown for the parotid glands (2–4).
The head and neck (H&N) district is particularly complex
because it contains a variety of tissues in close proximity, if
t requests: Giuseppe Sanguineti, M.D., Department of Ra-ncology & Molecular Radiation Sciences, The Sidneyomprehensive Cancer Center at Johns Hopkins, 401 N., Suite 1440, Baltimore, MD 21231-2410. Tel: 410-
; Fax: 410-502-1419; E-mail: [email protected] of interest: none.
161
not embedded, within the targets and thus exposed to signif-
icant doses of radiation. Moreover, the dose reduction to
specified structures during IMRT planning may lead to an in-
creased beam path dose to nontarget structures that may reach
a level of clinical relevance (5). The patient with H&N cancer
treated with (chemo)radiotherapy is also at particular risk
for significant quantitative and qualitative changes in body
mass composition during the course of treatment that are
only partially counteracted by adequate nutritional support
(6, 7).
Therefore, it is not surprising that some studies have docu-
mented parotid gland shrinkage in most patients undergoing
radiotherapy for H&N cancer (2–4, 8, 9). However, based on
the considerations discussed previously, we suspect that
many other soft-tissue OAR may change in volume as well.
As part of a larger H&N cancer project aimed at quantify-
ing both volumetric and dosimetric changes in selected OAR
Acknowledgment—The authors would like to thank Maria PiaSormani, Ph.D., John Christodouleas, M.D., and Claudio Fiorino,Ph.D., for insights about the analysis and the interpretation of thedata.
Received Dec 2, 2009, and in revised form Jan 24, 2010.Accepted for publication Jan 28, 2010.

162 I. J. Radiation Oncology d Biology d Physics Volume 80, Number 1, 2011
during a course of IMRT and perspective treatment adapta-
tion at our institution, we report the volumetric change of se-
lected OAR during a course of IMRT for oropharyngeal
squamous cell carcinoma.
MATERIALS AND METHODS
Patients and scansPatients treated with definitive IMRT � chemotherapy for oro-
pharyngeal squamous cell carcinoma at Johns Hopkins University
undergo weekly kilovolt (KV) computed tomography (CT) scans
in addition to the planning CT (pl-CT) as part of an internal quality
assurance program. The CT scan is tentatively acquired during each
week of treatment, without a fixed time interval between consecu-
tive scans, based on the availability of the CT simulation. On each
scan, selected organs at risk were retrospectively contoured as ap-
propriate on consecutive patients treated at Johns Hopkins Univer-
sity over a 1-year time frame. The purpose of the present study
that was approved by the local institutional review board is to de-
scribe the volumetric change of selected OAR during treatment of
patients with oropharynx cancer.
Fig. 1. Axial computed tomography (CT) scans illustratingContours at planning CT are the red and the yellow ones for colight blue colors represent the organs at risk at week 7.
OAR and contoursA single observer (F.R.) contoured the following OAR on each
scan: parotid glands (PG), submandibular glands (SMG), thyroid
gland (TG), constrictor muscles (CM), sternocleidomastoid muscles
(SCM), masticatory muscles (MM), and larynx (L). Contours on the
initial planning scan were reviewed by another radiation oncologist
(G.S.). To contour the larynx, we followed a previously reported ap-
proach that focuses on the soft tissues within the cartilaginous
framework (10) after further excluding the airway. For the constric-
tor muscles, we followed the directions illustrated by Levendag
et al. that essentially identifies the thin muscle layer in the posterior
pharyngeal wall in front of the vertebral bodies and the prevertebral
muscles (11). The superior, middle, and inferior constrictor muscles
were then pooled into a single region of interest. Figure 1 illustrates
an example for both L and CM on an axial slice. In the contour of
the MM, we included the masseter muscle and the medial and the
lateral pterygoid muscles from the mandible cranially to the level
of the zygomatic arch, excluding all other structures/tissues (mandi-
ble, fat) as appropriate. The SCM has been contoured from the
mastoid tip down to the clavicle. Each paired OAR was divided
into ipsilateral (i) and contralateral (c) with respect to the dominant
side of the cancer.
volumetric changes of larynx and constrictors muscles.nstrictor muscles and larynx, respectively; the green and
Volumetric Change of OAR during IMRT d F. RICCHETTI et al. 163
To improve consistency of contours among scans, a propagation
tool from Pinnacle3 (Philips RadOnc Systems, Madison, WI)
was used to transfer a given contour on the subsequent scan after
CT-CT registration based on bony landmarks. This allowed the
observer to edit the new contour based on the preceding one and
to start from the same craniocaudal borders, thus minimizing
uncertainties in this direction.
Contoured structures had to be clinically grossly uninvolved by
the tumor and clearly identifiable on the initial pl-CT. Therefore,
not all the regions of interest were contoured for each patient. Se-
lected OAR were not available if they had been surgically removed
(i.e., the submandibular gland after a modified radical neck dissec-
tion) or infiltrated by the tumor to the point that the structure was
no longer clearly identifiable as a separate structure on the pl-CT
(i.e., SCM infiltration by a neck lymph node or laryngeal infiltration
by a primary tumor in the base of tongue). However, if a given OAR
was available on the pl-CT, it was also contoured on all weekly CT
for a given patient as appropriate.
IMRTAll patients underwent a three-level dose painting IMRT with the
following total doses: 70 Gy to macroscopic disease clinical target
volume (CTV1); 63 Gy to microscopic high-risk disease (CTV2);
and 58.1 Gy to microscopic low-risk disease (CTV3). All doses
were given for the same number (n = 35) of fractions over 7 weeks.
In patients with upfront tonsillectomy, the dose to the tonsillar bed
could have been lowered to 68.25 Gy (1.95 Gy per fraction) instead
of 70 Gy, which would correspond to about 66 Gy at 2 Gy per fraction
(12). Each CTV was expanded by 5 mm to the corresponding PTV.
Our IMRT approach involves a nine-field step-and-shoot tech-
nique. Dose–volume objectives are placed on both primary (brain,
brainstem, cord + 4 mm) and secondary (mandible, parotids, and
larynx) OAR.
StatisticsAfter each selected OAR was contoured on the serial CT as appro-
priate, its volume was extracted from Pinnacle3. For each observa-
tion during treatment and each OAR, we computed the absolute
and the relative variation in volume compared with the one at plan-
ning. Locally weighted scatterplot smoothing curves were used to
illustrate the relative change of each OAR across time.
To avoid inference by dealing with repeated data from the same
patient and to investigate the effect of temporal changes on volumet-
ric data, observed values were organized as follows. We first
assigned the computed value of relative change for each OAR to
a week of treatment based on the calendar day of IMRT delivery
with respect to the first day of treatment (time = 0). Week 1 includes
data computed from observations recorded during treatment days 1–
7; week 2, days 8–15; week 3, days 16–22; and so on. For patients
who had two observations during the same week of treatment,
a mathematical average of the two was taken. No attempt was
made to correct for missing data. Changes over baseline were com-
pared with the Wilcoxon rank sum test in a pair-wise fashion. It
should be noted that because not all contours were available for
each patient, the number of pairs being compared at each time
interval might vary among comparisons. Within each time frame,
significance levels were adjusted with the Bonferroni-Holm correc-
tion for multiple testing (13). All tests were two-sided and statistical
difference was claimed for adjusted p (a-p) values < 0.05.
Intra-observer variability was assessed for its impact on observed
differences over time as follows. Within each OAR, patients were
divided into three groups based on the relative change at the last
available scan over baseline. From each subgroup (here defined
low, intermediate, and high variation), 2 patients were randomly se-
lected. For each of the resulting 6 patients, we further randomly
selected three scans: one during the first 2.5 weeks; one during the
second 2.5 weeks; and one after the fifth week of treatment. The
same observer (F.R.) recontoured the repeated structures at least 2
months after the first pass using the same procedure as discussed
previously and was blinded to the previous result. This resulted in
18 recontours for each OAR. The measurement error (ME) was
computed as the absolute difference between the two measured
volumes of the same OAR at the two readings. The percentage mea-
surement error (%ME) that estimates intraobserver variability (14)
was determined by dividing the measurement error by the average
of the two measurements for each OAR. The mean, standard
deviation (SD), median, and range were calculated for each OAR.
Differences in measurement error between observations obtained
in the various subgroups were tested with a Wilcoxon rank sum
test and significance claimed for p values < 0.05.
All analyses were performed using GraphPad (version 1.03,
GraphPad Software Inc., San Diego, CA) and SPSS (version 17.0,
SPSS Inc., Chicago, IL).
RESULTS
Patients and treatmentThe analyzed patient population consists of 26 consecutive
patients treated between November 2007 and November
2008. Patient, tumor, and treatment characteristics are re-
ported in Table 1. Median age was 54 years (range, 41–73
years). Six patients underwent upfront surgery: 2 had bilat-
eral tonsillectomy, 2 had neck dissection, and 2 tonsillectomy
and neck dissection.
Regarding nutritional status at baseline, 6 patients (23.7%)
had reported dysphagia and weight loss >10%; all were
started on enteral nutrition via a percutaneous endoscopic
gastrostomy (PEG) tube. In the other 14 patients (53.8%),
a PEG tube was inserted prophylactically before chemoradio-
therapy. Pretreatment speech pathologist evaluation includ-
ing swallowing assessment was performed in 14 patients
(53.8%). Formal instruction on prophylactic swallowing
and trismus exercises to be done twice daily throughout treat-
ment was provided to 12 patients (46.1%). Moreover, all pa-
tients were instructed to try to continue oral intake throughout
treatment despite the PEG tube.
All patients completed IMRT as prescribed except for
1 patient who missed the last fraction (total dose: 68 Gy).
Median overall treatment time was 7.0 weeks (range, 6.6–
9.6 weeks).
Median weight loss during treatment was -11.2% (range,
+6.1% to -20.7%). Of note, 1 patient had fluid retention
from chemo-related nephrotoxicity and gained weight. At
a median follow-up of 13.0 months (range, 1.9–18.8
months), 5 patients remain PEG tube–dependent, 4 of these
with persistent/recurrent local disease, and 1 without evi-
dence of disease at 18.2 months from treatment completion.
ScansPatients underwent the pretreatment pl-CT at a median
time of 18 days (range, 10–27 days) before treatment start.
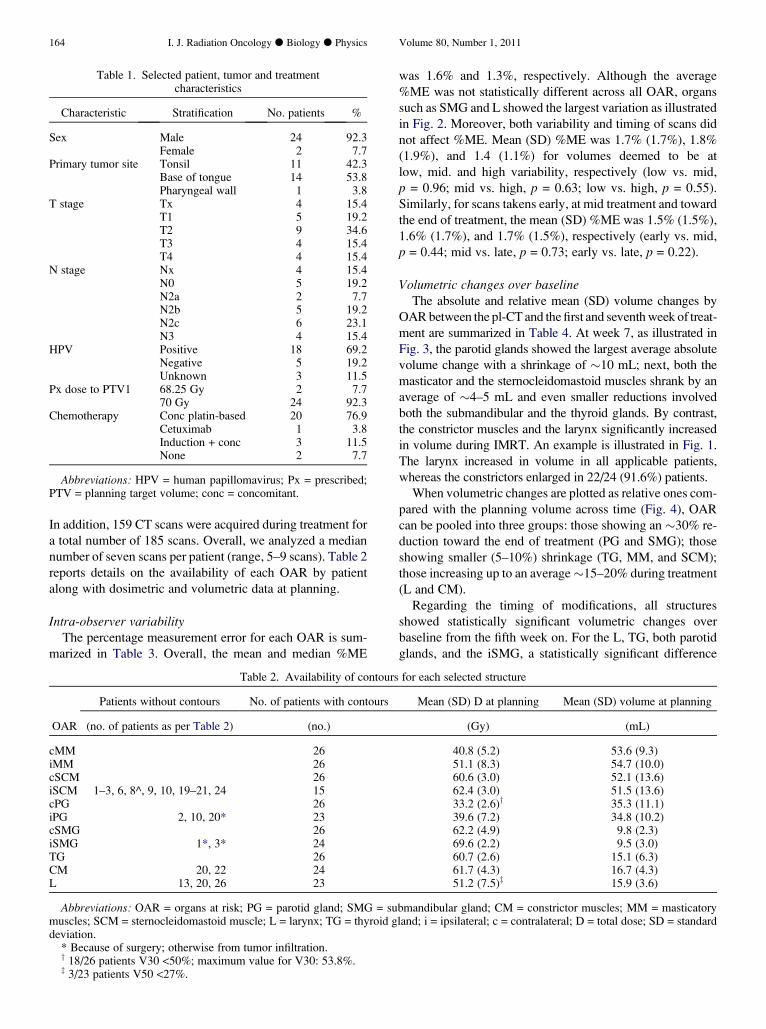
Table 1. Selected patient, tumor and treatmentcharacteristics
Characteristic Stratification No. patients %
Sex Male 24 92.3Female 2 7.7
Primary tumor site Tonsil 11 42.3Base of tongue 14 53.8Pharyngeal wall 1 3.8
T stage Tx 4 15.4T1 5 19.2T2 9 34.6T3 4 15.4T4 4 15.4
N stage Nx 4 15.4N0 5 19.2N2a 2 7.7N2b 5 19.2N2c 6 23.1N3 4 15.4
HPV Positive 18 69.2Negative 5 19.2Unknown 3 11.5
Px dose to PTV1 68.25 Gy 2 7.770 Gy 24 92.3
Chemotherapy Conc platin-based 20 76.9Cetuximab 1 3.8Induction + conc 3 11.5None 2 7.7
Abbreviations: HPV = human papillomavirus; Px = prescribed;PTV = planning target volume; conc = concomitant.
164 I. J. Radiation Oncology d Biology d Physics Volume 80, Number 1, 2011
In addition, 159 CT scans were acquired during treatment for
a total number of 185 scans. Overall, we analyzed a median
number of seven scans per patient (range, 5–9 scans). Table 2
reports details on the availability of each OAR by patient
along with dosimetric and volumetric data at planning.
Intra-observer variabilityThe percentage measurement error for each OAR is sum-
marized in Table 3. Overall, the mean and median %ME
Table 2. Availability of contours
Patients without contours No. of patients with contours
OAR (no. of patients as per Table 2) (no.)
cMM 26iMM 26cSCM 26iSCM 1–3, 6, 8^, 9, 10, 19–21, 24 15cPG 26iPG 2, 10, 20* 23cSMG 26iSMG 1*, 3* 24TG 26CM 20, 22 24L 13, 20, 26 23
Abbreviations: OAR = organs at risk; PG = parotid gland; SMG = sumuscles; SCM = sternocleidomastoid muscle; L = larynx; TG = thyroid gdeviation.
* Because of surgery; otherwise from tumor infiltration.y 18/26 patients V30 <50%; maximum value for V30: 53.8%.z 3/23 patients V50 <27%.
was 1.6% and 1.3%, respectively. Although the average
%ME was not statistically different across all OAR, organs
such as SMG and L showed the largest variation as illustrated
in Fig. 2. Moreover, both variability and timing of scans did
not affect %ME. Mean (SD) %ME was 1.7% (1.7%), 1.8%
(1.9%), and 1.4 (1.1%) for volumes deemed to be at
low, mid. and high variability, respectively (low vs. mid,
p = 0.96; mid vs. high, p = 0.63; low vs. high, p = 0.55).
Similarly, for scans takens early, at mid treatment and toward
the end of treatment, the mean (SD) %ME was 1.5% (1.5%),
1.6% (1.7%), and 1.7% (1.5%), respectively (early vs. mid,
p = 0.44; mid vs. late, p = 0.73; early vs. late, p = 0.22).
Volumetric changes over baselineThe absolute and relative mean (SD) volume changes by
OAR between the pl-CT and the first and seventh week of treat-
ment are summarized in Table 4. At week 7, as illustrated in
Fig. 3, the parotid glands showed the largest average absolute
volume change with a shrinkage of �10 mL; next, both the
masticator and the sternocleidomastoid muscles shrank by an
average of �4–5 mL and even smaller reductions involved
both the submandibular and the thyroid glands. By contrast,
the constrictor muscles and the larynx significantly increased
in volume during IMRT. An example is illustrated in Fig. 1.
The larynx increased in volume in all applicable patients,
whereas the constrictors enlarged in 22/24 (91.6%) patients.
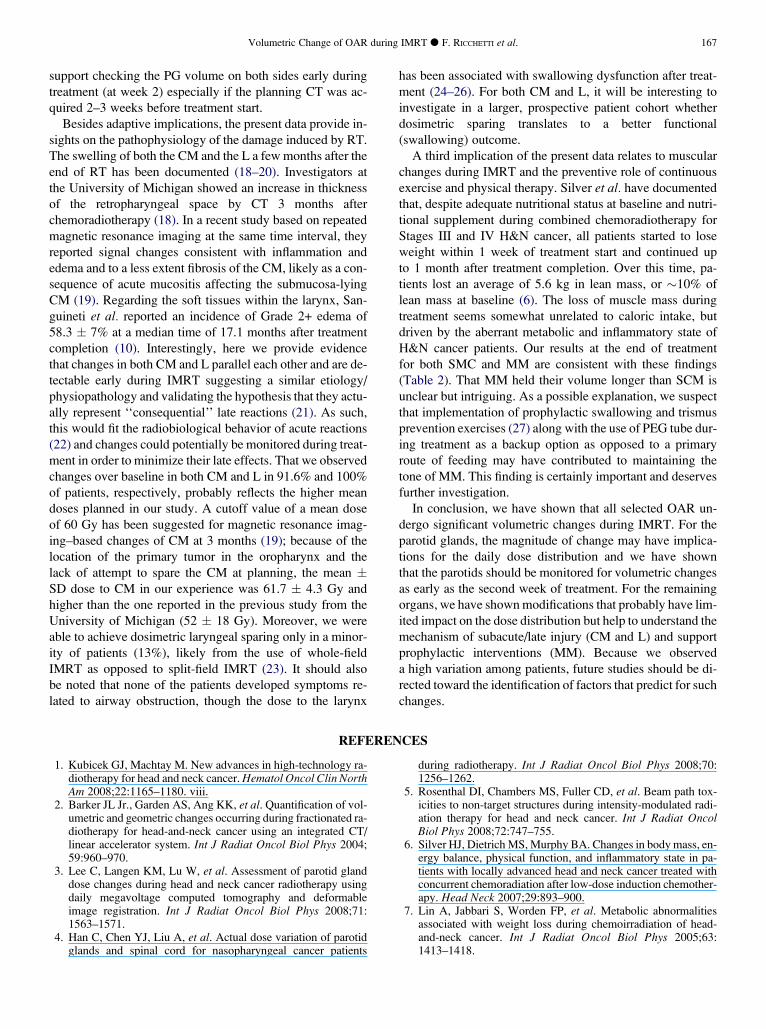
When volumetric changes are plotted as relative ones com-
pared with the planning volume across time (Fig. 4), OAR
can be pooled into three groups: those showing an �30% re-
duction toward the end of treatment (PG and SMG); those
showing smaller (5–10%) shrinkage (TG, MM, and SCM);
those increasing up to an average�15–20% during treatment
(L and CM).
Regarding the timing of modifications, all structures
showed statistically significant volumetric changes over
baseline from the fifth week on. For the L, TG, both parotid
glands, and the iSMG, a statistically significant difference
for each selected structure
Mean (SD) D at planning Mean (SD) volume at planning
(Gy) (mL)
40.8 (5.2) 53.6 (9.3)51.1 (8.3) 54.7 (10.0)60.6 (3.0) 52.1 (13.6)62.4 (3.0) 51.5 (13.6)33.2 (2.6)y 35.3 (11.1)39.6 (7.2) 34.8 (10.2)62.2 (4.9) 9.8 (2.3)69.6 (2.2) 9.5 (3.0)60.7 (2.6) 15.1 (6.3)61.7 (4.3) 16.7 (4.3)51.2 (7.5)z 15.9 (3.6)
bmandibular gland; CM = constrictor muscles; MM = masticatoryland; i = ipsilateral; c = contralateral; D = total dose; SD = standard
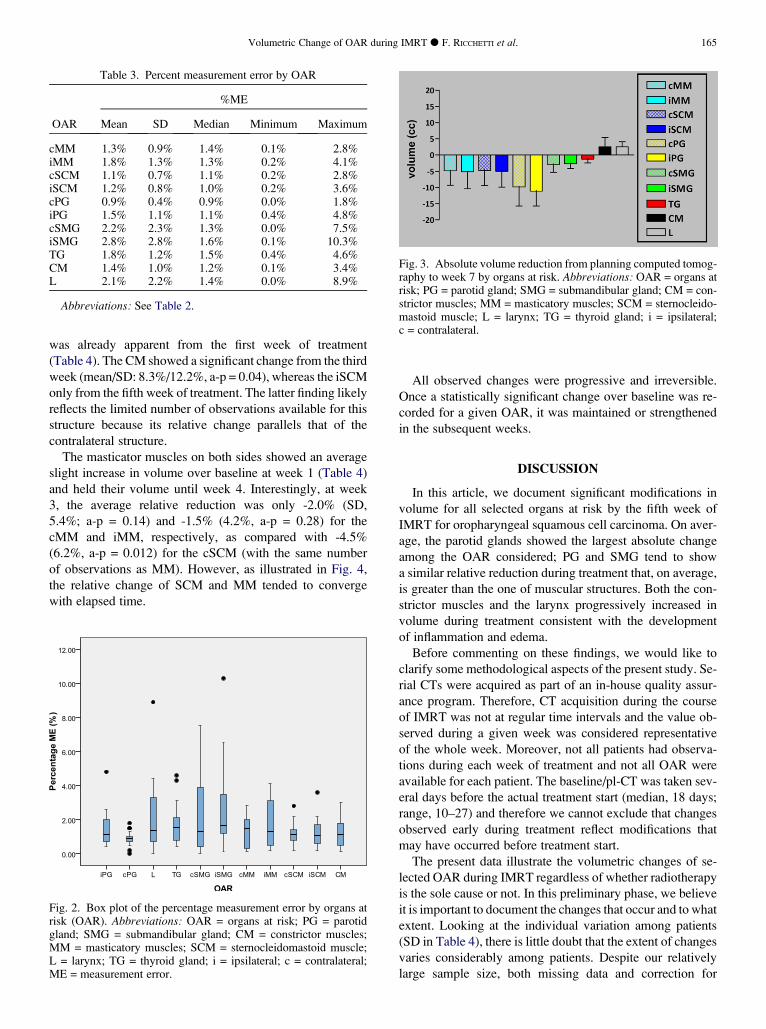
Table 3. Percent measurement error by OAR
%ME
OAR Mean SD Median Minimum Maximum
cMM 1.3% 0.9% 1.4% 0.1% 2.8%iMM 1.8% 1.3% 1.3% 0.2% 4.1%cSCM 1.1% 0.7% 1.1% 0.2% 2.8%iSCM 1.2% 0.8% 1.0% 0.2% 3.6%cPG 0.9% 0.4% 0.9% 0.0% 1.8%iPG 1.5% 1.1% 1.1% 0.4% 4.8%cSMG 2.2% 2.3% 1.3% 0.0% 7.5%iSMG 2.8% 2.8% 1.6% 0.1% 10.3%TG 1.8% 1.2% 1.5% 0.4% 4.6%CM 1.4% 1.0% 1.2% 0.1% 3.4%L 2.1% 2.2% 1.4% 0.0% 8.9%
Abbreviations: See Table 2.
Fig. 3. Absolute volume reduction from planning computed tomog-raphy to week 7 by organs at risk. Abbreviations: OAR = organs atrisk; PG = parotid gland; SMG = submandibular gland; CM = con-strictor muscles; MM = masticatory muscles; SCM = sternocleido-mastoid muscle; L = larynx; TG = thyroid gland; i = ipsilateral;c = contralateral.
Volumetric Change of OAR during IMRT d F. RICCHETTI et al. 165
was already apparent from the first week of treatment
(Table 4). The CM showed a significant change from the third
week (mean/SD: 8.3%/12.2%, a-p = 0.04), whereas the iSCM
only from the fifth week of treatment. The latter finding likely
reflects the limited number of observations available for this
structure because its relative change parallels that of the
contralateral structure.
The masticator muscles on both sides showed an average
slight increase in volume over baseline at week 1 (Table 4)
and held their volume until week 4. Interestingly, at week
3, the average relative reduction was only -2.0% (SD,
5.4%; a-p = 0.14) and -1.5% (4.2%, a-p = 0.28) for the
cMM and iMM, respectively, as compared with -4.5%
(6.2%, a-p = 0.012) for the cSCM (with the same number
of observations as MM). However, as illustrated in Fig. 4,
the relative change of SCM and MM tended to converge
with elapsed time.
Fig. 2. Box plot of the percentage measurement error by organs atrisk (OAR). Abbreviations: OAR = organs at risk; PG = parotidgland; SMG = submandibular gland; CM = constrictor muscles;MM = masticatory muscles; SCM = sternocleidomastoid muscle;L = larynx; TG = thyroid gland; i = ipsilateral; c = contralateral;ME = measurement error.
All observed changes were progressive and irreversible.
Once a statistically significant change over baseline was re-
corded for a given OAR, it was maintained or strengthened
in the subsequent weeks.
DISCUSSION
In this article, we document significant modifications in
volume for all selected organs at risk by the fifth week of
IMRT for oropharyngeal squamous cell carcinoma. On aver-
age, the parotid glands showed the largest absolute change
among the OAR considered; PG and SMG tend to show
a similar relative reduction during treatment that, on average,
is greater than the one of muscular structures. Both the con-
strictor muscles and the larynx progressively increased in
volume during treatment consistent with the development
of inflammation and edema.
Before commenting on these findings, we would like to
clarify some methodological aspects of the present study. Se-
rial CTs were acquired as part of an in-house quality assur-
ance program. Therefore, CT acquisition during the course
of IMRT was not at regular time intervals and the value ob-
served during a given week was considered representative
of the whole week. Moreover, not all patients had observa-
tions during each week of treatment and not all OAR were
available for each patient. The baseline/pl-CT was taken sev-
eral days before the actual treatment start (median, 18 days;
range, 10–27) and therefore we cannot exclude that changes
observed early during treatment reflect modifications that
may have occurred before treatment start.
The present data illustrate the volumetric changes of se-
lected OAR during IMRT regardless of whether radiotherapy
is the sole cause or not. In this preliminary phase, we believe
it is important to document the changes that occur and to what
extent. Looking at the individual variation among patients
(SD in Table 4), there is little doubt that the extent of changes
varies considerably among patients. Despite our relatively
large sample size, both missing data and correction for
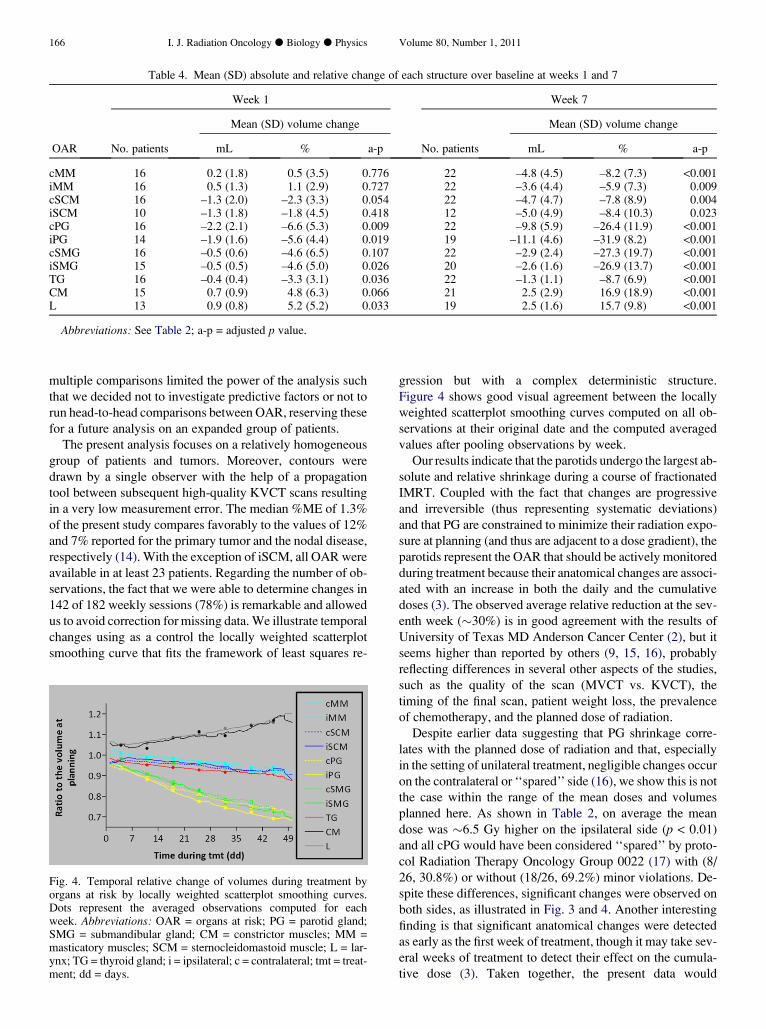
Table 4. Mean (SD) absolute and relative change of each structure over baseline at weeks 1 and 7
Week 1 Week 7
Mean (SD) volume change Mean (SD) volume change
OAR No. patients mL % a-p No. patients mL % a-p
cMM 16 0.2 (1.8) 0.5 (3.5) 0.776 22 –4.8 (4.5) –8.2 (7.3) <0.001iMM 16 0.5 (1.3) 1.1 (2.9) 0.727 22 –3.6 (4.4) –5.9 (7.3) 0.009cSCM 16 –1.3 (2.0) –2.3 (3.3) 0.054 22 –4.7 (4.7) –7.8 (8.9) 0.004iSCM 10 –1.3 (1.8) –1.8 (4.5) 0.418 12 –5.0 (4.9) –8.4 (10.3) 0.023cPG 16 –2.2 (2.1) –6.6 (5.3) 0.009 22 –9.8 (5.9) –26.4 (11.9) <0.001iPG 14 –1.9 (1.6) –5.6 (4.4) 0.019 19 –11.1 (4.6) –31.9 (8.2) <0.001cSMG 16 –0.5 (0.6) –4.6 (6.5) 0.107 22 –2.9 (2.4) –27.3 (19.7) <0.001iSMG 15 –0.5 (0.5) –4.6 (5.0) 0.026 20 –2.6 (1.6) –26.9 (13.7) <0.001TG 16 –0.4 (0.4) –3.3 (3.1) 0.036 22 –1.3 (1.1) –8.7 (6.9) <0.001CM 15 0.7 (0.9) 4.8 (6.3) 0.066 21 2.5 (2.9) 16.9 (18.9) <0.001L 13 0.9 (0.8) 5.2 (5.2) 0.033 19 2.5 (1.6) 15.7 (9.8) <0.001
Abbreviations: See Table 2; a-p = adjusted p value.
166 I. J. Radiation Oncology d Biology d Physics Volume 80, Number 1, 2011
multiple comparisons limited the power of the analysis such
that we decided not to investigate predictive factors or not to
run head-to-head comparisons between OAR, reserving these
for a future analysis on an expanded group of patients.
The present analysis focuses on a relatively homogeneous
group of patients and tumors. Moreover, contours were
drawn by a single observer with the help of a propagation
tool between subsequent high-quality KVCT scans resulting
in a very low measurement error. The median %ME of 1.3%
of the present study compares favorably to the values of 12%
and 7% reported for the primary tumor and the nodal disease,
respectively (14). With the exception of iSCM, all OAR were
available in at least 23 patients. Regarding the number of ob-
servations, the fact that we were able to determine changes in
142 of 182 weekly sessions (78%) is remarkable and allowed
us to avoid correction for missing data. We illustrate temporal
changes using as a control the locally weighted scatterplot
smoothing curve that fits the framework of least squares re-
Fig. 4. Temporal relative change of volumes during treatment byorgans at risk by locally weighted scatterplot smoothing curves.Dots represent the averaged observations computed for eachweek. Abbreviations: OAR = organs at risk; PG = parotid gland;SMG = submandibular gland; CM = constrictor muscles; MM =masticatory muscles; SCM = sternocleidomastoid muscle; L = lar-ynx; TG = thyroid gland; i = ipsilateral; c = contralateral; tmt = treat-ment; dd = days.
gression but with a complex deterministic structure.
Figure 4 shows good visual agreement between the locally
weighted scatterplot smoothing curves computed on all ob-
servations at their original date and the computed averaged
values after pooling observations by week.
Our results indicate that the parotids undergo the largest ab-
solute and relative shrinkage during a course of fractionated
IMRT. Coupled with the fact that changes are progressive
and irreversible (thus representing systematic deviations)
and that PG are constrained to minimize their radiation expo-
sure at planning (and thus are adjacent to a dose gradient), the
parotids represent the OAR that should be actively monitored
during treatment because their anatomical changes are associ-
ated with an increase in both the daily and the cumulative
doses (3). The observed average relative reduction at the sev-
enth week (�30%) is in good agreement with the results of
University of Texas MD Anderson Cancer Center (2), but it
seems higher than reported by others (9, 15, 16), probably
reflecting differences in several other aspects of the studies,
such as the quality of the scan (MVCT vs. KVCT), the
timing of the final scan, patient weight loss, the prevalence
of chemotherapy, and the planned dose of radiation.
Despite earlier data suggesting that PG shrinkage corre-
lates with the planned dose of radiation and that, especially
in the setting of unilateral treatment, negligible changes occur
on the contralateral or ‘‘spared’’ side (16), we show this is not
the case within the range of the mean doses and volumes
planned here. As shown in Table 2, on average the mean
dose was �6.5 Gy higher on the ipsilateral side (p < 0.01)
and all cPG would have been considered ‘‘spared’’ by proto-
col Radiation Therapy Oncology Group 0022 (17) with (8/
26, 30.8%) or without (18/26, 69.2%) minor violations. De-
spite these differences, significant changes were observed on
both sides, as illustrated in Fig. 3 and 4. Another interesting
finding is that significant anatomical changes were detected
as early as the first week of treatment, though it may take sev-
eral weeks of treatment to detect their effect on the cumula-
tive dose (3). Taken together, the present data would
Volumetric Change of OAR during IMRT d F. RICCHETTI et al. 167
support checking the PG volume on both sides early during
treatment (at week 2) especially if the planning CT was ac-
quired 2–3 weeks before treatment start.
Besides adaptive implications, the present data provide in-
sights on the pathophysiology of the damage induced by RT.
The swelling of both the CM and the L a few months after the
end of RT has been documented (18–20). Investigators at
the University of Michigan showed an increase in thickness
of the retropharyngeal space by CT 3 months after
chemoradiotherapy (18). In a recent study based on repeated
magnetic resonance imaging at the same time interval, they
reported signal changes consistent with inflammation and
edema and to a less extent fibrosis of the CM, likely as a con-
sequence of acute mucositis affecting the submucosa-lying
CM (19). Regarding the soft tissues within the larynx, San-
guineti et al. reported an incidence of Grade 2+ edema of
58.3 � 7% at a median time of 17.1 months after treatment
completion (10). Interestingly, here we provide evidence
that changes in both CM and L parallel each other and are de-
tectable early during IMRT suggesting a similar etiology/
physiopathology and validating the hypothesis that they actu-
ally represent ‘‘consequential’’ late reactions (21). As such,
this would fit the radiobiological behavior of acute reactions
(22) and changes could potentially be monitored during treat-
ment in order to minimize their late effects. That we observed
changes over baseline in both CM and L in 91.6% and 100%
of patients, respectively, probably reflects the higher mean
doses planned in our study. A cutoff value of a mean dose
of 60 Gy has been suggested for magnetic resonance imag-
ing–based changes of CM at 3 months (19); because of the
location of the primary tumor in the oropharynx and the
lack of attempt to spare the CM at planning, the mean �SD dose to CM in our experience was 61.7 � 4.3 Gy and
higher than the one reported in the previous study from the
University of Michigan (52 � 18 Gy). Moreover, we were
able to achieve dosimetric laryngeal sparing only in a minor-
ity of patients (13%), likely from the use of whole-field
IMRT as opposed to split-field IMRT (23). It should also
be noted that none of the patients developed symptoms re-
lated to airway obstruction, though the dose to the larynx
has been associated with swallowing dysfunction after treat-
ment (24–26). For both CM and L, it will be interesting to
investigate in a larger, prospective patient cohort whether
dosimetric sparing translates to a better functional
(swallowing) outcome.
A third implication of the present data relates to muscular
changes during IMRT and the preventive role of continuous
exercise and physical therapy. Silver et al. have documented
that, despite adequate nutritional status at baseline and nutri-
tional supplement during combined chemoradiotherapy for
Stages III and IV H&N cancer, all patients started to lose
weight within 1 week of treatment start and continued up
to 1 month after treatment completion. Over this time, pa-
tients lost an average of 5.6 kg in lean mass, or �10% of
lean mass at baseline (6). The loss of muscle mass during
treatment seems somewhat unrelated to caloric intake, but
driven by the aberrant metabolic and inflammatory state of
H&N cancer patients. Our results at the end of treatment
for both SMC and MM are consistent with these findings
(Table 2). That MM held their volume longer than SCM is
unclear but intriguing. As a possible explanation, we suspect
that implementation of prophylactic swallowing and trismus
prevention exercises (27) along with the use of PEG tube dur-
ing treatment as a backup option as opposed to a primary
route of feeding may have contributed to maintaining the
tone of MM. This finding is certainly important and deserves
further investigation.
In conclusion, we have shown that all selected OAR un-
dergo significant volumetric changes during IMRT. For the
parotid glands, the magnitude of change may have implica-
tions for the daily dose distribution and we have shown
that the parotids should be monitored for volumetric changes
as early as the second week of treatment. For the remaining
organs, we have shown modifications that probably have lim-
ited impact on the dose distribution but help to understand the
mechanism of subacute/late injury (CM and L) and support
prophylactic interventions (MM). Because we observed
a high variation among patients, future studies should be di-
rected toward the identification of factors that predict for such
changes.
REFERENCES
1. Kubicek GJ, Machtay M. New advances in high-technology ra-diotherapy for head and neck cancer. Hematol Oncol Clin NorthAm 2008;22:1165–1180. viii.
2. Barker JL Jr., Garden AS, Ang KK, et al. Quantification of vol-umetric and geometric changes occurring during fractionated ra-diotherapy for head-and-neck cancer using an integrated CT/linear accelerator system. Int J Radiat Oncol Biol Phys 2004;59:960–970.
3. Lee C, Langen KM, Lu W, et al. Assessment of parotid glanddose changes during head and neck cancer radiotherapy usingdaily megavoltage computed tomography and deformableimage registration. Int J Radiat Oncol Biol Phys 2008;71:1563–1571.
4. Han C, Chen YJ, Liu A, et al. Actual dose variation of parotidglands and spinal cord for nasopharyngeal cancer patients
during radiotherapy. Int J Radiat Oncol Biol Phys 2008;70:1256–1262.
5. Rosenthal DI, Chambers MS, Fuller CD, et al. Beam path tox-icities to non-target structures during intensity-modulated radi-ation therapy for head and neck cancer. Int J Radiat OncolBiol Phys 2008;72:747–755.
6. Silver HJ, Dietrich MS, Murphy BA. Changes in body mass, en-ergy balance, physical function, and inflammatory state in pa-tients with locally advanced head and neck cancer treated withconcurrent chemoradiation after low-dose induction chemother-apy. Head Neck 2007;29:893–900.
7. Lin A, Jabbari S, Worden FP, et al. Metabolic abnormalitiesassociated with weight loss during chemoirradiation of head-and-neck cancer. Int J Radiat Oncol Biol Phys 2005;63:1413–1418.
168 I. J. Radiation Oncology d Biology d Physics Volume 80, Number 1, 2011
8. Robar JL, Day A, Clancey J, et al. Spatial and dosimetric vari-ability of organs at risk in head-and-neck intensity-modulatedradiotherapy. Int J Radiat Oncol Biol Phys 2007;68:1121–1130.
9. Hansen EK, Bucci MK, Quivey JM, et al. Repeat CT imagingand replanning during the course of IMRT for head-and-neckcancer. Int J Radiat Oncol Biol Phys 2006;64:355–362.
10. Sanguineti G, Adapala P, Endres EJ, et al. Dosimetric predictorsof laryngeal edema. Int J Radiat Oncol Biol Phys 2007;68:741–749.
11. Levendag PC, Teguh DN, Voet P, et al. Dysphagia disorders inpatients with cancer of the oropharynx are significantly affectedby the radiation therapy dose to the superior and middle con-strictor muscle: A dose-effect relationship. Radiother Oncol2007;85:64–73.
12. Yildirim G, Morrison WH, Rosenthal DI, et al. Outcomes of pa-tients with tonsillar carcinoma treated with post-tonsillectomyradiation therapy. Head Neck 2010;32(4):473–480.
13. Holm S. A simple sequentially rejective multiple test procedure.Scand J Stat 1979;6:65–70.
14. Gordon AR, Loevner LA, Shukla-Dave A, et al. Intraobservervariability in the MR determination of tumor volume in squa-mous cell carcinoma of the pharynx. AJNR Am J Neuroradiol2004;25:1092–1098.
15. Lee C, Langen KM, Lu W, et al. Evaluation of geometricchanges of parotid glands during head and neck cancer radio-therapy using daily MVCT and automatic deformable registra-tion. Radiother Oncol 2008;89:81–88.
16. Vasquez Osorio EM, Hoogeman MS, Al-Mamgani A, et al.Local anatomic changes in parotid and submandibular glandsduring radiotherapy for oropharynx cancer and correlationwith dose, studied in detail with nonrigid registration. Int J Ra-diat Oncol Biol Phys 2008;70:875–882.
17. Eisbruch A, Harris J, Garden AS, et al. Multi-Institutional Trialof Accelerated Hypofractionated Intensity-Modulated RadiationTherapy for Early-Stage Oropharyngeal Cancer (RTOG 00-22).Int J Radiat Oncol Biol Phys 2010;76(5):1333–1338.
18. Eisbruch A, Schwartz M, Rasch C, et al. Dysphagia and aspira-tion after chemoradiotherapy for head-and-neck cancer: Whichanatomic structures are affected and can they be spared byIMRT? Int J Radiat Oncol Biol Phys 2004;60:1425–1439.
19. Popovtzer A, Cao Y, Feng FY, et al. Anatomical changes in thepharyngeal constrictors after chemo-irradiation of head andneck cancer and their dose-effect relationships: MRI-basedstudy. Radiother Oncol 2009;93(3):510–515.
20. Mukherji SK, Mancuso AA, Kotzur IM, et al. Radiologic ap-pearance of the irradiated larynx. Part I. Expected changes. Ra-diology 1994;193:141–148.
21. Denham JW, Peters LJ, Johansen J, et al. Do acute mucosal re-actions lead to consequential late reactions in patients with headand neck cancer? Radiother Oncol 1999;52:157–164.
22. Withers HR, Peters LJ, Taylor JM, et al. Late normal tissue se-quelae from radiation therapy for carcinoma of the tonsil: Pat-terns of fractionation study of radiobiology. Int J RadiatOncol Biol Phys 1995;33:563–568.
23. Dabaja B, Salehpour MR, Rosen I, et al. Intensity-modulatedradiation therapy (IMRT) of cancers of the head and neck: Com-parison of split-field and whole-field techniques. Int J RadiatOncol Biol Phys 2005;63:1000–1005.
24. Caglar HB, Tishler RB, Othus M, et al. Dose to larynx predictsfor swallowing complications after intensity-modulated radio-therapy. Int J Radiat Oncol Biol Phys 2008;72:1110–1118.
25. Dornfeld K, Simmons JR, Karnell L, et al. Radiation doses tostructures within and adjacent to the larynx are correlatedwith long-term diet- and speech-related quality of life. Int J Ra-diat Oncol Biol Phys 2007;68:750–757.
26. Feng FY, Kim HM, Lyden TH, et al. Intensity-modulated radio-therapy of head and neck cancer aiming to reduce dysphagia:Early dose-effect relationships for the swallowing structures.Int J Radiat Oncol Biol Phys 2007;68:1289–1298.
27. Kulbersh BD, Rosenthal EL, McGrew BM, et al. Pretreatment,preoperative swallowing exercises may improve dysphagiaquality of life. Laryngoscope 2006;116:883–886.