Volume 3 - Equinor
369
North American Oil Sands Corporation North American Oil Sands Corporation A wholly-owned affiliate of StatoilHydro ASA A wholly-owned affiliate of StatoilHydro ASA Upgrader Project Upgrader Project Volume 1 Volume 2 Volume 3 Volume 4 Volume 5 1 INTRODUCTION 2 APPLICATION FOR APPROVAL 3 THE PROJECT 4 INFRASTRUCTURE, UTILITIES AND OFFSITES 5 ENERGY AND MATERIAL BALANCES 6 ENVIRONMENTAL MANAGEMENT 7 C&R PLAN 8 SUMMARY OF THE EIA 9 SOCIO-ECONOMIC SUMMARY 10 PUBLIC CONSULTATION 11 LITERATURE CITED 1 IMPACT ASSESSMENT APPROACH 2 AIR 3 NOISE 4 HEALTH 5 HYDROGEOLOGY 6 HYDROLOGY 7 SURFACE WATER QUALITY 8 FISH AND FISH HABITAT 9 SOILS 10 VEGETATION 11 WILDLIFE 12 BIODIVERSITY 13 LAND USE 14 LIGHT 15 SEIA 16 HISTORICAL RESOURCES
-
Upload
khangminh22 -
Category
Documents
-
view
0 -
download
0
Transcript of Volume 3 - Equinor

North American Oil Sands CorporationNorth American Oil Sands CorporationA wholly-owned affiliate of StatoilHydro ASAA wholly-owned affiliate of StatoilHydro ASA
Upgrader ProjectUpgrader Project
Volume 1
Volume 2
Volume 3
Volume 4
Volume 5
1 INTRODUCTION2 APPLICATION FOR APPROVAL3 THE PROJECT4 INFRASTRUCTURE, UTILITIES AND OFFSITES5 ENERGY AND MATERIAL BALANCES6 ENVIRONMENTAL MANAGEMENT
7 C&R PLAN8 SUMMARY OF THE EIA9 SOCIO-ECONOMIC SUMMARY10 PUBLIC CONSULTATION11 LITERATURE CITED
1 IMPACT ASSESSMENT APPROACH
2 AIR
3 NOISE
4 HEALTH
5 HYDROGEOLOGY
6 HYDROLOGY
7 SURFACE WATER QUALITY
8 FISH AND FISH HABITAT
9 SOILS
10 VEGETATION
11 WILDLIFE
12 BIODIVERSITY
13 LAND USE
14 LIGHT
15 SEIA
16 HISTORICAL RESOURCES

5-i December 2007 North American Upgrader Project Volume 3, Section 5 - Hydrogeology
NORTH AMERICAN OIL SANDS CORPORATION
TABLE OF CONTENTS
5 HYDROGEOLOGY.......................................................................................................................5-1 5.1 Introduction ......................................................................................................................5-1 5.2 Study Area .......................................................................................................................5-1
5.2.1 Local Study Area.................................................................................................5-1 5.2.2 Regional Study Area ...........................................................................................5-1
5.3 Issues and Assessment Criteria ......................................................................................5-4 5.4 Methods ...........................................................................................................................5-5
5.4.1 Baseline Conditions ............................................................................................5-5 5.4.2 Methods for Impact Assessment.........................................................................5-8
5.5 Existing Conditions...........................................................................................................5-9 5.5.1 Topography and Drainage ..................................................................................5-9 5.5.2 Regional Geology ...............................................................................................5-9 5.5.3 Bedrock Geology ..............................................................................................5-10 5.5.4 Surficial Geology...............................................................................................5-10 5.5.5 Local Geology ...................................................................................................5-11 5.5.6 Regional Hydrogeology.....................................................................................5-13 5.5.7 Local Hydrogeology ..........................................................................................5-14 5.5.8 Groundwater Quality .........................................................................................5-17 5.5.9 Existing Groundwater Users .............................................................................5-22
5.6 Impact Assessment and Mitigative Measures ...............................................................5-39 5.6.1 Impacts Due to Surface Facilities .....................................................................5-39 5.6.2 Impacts Due to Dewatering of Excavations ......................................................5-40 5.6.3 Impacts Due to Groundwater Withdrawal Below Ponds...................................5-41
5.7 Cumulative Effects Assessment ....................................................................................5-45 5.8 Follow-up and Monitoring...............................................................................................5-45
5.8.1 Groundwater Response Plan............................................................................5-46 5.9 Summary........................................................................................................................5-48 5.10 Literature Cited...............................................................................................................5-48
TABLES
Table 5.4-1 Hydrogeological Study Drilling Locations ........................................................................5-6 Table 5.4-2 Monitoring Well Summary................................................................................................5-7 Table 5.5-1 Hydraulic Conductivity Test Results ..............................................................................5-14 Table 5.5-2 Vertical Hydraulic Gradients ..........................................................................................5-16 Table 5.5-3 Groundwater Quality Results, Field Measured Parameters ..........................................5-17 Table 5.5-4 Groundwater Quality Results - Routine, Indicator and Inorganic Chemistry .................5-18 Table 5.5-5 Groundwater Quality Results - Dissolved Metals ..........................................................5-19 Table 5.5-6 Groundwater Quality Results, Dissolved Hydrocarbons................................................5-20 Table 5.6-1 Impact Due to Surface Facilities ....................................................................................5-39 Table 5.6-2 Impact Due to Dewatering of Excavations.....................................................................5-41 Table 5.6-3 Impact Due to Groundwater Withdrawal Below Ponds..................................................5-42 Table 5.8-1 Analytical Parameters That May be Used in the Groundwater Monitoring Program.....5-45
FIGURES
Figure 5.2-1 Hydrogeological Study Areas...........................................................................................5-2 Figure 5.2-2 Hydrogeological Local Study Area and Drilling Locations ...............................................5-3 Figure 5.5-1 Topography within Local Study Area .............................................................................5-24 Figure 5.5-2 Regional Study Area – Stratigraphic Column ................................................................5-25 Figure 5.5-3 Cross-Section C-C′ ........................................................................................................5-26

5-ii December 2007 North American Upgrader Project Volume 3, Section 5 - Hydrogeology
NORTH AMERICAN OIL SANDS CORPORATION
Figure 5.5-4 Bedrock Geology............................................................................................................5-27 Figure 5.5-5 Surficial Geology ............................................................................................................5-28 Figure 5.5-6 Location of Beverly Channel ..........................................................................................5-29 Figure 5.5-7 Cross-Section A-A′ .........................................................................................................5-30 Figure 5.5-8 Cross-Section B-B′ .........................................................................................................5-31 Figure 5.5-9 Bedrock Topography within the LSA..............................................................................5-32 Figure 5.5-10 Regional Hydrogeology..................................................................................................5-33 Figure 5.5-11 Groundwater Flow Map – Clay Till – May 11, 2007.......................................................5-34 Figure 5.5-12 Groundwater Flow Map – Lower Sand and Gravel – May 11, 2007..............................5-35 Figure 5.5-13 Groundwater Flow Map – Bedrock – May 11, 2007 ......................................................5-36 Figure 5.5-14 Groundwater Piper Diagram ..........................................................................................5-37 Figure 5.5-15 Water Well Locations (within a 7-km Radius) ................................................................5-38 Figure 5.6-1 Predicted Groundwater Level Changes – North American Upgrader Excavations .......5-43 Figure 5.6-2 Predicted Groundwater Level Changes – North American Upgrader Ponds ................5-44 Figure 5.8-1 Proposed Monitoring Well Network................................................................................5-47
APPENDICES
Appendix 5A Hydraulic Conductivity Tests Appendix 5B Drilling Logs Appendix 5C Quality Control Sample Results Appendix 5D Water Wells Within a 7.0 km Radius

5-1 December 2007 North American Upgrader Project Volume 3, Section 5 - Hydrogeology
NORTH AMERICAN OIL SANDS CORPORATION
5 HYDROGEOLOGY 5.1 Introduction
This section of the EIA describes baseline hydrogeological conditions and identifies components of the Upgrader Project that will potentially affect groundwater from a local and regional perspective.
5.2 Study Area The hydrogeological study areas are shown on Figure 5.2-1.
5.2.1 Local Study Area
The Local Study Area (LSA) comprises the North American lands plus an 800 m buffer surrounding the property (Figure 5.2-2). The LSA includes portions of Sections 22, 23, 25, 26, 27, 34, 35 and 36 of Township 55 Range 21 W4M, as well as portions of Sections 1 and 2 of Township 56 Range 21 W4M (Figure 5.2-2).
5.2.2 Regional Study Area
The Regional Study Area (RSA) is bounded to the west and north by the North Saskatchewan River (NSR) and to the north and east by Beaverhill Creek, as these surface waterbodies are interpreted to be shallow groundwater divides (Figure 5.2-1). The southern boundary of the RSA is located approximately 10 km from the centre of the North American lands, and was based on regional topography and the shallow interpreted groundwater flow direction.


5-4 December 2007 North American Upgrader Project Volume 3, Section 5 - Hydrogeology
NORTH AMERICAN OIL SANDS CORPORATION
5.3 Issues and Assessment Criteria Through the construction and operation phases of the Project, components which have the potential to affect groundwater resources include:
• The operation of surface facilities;
• dewatering of excavations during construction of the Upgrader; and
• groundwater withdrawal under the potentially contaminated pond and oily water pond during operation of the Project.
The assessment describes the potential impact to groundwater resources in terms of the following attributes:
• the direction of the impact;
• the geographic extent;
• the magnitude of impact;
• the duration of the impact;
• the confidence in the available information used to make the assessment; and
• the final impact rating.
A detailed description of the criteria for each of the attributes is located in Volume 2, Section 1.
The attributes were used to rank the potential severity of impact to each of the following resources:
• Shallow Overburden Aquifers;
• Lower Sand and Gravel Aquifer;
• Beverly Channel Aquifer; and
• Bedrock Aquifers.
The potential impact to each of the above resources was evaluated with respect to water quality and water levels (hydraulic head). Specific methods used to measure and evaluate the potential impacts to each aquifer (compared to their respective baseline conditions) are discussed in the following subsections.

5-5 December 2007 North American Upgrader Project Volume 3, Section 5 - Hydrogeology
NORTH AMERICAN OIL SANDS CORPORATION
5.4 Methods
5.4.1 Baseline Conditions
5.4.1.1 Literature Review
An investigation of baseline conditions at the site was conducted by supplementing existing literature with a site-specific hydrogeological investigation. The primary literature sources used for the hydrogeological investigation included the following:
• Environmental Impact Assessment for the BA Energy Inc. Heartland Oil Sands Processing Plant (Bitumen Upgrader) (BA Energy, 2004);
• Regional groundwater study of the Beverly Channel in the Fort Saskatchewan area (Stantec, 2006);
• Water Well Drilling Reports from the Alberta Environment Groundwater Information Centre (GIC, 2006);
• Quaternary stratigraphy of the Edmonton area (Andriashek, 1988);
• Report and map of the hydrogeology of the Edmonton area (Stein, 1976);
• Map of the Quaternary Geology of Central Alberta (Shetsen, 1990); and
• Map of the bedrock geology of Alberta (Hamilton et al., 1998).
5.4.1.2 Site-Specific Investigations
A geotechnical investigation was conducted at the site from November 20 to 26, 2006, and consisted of drilling 20 boreholes and installing 10 monitoring wells. A subsequent hydrogeological field investigation was conducted that consisted of drilling and installing additional monitoring wells and groundwater sampling.
5.4.1.3 Drilling and Installation of Monitoring Wells
Drilling was conducted from March 21 to 26, 2007, with a dual rotary drilling rig. The dual rotary rig is an air rotary rig equipped with a drilling shoe on the drill casing. A total of twelve boreholes were drilled and eleven monitoring wells were installed at six locations. The drilling locations are presented on Figure 5.2-2 and Table 5.4-1.
5-6North AmericVolum
December 2007an Upgrader Project
e 3, Section 5 - Hydrogeology
All monitoring wells were completed with non-reactive polyvinyl chloride (PVC). In each well, the screen was connected to a solid riser pipe extending above the ground surface. The annular space between the screen and wellbore was backfilled with a filter pack. A bentonite seal was placed above the filter pack, extending to the ground surface in order to prevent the inflow of surface water. A protective metal surface casing with a locking cap was installed over the riser pipe. Completion details are provided in Table 5.4-2.
Table 5.4-1 Hydrogeological Study Drilling Locations
Borehole/Well Legal Location Easting (NAD83, Zone 12)
Northing (NAD83, Zone 12)
07-1 SE 02-056-21 W4M 367842.6 5964321.8 07-2 SE 02-056-21 W4M 367838.7 5964321.0 07-3 SW 35-055-21 W4M 366654.8 5962652.7 07-4 SW 35-055-21 W4M 366656.5 5962649.5 07-5 SE 35-055-21 W4M 368201.3 5962501.3 07-6 SE 35-055-21 W4M 368201.1 5962499.8 07-7 NE 26-055-21 W4M 366611.6 5961390.0 07-8 NE 26-055-21 W4M 366613.0 5961391.0 07-9 NE 35-055-21 W4M 367458.4 5963490.2
07-10 NW 36-055-21 W4M 368429.4 5963088.5 07-11 NW 36-055-21 W4M 368429.9 5963091.4 07-B1 NE 35-055-21 W4M 367458.0 5963490.0
NORTH AMERICAN OIL SANDS CORPORATION

5-7 December 2007 an Upgrader Project
e 3, Section 5 - Hydrogeology
Elevation* (masl) Depth (m) May 11/07 May 11/07
Monitoring Well Ground
Surface Top of Casing
Water Level
Ground to Total Drilled
Ground to Top of Screen
Ground to Base of Screen
Top of Casing
to Water
Ground to Water
Top of Casing to Product
Hydraulic Conductivity
(m/s) Method
Lithology of Screened Interval
07-1 621.42 622.42 615.70 42.1 37.0 41.0 6.72 5.72 ND --- --- clay, sandstone 07-2 621.42 622.47 617.70 19.3 16.3 19.3 4.77 3.72 ND --- --- sand
07-3 623.20 624.44 destroyed
2007 31.1 27.1 31.1 --- --- --- --- --- sand, clay 07-4 623.17 624.32 614.61 18.1 15.1 18.1 9.71 8.56 ND --- --- gravel and sand 07-5 627.65 628.55 620.47 34.3 27.0 30.0 8.08 7.18 ND 9.0E-09 H sand and silt 07-6 627.62 628.65 620.68 18.7 15.3 18.3 7.97 6.94 ND 9.0E-05 T gravel and sand 07-7 626.64 627.71 614.27 30.1 26.8 29.8 13.44 12.37 ND --- --- sand 07-8 626.62 627.59 621.96 11.7 8.7 11.7 5.63 4.66 ND 1.0E-09 H clay 07-9 624.26 625.22 622.43 12.1 9.1 12.1 2.79 1.83 ND --- --- clay
07-10 624.66 625.61 620.43 26.1 12.5 15.5 5.18 4.23 ND --- --- gravel and sand 07-11 624.60 625.54 621.21 11.7 7.7 10.7 4.33 3.39 ND 6.0E-09 H clay
BH06-01 633.60 634.40 dry 10.4 3.5 5.5 --- --- --- --- --- silt, clayey sandy
till BH06-03 629.40 630.48 614.67 22.6 18.3 19.8 15.81 14.73 ND --- --- sand, silty clay BH06-04 628.70 629.75 625.33 10.4 6.6 9.6 4.42 3.37 ND --- --- silty clay till BH06-06 625.80 626.85 614.62 19.5 16.2 17.7 12.23 11.18 ND --- --- sand BH06-07 623.90 625.11 617.21 16.5 12.8 14.3 7.90 6.69 ND --- --- silty clay till, sand
BH06-08 621.30 622.48 619.01 10.4 6.7 9.7 3.47 2.29 ND --- --- clay, silty sand,
silty clay till BH06-10 623.70 624.84 622.00 21.1 8.9 11.9 2.84 1.70 ND --- --- silty clay till, BH06-11 624.40 625.51 622.53 10.4 2.4 5.5 2.98 1.87 ND 6.0E-09 H silty clay till BH06-13 627.20 628.34 625.81 10.4 3.4 6.4 2.53 1.39 ND --- --- silty clay till BH06-15 628.90 629.96 621.46 21.1 18.8 20.3 8.50 7.44 ND --- --- sand
NORTH AMERICAN OIL SANDS CORPORATION
Table 5.4-2 Monitoring Well Summary
H - Hvorslev analysis method (1951).
masl - metres above sea level. * - elevations are geodetic.
TH - Theis method (1935).
--- - not available. ND - not detected.
North AmericVolum
Notes:

5-8 December 2007 North American Upgrader Project Volume 3, Section 5 - Hydrogeology
5.4.1.4 Groundwater Sampling
Groundwater sampling was conducted from May 9 to 12, 2007. Static water levels were measured on May 9 and 10. Monitoring wells were purged prior to collecting groundwater samples. Samples were collected on May 11 using dedicated bailers, preserved in ice-filled coolers and transferred to a certified laboratory for analyses.
Field-measured parameters at each monitoring well consisted of temperature, pH, electrical conductivity (EC) and dissolved oxygen (DO). Laboratory analyses included routine parameters, dissolved metals, benzene, toluene, ethylbenzene and xylenes (BTEX), petroleum hydrocarbon (PHC) fraction 1 (F1; C6-C10, excluding BTEX) and fraction 2 (F2; C>10-C16).
In addition, hydraulic response tests were conducted on monitoring wells 07-5, 07-6, 07-8, 07-11 and BH06-11. A description of the methodology and results of the hydraulic response testing are provided in Appendix 5A.
5.4.2 Methods for Impact Assessment
5.4.2.1 Assessment of Potential Impacts to Water Levels
An assessment was completed of potential impacts to water levels due to dewatering of excavations during construction, and groundwater withdrawal during the operational lifetime of the Upgrader. Geotechnical and hydrogeological borehole information, hydraulic heads, hydraulic conductivity estimates and previously published information were referenced for the assessment.
Dewatering of the open excavations may be conducted during construction activities, which could result in a decline in groundwater levels surrounding these excavations. A solution to this problem in one dimension is given in McWhorter and Sunada (1977):
⎥⎦
⎤⎢⎣
⎡•=t
xerfcssα40
where:
x = distance from the excavation (L) s = predicted water level change at distance x (L) s0 = change in water level at the excavation (L) erfc = complementary error function t = time (T)
and:
sSK
=α
where:
α = hydraulic diffusivity (L2/T) K = the hydraulic conductivity (L/T) S = specific storage (L-1)
NORTH AMERICAN OIL SANDS CORPORATION

5-9 December 2007 North American Upgrader Project Volume 3, Section 5 - Hydrogeology
NORTH AMERICAN OIL SANDS CORPORATION
The following values were used to determine the maximum impacts resulting from dewatering of excavations during construction of the Upgrader:
• a drawdown at the excavation (s0) of 6 m;
• a total dewatering time of 180 days (6 months);
• the maximum hydraulic conductivity estimate for the clay till of 6 x 10⁻⁹ m/s; and
• a specific storage value for the clay till of 1 x 10⁻³ m-1 was calculated based on an assumed porosity of 0.15 and a medium-hard clay compressibility of 1 x 10⁻⁷ m2/N (Domenico and Schwartz, 1997).
The following values were used to determine the maximum impacts resulting from groundwater withdrawal under the potentially contaminated and oily water ponds:
• a drawdown at the ponds (s0) of 6.1 m;
• a total dewatering time of 50 years;
• the maximum hydraulic conductivity estimate for the till of 6 x 10⁻⁹ m/s; and
• a specific storage value for the clay till of 1 x 10⁻³ m-1 was calculated based on an assumed porosity of 0.15 and a medium-hard clay compressibility of 1 x 10⁻⁷ m2/N (Domenico and Schwartz, 1997).
5.5 Existing Conditions
5.5.1 Topography and Drainage
The Project site lies at an elevation of approximately 625 m above sea level (masl). The topography of the RSA is gently undulating and slopes regionally towards the NSR to the northwest. The highest elevation, of approximately 735 masl, occurs in the southeast portion of the RSA. The lowest elevation, of approximately 594 masl, occurs at the NSR (Figure 5.2-1).
Drainage within the RSA generally flows north towards the NSR. Astotin Creek, located in the northwest corner of the LSA, is the nearest permanent stream to the Project site, and drains into Beaverhill Creek. Topographic contours within the LSA are presented on Figure 5.5-1. Topography within the LSA is gently undulating, and a number of topographical depressions (wetlands) are present.
5.5.2 Regional Geology
The uppermost bedrock geology in the Fort Saskatchewan area consists of Upper Cretaceous deposits. Surficial deposits consist of Quaternary sediments, including fluvial, eolian and lacustrine deposits, as well as glacial tills. The following section provides a regional geological description from oldest to youngest.
A stratigraphic column of the RSA is presented on Figure 5.5-2. Regional cross-section C-C′ indicates the upper bedrock and major surficial deposits underlying the proposed Upgrader site relative to the RSA (Figure 5.5-3). The cross-section line is indicated on Figure 5.2-1. The drilling logs are presented in Appendix 5B.

5-10 December 2007 North American Upgrader Project Volume 3, Section 5 - Hydrogeology
NORTH AMERICAN OIL SANDS CORPORATION
5.5.3 Bedrock Geology
The upper bedrock geology in most of the RSA consists of the Oldman Formation of the Belly River Group. However, the southeast region of the RSA includes the subcrop edges of the Bearpaw Formation and the Horseshoe Canyon Formation (Figure 5.5-4). A description of the upper bedrock formations is provided below.
A major top of bedrock feature within the RSA is the buried Beverly Channel. The Beverly Channel is a major preglacial buried fluvial channel, with local bedrock relief of up to 60 m and a width of 4 km to 10 km in Strathcona County (Agriculture and Agri-Food Canada, 2001). Locally, the Beverly Channel is interpreted to be 7 km to 8 km wide (Stantec, 2006). The Project site is interpreted to overlie a bedrock terrace adjacent to the Beverly Channel (Figure 5.5-3). Within the LSA, the top of bedrock structure decreases to the northwest towards the buried Beverly Channel.
5.5.3.1 Belly River Group
The Belly River Group consists of the Oldman Formation and the Foremost Formation. Sediments of the Belly River Group are primarily of fluvial origin, consisting of medium to fine-grained sandstone and siltstone, with minor mudstone and coal (Mossop and Shetsen, 1994). The Foremost Formation underlies the Oldman Formation and consists of sandstone and shale units, as well as the McKay and Taber coal zones (Agriculture and Agri-Food Canada, 2001). The Oldman Formation has a maximum thickness of 120 m in the study area, and is composed of sandstone, siltstone, shale and coal. The formation contains three members, identified as the Comrey, Upper Siltstone and Dinosaur Members (Agriculture and Agri-Food Canada, 2001). The regional dip of the Upper Cretaceous beds is approximately 2o to the southwest (Hamilton et al., 1999).
5.5.3.2 Bearpaw Formation
The Bearpaw Formation overlies the Belly River Group, and has a thickness of 80 m to 100 m in the north-central part of Strathcona County (Agriculture and Agri-Food Canada, 2001). Sediments of the Bearpaw Formation are primarily laminated shale and siltstone, with some sandstone beds and lenses of kaolinic claystone (Mossop and Shetsen, 1994).
5.5.3.3 Horseshoe Canyon Formation
The Horseshoe Canyon Formation is part of the Edmonton Group, and overlies the Bearpaw Formation. The Horseshoe Canyon Formation consists of interbedded sandstone, siltstone and mudstone, with up to ten potentially economic coal seams (Mossop and Shetsen, 1994). Within the RSA, only the Lower Horseshoe Canyon Formation is present, which can include coarser-grained sandstone deposits (Agriculture and Agri-Food Canada, 2001).
5.5.4 Surficial Geology
Unconsolidated surficial sediments in the area consist of preglacial, glacial lacustrine, eolian and fluvial deposits (Shetsen, 1990). A map detailing the uppermost Quaternary geology is presented on Figure 5.5-5. Surficial deposits are generally less than 30 m thick in the region, with the exception of the sediments overlying the Beverly Channel, which can reach 50 m in thickness (Agriculture and Agri-Food Canada, 2001). A description of the surficial units within the RSA is presented in the following subsections.

5-11 December 2007 North American Upgrader Project Volume 3, Section 5 - Hydrogeology
NORTH AMERICAN OIL SANDS CORPORATION
5.5.4.1 Empress Formation
The Empress Formation is defined as all stratified sediments that rest on bedrock and are covered by the first occurrence of glacial till (Andriashek, 1988). These drift sediments consist of “stratified gravel, sand, silt and clay of fluvial, lacustrine and colluvial origin” (Whitaker and Christiansen, 1972), and exist within incised channels and on bedrock terraces. Within the RSA, the Empress Formation is present within the Beverly Channel and on the bedrock terrace to the southeast of the channel. The deposits within the Beverly Channel follow a sedimentary sequence of gravel grading to sand, and finally to silt and clay. The Empress Formation deposits are less than 20 m in thickness (Stantec, 2006). The extent of the Beverly Channel is presented on Figure 5.5-6, as estimated by Stein (1976).
5.5.4.2 Glacial Till
Glacial till deposits are unstratified and unsorted deposits of clay, silt, sand and gravel. These deposits are identified throughout the RSA. The top surface of the glacial till unit is gently to moderately undulating in the region. The thickness of glacial till varies from 0 m to 30 m in the region (Stantec, 2006). Glacial moraine deposits are reported to cover the southeast portion of the RSA, including the south half of the LSA (Figure 5.5-5). Minor sand and gravel deposits are also reported within the glacial till unit.
5.5.4.3 Lacustrine Deposits
A lacustrine clay unit within the RSA has been interpreted as being deposited near the shore of the ancient Lake Edmonton (BA Energy, 2004). The unit is primarily composed of clay and silt, with interspersed sand lenses. The clay unit is generally underlain by glacial till, and has a maximum thickness of greater than 15 m in the RSA (Stantec, 2006). A coarse-grained lacustrine deposit is reported to extend into the northern half of the LSA from the east (Figure 5.5-5).
5.5.4.4 Eolian Deposits
Eolian deposits form the surficial unit in much of the northwest portion of the RSA. The unit consists of loose, fine- to medium-grained sands, with interspersed lacustrine clay layers (Stantec, 2006). These eolian deposits extend into the northwest portion of the LSA (Figure 5.5-5).
5.5.5 Local Geology
The interpretation of the geology at the site is based on borehole records obtained from the geotechnical investigation conducted in the fall of 2006 and the hydrogeological investigation conducted in the spring of 2007. The drilling locations for the hydrogeological and geotechnical investigations are presented on Figure 5.2-2. The geology at the site, from oldest to youngest, consists of:
• Bedrock deposits
o Sandstone/siltstone/claystone
• Surficial deposits
o Lower sand and gravel unit o Clay till unit o Surficial sand unit

5-12 December 2007 North American Upgrader Project Volume 3, Section 5 - Hydrogeology
NORTH AMERICAN OIL SANDS CORPORATION
Two geologic cross-sections in the LSA are presented on Figures 5.5-7 and 5.5-8. Cross-section A-A′ runs approximately south to north through the site, while cross-section B-B′ runs approximately southwest to northeast through the site. The drilling locations and geological cross-section lines are illustrated on Figure 5.2-2.
5.5.5.1 Bedrock
The upper bedrock encountered during drilling was highly weathered, and was interpreted to underlie directly a sand and gravel unit which was present across the LSA. Ten boreholes were interpreted to be drilled into bedrock.
Based on the drilling program conducted at the site, the depth to bedrock ranged between 14.5 m and 22.3 m below ground surface (bgs). Based on these results, the bedrock elevation ranged from 603.6 masl to 610.2 masl. Bedrock topography within the LSA is presented on Figure 5.5-9, and is generally consistent with that presented in Stantec (2006) and Andriashek (1988).
Bedrock lithology was primarily fine-grained sandstone with interbedded siltstone and claystone (Figures 5.5-7 and 5.5-8). The lithology encountered underlying the site is consistent with descriptions of the Oldman Formation (Agriculture and Agri-Food Canada, 2001).
5.5.5.2 Surficial Sediments
The surficial sediments in the LSA range from 15 m to 23 m in thickness, and are generally consistent with the range reported by Andriashek (1988).
Lower Sand and Gravel
A sand and gravel unit overlies bedrock throughout the LSA. This coarse-grained unit ranged between 1 m and 6 m in thickness, and was observed in all boreholes drilled through the base of the clay till. The gravel and sand unit is interpreted as the Empress Formation. Based on the bedrock elevation, it is interpreted to be located on a bedrock terrace adjacent to the buried Beverly Channel. However, it is not interpreted to be hydrostratigraphically equivalent to the Empress Formation sands and gravels within the Beverly Channel, as indicated on Cross-section C-C′ (Figure 5.5-3). The unit was previously identified as Saskatchewan Sand and Gravels by Stein (1976).
Glacial Till
Glacial till was observed at all borehole locations, and formed the surficial unit at all locations, with the exception of locations in the northern extent of the LSA, where it was overlain by sand. The glacial till at the site was primarily described as clay, with some intervals of silt or sand. Although the till unit was primarily described as a clay, glacial till typically contains approximately equal proportions of clay, silt and sand. The thickness of the till unit ranged from 5.5 m at borehole 07-1, where the glacial till was overlain by the eolian sand, to 23 m at borehole 07-7.
Surficial Sand Unit
A surficial sand unit overlies the clay till at borehole locations BH06-07 and BH06-09, and monitoring well locations 07-1 and 07-2, along the northern extent of the site. This sand is interpreted as being the edge of an eolian sand deposit that extends to the west and north of the site (Figure 5.5-5). The thickness of the sand unit observed on the site was 2.8 m to 5 m.

5-13 December 2007 North American Upgrader Project Volume 3, Section 5 - Hydrogeology
NORTH AMERICAN OIL SANDS CORPORATION
Sand lenses were also observed in the upper 7 m of the clay till at boreholes BH06-06, BH06-12 and BH06-13, located in Section 35-055-21 W4M. The sand lenses were 0.8 m to 3.5 m thick at these locations, and may be continuous between these locations; however, these sand lenses are located within the glacial till and are not considered to be associated with the eolian sand unit.
5.5.6 Regional Hydrogeology
Groundwater flow in the RSA is interpreted to flow west and north in the direction of the buried Beverly Channel and the NSR. Local variations in this regional flow direction are expected in the shallow subsurface in areas of topographical relief. Within the Beverly Channel, groundwater flow is directed approximately northeast along the buried valley thalweg (Figure 5.5-10). A buried valley tributary was reported by Stein (1976) to transect the LSA, as indicated on Figure 5.5-10. However, no evidence of a buried channel was found during the drilling programs.
The clay and clay till units typically have low permeability, and are interpreted to be aquitards. Groundwater from the clay and clay till units immediately northwest of the LSA is described as a calcium-magnesium/bicarbonate type, with total dissolved solids (TDS) concentrations ranging from 291 mg/L to 783 mg/L (BA Energy, 2004).
Hydraulic conductivity estimates of the surficial sand deposits immediately northwest of the LSA range from 1 × 10⁻⁵ m/s to 2 × 10⁻⁴ m/s (BA Energy, 2004). Groundwater flow within this unit is expected to flow towards Astotin Creek. Groundwater from within the surficial sand unit was mostly of a calcium-magnesium/bicarbonate type, with TDS concentrations ranging from 217 mg/L to 563 mg/L (BA Energy, 2004).
Previous hydraulic conductivity estimates for Empress Formation sand and gravel deposits within the Beverly Channel range from 2 × 10⁻⁴ m/s to 9 × 10⁻⁴ m/s as reported by Stantec (2006), and 3 × 10⁻⁵ m/s to 4 × 10⁻⁴ m/s as reported by Stein (1976). The estimated apparent yield of the Empress Formation ranges from 160 m3/day to 650 m3/day (1.9 L/s to 7.5 L/s) where sufficiently thick (BA Energy, 2004). Groundwater within Beverly Channel sand and gravels immediately northwest of the LSA is reported to vary from a sodium/bicarbonate-sulphate to mixed/bicarbonate type (BA Energy, 2004).
The main aquifer units in the Lower Horseshoe Canyon Formation, which subcrops in the southeast portion of the RSA, are fractured coal seams (Agriculture and Agri-Food Canada, 2001). The Bearpaw Formation is considered to be a regional aquitard, based on the predominance of fine-grained sediments, but contains coarser-grained deposits which function as aquifer units. The maximum apparent yield was 98 m3/day for wells completed in the Bearpaw Formation in Strathcona County (Agriculture and Agri-Food Canada, 2001).
The uppermost 120 m of Belly River Group sediments contain sandstone intervals which are capable of yielding in excess of 1.9 L/s (160 m3/d). Sandstone and gravel aquifers are present within the LSA, with expected yields of 0.4 L/s to 1.9 L/s (35 m3/day to 160 m3/day; Stein, 1976). In the Bruderheim area, the uppermost sandstone intervals of the Belly River Group are reported to have hydraulic conductivity values of 6 × 10⁻⁷ to 8 × 10⁻⁵ m/s (Stein, 1976). TDS concentrations of groundwater within the Oldman Formation are expected to range between 750 mg/L and 1,500 mg/L (Agriculture and Agri-Food Canada, 2001). Groundwater from aquifer units within the Oldman Formation is typically sodium-bicarbonate type (Agriculture and Agri-Food Canada, 2001).
TDS concentrations in groundwater from upper bedrock formations within the RSA typically range from 500 mg/L to 3,000 mg/L (Agriculture and Agri-Food Canada, 2001). Groundwater from bedrock units in Strathcona County is typically a sodium-bicarbonate or calcium-magnesium-bicarbonate-sulphate type (Agriculture and Agri-Food Canada, 2001).

5-14 December 2007 North American Upgrader Project Volume 3, Section 5 - Hydrogeology
NORTH AMERICAN OIL SANDS CORPORATION
5.5.7 Local Hydrogeology
5.5.7.1 Hydraulic Conductivity
Hydraulic conductivity tests were conducted at five monitoring wells located at the site. Hydraulic conductivity testing included bail/recovery tests and one pumping test. A description of the methods, results and interpretation are included in Appendix 5A. The results of the testing are presented in Table 5.5-1.
Table 5.5-1 Hydraulic Conductivity Test Results
Monitoring Well
Lithology Interpretation Method Hydraulic Conductivity
(m/s) 07-5 Sandstone, Siltstone
(Oldman Formation) Hvorslev (1951) 2 × 10⁻⁷
07-6 Gravel, Sand (Empress Formation) Theis Recovery (Theis, 1935) 8 × 10⁻⁵
07-8 Clay Till Hvorslev (1951) 1 × 10⁻⁹
07-11 Clay Till Hvorslev (1951) 6 × 10⁻⁹
BH06-15 Clay Till Hvorslev (1951) 6 × 10⁻⁹
Testing in the clay till was conducted in three monitoring wells completed at depths ranging from 1.8 m bgs to 11.7 m bgs. Based on the test results, the hydraulic conductivity of the clay till unit is estimated to range from 1 × 10⁻⁹ m/s to 6 × 10⁻⁹ m/s.
Near-surface sand deposits were observed at boreholes along the north extent and central region of the site. These deposits were largely unsaturated, and no hydraulic conductivity testing was conducted over these intervals. Based on the lithology, the saturated hydraulic conductivity of these sand deposits is expected to be in the order of 10-5 m/s to 10-4 m/s.
A sand and gravel unit overlying bedrock across the site is interpreted as a bedrock terrace deposit of the Empress Formation. A pumping/recovery test was conducted on monitoring well 07-6. Based on the test results, the hydraulic conductivity of the lower sand and gravel is estimated to be 8 × 10⁻⁵ m/s.
The upper bedrock (Oldman Formation) at the site is primarily fine-grained sandstone and siltstone. The hydraulic conductivity of the sandstone/siltstone bedrock underlying the site was estimated to be 2 × 10⁻⁷ m/s, based on testing conducted at monitoring well 07-5.

5-15 December 2007 North American Upgrader Project Volume 3, Section 5 - Hydrogeology
5.5.7.2 Lateral Groundwater Flow
Water levels measured at the site from May 9 to 11, 2007, are presented in Table 5.4-2. The water levels were used to generate piezometric contours for the glacial till, bedrock and lower sand and gravel. These piezometric contours were used to estimate groundwater flow direction in the respective units. Groundwater flow maps for the clay till, bedrock and sand and gravel are presented on Figures 5.5-11, 5.5-12 and 5.5-13, respectively. For each unit, the linear velocity (vL) was estimated using the relationship between hydraulic conductivity (K), hydraulic gradient (i) and effective porosity (ηe):
eL
Kivη
=
Clay Till
Water levels within the clay till varied between 619.01 masl and 625.81 masl. Groundwater flow within the clay till generally flows to the north and west (Figure 5.5-11). However, the groundwater flow patterns illustrated on Figure 5.5-12 are expected to be simplified due to the limited number of data points. Shallow groundwater flow through shallow low-permeability sediments typically follows topography, with the exception of trends observed at topographical depressions. Seasonal water table mounding is expected to occur at topographic depressions where surface water collects (wetlands). These wetlands are commonly the focal points for depression-focused groundwater recharge in the prairie region (Hayashi et al., 1998). Thus, groundwater mounding is expected to occur at topographic depressions, resulting in radial groundwater flow directed away from the depressions.
The maximum horizontal hydraulic gradient within the clay till was estimated to be 0.005 m/m, with flow generally directed towards the north and west. Local gradients may be larger, particularly in areas of focused recharge. Using the maximum estimated hydraulic conductivity of 6 × 10⁻⁹ m/s, and assuming an effective porosity of 15% and hydraulic gradient of 0.005 m/m, the linear velocity of groundwater in the clay till is expected to be approximately 0.006 m/y.
Lower Sand and Gravel
Piezometric water levels within the lower sand and gravel unit varied between 614.61 masl and 620.68 masl. The water levels on the site are at least 15 m higher than those observed within the Beverly Channel sands and gravels immediately west of the site, which were less than 600 masl (Stantec, 2006). This fact suggests that there is not direct hydraulic communication between the Empress Formation deposits in the Beverly Channel and those of the bedrock terrace below the site.
Groundwater flow within the lower sand and gravel is directed towards the west, with a hydraulic gradient of approximately 0.004 m/m (Figure 5.5-12). This value falls within the range of hydraulic gradients (0.0005 m/m to 0.005 m/m) observed in the Empress Formation sands and gravels within the Beverly Channel (Stantec, 2006). Groundwater flow within the lower sand and gravel appears to follow bedrock topography, and flows toward the Beverly Channel to the west. Groundwater flow within the Beverly Channel Empress Formation immediately west of the site was directed towards the north, with a gradient of approximately 0.001 m/m (BA Energy, 2004). Assuming a hydraulic conductivity of 8 × 10⁻⁵ m/s, and assuming an effective porosity of 30% and hydraulic gradient of 0.004 m/m, the horizontal linear velocity of groundwater in the lower sand and gravel is expected to be approximately 30 m/y to the west.
NORTH AMERICAN OIL SANDS CORPORATION

5-16 December 2007 North American Upgrader Project Volume 3, Section 5 - Hydrogeology
NORTH AMERICAN OIL SANDS CORPORATION
Bedrock
The lithology of the upper bedrock under the site is primarily fine-grained sandstone and siltstone. At monitoring well 07-1, interbeds of claystone were observed. These intervals are not expected to be regionally continuous (Stein, 1976).
Piezometric water levels within the bedrock (sandstone and siltstone) ranged from 614.27 masl to 621.48 masl. Based on the water levels, groundwater flow is directed towards the west-northwest, with a hydraulic gradient of approximately 0.005 m/m (Figure 5.5-13). Assuming a hydraulic conductivity of 2 × 10⁻⁷ m/s, and assuming an effective porosity of 20% and hydraulic gradient of 0.005 m/m, the horizontal velocity of groundwater in the bedrock is expected to be approximately 0.2 m/y to the west-northwest.
5.5.7.3 Vertical Hydraulic Gradients
Nested monitoring well pairs were installed at five locations to determine vertical hydraulic gradients at the site. These wells were installed at various depths and in different units. The water levels were measured from May 9 to 11, 2007, and are summarized in Table 5.4-2. At each location, the water level in the shallower unit was higher than the water level in the deeper unit. This indicates that there is a downward hydraulic gradient in the area which induces downward vertical groundwater flow. This is consistent with the findings of previous investigations (Stantec, 2006). Hydraulic gradients within the clay till can exceed 0.5 m/m due to the low permeability of the material. Groundwater flow within the clay till is expected to be primarily downward, whereas the flow in the lower sand and gravel is expected to be primarily lateral (Figures 5.5-7 and 5.5-8). The vertical hydraulic conductivity estimates for the site are provided in Table 5.5-2.
Nested monitoring well pair 07-10 and 07-11 were completed within the lower sand and gravel (07-10) and clay till (07-11). Assuming hydraulic head changes within the gravel are negligible because of its large hydraulic conductivity, the vertical gradient can be calculated as the difference in hydraulic head between the midpoint of the upper screen and the bottom of the clay till unit. Based on these assumptions, the vertical hydraulic gradient within the clay till is estimated to be 0.24 m/m.
Nested monitoring well pairs 07-1 and 07-2 and 07-5 and 07-6 were completed within the bedrock and the overlying sand and gravel. Like the clay, the assumption can be made that the head changes within the sand and gravel are negligible, so that the majority of the hydraulic head decreases occur within the bedrock units. The vertical hydraulic gradient was greater (0.085 m/m) at nested wells 07-1 and 07-2, where interbedded claystone was present within the bedrock interval, as compared to nested wells 07-5 and 07-6, where the bedrock lithology was sandstone and siltstone.
Table 5.5-2 Vertical Hydraulic Gradients
Monitoring Well Nested Pair
Lithology Vertical Distance
(m)
Hydraulic Head
Difference (m)
Vertical Hydraulic
Gradient (m/m) 07-1, 07-2 Sandstone, siltstone, claystone 23.5 2.0 0.085 07-5, 07-6 Sandstone, siltstone 8.5 0.21 0.025 07-10, 07-11 Clay till 3.2 0.78 0.24

5-17North AmericVolum
December 2007an Upgrader Project
e 3, Section 5 - Hydrogeology
Monitoring Well Sample Date Temp °C Field pH Field EC*
uS/cm Field DO
mg/L Clay Till
07-8 May 11/07 7.3 6.8 3,820 3.9 07-8 dup May 11/07 6.9 6.8 3,820 4.4
07-9 May 11/07 7.0 7.1 1,120 3.2 07-11 May 11/07 6.8 6.7 2,740 5.4
BH06-01 May 11/07 --- --- --- --- BH06-04 May 11/07 7.6 7.0 2,260 7.2 BH06-08 May 11/07 7.3 6.9 3,890 6.4 BH06-11 May 11/07 6.3 7.1 1,830 3.2 BH06-13 May 11/07 5.1 7.3 630 3.7
Sand and Gravel 07-2 May 11/07 6.0 7.2 800 3.4 07-4 May 11/07 11.1 7.5 830 8.1 07-6 May 11/07 6.9 7.4 730 3.8
07-6 dup May 11/07 6.2 7.4 730 3.7 07-10 May 11/07 6.3 6.6 1,090 3.0
BH06-03 May 11/07 7.9 7.1 1,480 2.5 BH06-06 May 11/07 7.8 7.2 880 2.7 BH06-07 May 11/07 7.9 6.9 1,100 3.2 BH06-10 May 11/07 7.4 7.0 4,470 6.4
Bedrock 07-1 May 11/07 6.8 7.4 1,000 2.6 07-3 May 11/07 --- --- --- --- 07-5 May 11/07 6.8 8.0 900 3.2 07-7 May 11/07 7.2 7.6 750 2.4
BH06-15 May 11/07 7.5 7.2 1,370 2.4 Detection Limit 0.1 0.1 10 0.1 Canadian Drinking Water Guidelines** 15 (AO) 6.5-8.5(AO) NS NS
NORTH AMERICAN OIL SANDS CORPORATION
5.5.8 Groundwater Quality
Groundwater samples were collected from all monitoring wells on May 11, 2007, with the exception of 07-3 (damaged well) and BH06-01 (dry). Field parameter results (temperature, pH, EC and DO) are summarized in Table 5.5-3. The results for routine, indicator and inorganic chemistry are summarized in Table 5.5-4, dissolved metals are summarized in Table 5.5-5 and dissolved hydrocarbons are summarized in Table 5.5-6. The quality control sample results are presented in Appendix 5C. Key results of the groundwater quality characterization are discussed below.
Table 5.5-3 Groundwater Quality Results, Field Measured Parameters
Notes: --- - not analyzed. NS - guideline not specified. AO - aesthetic objective. * - field EC corrected to 25°C. ** - Guidelines for Canadian Drinking Water Quality (Health Canada, 2006a). Italics - indicate values do not meet Canadian Drinking Water Guidelines.

5-18 December 2007 North American Upgrader Project Volume 3, Section 5 - Hydrogeology
NORTH AMERICAN OIL SANDS CORPORATION
Table 5.5-4 Groundwater Quality Results - Routine, Indicator and Inorganic Chemistry
Monitoring Well Sample Date Lab pH Lab EC uS/cm
Ca mg/L
Mg mg/L
Na mg/L
K mg/L
Cl mg/L
HCO3 as CaCO3 mg/L
SO4 mg/L
NO2-N mg/L
NO3-N mg/L
Hardness mg/L
TDS mg/L
Clay Till 07-8 May 11/07 7.39 3670 621 263 188 14.6 3.6 733 2,260 0.003 0.016 2600 3,710
07-8 dup May 11/07 7.26 3690 624 266 192 14.9 3.6 723 2,270 <0.003 0.017 2700 3,730 07-9 May 11/07 7.67 1140 149 39 56.1 5.3 2.0 662 163 0.007 0.031 530 741
07-11 May 11/07 7.48 2660 393 131 102 8.6 5.7 556 1,390 <0.003 0.024 1500 2,300 BH06-04 May 11/07 7.61 2240 368 155 79.2 9.9 1.4 449 1,180 <0.003 0.006 1600 2,010 BH06-08 May 11/07 7.53 3740 394 255 260 12.7 8.3 653 2,280 0.031 0.242 2000 3,540 BH06-11 May 11/07 7.71 1840 290 89.3 58.6 6.4 1.5 518 714 0.02 16.6 1100 1,490 BH06-13 May 11/07 7.93 639 86 24.8 13.9 6 2.4 348 39.9 0.063 11.1 320 394
Sand and Gravel 07-2 May 11/07 7.83 825 80.5 22.6 80.4 4.6 5.3 508 70.4 0.009 0.005 290 516 07-4 May 11/07 8.06 836 83.2 23.4 73.2 5.5 2.9 439 128 0.005 0.017 300 532 07-6 May 11/07 7.92 749 89.2 27.4 56.7 6.5 2.5 437 77.4 0.007 0.037 340 475
07-6 dup May 11/07 7.66 757 88 25.8 54.1 6.2 2.3 435 78 0.007 0.038 330 469 07-10 May 11/07 7.75 1120 110 33.5 110 5.1 4.5 572 167 0.022 6.62 410 742
BH06-03 May 11/07 7.68 1490 210 65 50.7 6.2 1.9 594 445 <0.003 0.009 790 1,080 BH06-06 May 11/07 7.94 895 102 27.2 63.4 5 1.2 503 122 <0.003 0.008 370 571 BH06-07 May 11/07 7.57 1120 140 52.4 45.5 5.1 1.7 689 133 0.005 0.191 560 718 BH06-10 May 11/07 7.78 4340 312 135 718 9.7 10.5 503 2,430 0.229 5.45 1300 3890
Bedrock 07-1 May 11/07 8.07 1030 39.6 10.5 192 3 2.6 595 102 0.113 0.039 140 644 07-5 May 11/07 8.19 937 16.7 3.1 204 3.2 7.8 559 66 0.004 0.021 54 576 07-7 May 11/07 7.82 768 36.3 8.4 121 3.4 1.4 153 235 0.004 0.009 130 480
BH06-15 May 11/07 7.79 1380 131 30.6 168 7 2.6 632 290 0.024 0.709 450 946 Laboratory Detection Limit 0.01 0.02 0.1 0.1 0.1 0.3 0.5 0.5 0.1 0.003 0.003 0.5 1 Canadian Drinking Water
Guidelines*** 6.5-
8.5(AO) NS NS NS 200(AO) NS 250(AO) NS 500(AO) 1(MAC) 10(MAC) NS 500(AO)
Notes: NS - not specified. AO - aesthetic objective. MAC - maximum acceptable concentration based on health effects. *** - Guidelines for Canadian Drinking Water Quality (Health Canada, 2006a). Italics - indicate values do not meet Canadian Drinking Water Guidelines.

5-19 December 2007 North American Upgrader Project Volume 3, Section 5 - Hydrogeology
NORTH AMERICAN OIL SANDS CORPORATION
Table 5.5-5 Groundwater Quality Results - Dissolved Metals
Monitoring Sample Al Sb As Ba Be B Cd Cr Co Cu Fe Pb Li Well Date mg/L mg/L mg/L mg/L mg/L mg/L mg/L mg/L mg/L mg/L mg/L mg/L mg/L
Clay Till 07-8 May 11/07 <0.04 <0.0002 0.001 0.06 <0.001 0.26 <0.0002 0.01 0.0188 0.0054 0.28 <0.0002 0.49
07-8 dup May 11/07 <0.04 <0.0002 <0.001 0.06 <0.001 0.26 <0.0002 0.01 0.0191 0.0068 0.30 <0.0002 0.50 07-9 May 11/07 <0.04 <0.0002 0.007 0.06 <0.001 0.25 <0.0002 <0.01 0.0018 0.0010 0.31 <0.0002 0.11
07-11 May 11/07 <0.04 <0.0002 <0.001 0.05 <0.001 0.32 0.0002 <0.01 0.0129 0.0035 0.46 <0.0002 0.19 BH06-04 May 11/07 <0.04 <0.0002 <0.001 0.03 <0.001 0.16 <0.0002 0.01 0.0044 0.0032 0.17 <0.0002 0.26 BH06-08 May 11/07 <0.04 <0.0002 0.006 0.02 <0.001 0.28 <0.0002 <0.01 0.0041 0.0042 0.82 <0.0002 0.43 BH06-11 May 11/07 <0.04 <0.0002 <0.001 0.04 <0.001 0.11 <0.0002 <0.01 0.0009 0.0028 0.07 <0.0002 0.11 BH06-13 May 11/07 <0.04 <0.0002 0.002 0.12 <0.001 0.04 <0.0002 <0.01 0.0008 0.0010 <0.06 <0.0002 0.02
Sand and Gravel
07-2 May 11/07 <0.04 0.0007 0.002 0.05 <0.001 0.13 <0.0002 <0.01 0.0016 0.0010 1.66 <0.0002 0.04 07-4 May 11/07 <0.04 0.0002 0.005 0.07 <0.001 0.13 <0.0002 <0.01 0.0018 0.0023 <0.06 <0.0002 0.07 07-6 May 11/07 <0.04 0.0011 0.003 0.11 <0.001 0.11 <0.0002 <0.01 0.0009 0.0006 0.37 <0.0002 0.06
07-6 dup May 11/07 <0.04 0.0019 0.003 0.09 <0.001 0.11 <0.0002 <0.01 0.0014 0.0016 0.33 <0.0002 0.06 07-10 May 11/07 <0.04 <0.0002 0.002 0.06 <0.001 0.16 <0.0002 <0.01 0.0008 0.0020 0.46 <0.0002 0.10
BH06-03 May 11/07 <0.04 <0.0002 0.007 0.03 <0.001 0.16 <0.0002 <0.01 0.0009 0.0015 5.08 <0.0002 0.09 BH06-06 May 11/07 <0.04 <0.0002 0.009 0.06 <0.001 0.15 <0.0002 <0.01 0.0007 0.0003 2.67 <0.0002 0.07 BH06-07 May 11/07 <0.04 <0.0002 <0.001 0.17 <0.001 0.14 <0.0002 <0.01 0.0016 0.0019 <0.06 <0.0002 0.08 BH06-10 May 11/07 <0.04 <0.0002 <0.001 0.01 <0.001 0.20 <0.0002 <0.01 0.0027 0.0042 0.24 <0.0002 0.44
Bedrock
07-1 May 11/07 <0.04 <0.0002 0.003 0.05 <0.001 0.23 <0.0002 <0.01 0.0007 0.0003 0.66 <0.0002 0.06 07-5 May 11/07 0.04 0.0015 0.001 0.06 <0.001 0.28 <0.0002 <0.01 <0.0003 0.0005 <0.06 <0.0002 0.02 07-7 May 11/07 <0.04 0.0008 0.003 0.02 <0.001 0.05 <0.0002 <0.01 <0.0003 0.0009 <0.06 <0.0002 0.07
BH06-15 May 11/07 <0.04 <0.0002 0.001 0.05 <0.001 0.15 <0.0002 <0.01 0.0013 0.0011 2.75 <0.0002 0.12
Laboratory Detection Limit 0.04 0.0002 0.001 0.01 0.001 0.02 0.0002 0.01 0.0003 0.0002 0.06 0.0002 0.02 Canadian Drinking Water Guidelines** NS^^ 0.006(MAC) 0.01(MAC)* 1.0(MAC) NS 5(MAC) 0.005(MAC) 0.05(MAC) NS 1.0(AO) 0.3(AO) 0.01(MAC) NS
Notes: NS - guideline not specified. AO - aesthetic objective. MAC - maximum acceptable concentration based on health effects. * - Guidelines for Canadian Drinking Water Quality: Guideline Technical Document for Arsenic (Health Canada, 2006b). ** - Guidelines for Canadian Drinking Water Quality (Health Canada, 2006). ^ - indicates value for Inorganic Mercury. ^^ - guideline applies only to drinking water treatment plants. Italics - indicates values do not meet Canadian Drinking Water Guidelines.

5-20 December 2007 an Upgrader Project
e 3, Section 5 - Hydrogeology
Monitoring Well Sample Date Benzene
(mg/L) Toluene (mg/L)
Ethylbenzene (mg/L)
Xylenes (mg/L)
Total BTEX (mg/L)
F1††C6-C10(mg/L) F2 C>10-C16
(mg/L) Clay Till
07-8 May 11/07 <0.0004 <0.0004 <0.0004 <0.0008 ND <0.1 <0.12 07-8 dup May 11/07 <0.0004 <0.0004 <0.0004 <0.0008 ND <0.1 <0.12
07-9 May 11/07 <0.0004 <0.0004 <0.0004 <0.0008 ND <0.1 <0.12 07-11 May 11/07 <0.0004 <0.0004 <0.0004 <0.0008 ND <0.1 <0.12
BH06-04 May 11/07 <0.0004 <0.0004 <0.0004 <0.0008 ND <0.1 <0.12 BH06-08 May 11/07 <0.0004 <0.0004 <0.0004 <0.0008 ND <0.1 <0.12 BH06-11 May 11/07 <0.0004 <0.0004 <0.0004 <0.0008 ND <0.1 <0.12 BH06-13 May 11/07 <0.0004 <0.0004 <0.0004 <0.0008 ND <0.1 <0.12
Sand and Gravel 07-2 May 11/07 <0.0004 <0.0004 <0.0004 <0.0008 ND <0.1 <0.12 07-4 May 11/07 <0.0004 0.0005 <0.0004 <0.0008 0.0005 <0.1 <0.12 07-4 Jun 7/07 <0.0004 <0.0004 <0.0004 <0.0008 ND --- --- 07-6 May 11/07 <0.0004 <0.0004 <0.0004 <0.0008 ND <0.1 <0.12
07-6 dup May 11/07 <0.0004 <0.0004 <0.0004 <0.0008 ND <0.1 <0.12 07-10 May 11/07 <0.0004 <0.0004 <0.0004 <0.0008 ND <0.1 <0.12
BH06-03 May 11/07 <0.0004 <0.0004 <0.0004 <0.0008 ND <0.1 <0.12 BH06-06 May 11/07 <0.0004 <0.0004 <0.0004 <0.0008 ND <0.1 <0.12 BH06-07 May 11/07 <0.0004 <0.0004 <0.0004 <0.0008 ND <0.1 <0.12 BH06-10 May 11/07 <0.0004 <0.0004 <0.0004 <0.0008 ND <0.1 <0.12
Bedrock 07-1 May 11/07 <0.0004 <0.0004 <0.0004 <0.0008 ND <0.1 <0.12 07-5 May 11/07 <0.0004 0.0008 <0.0004 <0.0008 0.0008 <0.1 <0.12 07-5 Jun 7/07 <0.0004 <0.0004 <0.0004 <0.0008 ND --- --- 07-7 May 11/07 <0.0004 <0.0004 <0.0004 <0.0008 ND <0.1 <0.12
BH06-15 May 11/07 <0.0004 <0.0004 <0.0004 <0.0008 ND <0.1 <0.12
Laboratory detection limit 0.0004 0.0004 0.0004 0.0008 - 0.1 0.12 Alberta SWQG* - Human Drinking Water - All Soils 0.005 0.024 0.0024 0.3 NS 4.6 2.1
NORTH AMERICAN OIL SANDS CORPORATION
Table 5.5-6 Groundwater Quality Results, Dissolved Hydrocarbons
Notes: ND - not detected. NS - no guideline specified. * - Alberta Soil and Water Quality Guidelines for Hydrocarbons at Upstream Oil and Gas Facilities (AENV, 2001).
Italics - indicates that values exceed applicable Alberta SWQG. †† - F1 excludes BTEX.
North AmericVolum

5-21 December 2007 North American Upgrader Project Volume 3, Section 5 - Hydrogeology
NORTH AMERICAN OIL SANDS CORPORATION
5.5.8.1 Clay Till
Groundwater quality within the clay till appears to vary between well locations. The temperature of groundwater samples collected from the clay till ranged from 5.1°C to 7.6°C, with temperatures generally increasing with depth. Field pH values ranged from 6.7 to 7.3, indicating that the water is slightly acidic to slightly basic. Laboratory-measured pH values were slightly higher in all samples. This is expected to occur due to the loss of carbon dioxide (CO2) from the samples, which causes an increase in the pH.
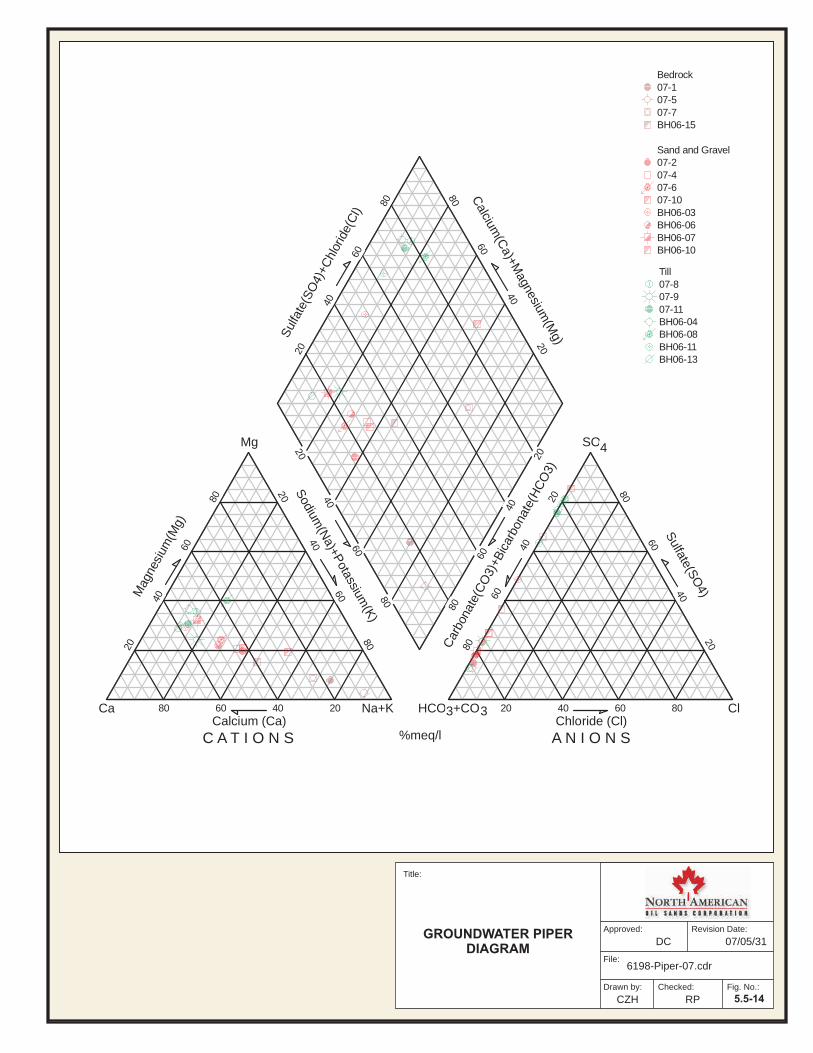
TDS concentrations ranged from 394 mg/L to 3,710 mg/L, and correlated well with both field and laboratory-measured EC values. A good correlation between TDS concentrations and depth within the till was not observed. Major ion concentrations were plotted in a Piper diagram (Figure 5.5-14). Sulphate was the dominant anion in groundwater samples collected from the clay till, with concentrations ranging from 39.9 mg/L to 2,430 mg/L. Five of the seven water samples collected from the clay till exceeded the Canadian Drinking Water Quality (CDWQ) aesthetic objective for sulphate of 500 mg/L (Health Canada, 2006).
In the seven groundwater samples collected from the clay till, carbonate and bicarbonate presence was variable (approximately 20% and 90%), and the relative chloride presence was negligible. Calcium was the dominant cation (approximately 75% to 90%), with some magnesium (approximately 20% to 40%) and sodium (approximately 60% to 80%). Chloride and potassium concentrations were less than 15 mg/L.
Nitrate-nitrogen concentrations exceeded the CDWQ maximum acceptable concentration (MAC) of 10 mg/L in monitoring wells BH06-11 and BH06-13. Both of these monitoring wells are completed at shallow depths (between 2.4 bgs and 6.4 m bgs), and are located in agricultural fields.
Dissolved metal concentrations were relatively consistent within the clay till. The most prevalent metal concentrations in the clay till were silicon (6.0 mg/L to 8.8 mg/L), strontium (0.34 mg/L to 4.45 mg/L) and manganese (0.409 mg/L to 6.010 mg/L).
Dissolved hydrocarbons were not detected in groundwater samples collected from the clay till.
5.5.8.2 Lower Sand and Gravel
The temperature of groundwater samples from the lower sand and gravel ranged from 6.0°C to 11.1°C. The water was slightly acidic to slightly basic, with field pH values ranging from 6.6 to 7.5. Laboratory-measured pH values were slightly higher, ranging from 7.6 to 8.1.
TDS concentrations ranged from 516 mg/L to 3,890 mg/L in the sand and gravel unit. Like the clay, sulphate was the dominant anion in the sand and gravel, with concentrations ranging from 70.4 mg/L to 2,430 mg/L. The highest sulphate and TDS concentrations occurred in BH06-10, which was screened across both the gravel and the clay till; thus, there was likely some influence from groundwater in the clay. Aside from BH06-10, the highest sulphate concentration was 445 mg/L. The groundwater chemistry of the sand and gravel is plotted in the Piper diagram on Figure 5.5-14. In terms of cations, a shift can be observed in the Piper diagram, indicating a greater relative abundance of sodium and a lower relative abundance of calcium and magnesium compared to the clay till. Potassium and chloride concentrations did not exceed 11 mg/L in groundwater samples collected from the lower sand and gravel.

5-22 December 2007 North American Upgrader Project Volume 3, Section 5 - Hydrogeology
NORTH AMERICAN OIL SANDS CORPORATION
Dissolved metal concentrations were variable within the sand and gravel. The highest concentrations were silicon (3.8 mg/L to 7.6 mg/L), iron (non-detectable to 5.08 mg/L), strontium (0.50 mg/L to 2.54 mg/L) and manganese (0.218 mg/L to 2.390 mg/L).
Dissolved hydrocarbons were not detected in groundwater samples collected from the sand and gravel, with the exception of monitoring well 07-4, which contained a trace concentration of toluene. A confirmatory sample was collected from 07-4 on June 7, 2007, and analyzed for benzene, toluene, ethylbenzene and xylenes (BTEX). The BTEX constituent concentrations in the June 7 sample were non-detectable.
5.5.8.3 Bedrock
The field-measured temperature of groundwater samples collected from bedrock units ranged from 6.8 C to 7.5°C. Field-measured pH values ranged from 7.2 to 8.0, indicating that conditions are slightly more basic compared to the surficial deposits. Laboratory-measured pH values were slightly higher, ranging from 7.8 to 8.2.
TDS concentrations of bedrock groundwater samples ranged from 480 mg/L to 946 mg/L. Sulphate concentrations ranged from 66 mg/L to 290 mg/L, and were generally lower than the surficial deposits. Bicarbonate concentrations were similar in groundwater samples collected from the clay, bedrock and sand and gravel. The groundwater chemistry is plotted in a Piper diagram (Figure 5.5-14). The Piper diagram indicates a shift from the clay till to bedrock in the groundwater chemistry, with decreasing relative abundances of calcium and magnesium, and increasing abundances of sodium. Potassium and chloride concentrations in groundwater samples from bedrock did not exceed 10 mg/L, similar to the overlying units.
Dissolved metal concentrations in bedrock groundwater samples were generally lower than those in the surficial deposits. The highest metal concentrations were silicon (1.5 mg/L to 7.5 mg/L), iron (non-detectable to 2.75 mg/L) and strontium (0.15 mg/L to 1.47 mg/L).
Dissolved hydrocarbon concentrations were non-detectable in bedrock groundwater samples, with the exception of monitoring well 07-5, which had a trace concentration of toluene. A confirmatory sample was collected from 07-5 on June 7, 2007, and analyzed for BTEX. The BTEX constituent concentrations in the June 7 sample were non-detectable.
5.5.9 Existing Groundwater Users
5.5.9.1 Water Wells
A total of 466 water wells are located within a 7 km radius of the centre of the Project site, according to the Groundwater Information Centre (GIC) database (Figure 5.5-15; Appendix 5D). The majority of these wells (403 wells, or 86% of total) are identified as being used for domestic and/or stock use. Twenty-three wells (5%) are identified as being used for industrial purposes. The remaining water well reports do not identify a well use. The majority of water wells in the RSA with a reported completion depth were completed at depths of less than 50 m bgs, with an average completion depth of 38 m bgs.
Based on the water well search, a total of 51 water wells are located within the LSA. Six of the water wells in the LSA are reported to be located within the Project site. Similar to the RSA, the majority of water wells within the LSA are completed at depths of less than 50 m bgs, with an average completion depth of 35 m bgs.
The locations of potential receptors near the Upgrader site were identified as a part of North American’s public consultation program, as described in Volume 1, Section 10.

5-23 December 2007 North American Upgrader Project Volume 3, Section 5 - Hydrogeology
NORTH AMERICAN OIL SANDS CORPORATION
The receptor locations are indicated on Volume 1, Appendix D2, Figure D2-1. A total of 124 potential receptors were identified in the area surrounding the Upgrader. Of these, 33 receptors were within 1.6 km of the site boundaries, and 91 receptors were between 1.6 km and 5.0 km from the site boundaries.


ZS RP 5.5-2
TVD
Legend Title:
Approved: Revision Date:
File:
Drawn By: Checked: Fig. No.
6198-StratColumn-07
JUNE 2007REGIONAL STUDY AREA
STRATIGRAPHIC COLUMN
FOREMOST FORMATION
OLDMAN FORMATION
BE
LLY
RIV
ER
GR
OU
P
EMPRESS FORMATION CHANNEL SAND AND
GRAVEL(BEVERLYCHANNEL)
EMPRESS FORMATION TERRACE SAND AND GRAVEL
BEARPAW FORMATION
HORSESHOE CANYON FORMATION
EOLIAN DEPOSITSLACUSTRINE DEPOSITS
CLAY TILL


Title:
Approved: Revision Date:
File:
Drawn by: Checked: Fig. No.:
Title:
Approved: Revision Date:
File:
Drawn by: Checked: Fig. No.:
CZH RP
6198-Piper-07.cdr
DC 07/05/31
5.5-14
GROUNDWATER PIPER DIAGRAM
C A T I O N S A N I O N S%meq/l
Na+K HCO +CO3 3 Cl
Mg SO4
CaCalcium (Ca) Chloride (Cl)
Sul
fate
(SO
4)+C
hlor
ide(
Cl)
Calcium
(Ca)+M
agnesium(M
g)
Car
bona
te(C
O3)
+Bic
arbo
nate
(HC
O3)
Sodium
(Na)+P
otassium(K
)
Sulfate(S
O4)M
agne
sium
(Mg)
80 60 40 20 20 40 60 80
80
60
40
20
20
40
60
80
20
40
60
80
80
60
40
20
20
40
60
80
20
40
60
80
80
60
40
20
80
60
40
20
Bedrock07-107-507-7BH06-15
Sand and Gravel07-207-407-607-10BH06-03BH06-06BH06-07BH06-10
Till07-807-907-11BH06-04BH06-08BH06-11BH06-13


5-39 December 2007 North American Upgrader Project Volume 3, Section 5 - Hydrogeology
NORTH AMERICAN OIL SANDS CORPORATION
5.6 Impact Assessment and Mitigative Measures The potential impacts resulting from construction and operation of the Upgrader are described in the following subsections. The potential impacts are evaluated with respect to the following key hydrogeological indicator resources: surficial aquifers within the clay till unit (Shallow Overburden Aquifers), the Lower Sand and Gravel Aquifer, the Beverly Channel Aquifer and Bedrock Aquifers.
5.6.1 Impacts Due to Surface Facilities
Surface disturbance for the Project include Upgrader facilities, tank farms and ponds. Measurable impacts to water levels as a result of the operation of these surface facilities are not expected and are considered neutral, with a prediction confidence of high and a final impact rating of no impact (Table 5.6-1).
Table 5.6-1 Impact Due to Surface Facilities
Key Indicator Resource
Attribute Direction Extent Magnitude Duration Frequency Permanence Prediction Confidence
Final Impact Rating
Water Levels neutral n/a n/a n/a n/a n/a high no impact
Shallow Overburden
Aquifers Water Quality negative local high long-term isolated
reversible in the short to long-term high
low impact
Water Levels neutral n/a n/a n/a n/a n/a high no impact Lower
Sand and Gravel Aquifer
Water Quality negative local high long-term isolated
reversible in the short to long-term high
low impact
Water Levels neutral n/a n/a n/a n/a n/a high no impact Beverly
Channel Aquifer
Water Quality neutral n/a n/a n/a n/a n/a high no impact Water Levels neutral n/a n/a n/a n/a n/a high no impact
Bedrock Aquifers
Water Quality negative local high long-term isolated
reversible in the short to long-term medium
low impact
Accidental releases from surface facilities such as pipelines, tanks, buildings and ponds all have the potential to impact groundwater quality negatively. The potential risk to receptors depends on the location of the release, the volume of the release, the duration of the release, the nature of materials released and the subsurface hydraulic conditions.
Much of the LSA is covered by organic soils underlain by a clay till unit, with a thickness of 5.5 m to 23 m and a relatively low hydraulic conductivity of 1 x 10⁻⁹ m/s to 6 x 10⁻⁹ m/s (Table 5.4-2). The linear velocity of groundwater in the clay till is estimated to be 0.006 m/y. A surficial eolian sand deposit overlies the till at the northern part of the Project site where no facilities are planned for construction. Accidental releases have the potential to impact shallow groundwater quality adversely. North American will implement the following mitigative strategies for the Project:
• Where possible, piping and tanks will be located aboveground to facilitate leak detection (pipeline will be belowground).

5-40 December 2007 North American Upgrader Project Volume 3, Section 5 - Hydrogeology
NORTH AMERICAN OIL SANDS CORPORATION
• Storage tanks will be protected against leaks using environmental controls such as internal coatings, cathodic protection and secondary containment, in accordance with EUB Directive 055 (EUB, 2001). Leak detection equipment will be installed where appropriate.
• North American will develop contingency plans that will serve as a guide for spill response.
• North American will establish formal asset integrity programs to ensure that equipment quality is managed and maintained.
• North American will require appropriate training for all people whose work may create an impact on the environment.
• Groundwater monitoring will be conducted at processing facilities, tank farms and ponds (Section 5.8) to monitor the effectiveness of the implemented mitigative measures.
Because of these mitigative measures, the depth below ground surface and the low hydraulic conductivity of the overlying till, accidental releases from ground surface pose little threat to the Beverly Channel Aquifer. The direction of impact is considered neutral, with a high prediction confidence and a final impact rating of no impact.
Accidental releases from surface facilities could result in a deterioration of the water quality in the Shallow Overburden, Lower Sand and Gravel and Bedrock Aquifers, and is considered a negative impact. The extent is local, the magnitude is potentially high, the duration is long-term, the frequency is isolated and the permanence is reversible in the short to long-term, depending on the size and nature of the release. The prediction confidence of this assessment is medium to high.
The mitigative measures and groundwater monitoring (Section 5.8) in the vicinity of surface facilities will ensure that any releases will be identified and response measures implemented to minimize impacts. Although potential changes in water quality due to surface facility operations are possible, the final impact rating is considered low because effective industry standard mitigation and monitoring efforts will be implemented for the Project.
5.6.2 Impacts Due to Dewatering of Excavations
Groundwater will not be used for water supply during construction or operation of the Upgrader. Dewatering of excavations may occur during construction of the Upgrader. The depths of the excavations are not expected to extend below the base of the clay till.
Measurable impacts to groundwater quality as a result of dewatering are not expected and are considered neutral, with a prediction confidence of high and a final impact rating of no impact (Table 5.6-2).

5-41 December 2007 North American Upgrader Project Volume 3, Section 5 - Hydrogeology
NORTH AMERICAN OIL SANDS CORPORATION
Table 5.6-2 Impact Due to Dewatering of Excavations
Key Indicator Resource
Attribute Direction Extent Magnitude Duration Frequency Permanence Prediction Confidence
Final Impact Rating
Water Levels negative local medium
short-term isolated
reversible in the short-
term high low
impact Shallow Overburden
Aquifers Water Quality neutral n/a n/a n/a n/a n/a high no impact
Water Levels negative local low
short-term isolated
reversible in the short-
term medium negligible
impact Lower
Sand and Gravel Aquifer
Water Quality neutral n/a n/a n/a n/a n/a high no impact
Water Levels negative local negligible
short-term isolated
reversible in the short-
term high negligible
impact Beverly Channel Aquifer
Water Quality neutral n/a n/a n/a n/a n/a high no impact
Water Levels negative local negligible
short-term isolated
reversible in the short-
term medium negligible
impact Bedrock Aquifers
Water Quality neutral n/a n/a n/a n/a n/a high no impact
The predicted drawdown at distances of 1 m, 2 m, 5 m, 10 m and 20 m from the excavation is presented in Figure 5.6-1. Assuming a conservative required drawdown of 6 m for a period of six months, the measurable drawdown is predicted not to extend beyond 20 m from the excavation (Figure 5.6-1).
Dewatering of the excavations could result in a decrease in the water levels in the Shallow Overburden Aquifers in the vicinity of the excavations, and is considered a negative impact. The extent is local, the magnitude is medium, the duration is short-term, the frequency is isolated and the permanence is reversible in the short-term. The prediction confidence in this assessment is high, and the final impact rating of dewatering on Shallow Overburden Aquifers is low (Table 5.6-2).
Because of thickness and low hydraulic conductivity of the clay till, and the large hydraulic conductivity of the Lower Sand and Gravel Aquifer, dewatering of excavations is expected to have minimal effect on water levels in the Lower Sand and Gravel Aquifer, and a lower magnitude in comparison to the Shallow Overburden Aquifers. The direction of impact is considered negative, with low magnitude, a medium prediction confidence and a final impact rating of negligible (Table 5.6-2).
Based on the low impact to water levels in the Lower Sand and Gravel Aquifer, dewatering of excavations would have no detectable effect on water levels in the Beverly Channel and Bedrock Aquifers. The direction of impact is considered negative, with a medium prediction confidence and a final impact rating of negligible (Table 5.6-2).
5.6.3 Impacts Due to Groundwater Withdrawal Below Ponds
The potentially contaminated pond and oily water pond will be excavated to a working depth of 6.1 m. Liners will be installed in these ponds to prevent infiltration of contaminated water to the groundwater system. If the water table intersects these ponds, groundwater would enter the pond excavation and cause the liners to float. To prevent this, a groundwater tile drainage

5-42 December 2007 North American Upgrader Project Volume 3, Section 5 - Hydrogeology
NORTH AMERICAN OIL SANDS CORPORATION
system will be installed to maintain the water table elevation below the pond bottoms. The drained groundwater will be pumped into the pond system. The depths of the ponds are not expected to extend below the base of the clay till.
Measurable impacts to groundwater quality as a result of groundwater withdrawal are not expected and are considered neutral, with a prediction confidence of high and a final impact rating of no impact (Table 5.6-3).
Table 5.6-3 Impact Due to Groundwater Withdrawal Below Ponds
Key Indicator Resource
Attribute Direction Extent Magnitude Duration Frequency Permanence Prediction Confidence
Final Impact Rating
Water Levels negative local medium long-term continuous
reversible in the medium-
term high low
impact Shallow Overburden
Aquifers Water Quality neutral n/a n/a n/a n/a n/a high no impact
Water Levels negative local low
long-term continuous
reversible in the short-
term medium low
impact Lower
Sand and Gravel Aquifer
Water Quality neutral n/a n/a n/a n/a n/a high no impact
Water Levels negative local negligible
long-term continuous
reversible in the short-
term high negligible
impact Beverly Channel Aquifer
Water Quality neutral n/a n/a n/a n/a n/a high no impact
Water Levels negative local negligible
long-term continuous
reversible in the short-
term medium negligible
impact Bedrock Aquifers
Water Quality neutral n/a n/a n/a n/a n/a high no impact
The predicted drawdown at distances of 5 m, 20 m, 50 m, 100 m and 200 m from the ponds is presented in Figure 5.6-2. Assuming a required drawdown of 6.1 m for a period of 50 years, the measurable drawdown is predicted to be less than 0.4 m at a distance of 100 m from the ponds, and negligible at a distance of 200 m (Figure 5.6-2).
Groundwater withdrawal beneath the potentially contaminated and oily water ponds could result in a decrease in the water levels in the Shallow Overburden Aquifers in the vicinity of the ponds, and is considered a negative impact. The extent is local, the magnitude is medium, the duration is long-term, the frequency is continuous and the permanence is reversible in the medium-term. The prediction confidence in this assessment is high, and the final impact rating of dewatering on Shallow Overburden Aquifers is low (Table 5.6-3).
Because of thickness and low hydraulic conductivity of the clay till, as well as the large hydraulic conductivity of the Lower Sand and Gravel Aquifer, groundwater withdrawal is expected to have minimal effect on water levels in the Lower Sand and Gravel Aquifer, and a lower magnitude in comparison to the Shallow Overburden Aquifers. The direction of impact is considered negative, with low magnitude, a medium prediction confidence and a final impact rating of low (Table 5.6-3).
Based on the low impact to water levels in the Lower Sand and Gravel Aquifer, groundwater withdrawal would have no detectable effect on water levels in the Beverly Channel and Bedrock Aquifers. The direction of impact is considered negative, with a medium prediction confidence and a final impact rating of negligible (Table 5.6-3).

PR
ED
ICTE
D G
RO
UN
DW
ATE
R L
EV
EL C
HA
NG
ES
NO
RTH
AM
ER
ICA
N U
PG
RA
DE
R E
XC
AV
ATIO
NS
0123456
015
30
45
60
75
90
105
120
135
150
165
180
Consecutive D
ays o
f P
um
pin
g
Drawdown (m)
1 m
2 m
5 m
10 m
20 m
Figure 5.6-1

PR
ED
ICTE
D G
RO
UN
DW
ATE
R L
EV
EL C
HA
NG
ES
NO
RTH
AM
ER
ICA
N U
PG
RA
DE
R P
ON
DS
0123456
05
10
15
20
25
30
35
40
45
50
Consecutive Y
ears
of P
um
pin
g
Drawdown (m)
5 m
20 m
50 m
100 m
200 m
Figure 5.6-2
5-45 December 2007 North American Upgrader Project Volume 3, Section 5 - Hydrogeology
NORTH AMERICAN OIL SANDS CORPORATION
5.7 Cumulative Effects Assessment Due to the thickness and low permeability of the surficial clay till unit, impacts to groundwater levels and groundwater quality are expected to be local, and no measurable effects on groundwater are expected to extend outside of the LSA. Temporal and spatial overlaps with existing and future groundwater users in the region are not expected. Thus, no cumulative effects on groundwater quality or groundwater levels are anticipated.
5.8 Follow-up and Monitoring A groundwater monitoring program will be implemented to monitor groundwater levels, flow conditions and groundwater quality at the Project site. This groundwater monitoring approach will be used to enable early detection of changes in groundwater conditions.
The groundwater monitoring program will include the use of existing monitoring wells, as well as additional monitoring wells that will be installed after the Project facilities have been constructed. The groundwater monitoring network will focus on the water table zone within the clay till unit, to target the most vulnerable zone with respect to potential impacts associated with Project operations, as well as the lower sand and gravel and bedrock. Monitoring wells will be installed adjacent to areas exposed to potential sources of accidental releases, as well as in areas of groundwater withdrawal. At least one on-site monitoring well location will consist of a nested pair, with one well completed at the water table and a second monitoring well completed at a depth of approximately 10 m bgs. At least one monitoring well will be located hydraulically upgradient of the site to serve as a background (control) well. The proposed monitoring well network is presented in Figure 5.8-1.
Groundwater samples will be collected from each monitoring well at least once annually, and analyzed for field parameters, including temperature, pH, EC and DO. Laboratory analyses may include the indicator parameters, which are based on potential impact to groundwater quality associated with heavy oil facilities listed on Table 5.8-1.
Table 5.8-1 Analytical Parameters That May be Used in the Groundwater Monitoring Program
Source of Impact Routine1 Dissolved Metals2
DOC BTEX, F1 and F23
NO2-NO3 and NH4
Amines
Ponds X X X X Amines X X Sulfur X Sodium hydroxide X Fuel X X Bitumen X X X Diluent X X Sour Water X X X X Process Chemicals X X
Notes:
1 Routine water analysis includes EC, pH, total dissolved solids, sodium, potassium, calcium, magnesium, manganese, iron, hydroxide, chloride, carbonate, bicarbonate, sulphate, hardness and alkalinity.
2 Dissolved metals analysis includes aluminum, antimony, arsenic, barium, beryllium, boron, cadmium, chromium, cobalt, copper, iron, lead, lithium, manganese, molybdenum, nickel, phosphorus, selenium, silicon, strontium, sulphur, thallium, tin, titanium, uranium, vanadium, zinc and zirconium.
3 BTEX analysis includes benzene, toluene, ethylbenzene and xylenes, F1 includes hydrocarbon fractions C5-C10 and F2 includes hydrocarbon fractions C10-C16.

5-46 December 2007 North American Upgrader Project Volume 3, Section 5 - Hydrogeology
NORTH AMERICAN OIL SANDS CORPORATION
In the event that significant changes in groundwater quality are detected, an incident-specific groundwater response plan will be developed and implemented.
5.8.1 Groundwater Response Plan
In the unlikely event that major changes in groundwater quality are detected as a result of Project operations, an incident-specific response plan will be developed and implemented. Aspects of the plan include:
• conducting confirmatory sampling;
• notifying AENV on confirmation of impact; and
• identifying the source(s) of impact.
Once the source(s) of impact have been identified, a remediation plan and/or site-specific risk management strategy will be developed, based on the nature and concentration of contaminants and potential receptors in the area. The remediation plan and/or risk management strategy will be submitted to AENV for approval, and the remediation plan and/or risk management strategy will be implemented.


5-48 December 2007 North American Upgrader Project Volume 3, Section 5 - Hydrogeology
NORTH AMERICAN OIL SANDS CORPORATION
5.9 Summary The potential impacts of the Project on groundwater were assessed with respect to water levels and water quality for the following: Shallow Overburden Aquifers, Lower Sand and Gravel Aquifer, Beverly Channel Aquifer and Bedrock Aquifers.
Throughout the lifespan of the Project, components which have the potential to affect key indicator resources include:
• the operation of surface facilities;
• dewatering of excavations; and
• withdrawal of shallow groundwater.
All of the above components were given a final impact rating of no impact to low impact.
Groundwater monitoring will be required during the operation phase of the Project to confirm that changes in groundwater levels, groundwater flow direction and/or water quality are consistent with the results of the impact assessment, and to evaluate the environmental performance of operations and engineered structures.
5.10 Literature Cited Agriculture and Agri-Food Canada. 2001. Strathcona County: Part of the NSR Basin, Parts of
Tp 050 to 057, R 20 to 24, W4M. Regional Groundwater Assessment. Prepared for Strathcona County.
Alberta Energy and Utilities Board (EUB). 2001. Directive 055: Storage Requirements for the Upstream Petroleum Industry. Calgary, Alberta.
Alberta Environment (AENV). 2001. Alberta Soil and Water Quality Guidelines for Hydrocarbons at Upstream Oil and Gas Facilities. Volume 3: User Guide, prepared by the Land Branch, Science and Standards Division, Edmonton, Alberta, Publication No. T/622, September 2001. http://environment.gov.ab.ca/info/home.asp
Andriashek, L.D. 1988. Open File Report 1988-04: Quaternary Stratigraphy of the Edmonton Map Area, NTS 83H. Alberta Research Council, Terrain Sciences Department, Natural Resources Division.
BA Energy. 2004. Volume 2: Environmental Impact Assessment, BA Energy Heartland Oil Sands Processing Plant (Bitumen Upgrader).
Domenico, P.A. and F.W. Schwartz. 1997. Physical and Chemical Hydrogeology. John Wiley & Sons. New York.
Groundwater Information Centre (GIC). 2006. Water Well Drilling Reports. Provided to Matrix Solutions Inc. by the Water Data Management Section, Alberta Environment. April 2003. Updates from Alberta Environment Groundwater Information Website, 2006.
Hamilton, W.N., Price, M.C. and C.W. Langenberg (compilers). 1999. Geological Map of Alberta. Alberta Geological Survey, Alberta Energy and Utilities Board. Map No. 236, scale 1:1,000,000.

5-49 December 2007 North American Upgrader Project Volume 3, Section 5 - Hydrogeology
NORTH AMERICAN OIL SANDS CORPORATION
Hayashi, M., van der Kamp, G. and D.L. Rudolph. 1998. Water and Solute Transfer between a Prairie Wetland and Adjacent Uplands, 1. Water Balance. Journal of Hydrology, 207(1-2): 42-55.
Health Canada. 2006a. Guidelines for Canadian Drinking Water Quality. Summary Table. Federal-Provincial-Territorial Committee on Drinking Water of the Federal-Provincial-Territorial Committee on Health and the Environment. March 2006. http://www.hc-sc.gc.ca/ewh-semt/pubs/water-eau/doc_sup-appui/index_e.html
Health Canada. 2006b. Summary of Guidelines for Canadian Drinking Water Quality: Guideline Technical Document for Arsenic. Federal-Provincial-Territorial Committee on Drinking Water of the Federal-Provincial-Territorial Committee on Health and the Environment, May 2006. http://www.hc-sc.gc.ca/ewh-semt/pubs/water-eau/doc_sup-appui/arsenic/index_e.html
Hvorslev, M.J. 1951. Time Lag and Soil Permeability in Groundwater Observations. U.S. Army Corps of Engineers, Waterways Exploration Station Bulletin 36. Vicksburg, Mississippi.
McWhorter, D.B. and D.K. Sunada. 1977. Ground-Water Hydrology and Hydraulics. Water Resources Publications. Littleton, Colorado.
Mossop, G. and I. Shetsen. 1994. Geological Atlas of the Western Canada Sedimentary Basin. Published jointly by the Canadian Society of Petroleum Geologists and the Alberta Research Council in sponsorship association with the Alberta Department of Energy and the Geological Survey of Canada.
Stein, R. 1976. Report 76-1: Hydrogeology of the Edmonton area (northeast segment), Alberta. Alberta Research Council, Groundwater Department, Natural Resources Division.
Shetsen, I. 1990. Quaternary Geology, Central Alberta. 1:500,000 scale map. Alberta Research Council.
Stantec Consulting Ltd. (Stantec). 2006. Regional Groundwater Quality Study of the Beverly Channel in the Fort Saskatchewan Area – Phase II. Prepared for Northeast Capital Industrial Association (NCIA). October 2006.
Theis, C.V. 1935. The Relation between the Lowering of the Piezometric Surface and the Rate and Duration of Discharge of a Well Using Groundwater Storage. American Geophysical Union.
Whitaker, S.H. and E.A. Christiansen. 1972. The Empress Group in Saskatchewan. Canadian Journal of Earth Sciences. 9 pp. 353-360.

6-i December 2007 North American Upgrader Project Volume 3, Section 6 - Hydrology
NORTH AMERICAN OIL SANDS CORPORATION
TABLE OF CONTENTS
6 HYDROLOGY ...............................................................................................................................6-1 6.1 Introduction ......................................................................................................................6-1 6.2 Study Area .......................................................................................................................6-1
6.2.1 LSA .....................................................................................................................6-1 6.2.2 RSA.....................................................................................................................6-2
6.3 Issues and Assessment Criteria ......................................................................................6-4 6.4 Methods ...........................................................................................................................6-4
6.4.1 Analyses..............................................................................................................6-4 6.4.2 Existing and Planned Developments ..................................................................6-4
6.5 Existing Conditions...........................................................................................................6-4 6.5.1 Climatic Variables ...............................................................................................6-4 6.5.2 Local Watercourses and Water Bodies ..............................................................6-5 6.5.3 North Saskatchewan River .................................................................................6-7
6.6 Impact Assessment and Mitigative Measures ...............................................................6-19 6.6.1 Upgrader Site Drainage System and Water Management ...............................6-19 6.6.2 Raw Water Supply System ...............................................................................6-20 6.6.3 Impacts During Construction.............................................................................6-22 6.6.4 Impacts During Operations ...............................................................................6-22
6.7 Cumulative Effects Assessment ....................................................................................6-24 6.7.1 Changes in the Flow in the NSR due to Water Withdrawal ..............................6-24
6.8 Follow-up and Monitoring...............................................................................................6-29 6.9 Impact Summary ............................................................................................................6-29 6.10 Literature Cited...............................................................................................................6-30
6.10.1 Websites Referenced........................................................................................6-32
TABLES
Table 6.5-1 North Saskatchewan River Flow Regime Parameters at Edmonton Station (1973-2005) ................................................................................................................................6-9
Table 6.5-2 North Saskatchewan River Basin Existing and Applied Withdrawal Licences Downstream of Edmonton .............................................................................................6-10
Table 6.6-1 Phase 1 and Project North Saskatchewan River Raw Water Demands and Return Flows ..................................................................................................................6-23
Table 6.6-2 Percentage of Project Water Use versus NSR Flows....................................................6-23 Table 6.9-1 Hydrologic Impacts for North American Upgrader Project.............................................6-30
FIGURES
Figure 6.2-1 Surface Water Local Study Area......................................................................................6-3 Figure 6.5-1 Local Topography and Drainage Features ....................................................................6-12 Figure 6.5-2 Regional Flood Frequency Analysis ..............................................................................6-13 Figure 6.5-3 Aerial Photograph and Property Drainage.....................................................................6-14 Figure 6.5-4 Changes in 7 Day Minimum Flows from Pre to Post Regulation...................................6-15 Figure 6.5-5 North Saskatchewan River Historic Flows.....................................................................6-16 Figure 6.5-6 North Saskatchewan River Monthly Flow Duration Curves...........................................6-17 Figure 6.5-7 North Saskatchewan River Typical Daily Flow and Water Level Variations..................6-18 Figure 6.7-1 North Saskatchewan River Cumulative Impact of Withdrawals at Mean Annual
Flow................................................................................................................................6-27 Figure 6.7-2 North Saskatchewan River Cumulative Impact of Withdrawals at 7Q10.......................6-28

6-1 December 2007 North American Upgrader Project Volume 3, Section 6 - Hydrology
NORTH AMERICAN OIL SANDS CORPORATION
6 HYDROLOGY 6.1 Introduction
This section describes the hydrology of the area considering the watercourses, waterbodies and wetlands that may be affected by the North American Upgrader Project (the Project). The following includes a description of the existing hydrologic setting within the study areas, identifies potential changes to surface water resources including cumulative effects associated with Project developments, and presents mitigation strategies to minimize or reduce potential environmental effects.
The available local and regional surface flow baseline data, including low, average, and peak flows for key creeks and rivers and typical water level fluctuations are presented. Data and information presented are based upon site specific field surveys conducted in 2006-2007 in the area, relevant historical data available in the region and information from previous studies.
6.2 Study Area Two study areas were selected to document the hydrologic conditions and assess the hydrologic effects of the Project on a regional basis and a more detailed local level. Figure 6.2-1 shows the hydrology Local Study Area (LSA). The Hydrology Regional Study Area (RSA) is the same as the LSA plus the reach of the North Saskatchewan River (NSR) from the Gold Bar Wastewater Treatment Plant in Edmonton to the Alberta-Saskatchewan border. The Surface Water Quality (Volume 3, Section 7) and Fish and Fish Habitat (Volume 3, Section 8) assessments apply these same study areas.
6.2.1 LSA
The Hydrology and Fish and Fish Habitat LSA was established to assess the potential for localized effects on water quality, hydrology and fish and fish habitat, and was delineated based on the Project footprint, local drainage basin boundaries and local effects on the NSR. The hydrology LSA includes all Project disturbance activities consisting of the plant area, roads, pipelines and river intake. The hydrology LSA boundaries, as shown in Figure 6.2-1, are defined as follows:
• Astotin Creek watershed boundary to the south;
• Beaverhill Creek to the northeast;
• north-south Range Road 214, which forms the western limit of Astotin Creek watershed; and
• a 15 km reach of the NSR on the north from upstream of the existing Shell Scotford river intake to below the confluence with Beaverhill Creek (approximately 5 km downstream of the proposed river intake and outfall)
The hydrology LSA encompasses 308 km². This area includes the Astotin Creek watershed area of 201 km2. The Astotin Creek watershed extends into Elk Island National Park and includes Astotin and Oster Lakes. The hydrology LSA consists of rolling to near flat Parkland terrain with land slopes ranging from near flat in the Upgrader area to 3% south of Bruderheim. Total relief ranges 140 m, from elevation 730 m in the headwaters of Astotin Creek to the NSR bed at about

6-2 December 2007 North American Upgrader Project Volume 3, Section 6 - Hydrology
NORTH AMERICAN OIL SANDS CORPORATION
elevation 590 m. The river valley rises to approximately 617 m with a fragmentary terrace level at about elevation 606 m. Ground level in the Upgrader area ranges about 8 m from elevation 623 m to 631 m.
6.2.2 RSA
The hydrology RSA is defined primarily on the basis of potential impacts of the Project on flows and water levels in the NSR. It defines the study area for the cumulative effects assessment. The Project is expected to have negligible water resources impacts beyond the hydrology RSA. In view of the Alberta-Saskatchewan Apportionment Agreement, the hydrology RSA is extended from the Gold Bar Wastewater Treatment Plant in Edmonton to the Alberta-Saskatchewan border to identify any implications in meeting the 50% apportionment requirement with Saskatchewan. The 60 km stretch of river from Edmonton to the confluence with the Redwater River at Vinca Bridge is the main area of hydrology/water quality assessments. A separate RSA has been defined for the assessment of potential acid input (PAI) to surface water, as discussed in Volume 3, Section 7.


6-4 December 2007 North American Upgrader Project Volume 3, Section 6 - Hydrology
NORTH AMERICAN OIL SANDS CORPORATION
6.3 Issues and Assessment Criteria Construction and operation of the Project may have the potential to affect the surface water flow regime in watercourses and water levels in waterbodies within the Project and surrounding area. The specific requirements for assessing potential impacts to surface water are identified in the TOR (Volume 1, Appendix A).
Potential surface water quantity impacts may occur as a result of:
• Project water use and return flows from and to the NSR, and
• changes in runoff volumes as a result of changes in land use from agricultural to industrial and related effects during construction and operation of the Project facilities.
The potential impacts of these items are discussed, and where appropriate analyzed for the local sub-basins within the Project area and the NSR. Because variations in stream flow and lake and wetland water levels may affect vegetation, aquatic habitat, wildlife habitat and recreational activities, this assessment attempts to identify if the impact is likely to be measurable, and presents mitigation strategies.
6.4 Methods The surface water environmental setting is primarily a compilation of existing long-term regional data supplemented with site specific observation of drainage conditions within the Project and surrounding areas, as discussed in the following section. Historical long-term regional data applied to site specific drainage conditions, where appropriate, provide the basis for characterizing the hydrology in the area.
6.4.1 Analyses
Statistical analyses, summaries and comparisons were conducted to describe and predict the variability of climatic and hydrologic conditions relevant to the LSA and RSA. Climatic and hydrological variables analyzed include: temperature, precipitation, evaporation rates, water levels, local and regional stream flows, sediment loading, existing and applied for surface water withdrawal licences, and channel section and geomorphic data.
6.4.2 Existing and Planned Developments
Existing and planned developments are described in Volume 1, Section 1.
6.5 Existing Conditions
6.5.1 Climatic Variables
Climatic variables applied for assessment and design are based upon an average of climatic data and statistics from the Edmonton International Airport and city stations. Specific values applied, sources and how they are applied are as follows:
• Mean Annual Precipitation of 480 mm was used for lake water balance and outflows and was based on data from 1971-2000 climate normals (average of city and airport stations) (Environment Canada, 2001).

6-5 December 2007 North American Upgrader Project Volume 3, Section 6 - Hydrology
NORTH AMERICAN OIL SANDS CORPORATION
• Mean Annual Areal Evapotranspiration of 400 mm was used for annual water balance (average of city and airport stations) (AENV, 2001).
• Mean Annual Lake Evaporation of 665 mm was used for annual lake water balance and outflows (AENV, 2001).
• Maximum 1:25 Year, 24-hour design rainfall of 96.8 mm was used for storm runoff volumes and stormwater pond sizing by the engineering design team. By comparison, the reported 1:25 year, 24 hour rainfall at Edmonton International Airport (AES Canadian Climate Centre, 1984) was only 77.7 mm, based upon data from 1961-1983.
• Maximum 1:25 Year, 15 minute rainfall intensity of 92.8 mm/h (i.e., 23.2 mm in 15 minutes) was used for estimating peak flows for sizing ditches and culverts.
6.5.2 Local Watercourses and Water Bodies
6.5.2.1 Beaverhill Creek
The watersheds and drainage features around the Project area are shown in Figure 6.5-1. The Project area drains into Beaverhill Creek via Astotin Creek and an intermittent unnamed tributary stream.
Beaverhill Creek drains north and west, over a distance of approximately 57 km, ultimately emptying into the NSR where it has a gross drainage area of 2,930 km². Beaverhill Lake with a surface area of 139 km² has a drainage area of 1,970 km² (excluding the lake). Beaverhill Lake significantly controls and reduces downstream flows to the creek and essentially reduces the drainage area of Beaverhill Creek within the hydrology LSA to 960 km².
Beaverhill Creek in the hydrology LSA follows an irregular meander pattern, with an average channel width of approximately 11 m near its mouth. Flows on Beaverhill Creek are strongly affected by beaver activity. A large beaver dam (>2 m in height) located approximately 600 m upstream from the NSR completely impeded the surface flow of the creek in autumn 2006 through the winter 2007. In the period from late April 2007 to early May 2007, the beaver dam washed out due to high runoff. During this period, Beaverhill Creek near its mouth had an average wetted width of 8.5 m, a maximum depth of 0.89 m and a discharge of 1.25 m³/s. Channel substrate was composed of organic fines with occasional areas of large cobbles and boulders.
Beaverhill Creek was gauged for 12 years from 1975-1986 over the March-October season (Water Survey of Canada Station 05EB015, Environment Canada website). These data may therefore provide an indication of runoff rates for Beaverhill Creek’s tributaries including Astotin Creek. The mean seasonal (March-October) runoff over the 12-year monitoring period was only 4.4 mm (based on the gross drainage area) or 15.7 mm (excluding the Beaverhill Lake drainage area). The equivalent average flow rate in Beaverhill Creek under either scenario was 0.608 m³/s. By comparison, mean seasonal runoff observed at several other smaller regional gauged streams (Whitemud, West Whitemud, Pointe Aux-Pins, Blackmud, Namepi and Waskatenau Creeks) range from less than 15 mm to over 33 mm and average 28.5 mm. This regional average runoff of 28.5 mm is assumed for annual runoff assessments for the site.
There is commonly no flow in streams in the Project area, including Beaverhill Creek, in the months from July to March. Therefore, no low flow analyses were required for the smaller streams in the hydrology LSA (Astotin and unnamed tributaries).
6-6 December 2007 North American Upgrader Project Volume 3, Section 6 - Hydrology
NORTH AMERICAN OIL SANDS CORPORATION
A regional flood frequency analysis of the gauged small watersheds was conducted to estimate flood flows for the streams in the Project area. The analysis considered effective areas (areas that contribute to runoff during a mean annual flood) and gross drainage areas. Based upon the marginal difference in the results, gross drainage areas versus maximum instantaneous flood discharge relationships were applied to estimate flood flows on the streams in the LSA. The resulting regional flood frequency relationships are shown in Figure 6.5-2. Based upon these relationships and fully excluding the Beaverhill Lake drainage, estimated flood discharges from Beaverhill Creek at its mouth are 11 m³/s for the mean annual flood and 72 m³/s at the 1:100 year flood. By comparison, the highest recorded flow in Beaverhill Creek was 78.7 m³/s on June 26, 1983.
6.5.2.2 Astotin Creek
The southwest portion of the Project area drains west and north to Astotin Creek. This creek flows in a northerly direction from Elk Island National Park, around the west side of the Project and then northeast to its confluence with Beaverhill Creek (Figure 6.5-1). The drainage area of Astotin Creek at its mouth is approximately 200 km2. Portions of Astotin Creek have been channelized as part of the road ditching on Range Road 214. In this area the creek is a stable, grassed road ditch approximately 0.5 m deep and 6 m wide. Further downstream, below the property, the channel is 10 m wide by 1.6 m deep. The low channel slope at 0.6 m/km is extensively affected by backwater conditions. The channel consists of sandy, silt bed and bank material.
Astotin Creek is not gauged. Astotin Creek flows are regulated by the upstream lakes and wetlands in Elk Island National Park including Astotin Lake that is over 4 km² in area. Estimated flows for Astotin Creek at its mouth based upon the regional hydrologic station data are as follows:
• Mean Annual Flow is 0.14 m3/s;
• Low flows are commonly dry for extended periods;
• Mean Annual Flood is 4.5 m3/s;
• 1:10 year flood is 13 m³/s; and
• 1:100 year flood is 30 m³/s.
6.5.2.3 Unnamed Tributary to Beaverhill Creek
The northeast portion of the Project area drains north into a small slough complex that drains northeast into an intermittent unnamed tributary of Beaverhill Creek. This unnamed tributary has several intermittent and poorly defined tributaries that drain north off of the sloping ground south of Bruderheim. The total drainage area of this unnamed tributary at its mouth is approximately 64 km².
This unnamed tributary to Beaverhill Creek stream is poorly defined in many locations. Where it enters Beaverhill Creek, just downstream of Highway 45 crossing, the channel section has a topwidth of approximately 4.5 m. During the May 2007 site observation (a wet post-snowmelt period), this tributary had a wetted width of 2 m, a depth of 0.4 m and an estimated flow of 0.10 m³/s. Upstream of Highway 45, the creek is significantly affected by grazing cattle causing sloping and eroding banks. The channel bed consists of organic fines and cobbles.

6-7 December 2007 North American Upgrader Project Volume 3, Section 6 - Hydrology
NORTH AMERICAN OIL SANDS CORPORATION
Based upon the regional hydrologic station data, estimated flows in the unnamed tributary at its mouth are as follows:
• Mean Annual Flow is 0.05 m3/s;
• Low flows (commonly dry for extended periods);
• Mean Annual Flood is 2.2 m3/s;
• 1:10 year flood is 6.7 m³/s; and
• 1:100 year flood is 15 m³/s.
6.5.2.4 Other Watercourses and Waterbodies
Several small sloughs or wetlands ranging from less than 70 m to 300 m in diameter (0.4 ha to 7 ha) are located within the Project area, as indicated in the topographic drainage map in Figure 6.5-1 and the aerial photograph in Figure 6.5-3. A detailed description and classification of these are presented in Vegetation and Wetlands (Volume 4, Section 10).
The main connected sloughs are in the complex in the northern portion of the Project area. These drain into the intermittent unnamed tributary draining to Beaverhill Creek. These are Class IV (Stewart and Kantrud, 1971) semi-permanent ponds. This “North Wetland Complex” is composed of three ponds and has a combined area of 9.36 ha. One of the ponds is present on both sides of Township Road 560. In May 2007, the area was flooded due to snow melt. Measured pond depths on June 26, 2007, when high water levels had receded, were approximately 1 m. These ponds are surrounded by riparian vegetation rings averaging 5 m wide and extending 0.2 m to 0.3 m above the normal water level, suggesting this may be representative of the typical variation in water level in these ponds.
The next largest wetland is a Class III seasonal pond located in the southwest portion of the Project area in NW 26-55-21-W4M. It has a total area of approximately 5.95 ha. The soils around this slough have been cultivated numerous times, resulting in limited riparian vegetation remaining. Satellite photographs of the area dating back to 1979 show a larger wetland area that has receded over the years. This area is now a depression less than 1 m deep with seasonal water typically about 0.3 m deep.
Standing water is present on both sides of the Canadian National Railway (CNR) rail line on the south boundary of the Project area. This area covers up to 3.0 ha on both sides of the rail line. Two culverts under the railway tracks (600 mm and 1,000 mm in diameter) convey water from the upslope area to the south. The total area contributing to runoff south and under the rail line is 1.7 km². The drainage path, as indicated in the aerial photograph in Figure 6.5-3, appears to drain north through the Project area to the North Wetland Complex and then to the unnamed tributary. No flow through either culvert was observed during the wet conditions in May 2007 suggesting that any surface flow here is limited to extreme melt and storm events. This runoff will be routed east to drain north via the Range Road 211 drainage ditch.
Other than smaller pothole type depressions and road ditches, there are no other connected drainage paths on the property.
6.5.3 North Saskatchewan River
The raw water supply for the Project is planned to come from the NSR. North American is pursuing alternative sources and supply delivery mechanisms such as the effluent from the City

6-8 December 2007 North American Upgrader Project Volume 3, Section 6 - Hydrology
NORTH AMERICAN OIL SANDS CORPORATION
of Edmonton Gold Bar Wastewater Treatment Plant and a regional industrial water treatment and distribution system (Morrison Hershfield, 2007), as discussed in Volume 1, Section 6. For the purposes of assessment, withdrawal from the NSR is proposed at an intake site to be located downstream of the BA Energy/ATCO intake site, as shown in Figure 6.5-1.
Flows have been recorded by Water Survey of Canada (Environment Canada, 2004b) since 1912 (station number 05DF001) where the total basin area is approximately 28,000 km². This gauge site is located approximately 63 km upstream of the proposed intake site. Major inflows between the Edmonton station and the intake site are the Sturgeon River with a drainage area of 3,350 km² and a few minor tributaries that increase the total drainage area at the intake site to approximately 33,000 km². In addition to these inflows, a number of withdrawals and return flows also occur along this reach.
A gauge (05EA001) on the Sturgeon River near Fort Saskatchewan just upstream of the Project indicates the Sturgeon River has a mean March-October discharge into the NSR of 4.2 m3/s. Assuming the other minor tributaries entering the NSR between the Edmonton gauge and the intake site contribute similar average runoff rates as the Sturgeon River, these may add a further 2 m3/s to the average flow during the March-October months. Therefore, between the WSC gauge in Edmonton and the intake site, the flow may increase by an average of 6.2 m3/s (2.7%) during the March-October period. However, due to minimal winter runoff conditions from these tributary watersheds, their relative flow contribution is much less during the winter months and may be considered as negligible.
Withdrawals from this reach, based on current water licences, total 5.6 m3/s. Assuming all are withdrawing at their maximum licenced rate, which is highly unlikely, the flow during the open water season may therefore be nearly equal at the Project site as at the Edmonton gauge due to the above noted inflows. Because of the limited additional inflows between Edmonton and the Project area during the low flow months, the impacts of withdrawals on both average annual and low winter flow conditions are evaluated by neglecting any inflows between the gauging station at Edmonton and the intake site, as presented in the following sections.
6.5.3.1 Hydrologic Regime
The NSR is regulated by two major multi-purpose (flood control, recreational and flow augmentation) dams. The Brazeau Dam located on the Brazeau River came on line in 1962 and the Bighorn Dam located on the NSR came on line in 1972. Regulation of the NSR has resulted in an increase in low flows and a moderating of peak flows. The annual 7-day low flow is 350% of the unregulated flow, as shown in Figure 6.5-4, from a median of 22.4 m³/s prior to 1961 to a median of 77.8 m³/s after 1972. Because of this flow alteration of the natural hydrologic regime of the NSR, the post-regulation flow conditions (1973-2005) have been considered.
Since regulation in 1972, the gauge on the NSR at Edmonton (WSC 05DF001) has recorded a mean annual flow of 196 m3/s (234 m3/s for the open water season of March to October). Figure 6.5-5 presents a summary of the range of historical flows on a monthly and daily basis. The highest flow months are June and July and the lowest monthly flows typically occur in January and February although extreme lows can occur in November, likely in response to freeze-up conditions when water flow goes into the formation of ice. Because of regulation, the range of daily flows, as shown in Figure 6.5-5, are fairly constant with little variation between the minimums, and the upper and lower quartiles. The only major fluctuations occur during large flood events. The lowest flow recorded since regulation was 19.8 m3/s on November 22, 1977, and the highest was 3,990 m3/s on July 19, 1986.
Figure 6.5-6 shows daily flow duration curves indicating the percentage of time any given flow is equaled or exceeded in each month. Daily flows rarely drop below 100 m³/s from March to

6-9 December 2007 North American Upgrader Project Volume 3, Section 6 - Hydrology
NORTH AMERICAN OIL SANDS CORPORATION
October and only very rarely drop below 50 m³/s in November and December. These extreme low flows are typically a result of initial freeze-up conditions and the flow recovers after freeze-up and an ice cover layer is established. For example, during the extreme low in 1977 the flow dropped from 88.6 m³/s to 19.8 m³/s in three days and recovered to 85.8 m³/s three days later.
The mean annual flow volume passing by the Edmonton gauge since regulation is approximately 6,170,000 dam3 (1 dams³ = 1,000 m³). The wettest year was 1990 with a total volume of approximately 9,227,000 dam3 and the driest was 1975 with a total volume of approximately 4,430,000 dam3.
High and low flow frequency analyses of the data from 1973-2005 result in similar flood and low flow values, as previously reported (PCOSI, 2006). The estimated 7-day, 1:10 year low flow is 60 m³/s and the 1:100 year maximum instantaneous discharge is 5,760 m³/s. From 1973-2005 there were 50 days when the daily flow was less than 60 m³/s and one 7-day period in 1979 when the flow remained below 60 m³/s. Table 6.5-1 summarizes various statistical flows on the NSR at the Edmonton gauging station for the 1973-2005 period.
The significant flow variation over the day in the NSR should also be noted. This fluctuation is a result of peaking power operations at the dams. Typical flow and water level fluctuations recorded at the Edmonton gauge, as presented in Figure 6.5-7, show that flows may vary by over 50% within a day and levels can vary by 0.6 m within a day due to the flow regulation.
Table 6.5-1 North Saskatchewan River Flow Regime Parameters at Edmonton Station (1973-2005)
Flow Parameter Flow (m³/s)
Lowest Daily Flow on Record (November) 19.8 Minimum Recorded Monthly Flow (November) 77.5 7Q10 (7-day, 1 in 10 year low flow) 60 7Q2 (7-day, mean annual low flow) 79 Discharge Exceeded 95% of the time 85 Mean November Flow 129 Mean Annual Flow 196 1:2 Year Maximum Instantaneous 815 1:10 Year Maximum Instantaneous 1,990 1:100 Year Maximum Instantaneous 5,760
NSR flows downstream near the Saskatchewan border were monitored at Lea Park (Station 07EF003) from 1959-1971. Although this is a limited period and prior to the Bighorn Dam period, the ten years of overlapping data indicate an average increase in flow of 9.3 m³/s from Edmonton to Lea Park. The next downstream NSR station is near Deer Creek in Saskatchewan. Adjusting for the difference in drainage areas, the 1973-2005 flow data at this station would indicate an average historical increase in flow of about 8 m³/s from Edmonton to the Saskatchewan border.
Total suspended sediment (TSS) data at the gauging station at Edmonton are limited to 121 measurements from 1974-1990. Measured TSS concentrations range from 3 mg/L to 2,460 mg/L. The data correlated with flow predict an average concentration of 43 mg/L at the mean annual flow and a TSS concentration of 800 mg/L at the mean annual flood event. Review of the flow and TSS data suggest TSS concentrations above 500 mg/L are rarely expected to last for periods longer than a week.

6-10 December 2007 North American Upgrader Project Volume 3, Section 6 - Hydrology
NORTH AMERICAN OIL SANDS CORPORATION
6.5.3.2 Channel Regime
The NSR has a stream cut valley with two fragmentary terrace levels in the hydrology LSA reach. The low terraces at the river are about 14 m high on the south and 8 m high on the north. In this reach the NSR is a single meandering, gravel bed channel 160 m to 210 m wide with a mean depth of 1.2 m at the mean annual flow of 196 m³/s and over 5.6 m at the 1:100 year flood level. The median substrate size is 15 mm based upon sampling upstream and downstream of the hydrology LSA (Shaw and Kellerhalls, 1982). Banks consist of sand and silt that are densely vegetated with willows and shrubs. The overall channel slope is 0.35 m/km based upon regional topographic mapping. However, local channel surveys in the vicinity of the proposed intake indicate a locally steeper gradient at 0.8 m/km.
Review of historical aerial photographs indicates the channel is moderately stable with only minor point bar and bed shifting. The mean channel velocity is 1 m/s at the mean annual flow, increasing to nearly 2.6 m/s at the 1:100 year flood flow. The deepest channel depth, recorded on June 26, 2007 at a flow of approximately 450 m³/s, was 1.9 m within 20 m of the south bank in the reach just downstream of the existing BA Energy/ATCO intake site. Initial freeze-up has occurred from mid-October to mid-December and averages mid-November. The river becomes ice free starting in early April to early May and averages around mid-April.
6.5.3.3 Existing and Applied Water Withdrawals
Table 6.5-2 includes a summary of existing active licenced surface water withdrawals in the NSR basin based upon the database provided by Alberta Environment (AENV) (Ed Bulgar, pers. comm., 2006). Additional major applications in progress are also included in Table 6.5-2. These include the BA Energy Heartland Upgrader and North West Upgrader that have received regulatory approval although water withdrawal licences are still pending. Other proposed projects currently under review include the Petro-Canada Oil Sands Inc. Sturgeon and Synenco Northern Lights Upgraders and further expansion plans for the Shell Scotford Complex. Differences in the licences in Table 6.5-2 and those reported in previous upgrader EIAs are because licences with expiry dates prior to this report are excluded (e.g., CCS Inc. with a maximum annual withdrawal licence of 2,990 dam³) and differences in the raw database provided by AENV (e.g., Alberta Ltd. for 2,220 dam³ was not listed in the database).
Table 6.5-2 North Saskatchewan River Basin Existing and Applied Withdrawal Licences Downstream of Edmonton
Project Maximum
Annual Diversion
(dam³)
Consumptive Use
(dam³) Losses (dam³)
Return Flow
(dam³)
Net Withdrawal
(dam³)
Licenced Withdrawals Between Edmonton Gauge and the Project Site Agrium Products Inc. – Fort Saskatchewan Fertilizer Plant 3,809 2,476 0 1,333 2,476 Agrium Products Inc. – Redwater Fertilizer Plant 15,647 12,518 1,564 1,564 14,082 BP Canada Energy Company – Fort Saskatchewan Fractionation Plant 2,146 2,146 0 0 2,146 Celanese Canada Inc. – Edmonton Petrochemical Manufacturing Plant 16,038 7,489 0 8,549 7,489 Dow Chemical Inc. – Fort Saskatchewan Chemical Manufacturing Plant 21,493 5,378 16,115 0 21,493 EPCOR 450,220 0 22,511 427,709 22,511 Imperial Oil Ltd. - Strathcona Oil Refinery 9,251 5,499 0 3,752 5,499 Northwest Utilities / ATCO 3,700 3,700 0 0 3,700 Petro-Canada Products – Edmonton Refinery 5,789 1,438 2,912 1,438 4,351 Shell Canada Ltd. - Scotford Complex 20,672 14,963 0 5,708 14,963

6-11 December 2007 North American Upgrader Project Volume 3, Section 6 - Hydrology
NORTH AMERICAN OIL SANDS CORPORATION
Project Maximum
Annual Diversion
(dam³)
Consumptive Use
(dam³)
Losses (dam³)
Return Flow
(dam³)
Net Withdrawal
(dam³)
Sherritt International Inc. – Fort Saskatchewan Fertilizer Plant 5,154 3,351 0+ 1,803 3,351 BA Energy Inc. - Heartland Oil Sands Bitumen Upgrader* 7,570 7,570 0 0 7,570 PCOSI Sturgeon Upgrader* 14,454 11,739 0 2,715 11,739 North West Upgrader* 6,570 2,470 0 4,100 2,470 Synenco Energy - Northern Lights Upgrader* 10,300 2,060 0 8,240 2,060 Shell Canada Ltd. - Scotford Upgrader 2* 39,420 26,280 0 13,140 26,280 Smaller Licences (< 2,000 dam³/y) 27,101 17,640 4,044 5,417 21,684
Total (dam³) 659,334 126,719 47,147 485,469 173,865 Total (m³/s) 20.91 4.02 1.50 15.39 5.51
Licenced Withdrawals Between the Project Site and the Alberta Saskatchewan Border Alberta Environment 2,220 0 0 2,220 0 Canadian Salt Company Ltd. 12,039 1,204 0 10,835 1,204 City of Lloydminster 11,101 1,110 12 9,979 1,122 Husky Energy Lloydminster 9,955 9,955 0 0 9,955 Murphy Oil Company Ltd. 2,802 2,802 0 0 2,802 Anadarko Canada Corporation (now Canadian Natural Resources Limited) 2,985 2,985 0 0 2,985 Smaller Licences (< 2,000 dam³/y) 28,246 13,282 10,589 4,376 23,870
Total (dam³) 69,349 31,338 10,601 27,410 41,939 Total (m³/s) 2.20 0.99 0.34 0.87 1.33
Licenced Withdrawals Between Edmonton Gauge and Alberta Saskatchewan Border Total (dam³) 728,683 158,057 57,748 512,879 215,804 Total (m³/s) 23.11 5.01 1.83 16.26 6.84
Notes: Maximum Annual Diversion = Consumptive Use + Losses + Return Flow Examples of Losses are seepage and evaporation. Net Withdrawal = Consumptive Use + Losses 1 dam³ = 1,000 cubic metres Sources: AENV, 2006 – EMS database dated November 2006, * Water Licence Applications pending – BA Energy Inc. Heartland Oil Sands Bitumen Upgrader (BA Energy, 2004), North West Upgrader EIA (North West, 2006), Northern Lights Upgrader EIA (Synenco, 2006), Petro-Canada Oil Sands Inc. Sturgeon Upgrader EIA (PCOSI, 2006), Scotford Upgrader 2 EIA, (Shell Canada Ltd., 2007).
The licenced consumptive use rate from Table 6.5-2 is 3.42 m3/s plus 1.59 m³/s from applications under review for a total of 5.01 m³/s or a total annual volume of 158,057 dam3.
As a whole, actual total withdrawals and consumptive use are expected to be less than the licenced amounts, although individual amounts may vary substantially from the specific licenced allocations. The North West Upgrader EIA reported that actual consumptive use and losses for the major users totaled approximately 87,400 dam³ or about 82% of their total licenced amount (North West, 2006). The reported total maximum annual withdrawal for these major users was equivalent to about 91% of their total licenced allocation. These results were reported as based on averages over the 2000-2004 period for the facilities supplying data. Where no actual value was obtained from a major user, the full licenced amounts were assumed. Since this assumption accounted for nearly one-half of the total volume of uses, actual uses may have been less than the percentages given above. A study investigating licence allocations in the NSR basin and estimates of actual uses is currently ongoing (AMEC, 2007 Draft) and may better define actual uses versus allocated amounts.
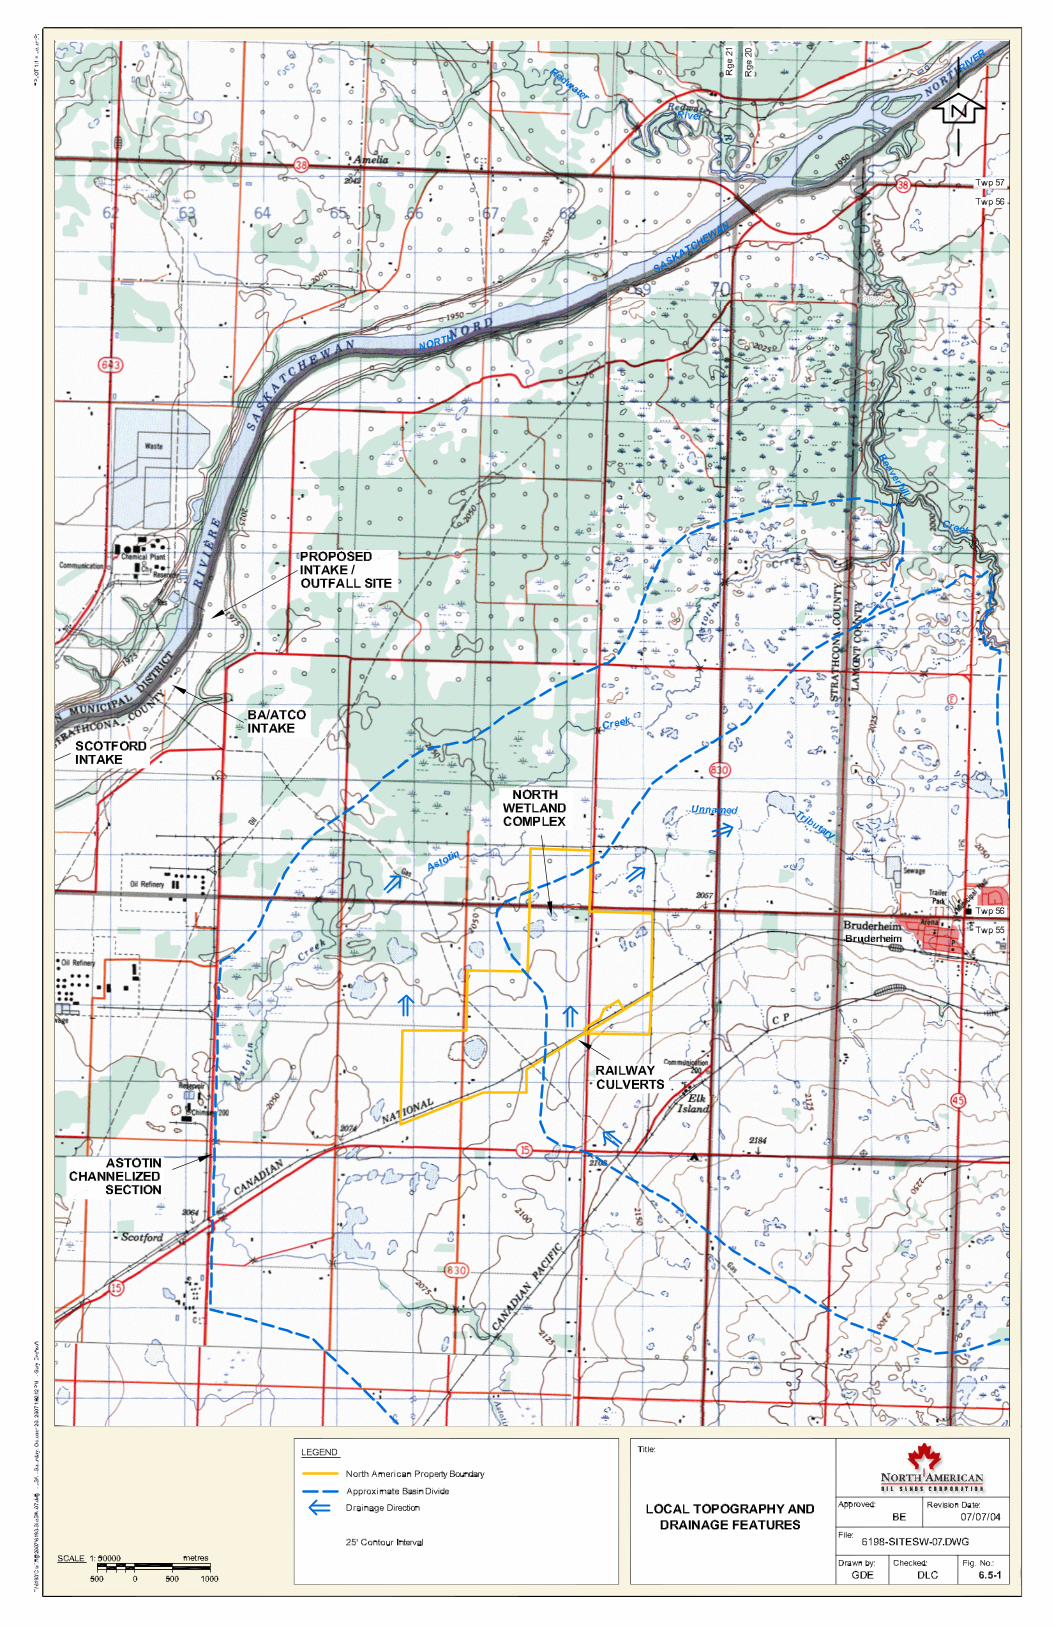

Title:
Approved: Revision Date:
File:
Drawn by: Checked: Fig. No.:
Title:
Approved: Revision Date:
File:
Drawn by: Checked: Fig. No.:BSW BE
6198-Charts2-07.cdr
DC 07/05/31
6.5-2
Regional Flood Frequency Analysis
Regional Flood Frequency Analysis
1:2 Year Event, Q = 0.1877A0.6
1:10 Year Event, Q = 0.551A0.6
1:25 Year Event, Q = 0.7863A0.6
1:100 Year Event, Q = 1.2841A0.6
0.1
1
10
100
1000
1 10 100 1000 10000
2Gross Drainage Area (km )
1:2 Year Estimated Flood1:10 Year Estimated Flood
1:25 Year Estimated Flood1:100 Year Estimated Flood
05EA001
05EC00505EC00405DF003
05DF006
05EC00205EB90205DF007
05EB910
3M
axim
um In
stan
tane
ous
Dis
char
ge (m
/s)


Title:
Approved: Revision Date:
File:
Drawn by: Checked: Fig. No.:
Title:
Approved: Revision Date:
File:
Drawn by: Checked: Fig. No.:BSW BE
6198-Charts2-07.cdr
DC 07/05/31
6.5-4
Changes in 7 Day Minimum Flows from Pre to Post
Regulation
North Saskachewan River at Edmonton (WSC 05DF001)
Change in 7-Day Minimum Flows from Pre to Post-Regulation
0
20
40
60
80
100
120
1912 1922 1932 1942 1952 1962 1972 1982 1992 2002
Year
Pre-Regulation (1912 - 1961) Post-Regulation (1973 to 2005) Median
37-D
ay M
inim
um
Flo
w (
m/s
)

Title:
Approved: Revision Date:
File:
Drawn by: Checked: Fig. No.:
Title:
Approved: Revision Date:
File:
Drawn by: Checked: Fig. No.:
BSW BE
6198-Charts-07.cdr
DC 07/05/31
6.5-5
NORTH SASKATCHEWAN RIVER HISTORIC MONTHLY
AND DAILY FLOWS
Post-Regulation Monthly Historical Flow
North Saskatchewan River at Edmonton 05DF001 (1973-2005)
0
100
200
300
400
500
600
700
800
900
Month
Maximum Monthly 160 153 192 432 431 857 851 479 353 260 188 192
Mean Monthly 112.3 114.6 134.0 231.8 245.3 333.1 358.4 225.4 186.8 152.8 129.2 119.2
Minimum Monthly 82.2 82.2 90.8 149 135 188 138 127 103 91.1 77.5 76
Jan Feb Mar Apr May Jun Jul Aug Sep Oct Nov Dec
Average Flow During Open Water Season (Mar - Oct) = 234 m³/s Mean Annual Flow = 196 m³/s
3M
on
thly
Flo
w (
m/s
)
North Saskatchewan River at Edmonton - Historic Range of Daily Discharge, 1973-2005
10
100
1000
10000
Jan Feb Mar Apr May Jun Jul Aug Sep Oct Nov Dec
Date
Maximum
Upper Quartile
Median
Lower Quartile
Minimum
Maximum Daily Recorded = 3,990 m³/s July 19, 1986
Minimum Daily Recorded = 19.8 m³/s November 22, 1977
3D
ail
y F
low
(m
/s)

Title:
Approved: Revision Date:
File:
Drawn by: Checked: Fig. No.:
Title:
Approved: Revision Date:
File:
Drawn by: Checked: Fig. No.:BSW BE
6198-Charts-07.cdr
DC 07/05/31
6.5-6
NORTH SASKATCHEWAN RIVER MONTHLY FLOW
DURATION CURVES
North Saskatchewan River Post-Regulation November-February Flow Duration Curves (1973-2005)
0
50
100
150
200
250
300
0 10 20 30 40 50 60 70 80 90 100Percent of Time Flow is Equaled or Exceeded
Jan Feb
Nov Dec
North Saskatchewan River Post-Regulation March-October Flow Duration Curves (1973-2005)
0
100
200
300
400
500
600
700
800
900
1000
0 10 20 30 40 50 60 70 80 90 100Percentage of Time Flow is Equaled or Exceeded
Mar Apr May
Jun Jul Aug
Sep Oct
3D
ail
y F
low
(m
/s)
3D
aily
Flo
w (
m/s
)

Title:
Approved: Revision Date:
File:
Drawn by: Checked: Fig. No.:
Title:
Approved: Revision Date:
File:
Drawn by: Checked: Fig. No.:BSW BE
6198-Charts-07.cdr
DC 07/05/31
6.5-7
North Saskatchewan River Typical Daily Flow and Water Level Variations
June 25 - 28, 2007 Flow and Water Level
300
350
400
450
500
550
600
3.9
4
4.1
4.2
4.3
4.4
4.5
4.6
4.7
FlowWater Level
3F
low
(m
/s)
Sta
ge
Wa
ter
Le
ve
l (m
)
6/25/0
7 12:0
0 PM
6/26/0
7 12:0
0 AM
6/26/0
7 12:0
0 PM
6/27/0
7 12:0
0 AM
6/27/0
7 12:0
0 PM
6/28/0
7 12:0
0 AM
6/28/0
7 12:0
0 PM
October 31 - November 2, 2006 Flow and Water Level
0
25
50
75
100
125
150
175
200
225
2.9
2.95
3
3.05
3.1
3.15
3.2
3.25
3.3
3.35
3.4
FlowWater Level
11/2/
06 12
:00 P
M
11/2/
06 12
:00 AM
11/1/
06 12
:00 P
M
11/1/
06 12
:00 AM
10/31
/06 12
:00 P
M
10/31
/06 12
:00 AM
10/30
/06 12
:00 P
M
3F
low
(m
/s)
Sta
ge W
ate
r L
evel
(m)

6-19 December 2007 North American Upgrader Project Volume 3, Section 6 - Hydrology
NORTH AMERICAN OIL SANDS CORPORATION
6.6 Impact Assessment and Mitigative Measures The assessment of potential impacts to hydrology indicators uses the criteria described in Volume 2, Section 1. Final impact ratings, post mitigation, are based on the consolidation of the seven impact assessment criteria (direction, geographic extent, magnitude, duration, frequency of occurrence, permanence and confidence) and professional judgment. Mitigation measures including management of operations and best management practices are provided along with the discussion of impacts.
6.6.1 Upgrader Site Drainage System and Water Management
The water management and site drainage system is shown in Volume 1, Figure 4.3-1. The Upgrader site consists of the main complex and process area in the middle, an administration area to the north located around the raw water pond, and undeveloped construction laydown areas on the east side and in the southwest corner. The water management plan, system design criteria and features are described in more detail in Volume 1, Section 6.5.
Runoff water will be controlled via berms and ditches. It will be contained on site and directed to ponds. The only surface water coming onto the Upgrader site will be from the two previously described culverts under the CN rail line. This local upslope drainage will be isolated from on-site drainage by directing it north along the east side ditch of Range Road 211 to drain to the North Wetland Complex. This redirection of water will maintain part of the natural drainage pattern into the wetlands.
There will be a total of eight engineered ponds within the property boundary, six of which will be for stormwater containment. The pond catchment areas and design storage capacities are identified in Volume 1, Figure 4.3-1. Freeboard in the ponds and backup in the drainage system provides additional storage capacity for extreme storm events in excess of the design. The oily stormwater pond size is based upon 12 hours of fire water storage. It collects drainage from 70% of the process area via catchbasins and an underground stormwater sewer system. The balance of the process area and development area drains to the potentially contaminated pond via the drainage ditch system shown in blue in Volume 1, Figure 4.3-1.
The water from the stormwater ponds that is not contaminated will be sent to the raw water pond as process make-up water. On occasion, if water meets regulatory requirements for release, the three stormwater ponds in the north and east undeveloped areas (admin, northeast and southeast) could have managed releases to enhance and maintain water levels in the wetland area to the north. This may be required, as a portion of the wetlands natural drainage system is captured by these ponds (Figure 6.5-3). After major storms, if ponds are full and water quality sampling indicates that the water meets regulatory requirements for release, the water may be discharged to the NSR via the effluent disposal system. Water that does not meet requirements for process use or release would be treated in the wastewater treatment plant. The total area contained by the drainage system is approximately 400 ha. Applying the regional mean annual runoff rate of 28.5 mm, the average annual volume of water that may be diverted to the stormwater ponds and retained on-site as process make-up water is 114,000 m³. An application for a Water Act licence for diversion of this amount is included in Volume 1, Appendix C.
The following mitigation measures will be implemented as part of the surface water management plan to minimize possible changes to water levels, flows, erosion potential and sediment loading to receiving streams:
• Industrial runoff management facilities consisting of stormwater ponds, berms and drainage ditches will be utilized to collect and contain surface water runoff from the

6-20 December 2007 North American Upgrader Project Volume 3, Section 6 - Hydrology
NORTH AMERICAN OIL SANDS CORPORATION
Project area. These will be designed to provide full containment and use of runoff water in the Upgrader processes. Controlled releases from stormwater runoff ponds (after water quality sampling indicates the water is suitable for release) may be used to maintain the North Wetland Complex.
• The natural low gradient terrain of the Project area means potential erosion concerns will be minimized.
• Culverts will be provided along road alignments. These will be designed and installed to eliminate potential flow restrictions and maintain natural drainage patterns.
• Setback from development near wetlands.
• Best management practices will be used to reduce erosion and provide runoff control during construction of the plant site, roads, drainage ditches and pipelines. These will include: appropriate planning, scheduling and layout of works, installing sediment/runoff retention structures such as silt fences and biotechnical erosion control measures; and maintaining buffers and minimizing disturbances.
• The Upgrader site will be reclaimed by grading and vegetating to restore natural drainage patterns following decommissioning. Further details on reclamation are provided in the Conservation and Reclamation Plan (Volume 1, Section 7).
6.6.2 Raw Water Supply System
The proposed raw water source for the Project is the NSR. Average annual daily raw water demand for the Project is 39,500 m³/d, and the Phase 1 average demand is 9,500 m³/d. Recognizing that alternative water supply options are still being investigated, the raw water supply system assessed here will consist of the following features:
• A river intake structure on the south bank of the NSR in the reach immediately downstream of the BA Energy/ATCO intake site, as indicated in Figure 6.5-1. A combined river intake and effluent dispersion pipe system will be constructed along with a pumphouse facility.
• A pipeline from the intake to the Project site which will be addressed in a separate application.
• A pipeline from the Project to the effluent dispersion pipe system, which will be addressed in a separate application.
• A raw water pond, located as shown in Volume 1, Figure 4.3-1; and
• A wastewater treatment plant within the Project, as discussed in Volume 1, Section 6.4.
The raw water pond is sized to provide at least 14 days storage plus 12 hours fire demand storage. This storage capacity will permit short-term shutdowns or reductions in river withdrawals during high sediment load periods, frazil ice periods, or low flow periods where potential future instream flow restrictions might be applied.
Design and construction of the intake will meet or exceed regulatory guidelines and requirements, in particular under the federal Fisheries Act and Navigable Waters Protection Act and the

6-21 December 2007 North American Upgrader Project Volume 3, Section 6 - Hydrology
NORTH AMERICAN OIL SANDS CORPORATION
provincial Water Act. Some of these requirements and conceptual design features of the intake structure are as follows:
• The instream portion of the structure will be sized and constructed for the ultimate design water supply rate to eliminate the need for any follow-up instream expansion work.
• A low profile bank intake structure constructed of sheet piling and rock riprap transitions to a concrete walled intake structure is proposed. The structure is expected to project approximately 10 m out into the river and extend as high as the mean annual flood level within the river. The intake is expected to be similar in profile but much larger than the existing BA Energy/ATCO intake. Concrete intake bays will lead back to the main intake pumphouse constructed in line horizontally with the high bank of the river. A modular design concept for the pumphouse facility will be applied for expansion from Phase 1 to the final Project.
• The outer wall of the intake will be angled slightly (about 10 degrees) into the flow to induce local scouring and maintain a sweeping velocity past the vertical intake wall area.
• The screens will have 2.54 mm size openings with a maximum design intake approach velocity of 0.038 m/s. These screens have been designed for exclusion of anguilliform swimming mode fish species such as pike, as per fisheries intake guidelines (DFO, 1995). The design peak summer day withdrawal rate of 62,666 m³/d results in a minimum required open screen area of 19 m². Since these intake screens typically have an open area of 58.5%, the total size of the required screening is 32.6 m². These screen dimensions are assumed for preliminary intake sizing; however, detailed designs may alter these dimensions. A series of intake bays will provide moderately uniform intake velocities across the screens.
• Initial field investigations for this reach of the NSR indicate that a reliable scoured depth of 1.8 m may be achieved at minimum flow conditions. With screens set at least 0.3 m above the bed, this means the minimum effective vertical screen height is 1.5 m at low flow. Allowing for the width of walls for bays and structural supports and assuming a spare bay for maintenance, the resulting length of the intake structure will be approximately 27 m. Detailed layout configurations involving angled screens and/or fish bypass systems may be employed to reduce the overall footprint of the intake structure. However, for assessment purposes, a total footprint area of up to 360 m² on the river bed is assumed. This includes the upstream and downstream transition areas.
• A protective trash rack may be provided in front of the screens. Either air or water backwashing or self cleaning screens may be used to clear debris and ice. However, cleaning and maintenance issues are expected to be minor. The screen system is designed based upon a minimum flow depth and a maximum design withdrawal rate at the same time, and as such is expected to provide more than adequate over-design for all other operating conditions. It is notable that the average intake rate is about 63% of the peak rate. During Phase 1 only one or two bays in the intake structure may be utilized. In addition, the 14-day storage capacity in the raw water storage pond allows for lengthy reductions in withdrawal rates below the design peak rates or even complete shutdowns in extreme situations such as during flood or ice/debris blockage conditions.
Potable water will be supplied by Strathcona County’s expanded distribution system.

6-22 December 2007 North American Upgrader Project Volume 3, Section 6 - Hydrology
NORTH AMERICAN OIL SANDS CORPORATION
6.6.3 Impacts During Construction
A water management and sediment control plan will be developed to provide appropriate isolation and containment of all disturbed area runoff during construction. After topsoil stripping and grading berms, the stormwater ponds and drainage ditches will be among the initial works constructed in order to manage runoff and maintain good drainage conditions during construction. There are no existing defined drainage channels on the site. The only upslope drainage is from the CNR rail culverts at the south. This runoff will be routed east to drain north via the Range Road 211 drainage ditch, as shown in Volume 1, Figure 4.3-1.
Water management and sediment control mitigation measures to be employed during construction will include:
• minimizing the extent of disturbance to developed areas and maintaining a vegetative cover in undeveloped areas including large portions of the laydown areas;
• creating stable topsoil and subsoil stockpiles with maximum 3H:1V side slopes and using sediment control fences until a protective vegetative cover is established;
• using erosion control matting where slopes and soil conditions warrant additional control measures;
• restoring vegetative cover on disturbed areas as soon as practical following completion of construction activities in an area; and
• creating stable low gradient ditches at less than 0.2% grade.
Water during construction will be primarily required for the concrete batch plant, dust suppression and soil compaction and will be provided by stormwater collected from the site and excavation dewatering. Any requirements that exceed the capacity of these supplies will be obtained from the potable water supply until the source water system is constructed.
Instream construction of the water intake structure will be conducted by isolating the area with a cofferdam. Less than 40% of the NSR will be constricted during construction with clean stable rock material placed out around the outside of the cofferdam to control erosion and sediment during construction. The cofferdam will need to accommodate the significant daily water level fluctuations due to the peaking power flow regulation. The effect of the cofferdam on the river water level during construction will be minor compared to these existing fluctuations. Instream construction activities will be limited to the August 1 to April 15 period, which is outside of the Restricted Activity Period (AENV, 2000) for this reach of the NSR.
6.6.4 Impacts During Operations
6.6.4.1 Water Use and Licensing
Daily water use and return flows for Phase 1 (80,000 bpsd production), Gasification 1 at 243,000 bpsd, and the Project (with Gasification 2) at 243,000 bpsd are summarized in Table 6.6-1 for both average and peak water demand conditions. Peak water demands will occur during summer when cooling water requirements are greatest. The demands indicated here include a 15% contingency factor. Water balance details and requirements are presented in Volume 1, Section 5.3.

6-23 December 2007 North American Upgrader Project Volume 3, Section 6 - Hydrology
NORTH AMERICAN OIL SANDS CORPORATION
Table 6.6-1 Phase 1 and Project North Saskatchewan River Raw Water Demands and Return Flows
Raw Water Demand Wastewater Return Flow Development Case
Average m³/d (m³/s)
Peak m³/d (m³/s)
Average m³/d (m³/s)
Peak m³/d (m³/s)
Phase 1: 80,000 bpsd 9,500 (0.110) 12,190 (0.141) 4,814 (0.056) 5,352 (0.062) Gasification 1: 243,000 bpsd 31,158 (0.361) 47,756 (0.553) 4,306 (0.050) 7,646 (0.088) Project: 243,000 bpsd 39,500 (0.457) 62,666 (0.725) 0 0
A Water Act application for an annual raw water volume of 14,417,500 m³ based on the average daily withdrawal rate of 39,500 m³/d is presented in Volume 1, Appendix C.
Measures taken by North American to contribute to the improvement in efficiency and productivity of water use for the Project include water recycle and reuse reclaims of all wastewater through: evaporators, ultrafiltration backwash recycle, stripped sour water recycle and BIOX effluent reuse, stormwater recycle, and recycle of biosolids dewatering filtrate. At the second stage of gasification, a 30% reduction in trim cooling by cooling towers is planned by using aerial cooling. No effluent will be discharged to the river after the second stage of gasification comes on line (referred to as Zero Liquid Discharge [ZLD]). The above measures meet or exceed industry leading water conservation and reuse benchmarks compared to the other upgraders proposed in the AIH. North American will continue to explore technical advancements to further improve water use efficiency over time.
The peak summer day demand of 0.725 m³/s for the Project represents a small percentage of both average and low flow conditions and even the minimum recorded monthly flow in the NSR, as indicated in Table 6.6-2. However, of greater concern is the cumulative effect on NSR flows when combined with other existing and planned projects. These are discussed in the Section 6.7.
Table 6.6-2 Percentage of Project Water Use versus NSR Flows
NSR Flow Condition Average Demand
(%)
Peak Summer Day Demand
(%) Mean Annual Flow (196 m³/s) 0.23 0.37 1:10 Year, 7-day Low Flow (60 m³/s) 0.76 1.21* Minimum Recorded Monthly Flow in August (127 m³/s) 0.36 0.57
* Peak demand conditions are not expected to occur during winter low flow conditions.
Potable water demands of 2 m³/h and 3 m³/h for Phase 1 and Project stages, respectively, will be supplied from Strathcona County.
6.6.4.2 Stormwater Management
Site runoff will be managed as discussed above in Section 6.6.1.
Potential runoff from approximately 225 ha of the Astotin Creek basin and 175 ha of the unnamed tributary basin will be intercepted by the stormwater control system on site. However, a portion of these areas are non-effective areas – i.e., they currently do not contribute surface runoff downstream during less than mean annual flood conditions as they drain to local pothole wetlands within the Project boundary. The effective drainage areas intercepted by the Project are

6-24 December 2007 North American Upgrader Project Volume 3, Section 6 - Hydrology
NORTH AMERICAN OIL SANDS CORPORATION
estimated at 92 ha in the Astotin Creek basin and 101 ha in the unnamed tributary basin. These effective areas represent approximately 0.5% of the Astotin basin where the runoff would enter Astotin Creek and 1.6% of the total unnamed tributary basin area. More efficiently directing the drainage of the upslope area south of the CNR rail line to the North Wetland Complex, and ultimately the unnamed tributary watershed, somewhat offsets the runoff that is retained within the unnamed tributary watershed. Based upon these small percentage areas, their low natural contribution and the proposed drainage improvements, any impact on downstream flows in the Astotin Creek and unnamed tributary basins are not expected to be detectable. This would apply to all flow regimes (high, low and average).
The Project will result in the loss of Class I and II (ephemeral and temporary pond) wetlands and the Class III seasonal pond in the NW 26-55-21 W4M. The Class IV semi-permanent wetland (North Wetland Complex) on the northwest corner of SW 35-55-21 W4M will remain physically undisturbed. This wetland is already bound by an existing road around its southeast perimeter that limits drainage to it from the Project area. The Project development will decrease the surface drainage area to the North Wetland Complex by up to 25%, resulting in a decrease in runoff and water levels in this wetland. This reduction in runoff will be offset by more efficiently directing the upslope drainage south of the Project area via road ditching to this area.
Monitoring of water levels in the North Wetland Complex will identify when periodic releases from the stormwater ponds may be desirable to sustain and enhance the North Wetland Complex. Opportunities for further enhancement may include establishing greater riparian vegetation buffers around the North Wetland Complex, and setbacks for development.
6.7 Cumulative Effects Assessment
6.7.1 Changes in the Flow in the NSR due to Water Withdrawal
The cumulative effect of withdrawals from the NSR was assessed using the existing and proposed licenced withdrawals indicated in Table 6.5-2 plus the Project. The effect on the mean annual flow is illustrated in Figure 6.7-1. Cumulative licenced withdrawals from downstream of Edmonton to the Alberta – Saskatchewan boundary amount to 743,101 dam³ or a flow rate of 23.56 m³/s, with return flows of 16.26 m³/s, resulting in a net withdrawal rate of 7.30 m³/s. This net withdrawal is 3.7% of the mean annual flow at Edmonton and about 3.6% of the estimated mean annual flow at the Alberta – Saskatchewan border. As noted in Figure 6.7-1, mean annual inflows downstream of Edmonton to the Saskatchewan boundary may amount to approximately 8 m³/s, or more than the total licenced net withdrawals. In the lowest flow year from 1973-2005 (1975), the maximum allocated net withdrawal is equal to 5.2% of the mean annual flow at Edmonton.
The cumulative effect of licenced and proposed licenced withdrawals under low (7Q10) flow conditions is illustrated in Figure 6.7-2. Under this low flow condition, the cumulative net withdrawal from Edmonton to the Saskatchewan boundary (not accounting for any tributary inflows) is 12.0% of the NSR flow.
The cumulative effects of these withdrawals are considered low in view of the following considerations:
• Not all licenced users will withdraw full licenced amounts.
• While peak withdrawal rates may be higher than the licenced annual average rate presented here, these will not all occur at the same time and many peak demands, due to cooling water demands, will generally occur during the higher summer flow periods and not during the 7Q10 low flow period in the winter.

6-25 December 2007 North American Upgrader Project Volume 3, Section 6 - Hydrology
NORTH AMERICAN OIL SANDS CORPORATION
• Downstream inflows further reduce the cumulative effects of withdrawals. In addition, the assessment is based upon the gauging station flows at Edmonton which do not include the return flows from the City of Edmonton.
• The daily fluctuations in flow currently occurring in the NSR are typically much greater than the sum of all net withdrawals.
• Most operations including North American’s have storage that would allow for short term cutbacks in withdrawals in the event of future restrictions due to possible instream flow needs during critical low flow periods.
• Flow regulation has substantially increased previous natural low flows in the NSR (the 7-day minimum annual flow has increased from a median of 22.4 m³/s prior to regulation to 77.8 m³/s after regulation).
• Flow monitoring accuracy on the NSR is likely in the order of ±5%.
6.7.1.1 Impact of Climate Change During Low Flow Periods
The TOR requests a discussion of the potential hydrologic impact of climate change on the availability of water in the NSR during low flow periods and thus the availability of water for the Project and other users in the future. To gauge the potential effects of climate change on low flows, consideration must be given to a range of complex interrelated factors. These include potential changes in precipitation and evaporation, changes in timing and changes in glacial melt contributions. In addition to these factors, past historical fluctuations and trends can be used as a guide. However, these may be masked by changes in land use (forest cover) and water management and abstractions. All of these factors need to be considered when predicting a seasonal expression of flow. A summary of some issues to consider follows:
• Flow data in the NSR is available from 1912 to present. The recorded annual flow at Edmonton from 1912 to 2002 shows a significant negative trend (at 95% significance criterion) (Seneca, 2004). Although this may be partly due to increasing withdrawals, recently computed naturalized flow data from 1912-2002 (Stantec, 2005) still indicate a strong negative trend over the period of record. (Naturalized means removing the effect of uses and dam operations.) The 1912-2005 naturalized mean annual flow is 214 m³/s. By comparison, the 1973-2005 post-dam evaluation period indicates a mean annual naturalized flow of approximately 200 m³/s versus the mean annual recorded flow of 196 m³/s, as used in this assessment report. The year 1975 was the lowest flow year on record with an estimated naturalized flow of 136.4 m³/s versus a recorded flow of 140 m³/s at Edmonton. The lower computed naturalized flow in 1975 implies flows were likely increased this year by reservoir drawdown from the two major dams.
• Current Global Climate Model (GCM) simulations demonstrate significant variability in predicted future changes for both mean temperature and total precipitation on the Canadian prairies and in Alberta (Toyra et al, 2005). Most models appear to indicate that increasing temperatures in Alberta will lead to increased precipitation and increased evaporation and transpiration. The net effect on streamflows is uncertain depending upon whether increased evapotranspiration would exceed any increases in annual precipitation. Canadian studies generally provide indications that the annual volume of runoff may increase in northern regions and decrease in southern regions (Fillion, 2000). The NSR basin sits between these northern and southern regions. For example, several studies in the South Saskatchewan River Basin (SSRB) have predicted lower low flows and drier conditions in southern Alberta. However, the predicted impacts appear to be less severe in central Alberta. Results using scatterplot tools from 31 GCMs for 30-year time periods from 2010-2039 and 2049-2069 (Environment Canada website) forecast a

6-26 December 2007 North American Upgrader Project Volume 3, Section 6 - Hydrology
NORTH AMERICAN OIL SANDS CORPORATION
median increase in precipitation from 3.5% to 4.1% (max 13.4% min -10.6%) for the first time period and 7.3% to 7.8% (maximum 19.2% minimum -5.5%) for the second time period with greater increases predicted in the eastern part of the basin. Similar modelling results for predictions of evaporation rates are much more variable and could not be summarized. In addition, modelling of monthly predictions to translate this into low flow periods becomes increasingly speculative.
• “A general increasing trend in precipitation has been projected in the Northern Hemisphere at mid- and high-latitude (particularly during autumn and winter ), and there is a general belief that the frequency of heavy rainfall events is likely to increase with global warming due to an intensification of the hydrologic cycle (Hennessay et al., 1997; McGuggie et al., 1999). However precipitation variations associated with climate change over the next 50 years are believed to be small compared to those resulting from natural decadal variability (McCarthy et al., 2001). In light of these considerations, climatic variations as compared to climate change, are expected to play a more decisive role in water resources decisions in the near future than long term gradual climate change” (ASCE, 2006).
• Climate warming results in increased melting of glaciers, although whether a glacier retreats or advances is additionally dependent on snowfall and the dynamic characteristics of the glacier. For the NSR at Edmonton, glaciers covered approximately 1.4% of the total drainage area in 1975. This was reduced to about 1.1% in 1998 (Pietroniro, 2006). At Edmonton, estimates of the proportion of runoff directly from glaciers represents 7.4% of the late summer (August to October) flow and 1.8% of the annual flow (Pietroniro and Nemuth, 2006) in the NSR. However, in low flow years this percentage contribution may be much higher. Assuming double the above contribution to flow in the lowest flow year - 1975 as an illustrative example, and if the glaciers were to fully disappear, the minimum historically recorded flow month in the late summer period (October 1975) could decrease from the 91.1 m³/s recorded to 77.6 m³/s. In this scenario, cumulative net consumptive uses downstream of Edmonton would amount to 9.3% of this reduced minimum monthly flow.
• Notwithstanding the scant and sometimes contrasting evidence, the literature highlights concerns that the frequency of severe episodes (droughts and flooding) will increase in the future. Long term low flow investigations to date have primarily relied upon paleoenvironmental studies and tree-ring constructions to define drought patterns and periods (George and Sauchyn, 2006). Evaluation in the context of historical trends needs to be considered. In the past century, droughts in Alberta have had a return period of 30 years to 50 years (Herrington et al., 1997) with severe droughts in the 1930s. Post glacial proxy climate data indicates that the prairies have experienced droughts “far more severe” than during the 1900s (Herrington et al., 1997). However, a 500-year analysis of tree rings on the Canadian prairies concluded that during the last 100 years, “the frequency of droughts…has not been appreciably different from conditions of the preceding four centuries” (Case and MacDonald, 1995).
Drawing conclusions from the literature and available data is difficult at best. Compounding the impact of possible declining annual discharge, as seen in the historic trend, is the need to consider changes in seasonal flows. Late summer flows are expected to decline however late winter flows may slightly increase (Rood, 2006). In addition, the frequency and duration of low flow periods may be expected to increase. In view of the uncertainties, the practice of applying caution in water management is prudent. For the NSR, the use of the substantial flow regulation that is available within the basin combined with potential future restrictions on withdrawals for instream flow needs, and hence the need for short duration offstream storage for the Project, are measures available to address these potential future uncertainties.

Title:
Approved: Revision Date:
File:
Drawn by: Checked: Fig. No.:
Title:
Approved: Revision Date:
File:
Drawn by: Checked: Fig. No.:
GDE DC
4455-IMPACT-07.cdr
LP 07/03/30
6.7-1
NORTH SASKATCHEWAN RIVER CUMULATIVE
IMPACT OF WITHDRAWALS AT MEAN
ANNUAL FLOW
EDMONTON
196
20.91 15.39
193.3190.5 192.8
0.87
0
196.7 (3)
0.457THE PROJECT(39,500 m³/day)
AL
BE
RTA
SA
SK
AT
CH
EW
AN
2.20
REDWATERRIVER (0.8) (2)
NAMEPICREEK (0.3)
STURGEONRIVER (2.8) (2)
BEAVERHILLCREEK (0.4)
VERMILIONRIVER (0.4)
LEGEND
(1)Maximum Annual Withdrawal (as a flow m³/s)
(1)Annual Return Flow (m³/s)
Estimated Mean Annual Tributary Inflow
NOTE
(1) Includes all existing licenses plus applications plus the project at maximum licenced allocations.
(2) Average annual increase in flow from Edmonton to Alberta - Saskatchewan border = 8 m³/s. Approximate contribution of main tributaries shown in brackets.
(3) A net increase in flow from Edmonton to the Alberta - Saskatchewan border occurs on average considering all licensed withdrawals and natural inflows.
OTHER TRIBUTARIES AND GROUNDWATER
(3.3)
(0.8)
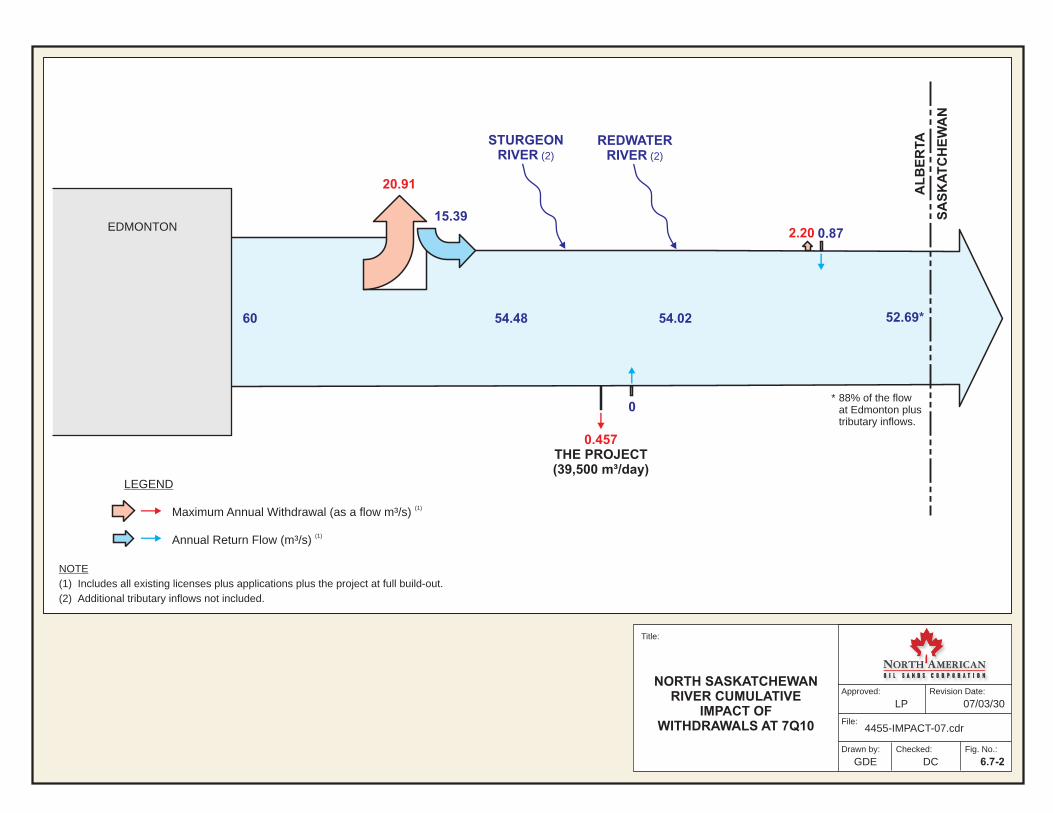
Title:
Approved: Revision Date:
File:
Drawn by: Checked: Fig. No.:
Title:
Approved: Revision Date:
File:
Drawn by: Checked: Fig. No.:
GDE DC
4455-IMPACT-07.cdr
LP 07/03/30
6.7-2
NORTH SASKATCHEWAN RIVER CUMULATIVE
IMPACT OF WITHDRAWALS AT 7Q10
EDMONTON
60
20.91
15.39
54.48 54.02
0.87
0
52.69*
0.457THE PROJECT(39,500 m³/day)
AL
BE
RTA
SA
SK
AT
CH
EW
AN
2.20
REDWATERRIVER (2)
STURGEONRIVER (2)
LEGEND
(1)Maximum Annual Withdrawal (as a flow m³/s)
(1)Annual Return Flow (m³/s)
NOTE
(1) Includes all existing licenses plus applications plus the project at full build-out.
(2) Additional tributary inflows not included.
* 88% of the flow at Edmonton plus tributary inflows.
6-29 December 2007 North American Upgrader Project Volume 3, Section 6 - Hydrology
NORTH AMERICAN OIL SANDS CORPORATION
6.8 Follow-up and Monitoring Hydrologic monitoring conducted as part of operations will consist of the following:
• stormwater pond level monitoring and testing on a regular basis during and following runoff events;
• regular inspections of the drainage system (ditches and culverts) and repair of erosion or blockage issues and
• monitoring of water levels in the North Wetland Complex to ensure natural water levels are being maintained. An assessment of stormwater pond release requirements and timing may be beneficial. A control wetland in an undisturbed drainage area (possibly in Elk Island Park) could be used for comparison purposes.
6.9 Impact Summary The Project will require water from the NSR. Some local stormwater runoff will be collected from the Project area that is not released back to the environment. Controlled releases of suitable quality runoff water will occur. Cumulative changes anticipated in flows and water levels in the NSR are considered to be minor, and are less than the existing daily fluctuations presently occurring in this reach of the NSR. The Project will not substantially contribute to existing regional cumulative effects on the NSR.
A summary of the hydrologic impacts for the Project are summarized in Table 6.9-1. Comments on each of the evaluation indicators follow.
Temporary / permanent changes in existing drainage patterns, waterbodies and wetlands: This indicator applies to the physical changes in water conveyance and retention areas. There are no defined watercourses in the Project area and no changes in drainage patterns outside of the development area. Wetlands will be removed within the Project area with others enhanced and protected. Any change is considered a net negative impact that is sub-regional in extent (within the Astotin Creek and unnamed tributary watersheds). The magnitude of the impact is low, within acceptable protective standards with no downstream detectable change to runoff rates. The duration is long-term, continuing through construction, Project life and until reclamation is complete. Reclamation can restore the area to pre-Project hydrologic conditions. The level of confidence in this assessment is medium, based upon a good understanding of the cause-effect relationships.
Effect of site runoff management on flows / levels in drainage channels / waterbodies: The retention and use of storm runoff water will have a negative impact that will extend beyond the Project development area to the Astotin and unnamed tributary watersheds. The retention of storm runoff may reduce contributing flows to the North Wetland Complex. The magnitude of the impact is low as any existing contribution of direct surface runoff from the majority of the Project area is small and would not be detectable in the downstream watercourses. The duration is long-term, continuing through construction, Project life and until reclamation is complete. Reclamation of the Project area can restore pre-Project hydrologic conditions. The level of confidence in this assessment is medium, based upon a good understanding of the cause-effect relationships.
Project contribution to cumulative pressures on surface water resources and cumulative impact of water withdrawal on the NSR: These indicators are two separate discussion items stated in the

6-30 December 2007 North American Upgrader Project Volume 3, Section 6 - Hydrology
NORTH AMERICAN OIL SANDS CORPORATION
TOR. They are combined because they have the same evaluation results in terms of impacts in the NSR watershed. Any change or development adds to cumulative pressures on surface water resources. Therefore, this is a negative, regional (NSR watershed) impact that is of medium magnitude because the cumulative magnitude of the water use causes a detectable change in river flow. The duration of the impact is long-term and continuous over the life of the Project. The impact is reversible in the long-term with an end to water uses and site restoration at Project closure. The level of confidence in this assessment is high based upon a good database of flow records on the NSR and a good understanding of current and planned water demands.
The final impact ratings for the above three indicators are rated the same as the magnitude impact ratings.
Table 6.9-1 Hydrologic Impacts for North American Upgrader Project
Indicator
Dire
ctio
n of
Im
pact
Exte
nt o
f Im
pac t
Mag
nitu
de o
f Im
pac t
Dur
atio
n of
Im
pact
Freq
uenc
y of
O
ccur
renc
e of
Im
pact
Perm
anen
ce
of Im
pact
Leve
l of
Con
fiden
ce
Fina
l Im
pact
R
atin
g
Temporary / permanent changes in existing drainage patterns, waterbodies and wetlands
Negative Sub-regional Low Long-term Continuous Long-
term Medium Low
Effect of site runoff management on flows / levels in drainage channels / waterbodies
Negative Sub-regional Low Long-term Continuous Long-
term Medium Low
Project contribution to cumulative pressures on surface water resources and Cumulative impact of water withdrawal on the NSR
Negative Regional Medium Long-term Continuous Long-term High Medium
6.10 Literature Cited Alberta Environment (AENV). 2000. Code of Practice (COP) for Watercourse Crossing.
Edmonton, AB.
AMEC Earth and Environmental. 2007. Current and Future Water Use In Alberta. Draft. Prepared for Alberta Environment. Edmonton, AB.
American Society of Civil Engineers (ASCE). 2006. Climate Variations, Climate Change, and Water Resources Engineering. American Society of Civil Engineers. Reston, VA.
Case, R. A. and G.M. MacDonald. 1995. A Dendroclimatic Reconstruction Annual Precipitation on the Western Canadian Prairies since A.D. 1505 from Pinus flexilis James. Quaternary Research 44, 267-275 (1995).
Environment Canada. 2004a. Meteorological Service of Canada (MSC) Climate Data. Calgary, AB.
Environment Canada. 2004b. Water Survey of Canada (WSC) Streamflow, Water Level and Sediment Concentration Data. Calgary, AB.

6-31 December 2007 North American Upgrader Project Volume 3, Section 6 - Hydrology
NORTH AMERICAN OIL SANDS CORPORATION
Filion, Yves. 2000. Climate Change: Implications for Canadian Water Resources and Hydropower Production. Canadian Water Resources Journal. Vol. 25 No. 3, pg 255-269.
Fisheries and Oceans Canada (DFO). 1995. Freshwater Intake End-of-Pipe Fish Screen Guideline. Catalogue No. Fs 23-270 / 1995E. Ottawa, ON.
George, Scott St. and D. Sauchyn. 2006. Paleoenvironmental Perspectives on Drought in Western Canada – Introduction. Canadian Water Resources Journal. Vol. 31, No. 5 pg. 197-206.
Hennessy, R.J., Gregory, J.M. and J.F.B. Mitchell. 1997. Changes in Daily Precipitation Under Enhanced Greenhouse Conditions. Climate Dynamics, 13:667-680.
Herrington, R., Johnson, B. and F. Hunter. 1997. Responding to Global Climate Change in the Prairies: Volume III of the Canada Country Study: Climate Impacts and Adaptation. Environment Canada. October 1997
McGuffie, K., Henderson-Sellers, A., Holbrook, N., Kothavala, Z., Balchova, O. and J. Hoekstra. 1999. Assessing Simulations of Daily Temperature and Precipitation Variability with Global Climate Models for Present and Enhanced Greenhouse Climates. International Journal of Climatology, 19:1-26.
Morrision Hershfield Ltd. 2007. Alberta Industrial Heartland Process Water Feasibility Study – Draft. Prepared for Strathcona County and Sturgeon County.
North West Upgrading Inc. 2006. North West Upgrader Project: Integrated Application for Approval. Submitted to Alberta Environment and the Alberta Energy and Utilities Board. January 2006.
Petro-Canada Oil Sands Inc. (PCOSI). 2006. Application for Approval of the Sturgeon Upgrader. Submitted to the Alberta Energy and Utilities Board and Alberta Environment. Submitted by Petro-Canada Oil Sands Inc. on behalf of Fort Hills Oil Sands L.P. December 2006.
Pietroniro, A. 2006. Climate Change Modelling and Predictions Regarding Water Budget in the Prairies. Canadian Water Resources Association. Alberta Branch 2006 Conference.
Pietroniro A. and M.N. Nemuth. 2006. Current and Future Trends to Runoff in the Saskatchewan River Basin. Presentation at Canadian Water Resources Association Climate Change Conference. Edmonton, AB. April 2006.
Rood, Stewart. 2006. Flowing to the Future: Declining Streamflows of Alberta’s Rocky Mountain Rivers. Canadian Water Resources Association. Alberta Branch 2006 Conference.
Seneca Michael. 2004. Trends in Historical Annual Flows for Major Rivers in Alberta. AENV. Edmonton, AB.
Shaw J. and R. Kellerhalls. 1982. The Composition of Recent Alluvial Gravel in Alberta River Beds. Alberta Research Council. Bulletin 41.
Shell Canada Limited. 2007. Application for Approval of the Shell Scotford Upgrader 2 Project. Submitted to EUB and AENV. July 2007.
Stantec Consulting Ltd. 2005. Alberta Environment Naturalized flow Study, North Saskatchewan River, Alberta. Prepared for AENV.

6-32 December 2007 North American Upgrader Project Volume 3, Section 6 - Hydrology
NORTH AMERICAN OIL SANDS CORPORATION
Stewart Robert E. and H.A. Kantrud. 1971. Classification of Natural Ponds and Lakes in the Glaciated Prairie Region. Resource Publication 92, Bureau of Sport Fisheries and Wildlife. US Fish and Wildlife Service. Washington, DC.
Synenco Energy Inc. (Synenco). 2006. Application for Approval of the Northern Lights Upgrader Project. Submitted to Alberta Environment and Alberta Energy and Utilities Board. September 2006.
Toyra J., Pietroniro A. and B. Bonsal. 2005. Evaluation of GCM Simulated Climate over the Canadian Prairie Provinces. Canadian Water Resources Journal. Vol. 30, No 5 pg 245-262.
6.10.1 Websites Referenced
Environment Canada - Climate Change Scenarios Network. http://www.ccsn.ca/I-and-A/canada/scattergrams/intro2-e.html
Environment Canada - Water Survey of Canada Archived Database. http://www.wsc.ec.gc.ca/hydat/H2O/index_e.cfm?cname=main_e.cfm
7-i December 2007 North American Upgrader Project Volume 3, Section 7 – Surface Water Quality
NORTH AMERICAN OIL SANDS CORPORATION
TABLE OF CONTENTS
7 SURFACE WATER QUALITY......................................................................................................7-1 7.1 Introduction ......................................................................................................................7-1 7.2 Spatial Boundaries...........................................................................................................7-1
7.2.1 Local Study Area.................................................................................................7-2 7.2.2 Regional Study Areas .........................................................................................7-2
7.3 Temporal Boundaries.......................................................................................................7-6 7.4 Issues and Assessment Criteria ......................................................................................7-6
7.4.1 Effects Criteria.....................................................................................................7-7 7.5 Methods ...........................................................................................................................7-9
7.5.1 Data Sources for Historic Data Review ..............................................................7-9 7.5.2 Field Program......................................................................................................7-9 7.5.3 Assessment Methodology.................................................................................7-11
7.6 Existing Conditions.........................................................................................................7-15 7.6.1 Description of Waterbodies and Watercourses within the LSA ........................7-15 7.6.2 Description of Waterbodies/Watercourses in the Regional Study Area ...........7-17 7.6.3 Description of Lakes within the Acidification RSA ............................................7-18 7.6.4 Historic and Current Water Quality of the North Saskatchewan River .............7-18 7.6.5 Historic Water and Sediment Quality Data of Other Watercourses in the
LSA and RSA....................................................................................................7-31 7.7 Impact Assessment and Mitigative Measures ...............................................................7-40
7.7.1 Erosion and Sediment Control During Construction .........................................7-40 7.7.2 Dewatering During Construction.......................................................................7-41 7.7.3 Dewatering During Operations..........................................................................7-41 7.7.4 Wastewater Treatment and Discharge .............................................................7-42 7.7.5 Effects of Treated Effluent Discharge on the Local Study Area .......................7-44 7.7.6 Effects of Effluent Discharge on the Regional Study Area ...............................7-51 7.7.7 Effects of Acidic Emissions on Surface Water Quality in the RSA ...................7-66
7.8 Cumulative Effects Assessment ....................................................................................7-69 7.8.1 Erosion and Sediment Control ..........................................................................7-69 7.8.2 Dewatering ........................................................................................................7-69 7.8.3 Effects of Effluent Discharge on the LSA and RSA ..........................................7-69 7.8.4 Surface Water Runoff .......................................................................................7-69 7.8.5 Spills..................................................................................................................7-69 7.8.6 Acidification of Regional Lakes .........................................................................7-69
7.9 Follow-up and Monitoring...............................................................................................7-69 7.10 Impact Summary ............................................................................................................7-69 7.11 Literature Cited...............................................................................................................7-72
7.11.1 Websites Referenced........................................................................................7-74
TABLES
Table 7.4-1 Potential Water Quality Issues Associated with the Project ............................................7-6 Table 7.4-2 Alberta and Canadian Water Quality Guidelines (mg/L except as noted) .......................7-8 Table 7.5-1 Location of Primary Field Sampling Sites ......................................................................7-10 Table 7.5-2 Location of Additional Lakes Sampled for Assessing PAI .............................................7-11 Table 7.5-3 Predicted Chemical Properties of the Effluent Discharged to the NSR.........................7-12 Table 7.6-1 Routine Water Quality Parameters in the NSR at Pakan (1982-2006)..........................7-23 Table 7.6-2 Total Metals Concentrations in the North Saskatchewan River at Pakan (1982-
2006) ..............................................................................................................................7-24

7-ii December 2007 North American Upgrader Project Volume 3, Section 7 – Surface Water Quality
NORTH AMERICAN OIL SANDS CORPORATION
Table 7.6-3 Comparison of Selected Parameters in the NSR Upstream of the Sturgeon River during Rain Events and Dry Conditions.........................................................................7-24
Table 7.6-4 Routine Water Quality Parameters at Vinca Bridge, Pakan and NSR1.........................7-26 Table 7.6-5 Total Metals Concentrations at Vinca Bridge, Pakan and NSR1...................................7-27 Table 7.6-6 Water Quality in Beaverhill Creek – Routine Parameters..............................................7-32 Table 7.6-7 Water Quality in Beaverhill Creek – Total Metals ..........................................................7-33 Table 7.6-8 Water Quality of Lakes in the LSA and RSA – Routine Parameters .............................7-34 Table 7.6-9 Water Quality of Lakes in the LSA and RSA – Total Metals..........................................7-35 Table 7.6-10 Total Metals in Sediments Collected During the 2006-2007 Field Program..................7-37 Table 7.6-11 Total Petroleum Hydrocarbons in Sediments Collected During the 2006-2007
Field Program.................................................................................................................7-38 Table 7.6-12 PAHs in Sediment Collected During the 2006-2007 Field Program ..............................7-39 Table 7.7-1 CORMIX Modelling Parameters.....................................................................................7-45 Table 7.7-2 Characteristics of the Effluent Plume under 7Q10 and Average Flow Conditions..........7-46 Table 7.7-3 Concentrations of Chemical Variables in the North Saskatchewan River
Downstream of the Proposed Wastewater Outfall Predicted from the CORMIX Model Under 7Q10 Flow Conditions ...............................................................................7-48
Table 7.7-4 Existing/Approved and Planned Dischargers to the North Saskatchewan River ..........7-52 Table 7.7-5 Loading Analysis of Point Sources on the NSR within the Regional Study Area –
Application Case ............................................................................................................7-54 Table 7.7-6 Loading Analysis of Point Sources on the NSR within the Regional Study Area –
Cumulative Case............................................................................................................7-55 Table 7.7-7 Lake Chemistry, Hydrology and Potential Acid Input to Eight Regional Study
Lakes..............................................................................................................................7-68 Table 7.10-1 Summary of Residual Effects for Surface Water Quality ...............................................7-71
FIGURES
Figure 7.2-1 Local Study Area and Field Sampling Sites for the North American Upgrader Project ..............................................................................................................................7-3
Figure 7.2-2 The Regional Study Area for Issues Related to Process Water Discharge.....................7-4 Figure 7.2-3 The PAI Regional Study for North American Upgrader Project.......................................7-5 Figure 7.6-1 Temporal Variability of Water Chemistry in the NSR at Pakan (1999-2006).................7-28 Figure 7.6-2 Temporal Variability of Total Trace Metals in the NSR at Pakan (1999-2006)..............7-30 Figure 7.7-1 Percent Effluent Concentration and Temperature Differential in the Centreline of
the Plume versus Downstream Distance for 7Q10 Flow Conditions ..............................7-50 Figure 7.7-2 Predicted Concentrations of Chloride Along the North Saskatchewan River for
the Baseline Case..........................................................................................................7-58 Figure 7.7-3 Predicted Concentrations of Chloride Along the North Saskatchewan River for
the Application Case ......................................................................................................7-58 Figure 7.7-4 Predicted Concentrations of Chloride Along the North Saskatchewan River Near
the Project for the Application Case (Close-up View)....................................................7-59 Figure 7.7-5 Predicted Concentrations of Chloride Along the North Saskatchewan River for
the Cumulative Case......................................................................................................7-59 Figure 7.7-6 Average Concentration of Chloride Along the North Saskatchewan River
Downstream of Gold Bar WWTP ...................................................................................7-60 Figure 7.7-7 Predicted Concentrations of COD Along the North Saskatchewan River for the
Baseline Case ................................................................................................................7-61 Figure 7.7-8 Predicted Concentrations of COD Along the North Saskatchewan River for the
Application Case ............................................................................................................7-61 Figure 7.7-9 Predicted Concentration of COD Along the North Saskatchewan River Near the
Project for the Application Case (Close-up View)..........................................................7-62

7-iii December 2007 North American Upgrader Project Volume 3, Section 7 – Surface Water Quality
NORTH AMERICAN OIL SANDS CORPORATION
Figure 7.7-10 Predicted Concentrations of COD Along the North Saskatchewan River for the Cumulative Case............................................................................................................7-62
Figure 7.7-11 Average Concentration of COD in the North Saskatchewan River Downstream of Gold Bar WWTP.............................................................................................................7-63
APPENDICES
Appendix 7A Field Water Quality Data Appendix 7B Volatile Hydrocarbons and Polycyclic Aromatic Hydrocarbons in Field Samples Appendix 7C Results of CORMIX Modeling – 7Q10 Flow Appendix 7D WASP Results

7-1 December 2007 North American Upgrader Project Volume 3, Section 7 – Surface Water Quality
NORTH AMERICAN OIL SANDS CORPORATION
7 SURFACE WATER QUALITY 7.1 Introduction
The following sections provide a description of the existing water quality conditions of the creeks, rivers and lakes within the North American Upgrader Project area, and identify potential changes to surface water quality associated with the Project. Mitigative measures to minimize potential environmental effects are presented and residual effects are assessed. In particular, the surface water quality component of the Environmental Impact Assessment (EIA) will address the Terms of Reference (TOR) (Volume 1, Appendix A). These include discussion of:
• water quality characteristics in surface waterbodies within the study areas, their seasonal variation, relationships to flow and other controlling factors and a summary of existing water quality data, including surveys conducted to characterize the water quality;
• the potential Project-related and cumulative impacts of acidifying and other air emissions on surface water quality in the local and regional waterbodies;
• the potential effects of site runoff on water quality in surface waterbodies within the study areas;
• the potential impacts on surface water quality within the study areas due to the change in groundwater movement;
• the potential impacts on surface water quality within the study areas due to spills;
• mitigation plans to minimize these potential effects throughout the Project life;
• a plan and implementation program for the protection of surface water quality, addressing the following:
o monitoring program for early detection of potential contamination and assistance in remediation planning; and
o remedial options to be considered for implementation in the event that adverse effects are detected;
• the relative contribution of the Project (after mitigation) to regional cumulative effects on surface water quality; and
• the significant and potential impacts on surface water quality within the study areas resulting from the Project, including site runoff and Project-related wastewater discharges, that may indicate a potential adverse effect or exceedance of the Surface Water Quality Guidelines for Use in Alberta (AENV, 1999) or Canadian Water Quality Guidelines (CCME, 1999-2006 update).
7.2 Spatial Boundaries Three study areas were selected to document water quality conditions and assess the potential effects of the Project on both the local and regional level. These are shown in Figures 7.2-1 to 7.2-3, and are described in Section 7.2.1 and 7.2.2.

7-2 December 2007 North American Upgrader Project Volume 3, Section 7 – Surface Water Quality
NORTH AMERICAN OIL SANDS CORPORATION
7.2.1 Local Study Area
The LSA includes waterbodies and watercourses located within the proposed Project development area, which may be directly or indirectly affected by the Project. The Local Study Area (LSA) (Figure 7.2-1) for the surface water assessment includes the Upgrader site, the catchment basin for Astotin Creek and the catchment basin of an unnamed tributary flowing into Beaverhill Creek. The north end of the LSA follows the North Saskatchewan River (NSR) and includes the proposed locations of the water intake, pump house, outfall and a portion of the NSR within the effluent plume of the proposed effluent outfall (an approximately 5 km stretch downstream of the outfall). A north-central portion of the LSA borders on Beaverhill Creek. This LSA is consistent with that used for the Hydrology and Fish and Fish Habitat assessments (Volume 3, Sections 6 and 8, respectively).
7.2.2 Regional Study Areas
The Regional Study Area (RSA) was selected to identify potential effects of the Project on regional surface water quality associated with changes in flows, runoff, treated effluent discharge and aerial deposition of acidifying substances. In addition, it defines the study area where the cumulative effects assessment will be focused.
Two RSAs are defined. For most surface water issues, the RSA consists of the LSA and a length of the NSR within which the cumulative effects of treated process water discharge to the NSR would likely be measurable. The RSA extends along the NSR from the discharge of the Gold Bar Wastewater Treatment Plant (WWTP) to the confluence with the Redwater River (Figure 7.2-2).
A second RSA, the acidification RSA, for the issue of potential lake acidification from airborne emissions, is defined as that area within the 0.17 keq H+/ha/y isopleth for the PAI determined for the Cumulative Case by air emissions modelling. This isopleth corresponds to a level of acid input where monitoring and further study are called for (AENV-CASA, 1999; Foster et al., 2001). Because the PAI is largely dominated by the contributions from the City of Edmonton, the analysis in this assessment is concentrated on the eastern portion of the acidification RSA, where the potential effects of the Project would be most apparent (Figure 7.2-3).


7-6 December 2007 North American Upgrader Project Volume 3, Section 7 – Surface Water Quality
NORTH AMERICAN OIL SANDS CORPORATION
7.3 Temporal Boundaries The temporal scope of the EIA reflects the timing and nature of the Project phases, as well as information available on other proposed projects. Project and cumulative effects are assessed for the construction, operations, decommissioning and reclamation and closure phases of the Project. The Project schedule is outlined in Volume 1, Section 1.4.
To establish a baseline timeframe, background conditions were assumed to be those that existed as of May 1, 2007, and include both unpublished data and published data that were readily available.
For this EIA, existing projects are defined as those that have been approved by the EUB and/or AENV. Planned developments include projects that have been publicly disclosed (but not approved) as of May 1, 2007. The projects and developments included within the scope of this assessment are listed in Volume 2, Section 1.
7.4 Issues and Assessment Criteria Potential water quality issues associated with the Project were identified based on the final TOR prepared by Alberta Environment (AENV) (Volume 1, Appendix A), public input and the professional judgment of the author. Key water quality issues are presented in Table 7.4-1.
Table 7.4-1 Potential Water Quality Issues Associated with the Project
Project Phase Issue Comment Sediment release to waterbodies
Land clearing, road construction and plant construction could potentially increase sediment in runoff to local waterbodies.
Construction
Changes in surface water quality from dewatering
Construction activities involving excavations could lower shallow water tables and indirectly result in water quality changes in local waterbodies.
Changes in surface water quality from groundwater suppression
Permanent groundwater suppression under stormwater ponds for liner protection could lower shallow water tables and indirectly result in water quality changes in local waterbodies (see construction impacts above).
Changes in the water quality of the NSR from release of treated effluent
Discharge of treated process waters could adversely affect the water quality of the NSR.
Changes in water quality in local waterbodies from the release of stormwater runoff
Release of stormwater runoff from storage ponds could affect the water quality of local waterbodies.
Changes in water quality in local waterbodies from spills
Spills could affect the water quality of local waterbodies.
Operations
Acidification of local and regional lakes
Increased levels of acidifying air emissions (e.g., nitrogen oxides and sulphur dioxide) from the Upgrader could result in acidification of regional lakes.

7-7 December 2007 North American Upgrader Project Volume 3, Section 7 – Surface Water Quality
NORTH AMERICAN OIL SANDS CORPORATION
7.4.1 Effects Criteria
Residual effects from all water quality issues will be predicted after application of mitigative measures. For most water quality issues, the assessment is based on comparisons between predicted concentrations of specific parameters and published water quality guidelines. These include the Alberta Surface Water Quality Guidelines (ASWQG) and the guidelines published by the Canada Council of Ministers of the Environment (CCME). These water quality guidelines are presented in Table 7.4-2. Consistent with policies outlined in the Canadian Environmental Assessment Act Responsible Authorities Guide (FEARO, 1994), Project-specific effects and cumulative effects will be assessed as outlined in Volume 2, Section 1, except for extent and magnitude.
Extent describes the area within which the effect occurs. It is classified as subregional (one watershed or natural subregion), regional (within the RSA) or extra-regional (effects extend beyond the RSA) effect.
Magnitude describes the size and severity of the effect. Magnitude is classified as negligible (no discernible contribution), low (within acceptable protective standards and/or causes no detectable change to the resource), medium (within acceptable protective standards and/or causes a detectable change to the resource) or high (exceeds protective standards and/or causes a detectable change to the resource beyond the range of tolerance). For surface waters, “protective standards” are assumed to be the applicable water and sediment quality guidelines published by AENV or the CCME. The relevant guidelines are presented with each data summary.
Conclusions for the project effects criteria are based on qualitative and quantitative assessments. Quantitative assessments include the results of measurable predictions or objective comparisons of residual project impacts with established limits (e.g., water quality guidelines, ambient air quality guidelines, environmental objectives, etc.) Qualitative assessments are subjective and take into account professional judgment. This is important when environmental objectives are not available or quantitative predictions are not feasible.
The integration of the various impact ratings results in a final impact rating of no impact, negligible impact, low impact, medium impact or high impact for each potential project effect.

7-8 December 2007 North American Upgrader Project Volume 3, Section 7 – Surface Water Quality
NORTH AMERICAN OIL SANDS CORPORATION
Table 7.4-2 Alberta and Canadian Water Quality Guidelines (mg/L except as noted)
Parameter Alberta Fresh Water
Aquatic Life (Acute)
Alberta Fresh Water
Aquatic Life (Chronic)
CCME Guidelines for Protection of Aquatic Life
CCME Protection of Agricultural Water
Uses2
CCME Recreational
Water Quality
Guidelines Routine Parameters Total Dissolved Solids
500-3,500
Total Suspended Solids
<10 mg/L over background value
Clear flow: maximum increase of 25 mg/L for <24 h or 5 mg/L for 1-30 d High flow: maximum increase of 25 mg/L when background between 25 mg/L and 250 mg/L, 10% increase when background is >250 mg/L
Temperature (oC) Change of 3oC Temperature: changes should not alter thermal stratification, exceed maximum weekly average temperature, or exceed short–term exposures to maximum temperature
pH (pH units) 5.0 (1 day) 6.5-8.5 6.5-9.0 5.0-9.0 Dissolved Oxygen 5-6.5 5.5 -9.5 Major Ions Sodium Calcium 100 Chloride 100-700 Sulphate 1,000 (livestock) Fluoride 1.00-2.00 Bacteria E. coli 200/100 mL Fecal Coliforms 100 per 100 mL Total Metals Aluminum 0.1 5 Antimony Arsenic 0.005 0.1/0.025 Barium Beryllium 0.1/0.1 Boron 0.5-6.0 Cadmium 0.000047-0.000054 0.0051/0.080 Chromium 0.0089 0.0049/0.050 Cobalt 0.050/1.00 Copper 0.024 0.007 0.002-0.004 0.200-1.00/0.5-5.00 Iron 0.3 5.00 Lead 0.001-0.007 0.200/0.100 Lithium 2.50 Manganese 0.20 (irrigation only) Mercury (total) 0.000013 0.000005 0.0001 0.003 (livestock only) Molybdenum 0.073 0.010-0.050 Nickel 0.11 0.200/1.00 Selenium 0.001 100 (livestock only) Silver 0.0001 Uranium 0.010/0.200 Vanadium 0.100/0.100 Zinc 0.03 1.0-5.0/50.0 Notes: Blank cells indicate no guideline. Sources of information: (AENV, 1999; CCME, 1999-2006 update). 1 Aesthetic objective. 2 Slash indicates difference between irrigation guideline (first number) and livestock guideline (second number).

7-9 December 2007 North American Upgrader Project Volume 3, Section 7 – Surface Water Quality
NORTH AMERICAN OIL SANDS CORPORATION
7.5 Methods
7.5.1 Data Sources for Historic Data Review
Baseline water quality data from the NSR were derived from AENV’s water quality database. Data from the following stations were analyzed:
• AENV Station 00AL05EC0005 at Pakan, Alberta; and
• AENV Station 00AL05EB2500 at Vinca Bridge, immediately upstream of the confluence of the NSR and the Redwater River and near the site of the proposed water intake and outfall. The Vinca Bridge station is located within the LSA (Figure 7.2-1).
The Pakan station is part of AENV’s Long-Term Monitoring River Network (AENV, 2002a), and is located approximately 54 km downstream of the Project. Data from the Pakan station included the examination of seasonal and flow-related trends in water quality parameters. There were insufficient data available for the Vinca Bridge station to examine these trends.
Analysis of the water quality data from the AENV database involved calculating maximum, minimum, mean and median values. Because of changes in methods and detection limits over the years, only data since 1982 were considered. To calculate statistics on data containing parameters below detection limits, non-detectable values were assumed to be one-half the detection limit. Outlying values for each parameter were identified for the Fort Saskatchewan and Vinca Bridge stations as values greater than the 95th percentile. Over 25 years of monitoring data at the Pakan station were plotted and examined for seasonal trends. Since 2005, improvements in municipal wastewater treatment have resulted in decreases in the median concentrations of certain parameters, including total phosphorus and ammonia. Using the full range of the data in the assessment of Project effects on these parameters makes the assessment more conservative and protective of water quality in the NSR.
Water quality data from recent studies conducted during 2003 and 2004 by the City of Edmonton from the NSR upstream of the confluence with the Sturgeon River were also reviewed (Focus, 2004; 2005). AENV water quality data from 1975 to 1990 from Beaverhill Creek near the confluence with the NSR (AENV Station AB05EB0900) were reviewed. These were the only data available for this waterbody.
7.5.2 Field Program
The field program was designed to characterize water quality in waterbodies and watercourses on and near the Project area. Sampling sites were selected to collect baseline data for locations that may be influenced by potential downstream effects from the Project. These included the transportation of potential contaminants through watercourses or downwind aerial deposition of contaminants in waterbodies.
The field program consisted of four trips to the Project area during 2006 and 2007 to collect water samples during all four seasons. The surface water sampling sites generally correspond to sites assessed in the Fish and Fish Habitat study (Volume 3, Section 8). The site coordinates and sampling dates are summarized in Table 7.5-1. The location of each sampling site, including samples taken as part of the Project water-sampling program and historic data-sampling locations, with the exception of Pakan, are shown in Figure 7.2-1.
Industry standard water quality sampling protocols were followed when handling samples to avoid damage/breakage or contamination (RAMP, 1999; AENV, 2002b). In situ field water quality parameters were measured using a multimeter that was calibrated daily. Field parameters

7-10 December 2007 North American Upgrader Project Volume 3, Section 7 – Surface Water Quality
NORTH AMERICAN OIL SANDS CORPORATION
included water temperature, electrical conductivity (EC), pH and dissolved oxygen (DO). Grab samples were collected for laboratory analysis. Samples collected in watercourses were obtained just below the water surface when open water was encountered, and below the ice during the winter. Water samples from lakes were collected at the mid-depth of the deepest location, using a Van Dorn sampler. Sediment samples were taken with a Ponar or Eckman dredge sampler from the upper 0 cm to 15 cm of sediment.
The water samples from each location were analyzed for the following parameters:
• Routine parameters: EC, pH, total dissolved solids (TDS), major cations (sodium, potassium, calcium, magnesium), major anions (chloride, sulphate, carbonate/bicarbonate), total suspended solids (TSS), alkalinity, hardness;
• Nutrients: nitrate, nitrite, total Kjeldahl nitrogen (TKN), ammonia, total phosphorus (TP);
• Total and dissolved metals: aluminum (Al), antimony (Sb), arsenic (As), barium (Ba), beryllium (Be), boron (B), cadmium (Cd), chromium (Cr), cobalt (Co), copper (Cu), iron (Fe), lead (Pb), lithium (Li), magnesium (Mg), manganese (Mn), mercury (Hg), molybdenum (Mo), nickel (Ni), selenium (Se), silicon (Si), silver (Ag), strontium (Sr), thallium (Tl), titanium(Ti), uranium (U), vanadium (V) and zinc (Zn);
• Organics: phenols, total volatile hydrocarbons (F1+BTEX, F2) and polycyclic aromatic hydrocarbons (PAHs). PAHs include naphthalene, acenaphthylene, acenaphthene, fluorene, phenanthrene, anthracene, acridine, fluoranthene, pyrene, benz[a]anthracene, chrysene, benzo[b]fluoranthene, benzo[k]fluoranthene, benzo[a]pyrene (b(a)p), indeno[1,2,3-cd]pyrene, dibenz[a,h]anthracene, benzo[g,h,i]perylene, CCME B(a)P calculated equivalent.
The sediment samples were analyzed for total metals, petroleum hydrocarbons (BTEX, F1-F4 fractions) and PAHs. The water and sediment samples were sent to an accredited laboratory for analysis. Mercury samples were sent to a specialized laboratory capable of achieving lower detection limits. The laboratory results are presented in Appendix 7A.
Table 7.5-1 Location of Primary Field Sampling Sites
UTM (NAD 83, Zone 12) Station Designation Sampling Date Easting Northing Description
AC1
Aug 28, 2006 Oct 24, 2006 Jan 23, 2007 May 1, 2007
371701 5972559 Beaverhill Creek at mouth
AC2
Aug 28, 2006 Oct 23, 2006 Jan 23, 2007 Apr 30, 2007
363312 5960108 Astotin Creek upstream station in road ditch
AC3
Aug 29, 2006 Oct 23, 2006 Jan 23, 2007 Apr 30, 2007
368300 5965864 Astotin Creek downstream
NSR1
Aug 30, 2006 Oct 24, 2006 Jan 23, 2007 May 3, 2007
372727 5974369
NSR downstream of confluence with Redwater River and Beaverhill Creek

7-11 December 2007 North American Upgrader Project Volume 3, Section 7 – Surface Water Quality
NORTH AMERICAN OIL SANDS CORPORATION
UTM (NAD 83, Zone 12) Station Designation Sampling Date Easting Northing Description
Astotin Lake
Aug 29, 2006 Oct 24, 2006 Jan 24, 2007 May 2, 2007
377690 5950025
in Elk Island National Park
Antler Lake
Aug 29, 2006 Oct 24, 2006 Jan 24, 2007 May 1, 2007
368476 5929118 south of Elk Island National Park
In order to address predicted PAI from Project emissions on regional lakes, six lakes in and near Elk Island National Park were sampled once in the spring (May 1 to May 3, 2007). The locations of these lakes are indicated in Table 7.5-2 and Figure 7.2-3. Lakes were sampled near shore by wading out to a point that was as deep as was feasible. The lakes were not accessible by boat at the time of sampling. Field measurements of dissolved oxygen, pH, EC and temperature were taken with a calibrated multimeter. Water samples were collected and analyzed for routine parameters, nutrients and metals.
Table 7.5-2 Location of Additional Lakes Sampled for Assessing PAI
Lake Date Sampled Location (NAD 83, Zone 12) Easting Northing Tawayik May 1, 2007 376218 5942099 Oster May 2, 2007 372791 5943855 Adamson May 2, 2007 372906 5942813 Hasting May 2, 2007 371987 5921185 Wanisan May 2, 2007 372081 5925512 Cooking May 3, 2007 370456 5925505
7.5.3 Assessment Methodology
7.5.3.1 Effects of Increase in Sediment Release, Dewatering and Release of Stormwater Runoff
Professional judgment and experience with similar projects were used to assess the potential effects of:
• sediment release during construction;
• dewatering during construction; and
• release of stormwater runoff during operations.
Most of these potential issues are resolved through the appropriate application of standard mitigative measures applied to all current and approved projects.
7.5.3.2 Release of Treated Effluent to the North Saskatchewan River
The effects of the discharge of treated process waters on the NSR were examined in both the LSA and the RSA in the Application Case and Cumulative Case. Concentrations and loadings (kg/d) were calculated for both the average annual and peak summer conditions at 243,000 bpsd with Gasification 1. The peak summer loadings presented in Table 7.5-3 represents the worst-

7-12 December 2007 North American Upgrader Project Volume 3, Section 7 – Surface Water Quality
NORTH AMERICAN OIL SANDS CORPORATION
case loading scenario used in the assessment. Development beyond 243,000 bpsd with Gasification 1 will incorporate zero liquid discharge technologies (ZLD) for treatment of all waste streams, which will eliminate loadings to the NSR under normal Upgrader operation. Notable loadings are evident for reduced forms of nitrogen (TKN in particular), chemical oxygen demand (COD) and major ions, including sodium and chloride. The latter parameters contribute to a measurable loading of TDS. Analyses were completed both for the effects of discharge of treated process waters on the LSA and the RSA (cumulative effects).
Table 7.5-3 Predicted Chemical Properties of the Effluent Discharged to the NSR
Parameter Units Average Annual Concentration
Average Annual Loading (kg/d)
Peak Summer Concentration
Peak Summer Loading (kg/d)
Flow m³/h 1791 - 319 - Flow m³/d 4,306 - 7,644 - TDS mg/L 1,580 6,803 1,558 11,908 TSS mg/L 35 151 37 279 Oil and Grease (O&G)
mg/L 0.0 0 0.0 0
Biological Oxygen Demand (BOD)
mg/L 33.0 142 43.5 332
Chemical Oxygen Demand (COD
mg/L 220 947 257 1,961
Total Organic Carbon (TOC)
mg/L 37.0 159 49.8 381
Hardness1 mg/L 598 2,575 565 4,320 Alkalinity1 mg/L 481 2,071 473 3,614 Na+ mg/L 216 930 213.3 1,630 K+ mg/L 11.0 47 16.1 123 Ca2+ mg/L 159 685 150 1,144 Mg2+ mg/L 49.0 211 46.2 353 Fe3+ mg/L 2.0 8.6 1.5 11.6 Cl- mg/L 279 1,201 277.9 2,124 SO4
2- mg/L 184 792 162 1,235 HCO3
- mg/L 578 2,489 568 4,339 CO3
2- mg/L 4.0 17.2 4.2 32.0 OH- mg/L 0.1 0.564 0.1 0.724 SiO2 mg/L 39.0 168 41.3 316 NH3 mg/L 2.0 8.6 2.3 17.6 NO3 mg/L 9.0 38.8 10.4 79.8 TKN mg/L 48.0 207 64.9 496 Total P mg/L 1.0 4.31 0.5 3.54 Cyanides mg/L 0.0 0.084 0.1 0.488 Phenols mg/L 0.012 0.053 0.032 0.242 Sulphides mg/L 0.004 0.019 0.010 0.077 Aluminum mg/L - - 0.365 2.79 Antimony mg/L - - 0.00004 0.0003 Arsenic mg/L - - 0.0008 0.0061 Beryllium mg/L - - 0.0002 0.0015 Cadmium mg/L - - 0.0004 0.0031 Chromium mg/L - - 0.002 0.0153 Cobalt mg/L - - 0.0006 0.0046 Copper mg/L - - 0.005 0.0382 Iron mg/L - - 1.5 11.5 Lead mg/L - - 0.0045 0.0344 Mercury mg/L - - 0.00004 0.0003 Molybdenum mg/L - - 0.0055 0.0420

7-13 December 2007 North American Upgrader Project Volume 3, Section 7 – Surface Water Quality
NORTH AMERICAN OIL SANDS CORPORATION
Parameter Units Average Annual Concentration
Average Annual Loading (kg/d)
Peak Summer Concentration
Peak Summer Loading (kg/d)
Nickel mg/L - - 0.009 0.0688 Selenium mg/L - - 0.0002 0.0015 Titanium mg/L - - 0.0115 0.0879 Vanadium mg/L - - 0.004 0.0306 Zinc mg/L - - 0.04 0.306
Note:
1 Expressed as CaCO3.
Effects of Treated Effluent Discharge on the Local Study Area
The Cornell Mixing Zone Expert System (CORMIX) model was used to examine the dispersion of treated process water discharge and the effects of the discharge on NSR water quality in the LSA for the Application Case. The goal of the dispersion modelling was to predict the geometry and dilution characteristics of the mixing zone so that compliance with water quality regulatory guidelines could be judged. Mixing was examined in both the near-field and the far-field of the mixing zone. The near-field is that region of the effluent plume where dispersion is dominated by the forces of buoyancy and the original momentum of the discharge. The far-field is that region further downstream where mixing is dominated by horizontal buoyant spreading and turbulent mixing. AENV recommends CORMIX for detailed plume analysis of mixing zones in river areas containing sensitive features such as spawning grounds, drinking water intakes or overlapping plumes (AENV, 1995).
The data requirements for the CORMIX model include:
• the wastewater outfall type (submerged single port, multiport diffuser or surface discharge);
• the orientation, depth and configuration of the outfall in the river;
• the effluent flow and temperature;
• ambient water temperature and river flow; and
• bottom bathymetry at and downstream of the discharge (depth, width, bottom slope).
Effluent dispersion was modelled for average flow conditions and low flow (7Q10) conditions. The average flow conditions were assumed to be those at the mean annual flow of the NSR (196 m3/s). The 7Q10 flow represents the lowest stream flow for seven consecutive days that would be expected to occur once in ten years. The 7Q10 conditions (60 m3/s) represent the worst-case scenario where dilution would be at a minimum.
CORMIX assumes channelization of the river within the area of interest; that is, the reduction of the river to a channel of standard width and depth. Bathymetry profiles of the river, taken near the proposed water intake and outfall, were used for this purpose. The modelling parameters are summarized in Section 7.7.5.
Effects of Treated Effluent Discharge on the RSA
The effects of effluent discharge on the RSA were examined by two methods. The first method involved conducting a loading analysis for each parameter to the NSR from all known point

7-14 December 2007 North American Upgrader Project Volume 3, Section 7 – Surface Water Quality
NORTH AMERICAN OIL SANDS CORPORATION
sources (municipal and industrial), and calculating the relative contribution of the Project to the total loading of each parameter. The second method was using the Water Quality Analysis Simulation Program (WASP) version 7.2; (Wool et al., 2004) to assess the effects of the proposed effluent discharge on the NSR. The model was applied to two parameters having significant loadings, namely COD and chloride. Chloride represents the discharge of major ions and TDS.
The loading analysis involved the collection of available discharge data for the above parameters in the effluents of known dischargers in the RSA. When available, the loadings were calculated from the individual monitoring data reported by each facility to AENV or collected by AENV in on-site audits. Average values were calculated from the monitoring data and converted to daily loading rates. To calculate background (upstream) loadings in the NSR, concentrations of these parameters upstream of the Gold Bar WWTP were assumed to be the same as those reported at Dawson Bridge (Focus, 2005) in Edmonton during February, when low flow conditions prevailed. For parameters not included in the Focus (2005) report, background concentrations of the NSR were taken from AENV’s long-term monitoring station at Devon (AENV, 2002a). Background loadings in the NSR were calculated using the 7Q10 flow. The loading analysis involved summing the loadings of each parameter to the NSR and determining the relative contribution of the Project to the total loading of that parameter in the RSA.
The WASP model is a dynamic compartment modelling program for aquatic systems that allows the user to predict the water quality responses to natural phenomena and anthropogenic discharges. WASP uses mass balance equations to calculate chemical mass and concentration for defined river segments or reaches along the NSR. The user can specify modelling time steps, the duration of the simulation and the process-affected water loadings from the various facilities in each segment.
The WASP model was configured to simulate water quality within the NSR using 440 surface water segments along the modelled 60 km reach of the RSA. The model was run to predict steady-state conditions. Flows and chemical loadings were kept constant. The model was run under 7Q10 conditions (60.0 m3/s), representing a conservative dilution scenario. River hydraulic conditions were approximated using Leopold-Maddock coefficients developed for the NSR (Ray and Dykema, 1991). Dispersion coefficients were assumed constant across the channel at all locations, and a river temperature of 1ºC was applied.
The calibration procedures for the model match those used by an analogous facility, and consisted of adjusting lateral dispersion coefficients so that simulated dye concentrations matched the results of an earlier modelling study by Golder (1995). To verify the performance of the calibrated WASP model for the NSR, the model was applied to simulate recently measured water quality parameters in the NSR.
Effects of Acidifying Emissions on Regional Lakes
The acidification of lakes has been linked in Europe and in eastern North America to the deposition of acidifying emissions from industrial and municipal facilities. Oxides of sulphur and nitrogen (SOx and NOx) in these emissions result in the formation of acids that can reduce the acid-neutralization capacity of soils and surface waterbodies, and cause adverse effects on aquatic biota. Acidifying compounds will be emitted from the Upgrader throughout the entire operations phase of the Project.
The RSA for the acidification assessment includes all lands covered by the Cumulative Case 0.17 keq H+/ha/y PAI isopleth (Figure 7.2-3). A level of acid deposition equivalent to 0.17 keq H+/ha/y level triggers increased monitoring of potentially affected waterbodies for acidification (CASA–AENV, 1999; Foster et al., 2001).

7-15 December 2007 North American Upgrader Project Volume 3, Section 7 – Surface Water Quality
NORTH AMERICAN OIL SANDS CORPORATION
A critical load approach to determine the potential effects of acid deposition on regional lakes was recommended for Alberta in the late 1990s by the Target Loading Subgroup of the Clean Air Strategic Alliance (CASA) for median and long-term management of acidic emissions (AENV-CASA, 1999). The critical load of acidity (CL), in units of keq H+/ha/y, is defined as the highest rate of acidic deposition that will not cause adverse biological effects on a lake and its catchment, and is an inherent property of the lake (Nilsson and Grennfelt, 1988). Critical loads of acidity, calculated from steady-state models, have been applied extensively in Northern Europe, where detailed grid maps of lake sensitivity have been produced based on surveys of thousands of lakes (Posch et al., 1995, 1997, 1999; Rhim, 1995; Henriksen et al., 1992; Kamari et al., 1993). In these acidification studies, acid deposition was expressed as the PAI, defined as the total deposition of sulphur and nitrogen species in both wet and dry forms minus the base cations. The PAI, therefore, accounts for the contribution of both sulphate and nitrogen oxides to acid deposition (wet and dry), as well as the acid-neutralizing effects of base cations.
Following the European model, the Target Loading Subgroup of CASA set acid sensitivity grid cells for Alberta of one degree of latitude by one degree of longitude, with critical loads of 0.25 keq H+/ha/y, 0.50 keq H+/ha/y and 1.00 keq H+/ha/y for cells categorized as sensitive, moderately sensitive and of low sensitivity to acidic deposition. Target loads, the environmental management objectives, were similarly set at 0.22 keq H+/ha/y, 0.45 keq H+/ha/y and 0.90 keq H+/ha/y. Monitoring loads were set at 0.17 keq H+/ha/y, 0.35 keq H+/ha/y and 0.70 keq H+/ha/y, respectively. Exceedances of the PAI monitoring loads result in deposition monitoring and studies of receptor sensitivity (Foster et al., 2001; CASA-AENV, 1999).
In most assessments, the Henriksen steady-state model is applied to calculate critical loads for all lakes within the RSA for which water quality data are available. These lake-specific critical loads are then compared to the PAI at each lake modelled during the air quality assessment (Volume 2, Section 2). An exceedance of the critical load implies that the lake has a potential for acidification under this rate of PAI. However, it does not necessarily mean that acidification is a certainty, or that it could happen in the near future.
The Henriksen steady-state model could not be applied to the eight lakes in this study. The Henriksen model assumes that acid neutralizing capacity (ANC), in the form of base cations, is exported to each lake in surface runoff. The runoff, which is one of the terms of the model, is equivalent to the amount of water that would be measured at the lake outflow. Most of the lakes, however, do not have any outflow on a mean annual basis. Hence, there was no measurable runoff. In some cases, when surface evaporation is accounted for, the runoff is actually negative.
7.6 Existing Conditions The Project is located within the Beaverhill sub-basin of the NSR watershed (NSWA, 2005). This sub-basin is 440,544 ha, and is situated in the Boreal Forest and Parkland natural regions (Volume 4, Section 10). The Project area drains into Beaverhill Creek via Astotin Creek and an intermittent unnamed tributary stream.
7.6.1 Description of Waterbodies and Watercourses within the LSA
Waterbodies within the LSA (Figure 7.2-1) include:
• Astotin Creek;
• Beaverhill Creek.;
• an unnamed creek that flows into Beaverhill Creek;

7-16 December 2007 North American Upgrader Project Volume 3, Section 7 – Surface Water Quality
NORTH AMERICAN OIL SANDS CORPORATION
• a portion of the NSR;
• Astotin and Oster Lakes in Elk Island National Park; and
• several small sloughs/wetlands, some of which are within the lands owned by North American.
Two additional lakes, Antler and Adamson, are outside the LSA but are also described below.
Astotin Creek has a drainage area of approximately 200 km2. The creek flows in a northerly direction from Elk Island National Park, around the Upgrader site and then northeast to its confluence with Beaverhill Creek. Portions of Astotin Creek have been channelized as a result of the road ditching on Range Road 214. In this area, the creek is a stable, vegetated ditch approximately 0.5 m deep and 6 m wide. Further downstream the channel is 10 m wide by 1.6 m deep, and consists of sandy silt bed and bank material. Astotin Creek is not gauged, and its flows are regulated by the upstream lakes and wetlands in Elk Island National Park, including Astotin Lake.
Beaverhill Creek drains north and west, over a distance of approximately 57 km, ultimately emptying into the NSR. The creek has a gross drainage area of 2,930 km² and follows an irregular meander pattern, with an average channel width of approximately 11 m near its mouth. Flows on Beaverhill Creek are strongly affected by beaver activity. A large beaver dam (greater than 2 m in height) located approximately 600 m upstream from the NSR impeded the surface flow in the fall of 2006 through the winter 2007. By early May 2007, high runoff had washed out the beaver dam. At that time, Beaverhill Creek, near its mouth, had a wetted width of 8.5 m, a maximum depth of 0.89 m and a discharge of 1.25 m³/s. Channel substrate was composed of organic fines, with occasional areas of large cobble and boulder.
The northeast portion of the Upgrader site drains north into a small wetland complex that drains into an intermittent unnamed tributary of Beaverhill Creek. This unnamed creek has several intermittent tributaries that drain towards the north from the elevated area south of Bruderheim. The total drainage area of this creek at its mouth is approximately 64 km². A portion of the slope south of the CPR line, approximately 3 km² in area, drains under the rail line at the property. This surface water will be routed east towards Range Road 211.
Astotin, Oster and Adamson lakes are very shallow (1 m to 2 m maximum depth) and highly coloured. Astotin, the largest lake, has an area of 5.8 km2 and a drainage area of 52.2 km2. Astotin Lake is used extensively for recreational purposes. Oster Lake has an area of 1.1 km2
and a drainage area of 5.6 km2. Adamson Lake has an area of 0.43 km 2 and a drainage area of 4.3 km2.
The wetlands within the lands owned by North American are described in detail in the Vegetation and Wetlands section (Volume 4, Section 10). These wetlands were classified based on the categories given in Classification of Natural Ponds and Lakes in the Glaciated Prairie Region (Stewart and Kantrud, 1971). They range in size from 70 m to 300 m in diameter (0.4 ha to 7.0 ha in area) and include:
• Class IV Wetlands: these wetlands form a region to the north of the property that drains into the unnamed creek described above. In this EIA, these are collectively referred to as the North Wetland Complex;
• Class III Wetland: a seasonal pond located in the southwest portion of the property in NW 26-55-21 W4M that is intended to be drained and converted to a stormwater pond;

7-17 December 2007 North American Upgrader Project Volume 3, Section 7 – Surface Water Quality
NORTH AMERICAN OIL SANDS CORPORATION
• Class I/II Wetlands: these are ephemeral and temporary ponds and sloughs that are distributed throughout the Upgrader site area. Some of these ponds contribute to a wetland complex that drains across the Canadian National Railway (CNR) rail line on the south border of the Upgrader site and through an ephemeral draw towards the North Wetland Complex. This drainage will be diverted in ditches along Range Road 211; and
• Ephemeral Draws: these drainage paths are intermittently visible on aerial photographs of the Upgrader site. Surface flow within these draws may be limited to extreme snowmelt and storm events.
7.6.2 Description of Waterbodies/Watercourses in the Regional Study Area
Waterbodies in the RSA include those listed above in the LSA, as well as a section of the NSR from Gold Bar WWTP to a point 20 km downstream of the proposed outfall (Figure 7.2-2).
7.6.2.1 Description of the NSR
The NSR is located about 6.5 km northwest of the Upgrader site. The Sturgeon River is approximately 9 km upstream of the proposed intake structure, and the Redwater River is approximately 11 km downstream near Vinca Bridge (Highway 38). The NSR originates in the Columbia Icefield in Banff and Jasper National Parks, and is regulated by the Bighorn and Brazeau dams in its upper reaches. It flows eastward toward the Saskatchewan border, and has a mean annual discharge at the border that exceeds seven billion cubic metres. The NSR will serve as the main source of water for the Project, and will receive treated runoff and wastewater from the Upgrader during the early stages of the Project. As the Upgrader expands from Phase 1 towards the Project, ZLD treatment of targeted waste streams will be phased in. Eventually, the Project will incorporate ZLD treatment of all waste streams to eliminate effluent discharges to the NSR, and to maximize water recycle.
Many industrial and municipal facilities are located along the NSR and use the NSR for both water supply and effluent discharge. Industrial development in the vicinity of Fort Saskatchewan extends over 194 km2, from the City of Fort Saskatchewan to the confluence with Redwater River (Alberta’s Industrial Heartland website, 2007).
Ongoing monitoring of water quality on the NSR is conducted by AENV at the Devon and Pakan Long-term River Network (LTRN) sampling sites. The Devon site is located between the headwaters of the NSR and Edmonton. Upstream of Devon, the North Saskatchewan River Basin (NSRB) is sparsely populated and dominated by forestry and agricultural activities. In this area, point source inputs are limited to continuous and periodic municipal discharges and some periodic industrial discharges. The Pakan site is located approximately 55 km downstream of the proposed water intake structure near Victoria Settlement.
Flows have been recorded by Water Survey of Canada (WSC) on the NSR at Edmonton since 1912 (station number 05DF001) where the total basin area is approximately 28,000 km². This gauge site is located approximately 63 km upstream of the proposed intake site. Major inflows between the Edmonton station and the proposed intake site are the Sturgeon River, with a drainage area of 3,350 km² and a few minor tributaries that increase the total drainage area at the intake site to approximately 33,000 km². The mean annual flow of the NSR at Edmonton is 196 m3/s. The highest mean monthly flow occurs in July (359 m3/s), while the lowest mean monthly flow is observed in January (82.2 m3/s). The 7Q10 flow is calculated at 60 m3/s.

7-18 December 2007 North American Upgrader Project Volume 3, Section 7 – Surface Water Quality
NORTH AMERICAN OIL SANDS CORPORATION
7.6.3 Description of Lakes within the Acidification RSA
The RSA for the acidification issue (Figure 7.2-3) includes a large area encompassed by the 0.17 keq H+/ha/y isopleth for PAI. This isopleth represents a level of PAI where further monitoring is required (CASA-AENV, 1999). Most of the lakes in this region are small prairie sloughs, several hundred metres in diameter, surrounded by agricultural lands. These are usually high pH, hardwater lakes that are not particularly sensitive to acid deposition. These include Antler Lake, Cooking Lake, Big Island and Boag Lakes. Lakes for which water quality data were collected in the field studies include:
• Cooking Lake (area 42.9 km2);
• Antler Lake (area 2.4 km2);
• Astotin Lake (area 5.8 km2);
• Adamson Lake (area 0.42 km2);
• Wanison Lake (area 2.68 km2);
• Hastings Lake; (area 8.2 km2);
• Oster Lake (area 1.05 km2); and
• Tawayik Lake (area 3.79 km2).
Most of these lakes, in particular Cooking Lake, have considerable recreational value (e.g., for boating) for the region. Tawayik Lake, Oster Lake, Astotin Lake and Adamson Lake are located within Elk Island National Park.
7.6.4 Historic and Current Water Quality of the North Saskatchewan River
7.6.4.1 Review of Water Quality Studies on the North Saskatchewan River
Water quality in the NSR has been studied extensively over the last 20 years, primarily to document the effects of municipal and industrial discharges within the Edmonton–Fort Saskatchewan region. Water quality studies of the NSR near the Project include Anderson et al. (1986); Shaw et al. (1994); Golder (1995); Mitchell (1998); Focus (2004; 2005); Hebben (2005); Anderson (2005) and information collected as part of Alberta’s Water for Life Strategy (AENV, 2007). The results of these studies are summarized below:
• a distinct increase was identified in the concentrations of a number of water quality parameters downstream of Edmonton, including temperature, dissolved oxygen, biochemical and chemical oxygen demand, TSS, EC, DOC, total nitrogen, ammonia, nitrates, total phosphorus, sodium, potassium, chloride, sulphate and several trace metals (zinc, nickel, lead, manganese);
• loading estimates indicate that the main sources of the increases identified in the concentrations of water chemistry variables are the Edmonton WWTPs. Both planktonic and epilithic algae have been stimulated by the increased nutrient loads in this region and have increased markedly downstream. Bacterial forms increased immediately below the Gold Bar WWTP in Edmonton and remain at high levels downstream. The Gold Bar WWTP is the largest point source of contaminants. Compared to this source, the impact

7-19 December 2007 North American Upgrader Project Volume 3, Section 7 – Surface Water Quality
NORTH AMERICAN OIL SANDS CORPORATION
of industrial discharges on water quality has been low. However, increases in chromium, cobalt, nickel and zinc downstream of Edmonton are attributable to a variety of industrial discharges;
• seasonal patterns in water quality include peaks in suspended solids, metals and other related parameters during high-flow periods in spring. These parameters are lowest during low-flow periods in winter. In contrast, concentrations of many dissolved substances are highest during basal flow conditions in winter;
• the discharge of stormwater from Edmonton caused increases in EC, suspended solids, chemical oxygen demand, chromium, lead, nickel, nitrogen, phosphorus and fecal coliforms, that, in some cases, could be detected to the Saskatchewan boundary; and
• the NSR is poorly mixed downstream of Edmonton. Effluents from various sources in Edmonton are not mixed horizontally across the river for 100 km downstream.
Golder Associates Ltd. (1995) completed a joint industrial–municipal study of the NSR in which water quality was simulated using the WASP water quality model for a 60 km study area between Edmonton and the Redwater River under low-flow (7Q10) conditions. The simulations suggested that:
• An effluent plume of ammonia would be detectable 20 km downstream of the Gold Bar WWTP, with simulated ammonia concentrations exceeding water quality criteria for much of the length of the study reach. Smaller contributions from the Capital Region WWTP and the Sherritt’s Fort Saskatchewan Fertilizer and Metal Manufacturing Plant were barely discernable within the Gold Bar WWTP plume.
• Simulated total phosphorus (TP) would exceed the Alberta chronic water quality objective throughout most of the study reach.
• Of 13 metals simulated in the Golder study, none were predicted to approach water quality guidelines except for aluminum, high values of which are considered a natural phenomenon.
• Additive effects of various constituents could potentially be toxic to aquatic life for approximately 7 km below the Sherritt Fort Saskatchewan Fertilizer and Metal Manufacturing Plant and Dow Chemical’s Fort Saskatchewan Chemical Manufacturing Plant.
Studies by Focus in 2003 and 2004 (Focus, 2004; 2005) for the City of Edmonton examined differences in water quality in the NSR during high-flow and low-flow conditions. The findings were:
• During wet weather conditions (high flow after rain events) nutrients (especially phosphorus) and certain metals (aluminum, iron, copper, zinc, mercury, silver, lead) sometimes exceed ASWQ guidelines. Fewer exceedances were observed during dry weather conditions.
• Between 1994 and 2003, TP loading was almost halved, primarily due to improvements in municipal wastewater treatment technology.
• Downstream of wastewater treatment plants, increases in fecal coliform and total coliform counts of more than one order of magnitude were observed in both wet and dry conditions between 1996 and 2004.

7-20 December 2007 North American Upgrader Project Volume 3, Section 7 – Surface Water Quality
NORTH AMERICAN OIL SANDS CORPORATION
The following long-term changes were found to have occurred at Pakan and Devon between 1977 and 2002 (Hebben, 2005):
• Hardness, sodium, magnesium and sulphate have increased at both Devon and Pakan monitoring stations. The NSR at Pakan can be classified as eutrophic according to TP, and algal biomass and mesotrophic according to total nitrogen (TN).
• Total phosphorus (TP), total dissolved phosphorus (TDP), total nitrogen (TN) and total coliforms have decreased at Pakan. These reductions, and reductions in the frequency of guideline exceedances for these parameters, can be attributed to improved wastewater treatment technology.
• TP had the lowest compliance rates of all nutrients assessed at Pakan, followed by TN.
A report by Anderson (2005) examined the nature and extent of pesticide contamination in Alberta’s surface waters between 1995 and 2002. The study found that:
• Water quality with respect to pesticide concentrations was rated as “fair” at Pakan and “good” at Devon. All pesticides detected at Pakan were below CCME water quality guidelines.
• Elevated levels of 2,4-D and Lindane in the NSR in the 1970s and early 2000s were attributed to industrial point sources. Detection of these chemicals declined once remedial actions were taken and/or the sources were removed.
7.6.4.2 Summary of Historic Water Quality Data on the NSR
Water quality data for the Pakan station are provided in Tables 7.6-1 and 7.6-2 for January 1982 to April 2006. In general, the waters from the NSR are characterized as well oxygenated; slightly alkaline; high in EC, TDS and alkalinity; dominated by calcium bicarbonate; and relatively high in nutrients (phosphorus and nitrogen). Individual parameters are discussed below. Seasonal changes in water quality parameters from 1999 to 2006 are shown in Figures 7.6-1 and 7.6-2. A brief summary of the water quality parameters follows:
• The pH at Pakan ranged from 6.64 to 9.13, with a median of 8.01. These values are generally well within the guideline range of 6.5 to 9.0. The highest values of pH occur during the periods of high flow in June-July, while the lowest values occur during the low-flow winter months (Figure 7.6-1).
• Dissolved oxygen levels at Pakan ranged from 7.5 mg/L to 15.7 mg/L, with a median concentration of 10.8 mg/L. Dissolved oxygen levels were well above the chronic and acute guideline values. Oxygen levels cycle with the seasons, and are higher when the water temperature is low in winter and lower in the warmer summer months (Figure 7.6-1).
• Conductivity ranged from 220 uS/cm to 461 uS/cm, with a median value of 342 uS/cm (Table 7.6-1). TDS ranged from 139 mg/L to 261 mg/L, with a median value of 342 mg/L. Hardness at Pakan ranged from 100 mg/L to 210 mg/L, with a median value of 166 mg/L. According to the scale published by the Water Quality Association, the water in the NSR is ranked as “hard” (WQA, 2006). All three parameters are highest during periods of base flow in winter and lowest during periods of high flow in June and July during the snowmelt (Figure 7.6-1).

7-21 December 2007 North American Upgrader Project Volume 3, Section 7 – Surface Water Quality
NORTH AMERICAN OIL SANDS CORPORATION
• In order of their importance to the cationic charge, the major cations in the NSR are Ca>Mg>Na>K. Calcium and magnesium together account for 91% of the cationic charge, with the remainder attributable to sodium (9%). Potassium accounted for only 0.8% of the cationic charge. The relative order of importance of the major anions is bicarbonate>sulphate>chloride. Bicarbonate accounts for most (71.8%) of the anionic charge, while sulphate accounts for only 25.7% of the charge. Calcium and magnesium bicarbonates, therefore, represent the principal dissolved species, while calcium/magnesium sulphates and sodium sulphates represent secondary species.
• The alkalinity in the NSR was relatively high, ranging from 1,680 ueq/L to 3,240 ueq/L, with a medium of 2,660 ueq/L. Seasonal cycling of alkalinity follows that of the major ions, and is highest during periods of base flow in winter and lowest during periods of high flow in June and July during the snowmelt (Figure 7.6-1).
• Fecal coliforms at Pakan ranged from non-detectable (<4) to 25,000/100 mL, with a median value of 80/100 mL. There are periodic exceedances of the CCME irrigation guidelines for fecal coliforms (100/100 mL). These exceedances generally occurred in the summer months, with occasional episodes of very high bacterial numbers (Figure 7.6-1). Numbers of E. coli ranged from non-detectable (<4) to 8,900/100 mL, with a median number of 30/100 mL. Episodic exceedances were observed for the CCME recreational guidelines (200/100 mL).
• Levels of TSS ranged from 0.2 mg/L to 2,009 mg/L, with a median of 10 mg/L. TSS is elevated during spring runoff during June and early July, when the NSR receives large volumes of runoff from its tributaries, and is lowest during the winter months under basal flow conditions (Figure 7.6-1). TSS is episodic in nature and can peak at extremely high values.
• TP ranged from 0.007 mg/L to 1.15 mg/L, with a median concentration of 0.088 mg/L. Concentrations of TP are greatest during spring runoff (May to July), and least during winter under basal flow conditions (Figure 7.6-1). The high values in spring are likely associated with the high suspended loads often present at this time. Values of total phosphorus are frequently above the Alberta surface water quality guideline of 0.05 mg/L. Levels of TDP were considerably less than TP, and peaks were not as easily related to season or particulate load. TDP at Pakan ranged from 0.002 mg/L to 0.208 mg/L, with a median concentration of 0.044 mg/L.
• Ammonia ranged from 0.005 mg/L to 0.79 mg/L, with a median of 0.190 mg/L. Seasonal cycling of ammonia was evident, with pronounced peaks observed during the low-flow period in winter. Nitrates ranged from non-detectable to 1.57 mg/L, with a median concentration of 0.32 mg/L. As with ammonia, there is a pronounced seasonal cycling of nitrates, with the highest values recorded in the winter (Figure 7.6-1). Levels of ammonia and nitrates never approached the CCME guidelines. As expected in oxygenated waters, nitrite levels were generally low, with a median value of 0.016 mg/L. Occasional exceedances of the CCME guideline (0.060 mg/L) were observed. The elevated values in winter for both ammonia and nitrates reflect reduced uptake by phytoplankton, periphyton and macrophytes during the winter. Sources of ammonia and nitrates include agricultural runoff and discharge from wastewater treatment plants upstream. TKN ranged from 0.025 mg/L to 3.8 mg/L, with a median concentration of 0.56 mg/L. Although less distinct than those observed for nitrates and ammonia, peaks in TKN were also observed during the winter months (Figure 7.6-1).

7-22 December 2007 North American Upgrader Project Volume 3, Section 7 – Surface Water Quality
NORTH AMERICAN OIL SANDS CORPORATION
• Dissolved organic carbon (DOC) ranged from 0.9 mg/L to 27.1 mg/L, with a median of 2.7 mg/L (Table 7.6-1). Total phenolics ranged from non-detectable to 0.044 mg/L, with a non-detectable median value. The majority of the values were less than the detection limit. Over the 22 years of monitoring data, only one value exceeded the CCME guideline (0.004 mg/L).
• Trace metal concentrations were generally low, with a large number of values below detection limits. There were occasional exceedances of CCME guidelines; however, only aluminum had a median concentration exceeding the guideline. Mean values of cadmium and mercury exceeded guidelines, but this was largely an artifact of the convention used to calculate the statistics from the non-detectable measurements, and the fact that the guidelines were generally set below the detection limit. Therefore, any measure of these metals would result in an exceedance. Total aluminum is frequently found to be above guidelines because it is released from suspended particles during sample analysis. Seasonal cycling of aluminum, iron, lead and possible arsenic was evident in the plots, with the highest values occurring during the high-flow period (June-July), coinciding with peaks in TSS (Table 7.5-2).
The effect of significant rain events on the chemistry of the NSR was evident in the reports completed for the City of Edmonton (Focus, 2004; 2005). During rain events, the TSS was noted to increase by two orders of magnitude relative to low-flow, dry conditions. Significant increases were also evident in TP, nitrates, ammonia, fecal coliforms and E. coli (Table 7.6-3). The results of the Focus studies emphasize that the variation in water chemistry is affected strongly by both seasonal factors and episodic flow/rain events.
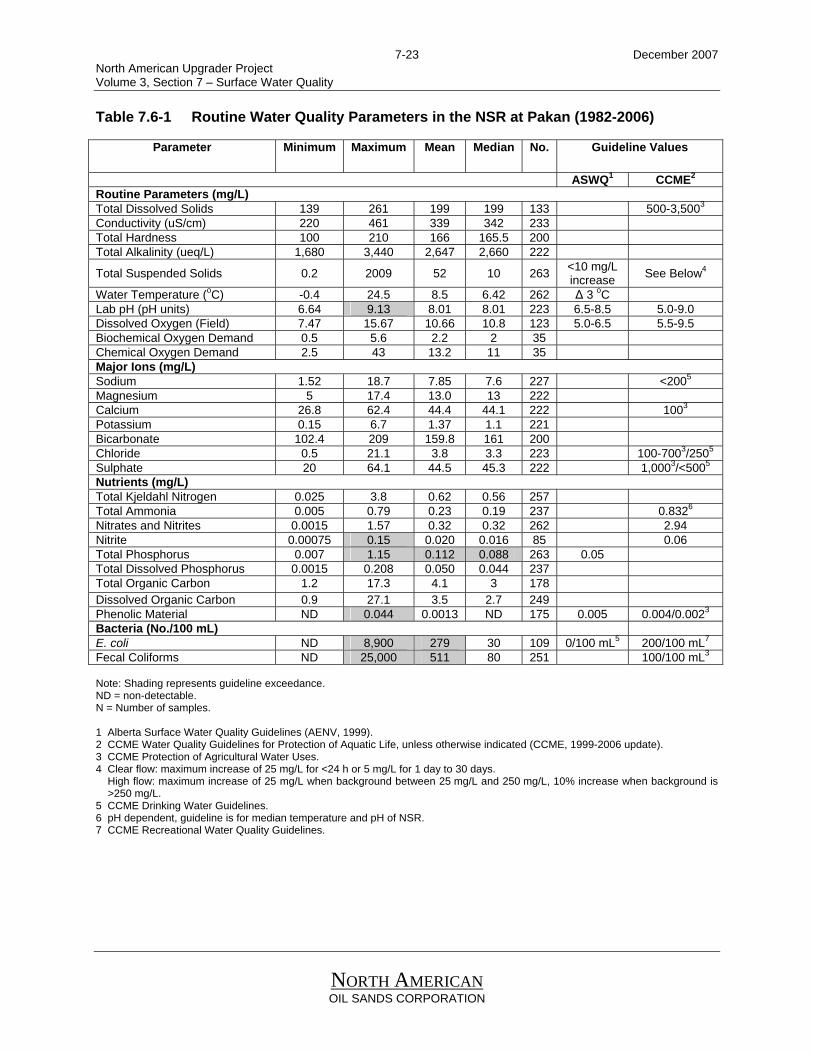
7-23 December 2007 North American Upgrader Project Volume 3, Section 7 – Surface Water Quality
NORTH AMERICAN OIL SANDS CORPORATION
Table 7.6-1 Routine Water Quality Parameters in the NSR at Pakan (1982-2006)
Parameter Minimum Maximum Mean Median No. Guideline Values
ASWQ1 CCME2
Routine Parameters (mg/L) Total Dissolved Solids 139 261 199 199 133 500-3,5003
Conductivity (uS/cm) 220 461 339 342 233 Total Hardness 100 210 166 165.5 200 Total Alkalinity (ueq/L) 1,680 3,440 2,647 2,660 222
Total Suspended Solids 0.2 2009 52 10 263 <10 mg/L increase See Below4
Water Temperature (oC) -0.4 24.5 8.5 6.42 262 Δ 3 oC Lab pH (pH units) 6.64 9.13 8.01 8.01 223 6.5-8.5 5.0-9.0 Dissolved Oxygen (Field) 7.47 15.67 10.66 10.8 123 5.0-6.5 5.5-9.5 Biochemical Oxygen Demand 0.5 5.6 2.2 2 35 Chemical Oxygen Demand 2.5 43 13.2 11 35 Major Ions (mg/L) Sodium 1.52 18.7 7.85 7.6 227 <2005
Magnesium 5 17.4 13.0 13 222 Calcium 26.8 62.4 44.4 44.1 222 1003
Potassium 0.15 6.7 1.37 1.1 221 Bicarbonate 102.4 209 159.8 161 200 Chloride 0.5 21.1 3.8 3.3 223 100-7003/2505
Sulphate 20 64.1 44.5 45.3 222 1,0003/<5005
Nutrients (mg/L) Total Kjeldahl Nitrogen 0.025 3.8 0.62 0.56 257 Total Ammonia 0.005 0.79 0.23 0.19 237 0.8326
Nitrates and Nitrites 0.0015 1.57 0.32 0.32 262 2.94 Nitrite 0.00075 0.15 0.020 0.016 85 0.06 Total Phosphorus 0.007 1.15 0.112 0.088 263 0.05 Total Dissolved Phosphorus 0.0015 0.208 0.050 0.044 237 Total Organic Carbon 1.2 17.3 4.1 3 178 Dissolved Organic Carbon 0.9 27.1 3.5 2.7 249 Phenolic Material ND 0.044 0.0013 ND 175 0.005 0.004/0.0023
Bacteria (No./100 mL) E. coli ND 8,900 279 30 109 0/100 mL5 200/100 mL7
Fecal Coliforms ND 25,000 511 80 251 100/100 mL3
Note: Shading represents guideline exceedance. ND = non-detectable. N = Number of samples.
1 Alberta Surface Water Quality Guidelines (AENV, 1999). 2 CCME Water Quality Guidelines for Protection of Aquatic Life, unless otherwise indicated (CCME, 1999-2006 update). 3 CCME Protection of Agricultural Water Uses. 4 Clear flow: maximum increase of 25 mg/L for <24 h or 5 mg/L for 1 day to 30 days. High flow: maximum increase of 25 mg/L when background between 25 mg/L and 250 mg/L, 10% increase when background is
>250 mg/L. 5 CCME Drinking Water Guidelines. 6 pH dependent, guideline is for median temperature and pH of NSR. 7 CCME Recreational Water Quality Guidelines.

7-24 December 2007 North American Upgrader Project Volume 3, Section 7 – Surface Water Quality
NORTH AMERICAN OIL SANDS CORPORATION
Table 7.6-2 Total Metals Concentrations in the North Saskatchewan River at Pakan (1982-2006)
Parameter Minimum Maximum Mean Median N Guidelines Total Metals (mg/L) ASWQG1 CCME2
Aluminum ND 29.2 0.70 0.169 240 0.1 Antimony 0.00004 0.0025 0.00018 0.0001 87 Arsenic ND 0.02 0.0008 0.00043 136 0.005 Barium 0.0346 0.483 0.080 0.07 138 13
Beryllium ND 0.006 0.0003 ND 106 Boron ND 0.85 0.033 0.02 86 Cadmium ND 0.0049 0.0004 ND 202 0.0000474
Chromium ND 0.021 0.0037 0.003 202 0.0089 Cobalt 0.00006 0.0118 0.0008 0.0005 160 Copper ND 0.0503 0.0035 0.002 224 0.024-0.03 0.0034
Iron ND 30.3 0.901 0.21 131 0.30 Lead5 ND 0.0214 0.0024 0.00119 213 0.0044
Lithium ND 0.301 0.0085 0.00416 82 2.56
Manganese ND 0.337 0.020 0.006 147 <0.053
Mercury ND 0.00122 0.000042 ND 197 0.000005 0.000026 Molybdenum 0.0003 0.004 0.0011 0.00108 121 0.073 Nickel ND 0.0592 0.0054 0.0035 227 0.114
Selenium ND 0.0035 0.0004 0.0001 133 0.001 Silver ND 0.002 0.0002 0.00005 130 0.0001 Strontium 0.238 0.552 0.400 0.412 87 Tin ND 0.02 0.0010 0.0005 87 Titanium 0.00025 0.127 0.016 0.003 87 Uranium ND 0.04 0.0011 0.0006 87 0.023
Vanadium ND 0.039 0.0030 0.001 157 Zinc 0.0005 0.0922 0.0151 0.0109 223 0.03
Notes: Data from April 2005-Present are from total extractable fraction of metals. Shaded values indicate guideline exceedances. N = number of samples.
1 Alberta Surface Water Quality Guidelines–chronic guidelines (AENV, 1999). 2 CCME Water Quality Guidelines for Protection of Aquatic Life, unless otherwise indicated (CCME, 1999-2006 update). 3 CCME Drinking Water Guidelines. 4 At median hardness of the NSR. 5 Data from only 1995–2004. 6 CCME Protection of Agricultural Water Uses.
Table 7.6-3 Comparison of Selected Parameters in the NSR Upstream of the Sturgeon River during Rain Events and Dry Conditions
Parameter April 30, 2003 Rain Event
September 3, 2003 Dry Conditions
July 3, 2004Rain Event
September 21, 2004 Dry Conditions
Mean
TSS 411 3.6 349 30 198 N-TKN 1.15 0.534 1.48 0.4 0.89 N-NH3 0.241 0.286 0.27 0.04 0.209 N-NO2+NO3 0.09 0.451 0.469 0.069 0.270 TP 0.283 0.083 0.42 0.09 0.219 Fecal Coliforms 50 2 29,973 279 7,576 E. Coli 2 17,330 214 5,849
Source: Focus 2004; 2005.

7-25North AmericVolum
December 2007an Upgrader Project
e 3, Section 7 – Surface Water Quality
Water Quality of the NSR within the LSA
Water quality is similar among samples collected at Vinca Bridge, Pakan and NSR1. This similarity suggests that the seasonal trends evident at Pakan apply as well to those sections of the NSR within the LSA. Higher values of nitrates are evident at Pakan, likely the result of runoff from agricultural lands downstream of Vinca Bridge. Higher median concentrations of TDS, hardness and major ions at NSR1 compared to Vinca Bridge reflect a sampling bias at the latter station, where very few winter samples were collected. These parameters tend to be greatest during the winter. Guideline exceedances were evident for the mean and median values of TP at Vinca, and on May 3, 2007, at NSR1 during the field studies. Guideline exceedances were also observed for the median concentrations of aluminum and cadmium. As above, the exceedances for cadmium are largely an artifact of the low guideline values relative to the detection limit.
The only historic monitoring station in the LSA is an AENV station at Vinca Bridge (Highway 38). Water quality data from this station are presented in Tables 7.6-4 and 7.6-5. These tables include the results of the 2006 and 2007 field sampling at NSR1, a sampling location established as part of this study. NSR1 is located about 2 km downstream of Vinca Bridge. There were 29 sampling events at Vinca Bridge in the AENV database from samples collected between 1984 and 2002. The median values of each parameter at the Pakan long-term monitoring station about 52 km downstream are included in Tables 7.6-4 and 7.6-5 for comparison.
NORTH AMERICAN OIL SANDS CORPORATION

7-26 December 2007 North American Upgrader Project Volume 3, Section 7 – Surface Water Quality
NORTH AMERICAN OIL SANDS CORPORATION
Table 7.6-4 Routine Water Quality Parameters at Vinca Bridge, Pakan and NSR1 Vinca Bridge Median
Pakan NSR1 (This Study) Guidelines Parameter
N Min Max Mean Median Aug 30/06 Oct 26/06 Jan 23/07 May 03/07 ASWQ1 CCME2
Routine Parameters Total Dissolved Solids 12 181 220 197 197 210 198 198 236 194 500-3,5003
Conductivity (uS/cm) 15 310 394 349 341 342 328 361 417 349 Hardness (as CaCO3) 15 150 187 166 166 165.5 170 170 200 160 Total Alkalinity (ueq/L) 13 2,440 2,900 2,666 2,640 2,660 2,600 2,840 3,060 2,660 Total Suspended Solids 29 0.5 72 23 11 10 6 7 1 55 <10 mg/L increase See Below4
Temperature (oC) 22 -0.2 23 13 15 6.42 --- 5.49 0.03 8.5 Δ 3 oC pH (pH units) 15 7.94 8.5 8.2 8.2 8.01 8.43 8.35 8.22 8.24 6.5-8.5 5.0-9.0 Dissolved Oxygen 12 7.5 12.6 10.5 10.6 10.82 --- 13.36 15.02 12.6 5.0-6.5 5.5-9.5 Biochemical Oxygen Demand 19 ND 3.2 1.5 1.3 2 --- --- --- --- Chemical Oxygen Demand 11 --- --- --- --- Major Ions (mg/L) Sodium 14 4 12 7 7 7.6 6.9 8.1 8.2 10.2 <2005
Magnesium 12 11 15 13 13 13 14.2 13.3 14.8 12.4 Calcium 12 42 50 45 45 44.1 44.6 45.6 53.7 43.5 1003
Potassium 12 0.7 2.8 1.1 1 1.1 1.2 1.1 1.1 2 Bicarbonate 12 144 176 161 160 161 152 171 186 162 Chloride 15 2 5 3 3 3.3 3.5 3.2 3.8 4.4 2505 100-7003
Sulphate 13 38 54 45 45 45.3 49.5 40.4 60.3 40.6 <5005 10003
Nutrients (mg/L) Total Kjeldahl Nitrogen 21 0.2 1.1 0.5 0.5 0.56 1.15 0.31 0.42 0.55 Total Ammonia 17 0.1 0.4 0.2 0.1 0.19 0.05 0.02 0.25 0.09 0.8326
Nitrates and Nitrites 12 0.008 0.1 0.04 0.02 0.32 0.11 0.227 0.404 0.143 2.94 Nitrite 12 0.008 0.12 0.04 0.02 0.016 0.014 <0.003 0.008 0.007 0.06 Total Phosphorus 27 0.03 0.1 0.1 0.07 0.088 0.013 0.017 0.012 0.076 0.05 Total Organic Carbon 11 2 22 5 3 3 --- --- --- --- Dissolved Organic Carbon 10 0.9 6 3 2 2.7 2.1 3.5 2 6.5 Phenolic Material 13 ND 0.005 0.002 0.002 0.0005 --- --- --- --- 0.005 0.004/0.0023
Bacteria (No./100 mL) E. coli 9 ND 180 51 30 30 --- --- --- --- 200/100 mL7
Fecal Coliforms 20 10 10,000 812 163 80 --- --- --- --- 100/100 mL3
Note: Shaded values indicate guideline exceedance. 1 Alberta Surface Water Quality Guidelines (AENV, 1999). 2 CCME Water Quality Guidelines for Protection of Aquatic Life, unless otherwise indicated (CCME, 1999-2006 update). 3 CCME Protection of Agricultural Water Uses. 4 Clear flow: maximum increase of 25 mg/L for <24 h or 5 mg/L for 1 to 30 day, High flow: maximum increase of 25 mg/L when background is between 25 mg/L and 250 mg/L, 10%
increase when background is >250 mg/L. 5 CCME Drinking Water Guidelines. 6 Guideline is pH dependant, based on median temperature and pH of NSR. 7 CCME Recreational Water Quality Guidelines.

7-27 December 2007 an Upgrader Project
e 3, Section 7 – Surface Water Quality
Vinca Bridge NSR1 (This Study) Pakan Parameter (mg/L)1
Min Max Mean Median N Aug 30/06 Oct 26/06 Jan 23/07 May 03/07 Median
Guidelines CCME2
Aluminum 0.03 2.02 0.46 0.24 17 0.09 0.167 0.082 1.4 0.2 0.1 Antimony 0.00001 0.00013 0.00007 0.000071 8 <0.0002 <0.0002 <0.0002 <0.0002 0.0001 Arsenic 0.0001 0.001 0.001 0.0006 15 0.0039 <0.0002 <0.0002 0.0007 0.0004 0.005 Barium 0.01 0.09 0.06 0.07 10 0.0687 0.05 0.06 0.07 0.07 14
Beryllium ND 0.0005 0.0003 0.0004 16 <0.0002 <0.001 <0.001 <0.001 0.0001 Boron 0.0079 0.0228 0.0158 0.0159 7 0.01 <0.020 <0.020 0.03 0.02 Cadmium ND 0.002 0.0004 0.0003 16 0.00001 0.00002 0.00007 0.00009 0.0001 0.0000475
Chromium 0.0002 0.007 0.002 0.001 21 <0.001 <0.001 0.001 0.002 0.003 0.0089 Cobalt ND 0.005 0.0008 0.0005 16 <0.0003 <0.0003 0.0006 0.0011 0.0005 Copper ND 0.01 0.002 0.002 18 0.0009 0.0015 0.0018 0.0034 0.002 0.0035
Iron ND 1.01 0.3 0.1 21 0.01 <0.06 <0.06 <0.06 0.2 0.30 Lead ND 0.003 0.001 0.002 21 <0.0003 <0.0002 <0.0002 0.001 0.001 0.0045
Lithium 0.0036 0.0051 0.0045 0.0045 7 <0.004 <0.020 <0.020 <0.020 0.004 2.53
Manganese 0.01 33.9 8.00 0.032 19 <0.004 <0.004 <0.004 <0.004 0.004 <0.054
Mercury (ug/L) ND 0.2 0.042 0.025 18 <0.0006 <0.0006 <0.0006 0.0023 0.00003 0.026 Molybdenum ND 0.005 0.001 0.001 16 0.001 0.0009 0.0013 0.001 0.0011 0.073 Nickel ND 0.01 0.004 0.003 20 0.0025 0.0023 0.0057 0.0059 0.004 0.115
Selenium ND 0.0009 0.0003 0.00015 16 <0.0002 <0.0002 0.0004 0.0002 0.0001 0.001 Silicon 1.3 3.6 2.3 2.1 5 1.01 1.7 2.3 4.6 Silver ND 0.00002 0.00001 ND 7 <0.0001 <0.0001 <0.0001 0.0001 0.00005 0.0001 Strontium 0.346 0.472 0.427 0.449 7 0.432 0.42 0.46 0.35 0.4 Thallium (ug/L) ND 0.06 0.026 0.022 7 <0. 2 <0.2 <0.2 <0.2 Tin ND ND ND ND 7 <0.001 <0.001 <0.001 <0.001 0.0005 Titanium 0.0018 0.018 0.0077 0.0035 7 <0.001 0.003 0.005 0.041 0.002 Uranium 0.00042 0.00065 0.00055 0.00052 7 0.0004 0.0004 0.0006 0.0008 0.0006 0.024
Vanadium ND 0.006 0.003 0.003 16 <0.001 <0.001 <0.001 0.004 0.001 Zinc ND 0.05 0.007 0.004 19 0.0169 0.007 0.032 0.008 0.01 0.03
NORTH AMERICAN OIL SANDS CORPORATION
Table 7.6-5 Total Metals Concentrations at Vinca Bridge, Pakan and NSR1
Note: Shaded values indicate guideline exceedance. N = Number of samples. ND= non-detectable. 1 Units in mg/L, unless indicated otherwise. 2 CCME Water Quality Guidelines for Protection of Aquatic Life unless otherwise indicated (CCME, 1999-2006 update). 3 CCME Protection of Agricultural Water Uses. 4 CCME Drinking Water Guidelines. 5 At median hardness.
North AmericVolum

7-28 December 2007 North American Upgrader Project Volume 3, Section 7 – Surface Water Quality
Figure 7.6-1 Temporal Variability of Water Chemistry in the NSR at Pakan (1999-2006)
Tem
pera
ture
(o C)
pH (p
H u
nits
)D
isso
lved
O
xyge
n (m
g/L)
Tota
l Dis
solv
ed
Sol
ids
(mg/
L)To
tal A
lkal
inity
(µeq
/L)
Con
duct
ivity
(µS
/cm
)To
tal S
uspe
nded
S
olid
s (m
g/L)
Cal
cium
(mg/
L)
Sod
ium
(mg/
L)
Bic
arbo
nate
(mg/
L)
7
8
9
Jan-9
9
Jan-00
Jan-0
1
Jan-0
2
Jan-03
Jan-0
4
Jan-0
5
Jan-06
Jan-0
7
-505
1015202530
Jan-9
9
Jan-0
0
Jan-0
1
Jan-0
2
Jan-0
3
Jan-0
4
Jan-0
5
Jan-0
6
Jan-0
7
0
4
8
12
16
20
Jan-9
9
Jan-0
0
Jan-0
1
Jan-0
2
Jan-0
3
Jan-0
4
Jan-0
5
Jan-0
6
Jan-0
7
0
100
200
300
400
500
Jan-9
9
Jan-0
0
Jan-0
1
Jan-0
2
Jan-0
3
Jan-0
4
Jan-0
5
Jan-0
6
Jan-0
7
0
200
400
600
Jan-9
9
Jan-0
0
Jan-0
1
Jan-0
2
Jan-0
3
Jan-0
4
Jan-0
5
Jan-0
6
Jan-0
7
0
100
200
300
Jan-99
Jan-00
Jan-01
Jan-02
Jan-03
Jan-04
Jan-05
Jan-06
Jan-07
1500
2000
2500
3000
3500
Jan-99
Jan-00
Jan-01
Jan-02
Jan-03
Jan-04
Jan-05
Jan-06
Jan-07
0
15
30
45
60
75
Jan-99
Jan-00
Jan-01
Jan-02
Jan-03
Jan-04
Jan-05
Jan-06
Jan-07
0
50
100
150
200
250
Jan-99
Jan-00
Jan-01
Jan-02
Jan-03
Jan-04
Jan-05
Jan-06
Jan-07
0
4
8
12
16
20
Jan-99
Jan-00
Jan-01
Jan-02
Jan-03
Jan-04
Jan-05
Jan-06
Jan-07
NORTH AMERICAN OIL SANDS CORPORATION

7-29 December 2007 North American Upgrader Project Volume 3, Section 7 – Surface Water Quality
Figure 7.6-1 (continued) Temporal Variability of Water Chemistry in the NSR at Pakan (1999-2006)
NORTH AMERICAN OIL SANDS CORPORATION
Note: Guidelines indicated as dotted lines where available.
0
5
10
15
Jan-99
Jan-00
Jan-01
Jan-02
Jan-03
Jan-04
Jan-05
Jan-06
Jan-07
0.00
0.02
0.04
0.06
0.08
0.10
Jan-99
Jan-00
Jan-01
Jan-02
Jan-03
Jan-04
Jan-05
Jan-06
Jan-07
0.00
0.05
0.10
0.15
0.20
0.25
0.30
Jan-99
Jan-00
Jan-01
Jan-02
Jan-03
Jan-04
Jan-05
Jan-06
Jan-07
Feca
oli
m(N
o/10
0 m
L)t
mn
(mg-
N/L
)o
jda
hN
itrog
en (m
g-N
/L)
Tot
iss
veP
hosp
horu
s (m
g/L)
Esc
heric
hia
Col
i (N
o/10
0 m
L)N
itrat
es a
nd
Nitr
ites
(mg-
N/L
)To
tal P
hosp
horu
s(m
g/L)
Dis
solv
ed O
rgan
icC
arbo
n (m
g/L)
2400
l Cfo
rs
Toal
Am
oia
T
tal K
ell
al D
old
0
200
400
600
800
1000
Jan-9
9
Jan-0
0
Jan-0
1
Jan-0
2
Jan-0
3
Jan-0
4
Jan-0
5
Jan-0
6
Jan-0
7
0
200
400
600
800
1000
Jan-9
9
Jan-0
0
Jan-0
1
Jan-0
2
Jan-0
3
Jan-0
4
Jan-0
5
Jan-0
6
Jan-0
7
0.0
0.2
0.4
0.6
0.8
1.0
Jan-9
9
Jan-0
0
Jan-0
1
Jan-0
2
Jan-0
3
Jan-0
4
Jan-0
5
Jan-0
6
Jan-0
7
0.0
0.2
0.4
0.6
0.8
1.0
Jan-9
9
Jan-0
0
Jan-0
1
Jan-02
Jan-0
3
Jan-0
4
Jan-0
5
Jan-0
6
Jan-0
7
0.0
0.5
1.0
1.5
2.0
Jan-9
9
Jan-0
0
Jan-0
1
Jan-0
2
Jan-0
3
Jan-0
4
Jan-0
5
Jan-0
6
Jan-0
7
8000 3900
1.57
4600 50003400
0.528 0.7610.336
27.1
20001600 2400 1600 1900
0.208
0
5
10
15
Jan-99
Jan-00
Jan-01
Jan-02
Jan-03
Jan-04
Jan-05
Jan-06
Jan-07
0.00
0.02
0.04
0.06
0.08
0.10
Jan-99
Jan-00
Jan-01
Jan-02
Jan-03
Jan-04
Jan-05
Jan-06
Jan-07
0.00
0.05
0.10
0.15
0.20
0.25
0.30
Jan-99
Jan-00
Jan-01
Jan-02
Jan-03
Jan-04
Jan-05
Jan-06
Jan-07
Feca
oli
m(N
o/10
0 m
L)t
mn
(mg-
N/L
)o
jda
hN
itrog
en (m
g-N
/L)
Tot
iss
veP
hosp
horu
s (m
g/L)
Esc
heric
hia
Col
i (N
o/10
0 m
L)N
itrat
es a
nd
Nitr
ites
(mg-
N/L
)To
tal P
hosp
horu
s(m
g/L)
Dis
solv
ed O
rgan
icC
arbo
n (m
g/L)
2400
l Cfo
rs
Toal
Am
oia
T
tal K
ell
al D
old
0
200
400
600
800
1000
Jan-9
9
Jan-0
0
Jan-0
1
Jan-0
2
Jan-0
3
Jan-0
4
Jan-0
5
Jan-0
6
Jan-0
7
0
200
400
600
800
1000
Jan-9
9
Jan-0
0
Jan-0
1
Jan-0
2
Jan-0
3
Jan-0
4
Jan-0
5
Jan-0
6
Jan-0
7
0.0
0.2
0.4
0.6
0.8
1.0
Jan-9
9
Jan-0
0
Jan-0
1
Jan-0
2
Jan-0
3
Jan-0
4
Jan-0
5
Jan-0
6
Jan-0
7
0.0
0.2
0.4
0.6
0.8
1.0
Jan-9
9
Jan-0
0
Jan-0
1
Jan-02
Jan-0
3
Jan-0
4
Jan-0
5
Jan-0
6
Jan-0
7
0.0
0.5
1.0
1.5
2.0
Jan-9
9
Jan-0
0
Jan-0
1
Jan-0
2
Jan-0
3
Jan-0
4
Jan-0
5
Jan-0
6
Jan-0
7
8000 3900
1.57
4600 50003400
0.528 0.7610.336
0.528 0.7610.336
0.528 0.7610.336
27.1
20001600 2400 1600 1900
0.208

7-30 December 2007 North American Upgrader Project Volume 3, Section 7 – Surface Water Quality
Figure 7.6-2 Temporal Variability of Total Trace Metals in the NSR at Pakan (1999-2006) A
lum
inum
(mg/
L)Iro
n (m
g/L)
Mer
cury
(mg/
L)S
elen
ium
(mg/
L)C
adm
ium
(mg/
L)
Date Date
Mol
ybde
num
(mg/
L)Zi
nc (m
g/L)
Chr
omiu
m (m
g/L)
Lead
(mg/
L)A
rsen
ic (m
g/L)
0.02
0.0012
01234567
2-Dec
-98
2-Dec
-99
1-Dec
-00
1-Dec
-01
2-Dec
-02
2-Dec
-03
1-Dec
-04
1-Dec
-05
7.1 29.2
0
0.002
0.004
0.006
2-Dec
-98
2-Dec
-99
1-Dec
-00
1-Dec
-01
2-Dec
-02
2-Dec
-03
1-Dec
-04
1-Dec
-05
0.02
0
1
2
3
4
5
2-Dec
-98
2-Dec
-99
1-Dec
-00
1-Dec
-01
2-Dec
-02
2-Dec
-03
1-Dec
-04
1-Dec
-05
30.05.16
0
0.004
0.008
0.012
2-Dec
-98
2-Dec
-99
1-Dec
-00
1-Dec
-01
2-Dec
-02
2-Dec
-03
1-Dec
-04
1-Dec
-05
0.02
0
0.0005
0.001
0.0015
0.002
2-Dec
-98
2-Dec
-99
1-Dec
-00
1-Dec
-01
2-Dec
-02
2-Dec
-03
1-Dec
-04
1-Dec
-05
0
0.001
0.002
0.003
0.004
0.005
2-Dec
-98
2-Dec
-99
1-Dec
-00
1-Dec
-01
2-Dec
-02
2-Dec
-03
1-Dec
-04
1-Dec
-05
0.00
0.02
0.04
0.06
0.08
0.10
2-Dec
-98
2-Dec
-99
1-Dec
-00
1-Dec
-01
2-Dec
-02
2-Dec
-03
1-Dec
-04
1-Dec
-05
0
0.001
0.002
0.003
2-Dec
-98
2-Dec
-99
1-Dec
-00
1-Dec
-01
2-Dec
-02
2-Dec
-03
1-Dec
-04
1-Dec
-05
0
0.004
0.008
0.012
2-Dec
-98
2-Dec
-99
1-Dec
-00
1-Dec
-01
2-Dec
-02
2-Dec
-03
1-Dec
-04
1-Dec
-05
0.0130.02
0
0.00002
0.00004
0.00006
0.00008
0.0001
2-Dec
-98
2-Dec
-99
1-Dec
-00
1-Dec
-01
2-Dec
-02
2-Dec
-03
1-Dec
-04
1-Dec
-05
0.0012
Alu
min
um (m
g/L)
Iron
(mg/
L)M
ercu
ry (m
g/L)
Sel
eniu
m (m
g/L)
Cad
miu
m (m
g/L)
Date Date
Mol
ybde
num
(mg/
L)Zi
nc (m
g/L)
Chr
omiu
m (m
g/L)
Lead
(mg/
L)A
rsen
ic (m
g/L)
0.02
0.0012
01234567
2-Dec
-98
2-Dec
-99
1-Dec
-00
1-Dec
-01
2-Dec
-02
2-Dec
-03
1-Dec
-04
1-Dec
-05
7.1 29.2
0
0.002
0.004
0.006
2-Dec
-98
2-Dec
-99
1-Dec
-00
1-Dec
-01
2-Dec
-02
2-Dec
-03
1-Dec
-04
1-Dec
-05
0.02
0
1
2
3
4
5
2-Dec
-98
2-Dec
-99
1-Dec
-00
1-Dec
-01
2-Dec
-02
2-Dec
-03
1-Dec
-04
1-Dec
-05
30.05.16
0
0.004
0.008
0.012
2-Dec
-98
2-Dec
-99
1-Dec
-00
1-Dec
-01
2-Dec
-02
2-Dec
-03
1-Dec
-04
1-Dec
-05
0.02
0
0.0005
0.001
0.0015
0.002
2-Dec
-98
2-Dec
-99
1-Dec
-00
1-Dec
-01
2-Dec
-02
2-Dec
-03
1-Dec
-04
1-Dec
-05
0
0.001
0.002
0.003
0.004
0.005
2-Dec
-98
2-Dec
-99
1-Dec
-00
1-Dec
-01
2-Dec
-02
2-Dec
-03
1-Dec
-04
1-Dec
-05
0.00
0.02
0.04
0.06
0.08
0.10
2-Dec
-98
2-Dec
-99
1-Dec
-00
1-Dec
-01
2-Dec
-02
2-Dec
-03
1-Dec
-04
1-Dec
-05
0
0.001
0.002
0.003
2-Dec
-98
2-Dec
-99
1-Dec
-00
1-Dec
-01
2-Dec
-02
2-Dec
-03
1-Dec
-04
1-Dec
-05
0
0.004
0.008
0.012
2-Dec
-98
2-Dec
-99
1-Dec
-00
1-Dec
-01
2-Dec
-02
2-Dec
-03
1-Dec
-04
1-Dec
-05
0.0130.02
0
0.00002
0.00004
0.00006
0.00008
0.0001
2-Dec
-98
2-Dec
-99
1-Dec
-00
1-Dec
-01
2-Dec
-02
2-Dec
-03
1-Dec
-04
1-Dec
-05
0.0012
Date Date
Mol
ybde
num
(mg/
L)Zi
nc (m
g/L)
Chr
omiu
m (m
g/L)
Lead
(mg/
L)A
rsen
ic (m
g/L)
0.02
0.0012
01234567
2-Dec
-98
2-Dec
-99
1-Dec
-00
1-Dec
-01
2-Dec
-02
2-Dec
-03
1-Dec
-04
1-Dec
-05
7.1 29.2
01234567
2-Dec
-98
2-Dec
-99
1-Dec
-00
1-Dec
-01
2-Dec
-02
2-Dec
-03
1-Dec
-04
1-Dec
-05
7.1 29.2
0
0.002
0.004
0.006
2-Dec
-98
2-Dec
-99
1-Dec
-00
1-Dec
-01
2-Dec
-02
2-Dec
-03
1-Dec
-04
1-Dec
-05
0.02
0
0.002
0.004
0.006
2-Dec
-98
2-Dec
-99
1-Dec
-00
1-Dec
-01
2-Dec
-02
2-Dec
-03
1-Dec
-04
1-Dec
-05
0.02
0
1
2
3
4
5
2-Dec
-98
2-Dec
-99
1-Dec
-00
1-Dec
-01
2-Dec
-02
2-Dec
-03
1-Dec
-04
1-Dec
-05
30.05.16
0
1
2
3
4
5
2-Dec
-98
2-Dec
-99
1-Dec
-00
1-Dec
-01
2-Dec
-02
2-Dec
-03
1-Dec
-04
1-Dec
-05
30.05.16
0
1
2
3
4
5
2-Dec
-98
2-Dec
-99
1-Dec
-00
1-Dec
-01
2-Dec
-02
2-Dec
-03
1-Dec
-04
1-Dec
-05
30.05.16
0
0.004
0.008
0.012
2-Dec
-98
2-Dec
-99
1-Dec
-00
1-Dec
-01
2-Dec
-02
2-Dec
-03
1-Dec
-04
1-Dec
-05
0.02
0
0.004
0.008
0.012
2-Dec
-98
2-Dec
-99
1-Dec
-00
1-Dec
-01
2-Dec
-02
2-Dec
-03
1-Dec
-04
1-Dec
-05
0.02
0
0.0005
0.001
0.0015
0.002
2-Dec
-98
2-Dec
-99
1-Dec
-00
1-Dec
-01
2-Dec
-02
2-Dec
-03
1-Dec
-04
1-Dec
-05
0
0.001
0.002
0.003
0.004
0.005
2-Dec
-98
2-Dec
-99
1-Dec
-00
1-Dec
-01
2-Dec
-02
2-Dec
-03
1-Dec
-04
1-Dec
-05
0.00
0.02
0.04
0.06
0.08
0.10
2-Dec
-98
2-Dec
-99
1-Dec
-00
1-Dec
-01
2-Dec
-02
2-Dec
-03
1-Dec
-04
1-Dec
-05
0
0.001
0.002
0.003
2-Dec
-98
2-Dec
-99
1-Dec
-00
1-Dec
-01
2-Dec
-02
2-Dec
-03
1-Dec
-04
1-Dec
-05
0
0.004
0.008
0.012
2-Dec
-98
2-Dec
-99
1-Dec
-00
1-Dec
-01
2-Dec
-02
2-Dec
-03
1-Dec
-04
1-Dec
-05
0.0130.02
0
0.004
0.008
0.012
2-Dec
-98
2-Dec
-99
1-Dec
-00
1-Dec
-01
2-Dec
-02
2-Dec
-03
1-Dec
-04
1-Dec
-05
0.013
0
0.004
0.008
0.012
2-Dec
-98
2-Dec
-99
1-Dec
-00
1-Dec
-01
2-Dec
-02
2-Dec
-03
1-Dec
-04
1-Dec
-05
0.013
0
0.004
0.008
0.012
2-Dec
-98
2-Dec
-99
1-Dec
-00
1-Dec
-01
2-Dec
-02
2-Dec
-03
1-Dec
-04
1-Dec
-05
0.0130.02
0
0.00002
0.00004
0.00006
0.00008
0.0001
2-Dec
-98
2-Dec
-99
1-Dec
-00
1-Dec
-01
2-Dec
-02
2-Dec
-03
1-Dec
-04
1-Dec
-05
0.0012
0
0.00002
0.00004
0.00006
0.00008
0.0001
2-Dec
-98
2-Dec
-99
1-Dec
-00
1-Dec
-01
2-Dec
-02
2-Dec
-03
1-Dec
-04
1-Dec
-05
0
0.00002
0.00004
0.00006
0.00008
0.0001
2-Dec
-98
2-Dec
-99
1-Dec
-00
1-Dec
-01
2-Dec
-02
2-Dec
-03
1-Dec
-04
1-Dec
-05
0.0012
Note: Guidelines indicated as dotted lines where available Impact Assessment and Mitigative Measures.
NORTH AMERICAN OIL SANDS CORPORATION

7-31North AmericVolum
December 2007an Upgrader Project
e 3, Section 7 – Surface Water Quality
7.6.5.2 Water Quality of Regional Lakes
The water quality of eight regional lakes sampled in the field program is summarized in Tables 7.6-8 and 7.6-9. The lakes are typically hard-water lakes with high conductivities, TDS and alkalinity. The phosphorus concentrations were high in most of the lakes, and exceeded the ASWQ guidelines. While nitrates are generally low (below detection) in most lakes, reduced forms of nitrogen attained high levels, with ammonia exceeding CCME guidelines for protection of aquatic life. Low oxygen levels were identified beneath the ice in January in Astotin and Antler Lakes. Metal concentrations in the lakes were almost uniformly low, with few guideline exceedances.
7.6.5.1 Beaverhill Creek
The historic data available on Beaverhill Creek and the 2006-2007 field results from this study are presented in Tables 7.6-6 and 7.6-7. Relative to the NSR, Beaverhill Creek is considerably higher in EC, hardness, alkalinity, major ions and nutrients, including TKN, ammonia, nitrates, total phosphorus and phenolics. The high levels of nutrients in Beaverhill Creek are likely the result of intensive agricultural activities in the creek’s drainage area. Metals were low in concentration, with isolated exceedances observed for copper, cadmium, iron, aluminum, zinc and manganese (an aesthetic guideline under the CCME drinking water guidelines). As previously noted, the exceedances for cadmium reflect the low guideline value relative to the detection limit, especially in the older data.
7.6.5 Historic Water and Sediment Quality Data of Other Watercourses in the LSA and RSA
NORTH AMERICAN OIL SANDS CORPORATION

7-32 December 2007 North American Upgrader Project Volume 3, Section 7 – Surface Water Quality
NORTH AMERICAN OIL SANDS CORPORATION
Table 7.6-6 Water Quality in Beaverhill Creek – Routine Parameters Historic Data (AENV) 1975-1990 AC1 (This Study) Guidelines Parameter
N Minimum Maximum Mean Median Aug 28/06 Oct 25/06 Jan 23/07 May 1/07 ASWQ1 CCME2
Routine Parameters (mg/L) Total Dissolved Solids 12 170 525 345 316 341 396 471 219 500-35003
Conductivity (Lab) (uS/cm) 13 313 1,320 611 520 566 707 836 385 Total Hardness (as CaCO3) 7 132 503 326 350 210 250 350 110 Total Alkalinity (ueq/L) 13 1,980 10,400 5,580 5,220 3,800 5,740 7,960 2,460 Total Suspended Solids 8 240 800 414 350 59 13.0 3.0 38.0 <10 mg/L increase See Below4
Water Temperature (oC) 11 0 21 9.4 7.5 15.55 1.35 0.50 9.74 Δ 3 oC Lab pH (pH units) 13 7.5 8.2 8.0 8 8.35 8.30 8.02 8.11 6.5-8.5 5.0-9.0 Dissolved Oxygen (Field) 6 5.6 12.4 7.9 6.7 9.1 8.66 13.5 11.4 5.0-6.5 5.5-9.5 Bioch. Oxygen Demand 11 1.1 10.8 4.0 2.8 -- -- -- -- Chemical Oxygen Demand 6 21.9 121.2 59.1 54.6 -- -- -- -- Major Ions (mg/L) Sodium 13 11 97 41 39 41.3 49.7 37.9 32.0 <2005
Magnesium 13 7 36 20 15 16.4 20.6 24.6 9.0 Calcium 8 23 142 59 46 58.5 67.4 101 30 1003
Potassium 13 2 13.2 6.7 6.2 11.1 11.0 7.0 9.6 Bicarbonate 2 187 634 410 410 228 350 485 151 Chloride 13 3 78 20 12 21.6 55.4 29.4 11.6 2505 100-7003
Sulphate 13 31 117 51 42 77.8 19.5 31.3 51.4 <5005 10003
Fluoride 13 0.15 0.53 0.24 0.22 -- -- -- -- Nutrients (mg/L) Total Kjeldahl Nitrogen 12 0.74 6.4 2.19 1.75 0.29 1.44 1.08 1.53 Total Ammonia 13 0.02 0.98 0.30 0.1 0.04 0.04 0.13 0.25 0.8326
Nitrates and Nitrites 14 0.009 0.582 0.228 0.16 <0.003 <0.006 0.010 0.040 2.94 Nitrite 11 0.025 0.17 0.052 0.05 <0.003 <0.006 0.005 0.010 0.06 Total Phosphorus 12 0.065 2.4 0.512 0.29 0.241 0.145 0.056 0.239 0.05 Total Dissolved Phosphorus 2 0.224 0.765 0.495 0.495 -- -- -- -- Total Organic Carbon 3 30 48 39 39 -- -- -- -- Dissolved Organic Carbon 7 24 78 45 42 13.7 18.4 14.1 21.1 Phenolic Material 14 0.003 0.037 0.0145 0.012 -- -- -- -- 0.005 0.004/0.0023
Bacteria` (No./100 mL) Fecal Coliforms 12 0 110 36 18 -- -- -- -- 100/100 mL3
Note: Shaded values indicate guideline exceedances. 1 Alberta Surface Water Quality Guidelines (AENV, 1999). 2 CCME Water Quality Guidelines for Protection of Aquatic Life, unless otherwise indicated (CCME, 1999-2006 update). 3 CCME Protection of Agricultural Water Uses. 4 Clear flow: maximum increase of 25 mg/L for <24 h or 5 mg/L for 1 day to 30 day High flow: max increase of 25 mg/L when background between 25 mg/L and 250 mg/L, 10%
increase when background is >250 mg/L.. 5 CCME Drinking Water Guidelines. 6 Guideline is pH dependant, based on median temperature and pH of NSR.

7-33 December 2007 North American Upgrader Project Volume 3, Section 7 – Surface Water Quality
NORTH AMERICAN OIL SANDS CORPORATION
Table 7.6-7 Water Quality in Beaverhill Creek – Total Metals Historic Data (AENV) 1975-1990 AC1 (This Study) Parameter (mg/L)
Minimum Maximum Average Median N Aug 28/06 Oct 25/06 Jan 23/07 May 01/07 Guidelines
CCME1
Aluminum (Extractable) 0.06 8.45 1.36 0.14 7 1.86 0.166 0.02 2.03 0.1 Antimony (Total) -- -- -- -- 0.0003 <0.0002 0.0003 0.0002 Arsenic (Total) 0.0008 0.0035 0.0021 0.0017 5 0.0069 0.0021 0.0016 0.0019 0.005 Barium (Total) 0.087 0.087 0.087 0.087 1 0.165 0.11 0.13 0.08 13
Beryllium (Extractable) 0.0005 0.0005 0.0005 0.0005 6 <0.0002 <0.001 <0.001 <0.001 Boron (Total) 0.05 0.02 0.03 0.05 Cadmium (Total) ND 0.002 0.001 ND 7 0.00006 0.00004 0.00005 0.00009 0.0000974
Chromium (Total) 0.003 0.008 0.005 0.005 7 0.003 0.001 0.001 0.003 0.0089 Cobalt (Total) ND 0.006 0.002 0.003 7 0.0016 0.0008 0.0025 0.0017 Copper (Total) ND 0.019 0.008 0.007 7 0.0021 0.0015 0.0015 0.0051 0.0044
Iron (Total) 3.91 3.91 3.91 3.91 1 0.07 0.19 0.32 1.15 0.30 Lead (Extractable) ND 0.031 0.008 0.0035 12 0.0015 0.0003 0.0004 0.0014 0.0074
Lithium (Total) -- -- -- -- 0.019 0.02 0.02 <0.02 2.52
Manganese (Total) 0.042 0.284 0.128 0.104 7 0.007 0.38 0.73 0.05 <0.053
Mercury (Total) ND 0.00005 0.000048 ND 13 0.000015 0.000001 0.000001 0.000005 0.000026 Molybdenum (Dissolved) 0.0005 0.006 0.0026 0.003 7 0.0021 0.0006 0.0006 0.0012 0.073 Nickel (Total) 0.008 0.022 0.012 0.011 7 0.0074 0.0061 0.014 0.0096 0.1504
Selenium (Total) ND 0.0001 0.00009 ND 5 <0.0002 <0.0002 0.0004 0.0005 0.001 Silver (Total) -- -- -- -- <0.0001 <0.0001 <0.0001 <0.0001 0.0001 Strontium (Total) -- -- -- -- 0.294 0.34 0.43 0.18 Thallium (Total) -- -- -- -- <0.0002 <0.0002 <0.0002 <0.0002 Tin (Total) -- -- -- -- <0.001 <0.001 <0.001 <0.001 Titanium (Total) -- -- -- -- 0.029 0.007 0.008 0.038 Uranium(Total) -- -- -- -- 0.0021 0.0007 0.0008 0.0011 0.023
Vanadium (Total) ND 0.022 0.008 0.009 7 0.007 <0.001 <0.001 0.006 Zinc (Total) 0.005 0.055 0.017 0.011 7 0.0149 0.009 0.025 0.012 0.03
Note: Shaded values indicate guideline exceedances. ND= non-detectable. N = number of samples. 1 CCME Water Quality Guidelines for Protection of Aquatic Life, unless otherwise indicated (CCME, 1999-2006 update). 2 CCME Protection of Agricultural Water Uses. 3 CCME Drinking Water Guidelines. 4 Guideline is hardness dependant; guideline is based on median hardness.

7-34 December 2007 North American Upgrader Project Volume 3, Section 7 – Surface Water Quality
NORTH AMERICAN OIL SANDS CORPORATION
Table 7.6-8 Water Quality of Lakes in the LSA and RSA – Routine Parameters
Study Lakes (Sampled May 01- 03/07) Astotin Lake (AST4) Antler Lake (AST5) Parameter Oster Adamson Hastings Wanisan Cooking Tawayik Aug
29/06 Oct
24/06 Jan
27/07 May
02/07 Aug
29/06 Oct
25/06 Jan
23/07 May
01/07 Routine Parameters Total Dissolved Solids 186 209 626 233 1,230 483 286 281 328 265 271 259 398 218 Conductivity (Lab) (uS/cm) 329 348 1,050 406 1,870 758 485 484 585 461 462 447 715 403 Hardness (as CaCO3) 120 140 280 180 260 180 180 170 200 170 140 130 200 120 Total Alkalinity (ueq/L) 3,020 3,140 5,580 3,000 8,120 4,340 4,600 4,620 5,520 4,300 3,600 3,520 5,600 3,040 Total Suspended Solids 20 55 10 63 50 13 25.0 17.0 4.0 10.0 138 48.0 4.0 18.0 Temperature oC 8.75 9.84 7.41 10.3 9.34 10.2 --- 3.48 1.30 5.73 --- 4.12 2.94 5.74 pH (pH units) 8.5 9.21 8.6 8.2 9.42 9.1 8.89 8.77 8.49 8.31 9.23 9.20 8.45 8.05 Dissolved Oxygen 12.9 9.32 11.7 11.8 15.5 --- 13.7 4.10 8.92 --- 16.1 1.85 4.65 Major Ions Sodium (Total) 18.5 17.5 107 8.3 329 88.8 35.5 35.6 38.0 30.1 37.6 36.9 53.0 27.3 Magnesium (Total) 14.2 15.9 51.4 18.5 51.7 23.6 31 28.6 32.6 26.4 14.7 14.6 23.3 12.7 Calcium (Total) 22.5 30.9 25.8 38.5 22.4 29.4 21.6 19.5 24.8 22.9 32.3 27.0 41.2 25.3 Potassium (Total) 16.2 16.2 32.2 18.8 49.4 19.5 22.3 22.0 22.8 18.3 29.9 29.2 41.2 21.2 Bicarbonate 175 144 315 184 296 202 241 258 321 258 159 163 329 185 Chloride (Dissolved) 4.1 3.1 18.4 5.3 43.5 6.4 6.3 6.4 7.7 5.7 29.8 28.1 43.3 23.1 Sulphate (Dissolved) 14.6 30.4 217 48.2 499 176 31.5 30.1 35.7 31.4 18.3 17.3 22.6 15.5 Carbonate 4.7 23.4 12.6 <0.5 98 31.1 19.5 11.7 7.8 1.9 30.1 25.4 6.4 <0.5 Nutrients Total Kjeldahl Nitrogen 3.49 4.25 3.39 2.93 8.88 3 0.38 3.00 3.39 3.48 4.77 6.25 9.90 4.88 Total Ammonia 0.12 0.08 0.37 0.07 0.12 0.06 0.06 0.05 0.59 0.88 0.15 0.06 2.21 1.05 Nitrates and Nitrites 0.03 <0.003 0.02 <0.003 0.006 <0.003 <0.003 <0.02 0.118 0.010 0.003 <0.003 0.430 0.003 Nitrite (Dissolved) 0.03 <0.003 0.013 <0.003 0.006 <0.003 <0.003 <0.02 0.004 <0.003 <0.003 <0.003 <0.003 <0.003Total Phosphorus 0.239 0.398 0.071 0.232 0.678 0.168 0.087 0.084 0.048 0.066 0.738 0.383 0.680 0.679 Dissolved Organic Carbon 40.5 40.6 33.7 39.6 80.8 38.5 35.9 36.0 36.0 28.7 71.1 58.1 81.7 40.1 Note: Shaded values indicate ASWQ or CCME guideline exceedances.

7-35 December 2007 an Upgrader Project
e 3, Section 7 – Surface Water Quality
Parameter Study Lakes (Sampled May 1 to May 3, 2007) Astotin Lake Antler Lake Oster Adamson Hastings Wanisan Cooking Tawayik Aug
29/06 Oct
24/06 Jan
27/07 Jan
27/07 May
02/07 Aug
29/06 Oct
25/06 Jan
23/07 May
01/07 Total Metals (mg/L)
Aluminum 0.122 0.03 0.023 0.06 0.029 0.008 0.016 0.018 0.016 0.011 0.011 0.278 0.076 0.02 0.004 Antimony <0.0002 <0.0002 <0.0002 <0.0002 0.0009 <0.0002 0.0005 <0.0002 <0.0002 <0.0002 <0.0002 <0.0002 <0.0002 <0.0002 <0.0002 Arsenic 0.0003 0.0002 0.0009 0.0004 0.0055 0.0013 <0.002 <0.0002 0.0002 0.0002 0.0002 0.0059 <0.0002 0.0002 0.0003 Barium 0.05 0.05 0.04 0.05 0.02 0.03 0.0643 0.03 0.05 0.05 0.05 0.0828 0.02 0.1 0.05 Beryllium <0.001 <0.001 <0.001 <0.001 <0.001 <0.001 <0.0002 <0.001 <0.001 <0.001 <0.001 <0.0002 <0.001 <0.001 <0.001 Boron 0.09 0.03 0.11 0.06 0.2 0.08 0.09 0.07 0.09 0.09 0.07 0.08 0.06 0.11 0.07 Cadmium (ug/L) 0.04 0.01 <0.01 0.02 0.04 0.01 0.01 0.02 0.01 0.01 0.02 <0.01 0.08 0.04 <0.01 Chromium <0.001 <0.001 <0.001 <0.001 0.002 <0.001 <0.001 0.001 0.001 0.001 0.005 0.001 0.001 0.002 <0.001 Cobalt 0.0004 0.0004 0.0003 0.0005 0.0008 0.0004 <0.0003 <0.0003 0.0004 0.0003 <0.0003 0.0006 0.0006 0.0011 0.0004 Copper 0.0008 0.0008 0.0014 0.0011 0.0028 0.0013 0.0006 0.001 0.001 0.0029 0.0012 0.0008 0.0009 0.001 0.0013 Iron 0.19 0.06 0.08 0.23 0.11 <0.06 0.02 <0.06 <0.06 <0.06 <0.06 0.03 <0.06 0.06 <0.06 Lead <0.0002 <0.0002 <0.0002 <0.0002 <0.0002 <0.0002 <0.0003 <0.0002 <0.0002 <0.0002 <0.0002 0.0007 0.0003 0.0003 <0.0002 Lithium 0.03 0.03 0.08 0.02 0.15 0.06 0.049 0.05 0.07 0.07 0.04 0.031 0.03 0.06 <0.020 Manganese 0.107 0.113 0.039 0.061 0.021 0.014 <0.004 <0.004 0.055 0.043 <0.004 <0.004 0.008 0.041 <0.004 Mercury (ug/L) 0.06 0.07 0.08 0.11 0.07 0.08 <0.0006 <0.0006 <0.0006 0.0019 0.0008 0.0011 <0.0006 0.0009 <0.0006 Molybdenum 0.0003 0.0003 0.0003 0.0007 0.0016 0.0006 <0.0002 <0.0002 <0.0002 <0.0002 <0.0002 0.0009 0.0012 0.0016 0.0007 Nickel 0.0031 0.0041 0.0025 0.0037 0.0046 0.0034 0.0015 0.0013 0.0031 0.0029 0.0022 0.0037 0.0027 0.0074 0.0021 Selenium 0.0003 0.0002 0.0002 0.0002 0.0003 0.0002 <0.002 <0.0002 0.0004 0.0004 0.0003 <0.0002 <0.0002 0.0005 0.0004 Silicon 4.4 3.6 2.1 3.2 1.7 4.5 2.17 2.4 3.3 3.3 2.5 8.99 0.3 1.5 2.4 Silver 0.0002 <0.0001 <0.0001 <0.0001 <0.0001 0.0002 0.0001 <0.0001 <0.0001 <0.0001 <0.0001 <0.0001 <0.0001 <0.0001 <0.0001 Strontium 0.16 0.19 0.27 0.2 0.22 0.27 0.231 0.22 0.27 0.28 0.2 0.202 0.17 0.28 0.15 Thallium <0.0002 <0.0002 <0.0002 <0.0002 <0.0002 <0.0002 0.0029 <0.0002 <0.0002 <0.0002 <0.0002 <0.0002 <0.0002 <0.0002 <0.0002 Tin <0.001 <0.001 <0.001 <0.001 <0.001 <0.001 <0.001 <0.001 <0.001 <0.001 <0.001 <0.001 <0.001 <0.001 <0.001 Titanium 0.007 0.006 0.003 0.005 0.006 0.005 0.001 0.002 0.004 0.004 0.002 0.01 0.007 0.007 0.005 Uranium 0.0005 0.0007 0.0008 0.0005 0.0019 0.0005 <0.0004 0.0002 0.0003 0.0003 0.0002 0.0005 0.0007 0.001 0.0003 Vanadium 0.002 0.002 <0.001 0.001 0.004 0.001 <0.001 <0.001 <0.001 <0.001 <0.001 0.003 0.002 0.002 <0.001 Zinc 0.009 0.009 0.006 0.008 0.011 0.007 0.0121 0.006 0.017 0.014 0.005 0.0135 0.008 0.014 0.007
NORTH AMERICAN OIL SANDS CORPORATION
Table 7.6-9 Water Quality of Lakes in the LSA and RSA – Total Metals
Note: Shaded values indicate ASWQ or CCME guideline exceedances.
North AmericVolum

7-36North AmericVolum
December 2007an Upgrader Project
e 3, Section 7 – Surface Water Quality
7.6.5.4 Sediment Quality in Waterbodies in the LSA
Sediment concentrations of total metals, total petroleum hydrocarbons and PAHs at the six field stations are summarized in Tables 7.6-10 to 7.6-12. The highest metals concentrations are found in the lake sediments, which represent depositional environments, composed largely of fine particles. Higher metal concentrations are routinely found in finer sediments (Baudo et al., 1990). Exceedances of CCME freshwater sediment quality guidelines were identified for chromium (Astotin Lake, Antler Lake), copper (Astotin Lake) and zinc (Astotin Lake). There were no volatile hydrocarbons (BTEX, C1-C6) identified in samples from any of the six field sites. Consistently high concentrations of hydrocarbon fractions F2-F4 were found in Astotin Creek at the downstream station, although there were no guideline exceedances. Exceedances of the CCME Canada-wide standards for petroleum hydrocarbons in soils (F3 fraction) were observed in Astotin and Antler Lakes. Again, these represent depositional environments, and the high values of F3 are likely natural in origin. PAH concentrations were all less than detection limits at all stations, except for the downstream station on Astotin Creek (AC3). A total of 17 PAH species were detected, 13 of which exceeded CCME interim sediment quality guidelines. High sediment PAH concentrations were also seen in water samples for this site. The sources of these PAHs at this station on Astotin Creek are unknown.
7.6.5.3 Concentrations of Organic Parameters in Waterbodies in the LSA
Water samples from all six field sampling stations were analyzed for volatile hydrocarbons and PAHs for all four sampling occasions. Volatile hydrocarbons included BTEX and the F1 (C6-C10) and F2 (C6-C16) CCME fractions. Detailed results are presented in Appendix 7A. All volatile hydrocarbons were less than detection limits, and there were no guideline exceedances. Detectable PAHs were identified only at the downstream station of Astotin Creek (AC3) for the following parameters: naphthalene, acenaphthene, fluorene, phenanthrene, fluoranthene and pyrene. Levels of naphthalene, fluoranthene and pyrene at this station exceeded the CCME guidelines for protection of aquatic life during the October sampling.
NORTH AMERICAN OIL SANDS CORPORATION

7-37 December 2007 North American Upgrader Project Volume 3, Section 7 – Surface Water Quality
NORTH AMERICAN OIL SANDS CORPORATION
Table 7.6-10 Total Metals in Sediments Collected During the 2006-2007 Field Program
Parameter Units Beaverhill Cr. AC1
Oct 25/06
Astotin Cr. (Upstream)
AC2 Oct 25/06
Astotin Cr. (Downstream)
AC3 Oct 25/06
North Saskatchewan
River, NSR1 Oct 26/06
Astotin Lake Oct 24/06
Antler Lake Oct 25/06
ISQG1
As mg/kg 2.7 4.2 <0.5 3.1 3 2.3 5.9 Ba mg/kg 109 177 0.41 94.6 67.6 75 NS Be mg/kg 0.31 0.57 <0.02 0.27 0.36 0.36 NS B mg/kg 0.6 0.9 1 0.1 6.7 6 NS
Cd mg/kg 0.35 0.60 <0.02 0.29 0.39 0.44 0.6 Cr mg/kg 30.2 16.5 <0.1 16.9 45.5 58.2 37.3 Co mg/kg 4.8 6.53 <0.03 4.13 3.77 3.88 NS Cu mg/kg 8.02 15.0 0.03 5.48 301 9.69 37.5 Pb mg/kg 5.02 11.4 0.02 5.91 9.43 8.07 35 Hg mg/kg 0.033 <0.2 <0.2 <0.02 0.071 0.034 0.17 Mo mg/kg 0.37 0.21 <0.02 0.4 1.37 1.46 NS Ni mg/kg 21.3 19.6 0.06 15.5 27.7 34.9 NS Se mg/kg <1 <1 <1 <1 <1 <1 NS Tl mg/kg 0.1 0.2 <0.02 0.07 0.1 0.1 NS V mg/kg 12.8 23.3 <0.1 10.8 15.3 12 NS Zn mg/kg 27.9 44.6 0.26 26.5 265 47.6 123 Zr mg/kg 4.4 9.8 <0.1 4.2 3.2 4.4 NS
Note: Guideline exceedances are shaded. NS=no guideline available. 1 Interim sediment quality guidelines for freshwater (CCME, 1999–2006 update).

7-38 December 2007 North American Upgrader Project Volume 3, Section 7 – Surface Water Quality
NORTH AMERICAN OIL SANDS CORPORATION
Table 7.6-11 Total Petroleum Hydrocarbons in Sediments Collected During the 2006-2007 Field Program
Parameter Beaverhill Creek AC1
Oct 25/06
Astotin CreekAC2
Oct 25/06
Astotin Creek AC3
Oct 25/06
North Saskatchewan
River NSR1
Oct 26/06
Astotin LakeOct 24/06
Antler Lake Oct 25/06
Laboratory Detection
Limit
Guidelines
Benzene mg/kg <0.0072 <0.0075 <0.0063 <0.0062 <0.053 <0.065 0.0062 0.0731 /0.052
Toluene mg/kg <0.029 <0.03 <0.025 <0.025 <0.21 <0.26 0.025 0.861 /0.12
Ethylbenzene mg/kg <0.014 <0.015 0.015 <0.012 <0.11 <0.13 0.012 0.191 /0.12
Xylenes mg/kg <0.064 <0.067 <0.057 <0.055 <0.47 <0.58 0.055 251 /0.12
B[a]P4 mg/kg <0.000016 <0.000017 1.18 <0.000013 <0.00012 <0.00014 0.000013 - F1 C6-C10 mg/kg <12 <12 <12 <12 <12 <12 <12 2603
F2 C>10-C16 mg/kg <10 26 193 <10 <80 <100 10 9003
F3 C>16-C34 mg/kg 378 310 660 <10 1,140 2,490 10 8003
F4 C>34 mg/kg 181 159 2,180 <20 <200 1,300 20 5,6003
Note: Shading represents guideline exceedances. 1 Alberta Soil and Water Quality Guidelines for Hydrocarbons at Upstream Oil and Gas Facilities (AENV, 2001). 2 CCME soil quality guidelines, agricultural land usages (CCME, 1999-2006 update). 3 Canada-wide standards for petroleum hydrocarbons in soil, fine-grain surface soils, ecological soil contact (CCME, 2001). 4 Equivalent benzo[a]pyrene concentration. The Benzo(a)pyrene toxic equivalent is a weighted concentration of total carcinogenic polyaromatic hydrocarbons in a mixture that
compensates for the differences in toxicity among the polyaromatic hydrocarbon analogs.

7-39 December 2007 North American Upgrader Project Volume 3, Section 7 – Surface Water Quality
NORTH AMERICAN OIL SANDS CORPORATION
Table 7.6-12 PAHs in Sediment Collected During the 2006-2007 Field Program
Parameter (mg/kg)
Beaverhill Creek (AC1)
Oct 25/06
Astotin Creek (AC2) (Upstream)
Oct 25/06
Astotin Creek (AC3)
(Downstream) Oct 25/06
North Saskatchewan River (NSR1)
Oct 26/06
Astotin Lake Oct 24/06
Antler Lake Oct 25/06
CCME Interim Sediment
Quality Guidelines
Acenaphthene <0.0074 <0.0075 2.43 <0.0061 <0.054 <0.065 0.00671 Acenaphthylene <0.0074 <0.0075 0.0694 <0.0061 <0.054 <0.065 0.00587 Anthracene <0.0037 <0.0038 0.915 <0.003 <0.027 <0.032 0.0469 Benz[a]anthracene <0.0074 <0.0075 0.846 <0.0061 <0.054 <0.065 0.0317 Benzo[a]pyrene <0.0037 <0.0038 0.72 <0.003 <0.027 <0.032 0.0319 Chrysene <0.0037 <0.0038 0.75 <0.003 <0.027 <0.032 0.0571 Dibenz[a,h]anthracene <0.0037 <0.0038 0.118 <0.003 <0.027 <0.032 0.00622 Fluoranthene <0.0037 <0.0038 3.59 <0.003 <0.027 <0.032 0.111 Fluorene <0.0037 <0.0038 1.73 <0.003 <0.027 <0.032 0.0212 2-Methylnaphthalene <0.0074 <0.0075 1.2 <0.0061 <0.054 <0.065 0.0202 Naphthalene <0.0074 <0.0075 6.31 <0.0061 <0.054 <0.065 0.0346 Phenanthrene <0.0037 0.006 3.98 <0.003 <0.027 <0.032 0.0419 Pyrene <0.0037 <0.0038 2.63 <0.003 <0.027 <0.032 0.053 Benzo[c]phenanthrene <0.0037 <0.0038 <0.0032 <0.003 <0.027 <0.032 NS 7,12-dimethybenz[a]anthracene <0.037 <0.038 <0.032 <0.03 <0.27 <0.32 NS Benzo[b&j]fluoranthene <0.0074 <0.0075 1.14 <0.0061 <0.054 <0.065 NS Benzo[k]fluoranthene <0.0074 <0.0075 0.344 <0.0061 <0.054 <0.065 NS Indeno[1,2,3-cd]pyrene <0.0074 <0.0075 0.486 <0.0061 <0.054 <0.065 NS Benzo[g,h,i]perylene <0.0037 <0.0038 0.529 <0.003 <0.027 <0.032 NS Dibenzo[a,h]pyrene <0.0074 <0.0075 <0.0064 <0.0061 <0.054 <0.065 NS Dibenzo[a,i]pyrene <0.0074 <0.0075 <0.0064 <0.0061 <0.054 <0.065 NS
Shaded values represent exceedances of the CCME Interim Sediment Quality Guidelines for Freshwater (CCME, 1999–2006 update). NS=no guideline available.

7-40 December 2007 North American Upgrader Project Volume 3, Section 7 – Surface Water Quality
NORTH AMERICAN OIL SANDS CORPORATION
7.7 Impact Assessment and Mitigative Measures The assessment of potential impacts to surface water quality indicators uses the criteria described in Volume 2, Section 1, with the exception of extent and magnitude which have been revised for this section. Final impact ratings, post mitigation, are based on the consolidation of the seven impact assessment criteria (direction, geographic extent, magnitude, duration, frequency of occurrence, permanence and confidence) and professional judgment. Mitigation measures, including management of operations and best management practices, are provided, along with the discussion of impacts.
More details regarding mitigation measures may be found in the Water Management Plan (Volume 1, Section 6.4).
During construction, potential effects on surface water quality are linked to erosion and sediment loading in local waterbodies, and dewatering.
During plant operations, potential effects on surface water quality are linked to groundwater suppression under the stormwater ponds, wastewater discharge, sediment runoff, releases of process-affected waters and incidental spills. To prevent such effects, engineered protection measures will be a fundamental part of the plant design. In addition, spill response plans and other management procedures will be put in place as described in Volume 1.
7.7.1 Erosion and Sediment Control During Construction
Appropriate design and mitigation measures will be implemented during construction in order to minimize the impacts of the Project on surface water quality. A Water Management and Sediment Control Plan will be developed to provide appropriate isolation and containment of runoff from all disturbed areas. Site grading, berms, stormwater ponds and drainage ditches will be among the initial works constructed to manage runoff during construction. Initial grading and stockpile berms will be used to control runoff temporarily until the ditches and ponds can be completed. There are no defined drainage channels on the site. The only upslope drainage is that from the CNR culverts at the south, which will be diverted to the North Wetland Complex using the Range Road 211 ditch system.
Water management and sediment control mitigation measures to be employed during construction will include:
• minimizing the extent of disturbance to developed areas and maintaining a vegetative cover in undeveloped portions of the site;
• creating stable topsoil and subsoil berms with maximum 3H:1V side slopes and using sediment control fences around them until a vegetation cover is established;
• using erosion control matting where slopes and soil conditions warrant additional control measures;
• restoring vegetation cover on disturbed areas as soon as practical following completion of construction activities in an area; and
• creating stable low gradient ditches at less than 0.2% grade.
Instream construction of the water intake will be conducted by isolating the area with a cofferdam. Less than 40% of the river flow will be constricted during construction, with clean armour material

7-41 December 2007 North American Upgrader Project Volume 3, Section 7 – Surface Water Quality
NORTH AMERICAN OIL SANDS CORPORATION
placed around the outside of the cofferdam to control erosion and sediment release during construction. Instream construction activities will be limited to the period of August 1 to April 15 to fall outside of the Restricted Activity Period for this reach of the NSR.
The potential release of sediment during construction will have little effect on the surface water quality of the NSR, Astotin Creek and the unnamed creek. The planned mitigation measures will minimize the movement of sediments off-site. Any suspended sediment loading that might occur during construction would be minimal, occur only occasionally during high rainfall or snowmelt, last a short period and be within the range of natural variability.
The geographic extent of any effect on the tributaries will be localized, and will not produce effects on the water quality of the NSR. The movement of any suspended sediment from the tributaries to the NSR would be undetectable. Once construction is completed, the potential for sedimentation of surface water quality will cease, and the effects will likely revert to baseline conditions.
With mitigation, the residual effects of sediment release on surface water quality will be low in magnitude, short-term in duration and reversible, and will have a low overall environmental consequence.
7.7.2 Dewatering During Construction
During site construction, excavations into the shallow subsoil will be required for the construction of ponds, construction of foundations for aboveground structures and installation of utilities. These excavations may fill with groundwater/seepage that may require removal. The amount of groundwater that could enter an excavation will depend on the size and depth of the excavation below the water table, the permeability of the soil and the length of time that the excavation is left open. Dewatering is generally a temporary requirement associated with construction activities.
The groundwater removed from the excavations will be directed to an on-site holding pond and tested. If the dewatered groundwater quality meets the guidelines for surface water quality (AENV, 1999), the dewatered groundwater will be released to existing drainage control structures (e.g., ditches and stormwater ponds).
Localized dewatering of the Upgrader site during construction will not affect the water quality of Astotin Creek, the unnamed creek or the NSR because of the planned mitigation measures. Therefore, the magnitude of the residual effects is negligible, and the duration and reversibility of the effects are not applicable. There will be no environmental consequence on water quality for dewatering activities. The residual effect of dewatering will not contribute measurably to cumulative effects on surface water quality.
7.7.3 Dewatering During Operations
During operations, dewatering of the shallow subsoil under the stormwater ponds is required to suppress the groundwater table for pond liner protection. The amount of groundwater that may need to removed will depend on the size and depth of the ponds below the water table, the permeability of the soil and the duration of Upgrader operations.
The groundwater removed beneath the stormwater ponds will be directed to the potentially contaminated pond. This water will be managed as part of the stormwater runoff management strategy, and either transferred to the raw water pond, released to the North Wetland Complex or discharged to the effluent pond.

7-42 December 2007 North American Upgrader Project Volume 3, Section 7 – Surface Water Quality
NORTH AMERICAN OIL SANDS CORPORATION
Localized groundwater dewatering beneath the lined stormwater ponds during operations will not affect the water quality of Astotin Creek, the unnamed creek or the NSR because of the planned mitigation measures. Therefore, the magnitude of the residual effects is negligible, and the duration and reversibility of the effects are not applicable. There will be no environmental consequence on water quality for dewatering activities. The residual effect of dewatering will not contribute measurably to cumulative effects on surface water quality.
7.7.4 Wastewater Treatment and Discharge
A treatment facility will be provided on-site to treat the following wastewater streams prior to reuse and/or discharge to the NSR:
• cooling tower blowdown;
• boiler blowdown;
• desalter wash water;
• excess stripped sour water;
• gasification wastewater;
• ultrafiltration backwash;
• reverse osmosis reject;
• groundwater relief;
• ion exchange regeneration waste;
• miscellaneous process waste streams;
• stormwater runoff;
• potentially contaminated stormwater;
• contaminated water; and
• sanitary waste.
7.7.4.1 Wastewater Segregation
The various Upgrader wastewater streams will have varying degrees of water quality, including dissolved solids, oil and grease, biodegradable organics, nitrogen, phosphorus, sulphide, cyanides and phenols. To optimize the efficiency of the wastewater treatment facilities, the wastewater streams will be segregated into “organic” and “high TDS.” The organic waste streams, which typically contain oil and grease and other biodegradable contaminants, will be treated separately from the high TDS waste streams. All the excess treated waste streams not recycled to the Upgrader will be directed to the effluent pond for temporary storage prior to discharge to the NSR.

7-43 December 2007 North American Upgrader Project Volume 3, Section 7 – Surface Water Quality
NORTH AMERICAN OIL SANDS CORPORATION
7.7.4.2 Organic Wastewater Treatment
The organic waste stream, which includes desalter wash water, potentially contaminated stormwater, oily wastewater, and sanitary wastewater, will be treated in the following facilities/processes:
• desalter break tank (initial skim tank for desalter wash water);
• skim tanks;
• dissolved gas flotation;
• membrane bioreactor equalization tank;
• membrane bioreactor; and
• excess biological solids from the bioreactor will be treated with the following processes, prior to off-site disposal that follows AENV licence requirements:
o aerobic digestion; and o digested biosolids dewatering.
7.7.4.3 High TDS Wastewater Treatment
Wastewater streams that have elevated TDS, including boiler and cooling tower blowdowns, excess condensate, reverse osmosis reject and neutralized ion exchange waste will not be treated by the organic wastewater treatment process unless they are contaminated by hydrocarbons. These streams are normally relatively clean, with little or no organics, and typically do not require treatment prior to river discharge.
For Phase 1, all of the high TDS streams will be discharged to the effluent pond, unless contamination is detected. Contaminated high TDS wastewater will be diverted to the wastewater treatment unit for treatment. The concentration of the high TDS streams will be monitored to ensure that adequate dilution is occurring in the effluent pond to maintain TDS within acceptable levels for river discharge.
As the Upgrader expands beyond Phase 1, increased levels of internal recycle will be developed, including ZLD treatment of targeted waste streams. Eventually, the Project will incorporate ZLD treatment of all waste streams to eliminate effluent discharges to the NSR. For Upgrader development beyond Phase 1, North American will introduce the first stage of ZLD treatment, with segregation and ZLD treatment of the reverse osmosis reject and neutralized ion exchange waste streams using an evaporator process. The distillate from this first stage of ZLD treatment will be recycled as boiler feed makeup.
The evaporation process will produce a concentrated brine waste that will be disposed of off-site in a manner approved by regulators. North American is currently investigating potential disposal options, including third-party liquid industrial waste disposal facilities.
7.7.4.4 Raw Water Treatment Waste
The ultrafiltration membrane system used as part of the raw water treatment process will generate a waste stream associated with backwash. This waste stream, which contains

7-44 December 2007 North American Upgrader Project Volume 3, Section 7 – Surface Water Quality
NORTH AMERICAN OIL SANDS CORPORATION
suspended solids, will be directed to the head of the raw water pond to allow suspended solids to settle, as well as the recycling of clarified water.
7.7.4.5 Wastewater Discharge
River discharge information is summarized in Table 4.3-2 of Volume 1. There are no waste streams discharged to the NSR for the full Project build-out, since full ZLD is planned. The maximum effluent discharge to the NSR occurs for the case of the Project, excluding Gasification 2 during the summer cooling period.
Treated wastewater will be discharged from the effluent pond to a diffuser in the NSR via a new discharge pipeline. A mulitport, submerged diffuser will provide efficient mixing of the effluent in the river channel. The construction of the in-channel diffuser will require the use of a temporary coffer dam. Construction will be completed in accordance with applicable legislation governing allowable in-stream construction activities. The completed outfall diffuser will not result in permanent alterations or diversions to the NSR. The treated wastewater outfall diffuser would be installed downstream of the proposed raw water intake.
The effluent pond will have sufficient capacity to retain effluent in the event that it does not meet effluent discharge criteria. In such an event, the contaminated effluent will be recycled to the wastewater treatment unit for additional treatment. The discharge from the effluent pond will be continuously monitored for key parameters, including temperature, pH, flow rate and any other parameters specified in the AENV Approval. A composite sampler will be provided to allow daily analyses of the discharge to the NSR.
7.7.5 Effects of Treated Effluent Discharge on the Local Study Area
The CORMIX model was used to examine the dispersion of treated process water discharge and the effects of the discharge on NSR water quality in the LSA (Section 7.5.3.2). The location of the proposed outfall is indicated in Figure 7.7-1. The following mixing zone restrictions outlined in AENV (1995) apply:
• Acute water quality guidelines should be met at end-of-pipe.
• Chronic water quality guidelines should be met before ten times the stream width along the length of the river and one-half the stream width laterally. The stream width in both cases is defined as that width when the river is at the 7Q10 flow. The 7Q10 flow is the lowest stream flow for seven consecutive days that would be expected to occur once in ten years. Chronic guidelines include a maximum temperature change above ambient of 3oC.
The point where the guidelines for chronic effects must be met is referred to in the following sections as the chronic boundary within the effluent plume. Effluent mixing was examined in both the near-field and the far-field of the mixing zone.
Effluent and temperature dispersion were modelled at the 7Q10 flow (60 m3/s), as well as at mean annual flow of the NSR (196 m3/s). The effluent chemistry used was that predicted for the Project. The 7Q10 conditions represent the worst-case scenario, where dilution would be at a minimum. The mean annual flow conditions represent effluent dispersion under average flow conditions in the NSR.
The proposed wastewater outfall was assumed to be a multiport diffuser, 30 cm in diameter, with ten 10 cm ports extending between 8 m and 11 m from the bank of the river at the 7Q10 flow.

7-45 December 2007 North American Upgrader Project Volume 3, Section 7 – Surface Water Quality
NORTH AMERICAN OIL SANDS CORPORATION
The diffuser was situated just downstream of the intake structure. As reported in the Hydrology section (Volume 3, Section 6), the width of the NSR at the location of the proposed outfall under 7Q10 conditions is 129 m. This means that chronic guidelines must be met at a point 1.29 km downstream. The width of the NSR under mean annual flow was 183 m. The model parameters are listed in Table 7.7-1. Further details of the inputs to the CORMIX model are presented in the model output in Appendix 7B.
Table 7.7-1 CORMIX Modelling Parameters
Parameter Average Flow Conditions 7Q10 Flow Conditions River Flow 196 m3/s 60.0 m3/s River Width 183 m 129 m River Mean Depth 1.9 m 1.00 Effluent Flow 0.0886 m3/s 0.0886 m3/s Effluent Temperature 27°C 24°C Diameter of Outfall Pipe 0.3 m 0.3 m Number of Ports 10 10 Diameter of Ports 0.1 m 0.1 m Distance of Diffuser from Bank 8 m to 11 m 8 m to 11 m
7.7.5.1 Results of CORMIX Modelling
Under both the 7Q10 and average flow scenarios, the effluent plume follows the right bank of the river, dynamically attaches to this bank and remains attached for at least 20 km downstream. The plume characteristics for both average flow and low-flow scenarios are presented in Table 7.7-2. The near-field, dominated by the forces of buoyancy and momentum, is very short in both cases. At the end of the near-field, the width of the plume is only 2.6 m under 7Q10 conditions, and about 4.4 m for mean annual flow conditions. Starting with 100% effluent at end-of-pipe, effluent concentrations at the end of the near-field zone are predicted to be 4.2% under 7Q10 conditions, and 2.3% under average flow conditions.
In the far-field, the plume continues to spread horizontally across the river, although at a relatively slow rate. The plume is fully mixed vertically at about 11.1 m downstream under 7Q10 conditions, and 27.2 m under average flow conditions. The plume attaches to the right bank at 931 m and 618 m, respectively. At the chronic boundary of the plume, where compliance with chronic guidelines is required, the concentration in the midpoint of the plume is 0.58% effluent for 7Q10 conditions, and 0.30% for average flow conditions. Mixing is far less efficient under 7Q10 conditions, which would normally occur during the winter. The widths of the plume at the chronic boundary were 19.4 m under 7Q10 flow, and 21.1 m under average flow conditions. The temperature differential (Delta T) at the chronic boundary was only 0.12oC under the 7Q10 flow, and 0.05oC under average flow conditions. Effluent and temperature concentrations in the centre line of the effluent plume and a planar view of the dispersion for the 7Q10 case are shown in Figure 7.7-1.

7-46 December 2007 North American Upgrader Project Volume 3, Section 7 – Surface Water Quality
NORTH AMERICAN OIL SANDS CORPORATION
Table 7.7-2 Characteristics of the Effluent Plume under 7Q10 and Average Flow Conditions
Plume Characteristic
Average Flow Conditions (196 m3/s)
Low Flow Conditions (7Q10)
(60 m3/s) Near Field Downstream distance of plume at end of near-field 11 m 6.5 m Width of plume at end of near-field 4.4 m 2.6 m Effluent concentration at end of near-field 2.3% 4.2% Far Field Distance downstream that plume is fully mixed vertically 27.2 m 11.1 m Distance downstream that plume is attached to the right bank 618 931 Effluent concentration at 1.29 km downstream (width at 7Q10 flow) 0.30% 0.58% Width of plume at 1.29 km downstream (width at 7Q10 flow) 21.1 m 19.4 m Temperature Differential (Delta T) at 1.29 km downstream 0.05 0.12oC
7.7.5.2 Compliance with Mixing Zone Requirements
Predicted effluent concentrations and loadings at end-of-pipe for relevant chemical parameters are presented in Table 7.7-3. The effluent loadings are those predicted for the peak summer day for the Project, and hence represent “worst-case,” or conservative conditions. Column 8 presents the predicted concentrations of these chemical parameters at the chronic boundary of the plume, at 1.29 km downstream of the outfall under 7Q10 conditions. Table 7.7-3 also includes the background winter (December to February) concentration of each parameter in the NSR and the concentration of each parameter in the river at full mixing (Column 9). Because acute water quality guidelines are met at the end-of-pipe for all parameters for which acute guidelines are available (Table 7.7-3), the first mixing zone requirement is satisfied. The second mixing zone requirement is met for all parameters except TP and TN. For phosphorus, the background concentration in the NSR (0.069 mg/L) already exceeds Alberta’s surface water quality chronic guideline (0.05 mg/L). The concentration of TP at the chronic boundary (0.071 mg/L) is marginally greater than this background value. At full mixing, the concentration of phosphorus is analytically indistinguishable from the background concentration. For TN, the background concentration in the NSR (1.14 mg/L) similarly exceeds the chronic guideline (1.0 mg/L). At the chronic boundary of the plume the predicted concentration of total nitrogen will be 1.38 mg/L. At full mixing, the concentration is predicted to be 1.20 mg/L, which is marginally greater than the upstream concentration and within the seasonal variation in this parameter. Much of the loading of total nitrogen (329 kg/d) is attributable to TKN (283 kg/d). TKN represents reduced forms of nitrogen, including ammonia. As ammonia loading is relatively low (15 kg/d), a large percentage (81%) of the nitrogen loading is attributable to reduced organic forms of nitrogen. Although previous impact assessments for other facilities have concentrated on the Project contribution of ammonia, this does not seem warranted for this Project.
The predicted concentrations of most major chemical parameters at full mixing in the NSR are indistinguishable from background values within the range of analytical error (Table 7.7-3). Exceptions include the major ions sodium and chloride. Incremental increases of 0.3 mg/L are predicted for sodium and 0.4 mg/L for chloride. These incremental increases in the NSR would theoretically be detectable, although they fall within the range of the seasonal variability of each parameter. The predicted increase in TDS (from 218 mg/L upstream to 220 mg/L at full mixing of the discharge) is due to the increase in these major ions.

7-47North AmericVolum
December 2007an Upgrader Project
e 3, Section 7 – Surface Water Quality
The residual effects of the discharge of treated effluent on the LSA will be negative in direction, regional in extent, low in magnitude, medium-term in duration, continual in frequency and reversible in the median term. The residual effects will be low in magnitude because the incremental increases in certain water quality parameters attributable to the Project are within acceptable protective standards. The confidence in this prediction is high. The residual effects of the discharge of treated effluent on the NSR have an overall impact rating of low.
NORTH AMERICAN OIL SANDS CORPORATION

7-48 December 2007 North American Upgrader Project Volume 3, Section 7 – Surface Water Quality
NORTH AMERICAN OIL SANDS CORPORATION
Table 7.7-3 Concentrations of Chemical Variables in the North Saskatchewan River Downstream of the Proposed Wastewater Outfall Predicted from the CORMIX Model Under 7Q10 Flow Conditions
Variable Units Effluent Concentration
Loading (kg/d)
Median Winter Concentration
of NSR at Pakan
Acute Guideline
Chronic Guideline
Predicted Concentration
in Plume at 1.29 km
Downstream
Concentration at Full Mixing
BOD mg/L 43.5 333 1.33 1.6 1.39 COD mg/L 257 1,965 6 7.5 6.36 TDS mg/L 1,558 11,909 218 226 220 TOC mg/L 49.8 381 2.1 2.4 2.17 TSS mg/L 37 283 2 2.2 2.05 Hardness mg/L 565 4,319 180 182.2 180 Alkalinity mg/L 473 3,616 142 143.9 142 Sodium mg/L 213.3 1,630 7.85 9.0 8.14 Potassium mg/L 16.1 123 1.1 1.2 1.12 Calcium mg/L 150 1,147 49.65 50.2 49.7 Magnesium mg/L 46.2 353 14.2 14.4 14.2 Chloride mg/L 277.9 2,124 3.6 5.2 4.00 Sulphate mg/L 162 1,238 51.6 52.2 51.7 Ammonia-N mg/L 2 15 0.43 8.3 0.832 0.439 0.43 Nitrates-N mg/L 6 46 0.36 2.94 0.393 0.37 TKN mg/L 37 283 0.64 0.851 0.69 Total N mg/L 43 329 1.14 1.0 1.38 1.20 Total P mg/L 0.5 3.82 0.069 0.05 0.071 0.070 Cyanides mg/L 0.1 0.76 ND 0.005 0.0006 0.0001 Sulphides mg/L 0.01 0.0764 - 0.002 0.0001 ND Phenols mg/L 0.032 0.2446 0.001 0.005/0.004 0.0012 0.001 Aluminum mg/L 0.365 2.7901 0.073 0.1 0.0747 0.073 Antimony mg/L 0.000043 0.0003 ND ND ND Arsenic mg/L 0.0008 0.0061 ND 0.005 ND ND Beryllium mg/L 0.0002 0.0015 0.0001 0.0001 0.0001 Cadmium mg/L 0.0004 0.0031 ND 0.000047 0.000002 ND

7-49 December 2007 North American Upgrader Project Volume 3, Section 7 – Surface Water Quality
NORTH AMERICAN OIL SANDS CORPORATION
Table 7.7-3 (continued) Concentrations of Chemical Variables in the North Saskatchewan River Downstream of the Proposed Wastewater Outfall Predicted from the CORMIX Model Under 7Q10 Flow Conditions
Variable Units Effluent Concentration
Loading (kg/d)
Median Winter Concentration
of NSR at Pakan
Acute Guideline
Chronic Guideline
Predicted Concentration
in Plume at 1.29 km
Downstream
Concentration at Full Mixing
Chromium mg/L 0.002 0.0153 ND 0.0089 0.00001 ND Cobalt mg/L 0.0006 0.0046 ND ND ND Copper mg/L 0.005 0.0382 0.001 0.028 0.003 0.0010 0.001 Iron mg/L 1.5 11.5 0.103 0.3 0.1111 0.105 Lead mg/L 0.0045 0.0344 0.0009 0.0652 0.004 0.0009 0.0009 Mercury mg/L 0.00004 0.0003 ND 0.013 0.0001 ND ND Molybdenum mg/L 0.0055 0.0420 0.0011 0.073 0.0011 0.0011 Nickel mg/L 0.009 0.0688 0.0018 0.472 0.11 0.0018 0.0018 Selenium mg/L 0.0002 0.0015 ND 0.001 ND ND Titanium mg/L 0.0115 0.0879 0.0023 0.0024 0.0023 Vanadium mg/L 0.004 0.0306 ND 0.12 0.00002 ND Zinc mg/L 0.04 0.3058 0.008 0.12 0.03 0.0082 0.008 Notes: 1 CCME Water Quality Guidelines for Protection of Aquatic Life or Alberta Surface Water Quality Guidelines, unless otherwise indicated. 2 U.S. EPA chronic guidelines (2006). These are recommended when CCME or AENV guidelines are lacking. 3 ND = non-detectable. 4 Bold indicates parameters which exceed the chronic guideline at 1.29 km downstream.

7-50 December 2007 North American Upgrader Project Volume 3, Section 7 – Surface Water Quality
Figure 7.7-1 Percent Effluent Concentration and Temperature Differential in the Centreline of the Plume versus Downstream Distance for 7Q10 Flow Conditions
NORTH AMERICAN OIL SANDS CORPORATION

7-51 December 2007 North American Upgrader Project Volume 3, Section 7 – Surface Water Quality
NORTH AMERICAN OIL SANDS CORPORATION
7.7.6 Effects of Effluent Discharge on the Regional Study Area
The effects of effluent discharge on the RSA were examined by two methods. The first method involved conducting a loading analysis of 14 chemical parameters to the NSR from all major point sources (municipal and industrial) in order to calculate the relative contribution of the Project to the total loading of each parameter. The Baseline Case included all existing and approved dischargers, while the Application Case added the proposed discharge for the Project (Table 7.7-4). The Cumulative Case included the addition of two facilities: Petro-Canada Oil Sands Inc.’s Sturgeon Upgrader and Shell Scotford Upgrader Expansion 2. No discharge was reported for BA Energy’s Heartland Oil Sands Bitumen Upgrader and the Synenco Northern Lights Upgrader. The second method involved use of the WASP model to assess the effects of the above discharges on the overall water chemistry of the NSR. The model was applied to a selection of the parameters having the highest loadings as determined in the loading analyses. The WASP model is useful for showing the effects of multiple discharges and overlapping plumes within segments of the NSR.
7.7.6.1 Loading Analysis
The loading of 14 effluent parameters for existing and approved dischargers (including the Project) in the RSA is summarized in Table 7.7-5 for the Application Case. The Cumulative Case is presented in Table 7.7-3. In most cases, average daily loading rates were calculated from AENV monitoring data for the most recent five years of data. To calculate background (upstream) loadings in the NSR, concentrations of the 14 parameters upstream of the Gold Bar WWTP reported in Focus (2005) at Dawson Bridge in Edmonton during February during low-flow conditions were used. For parameters not included in the Focus (2005) report, background concentrations of the NSR were taken from AENV’s long-term monitoring station at Devon (AENV, 2002a). Background loadings in the NSR were calculated using the 7Q10 flow. Data from AENV were also used to calculate the loadings attributable to the Sturgeon River. The loading analysis involved summing the loadings of each parameter to the river and determining the relative contribution of the Project to the total loading of that parameter in the RSA.
In the Application Case, the relative contribution of the Project to the total loadings of the 14 parameters ranged from 0.2% for aluminum to 7.6% for COD. The Project is projected to contribute greater than 2% of the load of four parameters:
• COD (7.6%); • BOD (3.3%); • sodium (2.6%); and • chloride (5.3%).
The incremental increases in major ions (sodium, chloride, TDS) downstream of the Project were already noted in the CORMIX effluent dispersion modelling. While the contribution of the Project to ammonia was relatively small (0.7%), the contribution of the Project to all reduced forms of nitrogen, expressed as TKN, is notable and represents about 8.6% of the contribution from Gold Bar WWTP. There were insufficient data to include TKN in the loading analysis or in the WASP modelling below.
The relative contributions of the Project in the Cumulative Case were almost identical to those in the Application Case (Table 7.7-3).
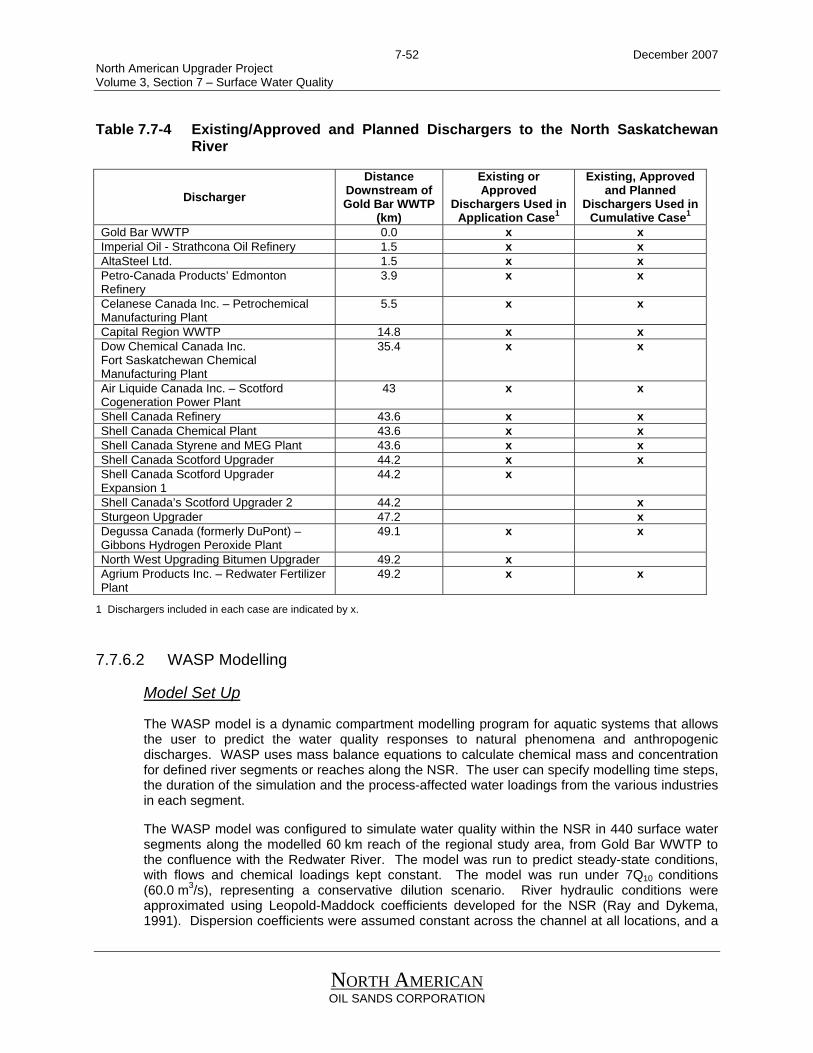
7-52 December 2007 North American Upgrader Project Volume 3, Section 7 – Surface Water Quality
NORTH AMERICAN OIL SANDS CORPORATION
Table 7.7-4 Existing/Approved and Planned Dischargers to the North Saskatchewan River
Discharger Distance
Downstream of Gold Bar WWTP
(km)
Existing or Approved
Dischargers Used in Application Case1
Existing, Approved and Planned
Dischargers Used in Cumulative Case1
Gold Bar WWTP 0.0 x x Imperial Oil - Strathcona Oil Refinery 1.5 x x AltaSteel Ltd. 1.5 x x Petro-Canada Products’ Edmonton Refinery
3.9 x x
Celanese Canada Inc. – Petrochemical Manufacturing Plant
5.5 x x
Capital Region WWTP 14.8 x x Dow Chemical Canada Inc. Fort Saskatchewan Chemical Manufacturing Plant
35.4 x x
Air Liquide Canada Inc. – Scotford Cogeneration Power Plant
43 x x
Shell Canada Refinery 43.6 x x Shell Canada Chemical Plant 43.6 x x Shell Canada Styrene and MEG Plant 43.6 x x Shell Canada Scotford Upgrader 44.2 x x Shell Canada Scotford Upgrader Expansion 1
44.2 x
Shell Canada’s Scotford Upgrader 2 44.2 x Sturgeon Upgrader 47.2 x Degussa Canada (formerly DuPont) – Gibbons Hydrogen Peroxide Plant
49.1 x x
North West Upgrading Bitumen Upgrader 49.2 x Agrium Products Inc. – Redwater Fertilizer Plant
49.2 x x
1 Dischargers included in each case are indicated by x.
7.7.6.2 WASP Modelling
Model Set Up
The WASP model is a dynamic compartment modelling program for aquatic systems that allows the user to predict the water quality responses to natural phenomena and anthropogenic discharges. WASP uses mass balance equations to calculate chemical mass and concentration for defined river segments or reaches along the NSR. The user can specify modelling time steps, the duration of the simulation and the process-affected water loadings from the various industries in each segment.
The WASP model was configured to simulate water quality within the NSR in 440 surface water segments along the modelled 60 km reach of the regional study area, from Gold Bar WWTP to the confluence with the Redwater River. The model was run to predict steady-state conditions, with flows and chemical loadings kept constant. The model was run under 7Q10 conditions (60.0 m3/s), representing a conservative dilution scenario. River hydraulic conditions were approximated using Leopold-Maddock coefficients developed for the NSR (Ray and Dykema, 1991). Dispersion coefficients were assumed constant across the channel at all locations, and a

7-53North AmericVolum
December 2007an Upgrader Project
e 3, Section 7 – Surface Water Quality
river temperature of 2ºC was applied. The calibration procedures for the model match those used by an analogous facility, and consisted of adjusting lateral dispersion coefficients so that simulated dye concentrations matched the results of an earlier modelling study by Golder (1995). To verify the performance of the calibrated WASP model for the NSR, the model was applied to simulate recently measured water quality parameters in the NSR. Loadings of the modelled parameters were obtained from the loading analysis described above.
NORTH AMERICAN OIL SANDS CORPORATION

7-54 December 2007 North American Upgrader Project Volume 3, Section 7 – Surface Water Quality
NORTH AMERICAN OIL SANDS CORPORATION
Table 7.7-5 Loading Analysis of Point Sources on the NSR within the Regional Study Area – Application Case
Point Source Ammonia (kg/d)
Total P (kg/d)
Sulphide (kg/d)
Phenols (kg/d)
COD (kg/d)
BOD (kg/d)
TDS (kg/d)
Sodium (kg/d)
Chloride (kg/d)
Sulphate (kg/d)
Fe (kg/d)
Al (kg/d)
Zn (kg/d)
Ni (kg/d)
NSR Background 72 153 0.511 0.511 2,557 5,115 961,597 14,833 4,399 228,635 2,823 1,228 10.7 3.58 Sturgeon River 50.8 12.6 NA NA 5,076 165 NA NA 1,248 NA NA NA NA NA Gold Bar WWTP 817 211.5 1.86 NA 9,300 2,523 175,770 28241 21421 48670 21.1 20.2 18.6 4.2 AltaSteel Ltd. NA NA NA NA 6.72 NA NA NA NA NA 0.106 0.037 NA NA Celanese Canada Inc. – Petrochemical Manufacturing Plant
4.1 NA NA NA 261 65.2 NA NA NA NA NA NA NA NA
Air Liquide Canada – Scotford Cogeneration Power Plant
NA 0.32 NA NA 116 NA 1601 NA NA NA NA NA NA NA
Imperial Oil - Strathcona Oil Refinery 1.75 NA 0.67 0.13 225 NA 4855 803.4 1390.0 1365 1.2 1.23 0.65 0.010
Petro-Canada Products Edmonton Refinery 2.22 1.12 0.07 0.0169 209 NA NA 841.2 NA NA 4.43 3.65 0.40 0.025
Capital Region WWTP 1,052 137 1.425 NA 3571 1478 51,075 7,950.0 5872.5 14,100 8.0 7.35 5.33 1.02 Dow Chemical – Fort Saskatchewan Chemical Manufacturing Plant
2.58 6.23 NA 0.0003 529 81.6 3,789 731.3 263 1,345 0.8 0.79 0.07 0.04
Shell Canada Scotford Refinery 0.880 NA 0.034 0.057 184 NA 2,151 434.2 501.3 675 1.1 NA NA NA
Shell Canada Scotford Chemical Plant NA NA NA NA NA 22.8 NA NA NA NA NA NA NA NA
Shell Canada Scotford Styrene and MEG Plant
NA NA NA NA 225 26.7 NA NA NA NA NA NA NA NA
Shell Canada Scotford Upgrader 2.09 69.6 0.154 0.067 316 30.6 39,816 2712 960 7416 4.3 2.05 0.30 0.04
Shell Scotford Upgrader Expansion 1 33.6 43.2 1.2 0.48 744 192 23,438 1625 576 4442 1.68 9.84 11.9 0.216
Degussa Canada – Gibbons Hydrogen Peroxide Plant
0.081 0.724 NA NA 12.2 1.7 NA NA NA NA NA NA NA NA
North West Upgrading Bitumen Upgrader 56.9 2.16 5.7 11.4 513 171 9132 2587 1468 2076 0.72 1.01 2.28 2.28
Agrium Products Inc. - Redwater Fertilizer Plant 10.1 8.4 NA NA 167 21.0 NA NA NA NA NA NA NA NA
North American Upgrader Project 15 3.82 0.076 0.24 1965 333 11,909 1,630 2,124 1238 11.5 2.79 0.30 0.07
Total Loadings 2121 650 12 13 25,977 10,226 1,285,133 62,388 40,223 309,963 2878 1276 51 12 Percent of Total Loading Attributable to Project
0.7 0.6 0.7 1.9 7.6 3.3 0.9 2.6 5.3 0.4 0.4 0.2 0.6 0.6
Data obtained from AENV monitoring data; Data obtained from Regulatory Approvals; Data predicted from EIA; NA=no data available
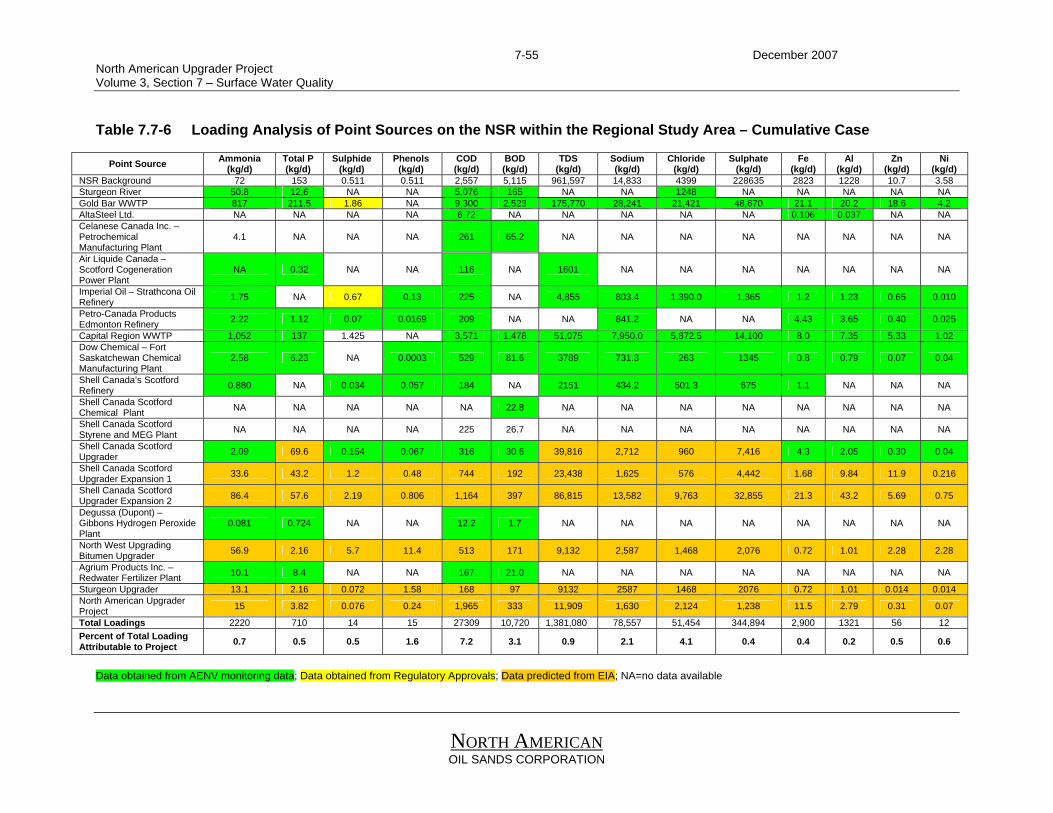
7-55 December 2007 North American Upgrader Project Volume 3, Section 7 – Surface Water Quality
NORTH AMERICAN OIL SANDS CORPORATION
Table 7.7-6 Loading Analysis of Point Sources on the NSR within the Regional Study Area – Cumulative Case
Point Source Ammonia (kg/d)
Total P (kg/d)
Sulphide (kg/d)
Phenols (kg/d)
COD (kg/d)
BOD (kg/d)
TDS (kg/d)
Sodium (kg/d)
Chloride (kg/d)
Sulphate (kg/d)
Fe (kg/d)
Al (kg/d)
Zn (kg/d)
Ni (kg/d)
NSR Background 72 153 0.511 0.511 2,557 5,115 961,597 14,833 4399 228635 2823 1228 10.7 3.58 Sturgeon River 50.8 12.6 NA NA 5,076 165 NA NA 1248 NA NA NA NA NA Gold Bar WWTP 817 211.5 1.86 NA 9,300 2,523 175,770 28,241 21,421 48,670 21.1 20.2 18.6 4.2 AltaSteel Ltd. NA NA NA NA 6.72 NA NA NA NA NA 0.106 0.037 NA NA Celanese Canada Inc. – Petrochemical Manufacturing Plant
4.1 NA NA NA 261 65.2 NA NA NA NA NA NA NA NA
Air Liquide Canada – Scotford Cogeneration Power Plant
NA 0.32 NA NA 116 NA 1601 NA NA NA NA NA NA NA
Imperial Oil – Strathcona Oil Refinery 1.75 NA 0.67 0.13 225 NA 4,855 803.4 1,390.0 1,365 1.2 1.23 0.65 0.010
Petro-Canada Products Edmonton Refinery 2.22 1.12 0.07 0.0169 209 NA NA 841.2 NA NA 4.43 3.65 0.40 0.025
Capital Region WWTP 1,052 137 1.425 NA 3,571 1,478 51,075 7,950.0 5,872.5 14,100 8.0 7.35 5.33 1.02 Dow Chemical – Fort Saskatchewan Chemical Manufacturing Plant
2.58 6.23 NA 0.0003 529 81.6 3789 731.3 263 1345 0.8 0.79 0.07 0.04
Shell Canada’s Scotford Refinery 0.880 NA 0.034 0.057 184 NA 2151 434.2 501.3 675 1.1 NA NA NA
Shell Canada Scotford Chemical Plant NA NA NA NA NA 22.8 NA NA NA NA NA NA NA NA
Shell Canada Scotford Styrene and MEG Plant NA NA NA NA 225 26.7 NA NA NA NA NA NA NA NA
Shell Canada Scotford Upgrader 2.09 69.6 0.154 0.067 316 30.6 39,816 2,712 960 7,416 4.3 2.05 0.30 0.04
Shell Canada Scotford Upgrader Expansion 1 33.6 43.2 1.2 0.48 744 192 23,438 1,625 576 4,442 1.68 9.84 11.9 0.216
Shell Canada Scotford Upgrader Expansion 2 86.4 57.6 2.19 0.806 1,164 397 86,815 13,582 9,763 32,855 21.3 43.2 5.69 0.75
Degussa (Dupont) – Gibbons Hydrogen Peroxide Plant
0.081 0.724 NA NA 12.2 1.7 NA NA NA NA NA NA NA NA
North West Upgrading Bitumen Upgrader 56.9 2.16 5.7 11.4 513 171 9,132 2,587 1,468 2,076 0.72 1.01 2.28 2.28
Agrium Products Inc. – Redwater Fertilizer Plant 10.1 8.4 NA NA 167 21.0 NA NA NA NA NA NA NA NA
Sturgeon Upgrader 13.1 2.16 0.072 1.58 168 97 9132 2587 1468 2076 0.72 1.01 0.014 0.014 North American Upgrader Project 15 3.82 0.076 0.24 1,965 333 11,909 1,630 2,124 1,238 11.5 2.79 0.31 0.07
Total Loadings 2220 710 14 15 27309 10,720 1,381,080 78,557 51,454 344,894 2,900 1321 56 12 Percent of Total Loading Attributable to Project 0.7 0.5 0.5 1.6 7.2 3.1 0.9 2.1 4.1 0.4 0.4 0.2 0.5 0.6
Data obtained from AENV monitoring data; Data obtained from Regulatory Approvals; Data predicted from EIA; NA=no data available

7-56 December 2007 North American Upgrader Project Volume 3, Section 7 – Surface Water Quality
The model was applied to two of the four parameters listed above: chloride and COD. As WASP does not have the algorithms for handling COD, this parameter was run as a conservative compound in WASP’s toxicant module, with a small decay constant equivalent to one-tenth of the value normally assigned to carbonaceous BOD (Wool et al., 2004). Chloride was modelled as representing the release of major ions, including sodium (its most common cation) and total dissolved solids. Chloride was also modelled as a conservative compound. Since the contributions of the Project to the loadings of both ammonia and total phosphorus were both quite small (0.7% and 0.6% of the total loads, respectively), these parameters were not modelled in WASP. These two nutrients have been modelled in WASP in previous applications. Initial and boundary (upstream) conditions were assumed to be winter concentrations of COD and chloride reported in Focus (2005) at Dawson Bridge.
Results of WASP Modelling
The results of the loadings on the NSR for the Baseline Case and the Application Case for chloride and COD are presented in the following sections. The plots present pictorially the dispersion of the loadings in Table 7.7-2 and the effects of overlapping plumes from the various point sources. The raw model output is provided in Appendix 7C. The WASP modelling results for the Cumulative Case were very similar to those for the Application Case. Results are included in Appendix 7C.
Chloride
The WASP simulations for chloride are shown in Figures 7.7-1 to 7.7-5. These simulations are representative of the major ion loadings to the NSR, including sodium and TDS. Figure 7.7-1 presents the simulation for the Baseline Case. The background chloride concentration upstream of Gold Bar WWTP is 0.83 mg/L at Dawson Bridge. Immediately downstream of this facility, the concentration rises dramatically to 27.0 mg/L. As suggested in the CORMIX modelling of the proposed effluent discharge from the Project, the effluent plume from Gold Bar WWTP hugs the right bank of the NSR and slowly spreads horizontally across the river. Loadings of chloride from Imperial Oil’s Strathcona Oil Refinery at 1.5 km downstream and Petro-Canada’s Sturgeon Upgrader 3.9 km downstream are indistinguishable in the large Gold Bar WWTP plume. Another large loading of chloride is evident from Capital Region WWTP at 14.8 km downstream, when the concentration along the right bank rises from 12.5 mg/L to 21.5 mg/L. A small increase in chloride concentration in the NSR is attributable to loading from Dow Chemical’s Fort Saskatchewan Chemical Manufacturing Plant 35.4 km downstream. The discharge of the Sturgeon River to the NSR 38 km downstream results in an increase of about 1 mg/L on the left bank. The Shell Canada Scotford Complex, including the Shell Canada Scotford Refinery and the Shell Canada Scotford Upgrader, account for an increase of 3.3 mg/L along the right bank at 44 km downstream. Degussa’s Gibbons Hydrogen Peroxide Manufacturing Plant, North West Upgrading’s Bitumen Upgrader and Agrium Products’ Redwater Fertilizer Plant account for an increase of 2.2 mg/L on the left bank at 49 km downstream. At the end of the WASP simulation, the chloride concentration across the river ranged from 5.65 mg/L to 10.32 mg/L, for an average of 7.33 mg/L. This value is twice the median winter concentration chloride measured at Pakan downstream (3.6 mg/L; Table 7.7-3). The higher predicted values are likely the result of the use of the very low 7Q10 flow in the model.
Figures 7.7-2 and 7.7-3 present the WASP simulation for the Application Case for the entire RSA, and a small section of the NSR in the vicinity of the Project (close-up view). Under the application scenario, the chloride discharge from the Project at 49 km downstream is evident on the right bank in Figure 7.7-3, and results in a concentration increase along this bank of 2.7 mg/L. At the end of the simulation, 60 km downstream of Gold Bar WWTP, the chloride concentration across the NSR ranged from 5.66 mg/L to11.84 mg/L, for an average concentration of 7.74 mg/L. The difference between the average concentrations of chloride in the NSR attributable to the Project (Application Case–Baseline Case) is 0.41 mg/L. This value is very close to the incremental increase of 0.4 mg/L in chloride predicted from mass balance calculations conducted during the CORMIX dispersion modelling (Table 7.7-3).
Figure 7.7-4 presents the Cumulative Case scenario that includes the contributions of the proposed Sturgeon Upgrader and the Scotford Upgrader Expansion 2. The average concentration of chloride across the NSR at the end of the simulation for this scenario was 7.75 mg/L.
NORTH AMERICAN OIL SANDS CORPORATION

7-57 December 2007 North American Upgrader Project Volume 3, Section 7 – Surface Water Quality
Figure 7.7-5 presents the average chloride concentrations across the NSR as a function of distance downstream for the Baseline, Application and Cumulative Cases. The differences between the baseline and application lines in Figure 7.7-4 indicate the incremental increase in chloride attributable to the Project.
COD
The results of the WASP simulation for COD in the NSR are presented in Figures 7.7-6 to 7.7-10. COD concentrations in the NSR upstream of the Gold Bar WWTP are 0.5 mg/L (Focus, 2005). In the Baseline Case, as a result of the loading of 9,300 kg/d from Gold Bar WWTP, the COD concentration along the left bank of the NSR is predicted to reach 11.6 mg/L. As before, the COD plume from Gold Bar hugs the right bank as it slowly mixes across the river. The COD contributions from AltaSteel Ltd., Imperial Oil’s Strathcona Oil Refinery and Celanese Canada’s Petrochemical Manufacturing Plant downstream of Gold Bar WWTP are lost in the large Gold Bar plume. A loading of 3,571 kg/d from Capital Region WWTP results in another major increase in COD, to 9.1 mg/L along the right bank. The effects of COD loading from the Sturgeon River at 38.5 km, the Shell Canada Scotford Complex at 44 km downstream, Degussa Gibbons Plant at 49.1 km and Agrium Redwater Fertilizer facilities at 49.2 km downstream are small but evident in the plots. Dilution of the plumes from the various point sources continues downstream until the end of the simulation at Vinca Bridge, when the average river concentration is 1.37 mg/L.
The loading of 1,965 kg/d from the Project in the Application Case is fully visible on the right bank at 49 km downstream (Figures 7.7-7 and 7.7-8). The COD concentration increases by 2.4 mg/L at the point of discharge. At the end of the simulation, 60 km downstream of Gold Bar WWTP, the average river concentration was 1.63 mg/L. The difference between the two average concentrations of COD represents the incremental increase in COD attributable to the Project (0.26 mg/L). This value is again close to the incremental increase of 0.36 mg/L predicted from the mass balance calculations conducted during the CORMIX dispersion modelling (Table 7.6-3). The values predicted during the CORMIX modelling may be higher because the oxidative decay of COD was not taken into account in these calculations, as it was in the WASP model.
Figure 7.7-10 presents the Cumulative Case scenario. The average concentration of COD across the NSR at the end of the simulation for this scenario was 1.78 mg/L.
The effects of the Project on the average river concentrations of COD along the length of the NSR are presented in Figure 7.7-11. This incremental increase in COD attributable to the Project is extremely small and analytically indistinguishable from the Baseline Case.
7.7.6.3 Summary of Residual Effects in the Regional Study Area
The loading analysis and the WASP modelling corroborate the conclusions of the CORMIX analysis on the effects of the proposed effluent discharge on water quality in the NSR. All three analyses indicate that the contribution of the Project to the loading of most parameters to the NSR is extremely small, with final concentrations analytically indistinguishable from baseline concentrations. Incremental increases in major ion concentrations (chloride, sodium and sulphate) are predicted, although no guideline exceedances are anticipated. An incremental increase in reduced forms of nitrogen is also predicted, although insufficient data were available to determine the relative importance of the Project to the overall loading of this parameter to the NSR from all sources. The residual effects of the discharge of treated effluent on the RSA will be negative in direction, regional in extent, low in magnitude, medium-term in duration, continual in frequency and reversible in the medium-term. The residual effects will be low in magnitude because the incremental increases in certain water quality parameters attributable to the Project are within acceptable protective standards (i.e., water quality guidelines; Section 7.4.1). The confidence in this prediction is high. The residual effects of the discharge of treated effluent on the NSR have an overall impact rating of low.
NORTH AMERICAN OIL SANDS CORPORATION

7-58 December 2007 North American Upgrader Project Volume 3, Section 7 – Surface Water Quality
Figure 7.7-2 Predicted Concentrations of Chloride Along the North Saskatchewan River for the Baseline Case
Petro-Canada
Imperial Oil Strathcona Refinery
Gold Bar WWTPDow Chemicals Inc.
Shell Scottford Complex
Sturgeon River
North West UpgraderAgrium Redwater
Degussa Canada Inc.(Dupont Canada Inc.)Chloride (mg/L)
Baseline Case
Kilometres Downstream of Gold Bar WWTP
5 10 15 20 25 30 35 40 45 50 55
Rel
ativ
e D
ista
nce
from
Rig
ht B
ank
0.2
0.4
0.6
0.8
2 4 6 8 10 12 14 16 18 20 22 24 26
Capital Region WWTP
Figure 7.7-3 Predicted Concentrations of Chloride Along the North Saskatchewan River for the Application Case
Petro-Canada
Imperial Oil Strathcona Refinery
Gold Bar WWTP
Capital Region WWTP
Dow Chemicals Inc.
North West UpgraderAgrium Redwater
Degussa Canada Inc.(Dupont Canada Inc.)Chloride (mg/L)
Application Case
Kilometres Downstream of Gold Bar WWTP
5 10 15 20 25 30 35 40 45 50 55
Rel
ativ
e D
ista
nce
from
Rig
ht B
ank
2
4
6
8
102 4 6 8 10 12 14 16 18 20 22 24 26
North AmericanUpgrader
Shell Scottford Complex
Sturgeon River
NORTH AMERICAN OIL SANDS CORPORATION

7-59 December 2007 North American Upgrader Project Volume 3, Section 7 – Surface Water Quality
Figure 7.7-4 Predicted Concentrations of Chloride Along the North Saskatchewan River Near the Project for the Application Case (Close-up View)
Chloride (mg/L)Application Case
Kilometres Downstreamof Gold Bar WWTP
46 47 48 49 50 51 52 53 54 55 56 57 58
Rel
ativ
e D
ista
nce
from
Rig
ht B
ank
2
4
6
8
105.25 7.00 8.75 10.50 12.25 14.00
North American Upgrader
Shell Scottford Complex
Agrium Redwater
Dupont (Degussa) North West Upgrader
Figure 7.7-5 Predicted Concentrations of Chloride Along the North Saskatchewan River for the Cumulative Case
Petro-Canada
Imperial Oil Strathcona Refinery
Gold Bar WWTP
Dow Chemicals Inc.Shell Scottford Complex
Chloride (mg/L)Cumulative Case
Kilometres Downstream of Gold Bar WWTP
5 10 15 20 25 30 35 40 45 50 55
Rel
ativ
e D
ista
nce
from
Rig
ht B
ank
2
4
6
8
102500 5000 7500 10000 12500 15000 17500 20000 22500 25000 27500
Capital Region WWTP North AmericanUpgrader
Sturgeon Upgrader
Degussa Canada Inc.(Dupont Canada Inc.)
North West UpgraderAgrium Redwater
Sturgeon River
NORTH AMERICAN OIL SANDS CORPORATION

7-60 December 2007 North American Upgrader Project Volume 3, Section 7 – Surface Water Quality
Figure 7.7-6 Average Concentration of Chloride Along the North Saskatchewan River Downstream of Gold Bar WWTP
6.4
6.8
7.2
7.6
8.0
44.5 45.5 47 49 50.5 52.5 55.5 58.5
Kilometres Downstream of Gold Bar WWTP
Chl
orid
e C
once
ntra
tion
(mg/
L)
baseline caseapplication casecumulative case
NORTH AMERICAN OIL SANDS CORPORATION

7-61 December 2007 North American Upgrader Project Volume 3, Section 7 – Surface Water Quality
Figure 7.7-7 Predicted Concentrations of COD Along the North Saskatchewan River for the Baseline Case
Petro-Canada
Imperial Oil Strathcona Refinery
Gold Bar WWTPDow Chemicals Inc.
Shell Scottford Complex
Sturgeon River
COD (mg/L)Baseline Case
Kilometres Downstream of Gold Bar WWTP
5 10 15 20 25 30 35 40 45 50 55
Rel
ativ
e D
ista
nce
from
Rig
ht B
ank
0.2
0.4
0.6
0.8
1 2 3 4 5 6 7 8 9 10 11
Capital Region WWTP
North West UpgraderAgrium Redwater
(Dupont Canada Inc.)Degussa Canada Inc.
Figure 7.7-8 Predicted Concentrations of COD Along the North Saskatchewan River for the Application Case
Petro-Canada
Imperial Oil Strathcona Refinery
Gold Bar WWTP
Capital Region WWTP
Dow Chemicals Inc.Shell Scottford Complex
COD (mg/L)Application Case
Kilometres Downstream of Gold Bar WWTP
5 10 15 20 25 30 35 40 45 50 55
Rel
ativ
e D
ista
nce
from
Rig
ht B
ank
2
4
6
8
101 2 3 4 5 6 7 8 9 10 11
North AmericanUpgrader
Sturgeon River North West UpgraderAgrium Redwater
Degussa Canada Inc.(Dupont Canada Inc.)
NORTH AMERICAN OIL SANDS CORPORATION

7-62 December 2007 North American Upgrader Project Volume 3, Section 7 – Surface Water Quality
Figure 7.7-9 Predicted Concentration of COD Along the North Saskatchewan River Near the Project for the Application Case (Close-up View)
COD (mg/L)Application Case
Kilometres Downstreamof Gold Bar WWTP
46 47 48 49 50 51 52 53 54 55 56 57 58
Rel
ativ
e D
ista
nce
from
Rig
ht B
ank
2
4
6
8
101.0 1.5 2.0 2.5 3.0 3.5 4.0 4.5 5.0 5.5
Shell Scottford Complex
North American Upgrader
Agrium Redwater
Dupont (Degussa) North West Upgrader
Figure 7.7-10 Predicted Concentrations of COD Along the North Saskatchewan River for the Cumulative Case
Petro-Canada
Imperial Oil Strathcona Refinery
Gold Bar WWTP
Capital Region WWTP
Dow Chemicals Inc. Shell Scottford Complex
COD (mg/L)Cumulative Case
Kilometres Downstream of Gold Bar WWTP
5 10 15 20 25 30 35 40 45 50 55
Rel
ativ
e D
ista
nce
from
Rig
ht B
ank
2
4
6
8
101 2 3 4 5 6 7 8 9 10 11
North AmericanUpgrader
Sturgeon River
Sturgeon Upgrader North West UpgraderAgrium Redwater
Degussa Canada Inc.(Dupont Canada Inc.)
NORTH AMERICAN OIL SANDS CORPORATION

7-63 December 2007 North American Upgrader Project Volume 3, Section 7 – Surface Water Quality
Figure 7.7-11 Average Concentration of COD in the North Saskatchewan River Downstream of Gold Bar WWTP
1.1
1.3
1.5
1.7
1.9
2.1
2.3
2.5
44.5 45.5 47 49 50.5 52.5
Kilometres Downstream of Gold Bar WWTP
CO
D C
once
ntra
tion
(mg/
L)
baseline case
application case
cumulative case
55.5 58.5
NORTH AMERICAN OIL SANDS CORPORATION

7-64 December 2007 North American Upgrader Project Volume 3, Section 7 – Surface Water Quality
7.7.6.4 Stormwater Control and Treatment
All surface runoff during both the construction and operations phases will be directed to either the potentially contaminated stormwater pond, the oily stormwater pond or one of four clean stormwater ponds in the undeveloped areas of the site (3) and the administration area (1). The collected stormwater will either be reused within the plant, released to the North Wetland Complex or treated as required and released only when it meets provincial discharge criteria. No surface runoff or process-affected runoff will be directly released to surface waters. Appropriate containment and spill responses will reduce the likelihood for contaminants being released to surface waters.
With the planned mitigations for surface runoff, the likelihood for substantial releases of either sediment or process-related chemicals to surface waters is low. Therefore, only minimal changes to surface water quality are predicted. Suspended sediment concentrations in local surface waters might change measurably, but are expected to remain within natural variation. Therefore, the residual effects of surface runoff on surface water quality will be low in magnitude, medium-term in duration, reversible and will have low environmental consequence. The residual effects from stormwater discharge on surface water quality will have an overall impact rating of low.
Stormwater will be collected and retained on-site through site grading, berms and a network of drains, sewers, ditches and ponds. The stormwater management and site drainage system is shown in Figure 6.6-1 of the Hydrology section (Volume 3, Section 6). The site will be graded, and perimeter berms and ditches constructed, as required, to prevent stormwater runoff from leaving the site by overland flow. The ponds used to temporarily store stormwater collected from the developed areas of the Project site will be lined to prevent accidental contamination to underlying groundwater. In addition, the process areas will be surfaced with concrete and/or asphalt to limit stormwater infiltration in these areas. Stormwater collected on the developed areas of the project site is categorized as either “potentially contaminated stormwater” or “oily stormwater” and will be directed to the appropriate containment pond. Stormwater collected on the undeveloped areas of the site and the administration area is categorized as “clean stormwater,” and will be used to supplement raw water, released to the North Wetland Complex, or transferred to the effluent pond.
Stormwater runoff collected from the coke-handling area will be contained and recycled for coke wetting. Excess runoff from this area will be used for coke-cutting operations. Only under conditions of excessive runoff will stormwater from the coke-handling area be diverted to the oily stormwater pond.
Potentially Contaminated Stormwater
Potentially contaminated stormwater is defined as surface drainage collected from areas of the site that have a low risk of hydrocarbon contamination. These areas generally include portions of the site that are outside the processing areas. The potentially contaminated stormwater will be collected in a series of open ditches that drain to the potentially contaminated stormwater pond. Clean stormwater from the undeveloped Project area and administration areas will be collected in four satellite holding ponds.
Following a storm event, the contents of the potentially contaminated stormwater pond will be sampled for hydrocarbon contamination. Clean stormwater will be directed to either the raw water pond for process use, or to the effluent pond for river discharge. Clean stormwater may also be released periodically to the North Wetland Complex to maintain natural water levels. If it is determined that the stormwater is contaminated, it will be sent to the wastewater treatment unit for treatment. Free-phase hydrocarbon that collects on the surface of the potentially contaminated stormwater pond will be removed using a floating skimmer and vacuum truck.
NORTH AMERICAN OIL SANDS CORPORATION

7-65 December 2007 North American Upgrader Project Volume 3, Section 7 – Surface Water Quality
Clean stormwater retained in the four satellite stormwater holding ponds that meets release criteria will be periodically released to either the raw water pond, effluent pond or North Wetland Complex. Contaminated water from the satellite stormwater ponds will be transferred to the wastewater treatment unit.
Water collected within the bermed area of the tank farm following a storm event will be retained and analyzed for hydrocarbon contamination. Stormwater that meets release criteria will be released to the potentially contaminated stormwater system, and contaminated stormwater discharged to the oily stormwater sewer for treatment.
The potentially contaminated stormwater system is designed to provide stormwater retention for a 1:25-year, 24-hour storm event, plus freeboard. For the 1:25-year storm event, the pond levels will not exceed the invert of inlet sewers or ditches. For storm events that exceed the 1:25-year storm, water will be stored in the ponds above the inlet invert level, resulting in a backwater effect in the sewer and ditches.
Oily Stormwater Treatment
Oily stormwater is defined as water that is collected within processing areas that is at risk of hydrocarbon contamination. Oily stormwater will be collected within the processing areas through a series of catchbasins and underground sewers. The sewer system will include water seals to contain fire within any one catchment.
Oily stormwater collected from the various processing areas will be diverted to the oily stormwater collection hub, which incorporates lift pumps to transfer oily stormwater to the wastewater treatment facility. Oily stormwater in excess of the capacity of these pumps will overflow to the oily stormwater pond for temporary storage. Free-phase hydrocarbon will be retained in the collection hub for removal by vacuum truck, and free-phase hydrocarbon that forms on the surface of the oily stormwater pond will be removed with a floating skimmer and vacuum truck. The contents of the oily stormwater pond will be pumped to the wastewater treatment facility following the storm event. The oily stormwater system is designed to provide storage below the sewer invert for the greater of a 1:25-year storm event, or a fire event.
7.7.6.5 Containment and Collection of Spills
Spills, overfills and stormwater runoff will be contained, treated and disposed of in conformance with regulatory requirements. Product-transfer areas will be paved with concrete and graded, curbed or bermed to contain spills or overfills that might occur during the transfer process. Any spills in the plant will be contained through the stormwater system and routed for treatment. All storage tanks containing hydrocarbons will be protected with a secondary containment system and a leak detection system as per the appropriate provincial guidelines. The residual effects from spills on surface water quality will have an overall impact rating of low.
The water collected in the bermed tank areas will be considered contaminated until tested. Water collected in the bermed area will be held and tested before it is released. The drainage from bermed tank areas will be controlled by a sump and valve located at the low point of the area. Clean stormwater will be released to the potentially contaminated stormwater system, and contaminated stormwater discharged to the oily stormwater sewer for treatment.
Storage Tanks
Various hydrocarbon products from the process units and chemicals necessary for activities such as water treating will be stored in specific tanks. There will be no underground storage tanks. All tanks will meet the CCME Environmental Code of Practice for Aboveground and Underground
NORTH AMERICAN OIL SANDS CORPORATION
7-66 December 2007 North American Upgrader Project Volume 3, Section 7 – Surface Water Quality
Storage Tank Systems Containing Petroleum and Allied Petroleum Products (CCME, 1993) and the AENV Secondary Containment for Aboveground Storage Tanks (AEP, 1997). Secondary containment will be installed in accordance with Alberta Energy and Utilities Board (EUB) Directive 055: Storage Requirements for the Upstream Petroleum Industry (EUB, 2001), and will include the following minimum requirements:
• A synthetic, impervious liner will be placed over the containment area and under the storage tanks. The liner will be 60-mil (0.060 inches or 1.52 mm) thick and will be keyed into the berm walls.
• A leak detection and collection system will be installed under each storage tank. A porous layer, consisting of sand or gravel, or a combination, will be placed over the synthetic liner and under the storage tanks to protect the liner and permit leaks to flow to a collection point in the bermed area. A collection pipe system will be installed in the porous layer and will be easily accessible for visual inspection. Each month the bermed area, storage tanks and visible liners will be inspected for signs of leaks or spills.
Custody transfer meters will be installed on feed and product pipelines for dilbit, diluent, naphtha and gas oil for leak detection and measurement.
Spill Response Procedures
In addition to engineered protection measures to protect against surface water contamination during operations, the following management steps will be taken to address spill readiness and response:
• A comprehensive spill response plan will be developed and implemented that provides for quick spill response, containment and cleanup.
• Appropriate spill control and treatment procedures will be established for each group of chemicals and hydrocarbons used and produced during the upgrading process, including containment, to prevent the spread of the material to other areas and treatment to render materials safe.
• All employees will receive training in spill prevention, control and reporting, and on the sensitivities of the local geography and surface waters to spills.
• Process units will include strategically placed spill kits to assist with spill containment, if required.
• All spills will be reported internally. Spills with volumes above reporting thresholds will be reported to regulators.
7.7.7 Effects of Acidic Emissions on Surface Water Quality in the RSA
The acidification of lakes has been linked in Europe and eastern North America to the deposition of acidifying emissions from industrial and municipal facilities. Oxides of sulphur and nitrogen (SOx and NOx) in these emissions result in the formation of acids that can reduce the acid-neutralization capacity of soils and surface waterbodies, and cause adverse effects on aquatic biota. Acidifying compounds will be emitted from the Upgrader throughout the entire operations phase of the Project.
The regional study area for the acidification assessment includes all lands covered by the Cumulative Case 0.17 keq H+/ha/y PAI isopleth (Figure 7.2-3). A level of acid deposition
NORTH AMERICAN OIL SANDS CORPORATION

7-67 December 2007 North American Upgrader Project Volume 3, Section 7 – Surface Water Quality
NORTH AMERICAN OIL SANDS CORPORATION
equivalent to 0.17 keq H+/ha/y level triggers increased monitoring of potentially affected waterbodies for acidification (CASA–AENV, 1999; Foster et al., 2001). As the PAI is largely dominated by contributions from the City of Edmonton, the analysis is concentrated on the eastern portion of the region where the potential effects of the Project would be most apparent.
In most assessments, the Henriksen steady-state model is applied to calculate critical loads for all lakes within the RSA for which water quality data are available. These lake-specific critical loads are then compared to the PAI at each lake modelled during the air quality assessment (Volume 2, Section 2). An exceedance of the critical load of acidity of a lake by the PAI implies that there is a potential for acidification of the lake. However, it does not mean that acidification is a certainty, or that it will occur imminently.
The Henriksen steady-state model could not be applied to the eight lakes in this study. The Henriksen model assumes that acid neutralizing capacity (ANC), in the form of base cations, is exported to each lake in surface runoff. The runoff, which is one of the terms of the model, is equivalent to the amount of water that would be measured at the lake outflow. Most of the lakes, however, do not have any outflow on a mean annual basis. Hence, there was no measurable runoff. In some cases, when surface evaporation is accounted for, the runoff is actually negative.
The lakes appear to receive a great deal of their water input from groundwater seepage. This is suggested in the extremely high conductivities and values of ANC for these lakes. The chemistry of the study lakes and the predicted PAI at each lake are presented in Table 7.7-7. The predicted PAI is derived from the air emissions assessment (Volume 2, Section 2). ANC ranged from 3,020 ueq/L in Oster Lake to 8,120 ueq/L in Cooking Lake. These extremely high values for ANC imply that the lakes are highly buffered and resistant to acidification.
The potential for acidification of these lakes between the Baseline Case and the Application Case is considered extremely low for the following reasons:
1. The high ANC of each lake. Lakes as highly buffered as these have a very low risk of acidification.
2. The incremental increase in PAI between Baseline and Application Cases is extremely small, and ranges from 0.003 keq H+/ha/y to 0.010 keq H+/ha/y.
The incremental increase in PAI between Application and Cumulative Cases ranges from 0.017 keq H+/ha/y to 0.113 keq H+/ha/y.
Although a quantitative critical load assessment is not possible, the residual effects of acid emissions on the water quality of regional lakes will be negligible.

7-68 December 2007 an Upgrader Project
e 3, Section 7 – Surface Water Quality
Lake TDS (mg/L)
Conductivity (uS/cm)
Hardness (mg/L)
ANC (Alkalinity)
(ueq/L)
Base Cations (ueq/L)
Lake Area (km2)
Drainage Area (km2)
Runoff (m3/s)
PAI Baseline
Case (keq H+/ha/y)
PAI Application
Case (keq H+/ha/y)
PAI Cumulative
Case (keq H+/ha/y)
Oster 186 329 120 3,020 2,367 1.05 5.6 0 0.304 0.314 0.395 Adamson 209 348 140 3,140 2,603 0.42 4.3 0 0.274 0.282 0.356 Hastings 626 1,050 280 5,580 8,243 8.22 76.4 0 0.111 0.114 0.137 Wanisan 233 406 180 3,000 2,566 2.68 15.7 0 0.148 0.151 0.184 Cooking 1,230 1,870 260 8,120 18,263 42.9 196 0 0.127 0.129 0.146 Tawayik 483 758 180 4,340 6,068 3.79 18.4 0 0.225 0.234 0.308 Astotin 290 504 180 4,760 3,838 5.8 52.2 0 0.213 0.231 0.344 Antler 287 507 148 3,940 3,918 2.4 18.4 0.0004 0.193 0.196 0.223
Table 7.7-7 Lake Chemistry, Hydrology and Potential Acid Input to Eight Regional Study Lakes
NORTH AMERICAN OIL SANDS CORPORATION
North AmericVolum

7-69 December 2007 North American Upgrader Project Volume 3, Section 7 – Surface Water Quality
7.8 Cumulative Effects Assessment
7.8.1 Erosion and Sediment Control
The residual effects of sediment release during construction will not contribute measurably to cumulative effects on surface water quality.
7.8.2 Dewatering
The residual effect of dewatering will not contribute measurably to cumulative effects on surface water quality.
7.8.3 Effects of Effluent Discharge on the LSA and RSA
The residual effects of the discharge of treated effluent on the NSR have an overall impact rating of low.
7.8.4 Surface Water Runoff
Surface runoff will not contribute measurably to cumulative effects on surface water quality.
7.8.5 Spills
Spills will not contribute to cumulative effects on surface water quality.
7.8.6 Acidification of Regional Lakes
PAI will not contribute to acidification of regional lakes.
7.9 Follow-up and Monitoring Water contained in the stormwater ponds will be monitored before it is discharged to the raw water pond, North Wetland Complex or NSR for comparison to regulatory discharge criteria. Monitoring parameters will include pH, turbidity, TSS, ammonia, TP, cyanide and metals.
The Upgrader final effluent will also be monitored before it is discharged to the NSR to ensure it complies with regulatory discharge criteria. Monitoring will consist of continuous temperature, pH and flow measurements, while other water quality variables will be measured through composite sampling. Parameters to be monitored will include pH, turbidity, TSS, major ions, ammonia, nitrates, TP, cyanide, metals, BOD and COD, and other parameters as directed by AENV. AENV will establish the effluent discharge limits and specific monitoring requirements in the Project Approvals.
7.10 Impact Summary The summary of residual effects for surface water quality (after mitigation) are presented in Table 7.10-1. The application of the appropriate measures described above during construction and operations is expected to mitigate the potential effects of runoff and sediment release to local waterbodies and the NSR. Effluent recycling will reduce the volume of effluent and the load of the various chemical parameters in the effluent.
The CORMIX modelling of the predicted effluent discharge indicates that AENV’s mixing zone regulations will be met in the LSA. No chronic water quality guidelines will be exceeded at the
NORTH AMERICAN OIL SANDS CORPORATION

7-70 December 2007 North American Upgrader Project Volume 3, Section 7 – Surface Water Quality
NORTH AMERICAN OIL SANDS CORPORATION
edge of the mixing zone of the proposed treated effluent outfall (1.29 km downstream), with the exception of TP and TN, that are already exceeded upstream of the proposed discharge. These parameters will attain near-background concentrations when the effluent discharge is fully mixed. The increase in TN is due largely to the loading of reduced nitrogen compounds measured as TKN.
Although no guidelines are exceeded, certain major ions, including sodium, chloride and sulphate, are predicted to increase incrementally downstream of the discharge, even after complete mixing. These increments are theoretically measurable, although they fall within the normal seasonal variability of these parameters.
The loading analysis indicated that the Project would contribute almost 7.6% of the COD loading to the NSR. However, the WASP modelling showed that the incremental increase in this parameter would be very small and analytically undetectable.
The release of sediment and surface runoff will have a low impact on local waterbodies. Effluent discharge to the NSR will have a low impact on regional water quality. The effects of dewatering on local waterbodies and the release of acidifying emissions on regional lakes will be negligible. The overall impact of the Project on surface water quality is rated as low.

7-71 December 2007 an Upgrader Project
e 3, Section 7 – Surface Water Quality
Water Quality Issue
Dire
ctio
n of
Im
pact
Exte
nt o
f Im
pact
Mag
nitu
de o
f Im
p act
Dur
atio
n of
Im
p act
Freq
uenc
y of
O
ccur
renc
e of
Im
pact
Perm
anen
ce o
f Im
p act
Leve
l of
Con
fiden
ce
Ove
rall
Impa
ct
Sediment release to waterbodies negative local low short-term occasional reversible high low impact Dewatering negative local negligible - - - - negligible impact Effluent Discharge to the North Saskatchewan River negative regional low medium-term continual reversible high low impact
Surface Runoff release negative local low medium-term occasional reversible high low impact Spills negative local low short-term - - - low impact Acidification of Regional Lakes negative regional negligible - - - - negligible impact
NORTH AMERICAN OIL SANDS CORPORATION
Table 7.10-1 Summary of Residual Effects for Surface Water Quality
North AmericVolum

7-72 December 2007 North American Upgrader Project Volume 3, Section 7 – Surface Water Quality
NORTH AMERICAN OIL SANDS CORPORATION
7.11 Literature Cited Alberta Environment (AENV). 1995. Water Quality Based Effluent Limits Procedures Manual.
Standards and Guidelines Branch. ISBN: 0-7785-0140-X.
AENV. 1997. Guidelines For Secondary Containment For Above Ground Storage Tanks Industrial Waste And Wastewater Branch, Alberta Environmental Protection.
AENV. 1999. Surface Water Quality Guidelines for Use in Alberta. Alberta Environment Report. ISBN: 0-7785-4412-5.
AENV. 2001. Alberta Soil and Water Quality Guidelines for Hydrocarbons at Upstream Oil and Gas Facilities-Volume 2: Guideline Development. ISBN: 0-7785-1899-X.
AENV. 2002a. Analysis of Water Quality Trends for the Long-Term River Network: North Saskatchewan River, 1977-2002. Alberta Environment Report. ISBN: 0-7785-4412-5.
AENV. 2002b. Aquatic Ecosystems Field Sampling Protocols. Alberta Environment Report T/883. ISBN: 0-785-5079-6.
AENV. 2006. Final Terms of Reference for an Environmental Impact Assessment Report for the Proposed Petro-Canada Oil Sands Inc. (PCOSI) Sturgeon Upgrader. Edmonton, AB.
AENV. 2007. Information Synthesis and Initial Assessment of the Status and Health of Aquatic Ecosystems in Alberta. Surface Water Quality, Sediment Quality and Non-fish biota. Report to Alberta Environment. ISBN 978-0-7785-6747-9.
Alberta Environment and Clean Air Strategic Alliance (AENV-CASA). 1999. Application of Critical, Target, and Monitoring Loads for the Evaluation and Management of Acid Deposition. Alberta Environment-Clean Air Strategic Alliance. ISBN: 0-7785-0692-4. pp.67. Clean Air Strategic Alliance for Medium and Long-Term Management of Acidic Emissions.
Alberta Environmental Protection (AEP). 1997. Guidelines for Secondary Containment for Aboveground Storage Tanks. Alberta Environmental Protection. May 16, 1997.
Alberta Energy and Utilities Board (EUB). 2001. Directive 055: Storage Requirements for the Upstream Petroleum Industry. December 2001.
Anderson, A.M. 1986. North Saskatchewan River: Characterization of the Water Quality in the Vicinity of Edmonton (1982-1983). Part I. Introduction, water chemistry, chlorophyll, bacteriology. Water Quality Control Branch, Alberta Environment.
Anderson, A.M. 2005. Overview of pesticide data in Alberta Surface Waters Since 1995. Environmental Monitoring and Evaluation Branch. Alberta Environment.
Baudo, R., J. Giesy and H. Muntau. 1990. Sediments: Chemistry and Toxicity of In-Place Pollutants. Lewis Publishers.
Canadian Council of Ministers of the Environment (CCME). 1993. Environmental Code of Practice for Underground Storage Tank Systems Containing Petroleum Products and Allied Petroleum Products, 1993 Edition. Winnipeg, MB.
CCME. 2001. Canada-wide Standards for Petroleum Hydrocarbons in Soil, Fine-Grain Surface Soils, Ecological Soil Contact.
CCME. 1999 (2006 updates). Canadian Environmental Quality Guidelines. Canadian Council of Ministers of the Environment. Winnipeg, MB.

7-73 December 2007 North American Upgrader Project Volume 3, Section 7 – Surface Water Quality
NORTH AMERICAN OIL SANDS CORPORATION
FEARO. (1994). Reference Guide: Determining Whether a Project is Likely to Cause Significant Adverse Environmental Effects. In: Canadian Environmental Assessment Agency, The Canadian Environmental Assessment Act Responsible Authority's Guide. Ottawa, Ministry of Supply and Services Canada, 182-196.
Focus Corporation Ltd. (Focus). 2004. North Saskatchewan River 2003 Water Quality Sampling Program. Final Report. Report prepared for the City of Edmonton Drainage Services.
Focus. 2005. North Saskatchewan River 2004 Water Quality Sampling Program. Final Report. Report prepared for the City of Edmonton Drainage Services.
Foster, K.R. K. McDonald and K. Eastlick. 2001. Development and Application of Critical, Target and Monitoring Loads for the Management of Acid Deposition in Alberta. Canada Water, Air, & Soil Pollution: Focus. 1: 135-151.
Golder Associates Ltd. (Golder). 1995. Joint Industry-Municipal North Saskatchewan River Study. Prepared for AT Plastics Inc., Capital Region Sewage Commission, Celanese Canada Inc., City of Edmonton - Gold Bar WWTP, Dow Chemical Canada Inc., Dupont Canada Inc., Geon Canada Inc., Imperial Oil Products Division, Petro-Canada Products, Shell Canada Products Ltd., Edmonton, AB; Sherritt Inc., Fort Saskatchewan, AB and Redwater, AB.
Health Canada. 2004. Summary of Guidelines for Canadian Drinking Water Quality. Federal-Provincial-Territorial Committee on Drinking Water of the Federal-Provincial-Territorial Committee on Environmental and Occupational Health. April 2004.
Hebben, T. 2005. Analysis of Water Quality Trends for the Long-Term River Network: North Saskatchewan River, 1997-2002.
Henriksen, A; J. Kamari, M. Posch and A. Wilander. 1992. Critical Loads of Acidity: Nordic Surface Waters. Ambio: 21: 356-363.
Kamari, J., M. Forsius and M. Posch. 1993. Critical Loads of Sulfur and Nitrogen for Lakes II: Regional Extent and Variability in Finland. Water Air and Soil Pollution 66(1-2): 77-96.
Mitchell, P. 1998. Investigation of PPWB excursions in the North Saskatchewan River at the Alberta-Saskatchewan Boundary 1997. Report to Water Sciences Branch Alberta Environment.
Nilsson, J. and P. Grennfelt (eds). 1988. Critical loads for sulphur and Nitrogen. Nordic Council of Ministers. Copenhagen, Denmark. 418 pp.
North West Upgrading Inc. 2006. North West Upgrader Project: Integrated Application for Approval. Submitted to Alberta Environment and the Alberta Energy and Utilities Board. January 2006. Environmental Impact Assessment. Surface Water Section.E.7.
North Saskatchewan Watershed Alliance (NSWA). 2005. State of North Saskatchewan Watershed Report. Report of the North Saskatchewan Watershed Alliance.
Posch, M., P.A.M. De Met, J.P. Hettelingh and R.J. Downing. 1995. Calculation and Mapping of Critical Thresholds in Europe: Status Report 1995. RIVM Report No. 259101004. Coordination Centre for Effects. National Institute of Public Health and the Environment. Bilthoven, the Netherlands.
Posch, M., P.A.M. De Met, J.P. Hettelingh and R.J. Downing. 1997. Calculation and Mapping of Critical Thresholds in Europe: Status Report 1999. RIVM Report No. 259101009.

7-74 December 2007 North American Upgrader Project Volume 3, Section 7 – Surface Water Quality
NORTH AMERICAN OIL SANDS CORPORATION
Coordination Centre for Effects. National Institute of Public Health and the Environment. Bilthoven, the Netherlands.
Posch, M., P.A.M. De Met, J.P. Hettelingh and R.J. Downing. 1999. Calculation and Mapping of Critical Thresholds in Europe: Status Report 1999. RIVM Report No. 259101009. Coordination Centre for Effects. National Institute of Public Health and the Environment. Bilthoven, the Netherlands.
Ray, C. and K. Dykema. 1991. Leopold-Maddock Equations for the North Saskatchewan River Water Quality Study Edmonton-Saskatchewan Border. Report by Alberta Environment, River Engineering Branch.
Regional Aquatics Monitoring Program (RAMP). 1999. 1999 Technical Report to the RAMP Steering Committee.
Rhim, B. 1995. Critical Loads of Acidity for Forest Soils and Alpine Lakes: Steady State Mass Balance Method. Environmental Series No. 234. Air. Published by the Federal Office at Environment, Forests and Landscape. Berne, Switzerland. 79 pp.
Shaw, R.D., P.A. Mitchell and A.M. Anderson. 1994. Water Quality of the North Saskatchewan River in Alberta. Prepared for Environmental Protection Services, Alberta Environment. 252 pp.
Stewart, R.E. and H.A. Kantrud. 1971. Classification of Natural Ponds and Lakes in the Glaciated Prairie Region. Northern Prairie Wildlife Research Center-Division of Wildlife Research, United States Department of the Interior Fish and Wildlife Service.
Wool, T.A., R.B. Ambrose, J.L. Martin and E.A. Comer. 2004. Water Quality Analysis Simulation Program (WASP). Version 6.0, Draft: User’s Manual. U.S. EPA. 267 pp.
United States Environmental Protection Agency (U.S. EPA). 2006. National Recommended Water Quality Criteria. 25 pp.
7.11.1 Websites Referenced
Alberta’s Industrial Heartland website. www.sturgeoncounty.ab.ca/let_inup_htlnd.html
Water Quality Association (WQA). 2006. Glossary of Terms. http://www.wqa.org/

8-i December 2007 North American Upgrader Project Volume 3, Section 8 – Fish and Fish Habitat
NORTH AMERICAN OIL SANDS CORPORATION
TABLE OF CONTENTS
8 FISH AND FISH HABITAT ...........................................................................................................8-1 8.1 Introduction ......................................................................................................................8-1 8.2 Study Areas......................................................................................................................8-1
8.2.1 Local Study Areas...............................................................................................8-1 8.2.2 Regional Study Area ...........................................................................................8-2
8.3 Issues and Assessment Criteria ......................................................................................8-4 8.4 Methods ...........................................................................................................................8-4
8.4.1 Historical Resources ...........................................................................................8-4 8.4.2 Species at Risk and of Special Concern.............................................................8-5 8.4.3 Fish and Fish Habitat Surveys ............................................................................8-5 8.4.4 Benthic Invertebrates ........................................................................................8-15 8.4.5 Periphyton .........................................................................................................8-15 8.4.6 Impact Assessment and Mitigative Measures ..................................................8-16 8.4.7 Cumulative Effects Assessment .......................................................................8-17
8.5 Existing Conditions.........................................................................................................8-17 8.5.1 Historical Information ........................................................................................8-17 8.5.2 Species at Risk and of Special Concern...........................................................8-19 8.5.3 Waterbody and Watercourse Assessment Results ..........................................8-19 8.5.4 Waterbodies and Watercourses – Baseline Data Summary ............................8-20 8.5.5 Benthic Invertebrates ........................................................................................8-22 8.5.6 Periphyton .........................................................................................................8-23
8.6 Impact Assessment and Mitigative Measures ...............................................................8-23 8.6.1 Indicators...........................................................................................................8-24 8.6.2 Assessment Criteria..........................................................................................8-26 8.6.3 Effects on Aquatic Resources...........................................................................8-26 8.6.4 Combined Industrial Disturbance on Fish and Fish Habitat .............................8-31
8.7 Cumulative Effects Assessment ....................................................................................8-36 8.8 Follow-up and Monitoring...............................................................................................8-36 8.9 Impact Summary ............................................................................................................8-36 8.10 Literature Cited...............................................................................................................8-38
8.10.1 Personal Communications ................................................................................8-39
TABLES
Table 8.4-1 Waterbodies and Watercourses Included in a Search of FMIS.......................................8-5 Table 8.4-2 Sampling Site Locations and Seasonal Field Survey Dates............................................8-7 Table 8.4-3 Periphyton Sampling Site Locations and Field Survey Dates .......................................8-15 Table 8.4-4 Assessment Criteria used to Predict Potential Impacts Associated with the North
American Upgrader Project............................................................................................8-16 Table 8.5-1 Fish Species Documented During the Present and Previous Studies in or near
the North American Upgrader LSA and RSA.................................................................8-18 Table 8.5-2 Periphyton Samples from the LSA.................................................................................8-23 Table 8.9-1 Potential Impacts Associated with the Project ...............................................................8-37
FIGURES
Figure 8.2-1 Fish and Fish Habitat Sampling Locations ......................................................................8-3

8-ii December 2007 North American Upgrader Project Volume 3, Section 8 – Fish and Fish Habitat
NORTH AMERICAN OIL SANDS CORPORATION
APPENDICES
Appendix 8A Figure 8A-1 AST 1 Watercourse Data Figure 8A-2 AST 2 Watercourse Data Figure 8A-3 AST 3 Watercourse Data Figure 8A-4 AST 4 Waterbody Data Figure 8A-5 AST 5 Waterbody Data Figure 8A-6 AST 6 Watercourse Data Figure 8A-7 NSR 1 Watercourse Data
Appendix 8B Benthic Invertebrates

8-1 December 2007 North American Upgrader Project Volume 3, Section 8 – Fish and Fish Habitat
NORTH AMERICAN OIL SANDS CORPORATION
8 FISH AND FISH HABITAT 8.1 Introduction
The fish and fish habitat section provides an assessment of the fish and fish habitat and benthic invertebrate communities on the North American Project site, as well as in the local and regional study areas directly related to North American’s development plans. Field assessments focused on determining presence and absence of fish species in the region, as well as the quality and availability of fish habitat (including the benthic invertebrate community).
In addition to conducting detailed field assessments related to the Project, an assessment of existing historical data related to the area was conducted. The historical data compiled were used to aid in the determination of general fish and fish habitat observed in the region.
The impact assessment for the Project was based upon measured, predicted or reasonably expected changes in some attributes of a selected indicator. Indicators (i.e., fish, benthic invertebrates) were chosen to represent important components of fish and fish habitat. The predicted response of the indicator resources was used to ascertain the level of effects to fish and fish habitat related to the Project. Assessments of potential effects were described in terms of:
• direction (positive or negative effect);
• extent (area of potential change);
• magnitude (amount of change);
• duration (length of time over which change may occur);
• frequency (regularity of impact);
• permanence (reversibility of impact);
• confidence (level of understanding); and
• environmental impact.
A final qualitative impact rating provides guidance as to whether further measures should be considered. Measures including mitigation, monitoring and other means of preventing habitat loss are discussed in detail and relate to potential project activities.
8.2 Study Areas For the purpose of conducting the assessment of fish and fish habitat related to the Project, a Local Study Area (LSA) and a regional Study Area (RSA) were identified. The study areas were selected to document the aquatic resources as discussed in the Hydrology and Surface Water Quality (Volume 3, Sections 6.2 and 7.2, respectively).
8.2.1 Local Study Areas
The Fish and Fish Habitat and hydrology LSA was established to assess the potential for localized effects on water quality, hydrology and fish and fish habitat, and was delineated based

8-2 December 2007 North American Upgrader Project Volume 3, Section 8 – Fish and Fish Habitat
NORTH AMERICAN OIL SANDS CORPORATION
on the Project footprint, local drainage basin boundaries and local effects on the NSR. The fish and fish habitat LSA includes all Project disturbance activities consisting of the plant area, roads, pipelines and river intake. The hydrology LSA boundaries, as shown in Figure 8.2-1, are defined as follows:
• Astotin Creek watershed boundary to the south;
• Beaverhill Creek to the northeast;
• north-south Range Road 214, which forms the western limit of Astotin Creek watershed; and
• a 15 km reach of the NSR on the north from upstream of the existing Shell Canada Scotford Complex river intake to below the confluence with Beaverhill Creek (approximately 5 km downstream of the proposed river intake and outfall)
In order to capture the areas which may be impacted as a result of Project development, the local study area included the Astotin Creek drainage, the lower Beaverhill Creek drainage (downstream of where Astotin Creek enters) and the North Saskatchewan River (NSR). Detailed studies were conducted within these study areas, and the information collected is used to provide a general overview of the waterbodies and watercourses in the entire region.
Astotin Creek/Beaverhill Creek Area
The Astotin Creek/Beaverhill Creek Area (Figure 8.2-1) is delineated by watershed boundaries for Astotin Creek and several tributaries and lakes associated with the Astotin Creek Watershed. A total of three watercourses (Astotin Creek, Beaverhill Creek and one unnamed) and two waterbodies (Astotin Lake and Antler Lake) were visited in 2006/2007 field surveys.
NSR Area
Detailed studies were conducted on a 15 km reach of the NSR from upstream of the existing Shell Canada Scotford Complex river intake to the confluence with Beaverhill Creek, approximately 5 km downstream of the proposed outfall. The outfall location is described in the Hydrology Section (Section 6). The studies were conducted along the south bank of the 10 km reach.
8.2.2 Regional Study Area
The RSA is defined primarily on the basis of potential impacts of the Project on flows and levels in the NSR. It defines the study area where any cumulative effects are expected to occur. In view of the Alberta-Saskatchewan Apportionment Agreement, the RSA is extended from the Gold Bar Waste Water Treatment Plant (WWTP) in Edmonton to the Alberta-Saskatchewan border, to identify any implications in meeting the 50% apportionment requirement with Saskatchewan. The main area of regional aquatic resource assessment includes a 62 km stretch of the NSR from the confluence with Beaverhill Creek downstream of Vinca Bridge to the Saskatchewan/Alberta border. Antler Lake, south of Astotin Lake (Figure 8.2-1) was included in the RSA in order to define the existing fish and fish habitat conditions for that area. The RSA is defined on the basis of potential impacts of the Project on flows and levels in regional rivers, lakes and streams and the likelihood of potential acid input (PAI) and the issue of potential lake acidification and eutrophication.
Consideration was also given to locations where potential for impacts to the surface water/groundwater interactions exists.


8-4 December 2007 North American Upgrader Project Volume 3, Section 8 – Fish and Fish Habitat
NORTH AMERICAN OIL SANDS CORPORATION
8.3 Issues and Assessment Criteria Activities associated with the Project, including construction, operation and reclamation, have the potential to affect fish and fish habitat in watercourses and waterbodies within the study areas. The aquatic resources assessment considered project activities that might cause direct physical impacts to fish and fish habitat, as well as indirect effects associated with changes to surface water quality and hydrology.
The following key issues for aquatic resources have been identified. They are based on public and regulatory consultations, professional experience and the issues identified with other developments in the Fort Saskatchewan area.
The Project could potentially impact the aquatic resources within the study area in the following ways:
• riparian and instream fish habitat alteration:
o sedimentation; o changes to water flows and levels; o riparian habitat degradation; and o changes in benthic invertebrate abundance and composition.
• combined industrial disturbance on fish habitat:
o spill and discharges; o changes in surface water pH; and o increased access.
These potential effects on fish and fish habitat can ultimately affect fish health and/or fish abundance.
8.4 Methods The methods used for the fish and fish habitat assessment of watercourses and waterbodies included a review of historical fisheries data and field assessments to evaluate the current baseline conditions of fish habitat and fish community structure. During field assessments, data were collected, using standardized operating procedures, and checked through quality assurance reviews. Results were then analyzed and summarized.
8.4.1 Historical Resources
A review of existing information was conducted to aid in the development of the baseline conditions related to the Project area. The information collected in review came from a number of sources, including existing baseline reports related to similar projects in the area, regional studies, government databases and information contained in current regulatory publications. Several projects in the area have assessed and characterized watercourses and waterbodies with similar characteristics as those captured within the Project area. The data provided in the studies in the Project area were reviewed and used in this assessment where it was deemed relevant (Synenco Energy, 2006; North West, 2006; PCOSI, 2006; Shell, 2005).
Historical information on the fish community associated with the Project area was also acquired from the Alberta Sustainable Resource Development (ASRD) Fisheries Management Information System (FMIS) during consultation with representatives of ASRD (2006) (Table 8.4-1). Sites

8-5 December 2007 North American Upgrader Project Volume 3, Section 8 – Fish and Fish Habitat
NORTH AMERICAN OIL SANDS CORPORATION
included in the search consisted of watercourses and waterbodies visited during the sampling program associated with the Project, and waterbodies on or within close proximity to the Project areas.
Additional information related to fish species presence in the area was attained through various sources, including the Alberta Guide to Sportfishing Regulations (ASRD, 2007a; Mitchell, 2007).
Table 8.4-1 Waterbodies and Watercourses Included in a Search of FMIS
Site Name Aquatic Type LSD Section Township Range Meridian Beaverhill Creek (AST 1) Watercourse 9 31 56 20 4 Astotin Creek (AST 2) Watercourse 13 21 55 21 4 Astotin Creek (AST 3) Watercourse 8 11 56 21 4 Astotin Lake (AST 4) Waterbody 13 23 54 20 4 Antler Lake (AST 5) Waterbody 15 14 52 21 4 Astotin Creek (AST 6) Watercourse 5 32 54 20 4 NSR (NSR 1) Watercourse 15 5 57 20 4
8.4.2 Species at Risk and of Special Concern
A search of existing databases was conducted to determine the presence of Species at Risk and Species of Special Concern within the vicinity of the Project area. Database inquiries included a search of the Alberta Species at Risk (SARA) (ASRD, 2007b) listings, as well as the lists generated by the Committee on the Status of Endangered Wildlife in Canada (COSEWIC) (Environment Canada, 2007). Information from these lists was cross-referenced with lists of fish species known to exist in the vicinity of the Project area.
8.4.3 Fish and Fish Habitat Surveys
8.4.3.1 Scope, Timing and Locations of Work
Field surveys were conducted at different times of the year in order to assess the seasonal use of the watercourses and waterbodies by fish species in various life stages. For the purpose of this survey, data were collected from selected study sites within the LSA during summer and fall of 2006 and the winter and spring of 2007. Study sites were selected based on probability of providing fish habitat and potential to support fish communities.
Two waterbodies within the LSA were selected for study, based on their probability of providing fish habitat and supporting fish communities. Representative waterbodies included a relatively shallow lake (Antler Lake), as well as a deeper lake (Astotin Lake), with one or more inlets and/or outlets. Seasonal field studies were conducted at each waterbody to provide data pertaining to the habitat use potential and the fish communities present. Fishing was not conducted in Astotin Lake.
Representative watercourse locations were used to determine typical existing baseline habitat conditions, fish community structure and fish habitat usage within the Project area (Figure 8.2-1 and Table 8.4-2). A total of four watercourse study locations were evaluated during the baseline assessment within the LSA. Of the four study sites, two were located on the mainstem of Astotin Creek, one site was located on Beaverhill Creek and one was located on the NSR.
Within the Project area, Astotin Creek generally flows in a north-northeast direction before flowing to the north into Beaverhill Creek. Beaverhill Creek generally drains in a northwest direction

8-6 December 2007 North American Upgrader Project Volume 3, Section 8 – Fish and Fish Habitat
NORTH AMERICAN OIL SANDS CORPORATION
before it flows into the NSR within the LSA. Baseline seasonal sampling examined representative sites for the potential to provide fish habitat and to support fish communities.
8.4.3.2 Field Sampling Methods
Various field sampling techniques were used to assess fish communities and fish habitat in the selected watercourses and waterbodies. Sampling methods were selected for each site based on the most appropriate method for the season and site conditions. The timing of seasonal sampling activities conducted at sampling sites are outlined in Table 8.4-2.
The seasonal baseline field assessments for watercourses included, as appropriate:
• habitat mapping of all relevant instream and bank habitat characteristics, to provide an inventory of available spawning, rearing, feeding and overwintering habitats;
• measurement of average channel dimensions;
• identification of features that may affect fish movement and fish migration potential;
• measurement of stream discharge to help evaluate habitat use potential;
• measurement of water quality parameters (i.e., pH, conductivity, temperature and dissolved oxygen (DO));
• description of riparian vegetation;
• investigation of under-ice habitat and overwintering potential;
• fish inventory, to determine the fish community present; and
• photographs documenting available habitat types and general stream morphology.
The seasonal baseline field assessment of waterbody sites included, as appropriate:
• habitat mapping of the waterbody basin and shoreline characteristics (including distribution of aquatic macrophytes);
• confirmation of basin dimensions and depths;
• examination of inlet and outlet channels to evaluate fish passage potential;
• measurement of water quality parameters (i.e., pH, conductivity, temperature and DO) along a vertical profile or series of profiles at various depths;
• description of riparian vegetation;
• investigation of under-ice habitat and overwintering habitat potential;
• fish inventory to determine the fish community present; and
• photographs documenting available habitat types and general basin morphology.

8-7 December 2007 North American Upgrader Project Volume 3, Section 8 – Fish and Fish Habitat
NORTH AMERICAN OIL SANDS CORPORATION
Details of the various field sampling activities for habitat evaluation and fish sampling techniques are provided below.
8.4.3.3 Habitat Mapping
Habitat mapping was used to provide an inventory of habitats available, and also to detail the location and extent of each stream or lake habitat type within the study reach. The habitat classification system is intended to be ecologically meaningful with respect to describing and cataloging physical habitats in relation to requirements of fish species and their various life stages (spawning, incubation, nursery, rearing, summer feeding, holding, overwintering and migration), and also, to a lesser extent, the relationship between physical habitat and benthic invertebrate productivity, at least with respect to fish food. Detailed habitat maps were generated for each sampling site, where possible. The location and timing of watercourse and waterbody sampling are detailed in Table 8.4-2.
Table 8.4-2 Sampling Site Locations and Seasonal Field Survey Dates
UTM (NAD 83-Zone 12) Study Site ID Sampling
Date Easting Northing
AST 1 Figure 8A-2
Aug 28/06 Oct 24/06 Jan 23/07 May 1/07
371701 5972559
AST 2 Figure 8A-3
Aug 28/06 Oct 23/06 Jan 23/07 Apr 30/07
363312 5960108
AST 3 Figure 8A-4
Aug 29/06 Oct 23/06 Jan23/07
April 30/07
368300 5965864
AST 4 Figure 8A-5
Aug 29/06 Oct 24/06 Jan 24/07 May 2/07
377690 5950025
AST 5 Figure 8A-6
Aug 29/06 Oct 24/06 Jan 24/07 May 1/07
368476 5929118
AST 6* Figure 8A-7 May 3/07 372925 5952410
NSR 1 Figure 8A-8
Aug 30/06 Oct 24/06 Jan 23/07 May 3/07
372727 5974369
*Only benthic and periphyton samples were collected at this site.
Waterbodies
Two waterbodies within the study area were selected for detailed assessments, based on their locations and the probability of providing fish habitat and supporting fish communities. Seasonal field studies were conducted at each waterbody to provide baseline data pertaining to the habitat use potential and the fish communities present.

8-8 December 2007 North American Upgrader Project Volume 3, Section 8 – Fish and Fish Habitat
NORTH AMERICAN OIL SANDS CORPORATION
Waterbodies were mapped during open-water season (i.e., spring or summer), when habitat features were most visible. Bathymetric surveys were conducted to determine the extent of the habitat types and to identify shallow littoral zones and deep pelagic zones. Habitat maps were developed to show the location of shoreline characteristics and the distribution of aquatic vegetation.
The physical characteristics recorded for each waterbody included:
• inlet and outlet locations and condition;
• water depths;
• distribution of aquatic macrophytes (submergent, emergent and floating-leaved vegetation);
• shoreline slope and stability;
• riparian vegetation; and
• water quality characteristics (i.e., pH, conductivity, temperature and DO) at varying depths.
The habitat use potential for each waterbody was evaluated based on habitat characteristics, such as the proportions of the available habitat types, water depths, substrate material, vegetation distribution and shoreline development, using the Fish Habitat Manual (Alberta Transportation and Utilities, 2001). Analysis of these types of habitat parameters provides an indication of the potential suitability of the habitats for use by fish species in various stages of life.
Watercourses
A total of four sampling locations were assessed in the study area for fish and fish habitat potential. Two sampling sites were selected on Astotin Creek (AST 2, AST 3), one sampling site was selected on Beaverhill Creek (AST 1) and one site on the NSR (NSR 1).
Representative locations were used to determine typical baseline habitat conditions, fish community structure and fish habitat usage. Watercourses were mapped during open-water season, namely spring or summer, when habitat features were most visible. The location and extent of all instream habitat types and bank characteristics of each watercourse sampling site were mapped to provide an inventory of available habitats. Typical habitat units include riffle, run and pool-type habitats.
The physical characteristics recorded for each sampling site included:
• channel unit type;
• maximum water depth;
• dominant substrate type and size classification;
• channel dimensions, including mean channel width and wetted width;
• debris piles (small and large woody debris);

8-9 December 2007 North American Upgrader Project Volume 3, Section 8 – Fish and Fish Habitat
NORTH AMERICAN OIL SANDS CORPORATION
• cover for fish, including both instream (velocity shelter) and overhead (visual isolation) cover;
• aquatic vegetation;
• water quality characteristics (i.e., pH, conductivity, temperature and DO);
• features that might impede fish movements (i.e., beaver dams);
• bank features, including areas of unstable bank and areas of overhanging vegetation or undercut banks; and
• riparian plant community composition.
At each sampling site, representative photographs were taken to illustrate physical characteristics such as bank conditions, bank profiles, riparian areas, channel characteristics and general terrain layout.
The habitat use potential for study sites was evaluated relative to the habitat requirements of the local fish species and life stages (e.g., spawning, rearing and feeding), the types and proportions of the available channel units, average water depths and substrate material.
Discharge Measurements
Stream discharges were measured at study sites during seasonal sampling activities. Discharge measurements were conducted according to standard industry protocols. Measurements were conducted using a calibrated tagline to determine horizontal stations, and a Pygmy Water Velocity Meter and top setting-wading rod to measure water depth and velocity. The horizontal station distance, water depth and water velocity data were used to calculate the total stream discharge. Measurement of discharge was not possible at some locations due to safety concerns, the lack of measurable flow or the lack of a defined channel. Field discharge measurements were not collected on the NSR.
Water Quality Parameters
Water quality parameters (i.e., water temperature, DO, pH and conductivity) were measured at study sites during seasonal sampling activities. In watercourses and waterbodies, water quality parameters were measured at one or more locations along a vertical profile. Surface water quality and water quality profiles were measured using a YSI 556 Multi-Parameter handheld water quality meter equipped with a 30-m cable.
Overwintering Habitat Assessment
Overwintering habitat assessments evaluated the potential for watercourses and waterbodies to provide habitat for fish throughout the winter season. The assessment was conducted in winter to represent accurately the limiting conditions for fish potentially overwintering in these habitats.
The winter field assessment of watercourse sites included the following:
• measurement of ice thickness and under-ice water depth;
• measurement of water depth and velocity along a transect to determine average depth and velocity;

8-10 December 2007 North American Upgrader Project Volume 3, Section 8 – Fish and Fish Habitat
NORTH AMERICAN OIL SANDS CORPORATION
• measurement of stream discharge, where possible;
• measurement of water quality parameters (i.e., water temperature, DO, pH and conductivity); and
• fisheries inventory to determine fish presence.
The winter field assessment of waterbody sites included the following:
• measurement of ice thickness and under-ice water depth;
• measurement of water quality field parameter profiles (i.e., water temperature, DO, pH and conductivity); and
• fisheries inventory to determine fish presence.
8.4.3.4 Fish Inventory
Fish sampling was conducted at each watercourse and waterbody sampling site to determine the fish communities present. A variety of sampling techniques were used to determine the species and life stages of the fish that use these systems.
Fish sampling techniques employed during field investigations included:
• electrofishing in wadeable watercourses (Smith-Root Type 12b backpack electrofisher);
• baited standard Gee minnow traps;
• baited setlines; and
• test netting (multi-panel gill nets with eight 5.7-m panels with mesh sizes ranging from 25.4 mm to 152.4 mm).
Fish sampling methods were employed as site specific conditions allowed. For detailed sampling techniques and sampling methods used at each site, see Appendix 8A, Figures 8A-1 to 8A-7.
8.4.3.5 Seasonal Sampling
Seasonal sampling of study sites was conducted in an attempt to gather data on fish presence and fish habitat utilization at various times of the year. Some fish species may require different habitat types at different stages of their life cycle. Seasonal habitat assessments provide a representative view of habitat utilization by fish species at various stages in their life cycle. Where conditions permitted, sampling of aquatic environments included minnow trapping, set-lining and electrofishing as outlined in Section 8.4.3.4.
Spring, Summer and Fall Sampling
Minnow trapping, setlines, and backpack electrofishing were used on watercourses to assess fish populations and habitat conditions during open-water seasons. Large multi-panel gill nets were used to sample waterbodies.
Standard Gee-type minnow traps were used to sample for forage fish and juvenile sportfish species. The minnow traps were baited to attract fish and placed in locations suitable for small-

8-11 December 2007 North American Upgrader Project Volume 3, Section 8 – Fish and Fish Habitat
NORTH AMERICAN OIL SANDS CORPORATION
bodied species. The traps were set at study sites with sufficient water depths (generally ≥0.4 m) for effective minnow trap sampling to occur.
Backpack electrofishing could not be conducted at any of the sites, as water depth and soft silt substrates contributed to unsafe conditions.
The gill nets used for sampling waterbodies consisted of an eight-panel, 45.6-m net; each panel was 5.7 m in length and 1.8 m in depth, and the panel mesh size ranged from 25.4 mm to 152.4 mm.
Gill net sets were typically set up by placing the gill net perpendicular to the shoreline, while anchoring the bottom of the net to the substrate. Placing the gill net in this configuration increases the opportunity to capture fish species during daily movement between habitats.
Where possible, fish captured were identified and enumerated by species and life stage. Fork length (mm) and body weight (g) were measured for all large species and for a representative sub-sample of small species. If discernable from external examination, sex and state of maturity of captured fish were also recorded. For detailed sampling techniques and sampling methods used at each site, see Appendix 8A, Figures 8A-1 to 8A-7.
Winter Sampling
Fish sampling in winter was conducted at watercourse and waterbody sites as conditions permitted. Observations recorded include ice depth, water depth, water quality and under-ice conditions. Baited minnow traps were used to determine fish presence and assess potential overwintering habitat conditions. These traps were deployed at study sites with sufficient water depths (generally ≥0.4 m). At some locations insufficient water depth did not allow for proper deployment of minnow traps. For detailed sampling techniques and sampling methods used at each site, see Appendix 8A, Figures 8A-1 to 8A-7.
8.4.3.6 Habitat Assessments
Fisheries and Oceans Canada (DFO) defines fish habitat as those parts of the environment “on which fish depend, directly or indirectly, in order to carry out their life processes” (DFO, 1985). Therefore, fish habitat includes the water, water quality and aquatic life in rivers, lakes, canals, streams and oceans, as well as the total surroundings of those waterbodies, including plants and other life forms that interact to make fish life possible. Small streams, ponds, reservoirs, marshes, wetlands, canals, drains, and sometimes even flooded meadows near other waterbodies or watercourses, can provide important habitat for fish, if only on a seasonal basis.
Fish habitat assessments are designed to consider potential migratory corridors, as well as spawning, rearing, feeding and overwintering habitat for fish species that have the potential to exist within the RSA.
Fish use a wide variety of habitat conditions on a year-round or seasonal basis. Typical fish habitat requirements include spawning substrates, physical features providing food, refuge areas providing cover from water flow or predation and migratory corridors to and from overwintering or spawning areas.
Once the presence of fish habitat has been determined, the habitat can be further characterized according to large-bodied/sportfish and forage fish life cycle habitat requirements. The rating of potential habitat is a subjective interpretation of a variety of habitat characteristics based on physical and visual estimates. The habitat rating system is designed to provide a description of existing fish habitat and an indication of potential habitat use.

8-12 December 2007 North American Upgrader Project Volume 3, Section 8 – Fish and Fish Habitat
NORTH AMERICAN OIL SANDS CORPORATION
Physical, chemical and biological characteristics were assessed on a seasonal basis to evaluate the presence of seasonal fish habitat. Habitat characteristics assessed in seasonal surveys included:
• Water quality: pH, conductivity (uS/cm), DO (mg/L) and turbidity;
• Substrate composition: particle sizes and embeddedness, determined via visual estimation or pebble counts;
• Barriers to fish movement: beaver dams, falls, high velocity chutes, perched culverts intermittent flows or very low flow;
• Available instream cover habitats: large organic debris, boulders, instream vegetation, turbidity, deep pools and surface turbulence;
• Available overhead cover habitats: large organic debris, undercut banks and overhanging trees, shrubs or grasses;
• Bank and shoreline characteristics: height, slope, riparian vegetation, percent coverage, percentage of bank that is undercut, erosion potential, presence of riprap, crib walls or other erosion control measures;
• Physical dimensions: mean wetted width, mean wetted depth, mean channel width and mean channel depth;
• Hydrologic condition: discharge (m3/s), turbulence, watercourse stage (dry, pooled, low, moderate, high, flood);
• Food, cover and reproductive needs; and
• Habitat quantity: a specific habitat condition may be present, but may not be sufficiently represented within the study area.
8.4.3.7 Habitat Rating
Fish require specific habitat conditions to complete successfully critical life cycle stages, such as spawning, rearing, feeding and migration to spawning or overwintering areas.
Spawning habitats are areas of a watercourse or waterbody where fish congregate in order to seek out a mate, nest and reproduce. Rearing habitat refers to the areas that provide young fish the opportunity to hatch, feed and grow into adults. Migratory corridors are areas fish use to reach the habitats they require to carry out life processes. Overwintering habitats consist of areas that provide adequate water quality, habitat features and physical space for fish species to survive for months at a time without crowding into limited deepwater pockets. Available habitat could become overcrowded and/or anoxic (i.e., oxygen deprived) in summer months, resulting in mortalities due to “summer kill.” Similar conditions may occur in winter where water may freeze and result in mortalities due to “winter kill.”
Rating fish habitat requires the assessment of a broad spectrum of conditions. These include water quality, hydraulics, geographic location and physical attributes of the watercourse or waterbody. Habitat characteristics and an in-depth knowledge of the life cycle habitat requirements were used to determine the habitat rating.

8-13 December 2007 North American Upgrader Project Volume 3, Section 8 – Fish and Fish Habitat
NORTH AMERICAN OIL SANDS CORPORATION
Essential habitat requirements of a given fish species can vary between life cycle stages and/or seasonal temperature ranges. Therefore, fish will thrive in different habitats depending on life cycle or seasonal temperature regime.
Fish habitats consist of the areas within a watercourse or waterbody that fish need to carry out successfully one or all of their life processes. The potential utilization of fish habitat can be further described by fish life cycle stage and/or how the fish utilize the existing habitat.
Fish sampling techniques were employed to verify the existence of fish and thereby fish habitat. Fish capture data were used to identify the life cycle stage and species present within the representative assessment area. Historical records of fish habitat utilization, an assessment of existing habitat characteristics and habitat suitability indices were used to determine the habitat potential.
The degree of potential habitat utilization associated with a specific fish life stage may be further characterized as nil, low, medium or high.
A nil habitat rating would characterize an area that does not provide any significant habitat for a specific life cycle stage of a given fish species. A nil rating describes an area where habitat characteristics, such as water quality, were considered inadequate to support aquatic life (CCME, 2006), and/or physical attributes of the area were insufficient to provide for the life cycle requirements of fish species that may exist with the RSA. Nil habitat characteristics would include:
• dry and/or undefined channel;
• no suitable habitat for overwintering, spawning, migration or rearing; and
• not suitable for use as a migratory corridor.
A low habitat rating would indicate an area that provides limited habitat potential for fish life cycle requirements, due to the existence of suboptimal water quality, hydrological or physical conditions limiting the habitat potential. Low habitat characteristics would include:
• unstable banks present and abundant;
• high to moderate scour potential;
• deep pools or evidence of groundwater seepage are nonexistent or limited in abundance;
• flow and depths not generally suited for overwintering habitat;
• size of substrates and cover limiting for rearing activities;
• substrate or macrophytes not suitable for spawning, or not abundant;
• flows or water depth not favourable for spawning;
• flow and depths meet minimal requirements for rearing, but limiting in area;
• flows, water depth and cover habitats not typically suitable for adult holding or feeding; and

8-14 December 2007 North American Upgrader Project Volume 3, Section 8 – Fish and Fish Habitat
NORTH AMERICAN OIL SANDS CORPORATION
• barriers to upstream movement such as seasonal flow, beaver dams, waterfalls or perched culverts exist within the survey area.
A medium habitat rating would characterize habitat conditions that are considered adequate for supporting a given life cycle stage. This rating would include areas that provide sufficient habitat characteristics to satisfy life history requirements. This area would also be considered large enough to accommodate multiple individuals. Medium habitat characteristics would include:
• moderately stable banks;
• medium to low scour potential;
• deep pools, riffles, vegetation, evidence of groundwater seepage and suitable flows observed in moderate abundance;
• size of substrate or macrophytes, flows or water depth suitable for spawning activities;
• water depths, flows, size of substrate and instream or overhead cover adequately suitable for rearing; and
• barriers to upstream migration, such as low seasonal flow, beaver dams, waterfalls or perched culverts, were not observed in the immediate vicinity of the study area, or were not considered a barrier.
A high habitat rating describes habitat conditions considered optimal for one or more stages of a fish life cycle. Habitat characteristics that are rated high would provide ample physical space with optimal habitat condition to satisfy the life history requirements for fish species. This area would not be limiting due to available habitat and physical, chemical or biological characteristics. A high habitat potential area would include:
• stable banks abundant;
• low scour potential;
• deep pools, riffles, vegetation or evidence of groundwater seepage optimal for spawning activities;
• watercourse structure, overhead cover, flow velocities, water depths, size of substrates, instream cover and water quality were considered optimal for spawning, rearing, overwintering or migration activities; and
• barriers to upstream migration, such as low seasonal flow, beaver dams, waterfalls or perched culverts, were not observed in the immediate vicinity of the study area, or were not considered a barrier.
Fish habitats required at a given life cycle stage can vary from species to species, and are best summarized by defining the requirements of large-bodied/sportfish species and small-bodied forage fish species. Large-bodied/sportfish and forage fish species captured within the RSA are represented in Table 8.5-1.

8-15 December 2007 North American Upgrader Project Volume 3, Section 8 – Fish and Fish Habitat
8.4.4 Benthic Invertebrates
Benthic invertebrate samples were collected in the spring of 2007 (May 2 to 5). Benthic samples are generally collected in the fall; however, for this assessment spring sampling was conducted for two reasons; first, to build on previous data collected in the LSA (Synenco Energy, 2006); and secondly, other studies have found that watercourses in the area did not have suitable benthic habitat during base flows in the fall (PCOSI, 2006). Samples were collected at two watercourses and one waterbody in the LSA (Figure 8B-1), with the objective of characterizing the benthic invertebrate community in representative habitat areas. The data were used to describe baseline conditions regarding the availability of food resources for fish, as well as the overall health of the aquatic ecosystem.
Samples were collected in depositional sediments, using a Ponar sampling device with a sampling area of 0.023 m2, and were field sieved to remove fine sediments using a 250 um Nitex mesh netting. Five replicate samples were collected at each site to account for variability.
A literature review of historical data was completed to obtain background benthic invertebrate data for the study areas (Golder, 1995; PCOSI, 2006; North West, 2006; Synenco Energy, 2006; Shell, 2007).
The benthic invertebrate community was characterized using community variables, including abundance (numbers of organisms per square metre), dominance (the most common taxa at a given site), taxonomic richness (the number of benthic invertebrate taxa) and community composition. The abundance and dominance data among sites were presented graphically. Richness was presented as the total number of taxa (identified to the lowest practical level) among replicates at a site. Major groups of invertebrates were presented in stacked bar graphs to show significant differences in community composition (Appendix 8B provides details).
8.4.5 Periphyton
Periphyton samples were collected in the spring of 2007 (May 1 to 3). Six sampling sites were located in three watercourses in the LSA (Table 8.4-3). Watercourses were sampled in erosional habitat. The objective of collecting periphyton samples was to measure chlorophyll a, a biomass estimate of the amount of live algae. Periphyton data are also useful for monitoring environmental change in aquatic habitats.
Table 8.4-3 Periphyton Sampling Site Locations and Field Survey Dates
UTM (NAD 83-Zone 12) Watercourse Study Site ID
Sampling Date Easting Northing
AST1 May 1/07 371701 5972559
AST2 April 30/07 363312 5960108
AST6 May 3/07 372925 5952410
NSR1 May 3/07 372823 5974226
NSR3 May 3/07 362836 5966525 NSR4 May 3/07 363182 5967240
NORTH AMERICAN OIL SANDS CORPORATION

8-16 December 2007 North American Upgrader Project Volume 3, Section 8 – Fish and Fish Habitat
NORTH AMERICAN OIL SANDS CORPORATION
8.4.6 Impact Assessment and Mitigative Measures
Potential impacts to aquatic resources in the Project area were assessed in terms of indicator species. Impacts were evaluated in the context of project development and operation and reclamation activities, and include plant facilities, access roads, utility corridors and pipelines.
Two areas of concern for aquatic resources were identified. Riparian and instream habitat loss or alteration, as well as combined industrial disturbance (i.e., effluent discharge, waterbody acidification, spills or releases) on fish habitat. Criteria for evaluating impacts are outlined in Table 8.4-4. Mitigative measures for impacts include management of operations, best management practices for construction and maintenance activities and prevention initiatives.
Table 8.4-4 Assessment Criteria used to Predict Potential Impacts Associated with the North American Upgrader Project
Parameter Rating Criteria Positive Net benefit or gain to indicators or fish habitat. Neutral No net benefit or gain; or benefits and losses are balanced. Direction of
Impact Negative Net loss or detriment to indicators or fish habitat.
Local Impact to indicators or fish habitat confined to the area directly disturbed by Project facilities.
Sub-regional Impact to indicators or fish habitat extends beyond area of direct disturbance but is limited to the LSA.
Regional Impact to indicators or fish habitat extends beyond the LSA but is limited to the RSA.
Extent of Impact
Extra-regional Impact to indicators or fish habitat extends beyond the RSA. Negligible No discernable impact to indicators or fish habitat.
Low Disturbance to indicators or fish habitat predicted to cause no detectable changes greater than that observed in natural variation.
Medium Disturbance to indicators or fish habitat predicted to cause a detectable change greater than that observed in natural variation.
Magnitude of impact
High Disturbance predicted to cause a detectable change to indicators or fish habitat great enough to impair recovery.
Immediate Impact to indicators or fish habitat that occurs for less than two days.
Short-term Impact to indicators or fish habitat that occurs for two days or longer but less than one year.
Medium-term Impact to indicators or fish habitat that occurs for one year or longer but less than ten years.
Duration of Impact
Long-term Impact to indicators or fish habitat that occurs for ten years or longer. Isolated Impact to indicators fish habitat that occurs during a specified period.
Occasional Impact to indicators or fish habitat that occurs intermittently and sporadically over assessment period.
Regular Impact to indicators or fish habitat that occurs regularly over assessment period.
Frequency of Occurrence of Impact
Continuous Impact to indicators fish habitat that occurs continually over assessment period.
Reversible in short-term
Impact to indicators or fish habitat that can be reversed in less than one year.
Reversible in medium-term
Impact to indicators or fish habitat that can be reversed in one year or more, but less than ten years.
Reversible in long-term Impact to indicators or fish habitat that can be reversed in ten years or more.
Permanence of Impact
Irreversible Impact to indicators or fish habitat that is permanent.

8-17 December 2007 North American Upgrader Project Volume 3, Section 8 – Fish and Fish Habitat
NORTH AMERICAN OIL SANDS CORPORATION
Parameter Rating Criteria
Low Assessment based on poor understanding of cause-effect relationships and data certainty is unclear (e.g., historical data source, using data from elsewhere, data incomplete, etc)
Medium
Assessment based on good understanding of cause-effect relationships and data certainty is unclear (e.g., historical data source, using data from elsewhere, data incomplete, etc); or poorly understood cause-effect relationships using data with high certainty.
Level of Confidence
High Assessment based on good understanding of cause-effect relationships and high certainty of data.
No impact Impacts to indicators or fish habitat are not predicted to occur. Negligible impact
Impacts to indicators or fish habitat are not discernable above natural background variation.
Minor impact Impacts to indicators or fish habitat are low in magnitude, short-, medium- or long-term in duration and restricted to the (local or regional) study area.
Moderate impact
Impacts to indicators or fish habitat that are medium in magnitude, short-, medium- or long-term in duration and do not extend beyond the regional study area.
Environmental Impact
Major impact Impacts to indicators or fish habitat that are long-term in duration and/or extend beyond the regional study area.
8.4.7 Cumulative Effects Assessment
A Cumulative Effects Assessment (CEA) was conducted to consider the potential impacts associated with the Project in combination with other existing and future projects located within the Project’s RSA. The CEA for the Project focused on the effects of water withdrawals from the NSR and potential acidification of lakes in the region.
8.5 Existing Conditions The existing conditions related to fish and fish habitat within the North American Project area were collected during a series of background data searches, in addition to the seasonal field programs. The information collected is summarized in the following section.
8.5.1 Historical Information
Several assessments of fish habitat and fish species were conducted within the RSA (Synenco Energy, 2006; North West, 2006; PCOSI, 2006; Shell, 2005). These studies, along with an historical data search in FMIS database and existing reference literature (Nelson and Paetz, 1992; Scott and Crossman, 1998), provide a summary of the fish species and habitat in the Astotin Creek, Beaverhill Creek and NSR watersheds.
Table 8.5-1 summarizes the thirty fish species present in the LSA and RSA.
8.5.1.1 NSR and Tributaries
NSR
Watercourses
NSR1 (NSR) – The NSR was sampled in spring of 2006 and the fall of 2004 and 2006 in support of the following Environmental Impact Assessments (EIAs): Petro-Canada Oil Sands Inc. Sturgeon Upgrader EIA (PCOSI, 2006), Synenco Energy Northern Lights Upgrader EIA (Synenco Energy 2006), Shell Canada Scotford Upgrader Expansion EIA (Shell, 2005), and North West Upgrading Bitumen Upgrader Project (North West, 2006). A total of 30 species of fish are known to exist in the LSA or RSA, some of which were captured during sampling. These include burbot, goldeye, mountain whitefish, northern pike, walleye, sauger, mooneye, rainbow

8-18 December 2007 North American Upgrader Project Volume 3, Section 8 – Fish and Fish Habitat
NORTH AMERICAN OIL SANDS CORPORATION
trout, lake sturgeon, longnose sucker, white sucker, quillback sucker, shorthead redhorse, silver redhorse, longnose dace, trout perch, emerald shiner and river shiner. White sucker were the most abundant species during both spring and fall sampling. Spawning habitat potential was rated high for all fish species.
AST1 (Beaverhill Creek) – Beaverhill Creek was sampled in spring of 2006 in support of the Synenco Energy Northern Lights Upgrader EIA (Synenco Energy, 2006). A total of four species were captured during sampling. These include goldeye, white sucker, northern pike and longnose sucker. White sucker were the most abundant species during the spring sampling.
AST2, AST3 (Astotin Creek) – Astotin Creek was sampled in spring of 2006 in support of the Synenco Energy Northern Lights Upgrader EIA (Synenco Energy, 2006). Brook stickleback were the only species captured during sampling, and white sucker were observed in the study reach.
Waterbodies
No historical records of fish sampling was identified for Astotin Lake (AST4) or Antler Lake (AST5).
Table 8.5-1 Fish Species Documented During the Present and Previous Studies in or near the North American Upgrader LSA and RSA
Common Name Scientific Name Species Code
Occurrence Reported In
Found in Current Study
LSA RSA Longnose sucker Catostomus catostomus LNSC √ √ White sucker Catostomus commersoni WHSC √ √ √ Mountain sucker Catostomus platyrhynchus MNSC √ Quillback Carpiodes cyprinus QUIL √ Shorthead redhorse Moxostoma macrolepidotum SHRD √ Silver redhorse Moxostoma anisurum SLRD √ Longnose dace Rhinichthys cataractae LNDC √ Spottail shiner Notropis hudsonius SPSH √ River shiner Notropis blennius RVSH √ Fathead minnow Pimephales promelas FTMN √ Flathead chub Platygobio gracilis FLCH √ Emerald shiner Notropis atherinoides EMSH √ Northern redbelly dace Phoxinus eos NRDC √ Northern pike Esox lucius NRPK √ √ Burbot Lola Iota BURB √ Brook stickleback Culea inconstans BRST √ √ √ Goldeye Hiodon alosoides GOLD √ Mooneye Hiodon tergisus MOON √ Walleye Sander vitreus WALL √ √ Sauger Sander canadensis SAUG √ Iowa darter Etheostoma exile IWDR √ Yellow perch Perca flavescens YLPR √ Lake sturgeon Acipenser flavescens LKST √ Trout-perch Percopsis omiscomaycus TRPR √ Lake chub Couesius plumbeus LKCH √ Bull trout Salvelinus confluentus BLTR √ Brown trout Salmo trutta BNTR √

8-19 December 2007 North American Upgrader Project Volume 3, Section 8 – Fish and Fish Habitat
NORTH AMERICAN OIL SANDS CORPORATION
Common Name Scientific Name Species Code
Occurrence Reported In
Found in Current Study
Mountain whitefish Prosopium williamsoni MNWH √ Rainbow trout Oncorhynchus mykiss RNTR √ Source(s): Shell (2005), North West Upgrading (2006), PCOSI (2006), Synenco Energy (2006), FMIS (Fisheries Management
Information System) database, as of November 16, 2006 (pers. com. V. Buchwald, ASRD), Nelson and Paetz (1992), Scott and Crossman (1998).
8.5.2 Species at Risk and of Special Concern
Environment Canada maintains an Internet database for all species at risk in Canada (Environment Canada, 2007). Species that “may be at risk” currently require further study to determine whether legal protection under the Alberta Wildlife Act (ASRD, 2000) is required, while species that are “sensitive” are not currently at risk but may require future protection to prevent them from becoming at risk. None of these species are currently listed on the Committee on the Status of Endangered Wildlife in Canada website (COSEWIC, 2007). This database lists the following fish species within Alberta and their designation as determined by the Committee on the Status of Endangered Wildlife in Canada (COSEWIC, 2007):
1. Extinct. Banff Longnose Dace (Rhinichthys cataractae smithi);
2. Endangered. Lake Sturgeon (Acipenser fulvescens); and
3. Threatened. Eastslope sculpin (Cottus sp.), shortjaw cisco (Coregonus zenithicus), western silvery minnow (Hybognathus argyritis) and westslope cutthroat trout (Oncorhynchus clarkii lewisi).
Of the identified species, only lake sturgeon is present in the LSA.
Alberta Sustainable Resource Development maintains an Internet database for all species present in provincial waterbodies (ASRD, 2007a). Three species identified in the Alberta Species at Risk Program are known to occur near the RSA. These include the spoonhead sculpin (designated as “may be at risk”) and northern redbelly dace and sauger (designated as “sensitive”). Lake sturgeon has recently been designated as “at risk” under the Alberta Species at Risk Program, and as a result, sport fishing for lake sturgeon in the NSR is now limited to “catch and release” (ASRD, 2007b).
8.5.3 Waterbody and Watercourse Assessment Results
Observations recorded during the field surveys of waterbodies and watercourses are presented in Appendix 8A, Figures 8A-1 to 8A-7. These figures provide detailed descriptions of existing conditions and will be used for the purpose of the impact assessment. These figures may also be used as data to support future monitoring programs. The information presented in the figures includes detailed habitat mapping and descriptions, summaries of the recorded surface water quality characteristics, identification of observed fish species and an overall ranking of fish habitat quality. These information categories are further discussed below:
• The habitat map and descriptions provided for each waterbody contain details of existing conditions observed during the four survey seasons. This information includes lakebed composition (shape and substrate composition), the presence and location of inlet and outlet channels, and the presence of potential fish habitat (including depth, cover and vegetation).

8-20 December 2007 North American Upgrader Project Volume 3, Section 8 – Fish and Fish Habitat
NORTH AMERICAN OIL SANDS CORPORATION
• The field water quality data represented in the figures include the temperature (oC), DO (mg/L), pH and conductivity (uS/cm) recorded during the field surveys. Water quality was recorded throughout the water column of the lakes to provide an indication of conditions from the surface to the substrate. Temperature is recorded to determine the suitability of the waterbody to temperature-sensitive species (i.e., coldwater species [optimum temperature less than 18oC, with spawning temperatures less than 15oC] and cool water species [optimum temperatures less than 27oC, with spawning temperatures less than 21oC]; Mitchell and Prepas, 1990). DO levels are recorded in order to determine the waterbody’s capacity to sustain fish (i.e., DO levels below 5.6 mg/L were considered to be unsuitable [suboptimum] for sportfish; CCME, 2006; Ford et al., 1995). Recorded pH levels provide an indication of the acidity of the water, and conductivity levels provide an indication of the concentration of ions in the water.
• The fish species section included in the figures provides a breakdown of the species captured or observed during surveys, as well as the methods (baited minnow traps, gill nets, set-lines and angling) and effort required (recorded in hours and minutes) to capture the fish.
• The habitat rankings provided in the figures summarize the overall fish habitat observed for both forage and large-bodied/sportfish species. The rankings were derived using the observations of existing fish habitat and the observed water quality, combined with the presence of fish species observed during field surveys. Rankings are provided for spawning, rearing, feeding and overwintering habitat.
8.5.4 Waterbodies and Watercourses – Baseline Data Summary
For the purpose of the field assessments and the preparation of the baseline data summary, the Project study area was divided into two distinct areas reflecting the two watershed areas that the RSA encompasses. These areas include the following:
• The Astotin Creek/Beaverhill Creek and NSR study areas, which capture the upper, mid and lower regions of Astotin Creek, including Astotin Lake, as well as the lower portion of Beaverhill Creek and the reach of the NSR where Beaverhill Creek enters; and
• Antler Lake study area, which describes the section within the southern region of the regional study area.
The following section outlines the information collected at watercourses during the baseline surveys at each of the outlined study areas.
8.5.4.1 Beaverhill Creek (AST 1)
Beaverhill Creek had no flowing water during the summer, fall and winter surveys, as the channel was dry from just downstream of the study location to the confluence with the NSR. The upper section of Beaverhill Creek was observed to have standing pools of water as a result of existing beaver dams, and would provide limited rearing and feeding habitat use by large-bodied/sportfish and forage fish species. Beaverhill Creek had low to moderate overwintering habitat for both large-bodied/sportfish and forage fish. During the fall fish and fish habitat surveys, white sucker was the only species captured.
A detailed summary of the baseline data collected for AST 1 is presented in Appendix 8A, Figure 8A-1.

8-21 December 2007 North American Upgrader Project Volume 3, Section 8 – Fish and Fish Habitat
NORTH AMERICAN OIL SANDS CORPORATION
8.5.4.2 Astotin Creek (AST 2, AST 3, AST 6)
The locations surveyed for spawning, rearing and feeding in Astotin Creek (AST 2, AST 3) were found to have DO levels below CCME guidelines (<6.5 mg/L) (CCME, 2006), and therefore low habitat potential for large-bodied/sportfish and forage fish species. AST 2 and AST 3 may provide suitable seasonal habitat for fish species tolerant of low DO levels, such as brook stickleback or fathead minnow (Nelson and Paetz, 1992). This watercourse had no potential for overwintering habitat, as it was frozen to the bottom at both sites during the winter survey. Brook stickleback was the only species captured during the fall fish and fish habitat surveys. AST 6 was surveyed in May 2007 for benthic invertebrates only and water quality parameters only. No fishing efforts were completed at AST 6.
A detailed summary of the baseline data collected for the AST 2, AST 3 and AST 6 are presented in Appendix 8A, Figures 8A-2, 8A-4 and 8A-3.
8.5.4.3 Astotin Lake (AST 4)
Astotin Lake was surveyed for spawning, rearing and feeding habitat, and was found to have low habitat potential for large-bodied/sportfish and forage fish species. AST 4 was found to have DO levels below CCME guidelines (<6.5 mg/L) (CCME, 2006). When assessing overwintering habitat potential, it was determined that AST 4 was ranked as low to nil, and can provide suitable habitat for fish species tolerant of low DO levels, such as brook stickleback or fathead minnow (Nelson and Paetz, 1992).
A detailed summary of the baseline data collected for AST 4 is presented in Appendix 8A, Figure 8A-5.
8.5.4.4 Antler Lake (AST 5)
Antler Lake (AST 5) was surveyed for spawning, rearing and feeding habitat and was found to have low habitat potential for large bodied/sport and forage fish species. When assessing overwintering habitat potential it was determined that Antler Lake (AST 5) was ranked as low to nil, as it was found to have DO levels below CCME guidelines (<6.5 mg/L) (CCME, 2006). AST 5 can provide suitable for fish species tolerant of low DO levels, such as brook stickleback or fathead minnow (Nelson and Paetz, 1992); however, no fish were captured during the fish and fish habitat surveys.
A detailed summary of the baseline data collected for AST 5 is presented in Appendix 8A, Figure 8A-6.
8.5.4.5 NSR (NSR 1)
The NSR was determined to have high spawning, rearing and feeding habitat potential for both large-bodied/sportfish and forage fish species. When assessing overwintering habitat potential, it was determined that NSR 1 has high overwintering potential for large-bodied/sportfish and forage fish species. During the fish and fish habitat surveys (fall only), no fish were captured.
A detailed summary of the baseline data collected for NSR 1 is presented in Appendix 8A, Figure 8A-7.

8-22 December 2007 North American Upgrader Project Volume 3, Section 8 – Fish and Fish Habitat
NORTH AMERICAN OIL SANDS CORPORATION
8.5.5 Benthic Invertebrates
Beaver Hill and Astotin creeks
Benthic invertebrate mean total abundances in the Beaver Hill and Astotin creeks ranged from less than 500 organisms/m2 to greater than 11,000 organisms/m2. Densities in the two watercourses were similar in 2006 (Synenco Energy, 2006); however, they displayed greater variability in 2007 (Appendix 8B). Total richness appeared to be somewhat higher in Astotin Creek than Beaver Hill Creek during the spring in both 2006 and 2007.
Dominance is a measure of the most common taxa at a site, and higher values generally indicate disturbance or changes to the environment. Often r-selected species are quick to establish large populations after communities of other organisms have collapsed. Dominance was considerably higher in Astotin Creek than Beaver Hill Creek, and was lowest in Astotin Lake, most likely because of a more stable benthic environment.
Community composition of samples collected in the LSA was largely comprised of midges (Chironimidae), aquatic worms (Oligochaeta) and nematodes. The occurrence of large populations of these groups may indicate eutrophication or organic inputs into benthic habitats. This is not uncommon in agricultural areas, as the presence of livestock near watercourses, fertilization of cropland and the breakdown of allocthonous sources of carbon (leaves and terrestrial vegetation) can all contribute to increased organic matter in benthic substrates. Notably, community composition in Astotin Lake was more diverse than in either watercourse.
Differences in community composition between samples collected in 2006 (Synenco Energy, 2006) and samples collected for the project in 2007 suggest that the benthic community may be subject to a variable aquatic environment. Base flows in watercourses in the LSA may be quite low late in the summer and fall, exposing much of the benthic habitat to extreme conditions. For instance, PCOSI (2006) found that there was no flowing water in tributaries in the fall of 2006, and therefore could not collect samples. When habitat changes are excessive, many components of the community are affected and may need to re-establish populations when conditions permit. Depending upon the severity of annual environmental changes, community structure may vary from year to year as populations are restored.
The midge community varied between sampling years in Beaver Hill Creek. In 2006 the community consisted largely of unidentified Chironominae, whereas in 2007 the community was comprised of Chironomini and Tanytarsini (also both in the Chironominae subfamily). Astotin Lake and Astotin Creek communities (in both 2006 and 2007) were largely made up of Tanypodinae and Chironomini.
NSR
Existing benthic invertebrate data in the NSR near the LSA indicate that communities are somewhat variable in this watercourse (Golder, 1995; PCOSI, 2006; North West, 2006; Synenco Energy, 2006; Shell, 2007). Mean total abundances ranged from less than 2,000 organisms/m2 to greater than 35,000 organisms/m2 (Appendix 8B). Total richness was also variable in the NSR, ranging from 15 to 46 taxa (identified to lowest practical level).
Most of the studies considered revealed that the benthic invertebrate community was responding to nutrient enrichment. Golder (1995) and PCOSI (2006) suggested that the benthic invertebrate communities showed a change consistent with nutrient enrichment that increased from upstream to downstream. North West (2006) indicated that the proportion of midges and aquatic worms increased from upstream to downstream, which is also indicative of an enrichment effect. Shell (2007) suggested that nutrient effects in the benthic communities were evident at all sites;

8-23 December 2007 North American Upgrader Project Volume 3, Section 8 – Fish and Fish Habitat
NORTH AMERICAN OIL SANDS CORPORATION
however, an upstream to downstream gradient was not observed. Golder (1995) also identified a change in community structure downstream of two chemical plants, which may suggest a toxic effect.
8.5.6 Periphyton
Results for periphyton sampling are summarized in Table 8.5-2.
Table 8.5-2 Periphyton Samples from the LSA
Chlorophyll a Phaeophytin a Sample Point Sample Date
mg/m2 mg/m2
nd nd nd 1.14 AST1 May 1/07 nd 1.14
18.75 8.52 nd nd AST2 May 1/07
19.89 6.82 3.41 2.84 30.11 6.25 AST6 May 3/07 5.11 2.84 nd 2.27
0.57 1.14 NSR1 May 3/07 1.14 1.14 6.82 3.98 1.14 6.25 NSR3 May 3/07 2.84 0.57 nd nd nd nd NSR4 May 3/07
1.70 1.14 nd=below detection limits
8.5.6.1 Chlorophyll a
Mean chlorophyll a concentrations ranged from non-detectable in Astotin Creek (AST 1) to 30.11 mg/m2 (AST 6). The highest concentrations in the NSR sites were 6.82 mg/m2 at NSR 3. A spring survey conducted for Synenco Energy (2006) yielded similar chlorophyll a levels, ranging from 14 to 113 mg/m2.
8.5.6.2 Phaeophytin a
Mean phaeophytin a concentrations ranged from non-detectable in Astotin Creek (AST 1) to 8.52 mg/m2 (AST 2). Concentrations in the NSR sites ranged from non-detectable to 6.25 mg/m2 (NSR 3). A spring survey conducted for Synenco Energy (2006) yielded similar phaeophytin a levels, ranging from 4.25 mg/m2 (Astotin Creek) to 38.4 mg/m2 in the NSR.
8.6 Impact Assessment and Mitigative Measures Fish and fish habitat in the North American Project area was assessed in terms of indicator species. Potential impacts to indicators were evaluated in the context of project development, operation and reclamation activities, and include plant facilities, access roads, utility corridors and pipelines. Project activities with the potential to affect aquatic recourses include; first, riparian

8-24 December 2007 North American Upgrader Project Volume 3, Section 8 – Fish and Fish Habitat
NORTH AMERICAN OIL SANDS CORPORATION
and instream habitat loss or alteration, including altered flow regimes; and secondly, combined industrial disturbance of fish habitat (i.e. effluent discharge, waterbody acidification, spills or releases). Criteria for evaluating impacts are outlined in Table 8.4-2. Mitigative measures for impacts include management of operations; best management practices for construction and maintenance activities; and prevention initiatives, and they are summarized as they relate to the identified potential impacts.
8.6.1 Indicators
Indicator species depend upon a number of elements in the aquatic environment at various life history stages. They may be affected at various levels (e.g., population abundance, community diversity, health, etc.) when the aquatic environment undergoes change (e.g., effects from industry, over fishing, etc.). Indicators are species (e.g., northern pike) or groups of organisms (e.g., benthic invertebrates) that represent larger groups or processes in the aquatic environment. By acting as surrogates for the larger system, they help to focus the assessment. Specific indicators are chosen because they are able to signal environmental changes that may be caused by certain project-related activities. It is important to choose indicators with relevance to stakeholders, regulators and the aquatic environment.
Environmental changes in aquatic environments are often reflected in alteration to the fish community. Changes to habitat (e.g., substrate, water chemistry, water flow, cover) and food (e.g., macroinvertebrates) may affect fish in ways that include, but are not limited to:
• decreased fish population;
• altered spawning activity;
• altered movement of fish in or out of an area; or
• compromised fish health (e.g., low weight-to-length ratio, lesions, reduced fecundity).
According to recent literature on indicator species, the appropriateness of each indicator to detect environmental change should be assessed, and the natural history of each indicator should be considered to include a variety of indicator responses to detect environmental changes (Karr and Chu, 1999). Fish from different trophic levels (position in the food chain) should be included among the chosen indicators (Shuter and Post, 1990). Generalists (e.g., fish that can eat a variety of food types) tend to do better than specialists (e.g., predators) when environmental changes affect food sources (e.g., macroinvertebrates, algae, small-bodied fish). Small-bodied fish tend to mature rapidly and have a short life span. Consequently, their populations are greatly affected by stressors that affect larval development or fecundity (e.g., changes to pH).
The use of the benthic macroinvertebrate community (benthics, benthic invertebrates) as an indicator has increased in recent years because these communities have attributes that allow them to respond quickly to environmental change. Benthics are short-lived (one generation every two years to more than one generation in a year) and spend most of their lives in a local area. Benthic invertebrates are generally easy to sample, and community attributes (e.g., abundance, diversity, composition) are simple to calculate. Changes in these attributes are also easy to monitor, providing an indication of changes in the aquatic environment.
The following groups were chosen as indicators for the Project study area.

8-25 December 2007 North American Upgrader Project Volume 3, Section 8 – Fish and Fish Habitat
NORTH AMERICAN OIL SANDS CORPORATION
Benthic Macroinvertebrates
Benthic macroinvertebrates generally dwell in natural aquatic habitats. Habitat types tend to support identifiable invertebrate communities (e.g., erosional watercourse communities vs. depositional watercourse communities). A rapid response to environmental change (e.g., sedimentation, water quality) by the invertebrate community is a result of various attributes. These include:
• short life span;
• small territory;
• species with very defined niche requirements; and
• numerous trophic levels.
The role that benthic macroinvertebrates play in the food chain is also important, and is reason for their inclusion in the aquatic assessment. Fish species in northern Alberta generally depend on invertebrates for food during at least one life stage (Scott and Crossman, 1998).
Brook Stickleback
Brook stickleback are a common fish species throughout most of Alberta, and exist in a variety of habitats, including small ponds, lakes and streams with varying velocity and substrate type (Scott and Crossman, 1998). Being tolerant of a wide range of environmental conditions, the brook stickleback can populate many marginal habitats. They are known to tolerate low oxygen levels (Nelson and Paetz, 1992) and high salinity levels, and can survive where other species cannot (Scott and Crossman, 1998). Populations are known to occur in Astotin Creek (Synenco Energy, 2006).
Brook stickleback are predaceous, feeding upon fish eggs, benthic invertebrates and the larvae of various aquatic insects and fishes (Scott and Crossman, 1998). They are also a food source used by larger-bodied fish, including northern pike (Scott and Crossman, 1998). The fish matures in about one year and lives for about two to three breeding seasons.
White Sucker
White sucker is a fish species captured in rivers and lakes in many habitats throughout Alberta, except for high mountainous areas (Scott and Crossman 1998; Nelson and Paetz, 1992). They are generally bottom feeders, with a diet made up primarily of benthic invertebrates, mollusks and algae.
White suckers often favour specific tributaries for spawning, which occurs in Alberta from mid-May through June, when water temperature is about 10ºC. When conditions are right, hundreds of white sucker may migrate from their resident lake to a suitable stream with shallow water and a gravel substrate. White suckers are known to spawn around shoreline areas of lakes. Fecundity is related to size, with females producing an average of 10,000 eggs to 35,000 eggs during a spawning season. The life span is generally between 14 years and 17 years. Although this species is not considered commercially important, it may be captured with sportfish, including northern pike, walleye, yellow perch, lake whitefish, cisco and burbot.

8-26 December 2007 North American Upgrader Project Volume 3, Section 8 – Fish and Fish Habitat
NORTH AMERICAN OIL SANDS CORPORATION
Northern Pike
Northern pike is a popular sportfish captured throughout most of Alberta, except in some high mountainous areas (Nelson and Paetz, 1992). They prefer weedy, clear waters in lakes and marshes, but are also commonly captured in slower rivers and streams. Spawning occurs in early spring, often while ice is still present (Scott and Crossman, 1998). They typically find shallow, marshy locations or flooded grassy areas with ample vegetation to deposit their eggs.
Northern pike generally lie and wait for prey rather than hunt (Scott and Crossman, 1998). They are, however, aggressive and will eat other fish, crustaceans, insects, young muskrats and ducklings. Young of the year have been documented feeding on minnows, suckers, trout-perch and brook stickleback.
8.6.2 Assessment Criteria
Potential fish and fish habitat issues associated with the Project were identified based on the final Terms of Reference (TOR) prepared by AENV (Volume 1, Appendix A) and professional judgment.
8.6.3 Effects on Aquatic Resources
Several potential impacts were identified that could be affected by components of the Project, specifically during the Project’s construction and operation phases. Those identified included the potential changes to water quality in local watercourses and waterbodies as a result of sedimentation due to construction activities (which include riparian habitat disturbances); fish habitat alteration and loss due to changes in water levels and flow; fish habitat alteration and loss due to water intake construction; contamination of fish and fish habitat from wastewater discharge and spills; and fish loss due to entrainment at the water intake.
8.6.3.1 Sedimentation
Changes in sedimentation levels in watercourses and waterbodies are often the result of silt and clay particles, originating from the terrestrial environment, being released into the aquatic environment via surface water runoff. Runoff water flowing over a disturbed area collects and transports silt and clay particles that contribute to the sediment loading of surface water. Construction activities in close proximity to watercourses and waterbodies can lead to an increase in the potential for both the disturbance and suspension of sediments in the water column. Construction activities, including land clearing, road, plant and water intake construction, can potentially increase sediment in runoff to local watercourses and waterbodies (i.e., NSR), and may result in changes to fish habitat and fish health.
Environmental Issue
An increase of sediment loading into watercourses and waterbodies can have an impact on the aquatic environment. Sedimentation reduces overall fish habitat quality by filling the interstitial spaces in the gravel, rock or sand, leaving the substrate unsuitable for spawning and/or smothering of fish eggs. Increased turbidity causes many benthic invertebrate species to drift downstream, thereby reducing available food for resident fish populations. Where deposition occurs, benthic invertebrate communities can change from organisms favouring erosional habitat to organisms favouring depositional habitat, thus changing the type of food available for local fish.
An increase of sediment loading into watercourses and waterbodies can also have an impact on the health of fish communities. Fish behavior can be affected by an increase in turbidity; for
8-27 December 2007 North American Upgrader Project Volume 3, Section 8 – Fish and Fish Habitat
NORTH AMERICAN OIL SANDS CORPORATION
example, the feeding ability of visual feeder species such as Arctic grayling is reduced. Additionally, some fish species avoid turbid streams (Scott and Crossman, 1998) or move out of the areas with high turbidity; thus they are prevented from using traditional migration routes, feeding areas and spawning habitats. Fine sediments in moving water may act as a scouring agent, resulting in erosion to external gills on some benthic invertebrates (e.g., mayfly species). Sediments may also adhere to fish gills by sticking to mucous, resulting in the irritation of the gill membranes. This condition may then lead to increased infections in the gill tissues and inhibited respiration.
Mitigation
Increases in suspended sediment during land clearing, road construction and plant construction will be prevented by implementing mitigation measures and using best management practices (as described in Volume 3, Section 6.6.3). The effects of an increase in suspended sediment during water intake construction will be reduced by conducting instream activities outside of the Restricted Activity Period for this reach of the NSR (August 1 to April 15), by isolating the work site using a coffer dam and placement of clean armour (to prevent scour/erosion), and by implementing an appropriate construction water management and sediment control plan (Volume 3, Section 6.6.3).
Conclusions
Environmental effects on fish instream habitat due to sedimentation are predicted to be short-term and localized. Environmental impacts on the receiving environments are predicted to be negligible.
8.6.3.2 Water Levels and Flows
Surface water levels and stream flows are important environmental characteristics that, when altered, can affect the quality of fish habitat. Water levels determine the amount of available habitat, and the associated stream flow velocity strongly affects habitat quality (e.g., substrate composition). Development activities within the LSA have the potential to change surface water flow characteristics throughout the lease area. The creation of artificial drainage, straightening or alteration of existing channels and the removal of existing vegetation may increase flows and subsequently alter downstream habitat. However, in Volume 3, Section 6.6.4.2, it was predicted that any impact on downstream flows in the Astotin Creek and unnamed tributary basins are not expected to be detectable. Water withdrawal via the proposed water intake from the NSR has the potential to contribute further to fluctuations in water level.
Changes in surface flow are not always the result of development activities. Natural processes such as beaver activity in the area can also influence local surface water flow patterns. When watercourses associated with small lakes are influenced by beaver activity, changes in waterbody levels can occur. These changes can confound predictions regarding surface water flow dynamics. In addition, altered surface water flow patterns related to beaver activity can strongly affect fish and fish habitat. Beaver dams can restrict the migration of fish between overwintering or rearing areas and habitat suitable for spawning (e.g., headwater streams used by Arctic grayling). Flooding regime alterations can also affect conditions necessary for species like northern pike to spawn. For example, lakes may become impounded and restrict fish movement in and out of available habitats.

8-28 December 2007 North American Upgrader Project Volume 3, Section 8 – Fish and Fish Habitat
NORTH AMERICAN OIL SANDS CORPORATION
Potential Environmental Changes
Shoreline habitat and the littoral zone are considered critical for the health of the aquatic environment, and extend from the shoreline of a lake and continue to depth where sufficient light for plant growth reaches the sediments and lake bottom. The littoral zone is the area where adequate light can penetrate the bottom of the water column and allow for plant growth (Wetzel, 2001), which provides food and cover for many aquatic insects. In turn, many fish species use these areas to gain access to food (smaller fish and invertebrates), for cover and in some cases for spawning habitat (e.g., northern pike). Small decreases in water level at shallow shoreline areas can cause the water’s edge to recede, thus eliminating these areas of available habitat. In shallow lakes, a drop in the water level may allow sunlight to penetrate throughout the water column over the extent of the lake and cause an increase in primary productivity, thereby altering lake trophic levels. A drop in water level may also reduce the capacity of some waterbodies to provide overwintering habitat.
Watercourses can be affected by alterations in water levels in ways similar to waterbodies. Decreases in stream flow levels expose substrate at the shoreline and may also decrease shoreline cover. Decreased stream flows result in alterations to pool depths, impacting the fish habitat used for spawning, rearing, feeding, migration and overwintering. Additionally, increased velocities and changes to water volume may result in scouring of stream beds and changes to channel alignments.
Water quality parameters such as temperature, pH, DO and chemical load are important for fish health, and can change as a result of fluctuations in water levels. During the open-water season, changes in water temperature can be a function of water volume and depth. Temperatures in shallow waterbodies tend to fluctuate more rapidly than in deeper waterbodies. Chemical and biological processes (e.g., photosynthesis and respiration) may become more pronounced in lakes with reduced water levels. Fluctuations in pH levels and the oxygen/carbon dioxide ratio may change considerably, potentially affecting fish health. In addition, the chemical load (the amount of a given chemical a waterbody can safely assimilate) decreases as water levels go down.
Benthic invertebrate communities provide an important source of food for a number of fish species, and alteration to stream flows impact these communities. Some benthic invertebrates find the effects of modified stream velocities unfavourable, resulting in decreased food available for fish.
Mitigation
Changes in stream flows and lake levels will be prevented through a number of mitigation measures, implemented during both design and construction activities, as described in Volume 3, Sections 6.7.1 and 6.8. These changes, however, will be very limited and difficult to detect, and the nearest waterbody with fish habitat potential is located well outside the zone of predicted impact. The local waterbodies generally consisted of low-quality fish habitat supporting forage fish tolerant of low DO environments (i.e., brook stickleback) and low overwintering potential (frozen to bottom).
The cumulative effects of withdrawals are considered low in view of the considerations described in Volume 3, Section 6.7.1, including:
• not all licenced users will withdraw their full licenced amounts;
• while peak withdrawal rates may be higher than the licenced annual average rate presented here, these will not all occur at the same time, and many, due to cooling water

8-29 December 2007 North American Upgrader Project Volume 3, Section 8 – Fish and Fish Habitat
NORTH AMERICAN OIL SANDS CORPORATION
demands, will generally occur during the higher summer flow conditions than the 7Q10 low value, which is a winter flow condition;
• downstream inflows further reduce the cumulative effects of withdrawals;
• the daily fluctuations in flow currently occurring on the river are typically much greater than the sum of all net withdrawals;
• flow regulation has substantially increased previous natural low flows in the river (the 7-day minimum annual flow has increased from a median of 22.4 m³/s prior to regulation to 77.8 m³/s after regulation); and
• Flow monitoring accuracy on the river is likely in the order of ±5%.
Conclusions
Changes in water levels due to project activities should be isolated and short-term (limited to the duration of the construction period). Environmental impacts on the receiving environments are predicted to be negligible.
8.6.3.3 Riparian Habitat
Riparian zones provide ecosystem features that influence the aquatic habitats that support fish. Riparian areas are characterized as the bank and shoreline features of watercourses and waterbodies, as well as associated vegetation. This includes moist soils and substrates above the waterline, and also trees, shrubs, grasses and forbs growing along the bank. Riparian zones provide several features of fish habitat, including overhanging vegetation, submerged large woody debris and root wads. During periods of spring freshet, flooded areas in the riparian zone may also provide spawning habitat for species, such as the northern pike, that deposit eggs on inundated vegetation. These flooded areas may also provide refuge for various species during periods when stream flows are elevated.
Potential Environmental Changes
Project activities with the greatest potential to impact riparian habitat are associated with construction in the area adjacent to the water intake structure on the NSR. This activity requires the removal of sections of trees and vegetation, as well as the disruption of soil makeup on the banks.
Physical effects resulting from surface water runoff are moderated by vegetative cover in the riparian zones, slowing flow velocity that would otherwise cause stream bank erosion. Shoreline vegetation also acts as a filter for suspended sediments, reducing the sediment loading in watercourses and waterbodies. Additionally, many nutrients are absorbed by vegetation in the riparian zone, thus reducing nutrient loading and the associated effects they may have on trophic structure within the water column.
Alteration to riparian habitat may therefore result in impacts to fish health and fish community structure.
Mitigation
Impacts to riparian habitat will be limited to the areas of localized construction activities in the area adjacent to the water intake structure. With the recommended mitigation activities outlined

8-30 December 2007 North American Upgrader Project Volume 3, Section 8 – Fish and Fish Habitat
NORTH AMERICAN OIL SANDS CORPORATION
in Volume 3, Section 6.6.3, disturbed riparian habitat would be restored to conditions consistent with “no net loss” principles. In the unlikely event that the riparian habitat cannot be restored, alternative techniques will be discussed with regulators. Impacts to riparian habitats associated with the North American project are predicted to be short-term and localized. North American is committed to following best management practices to ensure that the impacts to fish and fish habitat will be minimized.
Conclusions
Environmental effects to riparian habitat are predicted to be isolated, short-term and localized, with a low magnitude. Environmental impacts on riparian habitat are predicted to be low as a result of the implementation of best management practices associated with the construction of roads and the water intake structure.
8.6.3.4 Benthic Invertebrate Abundance and Composition
The benthic invertebrate community includes a variety of insects that live on or in the substrates of waterbodies and watercourses. This community of organisms includes the larval and pupal stages of terrestrial adult insects (e.g., mayflies, dragonflies, black flies, midges, etc.), as well as some groups that spend their entire life underwater (e.g., aquatic worms, beetles, nematodes, some crustaceans, snails, etc.). Benthic habitat is typically defined as the interface between sediment and the water column, on the surface of sand, rocks and boulders. Invertebrates living on woody debris, on plant surfaces under the water and within the sediment itself are also included in this group.
Benthic invertebrates play an important role within the aquatic ecosystem. Populations of midges and aquatic worms cause the release of nutrients from sediment that is then available to bacteria, algae and aquatic vegetation for primary production. Organic plant material is broken down and consumed by some benthic organisms, thus continuing the nutrient cycle in the aquatic system. Because many benthic organisms serve as prey for fish, they also provide an important link for energy to be transferred to higher animals (e.g., fish and birds).
Potential Environmental Changes
Benthic invertebrate populations are susceptible to many of the same impacts as fish, including sedimentation, fluctuations in water level, alteration to water quality and general habitat degradation. As the benthic invertebrate community is a source of food for many fish species, changes in their health or population will inevitably affect the fish community. Changes in water levels and flows (Section 8.6.3.2) may result in a reduction of habitat area and changes to overall water quality. Benthic invertebrate community composition is often largely attributed to the effects of water velocity. Increased sedimentation (Section 8.6.3.1) may damage external gills. Project activities with the greatest potential to impact riparian habitat are associated with construction activities in the vicinity of the water intake structure. These activities require the removal of bank vegetation, which may cause increased sedimentation. Emissions-related effects can alter concentrations of major ions in waterbodies and affect pH levels (Section 8.6.4.2). These changes in water quality may impact some sensitive invertebrates. Additionally, land clearing, road construction and plant construction may directly disturb sediments, thereby affecting invertebrates in localized areas.

8-31 December 2007 North American Upgrader Project Volume 3, Section 8 – Fish and Fish Habitat
NORTH AMERICAN OIL SANDS CORPORATION
Mitigation
Construction of site facilities will comply with pertinent legislation and regulatory guidelines and practices. Effects on the benthic invertebrate community associated with the construction and operation of the Project will be alleviated by mitigation described further in Section 8.6.3.1.
Conclusions
Planned mitigation will ensure that construction activities associated with the Project will have a negligible effect on suspended sediment concentrations in receiving streams, lakes, ponds and wetlands. Therefore, impact to the benthic invertebrate community from altered water quality due to the release of sediment is expected to be negligible.
Changes in surface water levels and flows from Project construction and operation activities are predicted to be negligible. Therefore, loss of benthic invertebrate habitat from changes in water levels will be no greater than natural variation.
Small areas of benthic habitat may be altered with the construction in the vicinity of watercourses. However, effects are predicted to be localized and short-term. Once construction with mitigation measures is completed, the benthic community will be able to re-colonize disturbed habitats naturally.
The benthic invertebrate community is not likely to experience many changes from acidification of waterbodies. The lakes in the LSA are well buffered; therefore, the occurrence of acidification in the Project is not likely. Overall, the majority of lakes located within the Project’s RSA were found to be well buffered, with concentrations of CaCO3 commonly greater than 100 mg/L (Volume 3, Section 7.5.5.2). If acidification occurs, impacts to benthic invertebrates will be negative and subregional in extent, with medium magnitude. The duration will be long-term, with isolated frequency and long-term permanence. These predictions have been made with moderate confidence. The potential environmental impact to benthic invertebrates is predicted to be moderate under acidifying conditions.
Most activities associated with the Project development, operation and reclamation are conducted with measures to protect the aquatic environment. Where acidification is not a concern, impacts are predicted to be neutral and of negligible magnitude, short-term in duration and occur in occasional frequency. Impacts are expected to be reversible in the medium-term. The overall environmental impact rating for benthic invertebrates is considered to be low impact.
8.6.4 Combined Industrial Disturbance on Fish and Fish Habitat
A number of areas were identified to have the potential to impact fish and fish habitat from combined industrial disturbances associated with the Project (e.g. spills, discharges, changes in pH). The areas of potential impact included spills and wastewater discharges, changes in surface water pH and water intake construction effects on fish habitat.
8.6.4.1 Wastewater Discharge, Stormwater Runoff and Spills
The introduction of toxic or anthropogenic substances into the watercourses and waterbodies in the LSA may result in changes to surface water or groundwater quality. Accidental releases of toxic substances may occur from a variety of activities during construction, operation and reclamation of the Project.

8-32 December 2007 North American Upgrader Project Volume 3, Section 8 – Fish and Fish Habitat
NORTH AMERICAN OIL SANDS CORPORATION
Potential Environmental Changes
Wastewater discharge may result in accumulation of contaminants in higher trophic levels (such as piscivorous sportfish species like northern pike) which could affect the quality of fish relative to human consumption. Human health consumption guidelines exist for mercury, dioxins and furans (ASRD, 2007a). Only mercury will potentially be released in the wastewater discharge. Mercury has the potential to bioaccumulate in sportfish from the consumption of lower trophic levels and sediments, or through water exposure and subsequent uptake across the gills.
Stormwater runoff has the potential to introduce substances into surface waters. Elevated concentrations of foreign substances may result in changes in fish behavior (e.g., predator avoidance, spawning, feeding) and physiology (e.g., respiration, sensory mechanisms). Water quality alterations may also result in adverse affects on fish tissue quality (i.e., chemical burdens, tainting).
Mitigation
Conservative water quality modelling (Volume 3, Section 7 - Surface Water Quality) indicates that Project effluent will not increase the concentration of metals above CCME guidelines for aquatic life (including mercury) in the NSR under the fully mixed condition. The potential for the Project to contribute mercury to the NSR and increase bioaccumulation in sportfish is expected to be low.
During the development and operation phases of the Project, various measures will be taken to minimize the occurrence of spills and upset conditions. Spills will be cleaned up as per the North American emergency response procedures. Additionally, vehicles, machinery and facilities will be maintained in a manner that prevents the introduction of hydrocarbons or other deleterious substances into the environment.
Introducing foreign substances into surface water via stormwater runoff will be mitigated by implementing a stormwater management plan (Volume 1, Section 6 - Hydrology). Stormwater runoff will be collected in retention ponds, where it will be tested and treated (if necessary) to meet AENV guidelines before release into natural areas.
Conclusions
As a result of proposed water treatment plans and conservative water quality modelling, environmental impacts to fish and fish habitat as a result of wastewater discharge are predicted to be low. The collection and treatment of stormwater runoff will prevent any effects to surface water quality. The effects to fish and fish habitat are predicted to be negligible.
8.6.4.2 Changes in pH
The deposition of aerial emissions as a result of industrial activities has the potential to alter the chemistry of surface water in surrounding areas. The primary pollutants associated with aerial depositions include NOx and SO2, the precursors to nitric and sulphuric acid, which are the main constituents that may contribute to the acidification of waterbodies and watercourses.
Potential Environmental Changes
The effects of acidification within aquatic communities generally occur as pH levels reach 6.0 to 5.5 (Carbone et al., 1998; Husky, 2003). When pH levels fall below 5.0, impacts to aquatic communities become more severe, at times leading to the extirpation of aquatic species.

8-33 December 2007 North American Upgrader Project Volume 3, Section 8 – Fish and Fish Habitat
NORTH AMERICAN OIL SANDS CORPORATION
Waters with observed alkalinity levels less than 20 mg/L CaCO3 are considered to have a low acid neutralizing capacity and are more susceptible to the effects of acidification (Saffran and Trew, 1996). Waters with alkalinities at higher levels are considered to have a greater buffering capacity from the effects of acidification. Further discussion on surface water acidification from aerial deposition is included in Volume 3, Section 7 - Surface Water Quality.
Based upon the results from Surface Water Quality (Volume 3, Section 7) and Air Quality assessments (Volume 2, Section 2), the lakes within the Astotin Creek study area were determined to be well buffered at baseline (i.e., before Project commencement). Altered pH levels in regional waterbodies resultant from aerial deposition are considered a potential impact to fish and fish habitat. Changes associated with acidification would likely be long-term and, notably, irreversible in the short-term.
Mitigation
As a result of findings from the Surface Water Quality (Volume 3, Section 7) and Air Quality (Volume 2, Section 2) assessments for the Project, acidification from aerial deposition is considered to be unlikely.
Conclusions
The majority of lakes located within the Project’s RSA were found to be well buffered, with concentrations of CaCO3 commonly greater than 100 mg/L. The level of environmental impact is projected to be low for the remaining lakes in the RSA. This topic is discussed in detail in Volume 3, Section 7. It is reasonable to predict that the overall impact to fish and fish habitat related to project activities and altered pH will be low.
The environmental effects related to changes in pH associated with acidifying emissions on waterbodies not considered to be sensitive to acidification are predicted to be isolated, short-term and localized, with a negligible magnitude. No environmental impacts resulting from acidifying emissions on these waterbodies are predicted.
8.6.4.3 Water Intake Effects on Fish and Fish Habitat
The construction and operation of an intake on the NSR could affect the fish habitat and water quality in the NSR. The construction of the water intake has the potential to alter the watercourse and deposit sediment. Potential loss of fish may occur due to entrainment at the intake during operation and water withdrawal.
Potential Environmental Changes
Specifically, effects on fish habitat could result from direct disturbance, alteration or loss of productive habitats at the intake location. The proposed intake design is discussed in Volume 3, Section 6.6.2. A total footprint area of up to 450 m2 on the river bed is assumed.
Instream construction activities could potentially increase deposition of fine sediments downstream of the intake structure (short duration). Increased sedimentation might result in changes to food availability, suitability of spawning or overwintering habitats and alterations to channel morphology and cover habitat. Installation of the coffer dam and isolation activities could result in fish being stranded within the structure, as well as possible mortality.
Stream bed scouring, as a result of instream construction and hydrodynamic influences of the intake structure, could also affect fish habitat.

8-34 December 2007 North American Upgrader Project Volume 3, Section 8 – Fish and Fish Habitat
NORTH AMERICAN OIL SANDS CORPORATION
Entrainment of fry or juvenile fish at the intake could result in a decrease of recruitment levels and an overall decline in the local fish populations.
Mitigation
Because of the potential for erosion and the disturbance of fish habitat associated with the intake structure, the environmental effects are predicted to be low to moderate. Applications to construct the intake structure will be required under the Alberta Water Act. In addition, authorizations by DFO under the Fisheries Act and Transport Canada under the Navigable Waters Protection Act (Canadian Coast Guard, 1994) will also be required.
The intake structure will have a screen to prevent debris from entering the intake pumps and to exclude fish, and will meet the DFO criteria outlined in the “Freshwater Intake End-of-Pipe Fish Screen Guidelines” (DFO, 1995). The intake structure will be designed to draw the amount of water needed for operations, while maintaining water velocities that will not endanger smaller fish or fry by pulling them up against or through the intake screen.
Mitigation of potential impacts related to the construction of the NSR water intake for the Project will be accomplished by constructing the intake according to the guidelines and procedures of Transport Canada under the Navigable Waters Protection Act.
Construction scheduling will be completed in consultation with DFO and ASRD to minimize potential impacts of sedimentation and channel alteration on the NSR, and to ensure that activities do not affect fish activities at the intake location. The intake location will be isolated during construction to minimize downstream sediment deposition by:
• minimizing disturbances of stream banks in the immediate area;
• developing and implementing an erosion and sediment control plan before construction, to minimize suspended sediment generation caused by surface water runoff from newly excavated approach slopes and bank areas. Sediment control measures will include appropriate coffer damming, recontouring, revegetation and appropriate use of silt fences; and
• prior to dewatering of the work area, a fish salvage should be undertaken, returning fish to the main channel of NSR, thereby reducing fish mortalities.
A habitat compensation program may be developed to address the temporary disruption of fish habitat during the construction of the intake structure, as well as the loss of 450 m2 of habitat. Habitat compensation, if required, would be determined through consultations with DFO and ASRD.
The loss of potential fish habitat due to the intake structure footprint will be partially mitigated due to the design of the intake structure (Volume 3, Section 6.6.2). Backwater areas will exist upstream and downstream of the intake, providing a velocity break and cover for local and migrating fish. A detailed description of fish habitat compensation will be discussed in a separate application.
Conclusions
The environmental effects related to water intake construction are predicted to be isolated, short-term and localized, with a negligible magnitude. Environmental impacts resulting from the water intake on fish mortality due to entrainment is predicted to be negligible. Fish habitat loss due to the water intake footprint is expected to be a low-magnitude, medium-term effect.

8-35 December 2007 North American Upgrader Project Volume 3, Section 8 – Fish and Fish Habitat
NORTH AMERICAN OIL SANDS CORPORATION
8.6.4.4 Nutrient Enrichment
Wastewater discharge during operations can contribute nutrients, including phosphorus, nitrogen-containing compounds (including ammonia, nitrate/nitrite and organic nitrogen) and organic carbon. The addition of these components to a waterbody can contribute to eutrophication in a waterbody. The organic carbon content available for decomposition can be measured by two methods. The first is via biochemical oxygen demand (BOD), which is the amount of oxygen consumed during a five-day decomposition of the effluent under laboratory conditions. The other method is by chemical oxygen demand (COD), which provides a faster measure of BOD but is generally much higher.
Under high nutrient loading, the propagation of plant and algal matter can lead to increased decomposition of plant material, thus lowering oxygen levels. Increased bacterial activity associated with BOD may result in oxygen depletion, particularly where re-aeration is limited, such as under ice. Excessive plant and algal growth may cause wide swings in oxygen levels, from supersaturation during daylight hours to depletion at night, when both bacterial decomposition and respiration by plants are at a maximum (Wetzel, 2001).
The loading of BOD, in conjunction with nutrient loading, would be expected to contribute to a reduction in oxygen levels. During the growing season, oxygen levels can decline below saturation at night due to plant and algal respiration, particularly where there is excessive growth of plants and algae. Although no data are available to assess nighttime depletion, a few measurements collected in the early morning do not suggest major overnight declines in oxygen levels. However, oxygen depletion during the growing season depends on many factors and can be highly episodic, so lower levels of oxygen than have been recorded might occasionally occur.
Potential Environmental Changes
The effect of nutrient inputs to aquatic biota is complex and varied. Low levels of organic matter stimulate bacterial activity, and the bacteria, in turn, provide an increased food source to aquatic microorganisms near the base of the food chain. Increased bacterial activity can lower oxygen levels, depending on the amount of BOD. Nitrogen and phosphorus stimulate the growth of algae (both attached and planktonic) and macrophytes when other conditions are suitable for growth, such as light availability and substrate. An increase in primary nutrient production (i.e., phytoplankton) can increase invertebrate and overall aquatic community production, but can also lead to loss of sensitive species and habitat changes (e.g., bare rocks can become covered in algae). Certain types of algae (e.g., blue-green algae) may also produce toxins, and eutrophication may lead to blue-green algal blooms and increased production of algal microtoxins.
Mitigation
Conservative water quality modelling (Volume 3, Section 7) indicates that project effluent may increase the concentration of nutrients above CCME guidelines for aquatic life in the NSR under the fully mixed condition. It is important to note that background levels of nutrients in the NSR, specifically total phosphorus and nitrites, already exceed CCME guidelines (Volume 3, Section 7.6.4.2).
Conclusion
Overall, available information indicates that the LSA does not generally experience substantive oxygen depletion in the open-water season. Environmental impacts on the receiving environments are predicted to be negligible. The potential for the Project to contribute to nutrient

8-36 December 2007 North American Upgrader Project Volume 3, Section 8 – Fish and Fish Habitat
NORTH AMERICAN OIL SANDS CORPORATION
enrichment in the NSR is expected to be low, and to last for the duration of the operation phase of the Project.
8.7 Cumulative Effects Assessment A Cumulative Effects Assessment (CEA) considers the potential impacts associated with the Project in combination with other existing and future projects located within the Project’s RSA. Currently, there are a number of projects that exist or have been announced in the RSA. A list of these projects is presented in Volume 2, Section 1.
Impacts to fish and fish habitat are generally predicted to be negligible to low and localized as a result of North American’s commitment to adhering to best management practices as they relate to activities in the vicinity of all watercourses and waterbodies. Impact assessments for other projects in the region have also predicted low impacts, localized around each project’s intake structure or outfall. As such, the potential fish and fish habitat impacts are not considered to spatially overlap, and therefore no cumulative effects are anticipated.
Cumulative impacts to water quality of the NSR were assessed to be negative in direction, regional in extent, low in magnitude, medium-term in duration, continual in frequency and reversible in medium-term. The effects will be low in magnitude because the incremental increases in certain water quality parameters as a result of the Project are within water quality guidelines (Volume 3, Section 7.7.2). The residual effects of acid emissions on the water quality of regional lakes will be negligible (Volume 3, Section 7.73). Based on the relationship between water quality, fish health and fish habitat, no cumulative effects are predicted for fish.
8.8 Follow-up and Monitoring North American will adhere to monitoring and mitigation activities during Project development, operation and closure as required.
For construction activities occurring at or near watercourses and waterbodies, appropriate authorizations will be obtained prior to activity commencement. Monitoring and mitigation programs that will be conducted in the LSA in association with the construction activities are further discussed in the mitigation sections outlined in Section 8.6.
8.9 Impact Summary The fish and fish habitat LSA was delineated based on the Project lease and footprint areas, as well as local drainage basin boundaries. The LSA includes waterbodies and watercourses which may be affected, directly or indirectly, by the Project. The RSA was selected based on potential effects to fish and fish habitat resulting from changes in water flows, levels and quality. In addition, the RSA encompasses the area where the cumulative effects assessment would be focused.
Baseline studies on fish and fish habitat were conducted in 2006 and 2007. Study locations in two waterbodies and three watercourses were selected to characterize fish habitat potential and identify resident fish populations. Historical data sources were reviewed and used to supplement the baseline data collected during field surveys. The overall fish habitat quality observed in the area in both watercourses and waterbodies ranged from low to high. Both forage fish and large-bodied fish species were observed during the field surveys, and included brook stickleback and white sucker.

8-37 December 2007 North American Upgrader Project Volume 3, Section 8 – Fish and Fish Habitat
NORTH AMERICAN OIL SANDS CORPORATION
The fish and fish habitat assessment considered the Project activities that had the potential to cause direct or indirect impact to fish and fish habitat, surface water quality and hydrology. Key issues related to riparian and instream fish habitat alteration and combined industrial disturbance on fish habitat were assessed in relation to the Project. In general, the Project is not expected to have any impacts on fish and fish habitat.
Table 8.9-1 Potential Impacts Associated with the Project
Environmental Impact Associated With Fish And Fish Habitat
Dire
ctio
n
Exte
nt
Mag
nitu
de
Dur
atio
n
Freq
uenc
y
Perm
anen
ce
Con
fiden
ce
Envi
ronm
enta
l Im
pact
Changes to fish habitat through sedimentation
neutral local low Short-term occasional reversible in
short-term medium negligible
Changes to water levels, flows and drainage patterns
neutral local low Short-term isolated reversible in
short-term medium negligible
Riparian habitat degradation negative local low Short-
term isolated reversible in medium-term
high low impact
Changes in benthic invertebrate abundance and composition
neutral local low Short-term occasional
reversible in medium-term
high low impact
Effects related to facility and operation spills
neutral local low Short-term isolated
reversible in medium-term
high
wastewater: low impact runoff: negligible
Acidifying emissions on fish in waterbodies not considered acid sensitive
neutral local negligible Short-term isolated Short-term moderate no impact
Fish mortality due to operation of water intake
negative local negligible Short-term isolated irreversible high negligible
Habitat loss due to water intake footprint
negative local low Medium-term isolated
reversible in the medium-term
high low impact
Nutrient Enrichment negative local negligible Medium-
term continuous reversible in medium-term
high negligible

8-38 December 2007 North American Upgrader Project Volume 3, Section 8 – Fish and Fish Habitat
NORTH AMERICAN OIL SANDS CORPORATION
8.10 Literature Cited Alberta Sustainable Resource Development (ASRD). 2002. The Wildlife Act. Available at:
http://www.qp.gov.ab.ca/Documents/acts/W10.CFM
ASRD. 2007a. Alberta Outdoorsmen. Available at: http://www.albertaoutdoorsmen.ca/fishingregs/
ASRD. 2007b. Species at Risk. Available at: http://www.srd.gov.ab.ca/fishwildlife/status/reptilesamphibiansfish.aspx (last updated February 2, 2007).
Alberta Transportation and Utilities. 2001. Fish Habitat Manual: Guidelines and Procedures for Watercourse Crossings in Alberta. Government of Alberta.
Canadian Coast Guard. 1994. Navigable Water Protection Act; Application Guide. Marine Navigation Services.
Canadian Council of Ministers of the Environment (CCME). 2006. Canadian Water Quality Guidelines for the Protection of Aquatic Life. Summary Table, Canadian Environmental Quality Guidelines. Winnipeg, Manitoba.
Carbone, J., W. Keller and R.W. Griffiths. 1998. Effects of Changes in Acidity on Aquatic Insects in Rocky Littoral Habitats of Lakes near Sudbury, Ontario. Restoration Ecology 6(4): 376-389.
Committee on the Status of Endangered Wildlife in Canada (COSEWIC). 2007. Canadian Species at Risk. Committee on the Status of Endangered Wildlife in Canada. January 2007. 84 pages.
Department of Fisheries and Oceans (DFO). 1995. Freshwater Intake End-of-Pipe Fish Screen Guideline. Department of Fisheries and Oceans. Ottawa, ON.
Environment Canada, Species at Risk. 2007. Available at: http://www.speciesatrisk.gc.ca/search/speciesResults_e.cfm?lang=e&common=&op=1&latin=&taxid=6&sid=0&disid=2
Ford, B.S., P.S. Higgins, A.F. Lewis, K.L. Cooper, T.A. Watson, C.M. Gee, G.L. Ennis and R.L. Sweeting. 1995. Literature Reviews of the Life History, Habitat Requirements and Mitigation/Compensation Strategies for Thirteen Sportfish Species in the Peace, Liard, and Columbia River Drainages of British Columbia. Canadian Manuscript Report, Fisheries and Aquatic Sciences.
Golder Associates Ltd. (Golder). 1995. Joint Industry-Municipal NSR Study. Calgary, AB. 88 pp.
Husky Energy Inc. (Husky). 2003. Tucker Thermal Project, Volume 2B, Environmental Impact Assessment, Water. Report submitted to the Alberta Energy and Utilities Board and Alberta Environment, February 2003.
Karr, J.R. and E.W. Chu. 1999. Restoring Life in Running Waters. Island Press, Washington. 206 pp.
Mitchell, B., 2007. The Alberta Fishing Guide. Volume 37, Barry Mitchell Publications, Red Deer, AB.

8-39 December 2007 North American Upgrader Project Volume 3, Section 8 – Fish and Fish Habitat
NORTH AMERICAN OIL SANDS CORPORATION
Mitchell, P. and E. Prepas (eds.). 1990. Atlas of Alberta Lakes. University of Alberta Press, Edmonton, AB. Available at: http://sunsite.ualberta.ca/Projects/Alberta-Lakes
Nelson, J.S. and M.J. Paetz. 1992. The Fishes of Alberta, 2nd Edition. University of Alberta Press.
North West Upgrading Inc. (North West). 2006. Application for North West Upgrader Project: Aquatics Assessment Report. Prepared by EMS Solutions Ltd.
Petro-Canada Oil Sands Inc. (PCOSI). 2006. Application for Approval of Sturgeon Upgrader. Volume 2. Submitted to Alberta Energy and Utilities Board and Alberta Environment. December 2006.
Saffran, K.A. and D.O. Trew. 1996. Sensitivity of Alberta Lakes to Acidifying Deposition: an update of sensitivity maps with emphasis on 109 northern Lakes. Alberta Environmental Protection. 35 pages, plus appendices.
Scott, W.B. and E.J. Crossman. 1998. Freshwater Fishes of Canada. Gold House Publications Ltd. Oakville, Ontario.
Shell Canada Limited (Shell). 2005. Application for Approval of the Scotford Upgrader Expansion Project. Volume 2. Submitted to Alberta Energy and Utilities Board and Alberta Environment. April 2005.
Shell. 2007. Application for Approval of the Scotford Upgrader 2 Project. Volume 2A. Submitted to Alberta Energy and Utilities Board and Alberta Environment. July 2007.
Shuter, B.J. and J.R. Post, 1990. Climate, population viability and the zoogeography of temperate fishes. Transactions of the American Fisheries Society 119:314-336.
Synenco Energy Inc. (Synenco Energy) 2006. Application for approval of the Northern Lights Upgrader Project. Volume 4. Submitted to Alberta Energy and Utilities Board and Alberta Environment. September 2006.
Wetzel, R.G. 2001. Limnology: Lake and River Ecosystems. Third Edition. Academic Press.
8.10.1 Personal Communications
Buchwald, Vance. 2006. Personal communication between Matrix Solutions Inc. and Vance Buchwald of Alberta Sustainable Resource Development. November 16, 2006.

5A-i December 2007 North American Upgrader Project Volume 3, Appendix 5A
APPENDIX 5A: HYDRAULIC CONDUCTIVITY TESTS
TABLE OF CONTENTS
5A1 SUMMARY....................................................................................................................................... 1 5A2 DETAILED PUMPING TEST DESCRIPTION.................................................................................. 1
5A2.1 Well Completion Details ...................................................................................................... 1 5A2.2 Pumping Program ............................................................................................................... 1 5A2.3 Summary of Collected Data ................................................................................................ 1 5A2.4 Pumping Analysis................................................................................................................ 2 5A2.5 Pumping/Recovery Analysis ............................................................................................... 2
5A3 DETAILED BAIL-RECOVERY TEST DESCRIPTION ..................................................................... 2 5A3.1 Well Completion Details ...................................................................................................... 2
5A3.1.1 Monitoring Well 07-8........................................................................................ 2 5A3.1.2 Monitoring Well 07-11...................................................................................... 2 5A3.1.3 Monitoring Well BH06-11................................................................................. 3 5A3.1.4 Monitoring Well 07-5........................................................................................ 3
5A3.2 Bail-Recovery Program....................................................................................................... 3 5A3.3 Recovery Analysis............................................................................................................... 3
5A4 LITERATURE CITED....................................................................................................................... 3
FIGURES
Figure 5A-1 07-6 Pumping Test Water Levels Figure 5A-2 Pumping Test 07-6 Theis (1935) – Forward Solution Figure 5A-3 Pumping Test 07-6 Cooper-Jacob Time Drawdown Figure 5A-4 07-6 Pumping Test Theis Recovery Figure 5A-5 Slug Test 07-8 Bail-Recovery Hvorslev Figure 5A-6 Slug Test 07-11 Bail Recovery Hvorslev Figure 5A-7 Slug Test BH06-11 Bail-Recovery Hvorslev Figure 5A-8 Slug Test 07-5 Bail-Recovery Hvorslev
NORTH AMERICAN OIL SANDS CORPORATION

5A-1 December 2007 North American Upgrader Project Volume 3, Appendix 5A
5A1 SUMMARY Hydraulic conductivity tests were conducted at monitoring wells installed in surficial and bedrock units between May 10 and 12, 2007. Bail/recovery tests were conducted on three monitoring wells (07-8, 07-11 and BH06-11) completed in the surficial till unit, as well as one monitoring well (07-5) completed in bedrock. In addition, a pumping/recovery test was also conducted at monitoring well 07-6, which is completed in the gravel unit overlying bedrock.
Hvorslev analysis of the bail/recovery test data indicated that the clay/till unit has a hydraulic conductivity ranging between 1 x 10⁻⁹ m/s and 6 x 10⁻⁹ m/s, and the siltstone/sandstone bedrock has a hydraulic conductivity of approximately 9 x 10⁻⁹ m/s. The pumping test data was analyzed using the Theis (1935) forward solution, Theis recovery solution and Cooper-Jacob time-drawdown solution. Based on the results of these analyses, the estimated hydraulic conductivity of the gravel unit is approximately 8 x 10⁻⁵ m/s. The storativity of the gravel unit was estimated to be 2 x 10⁻³, based on the Theis forward solution.
5A2 DETAILED PUMPING TEST DESCRIPTION
5A2.1 Well Completion Details
Monitoring well 07-6 is located at UTM easting 368201 and northing 5962500 (NAD 83) on surface lease 08-35-055-21 W4M. The ground elevation is 627.6 m above sea level (masl). The well was drilled to a depth of approximately 34.3 m below ground surface (bgs), and the sand pack extends from 26.2 m bgs to 30.5 m bgs within a unit of fine sandstone and siltstone. Further details regarding the elevation and well completion are summarized in Table 5.4-2.
The static head measurement in monitoring well 07-6 was 620.68 masl.
5A2.2 Pumping Program
The pumping test was completed with a constant pumping rate measured approximately every 10 minutes. The average pumping rate was 0.41 L/s (35 m3/day), with minor fluctuations of 0.01 L/s. The pumping test lasted 90 minutes, at which time pumping ceased.
5A2.3 Summary of Collected Data
Drawdown in well 07-6 was recorded for 90 minutes during the pumping portion of the test, and for 60 minutes after the cessation of pumping. Drawdown was recorded using a dedicated pressure transducer, as well as with periodic manual measurements using a water level tape. The drawdown is displayed in Figure 5A-1. The pressure transducer was lowered to a depth of approximately 9.5 m below the static water level and 1 m below the pump intake. When the water level was at its static level, the pressure reading exceeded the transducer’s 10 m maximum due to atmospheric pressure. The manual water levels were used to fill the data gaps.
NORTH AMERICAN OIL SANDS CORPORATION

5A-2 December 2007 North American Upgrader Project Volume 3, Appendix 5A
5A2.4 Pumping Analysis
Analysis of the pumping test data was facilitated using Waterloo Hydrogeologic Inc.’s software Aquifer Test Pro 3.5. In order to estimate hydraulic conductivity (K) of the gravel unit, the pumping data was analyzed according to the Theis (1935) forward solution (Figure 5A-2), as well as the Cooper and Jacob (1946) time-drawdown solution (Figure 5A-3).
A transmissivity value of 4.0 x 10⁻⁴ m2/s was calculated for both methods. Given the aquifer thickness of 4.5 m, the hydraulic conductivity for the gravel unit is estimated to be approximately 9 x 10⁻⁵ m/s. Based on the Cooper and Jacob (1946) solution, the storativity is estimated to be 2 x 10⁻³.
5A2.5 Pumping/Recovery Analysis
Analysis of the pumping and recovery was conducted using the Theis Recovery solution (Figure 5A-4). A transmissivity value of 3.7 x 10⁻⁴ m2/s was calculated using the analysis. Based on an aquifer thickness of 4.5 m, the hydraulic conductivity of the gravel unit is estimated to be 8 x 10⁻⁵ m/s. The results for the three methods of pumping test analysis are in relatively good agreement.
5A3 DETAILED BAIL-RECOVERY TEST DESCRIPTION
5A3.1 Well Completion Details
5A3.1.1 Monitoring Well 07-8
Monitoring well 07-8 is located at UTM easting 366613 and northing 5961391 (NAD 83) on surface lease 08-35-055-21 W4M. The ground elevation is 626.6 masl. The well was drilled to a depth of approximately 11.7 m bgs, and the sand pack extends from 8.4 m to 11.7 m bgs within the surficial glacial till unit. Further details regarding the elevation and well completion are summarized in Table 5.4-2.
The static head measurement in monitoring well 07-8 was 621.96 masl.
5A3.1.2 Monitoring Well 07-11
Monitoring well 07-11 is located at UTM easting 368430 and northing 5963091 (NAD 83) on surface lease 10-26-055-21 W4M. The ground elevation is 624.6 masl. The well was drilled to a depth of approximately 11.2 m bgs, and the sand pack extends from 7.4 m bgs to 11.2 m bgs within the glacial till unit. Further details regarding the elevation and well completion are summarized in Table 5.4-2.
The static head measurement in monitoring well 07-11 was 621.21 masl.
NORTH AMERICAN OIL SANDS CORPORATION

5A-3 December 2007 North American Upgrader Project Volume 3, Appendix 5A
5A3.1.3 Monitoring Well BH06-11
Monitoring well BH06-11 is located at UTM easting 367442 and northing 5963118 (NAD 83) on surface lease 15-26-055-21 W4M. The ground elevation is 624.4 masl. The well was drilled to a depth of approximately 11.7 m bgs, and the sand pack extends from 1.8 m to 5.8 m bgs within the glacial till unit. Further details regarding the elevation and well completion are summarized in Table 5.4-2.
The static head measurement in monitoring well BH06-11 was 622.53 masl.
5A3.1.4 Monitoring Well 07-5
Monitoring well 07-5 is located at UTM easting 368201 and northing 5962501 (NAD 83) on surface lease 08-35-055-21 W4M. The ground elevation is 627.7 masl. The well was drilled to a depth of approximately 34.3 m bgs, and the sand pack extends from 26.2 m to 30.5 m bgs within the glacial till unit. Further details regarding the elevation and well completion are summarized in Table 5.4-2.
The static head measurement in monitoring well 07-5 was 620.47 masl.
5A3.2 Bail-Recovery Program
Monitoring wells 07-8, 07-11 and BH06-11 were purged dry with a purge pump on May 10, 2007. Monitoring well 07-5 was purged dry with a Grunfos pump in the morning of May 11, 2007. Recovery was recorded by dedicated pressure transducers installed near the bottom of each well casing. The recovery tests were terminated on May 11, 2007, when the pressure transducers were removed from the wells.
5A3.3 Recovery Analysis
Analysis of the bail-recovery test data was facilitated by Waterloo Hydrogeologic Inc.’s software Aquifer Test Pro 3.5. In order to estimate hydraulic conductivity (K), the bail-recovery data was analyzed according to the Hvorslev (1951) solution. The recovery curves are plotted in Figures 5A-5, 5A-6, 5A-7 and 5A-8.
The estimated hydraulic conductivity of the till was estimated to be 1 x 10⁻⁹ m/s at monitoring well 07-8, 6 x 10⁻⁹ m/s at monitoring well 07-11, and 6 x 10⁻⁹ m/s at monitoring well BH06-11. Based on these results, the hydraulic conductivity of the till appears to be relatively consistent at various locations and depths across the site.
The estimated hydraulic conductivity of the sandstone/siltstone underlying the site is estimated to be 2 x 10⁻⁷ m/s, based on the bail-recovery test analysis of monitoring well 07-5.
5A4 LITERATURE CITED Alberta Environment (AENV). 2003. Groundwater Evaluation Guideline (Information Required
when Submitting an Application under the Water Act). February 5, 2003. http://www3.gov.ab.ca/env/water/Legislation/Guidelines/GroundwaterEvaluation.pdf
NORTH AMERICAN OIL SANDS CORPORATION

5A-4 December 2007 North American Upgrader Project Volume 3, Appendix 5A
Birsoy, Y.K. and W.K. Summers. 1980. Determination of Aquifer Parameters from Step Tests and Intermittent Pumping Data. Ground Water, 18.
Cooper, H.H. Jr. and C.E. Jacob. 1946. A Generalized Graphical Method for Evaluating Formation Constants and Summarizing Well Field History. Trans. American Geophysical Union, Vol. 27.
Hvorslev, M.J.. 1951. Time Lag and Soil Permeability in Groundwater Observation. U.S. Army Corps of Engineers Waterways Experimental Station Bulletin 36. Vicksburg, Mississippi.
Theis, C.V. 1935. The Relation between the Lowering of the Piezometric Surface and the Rate and Duration of Discharge of a Well Using Groundwater Storage. American Geophysical Union.
NORTH AMERICAN OIL SANDS CORPORATION

07-6 Pumping Test
Water Levels
9.3
9.5
9.7
9.9
10.1
10.3
10.5
0 1000 2000 3000 4000 5000 6000 7000 8000 9000 10000
time (s)
Water level (m)
Logger Manual
Pump on
(t = 0)
Pump off
(t = 5438 s)
Figure 5A-1

Approved: Revision Date:
File:
Drawn by: Checked: Fig. No.:
TVD
ADF RP
JULY, 2007
Title:
6198-PumpTest-07
5A-2
PUMPING TEST 07-6 THEIS(1935) - FORWARD SOLUTION

Approved: Revision Date:
File:
Drawn by: Checked: Fig. No.:
TVD
ADF RP
JULY, 2007
Title:
6198-PumpTest-07
5A-3
PUMPING TEST 07-6 COOPER-JACOB TIME-DRAWDOWN

07-6 Pumping Test
Theis Recovery
0
0.2
0.4
0.6
0.8
1 10 100 1000 10000
t/t'
s' (m)
T = 4 x 10⁻⁴ m
2/s
K = 8 x 10⁻⁵ m/s
Figure 5A-4

Approved: Revision Date:
File:
Drawn by: Checked: Fig. No.:
TVD
ADF RP
JULY, 2007
Title:
6198-PumpTest-07
5A-5
SLUG TEST 07-8 BAIL-RECOVERY HVORSLEV

Approved: Revision Date:
File:
Drawn by: Checked: Fig. No.:
TVD
ADF RP
JULY, 2007
Title:
6198-PumpTest-07
5A-6
SLUG TEST 07-11 BAILRECOVERY HVORSLEV
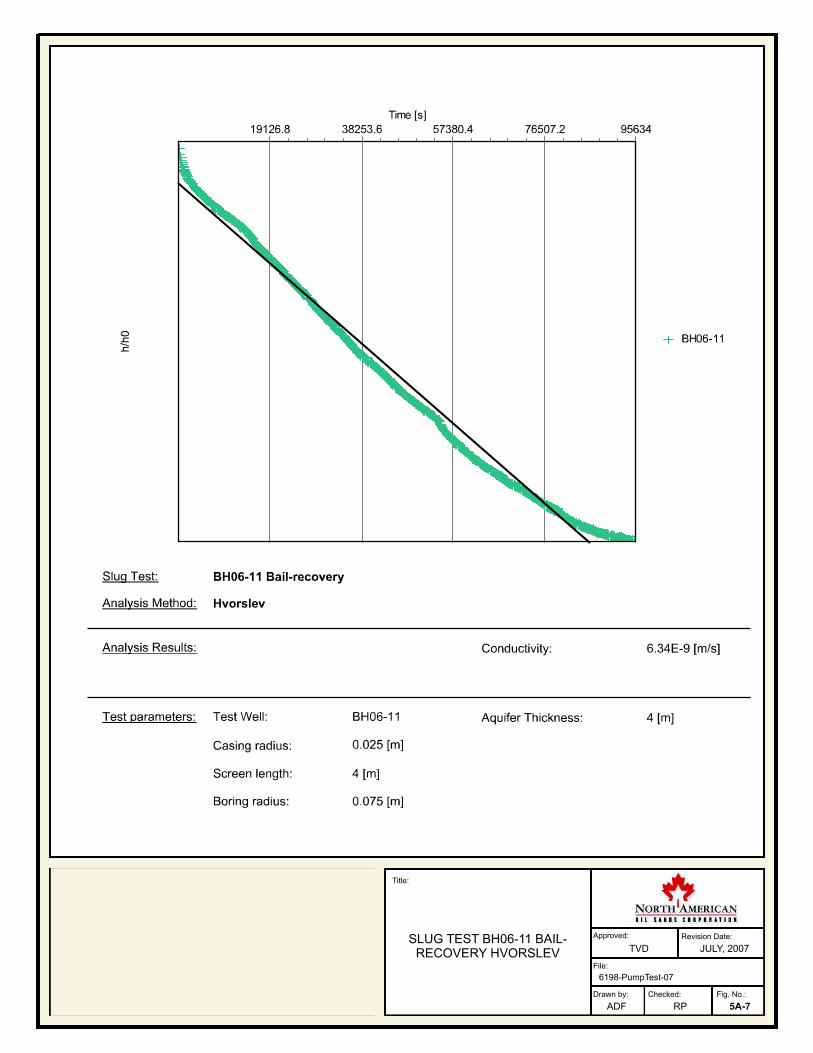
Approved: Revision Date:
File:
Drawn by: Checked: Fig. No.:
TVD
ADF RP
JULY, 2007
Title:
6198-PumpTest-07
5A-7
SLUG TEST BH06-11 BAIL-RECOVERY HVORSLEV

Approved: Revision Date:
File:
Drawn by: Checked: Fig. No.:
TVD
ADF RP
JULY, 2007
Title:
6198-PumpTest-07
5A-8
SLUG TEST 07-5 BAIL-RECOVERY HVORSLEV

Elevation (relative)
Compiled By:
Drill Equipment: Casing Diameter:
Screen Size:
Top / Base of Sand Pack:
Driller:
Screened Interval:
Total Depth:
Top of Casing:
Ground Elev:
Boring Diameter:
Finish Time:
Start Time:
Sample Method:
Logged By:
Date:
Project/Site:
Geologic Log - USC
primary structure, secondary structure, genesis, remarks.
LITHOLOGY: texture, plasticity, colour/oxidation, consistence, moisture,
MSI
J = Jar
B = Bag ppm uS/cm
Sample Depth CVC EC
1000
100
10
Soil Description
Lithology
Depth (m)
Data
10000
1
Completion
Well / Borehole
Client: Legal Location:
Relative Location:
Northing:
Easting:
Datum/Zone:
Well/borehole #:
Page 1 of 3
0
-1
-2
-3
-4
-5
-6
-7
-8
-9
-10
-11
-12
-13
-14
621
620
619
618
617
616
615
614
613
612
611
610
609
608
607
Tim Van Dijk
6198-514
Jennifer Barbier
rotary (air/water)
March 21, 2007
10:00
17:00
Beck
42.1m
0.01"
37.0-41.0m
37.6-40.6m
622.42m
621.42m
5 1/2" (7 1/4")
2"
NAOSC
6198070321...
SE-02-056-21 W4
---
5964321.8
367842.6
Zone 12
07-1
NOTE: Drill bit 5 1/2", casing 7 1/4". No casing shoe (lost by drillers).NOTE: May 11, 2007 water level - 5.72 m bgs.
@ 5.0m started using water.
@ 9.5-42.1m some gravel, increased sand, lighter brown.
Bentonite
0-4.0m (#001) B
11.0-14.0m (#002) B
SAND: (0-6.0m) fine, some silt, medium plasticity, medium brown, soft,moist.
CLAY: (6.0-11.5m) silty, some sand, medium brown, firm, (till).
GRAVEL AND SAND: (11.5-15.5m) cobbles to 5cm in diameter,rounded to subangular, poorly sorted, rusty (orange) brown.

Elevation (relative)
Compiled By:
Drill Equipment: Casing Diameter:
Screen Size:
Top / Base of Sand Pack:
Driller:
Screened Interval:
Total Depth:
Top of Casing:
Ground Elev:
Boring Diameter:
Finish Time:
Start Time:
Sample Method:
Logged By:
Date:
Project/Site:
Geologic Log - USC
primary structure, secondary structure, genesis, remarks.
LITHOLOGY: texture, plasticity, colour/oxidation, consistence, moisture,
MSI
J = Jar
B = Bag ppm uS/cm
Sample Depth CVC EC
1000
100
10
Soil Description
Lithology
Depth (m)
Data
10000
1
Completion
Well / Borehole
Client: Legal Location:
Relative Location:
Northing:
Easting:
Datum/Zone:
Well/borehole #:
Page 2 of 3
-15
-16
-17
-18
-19
-20
-21
-22
-23
-24
-25
-26
-27
-28
-29
606
605
604
603
602
601
600
599
598
597
596
595
594
593
592
Tim Van Dijk
6198-514
Jennifer Barbier
rotary (air/water)
March 21, 2007
10:00
17:00
Beck
42.1m
0.01"
37.0-41.0m
37.6-40.6m
622.42m
621.42m
5 1/2" (7 1/4")
2"
NAOSC
6198070321...
SE-02-056-21 W4
---
5964321.8
367842.6
Zone 12
07-1
NOTE: Drill bit 5 1/2", casing 7 1/4". No casing shoe (lost by drillers).NOTE: May 11, 2007 water level - 5.72 m bgs.
@ 24.0m drill with stem only, slow drilling with casing, drill bit chattering.
@ 28.0m some sand.
Bentonite
24.0-28.0m (#003) B
SAND: (15.5-21.0m) silty, fine to medium grained, well sorted, grey,some black grained, washes through sieve, (weathered sandstone).
CLAY: (21.0-23.5m) sandy, light brown, hard, homogeneous,(claystone).
CLAY: (23.5-32.0m) silty, light brown, hard, (claystone).
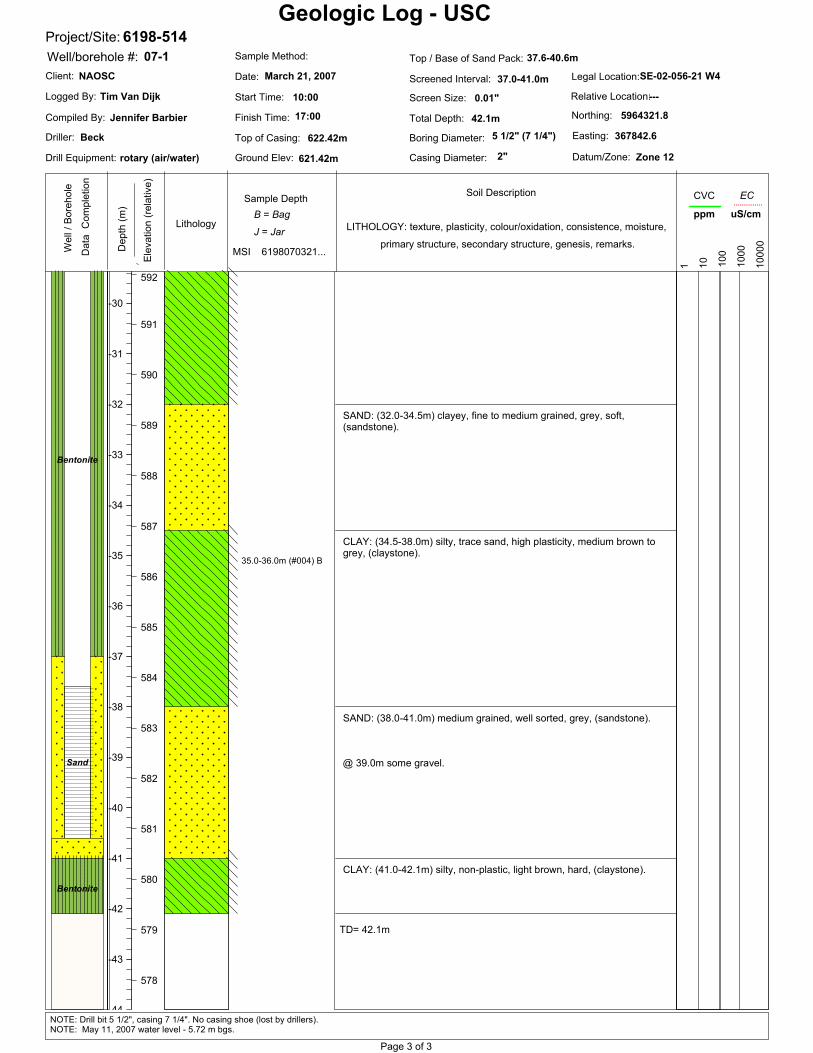
Elevation (relative)
Compiled By:
Drill Equipment: Casing Diameter:
Screen Size:
Top / Base of Sand Pack:
Driller:
Screened Interval:
Total Depth:
Top of Casing:
Ground Elev:
Boring Diameter:
Finish Time:
Start Time:
Sample Method:
Logged By:
Date:
Project/Site:
Geologic Log - USC
primary structure, secondary structure, genesis, remarks.
LITHOLOGY: texture, plasticity, colour/oxidation, consistence, moisture,
MSI
J = Jar
B = Bag ppm uS/cm
Sample Depth CVC EC
1000
100
10
Soil Description
Lithology
Depth (m)
Data
10000
1
Completion
Well / Borehole
Client: Legal Location:
Relative Location:
Northing:
Easting:
Datum/Zone:
Well/borehole #:
Page 3 of 3
-30
-31
-32
-33
-34
-35
-36
-37
-38
-39
-40
-41
-42
-43
-44
592
591
590
589
588
587
586
585
584
583
582
581
580
579
578
Tim Van Dijk
6198-514
Jennifer Barbier
rotary (air/water)
March 21, 2007
10:00
17:00
Beck
42.1m
0.01"
37.0-41.0m
37.6-40.6m
622.42m
621.42m
5 1/2" (7 1/4")
2"
NAOSC
6198070321...
SE-02-056-21 W4
---
5964321.8
367842.6
Zone 12
07-1
NOTE: Drill bit 5 1/2", casing 7 1/4". No casing shoe (lost by drillers).NOTE: May 11, 2007 water level - 5.72 m bgs.
TD= 42.1m
@ 39.0m some gravel.Sand
Bentonite
Bentonite
35.0-36.0m (#004) B
SAND: (32.0-34.5m) clayey, fine to medium grained, grey, soft,(sandstone).
CLAY: (34.5-38.0m) silty, trace sand, high plasticity, medium brown togrey, (claystone).
SAND: (38.0-41.0m) medium grained, well sorted, grey, (sandstone).
CLAY: (41.0-42.1m) silty, non-plastic, light brown, hard, (claystone).
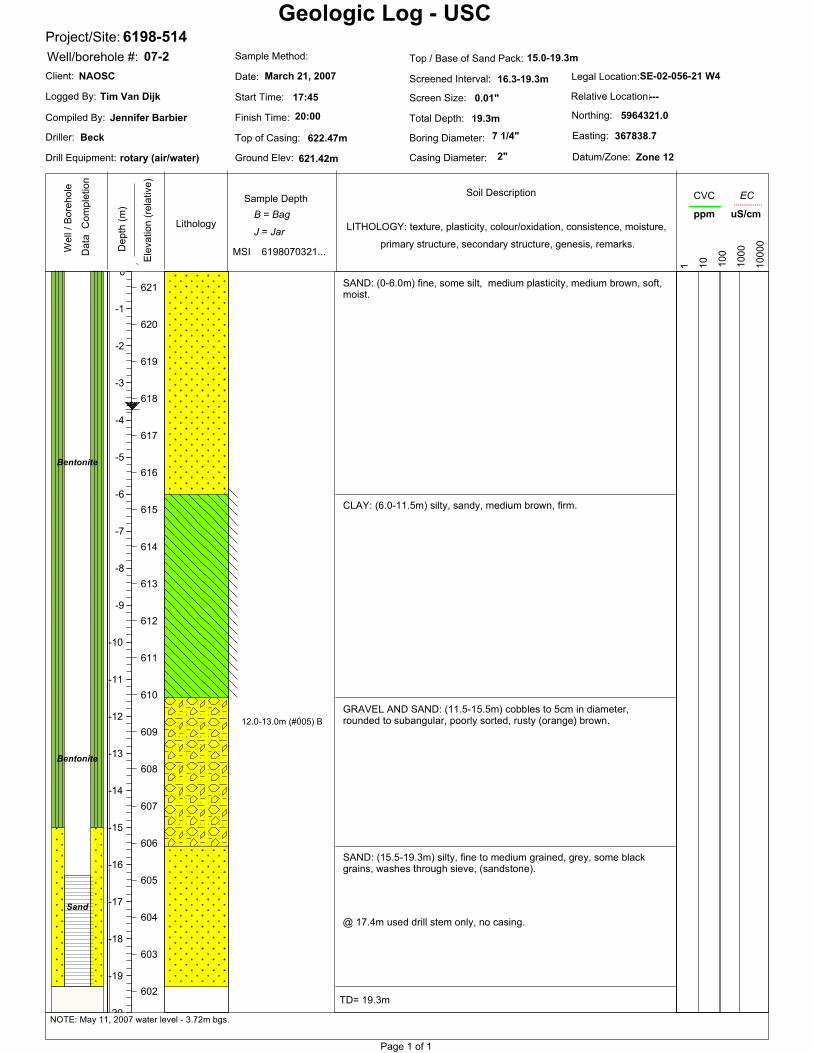
Elevation (relative)
Compiled By:
Drill Equipment: Casing Diameter:
Screen Size:
Top / Base of Sand Pack:
Driller:
Screened Interval:
Total Depth:
Top of Casing:
Ground Elev:
Boring Diameter:
Finish Time:
Start Time:
Sample Method:
Logged By:
Date:
Project/Site:
Geologic Log - USC
primary structure, secondary structure, genesis, remarks.
LITHOLOGY: texture, plasticity, colour/oxidation, consistence, moisture,
MSI
J = Jar
B = Bag ppm uS/cm
Sample Depth CVC EC
1000
100
10
Soil Description
Lithology
Depth (m)
Data
10000
1
Completion
Well / Borehole
Client: Legal Location:
Relative Location:
Northing:
Easting:
Datum/Zone:
Well/borehole #:
Page 1 of 1
0
-1
-2
-3
-4
-5
-6
-7
-8
-9
-10
-11
-12
-13
-14
-15
-16
-17
-18
-19
-20
621
620
619
618
617
616
615
614
613
612
611
610
609
608
607
606
605
604
603
602
Tim Van Dijk
6198-514
Jennifer Barbier
rotary (air/water)
March 21, 2007
17:45
20:00
Beck
19.3m
0.01"
16.3-19.3m
15.0-19.3m
622.47m
621.42m
7 1/4"
2"
NAOSC
6198070321...
SE-02-056-21 W4
---
5964321.0
367838.7
Zone 12
07-2
NOTE: May 11, 2007 water level - 3.72m bgs.
TD= 19.3m
@ 17.4m used drill stem only, no casing.
Sand
Bentonite
Bentonite
12.0-13.0m (#005) B
SAND: (0-6.0m) fine, some silt, medium plasticity, medium brown, soft,moist.
CLAY: (6.0-11.5m) silty, sandy, medium brown, firm.
GRAVEL AND SAND: (11.5-15.5m) cobbles to 5cm in diameter,rounded to subangular, poorly sorted, rusty (orange) brown.
SAND: (15.5-19.3m) silty, fine to medium grained, grey, some blackgrains, washes through sieve, (sandstone).

Elevation (relative)
Compiled By:
Drill Equipment: Casing Diameter:
Screen Size:
Top / Base of Sand Pack:
Driller:
Screened Interval:
Total Depth:
Top of Casing:
Ground Elev:
Boring Diameter:
Finish Time:
Start Time:
Sample Method:
Logged By:
Date:
Project/Site:
Geologic Log - USC
primary structure, secondary structure, genesis, remarks.
LITHOLOGY: texture, plasticity, colour/oxidation, consistence, moisture,
MSI
J = Jar
B = Bag ppm uS/cm
Sample Depth CVC EC
1000
100
10
Soil Description
Lithology
Depth (m)
Data
10000
1
Completion
Well / Borehole
Client: Legal Location:
Relative Location:
Northing:
Easting:
Datum/Zone:
Well/borehole #:
Page 1 of 2
0
-1
-2
-3
-4
-5
-6
-7
-8
-9
-10
-11
-12
-13
-14
-15
-16
623
622
621
620
619
618
617
616
615
614
613
612
611
610
609
608
607
T. Van Dijk/S. Salsman
6198-514
Jennifer Barbier
rotary (air/water)
March 22, 2007
9:15
13:45
Beck
31.1m
0.01"
27.1-31.1m
26.3-31.1m
624.44m
623.20m
7 3/4"
4"
NAOSC
6198070322...
SW-35-55-21 W4
---
5962652.7
366654.8
Zone 12
07-3
NOTE: After completion, could not get water level past 9.8m BTOC. Well destroyed, likely due to small angular space between P/C and drill casing.
@ 2.0m switch from air to water.
- from 4.0m some sand, medium brown, firm.
Benotnite
CLAY: (0-13.5m) silty, low to medium plasticity, dark brown, soft.
GRAVEL: (13.5-14.0m) subrounded, cobbles to 5cm in diameter, lightbrown.
CLAY: (14.0-15.0m) silty, rusty (orange) brown.
GRAVEL AND SAND: (15.0-18.8m) subrounded, cobbles to 5cm indiameter, poorly sorted, light brown.

Elevation (relative)
Compiled By:
Drill Equipment: Casing Diameter:
Screen Size:
Top / Base of Sand Pack:
Driller:
Screened Interval:
Total Depth:
Top of Casing:
Ground Elev:
Boring Diameter:
Finish Time:
Start Time:
Sample Method:
Logged By:
Date:
Project/Site:
Geologic Log - USC
primary structure, secondary structure, genesis, remarks.
LITHOLOGY: texture, plasticity, colour/oxidation, consistence, moisture,
MSI
J = Jar
B = Bag ppm uS/cm
Sample Depth CVC EC
1000
100
10
Soil Description
Lithology
Depth (m)
Data
10000
1
Completion
Well / Borehole
Client: Legal Location:
Relative Location:
Northing:
Easting:
Datum/Zone:
Well/borehole #:
Page 2 of 2
-17
-18
-19
-20
-21
-22
-23
-24
-25
-26
-27
-28
-29
-30
-31
-32
-33
606
605
604
603
602
601
600
599
598
597
596
595
594
593
592
591
T. Van Dijk/S. Salsman
6198-514
Jennifer Barbier
rotary (air/water)
March 22, 2007
9:15
13:45
Beck
31.1m
0.01"
27.1-31.1m
26.3-31.1m
624.44m
623.20m
7 3/4"
4"
NAOSC
6198070322...
SW-35-55-21 W4
---
5962652.7
366654.8
Zone 12
07-3
NOTE: After completion, could not get water level past 9.8m BTOC. Well destroyed, likely due to small angular space between P/C and drill casing.
TD= 31.1m
@ 17.5m more sand.
@ 19.0m drilling with air.
@ 26.0-26.5m no silt, medium grained, medium brown, moist.
@ 29.5m medium grained, light grey, loose, moist.
@ 30.0m medium grained, medium grey, moist.
Sand
Slough
Bentonite
19.0-20.0m (#006) B
27.0m (#007) B
29.5m (#008) B
SAND: (18.8-30.5m) silty, fine grained, well sorted, grey, loose, moist,(weathered sandstone).
CLAY: (30.5-31.0m) sandy, medium brown, firm, (claystone).
SAND: (31.0-31.1m) grey, very hard, cemented, (sandstone).

Elevation (relative)
Compiled By:
Drill Equipment: Casing Diameter:
Screen Size:
Top / Base of Sand Pack:
Driller:
Screened Interval:
Total Depth:
Top of Casing:
Ground Elev:
Boring Diameter:
Finish Time:
Start Time:
Sample Method:
Logged By:
Date:
Project/Site:
Geologic Log - USC
primary structure, secondary structure, genesis, remarks.
LITHOLOGY: texture, plasticity, colour/oxidation, consistence, moisture,
MSI
J = Jar
B = Bag ppm uS/cm
Sample Depth CVC EC
1000
100
10
Soil Description
Lithology
Depth (m)
Data
10000
1
Completion
Well / Borehole
Client: Legal Location:
Relative Location:
Northing:
Easting:
Datum/Zone:
Well/borehole #:
Page 1 of 1
0
-1
-2
-3
-4
-5
-6
-7
-8
-9
-10
-11
-12
-13
-14
-15
-16
-17
-18
-19
-20
623
622
621
620
619
618
617
616
615
614
613
612
611
610
609
608
607
606
605
604
T. Van Dijk/S. Salsman
6198-514
Jennifer Barbier
rotary (air/water)
March 22, 2007
14:30
16:30
Beck
18.1m
0.01"
15.1-18.1m
13.5-18.1m
624.32m
623.17m
7 3/4"
2"
NAOSC
6198070322...
SW-35-055-21 W4
---
5962649.5
366656.5
Zone 12
07-4
NOTE: Drilled with water.NOTE: May 11, 2007 water level - 8.56m bgs.
TD= 18.1m
- from 4.0m some sand, medium brown, firm.
Bentonite
Filter SandSlough
Bentonite
No Samples. CLAY: (0-13.5m) silty, some sand, low to medium plasticity, dark brown,soft.
GRAVEL: (13.5-14.0m) cobbles to 5 cm in diameter, subrounded, lightbrown.
CLAY: (14.0-15.0m) silty, rusty (orange) brown.
GRAVEL AND SAND: (15.0-18.1m) cobbles to 5cm in diameter,subrounded, poorly sorted, light brown.

Elevation (relative)
Compiled By:
Drill Equipment: Casing Diameter:
Screen Size:
Top / Base of Sand Pack:
Driller:
Screened Interval:
Total Depth:
Top of Casing:
Ground Elev:
Boring Diameter:
Finish Time:
Start Time:
Sample Method:
Logged By:
Date:
Project/Site:
Geologic Log - USC
primary structure, secondary structure, genesis, remarks.
LITHOLOGY: texture, plasticity, colour/oxidation, consistence, moisture,
MSI
J = Jar
B = Bag ppm uS/cm
Sample Depth CVC EC
1000
100
10
Soil Description
Lithology
Depth (m)
Data
10000
1
Completion
Well / Borehole
Client: Legal Location:
Relative Location:
Northing:
Easting:
Datum/Zone:
Well/borehole #:
Page 1 of 2
0
-1
-2
-3
-4
-5
-6
-7
-8
-9
-10
-11
-12
-13
-14
-15
-16
-17
627
626
625
624
623
622
621
620
619
618
617
616
615
614
613
612
611
610
Tim Van Dijk
6198-514
Jennifer Barbier
rotary (air/water)
March 23, 2007
9:20
13:00
Beck
34.3m
0.01"
27.0-30.0m
26.2-30.5m
628.55m
627.65m
7 3/4"
2"
NAOSC
6198070323...
SE-35-055-21 W4
---
5962501.3
368201.3
Zone 12
07-5
NOTE: May 11, 2007 water level - 7.18m bgs.
- from 2.5m some sand.
@ 6.5m becomes firm, medium brown to grey.
@ 6.5-7.5m some gravel, angular, <3cm in diameter.
@ 15.5-16.5 sand only.
@ 16.5-17.0m gravel, medium brown.
@ 17.0-17.5m sand, rusty brown.
Benotnite
CLAY: (0-15.5m) silty, medium plasticity, medium brown, soft to firm,moist.
GRAVEL AND SAND: (15.5-20.0m) fine to coarse sand, cobbles to 5cmin diameter, subrounded, some silt, rusty brown.

Elevation (relative)
Compiled By:
Drill Equipment: Casing Diameter:
Screen Size:
Top / Base of Sand Pack:
Driller:
Screened Interval:
Total Depth:
Top of Casing:
Ground Elev:
Boring Diameter:
Finish Time:
Start Time:
Sample Method:
Logged By:
Date:
Project/Site:
Geologic Log - USC
primary structure, secondary structure, genesis, remarks.
LITHOLOGY: texture, plasticity, colour/oxidation, consistence, moisture,
MSI
J = Jar
B = Bag ppm uS/cm
Sample Depth CVC EC
1000
100
10
Soil Description
Lithology
Depth (m)
Data
10000
1
Completion
Well / Borehole
Client: Legal Location:
Relative Location:
Northing:
Easting:
Datum/Zone:
Well/borehole #:
Page 2 of 2
-18
-19
-20
-21
-22
-23
-24
-25
-26
-27
-28
-29
-30
-31
-32
-33
-34
-35
610
609
608
607
606
605
604
603
602
601
600
599
598
597
596
595
594
593
Tim Van Dijk
6198-514
Jennifer Barbier
rotary (air/water)
March 23, 2007
9:20
13:00
Beck
34.3m
0.01"
27.0-30.0m
26.2-30.5m
628.55m
627.65m
7 3/4"
2"
NAOSC
6198070323...
SE-35-055-21 W4
---
5962501.3
368201.3
Zone 12
07-5
NOTE: May 11, 2007 water level - 7.18m bgs.
TD= 34.3m
@ 17.5-20.0m sand and gravel, medium brown.
@ 21.0m some gravel, grey, loose, dry.
@ 23.5m sand, medium grained, well sorted.
@ 24.0m silty sand, grey brown.
@ 24.5m moist.
@ 25.0m fine sand.
@ 26.0m silty fine sand.
@ 27.5 some stiff clay (pellets).
@ 28.0m fine sand, well sorted.
@ 29.0 fine sand, grey brown.
@ 29.5m light grey.
@ 30.0m using drill stem only, no casing.
Filter Sand
Bentonite
Bentonite
24.5m (#009) B
25.5m (#010) B
30.5m (#011) B
SAND: (20.0-22.0m) silty, fine grained, medium brown, loose powderreturns, (weathered sandstone).
SILT: (22.0-23.0m) some sand, some clay, trace gravel, grey to brown,(siltstone).
SAND AND SILT: (23.0-31.0m) alternating units of sand and silt, wellsorted, grey, loose, dry, (sandstone/siltstone).
SAND: (31.0-34.3m) grey, hard, dry powder, drill bit chattering,(sandstone).

Elevation (relative)
Compiled By:
Drill Equipment: Casing Diameter:
Screen Size:
Top / Base of Sand Pack:
Driller:
Screened Interval:
Total Depth:
Top of Casing:
Ground Elev:
Boring Diameter:
Finish Time:
Start Time:
Sample Method:
Logged By:
Date:
Project/Site:
Geologic Log - USC
primary structure, secondary structure, genesis, remarks.
LITHOLOGY: texture, plasticity, colour/oxidation, consistence, moisture,
MSI
J = Jar
B = Bag ppm uS/cm
Sample Depth CVC EC
1000
100
10
Soil Description
Lithology
Depth (m)
Data
10000
1
Completion
Well / Borehole
Client: Legal Location:
Relative Location:
Northing:
Easting:
Datum/Zone:
Well/borehole #:
Page 1 of 1
0
-1
-2
-3
-4
-5
-6
-7
-8
-9
-10
-11
-12
-13
-14
-15
-16
-17
-18
-19
-20
627
626
625
624
623
622
621
620
619
618
617
616
615
614
613
612
611
610
609
608
Tim Van Dijk
6198-514
Jennifer Barbier
rotary (air/water)
March 23, 2007
14:00
17:00
Beck
18.7m
0.01"
15.3-18.3m
14.5-18.3m
628.65m
627.62m
7 3/4"
2"
NAOSC
6198070323...
SE-35-055-21 W4
---
5962499.8
368201.1
Zone 12
07-6
NOTE: May 11, 2007 water level - 6.94m bgs.
TD= 18.7m
- from 2.5m some sand.
- from 6.5m medium brown to grey, firm.@ 6.5-7.5m some gravel, angular, <3cm in diameter, brown to grey.
@ 15.5-16.5m sand only.
@ 16.5-17.0m gravel, medium brown.
@ 17.0-17.5m sand only, rusty brown.
@ 17.5-18.7m sand, gravel, medium brown.
Sand
Benotnite
Benotnite
No Samples. CLAY: (0-15.0m) silty, medium plasticity, medium brown, soft to firm,moist.
GRAVEL AND SAND: (15.0-18.7m) some silt, fine to coarse sand,cobbles to 5cm in diameter, subrounded, rusty brown.

Elevation (relative)
Compiled By:
Drill Equipment: Casing Diameter:
Screen Size:
Top / Base of Sand Pack:
Driller:
Screened Interval:
Total Depth:
Top of Casing:
Ground Elev:
Boring Diameter:
Finish Time:
Start Time:
Sample Method:
Logged By:
Date:
Project/Site:
Geologic Log - USC
primary structure, secondary structure, genesis, remarks.
LITHOLOGY: texture, plasticity, colour/oxidation, consistence, moisture,
MSI
J = Jar
B = Bag ppm uS/cm
Sample Depth CVC EC
1000
100
10
Soil Description
Lithology
Depth (m)
Data
10000
1
Completion
Well / Borehole
Client: Legal Location:
Relative Location:
Northing:
Easting:
Datum/Zone:
Well/borehole #:
Page 1 of 2
0
-1
-2
-3
-4
-5
-6
-7
-8
-9
-10
-11
-12
-13
-14
-15
-16
626
625
624
623
622
621
620
619
618
617
616
615
614
613
612
611
Tim Van Dijk
6198-514
Jennifer Barbier
rotary (air/water)
March 24, 2007
10:00
10:30
Beck
30.1m
0.01"
26.8-29.8m
24.9-30.1m
627.71m
626.64m
7 3/4"
2"
NAOSC
6198070324...
NE-26-055-21 W4
---
5961390.0
366611.6
Zone 12
07-7
NOTE: May 11, 2007 water level - 12.37m bgs.
- from 9.5m some gravel, angular, <3cm in diameter.
Bentonite
CLAY: (0-17.0m) silty, some sand, medium plasticity, medium brown,firm.

Elevation (relative)
Compiled By:
Drill Equipment: Casing Diameter:
Screen Size:
Top / Base of Sand Pack:
Driller:
Screened Interval:
Total Depth:
Top of Casing:
Ground Elev:
Boring Diameter:
Finish Time:
Start Time:
Sample Method:
Logged By:
Date:
Project/Site:
Geologic Log - USC
primary structure, secondary structure, genesis, remarks.
LITHOLOGY: texture, plasticity, colour/oxidation, consistence, moisture,
MSI
J = Jar
B = Bag ppm uS/cm
Sample Depth CVC EC
1000
100
10
Soil Description
Lithology
Depth (m)
Data
10000
1
Completion
Well / Borehole
Client: Legal Location:
Relative Location:
Northing:
Easting:
Datum/Zone:
Well/borehole #:
Page 2 of 2
-17
-18
-19
-20
-21
-22
-23
-24
-25
-26
-27
-28
-29
-30
-31
-32
610
609
608
607
606
605
604
603
602
601
600
599
598
597
596
595
Tim Van Dijk
6198-514
Jennifer Barbier
rotary (air/water)
March 24, 2007
10:00
10:30
Beck
30.1m
0.01"
26.8-29.8m
24.9-30.1m
627.71m
626.64m
7 3/4"
2"
NAOSC
6198070324...
NE-26-055-21 W4
---
5961390.0
366611.6
Zone 12
07-7
NOTE: May 11, 2007 water level - 12.37m bgs.
TD=30.1m
@ 18.5-22.0m drilled with air.
@ 21.5-22.0m some clay, some silt.
@ 23.0-24.0m drilled with air.
@ 29.0m drill bit chattering.
Sil 9 Sand
Slough
Bentonite
18.0m (#012) B
23.0m (#013) B
GRAVEL AND SAND: (17.0-23.0m) medium to coarse sand, cobbles to5cm, subrounded, non-plastic.
SAND: (23.0-24.0m) silty, fine grained, well sorted, non-plastic, darkbrown, moist, (weathered sandstone).
SILT: (24.0-27.0m) with fine sand, well sorted, non-plastic, mediumbrown, moist, (siltstone).
SAND: (27.0-29.5m) silty, fine to medium grained, non-plastic, loosegrains, medium brown, moist, (sandstone).
SILT: (29.5-30.1m) medium brown, hard, moist, (siltstone).@ 30.1m grey, dry, dusty returns.

Elevation (relative)
Compiled By:
Drill Equipment: Casing Diameter:
Screen Size:
Top / Base of Sand Pack:
Driller:
Screened Interval:
Total Depth:
Top of Casing:
Ground Elev:
Boring Diameter:
Finish Time:
Start Time:
Sample Method:
Logged By:
Date:
Project/Site:
Geologic Log - USC
primary structure, secondary structure, genesis, remarks.
LITHOLOGY: texture, plasticity, colour/oxidation, consistence, moisture,
MSI
J = Jar
B = Bag ppm uS/cm
Sample Depth CVC EC
1000
100
10
Soil Description
Lithology
Depth (m)
Data
10000
1
Completion
Well / Borehole
Client: Legal Location:
Relative Location:
Northing:
Easting:
Datum/Zone:
Well/borehole #:
Page 1 of 1
0
-1
-2
-3
-4
-5
-6
-7
-8
-9
-10
-11
-12
626
625
624
623
622
621
620
619
618
617
616
615
614
Tim Van Dijk
6198-514
Jennifer Barbier
rotary (air/water)
March 24, 2007
14:15
15:45
Beck
11.7m
0.01"
8.7-11.7m
8.4-11.7m
627.59m
626.62m
7 3/4"
2"
NAOSC
6198070324...
NE-26-055-21 W4
---
5961391.0
366613.0
Zone 12
07-8
NOTE: May 11, 2007 water level - 4.66m bgs.
TD=11.7m
-from 9.5m some gravel, angular, <2cm in diameter.
Sand
Benotnite
No samples. CLAY: (0-11.7m) silty, some sand, medium plasticity, medium brown.

Elevation (relative)
Compiled By:
Drill Equipment: Casing Diameter:
Screen Size:
Top / Base of Sand Pack:
Driller:
Screened Interval:
Total Depth:
Top of Casing:
Ground Elev:
Boring Diameter:
Finish Time:
Start Time:
Sample Method:
Logged By:
Date:
Project/Site:
Geologic Log - USC
primary structure, secondary structure, genesis, remarks.
LITHOLOGY: texture, plasticity, colour/oxidation, consistence, moisture,
MSI
J = Jar
B = Bag ppm uS/cm
Sample Depth CVC EC
1000
100
10
Soil Description
Lithology
Depth (m)
Data
10000
1
Completion
Well / Borehole
Client: Legal Location:
Relative Location:
Northing:
Easting:
Datum/Zone:
Well/borehole #:
Page 1 of 1
0
-1
-2
-3
-4
-5
-6
-7
-8
-9
-10
-11
-12
-13
-14
624
623
622
621
620
619
618
617
616
615
614
613
612
611
Tim Van Dijk
6198-514
Jennifer Barbier
rotary (air/water)
March 26, 2007
11:30
13:00
Beck
12.1m
0.01"
9.1-12.1m
6.9-12.1m
625.22m
624.26m
7 3/4"
2"
NAOSC
6198070326...
NE-35-055-21 W4
---
5963490.2
367458.4
Zone 12
07-9
NOTE: Drilled with water.NOTE: May 11, 2007 water level - 1.83m bgs.
TD= 12.1m
- from 7.0m some sand.
- from11.0m some gravel, angular, <2cm in diameter.
Bentonite
Sand
CLAY: (0-12.1m) silty, medium plasticity, medium brown.

Elevation (relative)
Compiled By:
Drill Equipment: Casing Diameter:
Screen Size:
Top / Base of Sand Pack:
Driller:
Screened Interval:
Total Depth:
Top of Casing:
Ground Elev:
Boring Diameter:
Finish Time:
Start Time:
Sample Method:
Logged By:
Date:
Project/Site:
Geologic Log - USC
primary structure, secondary structure, genesis, remarks.
LITHOLOGY: texture, plasticity, colour/oxidation, consistence, moisture,
MSI
J = Jar
B = Bag ppm uS/cm
Sample Depth CVC EC
1000
100
10
Soil Description
Lithology
Depth (m)
Data
10000
1
Completion
Well / Borehole
Client: Legal Location:
Relative Location:
Northing:
Easting:
Datum/Zone:
Well/borehole #:
Page 1 of 1
0
-1
-2
-3
-4
-5
-6
-7
-8
-9
-10
-11
-12
-13
-14
-15
-16
-17
-18
-19
-20
-21
-22
-23
-24
-25
-26
-27
624
623
622
621
620
619
618
617
616
615
614
613
612
611
610
609
608
607
606
605
604
603
602
601
600
599
598
Tim Van Dijk
6198-514
Jennifer Barbier
rotary (air/water)
March 26, 2007
13:45
17:00
Beck
26.1m
0.01"
12.5-15.5m
12.2-16.3m
625.61m
624.66m
7 3/4"
2"
NAOSC
6198070326...
NW-36-055-21 W4
---
5963088.5
368429.4
Zone 12
07-10
NOTE: May 11, 2007 water level - 4.23m bgs.
TD=26.1m
@ 24.5m some fine sand, medium brown.
- from 7.0m some sand.
- from 11.0m some gravel, angular, <2cm in diameter.
Sil 9 Sand
Benotnite
Slough
Sil 9 Sand
Bentonite
Slough
Slough
No samples.CLAY: (0-12.5m) silty, medium to high plasticity, medium brown, firm.
GRAVEL AND SAND: (12.5-14.5m) medium to coarse sand, poorlysorted, cobbles to 5cm in diameter, subrounded, medium brown.
SAND: (14.5-22.0m) silty, trace gravel, fine grained, sorted, non-plastic,grey, (weathered sandstone).
SILT: (22.0-26.1m) well sorted, grey, hard, (siltstone).
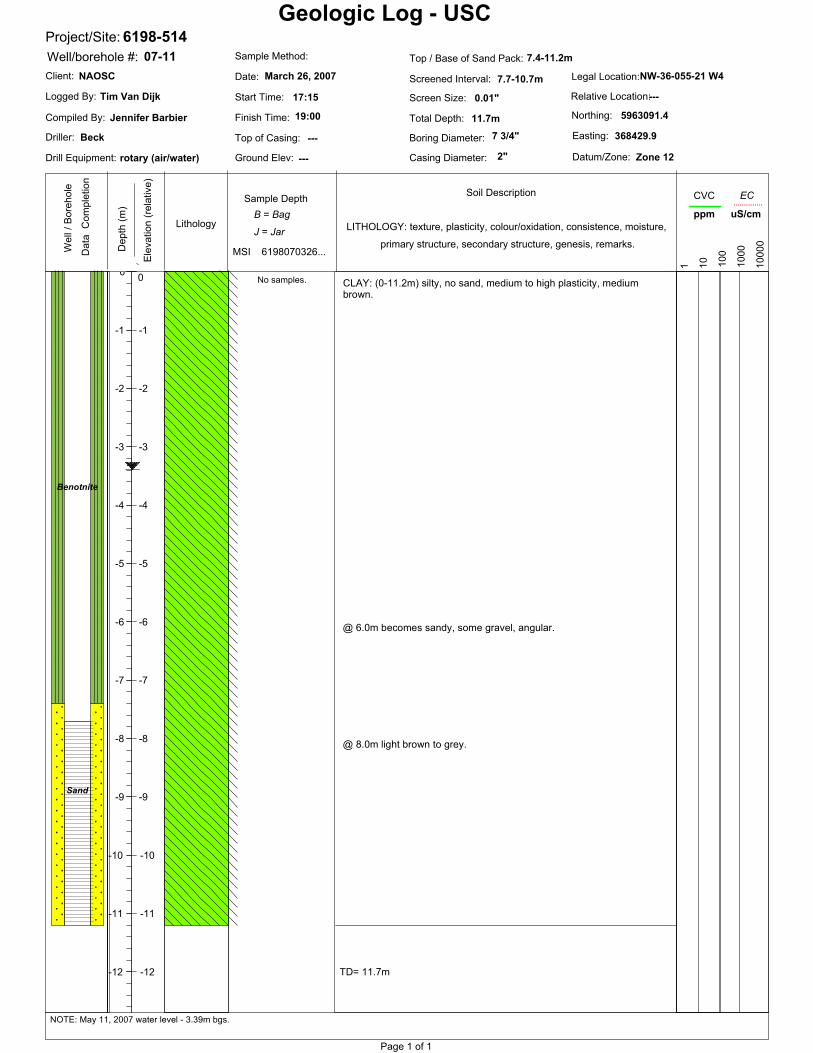
Elevation (relative)
Compiled By:
Drill Equipment: Casing Diameter:
Screen Size:
Top / Base of Sand Pack:
Driller:
Screened Interval:
Total Depth:
Top of Casing:
Ground Elev:
Boring Diameter:
Finish Time:
Start Time:
Sample Method:
Logged By:
Date:
Project/Site:
Geologic Log - USC
primary structure, secondary structure, genesis, remarks.
LITHOLOGY: texture, plasticity, colour/oxidation, consistence, moisture,
MSI
J = Jar
B = Bag ppm uS/cm
Sample Depth CVC EC
1000
100
10
Soil Description
Lithology
Depth (m)
Data
10000
1
Completion
Well / Borehole
Client: Legal Location:
Relative Location:
Northing:
Easting:
Datum/Zone:
Well/borehole #:
Page 1 of 1
0
-1
-2
-3
-4
-5
-6
-7
-8
-9
-10
-11
-12
0
-1
-2
-3
-4
-5
-6
-7
-8
-9
-10
-11
-12
Tim Van Dijk
6198-514
Jennifer Barbier
rotary (air/water)
March 26, 2007
17:15
19:00
Beck
11.7m
0.01"
7.7-10.7m
7.4-11.2m
---
---
7 3/4"
2"
NAOSC
6198070326...
NW-36-055-21 W4
---
5963091.4
368429.9
Zone 12
07-11
NOTE: May 11, 2007 water level - 3.39m bgs.
TD= 11.7m
@ 6.0m becomes sandy, some gravel, angular.
@ 8.0m light brown to grey.
Sand
Benotnite
No samples. CLAY: (0-11.2m) silty, no sand, medium to high plasticity, mediumbrown.

Elevation (relative)
Compiled By:
Drill Equipment: Casing Diameter:
Screen Size:
Top / Base of Sand Pack:
Driller:
Screened Interval:
Total Depth:
Top of Casing:
Ground Elev:
Boring Diameter:
Finish Time:
Start Time:
Sample Method:
Logged By:
Date:
Project/Site:
Geologic Log - USC
primary structure, secondary structure, genesis, remarks.
LITHOLOGY: texture, plasticity, colour/oxidation, consistence, moisture,
MSI
J = Jar
B = Bag ppm uS/cm
Sample Depth CVC EC
1000
100
10
Soil Description
Lithology
Depth (m)
Data
10000
1
Completion
Well / Borehole
Client: Legal Location:
Relative Location:
Northing:
Easting:
Datum/Zone:
Well/borehole #:
Page 1 of 2
0
-1
-2
-3
-4
-5
-6
-7
-8
-9
-10
-11
-12
-13
624
623
622
621
620
619
618
617
616
615
614
613
612
Tim Van Dijk
6198-514
Jennifer Barbier
rotary (air/water)
March 26, 2007
8:45
10:45
Beck
24.0m
---
---
---
---
624.3m
7 3/4"
---
NAOSC
6198070326...
NE-35-055-21 W4
---
5963490.0
367458.0
Zone 12
07-B1
NOTE:
- from 7.0m some sand.
-from 11.0m some gravel.
Bentonite
Slough
5.0m (#014) B
CLAY: (0-15.0m) silty, medium plasticity, medium brown, drilling withwater.

Elevation (relative)
Compiled By:
Drill Equipment: Casing Diameter:
Screen Size:
Top / Base of Sand Pack:
Driller:
Screened Interval:
Total Depth:
Top of Casing:
Ground Elev:
Boring Diameter:
Finish Time:
Start Time:
Sample Method:
Logged By:
Date:
Project/Site:
Geologic Log - USC
primary structure, secondary structure, genesis, remarks.
LITHOLOGY: texture, plasticity, colour/oxidation, consistence, moisture,
MSI
J = Jar
B = Bag ppm uS/cm
Sample Depth CVC EC
1000
100
10
Soil Description
Lithology
Depth (m)
Data
10000
1
Completion
Well / Borehole
Client: Legal Location:
Relative Location:
Northing:
Easting:
Datum/Zone:
Well/borehole #:
Page 2 of 2
-13
-14
-15
-16
-17
-18
-19
-20
-21
-22
-23
-24
-25
-26
611
610
609
608
607
606
605
604
603
602
601
600
599
Tim Van Dijk
6198-514
Jennifer Barbier
rotary (air/water)
March 26, 2007
8:45
10:45
Beck
24.0m
---
---
---
---
624.3m
7 3/4"
---
NAOSC
6198070326...
NE-35-055-21 W4
---
5963490.0
367458.0
Zone 12
07-B1
NOTE:
TD= 24.0m
@ 17.0m sand with some gravel
@ 21.5-23.0m fine grained, well sorted, light brown, hard.
Slough
GRAVEL AND SAND: (15.0-18.0m) medium to coarse sand, cobbles to5cm in diameter, subrounded, medium brown.
CLAY: (18.0-20.5m) sandy, silty, medium brown, firm, (claystone).
SAND: (20.5-23.0m) medium grained, well sorted, light brown, hard,(sandstone).@ 20.5-23.0m drilling slower, drill bit chattering.
CLAY: (23.0-23.5m) sandy, silty, fine to medium grained sand, poorlysorted, medium grey to brown, hard, (claystone).@ 23.0-23.5m very slow drilling.
SAND: (23.5-24.0m) silty, fine grained, well sorted, grey hard,(sandstone).


5C-1 December 2007 North American Upgrader Project Volume 3, Appendix 5C
APPENDIX 5C: QUALITY CONTROL SAMPLE RESULTS
Duplicate samples were submitted to the laboratory to monitor the quality of sampling and analysis. The results of the quality control program are presented in Table 7. Two duplicate sample sets, from wells 07-6 and 07-8, were processed from the May 11, 2007 sampling event. Duplicate groundwater samples were analyzed for field-measured parameters (Table 5C-1), routine and indicator parameters (Table 5C-2), dissolved hydrocarbons (Table 5C-3) and dissolved metals (Table 5C-4).
Reproducibility was evaluated based on the relative percent difference (RPD) calculated for each parameter. The RPD was calculated as follows (APHA, 1998):
100×=resultsduplicatetwotheofMean
resultsduplicatetwothebetweendifferenceAbsoluteRPD
Based on Matrix Solutions’ experience, RPD values greater than 30 usually indicate poor reproducibility. However, the reproducibility of duplicate analyses at concentrations near the MDL can be poor (Keith, 1992), resulting in RPD values greater than 30. Therefore, RPD values greater than 30 are acceptable if the differences in concentrations of the duplicate analyses are less than approximately 10 times the MDL.
The RPD values were less than 30 for field-measured parameters, routine and indicator parameters, and dissolved hydrocarbons. Therefore, the QC sample results are deemed acceptable for these parameters. In terms of dissolved metals, the RPD values for the sample collected from monitoring well 07-6 exceeded 30 for the laboratory analyses of antimony (53%), cobalt (43%), copper (95%) and zinc (76%). However, the measured concentrations of these metals were near the MDL and the differences in concentrations were less than 10 times the MDL for each result; thus, the reproducibility of these samples is considered acceptable.
REFERENCE
American Public Health Association (APHA), 1998. Standard Methods for the Examination of Water and Wastewater. 20th Edition, American Public Health Association, Washington, D.C.
Keith, L.H., 1992. Environmental Sampling and Analysis, a Practical Guide. Lewis Publishers.
NORTH AMERICAN OIL SANDS CORPORATION

North American Upgrader ProjectVolume 3, Appendix 5C
December 2007
TABLE 5C-1. QUALITY CONTROL SAMPLE RESULTSFIELD MEASURED PARAMETERS North American Oil Sands CorporationNorth American Upgrader Site
Monitoring Sample Temp Field pH Field EC Field DOWell Date °C uS/cm mg/L07-6 May 11/07 6.9 7.4 730 3.8
07-6 dup May 11/07 6.2 7.4 730 3.7Method Detection Limit 0.1 0.1 10 0.1
Absolute Difference* 0.7 0 0 0.1Absolute Relative Percent Difference (RPD)* 11 0 0 3
07-8 May 11/07 7.3 6.8 3820 3.907-8 dup May 11/07 6.9 6.8 3820 4.4
Method Detection Limit 0.1 0.1 10 0.1Absolute Difference* 0.4 0 0 0.5
Absolute Relative Percent Difference (RPD)* 6 0 0 12
TABLE 5C-2. QUALITY CONTROL SAMPLE RESULTSROUTINE AND INDICATOR PARAMETERSNorth American Oil Sands CorporationNorth American Upgrader Site
Monitoring Sample Lab pH Lab EC Ca Mg Na K Cl HCO3 SO4 NO2-N NO3-N Hardness TDSWell Date uS/cm mg/L mg/L mg/L mg/L mg/L mg/L mg/L mg/L mg/L mg/L mg/L07-6 May 11/07 7.92 749 89.2 27.4 56.7 6.5 2.5 437 77.4 0.007 0.037 340 475
07-6 dup May 11/07 7.66 757 88.0 25.8 54.1 6.2 2.3 435 78 0.007 0.038 330 469Method Detection Limit (MDL) 0.01 0.02 0.1 0.1 0.1 0.3 0.5 0.5 0.1 0.003 0.003 0.5 1
Absolute Difference* 0.26 8 1.2 1.6 2.6 0.3 0.2 2 0.6 0 0.001 10 6Absolute Relative Percent Difference (RPD)* 3 1 1 6 5 5 8 0 1 0 3 3 1
07-8 May 11/07 7.39 3670 621 263 188 14.6 3.6 733 2260 0.003 0.016 2600 371007-8 dup May 11/07 7.26 3690 624 266 192 14.9 3.6 723 2270 <0.003 0.017 2700 3730
Method Detection Limit (MDL) 0.01 0.02 0.1 0.1 0.1 0.3 0.5 0.5 0.1 0.003 0.003 0.5 1Absolute Difference* 0.13 20 3 3 4 0.3 0 10 10 0.00015 0.001 100 20
Absolute Relative Percent Difference (RPD)* 2 1 0 1 2 2 0 1 0 5 6 4 1
NORTH AMERICANOIL SANDS CORPORATION

North American Upgrader ProjectVolume 3, Appendix 5C
December 2007
TABLE 5C-3. QUALITY CONTROL SAMPLE RESULTSDISSOLVED HYDROCARBONSNorth American Oil Sands CorporationNorth American Upgrader Site
Monitoring Sample Benzene Toluene Ethylbenzene Xylenes F1††C6-C10 F2 C>10-C16
Well Date mg/L mg/L mg/L mg/L mg/L mg/L07-6 May 11/07 <0.0004 <0.0004 <0.0004 <0.0008 <0.1 <0.12
07-6 dup May 11/07 <0.0004 <0.0004 <0.0004 <0.0008 <0.1 <0.12Method Detection Limit (MDL) 0.0004 0.0004 0.0004 0.0008 0.1 0.12
Absolute Difference* --- --- --- --- --- ---Absolute Relative Percent Difference (RPD)* OK OK OK OK OK OK
07-8 May 11/07 <0.0004 <0.0004 <0.0004 <0.0008 <0.1 <0.1207-8 dup May 11/07 <0.0004 <0.0004 <0.0004 <0.0008 <0.1 <0.12
Method Detection Limit (MDL) 0.0004 0.0004 0.0004 0.0008 0.1 0.12Absolute Difference* --- --- --- --- --- ---
Absolute Relative Percent Difference (RPD)* OK OK OK OK OK OK
Notes:* - non-detectable concentrations are assessed at 95% of the detection limit
--- - difference cannot be calculated because both samples yielded non-detectable resultsOK - indicates acceptable reproducibility at non-detectable levels
^ - although the RPD is greater than 30, the concentration difference between duplicate analyses is less than approximately 10 times the MDL and, therefore, the reproducibility of the analysis is deemed acceptable
Italics - indicates RPD values greater than 30 and suggests poor reproducibility
NORTH AMERICANOIL SANDS CORPORATION

North American Upgrader ProjectVolume 3, Appendix 5C
December 2007
TABLE 5C-4. QUALITY CONTROL SAMPLE RESULTSDISSOLVED METALSNorth American Oil Sands CorporationNorth American Upgrader Site
Monitoring Sample Al Sb As Ba Be B Cd Cr Co Cu Fe Pb LiWell Date mg/L mg/L mg/L mg/L mg/L mg/L mg/L mg/L mg/L mg/L mg/L mg/L mg/L07-6 May 11/07 <0.04 0.0011 0.003 0.11 <0.001 0.11 <0.0002 <0.01 0.0009 0.0006 0.37 <0.0002 0.06
07-6 dup May 11/07 <0.04 0.0019 0.003 0.09 <0.001 0.11 <0.0002 <0.01 0.0014 0.0016 0.33 <0.0002 0.06Method Detection Limit (MDL) 0.04 0.0002 0.001 0.01 0.001 0.02 0.0002 0.01 0.0003 0.0002 0.06 0.0002 0.02
Absolute Difference* --- 0.0008 0.0001 0.02 --- 0 --- --- 0.0005 0.00103 0.04 --- 0Absolute Relative Percent Difference (RPD)* OK 53^ 4 20 OK 0 OK OK 43^ 95^ 11 OK 0
07-8 May 11/07 <0.04 <0.0002 0.001 0.06 <0.001 0.26 <0.0002 0.01 0.0188 0.0054 0.28 <0.0002 0.4907-8 dup May 11/07 <0.04 <0.0002 <0.001 0.06 <0.001 0.26 <0.0002 0.01 0.0191 0.0068 0.3 <0.0002 0.5
Method Detection Limit (MDL) 0.04 0.0002 0.001 0.01 0.001 0.02 0.0002 0.01 0.0003 0.0002 0.06 0.0002 0.02Absolute Difference* --- --- 0.00011 0 --- 0 --- 0 0.0003 0.0014 0.02 --- 0.01
Absolute Relative Percent Difference (RPD)* OK OK 11 0 OK 0 OK 0 2 23 7 OK 2
Monitoring Sample Mn Mo Ni Se Si Ag Sr Tl Sn Ti U V ZnWell Date mg/L mg/L mg/L mg/L mg/L mg/L mg/L mg/L mg/L mg/L mg/L mg/L mg/L07-6 May 11/07 0.22 0.0076 0.0103 <0.001 4.5 <0.0001 0.80 <0.0002 <0.001 0.002 0.0087 <0.001 0.013
07-6 dup May 11/07 0.218 0.0078 0.0104 <0.001 4.2 <0.0001 0.81 <0.0002 0.001 0.002 0.0082 <0.001 0.029Method Detection Limit (MDL) 0.004 0.0002 0.0005 0.001 0.1 0.0001 0.02 0.0002 0.001 0.001 0.0001 0.001 0.003
Absolute Difference* 0.002 0.0002 0.0001 --- 0.3 --- 0.01 --- 0.00005 0.00008 0.0005 --- 0.016Absolute Relative Percent Difference (RPD)* 1 3 1 OK 7 OK 1 OK 5 4 6 OK 76^
07-8 May 11/07 5.95 0.0011 0.108 0.006 8.7 <0.0001 4.35 <0.0002 <0.001 0.02 0.0457 0.031 0.01807-8 dup May 11/07 6.01 0.0012 0.107 0.007 8.8 <0.0001 4.45 <0.0002 <0.001 0.02 0.0465 0.03 0.023
Method Detection Limit (MDL) 0.004 0.0002 0.0005 0.001 0.1 0.0001 0.02 0.0002 0.001 0.001 0.0001 0.001 0.003Absolute Difference* 0.06 1E-04 0.001 0.001 0.1 --- 0.1 --- --- 0 0.0008 0.001 0.005
Absolute Relative Percent Difference (RPD)* 1 9 1 15 1 OK 2 OK OK 0 2 3 24
Notes:* - non-detectable concentrations are assessed at 95% of the detection limit
--- - difference cannot be calculated because both samples yielded non-detectable resultsOK - indicates acceptable reproducibility at non-detectable levels
^ - although the RPD is greater than 30, the concentration difference between duplicate analyses is less than approximately 10 times the MDL and, therefore, the reproducibility of the analysis is deemed acceptable
Italics - indicates RPD values greater than 30 and suggests poor reproducibility
NORTH AMERICANOIL SANDS CORPORATION

North American Upgrader ProjectVolume 3, Appendix 5D
December 2007
Table 5D-1. WATER WELLS WITHIN A 7.0km RADIUSNorth American Oil Sands CorporationNorth American Upgrader Project
1 83564 NE-35-055-21 W4 Charbonneau, Marcel 0.57 --- 12.8 --- --- --- 4.57 --- --- Domestic Chemistry2 83563 04-35-055-21 W4 Berg, R. 0.85 --- 30.48 --- --- --- --- 1-Jan-26 Domestic & Stock Federal Well Survey3 263334 03-02-056-21 W4 Halabey, Alex 1.04 --- 118.87 --- --- 78.03 21.64 --- 9-Jul-65 Domestic New Well4 83574 12-36-055-21 W4 Prokopczak, J. 1.05 --- 12.19 --- --- --- 2.74 --- 1-Jan-36 Stock Federal Well Survey5 83562 16-34-055-21 W4 Berg, Ron 1.19 --- 53.34 --- --- 47.24 12.19 --- 1-May-82 Stock New Well6 263327 SW-02-056-21 W4 Halabey, A 1.29 --- 10.66 --- --- --- 4.57 --- --- Domestic Chemistry7 159197 NE-34-055-21 W4 Berg, Ron 1.29 --- 54.86 46.63 52.73 42.37 11.27 --- 29-Sep-91 Stock New Well8 83561 NE-34-055-21 W4 Berg, Alfred 1.29 --- 30.48 28.35 29.87 28.35 9.44 --- 5-Jun-68 Domestic New Well9 83573 NW-36-055-21 W4 Prokopczak, David 1.29 --- 12.19 --- --- --- --- --- --- Domestic Chemistry
10 83545 SE-34-055-21 W4 Northwestern Utilities 1.29 --- 54.86 0.30 54.86 31.09 18.89 --- 19-Oct-82 Industrial New Well11 83572 SW-36-055-21 W4 United Grain Growers Ltd 1.3 --- 39.62 37.80 39.62 37.80 10.05 --- 7-Apr-88 Domestic New Well12 83504 16-27-055-21 W4 Heinrichs, Ed 1.44 --- 26.82 --- --- 25.60 17.67 --- 5-Jul-74 Stock New Well13 83010 13-25-055-21 W4 Hoffman 1.44 --- 27.43 --- --- --- --- --- --- Domestic & Stock Federal Well Survey14 83497 09-26-055-21 W4 Fluker, R. 1.53 --- 13.71 --- --- --- --- --- 1-Jan-33 Domestic & Stock Federal Well Survey15 83546 SH-34-055-21 W4 Northwestern Utilities 1.68 --- 36.57 --- --- --- --- --- --- Industrial Chemistry16 167584 NW-25-055-21 W4 Prokopczak, Wm 1.72 --- 60.96 --- --- --- --- --- --- Domestic Chemistry17 263308 SW-01-056-21 W4 Taron, D.E. 1.73 --- 14.02 --- --- --- --- --- --- Domestic Chemistry18 263315 SW-01-056-21 W4 Old, R/C 1.73 --- 36.57 --- --- --- --- --- --- Domestic Chemistry19 263351 SE-03-056-21 W4 Prokopczak, J. 1.73 --- 10.66 6.10 10.67 9.75 5.48 --- 17-Sep-74 Stock New Well20 267241 SE-03-056-21 W4 Prokopczak, L.J. 1.73 --- 10.66 4.57 10.67 10.67 6.09 --- 10-Oct-74 Stock New Well21 83568 02-36-055-21 W4 Shell Oil 1.93 --- 15.24 11.89 13.11 --- --- --- 18-Nov-80 Industrial New Well22 83556 NW-34-055-21 W4 Fisher, George P. 2.07 --- 39.62 34.44 35.97 31.70 --- --- 1-Oct-70 Domestic New Well23 83554 NW-34-055-21 W4 Pickard, Wayne 2.07 --- 18.28 --- --- --- 5.48 --- --- Domestic Chemistry24 83555 NW-34-055-21 W4 Daust, Charlie 2.07 --- 42.67 38.10 39.93 36.88 --- --- 1-Sep-70 Domestic & Stock New Well25 83560 NW-34-055-21 W4 Daoust, C. 2.07 --- 42.67 36.58 42.67 36.58 28.95 --- 14-Aug-89 Domestic New Well26 83550 SW-34-055-21 W4 Radke, Ben 2.07 --- 94.48 85.34 94.49 43.28 10.66 --- 28-Sep-77 Stock New Well27 83548 SW-34-055-21 W4 Radke, James 2.07 --- 15.24 --- --- --- 4.57 --- --- Domestic Chemistry28 83551 SW-34-055-21 W4 Radke 2.07 --- --- --- --- --- --- --- --- Domestic Chemistry29 83571 SE-36-055-21 W4 Wiens, Lori 2.08 --- 15.24 --- --- --- --- --- --- Domestic Chemistry30 83570 SE-36-055-21 W4 Navratil, John 2.08 --- 18.28 --- --- --- --- --- --- Domestic Chemistry31 83552 05-34-055-21 W4 Radke, J./ R. 2.24 --- 35.05 32.00 35.05 32.00 25.90 --- 9-Feb-86 Domestic New Well32 83559 13-34-055-21 W4 Daoust, C. 2.31 --- 42.67 36.58 42.67 36.58 7.62 --- 14-Jul-87 Stock New Well33 83557 13-34-055-21 W4 Hall'S Auto 2.31 --- 36.57 --- --- 33.53 27.43 --- 9-Sep-81 Stock New Well34 83558 13-34-055-21 W4 Daoust, Charles 2.31 --- 40.53 --- --- 39.93 --- --- 19-Oct-78 Stock New Well35 83549 04-34-055-21 W4 Radke, Ben 2.31 --- 12.19 --- --- 12.19 --- --- 26-Aug-75 Domestic New Well36 83547 04-34-055-21 W4 Radke, Ben 2.31 --- 32 --- --- 31.39 25.29 --- 13-Apr-82 Stock New Well37 83553 04-34-055-21 W4 Radke, Ben 2.31 --- 14.63 --- --- 14.63 8.22 --- 6-Nov-81 Stock New Well38 83569 01-36-055-21 W4 Shell Oil 2.32 --- 30.48 13.11 18.90 13.11 8.83 --- 6-Nov-80 Industrial New Well39 83566 01-36-055-21 W4 Shell Oil 2.32 --- 24.38 20.42 21.95 --- 3.35 --- 16-Nov-80 Industrial New Well40 83565 01-36-055-21 W4 Shell Oil 2.32 --- 24.38 17.98 22.56 18.90 3.35 --- 15-Nov-80 Industrial New Well41 83567 01-36-055-21 W4 Shell Oil 2.32 --- 45.72 40.23 41.45 --- 33.83 --- 17-Nov-80 Industrial New Well42 83498 SE-27-055-21 W4 Cholowski, Albert 2.36 --- 56.38 40.23 51.21 40.23 18.89 --- 30-Nov-62 Stock New Well43 90354 SE-27-055-21 W4 Cholowski, Albert 2.36 --- 54.86 39.01 42.67 --- 20.11 --- 1-Aug-72 Domestic New Well44 83492 SW-25-055-21 W4 Gabert, Morley 2.36 --- 68.58 --- --- --- 18.28 --- --- Domestic Chemistry45 83493 SW-25-055-21 W4 Olson, W. 2.36 --- 31.08 --- --- --- 25.60 --- --- Domestic Chemistry46 83494 SW-25-055-21 W4 Olson, William M. 2.36 --- 39.01 --- --- --- --- --- --- Domestic Chemistry47 83502 NW-27-055-21 W4 Millward, Donald 2.36 --- 42.67 --- --- --- 12.19 --- --- Domestic Chemistry48 83503 NW-27-055-21 W4 Millward, Donald 2.36 --- 42.67 --- --- --- 12.19 --- --- Domestic Chemistry49 157040 NW-01-056-21 W4 Cholowski, Tom 2.37 --- 10.97 --- --- --- 4.57 --- --- Domestic Chemistry50 90355 NE-25-055-21 W4 Bertz, Vern 2.37 --- 51.81 43.89 45.11 43.89 9.75 --- 13-Aug-76 Domestic New Well
Date of Information
(dd-mmm-yy)Type of Work Proposed Use for
WellBottom of Screen (m)
Bottom of Casing (m)
Depth to Water (m)
Bedrock Depth (m)
Distance from Site
(km)
Direction from Site
Total Depth (m)
Top of Screen
(m)
Water Well Number
(Figure 2)Well ID* Location Well Owner
1 of 10NORTH AMERICANOIL SANDS COPORATION

North American Upgrader ProjectVolume 3, Appendix 5D
December 2007
Table 5D-1. WATER WELLS WITHIN A 7.0km RADIUSNorth American Oil Sands CorporationNorth American Upgrader Project
Date of Information
(dd-mmm-yy)Type of Work Proposed Use for
WellBottom of Screen (m)
Bottom of Casing (m)
Depth to Water (m)
Bedrock Depth (m)
Distance from Site
(km)
Direction from Site
Total Depth (m)
Top of Screen
(m)
Water Well Number
(Figure 2)Well ID* Location Well Owner
51 297105 NE-25-055-21 W4 Bartz, Veron 2.37 --- 54.86 43.28 49.38 49.38 10.36 --- 29-May-01 Domestic & Stock New Well52 83496 NE-25-055-21 W4 Bartz, Vern 2.37 --- 10.97 --- --- --- --- --- --- Domestic Chemistry53 206702 NE-03-056-21 W4 Veltman, Herb 2.37 --- 44.19 40.54 42.06 40.54 29.26 --- 26-Mar-93 Domestic & Stock New Well54 263380 NE-03-056-21 W4 Veltman, H 2.37 --- 39.62 --- --- --- 24.38 --- --- Domestic Chemistry55 263303 SE-01-056-21 W4 Guenette, D 2.37 --- 12.19 --- --- --- 9.14 --- --- Domestic Chemistry56 263375 SW-03-056-21 W4 Hannerman, R 2.37 --- 6.4 --- --- --- 3.96 --- 1-Jan-73 Domestic Chemistry57 83495 16-25-055-21 W4 Newman, H. 2.45 --- 18.89 --- --- --- 7.62 --- 1-Jan-30 Domestic & Stock Federal Well Survey58 83478 14-23-055-21 W4 Arndt, G. 2.64 --- 13.41 --- --- --- --- --- 1-Jan-26 Stock Federal Well Survey59 83264 05-31-055-20 W4 Sampert, W. 2.67 --- 14.93 --- --- --- 6.70 --- 1-Jan-32 Domestic & Stock Federal Well Survey60 83483 13-24-055-21 W4 Kelly, E. 2.83 --- 99.06 --- --- --- 15.24 --- --- Domestic & Stock Federal Well Survey61 83482 13-24-055-21 W4 Fluker, Norman E. 2.83 --- 51.81 --- --- 49.68 39.62 --- 12-Dec-75 Stock New Well62 91497 04-06-056-20 W4 Hydrogeological Consult Ltd 2.85 --- 7.01 --- --- --- --- --- 17-Jul-75 Unknown Test Hole63 91495 04-06-056-20 W4 Yaworski, Mike 2.85 --- 17.06 --- --- 17.07 4.26 --- 16-Apr-86 Domestic & Stock New Well64 91494 04-06-056-20 W4 Sampert, T. 2.85 --- 6.09 --- --- --- --- --- --- Domestic Federal Well Survey65 83500 SW-27-055-21 W4 Cholowski, Albert 2.86 --- --- --- --- --- --- --- --- Domestic Chemistry66 83501 SW-27-055-21 W4 Chipchase, G. 2.86 --- 67.05 --- --- --- --- --- --- Domestic Chemistry67 83491 SE-25-055-21 W4 Victor, Robert 2.86 --- 18.28 --- --- --- 5.48 --- --- Domestic Chemistry68 83490 SE-25-055-21 W4 Quartly, C. 2.86 --- 24.38 --- --- --- 10.66 --- --- Domestic Chemistry69 83489 SE-25-055-21 W4 Bondt, Gerard 2.86 --- 15.24 --- --- --- 9.14 --- --- Domestic Chemistry70 153768 NW-23-055-21 W4 Arndt, R.E. 2.86 --- 42.67 35.36 36.58 35.36 9.75 --- 31-Aug-90 Domestic & Stock New Well71 83477 NW-23-055-21 W4 Arndt, Erdman 2.86 --- 36.57 35.36 36.58 35.36 9.75 --- 2-Jul-68 Domestic & Stock New Well72 83479 NE-23-055-21 W4 Wilson, Lloyd 2.86 --- 67.05 29.26 59.74 --- 16.00 --- 21-Dec-87 Domestic New Well73 83499 05-27-055-21 W4 Underschultz, A. 2.88 --- 30.48 --- --- --- --- --- 1-Jan-24 Domestic & Stock Federal Well Survey74 261886 09-01-056-21 W4 Schultz, E 2.88 --- 4.57 --- --- --- 0.03 --- --- Domestic & Stock Federal Well Survey75 263699 SW-12-056-21 W4 Olson, R 3.08 --- 31.08 --- --- 28.96 11.58 --- --- Stock New Well76 263707 SW-12-056-21 W4 Gabert, M. 3.08 --- 60.96 --- --- 0.00 53.34 --- --- Domestic Chemistry77 263703 SW-12-056-21 W4 Olsen, R 3.08 --- 13.71 --- --- 11.89 2.74 --- 3-Sep-77 Stock New Well78 83473 NE-22-055-21 W4 Chernichan, John 3.09 --- 18.28 --- --- --- --- --- --- Domestic Chemistry79 299632 NW-24-055-21 W4 Fluker, Norm 3.1 --- 21.03 15.24 21.03 --- 16.15 --- 31-May-01 Domestic New Well80 83484 NW-24-055-21 W4 Fluker, Norman 3.1 --- 18.28 --- --- 18.29 0.00 --- 27-Oct-76 Domestic New Well81 83485 NW-24-055-21 W4 Fluker, Norman E. 3.1 --- 68.58 --- --- --- 54.86 --- --- Domestic Chemistry82 91496 SW-06-056-20 W4 Thorne, Keith 3.11 --- 3.04 --- --- --- --- --- --- Domestic Chemistry83 208867 SW-06-056-20 W4 Yaworski, Micheal 3.11 --- 16.45 4.57 13.72 --- 4.26 --- 12-Mar-93 Domestic & Stock New Well84 83265 14-31-055-20 W4 Fisher, J. 3.12 --- 24.07 --- --- --- --- --- 1-Jan-15 Domestic & Stock Federal Well Survey85 83480 EH-23-055-21 W4 Wilson, Lloyd 3.26 --- 56.38 --- --- --- 14.93 --- --- Domestic Chemistry86 263661 09-11-056-21 W4 Anuratil, J. 3.31 --- 66.44 32.92 37.80 --- --- --- 31-Aug-73 Unknown Unknown87 83507 01-28-055-21 W4 Alta Agriculture #670H 3.46 --- 21.33 --- --- --- --- --- 24-Jun-69 Unknown Test Hole88 263676 SE-12-056-21 W4 Esch, G 3.48 --- 7.92 --- --- --- --- --- --- Domestic Chemistry89 263697 SE-12-056-21 W4 Mizera, T. 3.48 --- 0 --- --- --- --- --- --- Domestic Chemistry90 263683 SE-12-056-21 W4 Esch, G 3.48 --- 91.44 79.25 91.44 42.67 27.43 --- 5-Nov-81 Domestic New Well91 263633 09-11-056-21 W4 Navratil, J 3.49 --- 10.66 --- --- --- 2.74 --- --- Domestic Chemistry92 83471 NW-22-055-21 W4 Larsen, Helen 3.49 --- 54.86 --- --- --- --- --- --- Domestic Chemistry93 83470 NW-22-055-21 W4 Larsen, Svend 3.49 --- 64 --- --- --- 48.76 --- --- Domestic Chemistry94 83469 NW-22-055-21 W4 Larsen, S.A. 3.49 --- 51.81 --- --- 37.19 0.00 --- 1-Apr-65 Domestic & Stock New Well95 83475 05-23-055-21 W4 Penelton, J. 3.49 --- 54.86 --- --- --- --- --- 1-Jan-26 Stock Federal Well Survey96 83488 NE-24-055-21 W4 Alta Transp#Campground 3.5 --- 64 --- --- 60.66 17.67 --- 22-Apr-60 Domestic New Well97 169736 NE-24-055-21 W4 Mcintyre, Blaine 3.5 --- 73.15 --- --- 62.79 21.33 --- 27-Sep-92 Domestic New Well98 83487 NE-24-055-21 W4 Bruderheim Campground 3.5 --- 0 --- --- --- --- --- --- Domestic Chemistry99 83486 NE-24-055-21 W4 Alta Transp#Campsite 3.5 --- 45.72 --- --- --- --- --- --- Domestic Chemistry
100 83505 SE-28-055-21 W4 Royce, Sidney 3.5 --- 38.7 --- --- --- 32.30 --- --- Domestic Chemistry
2 of 10NORTH AMERICANOIL SANDS COPORATION

North American Upgrader ProjectVolume 3, Appendix 5D
December 2007
Table 5D-1. WATER WELLS WITHIN A 7.0km RADIUSNorth American Oil Sands CorporationNorth American Upgrader Project
Date of Information
(dd-mmm-yy)Type of Work Proposed Use for
WellBottom of Screen (m)
Bottom of Casing (m)
Depth to Water (m)
Bedrock Depth (m)
Distance from Site
(km)
Direction from Site
Total Depth (m)
Top of Screen
(m)
Water Well Number
(Figure 2)Well ID* Location Well Owner
101 83506 SE-28-055-21 W4 Royce, Sidney 3.5 --- 24.38 --- --- --- --- --- --- Domestic Chemistry102 83263 SW-30-055-20 W4 Schneider, Orvis 3.5 --- 7.62 --- --- --- --- --- --- Domestic Chemistry103 285788 05-24-055-21 W4 D&R Guenette Farms Ltd 3.65 --- 62.48 54.86 59.44 54.86 21.33 --- 9-May-96 Domestic & Stock New Well104 263640 NE-11-056-21 W4 Andruchow, E 3.66 --- 43.28 41.15 42.37 41.15 28.95 --- 17-Aug-84 Domestic New Well105 263595 NE-11-056-21 W4 Nauratil, J 3.66 --- 64.61 --- --- --- 33.52 --- --- Domestic Chemistry106 263651 NE-11-056-21 W4 Breit, E 3.66 --- 17.98 --- --- --- 8.22 --- 20-Jun-86 Domestic New Well107 263645 NE-11-056-21 W4 O'Brien, N 3.66 --- 36.57 --- --- --- --- --- --- Domestic Chemistry108 263607 NE-11-056-21 W4 Fairweather, B. 3.66 --- 37.18 --- --- 35.05 35.05 --- 1-Aug-73 Stock New Well109 263599 NE-11-056-21 W4 Taylor, G J 3.66 --- 36.57 --- --- 35.05 31.08 --- --- Stock New Well110 83476 SW-23-055-21 W4 Brown, George 3.66 --- 30.48 --- --- --- --- --- --- Domestic Chemistry111 83474 SE-23-055-21 W4 Boyko, Louis 3.66 --- 12.19 --- --- --- 6.09 --- --- Domestic Chemistry112 83266 NE-31-055-20 W4 Hennig, R. 3.69 --- 8.53 --- --- --- 2.43 --- --- Domestic Chemistry113 263710 NW-12-056-21 W4 Gabert, M. 3.83 --- 44.19 --- --- 42.06 12.19 --- 12-Aug-83 Stock New Well114 263714 NW-12-056-21 W4 Gabert, M. 3.83 --- 33.52 --- --- --- --- --- --- Domestic Chemistry115 153167 SE-22-055-21 W4 Poulin, Rodger 3.84 --- 48.76 41.15 42.67 42.67 15.24 --- 20-Jul-90 Domestic New Well116 83467 NE-21-055-21 W4 Scotford Hutterite Colony 4.03 --- 76.2 --- --- --- 27.43 --- --- Domestic Chemistry117 298287 NW-19-055-20 W4 4.03 --- 0 --- --- --- --- --- --- Domestic Old Well-Abandoned118 292190 NW-19-055-20 W4 Lamprecht, Henry 4.03 --- 48.76 36.58 42.67 --- 15.84 --- 20-Apr-99 Domestic New Well119 83468 05-22-055-21 W4 Langhausen, J. 4.1 --- 39.01 --- --- --- --- --- 1-Jan-15 Domestic & Stock Federal Well Survey120 83481 SE-24-055-21 W4 Gabert, Larry 4.18 --- 59.43 --- --- 57.91 18.89 --- 27-Aug-86 Stock New Well121 83261 SE-30-055-20 W4 Schneider, J. 4.18 --- 36.57 --- --- --- 8.83 --- 1-Sep-30 Domestic Well Inventory122 280650 SW-28-055-21 W4 Visscher, D. 4.18 --- 9.14 --- --- --- --- --- --- Domestic Chemistry123 91498 NE-06-056-20 W4 Schram, George 4.19 --- 91.44 --- --- --- --- --- --- Domestic Chemistry124 83262 08-30-055-20 W4 Prochau 4.27 --- 6.7 --- --- --- 5.18 --- 1-Jan-10 Domestic & Stock Federal Well Survey125 100870 05-32-055-20 W4 Schwanke, G. 4.29 --- 18.28 --- --- --- --- --- 1-Jan-19 Domestic & Stock Federal Well Survey126 83535 01-32-055-21 W4 Mohr, G.P. 4.33 --- 0 --- --- --- --- --- --- Domestic & Stock Federal Well Survey127 83179 05-19-055-20 W4 Schultz, R. 4.35 --- 18.89 --- --- --- 9.75 --- 1-Jan-34 Domestic & Stock Federal Well Survey128 83255 13-29-055-20 W4 Mashmeyer, K. 4.4 --- 67.05 --- --- --- --- --- 1-Jan-21 Domestic & Stock Federal Well Survey129 263410 01-05-056-21 W4 Can Badger Co Ltd #2 4.41 --- 47.24 38.10 41.15 --- 24.99 --- 6-Apr-82 Monitoring New Well130 263417 01-05-056-21 W4 Can Badger Co Ltd #3 4.41 --- 60.96 45.72 60.96 45.72 25.60 --- 8-Apr-82 Monitoring New Well131 263423 01-05-056-21 W4 Can Badger Co Ltd #4 4.41 --- 60.96 45.72 60.96 45.42 25.60 --- 13-Apr-82 Monitoring New Well132 263387 01-05-056-21 W4 Can Badger Co Ltd #7 4.41 --- 42.06 39.32 42.06 --- 25.60 --- 27-Apr-82 Monitoring New Well133 263459 01-05-056-21 W4 Can Badger Co Ltd #8 4.41 --- 42.67 39.01 40.54 39.01 25.60 --- 3-May-82 Monitoring New Well134 263465 01-05-056-21 W4 Can Badger Co Ltd #9 4.41 --- 42.67 --- --- 36.88 25.60 --- 5-May-82 Monitoring New Well135 263728 16-12-056-21 W4 Bruderheim, Town Of #9-75 4.43 --- 42.67 35.66 37.19 35.66 --- --- 3-Oct-75 Municipal New Well136 263723 16-12-056-21 W4 Bruderheim, Town Of#11-75 4.43 --- 42.67 29.26 30.78 29.26 --- --- 6-Nov-75 Municipal New Well137 263716 16-12-056-21 W4 Bruderheim, Town Of #15-75 4.43 --- 42.67 34.14 35.66 34.14 --- --- 17-Nov-75 Unknown138 263729 16-12-056-21 W4 Bruderheim, Town Of#10-75 4.43 --- 42.67 33.83 37.19 33.83 24.44 --- 4-Nov-75 Municipal New Well139 91499 16-06-056-20 W4 Schram, George 4.46 --- 67.97 48.77 67.97 28.96 13.71 --- 12-Apr-85 Domestic & Stock New Well140 83409 NW-14-055-21 W4 Fluker, Randy 4.47 --- 80.77 --- --- --- 68.58 --- --- Domestic Chemistry141 83408 NW-14-055-21 W4 Fluker, Randy 4.47 --- 76.2 --- --- --- --- --- --- Domestic Chemistry142 167583 NE-14-055-21 W4 Hanes, Raymond/Susan 4.47 --- 54.86 --- --- --- --- --- --- Domestic Chemistry143 83414 NE-14-055-21 W4 Roesler, Lloyd 4.47 --- 64 --- --- --- --- --- --- Domestic Chemistry144 83413 NE-14-055-21 W4 Lamarche, Laurier 4.47 --- 83.82 44.20 60.96 44.20 15.24 --- 30-May-80 Domestic Deepened145 263842 SE-14-056-21 W4 Smart, D 4.48 --- 3.65 --- --- --- 1.82 --- --- Domestic Chemistry146 263818 03-13-056-21 W4 Procnaim, R. 4.49 --- 4.87 --- --- --- 3.04 --- --- Stock Federal Well Survey147 83544 NE-32-055-21 W4 Visscher, D. 4.51 --- 46.32 --- --- --- 32.00 --- --- Domestic Chemistry148 83541 NE-32-055-21 W4 Pcl Braun Simons Ltd #Hole1 4.51 --- 42.67 40.23 42.67 --- 27.43 --- 20-Aug-81 Industrial New Well149 83539 NE-32-055-21 W4 Pcl Braun Simons Ltd #Well4 4.51 --- 41.14 35.05 41.15 41.15 28.95 --- 9-Oct-81 Industrial New Well150 83542 NE-32-055-21 W4 Pcl Braun Simons Ltd #Hole2 4.51 --- 42.67 40.23 42.67 --- 27.43 --- 2-Sep-81 Industrial New Well
3 of 10NORTH AMERICANOIL SANDS COPORATION

North American Upgrader ProjectVolume 3, Appendix 5D
December 2007
Table 5D-1. WATER WELLS WITHIN A 7.0km RADIUSNorth American Oil Sands CorporationNorth American Upgrader Project
Date of Information
(dd-mmm-yy)Type of Work Proposed Use for
WellBottom of Screen (m)
Bottom of Casing (m)
Depth to Water (m)
Bedrock Depth (m)
Distance from Site
(km)
Direction from Site
Total Depth (m)
Top of Screen
(m)
Water Well Number
(Figure 2)Well ID* Location Well Owner
151 83540 NE-32-055-21 W4 Pcl Braun Simons Ltd #Hole5 4.51 --- 41.14 35.66 41.15 41.15 28.95 --- 6-Oct-81 Industrial New Well152 83543 NE-32-055-21 W4 Pcl Braun Simons Ltd #Hole3 4.51 --- 42.67 40.54 42.67 --- 27.43 --- 25-Aug-81 Industrial New Well153 100869 SW-32-055-20 W4 Fibke, Henry 4.51 --- 19.81 --- --- --- 10.66 --- --- Domestic Chemistry154 83270 SW-32-055-20 W4 Maschmeyer, Loris 4.51 --- 47.24 42.37 43.89 20.73 16.55 --- 30-Sep-70 Domestic New Well155 83418 NE-15-055-21 W4 Anweiler, Sal 4.61 --- 91.44 --- --- --- --- --- --- Domestic Chemistry156 240752 NE-15-055-21 W4 Alta Env #0297E 4.61 --- 24.38 --- --- --- --- --- 12-May-69 Unknown Test Hole157 83405 NW-13-055-21 W4 Gabert, Ronald D. 4.62 --- 60.96 48.77 60.96 44.50 15.84 --- 19-Aug-80 Domestic New Well158 263820 SW-13-056-21 W4 Prochnau, E. 4.62 --- 47.24 35.05 47.24 --- 25.90 --- 9-May-88 Domestic & Stock New Well159 83465 SE-21-055-21 W4 Thomas, Warren 4.63 --- 64 --- --- 64.01 9.14 --- 12-Sep-82 Domestic & Stock New Well160 100848 SW-19-055-20 W4 Schultz, Herrmann 4.63 --- 45.72 --- --- --- 12.19 --- --- Domestic Chemistry161 158556 SW-19-055-20 W4 Schultz, H. 4.63 --- 53.34 48.77 53.34 43.28 22.70 --- 1-Sep-71 Domestic Deepened162 158556 SW-19-055-20 W4 Schultz, H. 4.63 --- 53.34 48.77 53.34 43.28 12.19 --- 1-Sep-71 Domestic Deepened163 83181 NE-19-055-20 W4 Duff, Don 4.63 --- --- --- --- --- --- --- --- Domestic Chemistry164 263592 SW-09-056-21 W4 Lechenko #3 Drinking Well 4.64 --- --- --- --- --- 5.18 --- --- Domestic Chemistry165 83254 NW-29-055-20 W4 Hargeshimer, George 4.65 --- 50.29 --- --- --- --- --- --- Domestic Chemistry166 164853 NW-29-055-20 W4 Hargesheimer, Peter/Adele 4.65 --- 34.13 --- --- --- --- --- --- Domestic Chemistry167 91491 SW-05-056-20 W4 Mandryk, Jerry 4.66 --- 18.28 --- --- --- 4.57 --- 1-Jan-78 Domestic Chemistry168 91492 SW-05-056-20 W4 Burwash, Earl 4.66 --- --- --- --- --- --- --- --- Domestic Chemistry169 83464 01-21-055-21 W4 Kribs, Robert 4.67 --- 38.1 31.70 36.58 26.82 16.15 --- 3-Apr-80 Stock New Well170 91501 01-07-056-20 W4 Hydrogeological Consult Ltd 4.68 --- 27.43 --- --- --- --- --- 17-Jul-75 Unknown Test Hole171 83180 16-19-055-20 W4 Duff, Don 4.68 --- 30.48 --- --- 25.60 12.49 --- 1-Nov-73 Stock New Well172 83182 16-19-055-20 W4 Kittlitz, C. 4.68 --- 18.28 --- --- --- --- --- 1-Jan-19 Domestic & Stock Federal Well Survey173 83415 09-14-055-21 W4 Fluker, R. 4.69 --- 48.76 --- --- --- 6.09 --- 1-Jan-19 Domestic & Stock Federal Well Survey174 263821 05-13-056-21 W4 Bruderheim, Town Of#14-75 4.77 --- 48.76 41.76 42.98 41.76 --- --- 11-Nov-75 Municipal New Well175 263789 01-13-056-21 W4 Bruderheim, Town Of #6A-75 4.8 --- 35.66 34.44 35.66 --- 25.81 --- 16-Jul-75 Municipal & Observation New Well176 263738 01-13-056-21 W4 Bruderheim, Town Of#6-75 Pump 4.8 --- 43.58 30.78 38.40 --- 24.84 --- 16-Jul-75 Municipal New Well177 263789 01-13-056-21 W4 Bruderheim, Town Of #6A-75 4.8 --- 35.66 34.44 35.66 --- 25.81 --- 16-Jul-75 Municipal & Observation New Well178 263738 01-13-056-21 W4 Bruderheim, Town Of#6-75 Pump 4.8 --- 43.58 30.78 38.40 --- 25.11 --- 16-Jul-75 Municipal New Well179 263918 04-15-056-21 W4 Seaboard Oil Co #4-15 4.81 --- 996.08 --- --- --- --- --- 15-Nov-50 Industrial Oil Exploratory180 83406 NE-13-055-21 W4 Gabert, Garry 4.89 --- 57.91 44.20 54.86 44.20 19.81 --- 28-May-79 Domestic New Well181 101389 00-32-055-20 W4 Bruderheim #Th 10-75 4.89 --- 36.88 --- --- 33.83 24.93 --- --- Municipal Test Hole182 83288 00-32-055-20 W4 Hofman, Lawrence 4.89 --- 6.09 --- --- --- 3.04 --- --- Domestic Chemistry183 263732 SE-13-056-21 W4 Wagner, J 4.9 --- 42.06 --- --- 39.93 27.43 --- --- Domestic & Stock New Well184 263736 SE-13-056-21 W4 Young, C.S. 4.9 --- 7.92 --- --- --- --- --- --- Domestic Chemistry185 91500 08-07-056-20 W4 Schram, Elmer 4.91 --- 14.63 --- --- 14.63 4.87 --- 24-Jul-81 Domestic & Stock New Well186 83509 SE-29-055-21 W4 Cf Braun Co 4.92 --- 45.72 41.76 44.81 --- 24.38 --- 24-Jun-77 Industrial New Well187 263525 NE-05-056-21 W4 Cholowski, R. 4.93 --- 6.09 --- --- 3.66 3.65 --- --- Domestic Chemistry188 263543 NE-05-056-21 W4 Cholowski, R. 4.93 --- 4.87 --- --- --- 1.21 --- --- Domestic Chemistry189 91564 04-18-056-20 W4 Stelter, A. 5 --- --- --- --- --- --- --- --- Domestic Federal Well Survey190 83421 16-16-055-21 W4 Manz, A. 5.01 --- 14.02 --- --- --- 6.09 --- 1-Jan-34 Stock Federal Well Survey191 83174 13-18-055-20 W4 Schutlz, F.H. 5.02 --- 24.38 --- --- --- --- --- --- Domestic Federal Well Survey192 91503 04-08-056-20 W4 Riske, E. 5.03 --- 7.62 --- --- --- 3.04 --- 1-Jan-19 Domestic & Stock Federal Well Survey193 83407 05-14-055-21 W4 Cantrell, M. 5.09 --- 33.52 --- --- --- --- --- --- Domestic & Stock Federal Well Survey194 263912 09-14-056-21 W4 Bruderheim, Town Of 5.1 --- 49.37 --- --- --- --- --- 16-Jul-75 Municipal New Well195 83260 00-29-055-20 W4 5.15 --- 69.79 --- --- --- --- --- --- Domestic Chemistry196 263735 08-13-056-21 W4 Wagner, J 5.16 --- 4.87 --- --- --- 3.04 --- 1-Jan-27 Domestic & Stock Federal Well Survey197 161758 SE-19-055-20 W4 Prochnau, Allan#Well 2 5.17 --- 19.81 --- --- --- --- --- --- Domestic Chemistry198 83176 SE-19-055-20 W4 Prochnau, A. 5.17 --- 27.43 --- --- --- 19.81 --- --- Domestic Chemistry199 83178 SE-19-055-20 W4 Prochnau, Allan 5.17 --- 9.14 --- --- --- --- --- --- Domestic Chemistry200 295816 SE-19-055-20 W4 Acheson, Bill 5.17 --- 61.87 40.23 52.43 --- 17.37 --- 5-Oct-98 Domestic New Well
4 of 10NORTH AMERICANOIL SANDS COPORATION

North American Upgrader ProjectVolume 3, Appendix 5D
December 2007
Table 5D-1. WATER WELLS WITHIN A 7.0km RADIUSNorth American Oil Sands CorporationNorth American Upgrader Project
Date of Information
(dd-mmm-yy)Type of Work Proposed Use for
WellBottom of Screen (m)
Bottom of Casing (m)
Depth to Water (m)
Bedrock Depth (m)
Distance from Site
(km)
Direction from Site
Total Depth (m)
Top of Screen
(m)
Water Well Number
(Figure 2)Well ID* Location Well Owner
201 161757 SE-19-055-20 W4 Prochnau, Allan#Well 1 5.17 --- 40.84 --- --- --- --- --- --- Domestic Chemistry202 91502 09-07-056-20 W4 Driesner, D. 5.17 --- 9.14 --- --- --- --- --- --- Domestic Federal Well Survey203 91490 02-05-056-20 W4 Arc #Test Hole 5.2 --- 103.63 --- --- 84.43 --- --- --- Unknown Test Hole204 83175 14-18-055-20 W4 Alta Env 5.24 --- 20.11 19.51 20.12 19.51 --- --- 21-Sep-86 Unknown Test Hole205 263877 NE-14-056-21 W4 Hodgson, G 5.28 --- 13.41 --- --- 13.41 --- --- 1-Aug-72 Domestic New Well206 263896 NE-14-056-21 W4 Hodgson, G 5.28 --- 48.76 42.37 43.89 43.89 21.33 --- 4-Nov-88 Domestic & Stock New Well207 263887 NE-14-056-21 W4 Percy, G. 5.28 --- 48.76 --- --- 46.33 27.43 --- 17-May-85 Domestic New Well208 261833 NE-14-056-21 W4 Hodgson, George 5.28 --- 11.27 --- --- 11.28 4.87 --- 19-Apr-89 Stock Deepened209 263883 NE-14-056-21 W4 Percy, G. 5.28 --- 11.27 --- --- --- 8.22 --- --- Domestic Chemistry210 263870 NE-14-056-21 W4 Hodgson, G A 5.28 --- 10.66 --- --- --- 4.87 --- --- Domestic Chemistry211 263910 NE-14-056-21 W4 Smibert, R 5.28 --- --- --- --- --- --- --- --- Domestic Chemistry212 83420 NE-16-055-21 W4 Mohr, Gus 5.29 --- 51.81 --- --- 43.89 13.71 --- 23-Apr-65 Domestic & Stock New Well213 208911 SE-16-056-21 W4 Henkelman, Percy 5.3 --- 11.88 4.57 11.28 --- 3.35 --- 25-Sep-92 Domestic New Well214 169121 SE-16-056-21 W4 Henkelman, P.R. 5.3 --- 34.74 --- --- --- --- --- 23-Sep-92 Unknown New Well-Abandoned215 91504 SW-08-056-20 W4 Schram, Ed 5.31 --- 23.77 --- --- --- --- --- Domestic Chemistry216 158576 SW-08-056-20 W4 Schram, Edward 5.31 --- 21.03 --- --- --- 3.65 --- 25-Sep-79 Domestic & Stock New Well217 100929 SW-08-056-20 W4 Schram, Ed 5.31 --- 7.92 --- --- --- 3.04 --- --- Domestic Chemistry218 83279 NE-32-055-20 W4 Ulmer, J. 5.31 --- 7.62 --- --- --- 3.04 --- --- Domestic Chemistry219 83276 NE-32-055-20 W4 French, N.E. 5.31 --- 7.92 --- --- --- 4.87 --- --- Domestic Chemistry220 83275 NE-32-055-20 W4 Benedict, Don 5.31 --- 6.09 --- --- --- 2.43 --- --- Domestic Chemistry221 83286 NE-32-055-20 W4 Bjorkquist, Bill 5.31 --- --- --- --- --- --- --- --- Domestic Chemistry222 83283 NE-32-055-20 W4 Strong, H.A. 5.31 --- 8.22 --- --- --- 4.87 --- --- Domestic Chemistry223 83274 NE-32-055-20 W4 Benedict, Don 5.31 --- 7.01 --- --- --- 2.74 --- --- Domestic Chemistry224 83277 NE-32-055-20 W4 Lukowesky, Peter 5.31 --- 7.31 --- --- --- 2.74 --- --- Domestic Chemistry225 83273 NE-32-055-20 W4 Klose, A. 5.31 --- 7.01 --- --- --- 2.43 --- --- Domestic Chemistry226 280267 NE-32-055-20 W4 Rosnau, E. 5.31 --- 6.09 --- --- --- 4.26 --- --- Domestic Chemistry227 83278 NE-32-055-20 W4 Hennig, R. 5.31 --- 8.53 --- --- --- 4.26 --- --- Domestic Chemistry228 83271 NE-32-055-20 W4 Benedict, D.C. 5.31 --- 48.76 --- --- --- 9.14 --- --- Domestic Chemistry229 83280 NE-32-055-20 W4 Florchuk, Henry 5.31 --- 9.14 --- --- --- 6.09 --- --- Domestic Chemistry230 83281 NE-32-055-20 W4 Klose, Albert 5.31 --- 48.76 27.43 48.77 27.43 12.19 --- 1-Dec-58 Domestic New Well231 83282 NE-32-055-20 W4 Chernyk, Dave 5.31 --- 6.7 --- --- 6.71 5.18 --- 3-Sep-69 Domestic New Well232 83285 NE-32-055-20 W4 Loeffelman, Alfred 5.31 --- 12.19 --- --- --- --- --- --- Domestic Chemistry233 83284 NE-32-055-20 W4 Abercan Ent Ltd 5.31 --- 6.09 --- --- --- --- --- --- Domestic Chemistry234 83272 NE-32-055-20 W4 Breitzke, David 5.31 --- 7.31 --- --- --- 3.65 --- --- Domestic Chemistry235 83536 NW-32-055-21 W4 Pcl Braun Simons Ltd 5.31 --- 39.62 --- --- --- --- --- --- Domestic Chemistry236 83537 NW-32-055-21 W4 Pcl Braun Simons Ltd 5.31 --- 39.62 --- --- --- --- --- --- Domestic Chemistry237 83538 NW-32-055-21 W4 Pcl Braun Simons Ltd 5.31 --- 45.72 --- --- --- --- --- --- Domestic Chemistry238 83267 SE-32-055-20 W4 Bruderheim, Village Of #3 5.31 --- 19.5 15.54 18.59 13.41 5.48 --- 3-Sep-70 Municipal New Well239 296521 SE-32-055-20 W4 Bruderheim, Town Of 5.31 --- 19.5 --- --- 13.41 --- --- 20-Apr-01 Municipal Old Well-Abandoned240 83268 SE-32-055-20 W4 Schultz, T.H. 5.31 --- 39.62 --- --- --- 20.72 --- --- Domestic Chemistry241 83185 NW-20-055-20 W4 Allard, Keith 5.31 --- 0 --- --- --- --- --- --- Domestic Chemistry242 83184 NW-20-055-20 W4 Prochnau, Elmer 5.31 --- 22.86 --- --- --- 15.24 --- --- Domestic Chemistry243 83256 NE-29-055-20 W4 Maschmeyer, Loris 5.43 --- 39.62 --- --- --- --- --- --- Domestic Chemistry244 83257 NE-29-055-20 W4 Roloff 5.43 --- 42.67 --- --- --- --- --- --- Domestic Chemistry245 83259 NE-29-055-20 W4 Heckbert, Joanne 5.43 --- 0 --- --- --- --- --- --- Domestic Chemistry246 263474 SW-05-056-21 W4 Reed, D 5.44 --- 16.76 --- --- --- 12.19 --- --- Domestic Chemistry247 100927 SE-05-056-20 W4 Rosnau, E. 5.44 --- 7.62 --- --- --- 2.74 --- --- Domestic Chemistry248 100928 SE-05-056-20 W4 Prochnau, Martha 5.44 --- 6.09 --- --- --- --- --- --- Domestic Chemistry249 159727 SE-05-056-20 W4 Hare, Gerald 5.44 --- 6.09 --- --- --- --- --- --- Domestic Chemistry250 91488 SE-05-056-20 W4 Pysmeny, Ross 5.44 --- 18.28 --- --- --- 16.15 --- --- Domestic Chemistry
5 of 10NORTH AMERICANOIL SANDS COPORATION

North American Upgrader ProjectVolume 3, Appendix 5D
December 2007
Table 5D-1. WATER WELLS WITHIN A 7.0km RADIUSNorth American Oil Sands CorporationNorth American Upgrader Project
Date of Information
(dd-mmm-yy)Type of Work Proposed Use for
WellBottom of Screen (m)
Bottom of Casing (m)
Depth to Water (m)
Bedrock Depth (m)
Distance from Site
(km)
Direction from Site
Total Depth (m)
Top of Screen
(m)
Water Well Number
(Figure 2)Well ID* Location Well Owner
251 83466 04-21-055-21 W4 Wakaryk, Andrew 5.45 --- 18.28 --- --- 18.29 7.31 --- 14-Sep-83 Stock New Well252 83177 01-19-055-20 W4 Kittlitz, R. 5.45 --- 21.94 --- --- --- --- --- 1-Jan-22 Domestic & Stock Federal Well Survey253 83402 08-13-055-21 W4 Gabert, A. 5.53 --- 13.71 --- --- --- 6.09 --- --- Domestic & Stock Federal Well Survey254 83287 16-32-055-20 W4 Stewart, M. 5.53 --- 10.05 --- --- --- 5.48 --- --- Domestic Chemistry255 83269 01-32-055-20 W4 Fredriking, E.G. 5.53 --- 12.49 --- --- --- --- --- 1-Jan-19 Domestic Federal Well Survey256 240751 EH-20-055-21 W4 Alta Env/Water Res #0296E 5.54 --- 45.11 --- --- --- --- --- 12-May-69 Unknown Test Hole257 83404 04-13-055-21 W4 Fluker, W. 5.55 --- 12.8 --- --- --- 4.57 --- 1-Jan-13 Domestic & Stock Federal Well Survey258 83258 16-29-055-20 W4 Stansky, L. 5.59 --- 29.56 --- --- --- --- --- 1-Jan-17 Domestic & Stock Federal Well Survey259 263484 04-05-056-21 W4 Yarshuk, P 5.6 --- 8.53 --- --- 8.53 5.48 --- 28-Jan-70 Domestic New Well260 91489 01-05-056-20 W4 Clonmel #Core Hole 5.6 --- 60.96 --- --- --- --- --- --- Industrial Core Hole261 297114 01-05-056-20 W4 Alta Infrastructure(Bruderheim 5.6 --- --- --- --- --- --- --- 14-Nov-00 Industrial Old Well-Abandoned262 83417 SW-15-055-21 W4 Whelan, James 5.63 --- 54.86 48.77 54.86 31.09 5.94 --- 8-Jun-89 Domestic New Well263 83253 SE-29-055-20 W4 Offenberger, Bryan 5.67 --- 54.86 --- --- --- --- --- --- Domestic Chemistry264 168089 SE-29-055-20 W4 Maschmeyer, L. 5.67 --- 60.96 45.72 54.86 54.86 25.60 --- 30-Jun-92 Stock New Well265 263492 NW-05-056-21 W4 Cholowski, R. 5.68 --- 42.67 --- --- 28.96 27.43 --- 12-Jan-61 Domestic Old Well-Abandoned266 91493 NE-05-056-20 W4 Mcbridge, R. 5.68 --- --- --- --- --- --- --- --- Domestic Chemistry267 91558 SE-18-056-20 W4 Mclellan, Arthur 5.75 --- 5.79 --- --- --- 3.65 --- --- Domestic Chemistry268 91560 SE-18-056-20 W4 Mclellan, Arthur 5.75 --- 15.84 --- --- 15.85 6.09 --- 9-Aug-78 Domestic & Stock New Well269 224564 SE-18-056-20 W4 Mclellan, Art 5.75 --- 42.67 35.36 41.45 41.45 21.18 --- 9-Oct-93 Domestic New Well270 91562 SE-18-056-20 W4 Mclellan, Arthur 5.75 --- 67.05 60.96 67.06 51.21 18.28 --- 31-Dec-81 Domestic New Well271 224564 SE-18-056-20 W4 Mclellan, Art 5.75 --- 42.67 35.36 41.45 41.45 21.18 --- 9-Oct-93 Domestic New Well272 224185 SE-18-056-20 W4 Mclellan, Art 5.75 --- 73.15 --- --- --- --- --- 8-Oct-93 Observation Test Hole-Abandoned273 91561 SE-18-056-20 W4 Mclellan, Arthur L. 5.75 --- 33.52 --- --- --- --- --- 17-Dec-81 Domestic New Well274 297564 SE-18-056-20 W4 Helmer, Muriel/Abner 5.75 --- 67.05 --- --- --- 24.38 --- 7-Oct-00 Domestic Old Well-Test275 91559 SE-18-056-20 W4 Mclellan, Arthur 5.75 --- 6.7 --- --- --- 5.48 --- --- Domestic Chemistry276 91505 13-08-056-20 W4 Sampert, Roger 5.75 --- 17.67 --- --- 17.68 4.26 --- 18-Jul-84 Domestic & Stock New Well277 263941 04-16-056-21 W4 Kropp, L. 5.76 --- 42.67 --- --- 38.40 30.02 --- --- Stock New Well278 263941 04-16-056-21 W4 Kropp, L. 5.76 --- 42.67 --- --- 38.40 30.02 --- --- Stock New Well279 83419 NW-16-055-21 W4 Krebs, Bernard 5.76 --- 56.38 --- --- --- --- --- --- Domestic Chemistry280 156870 NW-16-055-21 W4 Krebs, Bernard L. 5.76 --- 74.67 --- --- --- 21.33 --- --- Domestic Chemistry281 154895 NW-16-055-21 W4 Krebs, Bernard L. 5.76 --- 48.76 42.67 48.77 42.06 20.42 --- 13-Oct-90 Domestic New Well282 263924 SW-16-056-21 W4 Kropp, L. 5.78 --- --- --- --- --- --- --- --- Domestic Spring283 263933 SW-16-056-21 W4 Bolton School 5.78 --- --- --- --- --- --- --- --- Domestic Chemistry284 263959 SW-16-056-21 W4 Marquardt, E 5.78 --- 9.14 --- --- --- 3.04 --- --- Domestic Chemistry285 83462 SE-20-055-21 W4 Cnr#Beamer Spur 5.78 --- 99.36 --- --- --- --- --- --- Domestic Chemistry286 83463 SE-20-055-21 W4 Cnr#Scotford Yard 5.78 --- --- --- --- --- --- --- --- Domestic Chemistry287 83183 SW-20-055-20 W4 Violette, John 5.78 --- 39.62 --- --- --- --- --- --- Domestic Chemistry288 100931 00-08-056-20 W4 Inkster, Colin 5.86 --- 17.06 --- --- --- 2.43 --- --- Domestic Chemistry289 83188 00-20-055-20 W4 Fluker, David 5.87 --- 32.91 --- --- --- --- --- 1-Jan-67 Domestic Chemistry290 91566 11-18-056-20 W4 Serink, W. 5.89 --- 14.93 --- --- 14.94 3.04 --- 17-Jun-79 Domestic New Well291 83403 01-13-055-21 W4 Gabert, Richard 5.89 --- 14.63 --- --- --- 7.31 --- --- Domestic Chemistry292 263828 16-13-056-21 W4 Bruderheim, Town Of#13-75 5.9 --- 36.57 31.09 32.31 31.09 --- --- 10-Nov-75 Municipal New Well-Abandoned293 196474 12-33-055-20 W4 Kroker, G. Patricia/John 5.92 --- 9.14 --- --- --- 6.09 --- --- Domestic Chemistry294 83311 12-33-055-20 W4 Krebs, A.W. 5.92 --- 6.4 --- --- --- 2.13 --- --- Domestic Chemistry295 83252 01-29-055-20 W4 Bisch, B. 5.93 --- 48.76 --- --- --- --- --- 1-Jan-25 Domestic & Stock Federal Well Survey296 83309 13-33-055-20 W4 Thiel, Horst 5.95 --- 9.75 --- --- 9.75 4.26 --- 25-Oct-82 Domestic New Well297 83390 16-10-055-21 W4 Mohr, Irwin 5.96 --- 55.77 --- --- 42.98 18.28 --- 9-Jun-83 Stock New Well298 91565 NW-18-056-20 W4 Serink, W. 5.97 --- 12.19 --- --- 12.19 6.09 --- --- Domestic Chemistry299 91568 NW-18-056-20 W4 Serink, William 5.97 --- 47.24 --- --- --- 36.57 --- 24-Aug-87 Stock New Well300 83656 SE-16-055-21 W4 Rietveld, Leendert 5.98 --- 48.15 --- --- --- --- --- --- Domestic Chemistry
6 of 10NORTH AMERICANOIL SANDS COPORATION

North American Upgrader ProjectVolume 3, Appendix 5D
December 2007
Table 5D-1. WATER WELLS WITHIN A 7.0km RADIUSNorth American Oil Sands CorporationNorth American Upgrader Project
Date of Information
(dd-mmm-yy)Type of Work Proposed Use for
WellBottom of Screen (m)
Bottom of Casing (m)
Depth to Water (m)
Bedrock Depth (m)
Distance from Site
(km)
Direction from Site
Total Depth (m)
Top of Screen
(m)
Water Well Number
(Figure 2)Well ID* Location Well Owner
301 196672 SE-08-056-20 W4 Alexander, Bob 6 --- 6.09 --- --- --- --- --- --- Domestic Chemistry302 100930 SE-08-056-20 W4 Krause, F. 6 --- 9.14 --- --- --- --- --- --- Domestic Chemistry303 263579 SW-08-056-21 W4 Maschmeyer, R 6.01 --- 24.99 22.86 24.38 --- 13.41 --- 11-Nov-66 Domestic New Well304 263560 SW-08-056-21 W4 Kofluk, D 6.01 --- 48.76 --- --- 48.77 29.87 --- 1-Apr-73 Domestic New Well305 100849 NE-20-055-20 W4 Faubert, Al 6.01 --- 76.2 70.10 76.20 45.72 45.72 --- 5-Jun-74 Domestic New Well306 156859 NE-20-055-20 W4 Fluker, Arthur 6.01 --- 76.2 --- --- --- --- --- --- Domestic Chemistry307 83186 NE-20-055-20 W4 Hopwood, Roger 6.01 --- 7.92 --- --- --- 4.87 --- --- Domestic Chemistry308 83427 16-17-055-21 W4 Scotford Colony 6.03 --- 82.29 --- --- 72.85 27.43 --- 2-Jul-74 Stock New Well309 83430 16-17-055-21 W4 Scotford Colony 6.03 --- 73.15 71.63 73.15 --- 25.29 --- 23-Jun-78 Stock New Well310 83431 16-17-055-21 W4 Mann, A.A. 6.03 --- 85.34 --- --- --- --- --- --- Stock Federal Well Survey311 83432 16-17-055-21 W4 Scotford Colony 6.03 --- 134.11 --- --- 59.74 30.48 --- 2-Dec-83 Stock New Well312 91563 08-18-056-20 W4 Kaus, A. 6.03 --- 4.57 --- --- --- 3.35 --- 1-Jan-25 Domestic & Stock Federal Well Survey313 91556 04-17-056-20 W4 Schram, Barry 6.04 --- 42.67 27.43 42.67 27.43 6.09 --- 16-Aug-82 Stock New Well314 83392 15-10-055-21 W4 Greisling, P. 6.04 --- 15.24 --- --- --- 13.71 --- --- Domestic & Stock Federal Well Survey315 91567 13-18-056-20 W4 Serant, M. 6.05 --- 6.7 --- --- --- 1.82 --- 1-Jan-18 Stock Federal Well Survey316 263583 15-08-056-21 W4 Brodie, H.L. 6.07 --- 11.58 --- --- --- 10.05 --- --- Domestic Chemistry317 83396 NW-11-055-21 W4 Rhoades, Ron 6.09 --- 54.86 --- --- --- 17.37 --- --- Domestic Chemistry318 83187 16-20-055-20 W4 Schultz, Adolph 6.1 --- 7.62 --- --- --- 4.57 --- 1-Jan-00 Domestic & Stock Federal Well Survey319 83293 NW-33-055-20 W4 Liske, H. 6.13 --- 77.72 --- --- --- --- --- --- Domestic Chemistry320 83302 NW-33-055-20 W4 Kupsh, B. 6.13 --- 6.7 --- --- --- 2.74 --- --- Domestic Chemistry321 83295 NW-33-055-20 W4 Haur, W. 6.13 --- 29.26 --- --- --- --- --- --- Domestic Chemistry322 83310 NW-33-055-20 W4 Moravian Church 6.13 --- 18.28 --- --- --- --- --- --- Domestic Chemistry323 83307 NW-33-055-20 W4 Lilge, A. 6.13 --- 3.96 --- --- --- --- --- --- Domestic Chemistry324 100871 NW-33-055-20 W4 Thiel, R. 6.13 --- 7.31 --- --- --- 4.26 --- --- Domestic Chemistry325 100872 NW-33-055-20 W4 Thiel, R. 6.13 --- 6.7 --- --- --- 3.65 --- --- Domestic Chemistry326 100873 NW-33-055-20 W4 Theil, Rudolph 6.13 --- 6.7 --- --- 6.10 4.26 --- --- Domestic Chemistry327 83306 NW-33-055-20 W4 Sarjes, Joe 6.13 --- 10.66 --- --- 10.67 --- --- --- Domestic Chemistry328 83305 NW-33-055-20 W4 Loren, Roy 6.13 --- 3.96 --- --- --- 2.13 --- --- Domestic Chemistry329 83303 NW-33-055-20 W4 Lawrence, G.E. 6.13 --- 5.48 --- --- --- 1.82 --- --- Domestic Chemistry330 83301 NW-33-055-20 W4 Frauenfeld, Roy 6.13 --- 5.79 --- --- --- 2.74 --- --- Domestic Chemistry331 83300 NW-33-055-20 W4 Noske, A. 6.13 --- 5.18 --- --- --- 2.13 --- --- Domestic Chemistry332 83299 NW-33-055-20 W4 Jordan, J.R. 6.13 --- 6.09 --- --- --- --- --- --- Domestic Chemistry333 83298 NW-33-055-20 W4 Kottke, Emil 6.13 --- 7.62 --- --- --- 4.57 --- --- Domestic Chemistry334 83297 NW-33-055-20 W4 Strydnaka, M. 6.13 --- 7.01 --- --- --- 3.35 --- --- Domestic Chemistry335 83296 NW-33-055-20 W4 Loffleman, A. 6.13 --- 6.09 --- --- --- 2.43 --- --- Domestic Chemistry336 256352 NW-33-055-20 W4 Thiel Greenhouses 6.13 --- 12.19 9.14 12.19 --- 1.79 --- 29-Sep-94 Irrigation New Well337 83294 NW-33-055-20 W4 Strauss, R. 6.13 --- 39.62 --- --- --- --- --- --- Domestic Chemistry338 83292 NW-33-055-20 W4 Lutheran House 6.13 --- 9.14 --- --- --- --- --- --- Domestic Chemistry339 83291 NW-33-055-20 W4 Swartz, M. 6.13 --- 64 --- --- --- 3.04 --- --- Domestic Chemistry340 83304 NW-33-055-20 W4 Hoffman, G. 6.13 --- 3.65 --- --- --- 1.82 --- --- Domestic Chemistry341 83534 NE-31-055-21 W4 Pcl Braun Simons Ltd 6.13 --- 39.62 --- --- --- --- --- --- Domestic Chemistry342 83533 SE-31-055-21 W4 Pcl Braun Simons Ltd 6.13 --- 41.14 --- --- --- --- --- --- Domestic Chemistry343 83388 14-10-055-21 W4 Geislinger, Harold 6.15 --- 33.52 --- --- --- 12.19 --- --- Domestic Chemistry344 83391 NE-10-055-21 W4 Mohr, Irwin 6.2 --- 76.2 --- --- --- --- --- --- Domestic Chemistry345 83389 NE-10-055-21 W4 Mohr, P. 6.2 --- 60.96 --- --- 59.44 17.98 --- 2-Mar-58 Domestic New Well346 83399 NW-12-055-21 W4 Gabert, Glen 6.2 --- 73.15 60.96 73.15 43.28 16.76 --- 25-Sep-86 Domestic New Well347 152373 WH-08-056-21 W4 Maschmeyer, Ray 6.21 --- 24.99 --- --- 24.99 10.66 --- 26-Jun-90 Domestic New Well348 152372 WH-08-056-21 W4 Maschmeyer, Ray 6.21 --- 30.48 --- --- --- --- --- 26-Jun-90 Unknown Dry Hole349 240750 NE-30-055-21 W4 Alta Env/Water Res #0295E 6.24 --- 42.67 --- --- --- --- --- 11-May-69 Unknown Test Hole350 83400 16-12-055-21 W4 Gabert, S. 6.29 --- 71.93 --- --- --- 21.33 --- 1-Jan-18 Domestic & Stock Federal Well Survey
7 of 10NORTH AMERICANOIL SANDS COPORATION

North American Upgrader ProjectVolume 3, Appendix 5D
December 2007
Table 5D-1. WATER WELLS WITHIN A 7.0km RADIUSNorth American Oil Sands CorporationNorth American Upgrader Project
Date of Information
(dd-mmm-yy)Type of Work Proposed Use for
WellBottom of Screen (m)
Bottom of Casing (m)
Depth to Water (m)
Bedrock Depth (m)
Distance from Site
(km)
Direction from Site
Total Depth (m)
Top of Screen
(m)
Water Well Number
(Figure 2)Well ID* Location Well Owner
351 83428 NE-17-055-21 W4 Scotford Colony 6.32 --- 36.57 --- --- --- 21.33 --- --- Domestic Chemistry352 220716 NE-17-055-21 W4 Scotford Colony 6.32 --- 105.15 --- --- 59.13 57.91 --- 20-Sep-91 Domestic & Stock Reconstructed353 83437 NE-17-055-21 W4 Scotford Colony 6.32 --- 0 --- --- --- --- --- --- Domestic & Stock Chemistry354 83436 NE-17-055-21 W4 Scotford Hutterite Brethren 6.32 --- 79.85 --- --- --- 30.48 --- --- Domestic & Stock Chemistry355 83435 NE-17-055-21 W4 Scotford Colony 6.32 --- 97.53 85.34 97.54 36.58 36.57 --- 18-Jun-85 Domestic & Stock New Well356 83434 NE-17-055-21 W4 Scotford Colony 6.32 --- 21.33 17.68 19.20 17.68 9.14 --- 27-Aug-86 Stock New Well357 83433 NE-17-055-21 W4 Scotford Colony 6.32 --- 109.72 91.44 109.73 27.74 36.57 --- 19-Mar-86 Domestic & Stock Deepened358 83426 NE-17-055-21 W4 Scotford Hutterite Brethren 6.32 --- 79.24 --- --- --- --- --- --- Domestic Chemistry359 83425 NE-17-055-21 W4 Scotford Colony 6.32 --- 82.29 70.10 82.30 59.13 27.43 --- 17-Aug-83 Domestic New Well360 83424 NE-17-055-21 W4 Scotford Colony 6.32 --- 85.34 73.15 85.34 31.39 28.95 --- 7-Dec-83 Stock New Well361 167850 NE-17-055-21 W4 Scotford Colony 6.32 --- 20.42 12.19 20.42 --- 8.53 --- 12-Jul-92 Stock New Well362 167849 NE-17-055-21 W4 Scotford Colony 6.32 --- 14.93 --- --- --- --- --- 10-Jul-92 Stock New Well-Abandoned363 83433 NE-17-055-21 W4 Scotford Colony 6.32 --- 109.72 91.44 109.73 27.74 28.95 --- 19-Mar-86 Domestic & Stock Deepened364 285787 NE-17-055-21 W4 Hutterian Brethren 6.32 --- 18.59 12.19 18.29 18.59 11.09 --- 4-Jun-96 Domestic New Well365 159190 NE-17-055-21 W4 Scotford Colony#Pump House 6.32 --- 82.29 --- --- 50.29 30.48 --- 28-May-76 Stock New Well366 83429 09-17-055-21 W4 Scotford Colony 6.32 --- 45.72 --- --- 36.27 29.87 --- 1-Aug-73 Stock New Well367 293774 SW-17-056-20 W4 Schram, Barry 6.32 --- 85.34 72.24 80.77 --- 17.22 --- 17-Oct-99 Domestic New Well368 185985 SW-17-056-20 W4 Schram, Barry 6.32 --- 67.05 48.77 60.96 27.43 18.59 --- 28-Oct-92 Stock New Well369 293775 SW-17-056-20 W4 Schram, Barry 6.32 --- 123.44 --- --- --- --- --- 12-Oct-99 Domestic Dry Hole-Abandoned370 83173 NW-17-055-20 W4 Schultz, W.E. 6.33 --- 12.8 --- --- --- 6.09 --- --- Domestic Chemistry371 83168 NW-17-055-20 W4 Werres, Ernest 6.33 --- 18.28 --- --- 18.29 7.62 --- 19-May-78 Stock New Well372 83308 14-33-055-20 W4 Boettcher 6.35 --- 5.48 --- --- --- 2.74 --- 1-Jan-22 Domestic & Stock Federal Well Survey373 297115 NE-18-056-20 W4 Martin, Bonnie 6.39 --- 18.28 --- --- --- 7.28 --- 7-Oct-00 Domestic Old Well-Test374 255797 NW-10-055-21 W4 Echolane Farm Ltd/Rompre, Ben 6.41 --- 36.57 29.26 35.05 --- 11.70 --- 4-Aug-94 Domestic & Stock New Well375 83387 NW-10-055-21 W4 Cox, Douglas 6.41 --- 27.43 --- --- --- --- --- --- Domestic Chemistry376 156869 NE-12-055-21 W4 Gabert, Gordon 6.41 --- 76.2 --- --- --- 38.10 --- --- Domestic Chemistry377 83401 NE-12-055-21 W4 Gabert, J. 6.41 --- 68.58 57.91 65.53 48.77 24.38 --- 27-May-76 Domestic & Stock New Well378 263963 NW-16-056-21 W4 Blenn 6.42 --- 6.7 --- --- --- 2.43 --- --- Domestic Chemistry379 91507 NE-08-056-20 W4 Frey, B. 6.42 --- 5.48 --- --- --- 1.82 --- --- Domestic Chemistry380 100932 NE-08-056-20 W4 Inkster, Colin 6.42 --- 19.5 --- --- 19.51 0.00 --- 14-Jul-73 Domestic New Well381 91571 04-19-056-20 W4 Serink, William 6.44 --- 45.72 --- --- 41.76 0.00 --- 8-Jul-77 Stock New Well382 91572 04-19-056-20 W4 Serink, Bill 6.44 --- 44.19 --- --- 44.20 0.00 --- 23-Sep-78 Domestic New Well383 83510 SE-30-055-21 W4 Waters, Dean 6.45 --- 9.75 --- --- --- 3.65 --- --- Domestic Chemistry384 83517 SE-30-055-21 W4 Woudenburg, Mary 6.45 --- 45.72 --- --- --- 30.48 --- --- Domestic Chemistry385 83511 SE-30-055-21 W4 Docksteader, Ilef 6.45 --- 7.62 --- --- --- 6.09 --- --- Domestic Chemistry386 83514 SE-30-055-21 W4 Ordell, Richard 6.45 --- 6.09 --- --- --- --- --- Domestic Chemistry387 83515 SE-30-055-21 W4 Godbout, Stan 6.45 --- 9.75 3.66 9.75 8.23 3.65 --- 20-Aug-75 Stock New Well388 83516 SE-30-055-21 W4 Waters, Dean 6.45 --- 12.19 --- --- --- 4.87 --- --- Domestic Chemistry389 83513 SE-30-055-21 W4 Balimore, Wesly 6.45 --- 14.32 --- --- 14.33 6.70 --- 15-Feb-70 Domestic New Well390 83512 SE-30-055-21 W4 Harboway, M. 6.45 --- 9.14 --- --- --- 7.62 --- --- Domestic Chemistry391 156871 SE-30-055-21 W4 Honisch, Vernon 6.45 --- 9.75 --- --- --- --- --- --- Domestic Chemistry392 160666 SE-30-055-21 W4 Sowden, Helen 6.45 --- 8.53 --- --- --- --- --- --- Domestic Chemistry393 91511 04-09-056-20 W4 Fraunfeld 6.48 --- 9.14 --- --- --- --- --- --- Domestic & Stock Federal Well Survey394 91510 04-09-056-20 W4 Rosenau, Wes 6.48 --- 11.58 --- --- 11.58 5.48 --- 30-Apr-79 Domestic & Stock New Well395 91508 09-08-056-20 W4 Frey, J. 6.48 --- 12.19 --- --- 0.00 --- --- 1-Jan-20 Domestic Federal Well Survey396 83195 13-21-055-20 W4 Maschmeyer, Doug 6.49 --- 7.62 --- --- 7.62 4.57 --- 27-May-66 Domestic New Well397 83192 13-21-055-20 W4 Maschmeyer, Douglas 6.49 --- 70.71 --- --- 65.23 41.14 --- 18-Jun-68 Domestic & Stock New Well398 83194 13-21-055-20 W4 Maschmeyer, Douglas 6.49 --- 67.66 --- --- 53.04 33.22 --- 2-Apr-80 Stock New Well399 83313 00-33-055-20 W4 Klasen, Joseph 6.52 --- 6.09 --- --- --- --- --- --- Domestic Chemistry400 91485 11-04-056-20 W4 Sampert, E. 6.58 --- 15.24 --- --- --- --- --- --- Domestic Federal Well Survey
8 of 10NORTH AMERICANOIL SANDS COPORATION

North American Upgrader ProjectVolume 3, Appendix 5D
December 2007
Table 5D-1. WATER WELLS WITHIN A 7.0km RADIUSNorth American Oil Sands CorporationNorth American Upgrader Project
Date of Information
(dd-mmm-yy)Type of Work Proposed Use for
WellBottom of Screen (m)
Bottom of Casing (m)
Depth to Water (m)
Bedrock Depth (m)
Distance from Site
(km)
Direction from Site
Total Depth (m)
Top of Screen
(m)
Water Well Number
(Figure 2)Well ID* Location Well Owner
401 289177 EH-17-056-21 W4 I.O.L. #4 6.63 --- 15.24 --- --- --- --- --- 8-Sep-97 Industrial Test Hole-Abandoned402 289176 EH-17-056-21 W4 I.O.L. #3 6.63 --- 18.28 15.85 17.37 --- --- --- 7-Sep-97 Industrial Test Hole-Abandoned403 289174 EH-17-056-21 W4 I.O.L. #5 6.63 --- 13.41 --- --- --- --- --- 8-Sep-97 Industrial Test Hole-Abandoned404 289173 EH-17-056-21 W4 I.O.L. #6 6.63 --- 15.24 11.89 13.41 --- --- --- 9-Sep-97 Industrial Test Hole-Abandoned405 289175 EH-17-056-21 W4 I.O.L. #2 6.63 --- 14.93 11.89 14.94 --- --- --- 6-Sep-97 Industrial Test Hole-Abandoned406 91557 12-17-056-20 W4 Hodgson, L. 6.63 --- 48.76 39.62 41.45 39.62 20.42 --- 4-Jun-84 Stock New Well407 91554 02-17-056-20 W4 Sampert, Ray 6.63 --- 34.13 --- --- 34.14 24.38 --- 6-May-81 Domestic New Well408 83166 05-17-055-20 W4 Kittlitz, A.C. 6.64 --- 14.63 --- --- --- --- --- 1-Jan-34 Domestic & Stock Federal Well Survey409 281168 SH-06-056-21 W4 Alta Env #0294E 6.64 --- 36.57 --- --- --- --- --- 11-May-69 Investigation Test Hole410 83169 15-17-055-20 W4 Alta Env 6.64 --- 15.24 --- --- --- --- --- 29-Sep-87 Unknown Test Hole-Abandoned411 83393 00-10-055-21 W4 Durand, Real 6.68 --- 24.38 --- --- --- --- --- --- Domestic Chemistry412 91506 16-08-056-20 W4 Frey, Bert W. 6.7 --- 74.98 --- --- --- 18.28 --- 15-Nov-61 Domestic New Well413 83394 08-11-055-21 W4 Lundy, J. 6.7 --- 11.27 --- --- --- 3.65 --- 1-Jan-21 Stock Federal Well Survey414 83383 NE-09-055-21 W4 Ede, W. 6.71 --- --- --- --- --- --- --- --- Domestic Chemistry415 264203 SE-21-056-21 W4 Debaan, J 6.71 --- 57.91 12.80 14.33 12.80 2.43 --- 12-Sep-78 Domestic New Well416 264180 SE-21-056-21 W4 Debaan, J 6.71 --- 54.86 47.55 48.16 46.94 28.95 --- 3-Jul-78 Stock New Well417 264190 SE-21-056-21 W4 Debaan, J 6.71 --- 16.45 --- --- --- --- --- 12-May-78 Domestic New Well-Abandoned418 290979 SE-21-056-21 W4 Marquardt, Brent 6.71 --- 18.28 3.66 16.76 --- 3.04 --- 14-Jul-98 Domestic New Well419 294342 SE-21-056-21 W4 Sooree, Dick 6.71 --- 24.38 10.06 23.47 --- 3.65 --- 8-Aug-98 Domestic New Well420 297579 SE-21-056-21 W4 Marquardt, B. 6.71 --- 21.03 13.72 --- --- 2.74 --- 18-Sep-01 Domestic New Well421 167679 SW-09-056-20 W4 Holzbouer, Ralph 6.74 --- 96.01 47.24 89.92 36.58 13.71 --- 9-Mar-92 Stock New Well422 91509 SW-09-056-20 W4 Chilkowich, Anthony 6.74 --- 15.24 --- --- --- 15.24 --- --- Domestic Chemistry423 83453 NE-19-055-21 W4 Nebel, Robert 6.75 --- 39.01 --- --- --- --- --- --- Domestic Chemistry424 83461 NE-19-055-21 W4 Cameron, Ed 6.75 --- 50.29 --- --- --- --- --- --- Domestic Chemistry425 83460 NE-19-055-21 W4 Doige, J.F. 6.75 --- 9.14 --- --- --- 5.48 --- --- Domestic Chemistry426 83449 NE-19-055-21 W4 Ede, William 6.75 --- 39.62 36.58 38.10 --- 34.74 --- 23-Jul-75 Domestic New Well427 298285 NE-19-055-21 W4 6.75 --- --- --- --- --- --- --- --- Unknown Old Well-Abandoned428 83451 NE-19-055-21 W4 Ede, W.J. 6.75 --- 40.23 34.75 40.23 40.23 28.95 --- 10-Oct-81 Domestic New Well429 83452 NE-19-055-21 W4 Enos, Al 6.75 --- 48.76 --- --- --- --- --- --- Domestic Chemistry430 83459 NE-19-055-21 W4 Spruce Hill Hog Ranch 6.75 --- --- --- --- --- --- --- --- Domestic & Stock Chemistry431 83458 NE-19-055-21 W4 Nyhuis, Albert 6.75 --- 18.28 --- --- --- 9.14 --- --- Domestic Chemistry432 83450 NE-19-055-21 W4 Olson, Fred 6.75 --- 60.96 --- --- --- --- --- --- Domestic Chemistry433 83193 NW-21-055-20 W4 Maschmeyer, Doug 6.75 --- 97.53 --- --- --- 82.29 --- --- Domestic Chemistry434 91570 02-19-056-20 W4 Schumak, A. 6.82 --- 12.8 --- --- --- 1.52 --- --- Domestic & Stock Federal Well Survey435 91513 12-09-056-20 W4 Rosenau, Wes 6.84 --- 14.63 --- --- 14.63 3.65 --- 18-Apr-83 Domestic & Stock New Well436 91513 12-09-056-20 W4 Rosenau, Wes 6.84 --- 14.63 --- --- 14.63 --- --- 18-Apr-83 Domestic & Stock New Well437 91514 12-09-056-20 W4 Rosenau, Wes 6.84 --- 9.14 --- --- 9.14 --- --- 21-Sep-78 Domestic & Stock New Well438 83191 05-21-055-20 W4 Fibke, J. 6.86 --- 4.87 --- --- --- --- --- 1-Jan-14 Domestic & Stock Federal Well Survey439 83457 15-19-055-21 W4 Henderson, Garth 6.86 --- 12.19 5.49 7.62 6.71 6.70 --- 2-Jan-80 Stock New Well440 83454 15-19-055-21 W4 Nebel, Robert 6.86 --- 7.31 --- --- 7.32 3.04 --- 10-May-68 Stock New Well441 83455 15-19-055-21 W4 Nebel, Robert 6.86 --- 11.58 10.06 11.28 10.06 4.57 --- 11-May-78 Domestic New Well442 83456 15-19-055-21 W4 Henderson, Garth 6.86 --- 8.53 1.83 7.92 3.66 1.21 --- 7-Jan-80 Stock New Well443 91484 07-04-056-20 W4 Taylor Petro 6.88 --- 943.96 --- --- --- --- --- 24-Mar-49 Industrial Oil Exploratory444 83395 SW-11-055-21 W4 Mohr, James 6.89 --- 48.76 --- --- --- 12.19 --- --- Domestic Chemistry445 159888 SE-11-055-21 W4 Johnston, Reg 6.89 --- 51.81 --- --- 44.81 12.19 --- 8-May-65 Domestic New Well446 83423 11-17-055-21 W4 Cnr 6.89 --- 21.33 20.12 21.34 20.12 --- --- 9-Apr-85 Domestic New Well447 83422 NW-17-055-21 W4 Scotford Colony 6.91 --- 39.62 --- --- 38.10 --- --- 1-Nov-73 Stock New Well448 91555 SE-17-056-20 W4 Sampert, Ray 6.92 --- 19.2 4.27 17.37 --- 4.87 --- 19-Aug-86 Domestic & Stock New Well449 83165 SW-17-055-20 W4 Kittlitz, Elmer 6.92 --- 74.67 --- --- --- 39.62 --- --- Domestic Chemistry450 83164 SW-17-055-20 W4 Kittlitz, Adolph 6.92 --- 115.82 --- --- --- 36.57 --- --- Domestic Chemistry
9 of 10NORTH AMERICANOIL SANDS COPORATION

North American Upgrader ProjectVolume 3, Appendix 5D
December 2007
Table 5D-1. WATER WELLS WITHIN A 7.0km RADIUSNorth American Oil Sands CorporationNorth American Upgrader Project
Date of Information
(dd-mmm-yy)Type of Work Proposed Use for
WellBottom of Screen (m)
Bottom of Casing (m)
Depth to Water (m)
Bedrock Depth (m)
Distance from Site
(km)
Direction from Site
Total Depth (m)
Top of Screen
(m)
Water Well Number
(Figure 2)Well ID* Location Well Owner
451 83167 SW-17-055-20 W4 Kittlitz, Elmer 6.92 --- 82.29 73.15 82.30 36.88 33.52 --- 2-Dec-83 Domestic & Stock New Well452 83170 NE-17-055-20 W4 Fibke, William 6.93 --- 27.73 --- --- --- 12.19 --- --- Domestic Chemistry453 298077 NE-17-055-20 W4 Devry, Pat 6.93 --- 74.67 51.82 73.15 35.05 32.91 --- 30-Jul-01 Domestic New Well454 83172 NE-17-055-20 W4 Schneider, Howard 6.93 --- --- --- --- --- --- --- --- Domestic Chemistry455 289172 EH-07-056-21 W4 I.O.L. #1 6.93 --- 30.48 --- --- --- --- --- 6-Sep-97 Industrial Test Hole-Abandoned456 156866 NE-33-055-20 W4 Martinell, Brad (Can Oxy)#5 6.94 --- --- --- --- --- --- --- --- Domestic Chemistry457 83312 NE-33-055-20 W4 Gilbert, Thomas 6.94 --- 9.14 --- --- --- --- --- --- Domestic Chemistry458 90353 NE-33-055-20 W4 Bruderheim, Town Of #Well 1 6.94 --- 39.62 26.21 27.74 25.91 4.41 --- 23-Jul-70 Municipal New Well459 90352 NE-33-055-20 W4 Bruderheim, Town Of #Well 2 6.94 --- 38.1 0.00 0.00 24.99 5.18 --- 20-Jul-70 Municipal New Well460 169169 NE-33-055-20 W4 Marko, Jim/Carol 6.94 --- 11.88 --- --- --- --- --- --- Domestic Chemistry461 83290 SE-33-055-20 W4 Bruderheim, Village Of #5 6.94 --- 36.57 --- --- --- 7.92 --- 13-Aug-70 Municipal New Well462 83289 SE-33-055-20 W4 Bruderheim, Village Of 6.94 --- 35.05 --- --- --- 5.94 --- 3-Sep-70 Municipal New Well463 293392 NW-31-055-21 W4 Mckay, Brian 6.94 --- 24.38 19.81 21.34 19.81 9.08 --- 13-Sep-99 Domestic New Well464 83520 06-30-055-21 W4 Moser, Georgette 6.97 --- 41.14 39.62 41.15 39.62 27.43 --- 8-Aug-84 Domestic New Well465 83385 SE-10-055-21 W4 Mckaskill, John 6.99 --- 18.28 --- --- --- --- --- --- Domestic Chemistry466 83397 SW-12-055-21 W4 Gabird, H. 6.99 --- 53.34 --- --- 46.63 12.19 --- 1-Jan-65 Domestic & Stock New Well
Notes:--- - not available * Alberta Environment, Alberta Groundwater Data on CDROM, Groundwater Information Centre (GIC), 2003;
updates from Alberta Environment Groundwater Information Website as available
10 of 10NORTH AMERICANOIL SANDS COPORATION

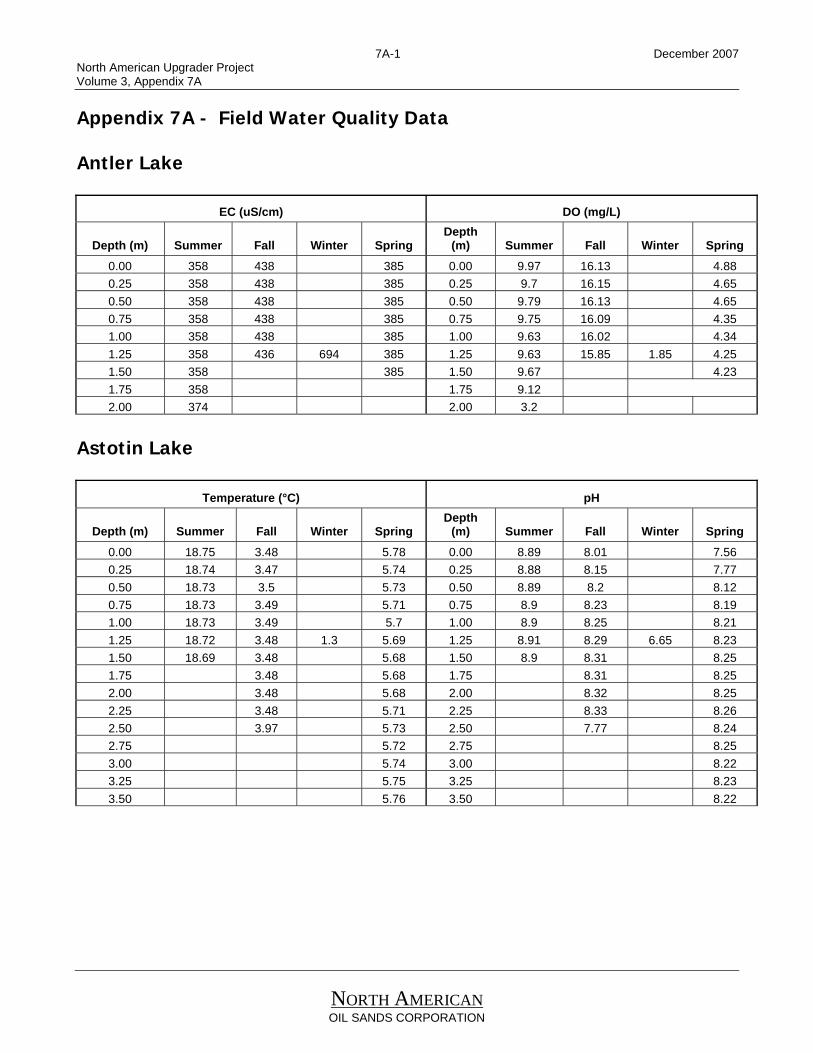
7A-1 December 2007 North American Upgrader Project Volume 3, Appendix 7A
NORTH AMERICAN OIL SANDS CORPORATION
Appendix 7A - Field Water Quality Data Antler Lake
EC (uS/cm) DO (mg/L)
Depth (m) Summer Fall Winter Spring Depth
(m) Summer Fall Winter Spring
0.00 358 438 385 0.00 9.97 16.13 4.88 0.25 358 438 385 0.25 9.7 16.15 4.65 0.50 358 438 385 0.50 9.79 16.13 4.65 0.75 358 438 385 0.75 9.75 16.09 4.35 1.00 358 438 385 1.00 9.63 16.02 4.34 1.25 358 436 694 385 1.25 9.63 15.85 1.85 4.25 1.50 358 385 1.50 9.67 4.23 1.75 358 1.75 9.12 2.00 374 2.00 3.2
Astotin Lake
Temperature (°C) pH
Depth (m) Summer Fall Winter Spring Depth
(m) Summer Fall Winter Spring
0.00 18.75 3.48 5.78 0.00 8.89 8.01 7.56 0.25 18.74 3.47 5.74 0.25 8.88 8.15 7.77 0.50 18.73 3.5 5.73 0.50 8.89 8.2 8.12 0.75 18.73 3.49 5.71 0.75 8.9 8.23 8.19 1.00 18.73 3.49 5.7 1.00 8.9 8.25 8.21 1.25 18.72 3.48 1.3 5.69 1.25 8.91 8.29 6.65 8.23 1.50 18.69 3.48 5.68 1.50 8.9 8.31 8.25 1.75 3.48 5.68 1.75 8.31 8.25 2.00 3.48 5.68 2.00 8.32 8.25 2.25 3.48 5.71 2.25 8.33 8.26 2.50 3.97 5.73 2.50 7.77 8.24 2.75 5.72 2.75 8.25 3.00 5.74 3.00 8.22 3.25 5.75 3.25 8.23 3.50 5.76 3.50 8.22

7A-2 December 2007 North American Upgrader Project Volume 3, Appendix 7A
NORTH AMERICAN OIL SANDS CORPORATION
Astotin Lake - continued
EC (uS/cm) DO (mg/L)
Depth (m) Summer Fall Winter Spring Depth
(m) Summer Fall Winter Spring
0.00 376 477 456 0.00 8.81 13.7 9.08 0.25 376 468 452 0.25 8.8 13.42 8.92 0.50 376 467 450 0.50 8.71 13.32 8.94 0.75 376 467 451 0.75 8.7 13.25 8.71 1.00 376 467 451 1.00 8.64 13.23 8.62 1.25 377 467 522 452 1.25 8.74 13.14 4.1 8.52 1.50 376 467 452 1.50 8.58 13.12 8.48 1.75 468 453 1.75 13.12 8.44 2.00 468 454 2.00 13 8.39 2.25 468 458 2.25 12.91 8.32 2.50 467 458 2.50 11.63 8.34 2.75 463 2.75 8.07 3.00 463 3.00 7.87 3.25 466 3.25 7.81 3.50 466 3.50 7.66
Summer Fall Winter Spring Antler Lake • Secchi .2 - - .37 • Turbidity - 39.36 - 12.62
Astotin Lake • Secchi .5 .48 - .8 • Turbidity - 13.71 7.44 7
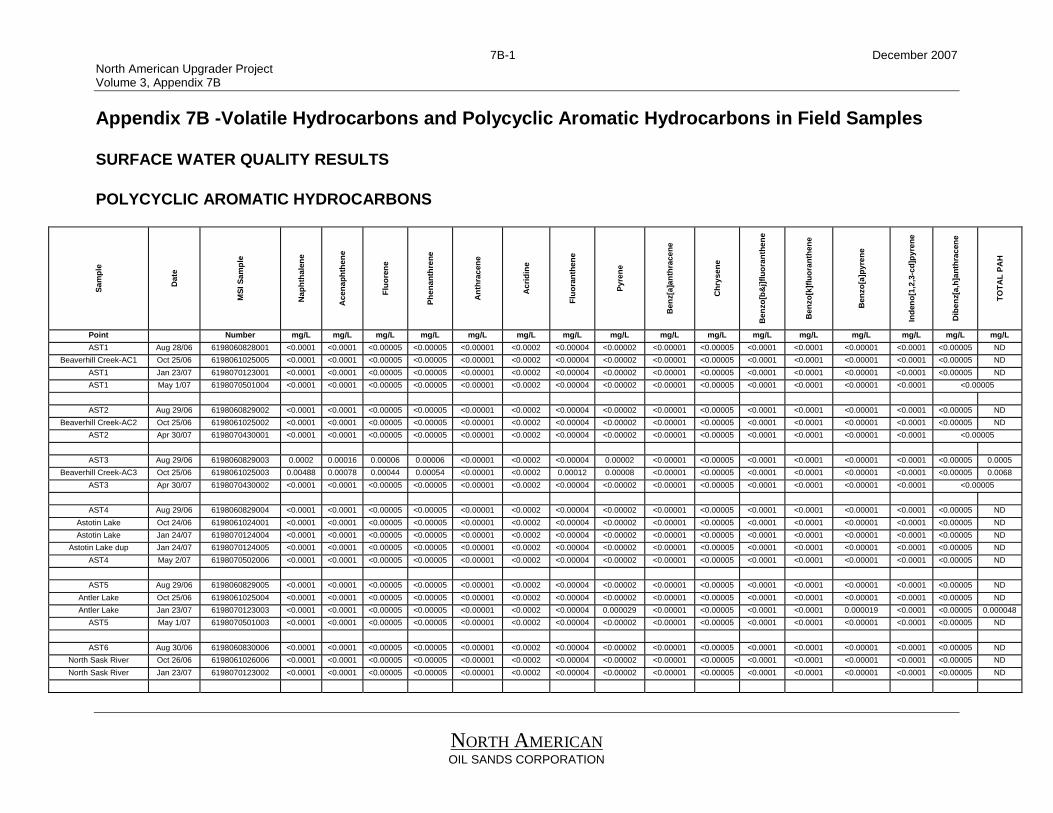
7B-1 December 2007 North American Upgrader Project Volume 3, Appendix 7B
NORTH AMERICAN OIL SANDS CORPORATION
Appendix 7B -Volatile Hydrocarbons and Polycyclic Aromatic Hydrocarbons in Field Samples SURFACE WATER QUALITY RESULTS POLYCYCLIC AROMATIC HYDROCARBONS
Sam
ple
Dat
e
MSI
Sam
ple
Nap
htha
lene
Ace
naph
then
e
Fluo
rene
Phen
anth
rene
Ant
hrac
ene
Acr
idin
e
Fluo
rant
hene
Pyre
ne
Ben
z[a]
anth
race
ne
Chr
ysen
e
Ben
zo[b
&j]f
luor
anth
ene
Ben
zo[k
]fluo
rant
hene
Ben
zo[a
]pyr
ene
Inde
no[1
,2,3
-cd]
pyre
ne
Dib
enz[
a,h]
anth
race
ne
TOTA
L PA
H
Point Number mg/L mg/L mg/L mg/L mg/L mg/L mg/L mg/L mg/L mg/L mg/L mg/L mg/L mg/L mg/L mg/L AST1 Aug 28/06 6198060828001 <0.0001 <0.0001 <0.00005 <0.00005 <0.00001 <0.0002 <0.00004 <0.00002 <0.00001 <0.00005 <0.0001 <0.0001 <0.00001 <0.0001 <0.00005 ND
Beaverhill Creek-AC1 Oct 25/06 6198061025005 <0.0001 <0.0001 <0.00005 <0.00005 <0.00001 <0.0002 <0.00004 <0.00002 <0.00001 <0.00005 <0.0001 <0.0001 <0.00001 <0.0001 <0.00005 ND AST1 Jan 23/07 6198070123001 <0.0001 <0.0001 <0.00005 <0.00005 <0.00001 <0.0002 <0.00004 <0.00002 <0.00001 <0.00005 <0.0001 <0.0001 <0.00001 <0.0001 <0.00005 ND AST1 May 1/07 6198070501004 <0.0001 <0.0001 <0.00005 <0.00005 <0.00001 <0.0002 <0.00004 <0.00002 <0.00001 <0.00005 <0.0001 <0.0001 <0.00001 <0.0001 <0.00005
AST2 Aug 29/06 6198060829002 <0.0001 <0.0001 <0.00005 <0.00005 <0.00001 <0.0002 <0.00004 <0.00002 <0.00001 <0.00005 <0.0001 <0.0001 <0.00001 <0.0001 <0.00005 ND
Beaverhill Creek-AC2 Oct 25/06 6198061025002 <0.0001 <0.0001 <0.00005 <0.00005 <0.00001 <0.0002 <0.00004 <0.00002 <0.00001 <0.00005 <0.0001 <0.0001 <0.00001 <0.0001 <0.00005 ND AST2 Apr 30/07 6198070430001 <0.0001 <0.0001 <0.00005 <0.00005 <0.00001 <0.0002 <0.00004 <0.00002 <0.00001 <0.00005 <0.0001 <0.0001 <0.00001 <0.0001 <0.00005
AST3 Aug 29/06 6198060829003 0.0002 0.00016 0.00006 0.00006 <0.00001 <0.0002 <0.00004 0.00002 <0.00001 <0.00005 <0.0001 <0.0001 <0.00001 <0.0001 <0.00005 0.0005
Beaverhill Creek-AC3 Oct 25/06 6198061025003 0.00488 0.00078 0.00044 0.00054 <0.00001 <0.0002 0.00012 0.00008 <0.00001 <0.00005 <0.0001 <0.0001 <0.00001 <0.0001 <0.00005 0.0068 AST3 Apr 30/07 6198070430002 <0.0001 <0.0001 <0.00005 <0.00005 <0.00001 <0.0002 <0.00004 <0.00002 <0.00001 <0.00005 <0.0001 <0.0001 <0.00001 <0.0001 <0.00005
AST4 Aug 29/06 6198060829004 <0.0001 <0.0001 <0.00005 <0.00005 <0.00001 <0.0002 <0.00004 <0.00002 <0.00001 <0.00005 <0.0001 <0.0001 <0.00001 <0.0001 <0.00005 ND
Astotin Lake Oct 24/06 6198061024001 <0.0001 <0.0001 <0.00005 <0.00005 <0.00001 <0.0002 <0.00004 <0.00002 <0.00001 <0.00005 <0.0001 <0.0001 <0.00001 <0.0001 <0.00005 ND Astotin Lake Jan 24/07 6198070124004 <0.0001 <0.0001 <0.00005 <0.00005 <0.00001 <0.0002 <0.00004 <0.00002 <0.00001 <0.00005 <0.0001 <0.0001 <0.00001 <0.0001 <0.00005 ND
Astotin Lake dup Jan 24/07 6198070124005 <0.0001 <0.0001 <0.00005 <0.00005 <0.00001 <0.0002 <0.00004 <0.00002 <0.00001 <0.00005 <0.0001 <0.0001 <0.00001 <0.0001 <0.00005 ND AST4 May 2/07 6198070502006 <0.0001 <0.0001 <0.00005 <0.00005 <0.00001 <0.0002 <0.00004 <0.00002 <0.00001 <0.00005 <0.0001 <0.0001 <0.00001 <0.0001 <0.00005 ND
AST5 Aug 29/06 6198060829005 <0.0001 <0.0001 <0.00005 <0.00005 <0.00001 <0.0002 <0.00004 <0.00002 <0.00001 <0.00005 <0.0001 <0.0001 <0.00001 <0.0001 <0.00005 ND
Antler Lake Oct 25/06 6198061025004 <0.0001 <0.0001 <0.00005 <0.00005 <0.00001 <0.0002 <0.00004 <0.00002 <0.00001 <0.00005 <0.0001 <0.0001 <0.00001 <0.0001 <0.00005 ND Antler Lake Jan 23/07 6198070123003 <0.0001 <0.0001 <0.00005 <0.00005 <0.00001 <0.0002 <0.00004 0.000029 <0.00001 <0.00005 <0.0001 <0.0001 0.000019 <0.0001 <0.00005 0.000048
AST5 May 1/07 6198070501003 <0.0001 <0.0001 <0.00005 <0.00005 <0.00001 <0.0002 <0.00004 <0.00002 <0.00001 <0.00005 <0.0001 <0.0001 <0.00001 <0.0001 <0.00005 ND
AST6 Aug 30/06 6198060830006 <0.0001 <0.0001 <0.00005 <0.00005 <0.00001 <0.0002 <0.00004 <0.00002 <0.00001 <0.00005 <0.0001 <0.0001 <0.00001 <0.0001 <0.00005 ND North Sask River Oct 26/06 6198061026006 <0.0001 <0.0001 <0.00005 <0.00005 <0.00001 <0.0002 <0.00004 <0.00002 <0.00001 <0.00005 <0.0001 <0.0001 <0.00001 <0.0001 <0.00005 ND North Sask River Jan 23/07 6198070123002 <0.0001 <0.0001 <0.00005 <0.00005 <0.00001 <0.0002 <0.00004 <0.00002 <0.00001 <0.00005 <0.0001 <0.0001 <0.00001 <0.0001 <0.00005 ND

7B-2 December 2007 North American Upgrader Project Volume 3, Appendix 7B
NORTH AMERICAN OIL SANDS CORPORATION
Sam
ple
Dat
e
MSI
Sam
ple
Nap
htha
lene
Ace
naph
then
e
Fluo
rene
Phen
anth
rene
Ant
hrac
ene
Acr
idin
e
Fluo
rant
hene
Pyre
ne
Ben
z[a]
anth
race
ne
Chr
ysen
e
Ben
zo[b
&j]f
luor
anth
ene
Ben
zo[k
]fluo
rant
hene
Ben
zo[a
]pyr
ene
Inde
no[1
,2,3
-cd]
pyre
ne
Dib
enz[
a,h]
anth
race
ne
TOTA
L PA
H
Point Number mg/L mg/L mg/L mg/L mg/L mg/L mg/L mg/L mg/L mg/L mg/L mg/L mg/L mg/L mg/L mg/L North Sask River 1 May 3/07 6198070503008 <0.0001 <0.0001 <0.00005 <0.00005 <0.00001 <0.0002 <0.00004 <0.00002 <0.00001 <0.00005 <0.0001 <0.0001 <0.00001 <0.0001 <0.00005 ND
North Sask River 1 dup May 3/07 6198070503009 <0.0001 <0.0001 <0.00005 <0.00005 <0.00001 <0.0002 <0.00004 <0.00002 <0.00001 <0.00005 <0.0001 <0.0001 <0.00001 <0.0001 <0.00005 ND
Laboratory detection limit 0.0001 0.0001 0.00005 0.00005 0.0001 0.0002 0.00004 0.00002 0.00001 0.00005 0.0001 0.0001 0.00001 0.0001 0.00005 Canadian drinking water guidelines** NS NS NS NS NS NS NS NS NS NS NS NS 0.00001(MAC) NS NS
AENV Freshwater Aquatic Life* 0.0011^ 0.0058^ 0.003^ 0.0004^ 0.000012^ 0.0044^ 0.00004^ 0.000025^ 0.000018^ NS NS NS 0.000015^ NS NS AENV Agriculture - Irrigation* NS NS NS NS NS NS NS NS NS NS NS NS NS NS NS AENV Agriculture-Livestock* NS NS NS NS NS NS NS NS NS NS NS NS NS NS NS

7B-3 December 2007 North American Upgrader Project Volume 3, Appendix 7B
NORTH AMERICAN OIL SANDS CORPORATION
DISSOLVED HYDROCARBONS
Sample Sample MSI Sample Benzene Toluene Ethylbenzene Xylenes F1††C6-C10 F2 C>10-C16 B[a]P Point Date Number mg/L mg/L mg/L mg/L mg/L mg/L µg/L AST1 Aug 28/06 6198060828001 <0.0004 <0.0004 <0.0004 <0.0008 <0.1 <0.13 <0.00022
Beaverhill Creek-AC1 Oct 25/06 6198061025005 <0.0004 <0.0004 <0.0004 <0.0008 <0.1 <0.13 <0.00022 AST1 Jan 23/07 6198070123001 <0.0004 <0.0004 <0.0004 <0.0008 <0.1 <0.13 <0.00022 AST1 May 1/07 6198070501004 <0.0004 <0.0004 <0.0004 <0.0008 <0.1 <0.12 <0.00022
AST2 Aug 29/06 6198060829002 <0.0004 <0.0004 <0.0004 <0.0008 <0.1 <0.13 <0.00022
Beaverhill Creek-AC2 Oct 25/06 6198061025002 <0.0004 <0.0004 <0.0004 <0.0008 <0.1 <0.13 <0.00022 AST2 Apr 30/07 6198070430001 <0.0004 <0.0004 <0.0004 <0.0008 <0.1 <0.12 <0.00022
AST3 Aug 29/06 6198060829003 <0.0004 <0.0004 <0.0004 <0.0008 <0.1 <0.13 <0.00022
Beaverhill Creek-AC3 Oct 25/06 6198061025003 <0.0004 0.0015 <0.0004 <0.0008 <0.1 <0.13 <0.00022 AST3 Apr 30/07 6198070430002 <0.0004 <0.0004 <0.0004 <0.0008 <0.1 <0.12 <0.00022
AST4 Aug 29/06 6198060829004 <0.0004 <0.0004 <0.0004 <0.0008 <0.1 <0.13 <0.00022
Astotin Lake Oct 24/06 6198061024001 <0.0004 <0.0004 <0.0004 <0.0008 <0.1 --- <0.00022 Astotin Lake Jan 24/07 6198070124004 <0.0004 <0.0004 <0.0004 <0.0008 <0.1 <0.13 <0.00022
Astotin Lake dup Jan 24/07 6198070124005 <0.0004 <0.0004 <0.0004 <0.0008 <0.1 <0.13 <0.00022 AST4 May 2/07 6198070502006 <0.0004 <0.0004 <0.0004 <0.0008 <0.1 <0.12 <0.00022
AST5 Aug 29/06 6198060829005 <0.0004 <0.0004 <0.0004 <0.0008 <0.1 <0.13 <0.00022
Antler Lake Oct 25/06 6198061025004 <0.0004 <0.0004 <0.0004 <0.0008 <0.1 <0.13 <0.00022 Antler Lake Jan 23/07 6198070123003 <0.0004 <0.0004 <0.0004 <0.0008 <0.1 <0.13 0.0187
AST5 May 1/07 6198070501003 <0.0004 <0.0004 <0.0004 <0.0008 <0.1 <0.12 <0.00022
AST6 Aug 30/06 6198060830006 <0.0004 <0.0004 <0.0004 <0.0008 <0.1 <0.13 <0.00022 North Sask River Oct 26/06 6198061026006 <0.0004 <0.0004 <0.0004 <0.0008 <0.1 <0.13 <0.00022 North Sask River Jan 23/07 6198070123002 <0.0004 <0.0004 <0.0004 <0.0008 <0.1 <0.13 <0.00022
North Sask River 1 May 3/07 6198070503008 <0.0004 <0.0004 <0.0004 <0.0008 <0.1 <0.12 <0.00022
North Sask River 1 dup May 3/07 6198070503009 <0.0004 <0.0004 <0.0004 <0.0008 <0.1 <0.12 <0.00022 Laboratory detection limit 0.0004 0.0004 0.0004 0.0008 0.1 0.13 0.00022 CCME Water Quality Guidelines - Freshwater** 0.37 0.002 0.090 NS NS NS NS
Notes:
B[a]P - equivalent benzo[a]pyrene concentration NS - guideline not specified
** - Canadian Water Quality Guidelines for the Protection of Aquatic Life (CCME, 1999) ††
Italics - F1 excludes BTEX
- indicate values do not meet CCME Freshwater Aquatic Life criteria

North American Upgrader ProjectVolume 3, Appendix 7B
Page 7B-4 December 2007
Appendix 7B - Dissolved Hydrocarbons and PAHs in Water Samples from the 2006-2007 Field Studies
Sample Sample MSI Sample Benzene Toluene Ethylbenzene Xylenes F1††C6-C10 F2 C>10-C16 B[a]PPoint Date Number mg/L mg/L mg/L mg/L mg/L mg/L µg/L
AST1 Aug 28-06 6198060828001 <0.0004 <0.0004 <0.0004 <0.0008 <0.1 <0.13 <0.00022Beaverhill Creek-AC1 Oct 25-06 6198061025005 <0.0004 <0.0004 <0.0004 <0.0008 <0.1 <0.13 <0.00022AST1 Jan 23-07 6198070123001 <0.0004 <0.0004 <0.0004 <0.0008 <0.1 <0.13 <0.00022AST1 May 1-07 6198070501004 <0.0004 <0.0004 <0.0004 <0.0008 <0.1 <0.12 <0.00022
AST2 Aug 29-06 6198060829002 <0.0004 <0.0004 <0.0004 <0.0008 <0.1 <0.13 <0.00022Beaverhill Creek-AC2 Oct 25-06 6198061025002 <0.0004 <0.0004 <0.0004 <0.0008 <0.1 <0.13 <0.00022AST2 Apr 30-07 6198070430001 <0.0004 <0.0004 <0.0004 <0.0008 <0.1 <0.12 <0.00022
AST3 Aug 29-06 6198060829003 <0.0004 <0.0004 <0.0004 <0.0008 <0.1 <0.13 <0.00022Beaverhill Creek-AC3 Oct 25-06 6198061025003 <0.0004 0.0015 <0.0004 <0.0008 <0.1 <0.13 <0.00022AST3 Apr 30-07 6198070430002 <0.0004 <0.0004 <0.0004 <0.0008 <0.1 <0.12 <0.00022
AST4 Aug 29-06 6198060829004 <0.0004 <0.0004 <0.0004 <0.0008 <0.1 <0.13 <0.00022Astotin Lake Oct 24-06 6198061024001 <0.0004 <0.0004 <0.0004 <0.0008 <0.1 --- <0.00022Astotin Lake Jan 24-07 6198070124004 <0.0004 <0.0004 <0.0004 <0.0008 <0.1 <0.13 <0.00022Astotin Lake dup Jan 24-07 6198070124005 <0.0004 <0.0004 <0.0004 <0.0008 <0.1 <0.13 <0.00022AST4 May 2-07 6198070502006 <0.0004 <0.0004 <0.0004 <0.0008 <0.1 <0.12 <0.00022
AST5 Aug 29-06 6198060829005 <0.0004 <0.0004 <0.0004 <0.0008 <0.1 <0.13 <0.00022Antler Lake Oct 25-06 6198061025004 <0.0004 <0.0004 <0.0004 <0.0008 <0.1 <0.13 <0.00022Antler Lake Jan 23-07 6198070123003 <0.0004 <0.0004 <0.0004 <0.0008 <0.1 <0.13 0.0187AST5 May 1-07 6198070501003 <0.0004 <0.0004 <0.0004 <0.0008 <0.1 <0.12 <0.00022
AST6 Aug 30-06 6198060830006 <0.0004 <0.0004 <0.0004 <0.0008 <0.1 <0.13 <0.00022North Sask River Oct 26-06 6198061026006 <0.0004 <0.0004 <0.0004 <0.0008 <0.1 <0.13 <0.00022North Sask River Jan 23-07 6198070123002 <0.0004 <0.0004 <0.0004 <0.0008 <0.1 <0.13 <0.00022
North Sask River 1 May 3-07 6198070503008 <0.0004 <0.0004 <0.0004 <0.0008 <0.1 <0.12 <0.00022North Sask River 1 dup May 3-07 6198070503009 <0.0004 <0.0004 <0.0004 <0.0008 <0.1 <0.12 <0.00022Laboratory detection limit 0.0004 0.0004 0.0004 0.0008 0.1 0.13 0.00022CCME Water Quality Guidelines - Freshwater** 0.37 0.002 0.090 NS NS NS NS
Notes:B[a]P - equivalent benzo[a]pyrene concentration
NS - guideline not specified** - Canadian Water Quality Guidelines for the Protection of Aquatic Life (CCME, 1999)
†† - F1 excludes BTEXItalics - indicate values do not meet CCME Freshwater Aquatic Life criteria
NORTH AMERICANOIL SANDS CORPORATION

North American Upgrader ProjectVolume 3, Appendix 7B
Page 7B-5 December 2007
Appendix 7B - Dissolved Hydrocarbons and PAHs in Water Samples from the 2006-2007 Field Studies
Sample Date MSI Sample Nap
htha
lene
Ace
naph
then
e
Flu
oren
e
Phe
nant
hren
e
Ant
hrac
ene
Acr
idin
e
Flu
oran
then
e
Pyr
ene
Ben
z[a]
anth
race
ne
Chr
ysen
e
Ben
zo[b
&j]f
luor
anth
ene
Ben
zo[k
]fluo
rant
hene
Ben
zo[a
]pyr
ene
Ind
eno[
1,2,
3-cd
]pyr
ene
Dib
enz[
a,h]
anth
race
ne
TO
TAL
PAH
Point Number mg/L mg/L mg/L mg/L mg/L mg/L mg/L mg/L mg/L mg/L mg/L mg/L mg/L mg/L mg/L mg/LAST1 Aug 28-06 6198060828001 <0.0001 <0.0001 <0.00005 <0.00005 <0.00001 <0.0002 <0.00004 <0.00002 <0.00001 <0.00005 <0.0001 <0.0001 <0.00001 <0.0001 <0.00005 ND
Beaverhill Creek-AC1 Oct 25-06 6198061025005 <0.0001 <0.0001 <0.00005 <0.00005 <0.00001 <0.0002 <0.00004 <0.00002 <0.00001 <0.00005 <0.0001 <0.0001 <0.00001 <0.0001 <0.00005 NDAST1 Jan 23-07 6198070123001 <0.0001 <0.0001 <0.00005 <0.00005 <0.00001 <0.0002 <0.00004 <0.00002 <0.00001 <0.00005 <0.0001 <0.0001 <0.00001 <0.0001 <0.00005 NDAST1 May 1-07 6198070501004 <0.0001 <0.0001 <0.00005 <0.00005 <0.00001 <0.0002 <0.00004 <0.00002 <0.00001 <0.00005 <0.0001 <0.0001 <0.00001 <0.0001 <0.00005
AST2 Aug 29-06 6198060829002 <0.0001 <0.0001 <0.00005 <0.00005 <0.00001 <0.0002 <0.00004 <0.00002 <0.00001 <0.00005 <0.0001 <0.0001 <0.00001 <0.0001 <0.00005 NDBeaverhill Creek-AC2 Oct 25-06 6198061025002 <0.0001 <0.0001 <0.00005 <0.00005 <0.00001 <0.0002 <0.00004 <0.00002 <0.00001 <0.00005 <0.0001 <0.0001 <0.00001 <0.0001 <0.00005 ND
AST2 Apr 30-07 6198070430001 <0.0001 <0.0001 <0.00005 <0.00005 <0.00001 <0.0002 <0.00004 <0.00002 <0.00001 <0.00005 <0.0001 <0.0001 <0.00001 <0.0001 <0.00005
AST3 Aug 29-06 6198060829003 0.0002 0.00016 0.00006 0.00006 <0.00001 <0.0002 <0.00004 0.00002 <0.00001 <0.00005 <0.0001 <0.0001 <0.00001 <0.0001 <0.00005 0.0005Beaverhill Creek-AC3 Oct 25-06 6198061025003 0.00488 0.00078 0.00044 0.00054 <0.00001 <0.0002 0.00012 0.00008 <0.00001 <0.00005 <0.0001 <0.0001 <0.00001 <0.0001 <0.00005 0.0068
AST3 Apr 30-07 6198070430002 <0.0001 <0.0001 <0.00005 <0.00005 <0.00001 <0.0002 <0.00004 <0.00002 <0.00001 <0.00005 <0.0001 <0.0001 <0.00001 <0.0001 <0.00005
AST4 Aug 29-06 6198060829004 <0.0001 <0.0001 <0.00005 <0.00005 <0.00001 <0.0002 <0.00004 <0.00002 <0.00001 <0.00005 <0.0001 <0.0001 <0.00001 <0.0001 <0.00005 NDAstotin Lake Oct 24-06 6198061024001 <0.0001 <0.0001 <0.00005 <0.00005 <0.00001 <0.0002 <0.00004 <0.00002 <0.00001 <0.00005 <0.0001 <0.0001 <0.00001 <0.0001 <0.00005 NDAstotin Lake Jan 24-07 6198070124004 <0.0001 <0.0001 <0.00005 <0.00005 <0.00001 <0.0002 <0.00004 <0.00002 <0.00001 <0.00005 <0.0001 <0.0001 <0.00001 <0.0001 <0.00005 ND
Astotin Lake dup Jan 24-07 6198070124005 <0.0001 <0.0001 <0.00005 <0.00005 <0.00001 <0.0002 <0.00004 <0.00002 <0.00001 <0.00005 <0.0001 <0.0001 <0.00001 <0.0001 <0.00005 NDAST4 May 2-07 6198070502006 <0.0001 <0.0001 <0.00005 <0.00005 <0.00001 <0.0002 <0.00004 <0.00002 <0.00001 <0.00005 <0.0001 <0.0001 <0.00001 <0.0001 <0.00005 ND
AST5 Aug 29-06 6198060829005 <0.0001 <0.0001 <0.00005 <0.00005 <0.00001 <0.0002 <0.00004 <0.00002 <0.00001 <0.00005 <0.0001 <0.0001 <0.00001 <0.0001 <0.00005 NDAntler Lake Oct 25-06 6198061025004 <0.0001 <0.0001 <0.00005 <0.00005 <0.00001 <0.0002 <0.00004 <0.00002 <0.00001 <0.00005 <0.0001 <0.0001 <0.00001 <0.0001 <0.00005 NDAntler Lake Jan 23-07 6198070123003 <0.0001 <0.0001 <0.00005 <0.00005 <0.00001 <0.0002 <0.00004 0.000029 <0.00001 <0.00005 <0.0001 <0.0001 0.000019 <0.0001 <0.00005 0.000048
AST5 May 1-07 6198070501003 <0.0001 <0.0001 <0.00005 <0.00005 <0.00001 <0.0002 <0.00004 <0.00002 <0.00001 <0.00005 <0.0001 <0.0001 <0.00001 <0.0001 <0.00005 ND
AST6 Aug 30-06 6198060830006 <0.0001 <0.0001 <0.00005 <0.00005 <0.00001 <0.0002 <0.00004 <0.00002 <0.00001 <0.00005 <0.0001 <0.0001 <0.00001 <0.0001 <0.00005 NDNorth Sask River Oct 26-06 6198061026006 <0.0001 <0.0001 <0.00005 <0.00005 <0.00001 <0.0002 <0.00004 <0.00002 <0.00001 <0.00005 <0.0001 <0.0001 <0.00001 <0.0001 <0.00005 NDNorth Sask River Jan 23-07 6198070123002 <0.0001 <0.0001 <0.00005 <0.00005 <0.00001 <0.0002 <0.00004 <0.00002 <0.00001 <0.00005 <0.0001 <0.0001 <0.00001 <0.0001 <0.00005 ND
North Sask River 1 May 3-07 6198070503008 <0.0001 <0.0001 <0.00005 <0.00005 <0.00001 <0.0002 <0.00004 <0.00002 <0.00001 <0.00005 <0.0001 <0.0001 <0.00001 <0.0001 <0.00005 NDNorth Sask River 1 dup May 3-07 6198070503009 <0.0001 <0.0001 <0.00005 <0.00005 <0.00001 <0.0002 <0.00004 <0.00002 <0.00001 <0.00005 <0.0001 <0.0001 <0.00001 <0.0001 <0.00005 ND
Laboratory detection limit 0.0001 0.0001 0.00005 0.00005 0.0001 0.0002 0.00004 0.00002 0.00001 0.00005 0.0001 0.0001 0.00001 0.0001 0.00005 -Canadian drinking water guidelines** NS NS NS NS NS NS NS NS NS NS NS NS 0.00001(MAC) NS NSAENV Freshwater Aquatic Life* 0.0011^ 0.0058^ 0.003^ 0.0004^ 0.000012^ 0.0044^ 0.00004^ 0.000025^ 0.000018^ NS NS NS 0.000015^ NS NSAENV Agriculture - Irrigation* NS NS NS NS NS NS NS NS NS NS NS NS NS NS NSAENV Agriculture-Livestock* NS NS NS NS NS NS NS NS NS NS NS NS NS NS NS
Notes:NS - not specified
MAC - maximum acceptable concentration based on health effects^ - Canadian Water Quality Guidelines for the Protection of Aquatic Life (CCME, 2005)* - Alberta Environment Surface Water Quality Guidelines for use in Alberta (AENV, 1999)
** - Summary of Guidelines for Canadian Drinking Water Quality (Health Canada, 2004)Italics - indicates values do not meet drinking water guidelines
NORTH AMERICANOIL SANDS CORPORATION

7C-1 December 2007 North American Upgrader Project Volume 3, Appendix 7C
NORTH AMERICAN OIL SANDS CORPORATION
Appendix 7C - Results of CORMIX Modelling – 7Q10 Flow
----------------------------------------------------------------------------- CORMIX MIXING ZONE EXPERT SYSTEM
Subsystem CORMIX2: Multiport Diffuser Discharges CORMIX Version 5.0GT HYDRO2 Version 5.0.0.0 March 2007 ----------------------------------------------------------------------------- ----------------------------------------------------------------------------- CASE DESCRIPTION Site name/label: Sturgeon upgrader Design case: 7Q10 flows FILE NAME: \\S...\7Q10_run_North American_multiport_10_newflow.prd Time stamp: Wed Oct 31 16:25:27 2007 ENVIRONMENT PARAMETERS (metric units) Bounded section BS = 100.00 AS = 100.00 QA = 60.00 ICHREG= 1 HA = 1.00 HD = 1.30 UA = 0.600 F = 0.066 USTAR =0.5449E-01 UW = 2.000 UWSTAR=0.2198E-02 Uniform density environment STRCND= U RHOAM = 999.9750 DIFFUSER DISCHARGE PARAMETERS (metric units) Diffuser type: DITYPE= alternating_perpendicular BANK = RIGHT DISTB = 9.35 YB1 = 8.00 YB2 = 10.70 LD = 2.70 NOPEN = 10 SPAC = 0.30 D0 = 0.100 A0 = 0.008 H0 = 0.30 SUB0 = 1.00 Nozzle/port arrangement: near_vertical_discharge GAMMA = 90.00 THETA = 90.00 SIGMA = 0.00 BETA = 90.00 U0 = 1.127 Q0 = 0.089 =0.8850E-01 RHO0 = 997.2973 DRHO0 =0.2678E+01 GP0 =0.2626E-01 C0 =0.1000E+03 CUNITS= % IPOLL = 1 KS =0.0000E+00 KD =0.0000E+00 FLUX VARIABLES - PER UNIT DIFFUSER LENGTH (metric units) q0 =0.3278E-01 m0 =0.3693E-01 j0 =0.8607E-03 SIGNJ0= 1.0 Associated 2-d length scales (meters) lQ=B = 0.029 lM = 4.08 lm = 0.10 lmp = 99999.00 lbp = 99999.00 la = 99999.00 FLUX VARIABLES - ENTIRE DIFFUSER (metric units) Q0 =0.8850E-01 M0 =0.9972E-01 J0 =0.2324E-02 Associated 3-d length scales (meters) LQ = 0.09 LM = 3.68 Lm = 0.53 Lb = 0.01 Lmp = 99999.00 Lbp = 99999.00 NON-DIMENSIONAL PARAMETERS FR0 = 40.77 FRD0 = 21.99 R = 1.88 PL = 2. (slot) (port/nozzle) FLOW CLASSIFICATION

7C-2 December 2007 North American Upgrader Project Volume 3, Appendix 7C
NORTH AMERICAN OIL SANDS CORPORATION
222222222222222222222222222222222222222222 2 Flow class (CORMIX2) = MU8 2 2 Applicable layer depth HS = 1.30 2 222222222222222222222222222222222222222222 MIXING ZONE / TOXIC DILUTION / REGION OF INTEREST PARAMETERS C0 =0.1000E+03 CUNITS= % NTOX = 0 NSTD = 0 REGMZ = 1 REGSPC= 1 XREG = 1293.00 WREG = 0.00 AREG = 0.00 XINT = 20000.00 XMAX = 20000.00 X-Y-Z COORDINATE SYSTEM: ORIGIN is located at the bottom and the diffuser mid-point: 9.35 m from the RIGHT bank/shore. X-axis points downstream, Y-axis points to left, Z-axis points upward. NSTEP = 200 display intervals per module ----------------------------------------------------------------------------- ----------------------------------------------------------------------------- BEGIN MOD201: DIFFUSER DISCHARGE MODULE Due to complex near-field motions: EQUIVALENT SLOT DIFFUSER (2-D) GEOMETRY Profile definitions: BV = Gaussian 1/e (37%) half-width, in vertical plane normal to trajectory BH = top-hat half-width, in horizontal plane normal to trajectory S = hydrodynamic centerline dilution C = centerline concentration (includes reaction effects, if any) X Y Z S C BV BH 0.00 0.00 0.30 1.0 0.100E+03 0.02 1.35 END OF MOD201: DIFFUSER DISCHARGE MODULE ----------------------------------------------------------------------------- ----------------------------------------------------------------------------- BEGIN MOD277: UNSTABLE NEAR-FIELD ZONE OF ALTERNATING PERPENDICULAR DIFFUSER Because of the strong ambient current the diffuser plume of this crossflowing discharge gets RAPIDLY DEFLECTED. A near-field zone is formed that is VERTICALLY FULLY MIXED over the entire layer depth. Full mixing is achieved at a downstream distance of about five (5) layer depths. Profile definitions: BV = layer depth (vertically mixed) BH = top-hat half-width, measured horizontally in Y-direction S = hydrodynamic average (bulk) dilution C = average (bulk) concentration (includes reaction effects, if any) X Y Z S C BV BH 0.00 0.00 0.30 1.0 0.100E+03 0.02 1.35 0.03 0.00 0.30 2.6 0.382E+02 0.03 1.35 0.06 0.00 0.30 3.3 0.304E+02 0.04 1.35

7C-3 December 2007 North American Upgrader Project Volume 3, Appendix 7C
NORTH AMERICAN OIL SANDS CORPORATION
0.10 0.00 0.31 3.8 0.263E+02 0.04 1.35 0.13 0.00 0.31 4.2 0.236E+02 0.05 1.35 0.16 0.00 0.31 4.6 0.217E+02 0.06 1.35 0.19 0.00 0.31 5.0 0.202E+02 0.06 1.35 0.23 0.00 0.31 5.3 0.189E+02 0.07 1.35 0.26 0.00 0.31 5.6 0.179E+02 0.07 1.35 0.29 0.00 0.32 5.9 0.171E+02 0.08 1.35 0.32 0.00 0.32 6.1 0.164E+02 0.09 1.35 0.36 0.00 0.32 6.4 0.157E+02 0.09 1.35 0.39 0.00 0.32 6.6 0.151E+02 0.10 1.35 0.42 0.00 0.32 6.8 0.146E+02 0.11 1.35 0.45 0.00 0.32 7.1 0.142E+02 0.11 1.35 0.49 0.00 0.33 7.3 0.138E+02 0.12 1.35 0.52 0.00 0.33 7.5 0.134E+02 0.13 1.35 0.55 0.00 0.33 7.7 0.130E+02 0.13 1.35 0.59 0.00 0.33 7.9 0.127E+02 0.14 1.35 0.62 0.00 0.33 8.0 0.124E+02 0.14 1.35 0.65 0.00 0.34 8.2 0.121E+02 0.15 1.35 0.68 0.00 0.34 8.4 0.119E+02 0.16 1.35 0.72 0.00 0.34 8.6 0.116E+02 0.16 1.35 0.75 0.00 0.34 8.8 0.114E+02 0.17 1.35 0.78 0.00 0.34 8.9 0.112E+02 0.18 1.35 0.81 0.00 0.34 9.1 0.110E+02 0.18 1.35 0.85 0.00 0.35 9.2 0.108E+02 0.19 1.35 0.88 0.00 0.35 9.4 0.106E+02 0.20 1.35 0.91 0.00 0.35 9.6 0.105E+02 0.20 1.35 0.94 0.00 0.35 9.7 0.103E+02 0.21 1.35 0.98 0.00 0.35 9.9 0.101E+02 0.21 1.35 1.01 0.00 0.35 10.0 0.100E+02 0.22 1.35 1.04 0.00 0.36 10.1 0.985E+01 0.23 1.35 1.07 0.00 0.36 10.3 0.972E+01 0.23 1.35 1.11 0.00 0.36 10.4 0.959E+01 0.24 1.35 1.14 0.00 0.36 10.6 0.946E+01 0.25 1.35 1.17 0.00 0.36 10.7 0.934E+01 0.25 1.35 1.20 0.00 0.36 10.8 0.923E+01 0.26 1.35 1.24 0.00 0.37 11.0 0.912E+01 0.27 1.35 1.27 0.00 0.37 11.1 0.901E+01 0.27 1.35 1.30 0.00 0.37 11.2 0.891E+01 0.28 1.35 1.33 0.00 0.37 11.4 0.881E+01 0.28 1.35 1.37 0.00 0.37 11.5 0.871E+01 0.29 1.35 1.40 0.00 0.38 11.6 0.862E+01 0.30 1.35 1.43 0.00 0.38 11.7 0.853E+01 0.30 1.35 1.46 0.00 0.38 11.8 0.844E+01 0.31 1.35 1.50 0.00 0.38 12.0 0.836E+01 0.32 1.35 1.53 0.00 0.38 12.1 0.827E+01 0.32 1.35 1.56 0.00 0.38 12.2 0.819E+01 0.33 1.35 1.59 0.00 0.39 12.3 0.812E+01 0.34 1.35 1.63 0.00 0.39 12.4 0.804E+01 0.34 1.35 1.66 0.00 0.39 12.5 0.797E+01 0.35 1.35 1.69 0.00 0.39 12.7 0.790E+01 0.36 1.35 1.72 0.00 0.39 12.8 0.783E+01 0.36 1.35 1.76 0.00 0.39 12.9 0.776E+01 0.37 1.35 1.79 0.00 0.40 13.0 0.770E+01 0.37 1.35 1.82 0.00 0.40 13.1 0.763E+01 0.38 1.35

7C-4 December 2007 North American Upgrader Project Volume 3, Appendix 7C
NORTH AMERICAN OIL SANDS CORPORATION
1.85 0.00 0.40 13.2 0.757E+01 0.39 1.35 1.89 0.00 0.40 13.3 0.751E+01 0.39 1.35 1.92 0.00 0.40 13.4 0.745E+01 0.40 1.35 1.95 0.00 0.41 13.5 0.739E+01 0.41 1.35 1.98 0.00 0.41 13.6 0.734E+01 0.41 1.35 2.02 0.00 0.41 13.7 0.728E+01 0.42 1.35 2.05 0.00 0.41 13.8 0.723E+01 0.43 1.35 2.08 0.00 0.41 13.9 0.717E+01 0.43 1.35 2.11 0.00 0.41 14.0 0.712E+01 0.44 1.35 2.15 0.00 0.42 14.1 0.707E+01 0.44 1.35 2.18 0.00 0.42 14.2 0.702E+01 0.45 1.35 2.21 0.00 0.42 14.3 0.698E+01 0.46 1.35 2.24 0.00 0.42 14.4 0.693E+01 0.46 1.35 2.28 0.00 0.42 14.5 0.688E+01 0.47 1.35 2.31 0.00 0.42 14.6 0.684E+01 0.48 1.35 2.34 0.00 0.43 14.7 0.679E+01 0.48 1.35 2.37 0.00 0.43 14.8 0.675E+01 0.49 1.35 2.41 0.00 0.43 14.9 0.671E+01 0.50 1.35 2.44 0.00 0.43 15.0 0.666E+01 0.50 1.35 2.47 0.00 0.43 15.1 0.662E+01 0.51 1.35 2.50 0.00 0.43 15.2 0.658E+01 0.51 1.35 2.54 0.00 0.44 15.3 0.654E+01 0.52 1.35 2.57 0.00 0.44 15.4 0.650E+01 0.53 1.35 2.60 0.00 0.44 15.5 0.647E+01 0.53 1.35 2.63 0.00 0.44 15.6 0.643E+01 0.54 1.35 2.67 0.00 0.44 15.6 0.639E+01 0.55 1.35 2.70 0.00 0.45 15.7 0.636E+01 0.55 1.35 2.73 0.00 0.45 15.8 0.632E+01 0.56 1.35 2.76 0.00 0.45 15.9 0.629E+01 0.57 1.35 2.80 0.00 0.45 16.0 0.625E+01 0.57 1.35 2.83 0.00 0.45 16.1 0.622E+01 0.58 1.35 2.86 0.00 0.45 16.2 0.618E+01 0.58 1.35 2.89 0.00 0.46 16.3 0.615E+01 0.59 1.35 2.93 0.00 0.46 16.3 0.612E+01 0.60 1.35 2.96 0.00 0.46 16.4 0.609E+01 0.60 1.35 2.99 0.00 0.46 16.5 0.606E+01 0.61 1.35 3.02 0.00 0.46 16.6 0.603E+01 0.62 1.35 3.06 0.00 0.46 16.7 0.600E+01 0.62 1.35 3.09 0.00 0.47 16.8 0.597E+01 0.63 1.35 3.12 0.00 0.47 16.8 0.594E+01 0.64 1.35 3.15 0.00 0.47 16.9 0.591E+01 0.64 1.35 3.19 0.00 0.47 17.0 0.588E+01 0.65 1.35 3.22 0.00 0.47 17.1 0.585E+01 0.66 1.35 3.25 0.00 0.48 17.2 0.582E+01 0.66 1.35 3.28 0.00 0.48 17.3 0.580E+01 0.67 1.35 3.32 0.00 0.48 17.3 0.577E+01 0.67 1.35 3.35 0.00 0.48 17.4 0.574E+01 0.68 1.35 3.38 0.00 0.48 17.5 0.572E+01 0.69 1.35 3.41 0.00 0.48 17.6 0.569E+01 0.69 1.35 3.45 0.00 0.49 17.7 0.567E+01 0.70 1.35 3.48 0.00 0.49 17.7 0.564E+01 0.71 1.35 3.51 0.00 0.49 17.8 0.562E+01 0.71 1.35 3.54 0.00 0.49 17.9 0.559E+01 0.72 1.35 3.58 0.00 0.49 18.0 0.557E+01 0.73 1.35

7C-5 December 2007 North American Upgrader Project Volume 3, Appendix 7C
NORTH AMERICAN OIL SANDS CORPORATION
3.61 0.00 0.49 18.0 0.554E+01 0.73 1.35 3.64 0.00 0.50 18.1 0.552E+01 0.74 1.35 3.67 0.00 0.50 18.2 0.550E+01 0.74 1.35 3.71 0.00 0.50 18.3 0.547E+01 0.75 1.35 3.74 0.00 0.50 18.3 0.545E+01 0.76 1.35 3.77 0.00 0.50 18.4 0.543E+01 0.76 1.35 3.80 0.00 0.50 18.5 0.541E+01 0.77 1.35 3.84 0.00 0.51 18.6 0.539E+01 0.78 1.35 3.87 0.00 0.51 18.6 0.536E+01 0.78 1.35 3.90 0.00 0.51 18.7 0.534E+01 0.79 1.35 3.93 0.00 0.51 18.8 0.532E+01 0.80 1.35 3.97 0.00 0.51 18.9 0.530E+01 0.80 1.35 4.00 0.00 0.52 18.9 0.528E+01 0.81 1.35 4.03 0.00 0.52 19.0 0.526E+01 0.81 1.35 4.06 0.00 0.52 19.1 0.524E+01 0.82 1.35 4.10 0.00 0.52 19.2 0.522E+01 0.83 1.35 4.13 0.00 0.52 19.2 0.520E+01 0.83 1.35 4.16 0.00 0.52 19.3 0.518E+01 0.84 1.35 4.19 0.00 0.53 19.4 0.516E+01 0.85 1.35 4.23 0.00 0.53 19.4 0.514E+01 0.85 1.35 4.26 0.00 0.53 19.5 0.513E+01 0.86 1.35 4.29 0.00 0.53 19.6 0.511E+01 0.87 1.35 4.32 0.00 0.53 19.7 0.509E+01 0.87 1.35 4.36 0.00 0.53 19.7 0.507E+01 0.88 1.35 4.39 0.00 0.54 19.8 0.505E+01 0.89 1.35 4.42 0.00 0.54 19.9 0.504E+01 0.89 1.35 4.45 0.00 0.54 19.9 0.502E+01 0.90 1.35 4.49 0.00 0.54 20.0 0.500E+01 0.90 1.35 4.52 0.00 0.54 20.1 0.498E+01 0.91 1.35 4.55 0.00 0.54 20.1 0.497E+01 0.92 1.35 4.58 0.00 0.55 20.2 0.495E+01 0.92 1.35 4.61 0.00 0.55 20.3 0.493E+01 0.93 1.35 4.65 0.00 0.55 20.3 0.492E+01 0.94 1.35 4.68 0.00 0.55 20.4 0.490E+01 0.94 1.35 4.71 0.00 0.55 20.5 0.488E+01 0.95 1.35 4.74 0.00 0.56 20.5 0.487E+01 0.96 1.35 4.78 0.00 0.56 20.6 0.485E+01 0.96 1.35 4.81 0.00 0.56 20.7 0.484E+01 0.97 1.35 4.84 0.00 0.56 20.7 0.482E+01 0.97 1.35 4.87 0.00 0.56 20.8 0.481E+01 0.98 1.35 4.91 0.00 0.56 20.9 0.479E+01 0.99 1.35 4.94 0.00 0.57 20.9 0.478E+01 0.99 1.35 4.97 0.00 0.57 21.0 0.476E+01 1.00 1.35 5.00 0.00 0.57 21.1 0.475E+01 1.01 1.35 5.04 0.00 0.57 21.1 0.473E+01 1.01 1.35 5.07 0.00 0.57 21.2 0.472E+01 1.02 1.35 5.10 0.00 0.57 21.3 0.470E+01 1.03 1.35 5.13 0.00 0.58 21.3 0.469E+01 1.03 1.35 5.17 0.00 0.58 21.4 0.467E+01 1.04 1.35 5.20 0.00 0.58 21.5 0.466E+01 1.04 1.35 5.23 0.00 0.58 21.5 0.465E+01 1.05 1.35 5.26 0.00 0.58 21.6 0.463E+01 1.06 1.35 5.30 0.00 0.59 21.6 0.462E+01 1.06 1.35 5.33 0.00 0.59 21.7 0.461E+01 1.07 1.35

7C-6 December 2007 North American Upgrader Project Volume 3, Appendix 7C
NORTH AMERICAN OIL SANDS CORPORATION
5.36 0.00 0.59 21.8 0.459E+01 1.08 1.35 5.39 0.00 0.59 21.8 0.458E+01 1.08 1.35 5.43 0.00 0.59 21.9 0.457E+01 1.09 1.35 5.46 0.00 0.59 22.0 0.455E+01 1.10 1.35 5.49 0.00 0.60 22.0 0.454E+01 1.10 1.35 5.52 0.00 0.60 22.1 0.453E+01 1.11 1.35 5.56 0.00 0.60 22.1 0.452E+01 1.11 1.35 5.59 0.00 0.60 22.2 0.450E+01 1.12 1.35 5.62 0.00 0.60 22.3 0.449E+01 1.13 1.35 5.65 0.00 0.60 22.3 0.448E+01 1.13 1.35 5.69 0.00 0.61 22.4 0.447E+01 1.14 1.35 5.72 0.00 0.61 22.5 0.445E+01 1.15 1.35 5.75 0.00 0.61 22.5 0.444E+01 1.15 1.35 5.78 0.00 0.61 22.6 0.443E+01 1.16 1.35 5.82 0.00 0.61 22.6 0.442E+01 1.17 1.35 5.85 0.00 0.61 22.7 0.441E+01 1.17 1.35 5.88 0.00 0.62 22.8 0.439E+01 1.18 1.35 5.91 0.00 0.62 22.8 0.438E+01 1.19 1.35 5.95 0.00 0.62 22.9 0.437E+01 1.19 1.35 5.98 0.00 0.62 22.9 0.436E+01 1.20 1.35 6.01 0.00 0.62 23.0 0.435E+01 1.20 1.35 6.04 0.00 0.63 23.1 0.434E+01 1.21 1.35 6.08 0.00 0.63 23.1 0.433E+01 1.22 1.35 6.11 0.00 0.63 23.2 0.432E+01 1.22 1.35 6.14 0.00 0.63 23.2 0.430E+01 1.23 1.35 6.17 0.00 0.63 23.3 0.429E+01 1.24 1.35 6.21 0.00 0.63 23.4 0.428E+01 1.24 1.35 6.24 0.00 0.64 23.4 0.427E+01 1.25 1.35 6.27 0.00 0.64 23.5 0.426E+01 1.26 1.35 6.30 0.00 0.64 23.5 0.425E+01 1.26 1.35 6.34 0.00 0.64 23.6 0.424E+01 1.27 1.35 6.37 0.00 0.64 23.6 0.423E+01 1.27 1.35 6.40 0.00 0.64 23.7 0.422E+01 1.28 1.35 6.43 0.00 0.65 23.8 0.421E+01 1.29 1.35 6.47 0.00 0.65 23.8 0.420E+01 1.29 1.35 6.50 0.00 0.65 23.9 0.419E+01 1.30 1.35 Cumulative travel time = 21.5988 sec Plume centerline may exhibit slight discontinuities in transition to subsequent far-field module. END OF MOD277: UNSTABLE NEAR-FIELD ZONE OF ALTERNATING PERPENDICULAR DIFFUSER ----------------------------------------------------------------------------- ** End of NEAR-FIELD REGION (NFR) ** ----------------------------------------------------------------------------- BEGIN MOD241: BUOYANT AMBIENT SPREADING Discharge is non-buoyant or weakly buoyant. Therefore BUOYANT SPREADING REGIME is ABSENT. END OF MOD241: BUOYANT AMBIENT SPREADING ----------------------------------------------------------------------------- Due to the attachment or proximity of the plume tothe bottom, the bottom coordinate for the FAR-FIELD differs from the ambient depth, ZFB = 0 m. In a subsequent analysis set "depth at discharge" equal to "ambient depth".

7C-7 December 2007 North American Upgrader Project Volume 3, Appendix 7C
NORTH AMERICAN OIL SANDS CORPORATION
----------------------------------------------------------------------------- BEGIN MOD261: PASSIVE AMBIENT MIXING IN UNIFORM AMBIENT Vertical diffusivity (initial value) = 0.142E-01 m^2/s Horizontal diffusivity (initial value) = 0.177E-01 m^2/s Profile definitions: BV = Gaussian s.d.*sqrt(pi/2) (46%) thickness, measured vertically = or equal to layer depth, if fully mixed BH = Gaussian s.d.*sqrt(pi/2) (46%) half-width, measured horizontally in Y-direction ZU = upper plume boundary (Z-coordinate) ZL = lower plume boundary (Z-coordinate) S = hydrodynamic centerline dilution C = centerline concentration (includes reaction effects, if any) Plume Stage 1 (not bank attached): X Y Z S C BV BH ZU ZL 6.50 0.00 1.30 23.9 0.419E+01 1.30 1.35 1.30 0.00 Plume interacts with BOTTOM. The passive diffusion plume becomes VERTICALLY FULLY MIXED within this prediction interval. 11.12 0.00 1.30 26.5 0.377E+01 1.30 1.50 1.30 0.00 15.74 0.00 1.30 28.9 0.346E+01 1.30 1.64 1.30 0.00 20.36 0.00 1.30 31.1 0.321E+01 1.30 1.77 1.30 0.00 24.98 0.00 1.30 33.2 0.301E+01 1.30 1.88 1.30 0.00 29.60 0.00 1.30 35.1 0.285E+01 1.30 1.99 1.30 0.00 34.22 0.00 1.30 37.0 0.270E+01 1.30 2.10 1.30 0.00 38.84 0.00 1.30 38.7 0.258E+01 1.30 2.20 1.30 0.00 43.46 0.00 1.30 40.4 0.247E+01 1.30 2.29 1.30 0.00 48.09 0.00 1.30 42.0 0.238E+01 1.30 2.38 1.30 0.00 52.71 0.00 1.30 43.6 0.229E+01 1.30 2.47 1.30 0.00 57.33 0.00 1.30 45.1 0.222E+01 1.30 2.56 1.30 0.00 61.95 0.00 1.30 46.5 0.215E+01 1.30 2.64 1.30 0.00 66.57 0.00 1.30 47.9 0.209E+01 1.30 2.72 1.30 0.00 71.19 0.00 1.30 49.3 0.203E+01 1.30 2.80 1.30 0.00 75.81 0.00 1.30 50.6 0.197E+01 1.30 2.87 1.30 0.00 80.43 0.00 1.30 51.9 0.193E+01 1.30 2.95 1.30 0.00 85.05 0.00 1.30 53.2 0.188E+01 1.30 3.02 1.30 0.00 89.67 0.00 1.30 54.4 0.184E+01 1.30 3.09 1.30 0.00 94.29 0.00 1.30 55.6 0.180E+01 1.30 3.16 1.30 0.00 98.91 0.00 1.30 56.8 0.176E+01 1.30 3.22 1.30 0.00 103.53 0.00 1.30 58.0 0.172E+01 1.30 3.29 1.30 0.00 108.15 0.00 1.30 59.1 0.169E+01 1.30 3.35 1.30 0.00 112.77 0.00 1.30 60.2 0.166E+01 1.30 3.42 1.30 0.00 117.39 0.00 1.30 61.3 0.163E+01 1.30 3.48 1.30 0.00 122.01 0.00 1.30 62.4 0.160E+01 1.30 3.54 1.30 0.00 126.64 0.00 1.30 63.5 0.158E+01 1.30 3.60 1.30 0.00 131.26 0.00 1.30 64.5 0.155E+01 1.30 3.66 1.30 0.00 135.88 0.00 1.30 65.5 0.153E+01 1.30 3.72 1.30 0.00 140.50 0.00 1.30 66.5 0.150E+01 1.30 3.77 1.30 0.00 145.12 0.00 1.30 67.5 0.148E+01 1.30 3.83 1.30 0.00 149.74 0.00 1.30 68.5 0.146E+01 1.30 3.89 1.30 0.00 154.36 0.00 1.30 69.5 0.144E+01 1.30 3.94 1.30 0.00

7C-8 December 2007 North American Upgrader Project Volume 3, Appendix 7C
NORTH AMERICAN OIL SANDS CORPORATION
158.98 0.00 1.30 70.4 0.142E+01 1.30 3.99 1.30 0.00 163.60 0.00 1.30 71.3 0.140E+01 1.30 4.05 1.30 0.00 168.22 0.00 1.30 72.3 0.138E+01 1.30 4.10 1.30 0.00 172.84 0.00 1.30 73.2 0.137E+01 1.30 4.15 1.30 0.00 177.46 0.00 1.30 74.1 0.135E+01 1.30 4.20 1.30 0.00 182.08 0.00 1.30 75.0 0.133E+01 1.30 4.25 1.30 0.00 186.70 0.00 1.30 75.9 0.132E+01 1.30 4.30 1.30 0.00 191.32 0.00 1.30 76.7 0.130E+01 1.30 4.35 1.30 0.00 195.94 0.00 1.30 77.6 0.129E+01 1.30 4.40 1.30 0.00 200.57 0.00 1.30 78.5 0.127E+01 1.30 4.45 1.30 0.00 205.19 0.00 1.30 79.3 0.126E+01 1.30 4.50 1.30 0.00 209.81 0.00 1.30 80.1 0.125E+01 1.30 4.55 1.30 0.00 214.43 0.00 1.30 81.0 0.124E+01 1.30 4.59 1.30 0.00 219.05 0.00 1.30 81.8 0.122E+01 1.30 4.64 1.30 0.00 223.67 0.00 1.30 82.6 0.121E+01 1.30 4.68 1.30 0.00 228.29 0.00 1.30 83.4 0.120E+01 1.30 4.73 1.30 0.00 232.91 0.00 1.30 84.2 0.119E+01 1.30 4.78 1.30 0.00 237.53 0.00 1.30 85.0 0.118E+01 1.30 4.82 1.30 0.00 242.15 0.00 1.30 85.7 0.117E+01 1.30 4.86 1.30 0.00 246.77 0.00 1.30 86.5 0.116E+01 1.30 4.91 1.30 0.00 251.39 0.00 1.30 87.3 0.115E+01 1.30 4.95 1.30 0.00 256.01 0.00 1.30 88.0 0.114E+01 1.30 4.99 1.30 0.00 260.63 0.00 1.30 88.8 0.113E+01 1.30 5.04 1.30 0.00 265.25 0.00 1.30 89.5 0.112E+01 1.30 5.08 1.30 0.00 269.87 0.00 1.30 90.3 0.111E+01 1.30 5.12 1.30 0.00 274.49 0.00 1.30 91.0 0.110E+01 1.30 5.16 1.30 0.00 279.12 0.00 1.30 91.7 0.109E+01 1.30 5.20 1.30 0.00 283.74 0.00 1.30 92.5 0.108E+01 1.30 5.25 1.30 0.00 288.36 0.00 1.30 93.2 0.107E+01 1.30 5.29 1.30 0.00 292.98 0.00 1.30 93.9 0.107E+01 1.30 5.33 1.30 0.00 297.60 0.00 1.30 94.6 0.106E+01 1.30 5.37 1.30 0.00 302.22 0.00 1.30 95.3 0.105E+01 1.30 5.41 1.30 0.00 306.84 0.00 1.30 96.0 0.104E+01 1.30 5.45 1.30 0.00 311.46 0.00 1.30 96.7 0.103E+01 1.30 5.48 1.30 0.00 316.08 0.00 1.30 97.4 0.103E+01 1.30 5.52 1.30 0.00 320.70 0.00 1.30 98.0 0.102E+01 1.30 5.56 1.30 0.00 325.32 0.00 1.30 98.7 0.101E+01 1.30 5.60 1.30 0.00 329.94 0.00 1.30 99.4 0.101E+01 1.30 5.64 1.30 0.00 334.56 0.00 1.30 100.1 0.999E+00 1.30 5.68 1.30 0.00 339.18 0.00 1.30 100.7 0.993E+00 1.30 5.71 1.30 0.00 343.80 0.00 1.30 101.4 0.986E+00 1.30 5.75 1.30 0.00 348.42 0.00 1.30 102.0 0.980E+00 1.30 5.79 1.30 0.00 353.05 0.00 1.30 102.7 0.974E+00 1.30 5.82 1.30 0.00 357.67 0.00 1.30 103.3 0.968E+00 1.30 5.86 1.30 0.00 362.29 0.00 1.30 104.0 0.962E+00 1.30 5.90 1.30 0.00 366.91 0.00 1.30 104.6 0.956E+00 1.30 5.93 1.30 0.00 371.53 0.00 1.30 105.2 0.950E+00 1.30 5.97 1.30 0.00 376.15 0.00 1.30 105.9 0.945E+00 1.30 6.01 1.30 0.00 380.77 0.00 1.30 106.5 0.939E+00 1.30 6.04 1.30 0.00 385.39 0.00 1.30 107.1 0.934E+00 1.30 6.08 1.30 0.00 390.01 0.00 1.30 107.7 0.928E+00 1.30 6.11 1.30 0.00 394.63 0.00 1.30 108.3 0.923E+00 1.30 6.15 1.30 0.00 399.25 0.00 1.30 109.0 0.918E+00 1.30 6.18 1.30 0.00

7C-9 December 2007 North American Upgrader Project Volume 3, Appendix 7C
NORTH AMERICAN OIL SANDS CORPORATION
403.87 0.00 1.30 109.6 0.913E+00 1.30 6.22 1.30 0.00 408.49 0.00 1.30 110.2 0.908E+00 1.30 6.25 1.30 0.00 413.11 0.00 1.30 110.8 0.903E+00 1.30 6.28 1.30 0.00 417.73 0.00 1.30 111.4 0.898E+00 1.30 6.32 1.30 0.00 422.35 0.00 1.30 112.0 0.893E+00 1.30 6.35 1.30 0.00 426.97 0.00 1.30 112.6 0.888E+00 1.30 6.39 1.30 0.00 431.60 0.00 1.30 113.2 0.884E+00 1.30 6.42 1.30 0.00 436.22 0.00 1.30 113.7 0.879E+00 1.30 6.45 1.30 0.00 440.84 0.00 1.30 114.3 0.875E+00 1.30 6.49 1.30 0.00 445.46 0.00 1.30 114.9 0.870E+00 1.30 6.52 1.30 0.00 450.08 0.00 1.30 115.5 0.866E+00 1.30 6.55 1.30 0.00 454.70 0.00 1.30 116.1 0.862E+00 1.30 6.58 1.30 0.00 459.32 0.00 1.30 116.6 0.857E+00 1.30 6.62 1.30 0.00 463.94 0.00 1.30 117.2 0.853E+00 1.30 6.65 1.30 0.00 468.56 0.00 1.30 117.8 0.849E+00 1.30 6.68 1.30 0.00 473.18 0.00 1.30 118.3 0.845E+00 1.30 6.71 1.30 0.00 477.80 0.00 1.30 118.9 0.841E+00 1.30 6.74 1.30 0.00 482.42 0.00 1.30 119.4 0.837E+00 1.30 6.78 1.30 0.00 487.04 0.00 1.30 120.0 0.833E+00 1.30 6.81 1.30 0.00 491.66 0.00 1.30 120.5 0.830E+00 1.30 6.84 1.30 0.00 496.28 0.00 1.30 121.1 0.826E+00 1.30 6.87 1.30 0.00 500.90 0.00 1.30 121.6 0.822E+00 1.30 6.90 1.30 0.00 505.53 0.00 1.30 122.2 0.818E+00 1.30 6.93 1.30 0.00 510.15 0.00 1.30 122.7 0.815E+00 1.30 6.96 1.30 0.00 514.77 0.00 1.30 123.3 0.811E+00 1.30 6.99 1.30 0.00 519.39 0.00 1.30 123.8 0.808E+00 1.30 7.02 1.30 0.00 524.01 0.00 1.30 124.3 0.804E+00 1.30 7.05 1.30 0.00 528.63 0.00 1.30 124.9 0.801E+00 1.30 7.08 1.30 0.00 533.25 0.00 1.30 125.4 0.797E+00 1.30 7.11 1.30 0.00 537.87 0.00 1.30 125.9 0.794E+00 1.30 7.14 1.30 0.00 542.49 0.00 1.30 126.5 0.791E+00 1.30 7.17 1.30 0.00 547.11 0.00 1.30 127.0 0.787E+00 1.30 7.20 1.30 0.00 551.73 0.00 1.30 127.5 0.784E+00 1.30 7.23 1.30 0.00 556.35 0.00 1.30 128.0 0.781E+00 1.30 7.26 1.30 0.00 560.97 0.00 1.30 128.6 0.778E+00 1.30 7.29 1.30 0.00 565.59 0.00 1.30 129.1 0.775E+00 1.30 7.32 1.30 0.00 570.21 0.00 1.30 129.6 0.772E+00 1.30 7.35 1.30 0.00 574.83 0.00 1.30 130.1 0.769E+00 1.30 7.38 1.30 0.00 579.45 0.00 1.30 130.6 0.766E+00 1.30 7.41 1.30 0.00 584.08 0.00 1.30 131.1 0.763E+00 1.30 7.44 1.30 0.00 588.70 0.00 1.30 131.6 0.760E+00 1.30 7.47 1.30 0.00 593.32 0.00 1.30 132.1 0.757E+00 1.30 7.50 1.30 0.00 597.94 0.00 1.30 132.6 0.754E+00 1.30 7.52 1.30 0.00 602.56 0.00 1.30 133.1 0.751E+00 1.30 7.55 1.30 0.00 607.18 0.00 1.30 133.6 0.748E+00 1.30 7.58 1.30 0.00 611.80 0.00 1.30 134.1 0.746E+00 1.30 7.61 1.30 0.00 616.42 0.00 1.30 134.6 0.743E+00 1.30 7.64 1.30 0.00 621.04 0.00 1.30 135.1 0.740E+00 1.30 7.66 1.30 0.00 625.66 0.00 1.30 135.6 0.737E+00 1.30 7.69 1.30 0.00 630.28 0.00 1.30 136.1 0.735E+00 1.30 7.72 1.30 0.00 634.90 0.00 1.30 136.6 0.732E+00 1.30 7.75 1.30 0.00 639.52 0.00 1.30 137.1 0.730E+00 1.30 7.78 1.30 0.00 644.14 0.00 1.30 137.5 0.727E+00 1.30 7.80 1.30 0.00 648.76 0.00 1.30 138.0 0.724E+00 1.30 7.83 1.30 0.00

7C-10 December 2007 North American Upgrader Project Volume 3, Appendix 7C
NORTH AMERICAN OIL SANDS CORPORATION
653.38 0.00 1.30 138.5 0.722E+00 1.30 7.86 1.30 0.00 658.01 0.00 1.30 139.0 0.719E+00 1.30 7.89 1.30 0.00 662.63 0.00 1.30 139.5 0.717E+00 1.30 7.91 1.30 0.00 667.25 0.00 1.30 139.9 0.715E+00 1.30 7.94 1.30 0.00 671.87 0.00 1.30 140.4 0.712E+00 1.30 7.97 1.30 0.00 676.49 0.00 1.30 140.9 0.710E+00 1.30 7.99 1.30 0.00 681.11 0.00 1.30 141.4 0.707E+00 1.30 8.02 1.30 0.00 685.73 0.00 1.30 141.8 0.705E+00 1.30 8.05 1.30 0.00 690.35 0.00 1.30 142.3 0.703E+00 1.30 8.07 1.30 0.00 694.97 0.00 1.30 142.8 0.700E+00 1.30 8.10 1.30 0.00 699.59 0.00 1.30 143.2 0.698E+00 1.30 8.13 1.30 0.00 704.21 0.00 1.30 143.7 0.696E+00 1.30 8.15 1.30 0.00 708.83 0.00 1.30 144.2 0.694E+00 1.30 8.18 1.30 0.00 713.45 0.00 1.30 144.6 0.691E+00 1.30 8.20 1.30 0.00 718.07 0.00 1.30 145.1 0.689E+00 1.30 8.23 1.30 0.00 722.69 0.00 1.30 145.5 0.687E+00 1.30 8.26 1.30 0.00 727.31 0.00 1.30 146.0 0.685E+00 1.30 8.28 1.30 0.00 731.93 0.00 1.30 146.4 0.683E+00 1.30 8.31 1.30 0.00 736.56 0.00 1.30 146.9 0.681E+00 1.30 8.33 1.30 0.00 741.18 0.00 1.30 147.3 0.679E+00 1.30 8.36 1.30 0.00 745.80 0.00 1.30 147.8 0.677E+00 1.30 8.38 1.30 0.00 750.42 0.00 1.30 148.2 0.675E+00 1.30 8.41 1.30 0.00 755.04 0.00 1.30 148.7 0.673E+00 1.30 8.44 1.30 0.00 759.66 0.00 1.30 149.1 0.670E+00 1.30 8.46 1.30 0.00 764.28 0.00 1.30 149.6 0.669E+00 1.30 8.49 1.30 0.00 768.90 0.00 1.30 150.0 0.667E+00 1.30 8.51 1.30 0.00 773.52 0.00 1.30 150.5 0.665E+00 1.30 8.54 1.30 0.00 778.14 0.00 1.30 150.9 0.663E+00 1.30 8.56 1.30 0.00 782.76 0.00 1.30 151.4 0.661E+00 1.30 8.59 1.30 0.00 787.38 0.00 1.30 151.8 0.659E+00 1.30 8.61 1.30 0.00 792.00 0.00 1.30 152.2 0.657E+00 1.30 8.64 1.30 0.00 796.62 0.00 1.30 152.7 0.655E+00 1.30 8.66 1.30 0.00 801.24 0.00 1.30 153.1 0.653E+00 1.30 8.69 1.30 0.00 805.86 0.00 1.30 153.5 0.651E+00 1.30 8.71 1.30 0.00 810.49 0.00 1.30 154.0 0.649E+00 1.30 8.73 1.30 0.00 815.11 0.00 1.30 154.4 0.648E+00 1.30 8.76 1.30 0.00 819.73 0.00 1.30 154.8 0.646E+00 1.30 8.78 1.30 0.00 824.35 0.00 1.30 155.3 0.644E+00 1.30 8.81 1.30 0.00 828.97 0.00 1.30 155.7 0.642E+00 1.30 8.83 1.30 0.00 833.59 0.00 1.30 156.1 0.641E+00 1.30 8.86 1.30 0.00 838.21 0.00 1.30 156.5 0.639E+00 1.30 8.88 1.30 0.00 842.83 0.00 1.30 157.0 0.637E+00 1.30 8.90 1.30 0.00 847.45 0.00 1.30 157.4 0.635E+00 1.30 8.93 1.30 0.00 852.07 0.00 1.30 157.8 0.634E+00 1.30 8.95 1.30 0.00 856.69 0.00 1.30 158.2 0.632E+00 1.30 8.98 1.30 0.00 861.31 0.00 1.30 158.6 0.630E+00 1.30 9.00 1.30 0.00 865.93 0.00 1.30 159.1 0.629E+00 1.30 9.02 1.30 0.00 870.55 0.00 1.30 159.5 0.627E+00 1.30 9.05 1.30 0.00 875.17 0.00 1.30 159.9 0.625E+00 1.30 9.07 1.30 0.00 879.79 0.00 1.30 160.3 0.624E+00 1.30 9.09 1.30 0.00 884.41 0.00 1.30 160.7 0.622E+00 1.30 9.12 1.30 0.00 889.04 0.00 1.30 161.1 0.621E+00 1.30 9.14 1.30 0.00 893.66 0.00 1.30 161.6 0.619E+00 1.30 9.17 1.30 0.00 898.28 0.00 1.30 162.0 0.617E+00 1.30 9.19 1.30 0.00
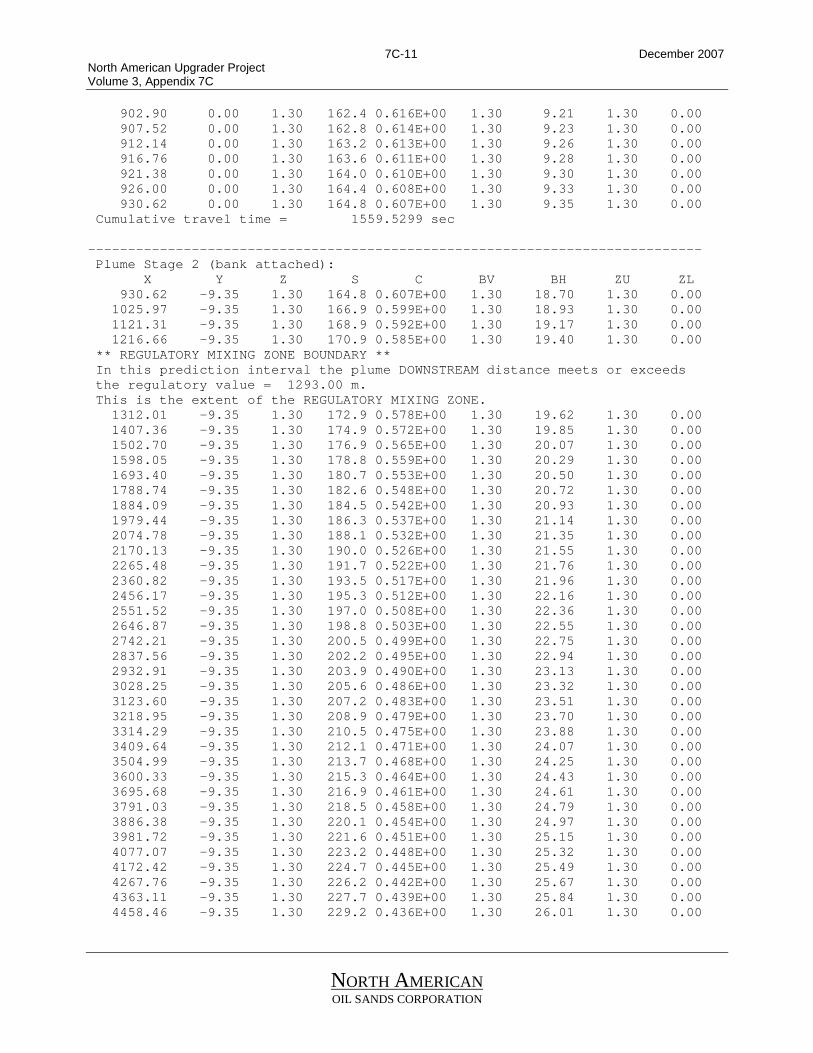
7C-11 December 2007 North American Upgrader Project Volume 3, Appendix 7C
NORTH AMERICAN OIL SANDS CORPORATION
902.90 0.00 1.30 162.4 0.616E+00 1.30 9.21 1.30 0.00 907.52 0.00 1.30 162.8 0.614E+00 1.30 9.23 1.30 0.00 912.14 0.00 1.30 163.2 0.613E+00 1.30 9.26 1.30 0.00 916.76 0.00 1.30 163.6 0.611E+00 1.30 9.28 1.30 0.00 921.38 0.00 1.30 164.0 0.610E+00 1.30 9.30 1.30 0.00 926.00 0.00 1.30 164.4 0.608E+00 1.30 9.33 1.30 0.00 930.62 0.00 1.30 164.8 0.607E+00 1.30 9.35 1.30 0.00 Cumulative travel time = 1559.5299 sec ----------------------------------------------------------------------------- Plume Stage 2 (bank attached): X Y Z S C BV BH ZU ZL 930.62 -9.35 1.30 164.8 0.607E+00 1.30 18.70 1.30 0.00 1025.97 -9.35 1.30 166.9 0.599E+00 1.30 18.93 1.30 0.00 1121.31 -9.35 1.30 168.9 0.592E+00 1.30 19.17 1.30 0.00 1216.66 -9.35 1.30 170.9 0.585E+00 1.30 19.40 1.30 0.00 ** REGULATORY MIXING ZONE BOUNDARY ** In this prediction interval the plume DOWNSTREAM distance meets or exceeds the regulatory value = 1293.00 m. This is the extent of the REGULATORY MIXING ZONE. 1312.01 -9.35 1.30 172.9 0.578E+00 1.30 19.62 1.30 0.00 1407.36 -9.35 1.30 174.9 0.572E+00 1.30 19.85 1.30 0.00 1502.70 -9.35 1.30 176.9 0.565E+00 1.30 20.07 1.30 0.00 1598.05 -9.35 1.30 178.8 0.559E+00 1.30 20.29 1.30 0.00 1693.40 -9.35 1.30 180.7 0.553E+00 1.30 20.50 1.30 0.00 1788.74 -9.35 1.30 182.6 0.548E+00 1.30 20.72 1.30 0.00 1884.09 -9.35 1.30 184.5 0.542E+00 1.30 20.93 1.30 0.00 1979.44 -9.35 1.30 186.3 0.537E+00 1.30 21.14 1.30 0.00 2074.78 -9.35 1.30 188.1 0.532E+00 1.30 21.35 1.30 0.00 2170.13 -9.35 1.30 190.0 0.526E+00 1.30 21.55 1.30 0.00 2265.48 -9.35 1.30 191.7 0.522E+00 1.30 21.76 1.30 0.00 2360.82 -9.35 1.30 193.5 0.517E+00 1.30 21.96 1.30 0.00 2456.17 -9.35 1.30 195.3 0.512E+00 1.30 22.16 1.30 0.00 2551.52 -9.35 1.30 197.0 0.508E+00 1.30 22.36 1.30 0.00 2646.87 -9.35 1.30 198.8 0.503E+00 1.30 22.55 1.30 0.00 2742.21 -9.35 1.30 200.5 0.499E+00 1.30 22.75 1.30 0.00 2837.56 -9.35 1.30 202.2 0.495E+00 1.30 22.94 1.30 0.00 2932.91 -9.35 1.30 203.9 0.490E+00 1.30 23.13 1.30 0.00 3028.25 -9.35 1.30 205.6 0.486E+00 1.30 23.32 1.30 0.00 3123.60 -9.35 1.30 207.2 0.483E+00 1.30 23.51 1.30 0.00 3218.95 -9.35 1.30 208.9 0.479E+00 1.30 23.70 1.30 0.00 3314.29 -9.35 1.30 210.5 0.475E+00 1.30 23.88 1.30 0.00 3409.64 -9.35 1.30 212.1 0.471E+00 1.30 24.07 1.30 0.00 3504.99 -9.35 1.30 213.7 0.468E+00 1.30 24.25 1.30 0.00 3600.33 -9.35 1.30 215.3 0.464E+00 1.30 24.43 1.30 0.00 3695.68 -9.35 1.30 216.9 0.461E+00 1.30 24.61 1.30 0.00 3791.03 -9.35 1.30 218.5 0.458E+00 1.30 24.79 1.30 0.00 3886.38 -9.35 1.30 220.1 0.454E+00 1.30 24.97 1.30 0.00 3981.72 -9.35 1.30 221.6 0.451E+00 1.30 25.15 1.30 0.00 4077.07 -9.35 1.30 223.2 0.448E+00 1.30 25.32 1.30 0.00 4172.42 -9.35 1.30 224.7 0.445E+00 1.30 25.49 1.30 0.00 4267.76 -9.35 1.30 226.2 0.442E+00 1.30 25.67 1.30 0.00 4363.11 -9.35 1.30 227.7 0.439E+00 1.30 25.84 1.30 0.00 4458.46 -9.35 1.30 229.2 0.436E+00 1.30 26.01 1.30 0.00

7C-12 December 2007 North American Upgrader Project Volume 3, Appendix 7C
NORTH AMERICAN OIL SANDS CORPORATION
4553.80 -9.35 1.30 230.7 0.433E+00 1.30 26.18 1.30 0.00 4649.15 -9.35 1.30 232.2 0.431E+00 1.30 26.35 1.30 0.00 4744.50 -9.35 1.30 233.7 0.428E+00 1.30 26.51 1.30 0.00 4839.84 -9.35 1.30 235.1 0.425E+00 1.30 26.68 1.30 0.00 4935.19 -9.35 1.30 236.6 0.423E+00 1.30 26.84 1.30 0.00 5030.54 -9.35 1.30 238.0 0.420E+00 1.30 27.01 1.30 0.00 5125.88 -9.35 1.30 239.5 0.418E+00 1.30 27.17 1.30 0.00 5221.23 -9.35 1.30 240.9 0.415E+00 1.30 27.33 1.30 0.00 5316.58 -9.35 1.30 242.3 0.413E+00 1.30 27.49 1.30 0.00 5411.92 -9.35 1.30 243.7 0.410E+00 1.30 27.65 1.30 0.00 5507.27 -9.35 1.30 245.1 0.408E+00 1.30 27.81 1.30 0.00 5602.62 -9.35 1.30 246.5 0.406E+00 1.30 27.97 1.30 0.00 5697.96 -9.35 1.30 247.9 0.403E+00 1.30 28.13 1.30 0.00 5793.31 -9.35 1.30 249.3 0.401E+00 1.30 28.29 1.30 0.00 5888.66 -9.35 1.30 250.7 0.399E+00 1.30 28.44 1.30 0.00 5984.00 -9.35 1.30 252.0 0.397E+00 1.30 28.60 1.30 0.00 6079.35 -9.35 1.30 253.4 0.395E+00 1.30 28.75 1.30 0.00 6174.70 -9.35 1.30 254.7 0.393E+00 1.30 28.90 1.30 0.00 6270.04 -9.35 1.30 256.1 0.391E+00 1.30 29.06 1.30 0.00 6365.39 -9.35 1.30 257.4 0.388E+00 1.30 29.21 1.30 0.00 6460.74 -9.35 1.30 258.7 0.386E+00 1.30 29.36 1.30 0.00 6556.08 -9.35 1.30 260.1 0.385E+00 1.30 29.51 1.30 0.00 6651.43 -9.35 1.30 261.4 0.383E+00 1.30 29.66 1.30 0.00 6746.78 -9.35 1.30 262.7 0.381E+00 1.30 29.81 1.30 0.00 6842.12 -9.35 1.30 264.0 0.379E+00 1.30 29.95 1.30 0.00 6937.47 -9.35 1.30 265.3 0.377E+00 1.30 30.10 1.30 0.00 7032.82 -9.35 1.30 266.6 0.375E+00 1.30 30.25 1.30 0.00 7128.16 -9.35 1.30 267.9 0.373E+00 1.30 30.39 1.30 0.00 7223.51 -9.35 1.30 269.1 0.372E+00 1.30 30.54 1.30 0.00 7318.86 -9.35 1.30 270.4 0.370E+00 1.30 30.68 1.30 0.00 7414.20 -9.35 1.30 271.7 0.368E+00 1.30 30.82 1.30 0.00 7509.55 -9.35 1.30 272.9 0.366E+00 1.30 30.97 1.30 0.00 7604.90 -9.35 1.30 274.2 0.365E+00 1.30 31.11 1.30 0.00 7700.24 -9.35 1.30 275.4 0.363E+00 1.30 31.25 1.30 0.00 7795.59 -9.35 1.30 276.7 0.361E+00 1.30 31.39 1.30 0.00 7890.94 -9.35 1.30 277.9 0.360E+00 1.30 31.53 1.30 0.00 7986.28 -9.35 1.30 279.1 0.358E+00 1.30 31.67 1.30 0.00 8081.63 -9.35 1.30 280.4 0.357E+00 1.30 31.81 1.30 0.00 8176.98 -9.35 1.30 281.6 0.355E+00 1.30 31.95 1.30 0.00 8272.32 -9.35 1.30 282.8 0.354E+00 1.30 32.09 1.30 0.00 8367.67 -9.35 1.30 284.0 0.352E+00 1.30 32.23 1.30 0.00 8463.02 -9.35 1.30 285.2 0.351E+00 1.30 32.36 1.30 0.00 8558.36 -9.35 1.30 286.4 0.349E+00 1.30 32.50 1.30 0.00 8653.71 -9.35 1.30 287.6 0.348E+00 1.30 32.63 1.30 0.00 8749.06 -9.35 1.30 288.8 0.346E+00 1.30 32.77 1.30 0.00 8844.40 -9.35 1.30 290.0 0.345E+00 1.30 32.90 1.30 0.00 8939.75 -9.35 1.30 291.2 0.343E+00 1.30 33.04 1.30 0.00 9035.10 -9.35 1.30 292.4 0.342E+00 1.30 33.17 1.30 0.00 9130.44 -9.35 1.30 293.5 0.341E+00 1.30 33.30 1.30 0.00 9225.79 -9.35 1.30 294.7 0.339E+00 1.30 33.44 1.30 0.00 9321.14 -9.35 1.30 295.9 0.338E+00 1.30 33.57 1.30 0.00 9416.48 -9.35 1.30 297.0 0.337E+00 1.30 33.70 1.30 0.00 9511.83 -9.35 1.30 298.2 0.335E+00 1.30 33.83 1.30 0.00 9607.18 -9.35 1.30 299.3 0.334E+00 1.30 33.96 1.30 0.00

7C-13 December 2007 North American Upgrader Project Volume 3, Appendix 7C
NORTH AMERICAN OIL SANDS CORPORATION
9702.52 -9.35 1.30 300.5 0.333E+00 1.30 34.09 1.30 0.00 9797.87 -9.35 1.30 301.6 0.332E+00 1.30 34.22 1.30 0.00 9893.22 -9.35 1.30 302.7 0.330E+00 1.30 34.35 1.30 0.00 9988.56 -9.35 1.30 303.9 0.329E+00 1.30 34.48 1.30 0.00 10083.91 -9.35 1.30 305.0 0.328E+00 1.30 34.60 1.30 0.00 10179.26 -9.35 1.30 306.1 0.327E+00 1.30 34.73 1.30 0.00 10274.60 -9.35 1.30 307.2 0.325E+00 1.30 34.86 1.30 0.00 10369.95 -9.35 1.30 308.3 0.324E+00 1.30 34.98 1.30 0.00 10465.30 -9.35 1.30 309.4 0.323E+00 1.30 35.11 1.30 0.00 10560.64 -9.35 1.30 310.6 0.322E+00 1.30 35.24 1.30 0.00 10655.99 -9.35 1.30 311.7 0.321E+00 1.30 35.36 1.30 0.00 10751.34 -9.35 1.30 312.8 0.320E+00 1.30 35.49 1.30 0.00 10846.68 -9.35 1.30 313.9 0.319E+00 1.30 35.61 1.30 0.00 10942.03 -9.35 1.30 314.9 0.318E+00 1.30 35.73 1.30 0.00 11037.38 -9.35 1.30 316.0 0.316E+00 1.30 35.86 1.30 0.00 11132.72 -9.35 1.30 317.1 0.315E+00 1.30 35.98 1.30 0.00 11228.07 -9.35 1.30 318.2 0.314E+00 1.30 36.10 1.30 0.00 11323.42 -9.35 1.30 319.3 0.313E+00 1.30 36.22 1.30 0.00 11418.76 -9.35 1.30 320.3 0.312E+00 1.30 36.35 1.30 0.00 11514.11 -9.35 1.30 321.4 0.311E+00 1.30 36.47 1.30 0.00 11609.46 -9.35 1.30 322.5 0.310E+00 1.30 36.59 1.30 0.00 11704.80 -9.35 1.30 323.5 0.309E+00 1.30 36.71 1.30 0.00 11800.15 -9.35 1.30 324.6 0.308E+00 1.30 36.83 1.30 0.00 11895.50 -9.35 1.30 325.7 0.307E+00 1.30 36.95 1.30 0.00 11990.84 -9.35 1.30 326.7 0.306E+00 1.30 37.07 1.30 0.00 12086.19 -9.35 1.30 327.8 0.305E+00 1.30 37.19 1.30 0.00 12181.54 -9.35 1.30 328.8 0.304E+00 1.30 37.31 1.30 0.00 12276.88 -9.35 1.30 329.8 0.303E+00 1.30 37.42 1.30 0.00 12372.23 -9.35 1.30 330.9 0.302E+00 1.30 37.54 1.30 0.00 12467.58 -9.35 1.30 331.9 0.301E+00 1.30 37.66 1.30 0.00 12562.92 -9.35 1.30 332.9 0.300E+00 1.30 37.78 1.30 0.00 12658.27 -9.35 1.30 334.0 0.299E+00 1.30 37.89 1.30 0.00 12753.62 -9.35 1.30 335.0 0.299E+00 1.30 38.01 1.30 0.00 12848.96 -9.35 1.30 336.0 0.298E+00 1.30 38.13 1.30 0.00 12944.31 -9.35 1.30 337.0 0.297E+00 1.30 38.24 1.30 0.00 13039.66 -9.35 1.30 338.1 0.296E+00 1.30 38.36 1.30 0.00 13135.00 -9.35 1.30 339.1 0.295E+00 1.30 38.47 1.30 0.00 13230.35 -9.35 1.30 340.1 0.294E+00 1.30 38.59 1.30 0.00 13325.70 -9.35 1.30 341.1 0.293E+00 1.30 38.70 1.30 0.00 13421.04 -9.35 1.30 342.1 0.292E+00 1.30 38.81 1.30 0.00 13516.39 -9.35 1.30 343.1 0.291E+00 1.30 38.93 1.30 0.00 13611.74 -9.35 1.30 344.1 0.291E+00 1.30 39.04 1.30 0.00 13707.08 -9.35 1.30 345.1 0.290E+00 1.30 39.15 1.30 0.00 13802.43 -9.35 1.30 346.1 0.289E+00 1.30 39.27 1.30 0.00 13897.78 -9.35 1.30 347.1 0.288E+00 1.30 39.38 1.30 0.00 13993.12 -9.35 1.30 348.1 0.287E+00 1.30 39.49 1.30 0.00 14088.47 -9.35 1.30 349.0 0.287E+00 1.30 39.60 1.30 0.00 14183.82 -9.35 1.30 350.0 0.286E+00 1.30 39.71 1.30 0.00 14279.16 -9.35 1.30 351.0 0.285E+00 1.30 39.82 1.30 0.00 14374.51 -9.35 1.30 352.0 0.284E+00 1.30 39.94 1.30 0.00 14469.86 -9.35 1.30 352.9 0.283E+00 1.30 40.05 1.30 0.00 14565.20 -9.35 1.30 353.9 0.283E+00 1.30 40.16 1.30 0.00 14660.55 -9.35 1.30 354.9 0.282E+00 1.30 40.27 1.30 0.00 14755.90 -9.35 1.30 355.8 0.281E+00 1.30 40.37 1.30 0.00
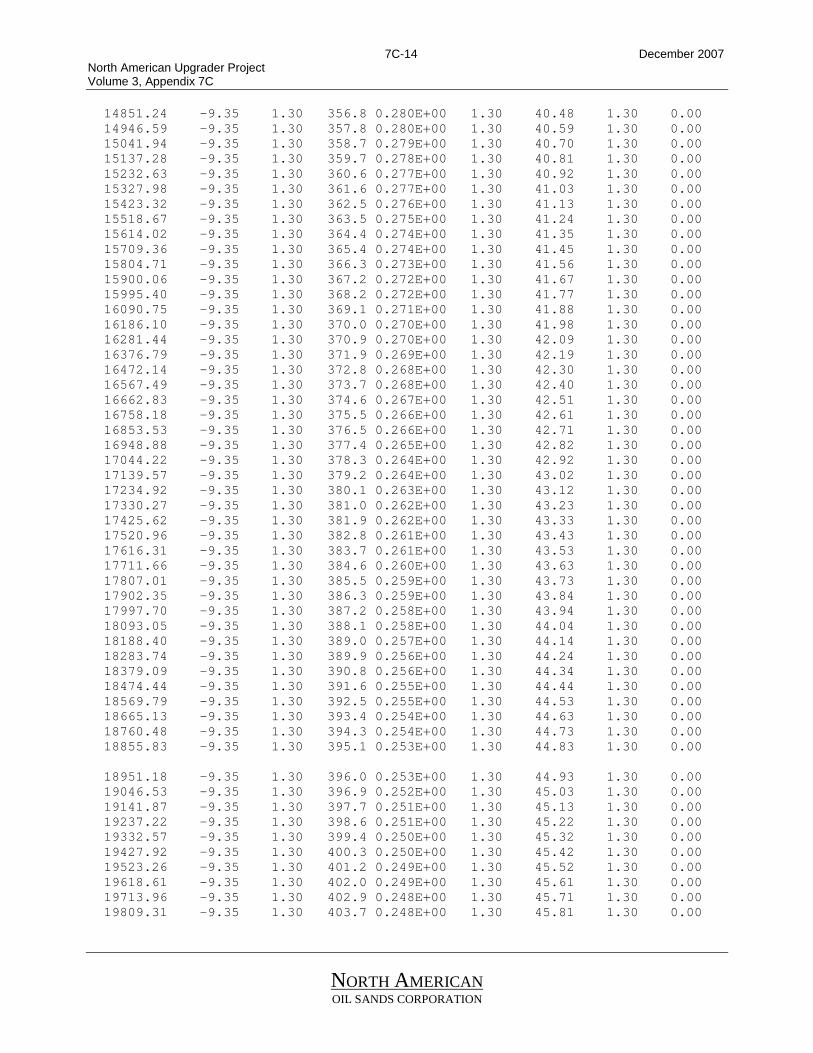
7C-14 December 2007 North American Upgrader Project Volume 3, Appendix 7C
NORTH AMERICAN OIL SANDS CORPORATION
14851.24 -9.35 1.30 356.8 0.280E+00 1.30 40.48 1.30 0.00 14946.59 -9.35 1.30 357.8 0.280E+00 1.30 40.59 1.30 0.00 15041.94 -9.35 1.30 358.7 0.279E+00 1.30 40.70 1.30 0.00 15137.28 -9.35 1.30 359.7 0.278E+00 1.30 40.81 1.30 0.00 15232.63 -9.35 1.30 360.6 0.277E+00 1.30 40.92 1.30 0.00 15327.98 -9.35 1.30 361.6 0.277E+00 1.30 41.03 1.30 0.00 15423.32 -9.35 1.30 362.5 0.276E+00 1.30 41.13 1.30 0.00 15518.67 -9.35 1.30 363.5 0.275E+00 1.30 41.24 1.30 0.00 15614.02 -9.35 1.30 364.4 0.274E+00 1.30 41.35 1.30 0.00 15709.36 -9.35 1.30 365.4 0.274E+00 1.30 41.45 1.30 0.00 15804.71 -9.35 1.30 366.3 0.273E+00 1.30 41.56 1.30 0.00 15900.06 -9.35 1.30 367.2 0.272E+00 1.30 41.67 1.30 0.00 15995.40 -9.35 1.30 368.2 0.272E+00 1.30 41.77 1.30 0.00 16090.75 -9.35 1.30 369.1 0.271E+00 1.30 41.88 1.30 0.00 16186.10 -9.35 1.30 370.0 0.270E+00 1.30 41.98 1.30 0.00 16281.44 -9.35 1.30 370.9 0.270E+00 1.30 42.09 1.30 0.00 16376.79 -9.35 1.30 371.9 0.269E+00 1.30 42.19 1.30 0.00 16472.14 -9.35 1.30 372.8 0.268E+00 1.30 42.30 1.30 0.00 16567.49 -9.35 1.30 373.7 0.268E+00 1.30 42.40 1.30 0.00 16662.83 -9.35 1.30 374.6 0.267E+00 1.30 42.51 1.30 0.00 16758.18 -9.35 1.30 375.5 0.266E+00 1.30 42.61 1.30 0.00 16853.53 -9.35 1.30 376.5 0.266E+00 1.30 42.71 1.30 0.00 16948.88 -9.35 1.30 377.4 0.265E+00 1.30 42.82 1.30 0.00 17044.22 -9.35 1.30 378.3 0.264E+00 1.30 42.92 1.30 0.00 17139.57 -9.35 1.30 379.2 0.264E+00 1.30 43.02 1.30 0.00 17234.92 -9.35 1.30 380.1 0.263E+00 1.30 43.12 1.30 0.00 17330.27 -9.35 1.30 381.0 0.262E+00 1.30 43.23 1.30 0.00 17425.62 -9.35 1.30 381.9 0.262E+00 1.30 43.33 1.30 0.00 17520.96 -9.35 1.30 382.8 0.261E+00 1.30 43.43 1.30 0.00 17616.31 -9.35 1.30 383.7 0.261E+00 1.30 43.53 1.30 0.00 17711.66 -9.35 1.30 384.6 0.260E+00 1.30 43.63 1.30 0.00 17807.01 -9.35 1.30 385.5 0.259E+00 1.30 43.73 1.30 0.00 17902.35 -9.35 1.30 386.3 0.259E+00 1.30 43.84 1.30 0.00 17997.70 -9.35 1.30 387.2 0.258E+00 1.30 43.94 1.30 0.00 18093.05 -9.35 1.30 388.1 0.258E+00 1.30 44.04 1.30 0.00 18188.40 -9.35 1.30 389.0 0.257E+00 1.30 44.14 1.30 0.00 18283.74 -9.35 1.30 389.9 0.256E+00 1.30 44.24 1.30 0.00 18379.09 -9.35 1.30 390.8 0.256E+00 1.30 44.34 1.30 0.00 18474.44 -9.35 1.30 391.6 0.255E+00 1.30 44.44 1.30 0.00 18569.79 -9.35 1.30 392.5 0.255E+00 1.30 44.53 1.30 0.00 18665.13 -9.35 1.30 393.4 0.254E+00 1.30 44.63 1.30 0.00 18760.48 -9.35 1.30 394.3 0.254E+00 1.30 44.73 1.30 0.00 18855.83 -9.35 1.30 395.1 0.253E+00 1.30 44.83 1.30 0.00 18951.18 -9.35 1.30 396.0 0.253E+00 1.30 44.93 1.30 0.00 19046.53 -9.35 1.30 396.9 0.252E+00 1.30 45.03 1.30 0.00 19141.87 -9.35 1.30 397.7 0.251E+00 1.30 45.13 1.30 0.00 19237.22 -9.35 1.30 398.6 0.251E+00 1.30 45.22 1.30 0.00 19332.57 -9.35 1.30 399.4 0.250E+00 1.30 45.32 1.30 0.00 19427.92 -9.35 1.30 400.3 0.250E+00 1.30 45.42 1.30 0.00 19523.26 -9.35 1.30 401.2 0.249E+00 1.30 45.52 1.30 0.00 19618.61 -9.35 1.30 402.0 0.249E+00 1.30 45.61 1.30 0.00 19713.96 -9.35 1.30 402.9 0.248E+00 1.30 45.71 1.30 0.00 19809.31 -9.35 1.30 403.7 0.248E+00 1.30 45.81 1.30 0.00
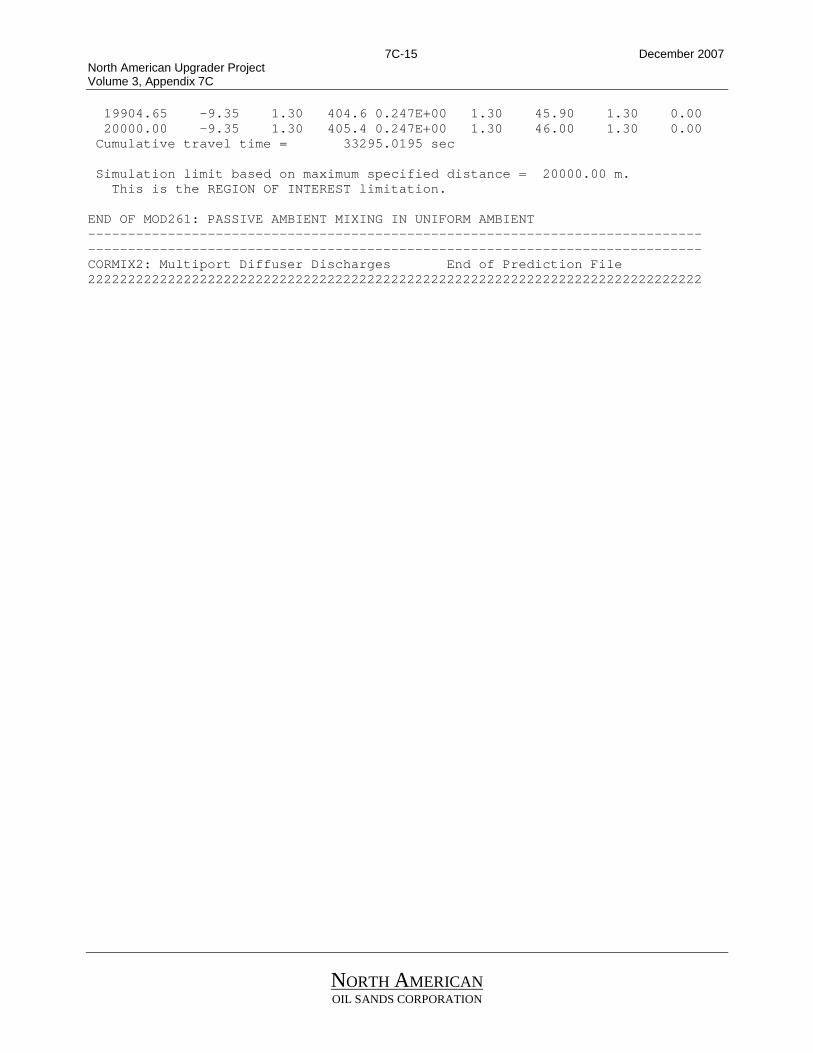
7C-15 December 2007 North American Upgrader Project Volume 3, Appendix 7C
NORTH AMERICAN OIL SANDS CORPORATION
19904.65 -9.35 1.30 404.6 0.247E+00 1.30 45.90 1.30 0.00 20000.00 -9.35 1.30 405.4 0.247E+00 1.30 46.00 1.30 0.00 Cumulative travel time = 33295.0195 sec Simulation limit based on maximum specified distance = 20000.00 m. This is the REGION OF INTEREST limitation. END OF MOD261: PASSIVE AMBIENT MIXING IN UNIFORM AMBIENT ----------------------------------------------------------------------------- ----------------------------------------------------------------------------- CORMIX2: Multiport Diffuser Discharges End of Prediction File 22222222222222222222222222222222222222222222222222222222222222222222222222222

7C-16 December 2007 North American Upgrader Project Volume 3, Appendix 7C
NORTH AMERICAN OIL SANDS CORPORATION
Results of CORMIX Modeling – Average Flow 22222222222222222222222222222222222222222222222222222222222222222222222222222 CORMIX MIXING ZONE EXPERT SYSTEM Subsystem CORMIX2: Multiport Diffuser Discharges CORMIX Version 5.0GT HYDRO2 Version 5.0.0.0 March 2007 ----------------------------------------------------------------------------- ----------------------------------------------------------------------------- CASE DESCRIPTION Site name/label: Sturgeon upgrader Design case: Avergae flow FILE NAME: \\S...erage_run_North American_multiport_10_newflow.prd Time stamp: Wed Oct 31 16:37:17 2007 ENVIRONMENT PARAMETERS (metric units) Bounded section BS = 160.00 AS = 304.00 QA = 196.00 ICHREG= 1 HA = 1.90 HD = 2.20 UA = 0.645 F = 0.053 USTAR =0.5262E-01 UW = 2.000 UWSTAR=0.2198E-02 Uniform density environment STRCND= U RHOAM = 999.8188 DIFFUSER DISCHARGE PARAMETERS (metric units) Diffuser type: DITYPE= alternating_perpendicular BANK = RIGHT DISTB = 9.35 YB1 = 8.00 YB2 = 10.70 LD = 2.70 NOPEN = 10 SPAC = 0.30 D0 = 0.100 A0 = 0.008 H0 = 0.30 SUB0 = 1.90 Nozzle/port arrangement: near_vertical_discharge GAMMA = 90.00 THETA = 90.00 SIGMA = 0.00 BETA = 90.00 U0 = 1.127 Q0 = 0.089 =0.8850E-01 RHO0 = 996.5137 DRHO0 =0.3305E+01 GP0 =0.3242E-01 C0 =0.1000E+03 CUNITS= % IPOLL = 1 KS =0.0000E+00 KD =0.0000E+00 FLUX VARIABLES - PER UNIT DIFFUSER LENGTH (metric units) q0 =0.3278E-01 m0 =0.3693E-01 j0 =0.1063E-02 SIGNJ0= 1.0 Associated 2-d length scales (meters) lQ=B = 0.029 lM = 3.54 lm = 0.09 lmp = 99999.00 lbp = 99999.00 la = 99999.00 FLUX VARIABLES - ENTIRE DIFFUSER (metric units) Q0 =0.8850E-01 M0 =0.9972E-01 J0 =0.2869E-02 Associated 3-d length scales (meters) LQ = 0.09 LM = 3.31 Lm = 0.49 Lb = 0.01 Lmp = 99999.00 Lbp = 99999.00 NON-DIMENSIONAL PARAMETERS FR0 = 36.69 FRD0 = 19.79 R = 1.75 PL = 2. (slot) (port/nozzle) FLOW CLASSIFICATION 222222222222222222222222222222222222222222

7C-17 December 2007 North American Upgrader Project Volume 3, Appendix 7C
NORTH AMERICAN OIL SANDS CORPORATION
2 Flow class (CORMIX2) = MU8 2 2 Applicable layer depth HS = 2.20 2 222222222222222222222222222222222222222222 MIXING ZONE / TOXIC DILUTION / REGION OF INTEREST PARAMETERS C0 =0.1000E+03 CUNITS= % NTOX = 0 NSTD = 0 REGMZ = 1 REGSPC= 1 XREG = 1293.00 WREG = 0.00 AREG = 0.00 XINT = 20000.00 XMAX = 20000.00 X-Y-Z COORDINATE SYSTEM: ORIGIN is located at the bottom and the diffuser mid-point: 9.35 m from the RIGHT bank/shore. X-axis points downstream, Y-axis points to left, Z-axis points upward. NSTEP = 200 display intervals per module ----------------------------------------------------------------------------- ----------------------------------------------------------------------------- BEGIN MOD201: DIFFUSER DISCHARGE MODULE Due to complex near-field motions: EQUIVALENT SLOT DIFFUSER (2-D) GEOMETRY Profile definitions: BV = Gaussian 1/e (37%) half-width, in vertical plane normal to trajectory BH = top-hat half-width, in horizontal plane normal to trajectory S = hydrodynamic centerline dilution C = centerline concentration (includes reaction effects, if any) X Y Z S C BV BH 0.00 0.00 0.30 1.0 0.100E+03 0.02 1.35 END OF MOD201: DIFFUSER DISCHARGE MODULE ----------------------------------------------------------------------------- ----------------------------------------------------------------------------- BEGIN MOD277: UNSTABLE NEAR-FIELD ZONE OF ALTERNATING PERPENDICULAR DIFFUSER Because of the strong ambient current the diffuser plume of this crossflowing discharge gets RAPIDLY DEFLECTED. A near-field zone is formed that is VERTICALLY FULLY MIXED over the entire layer depth. Full mixing is achieved at a downstream distance of about five (5) layer depths. Profile definitions: BV = layer depth (vertically mixed) BH = top-hat half-width, measured horizontally in Y-direction S = hydrodynamic average (bulk) dilution C = average (bulk) concentration (includes reaction effects, if any) X Y Z S C BV BH 0.00 0.00 0.30 1.0 0.100E+03 0.02 1.35 0.05 0.00 0.30 4.0 0.250E+02 0.03 1.35 0.11 0.00 0.31 5.2 0.191E+02 0.04 1.35 0.16 0.00 0.31 6.2 0.161E+02 0.06 1.35

7C-18 December 2007 North American Upgrader Project Volume 3, Appendix 7C
NORTH AMERICAN OIL SANDS CORPORATION
0.22 0.00 0.32 7.0 0.143E+02 0.07 1.35 0.28 0.00 0.32 7.7 0.130E+02 0.08 1.35 0.33 0.00 0.32 8.3 0.120E+02 0.09 1.35 0.39 0.00 0.33 8.9 0.112E+02 0.10 1.35 0.44 0.00 0.33 9.5 0.105E+02 0.11 1.35 0.50 0.00 0.34 10.0 0.100E+02 0.12 1.35 0.55 0.00 0.34 10.5 0.954E+01 0.13 1.35 0.61 0.00 0.34 10.9 0.914E+01 0.14 1.35 0.66 0.00 0.35 11.4 0.878E+01 0.15 1.35 0.72 0.00 0.35 11.8 0.847E+01 0.16 1.35 0.77 0.00 0.36 12.2 0.818E+01 0.18 1.35 0.83 0.00 0.36 12.6 0.793E+01 0.19 1.35 0.88 0.00 0.36 13.0 0.770E+01 0.20 1.35 0.94 0.00 0.37 13.4 0.748E+01 0.21 1.35 0.99 0.00 0.37 13.7 0.729E+01 0.22 1.35 1.05 0.00 0.38 14.1 0.711E+01 0.23 1.35 1.10 0.00 0.38 14.4 0.694E+01 0.24 1.35 1.15 0.00 0.38 14.7 0.678E+01 0.25 1.35 1.21 0.00 0.39 15.1 0.664E+01 0.26 1.35 1.26 0.00 0.39 15.4 0.650E+01 0.27 1.35 1.32 0.00 0.40 15.7 0.637E+01 0.28 1.35 1.37 0.00 0.40 16.0 0.625E+01 0.30 1.35 1.43 0.00 0.40 16.3 0.614E+01 0.31 1.35 1.48 0.00 0.41 16.6 0.603E+01 0.32 1.35 1.54 0.00 0.41 16.9 0.593E+01 0.33 1.35 1.59 0.00 0.42 17.1 0.583E+01 0.34 1.35 1.65 0.00 0.42 17.4 0.574E+01 0.35 1.35 1.70 0.00 0.42 17.7 0.565E+01 0.36 1.35 1.76 0.00 0.43 18.0 0.557E+01 0.37 1.35 1.81 0.00 0.43 18.2 0.549E+01 0.38 1.35 1.87 0.00 0.44 18.5 0.541E+01 0.39 1.35 1.92 0.00 0.44 18.7 0.534E+01 0.40 1.35 1.98 0.00 0.44 19.0 0.527E+01 0.42 1.35 2.03 0.00 0.45 19.2 0.520E+01 0.43 1.35 2.09 0.00 0.45 19.5 0.513E+01 0.44 1.35 2.14 0.00 0.46 19.7 0.507E+01 0.45 1.35 2.20 0.00 0.46 20.0 0.501E+01 0.46 1.35 2.25 0.00 0.46 20.2 0.495E+01 0.47 1.35 2.31 0.00 0.47 20.4 0.489E+01 0.48 1.35 2.36 0.00 0.47 20.7 0.484E+01 0.49 1.35 2.42 0.00 0.48 20.9 0.479E+01 0.50 1.35 2.47 0.00 0.48 21.1 0.474E+01 0.51 1.35 2.53 0.00 0.48 21.3 0.469E+01 0.52 1.35 2.58 0.00 0.49 21.6 0.464E+01 0.53 1.35 2.64 0.00 0.49 21.8 0.459E+01 0.55 1.35 2.69 0.00 0.50 22.0 0.455E+01 0.56 1.35 2.75 0.00 0.50 22.2 0.450E+01 0.57 1.35 2.81 0.00 0.50 22.4 0.446E+01 0.58 1.35 2.86 0.00 0.51 22.6 0.442E+01 0.59 1.35 2.92 0.00 0.51 22.8 0.438E+01 0.60 1.35 2.97 0.00 0.52 23.0 0.434E+01 0.61 1.35 3.03 0.00 0.52 23.2 0.430E+01 0.62 1.35 3.08 0.00 0.52 23.4 0.427E+01 0.63 1.35 3.14 0.00 0.53 23.6 0.423E+01 0.64 1.35

7C-19 December 2007 North American Upgrader Project Volume 3, Appendix 7C
NORTH AMERICAN OIL SANDS CORPORATION
3.19 0.00 0.53 23.8 0.419E+01 0.65 1.35 3.25 0.00 0.54 24.0 0.416E+01 0.67 1.35 3.30 0.00 0.54 24.2 0.413E+01 0.68 1.35 3.36 0.00 0.54 24.4 0.409E+01 0.69 1.35 3.41 0.00 0.55 24.6 0.406E+01 0.70 1.35 3.47 0.00 0.55 24.8 0.403E+01 0.71 1.35 3.52 0.00 0.56 25.0 0.400E+01 0.72 1.35 3.58 0.00 0.56 25.2 0.397E+01 0.73 1.35 3.63 0.00 0.56 25.4 0.394E+01 0.74 1.35 3.69 0.00 0.57 25.5 0.391E+01 0.75 1.35 3.74 0.00 0.57 25.7 0.389E+01 0.76 1.35 3.80 0.00 0.58 25.9 0.386E+01 0.77 1.35 3.85 0.00 0.58 26.1 0.383E+01 0.79 1.35 3.91 0.00 0.58 26.3 0.381E+01 0.80 1.35 3.96 0.00 0.59 26.4 0.378E+01 0.81 1.35 4.02 0.00 0.59 26.6 0.376E+01 0.82 1.35 4.07 0.00 0.60 26.8 0.373E+01 0.83 1.35 4.13 0.00 0.60 27.0 0.371E+01 0.84 1.35 4.18 0.00 0.60 27.1 0.368E+01 0.85 1.35 4.24 0.00 0.61 27.3 0.366E+01 0.86 1.35 4.29 0.00 0.61 27.5 0.364E+01 0.87 1.35 4.35 0.00 0.62 27.7 0.362E+01 0.88 1.35 4.40 0.00 0.62 27.8 0.359E+01 0.89 1.35 4.45 0.00 0.62 28.0 0.357E+01 0.90 1.35 4.51 0.00 0.63 28.2 0.355E+01 0.92 1.35 4.56 0.00 0.63 28.3 0.353E+01 0.93 1.35 4.62 0.00 0.64 28.5 0.351E+01 0.94 1.35 4.67 0.00 0.64 28.6 0.349E+01 0.95 1.35 4.73 0.00 0.64 28.8 0.347E+01 0.96 1.35 4.78 0.00 0.65 29.0 0.345E+01 0.97 1.35 4.84 0.00 0.65 29.1 0.343E+01 0.98 1.35 4.89 0.00 0.66 29.3 0.341E+01 0.99 1.35 4.95 0.00 0.66 29.4 0.340E+01 1.00 1.35 5.00 0.00 0.66 29.6 0.338E+01 1.01 1.35 5.06 0.00 0.67 29.8 0.336E+01 1.02 1.35 5.11 0.00 0.67 29.9 0.334E+01 1.04 1.35 5.17 0.00 0.68 30.1 0.333E+01 1.05 1.35 5.22 0.00 0.68 30.2 0.331E+01 1.06 1.35 5.28 0.00 0.68 30.4 0.329E+01 1.07 1.35 5.33 0.00 0.69 30.5 0.327E+01 1.08 1.35 5.39 0.00 0.69 30.7 0.326E+01 1.09 1.35 5.44 0.00 0.70 30.8 0.324E+01 1.10 1.35 5.50 0.00 0.70 31.0 0.323E+01 1.11 1.35 5.55 0.00 0.70 31.1 0.321E+01 1.12 1.35 5.61 0.00 0.71 31.3 0.320E+01 1.13 1.35 5.66 0.00 0.71 31.4 0.318E+01 1.14 1.35 5.72 0.00 0.72 31.6 0.317E+01 1.16 1.35 5.77 0.00 0.72 31.7 0.315E+01 1.17 1.35 5.83 0.00 0.72 31.9 0.314E+01 1.18 1.35 5.88 0.00 0.73 32.0 0.312E+01 1.19 1.35 5.94 0.00 0.73 32.2 0.311E+01 1.20 1.35 5.99 0.00 0.74 32.3 0.310E+01 1.21 1.35 6.05 0.00 0.74 32.5 0.308E+01 1.22 1.35 6.10 0.00 0.74 32.6 0.307E+01 1.23 1.35

7C-20 December 2007 North American Upgrader Project Volume 3, Appendix 7C
NORTH AMERICAN OIL SANDS CORPORATION
6.16 0.00 0.75 32.7 0.305E+01 1.24 1.35 6.21 0.00 0.75 32.9 0.304E+01 1.25 1.35 6.27 0.00 0.76 33.0 0.303E+01 1.26 1.35 6.32 0.00 0.76 33.2 0.302E+01 1.27 1.35 6.38 0.00 0.76 33.3 0.300E+01 1.29 1.35 6.43 0.00 0.77 33.4 0.299E+01 1.30 1.35 6.49 0.00 0.77 33.6 0.298E+01 1.31 1.35 6.54 0.00 0.78 33.7 0.297E+01 1.32 1.35 6.60 0.00 0.78 33.9 0.295E+01 1.33 1.35 6.65 0.00 0.78 34.0 0.294E+01 1.34 1.35 6.71 0.00 0.79 34.1 0.293E+01 1.35 1.35 6.76 0.00 0.79 34.3 0.292E+01 1.36 1.35 6.82 0.00 0.80 34.4 0.291E+01 1.37 1.35 6.87 0.00 0.80 34.5 0.290E+01 1.38 1.35 6.93 0.00 0.80 34.7 0.289E+01 1.39 1.35 6.98 0.00 0.81 34.8 0.287E+01 1.41 1.35 7.04 0.00 0.81 34.9 0.286E+01 1.42 1.35 7.09 0.00 0.82 35.1 0.285E+01 1.43 1.35 7.15 0.00 0.82 35.2 0.284E+01 1.44 1.35 7.20 0.00 0.82 35.3 0.283E+01 1.45 1.35 7.26 0.00 0.83 35.5 0.282E+01 1.46 1.35 7.31 0.00 0.83 35.6 0.281E+01 1.47 1.35 7.37 0.00 0.84 35.7 0.280E+01 1.48 1.35 7.42 0.00 0.84 35.8 0.279E+01 1.49 1.35 7.48 0.00 0.84 36.0 0.278E+01 1.50 1.35 7.53 0.00 0.85 36.1 0.277E+01 1.51 1.35 7.59 0.00 0.85 36.2 0.276E+01 1.53 1.35 7.64 0.00 0.86 36.4 0.275E+01 1.54 1.35 7.70 0.00 0.86 36.5 0.274E+01 1.55 1.35 7.75 0.00 0.86 36.6 0.273E+01 1.56 1.35 7.81 0.00 0.87 36.7 0.272E+01 1.57 1.35 7.86 0.00 0.87 36.9 0.271E+01 1.58 1.35 7.92 0.00 0.88 37.0 0.270E+01 1.59 1.35 7.97 0.00 0.88 37.1 0.269E+01 1.60 1.35 8.03 0.00 0.88 37.2 0.269E+01 1.61 1.35 8.08 0.00 0.89 37.4 0.268E+01 1.62 1.35 8.14 0.00 0.89 37.5 0.267E+01 1.63 1.35 8.19 0.00 0.90 37.6 0.266E+01 1.64 1.35 8.25 0.00 0.90 37.7 0.265E+01 1.66 1.35 8.30 0.00 0.90 37.8 0.264E+01 1.67 1.35 8.36 0.00 0.91 38.0 0.263E+01 1.68 1.35 8.41 0.00 0.91 38.1 0.263E+01 1.69 1.35 8.47 0.00 0.92 38.2 0.262E+01 1.70 1.35 8.52 0.00 0.92 38.3 0.261E+01 1.71 1.35 8.58 0.00 0.92 38.5 0.260E+01 1.72 1.35 8.63 0.00 0.93 38.6 0.259E+01 1.73 1.35 8.69 0.00 0.93 38.7 0.258E+01 1.74 1.35 8.74 0.00 0.94 38.8 0.258E+01 1.75 1.35 8.80 0.00 0.94 38.9 0.257E+01 1.76 1.35 8.85 0.00 0.94 39.1 0.256E+01 1.78 1.35 8.91 0.00 0.95 39.2 0.255E+01 1.79 1.35 8.96 0.00 0.95 39.3 0.255E+01 1.80 1.35 9.02 0.00 0.96 39.4 0.254E+01 1.81 1.35 9.07 0.00 0.96 39.5 0.253E+01 1.82 1.35

7C-21 December 2007 North American Upgrader Project Volume 3, Appendix 7C
NORTH AMERICAN OIL SANDS CORPORATION
9.13 0.00 0.96 39.6 0.252E+01 1.83 1.35 9.18 0.00 0.97 39.8 0.252E+01 1.84 1.35 9.24 0.00 0.97 39.9 0.251E+01 1.85 1.35 9.29 0.00 0.98 40.0 0.250E+01 1.86 1.35 9.35 0.00 0.98 40.1 0.249E+01 1.87 1.35 9.40 0.00 0.98 40.2 0.249E+01 1.88 1.35 9.46 0.00 0.99 40.3 0.248E+01 1.90 1.35 9.51 0.00 0.99 40.4 0.247E+01 1.91 1.35 9.57 0.00 1.00 40.6 0.247E+01 1.92 1.35 9.62 0.00 1.00 40.7 0.246E+01 1.93 1.35 9.68 0.00 1.00 40.8 0.245E+01 1.94 1.35 9.73 0.00 1.01 40.9 0.245E+01 1.95 1.35 9.79 0.00 1.01 41.0 0.244E+01 1.96 1.35 9.84 0.00 1.02 41.1 0.243E+01 1.97 1.35 9.90 0.00 1.02 41.2 0.243E+01 1.98 1.35 9.95 0.00 1.02 41.3 0.242E+01 1.99 1.35 10.01 0.00 1.03 41.5 0.241E+01 2.00 1.35 10.07 0.00 1.03 41.6 0.241E+01 2.01 1.35 10.12 0.00 1.04 41.7 0.240E+01 2.03 1.35 10.18 0.00 1.04 41.8 0.239E+01 2.04 1.35 10.23 0.00 1.04 41.9 0.239E+01 2.05 1.35 10.29 0.00 1.05 42.0 0.238E+01 2.06 1.35 10.34 0.00 1.05 42.1 0.237E+01 2.07 1.35 10.40 0.00 1.06 42.2 0.237E+01 2.08 1.35 10.45 0.00 1.06 42.3 0.236E+01 2.09 1.35 10.51 0.00 1.06 42.4 0.236E+01 2.10 1.35 10.56 0.00 1.07 42.6 0.235E+01 2.11 1.35 10.62 0.00 1.07 42.7 0.234E+01 2.12 1.35 10.67 0.00 1.08 42.8 0.234E+01 2.13 1.35 10.73 0.00 1.08 42.9 0.233E+01 2.15 1.35 10.78 0.00 1.08 43.0 0.233E+01 2.16 1.35 10.84 0.00 1.09 43.1 0.232E+01 2.17 1.35 10.89 0.00 1.09 43.2 0.231E+01 2.18 1.35 10.95 0.00 1.10 43.3 0.231E+01 2.19 1.35 11.00 0.00 1.10 43.4 0.230E+01 2.20 1.35 Cumulative travel time = 34.0160 sec Plume centerline may exhibit slight discontinuities in transition to subsequent far-field module. END OF MOD277: UNSTABLE NEAR-FIELD ZONE OF ALTERNATING PERPENDICULAR DIFFUSER ----------------------------------------------------------------------------- ** End of NEAR-FIELD REGION (NFR) ** ----------------------------------------------------------------------------- BEGIN MOD241: BUOYANT AMBIENT SPREADING Discharge is non-buoyant or weakly buoyant. Therefore BUOYANT SPREADING REGIME is ABSENT. END OF MOD241: BUOYANT AMBIENT SPREADING ----------------------------------------------------------------------------- Due to the attachment or proximity of the plume tothe bottom, the bottom coordinate for the FAR-FIELD differs from the ambient depth, ZFB = 0 m. In a subsequent analysis set "depth at discharge" equal to "ambient depth". -----------------------------------------------------------------------------

7C-22 December 2007 North American Upgrader Project Volume 3, Appendix 7C
NORTH AMERICAN OIL SANDS CORPORATION
BEGIN MOD261: PASSIVE AMBIENT MIXING IN UNIFORM AMBIENT Vertical diffusivity (initial value) = 0.232E-01 m^2/s Horizontal diffusivity (initial value) = 0.289E-01 m^2/s The passive diffusion plume is VERTICALLY FULLY MIXED at beginning of region. Profile definitions: BV = Gaussian s.d.*sqrt(pi/2) (46%) thickness, measured vertically = or equal to layer depth, if fully mixed BH = Gaussian s.d.*sqrt(pi/2) (46%) half-width, measured horizontally in Y-direction ZU = upper plume boundary (Z-coordinate) ZL = lower plume boundary (Z-coordinate) S = hydrodynamic centerline dilution C = centerline concentration (includes reaction effects, if any) Plume Stage 1 (not bank attached): X Y Z S C BV BH ZU ZL 11.00 0.00 2.20 43.4 0.230E+01 2.20 1.35 2.20 0.00 14.04 0.00 2.20 48.2 0.207E+01 2.20 1.50 2.20 0.00 17.07 0.00 2.20 52.6 0.190E+01 2.20 1.64 2.20 0.00 20.11 0.00 2.20 56.6 0.177E+01 2.20 1.77 2.20 0.00 23.14 0.00 2.20 60.4 0.166E+01 2.20 1.88 2.20 0.00 26.18 0.00 2.20 63.9 0.156E+01 2.20 1.99 2.20 0.00 29.21 0.00 2.20 67.3 0.149E+01 2.20 2.10 2.20 0.00 32.25 0.00 2.20 70.4 0.142E+01 2.20 2.20 2.20 0.00 35.28 0.00 2.20 73.5 0.136E+01 2.20 2.29 2.20 0.00 38.32 0.00 2.20 76.4 0.131E+01 2.20 2.38 2.20 0.00 41.35 0.00 2.20 79.3 0.126E+01 2.20 2.47 2.20 0.00 44.39 0.00 2.20 82.0 0.122E+01 2.20 2.56 2.20 0.00 47.42 0.00 2.20 84.6 0.118E+01 2.20 2.64 2.20 0.00 50.46 0.00 2.20 87.2 0.115E+01 2.20 2.72 2.20 0.00 53.49 0.00 2.20 89.7 0.112E+01 2.20 2.80 2.20 0.00 56.53 0.00 2.20 92.1 0.109E+01 2.20 2.87 2.20 0.00 59.56 0.00 2.20 94.4 0.106E+01 2.20 2.95 2.20 0.00 62.60 0.00 2.20 96.7 0.103E+01 2.20 3.02 2.20 0.00 65.63 0.00 2.20 99.0 0.101E+01 2.20 3.09 2.20 0.00 68.67 0.00 2.20 101.2 0.988E+00 2.20 3.16 2.20 0.00 71.70 0.00 2.20 103.3 0.968E+00 2.20 3.22 2.20 0.00 74.74 0.00 2.20 105.4 0.948E+00 2.20 3.29 2.20 0.00 77.77 0.00 2.20 107.5 0.930E+00 2.20 3.35 2.20 0.00 80.81 0.00 2.20 109.5 0.913E+00 2.20 3.42 2.20 0.00 83.84 0.00 2.20 111.5 0.897E+00 2.20 3.48 2.20 0.00 86.88 0.00 2.20 113.5 0.881E+00 2.20 3.54 2.20 0.00 89.91 0.00 2.20 115.4 0.867E+00 2.20 3.60 2.20 0.00 92.95 0.00 2.20 117.3 0.853E+00 2.20 3.66 2.20 0.00 95.99 0.00 2.20 119.1 0.839E+00 2.20 3.72 2.20 0.00 99.02 0.00 2.20 121.0 0.827E+00 2.20 3.77 2.20 0.00 102.06 0.00 2.20 122.8 0.814E+00 2.20 3.83 2.20 0.00 105.09 0.00 2.20 124.6 0.803E+00 2.20 3.89 2.20 0.00 108.13 0.00 2.20 126.3 0.792E+00 2.20 3.94 2.20 0.00 111.16 0.00 2.20 128.0 0.781E+00 2.20 3.99 2.20 0.00 114.20 0.00 2.20 129.7 0.771E+00 2.20 4.05 2.20 0.00

7C-23 December 2007 North American Upgrader Project Volume 3, Appendix 7C
NORTH AMERICAN OIL SANDS CORPORATION
117.23 0.00 2.20 131.4 0.761E+00 2.20 4.10 2.20 0.00 120.27 0.00 2.20 133.1 0.751E+00 2.20 4.15 2.20 0.00 123.30 0.00 2.20 134.7 0.742E+00 2.20 4.20 2.20 0.00 126.34 0.00 2.20 136.4 0.733E+00 2.20 4.25 2.20 0.00 129.37 0.00 2.20 138.0 0.725E+00 2.20 4.30 2.20 0.00 132.41 0.00 2.20 139.5 0.717E+00 2.20 4.35 2.20 0.00 135.44 0.00 2.20 141.1 0.709E+00 2.20 4.40 2.20 0.00 138.48 0.00 2.20 142.7 0.701E+00 2.20 4.45 2.20 0.00 141.51 0.00 2.20 144.2 0.694E+00 2.20 4.50 2.20 0.00 144.55 0.00 2.20 145.7 0.686E+00 2.20 4.55 2.20 0.00 147.58 0.00 2.20 147.2 0.679E+00 2.20 4.59 2.20 0.00 150.62 0.00 2.20 148.7 0.673E+00 2.20 4.64 2.20 0.00 153.65 0.00 2.20 150.2 0.666E+00 2.20 4.68 2.20 0.00 156.69 0.00 2.20 151.6 0.660E+00 2.20 4.73 2.20 0.00 159.72 0.00 2.20 153.1 0.653E+00 2.20 4.78 2.20 0.00 162.76 0.00 2.20 154.5 0.647E+00 2.20 4.82 2.20 0.00 165.79 0.00 2.20 155.9 0.641E+00 2.20 4.86 2.20 0.00 168.83 0.00 2.20 157.3 0.636E+00 2.20 4.91 2.20 0.00 171.86 0.00 2.20 158.7 0.630E+00 2.20 4.95 2.20 0.00 174.90 0.00 2.20 160.1 0.625E+00 2.20 4.99 2.20 0.00 177.94 0.00 2.20 161.5 0.619E+00 2.20 5.04 2.20 0.00 180.97 0.00 2.20 162.8 0.614E+00 2.20 5.08 2.20 0.00 184.01 0.00 2.20 164.2 0.609E+00 2.20 5.12 2.20 0.00 187.04 0.00 2.20 165.5 0.604E+00 2.20 5.16 2.20 0.00 190.08 0.00 2.20 166.8 0.599E+00 2.20 5.20 2.20 0.00 193.11 0.00 2.20 168.1 0.595E+00 2.20 5.25 2.20 0.00 196.15 0.00 2.20 169.4 0.590E+00 2.20 5.29 2.20 0.00 199.18 0.00 2.20 170.7 0.586E+00 2.20 5.33 2.20 0.00 202.22 0.00 2.20 172.0 0.581E+00 2.20 5.37 2.20 0.00 205.25 0.00 2.20 173.3 0.577E+00 2.20 5.41 2.20 0.00 208.29 0.00 2.20 174.5 0.573E+00 2.20 5.45 2.20 0.00 211.32 0.00 2.20 175.8 0.569E+00 2.20 5.48 2.20 0.00 214.36 0.00 2.20 177.0 0.565E+00 2.20 5.52 2.20 0.00 217.39 0.00 2.20 178.3 0.561E+00 2.20 5.56 2.20 0.00 220.43 0.00 2.20 179.5 0.557E+00 2.20 5.60 2.20 0.00 223.46 0.00 2.20 180.7 0.553E+00 2.20 5.64 2.20 0.00 226.50 0.00 2.20 181.9 0.550E+00 2.20 5.68 2.20 0.00 229.53 0.00 2.20 183.1 0.546E+00 2.20 5.71 2.20 0.00 232.57 0.00 2.20 184.3 0.542E+00 2.20 5.75 2.20 0.00 235.60 0.00 2.20 185.5 0.539E+00 2.20 5.79 2.20 0.00 238.64 0.00 2.20 186.7 0.536E+00 2.20 5.82 2.20 0.00 241.67 0.00 2.20 187.9 0.532E+00 2.20 5.86 2.20 0.00 244.71 0.00 2.20 189.1 0.529E+00 2.20 5.90 2.20 0.00 247.74 0.00 2.20 190.2 0.526E+00 2.20 5.93 2.20 0.00 250.78 0.00 2.20 191.4 0.523E+00 2.20 5.97 2.20 0.00 253.81 0.00 2.20 192.5 0.519E+00 2.20 6.01 2.20 0.00 256.85 0.00 2.20 193.7 0.516E+00 2.20 6.04 2.20 0.00 259.89 0.00 2.20 194.8 0.513E+00 2.20 6.08 2.20 0.00 262.92 0.00 2.20 195.9 0.510E+00 2.20 6.11 2.20 0.00 265.96 0.00 2.20 197.0 0.508E+00 2.20 6.15 2.20 0.00 268.99 0.00 2.20 198.1 0.505E+00 2.20 6.18 2.20 0.00 272.03 0.00 2.20 199.2 0.502E+00 2.20 6.22 2.20 0.00 275.06 0.00 2.20 200.3 0.499E+00 2.20 6.25 2.20 0.00 278.10 0.00 2.20 201.4 0.496E+00 2.20 6.28 2.20 0.00

7C-24 December 2007 North American Upgrader Project Volume 3, Appendix 7C
NORTH AMERICAN OIL SANDS CORPORATION
281.13 0.00 2.20 202.5 0.494E+00 2.20 6.32 2.20 0.00 284.17 0.00 2.20 203.6 0.491E+00 2.20 6.35 2.20 0.00 287.20 0.00 2.20 204.7 0.489E+00 2.20 6.39 2.20 0.00 290.24 0.00 2.20 205.8 0.486E+00 2.20 6.42 2.20 0.00 293.27 0.00 2.20 206.8 0.483E+00 2.20 6.45 2.20 0.00 296.31 0.00 2.20 207.9 0.481E+00 2.20 6.49 2.20 0.00 299.34 0.00 2.20 208.9 0.479E+00 2.20 6.52 2.20 0.00 302.38 0.00 2.20 210.0 0.476E+00 2.20 6.55 2.20 0.00 305.41 0.00 2.20 211.0 0.474E+00 2.20 6.58 2.20 0.00 308.45 0.00 2.20 212.1 0.472E+00 2.20 6.62 2.20 0.00 311.48 0.00 2.20 213.1 0.469E+00 2.20 6.65 2.20 0.00 314.52 0.00 2.20 214.1 0.467E+00 2.20 6.68 2.20 0.00 317.55 0.00 2.20 215.2 0.465E+00 2.20 6.71 2.20 0.00 320.59 0.00 2.20 216.2 0.463E+00 2.20 6.74 2.20 0.00 323.62 0.00 2.20 217.2 0.460E+00 2.20 6.78 2.20 0.00 326.66 0.00 2.20 218.2 0.458E+00 2.20 6.81 2.20 0.00 329.69 0.00 2.20 219.2 0.456E+00 2.20 6.84 2.20 0.00 332.73 0.00 2.20 220.2 0.454E+00 2.20 6.87 2.20 0.00 335.76 0.00 2.20 221.2 0.452E+00 2.20 6.90 2.20 0.00 338.80 0.00 2.20 222.2 0.450E+00 2.20 6.93 2.20 0.00 341.84 0.00 2.20 223.2 0.448E+00 2.20 6.96 2.20 0.00 344.87 0.00 2.20 224.2 0.446E+00 2.20 6.99 2.20 0.00 347.91 0.00 2.20 225.2 0.444E+00 2.20 7.02 2.20 0.00 350.94 0.00 2.20 226.1 0.442E+00 2.20 7.05 2.20 0.00 353.98 0.00 2.20 227.1 0.440E+00 2.20 7.08 2.20 0.00 357.01 0.00 2.20 228.1 0.438E+00 2.20 7.11 2.20 0.00 360.05 0.00 2.20 229.0 0.437E+00 2.20 7.14 2.20 0.00 363.08 0.00 2.20 230.0 0.435E+00 2.20 7.17 2.20 0.00 366.12 0.00 2.20 230.9 0.433E+00 2.20 7.20 2.20 0.00 369.15 0.00 2.20 231.9 0.431E+00 2.20 7.23 2.20 0.00 372.19 0.00 2.20 232.8 0.429E+00 2.20 7.26 2.20 0.00 375.22 0.00 2.20 233.8 0.428E+00 2.20 7.29 2.20 0.00 378.26 0.00 2.20 234.7 0.426E+00 2.20 7.32 2.20 0.00 381.29 0.00 2.20 235.6 0.424E+00 2.20 7.35 2.20 0.00 384.33 0.00 2.20 236.6 0.423E+00 2.20 7.38 2.20 0.00 387.36 0.00 2.20 237.5 0.421E+00 2.20 7.41 2.20 0.00 390.40 0.00 2.20 238.4 0.419E+00 2.20 7.44 2.20 0.00 393.43 0.00 2.20 239.3 0.418E+00 2.20 7.47 2.20 0.00 396.47 0.00 2.20 240.3 0.416E+00 2.20 7.50 2.20 0.00 399.50 0.00 2.20 241.2 0.415E+00 2.20 7.52 2.20 0.00 402.54 0.00 2.20 242.1 0.413E+00 2.20 7.55 2.20 0.00 405.57 0.00 2.20 243.0 0.412E+00 2.20 7.58 2.20 0.00 408.61 0.00 2.20 243.9 0.410E+00 2.20 7.61 2.20 0.00 411.64 0.00 2.20 244.8 0.408E+00 2.20 7.64 2.20 0.00 414.68 0.00 2.20 245.7 0.407E+00 2.20 7.66 2.20 0.00 417.71 0.00 2.20 246.6 0.406E+00 2.20 7.69 2.20 0.00 420.75 0.00 2.20 247.5 0.404E+00 2.20 7.72 2.20 0.00 423.79 0.00 2.20 248.4 0.403E+00 2.20 7.75 2.20 0.00 426.82 0.00 2.20 249.2 0.401E+00 2.20 7.78 2.20 0.00 429.86 0.00 2.20 250.1 0.400E+00 2.20 7.80 2.20 0.00 432.89 0.00 2.20 251.0 0.398E+00 2.20 7.83 2.20 0.00 435.93 0.00 2.20 251.9 0.397E+00 2.20 7.86 2.20 0.00 438.96 0.00 2.20 252.8 0.396E+00 2.20 7.89 2.20 0.00 442.00 0.00 2.20 253.6 0.394E+00 2.20 7.91 2.20 0.00

7C-25 December 2007 North American Upgrader Project Volume 3, Appendix 7C
NORTH AMERICAN OIL SANDS CORPORATION
445.03 0.00 2.20 254.5 0.393E+00 2.20 7.94 2.20 0.00 448.07 0.00 2.20 255.3 0.392E+00 2.20 7.97 2.20 0.00 451.10 0.00 2.20 256.2 0.390E+00 2.20 7.99 2.20 0.00 454.14 0.00 2.20 257.1 0.389E+00 2.20 8.02 2.20 0.00 457.17 0.00 2.20 257.9 0.388E+00 2.20 8.05 2.20 0.00 460.21 0.00 2.20 258.8 0.386E+00 2.20 8.07 2.20 0.00 463.24 0.00 2.20 259.6 0.385E+00 2.20 8.10 2.20 0.00 466.28 0.00 2.20 260.5 0.384E+00 2.20 8.13 2.20 0.00 469.31 0.00 2.20 261.3 0.383E+00 2.20 8.15 2.20 0.00 472.35 0.00 2.20 262.1 0.381E+00 2.20 8.18 2.20 0.00 475.38 0.00 2.20 263.0 0.380E+00 2.20 8.20 2.20 0.00 478.42 0.00 2.20 263.8 0.379E+00 2.20 8.23 2.20 0.00 481.45 0.00 2.20 264.7 0.378E+00 2.20 8.26 2.20 0.00 484.49 0.00 2.20 265.5 0.377E+00 2.20 8.28 2.20 0.00 487.52 0.00 2.20 266.3 0.376E+00 2.20 8.31 2.20 0.00 490.56 0.00 2.20 267.1 0.374E+00 2.20 8.33 2.20 0.00 493.59 0.00 2.20 268.0 0.373E+00 2.20 8.36 2.20 0.00 496.63 0.00 2.20 268.8 0.372E+00 2.20 8.38 2.20 0.00 499.67 0.00 2.20 269.6 0.371E+00 2.20 8.41 2.20 0.00 502.70 0.00 2.20 270.4 0.370E+00 2.20 8.44 2.20 0.00 505.74 0.00 2.20 271.2 0.369E+00 2.20 8.46 2.20 0.00 508.77 0.00 2.20 272.0 0.368E+00 2.20 8.49 2.20 0.00 511.81 0.00 2.20 272.8 0.367E+00 2.20 8.51 2.20 0.00 514.84 0.00 2.20 273.6 0.365E+00 2.20 8.54 2.20 0.00 517.88 0.00 2.20 274.4 0.364E+00 2.20 8.56 2.20 0.00 520.91 0.00 2.20 275.2 0.363E+00 2.20 8.59 2.20 0.00 523.95 0.00 2.20 276.0 0.362E+00 2.20 8.61 2.20 0.00 526.98 0.00 2.20 276.8 0.361E+00 2.20 8.64 2.20 0.00 530.02 0.00 2.20 277.6 0.360E+00 2.20 8.66 2.20 0.00 533.05 0.00 2.20 278.4 0.359E+00 2.20 8.69 2.20 0.00 536.09 0.00 2.20 279.2 0.358E+00 2.20 8.71 2.20 0.00 539.12 0.00 2.20 280.0 0.357E+00 2.20 8.73 2.20 0.00 542.16 0.00 2.20 280.8 0.356E+00 2.20 8.76 2.20 0.00 545.19 0.00 2.20 281.6 0.355E+00 2.20 8.78 2.20 0.00 548.23 0.00 2.20 282.3 0.354E+00 2.20 8.81 2.20 0.00 551.26 0.00 2.20 283.1 0.353E+00 2.20 8.83 2.20 0.00 554.30 0.00 2.20 283.9 0.352E+00 2.20 8.86 2.20 0.00 557.33 0.00 2.20 284.7 0.351E+00 2.20 8.88 2.20 0.00 560.37 0.00 2.20 285.4 0.350E+00 2.20 8.90 2.20 0.00 563.40 0.00 2.20 286.2 0.349E+00 2.20 8.93 2.20 0.00 566.44 0.00 2.20 287.0 0.348E+00 2.20 8.95 2.20 0.00 569.47 0.00 2.20 287.7 0.348E+00 2.20 8.98 2.20 0.00 572.51 0.00 2.20 288.5 0.347E+00 2.20 9.00 2.20 0.00 575.54 0.00 2.20 289.3 0.346E+00 2.20 9.02 2.20 0.00 578.58 0.00 2.20 290.0 0.345E+00 2.20 9.05 2.20 0.00 581.61 0.00 2.20 290.8 0.344E+00 2.20 9.07 2.20 0.00 584.65 0.00 2.20 291.5 0.343E+00 2.20 9.09 2.20 0.00 587.68 0.00 2.20 292.3 0.342E+00 2.20 9.12 2.20 0.00 590.72 0.00 2.20 293.0 0.341E+00 2.20 9.14 2.20 0.00 593.76 0.00 2.20 293.8 0.340E+00 2.20 9.17 2.20 0.00 596.79 0.00 2.20 294.5 0.340E+00 2.20 9.19 2.20 0.00 599.83 0.00 2.20 295.3 0.339E+00 2.20 9.21 2.20 0.00 602.86 0.00 2.20 296.0 0.338E+00 2.20 9.23 2.20 0.00

7C-26 December 2007 North American Upgrader Project Volume 3, Appendix 7C
NORTH AMERICAN OIL SANDS CORPORATION
605.90 0.00 2.20 296.8 0.337E+00 2.20 9.26 2.20 0.00 608.93 0.00 2.20 297.5 0.336E+00 2.20 9.28 2.20 0.00 611.97 0.00 2.20 298.2 0.335E+00 2.20 9.30 2.20 0.00 615.00 0.00 2.20 299.0 0.334E+00 2.20 9.33 2.20 0.00 618.04 0.00 2.20 299.7 0.334E+00 2.20 9.35 2.20 0.00 Cumulative travel time = 975.1174 sec ----------------------------------------------------------------------------- Plume Stage 2 (bank attached): X Y Z S C BV BH ZU ZL 618.04 -9.35 2.20 299.7 0.334E+00 2.20 18.70 2.20 0.00 714.95 -9.35 2.20 305.5 0.327E+00 2.20 19.06 2.20 0.00 811.86 -9.35 2.20 311.2 0.321E+00 2.20 19.42 2.20 0.00 908.77 -9.35 2.20 316.8 0.316E+00 2.20 19.77 2.20 0.00 1005.68 -9.35 2.20 322.3 0.310E+00 2.20 20.11 2.20 0.00 1102.59 -9.35 2.20 327.7 0.305E+00 2.20 20.45 2.20 0.00 1199.49 -9.35 2.20 333.0 0.300E+00 2.20 20.78 2.20 0.00 ** REGULATORY MIXING ZONE BOUNDARY ** In this prediction interval the plume DOWNSTREAM distance meets or exceeds the regulatory value = 1293.00 m. This is the extent of the REGULATORY MIXING ZONE. 1296.40 -9.35 2.20 338.2 0.296E+00 2.20 21.10 2.20 0.00 1393.31 -9.35 2.20 343.4 0.291E+00 2.20 21.42 2.20 0.00 1490.22 -9.35 2.20 348.4 0.287E+00 2.20 21.74 2.20 0.00 1587.13 -9.35 2.20 353.4 0.283E+00 2.20 22.05 2.20 0.00 1684.04 -9.35 2.20 358.4 0.279E+00 2.20 22.36 2.20 0.00 1780.95 -9.35 2.20 363.2 0.275E+00 2.20 22.66 2.20 0.00 1877.86 -9.35 2.20 368.0 0.272E+00 2.20 22.96 2.20 0.00 1974.77 -9.35 2.20 372.8 0.268E+00 2.20 23.26 2.20 0.00 2071.68 -9.35 2.20 377.5 0.265E+00 2.20 23.55 2.20 0.00 2168.59 -9.35 2.20 382.1 0.262E+00 2.20 23.84 2.20 0.00 2265.50 -9.35 2.20 386.6 0.259E+00 2.20 24.12 2.20 0.00 2362.41 -9.35 2.20 391.2 0.256E+00 2.20 24.41 2.20 0.00 2459.32 -9.35 2.20 395.6 0.253E+00 2.20 24.68 2.20 0.00 2556.23 -9.35 2.20 400.0 0.250E+00 2.20 24.96 2.20 0.00 2653.14 -9.35 2.20 404.4 0.247E+00 2.20 25.23 2.20 0.00 2750.05 -9.35 2.20 408.7 0.245E+00 2.20 25.50 2.20 0.00 2846.96 -9.35 2.20 413.0 0.242E+00 2.20 25.77 2.20 0.00 2943.87 -9.35 2.20 417.2 0.240E+00 2.20 26.03 2.20 0.00 3040.78 -9.35 2.20 421.4 0.237E+00 2.20 26.29 2.20 0.00 3137.69 -9.35 2.20 425.5 0.235E+00 2.20 26.55 2.20 0.00 3234.60 -9.35 2.20 429.6 0.233E+00 2.20 26.81 2.20 0.00 3331.51 -9.35 2.20 433.7 0.231E+00 2.20 27.06 2.20 0.00 3428.42 -9.35 2.20 437.7 0.228E+00 2.20 27.31 2.20 0.00 3525.33 -9.35 2.20 441.7 0.226E+00 2.20 27.56 2.20 0.00 3622.24 -9.35 2.20 445.7 0.224E+00 2.20 27.81 2.20 0.00 3719.15 -9.35 2.20 449.6 0.222E+00 2.20 28.05 2.20 0.00 3816.06 -9.35 2.20 453.5 0.221E+00 2.20 28.29 2.20 0.00 3912.97 -9.35 2.20 457.3 0.219E+00 2.20 28.54 2.20 0.00 4009.88 -9.35 2.20 461.2 0.217E+00 2.20 28.77 2.20 0.00 4106.79 -9.35 2.20 465.0 0.215E+00 2.20 29.01 2.20 0.00 4203.70 -9.35 2.20 468.7 0.213E+00 2.20 29.24 2.20 0.00 4300.61 -9.35 2.20 472.4 0.212E+00 2.20 29.48 2.20 0.00

7C-27 December 2007 North American Upgrader Project Volume 3, Appendix 7C
NORTH AMERICAN OIL SANDS CORPORATION
4397.52 -9.35 2.20 476.1 0.210E+00 2.20 29.71 2.20 0.00 4494.43 -9.35 2.20 479.8 0.208E+00 2.20 29.94 2.20 0.00 4591.34 -9.35 2.20 483.5 0.207E+00 2.20 30.16 2.20 0.00 4688.25 -9.35 2.20 487.1 0.205E+00 2.20 30.39 2.20 0.00 4785.16 -9.35 2.20 490.7 0.204E+00 2.20 30.61 2.20 0.00 4882.07 -9.35 2.20 494.2 0.202E+00 2.20 30.84 2.20 0.00 4978.98 -9.35 2.20 497.8 0.201E+00 2.20 31.06 2.20 0.00 5075.89 -9.35 2.20 501.3 0.199E+00 2.20 31.28 2.20 0.00 5172.80 -9.35 2.20 504.8 0.198E+00 2.20 31.49 2.20 0.00 5269.71 -9.35 2.20 508.2 0.197E+00 2.20 31.71 2.20 0.00 5366.62 -9.35 2.20 511.7 0.195E+00 2.20 31.93 2.20 0.00 5463.53 -9.35 2.20 515.1 0.194E+00 2.20 32.14 2.20 0.00 5560.44 -9.35 2.20 518.5 0.193E+00 2.20 32.35 2.20 0.00 5657.35 -9.35 2.20 521.9 0.192E+00 2.20 32.56 2.20 0.00 5754.26 -9.35 2.20 525.2 0.190E+00 2.20 32.77 2.20 0.00 5851.17 -9.35 2.20 528.5 0.189E+00 2.20 32.98 2.20 0.00 5948.07 -9.35 2.20 531.9 0.188E+00 2.20 33.18 2.20 0.00 6044.98 -9.35 2.20 535.1 0.187E+00 2.20 33.39 2.20 0.00 6141.89 -9.35 2.20 538.4 0.186E+00 2.20 33.59 2.20 0.00 6238.80 -9.35 2.20 541.7 0.185E+00 2.20 33.80 2.20 0.00 6335.71 -9.35 2.20 544.9 0.184E+00 2.20 34.00 2.20 0.00 6432.62 -9.35 2.20 548.1 0.182E+00 2.20 34.20 2.20 0.00 6529.53 -9.35 2.20 551.3 0.181E+00 2.20 34.40 2.20 0.00 6626.44 -9.35 2.20 554.5 0.180E+00 2.20 34.60 2.20 0.00 6723.35 -9.35 2.20 557.6 0.179E+00 2.20 34.79 2.20 0.00 6820.26 -9.35 2.20 560.8 0.178E+00 2.20 34.99 2.20 0.00 6917.17 -9.35 2.20 563.9 0.177E+00 2.20 35.18 2.20 0.00 7014.08 -9.35 2.20 567.0 0.176E+00 2.20 35.38 2.20 0.00 7110.99 -9.35 2.20 570.1 0.175E+00 2.20 35.57 2.20 0.00 7207.90 -9.35 2.20 573.1 0.174E+00 2.20 35.76 2.20 0.00 7304.81 -9.35 2.20 576.2 0.174E+00 2.20 35.95 2.20 0.00 7401.72 -9.35 2.20 579.2 0.173E+00 2.20 36.14 2.20 0.00 7498.63 -9.35 2.20 582.3 0.172E+00 2.20 36.33 2.20 0.00 7595.54 -9.35 2.20 585.3 0.171E+00 2.20 36.52 2.20 0.00 7692.45 -9.35 2.20 588.3 0.170E+00 2.20 36.70 2.20 0.00 7789.36 -9.35 2.20 591.2 0.169E+00 2.20 36.89 2.20 0.00 7886.27 -9.35 2.20 594.2 0.168E+00 2.20 37.07 2.20 0.00 7983.18 -9.35 2.20 597.1 0.167E+00 2.20 37.26 2.20 0.00 8080.09 -9.35 2.20 600.1 0.167E+00 2.20 37.44 2.20 0.00 8177.00 -9.35 2.20 603.0 0.166E+00 2.20 37.62 2.20 0.00 8273.91 -9.35 2.20 605.9 0.165E+00 2.20 37.80 2.20 0.00 8370.82 -9.35 2.20 608.8 0.164E+00 2.20 37.98 2.20 0.00 8467.73 -9.35 2.20 611.7 0.163E+00 2.20 38.16 2.20 0.00 8564.64 -9.35 2.20 614.5 0.163E+00 2.20 38.34 2.20 0.00 8661.55 -9.35 2.20 617.4 0.162E+00 2.20 38.52 2.20 0.00 8758.46 -9.35 2.20 620.2 0.161E+00 2.20 38.70 2.20 0.00 8855.37 -9.35 2.20 623.0 0.161E+00 2.20 38.87 2.20 0.00 8952.28 -9.35 2.20 625.8 0.160E+00 2.20 39.05 2.20 0.00 9049.19 -9.35 2.20 628.6 0.159E+00 2.20 39.22 2.20 0.00 9146.10 -9.35 2.20 631.4 0.158E+00 2.20 39.40 2.20 0.00 9243.01 -9.35 2.20 634.2 0.158E+00 2.20 39.57 2.20 0.00 9339.92 -9.35 2.20 637.0 0.157E+00 2.20 39.74 2.20 0.00 9436.83 -9.35 2.20 639.7 0.156E+00 2.20 39.91 2.20 0.00

7C-28 December 2007 North American Upgrader Project Volume 3, Appendix 7C
NORTH AMERICAN OIL SANDS CORPORATION
9533.74 -9.35 2.20 642.4 0.156E+00 2.20 40.08 2.20 0.00 9630.65 -9.35 2.20 645.2 0.155E+00 2.20 40.25 2.20 0.00 9727.56 -9.35 2.20 647.9 0.154E+00 2.20 40.42 2.20 0.00 9824.47 -9.35 2.20 650.6 0.154E+00 2.20 40.59 2.20 0.00 9921.38 -9.35 2.20 653.3 0.153E+00 2.20 40.76 2.20 0.00 10018.29 -9.35 2.20 656.0 0.152E+00 2.20 40.93 2.20 0.00 10115.20 -9.35 2.20 658.6 0.152E+00 2.20 41.09 2.20 0.00 10212.11 -9.35 2.20 661.3 0.151E+00 2.20 41.26 2.20 0.00 10309.02 -9.35 2.20 663.9 0.151E+00 2.20 41.43 2.20 0.00 10405.93 -9.35 2.20 666.6 0.150E+00 2.20 41.59 2.20 0.00 10502.84 -9.35 2.20 669.2 0.149E+00 2.20 41.75 2.20 0.00 10599.75 -9.35 2.20 671.8 0.149E+00 2.20 41.92 2.20 0.00 10696.66 -9.35 2.20 674.4 0.148E+00 2.20 42.08 2.20 0.00 10793.57 -9.35 2.20 677.0 0.148E+00 2.20 42.24 2.20 0.00 10890.48 -9.35 2.20 679.6 0.147E+00 2.20 42.40 2.20 0.00 10987.39 -9.35 2.20 682.2 0.147E+00 2.20 42.56 2.20 0.00 11084.30 -9.35 2.20 684.8 0.146E+00 2.20 42.72 2.20 0.00 11181.21 -9.35 2.20 687.3 0.145E+00 2.20 42.88 2.20 0.00 11278.12 -9.35 2.20 689.9 0.145E+00 2.20 43.04 2.20 0.00 11375.03 -9.35 2.20 692.4 0.144E+00 2.20 43.20 2.20 0.00 11471.94 -9.35 2.20 694.9 0.144E+00 2.20 43.36 2.20 0.00 11568.85 -9.35 2.20 697.5 0.143E+00 2.20 43.52 2.20 0.00 11665.76 -9.35 2.20 700.0 0.143E+00 2.20 43.67 2.20 0.00 11762.67 -9.35 2.20 702.5 0.142E+00 2.20 43.83 2.20 0.00 11859.58 -9.35 2.20 705.0 0.142E+00 2.20 43.99 2.20 0.00 11956.49 -9.35 2.20 707.4 0.141E+00 2.20 44.14 2.20 0.00 12053.40 -9.35 2.20 709.9 0.141E+00 2.20 44.29 2.20 0.00 12150.31 -9.35 2.20 712.4 0.140E+00 2.20 44.45 2.20 0.00 12247.22 -9.35 2.20 714.9 0.140E+00 2.20 44.60 2.20 0.00 12344.13 -9.35 2.20 717.3 0.139E+00 2.20 44.75 2.20 0.00 12441.04 -9.35 2.20 719.7 0.139E+00 2.20 44.91 2.20 0.00 12537.95 -9.35 2.20 722.2 0.138E+00 2.20 45.06 2.20 0.00 12634.86 -9.35 2.20 724.6 0.138E+00 2.20 45.21 2.20 0.00 12731.77 -9.35 2.20 727.0 0.138E+00 2.20 45.36 2.20 0.00 12828.68 -9.35 2.20 729.4 0.137E+00 2.20 45.51 2.20 0.00 12925.59 -9.35 2.20 731.8 0.137E+00 2.20 45.66 2.20 0.00 13022.50 -9.35 2.20 734.2 0.136E+00 2.20 45.81 2.20 0.00 13119.42 -9.35 2.20 736.6 0.136E+00 2.20 45.96 2.20 0.00 13216.33 -9.35 2.20 739.0 0.135E+00 2.20 46.11 2.20 0.00 13313.24 -9.35 2.20 741.4 0.135E+00 2.20 46.26 2.20 0.00 13410.15 -9.35 2.20 743.7 0.134E+00 2.20 46.40 2.20 0.00 13507.06 -9.35 2.20 746.1 0.134E+00 2.20 46.55 2.20 0.00 13603.97 -9.35 2.20 748.4 0.134E+00 2.20 46.70 2.20 0.00 13700.88 -9.35 2.20 750.8 0.133E+00 2.20 46.84 2.20 0.00 13797.79 -9.35 2.20 753.1 0.133E+00 2.20 46.99 2.20 0.00 13894.70 -9.35 2.20 755.4 0.132E+00 2.20 47.13 2.20 0.00 13991.61 -9.35 2.20 757.8 0.132E+00 2.20 47.28 2.20 0.00 14088.52 -9.35 2.20 760.1 0.132E+00 2.20 47.42 2.20 0.00 14185.43 -9.35 2.20 762.4 0.131E+00 2.20 47.57 2.20 0.00 14282.34 -9.35 2.20 764.7 0.131E+00 2.20 47.71 2.20 0.00 14379.25 -9.35 2.20 767.0 0.130E+00 2.20 47.85 2.20 0.00 14476.16 -9.35 2.20 769.2 0.130E+00 2.20 48.00 2.20 0.00 14573.07 -9.35 2.20 771.5 0.130E+00 2.20 48.14 2.20 0.00 14669.98 -9.35 2.20 773.8 0.129E+00 2.20 48.28 2.20 0.00

7C-29 December 2007 North American Upgrader Project Volume 3, Appendix 7C
NORTH AMERICAN OIL SANDS CORPORATION
14766.89 -9.35 2.20 776.1 0.129E+00 2.20 48.42 2.20 0.00 14863.80 -9.35 2.20 778.3 0.128E+00 2.20 48.56 2.20 0.00 14960.71 -9.35 2.20 780.6 0.128E+00 2.20 48.70 2.20 0.00 15057.62 -9.35 2.20 782.8 0.128E+00 2.20 48.84 2.20 0.00 15154.53 -9.35 2.20 785.1 0.127E+00 2.20 48.98 2.20 0.00 15251.44 -9.35 2.20 787.3 0.127E+00 2.20 49.12 2.20 0.00 15348.35 -9.35 2.20 789.5 0.127E+00 2.20 49.26 2.20 0.00 15445.26 -9.35 2.20 791.7 0.126E+00 2.20 49.40 2.20 0.00 15542.17 -9.35 2.20 793.9 0.126E+00 2.20 49.54 2.20 0.00 15639.08 -9.35 2.20 796.2 0.126E+00 2.20 49.67 2.20 0.00 15735.99 -9.35 2.20 798.4 0.125E+00 2.20 49.81 2.20 0.00 15832.90 -9.35 2.20 800.5 0.125E+00 2.20 49.95 2.20 0.00 15929.81 -9.35 2.20 802.7 0.125E+00 2.20 50.09 2.20 0.00 16026.72 -9.35 2.20 804.9 0.124E+00 2.20 50.22 2.20 0.00 16123.63 -9.35 2.20 807.1 0.124E+00 2.20 50.36 2.20 0.00 16220.54 -9.35 2.20 809.3 0.124E+00 2.20 50.49 2.20 0.00 16317.45 -9.35 2.20 811.4 0.123E+00 2.20 50.63 2.20 0.00 16414.36 -9.35 2.20 813.6 0.123E+00 2.20 50.76 2.20 0.00 16511.27 -9.35 2.20 815.7 0.123E+00 2.20 50.90 2.20 0.00 16608.18 -9.35 2.20 817.9 0.122E+00 2.20 51.03 2.20 0.00 16705.09 -9.35 2.20 820.0 0.122E+00 2.20 51.17 2.20 0.00 16802.00 -9.35 2.20 822.2 0.122E+00 2.20 51.30 2.20 0.00 16898.91 -9.35 2.20 824.3 0.121E+00 2.20 51.43 2.20 0.00 16995.82 -9.35 2.20 826.4 0.121E+00 2.20 51.56 2.20 0.00 17092.73 -9.35 2.20 828.6 0.121E+00 2.20 51.70 2.20 0.00 17189.64 -9.35 2.20 830.7 0.120E+00 2.20 51.83 2.20 0.00 17286.55 -9.35 2.20 832.8 0.120E+00 2.20 51.96 2.20 0.00 17383.46 -9.35 2.20 834.9 0.120E+00 2.20 52.09 2.20 0.00 17480.37 -9.35 2.20 837.0 0.119E+00 2.20 52.22 2.20 0.00 17577.28 -9.35 2.20 839.1 0.119E+00 2.20 52.35 2.20 0.00 17674.19 -9.35 2.20 841.2 0.119E+00 2.20 52.48 2.20 0.00 17771.10 -9.35 2.20 843.3 0.119E+00 2.20 52.61 2.20 0.00 17868.01 -9.35 2.20 845.3 0.118E+00 2.20 52.74 2.20 0.00 17964.92 -9.35 2.20 847.4 0.118E+00 2.20 52.87 2.20 0.00 18061.83 -9.35 2.20 849.5 0.118E+00 2.20 53.00 2.20 0.00 18158.74 -9.35 2.20 851.5 0.117E+00 2.20 53.13 2.20 0.00 18255.65 -9.35 2.20 853.6 0.117E+00 2.20 53.26 2.20 0.00 18352.56 -9.35 2.20 855.6 0.117E+00 2.20 53.39 2.20 0.00 18449.47 -9.35 2.20 857.7 0.117E+00 2.20 53.51 2.20 0.00 18546.38 -9.35 2.20 859.7 0.116E+00 2.20 53.64 2.20 0.00 18643.29 -9.35 2.20 861.8 0.116E+00 2.20 53.77 2.20 0.00 18740.20 -9.35 2.20 863.8 0.116E+00 2.20 53.90 2.20 0.00 18837.11 -9.35 2.20 865.8 0.115E+00 2.20 54.02 2.20 0.00 18934.02 -9.35 2.20 867.9 0.115E+00 2.20 54.15 2.20 0.00 19030.93 -9.35 2.20 869.9 0.115E+00 2.20 54.28 2.20 0.00 19127.84 -9.35 2.20 871.9 0.115E+00 2.20 54.40 2.20 0.00 19224.75 -9.35 2.20 873.9 0.114E+00 2.20 54.53 2.20 0.00 19321.66 -9.35 2.20 875.9 0.114E+00 2.20 54.65 2.20 0.00 19418.57 -9.35 2.20 877.9 0.114E+00 2.20 54.78 2.20 0.00 19515.48 -9.35 2.20 879.9 0.114E+00 2.20 54.90 2.20 0.00 19612.39 -9.35 2.20 881.9 0.113E+00 2.20 55.03 2.20 0.00 19709.30 -9.35 2.20 883.9 0.113E+00 2.20 55.15 2.20 0.00 19806.21 -9.35 2.20 885.9 0.113E+00 2.20 55.27 2.20 0.00 19903.12 -9.35 2.20 887.9 0.113E+00 2.20 55.40 2.20 0.00

7C-30 December 2007 North American Upgrader Project Volume 3, Appendix 7C
NORTH AMERICAN OIL SANDS CORPORATION
20000.04 -9.35 2.20 889.8 0.112E+00 2.20 55.52 2.20 0.00 Cumulative travel time = 31023.3711 sec Simulation limit based on maximum specified distance = 20000.00 m. This is the REGION OF INTEREST limitation. END OF MOD261: PASSIVE AMBIENT MIXING IN UNIFORM AMBIENT ----------------------------------------------------------------------------- ----------------------------------------------------------------------------- CORMIX2: Multiport Diffuser Discharges End of Prediction File 22222222222222222222222222222222222222222222222222222222222222222222222222222

7C-31 December 2007 North American Upgrader Project Volume 3, Appendix 7C
NORTH AMERICAN OIL SANDS CORPORATION
CORMIX Temperature Simulation - 7Q10 flow 22222222222222222222222222222222222222222222222222222222222222222222222222222 CORMIX MIXING ZONE EXPERT SYSTEM Subsystem CORMIX2: Multiport Diffuser Discharges CORMIX Version 5.0GT HYDRO2 Version 5.0.0.0 March 2007 ----------------------------------------------------------------------------- ----------------------------------------------------------------------------- CASE DESCRIPTION Site name/label: Sturgeon upgrader Design case: 7Q10 flows FILE NAME: \\S...run_North American_multiport_10_temp_new flow.prd Time stamp: Wed Oct 31 17:00:56 2007 ENVIRONMENT PARAMETERS (metric units) Bounded section BS = 100.00 AS = 100.00 QA = 60.00 ICHREG= 1 HA = 1.00 HD = 1.30 UA = 0.600 F = 0.066 USTAR =0.5449E-01 UW = 2.000 UWSTAR=0.2198E-02 Uniform density environment STRCND= U RHOAM = 999.9750 DIFFUSER DISCHARGE PARAMETERS (metric units) Diffuser type: DITYPE= alternating_perpendicular BANK = RIGHT DISTB = 9.35 YB1 = 8.00 YB2 = 10.70 LD = 2.70 NOPEN = 10 SPAC = 0.30 D0 = 0.100 A0 = 0.008 H0 = 0.30 SUB0 = 1.00 Nozzle/port arrangement: near_vertical_discharge GAMMA = 90.00 THETA = 90.00 SIGMA = 0.00 BETA = 90.00 U0 = 1.127 Q0 = 0.089 =0.8850E-01 RHO0 = 997.2973 DRHO0 =0.2678E+01 GP0 =0.2626E-01 C0 =0.2000E+02 CUNITS= deg.C IPOLL = 3 KS =0.2388E-05 KD =0.0000E+00 FLUX VARIABLES - PER UNIT DIFFUSER LENGTH (metric units) q0 =0.3278E-01 m0 =0.3693E-01 j0 =0.8607E-03 SIGNJ0= 1.0 Associated 2-d length scales (meters) lQ=B = 0.029 lM = 4.08 lm = 0.10 lmp = 99999.00 lbp = 99999.00 la = 99999.00 FLUX VARIABLES - ENTIRE DIFFUSER (metric units) Q0 =0.8850E-01 M0 =0.9972E-01 J0 =0.2324E-02 Associated 3-d length scales (meters) LQ = 0.09 LM = 3.68 Lm = 0.53 Lb = 0.01 Lmp = 99999.00 Lbp = 99999.00 NON-DIMENSIONAL PARAMETERS FR0 = 40.77 FRD0 = 21.99 R = 1.88 PL = 2. (slot) (port/nozzle) FLOW CLASSIFICATION 222222222222222222222222222222222222222222

7C-32 December 2007 North American Upgrader Project Volume 3, Appendix 7C
NORTH AMERICAN OIL SANDS CORPORATION
2 Flow class (CORMIX2) = MU8 2 2 Applicable layer depth HS = 1.30 2 222222222222222222222222222222222222222222 MIXING ZONE / TOXIC DILUTION / REGION OF INTEREST PARAMETERS C0 =0.2000E+02 CUNITS= deg.C NTOX = 0 NSTD = 0 REGMZ = 1 REGSPC= 1 XREG = 1293.00 WREG = 0.00 AREG = 0.00 XINT = 20000.00 XMAX = 20000.00 X-Y-Z COORDINATE SYSTEM: ORIGIN is located at the bottom and the diffuser mid-point: 9.35 m from the RIGHT bank/shore. X-axis points downstream, Y-axis points to left, Z-axis points upward. NSTEP = 200 display intervals per module NOTE on dilution/concentration values for this HEATED DISCHARGE (IPOLL=3): S = hydrodynamic dilutions, include buoyancy (heat) loss effects, but provided plume has surface contact C = corresponding temperature values (always in "degC"!), include heat loss, if any ----------------------------------------------------------------------------- ----------------------------------------------------------------------------- BEGIN MOD201: DIFFUSER DISCHARGE MODULE Due to complex near-field motions: EQUIVALENT SLOT DIFFUSER (2-D) GEOMETRY Profile definitions: BV = Gaussian 1/e (37%) half-width, in vertical plane normal to trajectory BH = top-hat half-width, in horizontal plane normal to trajectory S = hydrodynamic centerline dilution C = centerline concentration (includes reaction effects, if any) X Y Z S C BV BH 0.00 0.00 0.30 1.0 0.200E+02 0.02 1.35 END OF MOD201: DIFFUSER DISCHARGE MODULE ----------------------------------------------------------------------------- ----------------------------------------------------------------------------- BEGIN MOD277: UNSTABLE NEAR-FIELD ZONE OF ALTERNATING PERPENDICULAR DIFFUSER Because of the strong ambient current the diffuser plume of this crossflowing discharge gets RAPIDLY DEFLECTED. A near-field zone is formed that is VERTICALLY FULLY MIXED over the entire layer depth. Full mixing is achieved at a downstream distance of about five (5) layer depths. Profile definitions: BV = layer depth (vertically mixed) BH = top-hat half-width, measured horizontally in Y-direction S = hydrodynamic average (bulk) dilution C = average (bulk) concentration (includes reaction effects, if any)

7C-33 December 2007 North American Upgrader Project Volume 3, Appendix 7C
NORTH AMERICAN OIL SANDS CORPORATION
X Y Z S C BV BH 0.00 0.00 0.30 1.0 0.200E+02 0.02 1.35 0.03 0.00 0.30 2.6 0.764E+01 0.03 1.35 0.06 0.00 0.30 3.3 0.608E+01 0.04 1.35 0.10 0.00 0.31 3.8 0.526E+01 0.04 1.35 0.13 0.00 0.31 4.2 0.472E+01 0.05 1.35 0.16 0.00 0.31 4.6 0.433E+01 0.06 1.35 0.19 0.00 0.31 5.0 0.403E+01 0.06 1.35 0.23 0.00 0.31 5.3 0.379E+01 0.07 1.35 0.26 0.00 0.31 5.6 0.359E+01 0.07 1.35 0.29 0.00 0.32 5.9 0.342E+01 0.08 1.35 0.32 0.00 0.32 6.1 0.327E+01 0.09 1.35 0.36 0.00 0.32 6.4 0.314E+01 0.09 1.35 0.39 0.00 0.32 6.6 0.303E+01 0.10 1.35 0.42 0.00 0.32 6.8 0.293E+01 0.11 1.35 0.45 0.00 0.32 7.1 0.284E+01 0.11 1.35 0.49 0.00 0.33 7.3 0.275E+01 0.12 1.35 0.52 0.00 0.33 7.5 0.268E+01 0.13 1.35 0.55 0.00 0.33 7.7 0.261E+01 0.13 1.35 0.59 0.00 0.33 7.9 0.254E+01 0.14 1.35 0.62 0.00 0.33 8.0 0.248E+01 0.14 1.35 0.65 0.00 0.34 8.2 0.243E+01 0.15 1.35 0.68 0.00 0.34 8.4 0.238E+01 0.16 1.35 0.72 0.00 0.34 8.6 0.233E+01 0.16 1.35 0.75 0.00 0.34 8.8 0.228E+01 0.17 1.35 0.78 0.00 0.34 8.9 0.224E+01 0.18 1.35 0.81 0.00 0.34 9.1 0.220E+01 0.18 1.35 0.85 0.00 0.35 9.2 0.216E+01 0.19 1.35 0.88 0.00 0.35 9.4 0.213E+01 0.20 1.35 0.91 0.00 0.35 9.6 0.209E+01 0.20 1.35 0.94 0.00 0.35 9.7 0.206E+01 0.21 1.35 0.98 0.00 0.35 9.9 0.203E+01 0.21 1.35 1.01 0.00 0.35 10.0 0.200E+01 0.22 1.35 1.04 0.00 0.36 10.1 0.197E+01 0.23 1.35 1.07 0.00 0.36 10.3 0.194E+01 0.23 1.35 1.11 0.00 0.36 10.4 0.192E+01 0.24 1.35 1.14 0.00 0.36 10.6 0.189E+01 0.25 1.35 1.17 0.00 0.36 10.7 0.187E+01 0.25 1.35 1.20 0.00 0.36 10.8 0.185E+01 0.26 1.35 1.24 0.00 0.37 11.0 0.182E+01 0.27 1.35 1.27 0.00 0.37 11.1 0.180E+01 0.27 1.35 1.30 0.00 0.37 11.2 0.178E+01 0.28 1.35 1.33 0.00 0.37 11.4 0.176E+01 0.28 1.35 1.37 0.00 0.37 11.5 0.174E+01 0.29 1.35 1.40 0.00 0.38 11.6 0.172E+01 0.30 1.35 1.43 0.00 0.38 11.7 0.171E+01 0.30 1.35 1.46 0.00 0.38 11.8 0.169E+01 0.31 1.35 1.50 0.00 0.38 12.0 0.167E+01 0.32 1.35 1.53 0.00 0.38 12.1 0.165E+01 0.32 1.35 1.56 0.00 0.38 12.2 0.164E+01 0.33 1.35 1.59 0.00 0.39 12.3 0.162E+01 0.34 1.35 1.63 0.00 0.39 12.4 0.161E+01 0.34 1.35 1.66 0.00 0.39 12.5 0.159E+01 0.35 1.35

7C-34 December 2007 North American Upgrader Project Volume 3, Appendix 7C
NORTH AMERICAN OIL SANDS CORPORATION
1.69 0.00 0.39 12.7 0.158E+01 0.36 1.35 1.72 0.00 0.39 12.8 0.157E+01 0.36 1.35 1.76 0.00 0.39 12.9 0.155E+01 0.37 1.35 1.79 0.00 0.40 13.0 0.154E+01 0.37 1.35 1.82 0.00 0.40 13.1 0.153E+01 0.38 1.35 1.85 0.00 0.40 13.2 0.151E+01 0.39 1.35 1.89 0.00 0.40 13.3 0.150E+01 0.39 1.35 1.92 0.00 0.40 13.4 0.149E+01 0.40 1.35 1.95 0.00 0.41 13.5 0.148E+01 0.41 1.35 1.98 0.00 0.41 13.6 0.147E+01 0.41 1.35 2.02 0.00 0.41 13.7 0.146E+01 0.42 1.35 2.05 0.00 0.41 13.8 0.145E+01 0.43 1.35 2.08 0.00 0.41 13.9 0.143E+01 0.43 1.35 2.11 0.00 0.41 14.0 0.142E+01 0.44 1.35 2.15 0.00 0.42 14.1 0.141E+01 0.44 1.35 2.18 0.00 0.42 14.2 0.140E+01 0.45 1.35 2.21 0.00 0.42 14.3 0.140E+01 0.46 1.35 2.24 0.00 0.42 14.4 0.139E+01 0.46 1.35 2.28 0.00 0.42 14.5 0.138E+01 0.47 1.35 2.31 0.00 0.42 14.6 0.137E+01 0.48 1.35 2.34 0.00 0.43 14.7 0.136E+01 0.48 1.35 2.37 0.00 0.43 14.8 0.135E+01 0.49 1.35 2.41 0.00 0.43 14.9 0.134E+01 0.50 1.35 2.44 0.00 0.43 15.0 0.133E+01 0.50 1.35 2.47 0.00 0.43 15.1 0.132E+01 0.51 1.35 2.50 0.00 0.43 15.2 0.132E+01 0.51 1.35 2.54 0.00 0.44 15.3 0.131E+01 0.52 1.35 2.57 0.00 0.44 15.4 0.130E+01 0.53 1.35 2.60 0.00 0.44 15.5 0.129E+01 0.53 1.35 2.63 0.00 0.44 15.6 0.129E+01 0.54 1.35 2.67 0.00 0.44 15.6 0.128E+01 0.55 1.35 2.70 0.00 0.45 15.7 0.127E+01 0.55 1.35 2.73 0.00 0.45 15.8 0.126E+01 0.56 1.35 2.76 0.00 0.45 15.9 0.126E+01 0.57 1.35 2.80 0.00 0.45 16.0 0.125E+01 0.57 1.35 2.83 0.00 0.45 16.1 0.124E+01 0.58 1.35 2.86 0.00 0.45 16.2 0.124E+01 0.58 1.35 2.89 0.00 0.46 16.3 0.123E+01 0.59 1.35 2.93 0.00 0.46 16.3 0.122E+01 0.60 1.35 2.96 0.00 0.46 16.4 0.122E+01 0.60 1.35 2.99 0.00 0.46 16.5 0.121E+01 0.61 1.35 3.02 0.00 0.46 16.6 0.121E+01 0.62 1.35 3.06 0.00 0.46 16.7 0.120E+01 0.62 1.35 3.09 0.00 0.47 16.8 0.119E+01 0.63 1.35 3.12 0.00 0.47 16.8 0.119E+01 0.64 1.35 3.15 0.00 0.47 16.9 0.118E+01 0.64 1.35 3.19 0.00 0.47 17.0 0.118E+01 0.65 1.35 3.22 0.00 0.47 17.1 0.117E+01 0.66 1.35 3.25 0.00 0.48 17.2 0.116E+01 0.66 1.35 3.28 0.00 0.48 17.3 0.116E+01 0.67 1.35 3.32 0.00 0.48 17.3 0.115E+01 0.67 1.35 3.35 0.00 0.48 17.4 0.115E+01 0.68 1.35 3.38 0.00 0.48 17.5 0.114E+01 0.69 1.35

7C-35 December 2007 North American Upgrader Project Volume 3, Appendix 7C
NORTH AMERICAN OIL SANDS CORPORATION
3.41 0.00 0.48 17.6 0.114E+01 0.69 1.35 3.45 0.00 0.49 17.7 0.113E+01 0.70 1.35 3.48 0.00 0.49 17.7 0.113E+01 0.71 1.35 3.51 0.00 0.49 17.8 0.112E+01 0.71 1.35 3.54 0.00 0.49 17.9 0.112E+01 0.72 1.35 3.58 0.00 0.49 18.0 0.111E+01 0.73 1.35 3.61 0.00 0.49 18.0 0.111E+01 0.73 1.35 3.64 0.00 0.50 18.1 0.110E+01 0.74 1.35 3.67 0.00 0.50 18.2 0.110E+01 0.74 1.35 3.71 0.00 0.50 18.3 0.109E+01 0.75 1.35 3.74 0.00 0.50 18.3 0.109E+01 0.76 1.35 3.77 0.00 0.50 18.4 0.109E+01 0.76 1.35 3.80 0.00 0.50 18.5 0.108E+01 0.77 1.35 3.84 0.00 0.51 18.6 0.108E+01 0.78 1.35 3.87 0.00 0.51 18.6 0.107E+01 0.78 1.35 3.90 0.00 0.51 18.7 0.107E+01 0.79 1.35 3.93 0.00 0.51 18.8 0.106E+01 0.80 1.35 3.97 0.00 0.51 18.9 0.106E+01 0.80 1.35 4.00 0.00 0.52 18.9 0.106E+01 0.81 1.35 4.03 0.00 0.52 19.0 0.105E+01 0.81 1.35 4.06 0.00 0.52 19.1 0.105E+01 0.82 1.35 4.10 0.00 0.52 19.2 0.104E+01 0.83 1.35 4.13 0.00 0.52 19.2 0.104E+01 0.83 1.35 4.16 0.00 0.52 19.3 0.104E+01 0.84 1.35 4.19 0.00 0.53 19.4 0.103E+01 0.85 1.35 4.23 0.00 0.53 19.4 0.103E+01 0.85 1.35 4.26 0.00 0.53 19.5 0.103E+01 0.86 1.35 4.29 0.00 0.53 19.6 0.102E+01 0.87 1.35 4.32 0.00 0.53 19.7 0.102E+01 0.87 1.35 4.36 0.00 0.53 19.7 0.101E+01 0.88 1.35 4.39 0.00 0.54 19.8 0.101E+01 0.89 1.35 4.42 0.00 0.54 19.9 0.101E+01 0.89 1.35 4.45 0.00 0.54 19.9 0.100E+01 0.90 1.35 4.49 0.00 0.54 20.0 0.100E+01 0.90 1.35 4.52 0.00 0.54 20.1 0.997E+00 0.91 1.35 4.55 0.00 0.54 20.1 0.993E+00 0.92 1.35 4.58 0.00 0.55 20.2 0.990E+00 0.92 1.35 4.61 0.00 0.55 20.3 0.987E+00 0.93 1.35 4.65 0.00 0.55 20.3 0.983E+00 0.94 1.35 4.68 0.00 0.55 20.4 0.980E+00 0.94 1.35 4.71 0.00 0.55 20.5 0.977E+00 0.95 1.35 4.74 0.00 0.56 20.5 0.974E+00 0.96 1.35 4.78 0.00 0.56 20.6 0.970E+00 0.96 1.35 4.81 0.00 0.56 20.7 0.967E+00 0.97 1.35 4.84 0.00 0.56 20.7 0.964E+00 0.97 1.35 4.87 0.00 0.56 20.8 0.961E+00 0.98 1.35 4.91 0.00 0.56 20.9 0.958E+00 0.99 1.35 4.94 0.00 0.57 20.9 0.955E+00 0.99 1.35 4.97 0.00 0.57 21.0 0.952E+00 1.00 1.35 5.00 0.00 0.57 21.1 0.949E+00 1.01 1.35 5.04 0.00 0.57 21.1 0.946E+00 1.01 1.35 5.07 0.00 0.57 21.2 0.943E+00 1.02 1.35 5.10 0.00 0.57 21.3 0.941E+00 1.03 1.35 5.13 0.00 0.58 21.3 0.938E+00 1.03 1.35

7C-36 December 2007 North American Upgrader Project Volume 3, Appendix 7C
NORTH AMERICAN OIL SANDS CORPORATION
5.17 0.00 0.58 21.4 0.935E+00 1.04 1.35 5.20 0.00 0.58 21.5 0.932E+00 1.04 1.35 5.23 0.00 0.58 21.5 0.929E+00 1.05 1.35 5.26 0.00 0.58 21.6 0.927E+00 1.06 1.35 5.30 0.00 0.59 21.6 0.924E+00 1.06 1.35 5.33 0.00 0.59 21.7 0.921E+00 1.07 1.35 5.36 0.00 0.59 21.8 0.919E+00 1.08 1.35 5.39 0.00 0.59 21.8 0.916E+00 1.08 1.35 5.43 0.00 0.59 21.9 0.913E+00 1.09 1.35 5.46 0.00 0.59 22.0 0.911E+00 1.10 1.35 5.49 0.00 0.60 22.0 0.908E+00 1.10 1.35 5.52 0.00 0.60 22.1 0.906E+00 1.11 1.35 5.56 0.00 0.60 22.1 0.903E+00 1.11 1.35 5.59 0.00 0.60 22.2 0.900E+00 1.12 1.35 5.62 0.00 0.60 22.3 0.898E+00 1.13 1.35 5.65 0.00 0.60 22.3 0.896E+00 1.13 1.35 5.69 0.00 0.61 22.4 0.893E+00 1.14 1.35 5.72 0.00 0.61 22.5 0.891E+00 1.15 1.35 5.75 0.00 0.61 22.5 0.888E+00 1.15 1.35 5.78 0.00 0.61 22.6 0.886E+00 1.16 1.35 5.82 0.00 0.61 22.6 0.883E+00 1.17 1.35 5.85 0.00 0.61 22.7 0.881E+00 1.17 1.35 5.88 0.00 0.62 22.8 0.879E+00 1.18 1.35 5.91 0.00 0.62 22.8 0.877E+00 1.19 1.35 5.95 0.00 0.62 22.9 0.874E+00 1.19 1.35 5.98 0.00 0.62 22.9 0.872E+00 1.20 1.35 6.01 0.00 0.62 23.0 0.870E+00 1.20 1.35 6.04 0.00 0.63 23.1 0.867E+00 1.21 1.35 6.08 0.00 0.63 23.1 0.865E+00 1.22 1.35 6.11 0.00 0.63 23.2 0.863E+00 1.22 1.35 6.14 0.00 0.63 23.2 0.861E+00 1.23 1.35 6.17 0.00 0.63 23.3 0.859E+00 1.24 1.35 6.21 0.00 0.63 23.4 0.857E+00 1.24 1.35 6.24 0.00 0.64 23.4 0.854E+00 1.25 1.35 6.27 0.00 0.64 23.5 0.852E+00 1.26 1.35 6.30 0.00 0.64 23.5 0.850E+00 1.26 1.35 6.34 0.00 0.64 23.6 0.848E+00 1.27 1.35 6.37 0.00 0.64 23.6 0.846E+00 1.27 1.35 6.40 0.00 0.64 23.7 0.844E+00 1.28 1.35 6.43 0.00 0.65 23.8 0.842E+00 1.29 1.35 6.47 0.00 0.65 23.8 0.840E+00 1.29 1.35 6.50 0.00 0.65 23.9 0.838E+00 1.30 1.35 Cumulative travel time = 21.5988 sec Plume centerline may exhibit slight discontinuities in transition to subsequent far-field module. END OF MOD277: UNSTABLE NEAR-FIELD ZONE OF ALTERNATING PERPENDICULAR DIFFUSER ----------------------------------------------------------------------------- ** End of NEAR-FIELD REGION (NFR) ** ----------------------------------------------------------------------------- BEGIN MOD241: BUOYANT AMBIENT SPREADING Discharge is non-buoyant or weakly buoyant. Therefore BUOYANT SPREADING REGIME is ABSENT.

7C-37 December 2007 North American Upgrader Project Volume 3, Appendix 7C
NORTH AMERICAN OIL SANDS CORPORATION
END OF MOD241: BUOYANT AMBIENT SPREADING ----------------------------------------------------------------------------- Due to the attachment or proximity of the plume tothe bottom, the bottom coordinate for the FAR-FIELD differs from the ambient depth, ZFB = 0 m. In a subsequent analysis set "depth at discharge" equal to "ambient depth". ----------------------------------------------------------------------------- BEGIN MOD261: PASSIVE AMBIENT MIXING IN UNIFORM AMBIENT Vertical diffusivity (initial value) = 0.142E-01 m^2/s Horizontal diffusivity (initial value) = 0.177E-01 m^2/s Profile definitions: BV = Gaussian s.d.*sqrt(pi/2) (46%) thickness, measured vertically = or equal to layer depth, if fully mixed BH = Gaussian s.d.*sqrt(pi/2) (46%) half-width, measured horizontally in Y-direction ZU = upper plume boundary (Z-coordinate) ZL = lower plume boundary (Z-coordinate) S = hydrodynamic centerline dilution C = centerline concentration (includes reaction effects, if any) Plume Stage 1 (not bank attached): X Y Z S C BV BH ZU ZL 6.50 0.00 1.30 23.9 0.838E+00 1.30 1.35 1.30 0.00 Plume interacts with BOTTOM. The passive diffusion plume becomes VERTICALLY FULLY MIXED within this prediction interval. 11.12 0.00 1.30 26.5 0.754E+00 1.30 1.50 1.30 0.00 15.74 0.00 1.30 28.9 0.692E+00 1.30 1.64 1.30 0.00 20.36 0.00 1.30 31.1 0.643E+00 1.30 1.77 1.30 0.00 24.98 0.00 1.30 33.2 0.603E+00 1.30 1.88 1.30 0.00 29.60 0.00 1.30 35.1 0.569E+00 1.30 1.99 1.30 0.00 34.22 0.00 1.30 37.0 0.541E+00 1.30 2.10 1.30 0.00 38.84 0.00 1.30 38.7 0.516E+00 1.30 2.20 1.30 0.00 43.46 0.00 1.30 40.4 0.495E+00 1.30 2.29 1.30 0.00 48.09 0.00 1.30 42.0 0.476E+00 1.30 2.38 1.30 0.00 52.71 0.00 1.30 43.6 0.459E+00 1.30 2.47 1.30 0.00 57.33 0.00 1.30 45.1 0.444E+00 1.30 2.56 1.30 0.00 61.95 0.00 1.30 46.5 0.430E+00 1.30 2.64 1.30 0.00 66.57 0.00 1.30 47.9 0.417E+00 1.30 2.72 1.30 0.00 71.19 0.00 1.30 49.3 0.406E+00 1.30 2.80 1.30 0.00 75.81 0.00 1.30 50.6 0.395E+00 1.30 2.87 1.30 0.00 80.43 0.00 1.30 51.9 0.385E+00 1.30 2.95 1.30 0.00 85.05 0.00 1.30 53.2 0.376E+00 1.30 3.02 1.30 0.00 89.67 0.00 1.30 54.4 0.367E+00 1.30 3.09 1.30 0.00 94.29 0.00 1.30 55.6 0.359E+00 1.30 3.16 1.30 0.00 98.91 0.00 1.30 56.8 0.352E+00 1.30 3.22 1.30 0.00 103.53 0.00 1.30 58.0 0.345E+00 1.30 3.29 1.30 0.00 108.15 0.00 1.30 59.1 0.338E+00 1.30 3.35 1.30 0.00 112.77 0.00 1.30 60.2 0.332E+00 1.30 3.42 1.30 0.00 117.39 0.00 1.30 61.3 0.326E+00 1.30 3.48 1.30 0.00 122.01 0.00 1.30 62.4 0.320E+00 1.30 3.54 1.30 0.00 126.64 0.00 1.30 63.5 0.315E+00 1.30 3.60 1.30 0.00

7C-38 December 2007 North American Upgrader Project Volume 3, Appendix 7C
NORTH AMERICAN OIL SANDS CORPORATION
131.26 0.00 1.30 64.5 0.310E+00 1.30 3.66 1.30 0.00 135.88 0.00 1.30 65.5 0.305E+00 1.30 3.72 1.30 0.00 140.50 0.00 1.30 66.5 0.301E+00 1.30 3.77 1.30 0.00 145.12 0.00 1.30 67.5 0.296E+00 1.30 3.83 1.30 0.00 149.74 0.00 1.30 68.5 0.292E+00 1.30 3.89 1.30 0.00 154.36 0.00 1.30 69.5 0.288E+00 1.30 3.94 1.30 0.00 158.98 0.00 1.30 70.4 0.284E+00 1.30 3.99 1.30 0.00 163.60 0.00 1.30 71.3 0.280E+00 1.30 4.05 1.30 0.00 168.22 0.00 1.30 72.3 0.277E+00 1.30 4.10 1.30 0.00 172.84 0.00 1.30 73.2 0.273E+00 1.30 4.15 1.30 0.00 177.46 0.00 1.30 74.1 0.270E+00 1.30 4.20 1.30 0.00 182.08 0.00 1.30 75.0 0.267E+00 1.30 4.25 1.30 0.00 186.70 0.00 1.30 75.9 0.263E+00 1.30 4.30 1.30 0.00 191.32 0.00 1.30 76.7 0.260E+00 1.30 4.35 1.30 0.00 195.94 0.00 1.30 77.6 0.258E+00 1.30 4.40 1.30 0.00 200.57 0.00 1.30 78.5 0.255E+00 1.30 4.45 1.30 0.00 205.19 0.00 1.30 79.3 0.252E+00 1.30 4.50 1.30 0.00 209.81 0.00 1.30 80.1 0.249E+00 1.30 4.55 1.30 0.00 214.43 0.00 1.30 81.0 0.247E+00 1.30 4.59 1.30 0.00 219.05 0.00 1.30 81.8 0.244E+00 1.30 4.64 1.30 0.00 223.67 0.00 1.30 82.6 0.242E+00 1.30 4.68 1.30 0.00 228.29 0.00 1.30 83.4 0.240E+00 1.30 4.73 1.30 0.00 232.91 0.00 1.30 84.2 0.237E+00 1.30 4.78 1.30 0.00 237.53 0.00 1.30 85.0 0.235E+00 1.30 4.82 1.30 0.00 242.15 0.00 1.30 85.7 0.233E+00 1.30 4.86 1.30 0.00 246.77 0.00 1.30 86.5 0.231E+00 1.30 4.91 1.30 0.00 251.39 0.00 1.30 87.3 0.229E+00 1.30 4.95 1.30 0.00 256.01 0.00 1.30 88.0 0.227E+00 1.30 4.99 1.30 0.00 260.63 0.00 1.30 88.8 0.225E+00 1.30 5.04 1.30 0.00 265.25 0.00 1.30 89.5 0.223E+00 1.30 5.08 1.30 0.00 269.87 0.00 1.30 90.3 0.221E+00 1.30 5.12 1.30 0.00 274.49 0.00 1.30 91.0 0.220E+00 1.30 5.16 1.30 0.00 279.12 0.00 1.30 91.7 0.218E+00 1.30 5.20 1.30 0.00 283.74 0.00 1.30 92.5 0.216E+00 1.30 5.25 1.30 0.00 288.36 0.00 1.30 93.2 0.214E+00 1.30 5.29 1.30 0.00 292.98 0.00 1.30 93.9 0.213E+00 1.30 5.33 1.30 0.00 297.60 0.00 1.30 94.6 0.211E+00 1.30 5.37 1.30 0.00 302.22 0.00 1.30 95.3 0.210E+00 1.30 5.41 1.30 0.00 306.84 0.00 1.30 96.0 0.208E+00 1.30 5.45 1.30 0.00 311.46 0.00 1.30 96.7 0.207E+00 1.30 5.48 1.30 0.00 316.08 0.00 1.30 97.4 0.205E+00 1.30 5.52 1.30 0.00 320.70 0.00 1.30 98.0 0.204E+00 1.30 5.56 1.30 0.00 325.32 0.00 1.30 98.7 0.202E+00 1.30 5.60 1.30 0.00 329.94 0.00 1.30 99.4 0.201E+00 1.30 5.64 1.30 0.00 334.56 0.00 1.30 100.1 0.200E+00 1.30 5.68 1.30 0.00 339.18 0.00 1.30 100.7 0.198E+00 1.30 5.71 1.30 0.00 343.80 0.00 1.30 101.4 0.197E+00 1.30 5.75 1.30 0.00 348.42 0.00 1.30 102.0 0.196E+00 1.30 5.79 1.30 0.00 353.05 0.00 1.30 102.7 0.195E+00 1.30 5.82 1.30 0.00 357.67 0.00 1.30 103.3 0.193E+00 1.30 5.86 1.30 0.00 362.29 0.00 1.30 104.0 0.192E+00 1.30 5.90 1.30 0.00 366.91 0.00 1.30 104.6 0.191E+00 1.30 5.93 1.30 0.00 371.53 0.00 1.30 105.2 0.190E+00 1.30 5.97 1.30 0.00

7C-39 December 2007 North American Upgrader Project Volume 3, Appendix 7C
NORTH AMERICAN OIL SANDS CORPORATION
376.15 0.00 1.30 105.9 0.189E+00 1.30 6.01 1.30 0.00 380.77 0.00 1.30 106.5 0.188E+00 1.30 6.04 1.30 0.00 385.39 0.00 1.30 107.1 0.187E+00 1.30 6.08 1.30 0.00 390.01 0.00 1.30 107.7 0.185E+00 1.30 6.11 1.30 0.00 394.63 0.00 1.30 108.3 0.184E+00 1.30 6.15 1.30 0.00 399.25 0.00 1.30 109.0 0.183E+00 1.30 6.18 1.30 0.00 403.87 0.00 1.30 109.6 0.182E+00 1.30 6.22 1.30 0.00 408.49 0.00 1.30 110.2 0.181E+00 1.30 6.25 1.30 0.00 413.11 0.00 1.30 110.8 0.180E+00 1.30 6.28 1.30 0.00 417.73 0.00 1.30 111.4 0.179E+00 1.30 6.32 1.30 0.00 422.35 0.00 1.30 112.0 0.178E+00 1.30 6.35 1.30 0.00 426.97 0.00 1.30 112.6 0.177E+00 1.30 6.39 1.30 0.00 431.60 0.00 1.30 113.2 0.177E+00 1.30 6.42 1.30 0.00 436.22 0.00 1.30 113.7 0.176E+00 1.30 6.45 1.30 0.00 440.84 0.00 1.30 114.3 0.175E+00 1.30 6.49 1.30 0.00 445.46 0.00 1.30 114.9 0.174E+00 1.30 6.52 1.30 0.00 450.08 0.00 1.30 115.5 0.173E+00 1.30 6.55 1.30 0.00 454.70 0.00 1.30 116.1 0.172E+00 1.30 6.58 1.30 0.00 459.32 0.00 1.30 116.6 0.171E+00 1.30 6.62 1.30 0.00 463.94 0.00 1.30 117.2 0.170E+00 1.30 6.65 1.30 0.00 468.56 0.00 1.30 117.8 0.170E+00 1.30 6.68 1.30 0.00 473.18 0.00 1.30 118.3 0.169E+00 1.30 6.71 1.30 0.00 477.80 0.00 1.30 118.9 0.168E+00 1.30 6.74 1.30 0.00 482.42 0.00 1.30 119.4 0.167E+00 1.30 6.78 1.30 0.00 487.04 0.00 1.30 120.0 0.166E+00 1.30 6.81 1.30 0.00 491.66 0.00 1.30 120.5 0.166E+00 1.30 6.84 1.30 0.00 496.28 0.00 1.30 121.1 0.165E+00 1.30 6.87 1.30 0.00 500.90 0.00 1.30 121.6 0.164E+00 1.30 6.90 1.30 0.00 505.53 0.00 1.30 122.2 0.163E+00 1.30 6.93 1.30 0.00 510.15 0.00 1.30 122.7 0.163E+00 1.30 6.96 1.30 0.00 514.77 0.00 1.30 123.3 0.162E+00 1.30 6.99 1.30 0.00 519.39 0.00 1.30 123.8 0.161E+00 1.30 7.02 1.30 0.00 524.01 0.00 1.30 124.3 0.161E+00 1.30 7.05 1.30 0.00 528.63 0.00 1.30 124.9 0.160E+00 1.30 7.08 1.30 0.00 533.25 0.00 1.30 125.4 0.159E+00 1.30 7.11 1.30 0.00 537.87 0.00 1.30 125.9 0.159E+00 1.30 7.14 1.30 0.00 542.49 0.00 1.30 126.5 0.158E+00 1.30 7.17 1.30 0.00 547.11 0.00 1.30 127.0 0.157E+00 1.30 7.20 1.30 0.00 551.73 0.00 1.30 127.5 0.157E+00 1.30 7.23 1.30 0.00 556.35 0.00 1.30 128.0 0.156E+00 1.30 7.26 1.30 0.00 560.97 0.00 1.30 128.6 0.155E+00 1.30 7.29 1.30 0.00 565.59 0.00 1.30 129.1 0.155E+00 1.30 7.32 1.30 0.00 570.21 0.00 1.30 129.6 0.154E+00 1.30 7.35 1.30 0.00 574.83 0.00 1.30 130.1 0.153E+00 1.30 7.38 1.30 0.00 579.45 0.00 1.30 130.6 0.153E+00 1.30 7.41 1.30 0.00 584.08 0.00 1.30 131.1 0.152E+00 1.30 7.44 1.30 0.00 588.70 0.00 1.30 131.6 0.152E+00 1.30 7.47 1.30 0.00 593.32 0.00 1.30 132.1 0.151E+00 1.30 7.50 1.30 0.00 597.94 0.00 1.30 132.6 0.151E+00 1.30 7.52 1.30 0.00 602.56 0.00 1.30 133.1 0.150E+00 1.30 7.55 1.30 0.00 607.18 0.00 1.30 133.6 0.149E+00 1.30 7.58 1.30 0.00 611.80 0.00 1.30 134.1 0.149E+00 1.30 7.61 1.30 0.00 616.42 0.00 1.30 134.6 0.148E+00 1.30 7.64 1.30 0.00 621.04 0.00 1.30 135.1 0.148E+00 1.30 7.66 1.30 0.00

7C-40 December 2007 North American Upgrader Project Volume 3, Appendix 7C
NORTH AMERICAN OIL SANDS CORPORATION
625.66 0.00 1.30 135.6 0.147E+00 1.30 7.69 1.30 0.00 630.28 0.00 1.30 136.1 0.147E+00 1.30 7.72 1.30 0.00 634.90 0.00 1.30 136.6 0.146E+00 1.30 7.75 1.30 0.00 639.52 0.00 1.30 137.1 0.146E+00 1.30 7.78 1.30 0.00 644.14 0.00 1.30 137.5 0.145E+00 1.30 7.80 1.30 0.00 648.76 0.00 1.30 138.0 0.145E+00 1.30 7.83 1.30 0.00 653.38 0.00 1.30 138.5 0.144E+00 1.30 7.86 1.30 0.00 658.01 0.00 1.30 139.0 0.144E+00 1.30 7.89 1.30 0.00 662.63 0.00 1.30 139.5 0.143E+00 1.30 7.91 1.30 0.00 667.25 0.00 1.30 139.9 0.143E+00 1.30 7.94 1.30 0.00 671.87 0.00 1.30 140.4 0.142E+00 1.30 7.97 1.30 0.00 676.49 0.00 1.30 140.9 0.142E+00 1.30 7.99 1.30 0.00 681.11 0.00 1.30 141.4 0.141E+00 1.30 8.02 1.30 0.00 685.73 0.00 1.30 141.8 0.141E+00 1.30 8.05 1.30 0.00 690.35 0.00 1.30 142.3 0.140E+00 1.30 8.07 1.30 0.00 694.97 0.00 1.30 142.8 0.140E+00 1.30 8.10 1.30 0.00 699.59 0.00 1.30 143.2 0.139E+00 1.30 8.13 1.30 0.00 704.21 0.00 1.30 143.7 0.139E+00 1.30 8.15 1.30 0.00 708.83 0.00 1.30 144.2 0.138E+00 1.30 8.18 1.30 0.00 713.45 0.00 1.30 144.6 0.138E+00 1.30 8.20 1.30 0.00 718.07 0.00 1.30 145.1 0.138E+00 1.30 8.23 1.30 0.00 722.69 0.00 1.30 145.5 0.137E+00 1.30 8.26 1.30 0.00 727.31 0.00 1.30 146.0 0.137E+00 1.30 8.28 1.30 0.00 731.93 0.00 1.30 146.4 0.136E+00 1.30 8.31 1.30 0.00 736.56 0.00 1.30 146.9 0.136E+00 1.30 8.33 1.30 0.00 741.18 0.00 1.30 147.3 0.135E+00 1.30 8.36 1.30 0.00 745.80 0.00 1.30 147.8 0.135E+00 1.30 8.38 1.30 0.00 750.42 0.00 1.30 148.2 0.135E+00 1.30 8.41 1.30 0.00 755.04 0.00 1.30 148.7 0.134E+00 1.30 8.44 1.30 0.00 759.66 0.00 1.30 149.1 0.134E+00 1.30 8.46 1.30 0.00 764.28 0.00 1.30 149.6 0.133E+00 1.30 8.49 1.30 0.00 768.90 0.00 1.30 150.0 0.133E+00 1.30 8.51 1.30 0.00 773.52 0.00 1.30 150.5 0.133E+00 1.30 8.54 1.30 0.00 778.14 0.00 1.30 150.9 0.132E+00 1.30 8.56 1.30 0.00 782.76 0.00 1.30 151.4 0.132E+00 1.30 8.59 1.30 0.00 787.38 0.00 1.30 151.8 0.131E+00 1.30 8.61 1.30 0.00 792.00 0.00 1.30 152.2 0.131E+00 1.30 8.64 1.30 0.00 796.62 0.00 1.30 152.7 0.131E+00 1.30 8.66 1.30 0.00 801.24 0.00 1.30 153.1 0.130E+00 1.30 8.69 1.30 0.00 805.86 0.00 1.30 153.5 0.130E+00 1.30 8.71 1.30 0.00 810.49 0.00 1.30 154.0 0.130E+00 1.30 8.73 1.30 0.00 815.11 0.00 1.30 154.4 0.129E+00 1.30 8.76 1.30 0.00 819.73 0.00 1.30 154.8 0.129E+00 1.30 8.78 1.30 0.00 824.35 0.00 1.30 155.3 0.128E+00 1.30 8.81 1.30 0.00 828.97 0.00 1.30 155.7 0.128E+00 1.30 8.83 1.30 0.00 833.59 0.00 1.30 156.1 0.128E+00 1.30 8.86 1.30 0.00 838.21 0.00 1.30 156.5 0.127E+00 1.30 8.88 1.30 0.00 842.83 0.00 1.30 157.0 0.127E+00 1.30 8.90 1.30 0.00 847.45 0.00 1.30 157.4 0.127E+00 1.30 8.93 1.30 0.00 852.07 0.00 1.30 157.8 0.126E+00 1.30 8.95 1.30 0.00 856.69 0.00 1.30 158.2 0.126E+00 1.30 8.98 1.30 0.00 861.31 0.00 1.30 158.6 0.126E+00 1.30 9.00 1.30 0.00 865.93 0.00 1.30 159.1 0.125E+00 1.30 9.02 1.30 0.00 870.55 0.00 1.30 159.5 0.125E+00 1.30 9.05 1.30 0.00

7C-41 December 2007 North American Upgrader Project Volume 3, Appendix 7C
NORTH AMERICAN OIL SANDS CORPORATION
875.17 0.00 1.30 159.9 0.125E+00 1.30 9.07 1.30 0.00 879.79 0.00 1.30 160.3 0.124E+00 1.30 9.09 1.30 0.00 884.41 0.00 1.30 160.7 0.124E+00 1.30 9.12 1.30 0.00 889.04 0.00 1.30 161.1 0.124E+00 1.30 9.14 1.30 0.00 893.66 0.00 1.30 161.6 0.123E+00 1.30 9.17 1.30 0.00 898.28 0.00 1.30 162.0 0.123E+00 1.30 9.19 1.30 0.00 902.90 0.00 1.30 162.4 0.123E+00 1.30 9.21 1.30 0.00 907.52 0.00 1.30 162.8 0.123E+00 1.30 9.23 1.30 0.00 912.14 0.00 1.30 163.2 0.122E+00 1.30 9.26 1.30 0.00 916.76 0.00 1.30 163.6 0.122E+00 1.30 9.28 1.30 0.00 921.38 0.00 1.30 164.0 0.122E+00 1.30 9.30 1.30 0.00 926.00 0.00 1.30 164.4 0.121E+00 1.30 9.33 1.30 0.00 930.62 0.00 1.30 164.8 0.121E+00 1.30 9.35 1.30 0.00 Cumulative travel time = 1559.5299 sec ----------------------------------------------------------------------------- Plume Stage 2 (bank attached): X Y Z S C BV BH ZU ZL 930.62 -9.35 1.30 164.8 0.121E+00 1.30 18.70 1.30 0.00 1025.97 -9.35 1.30 166.9 0.119E+00 1.30 18.93 1.30 0.00 1121.31 -9.35 1.30 168.9 0.118E+00 1.30 19.17 1.30 0.00 1216.66 -9.35 1.30 170.9 0.117E+00 1.30 19.40 1.30 0.00 ** REGULATORY MIXING ZONE BOUNDARY ** In this prediction interval the plume DOWNSTREAM distance meets or exceeds the regulatory value = 1293.00 m. This is the extent of the REGULATORY MIXING ZONE. 1312.01 -9.35 1.30 172.9 0.115E+00 1.30 19.62 1.30 0.00 1407.36 -9.35 1.30 174.9 0.114E+00 1.30 19.85 1.30 0.00 1502.70 -9.35 1.30 176.9 0.113E+00 1.30 20.07 1.30 0.00 1598.05 -9.35 1.30 178.8 0.111E+00 1.30 20.29 1.30 0.00 1693.40 -9.35 1.30 180.7 0.110E+00 1.30 20.50 1.30 0.00 1788.74 -9.35 1.30 182.6 0.109E+00 1.30 20.72 1.30 0.00 1884.09 -9.35 1.30 184.5 0.108E+00 1.30 20.93 1.30 0.00 1979.44 -9.35 1.30 186.3 0.107E+00 1.30 21.14 1.30 0.00 2074.78 -9.35 1.30 188.1 0.106E+00 1.30 21.35 1.30 0.00 2170.13 -9.35 1.30 190.0 0.105E+00 1.30 21.55 1.30 0.00 2265.48 -9.35 1.30 191.7 0.104E+00 1.30 21.76 1.30 0.00 2360.82 -9.35 1.30 193.5 0.103E+00 1.30 21.96 1.30 0.00 2456.17 -9.35 1.30 195.3 0.102E+00 1.30 22.16 1.30 0.00 2551.52 -9.35 1.30 197.0 0.101E+00 1.30 22.36 1.30 0.00 2646.87 -9.35 1.30 198.8 0.998E-01 1.30 22.55 1.30 0.00 2742.21 -9.35 1.30 200.5 0.989E-01 1.30 22.75 1.30 0.00 2837.56 -9.35 1.30 202.2 0.981E-01 1.30 22.94 1.30 0.00 2932.91 -9.35 1.30 203.9 0.972E-01 1.30 23.13 1.30 0.00 3028.25 -9.35 1.30 205.6 0.964E-01 1.30 23.32 1.30 0.00 3123.60 -9.35 1.30 207.2 0.956E-01 1.30 23.51 1.30 0.00 3218.95 -9.35 1.30 208.9 0.948E-01 1.30 23.70 1.30 0.00 3314.29 -9.35 1.30 210.5 0.941E-01 1.30 23.88 1.30 0.00 3409.64 -9.35 1.30 212.1 0.933E-01 1.30 24.07 1.30 0.00 3504.99 -9.35 1.30 213.7 0.926E-01 1.30 24.25 1.30 0.00 3600.33 -9.35 1.30 215.3 0.919E-01 1.30 24.43 1.30 0.00 3695.68 -9.35 1.30 216.9 0.912E-01 1.30 24.61 1.30 0.00 3791.03 -9.35 1.30 218.5 0.905E-01 1.30 24.79 1.30 0.00 3886.38 -9.35 1.30 220.1 0.898E-01 1.30 24.97 1.30 0.00

7C-42 December 2007 North American Upgrader Project Volume 3, Appendix 7C
NORTH AMERICAN OIL SANDS CORPORATION
3981.72 -9.35 1.30 221.6 0.892E-01 1.30 25.15 1.30 0.00 4077.07 -9.35 1.30 223.2 0.885E-01 1.30 25.32 1.30 0.00 4172.42 -9.35 1.30 224.7 0.879E-01 1.30 25.49 1.30 0.00 4267.76 -9.35 1.30 226.2 0.873E-01 1.30 25.67 1.30 0.00 4363.11 -9.35 1.30 227.7 0.867E-01 1.30 25.84 1.30 0.00 4458.46 -9.35 1.30 229.2 0.861E-01 1.30 26.01 1.30 0.00 4553.80 -9.35 1.30 230.7 0.855E-01 1.30 26.18 1.30 0.00 4649.15 -9.35 1.30 232.2 0.849E-01 1.30 26.35 1.30 0.00 4744.50 -9.35 1.30 233.7 0.844E-01 1.30 26.51 1.30 0.00 4839.84 -9.35 1.30 235.1 0.838E-01 1.30 26.68 1.30 0.00 4935.19 -9.35 1.30 236.6 0.833E-01 1.30 26.84 1.30 0.00 5030.54 -9.35 1.30 238.0 0.827E-01 1.30 27.01 1.30 0.00 5125.88 -9.35 1.30 239.5 0.822E-01 1.30 27.17 1.30 0.00 5221.23 -9.35 1.30 240.9 0.817E-01 1.30 27.33 1.30 0.00 5316.58 -9.35 1.30 242.3 0.812E-01 1.30 27.49 1.30 0.00 5411.92 -9.35 1.30 243.7 0.807E-01 1.30 27.65 1.30 0.00 5507.27 -9.35 1.30 245.1 0.802E-01 1.30 27.81 1.30 0.00 5602.62 -9.35 1.30 246.5 0.798E-01 1.30 27.97 1.30 0.00 5697.96 -9.35 1.30 247.9 0.793E-01 1.30 28.13 1.30 0.00 5793.31 -9.35 1.30 249.3 0.788E-01 1.30 28.29 1.30 0.00 5888.66 -9.35 1.30 250.7 0.784E-01 1.30 28.44 1.30 0.00 5984.00 -9.35 1.30 252.0 0.779E-01 1.30 28.60 1.30 0.00 6079.35 -9.35 1.30 253.4 0.775E-01 1.30 28.75 1.30 0.00 6174.70 -9.35 1.30 254.7 0.770E-01 1.30 28.90 1.30 0.00 6270.04 -9.35 1.30 256.1 0.766E-01 1.30 29.06 1.30 0.00 6365.39 -9.35 1.30 257.4 0.762E-01 1.30 29.21 1.30 0.00 6460.74 -9.35 1.30 258.7 0.758E-01 1.30 29.36 1.30 0.00 6556.08 -9.35 1.30 260.1 0.754E-01 1.30 29.51 1.30 0.00 6651.43 -9.35 1.30 261.4 0.750E-01 1.30 29.66 1.30 0.00 6746.78 -9.35 1.30 262.7 0.746E-01 1.30 29.81 1.30 0.00 6842.12 -9.35 1.30 264.0 0.742E-01 1.30 29.95 1.30 0.00 6937.47 -9.35 1.30 265.3 0.738E-01 1.30 30.10 1.30 0.00 7032.82 -9.35 1.30 266.6 0.734E-01 1.30 30.25 1.30 0.00 7128.16 -9.35 1.30 267.9 0.731E-01 1.30 30.39 1.30 0.00 7223.51 -9.35 1.30 269.1 0.727E-01 1.30 30.54 1.30 0.00 7318.86 -9.35 1.30 270.4 0.723E-01 1.30 30.68 1.30 0.00 7414.20 -9.35 1.30 271.7 0.720E-01 1.30 30.82 1.30 0.00 7509.55 -9.35 1.30 272.9 0.716E-01 1.30 30.97 1.30 0.00 7604.90 -9.35 1.30 274.2 0.713E-01 1.30 31.11 1.30 0.00 7700.24 -9.35 1.30 275.4 0.709E-01 1.30 31.25 1.30 0.00 7795.59 -9.35 1.30 276.7 0.706E-01 1.30 31.39 1.30 0.00 7890.94 -9.35 1.30 277.9 0.702E-01 1.30 31.53 1.30 0.00 7986.28 -9.35 1.30 279.1 0.699E-01 1.30 31.67 1.30 0.00 8081.63 -9.35 1.30 280.4 0.696E-01 1.30 31.81 1.30 0.00 8176.98 -9.35 1.30 281.6 0.693E-01 1.30 31.95 1.30 0.00 8272.32 -9.35 1.30 282.8 0.690E-01 1.30 32.09 1.30 0.00 8367.67 -9.35 1.30 284.0 0.686E-01 1.30 32.23 1.30 0.00 8463.02 -9.35 1.30 285.2 0.683E-01 1.30 32.36 1.30 0.00 8558.36 -9.35 1.30 286.4 0.680E-01 1.30 32.50 1.30 0.00 8653.71 -9.35 1.30 287.6 0.677E-01 1.30 32.63 1.30 0.00 8749.06 -9.35 1.30 288.8 0.674E-01 1.30 32.77 1.30 0.00 8844.40 -9.35 1.30 290.0 0.671E-01 1.30 32.90 1.30 0.00 8939.75 -9.35 1.30 291.2 0.668E-01 1.30 33.04 1.30 0.00 9035.10 -9.35 1.30 292.4 0.665E-01 1.30 33.17 1.30 0.00

7C-43 December 2007 North American Upgrader Project Volume 3, Appendix 7C
NORTH AMERICAN OIL SANDS CORPORATION
9130.44 -9.35 1.30 293.5 0.663E-01 1.30 33.30 1.30 0.00 9225.79 -9.35 1.30 294.7 0.660E-01 1.30 33.44 1.30 0.00 9321.14 -9.35 1.30 295.9 0.657E-01 1.30 33.57 1.30 0.00 9416.48 -9.35 1.30 297.0 0.654E-01 1.30 33.70 1.30 0.00 9511.83 -9.35 1.30 298.2 0.652E-01 1.30 33.83 1.30 0.00 9607.18 -9.35 1.30 299.3 0.649E-01 1.30 33.96 1.30 0.00 9702.52 -9.35 1.30 300.5 0.646E-01 1.30 34.09 1.30 0.00 9797.87 -9.35 1.30 301.6 0.644E-01 1.30 34.22 1.30 0.00 9893.22 -9.35 1.30 302.7 0.641E-01 1.30 34.35 1.30 0.00 9988.56 -9.35 1.30 303.9 0.638E-01 1.30 34.48 1.30 0.00 10083.91 -9.35 1.30 305.0 0.636E-01 1.30 34.60 1.30 0.00 10179.26 -9.35 1.30 306.1 0.633E-01 1.30 34.73 1.30 0.00 10274.60 -9.35 1.30 307.2 0.631E-01 1.30 34.86 1.30 0.00 10369.95 -9.35 1.30 308.3 0.628E-01 1.30 34.98 1.30 0.00 10465.30 -9.35 1.30 309.4 0.626E-01 1.30 35.11 1.30 0.00 10560.64 -9.35 1.30 310.6 0.624E-01 1.30 35.24 1.30 0.00 10655.99 -9.35 1.30 311.7 0.621E-01 1.30 35.36 1.30 0.00 10751.34 -9.35 1.30 312.8 0.619E-01 1.30 35.49 1.30 0.00 10846.68 -9.35 1.30 313.9 0.616E-01 1.30 35.61 1.30 0.00 10942.03 -9.35 1.30 314.9 0.614E-01 1.30 35.73 1.30 0.00 11037.38 -9.35 1.30 316.0 0.612E-01 1.30 35.86 1.30 0.00 11132.72 -9.35 1.30 317.1 0.610E-01 1.30 35.98 1.30 0.00 11228.07 -9.35 1.30 318.2 0.607E-01 1.30 36.10 1.30 0.00 11323.42 -9.35 1.30 319.3 0.605E-01 1.30 36.22 1.30 0.00 11418.76 -9.35 1.30 320.3 0.603E-01 1.30 36.35 1.30 0.00 11514.11 -9.35 1.30 321.4 0.601E-01 1.30 36.47 1.30 0.00 11609.46 -9.35 1.30 322.5 0.599E-01 1.30 36.59 1.30 0.00 11704.80 -9.35 1.30 323.5 0.596E-01 1.30 36.71 1.30 0.00 11800.15 -9.35 1.30 324.6 0.594E-01 1.30 36.83 1.30 0.00 11895.50 -9.35 1.30 325.7 0.592E-01 1.30 36.95 1.30 0.00 11990.84 -9.35 1.30 326.7 0.590E-01 1.30 37.07 1.30 0.00 12086.19 -9.35 1.30 327.8 0.588E-01 1.30 37.19 1.30 0.00 12181.54 -9.35 1.30 328.8 0.586E-01 1.30 37.31 1.30 0.00 12276.88 -9.35 1.30 329.8 0.584E-01 1.30 37.42 1.30 0.00 12372.23 -9.35 1.30 330.9 0.582E-01 1.30 37.54 1.30 0.00 12467.58 -9.35 1.30 331.9 0.580E-01 1.30 37.66 1.30 0.00 12562.92 -9.35 1.30 332.9 0.578E-01 1.30 37.78 1.30 0.00 12658.27 -9.35 1.30 334.0 0.576E-01 1.30 37.89 1.30 0.00 12753.62 -9.35 1.30 335.0 0.574E-01 1.30 38.01 1.30 0.00 12848.96 -9.35 1.30 336.0 0.572E-01 1.30 38.13 1.30 0.00 12944.31 -9.35 1.30 337.0 0.570E-01 1.30 38.24 1.30 0.00 13039.66 -9.35 1.30 338.1 0.569E-01 1.30 38.36 1.30 0.00 13135.00 -9.35 1.30 339.1 0.567E-01 1.30 38.47 1.30 0.00 13230.35 -9.35 1.30 340.1 0.565E-01 1.30 38.59 1.30 0.00 13325.70 -9.35 1.30 341.1 0.563E-01 1.30 38.70 1.30 0.00 13421.04 -9.35 1.30 342.1 0.561E-01 1.30 38.81 1.30 0.00 13516.39 -9.35 1.30 343.1 0.559E-01 1.30 38.93 1.30 0.00 13611.74 -9.35 1.30 344.1 0.558E-01 1.30 39.04 1.30 0.00 13707.08 -9.35 1.30 345.1 0.556E-01 1.30 39.15 1.30 0.00 13802.43 -9.35 1.30 346.1 0.554E-01 1.30 39.27 1.30 0.00 13897.78 -9.35 1.30 347.1 0.552E-01 1.30 39.38 1.30 0.00 13993.12 -9.35 1.30 348.1 0.551E-01 1.30 39.49 1.30 0.00 14088.47 -9.35 1.30 349.0 0.549E-01 1.30 39.60 1.30 0.00 14183.82 -9.35 1.30 350.0 0.547E-01 1.30 39.71 1.30 0.00

7C-44 December 2007 North American Upgrader Project Volume 3, Appendix 7C
NORTH AMERICAN OIL SANDS CORPORATION
14279.16 -9.35 1.30 351.0 0.545E-01 1.30 39.82 1.30 0.00 14374.51 -9.35 1.30 352.0 0.544E-01 1.30 39.94 1.30 0.00 14469.86 -9.35 1.30 352.9 0.542E-01 1.30 40.05 1.30 0.00 14565.20 -9.35 1.30 353.9 0.541E-01 1.30 40.16 1.30 0.00 14660.55 -9.35 1.30 354.9 0.539E-01 1.30 40.27 1.30 0.00 14755.90 -9.35 1.30 355.8 0.537E-01 1.30 40.37 1.30 0.00 14851.24 -9.35 1.30 356.8 0.536E-01 1.30 40.48 1.30 0.00 14946.59 -9.35 1.30 357.8 0.534E-01 1.30 40.59 1.30 0.00 15041.94 -9.35 1.30 358.7 0.532E-01 1.30 40.70 1.30 0.00 15137.28 -9.35 1.30 359.7 0.531E-01 1.30 40.81 1.30 0.00 15232.63 -9.35 1.30 360.6 0.529E-01 1.30 40.92 1.30 0.00 15327.98 -9.35 1.30 361.6 0.528E-01 1.30 41.03 1.30 0.00 15423.32 -9.35 1.30 362.5 0.526E-01 1.30 41.13 1.30 0.00 15518.67 -9.35 1.30 363.5 0.525E-01 1.30 41.24 1.30 0.00 15614.02 -9.35 1.30 364.4 0.523E-01 1.30 41.35 1.30 0.00 15709.36 -9.35 1.30 365.4 0.522E-01 1.30 41.45 1.30 0.00 15804.71 -9.35 1.30 366.3 0.520E-01 1.30 41.56 1.30 0.00 15900.06 -9.35 1.30 367.2 0.519E-01 1.30 41.67 1.30 0.00 15995.40 -9.35 1.30 368.2 0.517E-01 1.30 41.77 1.30 0.00 16090.75 -9.35 1.30 369.1 0.516E-01 1.30 41.88 1.30 0.00 16186.10 -9.35 1.30 370.0 0.514E-01 1.30 41.98 1.30 0.00 16281.44 -9.35 1.30 370.9 0.513E-01 1.30 42.09 1.30 0.00 16376.79 -9.35 1.30 371.9 0.512E-01 1.30 42.19 1.30 0.00 16472.14 -9.35 1.30 372.8 0.510E-01 1.30 42.30 1.30 0.00 16567.49 -9.35 1.30 373.7 0.509E-01 1.30 42.40 1.30 0.00 16662.83 -9.35 1.30 374.6 0.507E-01 1.30 42.51 1.30 0.00 16758.18 -9.35 1.30 375.5 0.506E-01 1.30 42.61 1.30 0.00 16853.53 -9.35 1.30 376.5 0.505E-01 1.30 42.71 1.30 0.00 16948.88 -9.35 1.30 377.4 0.503E-01 1.30 42.82 1.30 0.00 17044.22 -9.35 1.30 378.3 0.502E-01 1.30 42.92 1.30 0.00 17139.57 -9.35 1.30 379.2 0.501E-01 1.30 43.02 1.30 0.00 17234.92 -9.35 1.30 380.1 0.499E-01 1.30 43.12 1.30 0.00 17330.27 -9.35 1.30 381.0 0.498E-01 1.30 43.23 1.30 0.00 17425.62 -9.35 1.30 381.9 0.497E-01 1.30 43.33 1.30 0.00 17520.96 -9.35 1.30 382.8 0.495E-01 1.30 43.43 1.30 0.00 17616.31 -9.35 1.30 383.7 0.494E-01 1.30 43.53 1.30 0.00 17711.66 -9.35 1.30 384.6 0.493E-01 1.30 43.63 1.30 0.00 17807.01 -9.35 1.30 385.5 0.491E-01 1.30 43.73 1.30 0.00 17902.35 -9.35 1.30 386.3 0.490E-01 1.30 43.84 1.30 0.00 17997.70 -9.35 1.30 387.2 0.489E-01 1.30 43.94 1.30 0.00 18093.05 -9.35 1.30 388.1 0.488E-01 1.30 44.04 1.30 0.00 18188.40 -9.35 1.30 389.0 0.486E-01 1.30 44.14 1.30 0.00 18283.74 -9.35 1.30 389.9 0.485E-01 1.30 44.24 1.30 0.00 18379.09 -9.35 1.30 390.8 0.484E-01 1.30 44.34 1.30 0.00 18474.44 -9.35 1.30 391.6 0.483E-01 1.30 44.44 1.30 0.00 18569.79 -9.35 1.30 392.5 0.481E-01 1.30 44.53 1.30 0.00 18665.13 -9.35 1.30 393.4 0.480E-01 1.30 44.63 1.30 0.00 18760.48 -9.35 1.30 394.3 0.479E-01 1.30 44.73 1.30 0.00 18855.83 -9.35 1.30 395.1 0.478E-01 1.30 44.83 1.30 0.00 18951.18 -9.35 1.30 396.0 0.477E-01 1.30 44.93 1.30 0.00 19046.53 -9.35 1.30 396.9 0.475E-01 1.30 45.03 1.30 0.00 19141.87 -9.35 1.30 397.7 0.474E-01 1.30 45.13 1.30 0.00 19237.22 -9.35 1.30 398.6 0.473E-01 1.30 45.22 1.30 0.00

7C-45 December 2007 North American Upgrader Project Volume 3, Appendix 7C
NORTH AMERICAN OIL SANDS CORPORATION
19332.57 -9.35 1.30 399.4 0.472E-01 1.30 45.32 1.30 0.00 19427.92 -9.35 1.30 400.3 0.471E-01 1.30 45.42 1.30 0.00 19523.26 -9.35 1.30 401.2 0.470E-01 1.30 45.52 1.30 0.00 19618.61 -9.35 1.30 402.0 0.469E-01 1.30 45.61 1.30 0.00 19713.96 -9.35 1.30 402.9 0.467E-01 1.30 45.71 1.30 0.00 19809.31 -9.35 1.30 403.7 0.466E-01 1.30 45.81 1.30 0.00 19904.65 -9.35 1.30 404.6 0.465E-01 1.30 45.90 1.30 0.00 20000.00 -9.35 1.30 405.4 0.464E-01 1.30 46.00 1.30 0.00 Cumulative travel time = 33295.0195 sec Simulation limit based on maximum specified distance = 20000.00 m. This is the REGION OF INTEREST limitation. END OF MOD261: PASSIVE AMBIENT MIXING IN UNIFORM AMBIENT ----------------------------------------------------------------------------- ----------------------------------------------------------------------------- CORMIX2: Multiport Diffuser Discharges End of Prediction File 22222222222222222222222222222222222222222222222222222222222222222222222222222

7C-46 December 2007 North American Upgrader Project Volume 3, Appendix 7C
NORTH AMERICAN OIL SANDS CORPORATION
CORMIX Temperature Simulation - Average Flow 22222222222222222222222222222222222222222222222222222222222222222222222222222
CORMIX MIXING ZONE EXPERT SYSTEM Subsystem CORMIX2: Multiport Diffuser Discharges CORMIX Version 5.0GT HYDRO2 Version 5.0.0.0 March 2007 ----------------------------------------------------------------------------- ----------------------------------------------------------------------------- CASE DESCRIPTION Site name/label: Sturgeon upgrader Design case: Avergae flow FILE NAME: \\S...run_North American_multiport_10_temp_new flow.prd Time stamp: Wed Oct 31 17:22:51 2007 ENVIRONMENT PARAMETERS (metric units) Bounded section BS = 160.00 AS = 304.00 QA = 196.00 ICHREG= 1 HA = 1.90 HD = 2.20 UA = 0.645 F = 0.053 USTAR =0.5262E-01 UW = 2.000 UWSTAR=0.2198E-02 Uniform density environment STRCND= U RHOAM = 999.8188 DIFFUSER DISCHARGE PARAMETERS (metric units) Diffuser type: DITYPE= alternating_perpendicular BANK = RIGHT DISTB = 9.35 YB1 = 8.00 YB2 = 10.70 LD = 2.70 NOPEN = 10 SPAC = 0.30 D0 = 0.100 A0 = 0.008 H0 = 0.30 SUB0 = 1.90 Nozzle/port arrangement: near_vertical_discharge GAMMA = 90.00 THETA = 90.00 SIGMA = 0.00 BETA = 90.00 U0 = 1.127 Q0 = 0.089 =0.8850E-01 RHO0 = 996.5137 DRHO0 =0.3305E+01 GP0 =0.3242E-01 C0 =0.1850E+02 CUNITS= deg.C IPOLL = 3 KS =0.2388E-05 KD =0.0000E+00 FLUX VARIABLES - PER UNIT DIFFUSER LENGTH (metric units) q0 =0.3278E-01 m0 =0.3693E-01 j0 =0.1063E-02 SIGNJ0= 1.0 Associated 2-d length scales (meters) lQ=B = 0.029 lM = 3.54 lm = 0.09 lmp = 99999.00 lbp = 99999.00 la = 99999.00 FLUX VARIABLES - ENTIRE DIFFUSER (metric units) Q0 =0.8850E-01 M0 =0.9972E-01 J0 =0.2869E-02 Associated 3-d length scales (meters) LQ = 0.09 LM = 3.31 Lm = 0.49 Lb = 0.01 Lmp = 99999.00 Lbp = 99999.00 NON-DIMENSIONAL PARAMETERS FR0 = 36.69 FRD0 = 19.79 R = 1.75 PL = 2. (slot) (port/nozzle) FLOW CLASSIFICATION 222222222222222222222222222222222222222222

7C-47 December 2007 North American Upgrader Project Volume 3, Appendix 7C
NORTH AMERICAN OIL SANDS CORPORATION
2 Flow class (CORMIX2) = MU8 2 2 Applicable layer depth HS = 2.20 2 222222222222222222222222222222222222222222 MIXING ZONE / TOXIC DILUTION / REGION OF INTEREST PARAMETERS C0 =0.1850E+02 CUNITS= deg.C NTOX = 0 NSTD = 0 REGMZ = 1 REGSPC= 1 XREG = 1293.00 WREG = 0.00 AREG = 0.00 XINT = 20000.00 XMAX = 20000.00 X-Y-Z COORDINATE SYSTEM: ORIGIN is located at the bottom and the diffuser mid-point: 9.35 m from the RIGHT bank/shore. X-axis points downstream, Y-axis points to left, Z-axis points upward. NSTEP = 200 display intervals per module NOTE on dilution/concentration values for this HEATED DISCHARGE (IPOLL=3): S = hydrodynamic dilutions, include buoyancy (heat) loss effects, but provided plume has surface contact C = corresponding temperature values (always in "degC"!), include heat loss, if any ----------------------------------------------------------------------------- ----------------------------------------------------------------------------- BEGIN MOD201: DIFFUSER DISCHARGE MODULE Due to complex near-field motions: EQUIVALENT SLOT DIFFUSER (2-D) GEOMETRY Profile definitions: BV = Gaussian 1/e (37%) half-width, in vertical plane normal to trajectory BH = top-hat half-width, in horizontal plane normal to trajectory S = hydrodynamic centerline dilution C = centerline concentration (includes reaction effects, if any) X Y Z S C BV BH 0.00 0.00 0.30 1.0 0.185E+02 0.02 1.35 END OF MOD201: DIFFUSER DISCHARGE MODULE ----------------------------------------------------------------------------- ----------------------------------------------------------------------------- BEGIN MOD277: UNSTABLE NEAR-FIELD ZONE OF ALTERNATING PERPENDICULAR DIFFUSER Because of the strong ambient current the diffuser plume of this crossflowing discharge gets RAPIDLY DEFLECTED. A near-field zone is formed that is VERTICALLY FULLY MIXED over the entire layer depth. Full mixing is achieved at a downstream distance of about five (5) layer depths. Profile definitions: BV = layer depth (vertically mixed) BH = top-hat half-width, measured horizontally in Y-direction S = hydrodynamic average (bulk) dilution C = average (bulk) concentration (includes reaction effects, if any)

7C-48 December 2007 North American Upgrader Project Volume 3, Appendix 7C
NORTH AMERICAN OIL SANDS CORPORATION
X Y Z S C BV BH 0.00 0.00 0.30 1.0 0.185E+02 0.02 1.35 0.05 0.00 0.30 4.0 0.463E+01 0.03 1.35 0.11 0.00 0.31 5.2 0.353E+01 0.04 1.35 0.16 0.00 0.31 6.2 0.299E+01 0.06 1.35 0.22 0.00 0.32 7.0 0.264E+01 0.07 1.35 0.28 0.00 0.32 7.7 0.240E+01 0.08 1.35 0.33 0.00 0.32 8.3 0.222E+01 0.09 1.35 0.39 0.00 0.33 8.9 0.207E+01 0.10 1.35 0.44 0.00 0.33 9.5 0.195E+01 0.11 1.35 0.50 0.00 0.34 10.0 0.185E+01 0.12 1.35 0.55 0.00 0.34 10.5 0.176E+01 0.13 1.35 0.61 0.00 0.34 10.9 0.169E+01 0.14 1.35 0.66 0.00 0.35 11.4 0.162E+01 0.15 1.35 0.72 0.00 0.35 11.8 0.157E+01 0.16 1.35 0.77 0.00 0.36 12.2 0.151E+01 0.18 1.35 0.83 0.00 0.36 12.6 0.147E+01 0.19 1.35 0.88 0.00 0.36 13.0 0.142E+01 0.20 1.35 0.94 0.00 0.37 13.4 0.138E+01 0.21 1.35 0.99 0.00 0.37 13.7 0.135E+01 0.22 1.35 1.05 0.00 0.38 14.1 0.131E+01 0.23 1.35 1.10 0.00 0.38 14.4 0.128E+01 0.24 1.35 1.15 0.00 0.38 14.7 0.125E+01 0.25 1.35 1.21 0.00 0.39 15.1 0.123E+01 0.26 1.35 1.26 0.00 0.39 15.4 0.120E+01 0.27 1.35 1.32 0.00 0.40 15.7 0.118E+01 0.28 1.35 1.37 0.00 0.40 16.0 0.116E+01 0.30 1.35 1.43 0.00 0.40 16.3 0.114E+01 0.31 1.35 1.48 0.00 0.41 16.6 0.112E+01 0.32 1.35 1.54 0.00 0.41 16.9 0.110E+01 0.33 1.35 1.59 0.00 0.42 17.1 0.108E+01 0.34 1.35 1.65 0.00 0.42 17.4 0.106E+01 0.35 1.35 1.70 0.00 0.42 17.7 0.105E+01 0.36 1.35 1.76 0.00 0.43 18.0 0.103E+01 0.37 1.35 1.81 0.00 0.43 18.2 0.101E+01 0.38 1.35 1.87 0.00 0.44 18.5 0.100E+01 0.39 1.35 1.92 0.00 0.44 18.7 0.987E+00 0.40 1.35 1.98 0.00 0.44 19.0 0.974E+00 0.42 1.35 2.03 0.00 0.45 19.2 0.961E+00 0.43 1.35 2.09 0.00 0.45 19.5 0.949E+00 0.44 1.35 2.14 0.00 0.46 19.7 0.938E+00 0.45 1.35 2.20 0.00 0.46 20.0 0.927E+00 0.46 1.35 2.25 0.00 0.46 20.2 0.916E+00 0.47 1.35 2.31 0.00 0.47 20.4 0.905E+00 0.48 1.35 2.36 0.00 0.47 20.7 0.895E+00 0.49 1.35 2.42 0.00 0.48 20.9 0.886E+00 0.50 1.35 2.47 0.00 0.48 21.1 0.876E+00 0.51 1.35 2.53 0.00 0.48 21.3 0.867E+00 0.52 1.35 2.58 0.00 0.49 21.6 0.858E+00 0.53 1.35 2.64 0.00 0.49 21.8 0.850E+00 0.55 1.35 2.69 0.00 0.50 22.0 0.841E+00 0.56 1.35 2.75 0.00 0.50 22.2 0.833E+00 0.57 1.35 2.81 0.00 0.50 22.4 0.825E+00 0.58 1.35

7C-49 December 2007 North American Upgrader Project Volume 3, Appendix 7C
NORTH AMERICAN OIL SANDS CORPORATION
2.86 0.00 0.51 22.6 0.818E+00 0.59 1.35 2.92 0.00 0.51 22.8 0.810E+00 0.60 1.35 2.97 0.00 0.52 23.0 0.803E+00 0.61 1.35 3.03 0.00 0.52 23.2 0.796E+00 0.62 1.35 3.08 0.00 0.52 23.4 0.789E+00 0.63 1.35 3.14 0.00 0.53 23.6 0.783E+00 0.64 1.35 3.19 0.00 0.53 23.8 0.776E+00 0.65 1.35 3.25 0.00 0.54 24.0 0.770E+00 0.67 1.35 3.30 0.00 0.54 24.2 0.764E+00 0.68 1.35 3.36 0.00 0.54 24.4 0.758E+00 0.69 1.35 3.41 0.00 0.55 24.6 0.752E+00 0.70 1.35 3.47 0.00 0.55 24.8 0.746E+00 0.71 1.35 3.52 0.00 0.56 25.0 0.740E+00 0.72 1.35 3.58 0.00 0.56 25.2 0.735E+00 0.73 1.35 3.63 0.00 0.56 25.4 0.729E+00 0.74 1.35 3.69 0.00 0.57 25.5 0.724E+00 0.75 1.35 3.74 0.00 0.57 25.7 0.719E+00 0.76 1.35 3.80 0.00 0.58 25.9 0.714E+00 0.77 1.35 3.85 0.00 0.58 26.1 0.709E+00 0.79 1.35 3.91 0.00 0.58 26.3 0.704E+00 0.80 1.35 3.96 0.00 0.59 26.4 0.700E+00 0.81 1.35 4.02 0.00 0.59 26.6 0.695E+00 0.82 1.35 4.07 0.00 0.60 26.8 0.690E+00 0.83 1.35 4.13 0.00 0.60 27.0 0.686E+00 0.84 1.35 4.18 0.00 0.60 27.1 0.682E+00 0.85 1.35 4.24 0.00 0.61 27.3 0.677E+00 0.86 1.35 4.29 0.00 0.61 27.5 0.673E+00 0.87 1.35 4.35 0.00 0.62 27.7 0.669E+00 0.88 1.35 4.40 0.00 0.62 27.8 0.665E+00 0.89 1.35 4.45 0.00 0.62 28.0 0.661E+00 0.90 1.35 4.51 0.00 0.63 28.2 0.657E+00 0.92 1.35 4.56 0.00 0.63 28.3 0.653E+00 0.93 1.35 4.62 0.00 0.64 28.5 0.649E+00 0.94 1.35 4.67 0.00 0.64 28.6 0.646E+00 0.95 1.35 4.73 0.00 0.64 28.8 0.642E+00 0.96 1.35 4.78 0.00 0.65 29.0 0.639E+00 0.97 1.35 4.84 0.00 0.65 29.1 0.635E+00 0.98 1.35 4.89 0.00 0.66 29.3 0.632E+00 0.99 1.35 4.95 0.00 0.66 29.4 0.628E+00 1.00 1.35 5.00 0.00 0.66 29.6 0.625E+00 1.01 1.35 5.06 0.00 0.67 29.8 0.622E+00 1.02 1.35 5.11 0.00 0.67 29.9 0.618E+00 1.04 1.35 5.17 0.00 0.68 30.1 0.615E+00 1.05 1.35 5.22 0.00 0.68 30.2 0.612E+00 1.06 1.35 5.28 0.00 0.68 30.4 0.609E+00 1.07 1.35 5.33 0.00 0.69 30.5 0.606E+00 1.08 1.35 5.39 0.00 0.69 30.7 0.603E+00 1.09 1.35 5.44 0.00 0.70 30.8 0.600E+00 1.10 1.35 5.50 0.00 0.70 31.0 0.597E+00 1.11 1.35 5.55 0.00 0.70 31.1 0.594E+00 1.12 1.35 5.61 0.00 0.71 31.3 0.591E+00 1.13 1.35 5.66 0.00 0.71 31.4 0.589E+00 1.14 1.35 5.72 0.00 0.72 31.6 0.586E+00 1.16 1.35

7C-50 December 2007 North American Upgrader Project Volume 3, Appendix 7C
NORTH AMERICAN OIL SANDS CORPORATION
5.77 0.00 0.72 31.7 0.583E+00 1.17 1.35 5.83 0.00 0.72 31.9 0.580E+00 1.18 1.35 5.88 0.00 0.73 32.0 0.578E+00 1.19 1.35 5.94 0.00 0.73 32.2 0.575E+00 1.20 1.35 5.99 0.00 0.74 32.3 0.573E+00 1.21 1.35 6.05 0.00 0.74 32.5 0.570E+00 1.22 1.35 6.10 0.00 0.74 32.6 0.568E+00 1.23 1.35 6.16 0.00 0.75 32.7 0.565E+00 1.24 1.35 6.21 0.00 0.75 32.9 0.563E+00 1.25 1.35 6.27 0.00 0.76 33.0 0.560E+00 1.26 1.35 6.32 0.00 0.76 33.2 0.558E+00 1.27 1.35 6.38 0.00 0.76 33.3 0.556E+00 1.29 1.35 6.43 0.00 0.77 33.4 0.553E+00 1.30 1.35 6.49 0.00 0.77 33.6 0.551E+00 1.31 1.35 6.54 0.00 0.78 33.7 0.549E+00 1.32 1.35 6.60 0.00 0.78 33.9 0.547E+00 1.33 1.35 6.65 0.00 0.78 34.0 0.544E+00 1.34 1.35 6.71 0.00 0.79 34.1 0.542E+00 1.35 1.35 6.76 0.00 0.79 34.3 0.540E+00 1.36 1.35 6.82 0.00 0.80 34.4 0.538E+00 1.37 1.35 6.87 0.00 0.80 34.5 0.536E+00 1.38 1.35 6.93 0.00 0.80 34.7 0.534E+00 1.39 1.35 6.98 0.00 0.81 34.8 0.532E+00 1.41 1.35 7.04 0.00 0.81 34.9 0.530E+00 1.42 1.35 7.09 0.00 0.82 35.1 0.528E+00 1.43 1.35 7.15 0.00 0.82 35.2 0.526E+00 1.44 1.35 7.20 0.00 0.82 35.3 0.524E+00 1.45 1.35 7.26 0.00 0.83 35.5 0.522E+00 1.46 1.35 7.31 0.00 0.83 35.6 0.520E+00 1.47 1.35 7.37 0.00 0.84 35.7 0.518E+00 1.48 1.35 7.42 0.00 0.84 35.8 0.516E+00 1.49 1.35 7.48 0.00 0.84 36.0 0.514E+00 1.50 1.35 7.53 0.00 0.85 36.1 0.512E+00 1.51 1.35 7.59 0.00 0.85 36.2 0.511E+00 1.53 1.35 7.64 0.00 0.86 36.4 0.509E+00 1.54 1.35 7.70 0.00 0.86 36.5 0.507E+00 1.55 1.35 7.75 0.00 0.86 36.6 0.505E+00 1.56 1.35 7.81 0.00 0.87 36.7 0.504E+00 1.57 1.35 7.86 0.00 0.87 36.9 0.502E+00 1.58 1.35 7.92 0.00 0.88 37.0 0.500E+00 1.59 1.35 7.97 0.00 0.88 37.1 0.499E+00 1.60 1.35 8.03 0.00 0.88 37.2 0.497E+00 1.61 1.35 8.08 0.00 0.89 37.4 0.495E+00 1.62 1.35 8.14 0.00 0.89 37.5 0.494E+00 1.63 1.35 8.19 0.00 0.90 37.6 0.492E+00 1.64 1.35 8.25 0.00 0.90 37.7 0.490E+00 1.66 1.35 8.30 0.00 0.90 37.8 0.489E+00 1.67 1.35 8.36 0.00 0.91 38.0 0.487E+00 1.68 1.35 8.41 0.00 0.91 38.1 0.486E+00 1.69 1.35 8.47 0.00 0.92 38.2 0.484E+00 1.70 1.35 8.52 0.00 0.92 38.3 0.483E+00 1.71 1.35 8.58 0.00 0.92 38.5 0.481E+00 1.72 1.35 8.63 0.00 0.93 38.6 0.480E+00 1.73 1.35 8.69 0.00 0.93 38.7 0.478E+00 1.74 1.35

7C-51 December 2007 North American Upgrader Project Volume 3, Appendix 7C
NORTH AMERICAN OIL SANDS CORPORATION
8.74 0.00 0.94 38.8 0.477E+00 1.75 1.35 8.80 0.00 0.94 38.9 0.475E+00 1.76 1.35 8.85 0.00 0.94 39.1 0.474E+00 1.78 1.35 8.91 0.00 0.95 39.2 0.472E+00 1.79 1.35 8.96 0.00 0.95 39.3 0.471E+00 1.80 1.35 9.02 0.00 0.96 39.4 0.470E+00 1.81 1.35 9.07 0.00 0.96 39.5 0.468E+00 1.82 1.35 9.13 0.00 0.96 39.6 0.467E+00 1.83 1.35 9.18 0.00 0.97 39.8 0.465E+00 1.84 1.35 9.24 0.00 0.97 39.9 0.464E+00 1.85 1.35 9.29 0.00 0.98 40.0 0.463E+00 1.86 1.35 9.35 0.00 0.98 40.1 0.461E+00 1.87 1.35 9.40 0.00 0.98 40.2 0.460E+00 1.88 1.35 9.46 0.00 0.99 40.3 0.459E+00 1.90 1.35 9.51 0.00 0.99 40.4 0.457E+00 1.91 1.35 9.57 0.00 1.00 40.6 0.456E+00 1.92 1.35 9.62 0.00 1.00 40.7 0.455E+00 1.93 1.35 9.68 0.00 1.00 40.8 0.454E+00 1.94 1.35 9.73 0.00 1.01 40.9 0.452E+00 1.95 1.35 9.79 0.00 1.01 41.0 0.451E+00 1.96 1.35 9.84 0.00 1.02 41.1 0.450E+00 1.97 1.35 9.90 0.00 1.02 41.2 0.449E+00 1.98 1.35 9.95 0.00 1.02 41.3 0.447E+00 1.99 1.35 10.01 0.00 1.03 41.5 0.446E+00 2.00 1.35 10.07 0.00 1.03 41.6 0.445E+00 2.01 1.35 10.12 0.00 1.04 41.7 0.444E+00 2.03 1.35 10.18 0.00 1.04 41.8 0.443E+00 2.04 1.35 10.23 0.00 1.04 41.9 0.442E+00 2.05 1.35 10.29 0.00 1.05 42.0 0.440E+00 2.06 1.35 10.34 0.00 1.05 42.1 0.439E+00 2.07 1.35 10.40 0.00 1.06 42.2 0.438E+00 2.08 1.35 10.45 0.00 1.06 42.3 0.437E+00 2.09 1.35 10.51 0.00 1.06 42.4 0.436E+00 2.10 1.35 10.56 0.00 1.07 42.6 0.435E+00 2.11 1.35 10.62 0.00 1.07 42.7 0.434E+00 2.12 1.35 10.67 0.00 1.08 42.8 0.433E+00 2.13 1.35 10.73 0.00 1.08 42.9 0.431E+00 2.15 1.35 10.78 0.00 1.08 43.0 0.430E+00 2.16 1.35 10.84 0.00 1.09 43.1 0.429E+00 2.17 1.35 10.89 0.00 1.09 43.2 0.428E+00 2.18 1.35 10.95 0.00 1.10 43.3 0.427E+00 2.19 1.35 11.00 0.00 1.10 43.4 0.426E+00 2.20 1.35 Cumulative travel time = 34.0160 sec Plume centerline may exhibit slight discontinuities in transition to subsequent far-field module. END OF MOD277: UNSTABLE NEAR-FIELD ZONE OF ALTERNATING PERPENDICULAR DIFFUSER ----------------------------------------------------------------------------- ** End of NEAR-FIELD REGION (NFR) ** ----------------------------------------------------------------------------- BEGIN MOD241: BUOYANT AMBIENT SPREADING Discharge is non-buoyant or weakly buoyant. Therefore BUOYANT SPREADING REGIME is ABSENT.
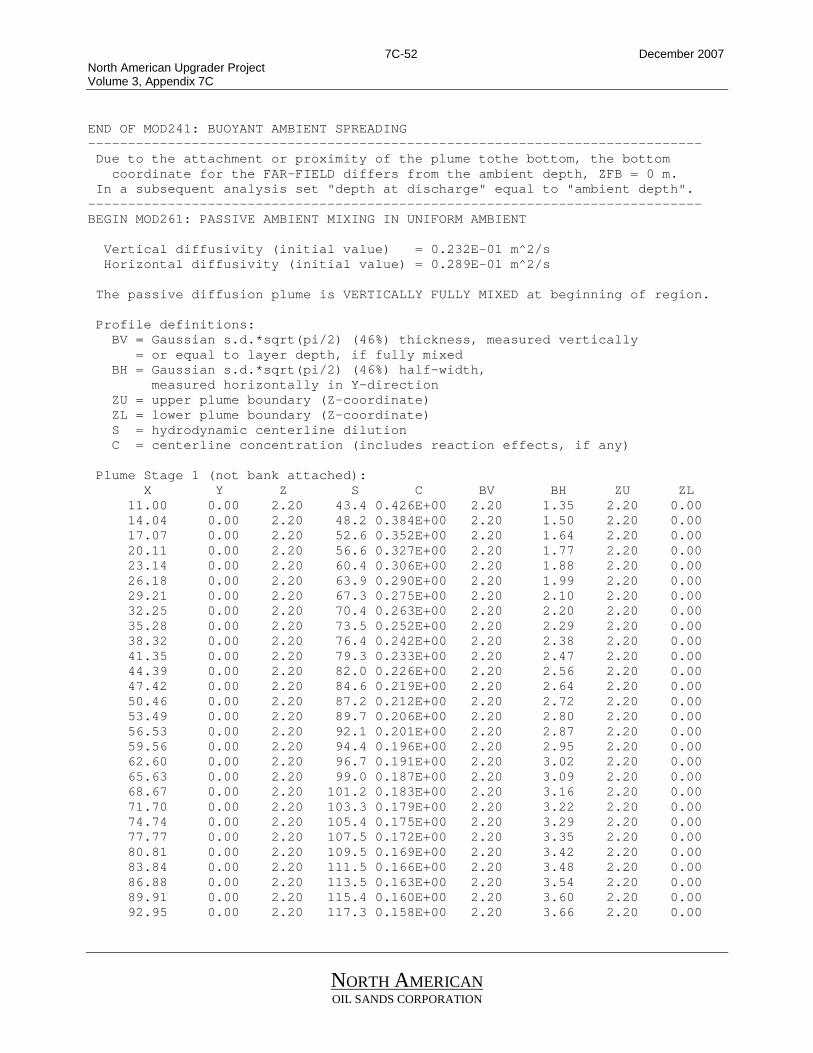
7C-52 December 2007 North American Upgrader Project Volume 3, Appendix 7C
NORTH AMERICAN OIL SANDS CORPORATION
END OF MOD241: BUOYANT AMBIENT SPREADING ----------------------------------------------------------------------------- Due to the attachment or proximity of the plume tothe bottom, the bottom coordinate for the FAR-FIELD differs from the ambient depth, ZFB = 0 m. In a subsequent analysis set "depth at discharge" equal to "ambient depth". ----------------------------------------------------------------------------- BEGIN MOD261: PASSIVE AMBIENT MIXING IN UNIFORM AMBIENT Vertical diffusivity (initial value) = 0.232E-01 m^2/s Horizontal diffusivity (initial value) = 0.289E-01 m^2/s The passive diffusion plume is VERTICALLY FULLY MIXED at beginning of region. Profile definitions: BV = Gaussian s.d.*sqrt(pi/2) (46%) thickness, measured vertically = or equal to layer depth, if fully mixed BH = Gaussian s.d.*sqrt(pi/2) (46%) half-width, measured horizontally in Y-direction ZU = upper plume boundary (Z-coordinate) ZL = lower plume boundary (Z-coordinate) S = hydrodynamic centerline dilution C = centerline concentration (includes reaction effects, if any) Plume Stage 1 (not bank attached): X Y Z S C BV BH ZU ZL 11.00 0.00 2.20 43.4 0.426E+00 2.20 1.35 2.20 0.00 14.04 0.00 2.20 48.2 0.384E+00 2.20 1.50 2.20 0.00 17.07 0.00 2.20 52.6 0.352E+00 2.20 1.64 2.20 0.00 20.11 0.00 2.20 56.6 0.327E+00 2.20 1.77 2.20 0.00 23.14 0.00 2.20 60.4 0.306E+00 2.20 1.88 2.20 0.00 26.18 0.00 2.20 63.9 0.290E+00 2.20 1.99 2.20 0.00 29.21 0.00 2.20 67.3 0.275E+00 2.20 2.10 2.20 0.00 32.25 0.00 2.20 70.4 0.263E+00 2.20 2.20 2.20 0.00 35.28 0.00 2.20 73.5 0.252E+00 2.20 2.29 2.20 0.00 38.32 0.00 2.20 76.4 0.242E+00 2.20 2.38 2.20 0.00 41.35 0.00 2.20 79.3 0.233E+00 2.20 2.47 2.20 0.00 44.39 0.00 2.20 82.0 0.226E+00 2.20 2.56 2.20 0.00 47.42 0.00 2.20 84.6 0.219E+00 2.20 2.64 2.20 0.00 50.46 0.00 2.20 87.2 0.212E+00 2.20 2.72 2.20 0.00 53.49 0.00 2.20 89.7 0.206E+00 2.20 2.80 2.20 0.00 56.53 0.00 2.20 92.1 0.201E+00 2.20 2.87 2.20 0.00 59.56 0.00 2.20 94.4 0.196E+00 2.20 2.95 2.20 0.00 62.60 0.00 2.20 96.7 0.191E+00 2.20 3.02 2.20 0.00 65.63 0.00 2.20 99.0 0.187E+00 2.20 3.09 2.20 0.00 68.67 0.00 2.20 101.2 0.183E+00 2.20 3.16 2.20 0.00 71.70 0.00 2.20 103.3 0.179E+00 2.20 3.22 2.20 0.00 74.74 0.00 2.20 105.4 0.175E+00 2.20 3.29 2.20 0.00 77.77 0.00 2.20 107.5 0.172E+00 2.20 3.35 2.20 0.00 80.81 0.00 2.20 109.5 0.169E+00 2.20 3.42 2.20 0.00 83.84 0.00 2.20 111.5 0.166E+00 2.20 3.48 2.20 0.00 86.88 0.00 2.20 113.5 0.163E+00 2.20 3.54 2.20 0.00 89.91 0.00 2.20 115.4 0.160E+00 2.20 3.60 2.20 0.00 92.95 0.00 2.20 117.3 0.158E+00 2.20 3.66 2.20 0.00

7C-53 December 2007 North American Upgrader Project Volume 3, Appendix 7C
NORTH AMERICAN OIL SANDS CORPORATION
95.99 0.00 2.20 119.1 0.155E+00 2.20 3.72 2.20 0.00 99.02 0.00 2.20 121.0 0.153E+00 2.20 3.77 2.20 0.00 102.06 0.00 2.20 122.8 0.151E+00 2.20 3.83 2.20 0.00 105.09 0.00 2.20 124.6 0.148E+00 2.20 3.89 2.20 0.00 108.13 0.00 2.20 126.3 0.146E+00 2.20 3.94 2.20 0.00 111.16 0.00 2.20 128.0 0.144E+00 2.20 3.99 2.20 0.00 114.20 0.00 2.20 129.7 0.143E+00 2.20 4.05 2.20 0.00 117.23 0.00 2.20 131.4 0.141E+00 2.20 4.10 2.20 0.00 120.27 0.00 2.20 133.1 0.139E+00 2.20 4.15 2.20 0.00 123.30 0.00 2.20 134.7 0.137E+00 2.20 4.20 2.20 0.00 126.34 0.00 2.20 136.4 0.136E+00 2.20 4.25 2.20 0.00 129.37 0.00 2.20 138.0 0.134E+00 2.20 4.30 2.20 0.00 132.41 0.00 2.20 139.5 0.133E+00 2.20 4.35 2.20 0.00 135.44 0.00 2.20 141.1 0.131E+00 2.20 4.40 2.20 0.00 138.48 0.00 2.20 142.7 0.130E+00 2.20 4.45 2.20 0.00 141.51 0.00 2.20 144.2 0.128E+00 2.20 4.50 2.20 0.00 144.55 0.00 2.20 145.7 0.127E+00 2.20 4.55 2.20 0.00 147.58 0.00 2.20 147.2 0.126E+00 2.20 4.59 2.20 0.00 150.62 0.00 2.20 148.7 0.124E+00 2.20 4.64 2.20 0.00 153.65 0.00 2.20 150.2 0.123E+00 2.20 4.68 2.20 0.00 156.69 0.00 2.20 151.6 0.122E+00 2.20 4.73 2.20 0.00 159.72 0.00 2.20 153.1 0.121E+00 2.20 4.78 2.20 0.00 162.76 0.00 2.20 154.5 0.120E+00 2.20 4.82 2.20 0.00 165.79 0.00 2.20 155.9 0.119E+00 2.20 4.86 2.20 0.00 168.83 0.00 2.20 157.3 0.118E+00 2.20 4.91 2.20 0.00 171.86 0.00 2.20 158.7 0.117E+00 2.20 4.95 2.20 0.00 174.90 0.00 2.20 160.1 0.116E+00 2.20 4.99 2.20 0.00 177.94 0.00 2.20 161.5 0.115E+00 2.20 5.04 2.20 0.00 180.97 0.00 2.20 162.8 0.114E+00 2.20 5.08 2.20 0.00 184.01 0.00 2.20 164.2 0.113E+00 2.20 5.12 2.20 0.00 187.04 0.00 2.20 165.5 0.112E+00 2.20 5.16 2.20 0.00 190.08 0.00 2.20 166.8 0.111E+00 2.20 5.20 2.20 0.00 193.11 0.00 2.20 168.1 0.110E+00 2.20 5.25 2.20 0.00 196.15 0.00 2.20 169.4 0.109E+00 2.20 5.29 2.20 0.00 199.18 0.00 2.20 170.7 0.108E+00 2.20 5.33 2.20 0.00 202.22 0.00 2.20 172.0 0.108E+00 2.20 5.37 2.20 0.00 205.25 0.00 2.20 173.3 0.107E+00 2.20 5.41 2.20 0.00 208.29 0.00 2.20 174.5 0.106E+00 2.20 5.45 2.20 0.00 211.32 0.00 2.20 175.8 0.105E+00 2.20 5.48 2.20 0.00 214.36 0.00 2.20 177.0 0.104E+00 2.20 5.52 2.20 0.00 217.39 0.00 2.20 178.3 0.104E+00 2.20 5.56 2.20 0.00 220.43 0.00 2.20 179.5 0.103E+00 2.20 5.60 2.20 0.00 223.46 0.00 2.20 180.7 0.102E+00 2.20 5.64 2.20 0.00 226.50 0.00 2.20 181.9 0.102E+00 2.20 5.68 2.20 0.00 229.53 0.00 2.20 183.1 0.101E+00 2.20 5.71 2.20 0.00 232.57 0.00 2.20 184.3 0.100E+00 2.20 5.75 2.20 0.00 235.60 0.00 2.20 185.5 0.997E-01 2.20 5.79 2.20 0.00 238.64 0.00 2.20 186.7 0.990E-01 2.20 5.82 2.20 0.00 241.67 0.00 2.20 187.9 0.984E-01 2.20 5.86 2.20 0.00 244.71 0.00 2.20 189.1 0.978E-01 2.20 5.90 2.20 0.00 247.74 0.00 2.20 190.2 0.972E-01 2.20 5.93 2.20 0.00 250.78 0.00 2.20 191.4 0.966E-01 2.20 5.97 2.20 0.00 253.81 0.00 2.20 192.5 0.961E-01 2.20 6.01 2.20 0.00 256.85 0.00 2.20 193.7 0.955E-01 2.20 6.04 2.20 0.00

7C-54 December 2007 North American Upgrader Project Volume 3, Appendix 7C
NORTH AMERICAN OIL SANDS CORPORATION
259.89 0.00 2.20 194.8 0.949E-01 2.20 6.08 2.20 0.00 262.92 0.00 2.20 195.9 0.944E-01 2.20 6.11 2.20 0.00 265.96 0.00 2.20 197.0 0.939E-01 2.20 6.15 2.20 0.00 268.99 0.00 2.20 198.1 0.933E-01 2.20 6.18 2.20 0.00 272.03 0.00 2.20 199.2 0.928E-01 2.20 6.22 2.20 0.00 275.06 0.00 2.20 200.3 0.923E-01 2.20 6.25 2.20 0.00 278.10 0.00 2.20 201.4 0.918E-01 2.20 6.28 2.20 0.00 281.13 0.00 2.20 202.5 0.913E-01 2.20 6.32 2.20 0.00 284.17 0.00 2.20 203.6 0.908E-01 2.20 6.35 2.20 0.00 287.20 0.00 2.20 204.7 0.903E-01 2.20 6.39 2.20 0.00 290.24 0.00 2.20 205.8 0.899E-01 2.20 6.42 2.20 0.00 293.27 0.00 2.20 206.8 0.894E-01 2.20 6.45 2.20 0.00 296.31 0.00 2.20 207.9 0.889E-01 2.20 6.49 2.20 0.00 299.34 0.00 2.20 208.9 0.885E-01 2.20 6.52 2.20 0.00 302.38 0.00 2.20 210.0 0.881E-01 2.20 6.55 2.20 0.00 305.41 0.00 2.20 211.0 0.876E-01 2.20 6.58 2.20 0.00 308.45 0.00 2.20 212.1 0.872E-01 2.20 6.62 2.20 0.00 311.48 0.00 2.20 213.1 0.868E-01 2.20 6.65 2.20 0.00 314.52 0.00 2.20 214.1 0.863E-01 2.20 6.68 2.20 0.00 317.55 0.00 2.20 215.2 0.859E-01 2.20 6.71 2.20 0.00 320.59 0.00 2.20 216.2 0.855E-01 2.20 6.74 2.20 0.00 323.62 0.00 2.20 217.2 0.851E-01 2.20 6.78 2.20 0.00 326.66 0.00 2.20 218.2 0.847E-01 2.20 6.81 2.20 0.00 329.69 0.00 2.20 219.2 0.843E-01 2.20 6.84 2.20 0.00 332.73 0.00 2.20 220.2 0.840E-01 2.20 6.87 2.20 0.00 335.76 0.00 2.20 221.2 0.836E-01 2.20 6.90 2.20 0.00 338.80 0.00 2.20 222.2 0.832E-01 2.20 6.93 2.20 0.00 341.84 0.00 2.20 223.2 0.828E-01 2.20 6.96 2.20 0.00 344.87 0.00 2.20 224.2 0.825E-01 2.20 6.99 2.20 0.00 347.91 0.00 2.20 225.2 0.821E-01 2.20 7.02 2.20 0.00 350.94 0.00 2.20 226.1 0.818E-01 2.20 7.05 2.20 0.00 353.98 0.00 2.20 227.1 0.814E-01 2.20 7.08 2.20 0.00 357.01 0.00 2.20 228.1 0.811E-01 2.20 7.11 2.20 0.00 360.05 0.00 2.20 229.0 0.807E-01 2.20 7.14 2.20 0.00 363.08 0.00 2.20 230.0 0.804E-01 2.20 7.17 2.20 0.00 366.12 0.00 2.20 230.9 0.801E-01 2.20 7.20 2.20 0.00 369.15 0.00 2.20 231.9 0.797E-01 2.20 7.23 2.20 0.00 372.19 0.00 2.20 232.8 0.794E-01 2.20 7.26 2.20 0.00 375.22 0.00 2.20 233.8 0.791E-01 2.20 7.29 2.20 0.00 378.26 0.00 2.20 234.7 0.788E-01 2.20 7.32 2.20 0.00 381.29 0.00 2.20 235.6 0.785E-01 2.20 7.35 2.20 0.00 384.33 0.00 2.20 236.6 0.781E-01 2.20 7.38 2.20 0.00 387.36 0.00 2.20 237.5 0.778E-01 2.20 7.41 2.20 0.00 390.40 0.00 2.20 238.4 0.775E-01 2.20 7.44 2.20 0.00 393.43 0.00 2.20 239.3 0.772E-01 2.20 7.47 2.20 0.00 396.47 0.00 2.20 240.3 0.769E-01 2.20 7.50 2.20 0.00 399.50 0.00 2.20 241.2 0.767E-01 2.20 7.52 2.20 0.00 402.54 0.00 2.20 242.1 0.764E-01 2.20 7.55 2.20 0.00 405.57 0.00 2.20 243.0 0.761E-01 2.20 7.58 2.20 0.00 408.61 0.00 2.20 243.9 0.758E-01 2.20 7.61 2.20 0.00 411.64 0.00 2.20 244.8 0.755E-01 2.20 7.64 2.20 0.00 414.68 0.00 2.20 245.7 0.752E-01 2.20 7.66 2.20 0.00 417.71 0.00 2.20 246.6 0.750E-01 2.20 7.69 2.20 0.00 420.75 0.00 2.20 247.5 0.747E-01 2.20 7.72 2.20 0.00

7C-55 December 2007 North American Upgrader Project Volume 3, Appendix 7C
NORTH AMERICAN OIL SANDS CORPORATION
423.79 0.00 2.20 248.4 0.744E-01 2.20 7.75 2.20 0.00 426.82 0.00 2.20 249.2 0.742E-01 2.20 7.78 2.20 0.00 429.86 0.00 2.20 250.1 0.739E-01 2.20 7.80 2.20 0.00 432.89 0.00 2.20 251.0 0.737E-01 2.20 7.83 2.20 0.00 435.93 0.00 2.20 251.9 0.734E-01 2.20 7.86 2.20 0.00 438.96 0.00 2.20 252.8 0.731E-01 2.20 7.89 2.20 0.00 442.00 0.00 2.20 253.6 0.729E-01 2.20 7.91 2.20 0.00 445.03 0.00 2.20 254.5 0.726E-01 2.20 7.94 2.20 0.00 448.07 0.00 2.20 255.3 0.724E-01 2.20 7.97 2.20 0.00 451.10 0.00 2.20 256.2 0.722E-01 2.20 7.99 2.20 0.00 454.14 0.00 2.20 257.1 0.719E-01 2.20 8.02 2.20 0.00 457.17 0.00 2.20 257.9 0.717E-01 2.20 8.05 2.20 0.00 460.21 0.00 2.20 258.8 0.714E-01 2.20 8.07 2.20 0.00 463.24 0.00 2.20 259.6 0.712E-01 2.20 8.10 2.20 0.00 466.28 0.00 2.20 260.5 0.710E-01 2.20 8.13 2.20 0.00 469.31 0.00 2.20 261.3 0.707E-01 2.20 8.15 2.20 0.00 472.35 0.00 2.20 262.1 0.705E-01 2.20 8.18 2.20 0.00 475.38 0.00 2.20 263.0 0.703E-01 2.20 8.20 2.20 0.00 478.42 0.00 2.20 263.8 0.701E-01 2.20 8.23 2.20 0.00 481.45 0.00 2.20 264.7 0.698E-01 2.20 8.26 2.20 0.00 484.49 0.00 2.20 265.5 0.696E-01 2.20 8.28 2.20 0.00 487.52 0.00 2.20 266.3 0.694E-01 2.20 8.31 2.20 0.00 490.56 0.00 2.20 267.1 0.692E-01 2.20 8.33 2.20 0.00 493.59 0.00 2.20 268.0 0.690E-01 2.20 8.36 2.20 0.00 496.63 0.00 2.20 268.8 0.688E-01 2.20 8.38 2.20 0.00 499.67 0.00 2.20 269.6 0.686E-01 2.20 8.41 2.20 0.00 502.70 0.00 2.20 270.4 0.684E-01 2.20 8.44 2.20 0.00 505.74 0.00 2.20 271.2 0.682E-01 2.20 8.46 2.20 0.00 508.77 0.00 2.20 272.0 0.680E-01 2.20 8.49 2.20 0.00 511.81 0.00 2.20 272.8 0.678E-01 2.20 8.51 2.20 0.00 514.84 0.00 2.20 273.6 0.676E-01 2.20 8.54 2.20 0.00 517.88 0.00 2.20 274.4 0.674E-01 2.20 8.56 2.20 0.00 520.91 0.00 2.20 275.2 0.672E-01 2.20 8.59 2.20 0.00 523.95 0.00 2.20 276.0 0.670E-01 2.20 8.61 2.20 0.00 526.98 0.00 2.20 276.8 0.668E-01 2.20 8.64 2.20 0.00 530.02 0.00 2.20 277.6 0.666E-01 2.20 8.66 2.20 0.00 533.05 0.00 2.20 278.4 0.664E-01 2.20 8.69 2.20 0.00 536.09 0.00 2.20 279.2 0.662E-01 2.20 8.71 2.20 0.00 539.12 0.00 2.20 280.0 0.660E-01 2.20 8.73 2.20 0.00 542.16 0.00 2.20 280.8 0.658E-01 2.20 8.76 2.20 0.00 545.19 0.00 2.20 281.6 0.656E-01 2.20 8.78 2.20 0.00 548.23 0.00 2.20 282.3 0.655E-01 2.20 8.81 2.20 0.00 551.26 0.00 2.20 283.1 0.653E-01 2.20 8.83 2.20 0.00 554.30 0.00 2.20 283.9 0.651E-01 2.20 8.86 2.20 0.00 557.33 0.00 2.20 284.7 0.649E-01 2.20 8.88 2.20 0.00 560.37 0.00 2.20 285.4 0.648E-01 2.20 8.90 2.20 0.00 563.40 0.00 2.20 286.2 0.646E-01 2.20 8.93 2.20 0.00 566.44 0.00 2.20 287.0 0.644E-01 2.20 8.95 2.20 0.00 569.47 0.00 2.20 287.7 0.642E-01 2.20 8.98 2.20 0.00 572.51 0.00 2.20 288.5 0.641E-01 2.20 9.00 2.20 0.00 575.54 0.00 2.20 289.3 0.639E-01 2.20 9.02 2.20 0.00 578.58 0.00 2.20 290.0 0.637E-01 2.20 9.05 2.20 0.00 581.61 0.00 2.20 290.8 0.636E-01 2.20 9.07 2.20 0.00

7C-56 December 2007 North American Upgrader Project Volume 3, Appendix 7C
NORTH AMERICAN OIL SANDS CORPORATION
584.65 0.00 2.20 291.5 0.634E-01 2.20 9.09 2.20 0.00 587.68 0.00 2.20 292.3 0.632E-01 2.20 9.12 2.20 0.00 590.72 0.00 2.20 293.0 0.631E-01 2.20 9.14 2.20 0.00 593.76 0.00 2.20 293.8 0.629E-01 2.20 9.17 2.20 0.00 596.79 0.00 2.20 294.5 0.627E-01 2.20 9.19 2.20 0.00 599.83 0.00 2.20 295.3 0.626E-01 2.20 9.21 2.20 0.00 602.86 0.00 2.20 296.0 0.624E-01 2.20 9.23 2.20 0.00 605.90 0.00 2.20 296.8 0.623E-01 2.20 9.26 2.20 0.00 608.93 0.00 2.20 297.5 0.621E-01 2.20 9.28 2.20 0.00 611.97 0.00 2.20 298.2 0.620E-01 2.20 9.30 2.20 0.00 615.00 0.00 2.20 299.0 0.618E-01 2.20 9.33 2.20 0.00 618.04 0.00 2.20 299.7 0.617E-01 2.20 9.35 2.20 0.00 Cumulative travel time = 975.1174 sec ----------------------------------------------------------------------------- Plume Stage 2 (bank attached): X Y Z S C BV BH ZU ZL 618.04 -9.35 2.20 299.7 0.617E-01 2.20 18.70 2.20 0.00 714.95 -9.35 2.20 305.5 0.605E-01 2.20 19.06 2.20 0.00 811.86 -9.35 2.20 311.2 0.594E-01 2.20 19.42 2.20 0.00 908.77 -9.35 2.20 316.8 0.583E-01 2.20 19.77 2.20 0.00 1005.68 -9.35 2.20 322.3 0.573E-01 2.20 20.11 2.20 0.00 1102.59 -9.35 2.20 327.7 0.564E-01 2.20 20.45 2.20 0.00 1199.49 -9.35 2.20 333.0 0.554E-01 2.20 20.78 2.20 0.00 ** REGULATORY MIXING ZONE BOUNDARY ** In this prediction interval the plume DOWNSTREAM distance meets or exceeds the regulatory value = 1293.00 m. This is the extent of the REGULATORY MIXING ZONE. 1296.40 -9.35 2.20 338.2 0.546E-01 2.20 21.10 2.20 0.00 1393.31 -9.35 2.20 343.4 0.538E-01 2.20 21.42 2.20 0.00 1490.22 -9.35 2.20 348.4 0.530E-01 2.20 21.74 2.20 0.00 1587.13 -9.35 2.20 353.4 0.522E-01 2.20 22.05 2.20 0.00 1684.04 -9.35 2.20 358.4 0.515E-01 2.20 22.36 2.20 0.00 1780.95 -9.35 2.20 363.2 0.508E-01 2.20 22.66 2.20 0.00 1877.86 -9.35 2.20 368.0 0.501E-01 2.20 22.96 2.20 0.00 1974.77 -9.35 2.20 372.8 0.495E-01 2.20 23.26 2.20 0.00 2071.68 -9.35 2.20 377.5 0.488E-01 2.20 23.55 2.20 0.00 2168.59 -9.35 2.20 382.1 0.482E-01 2.20 23.84 2.20 0.00 2265.50 -9.35 2.20 386.6 0.477E-01 2.20 24.12 2.20 0.00 2362.41 -9.35 2.20 391.2 0.471E-01 2.20 24.41 2.20 0.00 2459.32 -9.35 2.20 395.6 0.466E-01 2.20 24.68 2.20 0.00 2556.23 -9.35 2.20 400.0 0.460E-01 2.20 24.96 2.20 0.00 2653.14 -9.35 2.20 404.4 0.455E-01 2.20 25.23 2.20 0.00 2750.05 -9.35 2.20 408.7 0.451E-01 2.20 25.50 2.20 0.00 2846.96 -9.35 2.20 413.0 0.446E-01 2.20 25.77 2.20 0.00 2943.87 -9.35 2.20 417.2 0.441E-01 2.20 26.03 2.20 0.00 3040.78 -9.35 2.20 421.4 0.437E-01 2.20 26.29 2.20 0.00 3137.69 -9.35 2.20 425.5 0.432E-01 2.20 26.55 2.20 0.00 3234.60 -9.35 2.20 429.6 0.428E-01 2.20 26.81 2.20 0.00 3331.51 -9.35 2.20 433.7 0.424E-01 2.20 27.06 2.20 0.00 3428.42 -9.35 2.20 437.7 0.420E-01 2.20 27.31 2.20 0.00 3525.33 -9.35 2.20 441.7 0.416E-01 2.20 27.56 2.20 0.00 3622.24 -9.35 2.20 445.7 0.413E-01 2.20 27.81 2.20 0.00 3719.15 -9.35 2.20 449.6 0.409E-01 2.20 28.05 2.20 0.00
7C-57 December 2007 North American Upgrader Project Volume 3, Appendix 7C
NORTH AMERICAN OIL SANDS CORPORATION
3816.06 -9.35 2.20 453.5 0.405E-01 2.20 28.29 2.20 0.00 3912.97 -9.35 2.20 457.3 0.402E-01 2.20 28.54 2.20 0.00 4009.88 -9.35 2.20 461.2 0.398E-01 2.20 28.77 2.20 0.00 4106.79 -9.35 2.20 465.0 0.395E-01 2.20 29.01 2.20 0.00 4203.70 -9.35 2.20 468.7 0.392E-01 2.20 29.24 2.20 0.00 4300.61 -9.35 2.20 472.4 0.389E-01 2.20 29.48 2.20 0.00 4397.52 -9.35 2.20 476.1 0.386E-01 2.20 29.71 2.20 0.00 4494.43 -9.35 2.20 479.8 0.383E-01 2.20 29.94 2.20 0.00 4591.34 -9.35 2.20 483.5 0.380E-01 2.20 30.16 2.20 0.00 4688.25 -9.35 2.20 487.1 0.377E-01 2.20 30.39 2.20 0.00 4785.16 -9.35 2.20 490.7 0.374E-01 2.20 30.61 2.20 0.00 4882.07 -9.35 2.20 494.2 0.371E-01 2.20 30.84 2.20 0.00 4978.98 -9.35 2.20 497.8 0.369E-01 2.20 31.06 2.20 0.00 5075.89 -9.35 2.20 501.3 0.366E-01 2.20 31.28 2.20 0.00 5172.80 -9.35 2.20 504.8 0.363E-01 2.20 31.49 2.20 0.00 5269.71 -9.35 2.20 508.2 0.361E-01 2.20 31.71 2.20 0.00 5366.62 -9.35 2.20 511.7 0.358E-01 2.20 31.93 2.20 0.00 5463.53 -9.35 2.20 515.1 0.356E-01 2.20 32.14 2.20 0.00 5560.44 -9.35 2.20 518.5 0.353E-01 2.20 32.35 2.20 0.00 5657.35 -9.35 2.20 521.9 0.351E-01 2.20 32.56 2.20 0.00 5754.26 -9.35 2.20 525.2 0.349E-01 2.20 32.77 2.20 0.00 5851.17 -9.35 2.20 528.5 0.347E-01 2.20 32.98 2.20 0.00 5948.07 -9.35 2.20 531.9 0.344E-01 2.20 33.18 2.20 0.00 6044.98 -9.35 2.20 535.1 0.342E-01 2.20 33.39 2.20 0.00 6141.89 -9.35 2.20 538.4 0.340E-01 2.20 33.59 2.20 0.00 6238.80 -9.35 2.20 541.7 0.338E-01 2.20 33.80 2.20 0.00 6335.71 -9.35 2.20 544.9 0.336E-01 2.20 34.00 2.20 0.00 6432.62 -9.35 2.20 548.1 0.334E-01 2.20 34.20 2.20 0.00 6529.53 -9.35 2.20 551.3 0.332E-01 2.20 34.40 2.20 0.00 6626.44 -9.35 2.20 554.5 0.330E-01 2.20 34.60 2.20 0.00 6723.35 -9.35 2.20 557.6 0.328E-01 2.20 34.79 2.20 0.00 6820.26 -9.35 2.20 560.8 0.326E-01 2.20 34.99 2.20 0.00 6917.17 -9.35 2.20 563.9 0.324E-01 2.20 35.18 2.20 0.00 7014.08 -9.35 2.20 567.0 0.322E-01 2.20 35.38 2.20 0.00 7110.99 -9.35 2.20 570.1 0.321E-01 2.20 35.57 2.20 0.00 7207.90 -9.35 2.20 573.1 0.319E-01 2.20 35.76 2.20 0.00 7304.81 -9.35 2.20 576.2 0.317E-01 2.20 35.95 2.20 0.00 7401.72 -9.35 2.20 579.2 0.315E-01 2.20 36.14 2.20 0.00 7498.63 -9.35 2.20 582.3 0.314E-01 2.20 36.33 2.20 0.00 7595.54 -9.35 2.20 585.3 0.312E-01 2.20 36.52 2.20 0.00 7692.45 -9.35 2.20 588.3 0.310E-01 2.20 36.70 2.20 0.00 7789.36 -9.35 2.20 591.2 0.309E-01 2.20 36.89 2.20 0.00 7886.27 -9.35 2.20 594.2 0.307E-01 2.20 37.07 2.20 0.00 7983.18 -9.35 2.20 597.1 0.306E-01 2.20 37.26 2.20 0.00 8080.09 -9.35 2.20 600.1 0.304E-01 2.20 37.44 2.20 0.00 8177.00 -9.35 2.20 603.0 0.303E-01 2.20 37.62 2.20 0.00 8273.91 -9.35 2.20 605.9 0.301E-01 2.20 37.80 2.20 0.00 8370.82 -9.35 2.20 608.8 0.300E-01 2.20 37.98 2.20 0.00 8467.73 -9.35 2.20 611.7 0.298E-01 2.20 38.16 2.20 0.00 8564.64 -9.35 2.20 614.5 0.297E-01 2.20 38.34 2.20 0.00 8661.55 -9.35 2.20 617.4 0.295E-01 2.20 38.52 2.20 0.00 8758.46 -9.35 2.20 620.2 0.294E-01 2.20 38.70 2.20 0.00 8855.37 -9.35 2.20 623.0 0.293E-01 2.20 38.87 2.20 0.00

7C-58 December 2007 North American Upgrader Project Volume 3, Appendix 7C
NORTH AMERICAN OIL SANDS CORPORATION
8952.28 -9.35 2.20 625.8 0.291E-01 2.20 39.05 2.20 0.00 9049.19 -9.35 2.20 628.6 0.290E-01 2.20 39.22 2.20 0.00 9146.10 -9.35 2.20 631.4 0.289E-01 2.20 39.40 2.20 0.00 9243.01 -9.35 2.20 634.2 0.287E-01 2.20 39.57 2.20 0.00 9339.92 -9.35 2.20 637.0 0.286E-01 2.20 39.74 2.20 0.00 9436.83 -9.35 2.20 639.7 0.285E-01 2.20 39.91 2.20 0.00 9533.74 -9.35 2.20 642.4 0.283E-01 2.20 40.08 2.20 0.00 9630.65 -9.35 2.20 645.2 0.282E-01 2.20 40.25 2.20 0.00 9727.56 -9.35 2.20 647.9 0.281E-01 2.20 40.42 2.20 0.00 9824.47 -9.35 2.20 650.6 0.280E-01 2.20 40.59 2.20 0.00 9921.38 -9.35 2.20 653.3 0.279E-01 2.20 40.76 2.20 0.00 10018.29 -9.35 2.20 656.0 0.277E-01 2.20 40.93 2.20 0.00 10115.20 -9.35 2.20 658.6 0.276E-01 2.20 41.09 2.20 0.00 10212.11 -9.35 2.20 661.3 0.275E-01 2.20 41.26 2.20 0.00 10309.02 -9.35 2.20 663.9 0.274E-01 2.20 41.43 2.20 0.00 10405.93 -9.35 2.20 666.6 0.273E-01 2.20 41.59 2.20 0.00 10502.84 -9.35 2.20 669.2 0.272E-01 2.20 41.75 2.20 0.00 10599.75 -9.35 2.20 671.8 0.271E-01 2.20 41.92 2.20 0.00 10696.66 -9.35 2.20 674.4 0.269E-01 2.20 42.08 2.20 0.00 10793.57 -9.35 2.20 677.0 0.268E-01 2.20 42.24 2.20 0.00 10890.48 -9.35 2.20 679.6 0.267E-01 2.20 42.40 2.20 0.00 10987.39 -9.35 2.20 682.2 0.266E-01 2.20 42.56 2.20 0.00 11084.30 -9.35 2.20 684.8 0.265E-01 2.20 42.72 2.20 0.00 11181.21 -9.35 2.20 687.3 0.264E-01 2.20 42.88 2.20 0.00 11278.12 -9.35 2.20 689.9 0.263E-01 2.20 43.04 2.20 0.00 11375.03 -9.35 2.20 692.4 0.262E-01 2.20 43.20 2.20 0.00 11471.94 -9.35 2.20 694.9 0.261E-01 2.20 43.36 2.20 0.00 11568.85 -9.35 2.20 697.5 0.260E-01 2.20 43.52 2.20 0.00 11665.76 -9.35 2.20 700.0 0.259E-01 2.20 43.67 2.20 0.00 11762.67 -9.35 2.20 702.5 0.258E-01 2.20 43.83 2.20 0.00 11859.58 -9.35 2.20 705.0 0.257E-01 2.20 43.99 2.20 0.00 11956.49 -9.35 2.20 707.4 0.256E-01 2.20 44.14 2.20 0.00 12053.40 -9.35 2.20 709.9 0.255E-01 2.20 44.29 2.20 0.00 12150.31 -9.35 2.20 712.4 0.254E-01 2.20 44.45 2.20 0.00 12247.22 -9.35 2.20 714.9 0.254E-01 2.20 44.60 2.20 0.00 12344.13 -9.35 2.20 717.3 0.253E-01 2.20 44.75 2.20 0.00 12441.04 -9.35 2.20 719.7 0.252E-01 2.20 44.91 2.20 0.00 12537.95 -9.35 2.20 722.2 0.251E-01 2.20 45.06 2.20 0.00 12634.86 -9.35 2.20 724.6 0.250E-01 2.20 45.21 2.20 0.00 12731.77 -9.35 2.20 727.0 0.249E-01 2.20 45.36 2.20 0.00 12828.68 -9.35 2.20 729.4 0.248E-01 2.20 45.51 2.20 0.00 12925.59 -9.35 2.20 731.8 0.247E-01 2.20 45.66 2.20 0.00 13022.50 -9.35 2.20 734.2 0.247E-01 2.20 45.81 2.20 0.00 13119.42 -9.35 2.20 736.6 0.246E-01 2.20 45.96 2.20 0.00 13216.33 -9.35 2.20 739.0 0.245E-01 2.20 46.11 2.20 0.00 13313.24 -9.35 2.20 741.4 0.244E-01 2.20 46.26 2.20 0.00 13410.15 -9.35 2.20 743.7 0.243E-01 2.20 46.40 2.20 0.00 13507.06 -9.35 2.20 746.1 0.242E-01 2.20 46.55 2.20 0.00 13603.97 -9.35 2.20 748.4 0.242E-01 2.20 46.70 2.20 0.00 13700.88 -9.35 2.20 750.8 0.241E-01 2.20 46.84 2.20 0.00 13797.79 -9.35 2.20 753.1 0.240E-01 2.20 46.99 2.20 0.00 13894.70 -9.35 2.20 755.4 0.239E-01 2.20 47.13 2.20 0.00 13991.61 -9.35 2.20 757.8 0.238E-01 2.20 47.28 2.20 0.00 14088.52 -9.35 2.20 760.1 0.238E-01 2.20 47.42 2.20 0.00

7C-59 December 2007 North American Upgrader Project Volume 3, Appendix 7C
NORTH AMERICAN OIL SANDS CORPORATION
14185.43 -9.35 2.20 762.4 0.237E-01 2.20 47.57 2.20 0.00 14282.34 -9.35 2.20 764.7 0.236E-01 2.20 47.71 2.20 0.00 14379.25 -9.35 2.20 767.0 0.235E-01 2.20 47.85 2.20 0.00 14476.16 -9.35 2.20 769.2 0.235E-01 2.20 48.00 2.20 0.00 14573.07 -9.35 2.20 771.5 0.234E-01 2.20 48.14 2.20 0.00 14669.98 -9.35 2.20 773.8 0.233E-01 2.20 48.28 2.20 0.00 14766.89 -9.35 2.20 776.1 0.233E-01 2.20 48.42 2.20 0.00 14863.80 -9.35 2.20 778.3 0.232E-01 2.20 48.56 2.20 0.00 14960.71 -9.35 2.20 780.6 0.231E-01 2.20 48.70 2.20 0.00 15057.62 -9.35 2.20 782.8 0.230E-01 2.20 48.84 2.20 0.00 15154.53 -9.35 2.20 785.1 0.230E-01 2.20 48.98 2.20 0.00 15251.44 -9.35 2.20 787.3 0.229E-01 2.20 49.12 2.20 0.00 15348.35 -9.35 2.20 789.5 0.228E-01 2.20 49.26 2.20 0.00 15445.26 -9.35 2.20 791.7 0.228E-01 2.20 49.40 2.20 0.00 15542.17 -9.35 2.20 793.9 0.227E-01 2.20 49.54 2.20 0.00 15639.08 -9.35 2.20 796.2 0.226E-01 2.20 49.67 2.20 0.00 15735.99 -9.35 2.20 798.4 0.226E-01 2.20 49.81 2.20 0.00 15832.90 -9.35 2.20 800.5 0.225E-01 2.20 49.95 2.20 0.00 15929.81 -9.35 2.20 802.7 0.224E-01 2.20 50.09 2.20 0.00 16026.72 -9.35 2.20 804.9 0.224E-01 2.20 50.22 2.20 0.00 16123.63 -9.35 2.20 807.1 0.223E-01 2.20 50.36 2.20 0.00 16220.54 -9.35 2.20 809.3 0.222E-01 2.20 50.49 2.20 0.00 16317.45 -9.35 2.20 811.4 0.222E-01 2.20 50.63 2.20 0.00 16414.36 -9.35 2.20 813.6 0.221E-01 2.20 50.76 2.20 0.00 16511.27 -9.35 2.20 815.7 0.221E-01 2.20 50.90 2.20 0.00 16608.18 -9.35 2.20 817.9 0.220E-01 2.20 51.03 2.20 0.00 16705.09 -9.35 2.20 820.0 0.219E-01 2.20 51.17 2.20 0.00 16802.00 -9.35 2.20 822.2 0.219E-01 2.20 51.30 2.20 0.00 16898.91 -9.35 2.20 824.3 0.218E-01 2.20 51.43 2.20 0.00 16995.82 -9.35 2.20 826.4 0.218E-01 2.20 51.56 2.20 0.00 17092.73 -9.35 2.20 828.6 0.217E-01 2.20 51.70 2.20 0.00 17189.64 -9.35 2.20 830.7 0.216E-01 2.20 51.83 2.20 0.00 17286.55 -9.35 2.20 832.8 0.216E-01 2.20 51.96 2.20 0.00 17383.46 -9.35 2.20 834.9 0.215E-01 2.20 52.09 2.20 0.00 17480.37 -9.35 2.20 837.0 0.215E-01 2.20 52.22 2.20 0.00 17577.28 -9.35 2.20 839.1 0.214E-01 2.20 52.35 2.20 0.00 17674.19 -9.35 2.20 841.2 0.213E-01 2.20 52.48 2.20 0.00 17771.10 -9.35 2.20 843.3 0.213E-01 2.20 52.61 2.20 0.00 17868.01 -9.35 2.20 845.3 0.212E-01 2.20 52.74 2.20 0.00 17964.92 -9.35 2.20 847.4 0.212E-01 2.20 52.87 2.20 0.00 18061.83 -9.35 2.20 849.5 0.211E-01 2.20 53.00 2.20 0.00 18158.74 -9.35 2.20 851.5 0.211E-01 2.20 53.13 2.20 0.00 18255.65 -9.35 2.20 853.6 0.210E-01 2.20 53.26 2.20 0.00 18352.56 -9.35 2.20 855.6 0.210E-01 2.20 53.39 2.20 0.00 18449.47 -9.35 2.20 857.7 0.209E-01 2.20 53.51 2.20 0.00 18546.38 -9.35 2.20 859.7 0.209E-01 2.20 53.64 2.20 0.00 18643.29 -9.35 2.20 861.8 0.208E-01 2.20 53.77 2.20 0.00 18740.20 -9.35 2.20 863.8 0.208E-01 2.20 53.90 2.20 0.00 18837.11 -9.35 2.20 865.8 0.207E-01 2.20 54.02 2.20 0.00 18934.02 -9.35 2.20 867.9 0.206E-01 2.20 54.15 2.20 0.00 19030.93 -9.35 2.20 869.9 0.206E-01 2.20 54.28 2.20 0.00 19127.84 -9.35 2.20 871.9 0.205E-01 2.20 54.40 2.20 0.00 19224.75 -9.35 2.20 873.9 0.205E-01 2.20 54.53 2.20 0.00 19321.66 -9.35 2.20 875.9 0.204E-01 2.20 54.65 2.20 0.00

7C-60 December 2007 North American Upgrader Project Volume 3, Appendix 7C
NORTH AMERICAN OIL SANDS CORPORATION
19418.57 -9.35 2.20 877.9 0.204E-01 2.20 54.78 2.20 0.00 19515.48 -9.35 2.20 879.9 0.203E-01 2.20 54.90 2.20 0.00 19612.39 -9.35 2.20 881.9 0.203E-01 2.20 55.03 2.20 0.00 19709.30 -9.35 2.20 883.9 0.202E-01 2.20 55.15 2.20 0.00 19806.21 -9.35 2.20 885.9 0.202E-01 2.20 55.27 2.20 0.00 19903.12 -9.35 2.20 887.9 0.202E-01 2.20 55.40 2.20 0.00 20000.04 -9.35 2.20 889.8 0.201E-01 2.20 55.52 2.20 0.00 Cumulative travel time = 31023.3711 sec Simulation limit based on maximum specified distance = 20000.00 m. This is the REGION OF INTEREST limitation. END OF MOD261: PASSIVE AMBIENT MIXING IN UNIFORM AMBIENT ----------------------------------------------------------------------------- ----------------------------------------------------------------------------- CORMIX2: Multiport Diffuser Discharges End of Prediction File 22222222222222222222222222222222222222222222222222222222222222222222222222222

North American Upgrader ProjectVolume 3, Appendix 7D
December 2007
Appendix 7D - WASP Results - Chloride Base Case
Relative Distance from Right Bank 0.5 1.5 2.5 3.5 4.5 5.5 6.5 7.5 8.5 9.5 10.5 11.5 12.5 13.5 14.5 15.5 16.5 17.5 18.5 19.5 20.5 21.5
1 27.03896 25.98364 23.98927 22.36388 21.01696 19.88356 17.85016 16.32229 15.54375 14.87251 14.16252 13.55016 13.01513 12.54251 21.45971 19.71515 17.79449 16.43229 15.95698 15.53681 14.84782 14.267132 10.41535 12.28283 13.0204 13.42437 13.60906 13.64999 13.37675 12.96104 12.68917 12.41132 12.07204 11.74713 11.43981 11.15096 12.61974 13.31854 13.56911 13.43549 13.3429 13.22595 12.95312 12.670273 4.335628 5.429506 6.108233 6.706793 7.216995 7.641643 8.302232 8.685243 8.837801 8.931385 8.982599 8.987461 8.959643 8.90896 9.165334 9.484266 9.895006 10.14475 10.21965 10.27191 10.3082 10.295614 2.112107 2.587089 2.929105 3.281332 3.631083 3.968892 4.681046 5.252105 5.545855 5.794644 6.043994 6.242152 6.397608 6.517769 6.651013 6.819455 7.124562 7.403473 7.508462 7.605335 7.763127 7.886385 1.298908 1.486285 1.631081 1.793137 1.968819 2.15411 2.626613 3.07531 3.331019 3.570152 3.839607 4.080328 4.293325 4.480403 4.625283 4.772289 5.025364 5.275817 5.374749 5.471601 5.652001 5.816116 1.001509 1.072536 1.129445 1.196262 1.27281 1.358453 1.611693 1.885654 2.053794 2.222493 2.428626 2.627317 2.816217 2.993903 3.130802 3.26417 3.482947 3.699175 3.785195 3.870589 4.036997 4.1971567 0.892773 0.919223 0.940821 0.966892 0.997821 1.03384 1.153905 1.298717 1.393093 1.493413 1.624602 1.75935 1.895324 2.030599 2.138296 2.245078 2.421846 2.598243 2.668769 2.739259 2.879635 3.018668 0.853087 0.862899 0.87099 0.880914 0.892946 0.907342 0.960265 1.03037 1.078446 1.132177 1.206861 1.288147 1.374802 1.465617 1.540693 1.61753 1.749645 1.885392 1.940249 1.995643 2.108316 2.2224929 0.838799 0.842554 0.845667 0.84952 0.854256 0.860026 0.883056 0.916256 0.940083 0.967965 1.009029 1.05629 1.109437 1.168041 1.21837 1.271723 1.368102 1.471189 1.513453 1.556705 1.646856 1.74032
10 0.834189 0.835981 0.83747 0.839324 0.84162 0.844451 0.856515 0.875183 0.88909 0.905991 0.932113 0.963593 1.000567 1.043023 1.080596 1.121551 1.198597 1.283781 1.319114 1.355665 1.433314 1.515181
Relative Distance from Right Bank 22.5 23.5 24.5 25.5 27 29 31.5 33.5 34.5 35.5 37 39 41 43 44.5 45.5 47 49 50.5 52.5 55.5 58.5
1 13.76693 13.32855 12.93901 12.58899 12.00231 11.733 11.37274 10.77744 10.68147 11.02703 10.76607 10.54458 10.34971 10.17401 13.48651 13.00027 12.32745 11.83325 11.53138 10.91841 10.59068 10.317292 12.39141 12.12304 11.86781 11.62649 11.19567 10.99247 10.71235 10.23175 10.15376 10.13735 10.04851 9.935566 9.813894 9.690914 10.09087 10.32609 10.47727 10.4743 10.42453 10.16928 9.989922 9.8161463 10.24908 10.17953 10.09479 10.00038 9.796692 9.693193 9.538494 9.245521 9.197188 9.157491 9.086717 9.01603 8.943553 8.869703 8.895165 8.945733 9.042913 9.107256 9.135271 9.10823 9.060413 8.9964944 7.978791 8.044794 8.088777 8.114698 8.11768 8.109376 8.081099 7.990746 7.974862 7.959366 7.930372 7.902183 7.873975 7.845482 7.839655 7.843658 7.87588 7.917231 7.948781 8.014181 8.043317 8.0597335 5.962655 6.091609 6.203755 6.300333 6.442805 6.502801 6.571939 6.653153 6.665211 6.676056 6.69433 6.710854 6.726866 6.742943 6.752176 6.763674 6.797496 6.840963 6.877997 7.000118 7.079714 7.1531476 4.349537 4.493071 4.627154 4.751576 4.963848 5.061255 5.189569 5.390012 5.42192 5.452424 5.508583 5.565002 5.623828 5.684654 5.715558 5.747004 5.812162 5.884267 5.943026 6.13534 6.262078 6.3812287 3.155482 3.289271 3.419301 3.544998 3.776785 3.887619 4.042481 4.310616 4.354164 4.396602 4.477311 4.57434 4.682598 4.793679 4.848985 4.903366 5.00605 5.125898 5.223535 5.505636 5.676835 5.8277898 2.337698 2.453398 2.569042 2.684098 2.908438 3.018797 3.179345 3.477016 3.525959 3.574228 3.668029 3.850545 4.039115 4.208215 4.286677 4.358901 4.482355 4.697152 4.862066 5.22075 5.405498 5.5511349 1.836737 1.93571 2.036814 2.139611 2.34857 2.453478 2.610568 2.916283 2.966965 3.017349 3.116718 3.628691 3.914236 4.087815 4.155992 4.211748 4.298197 4.859135 5.105309 5.37428 5.472902 5.541518
10 1.600928 1.690202 1.782631 1.877824 2.076029 2.176677 2.329808 2.635793 2.68674 2.7376 2.838693 4.814781 4.574625 4.444799 4.400355 4.371327 4.351815 6.563736 6.25121 5.85658 5.72115 5.657737
7.047195 7.047177 7.047159 7.330319 7.33031 7.330281 7.330251 7.330221
Distance Downstream
Distance Downstream
NORTH AMERICANOIL SANDS CORPORATION

North American Upgrader ProjectVolume 3, Appendix 7D
December 2007
Appendix 7D - WASP Results - Chloride Application Case
Relative Distance from Right Bank 0.5 1.5 2.5 3.5 4.5 5.5 6.5 7.5 8.5 9.5 10.5 11.5 12.5 13.5 14.5 15.5 16.5 17.5 18.5 19.5 20.5 21.5
1 27.03896 25.98364 23.98927 22.36388 21.01696 19.88356 17.85016 16.32229 15.54375 14.87251 14.16252 13.55016 13.01513 12.54251 21.45971 19.71515 17.79449 16.43229 15.95698 15.53681 14.84782 14.267132 10.41535 12.28283 13.0204 13.42437 13.60906 13.64999 13.37675 12.96104 12.68917 12.41132 12.07204 11.74713 11.43981 11.15096 12.61974 13.31854 13.56911 13.43549 13.3429 13.22595 12.95312 12.670273 4.335628 5.429506 6.108233 6.706793 7.216995 7.641643 8.302232 8.685243 8.837801 8.931385 8.982599 8.987461 8.959643 8.90896 9.165334 9.484266 9.895006 10.14475 10.21965 10.27191 10.3082 10.295614 2.112107 2.587089 2.929105 3.281332 3.631083 3.968892 4.681046 5.252105 5.545855 5.794644 6.043994 6.242152 6.397608 6.517769 6.651013 6.819455 7.124562 7.403473 7.508462 7.605335 7.763127 7.886385 1.298908 1.486285 1.631081 1.793137 1.968819 2.15411 2.626613 3.07531 3.331019 3.570152 3.839607 4.080328 4.293325 4.480403 4.625283 4.772289 5.025364 5.275817 5.374749 5.471601 5.652001 5.816116 1.001509 1.072536 1.129445 1.196262 1.27281 1.358453 1.611693 1.885654 2.053794 2.222493 2.428626 2.627317 2.816217 2.993903 3.130802 3.26417 3.482947 3.699175 3.785195 3.870589 4.036997 4.1971567 0.892773 0.919223 0.940821 0.966892 0.997821 1.03384 1.153905 1.298717 1.393093 1.493413 1.624602 1.75935 1.895324 2.030599 2.138296 2.245078 2.421846 2.598243 2.668769 2.739259 2.879635 3.018668 0.853087 0.862899 0.87099 0.880914 0.892946 0.907342 0.960265 1.03037 1.078446 1.132177 1.206861 1.288147 1.374802 1.465617 1.540693 1.61753 1.749645 1.885392 1.940249 1.995643 2.108316 2.2224929 0.838799 0.842554 0.845667 0.84952 0.854256 0.860026 0.883056 0.916256 0.940083 0.967965 1.009029 1.05629 1.109437 1.168041 1.21837 1.271723 1.368102 1.471189 1.513453 1.556705 1.646856 1.74032
10 0.834189 0.835981 0.83747 0.839324 0.84162 0.844451 0.856515 0.875183 0.88909 0.905991 0.932113 0.963593 1.000567 1.043023 1.080596 1.121551 1.198597 1.283781 1.319114 1.355665 1.433314 1.515181
Relative Distance from Right Bank 22.5 23.5 24.5 25.5 27 29 31.5 33.5 34.5 35.5 37 39 41 43 44.5 45.5 47 49 50.5 52.5 55.5 58.5
1 13.76693 13.32855 12.93901 12.58899 12.00231 11.733 11.37274 10.77744 10.68147 11.02703 10.76607 10.54458 10.34971 10.17401 13.48651 13.00027 12.32745 15.02586 14.25135 12.94106 12.31551 11.837592 12.39141 12.12304 11.86781 11.62649 11.19567 10.99247 10.71235 10.23175 10.15376 10.13735 10.04851 9.935566 9.813894 9.690914 10.09087 10.32609 10.47727 11.17919 11.41153 11.33965 11.16875 10.961473 10.24908 10.17953 10.09479 10.00038 9.796692 9.693193 9.538494 9.245521 9.197188 9.157491 9.086717 9.01603 8.943553 8.869703 8.895165 8.945733 9.042913 9.262888 9.423651 9.650439 9.708753 9.7054144 7.978791 8.044794 8.088777 8.114698 8.11768 8.109376 8.081099 7.990746 7.974862 7.959366 7.930372 7.902183 7.873975 7.845482 7.839655 7.843658 7.87588 7.951594 8.025296 8.238465 8.355742 8.4433165 5.962655 6.091609 6.203755 6.300333 6.442805 6.502801 6.571939 6.653153 6.665211 6.676056 6.69433 6.710854 6.726866 6.742943 6.752176 6.763674 6.797496 6.84855 6.897233 7.087083 7.217817 7.3418486 4.349537 4.493071 4.627154 4.751576 4.963848 5.061255 5.189569 5.390012 5.42192 5.452424 5.508583 5.565002 5.623828 5.684654 5.715558 5.747004 5.812162 5.885942 5.947701 6.167764 6.319609 6.4678097 3.155482 3.289271 3.419301 3.544998 3.776785 3.887619 4.042481 4.310616 4.354164 4.396602 4.477311 4.57434 4.682598 4.793679 4.848985 4.903366 5.00605 5.126268 5.224644 5.517438 5.699821 5.8655098 2.337698 2.453398 2.569042 2.684098 2.908438 3.018797 3.179345 3.477016 3.525959 3.574228 3.668029 3.850545 4.039115 4.208215 4.286677 4.358901 4.482355 4.697234 4.862326 5.224995 5.414443 5.5670099 1.836737 1.93571 2.036814 2.139611 2.34857 2.453478 2.610568 2.916283 2.966965 3.017349 3.116718 3.628691 3.914236 4.087815 4.155992 4.211748 4.298197 4.859153 5.105369 5.375842 5.476427 5.548253
10 1.600928 1.690202 1.782631 1.877824 2.076029 2.176677 2.329808 2.635793 2.68674 2.7376 2.838693 4.814781 4.574625 4.444799 4.400355 4.371327 4.351815 6.563741 6.251228 5.857292 5.722855 5.661217
Distance Downstream
Distance Downstream
NORTH AMERICANOIL SANDS CORPORATION

North American Upgrader ProjectVolume 3, Appendix 7D
December 2007
Appendix 7D - WASP Results - Chloride Future
Relative Distance from Right Bank 0.5 1.5 2.5 3.5 4.5 5.5 6.5 7.5 8.5 9.5 10.5 11.5 12.5 13.5 14.5 15.5 16.5 17.5 18.5 19.5 20.5 21.5
1 27.03896 25.98364 23.98927 22.36388 21.01696 19.88356 17.85016 16.32229 15.54375 14.87251 14.16252 13.55016 13.01513 12.54251 21.45971 19.71515 17.79449 16.43229 15.95698 15.53681 14.84782 14.267132 10.41535 12.28283 13.0204 13.42437 13.60906 13.64999 13.37675 12.96104 12.68917 12.41132 12.07204 11.74713 11.43981 11.15096 12.61974 13.31854 13.56911 13.43549 13.3429 13.22595 12.95312 12.670273 4.335628 5.429506 6.108233 6.706793 7.216995 7.641643 8.302232 8.685243 8.837801 8.931385 8.982599 8.987461 8.959643 8.90896 9.165334 9.484266 9.895006 10.14475 10.21965 10.27191 10.3082 10.295614 2.112107 2.587089 2.929105 3.281332 3.631083 3.968892 4.681046 5.252105 5.545855 5.794644 6.043994 6.242152 6.397608 6.517769 6.651013 6.819455 7.124562 7.403473 7.508462 7.605335 7.763127 7.886385 1.298908 1.486285 1.631081 1.793137 1.968819 2.15411 2.626613 3.07531 3.331019 3.570152 3.839607 4.080328 4.293325 4.480403 4.625283 4.772289 5.025364 5.275817 5.374749 5.471601 5.652001 5.816116 1.001509 1.072536 1.129445 1.196262 1.27281 1.358453 1.611693 1.885654 2.053794 2.222493 2.428626 2.627317 2.816217 2.993903 3.130802 3.26417 3.482947 3.699175 3.785195 3.870589 4.036997 4.1971567 0.892773 0.919223 0.940821 0.966892 0.997821 1.03384 1.153905 1.298717 1.393093 1.493413 1.624602 1.75935 1.895324 2.030599 2.138296 2.245078 2.421846 2.598243 2.668769 2.739259 2.879635 3.018668 0.853087 0.862899 0.87099 0.880914 0.892946 0.907342 0.960265 1.03037 1.078446 1.132177 1.206861 1.288147 1.374802 1.465617 1.540693 1.61753 1.749645 1.885392 1.940249 1.995643 2.108316 2.2224929 0.838799 0.842554 0.845667 0.84952 0.854256 0.860026 0.883056 0.916256 0.940083 0.967965 1.009029 1.05629 1.109437 1.168041 1.21837 1.271723 1.368102 1.471189 1.513453 1.556705 1.646856 1.74032
10 0.834189 0.835981 0.83747 0.839324 0.84162 0.844451 0.856515 0.875183 0.88909 0.905991 0.932113 0.963593 1.000567 1.043023 1.080596 1.121551 1.198597 1.283781 1.319114 1.355665 1.433314 1.515181
Relative Distance from Right Bank 22.5 23.5 24.5 25.5 27 29 31.5 33.5 34.5 35.5 37 39 41 43 44.5 45.5 47 49 50.5 52.5 55.5 58.5
1 13.76693 13.32855 12.93901 12.58899 12.00231 11.733 11.37274 10.77744 10.68147 11.02703 10.76607 10.54458 10.34971 10.17401 13.48651 13.00027 12.32745 15.02586 14.25135 12.94106 5.661217 5.7228552 12.39141 12.12304 11.86781 11.62649 11.19567 10.99247 10.71235 10.23175 10.15376 10.13735 10.04851 9.935566 9.813894 9.690914 10.09087 10.32609 10.47727 11.17919 11.41153 11.33965 12.31551 11.837593 10.24908 10.17953 10.09479 10.00038 9.796692 9.693193 9.538494 9.245521 9.197188 9.157491 9.086717 9.01603 8.943553 8.869703 8.895165 8.945733 9.042913 9.262888 9.423651 9.650439 11.16875 10.961474 7.978791 8.044794 8.088777 8.114698 8.11768 8.109376 8.081099 7.990746 7.974862 7.959366 7.930372 7.902183 7.873975 7.845482 7.839655 7.843658 7.87588 7.951594 8.025296 8.238465 9.708753 9.7054145 5.962655 6.091609 6.203755 6.300333 6.442805 6.502801 6.571939 6.653153 6.665211 6.676056 6.69433 6.710854 6.726866 6.742943 6.752176 6.763674 6.797496 6.84855 6.897233 7.087083 8.355742 8.4433166 4.349537 4.493071 4.627154 4.751576 4.963848 5.061255 5.189569 5.390012 5.42192 5.452424 5.508583 5.565002 5.623828 5.684654 5.715558 5.747004 5.812162 5.885942 5.947701 6.167764 7.217817 7.3418487 3.155482 3.289271 3.419301 3.544998 3.776785 3.887619 4.042481 4.310616 4.354164 4.396602 4.477311 4.57434 4.682598 4.793679 4.848985 4.903366 5.00605 5.126268 5.224644 5.517438 6.319609 6.4678098 2.337698 2.453398 2.569042 2.684098 2.908438 3.018797 3.179345 3.477016 3.525959 3.574228 3.668029 3.850545 4.039115 4.208215 4.286677 4.358901 4.482355 4.697234 4.862326 5.224995 5.699821 5.8655099 1.836737 1.93571 2.036814 2.139611 2.34857 2.453478 2.610568 2.916283 2.966965 3.017349 3.116718 3.628691 3.914236 4.087815 4.155992 4.211748 4.298197 4.859153 5.105369 5.375842 5.414443 5.567009
10 1.600928 1.690202 1.782631 1.877824 2.076029 2.176677 2.329808 2.635793 2.68674 2.7376 2.838693 4.814781 4.574625 4.444799 4.400355 4.371327 4.351815 6.563741 6.251228 5.857292 5.476427 5.548253
7.047195 7.047177 7.047159 7.740042 7.740032 7.740002 7.733809 7.746107
Distance Downstream (km)
Distance Downstream (km)
NORTH AMERICAN OIL SANDS CORPORATION

North American Upgrader ProjectVolume 3, Appendix 7D
December 2007
Appendix 7D - WASP Results - COD Base Case
Relative Distance from Right Bank 0.5 1.5 2.5 3.5 4.5 5.5 6.5 7.5 8.5 9.5 10.5 11.5 12.5 13.5 14.5 15.5 16.5 17.5 18.5 19.5 20.5 21.5
1 11.61808 10.31459 9.282662 8.768726 8.002707 7.776535 6.734806 5.956183 5.497274 5.100338 4.710826 4.373122 4.07651 3.81319 9.091752 7.926995 6.759499 5.936646 5.554021 5.214793 4.788157 4.4289062 4.500618 5.0398 5.150874 5.183031 5.120571 5.056809 4.89103 4.639444 4.424118 4.210407 3.983362 3.768138 3.566112 3.377368 4.196687 4.535112 4.640677 4.521303 4.373285 4.216326 4.013073 3.809263 1.933536 2.300793 2.486646 2.636204 2.746518 2.827401 3.007916 3.077857 3.051959 3.003698 2.942034 2.864935 2.778367 2.686504 2.771103 2.886955 3.06282 3.144118 3.105782 3.05582 3.012756 2.945894 1.007657 1.163498 1.258167 1.350376 1.435974 1.513076 1.722036 1.874895 1.923223 1.953067 1.981086 1.989795 1.983101 1.964351 1.962959 1.983674 2.07562 2.154949 2.143959 2.128736 2.14454 2.1436075 0.673718 0.726622 0.759619 0.796282 0.835037 0.874453 1.010424 1.132947 1.184926 1.228407 1.27902 1.317462 1.344687 1.361886 1.367351 1.376282 1.428784 1.483664 1.478261 1.471962 1.498116 1.5170136 0.553279 0.564292 0.568885 0.576267 0.586127 0.598048 0.665168 0.73592 0.768596 0.79938 0.839859 0.875619 0.90616 0.931321 0.943387 0.95423 0.992502 1.031814 1.028695 1.025353 1.048193 1.0685357 0.509851 0.504907 0.498023 0.492695 0.488927 0.486668 0.511829 0.543504 0.557297 0.571853 0.594665 0.617031 0.63824 0.657759 0.668262 0.677733 0.706443 0.735093 0.733063 0.730888 0.748247 0.7648528 0.494218 0.483379 0.472125 0.461759 0.452313 0.443807 0.447891 0.45693 0.458363 0.461105 0.469587 0.479236 0.489593 0.500235 0.505742 0.511106 0.530542 0.550305 0.548181 0.546019 0.558256 0.5704339 0.488662 0.475702 0.462852 0.450603 0.438971 0.427971 0.422734 0.420639 0.415504 0.411536 0.411291 0.412523 0.415029 0.418587 0.419486 0.420815 0.432698 0.445602 0.442787 0.44007 0.448342 0.456936
10 0.486889 0.473248 0.459882 0.447017 0.434658 0.422811 0.414177 0.40772 0.399887 0.393045 0.388893 0.386167 0.384798 0.384681 0.383039 0.382057 0.389779 0.39893 0.395557 0.392366 0.398457 0.405069
Relative Distance from Right Bank 22.5 23.5 24.5 25.5 27 29 31.5 33.5 34.5 35.5 37 39 41 43 44.5 45.5 47 49 50.5 52.5 55.5 58.5
1 4.119812 3.84934 3.60948 3.394488 3.036339 2.79255 2.476696 2.264849 2.176683 2.950955 2.594234 2.318658 2.095277 2.073822 3.057911 2.72236 2.358253 2.081673 1.936062 1.635749 1.435632 1.2708452 3.612392 3.425634 3.250014 3.085528 2.796372 2.586565 2.309536 2.133435 2.053783 2.091377 2.044705 1.946446 1.829453 1.744371 1.795595 1.782356 1.749168 1.667289 1.616811 1.450063 1.307514 1.1800923 2.863972 2.773201 2.677851 2.580811 2.39135 2.233791 2.018595 1.899731 1.83437 1.786393 1.706893 1.627733 1.546155 1.471054 1.412265 1.362385 1.339718 1.305029 1.291733 1.22135 1.135511 1.0519954 2.128433 2.10176 2.066155 2.023843 1.924676 1.819239 1.668852 1.609724 1.560549 1.514634 1.434327 1.362041 1.29566 1.235863 1.175345 1.121241 1.090745 1.064415 1.061122 1.04203 0.994987 0.9457495 1.528159 1.531743 1.528361 1.518814 1.481692 1.417294 1.320946 1.310137 1.275797 1.242241 1.179465 1.124086 1.078099 1.041772 0.996524 0.955479 0.939315 0.928423 0.936091 0.954913 0.933694 0.9065226 1.085613 1.098955 1.108358 1.11383 1.110877 1.073965 1.016094 1.036957 1.014359 0.991892 0.948129 0.92079 0.913377 0.921042 0.900304 0.881782 0.89965 0.916882 0.942966 0.996674 0.988782 0.9682427 0.780306 0.794245 0.806382 0.816514 0.828378 0.807746 0.774134 0.811645 0.797331 0.782937 0.75413 0.795445 0.880174 0.974571 0.989482 0.999515 1.058742 1.105219 1.15003 1.214582 1.193846 1.1533338 0.582384 0.593916 0.604834 0.614959 0.631077 0.619126 0.5993 0.643215 0.634183 0.625024 0.60633 0.916012 1.226356 1.449771 1.489793 1.50489 1.556794 1.605178 1.648912 1.646054 1.559448 1.4559679 0.465756 0.474689 0.483608 0.492383 0.508418 0.500608 0.48779 0.532869 0.526834 0.520682 0.507964 2.040544 2.629946 2.780476 2.705762 2.593861 2.456492 2.505153 2.490972 2.256537 2.025625 1.811029
10 0.412114 0.419498 0.427123 0.434882 0.450086 0.443873 0.433904 0.478616 0.473909 0.469102 0.459104 7.719043 6.091782 4.987568 4.410805 3.93016 3.386971 3.955585 3.557225 2.830682 2.405353 2.073858
1.893378 1.785403 1.683585 1.713485 1.663192 1.524863 1.398039 1.281763
Distance Downstream
Distance Downstream
NORTH AMERICANOIL SANDS CORPORATION

North American Upgrader ProjectVolume 3, Appendix 7D
December 2007
Appendix 7D - WASP Results - COD Application Case
Relative Distance from Right Bank 0.5 1.5 2.5 3.5 4.5 5.5 6.5 7.5 8.5 9.5 10.5 11.5 12.5 13.5 14.5 15.5 16.5 17.5 18.5 19.5 20.5 21.5
1 11.61808 10.31459 9.282662 8.768726 8.002707 7.776535 6.734806 5.956183 5.497274 5.100338 4.710826 4.373122 4.07651 3.81319 9.091752 7.926995 6.759499 5.936646 5.554021 5.214793 4.788157 4.4289062 4.500618 5.0398 5.150874 5.183031 5.120571 5.056809 4.89103 4.639444 4.424118 4.210407 3.983362 3.768138 3.566112 3.377368 4.196687 4.535112 4.640677 4.521303 4.373285 4.216326 4.013073 3.809263 1.933536 2.300793 2.486646 2.636204 2.746518 2.827401 3.007916 3.077857 3.051959 3.003698 2.942034 2.864935 2.778367 2.686504 2.771103 2.886955 3.06282 3.144118 3.105782 3.05582 3.012756 2.945894 1.007657 1.163498 1.258167 1.350376 1.435974 1.513076 1.722036 1.874895 1.923223 1.953067 1.981086 1.989795 1.983101 1.964351 1.962959 1.983674 2.07562 2.154949 2.143959 2.128736 2.14454 2.1436075 0.673718 0.726622 0.759619 0.796282 0.835037 0.874453 1.010424 1.132947 1.184926 1.228407 1.27902 1.317462 1.344687 1.361886 1.367351 1.376282 1.428784 1.483664 1.478261 1.471962 1.498116 1.5170136 0.553279 0.564292 0.568885 0.576267 0.586127 0.598048 0.665168 0.73592 0.768596 0.79938 0.839859 0.875619 0.90616 0.931321 0.943387 0.95423 0.992502 1.031814 1.028695 1.025353 1.048193 1.0685357 0.509851 0.504907 0.498023 0.492695 0.488927 0.486668 0.511829 0.543504 0.557297 0.571853 0.594665 0.617031 0.63824 0.657759 0.668262 0.677733 0.706443 0.735093 0.733063 0.730888 0.748247 0.7648528 0.494218 0.483379 0.472125 0.461759 0.452313 0.443807 0.447891 0.45693 0.458363 0.461105 0.469587 0.479236 0.489593 0.500235 0.505742 0.511106 0.530542 0.550305 0.548181 0.546019 0.558256 0.5704339 0.488662 0.475702 0.462852 0.450603 0.438971 0.427971 0.422734 0.420639 0.415504 0.411536 0.411291 0.412523 0.415029 0.418587 0.419486 0.420815 0.432698 0.445602 0.442787 0.44007 0.448342 0.456936
10 0.486889 0.473248 0.459882 0.447017 0.434658 0.422811 0.414177 0.40772 0.399887 0.393045 0.388893 0.386167 0.384798 0.384681 0.383039 0.382057 0.389779 0.39893 0.395557 0.392366 0.398457 0.405069
Relative Distance from Right Bank 22.5 23.5 24.5 25.5 27 29 31.5 33.5 34.5 35.5 37 39 41 43 44.5 45.5 47 49 50.5 52.5 55.5 58.5
1 4.119812 3.84934 3.60948 3.394488 3.036339 2.79255 2.476696 2.264849 2.176683 2.950955 2.594234 2.318658 2.095277 2.073822 4.235552 3.705244 3.127294 5.519198 4.81507 3.65848 3.040165 2.5802922 3.612392 3.425634 3.250014 3.085528 2.796372 2.586565 2.309536 2.133435 2.053783 2.091377 2.044705 1.946446 1.829453 1.744371 1.94848 2.02099 2.058033 2.590944 2.767139 2.6505 2.412199 2.1663263 2.863972 2.773201 2.677851 2.580811 2.39135 2.233791 2.018595 1.899731 1.83437 1.786393 1.706893 1.627733 1.546155 1.471054 1.432113 1.407781 1.432922 1.5591 1.672064 1.793834 1.748531 1.6618814 2.128433 2.10176 2.066155 2.023843 1.924676 1.819239 1.668852 1.609724 1.560549 1.514634 1.434327 1.362041 1.29566 1.235863 1.177921 1.129005 1.11526 1.133544 1.176575 1.284887 1.292606 1.2749675 1.528159 1.531743 1.528361 1.518814 1.481692 1.417294 1.320946 1.310137 1.275797 1.242241 1.179465 1.124086 1.078099 1.041772 0.996859 0.95673 0.945283 0.946789 0.969322 1.050783 1.06581 1.0677596 1.085613 1.098955 1.108358 1.11383 1.110877 1.073965 1.016094 1.036957 1.014359 0.991892 0.948129 0.92079 0.913377 0.921042 0.900347 0.881976 0.901036 0.921638 0.952163 1.032749 1.043822 1.0417077 0.780306 0.794245 0.806382 0.816514 0.828378 0.807746 0.774134 0.811645 0.797331 0.782937 0.75413 0.795445 0.880174 0.974571 0.989488 0.999544 1.059055 1.106422 1.152497 1.227715 1.215737 1.1850278 0.582384 0.593916 0.604834 0.614959 0.631077 0.619126 0.5993 0.643215 0.634183 0.625024 0.60633 0.916012 1.226356 1.449771 1.489794 1.504895 1.556863 1.605476 1.649557 1.650739 1.567887 1.4691319 0.465756 0.474689 0.483608 0.492383 0.508418 0.500608 0.48779 0.532869 0.526834 0.520682 0.507964 2.040544 2.629946 2.780476 2.705762 2.593862 2.456507 2.505227 2.49114 2.258229 2.028898 1.816515
10 0.412114 0.419498 0.427123 0.434882 0.450086 0.443873 0.433904 0.478616 0.473909 0.469102 0.459104 7.719043 6.091782 4.987568 4.410805 3.93016 3.386975 3.955606 3.557276 2.831435 2.406904 2.076635
2.028712 1.913019 1.803923 2.184394 2.12028 1.943935 1.782256 1.634024
Distance Downstream
Distance Downstream
NORTH AMERICANOIL SANDS CORPORATION

North American Upgrader ProjectVolume 3, Appendix 7D
December 2007
Appendix 7D - WASP Results - COD Future Case
Relative Distance from Right Bank 0.5 1.5 2.5 3.5 4.5 5.5 6.5 7.5 8.5 9.5 10.5 11.5 12.5 13.5 14.5 15.5 16.5 17.5 18.5 19.5 20.5 21.5
1 11.61808 10.31459 9.282662 8.768726 8.002707 7.776535 6.734806 5.956183 5.497274 5.100338 4.710826 4.373122 4.07651 3.81319 9.091752 7.926995 6.759499 5.936646 5.554021 5.214793 4.788157 4.4289062 4.500618 5.0398 5.150874 5.183031 5.120571 5.056809 4.89103 4.639444 4.424118 4.210407 3.983362 3.768138 3.566112 3.377368 4.196687 4.535112 4.640677 4.521303 4.373285 4.216326 4.013073 3.809263 1.933536 2.300793 2.486646 2.636204 2.746518 2.827401 3.007916 3.077857 3.051959 3.003698 2.942034 2.864935 2.778367 2.686504 2.771103 2.886955 3.06282 3.144118 3.105782 3.05582 3.012756 2.945894 1.007657 1.163498 1.258167 1.350376 1.435974 1.513076 1.722036 1.874895 1.923223 1.953067 1.981086 1.989795 1.983101 1.964351 1.962959 1.983674 2.07562 2.154949 2.143959 2.128736 2.14454 2.1436075 0.673718 0.726622 0.759619 0.796282 0.835037 0.874453 1.010424 1.132947 1.184926 1.228407 1.27902 1.317462 1.344687 1.361886 1.367351 1.376282 1.428784 1.483664 1.478261 1.471962 1.498116 1.5170136 0.553279 0.564292 0.568885 0.576267 0.586127 0.598048 0.665168 0.73592 0.768596 0.79938 0.839859 0.875619 0.90616 0.931321 0.943387 0.95423 0.992502 1.031814 1.028695 1.025353 1.048193 1.0685357 0.509851 0.504907 0.498023 0.492695 0.488927 0.486668 0.511829 0.543504 0.557297 0.571853 0.594665 0.617031 0.63824 0.657759 0.668262 0.677733 0.706443 0.735093 0.733063 0.730888 0.748247 0.7648528 0.494218 0.483379 0.472125 0.461759 0.452313 0.443807 0.447891 0.45693 0.458363 0.461105 0.469587 0.479236 0.489593 0.500235 0.505742 0.511106 0.530542 0.550305 0.548181 0.546019 0.558256 0.5704339 0.488662 0.475702 0.462852 0.450603 0.438971 0.427971 0.422734 0.420639 0.415504 0.411536 0.411291 0.412523 0.415029 0.418587 0.419486 0.420815 0.432698 0.445602 0.442787 0.44007 0.448342 0.456936
10 0.486889 0.473248 0.459882 0.447017 0.434658 0.422811 0.414177 0.40772 0.399887 0.393045 0.388893 0.386167 0.384798 0.384681 0.383039 0.382057 0.389779 0.39893 0.395557 0.392366 0.398457 0.405069
Relative Distance from Right Bank 22.5 23.5 24.5 25.5 27 29 31.5 33.5 34.5 35.5 37 39 41 43 44.5 45.5 47 49 50.5 52.5 55.5 58.5
1 4.119812 3.84934 3.60948 3.394488 3.036339 2.79255 2.476696 2.264849 2.176683 2.950955 2.594234 2.318658 2.095277 2.073822 6.078 5.242984 4.330467 6.492609 5.668969 4.302203 3.56901 3.0227092 3.612392 3.425634 3.250014 3.085528 2.796372 2.586565 2.309536 2.133435 2.053783 2.091377 2.044705 1.946446 1.829453 1.744371 2.18767 2.39434 2.541264 3.099615 3.277449 3.10867 2.818346 2.523833 2.863972 2.773201 2.677851 2.580811 2.39135 2.233791 2.018595 1.899731 1.83437 1.786393 1.706893 1.627733 1.546155 1.471054 1.463165 1.478802 1.578746 1.757551 1.901342 2.053495 2.004109 1.904714 2.128433 2.10176 2.066155 2.023843 1.924676 1.819239 1.668852 1.609724 1.560549 1.514634 1.434327 1.362041 1.29566 1.235863 1.181953 1.141153 1.153637 1.199477 1.263267 1.411944 1.432603 1.4201125 1.528159 1.531743 1.528361 1.518814 1.481692 1.417294 1.320946 1.310137 1.275797 1.242241 1.179465 1.124086 1.078099 1.041772 0.997382 0.958687 0.954725 0.96693 0.999143 1.108645 1.137212 1.1487756 1.085613 1.098955 1.108358 1.11383 1.110877 1.073965 1.016094 1.036957 1.014359 0.991892 0.948129 0.92079 0.913377 0.921042 0.900415 0.88228 0.903696 0.928753 0.963905 1.062091 1.083308 1.0896747 0.780306 0.794245 0.806382 0.816514 0.828378 0.807746 0.774134 0.811645 0.797331 0.782937 0.75413 0.795445 0.880174 0.974571 0.989496 0.99959 1.061856 1.113942 1.16443 1.253287 1.248454 1.2234518 0.582384 0.593916 0.604834 0.614959 0.631077 0.619126 0.5993 0.643215 0.634183 0.625024 0.60633 0.916012 1.226356 1.449771 1.489795 1.504901 1.567847 1.627633 1.679185 1.692045 1.612372 1.5148629 0.465756 0.474689 0.483608 0.492383 0.508418 0.500608 0.48779 0.532869 0.526834 0.520682 0.507964 2.040544 2.629946 2.780476 2.705762 2.593863 2.507687 2.576428 2.569141 2.334125 2.098376 1.879444
10 0.412114 0.419498 0.427123 0.434882 0.450086 0.443873 0.433904 0.478616 0.473909 0.469102 0.459104 7.719043 6.091782 4.987568 4.410805 3.93016 3.627606 4.142751 3.717233 2.94776 2.501163 2.155223
2.240444 2.112676 2.022753 2.390569 2.320407 2.127427 1.950495 1.788279
Distance Downstream
Distance Downstream
NORTH AMERICANOIL SANDS CORPORATION

Fish Habitat
Potential
Large Bodied/
Sport FishForage Fish
Overwintering Low-Moderate Low-Moderate
Spawning Low Low
Rearing Low Low
Feeding Low Low
Title:
Approved: Revision Date:
File:
Drawn by: Checked: Fig. No.:
Title:
Approved: Revision Date:
File:
Drawn by: Checked: Fig. No.:
Sampling
Date
Water
Depth (m)
Discharge
(m3/s)
Temperature
(°C)
Dissolved
Oxygen
(mg/L)
Conductivity
(µS/cm)
pH
(units)
Turbidity
(NTU)
28-Aug-06 0.11 0.00 15.55 9.10 550 8.17 48.00
24-Oct-06 0.35 0.00 1.35 8.66 729 6.97 14.00
22-Jan-07 0.40 0.00 0.50 13.50 731 5.32 --
1-May-07 0.89 1.25 9.74 11.38 371 6.94 48.34
Note(s):
'--' = not sampled

Title:
Approved: Revision Date:
File:
Drawn by: Checked: Fig. No.:
Title:
Approved: Revision Date:
File:
Drawn by: Checked: Fig. No.:
Sampling
Season
Fish
CapturedEffort (h)
Fish
Captured
Effort
(h)
Fish
Captured
Effort
(sec.)
Summer -- -- -- -- -- --
Fall -- -- 466 BRST 22.30 -- --
Winter -- -- -- -- -- --
Spring -- -- 0* 19.50 -- --
Total -- -- 466 BRST 41.80 -- --
Note(s):
BRST - Brook stickleback
Angling Minnow Trap Electrofishing
* - no fish were caught, however one tiger salamander was caught in the trap.
'--' = method not used during this survey.
Sampling
Date
Water
Depth
(m)
Discharge
(m3/s)
Temperature
(°C)
Dissolved
Oxygen
(mg/L)
Conductivity
(µS/cm)
pH
(units)
Turbidity
(NTU)
29-Aug-06 0.30 0.00 14.21 2.93 1292 7.07 4.79
23-Oct-06 0.45 0.00 4.89 10.47 1893 6.79 11.74
23-Jan-07
30-Apr-07 0.22 -- 12.64 14.93 544 7.79 1.45
Note(s):
'--' = not surveyed
FROZEN TO BOTTOM
Fish Habitat
Potential
Large Bodied/
Sport FishForage Fish
Overwintering Nil Nil
Spawning Low Low
Rearing Low Low
Feeding Low Low

Title:
Approved: Revision Date:
File:
Drawn by: Checked: Fig. No.:
Title:
Approved: Revision Date:
File:
Drawn by: Checked: Fig. No.:

Title:
Approved: Revision Date:
File:
Drawn by: Checked: Fig. No.:
Title:
Approved: Revision Date:
File:
Drawn by: Checked: Fig. No.:
Sampling
Date
Water
Depth (m)
Discharge
(m3/s)
Temperature
(°C)
Dissolved
Oxygen
(mg/L)
Conductivity
(µS/cm)
pH
(units)
Turbidity
(NTU)
29-Aug-06 0.25 0.00 13.36 0.92 622 7.09 --
23-Oct-06 0.30 0.00 2.00 0.88 1679 6.70 192.40
23-Jan-07
30-Apr-07 0.95 0.28 11.77 6.11 471 6.61 0.38
Note(s):
'--' = not sampled
FROZEN TO BOTTOM
Fish Habitat
Potential
Large Bodied/
Sport FishForage Fish
Overwintering Nil Nil
Spawning Low Low
Rearing Low Low
Feeding Low Low
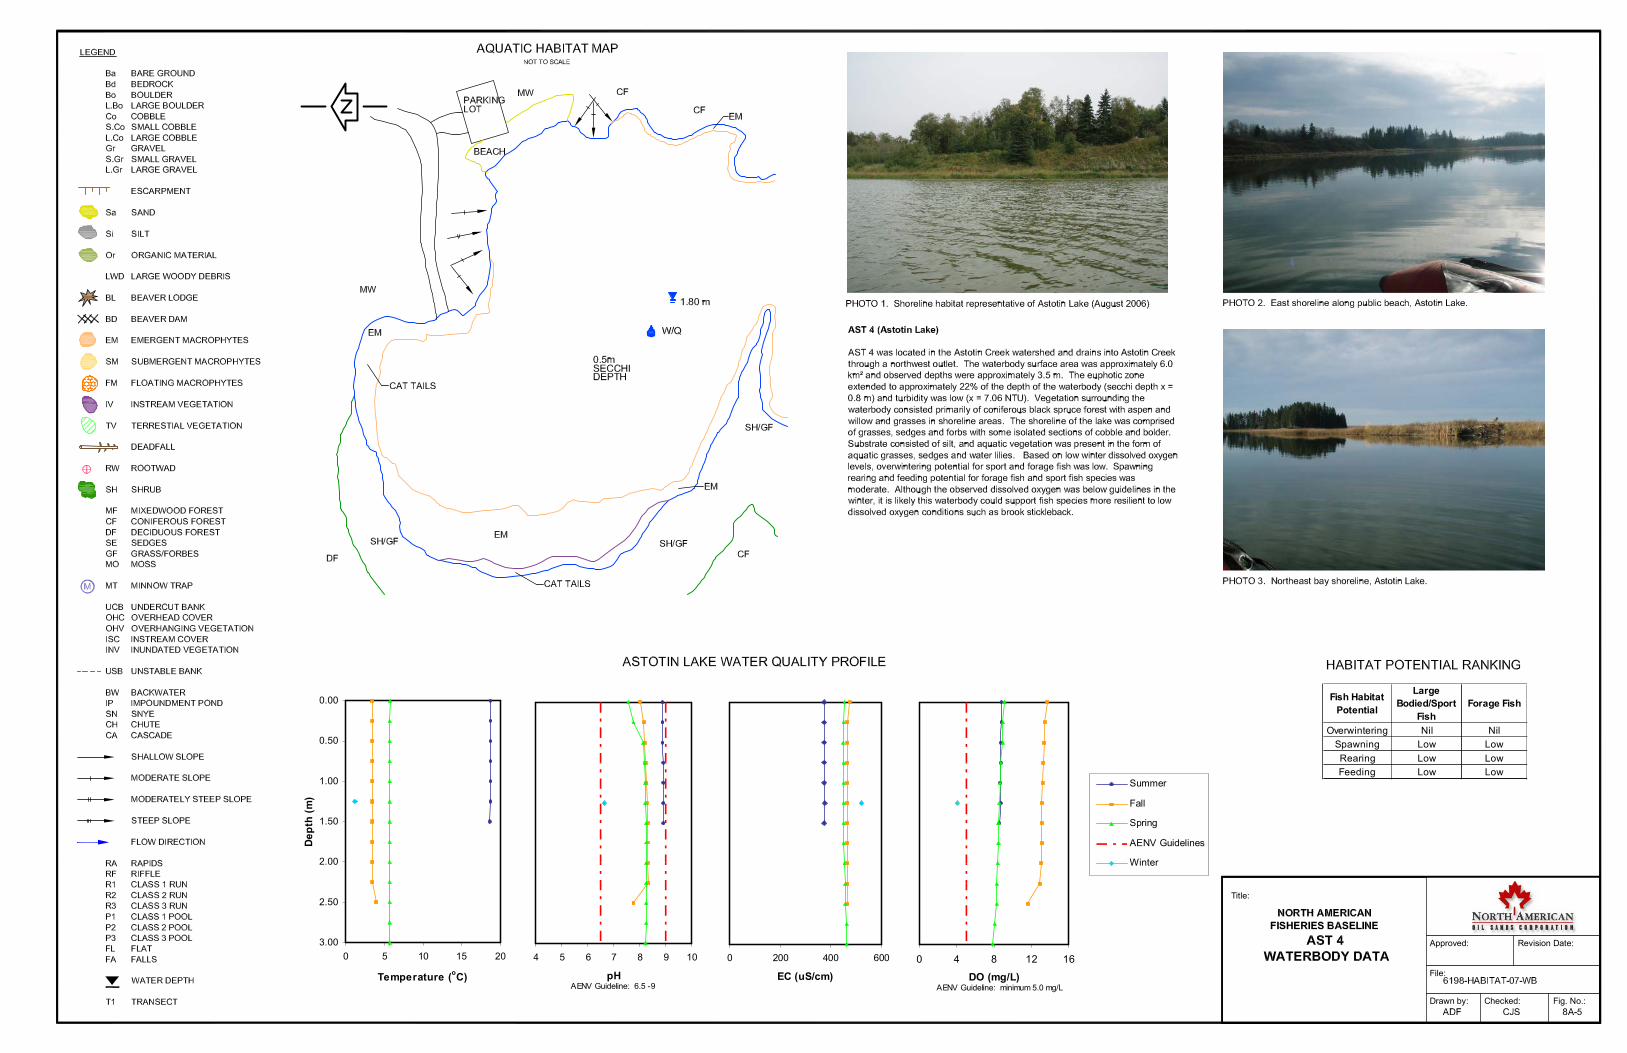
Title:
Approved: Revision Date:
File:
Drawn by: Checked: Fig. No.:
Title:
Approved: Revision Date:
File:
Drawn by: Checked: Fig. No.:
0.00
0.50
1.00
1.50
2.00
2.50
3.00
0 5 10 15 20
Temperature (oC)
Depth (m)
4 5 6 7 8 9 10
pHAENV Guideline: 6.5 -9
0 200 400 600
EC (uS/cm)
0 4 8 12 16
DO (mg/L)
Summer
Fall
Spring
AENV Guidelines
Winter
AENV Guideline: minimum 5.0 mg/L
Fish Habitat
Potential
Large
Bodied/Sport
Fish
Forage Fish
Overwintering Nil Nil
Spawning Low Low
Rearing Low Low
Feeding Low Low

Sampling
Season Fish Captured Effort (h)
Fish
Captured Effort (h)
Fish
Captured Effort (h)
Summer -- -- -- -- -- --
Fall -- -- 0 22.75 0 22.75
Winter -- -- 0 17 -- --
Spring -- -- 0 23.5 0 23.25
Total -- -- 0 63.25 0 46
Note(s):
'--' = method not used during this survey
Angling Minnow Trap Gill Nets
Title:
Approved: Revision Date:
File:
Drawn by: Checked: Fig. No.:
Title:
Approved: Revision Date:
File:
Drawn by: Checked: Fig. No.:
Fish Habitat
Potential
Large
Bodied/Sport
Fish
Forage Fish
Overwintering Nil Nil
Spawning Low Low
Rearing Low Low
Feeding Low Low
0.00
0.50
1.00
1.50
2.00
2.50
3.00
0 5 10 15 20
Temperature (oC)
Depth (m)
4 5 6 7 8 9 10
pHAENV Guideline: 6.5 -9
0 200 400 600
EC (uS/cm)
0 4 8 12 16 20
DO (mg/L)
Summer
Fall
Spring
AENV Guidelines
Winter
AENV Guideline: minimum 5.0 mg/L

Title:
Approved: Revision Date:
File:
Drawn by: Checked: Fig. No.:
Title:
Approved: Revision Date:
File:
Drawn by: Checked: Fig. No.:
Sampling
Date
Water
Depth
(m)
Discharge
(m3/s)
Temperature
(°C)
Dissolved
Oxygen
(mg/L)
Conductivity
(µS/cm)
pH
(units)
Turbidity
(NTU)
30-Aug-06 -- N/A 17.99 8.15 273 7.66 3.19
24-Oct-06 0.30 N/A 5.49 13.36 337 7.22 3.23
23-Jan-06 1.16 N/A 0.03 15.02 362 6.65 --
3-May-07 -- N/A 5.80 12.60 312 7.38 38.38
Note(s):
'--' = not sampled
Sampling
Season
Fish
CapturedEffort (h)
Fish
CapturedEffort (h)
Fish
Captured
Effort
(sec.)
Summer -- -- -- -- -- --
Fall -- -- 0 41.25 -- --
Winter -- -- -- -- -- --
Spring -- -- -- -- -- --
Total 0 0 0 41.25 -- --
Note(s):
'--' = method not used during this survey.
Angling Minnow Trap Electrofishing
Fish Habitat
Potential
Large Bodied/
Sport fishForage Fish
Overwintering High High
Spawning High High
Rearing High High
Feeding High High

8B-i December 2007
North American Upgrader Project Volume 3, Appendix 8B
NORTH AMERICAN OIL SANDS CORPORATION
APPENDIX 8B: BENTHIC INVERTEBRATES
TABLE OF CONTENTS
8B1 INTRODUCTION.............................................................................................................................. 1 8B2 METHODOLOGY............................................................................................................................. 1
8B2.1 Field Sampling .................................................................................................................... 1 8B2.1.1 Sample Handling.................................................................................................... 1 8B2.1.2 Supporting Data ..................................................................................................... 1
8B2.2 Laboratory Methods ............................................................................................................ 2 8B2.2.1 Laboratory Quality Assurance................................................................................ 2
8B2.3 Data Analysis ...................................................................................................................... 5 8B3 RESULTS ........................................................................................................................................ 5
8B3.1 Habitat ................................................................................................................................. 5 8B3.2 Benthic Invertebrates in the LSA ........................................................................................ 6 8B3.3 North Saskatchewan River ................................................................................................. 8
8B4 REFERENCES................................................................................................................................. 9
TABLES
Table 8B-1 Abundances of Organisms Collected in Benthic Invertebrate Samples from the North American Upgrader Project, Spring 2007 (presented as number of organisms per sample) ....................................................................................................... 3
Table 8B-2 Habitat Parameters at Benthic Invertebrates Sampling Sites in the LSA........................... 5 Table 8B-3 Benthic Invertebrates in Samples Collected in Beaver Hill Creek (AST1).......................... 6 Table 8B-4 Benthic Invertebrates in Samples Collected in Astotin Creek (AST6) ................................ 7 Table 8B-5 Benthic Invertebrates in Samples Collected in Astotin Lake (AST4).................................. 7 Table 8B-6 Existing Benthic Invertebrate Data in the NSR near the LSA............................................. 9
FIGURES
Figure 8B-1 Benthic Invertebrate Sampling Sites in the LSA ............................................................... 11 Figure 8B-2 Benthic Invertebrate Mean Total Abundance, Total Richness and Dominance in
Samples Collected in the North American Upgrader LSA ................................................ 12 Figure 8B-3 Benthic Invertebrate Community Composition and Chironomidae Composition in
Samples Collected in the North American Upgrader LSA ................................................ 13

8B-1 December 2007 North American Upgrader Project Volume 3, Appendix 8B
NORTH AMERICAN OIL SANDS CORPORATION
8B1 INTRODUCTION Benthic invertebrate samples were collected to assist in characterization of the aquatic habitat in the LSA. Benthic invertebrates can be used to help develop a trophic level understanding of aquatic habitats. Because they respond to environmental variation, they also indicate when aquatic habitats undergo change.
8B2 METHODOLOGY Benthic invertebrate samples were collected in the Spring of 2007 (May 2 to 5). Benthic samples are generally collected in the fall; however, for this assessment spring sampling was conducted for two reasons. First, to build on previous data collected in the LSA (Synenco, 2006) and second, other studies have found that watercourses in the area did not have suitable benthic habitat during base flows in the fall (Petro-Canada Oil Sands Inc., 2006). Samples were collected on two watercourses and one waterbody in the LSA (Figure 8B-1), with the objective of characterizing the benthic invertebrate community in representative habitat areas. The data were used to describe baseline conditions regarding the availability of food resources for fish and the overall health of the aquatic ecosystem.
8B2.1 Field Sampling Sampling points were randomly chosen in representative habitat at each of the sampling sites in the selected watercourse or waterbody. Sampling was conducted during the spring, similar to Synenco (2006). Samples were collected in depositional sediments using a Ponar sampling with a sampling area of 0.023 m2 and were field sieved to remove fine sediments using a 250 um Nitex mesh netting. Five replicate samples were collected at each site to account for variability.
8B2.1.1 Sample Handling
Benthic invertebrate samples were preserved in 85 percent ethyl alcohol and stored in properly labelled and sealed containers. Samples were then stored and shipped in plastic coolers to prevent damage. Identification and enumeration of samples was handled by Enviro-Test Laboratories in Winnipeg, Manitoba. Chain of custody forms were used to track samples and prevent against loss or misidentification.
8B2.1.2 Supporting Data
Supporting habitat information was collected at each sampling site to help understand the variation in benthic invertebrate community structure among different sampling sites. Supporting data collected at each site included:
• exact site location (easting and northing using Global Positioning System [GPS], NAD 83, UTM 12);
• water depth;
• water velocity (Marsh-McBirney Model 2000 current velocity meter);
• bankfull and wetted channel width (measuring tape);
• water quality parameters (temperature, dissolved oxygen (DO), conductance and pH using a field calibrated Quanta Hydrolab multi-meter); and

8B-2NVolum
December 2007 orth American Upgrader Project
e 3, Appendix 8B
8B2.2.1 Laboratory Quality Assurance
Laboratory procedures were conducted by trained individuals and were consistent with methods approved by other monitoring programs (e.g., AENV, 1990; Environment Canada, 2002). Sorting efficiency was calculated as follows:
8B2.2 Laboratory Methods Benthic invertebrate samples were sorted, identified and enumerated by Enviro-Test Laboratories in Winnipeg, Manitoba.
Each replicate sample was sieved using 500 um and 250 um radial sieves to divide replicate samples into fine and coarse fractions. The radial sieve was divided into one eighth or one quarter portions and used to sub-sample each fraction. Coarse and fine fractions were sub-sampled to the same proportion (both to ⅛ or both to ¼). Sub-samples were then transferred to a Petri dish for sorting. Benthic invertebrates were removed with the aid of a zoom stereo-microscope at 20 to 40 power (Enviro-Test, personal communication).
Invertebrates were identified to the lowest practical taxon (genus for amphipods, leeches, oligochaetes, aquatic mites, insects and molluscs; major group for nematodes, ostracods, zooplankton [in this classification, “major group” is defined as a grouping of like organisms at the class or order level where lower level identification is impractical and the information does not contribute to study objectives]). Damaged and immature specimens were identified to the lowest practical level that condition allowed. Laboratory data are presented as numbers of organisms per sample in Table 8B-1.
NORTH AMERICAN OIL SANDS CORPORATION
( )
• general description of the sampling area (e.g., macrophytes, riparian habitat, sediment characteristics).
100% ×+
=NN
Nri
rE
E%
where:
Benthic invertebrate abundance data were tallied on laboratory data sheets and transferred to an electronic format. Electronic data were then validated through comparison with the laboratory data sheets.
Sorting efficiency was calculated to be greater than 90 percent.
N
N r
i is the number of organisms found during initial sorting.
is the number of organisms found in a sample during resorting; and
is the calculated sorting efficiency;

8B-3 December 2007
North American Upgrader Project Volume 3, Appendix 8B
NORTH AMERICAN OIL SANDS CORPORATION
Table 8B-1 Abundances of Organisms Collected in Benthic Invertebrate Samples from the North American Upgrader Project, Spring 2007 (presented as number of organisms per sample)
Beaverhill Creek (AST 1) Astotin Creek (AST 6) Astotin Lake (AST 4)
Major Group Order Family Genus/species A B C D E A B C D E A B C D E Nematoda - - i/d 1 10 3 0 1 32 0 8 24 0 8 24 24 80 32 Oligochaeta - Lumbriculidae Lumbriculus sp 0 0 0 0 0 0 0 0 24 0 0 0 0 0 0 - Naididae Nais sp 0 1 3 0 0 0 0 0 0 0 0 0 0 0 8 - Pristina sp 0 0 1 1 0 0 0 0 0 0 0 0 0 0 0 - Tubificidae i/d 0 9 0 1 2 688 0 64 96 112 8 8 88 144 0 Annelida Hirudinea Erpobdellidae Erpobdella punctata 0 0 0 0 0 0 0 0 0 0 16 0 32 16 24 Hirudinidae Molibdella grandis 0 0 0 0 0 0 0 0 0 0 0 8 0 0 0 Lumbricidae Eiseniella sp 0 0 0 0 0 0 0 0 8 0 0 0 0 0 0 Pelecypoda Sphaeriacea Sphaeridae Sphaerium sp 0 1 0 0 0 0 8 0 0 0 0 0 0 0 0 Arachnoidea Hydracarina - i/d 0 0 0 0 0 8 0 8 0 0 0 0 0 0 0 Arrenuridae Arrenurus sp 0 0 0 0 0 0 0 0 0 0 0 0 8 0 0 Protziidae Calonyx sp 0 0 0 0 0 0 0 0 0 8 0 0 0 0 0 Unionicolidae Unionicola sp 0 0 0 0 0 0 0 0 8 0 0 0 0 0 0 Limnesiidae Tyrellia sp 0 0 0 0 0 0 0 0 0 0 0 0 0 0 8 Hydryphantidae Diplodontidae Diplodontus sp 0 0 0 0 0 0 0 0 0 0 0 8 16 16 8 Crustacea Copepoda Harpacticidae i/d 0 0 0 0 0 0 0 0 0 0 0 0 16 0 8 Ostrocoda - i/d 0 2 0 0 0 0 0 8 0 0 0 0 0 0 0 Amphipoda Hyalellidae Hyalella azteca 0 0 0 0 0 0 0 0 0 0 24 16 8 8 0 Insecta Collembola - i/d 0 0 0 0 0 16 0 0 0 0 0 0 0 0 0 Isotomidae Isotomurus sp 0 0 0 0 0 8 0 0 0 8 0 0 0 0 0 Ephemeroptera Caenidae Caenis sp 0 0 0 0 0 0 0 0 0 0 8 8 24 0 8 Odonata-Zygoptera Coenagrionidae Enallagma sp 0 0 0 0 0 0 0 0 0 0 0 0 0 0 8 Trichoptera Phryganeidae Agrypnia sp 0 0 0 0 0 0 0 0 0 0 8 16 0 0 8 Coleoptera - i/d 0 0 0 0 1 0 0 0 0 0 0 0 0 0 0 Coleoptera Elmidae Dubiraphia sp 0 0 0 0 0 0 8 0 0 0 0 0 0 0 0 Diptera - i/d 0 0 0 0 0 40 0 0 8 0 0 0 0 0 0 Ceratopogonidae i/d 2 3 0 0 0 0 0 0 0 8 48 112 48 16 8 Chironomidae - 0 0 0 0 0 0 0 0 0 0 0 0 0 0 0 Chironimini i/d 0 0 0 0 0 0 8 0 0 0 0 0 0 0 0 Chiromomus sp 0 0 0 0 0 0 0 8 0 0 0 0 0 0 0 Cryptochironomus sp 0 1 0 0 0 0 0 0 0 0 0 0 0 0 0 Dicrotendipes sp 0 2 0 0 0 0 0 0 0 0 0 56 8 24 16 Endochironomus sp 0 0 1 1 0 0 0 0 0 0 0 0 8 0 32 Glyptotendipes sp 2 2 1 1 0 0 0 0 0 0 0 0 0 0 0 Phaenopsectra sp 0 0 0 0 0 0 0 0 0 0 0 8 0 0 0

8B-4 December 2007
orth American Upgrader Project e 3, Appendix 8B
Beaverhill Creek (AST 1) Astotin Creek (AST 6) Astotin Lake (AST 4) Major Group Order Family Genus/species A B C D E A B C D E A B C D E Tanytarsini Cladotanytarsus sp 0 0 0 0 0 0 0 0 0 0 0 0 8 8 8 Tanytarsus sp 0 3 0 0 0 0 0 0 0 0 0 0 0 0 0 Orthocladinae i/d 0 0 0 0 0 0 0 0 0 0 0 0 0 0 8 Psectocladius sp 0 0 0 0 0 0 8 0 0 0 0 0 0 0 0 Tanypodinae Procladius sp 0 0 0 0 0 0 0 8 0 32 24 32 72 32 0 Dolichopodidae i/d 0 0 0 0 1 0 0 0 8 0 0 0 0 0 0 Empidiae i/d 0 0 0 0 0 40 0 0 16 0 0 0 0 0 0 Empidiae Hemerodromia sp 0 1 0 0 0 0 0 0 0 0 0 0 0 0 0 Psychodidae Pericoma sp 0 0 0 0 0 0 0 0 0 0 8 0 0 0 32 Psychodidae Psychoda sp 0 0 0 0 0 0 0 8 0 0 0 0 0 0 0 Tipulidae Ormosia sp 0 0 0 0 0 0 0 8 0 0 0 0 0 0 0 Total 5 35 9 4 5 832 32 120 192 168 152 296 360 344 216
NORTH AMERICAN OIL SANDS CORPORATION
NVolum

8B-5 December 2007
North American Upgrader Project Volume 3, Appendix 8B
NORTH AMERICAN OIL SANDS CORPORATION
8B2.3 Data Analysis A literature review of historic data was completed to obtain background benthic invertebrate data for the study areas (Golder, 1995; Petro-Canada Oil Sands Inc., 2006; North West, 2006; Synenco, 2006; Shell, 2007). Data were evaluated for suitability of inclusion with Project data (e.g., comparability of mesh sieve sizes and sampling equipment; season when samples were collected). Historical data that were included aided in providing a regional context to evaluate data collected for the Project.
The benthic invertebrate data were graphed and inspected for outliers and potential errors and taxonomic names were checked. Non-benthic invertebrates including terrestrial insects, adults and pupa were removed from the data set. Any incorrect data were removed or corrected.
Data files were kept electronically and systematically processed. Each series of steps was saved on subsequent worksheets in Microsoft Excel® files to allow calculation checks and validation of the results.
The benthic invertebrate community was characterized using community variables, including abundance (numbers of organisms per square metre), dominance (the most common taxa at a given site), taxonomic richness (the number of benthic invertebrate taxa) and community composition. The abundance and dominance data among sites were presented graphically. Richness was presented as the total number of taxa (identified to the lowest practical level) among replicates at a site. Major groups of invertebrates were presented in stacked bar graphs to show significant differences in community composition.
8B3 RESULTS 8B3.1 Habitat
Benthic invertebrate samples were collected between May 2 and 5, 2007 (Figure 8B-1). Samples were collected at two watercourse locations (Beaver Hill Creek [AST 1] and Astotin Creek [AST 6]) and in one waterbody (Astotin Lake [AST 4]). Watercourses were relatively small with mean depths between 0.4 m and 0.5 m. Stream flows in both watercourses were slow. Benthic invertebrate samples at AST4 were collected in the littoral zone at a mean depth of 0.4 m.
Water quality among the sampling sites was variable (Table 8B-2). Water temperatures in the watercourses were just above 9ºC; water temperature in Astotin Lake was slightly lower. The pH levels among all sampling sites ranged from 6.4 to 6.9. Conductance among sites ranged between 374 uS/cm and 542 uS/cm; the highest level was observed in Astotin Lake. Dissolved oxygen concentrations were variable. Concentrations in the watercourses were high enough to be protective of aquatic life (AENV, 1999); however, DO in Astotin Lake was considerably lower. Turbidity was high at Beaver Hill Creek but lower in Astotin Creek and Astotin Lake.
Table 8B-2 Habitat Parameters at Benthic Invertebrates Sampling Sites in the LSA
Parameter Beaver Hill Creek
(AST 1) Astotin Creek
(AST 6) Astotin Lake
(AST 4) Northing (Nad 83) 5972753 5952410 5949489 Easting (Nad 83) 371888 372925 379032 Date 02-May-07 03-May-07 02-May-07 Macrophyte Cover (%) 10 45 90 Algae Cover (%) 40 15 50

8B-6 December 2007
North American Upgrader Project Volume 3, Appendix 8B
NORTH AMERICAN OIL SANDS CORPORATION
Parameter Beaver Hill Creek
(AST 1) Astotin Creek
(AST 6) Astotin Lake
(AST 4) Conductance (µS/cm) 374 468 542 Temperature (°C) 9.65 9.15 6.82 Dissolved Oxygen (mg/L) 11.09 9.25 4.87 pH 6.40 6.91 6.57 Turbidity 43.42 5.5 11.71 Mean sample depth (m) 0.4 0.5 0.4 Mean stream velocity (m/s) 0.07 nm --
Note(s): nm non-measurable -- not applicable
8B3.2 Benthic Invertebrates in the LSA Benthic invertebrate mean total abundances in Beaver Hill and Astotin creeks ranged from less than 500 organisms/m2 to greater than 11,000 organisms/m2. Densities in the two watercourses were similar in 2006 (Synenco, 2006); however, displayed greater variability in 2007 (Figure 8B-2). Total Richness appeared to be somewhat higher in Astotin Creek than Beaver Hill Creek during the spring in both 2006 and 2007 (Tables 8B-3, 8B-4 and 8B-5).
Table 8B-3 Benthic Invertebrates in Samples Collected in Beaver Hill Creek (AST1)
Major Group Family Genus/species Mean SE
Percent of total
Abundance Nematoda - i/d 129.0 78.1 25.9 Oligochaeta Tubificidae i/d 103.2 72.7 20.7 Diptera Chironimini Glyptotendipes sp 51.6 16.1 10.3 Diptera Ceratopogonidae i/d 43.0 27.2 8.6 Oligochaeta Naididae Nais sp 34.4 25.1 6.9 Diptera Tanytarsini Tanytarsus sp 25.8 25.8 5.2 Oligochaeta Naididae Pristina sp 17.2 10.5 3.4 Ostrocoda - i/d 17.2 17.2 3.4 Diptera Chironimini Dicrotendipes sp 17.2 17.2 3.4 Diptera Chironimini Endochironomus sp 17.2 10.5 3.4 Pelecypoda Sphaeridae Sphaerium sp 8.6 8.6 1.7 Coleoptera - i/d 8.6 8.6 1.7 Diptera Chironimini Cryptochironomus sp 8.6 8.6 1.7 Diptera Dolichopodidae i/d 8.6 8.6 1.7 Diptera Empidiae Hemerodromia sp 8.6 8.6 1.7 Mean total abundance 499 254 Total Richness (lowest practical level) 15
Notes(s): SE Standard Error i/d immature or damaged specimen - not identified to that level

8B-7 December 2007
North American Upgrader Project Volume 3, Appendix 8B
NORTH AMERICAN OIL SANDS CORPORATION
Table 8B-4 Benthic Invertebrates in Samples Collected in Astotin Creek (AST6)
Major Group Family Genus/species Mean SE
Percent of total
Abundance Oligochaeta Tubificidae i/d 8,256.0 5,395.4 71.4 Nematoda - i/d 550.4 279.5 4.8 Diptera Empidiae i/d 481.6 337.0 4.2 Diptera - i/d 412.8 333.5 3.6 Diptera Tanypodinae Procladius sp 344.0 266.5 3.0 Oligochaeta Lumbriculidae Lumbriculus sp 206.4 206.4 1.8 Hydracarina - i/d 137.6 84.3 1.2 Collembola - i/d 137.6 137.6 1.2 Collembola Isotomidae Isotomurus sp 137.6 84.3 1.2 Hirudinea Lumbricidae Eiseniella sp 68.8 68.8 0.6 Pelecypoda Sphaeridae Sphaerium sp 68.8 68.8 0.6 Hydracarina Protziidae Calonyx sp 68.8 68.8 0.6 Hydracarina Unionicolidae Unionicola sp 68.8 68.8 0.6 Ostrocoda - i/d 68.8 68.8 0.6 Coleoptera Elmidae Dubiraphia sp 68.8 68.8 0.6 Diptera Ceratopogonidae i/d 68.8 68.8 0.6 Diptera Chironimini i/d 68.8 68.8 0.6 Diptera Chironimini Chiromomus sp 68.8 68.8 0.6 Diptera Orthocladinae Psectocladius sp 68.8 68.8 0.6 Diptera Dolichopodidae i/d 68.8 68.8 0.6 Diptera Psychodidae Psychoda sp 68.8 68.8 0.6 Diptera Tipulidae Ormosia sp 68.8 68.8 0.6 Mean total abundance 11,558 6,168 Total Richness (lowest practical level) 18
Notes(s): SE Standard Error i/d immature or damaged specimen - not identified to that level
Dominance is a measure of the most common taxa at a site and higher values tend to indicate disturbance or alteration to the environment. Often r-selected species are quick to establish large populations after communities of other organisms have collapsed. Dominance was considerably higher in Astotin Creek than Beaver Hill Creek and was the lowest in Astotin Lake, most likely because of a more stable benthic environment (Figure 8B-2).
Table 8B-5 Benthic Invertebrates in Samples Collected in Astotin Lake (AST4)
Major Group Family Genus/species Mean SE
Percent of Total
Abundance Oligochaeta Tubificidae i/d 2,132.8 1,227.8 18.1 Diptera Ceratopogonidae i/d 1,995.2 787.5 17.0 Nematoda - i/d 1,444.8 526.2 12.3 Diptera Tanypodinae Procladius sp 1,376.0 498.5 11.7 Diptera Chironimini Dicrotendipes sp 894.4 415.7 7.6 Hirudinea Erpobdellidae Erpobdella punctata 756.8 228.2 6.4 Amphipoda Hyalellidae Hyalella azteca 481.6 175.4 4.1 Hydryphantidae Diplodontidae Diplodontus sp 412.8 128.7 3.5 Ephemeroptera Caenidae Caenis sp 412.8 168.5 3.5

8B-8 December 2007
North American Upgrader Project Volume 3, Appendix 8B
NORTH AMERICAN OIL SANDS CORPORATION
Major Group Family Genus/species Mean SE
Percent of Total
Abundance Diptera Chironimini Endochironomus sp 344.0 266.5 2.9 Diptera Psychodidae Pericoma sp 344.0 266.5 2.9 Trichoptera Phryganeidae Agrypnia sp 275.2 128.7 2.3 Copepoda Harpacticidae i/d 206.4 137.6 1.8 Diptera Tanytarsini Cladotanytarsus sp 206.4 84.3 1.8 Oligochaeta Naididae Nais sp 68.8 68.8 0.6 Hirudinea Hirudinidae Molibdella grandis 68.8 68.8 0.6 Hydracarina Arrenuridae Arrenurus sp 68.8 68.8 0.6 Hydracirina Limnesiidae Tyrellia sp 68.8 68.8 0.6 Odonata-Zygoptera Coenagrionidae Enallagma sp 68.8 68.8 0.6 Diptera Chironimini Phaenopsectra sp 68.8 68.8 0.6 Diptera Orthocladinae i/d 68.8 68.8 0.6 Mean total abundance 11,765 1,694 Total Richness (lowest practical level) 21
Notes(s): SE Standard Error i/d immature or damaged specimen - not identified to that level
Community composition of samples collected in the LSA was largely comprised of midges (Chironimidae), aquatic worms (Oligochaeta) and nematodes (Figure 8B-3). The occurrence of large populations of these groups may indicate eutriphication or organic inputs into benthic habitats. This is not uncommon in agricultural areas, as the presence of livestock near watercourses, fertilization of cropland and the breakdown of allocthonous sources of carbon (leaves and terrestrial vegetation) can all contribute to increased organic matter in benthic substrates. Notably, community composition in Astotin Lake was more diverse than either watercourse (Figure 8B-3).
Differences in community composition between samples collected in 2006 (Synenco, 2006) and samples collected for the project in 2007 suggest the benthic community may be subject to a variable aquatic environment. Base flows in watercourses in the LSA may be quite low late in the summer and fall, exposing much of the benthic habitat to extreme conditions. For instance, Petro-Canada Oil Sands Inc. (2006) found that there was no flowing water in tributaries in the fall of 2006 and therefore could not collect samples. When habitat changes are excessive, many components of the community are affected and may need to re-establish populations when conditions permit. Depending upon the severity of annual environmental changes, community structure may vary from year to year as populations are restored.
The midge community varied between sampling years in Beaver Hill Creek (Figure 8B-3). In 2006 the community consisted largely of unidentified Chironominae, whereas, in 2007 the community was comprised of Chironomini and Tanytarsini (also both in the Chironominae subfamily). Astotin Lake and Astotin Creek communities (in both 2006 and 2007) were largely made up of Tanypodinae and Chironomini.
8B3.3 North Saskatchewan River Existing benthic invertebrate data in the North Saskatchewan River (NSR) near the LSA indicate that communities are somewhat variable in this watercourse (Golder, 1995; Petro-Canada Oil Sands Inc., 2006; Northwest, 2006; Synenco, 2006; Shell, 2007). Mean total abundances ranged

8B-9 December 2007
North American Upgrader Project Volume 3, Appendix 8B
NORTH AMERICAN OIL SANDS CORPORATION
from less than 2,000 organisms/m2 to greater than 35,000 organisms/m2 (Table 8B-6). Total richness was also variable in the NSR, ranging from 15 taxa to 46 taxa (identified to lowest practical level).
Table 8B-6 Existing Benthic Invertebrate Data in the NSR near the LSA
Golder (1995)
Petro-Canada (Fort Hills)
(2006) North West
(2006) Synenco
(2006) Shell (2006)
Parameter Fall 1992 Fall 1993 Fall 2006 Fall 2004 Spring 2006
Early summer 2006
Total Abundance (#/m2)
1,900-32,300
2,600-20,200 7,300-25,300 12,300-
35,700 5,500-26,700 20,400-28,700
Total Richness (lowest practical level)
15-25 18-33 35-38 23-46 16-39 6-8(a)
Notes(s)
(a) reported as mean richness
Most of the studies considered revealed that the benthic invertebrate community was responding to nutrient enrichment. Golder (1995) and Petro-Canada Oil Sands Inc. (2006) suggested that the benthic invertebrate communities showed a change consistent with nutrient enrichment that increased from upstream to downstream. North West (2006) indicated that the proportion of midges and aquatic worms increased from upstream to downstream, which is also indicative of an enrichment effect. Shell (2007) suggested that nutrient effects in the benthic communities were evident at all sites; however, an upstream to downstream gradient was not observed. Golder (1995) also identified a change in community structure downstream of two chemical plants which may suggest a toxic effect.
8B4 REFERENCES Alberta Environment (AENV). 1990. Selected Methods for Monitoring of Benthic Invertebrates in
Alberta Rivers. Environmental Assessment Division, Environmental Quality Monitoring Branch. Edmonton, Alberta. 41pp.
AENV. 1999. Surface Water Quality Guidelines for use in Alberta. Edmonton, Alberta.
Environment Canada. 2002. Metal Mining Guidance Document for Aquatic Environmental Effects Monitoring. National EEM Office, June 2002.
Golder Associates Ltd. (Golder). 1995. Joint Industry-Municipal North Saskatchewan River Study. Prepared for the Joint Industry Steering Committee and the City of Edmonton. 88 pp.
Golder. 2003. Review of Historical Benthic Invertebrate Data for Rivers and Streams in the Oil Sands Region. Prepared for the Regional Aquatic Monitoring Program Steering Committee. Report no. 022-2301(6340). Calgary, Alberta
North West Upgrading Inc. (North West). 2006. North West Upgrader: Aquatics Assessment Report. Prepared by Millennium EMS Solutions Ltd. Edmonton, AB.
Petro-Canada Oil Sands Inc. 2006. Application for Approval of the Sturgeon Upgrader. Submitted to the Alberta Energy and Utilities Board and Alberta Environment. Submitted by Petro-Canada Oil Sands Inc. on behalf of Fort Hills Oil Sands L.P. December 2006.

8B-10 December 2007
North American Upgrader Project Volume 3, Appendix 8B
NORTH AMERICAN OIL SANDS CORPORATION
Shell Canada Limited. 2007. Application for Approval of the Shell Scotford Upgrader 2 Project. Submitted to Alberta Energy and Utilities Board and Alberta Environment. July 2007.
Synenco Energy Inc. 2006. Application for Approval of the Northern Lights Mining and Extraction Project. Submitted to Alberta Environment and Alberta Energy and Utilities Board. June 2006.


8B-12 December 2007
North American Upgrader Project Volume 3, Appendix 8B
Figure 8B-2 Benthic Invertebrate Mean Total Abundance, Total Richness and Dominance in Samples Collected in the North American Upgrader LSA
Total Abundance
02,0004,0006,0008,000
10,00012,00014,00016,00018,00020,000
AST1 Synenco (2006) AST6 Synenco (2006) AST4
Beaverhill Creek Beaverhill Creek Astotin Creek Astotin Creek Astotin Lake
Tota
l Abu
ndan
ce (n
o./m
2)
Richness (lowest Level)
0
5
10
15
20
25
30
AST1 Synenco (2006) AST6 Synenco (2006) AST4
Beaverhill Creek Beaverhill Creek Astotin Creek Astotin Creek Astotin Lake
Tota
l Ric
hnes
s (lo
wes
t pro
ctic
al le
vel)
Dominance
0
10
20
30
40
50
60
70
80
AST1 Synenco (2006) ) NA AST6 Synenco (2006) NA AST4
Beaverhill Creek Beaverhill Creek Astotin Creek Astotin Creek Astotin Lake
Per
cent
Dom
inan
ce
Error bars represent one Standard Error
Note(s) NA – data not available
NORTH AMERICAN OIL SANDS CORPORATION

8B-13 December 2007
North American Upgrader Project Volume 3, Appendix 8B
Figure 8B-3 Benthic Invertebrate Community Composition and Chironomidae Composition in Samples Collected in the North American Upgrader LSA
Comunity Composition
0%
20%
40%
60%
80%
100%
AST1 Synenco (2006) AST6 Synenco (2006) AST4
Beaverhill Creek Beaverhill Creek Astotin Creek Astotin Creek Astotin Lake
Perc
ent A
bund
ance
Oligochaeta Chironomidae Nematoda Hydracarina Ostracoda Ephemeroptera Pelecypoda Other
Chironomidae Composition
0%
20%
40%
60%
80%
100%
AST1 Synenco (2006) AST6 Synenco (2006) AST4
Beaverhill Creek Beaverhill Creek Astotin Creek Astotin Creek Astotin Lake
Per
cent
Abu
ndan
ce
Tanypodinae Chironimini Tanytarsini Orthocladinae Other
NORTH AMERICAN OIL SANDS CORPORATION