Volume 117, No. 3, March 2017 - SAIMM
120
VOLUME 117 NO. 3 MARCH 2017
-
Upload
khangminh22 -
Category
Documents
-
view
1 -
download
0
Transcript of Volume 117, No. 3, March 2017 - SAIMM

VOLUME 117 NO. 3 MARCH 2017


20 April 2017Emperors Palace, Hotel Casino,
Convention Resort Johannesburg
PROXIMITY DETECTION ANDCOLLISION AVOIDANCE SYSTEMS IN MINING COLLOQUIUM 2017
Striving for zero harm from mining mobile machinery
BACKGROUNDConsiderable attention is being focused through the Department of Mineral Resources, the Mine Health and Safety Council, the mining companies and the original equipment manufacturers on the development and implementation of Proximity Detection Systems (PDSs) andCollision Avoidance Systems for underground and surface mobile machinery and underground track bound machinery. These initiatives are allin support of the quest by all stakeholders for reaching “zero harm”.
Systems have been developed and trialled for vehicle to person detection and warning, vehicle to beacon, and vehicle to vehicle detection.Technical challenges have been encountered in terms of the various system reliability and pedestrian/operator acceptance, as well as the
application on diesel powered and electric powered machinery, respectively.Whilst it is the intention to regulate this area in the near future, it is important that the various issues that could be problematic to
implementation be aired and solutions found.
Conference Co-ordinator: Camielah Jardine • SAIMM
Tel: +27 11 834-1273/7 • Fax: +27 11 833-8156 E-mail:[email protected]
Website: http://www.saimm.co.za
INCREASEDYIELD
AACHENTM HIGH SHEAR TECHNOLOGY
operational and process performance in gold plants. A combination of shear, elevated pressure and high oxygen levels enables superior oxidation reactions.Features and Higher processing recoveries and hard-wearing trouble-free service life. Standard
support and advice.
Maelgwyn Mineral Services Africa (Pty) LtdTel +27 (0)11 474 0705 Fax +27 (0)11 474 5580 Email [email protected] www.maelgwynafrica.com
support and advice.

�
ii
Mike TekePresident, Chamber of Mines of South Africa
Mosebenzi ZwaneMinister of Mineral Resources, South Africa
Rob DaviesMinister of Trade and Industry, South Africa
Naledi PandorMinister of Science and Technology, South Africa
C. Musingwini
S. Ndlovu
A.S. Macfarlane
M. Mthenjane
R.T. Jones
J. Porter
Z. Botha
V.G. Duke A.G. SmithI.J. Geldenhuys M.H. SolomonM.F. Handley M.R. TlalaW.C. Joughin D. TudorM. Motuku D.J. van NiekerkD.D. Munro A.T. van ZylG. Njowa
N.A. Barcza S.J. RamokgopaR.D. Beck M.H. RogersJ.R. Dixon D.A.J. Ross-WattM. Dworzanowski G.L. SmithH.E. James W.H. van NiekerkG.V.R. Landman R.P.H. WillisJ.C. Ngoma
Botswana L.E. DimbunguDRC S. MalebaJohannesburg J.A. LuckmannNamibia N.M. NamateNorthern Cape C.A. van WykPretoria P. BredellWestern Cape C.G. SweetZambia D. MumaZimbabwe S. MatutuZululand C.W. Mienie
Australia: I.J. Corrans, R.J. Dippenaar, A. Croll, C. Workman-Davies
Austria: H. WagnerBotswana: S.D. WilliamsUnited Kingdom: J.J.L. Cilliers, N.A. BarczaUSA: J-M.M. Rendu, P.C. Pistorius
The Southern African Institute of Mining and Metallurgy
*Deceased
* W. Bettel (1894–1895)* A.F. Crosse (1895–1896)* W.R. Feldtmann (1896–1897)* C. Butters (1897–1898)* J. Loevy (1898–1899)* J.R. Williams (1899–1903)* S.H. Pearce (1903–1904)* W.A. Caldecott (1904–1905)* W. Cullen (1905–1906)* E.H. Johnson (1906–1907)* J. Yates (1907–1908)* R.G. Bevington (1908–1909)* A. McA. Johnston (1909–1910)* J. Moir (1910–1911)* C.B. Saner (1911–1912)* W.R. Dowling (1912–1913)* A. Richardson (1913–1914)* G.H. Stanley (1914–1915)* J.E. Thomas (1915–1916)* J.A. Wilkinson (1916–1917)* G. Hildick-Smith (1917–1918)* H.S. Meyer (1918–1919)* J. Gray (1919–1920)* J. Chilton (1920–1921)* F. Wartenweiler (1921–1922)* G.A. Watermeyer (1922–1923)* F.W. Watson (1923–1924)* C.J. Gray (1924–1925)* H.A. White (1925–1926)* H.R. Adam (1926–1927)* Sir Robert Kotze (1927–1928)* J.A. Woodburn (1928–1929)* H. Pirow (1929–1930)* J. Henderson (1930–1931)* A. King (1931–1932)* V. Nimmo-Dewar (1932–1933)* P.N. Lategan (1933–1934)* E.C. Ranson (1934–1935)* R.A. Flugge-De-Smidt
(1935–1936)* T.K. Prentice (1936–1937)* R.S.G. Stokes (1937–1938)* P.E. Hall (1938–1939)* E.H.A. Joseph (1939–1940)* J.H. Dobson (1940–1941)* Theo Meyer (1941–1942)* John V. Muller (1942–1943)* C. Biccard Jeppe (1943–1944)* P.J. Louis Bok (1944–1945)* J.T. McIntyre (1945–1946)* M. Falcon (1946–1947)* A. Clemens (1947–1948)* F.G. Hill (1948–1949)* O.A.E. Jackson (1949–1950)* W.E. Gooday (1950–1951)* C.J. Irving (1951–1952)* D.D. Stitt (1952–1953)* M.C.G. Meyer (1953–1954)* L.A. Bushell (1954–1955)* H. Britten (1955–1956)* Wm. Bleloch (1956–1957)
* H. Simon (1957–1958)* M. Barcza (1958–1959)* R.J. Adamson (1959–1960)* W.S. Findlay (1960–1961)
D.G. Maxwell (1961–1962)* J. de V. Lambrechts (1962–1963)* J.F. Reid (1963–1964)* D.M. Jamieson (1964–1965)* H.E. Cross (1965–1966)* D. Gordon Jones (1966–1967)* P. Lambooy (1967–1968)* R.C.J. Goode (1968–1969)* J.K.E. Douglas (1969–1970)* V.C. Robinson (1970–1971)* D.D. Howat (1971–1972)
J.P. Hugo (1972–1973)* P.W.J. van Rensburg
(1973–1974)* R.P. Plewman (1974–1975)* R.E. Robinson (1975–1976)* M.D.G. Salamon (1976–1977)* P.A. Von Wielligh (1977–1978)* M.G. Atmore (1978–1979)* D.A. Viljoen (1979–1980)* P.R. Jochens (1980–1981)
G.Y. Nisbet (1981–1982)A.N. Brown (1982–1983)
* R.P. King (1983–1984)J.D. Austin (1984–1985)H.E. James (1985–1986)H. Wagner (1986–1987)
* B.C. Alberts (1987–1988)C.E. Fivaz (1988–1989)O.K.H. Steffen (1989–1990)
* H.G. Mosenthal (1990–1991)R.D. Beck (1991–1992)
* J.P. Hoffman (1992–1993)* H. Scott-Russell (1993–1994)
J.A. Cruise (1994–1995)D.A.J. Ross-Watt (1995–1996)N.A. Barcza (1996–1997)
* R.P. Mohring (1997–1998)J.R. Dixon (1998–1999)M.H. Rogers (1999–2000)L.A. Cramer (2000–2001)
* A.A.B. Douglas (2001–2002)S.J. Ramokgopa (2002-2003)T.R. Stacey (2003–2004)F.M.G. Egerton (2004–2005)W.H. van Niekerk (2005–2006)R.P.H. Willis (2006–2007)R.G.B. Pickering (2007–2008)A.M. Garbers-Craig (2008–2009)J.C. Ngoma (2009–2010)G.V.R. Landman (2010–2011)J.N. van der Merwe (2011–2012)G.L. Smith (2012–2013)M. Dworzanowski (2013–2014)J.L. Porter (2014–2015)R.T. Jones (2015–2016)
Scop Incorporated
Messrs R.H. Kitching
The Southern African Institute of Mining and Metallurgy
Fifth Floor, Chamber of Mines Building
5 Hollard Street, Johannesburg 2001 • P.O. Box 61127, Marshalltown 2107
Telephone (011) 834-1273/7 • Fax (011) 838-5923 or (011) 833-8156
E-mail: [email protected]

The Journal of the Southern African Institute of Mining and Metallurgy MARCH 2017 siii
ContentsJournal Commentby D. Tudor . . . . . . . . . . . . . . . . . . . . . . . . . . . . . . . . . . . . . . . . . . . . . . . . . . . . . . . . . . . . . . . . iv
President’s Corner—Advancing international collaboration through the Global MineralProfessionals Alliance (GMPA)by C. Musingwini . . . . . . . . . . . . . . . . . . . . . . . . . . . . . . . . . . . . . . . . . . . . . . . . . . . . . . . . . . . v
Erratum . . . . . . . . . . . . . . . . . . . . . . . . . . . . . . . . . . . . . . . . . . . . . . . . . . . . . . . . . . . . . . . . . . iv
On-campus mine surveying practicals: their contribution in training mining engineering students in an open distance learning contextby F.M. Lugoma. . . . . . . . . . . . . . . . . . . . . . . . . . . . . . . . . . . . . . . . . . . . . . . . . . . . . . . . . . . . . 207
Factors and challenges affecting coal recovery by opencast pillar mining in the Witbank coalfieldby P.L. Ngwenyama, W.W. de Graaf, and E.P. Preis . . . . . . . . . . . . . . . . . . . . . . . . . . . . . . . . . 215Weathering the ‘perfect storm’ facing the mining sectorby N. Singh . . . . . . . . . . . . . . . . . . . . . . . . . . . . . . . . . . . . . . . . . . . . . . . . . . . . . . . . . . . . . . . . 223Adapting oil and gas drilling techniques for the mining industry with dewatering well placement technologyby A. Rowland, M. Bester, M. Boland, C. Cintolesi, and J. Dowling . . . . . . . . . . . . . . . . . . . . . . 231Controlled foam injection: a new and innovative non-explosive rockbreaking technologyby R.G.B. Pickering and C. Young . . . . . . . . . . . . . . . . . . . . . . . . . . . . . . . . . . . . . . . . . . . . . . . 237
An investigation of failure modes and failure criteria of rock in complex stress statesby Z. Li, J. Shi, and A. Tang. . . . . . . . . . . . . . . . . . . . . . . . . . . . . . . . . . . . . . . . . . . . . . . . . . . . 245CFD study of the effect of face ventilation on CH4 in returns and explosive gas zones in progressively sealed longwall gobsby S.A. Saki, J.F. Brune, G.E. Bogin Jr., J.W. Grubb, M.Z. Emad, and R.C. Gilmore . . . . . . . . . . 257Narrow-reef mechanized mining layout at Anglo American Platinumby F. Fourie, P. Valicek, G. Krafft, and J. Sevenoaks . . . . . . . . . . . . . . . . . . . . . . . . . . . . . . . . . 263Geotechnical characterization of ore related to mudrushes in block caving miningby R.L. Castro, K. Basaure, S. Palma, and J. Vallejos . . . . . . . . . . . . . . . . . . . . . . . . . . . . . . . . . 275A mining perspective on the potential of renewable electricity sources for operations in South Africa: Part I—The research approach and internal evaluation processby R.G. Votteler and A.C. Brent . . . . . . . . . . . . . . . . . . . . . . . . . . . . . . . . . . . . . . . . . . . . . . . . . 285A mining perspective on the potential of renewable electricity sources for operations in South Africa: Part 2–A multi-criteria decision assessmentby R.G. Votteler and A.C. Brent . . . . . . . . . . . . . . . . . . . . . . . . . . . . . . . . . . . . . . . . . . . . . . . . 299
International Advisory Board
R. Dimitrakopoulos, McGill University, CanadaD. Dreisinger, University of British Columbia, CanadaE. Esterhuizen, NIOSH Research Organization, USAH. Mitri, McGill University, CanadaM.J. Nicol, Murdoch University, AustraliaE. Topal, Curtin University, Australia
Editorial Board
R.D. BeckJ. BeukesP. den Hoed
M. DworzanowskiB. Genc
M.F. HandleyR.T. JonesW.C. JoughinJ.A. LuckmannC. MusingwiniS. Ndlovu
J.H. PotgieterT.R. StaceyD.R. Vogt
Editorial Consultant
D. Tudor
Typeset and Published by
The Southern African Institute ofMining and MetallurgyP.O. Box 61127Marshalltown 2107Telephone (011) 834-1273/7Fax (011) 838-5923E-mail: [email protected]
Printed by
Camera Press, Johannesburg
Advertising Representative
Barbara SpenceAvenue AdvertisingTelephone (011) 463-7940E-mail: [email protected]
The SecretariatThe Southern African Instituteof Mining and Metallurgy
ISSN 2225-6253 (print)ISSN 2411-9717 (online)
THE INSTITUTE, AS A BODY, ISNOT RESPONSIBLE FOR THESTATEMENTS AND OPINIONSADVANCED IN ANY OF ITSPUBLICATIONS.Copyright© 1978 by The Southern AfricanInstitute of Mining and Metallurgy. All rightsreserved. Multiple copying of the contents ofthis publication or parts thereof withoutpermission is in breach of copyright, butpermission is hereby given for the copying oftitles and abstracts of papers and names ofauthors. Permission to copy illustrations andshort extracts from the text of individualcontributions is usually given upon writtenapplication to the Institute, provided that thesource (and where appropriate, the copyright)is acknowledged. Apart from any fair dealingfor the purposes of review or criticism underThe Copyright Act no. 98, 1978, Section 12,of the Republic of South Africa, a single copy ofan article may be supplied by a library for thepurposes of research or private study. No partof this publication may be reproduced, stored ina retrieval system, or transmitted in any form orby any means without the prior permission ofthe publishers. Multiple copying of the
contents of the publication without
permission is always illegal.
U.S. Copyright Law applicable to users In theU.S.A.The appearance of the statement of copyrightat the bottom of the first page of an articleappearing in this journal indicates that thecopyright holder consents to the making ofcopies of the article for personal or internaluse. This consent is given on condition that thecopier pays the stated fee for each copy of apaper beyond that permitted by Section 107 or108 of the U.S. Copyright Law. The fee is to bepaid through the Copyright Clearance Center,Inc., Operations Center, P.O. Box 765,Schenectady, New York 12301, U.S.A. Thisconsent does not extend to other kinds ofcopying, such as copying for generaldistribution, for advertising or promotionalpurposes, for creating new collective works, orfor resale.
VOLUME 117 NO. 3 MARCH 2017
UNISA PAPER
NEW TECHNOLOGY PAPERS
GENERAL PAPERS

�
iv
This issue contains just one paper from theUniversity of South Africa (UNISA), the onlySouth African university offering mining
engineering and mine surveying by open distancelearning. Lugoma explores the possibility ofsupplementing online course content with on-campus practical sessions. The encouraging findingshave prompted him to roll out this approach toeducation so as to enable students to familiarizethemselves with mine surveying equipment beforethey begin their professional careers.
It must be noted that of the 10 papers originallysubmitted by UNISA, seven were rejected by therefereeing process; one paper was withdrawn, andone is still being revised prior to possiblepublication at a later date. The referees were almostunanimous in their reasons for rejection, whichwere: lack of structure in the paper; the content ofthe paper did not correspond with the titledescription; and the results of the work did notproduce anything that is not already well known.
I hope that this will not deter the researchers atUNISA from submitting papers on their work in thefuture, and that the constructive comments by thereferees will enable researchers and authors toproduce papers of an acceptable standard forpublication in the Journal of the SAIMM.
The diligence of the referees of the UNISApapers is commendable in that they providedmeaningful feedback to the authors and at the sametime contributed to maintaining the standard of thepublications in our Journal.
D. TudorEditorial Consultant
Journal Comment
ErratumThe paper in the February issue of the SAIMMJournal, vol. 117, no. 2. pp. 97–108 by Feroze,T. and Genc, B. entitled ‘A CFD model toevaluate variables of the line brattice ventilationsystem in an empty heading’ contained anincorrect version of Figure 1 (p. 98). The correctfigure is as follows. We apologise for anymisunderstanding that may have ensued.

�v
When Finance Minister Pravin Gordhan was delivering his mid-term budget speech in 2016, he madereference to the following Pedi quote which is relevant to one of SAIMM’s strategic initiatives: ‘Ditau tsahloka seboka di shitwa ke nare e hlotsa’ (translated into English as ‘Lions that fail to work as a team will
struggle to bring down even a limping buffalo’). This quote cannot be any truer when one reflects on the needfor collaboration for a common purpose. In the October 2015 edition of the SAIMM Journal our Immediate PastPresident, Rodney Jones, wrote about a 2011 inaugural meeting in London which ultimately resulted in theformation of the Global Mineral Professionals Alliance (GMPA). I am happy to share with you a positivedevelopment – in February 2017 the SAIMM hosted the Annual GMPA Meeting in Cape Town, where weformally signed a Memorandum of Understanding (MoU).
Some of you may wonder what the GMPA is, and why it is important that the SAIMM participates in such acollaboration.
The GMPA is currently composed of six sister institutes: the Australasian Institute of Mining andMetallurgy (AusIMM), the Canadian Institute of Mining, Metallurgy and Petroleum (CIM), the Institute ofMaterials, Mining and Metallurgy (IOM3), the SAIMM, the Society for Mining, Metallurgy and Exploration Inc.(SME), and the Instituto de Ingenieros de Minas del Peru (IIMP). Each of these six professional organizationsis active in its specific geographic area in order to advance and promote the professional development of itsmembers. This common goal brings us together under the GMPA umbrella to share challenges and solutions.We are able to move towards this goal collectively through sharing institutional information andbenchmarking, and sharing technical information via OneMine.org and the Global Mining Standards andGuidelines Group (GMSG). I urge you to visit the OneMine.org website to see the wealth of technical papershosted on that platform. Through our collaborative partnership with the GMPA, we are able to enhance amutually beneficial relationship among member associations. Standing alone, we would run the risk ofstarving like the independent-minded lions that fail to bring down the limping buffalo.
The SAIMM is fully committed to the GMPA initiative as its members stand to benefit from the reciprocalarrangements that exist among the member institutions. For example, any SAIMM member in goodprofessional standing who visits any of the GMPA geographical locations for no more than 12 months qualifiesfor ‘Visiting Member’ status. This allows the member, among other things, to register for conferences,seminars, and workshops conducted by the host society at the host society’s member rate, and to have accessto the host society’s facilities. SAIMM members can login via the SAIMM website to the OneMine.org websiteand view, download, and print documents at no charge. Is this not a great leap forward in benefits for ourmembers? Is this not a global approach to dealing with global challenges? As you read this edition of theJournal, which is dedicated to papers from UNISA, the New Technology Conference, and other selected papersof topical interest, I would therefore like to leave you with this thought on collaboration. If a sorrow shared is asorrow halved, then a joy shared is a joy doubled. Will challenges shared not be challenges halved, andsuccess shared be success doubled?
C. MusingwiniPresident, SAIMM
Advancing internationalcollaboration through the Global
Mineral Professionals Alliance(GMPA)
President’s
Corner

SUBSCRIBEof the SAIMM Journal
TO 12 ISSUESJanuary to December 2017
ORR2025.00LOCAL
US$520.00OVERSEAS
per annum per subscription
For more information please contact: Kelly Matthee
The Journal Subscription Department
Tel: 27-11-834-1273/7 • e-mail: [email protected] or [email protected]: http://www.saimm.co.za
� Less 15% discount to agents only
� PRE-PAYMENT is required
� The Journal is printed monthly
� Surface mail postage included
� ISSN 2225-6253
� with cutting-edge research � new knowledge on old subjects � in-depth analysis

Unisa PaperOn-campus mine surveying practicals: their contribution in training mining engineering students in an open distance learning contextby F.M. Lugoma . . . . . . . . . . . . . . . . . . . . . . . . . . . . . . . . . . . . . . . . . . . . . . . . . . . . . . . . . . . . . . . . . . . . . . . . . . . . . . . . . 207
The University of South Africa (UNISA) is the only South African university offering mine surveying by open distance learning. A roster was designed for mine surveying practicals for implementation over one year, with students’ attendance being optional. A noticeable improvement in the pass rate was observed among students who attended the practical sessions. This constitutes an incentive to make the Mine Surveying practicals compulsory in future and integrating them into the current learning and assessment routine.
New Technology PapersFactors and challenges affecting coal recovery by opencast pillar mining in the Witbank coalfieldby P.L. Ngwenyama, W.W. de Graaf, and E.P. Preis. . . . . . . . . . . . . . . . . . . . . . . . . . . . . . . . . . . . . . . . . . . . . . . . . . . . . . 215
The challenges faced by an opencast pillar mining operation are presented, and their effect on the quality and quantity of coal reserves discussed.
Weathering the ‘perfect storm’ facing the mining sectorby N. Singh . . . . . . . . . . . . . . . . . . . . . . . . . . . . . . . . . . . . . . . . . . . . . . . . . . . . . . . . . . . . . . . . . . . . . . . . . . . . . . . . . . . . 223
This paper discusses the recently developed and accepted South African Mining Extraction Research, Development & Innovation (SAMERDI) strategy, and the merits of revitalizing the mining research, development, and innovation environment by strengthening and consolidating current efforts.
Adapting oil and gas drilling techniques for the mining industry with dewatering well placement technologyby A. Rowland, M. Bester, M. Boland, C. Cintolesi, and J. Dowling . . . . . . . . . . . . . . . . . . . . . . . . . . . . . . . . . . . . . . . . . . 231
This paper describes how the limitations of conventional open-pit dewatering systems can be addressed through placement of permanent, high-performance dewatering wells in optimum orientations beneath the pit using large-diameter directional drilling technology.
Controlled foam injection: a new and innovative non-explosive rockbreaking technologyby R.G.B. Pickering and C. Young . . . . . . . . . . . . . . . . . . . . . . . . . . . . . . . . . . . . . . . . . . . . . . . . . . . . . . . . . . . . . . . . . . . 237
Controlled foam injection (CFI) is a highly effective, novel non-explosive rockbreaking technology that in extensive trials has successfully broken every rock type encountered. CFI is safer and more productive than traditional drillingand blasting methods, and could be used replace all mining and civil engineering rockbreaking processes that utilize explosives in short and small-diameter blast-holes.
These papers will be available on the SAIMM websitehttp://www.saimm.co.za
PAPERS IN THIS EDITIONThese papers have been refereed and edited according to internationally accepted standards and are
accredited for rating purposes by the South African Department of Higher Education and Training

General PapersAn investigation of failure modes and failure criteria of rock in complex stress statesby Z. Li, J. Shi, and A. Tang . . . . . . . . . . . . . . . . . . . . . . . . . . . . . . . . . . . . . . . . . . . . . . . . . . . . . . . . . . . . . . . . . . . . . . . . 245
The controlling parameters that dominate tension fracture, local shear failure, and general shear failure are different. Using a reasonable assumption based on a number of experimental results, a failure criterion corresponding to three distinct failure modes is presented.
CFD study of the effect of face ventilation on CH4 in returns and explosive gas zones in progressively sealedlongwall gobsby S.A. Saki, J.F. Brune, G.E. Bogin Jr., J.W. Grubb, M.Z. Emad, and R.C. Gilmore . . . . . . . . . . . . . . . . . . . . . . . . . . . . . . 257
A parametric study is presented of the effect of air quantity at the longwall face on methane concentrations in the tailgate and formation of explosive gas zones (EGZs) in the gob. The results show that, counter to conventional wisdom, increased air quantities at the longwall face may increase the explosion hazard as they result in increased EGZ volumes in the gob, along with increased methane quantities in the tailgate return.
Narrow-reef mechanized mining layout at Anglo American Platinumby F. Fourie, P. Valicek, G. Krafft, and J. Sevenoaks. . . . . . . . . . . . . . . . . . . . . . . . . . . . . . . . . . . . . . . . . . . . . . . . . . . . . . 263
The results obtained during a production trial of extra-low profile mining equipment in pre-developed stoping areas, as well as the progress that has been made on ultra-low profile equipment, are discussed. Emphasis is placed on the higher production levels and greater efficiencies that can be achieved using this equipment, and the importance of the mining cycle as well as the availability of the equipment.
Geotechnical characterization of ore related to mudrushes in block caving miningby R.L. Castro, K. Basaure, S. Palma, and J. Vallejos . . . . . . . . . . . . . . . . . . . . . . . . . . . . . . . . . . . . . . . . . . . . . . . . . . . . . 275
The purpose of this work was to characterize by geotechnical laboratory tests, mud from a block cave and to derive mechanical reasons for the failure of this material while it is being drawn.
A mining perspective on the potential of renewable electricity sources for operations in South Africa: Part I—The research approach and internal evaluation processby R.G. Votteler and A.C. Brent . . . . . . . . . . . . . . . . . . . . . . . . . . . . . . . . . . . . . . . . . . . . . . . . . . . . . . . . . . . . . . . . . . . . . 285
In this paper, the first in a series of two, multi-criteria decision analysis is used to identify the criteria employed by mining corporations to evaluate possible electricity generation sources. The overall aim of the research is to providea clear understanding of the new, developing market of renewable energy sources.
A mining perspective on the potential of renewable electricity sources for operations in South Africa: Part 2–A multi-criteria decision assessmentby R.G. Votteler and A.C. Brent. . . . . . . . . . . . . . . . . . . . . . . . . . . . . . . . . . . . . . . . . . . . . . . . . . . . . . . . . . . . . . . . . . . . 299
Current knowledge about the external macroeconomic and the internal corporate environment is combined to produce a clear picture of how renewable sources of electricity could perform from the perspective of mining corporations in South Africa, using the multi-attribute value theory (MAVT) approach. The results show that hybrid versions of current electricity sources (diesel generators and Eskom grid connection) with solar photovoltaic and onshore wind compare favourably with the current sources alone.
PAPERS IN THIS EDITIONThese papers have been refereed and edited according to internationally accepted standards and are
accredited for rating purposes by the South African Department of Higher Education and Training
These papers will be available on the SAIMM websitehttp://www.saimm.co.za

The University of South Africa (UNISA) is theonly South African university offering minesurveying by open distance learning (ODL).The set-up was intended to primarily offerflexible training to mine practitioners in searchof formal qualifications without affecting theirprofessional lives. However, over time, profes-sional students employed in or by the miningindustry have been outnumbered by privatestudents. These students are freshly graduatedfrom high school with little to no priorindustrial experience.
It is clear that the current curriculum needsto be rethought considering the changingprofile of students enrolling for mining-relatedqualifications. That is why the Department ofMining Engineering at UNISA has introducedon-campus practical sessions. The programme
is initially aimed at supplementing students’formal training with relevant mine surveyingexercises.
In order to assess the impact of theprogramme, historical data pertaining to theperformance of students over the last fiveyears was extracted from the Universitydatabase. Six mine surveying modules formingpart of the National Diploma in MiningEngineering and National Diploma in MineSurveying offered at UNISA were considered.Mine surveying subjects include Mine SurveyII and III and Mine Valuation II and III; whilemining engineering subjects include MineSurvey and Valuation II and III. A roster wasdesigned for mine surveying practicals forimplementation over one year, with students’attendance being optional. The students whoaccepted the invitation were monitored for theduration of the research. Statistical analysiscentred on the hypothesis was performed todetermine the change in status before andafter the inception of the programme. Finally,recommendations for future work are proposedand conceivable changes to tuition policiesevoked.
The National Diploma in Mining Engineeringand in Mine Surveying are two of the formalengineering qualifications offered by UNISA’sDepartment of Electrical and MiningEngineering, which is based on the ScienceCampus in Florida, Roodepoort. TheDepartment of Electrical and MiningEngineering forms part of the School ofEngineering, which itself forms part of theCollege of Science, Engineering andTechnology (CSET), as shown in Figure 1.
On-campus mine surveying practicals:their contribution in training miningengineering students in an opendistance learning contextby F.M. Lugoma*
The University of South Africa (UNISA) is the only South Africanuniversity offering mine surveying by open distance learning (ODL).Initially intended to service mining engineering practitioners in search offormal training, the university has seen a growing enrolment of privatestudents. Because this cohort of students has had little contact with themining environment, there is a need to supplement the theoretical trainingby ODL with practical sessions on campus.
In order to investigate this concern, historical data pertaining to theperformance of students over the last five years was collected. Six minesurveying modules forming part of the national diplomas in MiningEngineering and in Mine Surveying offered at UNISA were considered:Mine Survey II and III, Mine Valuation II and III (Mine Surveyors subjects),and Mine Survey and Valuation II and III (Mine Engineering subjects).
A roster was then designed for mine surveying practicals forimplementation over one year, with students’ attendance being optional.The students who accepted the invitation were monitored for the durationof the research.
From the initial findings, a noticeable improvement in pass rate wasobserved for students who attended the practical sessions compared withthose who did not. This can be regarded as an incentive to make the minesurveying practicals compulsory in future while integrating them with thecurrent learning and assessment. One consequence of this would be thetraining of well-rounded technicians with sought-after skills for the SouthAfrican mining industry.
mine surveying, open distance learning, on-campus practicals, miningengineering education.
* Department of Electrical and Mining Engineering,Univerity of South Africa, Science Campus, SouthAfrica.
© The Southern African Institute of Mining andMetallurgy, 2017. ISSN 2225-6253. Paper receivedJul. 2016; revised paper received Feb. 2017.
207VOLUME 117 �
http://dx.doi.org/10.17159/2411-9717/2017/v117n3a1

On-campus mine surveying practicals
The purpose of this qualification is to produce competentmining technicians whose responsibilities would include theselection and managing of the optimal mining process for themineral deposit in question. A qualified person with sufficientexperience will be able to register with the EngineeringCouncil of South Africa (ECSA) as a Professional Technicianin this field of engineering. This programme is a prerequisitefor the BTech Mining Engineering offered by the Universityof Johannesburg.
The NDip Mining Engineering programme helpscandidates to obtain a Mine Manager’s Certificate ofCompetency (MMCoC) since it covers the syllabus of Part A aswell as sections of Part B. Students who completed thediploma may apply to the Department of Mineral Resources(DMR) for exemption from Part A of the MMCoC.
The curriculum of the programme is presented in Table I.
The main purpose of the National Diploma in Mine Surveyingis to produce competent mine surveyors whose responsi-bilities would include taking measurements on and under thesurface of the earth in a horizontal and vertical plane,showing the results in the form of a map, plan, or 3Dcomputer model after certain calculations have been done.
Many previously disadvantaged students are enrolled formining programmes at UNISA. Statistics collected from theInstitutional Information Portal (Directorate: Information andAnalysis, ‘HEDA’ (Unisa, 2016a)) reveal that they representabout 95% of all mining-related students over the last fiveyears. UNISA thereby assists mining companies to meet therequirements of the Mining Charter. Health and safety in theminerals industry continues to be a priority. UNISA wants tobetter equip future graduates with regard to mine health andsafety in particular.
The curriculum of the National Diploma in MineSurveying is outlined in Table II. It is important to point outthat UNISA and the University of Johannesburg are the onlytwo universities in South Africa offering a diploma inmine/minerals surveying. UNISA is the only university thatoffers such a programme by distance learning.
Methodologies used in distance learning differ from those
used in residential universities. In ODL, students are issuedwith a study package upon registration, consisting of studyguides, tutorial letters, and course notes. Textbooks areprescribed where course notes are not provided by UNISA.The assignments are included in tutorial letters. Students donot attend classes, but limited discussion classes and lectureconsultation sessions are offered in some cases. Discussionclasses are not compulsory and are not offered to remotestudents in South Africa, Africa, and the rest of the world. Tocompensate for this, UNISA uses e-learning technologies to alarge extent. The UNISA learning management system (LMS),called myUnisa, is the UNISA online student portal and theuniversity’s most important study tool (UNISA, 2016b).Students can download all course material, as well asadditional resources. myUnisa is also called the ‘virtualcampus for distant learners’. It constitutes a platform wherestudents can interact with fellow students, lecturers, andtutors.
Through self-study the students work through the studyguides in their own time, complete the assignments (two orthree), and submit them for assessment. Tutorial letters areused by lecturers to provide feedback on assignments and todiscuss general problems regarding the subject content. Somelecturers provide such feedback individually when they markstudent assignments. Lecturers, and in some cases alsotutors, are appointed for each subject to offer academicsupport to the students via telephone, e-mail, MyUnisa(internet), and personal sessions where required.
A year mark is calculated from assignment marks. Theyear mark has a weight of 20% when the final mark iscalculated; the examination (summative assessment) has aweight of 80%. There are three examination periods, namelyJanuary/February, May/June, and October/November. Allsemester modules have examinations in May/June andOctober/November respectively for students registered insemester 1 or semester 2. Examinations for full-year modulesare held in October/November, and in January/February ofthe following year for students who qualified to write asupplementary examination (i.e. students who have failedwith a minimum of 40%). The supplementary examinationfor semester modules is granted on the same condition but iswritten in the following session of examination.
At a residential institution a student will typically registerfor all level 1 subjects in a semester. At UNISA a student mayregister for subjects from levels 1, 2, and 3 simultaneouslyprovided that the prerequisites are fulfilled. As indicated inTables I and II, nearly all subjects/modules are offered over aperiod of a semester, while a few are offered over a full year.The remaining full-year modules are in the process of beingsemesterized. Certain subjects, for example work integrated-learning (WIL) subjects, remain full-year subjects.
The experiential learning components of the programmes,also called work-integrated learning (WIL) are divided intoseparate modules covering the required levels of theprogrammes as shown in Tables I and II. These subjects areadministered as individual modules. UNISA staff monitor theexperiential learning of students continuously throughfeedback from students and mentors, completion ofassignments and logbooks, and visits to the workplace wherepossible.
�
208 VOLUME 117

Mine surveying practicals on campus were developed tosupport the theoretical study of mine surveying subjects,since these subjects have been found to be challenging to themajority of students. This is particularly true of privatestudents, since they have never had the opportunity to visitor undergo training in a mine survey department.
Table III shows the pass rates and the number of studentsenrolled in 2012, indicating the difference between privateand professional students. The challenge faced by privatestudents transpires through their poor performance comparedwith professional students. For 2012 used as baseline, the
average pass rate of private students is only 10%, against26% for professional students.
In this section, the structure of the programme for on-campuspracticals is presented. Student performance is also reviewedin order to form a baseline for comparison before and afterimplementation of the on-campus programme.
Mine surveying practicals were implemented from 22February 2016 on the Science Campus of UNISA. The MiningEngineering laboratory and the vicinity of the campus were
On-campus mine surveying practicals
VOLUME 117 209 �
Table I
Admission requirements: A National Senior Certificate (Diploma endorsement) with at least 50% in the language of teaching and learning and with at least50% in Mathematics and Physical Science. Students who do not meet the additional requirements may follow Unisa's alternative pathway.
Purpose statement: To produce competent mining engineers whose responsibilities would include the selection and managing of the optimal mining processapplicable to the relevant mineral deposit to be mined. A qualified person with sufficient experience will be able to register with the Engineering Council ofSouth Africa (ECSA) as a Professional Technician in this field of Engineering.
First level: Group A. Compulsory
ENN103F English for Academic Purposes Semester
EUP1501 Ethical Information and Communication SemesterTechnologies for Development Solutions
MAT1581 Mathematics I (Engineering) Semester
MEP171X Mineral Exploitation I Semester
SMI181Q Science: Mining I Semester
STA1510 Basic Statistics Semester
Second level: Group A. Compulsory
CAD161S Computer Aided Draughting I Co-requisite: MED161Q Semester
ENV301E Environmental Management Semester
EWS121Q Engineering Work Study I Semester
FAC1501 Introductory Financial Accounting Semester
MAT2691 Mathematics II (Engineering) Prerequisite: MAT1581 Semester
MED161Q Mechanical Engineering Drawing I
MPR101E Mining Engineering Practice I Year (WIL)
MPR201E Mining Engineering Practice II Year (WIL)
Third level: Group A. Compulsory
EMA2601 Engineering Management II (Module A) Semester
EMA2602 Engineering Management II (Module B) Semester
MBE2601 Mineral Beneficiation II Prerequisite: MEP171X Semester
MEN2601 Mine Engineering II Prerequisite: SMI181Q Semester
MGY2601 Mining Geology II Prerequisite: MEP171X Semester
MIN2601 Mining II Prerequisite: MEP171X Semester
SAV2601 Mine Survey and Valuation II Prerequisite: MEP171X Semester
Fourth level Group A. Compulsory
EMA3601 Engineering Management III Prerequisite: EMA2601 or SemesterEMA2M1E & EMA2602 or
EMA2M2E
GMI3601 Geology: Mining III Prerequisite: MGY2601 or MGY291S Semester
MIE3601 Mine Engineering III Prerequisite: MEN2601 or MEN251W Semester
MIN3601 Mining III Prerequisite: MIN2601 or MIN201E Semester
MTS351X Mining Technical Services III Prerequisite: MEP171X Semester
SAV3601 Mine Survey and Valuation III Prerequisite: SAV2601 or SAV231Y Semester

On-campus mine surveying practicals
used for this purpose. Student attendance was optional. Thepractical sessions were run on a weekly basis from Mondayto Friday. The students who accepted the invitation to be partof the programme were received on a ’first-come first-served’basis in a group of 5 to 6 per session.
The first week of the practical sessions was devoted totraversing. The following week, students were exposed tolevelling and grading techniques. This sequence was repeatedalternately to accommodate all the students booked fortraining.
A study conducted at the University of the Witwatersrand
developed methodologies for assessing the effectiveness ofsupplemental instruction (SI). The method involves variouskinds of comparison between students who have attended agiven number (or more) of SI sessions and those who haveattended fewer than this number, or no sessions at all((Martin et al., 1992; Bidgood, 1992; Congos and Schoeps,1993), cited by McCarthy, et al., 1997). Practicals on campuscan be assimilated to supplemental instruction. Therefore thesame methodology is used in this paper for comparing theperformances of two groups of students.
The key metric used to quantify students’ performance isthe pass rate calculated after each examination period(January/February, May/June, and October/November). For
�
210 VOLUME 117
Table II
Admission requirements: A National Senior Certificate (Diploma endorsement) with at least 50% in the language of teaching and learning and with at least50% in Mathematics and Physical Science. Students who do not meet the additional requirements may follow Unisa's alternative pathway.
Purpose statement: To produce competent mine surveyors whose responsibilities (simplified) would include taking measurements upon and under the surfaceof the earth either in a horizontal or vertical plane and showing the results in the form of a map or plan applicable to the relevant mineral deposit to be mined.
First level: Group A. Compulsory
ENN103F English for Academic Purposes Semester
MAT1581 Mathematics I (Engineering) Semester
MEP171X Mineral Exploitation I Semester
MSP101R Mine Survey Practice I Year (WIL)
SMI181Q Science: Mining I Semester
STA1510 Basic Statistics Semester
Second level: Group A. Compulsory
EMA2601 Engineering Management II (Module A) Semester
EMA2602 Engineering Management II (Module B) Semester
EUC1501 End-User Computing I (Theory) Semester
EUP1501 Ethical Information and Communication SemesterTechnologies for Development Solutions
MAT2691 Mathematics II (Engineering) Prerequisite: MAT1581 Semester
MGY2601 Mining Geology II Prerequisite: MEP171X Semester
MSG211Q Mine Survey II Prerequisite: MEP171X Semester
MSP242S Mine Survey Practice II Year (WIL)
MVA231Q Mine Valuation II Prerequisite: MEP171X Semester
Third level: Group A. Compulsory
EMA3601 Engineering Management III Prerequisite: EMA2601 or SemesterEMA2M1E & EMA2602 or EMA2M2E
MSG3601 Mine Survey III Prerequisite: MSG211Q Year
MSP352T Mine Survey Practice III Year (WIL)
MVA3601 Mine Valuation III Prerequisite: MVA231Q & STA1510 Year
STG381S Structural Geology III Prerequisite: MGY291S Year
Table III
Mine Survey II 45 12 57 12% 26% 39%Mine Valuation II 68 19 87 13% 21% 33%Mine Survey III 18 12 30 27% 47% 73%Mine Valuation III 10 14 24 13% 21% 33%Mine Survey and Valuation II 90 39 129 2% 6% 8%Mine Survey and Valuation III 38 58 96 15% 38% 56%

simplicity, these periods are labelled as January, June, andOctober respectively. The official examination results are keptin the database of the academic department for each subject.These are filed as historical data for auditing purpose andstatistical analysis. They can also be obtained on requestfrom the Examination Administration Division. These twosources of information were used and consulted to compilethe pass rates over five years (2011 to 2015) for six minesurveying modules forming part of the National Diploma inMining Engineering and National Diploma in Mine Surveyingoffered at UNISA during the period under consideration: MineSurvey II and III, Mine Valuation II and III, and Mine Surveyand Valuation II and III.
Mine Survey II and Mine Valuation II were offered duringthe period under investigation as semester modules with twositting examinations June and October. Mine Survey andValuation II and III were offered as full-year modules until2013, with one examination in October followed by a supple-mentary in January. Therefore, the results for the Januarysession are combined with those of the October session fromthe previous year to obtain the overall results for each year.However, these modules were ’semesterized’ from 2014 andnow have two examination sittings – one in June and one inOctober. For semester modules, the June and October resultsare combined to reflect the results for each year. Studentswho fail in June and qualify for supplementary examinationre-write in October of the same year, or in general during thenext semester session of examination.
The principle of combining October and January resultsapplies also to Mine Survey III and Mine Valuation III, whichwere full-year modules during the entire period of investi-gation.
The pass rate is calculated as the number of students whopassed as a percentage of the number of students who wrotethe examination in each period. However, it should be notedthat all students admitted for examination do not necessarilywrite, due to the drop-out rate.
The full names of modules are presented in Tables I andII. However, for the analysis of the results, each subject isfurther described by its code as listed in Table IV.
A roster was designed for mine surveying practicals forimplementation over a year, split in the two semesters.Students had the choice to opt into two of the six sessionsscheduled per semester on the roster, shown in Table V.Three groups were formed; labelled A, B, and C.
Students’ attendance at practicals was recorded and issummarized in Table VI.
It appears that the attendance was very low, at 6%, forthe first semester. This can be explained in part by the factthat the practicals were optional. The attendees weremonitored for the duration of this research. It will be shownlater, when discussing the results, that not all studentsregistered were admitted to sitting for the May/Juneexamination period. Some of students cancelled theirregistration for financial reasons, which is one of the causesof drop-out. Some did not meet the minimum requirement ofsubmitting at least one assignment in order to gain access toexamination.
As stated prior to the analysis, the average pass rate for allthe subjects over the last five years is very low (28%), andvaries significantly from one year to another as well between
On-campus mine surveying practicals
VOLUME 117 211 �
Table IV
Mine Survey II MSG211QMine Valuation II MVA231QMine Survey and Valuation II SAV2601Mine Survey III MSG3601Mine Valuation III MVA3601Mine Survey and Valuation III SAV3601
Table V
Traversing 22/02–26/02 07/03–11/03 04/04–08/04Levelling /grading 29/02–04/03 14/03–18/03 11/04–15/04
Traversing 18/07–22/07 15/08–19/08 29/08–02/09Levelling /grading 25/07–29/07 22/08–26/08 05/09–09/09
Table VI
Mine Survey II 61 7 11%
Mine Valuation II 40 2 5%
Mine Survey III 29 2 7%
Mine Valuation III 27 1 4%
Mine Survey and Valuation II 170 13 8%
Mine Survey and Valuation III 163 6 4%
Total 490 31 6%

On-campus mine surveying practicals
the different modules. The low pass rate can be attributed tothe lack of practical experience among students enrollingdirectly from high school.
Figure 2 shows the pass rates for all the modules from2011 to 2015.
In order to assess the trend in pass rates over the periodunder investigation, separate charts with trend-lines areprovided for each module in Figures 3 and 4. Similar trendscan be observed for the other mine surveying modules asshown in Figure 2.
It can be noted that the pass rate is decreasing for all themodules except for MVA3601. This is alarming and indicatesthe need to find solutions that can help to improve thesituation.
The pass rates for all the modules over five years from2011 to 2015 are summarized in Table VII.
The number of students enrolled in 2016 was reported inTable VI. As stated previously, not all students whoregistered wrote in the June examination period, which willbe used to assess the impact of practicals on the results ofsemester’s mine survey modules MSG211Q, MVA231Q,SAV2601, and SAV3601. Table VIII shows the number ofstudents who wrote in the June examination period andtherefore indicates the number of students who dropped outfor any of the reasons mentioned.
The ratio of students writing the examination to thoseenrolled is 82%, indicating a significant rate of absence(18%) at the examination. Dropping out remains a seriousconcern for engineering studies. A study conducted at theFaculty of Engineering of the University of KwaZulu-Natalreports a similar academic drop-out rate of 14% (Pocock,
2012). An analysis of, and interviews with, a sample of thestudents who left showed that financial reasons played asignificant role, with 49% of non-academically excludedstudents having financial difficulties, and that a significantproportion of students continue their studies at universitiesof technology.
�
212 VOLUME 117
Table VII
Mine Survey II 34 39 39 6 7Mine Valuation II 28 33 39 24 19Mine Survey III 65 73 6 4 10Mine Valuation III 23 33 3 61 48Mine Survey and Valuation II 40 8 19 21 32Mine Survey and Valuation III 7 55 23 2 12
Table VIII
Mine Survey II 61 50 11 82%Mine Valuation II 40 31 9 78%Mine Survey and Valuation II 170 145 25 85%Mine Survey and Valuation III 163 128 35 79%Total 434 354 80 82%

After the inception of the practicals, it was noted that alow proportion of students attended compared to the totalnumber of students enrolled for the year and the firstsemester. From Table VI, a total of 31 students, representing6% of the total enrolled, attended. A further investigationshows that out the 31 students, only 19 students wrote theJune examination, which represents 5% of the cohortexamined, as illustrated in Table IX.
To assess the impact of practicals, the pass rates ofstudents who attended are compared to those who did notattend. The average pass rate of students who attended is46%, while it is 39% for the other group. A single factoranalysis of variance (ANOVA) was performed usingMicrosoft Excel to test the hypothesis that the means of thetwo groups are equal. The result of the test is summarized inTable X.
The terms from Table X have the following meanings inthe test as performed using the data analysis tool in Excel: SS= Sum of Squares, df = Degree of freedom, MS = Meansquare, F = Test statistic, and F crit = the critical value of thetest. In concluding the test, F < F crit means that we fail toreject the hypothesis that the two means are equal. In otherwords, the sample evidence is not strong enough to warrantrejection of the null hypothesis.
The individual pass rates for the modules written in theJune examination are shown in Table XI. A noticeableimprovement is evident compared to the previousexamination period.
The improved pass rate among students who attended the
practical sessions can be regarded as an incentive to makethe mine surveying practicals compulsory in future whileintegrating them to the current learning and assessment.
Is the overall and partial pass rate increase compared tofive previous years attributable to practicals? Considering theamount of information available at this stage, it would bepremature to give a definite answer. Therefore it isrecommended that the scope of the investigation be extendedbeyond one year and to cover various cohorts of students.
The results of this study constitute an incentive to make themine surveying practicals compulsory in future whileintegrating them with the current learning and assessment.One consequence of this would be the training of well-rounded technicians with sought-after skills for the SouthAfrican mining industry.
On-campus mine surveying practicals
VOLUME 117 213 �
Table X
Students who attended 19 864.08 45.478 428.06Students who did not attend 335 13211 39.437 326.3
Between groups 656.24 1 656.24 1.9796 0.1603 3.86801Within groups 116689 352 331.5Total 117345 353
Table XI
Mine Survey II 24 26Mine Valuation II 29 68Mine Survey and Valuation II 25 50Mine Survey and Valuation III 20 22Average 25 36
Table IX
Mine Survey II 50 4 8% 26% 8%Mine Valuation II 31 0 0% 68% 134%Mine Survey and Valuation II 145 10 7% 50% 100%Mine Survey and Valuation III 128 5 4% 22% 10%Total 354 19 5% 36% 44%

On-campus mine surveying practicals
The findings in this paper are limited to UNISA. However,it would be interesting to investigate and compare theperformance of students in surveying disciplines at otherinstitutions in South Africa and internationally. In thisregards, attempts were made to collect statistical informationfrom neighbouring institutions (in South Africa), but datacould be not be obtained before this paper was submitted forpublication. The same challenge may arise when dealing withinstitutions abroad.
In the opinion of the author, a more detailed paper canpresented in the future that can shed light on what ishappening elsewhere with teaching and learning ofgeomatics.
The author would like to thank the Examination Departmentof the University of South Africa for providing the statisticsused in this work.
Special thanks to the Department of Electrical and MiningEngineering for support throughout the execution of theresearch work.
MCCARTHY, A., SMUTS, B., and COSSER, M. 1997. Assessing the effectiveness ofsupplemental instruction: A critique and a case study. Studies in HigherEducation 22, no. 2: 221–31.
POCOCK, J. 2012. Leaving rates and reasons for leaving in an engineering facultyin South Africa: A case study. South African Journal of Science, vol. 108,no. 3–4. pp. 60–67.
TRIOLA, M.F. 2005. Essentials of Statistics. Pearson Addison Wesley, Boston,MA.
UNISA. 2016a. Directorate: Information and Analysis (DIA), Information andInstitutional Analysis Portal, Unisa, http://heda.unisa.ac.za/indicator-dashboard/default.aspx [Accessed 5 July 2016]
UNISA. 2016b. Learning Management System (LMS)-myUnisa,http://www.unisa.ac.za/sites/default/
UNISA. 2016c. MyRegistration@Unisa. College of Science, Engineering andTechnology (online brochure). https://registration.unisa.ac.za/info/[Accessed 25 April 2016].
UNISA. 2016d. XMO - examination marks online. (Intranet).http://www2.unisa.ac.za/AOL/XMO/
UNISA. 2014. Self-evaluation portfolio: National Diploma in Mine Surveying,2014 (unpublished). �
�
214 VOLUME 117
AMI Precious Metals 2017THE PRECIOUS METALS DEVELOPMENT NETWORK (PMDN)
In Association with Platinum 2017
advanced metals initiative
3 ECSA
CPD points
will be allocated
to all attending
delegates
17–20 October 2017Protea Hotel Ranch Resort, Polokwane, South Africa
BACKGROUNDThe Precious metals Development Network (PMDN) of theDST’s advanced metals initiative (AMI) programme will hostthe AMI’s annual conference in 2017.
The AMI Precious Metals 2017 Conference will be heldin association with the Platinum 2017 Conference. The Platinum conference series has covered a range of themessince inception in 2004, and traditionally addresses the opportunities and challenges facing the platinum Industry.
This AMI Precious Metals 2017 Conference will present aforum where scientists and technologists can come together
to learn and discuss the latest advances in precious metals(platinum group metals and gold) science and technology,under the broad themes of: � Catalysis � Materials � Chemistry
For further information contact: Head of Conferencing, Raymond van der Berg • Tel: +27 11 834-1273/7 • E-mail: [email protected]
our future through science
The Witbank coalfield in MpumalangaProvince holds one of the largest coalresources in South Africa and the rest of theworld . Both export and domestic coal areproduced from various mines in the coalfield.The study was based on one of the mines,which produces both export coal and domesticcoal which is supplied to a nearby Eskompower station. The mine is currently miningpillars from a previous underground bord-and-pillar operation as well as a virgin coal seam.The pillars are extracted using a surfacemining method referred to as opencast pillarmining, with an aim of maximizing coalrecovery from the pillars. The selection anddesign process of the opencast pillar mining
method was also influenced by the coalproduction rates and demand from the powerstation. Three seams are being mined; the no.4 lower seam (S4L), no. 2 seam (S2), and theno. 1 seam (S1). The S4L and S1 are virgincoal seams while the S2 resources consist ofpillar coal remaining from a previousbord-and-pillar operation that reached its endof life in the 1980s. The underground minewas operated using the conventional drill-and-blast, bord-and-pillar mining method. Thepillars were left intact when the undergroundoperation was shut down.
In 1995, a project to extract the remainingpillars was started as part of an initiative toextend the life of the mine. The extraction ofthe pillars was found to be economicallyfeasible due to the good quality coal remainingin the pillars (Table I). Overburden removalbegan in 2000 using a truck-and-shovel fleet.This was an initial and experimental approachwith the intention of exploring the risksassociated with the pillar mining method,which was uncommon at that time. The truck-and-shovel operation included cleaning aroundthe pillars, which resulted in extensive coallosses. Due to the size of the equipment it waspossible to dig the pillars without the need forblasting. It was then decided to implement adragline operation together with the truck-and-shovel fleet to overcome challenges withstability and spontaneous combustion on themidburden bench above the mined-out pillars.The first dragline was introduced in 2004. Theuse of the dragline was not part of the originaldesign, and it was introduced only after it wasidentified as a lower risk operation comparedto the truck-and-shovel fleet on themidburden.
Factors and challenges affecting coalrecovery by opencast pillar mining inthe Witbank coalfieldby P.L. Ngwenyama*, W.W. de Graaf*, and E.P. Preis*
The depletion of coal reserves in the Witbank coalfield in MpumalangaProvince has resulted in mining companies exploring the possibilities ofextracting coal pillars. These are pillars that were left behind forhangingwall support during underground bord-and-pillar operations.Recent studies of in situ pillar mining have found the extraction of thepillars to be feasible during opencast mining due to the high extractionrates of coal, relatively low stripping ratio, safety of the operation, andgeneral environmental requirements. The geological model of an opencastpillar mining operation within the Witbank coalfield has indicated thatsome 30% of the coal in the no. 2 seam remains in pillars. The no. 4 andno. 1 seams are yet to be mined. Opencast pillar mining requiresmaximizing coal recovery in order to be competitive in the market, since aportion of the resource has already been extracted. Exposure and recoveryof the coal are crucial in reducing coal losses and dilution due to the coalpillars and voids, and challenges experienced during the mining of pillarsfrom surface. The reconciliation process evaluated the overall flowprocesses, from in situ coal to the mined-out coal. The similarities betweenopencast pillar mining and conventional opencast mining were studied interms of the mining sequence, pit layout, and operations. A correlationbetween the SAMREC Resource and Reserve definitions was conductedthrough an investigation of coal losses and contamination during mining.The various types of coal losses affecting production volumes wereinvestigated. The dilution of coal was found to be higher in the no. 2 seamdue to blasted material filling the voids in the bords. The presence of bordvoids is one of the factors that increases the risk of spontaneouscombustion. This in turn affects the productivity of the operation, withbuffer blasting management and cladding techniques used to reduce therisk of spontaneous combustion.
coal recovery, pillar extraction, opencast mining, coal losses.
* Department of Mining Engineering, University ofPretoria, South Africa.
© The Southern African Institute of Mining andMetallurgy, 2017. ISSN 2225-6253. This paperwas first presented at the New technology andinnovation in the Minerals Industry Colloquium’,9–10 June 2016, Emperors Palace, Johannesburg,South Africa.
215VOLUME 117 �
http://dx.doi.org/10.17159/2411-9717/2017/v117n3a2

Factors and challenges affecting coal recovery by opencast pillar mining in Witbank
The S2RPB seam comprises three horizons: the S2R (no. 2 seam roof coal); S2P (no. 2 seam pillar coal); and S2B(no. 2 seam bottom coal). The S1 seam is separated from theS2RPB seam by parting material that varies between 0.1 mand 28.0 m in thickness across the Witbank coalfield, and isapproximately 7.0 m thick on average. The S1 seam isextracted together with the S2RPB seam where the parting isvery thin. The extraction of the pillars was found to befeasible through the use of opencast mining methods due tothe low stripping ratio, high recovery and extraction rate, andenvironmental and safety factors. This seam split was afunction of the different products, with the pillar coaldestined to produce export-type coal products and the roofand floor coal used in the adjacent power station after benefi-ciation in a separate plant. The pillars of the S2 seam in theground are depicted in Figure 1.
The S2RPB seam, simply referred to as the S2RP seam,was of major concern due to the potentially disturbed anddeteriorated conditions of the pillars since the undergroundworkings stopped some years ago. The geological polygon ofthe mine indicated that some 30% of the coal remains in thepillars and as remnant coal in the roof and floor of theprevious underground workings. The amount of coalremaining in the pillars was determined from the arealextraction ratio and the average mining height (seamthickness). The average mining height was taken intoaccount due to the inconsistencies in the seam thickness. Insome areas, roof and floor coal had been recovered, but thiswas not always indicated on the survey plans. This discoverywas based on recent exploration activities preparatory to theexploitation of the pillars. Investigations were conductedmainly to establish wash plant parameters in the initialdesign, while the volumes of the floor and roof remnantswere calculated from survey plans of the previous operation.As physical access to the workings was not possible, allinformation had to be obtained from survey plans, which arenot always accurate, and from earlier exploration boreholes,which were not subjected to wash analysis as is donecurrently. The pillars and remnant coal of the S2RP seamsituation are illustrated in Figure 2.
When bord-and-pillar mines reach their end of life, coalpillars are inevitably left unmined. A forecast can be made asto the feasibility of effective, efficient, and responsibleutilization of the reserves remaining in previously mined-outareas (Schalekamp, 2006). The underground conditions mayhave changed with time, and this makes it difficult to predictthe underground conditions. Jeffrey (2002) investigated thegeotechnical factors that influence secondary extraction inpreviously mined-out coal seams. The current undergroundconditions of opencast pillar mining operations are expectedto be as illustrated in Figure 2, but cannot be definedaccurately, because underground access was sealed off;
however, the old survey plans have proven to be accurateenough for volume calculations. Understanding the coalvolumes is crucial for maximizing coal recovery. This wasdone by evaluating the variations between theoretical andactual mined volumes.
The global coal industry loses about US$480 million(R5.5 billion) annually in revenue (Thompson, 2005) due tocoal losses in the mining process and contamination. The coalprice in 2005 was about US$45 per ton (InfoMine, 2015),which means that approximately 10.7 Mt of coal was lost.Coal losses are therefore a major concern for pillar miningoperations, since only 30% of the original coal reservesremain underground as old pillars in the no. 2 seam. Coallosses affect operational revenue and are included in thecurrent operating costs. It is thus critical for operations tostrive for maximum recovery of reserves (Johnston andKelleher, 2005). The extraction of pillars through normalopencast mining methods has been found to be afundamental factor leading to high dilution. The high dilutionis due to the large bord voids between the pillars, and this isa major concern in terms of the operating costs, especially theprocessing plant operating costs. The main aim of collapsingthe bords, which incurs high dilution, was to maximize coalrecovery, while the washing plant would remove waste fromthe ROM coal. The mining of pillars from surface causes air topenetrate the old workings, resulting in spontaneouscombustion, which is one of the big challenges in opencastpillar mining operations. Spontaneous combustion causes insitu coal to burn, and this decreases coal quality andquantity, and leads to the emission of noxious gases. Thecontinuous burning of coal in the pit also produces large
�
216 VOLUME 117
Table I
No. 4 seam 2.3 24.6 22.7No. 2 seam (S2RPB) 4.0 24.9 22.1No. 1 seam 2.3 23.9 25.9

volumes of dust, dark smoke, and harmful gases duringwaste removal, which has a deleterious impact on produc-tivity and the environment. A large portion of the dust iscreated during dumping on the low-wall side.
Opencast pillar mining follows a similar layout and strippingsequence to conventional opencast mining. The similarities ofthe two methods are mainly due to the dragline operation.Equipment selection was influenced by the risks of opencastpillar mining, particularly spontaneous combustion. Thedragline is allowed to mine only one bench at a time beforemoving to the next strip. Exposure of multi-seams at adouble bench pass is risky in pillar mining. Hence thedragline on a multi-pass single bench method is preferred inpillar mining operations, while the dragline on a multi-passdouble bench is applicable in conventional opencastoperations. There are minor differences in the layout of thetwo methods; for example, opencast pillar mining makes useof a 30.0 m wide blasted buffer to prevent spontaneouscombustion and sinkhole formation. Buffer blasting was, andstill is, the most effective technique for containingspontaneous combustion. It may not prevent spontaneouscombustion completely, but will significantly retard theprocess.
The buffer is indicated by the dashed blue outline inFigure 3. This is carried over to the next strip of extraction.Cladding is provided by cast-blasting the overburden to coverthe edge of the highwall, thus filling the bords and creatingthe buffer. The mining sequence is similar to the strippingsequence in conventional opencast:
� Removal and stockpiling of topsoil material� Drilling, charging, and blasting of overburden� Push over and pre-stripping of overburden using truck
and shovel operation� Stripping of blasted overburden with dragline� Extraction of S4L coal seam� Drilling, charging, and blasting of mid-burden� Stripping of midburden with dragline� Free digging of S2RP seam coal and blasting of hard
pillars� Drilling, charging, and blasting of S1 parting � Extraction of S1 coal seam.
Buffer management and cladding techniques wereimplemented to minimize or prevent the continuous burningof coal in the ground. The old pillars are only in the S2RPseam, and are approximately 7.0 × 7.0 m, with a bord widthof 6.1 m between the pillars. There are larger pillars in certainblocks, referred to as barrier pillars during the bord-and-pillar operations. The orientation of the pillars was designed
to cut across the strips at an angle, and not parallel to thestrips. Thompson (2005) mentioned that this was aimed atincreasing the stability of the highwall side or edge. Whenthe pillars are at an angle, the highwall edge will always besupported by pillars, thus preventing the highwall fromhanging unsupported above the bords. This also preventedlarge open spaces being left between two pillars. The risk offlooding from water accumulation in the panels also had aninfluence on the initial orientation direction of the pillars. Aplan view of the pillar orientations relative to strip direction isshown in Figure 4.
Reserve models are built and scheduled from a Resourcemodel to determine the profitability of a mine by accountingfor realistic factors that may affect the operation, such as coallosses and dilution. The Resource and Reserve models arebased on theoretical calculations. The theoretical calculationsare put in place to accommodate wide ranges in coal qualities.These differences are corrected or modified by surveyvolumes that show the real volumes. Losses, dilution, andcontamination are critical parameters as they play a majorrole in the Resource to Reserve conversion process. Thesefactors act as intermediary factors between Resources andReserves, as well as in moving from mineable in situ andrun-of-mine to saleable Reserves.
There are three main parameters that should beconsidered, according to the SAMREC Code:
� Mineable in situ Coal Reserve—The tonnages andquality of the coal at a particular moisture contentcontained in the in situ coal seam. This portion of theMineable Reserve is used in conceptual and detailedmine planning. The mining method and planned lossesare determined at this stage
� Run of Mine Reserve (ROM)—Run of Mine Reservesare based on the Mineable in situ Reserves. This is theactual amount of coal expected to be extracted anddelivered to the plant, usually over a particular timeperiod. The Run of Mine Reserves are the tonnages andcoal qualities remaining once the following factors havebeen accounted for:
– Coal losses during mining– Dilution and contamination– Moisture content of coal – Others, such as geological losses
� Saleable Coal Reserve—The actual tonnages with aparticular quality that will be available for market sales.This is calculated from the ROM tonnages afterwashing and beneficiation to the required productquality.
Factors and challenges affecting coal recovery by opencast pillar mining in Witbank
VOLUME 117 217 �

Factors and challenges affecting coal recovery by opencast pillar mining in Witbank
According to the SAMREC Code, the estimation ofReserves and Resources in previously mined workings is verycomplex compared to virgin coal grounds. This is due to thenecessity of considering and accounting for the previouslyextracted voids. The currently unknown conditions of thestanding pillars underground makes it difficult to build theReserve model by predicting the applied losses. Schalekamp(2006) explained that a proper and accurate reconciliationbetween planned and actual mineable tonnages requires anextensive survey. However, he noted that it is difficult toconduct physical surveys due to the risks of working directlyabove blasted and collapsed old workings. The presence ofspontaneous heating also makes the risk of surveying morecomplex in those areas, and semi-collapsed and uncollapsedvoids pose further risks. The major challenge is theestimation of the top of coal losses, while highwall and edgelosses are easier to estimate.
A review of the Resource (geological) versus Reservemodel of the mine was conducted to perform a coal massbalance (Figures 5–7). This was done to ascertain whethercoal losses and dilution are correctly utilized, especially onthe S2RP seam. The no. 2 seam contains voids that becomefilled with waste from midburden blasting. The dilution wasthen calculated, theoretically and from plant data, to beapproximately 20%. This is a theoretically calculated valuethat could not be physically measured. The data was basedon portions of strips that are currently being mined, andthose that are scheduled to be mined in the next two to threeyears. The Reserve was built from the geological model data,which was obtained from the GEMCOM Minex Software usedto create the Resource models, by applying some assumptionsas modifying factors for the conversion process (Table II).The modifying factors were applied for the three seams beingmined.
Figure 6 and Figure 7 indicate that there is no constantcorrelation or relationship between the Resources andReserves of the S2RP and S1 seams as compared to the S4L(Figure 5). Figure 6 shows the Resource of the remainingpillar and remnant coal versus the Reserve, taking intoaccount the expected dilution from collapsing the bords. TheReserve is greater than the Resource because the dilution willbe higher than the potential losses. The dilution factor maybe reduced by the presence of large barrier pillars, while thelosses remain constant. This causes the interchanging of theResource and Reserve tonnages on the S2RP seam. Theinterchange between the Reserve and Resource tonnages inFigure 7 is influenced by the fact that the S1 seam issometimes mined together with the parting. The parting isblasted together with the S1 seam where its thickness is lessthan 0.5 m, and separately where the thickness is greaterthan 0.5 m. The relationship between the Reserve and
Resource is depends mainly on the dilution and coal lossfactors:
[1]
There are other factors considered in the Reserve model,such as inherent moisture content. These other factors wereregarded as minor because they do not affect the relationshipbetween the Resource and Reserve. For example, the averagemoisture content was estimated to be approximately 2.5% forall seams. Total moisture content is known to have an effecton coal recovery. The study was limited to losses anddilution; these are the two factors that contribute the most inthe Reserve model, and can be estimated based on experienceor benchmarks, and measured. These two factors can bemeasured through survey reports and from plant beltweightometer measurements, but both methods are open toerrors. In principle, the Reserve tonnages should be consis-tently more or less than the Resource tonnages. An increasein the dilution factor resulted in an increase of Reservetonnages, while losses decreased the Reserve tonnages.
�
218 VOLUME 117
Table II
S4L 5 5 0 7 5 5 0 0 7S2RP 2 0 2 5 2 0 2 20 5S1 5 5 2 7 5 5 2 0 7

However, the dilution factor has to be kept within allowablelevels. If the dilution is too high the following ensues:
� Tonnages to be mined and processed increase, henceoperating costs increase
� Quality of coal decreases� Time of operating increases.
In general, dilution is defined as the percentage of non-coalmaterial that is unintentionally blasted and loaded togetherwith coal and delivered to the plant. The selected miningmethod uses a blasting technique called bord collapse, whichintentionally allows the occurrence of high dilution bycollapsing the bords. One of the main reasons for collapsingthe bords is to maximize coal recovery. Baruya (2012)explained that dilution affects the quality of coal in themining process. Reserve models take into account theamount of dilution that is expected during mining activities.
The quantification of dilution requires that wastehandling is controlled and reduced by understanding its rootcauses. The factors that affect dilution are as followsaccording to Ebrahimi (2013):
� Characteristics of the deposit � Method and scale of operation � Types and size of equipment� Operator skills and overall mine geometry.
It is necessary to quantify dilution in order to improve thedesign of a mine and evaluate project economics (Ebrahimi,2013). According to the Reserve model, that there will be 5%roof and floor dilution for the virgin coal seams and 20% forthe S2RP seam due to the bords. The high dilution in theS2RP seam is a result of the waste material that falls into andfills up the bords after blasting the midburden.
Figure 8 shows the variation in dilution in a pillar miningoperation. It should, however, be noted that this data is for ablend of the three seams. The run of mine (ROM) volumesentering the plant are divided into three products, namelyfines material, which is sent to slimes dams; reject material,which includes coal material that is below the cut-off grade;and product, which is the tonnages on the weightometer. Thevariation in data between the pit and plant has beenattributed to the manner in which dilution is measured andcalculated.
Figure 8 represents the percentage of discard materialrejected by the processing plant from monthly ROM tonnages.The majority of the dilution material is expected to begenerated from collapsing the bords in the S2RP, while therest is expected from the top of the seam, bottom of the seam,and edge of the seams during operations in the Reservemodel. However, it was noted that the data from the plantmay include a blend of the three seams, losses from finesgoing into slimes dams, reject coal, and coal below qualitycut-off. The dilution of the S1 and S4L seams was relativelyeasy to estimate, while the S2RP seam dilution could not beeasily defined. The following factors and assumptions weretaken into consideration in theoretically determining thedilution factor for the S2RP seam:
� The pillars remain intact after blasting the midburden� The roof coal above the bords is semi-collapsed after
blasting the midburden and falls directly into the voids(see Figure 9)
� Scaling of the pillars remains unchanged or the fall-outs accumulate on the floor with the tonnagesremaining the same
� The blasted material increases in volume by 60%.
Measuring and estimating dilution can be attributed by avariation in data. Determining the exact amount of dilutionwould require continuous measuring from the plant data, pitdata, as well as over an extensive area.
The blasted midburden is allowed to fall above the pillarsand thus fractures the roof coal, which is approximately 1.0 m thick. The midburden is drilled to the top of the roofcoal to limit the air entering the old workings. It was initiallypredicted that the roof coal would fully collapse directly intothe voids, while the pillars remained intact. It was thennoticed that the roof coal is actually semi-collapsed by themidburden material after blasting. This can be seen in Figure 9, which illustrates the two collapse scenarios for theroof coal.
The ideal scenario depicts the manner in which the roofcoal and pillars were expected to collapse. It was assumedthat the blasting of the midburden would fully collapse theroof coal above the bords, allowing it to fall directly in thebord void. In this scenario the roof coal above the bord ispushed to the floor and is fractured. The bord voids arecompletely filled with midburden material.
The actual scenario depicts the situation whereby the roofcoal above the bords is semi-collapsed as the midburden isblasted, leaving some unfilled voids. The roof coal becomesmixed with the blasted material during the collapse. Thebords are always collapsed, but in some cases the roof coal inthe bords may not be fully or perfectly collapsed. Thissituation remains unchanged even when the draglines worksabove the pillars. The voids caused by the semi-collapse ofthe roof coal allow air to penetrate the undergroundworkings, resulting in spontaneous combustion.
[2]
Factors and challenges affecting coal recovery by opencast pillar mining in Witbank
VOLUME 117 219 �

Factors and challenges affecting coal recovery by opencast pillar mining in Witbank
The actual dilution in the S2RP seam is approximately21.0%, which is 1.0% higher than estimated in the Reservemodel. The main aim of building the Reserve model was toestimate conditions after blasting, exposure, and extraction.The dilution decreases to 19% in areas surrounded by barrierpillars. The amount of dilution in the actual scenario isreduced because of the unfilled voids. Dilution increases theROM coal quantity while effectively reducing the calorificvalue and quality of the coal (Baruya, 2012). Mines will tendto increase dilution and encounter greater challenges ofdilution when seeking to maximize coal recovery from thecoal Reserve. This does not apply in cases where the plant isused to remove contamination, but only in cases where thecoal is not beneficiated.
Mining operations expend huge sums in capital and operatingcosts for the extraction of resources. Several processes arecarried out before coal extraction begins. A Reserve model isbuilt to accommodate any potential losses and dilution duringextraction.
Figure 10 shows the variance between the tonnages ofcoal in Reserves, which are converted from the theoreticalResources, and the actual amount of coal exposed andrecovered per mining block as measured by the surveyor.This data was obtained over various individual mining blocksfor which survey reports had indicated significant losses.
Figure 10 shows that a significant amount of coal wasnot recovered during the mining processes. In principle, theamount of coal recovered (actually mined) and the Reservecoal should be roughly the same. This is because the Reservemodel is constructed to accommodate these potentialResource losses and dilution. These variances indicate thatsome valuable coal is lost during the extraction process. Fieldinvestigations were carried out to determine the types of coallosses that occur in the pit. The types of losses and averagetonnage loss per mining block for the three seams are shownin Figure 12. A proposed coal process flow model that showsthe stages through which the coal proceeds is shown inFigure 11.
Figure 11 illustrates the random occurrence of differenttypes of coal losses in individual mining blocks for the threeseams. The diagram shows the worst cases of recorded coallosses that were encountered in certain individual andrandom mining blocks. The losses were found to have verylow occurrence rates.
Geological and geotechnical losses occur naturally andrandomly across all seams and cannot be physicallyprevented. The geological losses are dominant on the S1seam due to mining blocks being partially mined or leftunmined as a result of the parting being above cut-offthickness. The parting material is situated above the S1 seamand makes it difficult or uneconomical to extract the seam incertain blocks.
Highwall losses occur as a result of underbreak on thehighwall. There is potential for recovering these losses on thenext strip if the exposure is dedicated and prepared for therecovery as buffer blasting is also in place. However, thereare risks involved in doing so because this can result ingreater losses and damage. The Reserve model does not takehighwall losses on the S4 into account because of theimplementation of pre-split blasting on the upper 4 seambench. These losses are higher on the S2RP and S1 than the
S4L because the midburden is not pre-split blasted. The rockproperties have an influence on the effectiveness of pre-splitblasting. Pre-split blasting is better suited for hard materialthan for oxidized or weathered overburden material.
Figure 13 illustrates the occurrence of highwall losses.Highwall blasting with respect to pre-split blasting should bereviewed and monitored frequently in order to reducehighwall losses. The implementation of accurate pre-splitblasting procedures is the key to the minimization ofhighwall losses. The pre-split is blasted only on theoverburden (S4L seam), and not on the midburden which sitsabove the pillars.
Edge of seam/low-wall losses occur due to a collapse ofthe spoil. The spoil material begins to roll down and startscovering the edge of the seam on the low-wall side. This isdue to increased volume of stripped material. Edge lossesincrease with depth from the S4L to the S1, thus S4L edgelosses << S2RP edge losses << S1 edge losses. This resultsfrom the increase in the volume of the stripped material. Thisis noted in the vicinity of ramps or corners in the pit wherethere is limited space for spoil material.
Attempts to recover edge of seam losses are strictlyprohibited due to the risks associated with disturbing spoil,which can collapse, resulting in increased edge of seamlosses. Correct parameters, such as the amount of material to
�
220 VOLUME 117

be exposed, positioning of draglines (total distance of reachof dragline), and positions of access ramps can prevent edgeof seam coal losses. Another method is to create a 5.0 m widevoid at the edge of the seam as a safety measure foroccasionally collapsing spoil. The void can alternatively beused in areas where there are high volumes of material to beexposed. For localities with limited spoil area, such as ramps,the void can be deepened where necessary. A review on thepre-stripping of the overburden can be conducted to reduceand eliminate the occurrence of edge of seam coal losses.
Scalping or top of coal seam losses. The dragline bucketstarts scalping the top of the coal seam during exposure,which results in losses. This can be quite significant duringthe night shift as the visibility of the interface between wastematerial and coal is affected. The hardness of the coaldetermines the rate of this loss. The S4L seam is generallysofter, hence is subject to higher scalping losses, whereas thehardness of the S2RP and S1 prevents large scalping losses.The scalping losses in this case decrease with depth, thusS4L scalping losses >> S2RP scalping losses >> S1 scalpinglosses.
The top of coal losses are indicated by the purples lines inFigure 15, where green represents some geological losses.Top of coal losses during exposure can be effectivelymanaged through careful dragline operation. With thefunctional capabilities of draglines and the known depths ofthe seams, a digging limit with reference to the seam depthshould be implemented on the draglines to prevent scalping.The S4L is still virgin coal and thus scalping losses in pillarmining and conventional mining should not be different.
Floor losses result when coal is left on the floor. Floorlosses were found to be minimal across all seams. Credit canalso be given to the efficiency of operators in the extractioncrew. The occurrence of floor losses depends on the ability ofthe loader or excavator bucket to penetrate the bottom of theseam. Water accumulation affects the visibility of the bottomof the seam, and the loader operator may struggle to see coalremaining on floor. However, floor losses are often marginal.
Figure 16 displays a sectional view summarizing thedifferent coal losses as described above.
Preventative strategies need to be implemented in orderto minimize coal losses. These could include non-technicalstrategies, which influence the overall productivity ofworkers. Operators are working directly with the coal in thepit and can play a major role in the prevention of coal losses.Operators should be familiarized with the effects of coallosses and dilution. Refresher courses where operators aretaught about the influences of coal losses in the miningbusiness can be implemented. The courses should also beaimed at training operators, such as dragline and loadersoperators, to distinguish the types of material by colour,hardness, or other properties.
The stages that the coal goes through (from in situ to theplant) are illustrated in the proposed coal recovery model inFigure 17. The factors associated with each stage orprocesses are also highlighted. Some coal losses occurthrough blast damage to the coal seams, when the coalbecomes locked up with the overburden material during theblast. Guidelines for the drilling and blasting cycle should beprovided, and compliance with working procedures should bewell supervised. The workers and operators should beacquainted with the relevant working procedures. Forexample, the blasting crew should understand the reasons for
backfilling over-drilled blast-holes, and the drill operatorsshould understand the reasons for re-drilling an under-drilled blast-hole.
Scott and Wedmaier (1995) investigated the sources ofcoal losses and dilution. Coal losses have a direct relationshipto dilution. It was concluded that the roof of the seamexperiences more losses than dilution, while there is moredilution than losses at the bottom of the seam (Baruya,2012). The following were identified by Baruya (2012) as themajor factors influencing the occurrence of coal damage,losses, and dilution:
� Blast damage: during blasting operations of theoverburden, mid-burden, and parting material at thetop of the coal seam
� Type of equipment used (draglines versus truck andshovel) for coal exposure
� Extraction method and equipment: loader and truckextraction method and size of the equipment
� Equipment movement on top of coal � Geometry of the top of coal and floor conditions: the
deposition of the coal seams relative to the horizon-tality of the surface
� Coal properties: hardness and colour of the coal seam� Operator experience and visibility
Factors and challenges affecting coal recovery by opencast pillar mining in Witbank
VOLUME 117 221 �

Factors and challenges affecting coal recovery by opencast pillar mining in Witbank
� Presence of water in the coal exposure and loadingactivities.
Opencast pillar mining can be widely affected by spontaneouscombustion. Spontaneous combustion in coal mines is simplythe oxidation of self-heated coal, resulting in burning of insitu coal (Eroglu and Moolman, 2003; Phillips et al., 2011).Spontaneous combustion affects the calorific value of coal,leads to the emission of noxious gases, and contributes tocoal losses both directly and indirectly. The direct lossesoccur as coal continues to burn in the ground, and the valueand quantity of the coal is decreased. The indirect losses are aresult of the effect of burning coal on productivity.due to:
� Relatively complex hot-hole blasting procedures� Excessive dust generation during exposure activities,
which affects visibility during dragline operations� Delays (such as treating hot holes and extinguishing
open fires) due to spontaneous combustion that affectproductivity and operating costs
� Reduced stockpiling as burning coal is sent directly tothe plant
� Risk of people and machines working close to burningareas.
The basic principle in controlling and preventingspontaneous combustion is to eliminate one of the requisitecomponents – fuel, heat, and oxygen. Fuel (coal in this case)and heat from underground self-heating cannot be eliminatedin practice. While there are various ways in which oxygencan ingress the underground self-heated coal, oxygen seemsto be the key issue in dealing with spontaneous combustion(Eroglu and Moolman, 2003). Spontaneous combustion willfurther contribute to coal losses if air continuously penetratesthe old workings. The quality and quantity of coal is affectedby spontaneous combustion. Spontaneous combustionnecessitates the need for specialized techniques such as hot-hole blasting, buffering, and cladding. Excessive dust isencountered during dragline exposure activities as a result ofburning coal and this affects the productivity of the operationas a whole. The presence of dust increases dragline cycletimes, hence lowering productivity.
The occurrence of spontaneous combustion can beeffectively prevented and well managed through the use of abuffer and cladding blasting. These two techniques wereinitially used separately, but there were still signs ofspontaneous combustion. It was then decided to combine thetwo techniques for the same purpose, as shown in Figure 18.
The cladding technique is used to minimize the entry ofoxygen into the bord areas. The blasted muck-pile covers theno. 2 seam pillar coal with oxidized overburden material. Adozer may be used to push over more material to make surethat the area is sealed off completely. The buffer managementtechnique ensures that the voids are completely filled withnon-combustible material to limit entry of oxygen into thebord voids. These techniques have proven to be successful inthe elimination and prevention of spontaneous combustion,and have the following benefits:
� Reduction of direct coal losses� Improved productivity� Reduced hot areas and hence a minimization of the use
of hot-hole blasting procedures� Control of the risks to people and equipment associated
with loading of burning coal� Healthier and safer working conditions.
Opencast pillar mining is fairly similar to conventionalopencast mining in principle; however, it entails variousunique challenges. Opencast pillar mining is faced with therisks of spontaneous combustion, coal losses, high dilutiondue to the bords, imperfectly known conditions, andinaccurate plans of the old workings. Mining of old pillars is,however, viable due to the good quality coal in the pillars.The consequences of dilution and coal loss in pillar miningmethods are more severe than in conventional opencastmining. This paper has shown that coal recovery can beimproved if the process plant is capable of handling largeamounts of dilution material. If this is not the case, theoperation should attempt to mine accurately to avoid dilution,but this may result in coal losses. The flow of the coal processwas investigated from in situ geological tonnages up to thepoint that the coal reaches the process plant. This procedureindicated errors and inaccuracies in the data measuringpractices. Various types of coal losses were investigated, andcertain types of losses were found to be influenced by themining of old pillars, such as coal lost due to spontaneouscombustion and flooding of the old workings. The impact ofthe factors and challenges of opencast pillar mining on coalrecovery can be managed to prevent adverse effects onproductivity, minimize coal losses, and control dilution.
BARUYA, P. 2012. Losses in the coal supply chain. IEA Clean Coal Centre,London, UK.
EBRAHIMI, A. 2013. The importance of dilution factor for open pit miningprojects. Proceedings of the 23rd World Mining Congress, Montreal. CIM,Montreal.
EROGLU, N. and MOOLMAN, C. 2003. Development methods to prevent and controlspontaneous combustion associated with mining and subsidence. Coaltech2020. Division of Mining Technology, CSIR.
INFOMINE. 2015. http://www.infomine.com/investment/metal-prices/coal/all/JEFFREY, L.S. 2002. Geotechnical factors associated with previously mined areas
of coal and their impact on subsequent extraction. MSc thesis, Universityof the Witwatersrand.
JOHNSTON, S.N. and KELLEHER, M.L. 2005. Keep the cream - reconciling coalrecovery at BMA Goonyella Riverside. Proceedings of Coal 2005: CoalOperators' Conference. Aziz, N. (ed.). University of Wollongong and theAustralasian Institute of Mining and Metallurgy. pp. 161–168.
MINE X COLLIERY. 2015. Survey plans, Resource and Reserve models, Processplant data, and Internal reports and presentations.
MINE X COLLIERY PERSONNEL. 2015. Personal communications.PHILLIPS, H., ULUDAG, S., anD CHABEDI, K. 2003. Prevention and control of
spontaneous combustion. Best practice guidelines for surface coal minesin South Africa. Coaltech 2020. Division of Mining Technology, CSIR.
SAMREC. 2009. South African Mineral Resource Committee. The South AfricanCode for Reporting of Exploration Results, Mineral Resources and MineralReserves (the SAMREC Code). 2007 Edition as amended July 2009.http://www.samcode.co.za/downloads/SAMREC2009.pdf
SCHALEKAMP, E.E. 2006. The financial viability of coal reserves withinpreviously mined areas of the Witbank coalfield. Masters thesis,University of Pretoria.
SCOTT, A. and WEDMAIER, R. 1995. The assessment and control of coal damageand loss. Final report C3017. Australian Coal Association ResearchProgram (ACARP), Brisbane, Australia. 93 pp.
THOMPSON, R.J. 2005. Surface Strip Coal Mining Handbook. South AfricanColliery Mine Managers Association. �
�
222 VOLUME 117

The underground coal mining industryunderwent a resurgence when blasting wasreplaced by the use of continuous miners. Notonly were there significant improvements inproductivity and efficiency; the safety recordimproved dramatically. Hard rock undergroundoperations have not made this majortransition, despite significant efforts to developsimilar technology for narrow-reef, tabularmetalliferous mines. Metalliferousunderground mining in South Africa industryis carried out using cyclic drilling and blastingoperations. Although there have beenimprovements over time, these have beensmall and incremental.
� Ore is still broken from the host rock bythe use of explosives, which requiresblast-holes to be drilled into the rockmass
� Detonation of the explosives is nowdone in a much more controlled andcoordinated manner, by the use ofcentralized blasting and electronicdetonators rather than the manuallighting of each fuse by the miner as inthe early days of mining
� Scrapers and winches for cleaning,which were introduced in the 1920s, arestill in use today
� Support systems, to this day, consist ofcombinations of in situ pillars, backfill,wood, and steel.
South Africa’s mineral resources endowment isthe foremost in the world, not only as regardsgold and platinum group metals (PGMs) butalso manganese and chromium, to name but afew. The minerals industry contributes signifi-cantly to South Africa’s internal energyrequirements, trade balance, internalinvestment, domestic savings, foreign capital,and direct and indirect employment creation.Mining has made a significant contribution tothe South African economy for more than acentury. Many of the challenges facing thedomestic minerals sector over the medium tolong-term parallel those at the global level.
� South Africa faces increased competitionin terms of attracting foreign directinvestment in the minerals sector
� Mining horizons within existingorebodies are becoming deeper and moredifficult to access and extract, necessi-tating the adoption of mechanizedextraction methods, optimization of
Weathering the ‘perfect storm’ facingthe mining sectorby N. Singh*
The South African mining industry has made a significant contribution tothe country’s economy for more than a century. Changes in legislation formining licences, stricter health and safety targets, and stronger focus onreducing the impact on the environment coupled with increasing labourand electricity costs are some of the factors that significantly changed thelandscape in which the mining industry now operates. Further to this, lowcommodity prices force South African mines to seek new, more technicallyadvanced, cost-effective ways of increasing production without compro-mising occupational health and safety.
Research, development, and innovation (RD&I) in the mining sector istherefore required to find solutions that are cheaper, safer, and moreefficient. Alternative programmes must be developed and put in place totransform South Africa’s comparative mineral endowment advantages intomore sustainable and globally competitive strengths.
This paper discusses the recently developed and accepted SouthAfrican Mining Extraction Research, Development & Innovation(SAMERDI) strategy, which is strongly focused on productivity-relatedissues in order to ensure that mineral resources can be converted intomineable reserves economically, safely, and with minimal impact on theenvironment. Furthermore the paper will discuss the merits of revitalizingthe mining RD&I environment through the strenghtening and consoli-dation of efforts in a manner that is collaborative and ultimatelysustainable.
South African mining, competitiveness, productivity, innovation, researchand development.
* CSIR, South Africa.© The Southern African Institute of Mining and
Metallurgy, 2017. ISSN 2225-6253. This paperwas first presented at the New technology andinnovation in the Minerals Industry Colloquium’,9–10 June 2016, Emperors Palace, Johannesburg,South Africa.
223VOLUME 117 �
http://dx.doi.org/10.17159/2411-9717/2017/v117n3a3

Weathering the ‘perfect storm’ facing the mining sector
existing process flow sheets, and the development ofnew and improved methods to increase efficiency andimprove recoveries
� There is an increasing push for the development oftechnologies capable of maximizing energy and waterefficiency and ensuring environmental integrity
� Furthermore, as prices across all the miningcommodities continue in a downward trend, marginalmines face an ever-increasing risk of closure and thusthe post-mining rehabilitation and regeneration of mineland is another critical issue that needs to be addressednow.
A ‘perfect storm’ is a detrimental or calamitous situation orevent arising from the powerful combined effects of a uniqueset of circumstances. In relation to the South African miningindustry the issues can be summarized as follows.
� The ubiquitous need to ensure that the target of zeroharm is achieved with regard to occupational healthand safety
� The South African gold industry is characterized bydecreasing production, increasing depth of operations,and harder-to-access payable material
� Labour and other costs have increased significantly andhave adversely affected the profitability and sustain-ability of gold mining in South Africa
� South Africa dominates global production of PGMs.Labour costs and rising steel and electricity costs allresult in profitability being marginal in terms ofoperational costs
� In the iron ore industry, transport infrastructure andtransport costs are major problems. The low commodityprice as well as the decrease in the demand for steelhas had a negative impact on this sector
� The need to ensure that mine rehabilitationrequirements are well resourced and funded so that theenvironmental impact is minimized both during miningas well as once mining activities cease
� The skills shortage from a technical as well asoperational perspective
� Socio-economic issues, especially in communitieswhere mining operations are located.
Figure 1 is a graphical representation of the challengesfacing the mining industry. As per the definition, it can bepostulated that the South African mining sector is facing aperfect storm.
The severity of the challenges facing the South Africanmining industry is summarized in the following points thatwere raised during various mining stakeholder forums. TheChamber of Mines (Baxter, 2016) reported that:
� 59 407 jobs were lost between 2012 and 2015� Productivity has declined in the gold and platinum
sectors� Mining’s contribution to the GDP declined from 21.9%
in 1970 to just 5.1% in 2014� Having led the world in gold production in 2006, South
Africa now ranks 7th� Easy accessible resources, especially in gold, are
becoming depleted
� The industry has left a legacy of environmentalproblems, including acid mine drainage.
Following the Malaysian model for quick tangible results, theSouth African government-led Phakisa process (Departmentof Planning, Monitoring and Evaluation, n.d.) was applied inareas that would help foster growth and the attainment ofnational development goals. Phakisa is essentially a collabo-rative process, convened by government but involving arange of key stakeholders, to plan and oversee the implemen-tation of initiatives that will have a positive impact on theeconomy and society. Mining is one such area (South AfricanGovernment News Agency, 2016).
The mining cluster is facing deep-seated economic andsocio-economic historical, structural, and immediatechallenges. Phakisa is tasked with developing collaborativeinterventions that will have a meaningful impact on theshort- and medium-term challenges faced by the miningcluster, and putting in place institutional mechanisms thatwill entrench collaboration. The broad aim of the MiningPhakisa is to galvanize growth, transformation, investment,and employment creation along the entire mining valuechain, in relevant input sectors and in mining-relatedcommunities.
Stakeholders from the mining industry, organized labour,government departments, and research organizations agreedto endeavour to ‘extend the life of Platinum and Gold minesin South Africa beyond 2025 and establish global leadershipin narrow-reef, hard rock mining systems’. Furthermore,‘this is enabled through partnerships in research anddevelopment, skills and competitive local manufacturingcapability that will focus on the current and future miningoperations through next generation mining systems. Toachieve this, a just transition must be at the core’ (SouthAfrican Government News Agency. 2016).
Many leaders of mining companies have spoken of theneed to modernize mining in the country. However, modern-ization is often confused with mechanization. Modernizationmay involve mechanization, but it is more than justmechanization.
Modernization of mines through mechanization andautomation, and ultimately fully autonomous operations, isthe envisaged path that will bring change to processes,technologies, skill-sets, and social and environmental impactsassociated with current mining practices. This was echoed by
�
224 VOLUME 117

Anglo Platinum CEO, Chris Griffith ‘Modernisation is not justabout innovation, new technologies, mechanisation andautomated processes. We will only attain our vision of amodern mine if we work in partnership with our employees,government, unions and NGOs’ (Griffiths, 2015).
A vibrant, strongly capacitated, and adequately resourcedlocal mining R&D community is needed to ensure that thesolutions are designed for South African conditions from asocio-economic as well as technical perspective, due to thenature of South African mining conditions and thecomplexity of addressing the social imbalances of the past.
In November 2014, under the leadership of the DeputyMinister of Mineral Resources, Mr Godfrey Oliphant,stakeholders discussed R&D within the mining sector. Duringthe discussions, the CSIR was tasked with developing aconsolidated mining strategy utilizing the draft documents ofthe Department of Science and Technology (DST) (Craven etal., 2014) and the Department of Mineral Resources (DMR)(Vogt and McGill, 2014). The resulting document was entitledthe South African Mining Extraction Research, Developmentand Innovation (SAMERDI) Strategy.
At the core of the SAMERDI strategy, aligned to thevisions, are the following objectives:
i. To improve the competitiveness of the sector andcreate new opportunities for South African basedcompanies to operate in areas along the entire valuechain from the innovations stemming from the RD&Iareas
ii. To reposition South Africa as the world leader inmining RD&I by building human resources skills,capabilities, and capacities across industry, academia,and the science councils to ensure its sustainability.
SAMERDI served as an input document into the MiningPhakisa that was held in November 2015. Although theMining Phakisa outcomes have not been formally announced
by the Office of the Presidency, there have been significantdevelopments during the process.
� Firstly, stakeholders agreed that the SAMERDI strategywould be the consolidated strategy for miningextraction after consolidation with the inputs of theChamber of Mines
� Secondly, there is a collective agreement bystakeholders in that there is a need to strengthenmining extraction research capabilities and capacity inSouth Africa as the sector moves towards modern-ization. Stakeholders agreed that consolidation of thevarious resources and research offerings in onecommon space is necessary
� Finally, there was agreement on the need to developsystems that will migrate current mining from conven-tional, labour-intensive, highly diluted methods to theutilization of mechanized drilling and blastingequipment, and ultimately to a continuous miningmethod that is independent of the use of explosives.
To this end, two focus areas were developed.
1. Mining R&D—An intensively collaborative researchand development model with a holistic systemsapproach, that is substantially funded and which willfocus on core technologies, patents, and commercial-ization opportunities and ultimately position SouthAfrica as a global leader in developing solutions fornarrow-reef hard-rock mining
2. Mining manufacturing equipment cluster— A miningmanufacturing equipment cluster that is embeddedwith other existing clusters and initiatives, which willensure that development requirements are translatedinto coherent R&D programmes, enabling localpartnerships to develop and manufacture equipmentfor next-generation mining systems.
Weathering the ‘perfect storm’ facing the mining sector
VOLUME 117 225 �

Weathering the ‘perfect storm’ facing the mining sector
The South African mining R&D environment is veryfragmented compared to other countries. South Africa doesnot currently have any single, central entity to guide andcoordinate innovation in the mining industry. Instead, thereare number of mining-related collaborative initiatives suchas:
a) Centre for Sustainable Mining Industries (CSMI) –University of the Witwatersrand
b) Centre for Mechanised Mining Systems (CMMS) –University of the Witwatersrand
c) Wits Mining Institute (WRI) – University of theWitwatersrand
d) Mining Resilience Research Centre (MRRC) –University of Pretoria
e) Centre of Excellence on Occupational Health andSafety (CoE) – Mine Health and Safety Council
f) Mining Research Impact Area (RIA) – CSIR.Efforts to spread financial support across these various
institutions in South Africa have led to a situation wherethere is insufficient critical mass in any one field, resulting inresearch capability and capacity, and thus offerings, deterio-rating. There is a dire need for a vibrant, strongly capacitated,and adequately resourced local mining RD&I community toensure that the solutions for the South African miningindustry address local socio-economic as well as technicalchallenges as identified in the SAMERDI strategy. Until now,research providers have had to compete for limited funding.The end result of this process saw the erosion of researchcapability and capacity, which led to a loss of confidence inthe ability to develop new solutions and further reductions inR&D investments due to lack of capability. The SAMERDIstrategy aims to counter the erosion of research capability bystriving for true collaboration as follows:
1. To improve the competitiveness of the sector andcreate new opportunities for South African basedcompanies to operate in areas along the entire valuechain from the innovations stemming from the RD&Iareas
2. To reposition South Africa as the world leader inmining RD&I by building human resources skills,capabilities, and capacities across industry, academiaand the science councils, ensuring its sustainability.
Since the completion of the Mining Phakisa in November2015, significant work has been done under the leadership ofthe Department of Science and Technology (DST) through theCSIR and the Chamber of Mines in developing programmes ofwork for the implementation of the SAMERDI strategy, viz.:
(i) Modernization of current mining operations—Thefocus is on increasing the efficiency of extraction,improving occupational health and safety, andreducing costs
(ii) Mechanized drill and blasting—The developmentfully mechanized mining systems that will allowremote drilling and blasting in narrow-reef hard rockmines (in particular the gold and platinum mines)
(iii) 24/7 non-explosive rockbreaking—The developmentof complete mining systems for extraction that areentirely independent of the use of explosives.
(iv) Advanced orebody knowledge—Mechanization andmodernization of mining requires better knowledgeof the orebody ahead of the mining face. This projectaims to ‘make the rock transparent’, so that insteadof mining blind, an accurate 3D real-time model canbe used for safety and planning
(v) Real-time information management systems—Theinability to accurately monitor issues in real timeposes a significant challenge across the entire miningprocess, even more so when using mechanizedmining methods. Production-related issues have adirect impact on the efficiency of the mines. Usingreal-time information for monitoring and controlallows proactive intervention that can correctdeviations and unsafe conditions
(vi) Human factors—Modernization via automation andmechanization of South African mining processeswill have significant implications for the number ofpeople employed in the industry, as well as therequired skills levels. This will also require attentionas regards change management issues. Therequirements for the upstream and downstreamprocesses associated with mechanization will have tobe understood.
For each of the above areas, research questions weredeveloped in the areas identified by members of the Chamberof Mines Innovation Task Team (Table I).
The rebuilding of mining R&D capability requires a two-pronged approach:
1. The establishment of a forum or community ofresearchers—The hub-and-spoke model was adoptedsince it provides the opportunity to leverage theexisting capabilities of various research organizationswhile utilizing the administrative strengths of the hostorganization. A central core management team willserve as the ‘hub’ and coordinate the workprogrammes. The researchers from mining-focusedresearch institutes (universities and science councils)will serve as research providers and thus act as the‘spokes’. Figure 4 provides an overview of the processlisted below:
(i) Researchers from the identified research organi-zations (universities and science councils) willform teams to collectively develop solutions
(ii) Representatives from the various researchorganizations will participate in a series ofworkshops and meetings to form teams basedon the mix of skills and capabilities
(iii) The research teams will develop proposals andsubmit them to a committee made up ofappropriate subject-matter experts fromindustry for comment
(iv) Project proposals must indicate the level ofcollaboration. If a proposal is submitted thatdoes not have all four research providers’inputs, the parties not included must providereasons for their non-participation.
�
226 VOLUME 117

The nature of the mining R&D environment does notnecessarily imply that the already established centres, asmentioned above, are ineffective or not essential. However itdoes imply that the model for collaborative working needs tobe further investigated and revisited. The CSIR premises atCarlow Road in Auckland Park, Johannesburg has beenrevitalized to form the Mining Precinct.
The Mining Precinct will serve as a nerve centre for R&Dactivities that could be spread across many geographicalboundaries. The Mining Precinct will provide an environmentfor collaboration utilizing modern means of communication.Figure 5 shows the Carlow Road facility and the variousbuildings on the site that provide the following facilities.
� Building 1—This will be the main office complex andwill house (either temporarily or permanently) theresearchers and the administrative functions of theMining Precinct. The details of the occupants in thebuilding will be dealt with later in the document
� Building 2—This is planned as a learning centre, whichwill include an auditorium for hosting conferences andsymposia. This facility will attract mining stakeholdersto the Mining Precinct and thus provide opportunitiesfor further engagement with the researchers
� Building 3—This houses the existing testing facilitiesfor rock engineering support systems and ventilationservices. Considering the critical functions of both thesedisciplines in mining sector, it is envisaged that thefacilities could be revamped and upgraded.Furthermore, the other buildings and workshops can be
revitalized to function as mining laboratories and testfacilities, such as a backfill laboratory. Other state-of-the-art laboratory facilities may be established for minedesign, rock drilling and cutting, mechatronics androbotics, multiple-use sensors, geophysics, geomet-allurgy, and mine digitization
� Warehousing and workshop space—The largewarehouse at the back of the premises would be idealfor building a mock stoping and development end thatcan be used to simulate mining conditions, allowing forthe development of concepts and testing of researchhypothesis before embarking on full-scale in-situtesting.
The other significant aspect of Advancing the Cluster is theneed to develop a manufacturing capability for mechanizedmining equipment designed to operate in narrow tabularorebodies. The development of technologically advancedequipment can be described with reference to various stages,or ‘technology readiness levels’ (TRLs) as developed byNASA in the 1970s (Mankins, 1995). Figure 6 is conceptualdiagram showing the quantum of funding required for thedevelopment of technology solutions and the relationshipbetween state funding and industry funding. For R&Dpurposes, only those initiatives at TRL 6 and below will be
Weathering the ‘perfect storm’ facing the mining sector
VOLUME 117 227 �
Table I
Modernizing current mines • How can we improve the safety and health of employees as well as the profitability of existing operations?
Mechanized mining for gold and platinum • What are the system requirements to ensure the successful application of mechanized mining (including partial, hybrid, and full mechanization)?
Non-explosive rockbreaking • What are the critical rock engineering requirements to ensure the stability of the rock mass so that that mining can be undertaken?
• What rockbreaking mechanism is most appropriate for both gold and platinum operations?
Advanced orebody knowledge • What techniques and technologies could be used to ‘see’ 30 m through rock underground, and to model the orebody and surrounding rock in 3D, in multiple characteristics?
Real-time information management systems • What are the appropriate means and systems to enable real-time communication between the operating face of the mine and the surface?
Human factors• • How can resistance to change be overcome, (covering all levels in the organization, and extending across the mining value chain)? Studies to be undertaken across all mining companies and OEMs to research and consolidate these failures, so as to design practical solutions and strategies

Weathering the ‘perfect storm’ facing the mining sector
considered for funding. Technologies above TRL 6 will beallocated to the mining equipment manufacturers fordevelopment into commercialization opportunities. There isopportunity for the mining industry to provide funding inboth areas (with the state and with the OEMs).
Current labour-intensive methods of mining tabular golddeposits are increasingly expensive, and not conducive to theobjective of zero harm. It is therefore imperative to designand develop an integrated mining system that allows themining of deeper and lower-grade reefs, cost-effectively andsafely, for the sustainability of the industry.
The first and foremost aim of developing mechanizedmining solutions is to improve safety, health, and theeffectiveness of underground narrow-reef mining operations,which are still based on cyclical drill-and-blast operations.The objective is to remove the operators from the workingfaces, thus reducing their exposure to the ‘danger area’,while employing technology that is rugged, capable ofnegotiating mining dips and narrow (less than 1 m) widths,while ensuring accuracy and efficiency. In addition, theproject aims to deliver increasing ore reserves andproduction.
With the call for modernization of South African minesand the nature of the orebodies (depth, reef width, and thedip of the reef), the solutions that need to be sought will beuniquely South African. Mechanization is not a new conceptin the South African mining sector and has been used withvarying degrees of success for different mineral commodities,particularly in the coal mining sector and most recently insome platinum operations. Gold mines have had the leastsuccesses of all in deploying mechanized (trackless) mining,except for two mines that exploit massive orebodies. Previousattempts to mechanize mines, gold mines in particular, havenot been sustainable, either because of cost, or because ofmanagement intervention to return to conventional methods.The depth of mining, the steep angle of the orebodies, as wellas the narrow width of the reef package will requiresignificant investment in RD&I to understand the variouschallenges such as rock engineering requirements, themechanical design of the equipment, and related ventilationflow into the mines. To this end, a detailed programme hasbeen developed for the mechanization of gold and platinum
mines. The approach to mechanization is seen as two-phased:
� Mechanization that is still based on a cyclic drill andblast approach
� Full mechanization that is independent of the use ofexplosives and employs some mechanical form ofrockbreaking.
Figure 7 shows some of the mechanized mining solutionsbeing considered by South African mining operations.
Irrespective of the manner of mining usingmechanization, the solution that is sought is a full systemsapproach that covers all the mining activities associated witheither stoping or development (inclusive of rockbreaking,support installation, as well as tramming and hauling). Thedevelopment of the Mining Equipment Manufacturing Clusterwas supported by the Department of Trade and industry(DTI) and led to the formation of MEMSA. It is envisaged thatMEMSA will help position South African mining capital goodsmanufacturers as a world-class, competitive, innovative,dynamic and transformative industrial cluster, through whichSouth African OEMs will be able to develop and exportmechanized narrow-reef hard-rock mining equipment.
While modernization and technological innovation areparamount to the future of the mining sector, the humanconsequences of introducing change also need to beconsidered. Modernization will have a direct impact on theworkforce, and inevitably on the number of people employedin mining. This will have a follow-on effect on thecommunities dependent on mining. Therefore as well as thetechnical challenges, such as the development of suitabletechnologies, and mining and geotechnical constraints,critical aspects such as change management and leadership,re-skilling, training requirements, work planning andoperation of the mine, and relationships with supportingindustries need to be considered.
The need to access and process low-grade mineral depositsthat lie at greater depths, under more complex geotechnicalconstraints, in areas with sparse infrastructure, coupled withincreasing calls for maximum socio-economic returns from
�
228 VOLUME 117

mining, and increasing costs of energy, water, and labour,constitutes the perfect storm.
All stakeholders in the industry agree that ensuring thelongevity of the South African mining sector will require acoherent, collaborative approach to the current and futurechallenges.
The plateauing of production, set against the constantincrease in costs, the ubiquitous need to improve safety, anda depressed global market with commodity prices forecast toremain low for years to come, necessitates the revitalizationof mining R&D capabilities in South Africa.
The South African Mining Extraction Research,Development & Innovation (SAMERDI) strategy provides aroadmap on working collectively towards technologicalsolutions that will increase safety and productivity, reducecosts, and ultimately extend the life of mines.
Thus the implementation of SAMERDI strategy throughcollaboration and support from researchers (science councilsand academia), government departments, mining houses(individually and collectively), and organized labour unionscan be the solution to weather the perfect storm that besetsthe mining sector.
The CSIR is thanked for allowing the time to publish thispaper. The work was done partly in conjunction with theChamber of Mines, and the contributions of Mr AlastairMacFarlane and Mr Katlego Letsoalo are appreciated andacknowledged.
Further acknowledgments are extended to Mr ImraanPatel, the DDG of the DST; Mr Beeuwen Gerryts, ChiefDirector of the DST; Mr Llandley Simpson, Director ofAdvanced Minerals and Deputy Director; and Ms CandiceWillard for their efforts and leadership in the DST programme‘Development of a South African Research Agenda for MiningAnd Geosciences’ that led to the Rock Innovation Programme.
The members of the DMR, and in particular thoseinvolved in the Mining Industry Growth Development andEmployment Task Team (MIGDETT), are thanked for theirforesight in undertaking the DMR project ‘A TechnologyInnovation Roadmap for the South African MineralsIndustry’.
It is therefore with full gratitude that the following peopleare recognized for their individual and collective efforts in thedrafting of the initial documents for the DST and DMR:
� Peter Craven, Mintek� Stewart Foya, Council for Geosciences� Marian Lydall, Mintek� Declan Vogt, University of the Witwatersrand� Jeannette McGill, Anglo Platinum� Alan McKenzie, Mintek
A special acknowledgement to the Deputy Minister ofMineral Resources, Mr Godfrey Oliphant, for his leadership indriving the initial processes of collaboration and coordinationtowards a consolidated mining RD&I strategy.
Finally, the members from the various stakeholdergroupings involved in the RD&I workshops on mining as wellas the Mining Phakisa are acknowledged for their inputs andcomments.
BAXTER, R. 2016. Mining in South Africa the challenges and opportunities.http://www.chamberofmines.org.za/industry-news/publications/presen-tations/send/7-2015/269-mining-in-south-africa-the-challenges-and-opportunities
CRAVEN, P., LYDALL, M., VOGT, D., FOYA, S., and MCGILL, J. 2014. A technologyinnovation roadmap for the South African minerals industry. Departmentof Mineral Resources, Pretoria.
DEPARTMENT OF PLANNING, MONITORING AND EVALUATION. Not dated. OperationsPhakisa. Office of the Presidency.http://www.operationphakisa.gov.za/Pages/Home.aspx
GRIFFITHS, C. 2015. Modernisation – building a sustainable mining industry inSouth Africa. Address at the Mining Indaba.http://www.angloamerican.com/media/our-stories/modernisation-building-mining-in-sa
MACFARLANE, A. 2017. Chamber of Mines. Personnel communicationsMANKINS, J.C. 1995. Technology readiness levels. White Paper, NASA.
http://www.hq.nasa.gov/office/codeq/trl/trl.pdf SOUTH AFRICAN GOVERNMENT NEWS AGENCY. 2016. Mining Operation Phakisa to
start work in August. http://www.sanews.gov.za/south-africa/mining-operation-phakisa-start-work-august
SINGH, N. 2015. South African Mining Extraction Research, Development &Innovation Strategy. Department of Science and Technology.(Unpublished)
VOGT, D. and MCGILL, J. 2012. Development of a South African research agendafor mining and geosciences- part C: the agenda. Department of Scienceand Technology, Pretoria. (Unpublished).
ZUMA, J. 2016. State of the Nation Address.http://www.gov.za/speeches/president-jacob-zuma-state-nation-address-2016-11-feb-2016-0000 �
Weathering the ‘perfect storm’ facing the mining sector
VOLUME 117 229 �

The object of the interactive workshop is to address the more complex application of the codes through case studies. It willbe assumed that the participants are fully conversant with the codes and are able to discuss their perspective on aspectsof the case studies. The emphasis will be on being able to face one’s peers and include both compliance and best practiceaspects of the codes.
The workshop will take the form of group discussions of various case studies to facilitate discussion. The four topicsselected are Precious Metals, Coal, Diamonds and Valuation covering Exploration Results, Mineral Resources, MineralReserves and Valuations.
Participants will be supplied with material to review prior to the workshop. They will be placed in groups to discuss anddissect the material – 2 or 3 groups will be asked to present their findings at the end of each session. Each case study isdesigned for a 3 hour morning or afternoon session.
The workshop is intended to allow mining industry professionals to improve their knowledge and application of theadvanced aspects of the SAMREC and SAMVAL Codes.
SPONSORSHIPSponsorship opportunities are available. Companies wishing tosponsor should contact the Conference Co-ordinator.
THE SAMREC and SAMVAL CODESAdvanced Workshop: Can you face your peers?
15–16 August 2017Emperors Palace, Hotel Casino Convention Resort, Johannesburg
For further information contact:Camielah Jardine Conference Co-ordinator
Saimm, P O Box 61127, Marshalltown 2107, Tel: +27 (0) 11 834-1273/7E-mail: [email protected], Website: http://www.saimm.co.za
Wednesday: 3 May 2017 07:00–08:00 Registration08:00–08:30 Introduction to the Course
Case Study 1: Precious and Base Metals08:30–10:00 Session 1—Precious and Base Metals10:00–10:30 Tea10:30–12:00 Session 2—Precious and Base Metals12:00–12:45 Lunch
Case Study 2: Coal 12:45–14:15 Session 1—Coal14:15–14:45 Tea14:45–16:15 Session 2—Coal
Thursday: 4 May 201707:00–08:30 RegistrationCase Study 3: Diamonds08:30–10:00 Session 1—Diamonds10:00–10:30 Tea10:30–12:00 Session 2—Diamonds12:00–12:45 Lunch
Case Study 4: Valuation12:45–14:15 Session 1—Valuation14:15–14:45 Tea14:45–16:15 Session 2—Valuation
PROGRAMME

Introduction
The management of groundwater inevitablybecomes an integral part of open pit operationsas they eventually encounter groundwater.Depending on the conditions, thismanagement may take the form of proactivedewatering through the use of boreholes. Insuch situations, a robust and effectivedewatering system can be vital for maintainingslope stability and safety, and enabling theminimization of stripping ratios. Furthermore,effective dewatering removes groundwaterfrom the operating areas in the base of a pitand helps to reduce wear- and tear-relatedcosts on mining equipment, along withreduced haulage costs owing to the reducedhaulage of wet ore and waste (Dowling andRhys-Evans, 2015). The impacts on themining operations from poor dewatering ofteninclude:
‰ Wet drilling and blasting, requiring moreexpensive blasting agents and reducedfragmentation efficiency
‰ Wet working benches, which increaseequipment wear and introducesadditional safety risk factors
‰ Inundation of the pit floor and slowmine advancement
‰ Reduced geomechanical performance ofpit slopes that, in some cases, leads tothe design of more conservative slopeangles resulting in higher strip ratiosand deferral or loss of ore (Figure 1).
Although conditions vary widely, wherewall stability and reducing groundwater infloware the main dewatering objectives, conven-tional dewatering is normally implementedwith a combination of: (1) in-pit verticalpumping wells to remove groundwater fromthe formation and lower groundwater levelswithin the ultimate pit shell, (2) pit perimeterwells to intercept and remove groundwatermoving toward the mine, and (3) a series ofsumps and surface pumps to remove standingand near surface groundwater (Dowling andRhys-Evans, 2015) (Figure 2). This tends tobe effective for ore deposits in moderate tohigh permeability settings where productivezones are present and within the reach ofconventional drilling techniques.
Adapting innovation
The petroleum industry has faced many of thesame challenges as those currently facing themining industry, especially in terms ofdeclining grades and a precipitous decrease inlarge, easily accessible discoveries (McCartneyand Anderson, 2015). However, in order toaddress this, the O&G industry has maintainedsignificant investment in research anddevelopment (R&D) (McCartney and
Adapting oil and gas drilling techniquesfor the mining industry with dewateringwell placement technologyby A. Rowland*, M. Bester†, M. Boland‡, C. Cintolesi§, and J. Dowling**
Synopsis
Although increasing R&D spent to develop original technologies will benefitthe mining industry, adaptation of appropriate existing technologies fromother industries can be a more cost-effective alternative. Schlumberger WaterServices, now WSP|Parsons Brinckerhoff, has undertaken a 6-yearprogramme assessing the adaptation of oil and gas (O&G) drilling andgeophysical characterization techniques to a range of mining applications,including dewatering. Conventional dewatering systems for open pit minesgenerally use vertical boreholes that target hydraulically productive zoneswithin an orebody. The drilling and completion of vertical dewateringboreholes can be complicated by mine planning constraints, where optimumhydrogeological targets are not accessible from the available drillinglocations. As these boreholes are often located within the operating open pit,they can interfere with the mining operation and the ability to carry outsignificant dewatering ahead of mining is limited. Dewatering Well PlacementTechnology (DWPt) is WSP|Parsons Brinckerhoff’s next-generation minedewatering solution aimed at addressing the limitations of conventionaldewatering systems through placement of permanent, high-performancedewatering wells in optimum orientations beneath an open pit using large-diameter directional drilling technology commonly used in O&G. Ideally, wellcollars are located outside of the mine operating areas, resulting in improvedcompatibility between the dewatering system and mine plan. Recently drilledand constructed pilot directional dewatering wells in hard rock miningenvironment in the USA and Mexico have demonstrated that DWPt offerssignificant benefits for groundwater inflow control and value to miningoperations compared to conventional open pit mining dewatering practices.
Keywords
open pit mines, dewatering, well placement, directional drilling.
* Piteau Associates, South Africa.† Kumba Iron Ore, South Africa.‡ WSP | Parsons Brinckerhoff, United Kingdom.§ Anglo American, Chile.** Piteau Associates, USA.© The Southern African Institute of Mining and
Metallurgy, 2017. ISSN 2225-6253. This paperwas first presented at the New technology andinnovation in the Minerals IndustryColloquium’, 9–10 June 2016, Emperors Palace,Johannesburg, South Africa.
231The Journal of the Southern African Institute of Mining and Metallurgy VOLUME 117 march 2017 s
http://dx.doi.org/10.17159/2411-9717/2017/v117n3a4

Adapting oil and gas drilling techniques for the mining industry
Anderson, 2015). R&D spend as a percentage of revenueaverages around 0.5% for the major oil companies, and ishigher than 2% for the main service companies (McCartneyand Anderson, 2015). In contrast, R&D spend in the miningindustry has previously been pegged in the media at as littleas one-tenth of that in the O&G industry.
Directional drilling as a whole is considered a maturetechnology with widespread acceptance and commonplace usein the O&G, utilities, and infrastructure industries. However,directional well placement in hard rock mining has a verylimited track record and was previously untested fordewatering applications in an open pit mine. The geologicaland geomechanical environments, size and scale ofequipment, flow and production pumping regime, and theassociated well design requirements are significantlydifferent, requiring substantial adaptation and modification.However, WSP|Parsons Brinckerhoff and Freeport-McMoRanrecognized that the principal benefits of directionally drilleddewatering wells are highly applicable to open pit minedewatering (Dowling and Rhys-Evans, 2015). Crucially, theuse of directional drilling enables:
‰ Enhancement of hydraulic contact between multiplefractures zones and the production well or wells
‰ Access to permeable water-bearing zones unreachablewith vertical drilling
‰ Positioning of the well-heads permanently outside ofthe planned mine operating areas.
The combined impact of the benefits listed above hasbeen shown to result in a step-change improvement indewatering well efficiency, performance, and overalleffectiveness of the mine dewatering programme, resulting in
significant cost and risk reductions. Improvements that havebeen demonstrated by pilot programmes in the USA andMexico are:
‰ Increased well yield due to the design trajectory,interception of sub-vertical structure, and enhancedhydraulic contact.
‰ Improved well runtimes with the well-heads locatedoutside of operating areas, thereby avoidinginterference between dewatering infrastructure andmine operations
‰ High well yield and improved runtimes leading to astep-change increase in long-term volumes ofgroundwater produced from the dewatering programme
‰ Reduced number of well-head installations withassociated burdens of procurement, implementation,and in-pit operation interactions.
Recognizing the limitations of conventional dewateringpractices and the potential value of improved dewatering,WSP|Parsons Brinckerhoff and Freeport-McMoRan havecollaborated to develop, test, and implement a new generationof high-performance mine dewatering well systems,combining mine hydrogeology and dewatering expertise withcrossover technology of O&G directional well placement(Dowling and Rhys-Evans, 2015) (Figure 3). Subsequently,the success of various pilot programmes at Morenci withFreeport McMoRan led Kumba Iron Ore (KIO) to approachWSP|Parsons Brinckerhoff to conduct a technical feasibilitystudy (TFS) for the evaluation of directional well placementto improve dewatering effectiveness at their Sishen operationin South Africa.
Adaptation of existing technology requires a deepunderstanding of the goals of the adaptation, as well as thetechnology to be adapted. For example, the directionalplacement of a well to a pre-planned trajectory involvescomplex interactive consideration of multiple factors,including the ore deposit geology, geological structure andgeomechanical environment, the ranges of performance fordirectional tools, downhole surveying, and the ability tocontrol and steer the well to the target (Dowling and Rhys-Evans, 2015). The trade-offs between alternative options,risk factors, the final dewatering goal, and overall value tothe mine operation are integral to the matrix of planning,design, and implementation decisions. By adapting thesetechniques from the O&G industry, WSP|Parsons Brinckerhoffand Freeport-McMoRan developed a mine dewatering projectintegration matrix, which was subsequently implemented atthe Freeport-McMoRan Morenci copper mine in Arizona, withthe previously mentioned TFS having been done for KIO’sSishen operation.
Proof of concept
To date, two directionally placed dewatering wells have beensuccessfully implemented at Morenci as part of the Garfieldopen pit mine dewatering programme. An initial well wasconstructed on a ‘proof-of-concept’ basis and commissionedin early April 2013. The well site was located on the westwall of the open pit, outside of planned mining limits. Theborehole was steered underneath the centre of the planned piton a pre-planned directional trajectory. Attaining a measureddepth of approximately 700 m, the well intercepted hydrogeo-logical targets associated with major northeast-trendinggeological structures and hydrogeological compartments.After completion, the well was equipped with an oilfield-stylehigh-lift, slim-hole electrical submersible pump systemdesigned to minimize well drilling and construction holediameters while permitting high production pumping rates forvariable head pressure conditions (Figure 4). The wellinitially produced between 150 m3/h and 160 m3/h, which
s
232 march 2017 VOLUME 117 The Journal of the Southern African Institute of Mining and Metallurgy
Figure 1—Many large open pit operations are eventually impacted by
the inflow of groundwater, requiring proactive dewatering systems
Figure 2—A conceptual layout of a conventional dewatering system in a
hard rock, fractured environment. Some or all of the various aspects
illustrated may be included in any given system, and often a
combination is deployed based on local requirements (Dowling and
Rhys-Evans, 2015)

was at the high end of the planned production, and is five toten times greater than the previously installed conventional,vertical in-pit wells. The well was immediately commissionedinto the active dewatering programme and during the firstyear operated at 96% availability. Due to the combination ofhigh production rate and high availability, it effectivelyproduced up to two orders of magnitude more groundwaterthan any of the pre-existing in-pit vertical wells and exceededthe combined groundwater production from the rest of thedewatering system, comprised of six vertical production wells(Dowling and Rhys-Evans, 2015).
Following the success of the first well at Morenci andanother successful well in Mexico, Freeport-McMoRan inpartnership with WSP|Parsons Brinckerhoff commissioned anadditional programme to construct a second well collared onthe pit perimeter of the east high wall. The target for thesecond well was a set of northeast-trending geologicalstructures and lower permeability compartments. With a moreaggressive drill bit trajectory, design modifications weremade during implementation to control risk while attainingthe planned hydrogeological target. Results from early stagesof operation indicate the well to be a high-performance high-value dewatering asset (Dowling and Rhys-Evans, 2015).
Since initiation of the programme at Morenci, monitoringdata has shown a distinct acceleration in the rate of thegroundwater level reduction in the open pit. A number ofpiezometers located within and around the edges of the pithave shown a 200–250 foot (60–90 m) decline in static waterelevation (Dowling and Rhys-Evans, 2015).
South African example
The Sishen iron ore mine, Kumba Iron Ore’s flagshipoperation, is currently the largest open pit iron ore mine inAfrica, and one of the largest open pits mines in the world atalmost 14 km in length (Kumba Iron Ore, 2016a). Totalannual production at Sishen is approximately 35 Mt, with themost recent values being 5 842 kt in the first quarter of 2016(Kumba Iron Ore, 2016a). Additionally, up to 190 Mt ofwaste is removed annually from the open pits (Kumba IronOre, 2016b). This large-scale mining operation targets ahigh-grade haematite orebody with grades of significantlymore than 60% Fe and a sought-after lump content thatcommands higher prices on the global steel market (Astrup,Hammerbeck, and van den Berg, 1998).
Sishen currently consists of four operating areas thathave been excavated to near or below the naturalgroundwater surface (Schlumberger Water Services, 2014).As a result of the relatively shallow pre-mining groundwaterlevel, dewatering activities have been ongoing since thebeginning of mining operations, with a series of vertical in-pit and perimeter pumping wells targeting productivegeological formations within the mine area (SchlumbergerWater Services, 2014). The groundwater regime and rate ofmining require that dewatering pumping operates on acontinuous basis. The abstraction rate of the overall minedewatering system is approximately 1 800 m3/h as ofNovember 2015, from a total installed capacity of approxi-mately 2 130 m3/h (Nel and White, 2015). Of the fouroperating pits, the GR35 pit is currently the deepest and ismining at 950 m above sea level (masl) from an originalsurface elevation of approximately 1 200 masl.
Leading up to early 2014, dewatering operations at GR35pit faced significant challenges related to lithology, structure,and operations, including:
‰ Typically 2 to 4 ‘dry’ wells are drilled before a high-yielding water strike is intersected at the required depth
‰ The drill rigs at site could not drill beyond water strikesof 250 m³/h. Dewatering boreholes were thereforeconstructed below target abstraction as a result of theirlimited depth of penetration
‰ Due to highly fractured formations, explorationboreholes are not reamed and production wells aredrilled a few metres away. During production drillingthe risk of missing the water-bearing structureencountered in the exploration well close by issignificant due to the vertical orientation of structures
‰ The presence within the pit of dewatering, exploration,and production boreholes and the associated
Adapting oil and gas drilling techniques for the mining industry
The Journal of the Southern African Institute of Mining and Metallurgy VOLUME 117 march 2017 233 s
Figure 3—3D visualizations of directional well placement trajectories beneath the Garfield pit at the FreePort McMoRan Morenci Copper Mine, USA with
January 2014 phreatic surface shown. The trajectory on the left (Well C) is the proof-of-concept well completed in April 2013, while the trajectory on the
right (Mammoth Well) was completed in January 2015. The cross-section runs from NNW to SSE (Dowling and Rhys-Evans, 2015)
Figure 4—The collar of the first directionally placed well at Morenci,
permanently plumbed and operating outside the footprint of the
Garfield Pit
-13600 -13200 -12800 -12400 -12000 -11600 -11200 -10000 -10400 -10000 -9600 -9200 -8800 -8400 -8000

Adapting oil and gas drilling techniques for the mining industry
dewatering infrastructure interferes with the activemining front and pit operations
‰ Interruptions to dewatering operations from miningactivities resulted in significantly reduced utilization ofthe production boreholes and a consequent quickrebound of the groundwater system due to highconnectivity and hydraulic conductivity.
In order to address the challenges raised above,WSP|Parsons Brinckerhoff was approached to conduct a pre-feasibility study (PFS), and subsequently a full technicalfeasibility study (TFS) on the use of directional wellplacement to replace or augment the existing system in GR35pit. The PFS concluded that directional wells placed outside ofthe final pit shell, targeting chert (CH), banded iron formation(BIF), and sub-vertical structures would intercept fracturingthat would yield significant amounts of groundwater and leadto effective dewatering of the CH, BIF, and haematite (HEM)rock mass. Based on this and considering pumping systems,drilling, and completion diameter, a yield of about 360 m3/hfrom a single directionally placed well was determined to bean achievable abstraction target (Schlumberger WaterServices, 2014). The collar location for the drill pad wasproposed by Sishen based on the following criteria (Figure 5):
‰ Location outside the planned final GR35 pit shell‰ Easy access for the drill rig and ancillary services‰ Outside areas identified for construction of future waste
dumps and therefore the pad could be used for futuredirectional wells if required.
During the TFS, 14 different directional well configu-rations were assessed, with the Plan 11 and Plan 14 trajec-tories selected for detailed engineering design and costing.Detailed engineering design work was carried out in order todefine the feasibility of drilling the Plan 11 and Plan 14 wellsusing engineering inputs from a number of groups withinSchlumberger, including:
‰ Smith Bits: drill-bit selection, rate of penetration (ROP)calculations
‰ Drilling and Measurements: directional drilling plan,bottom hole assembly (BHA) and casing design
‰ MI Swaco: drilling fluid plan for hole cleaning‰ Drilling Tools and Remedial: turbine and mud-motor
selection‰ Artificial Lift: submersible pump design.
Plan 11 provided a base case as it involved assessment ofdrilling of all of the main lithologies present at GR35, at arange of drilling diameters from 24 inches to 8½ inches, witha significant directional component, and completion of a longhorizontal production zone within the well that would involvesignificant challenges and risks. Apart from assessing thetechnical feasibility of drilling the well, this proposedtrajectory also allowed the cost implications of focusing thedrilling on the dolomite units, as opposed to the shallowerchert and BIF, to be assessed. On the other hand, Plan 14(Figure 6) presented a simpler well trajectory, which wouldrequire less directional drilling to achieve its target placementbeneath the GR35 pit. This was assessed to have a higherprobability of success, especially considering that this wouldbe the world’s first directionally placed dewatering welldrilled in iron ore formations. This plan allowed the lowerrisk associated with the directional drilling component to beassessed against the cost and risk implications of drillingpredominantly within the harder and more fractured chertand BIF units. Eventually, the Plan 14 trajectory was selectedas the preferred option
A cost-benefit analysis was carried out to compare thecurrent approach to dewatering at Sishen, based on the use ofvertical in-pit wells, and the cost associated with developing a
dewatering programme based on DWPt. In addition, anumber of intangible benefits associated with the DWPtapproach were identified, and although the cost benefits ofthese were not assessed their value was to be considered inassessing the DWPt approach. These intangible benefits,which are applicable for other Sishen open pits and nearbymines (Kolomela), included:
‰ Improved in-pit safety environment due to reducedpersonnel movements in the pit related to dewateringactivities, and reduced in-pit infrastructure associatedwith dewatering
‰ Simplified mine planning due to removal of the need toincorporate dewatering infrastructure and maintenancein-pit
‰ Improved dewatering leading to:– More efficient and cheaper blasting. The reduced
block size resulting from more effective blastingwill in turn reduce the need for crushing,grinding, and potentially drying of material anddouble-hauling
– Reduced mining equipment maintenance due tolower humidity and acid rock drainage (ARD)generation at the mining front
– Improved ore transportation efficiency due to thereduction in the volume of water carried in ore
– Dewatering infrastructure that will remain in useafter backfilling of the GR35 pit, thus supportingongoing site-wide dewatering supporting GR80pit.
Overall, multiple conventional vertical well dewateringscenarios were evaluated against the chosen DWP plan. Thevalues for lost revenue were calculated on the basis thatbenches that could not be mined as a result of highgroundwater levels and/or changes to the mine plan as aresult of insufficient dewatering would be ‘lost’. The value ofore contained in the various benches as per the mine planwould as a result be defined as ‘lost revenue’. These weredescribed as follows:
‰ Scenario 1: ‘Most Likely’ – conventional dewateringcontinues as planned and two benches in the base ofthe pit are lost
‰ Scenario 2: ‘Least Likely’ – a best-case scenario whereconventional dewatering continues as planned and nobenches are lost
‰ Scenario 3: ‘Worst Case’ – a worst-case scenario whereconventional dewatering continues as planned but fourlevels in the base of the pit are lost
‰ Scenario 3: ‘DWP’ – the planned DWP is executedsuccessfully and all levels in the pit are mined.
The results of the trade-off analysis indicated thatalthough the estimated capex for continued vertical welldewatering was less than that of the proposed DWPt plan, thecost differential was offset by the estimated cost savingrelated to more efficient dewatering, and the resultingreduction in wet mining and water haulage. Additionally, inthe event that the GR35 mine plan could not be met as aresult of constraints related to the conventional dewateringsystem (such as evaluated in Scenarios 1 and 3), high-gradeore representing up to US$80 million in revenue could havebeen lost. Figure 7 shows the relative costs calculated for thevarious scenarios, clearly indicating that the greatesteconomic risk lies with potential lost revenue associated withlost benches as a result of the inadequacy of the conventionaldewatering system. The lost revenue values used in the cost-benefit analysis were calculated at iron ore prices of US$50 toUS$56 per ton, depending on the accessible volumes of fineand lump ore remaining for each bench in the GR35 pitaccording to the mine plan at the time.
s
234 march 2017 VOLUME 117 The Journal of the Southern African Institute of Mining and Metallurgy

Adapting oil and gas drilling techniques for the mining industry
The Journal of the Southern African Institute of Mining and Metallurgy VOLUME 117 march 2017 235 s
Figure 5—GR35 pit with the location of the DWP collar and drill path shown relative to critical structures and surface infrastructure

Adapting oil and gas drilling techniques for the mining industry
Considering that the cost-benefit analysis was conductedusing depressed iron ore prices in the same range as thecurrent iron ore price, the trade-off analysis demonstrates theclear economic benefits of deploying DWPt for the GR35 pit atSishen. However, the significant decline in iron ore prices andiron ore market fundamentals in 2014/15 resulted in amarked slowing of the rate of vertical advance in GR35 pitand significant changes to the mine plan. This enableddewatering of the pit at a slower rate using the existingconventional dewatering system and resulted in DWPt beingindefinitely delayed for the GR35 pit. However, since KIOremains committed to deploying the latest technologies attheir Sishen and Kolomela operations in an effort to increaseproductivity and efficiency (Mining Review Africa, 2016),DWPt as a concept has been retained to address the potentialdewatering requirements for other deep pits at Sishen andKolomela should conditions warrant it.
Conclusion
As the mining industry is driven to exploiting ore resourcesthat are deeper and in more inaccessible areas than everbefore, systems previously thought to be robust solutions areincreasingly being exposed as sub-optimal as mines getdeeper and larger. The use of vertical dewatering wells issuch an example, as the best hydrogeological targets cannot
always be reached from the available drilling locations.Additionally, a drive to increase efficiency and productivitythroughout the industry further pushes operations to reducein-pit dewatering infrastructure and to improve the overalleffectiveness of dewatering systems in the most cost-effectivemanner possible. As shown in this paper, the adaptation ofmature directional drilling technologies has broughtsignificant benefits to some of the largest open pit operationsthrough the deployment of directional well placementtechnology. It is expected that as pits continue to get largerand deeper, and less in-pit space is available, the use of thistechnology will become more common as it is accepted as acost-effective method for dewatering.
References
ASTRUP, J., HAMMERBECK, E.C.I., and VAN DEN BERG, H. 1998. Iron. The MineralResources of South Africa. Wilson, M.G.C. and Annhaeusser, C.R. (eds.).Handbook 16. Council for Geoscience, Pretoria, South Africa. pp. 402-416.
DOWLING, J. and RHYS-EVANS, G. 2015. Oilfield directional well placementtechnology used for mine dewatering. Mining Magazine. May 2015. p. 28.
KUMBA IRON ORE. 2016a. Operations. http://www.angloamericankumba.com/our-business/operations.aspx [Accessed 21 April 2016].
KUMBA IRON ORE. 2016b. Kumba Iron Ore Limited production and sales reportfor the quarter ended 31 March 2016.http://www.angloamericankumba.com/media/press-releases/2016/21-04-2016.aspx [Accessed 21 April 2016].
MCCARTNEY, J. and ANDERSON, M. 2015. Mining innovation – why start fromscratch. Mining Magazine. December 2015. p. 48.
MINING REVIEW AFRICA. 2016. Kumba says technology a company game-changer.http://www.miningreview.com/news/kumba-says-technology-a-company-game-changer/ [Accessed 11 May 2016].
NEL, E. and WHITE, T. 2015. Groundwater report, November 2015. Kumba IronOre Limited, Kathu, South Africa. 21 pp.
SCHLUMBERGER WATER SERVICES. 2015. Technical feasibility study for dewateringwell placement technology at the GR35 Pit, Sishen Mine. Report no.53810R2v11. Johannesburg, South Africa. 129 pp.
SCHLUMBERGER WATER SERVICES. 2014. Pre-feasibility assessment of the use ofdewatering well placement technology at the GR35 Pit, Sishen Mine.Report no. 53810R1v1. Johannesburg, South Africa. 62 pp. u
s
236 march 2017 VOLUME 117 The Journal of the Southern African Institute of Mining and Metallurgy
Figure 7—Chart showing the results of the cost-benefit analysis
conducted for the Sishen GR35 DWP project TFS. The graph clearly
shows that the costs associated with DWP are lower than all other
scenarios, including the ‘Least Likely’, but especially relative to the
‘Most Likely’ and ‘Worst Case’ scenarios
Figure 6—The final Plan 14 directional well trajectory and proposed construction
How do we increase productivity usingtechnology as the driver for change? Fromstudies in mining tunnelling it is obvious thatdevelopments in drilling technology, as well asincreased drilling rates, have not led to asignificant increase in the rate of tunneldevelopment. Drilling rates with mechanizeddrills have increased fivefold in the last 50years, while tunnel development rates inmechanized mining operations have reduced toabout one-third of those 50 years ago.
The biggest obstacle to lower cost andsafer mining in narrow-reef orebodies, typicalof the gold, platinum, and chrome mines foundin southern Africa, is the blasting cycle, withits inherent poor utilization of the miningassets. In conventional mining operations, thetotal face working time is typically less thaneight hours per day and less than seven days aweek. In reality only 25% of the totallyavailable time is utilized to generate revenue(Fenn, 2016). What is required is a technologythat allows for continuous mining, therebymaximizing the use of the asset. By
implementing some form of non-explosivemining the rate of face advance can beincreased and the length of face being workedcan be reduced, which leads to more concen-trated mining. Concentrated mining means lessservice infrastructure, less ventilation, andmore effective management. In soft-rockmining this has been achieved with theintroduction of pick-cutting machines, such asroad-headers, shearers, and continuousminers. The introduction of pick-cutting in thecoal mining industry in the 1950s led themove away from blasting and by the mid-1990s fatalities, measured in deaths permillion tons produced, had reduced to only1.6% of the 1947 figure and productivity atBritish Coal, measured in tons per employee,had risen by more than 20 times compared tothe blasting era (Pickering, 2004). Replacingblasting with cutting also reduces the blastdamage to the surrounding rock and increasessafety. Operating 24/7 results in much higherrates of face advance in development ends,leading to shorter lead times to production andbetter NPV returns Thus, we see that the moveto non-explosive mining had a major impacton safety, productivity, operating costs,, andreturn on invested capital.
The only rock-cutting machines that havebeen operated successfully in hard-rockmining are raise-boring machines and, in verylimited applications, tunnel-boring machines(TBMs). All these machines use discs orbuttons to break the rock, primarily incompression; and to overcome the high
Controlled foam injection: a new andinnovative non-explosive rockbreakingtechnologyby R.G.B. Pickering* and C. Young†
Controlled foam injection, or CFI, is a highly effective, novel non-explosiverockbreaking technology that with appropriate implementation andapplication can replace traditional drilling and blasting methods withdrilling and non-explosive breaking. The CFI technology is safer, moreproductive, environmentally friendly, and fully developed; and it canoperate with the same flexibility as more traditional small-hole drillingand blasting. To date, CFI has been regarded as an interestingrockbreaking process that could be used only in a few specializedapplications. However, in extensive trials it has successfully broken everyrock type encountered and in reality it could be used in place of all miningand civil engineering rockbreaking processes that utilize explosives inshort and small-diameter blast-holes. The narrow-reef hard-rock mines,typical of the southern African gold, platinum, and chrome sectors areunder severe pressure to mechanize and preferably operate on a 24/7basis, and this could be achieved through the application of CFI. What isstill outstanding is a suitable machine to fit a defined application, such astunnel development or stoping.
non-explosive rockbreaking, controlled foam injection, mining cyble,continuous operatios.
* Rod Pickering & Associates, Port Alfred, EasternCape, Cape Town, South Africa.
† CFI Technologies, Steamboat Springs, Colorado.© The Southern African Institute of Mining and
Metallurgy, 2017. ISSN 2225-6253. This paperwas first presented at the New technology andinnovation in the Minerals Industry Colloquium’,9–10 June 2016, Emperors Palace, Johannesburg,South Africa.
237VOLUME 117 �
http://dx.doi.org/10.17159/2411-9717/2017/v117n3a5

Controlled foam injection: a new and innovative non-explosive rockbreaking technology
compressive strength of the rock requires very high forces,massive machines to supply these forces, high power, andconsequently high capital cost. This is exacerbated by thehigh running cost of these machines due to the exceedinglyhigh abrasivity of the rock. To make matters worse, thesemachines are difficult to manoeuvre, which makes followingthe reef very difficult, if not impossible, and furthermore theyonly cut circular openings.
Original equipment manufacturers (OEMs) haveconducted extensive work, often funded by miningcompanies, to develop rock-cutting machines for hard-rockmining. Because of the inherent inefficiencies of cutting hardrock in compression, some OEMs have developed rock-cutting machines that attack the rock in an undercuttingmode to break the rock in tension, as the tensile strength ofthese hard rocks is 5–10% of the compressive strength. Someexamples are:
� The Mobile Tunnel Miner (MTM6), first developed byWirth in the 1990s for HDRK and recently given a newlease of life by Rio Tinto when a new machine fortunnel development was commissioned (TunnellingJournal, 2010). Within a few months of goingunderground in 2012 the project was cancelled. It is notknown if this was due to technology challenges or achange in mine ownership (Delabio, 2015)
� The Sandvik MN220 Reef Miner, previously known asthe ARM 1100, was first developed in 2001 andextensively developed over the next four years(Pickering et al., 2006). It recommenced trials in 2014.Despite achieving defined key performance indicatorsduring both trial periods it still has not beenimplemented as a mining machine, and the requiredassociated mining system is currently being optimized(Janicijevic and Valicek, 2015).
To date, no-one has been able to develop a hard-rockcutting machine for everyday commercial use in the miningindustry, other than for the specialized application of raise-boring circular shafts and a few specialized TBM-driven mineaccess projects.
The above story is interesting and has been told manytimes to justify the introduction of new technology. However,the recent work carried out by the Chamber of Mines sheds anew light on the possible future of the gold and platinummines in South Africa. This work was presented at the NewTechnology and Innovation in Mining Colloquium organisedby the SAIMM and is part of the Mining Phakisa initiative.
Figure 1 shows predicted production from the gold andplatinum mines in South Africa. In each graph the block onthe left is production from conventional mining and indicatesthe predicted closure of the gold and platinum mines by2026; unless the mines mechanize. The central blockindicates an increased lifespan if the mines are mechanizedwith drill-and-blast operations, and the block on the far rightshows how the life of the mines could be extended until themiddle of this century through the introduction of non-explosive mechanized mining operating 24/7. It has beenstated that without this drive to modernize mining it will notbe possible to unlock the potential to:
� Achieve zero harm and get closer to the goal ofeliminating fatalities
� Mine South Africa’s deep-level orebodies profitably.
Consequently, without modernization, 200 000 jobs couldbe lost by 2030 (Macfarlane, 2016).
In today’s environment of high energy costs, the energyefficiency of the rockbreaking process is also of paramountimportance. The graphs in Figure 2 clearly show how thespecific energy consumption per cubic metre of rock broken isdirectly proportional, on this log-log graph, to the fragmen-
�
238 VOLUME 117
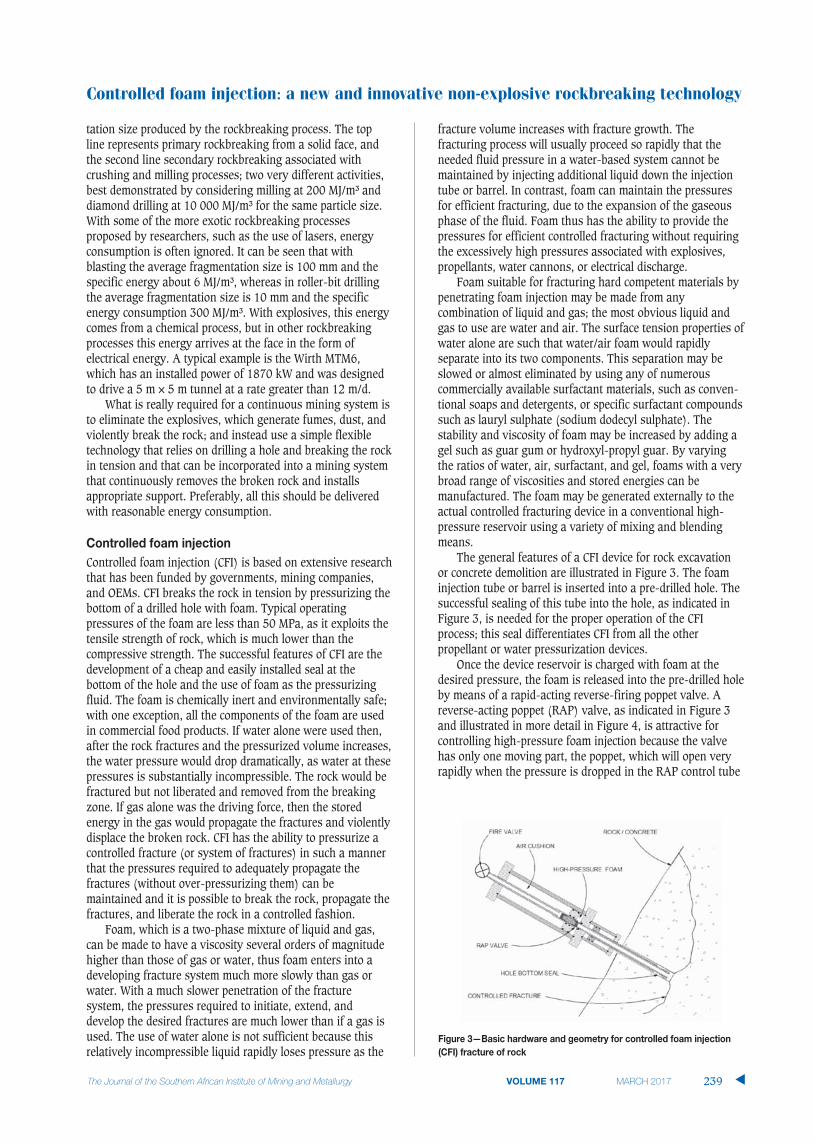
tation size produced by the rockbreaking process. The topline represents primary rockbreaking from a solid face, andthe second line secondary rockbreaking associated withcrushing and milling processes; two very different activities,best demonstrated by considering milling at 200 MJ/m³ anddiamond drilling at 10 000 MJ/m³ for the same particle size.With some of the more exotic rockbreaking processesproposed by researchers, such as the use of lasers, energyconsumption is often ignored. It can be seen that withblasting the average fragmentation size is 100 mm and thespecific energy about 6 MJ/m³, whereas in roller-bit drillingthe average fragmentation size is 10 mm and the specificenergy consumption 300 MJ/m³. With explosives, this energycomes from a chemical process, but in other rockbreakingprocesses this energy arrives at the face in the form ofelectrical energy. A typical example is the Wirth MTM6,which has an installed power of 1870 kW and was designedto drive a 5 m × 5 m tunnel at a rate greater than 12 m/d.
What is really required for a continuous mining system isto eliminate the explosives, which generate fumes, dust, andviolently break the rock; and instead use a simple flexibletechnology that relies on drilling a hole and breaking the rockin tension and that can be incorporated into a mining systemthat continuously removes the broken rock and installsappropriate support. Preferably, all this should be deliveredwith reasonable energy consumption.
Controlled foam injection (CFI) is based on extensive researchthat has been funded by governments, mining companies,and OEMs. CFI breaks the rock in tension by pressurizing thebottom of a drilled hole with foam. Typical operatingpressures of the foam are less than 50 MPa, as it exploits thetensile strength of rock, which is much lower than thecompressive strength. The successful features of CFI are thedevelopment of a cheap and easily installed seal at thebottom of the hole and the use of foam as the pressurizingfluid. The foam is chemically inert and environmentally safe;with one exception, all the components of the foam are usedin commercial food products. If water alone were used then,after the rock fractures and the pressurized volume increases,the water pressure would drop dramatically, as water at thesepressures is substantially incompressible. The rock would befractured but not liberated and removed from the breakingzone. If gas alone was the driving force, then the storedenergy in the gas would propagate the fractures and violentlydisplace the broken rock. CFI has the ability to pressurize acontrolled fracture (or system of fractures) in such a mannerthat the pressures required to adequately propagate thefractures (without over-pressurizing them) can bemaintained and it is possible to break the rock, propagate thefractures, and liberate the rock in a controlled fashion.
Foam, which is a two-phase mixture of liquid and gas,can be made to have a viscosity several orders of magnitudehigher than those of gas or water, thus foam enters into adeveloping fracture system much more slowly than gas orwater. With a much slower penetration of the fracturesystem, the pressures required to initiate, extend, anddevelop the desired fractures are much lower than if a gas isused. The use of water alone is not sufficient because thisrelatively incompressible liquid rapidly loses pressure as the
fracture volume increases with fracture growth. Thefracturing process will usually proceed so rapidly that theneeded fluid pressure in a water-based system cannot bemaintained by injecting additional liquid down the injectiontube or barrel. In contrast, foam can maintain the pressuresfor efficient fracturing, due to the expansion of the gaseousphase of the fluid. Foam thus has the ability to provide thepressures for efficient controlled fracturing without requiringthe excessively high pressures associated with explosives,propellants, water cannons, or electrical discharge.
Foam suitable for fracturing hard competent materials bypenetrating foam injection may be made from anycombination of liquid and gas; the most obvious liquid andgas to use are water and air. The surface tension properties ofwater alone are such that water/air foam would rapidlyseparate into its two components. This separation may beslowed or almost eliminated by using any of numerouscommercially available surfactant materials, such as conven-tional soaps and detergents, or specific surfactant compoundssuch as lauryl sulphate (sodium dodecyl sulphate). Thestability and viscosity of foam may be increased by adding agel such as guar gum or hydroxyl-propyl guar. By varyingthe ratios of water, air, surfactant, and gel, foams with a verybroad range of viscosities and stored energies can bemanufactured. The foam may be generated externally to theactual controlled fracturing device in a conventional high-pressure reservoir using a variety of mixing and blendingmeans.
The general features of a CFI device for rock excavationor concrete demolition are illustrated in Figure 3. The foaminjection tube or barrel is inserted into a pre-drilled hole. Thesuccessful sealing of this tube into the hole, as indicated inFigure 3, is needed for the proper operation of the CFIprocess; this seal differentiates CFI from all the otherpropellant or water pressurization devices.
Once the device reservoir is charged with foam at thedesired pressure, the foam is released into the pre-drilled holeby means of a rapid-acting reverse-firing poppet valve. Areverse-acting poppet (RAP) valve, as indicated in Figure 3and illustrated in more detail in Figure 4, is attractive forcontrolling high-pressure foam injection because the valvehas only one moving part, the poppet, which will open veryrapidly when the pressure is dropped in the RAP control tube
Controlled foam injection: a new and innovative non-explosive rockbreaking technology
VOLUME 117 239 �

Controlled foam injection: a new and innovative non-explosive rockbreaking technology
behind the poppet. As soon as the poppet moves, thereservoir foam pressure will act on the full sealing face of thepoppet, causing it to retract or open quite rapidly. The high-pressure foam will then be rapidly delivered to the bottom ofthe hole and effect a controlled fracturing of the rock. Rapidopening is important so that the bottom of the pre-drilledhole may be brought to a high enough pressure rapidlyenough to induce the desired combination of hole-bottomfracturing and radial fracturing needed to achieve completefragmentation.
It is desirable to avoid injecting more foam than is neededto achieve the required fracturing. Excess foam injectionrepresents a waste of energy and would result in someincrease in the (albeit low) air blast and fly-rock associatedwith CFI fracturing. An effective means of controlling theamount of foam injected is by incorporating an annularfloating piston into the foam reservoir as shown in Figure 4.This piston separates the rear portion of the reservoir, whichneed only contain a high-pressure air cushion, from theforward portion which contains the foam. The accumulatoreffect of this piston allows for the displacement and injectionof a desired foam charge into the barrel and hole bottomwithout a significant drop in the accumulator pressure. Thisfeature further increases the energy efficiency of the CFIrockbreaking process.
The sealing method for CFI fracture utilizes an injectiontube with a bulb enlargement at its tip and an annularhydraulic piston acting around the smaller barrel of the tube,as illustrated in Figures 3 and 4. Sealing is effected bycrushing an annulus of deformable material between the bulbtip and the annular piston. The crushing is effected with theannular sleeve on the CFI barrel driven by an annular piston.The crushing of this material along the axis of the holecauses it to expand radially and seal against the hole wallnear the bottom of the hole. Application of high-pressurefoam will cause the barrel and bulb tip to retract and furtherjam the material against the hole wall. With the properselection of bulb tip angle and deformable material, the recoilwill further jam the material against the hole wall andmaintain a very effective seal. Any deformable material maybe used, but granular materials such as sand, fine gravel, or acementitious mix have been found to work well. Tests to datewith a variety of cementitious materials have given excellentsealing, with negligible gas/foam leakage occurring around
the barrel when breaking hard granite at pressures as high as83 MPa.
An example of the seal effectiveness is shown in Figure 5. The air reservoir trace is taken from behind theannular floating piston (see Figure 4), and the other trace isfrom the foam reservoir. The records in Figure 5 show theinitial foam reservoir pressure of nearly 55 MPa (8 000 psi)prior to opening of the valve and the rapid drop of bothpressures to 48 MPa (7 000 psi) as the hole is charged. Asindicated in Figure 5, the 48 MPa foam pressure was not ableto immediately fracture the rock and there was a 7.4 seconddelay before the rock fractured, with the seal holding firmlyat this pressure. Once fracture was initiated the fracturingprocess was completed quite rapidly, with nearly 0.5 t of rockbeing excavated in a fraction of a second. Once fracture wasinitiated the foam pressure rapidly dropped to zero and theair-cushion pressure dropped 45 MPa.
There are other significant benefits derived from theunique viscous properties of foams. The viscosity of foamdepends strongly upon foam quality, defined as the volumefraction of gas. Foams of gas volume fraction less than 50%typically have viscosities only slightly higher than that of theliquid phase. As the gas volume fraction increases from 50%up to about 90%, foam viscosity increases markedly and canbe more than an order of magnitude higher than that of theliquid phase. As the foam gas volume fraction increasesabove 95%, the foam breaks down into a mist and theviscosity drops rapidly to approach that of the gas phase. In aCFI fracturing operation the foam might be generated initiallywith a gas volume fraction below 50%, albeit at very highpressure. As the foam expands into the developing fracturesystem, the gas volume fraction will increase with aconcordant increase in viscosity until the foam has expandedto a 95% or greater quality. This variation of effectiveviscosity with expansion serves to improve the efficiency ofthe CFI process in two ways. While the higher pressure foamis being generated, delivered to the injection device, andinjected via the barrel into the hole, viscosity will be low, asdesired. Once the rock or concrete begins to fracture, thefoam expands and viscosity increases, preventing thepremature escape of the pressurizing medium beforebreakage is complete. Once breakage is complete the foamexpands further, and as a gas volume fraction over 95% isrealized, the viscosity drops, allowing the foam (now a gasmist) to escape more rapidly and thus reducing the timeduring which high-pressure foam can accelerate fragments of
�
240 VOLUME 117

the broken material. By appropriate design of the foam, asequence of viscous behaviours optimally tailored to the foaminjection/material-breakage process can be achieved. Thismodification of foam properties is a simple process that canbe carried out by the operator.
The rockbreaking characteristic of CFI dictate that theinitial fracture is propagated from the bottom of the drilledhole at an angle of about 45º before curving around to thesurface, as shown in Figure 2. This initial fracture breaks aslab of rock that is roughly three times greater in diameterthan the depth of the hole. The structure of the rock dictatesthe final fragmentation. Further than the initial penetration ofthe fracture below the drilled hole there is no additionaldamage to the sidewall or hanging of the excavation. Inblasting, the shock wave generated by the blast can causeextensive damage to the surrounding rock, and work byPusch and Stanfors (1992) has shown that in a typicalmechanized mining operation where the perimeter holes aredrilled with a 43 mm bit and charged with pneumaticallyloaded ANFO, the depth of induced fracturing will be between2.5 m and 3 m (Figure 6).
During fracturing by blasting, excessive dust is releasedfrom the zone of crushed rock around the blast-hole. Evenwhen propellants are used to break the rock, and there is nozone of crushed rock, dust is generated during the rockfracturing process. No measurements of dust generatedduring the rockbreaking process using CFI have been made;however, after the break has been completed, the surface ofthe exposed rock of the primary fracture is covered in asmear of foam, and it is considered that this effectivelyreduces the amount of dust generated. Subsequent fracturingwill generate dust from the fracture planes. When CFI isincorporated into a mining machine it may be necessary tointroduce further dust alleviation methods such as floodingthe breaking zone with a water mist, as in coal cutting.
Field tests with the 51 mm diameter device were carriedout at the Colorado School of Mines (CSM) test mine locatedin Idaho Springs, Colorado. The rocks in this mine range fromhighly fractured gneiss to massive and competent schist andgneiss. Tests in the mine environment also allowed for theeffects of developing face geometry and successive breakageinteractions to be observed. For example, the influence ofrock anisotropy and jointing upon breakage was evaluated.Similarly, the sensitivity of breakage to foam properties as
controlled by surfactant, additives, and gas concentration wasstudied.
The tests conducted at the CSM experimental mineprovided confirmation on scaling of the CFI process. Existingdata on rock breakage by a variety of methods indicates thatthe efficiency of breakage improves with the scale ofbreakage. Thus, the energy required to excavate a unitvolume of rock decreases with increasing scale of breakage.This effect is primarily due to the interaction of larger andweaker rock defects (fractures, joints, parting planes, etc.)with the process at larger scales. For propellant, gas-drivenfracture the scale enhancement is approximately 50% foreach doubling of the linear scale. That is, a doubling of thehole diameter and an equivalent increase in the devicedimensions should yield eight times the material, but inreality it results in the breakage or removal of twelve times asmuch material. The data for CFI breakage in the CSM testmine, along with data for penetrating cone fracture (PCF)breakage in the same mine, is shown in Figure 7. Both PCFand CFI breakage follow a nonlinear scaling. This nonlinearscaling would be manifested both in a reduction in thepressure required to break rock, and in an increasedbreakage efficiency at larger scales.
During the course of efforts to evaluate the ability of theCFI method to break rock in the CSM mine, considerableexperimental data on the process was obtained. This dataserved to both confirm the proper functioning of theprototype CFI equipment and to provide guidance for themeasurements that might be utilized for process control inmore commercial applications of the method. It wasdetermined that control of the CFI process, including controlof foam quality, could be achieved with simple measurementsof gas pressure in the air-cushion reservoir, and foampressures in the foam generator and subsequently the foamreservoir. Other aspects of a commercial CFI process, such ashole drilling, indexing for CFI injector placement, and hole-seal crushing, could all be monitored and controlled byexisting hardware and techniques utilized in commercialautomated machinery, including remote radio control.
The big question that still needs to be answered is whatthe mining rate will be in a specific application. To date it isestimated that the mining rate from one CFI breaking tool, insolid competent rock, will be between 3 m³/h and 6 m³/h.
Controlled foam injection: a new and innovative non-explosive rockbreaking technology
VOLUME 117 241 �

Controlled foam injection: a new and innovative non-explosive rockbreaking technology
This is based on past experience of the time to complete acycle and experience in breaking from smaller drill-holes. Thescience based on Moore-Gault scaling and experience withPCF and CFI production suggests that with a 63 mm diameterdrill-hole, CFI will break 0.5 m³ per event. To put this inperspective, with a typical 600 mm staggered drilling patternused in gold mining stopes, with a stope width of 1.1 m andan advance of 0.9 m, each drill-hole produces 0.3 m³ of rockfrom the blast. Drilling intensity in platinum mines is higherdue to the tougher rock conditions, and consequentlyproduction per drill-hole is even lower.
CFI has been extensively tested in a variety of differentrock types and thus far all of the rock types have beensuccessfully broken. The component parts required tocompress the air and water and to generate and store thefoam have been engineered and proven. Consequently, it isargued that the CFI technology is already developed – what isstill lacking is a mining machine to accurately demonstratethe mining rate and operating cost in a specific application.The advantages of an integrated CFI mining machine will be asafer mining environment (as was demonstrated when coalmining moved from blasting to non-explosive excavation),low energy consumption, a relatively low capital costcombined with a low operating cost, and it will enable themine to operate 24/7.
The exciting thing about CFI is that it can find applicationwherever small-diameter and short blast-holes have beenused by the mining and construction industries. It can replaceexplosives in these applications and the mining andconstruction industries can have a genuine hard-rock, non-explosive rockbreaking tool. In southern Africa, a differentmachine could be designed and manufactured using CFI asthe rockbreaking technology, and applied for tunneldevelopment and stoping in the entire narrow-reef, hard-rockmining operations typical of the gold, platinum, and chromemining sectors.
The following are some of the obvious applications for atunnel development type of machine:
� In all mining, stoping, and development of narrow-reeftabular orebodies currently mined using a room-and-pillar layout and by mechanized trackless equipment.This is because in room and pillar mining the basicmining operation is tunnel development
� Globally, in all tunnel development for existing andnew mines, whether they are mined conventionally oras mechanized operations.
With time, other specialized machines could be developedfor:
� Narrow-reef stoping at flat and steep dips� Narrow-vein mining practiced all over the world for a
variety of minerals� Breaking through dykes and rock too hard to mine with
continuous miners in mechanized coal mining� Secondary breaking in all cave and longhole open
stoping operations.
Other applications could include the following:
� Many civil rockbreaking activities take place in built-upand congested environments. CFI could solve problemsassociated with noise, vibration, and fly-rock
� TBMs have found extensive application in civil rock
excavation, but in hard rock it is often necessary toexcavate rock not cut by the TBM, such as intercon-nections between two drives or the corners of a roundTBM excavation. CFI could be used as it is a gentlerockbreaking process and the lack of violent fly-rockwould minimize damage to other installedinfrastructure in the already developed and equippedTBM drive.
How do we go about implementing this novel and developedrockbreaking technology in mining machines? CFI has beeninstalled on eight different platforms; in all cases the primaryconcern was to develop and demonstrate the CFI technology.Machines have been tracked and wheel-mounted; thecommon denominator of these vehicles is that they have allused low amounts of power, with a rating of less than 60 kW.The disadvantage of these demonstration units is that nonehave been built for a specific underground application thattakes advantage of the way CFI breaks the rock. Theimmediate requirement is to clearly demonstrate therockbreaking rate and operating cost by building arockbreaking machine based on CFI, which will be the basisfor a mining machine designed to operate in a specificapplication such as tunnelling or stoping. In such a machinethe various CFI parameters of pressure, hole size, and foamcomposition would be varied to determine the optimumrockbreaking performance in the defined application. At alater stage a mining machine that concurrently breaks therock, removes the broken rock from the working face, andinstalls support would be designed and manufactured. At thisstage it is considered that the application that should befocused on is tunnel development.
The machine that comes closest to meeting thisrequirement was developed by Ripamonti and used to breakout safety niches when the Fréjus rail tunnel was recentlyenlarged and refurbished. This machine is shown in Figure 8.
Economic and societal pressures make it essential that thesafety and productivity of the narrow-reef hard-rock miningindustry improves. It is suggested that this can be achievedby replacing drilling and blasting with a novel non-explosiverockbreaking technology. The alternative technology isreferred to as controlled foam injection (CFI). To date, CFI hasbeen regarded as an interesting rockbreaking process for
�
242 VOLUME 117

specialized operations; however, it can operate with the sameflexibility and with higher productivity than more traditionalsmall-hole drill-and-blast operations. Just as in blasting,where the explosive charge weight and composition arevaried to achieve a specific performance, the CFI parametersof pressure, hole size, and foam composition can be varied toachieve different rockbreaking performance. Changes in CFIparameters are simple to make and as rock conditions in atunnel change so CFI parameters can be adjusted. The majorbenefits of CFI can be summarized as follows:
� CFI is safer as it does virtually no damage to the rocksurrounding the excavation due to the controlledmanner in which the rock is fractured. Therockbreaking process is sufficiently gentle to allowworkers in close proximity to mining. There have beenno measurements of dust generated during a CFI event;however, on observing a rockbreaking event it can beseen that the newly fractured surface is covered inwhite foam. Experience with the change from blastingto non-explosive cutting demonstrated a massiveimprovement in safety in coal mining; CFI can have thesame impact on narrow-reef hard-rock mining
� CFI is a very productive and efficient method ofbreaking rock as it generates more broken rock permetre drilled than conventional drilling and blasting.Over a ten-year period of experimentation CFI hassuccessfully broken every rock type in which it hasbeen tested. It is flexible in operation, with the CFIparameters easy to modify for different rock conditions.Installed machine power is low, and the specific energyof rock-breaking is very low when compared to hard-rock cutting. The installed power for the Wirth MTM6 isjust under 2 MW; the power for a CFI machine wouldbe more like 60–90 kW, as the stored energy in thefoam is accumulated over a period of time. The fractureis generated from the bottom of the hole and thusmaximizes the use of the drilled hole. The productionof broken rock per metre drilled is higher than that inconventional drilling and blasting. A machine utilizingCFI will have to drill a hole and then break the rock,and it is envisaged that such a machine will be similarto a mechanized drill rig and consequently the capitalcost of equipment should be similar to electro-hydraulicdrill rigs. Additionally, because of the low powerdemand and low forces the equipment can be light andhence low cost in comparison to a MTM6 or TBM.Operating costs should also be similar to electro-hydraulic drill rigs, with the main costs being drillingconsumables and general operation of the machine
� The CFI breaking process is environmentally friendly asit yields no fumes, no dust (except that released fromexisting rock fractures), very low noise levels, and verylimited fly-rock, so people can work relatively close tothe breaking process. The chemicals used in the foamare totally inert and thus environmentally safe
� The CFI technology is well developed, having been triedand tested for over 15 years. The hardware used toprovide the high-pressure foam has proven to functionreliably over long periods of service. The hardware forgenerating and delivering high-pressure foam to thebottom of the drilled hole has been proven in prototype
rigs. The primary function of these rigs was to developCFI and not to develop a mining machine. Finally, andvery importantly, the sand seal is a very effective andvery low-cost seal. This high-performance seal allowsthe injected foam to maintain the pressures to initiateand propagate the unique hole-bottom fracture.
CFI could be used in place of all mining and civilengineering rockbreaking processes where the rock is brokenby explosives in short, small-diameter blast-holes. Thenarrow-reef, hard-rock mines typical of the southern Africangold, platinum, and chrome sectors would then be able tooperate continuously on a 24/7 basis. The next step will be tomanufacture a narrow-reef mining machine for tunneldevelopment or stoping and prove that this non-explosiverockbreaking technology can be integrated into a machinethat will deliver safer and more productive mining operations.
COOK, N.G.W. and JOUGHIN, N.C. 1970. Rock fragmentation by mechanical,chemical and thermal methods. Proceedings of the Sixth InternationalMining Congress, Madrid.
DELABBIO. 2015. Personal communication.
FENN, A.G. 2016. Unlocking value by reorganizing the operational value chainthrough modernization. Proceedings of the New Technology andInnovation in the Minerals Industry Colloquium. Emperors Palace,Johannesburg, 9–10 June 2016. Southern African Institute of Mining andMetallurgy, Johannesburg. pp. 35–50.
JANICIJEVIC, D. and VALICEK, P. 2015. A review of hard-rock cutting equipmenttechnology development at Anglo American and Anglo Platinum.Proceedings of MPES 2015, Mine Planning and Equipment Selection2015, ‘Smart Innovation in Mining’, Sandton Convention Centre,Johannesburg, South Africa. Southern Institute of Mining and Metallurgy,Johannesburg. pp. 455–468
MACFARLANE, A. 2016. Moving to next generation mining systems: a Chamberof Mines view. Proceedings of the New Technology and Innovation in theMinerals Industry Colloquium. Emperors Palace, Johannesburg, 9-10 June2016. Southern African Institute of Mining and Metallurgy, Johannesburg.
MOORE, H.J., GAULT, D.E., and HEITOWIT, E.D. 1965. Change of effective targetstrength with increasing size of hypervelocity impact craters. Proceedingsof the Seventh Hypervelocity Impact Symposium, Tampa, FL, February1965. Vol. IV (Theory). Martin Co.
PICKERING, R.G.B, SMIT, A., and MOXHAM, K. 2006. Mining by cutting in narrowreefs. Proceedings of the International Platinum Conference – ‘PlatinumSurges Ahead’, Sun City, South Africa, 8-12 October 2006. SymposiumSeries S45. Southern African Institute of Mining and Metallurgy,Johannesburg. pp. 221–230.
PICKERING, R.G.B. 2004. The optimization of mining method and equipment.Proceedings of the First International Platinum Conference, ‘PlatinumAdding Value’, Sun City, South Africa, 3–7 October 2004. SymposiumSeries S38. Southern African Institute of Mining and Metallurgy,Johannesburg. pp. 111–116.
PUSCH, R. and STANFORS, R. 1992. The zone of disturbance around blastedtunnels at depth. International Journal of Rock Mechanics and MiningScience and Geomechanics Abstracts. vol. 29, no. 5. pp. 447–456.
TUNNELLING JOURNAL. 2011. www.tunnellingjournal.com Dec 2010/Jan2011
TURNER, P. 2016. Value creation through modernisation of South Africa’smining industry. Proceedings of the New Technology and Innovation inthe Minerals Industry Colloquium. Emperors Palace, Johannesburg, 9–10June 2016. Southern African Institute of Mining and Metallurgy,Johannesburg.
YOUNG, C. 1999. Controlled-foam injection for hard rock excavation.Proceedings of the 37th US Rock Mechanics Symposium, Vail, CO, 6-9June 1999. American Rock Mechanics Association. �
Controlled foam injection: a new and innovative non-explosive rockbreaking technology
VOLUME 117 243 �

6th Sulphur and Sulphuric Acid2017 Conference
9 May 2017—WORKSHOP10–11 May 2017—CONFERENCE12 May 2017—TECHNICAL VISIT
Southern Sun Cape Sun, Cape Town
OBJECTIVES> Expose SAIMM members to issues
relating to the generation andhandling of sulphur, sulphuric acidand SO2 abatement in themetallurgical and other industries.
> Provide opportunity to producersand consumers of sulphur andsulphuric acid and related productsto be exposed to new technologiesand equipment in the field.
> Enable participants to shareinformation and experience withapplication of such technologies.
> Provide opportunity to role players inthe industry to discuss commonproblems and their solutions.
For further information contact:Conference Co-ordinatorCamielah Jardine, SAIMM
P O Box 61127, Marshalltown 2107Tel: (011) 834-1273/7
Fax: (011) 833-8156 or (011) 838-5923E-mail: [email protected]
Website: http://www.saimm.co.za
EXHIBITION/SPONSORSHIPThere are a number of sponsorshipopportunities available. Companies wishingto sponsor or exhibit should contact theConference Co-ordinator.
Conference Announcement
BACKGROUNDThe production of SO2 and Sulphuric acid remains a pertinent topic in the SouthernAfrican mining, minerals and metallurgical industry. Due to significant growth in acidand SO2 production as a fatal product, as well as increased requirement for acid andSO2 to process Copper, Cobalt and Uranium, the Sub Saharan region has seen adramatic increase in the number of new plants. The design capacity of each of the newplants is in excess of 1000 tons per day.
In light of the current state of the industry and the global metal commodity prices theoptimisation of sulphuric acid plants, new technologies and recapture and recycle ofstreams is even more of a priority and focus. The 2017 Sulphuric Acid Conference willcreate an opportunity to be exposed to industry thought leaders and peers, internationalsuppliers, other producers and experts.
To ensure that you stay abreast of developments in the industry, The SouthernAfrican Institute of Mining and Metallurgy, invites you to participate in a conference onthe production, utilization and conversion of sulphur, sulphuric acid and SO2 abatementin metallurgical and other processes to be held in May 2017 in Cape Town.
WHO SHOULD ATTENDThe Conference will be of value to:> Metallurgical and chemical engineers
working in the minerals and metalsprocessing and chemical industries
> Metallurgical/Chemical/Plant Management> Project Managers> Research and development personnel> Academic personnel and students> Technology providers and engineering
firms for engineering solutions> Equipment and system providers> Relevant legislators> Environmentalists> Consultants
Sponsors:

Determination of rock mass strength isimportant in most rock engineering analysesthat are based on solid mechanics. Betterunderstanding of rock mass strength willfacilitate proper engineering design ofstructures. The loading condition of rock iscomplex, and a rock failure criterion representsthe strength of rock under different loadingconditions. Many failure criteria have beenproposed by researchers during the pastdecades. In rock engineering practice, thelinear Mohr-Coulomb (MC) criterion and thenonlinear Hoek-Brown (HB) criterion arewidely used in conditions where 2 = 3,largely due to their simplicity in formulationand the large amount of experimental dataavailable (Melkoumian, Priest, and Hunt,2009), despite the fact that the physical senseof the former is obscure and the latter is of apurely empirical character. Both theabovementioned criteria suffer limitations
arising from ignoring the effect of theintermediate principal stress ( 2) on rockstrength (Chang and Haimson, 2012;Haimson, 2006; Tiwari and Rao, 2004). Muchof the experimental evidence accumulated sofar strongly suggests that 2 has a consid-erable effect on rock strength (Chang andHaimson, 2012; Tanapol, Chaowarin, andKittitep, 2013; Tarasov and Potvin, 2013). Toincorporate the influence of 2, several generalfailure criteria have been proposed, amongwhich the Drucker-Prager criterion, themodified Lade criterion, the 3D Hoek-Browncriterion, and the unified strength criterion arewell-known (Xie and Chen, 2004). However,these failure criteria are not commonlyemployed in practice. According to severalcomparative studies, none of the existing 3Dfailure criteria has a significant advantage overothers, from both mathematical and practicalpoints of view.
A perceived shortcoming of the traditionalfailure criteria is that they are established onlyon the basis of macroscopic experiments andcombined theoretical analysis, and they do notattempt to microscopically analyse the failuremechanism and failure criterion of rock underdifferent loading conditions. In fact, the studyof deformation and failure of rock on themicro-meso scale can reveal the innatecharacter and relationship between themacroscopic response, in the form ofdeformation or failure, and the intrinsicmicroscopic mechanism (Adelinet et al., 2013;Lin et al., 2015; Zhou and Linn, 2013; Zhouand Linn, 2014).
An investigation of failure modes andfailure criteria of rock in complexstress statesby Z. Li*, J. Shi*, and A. Tang*
Rock in engineering and geological environments is usually in complexstress states. Based on many experimental results for rock under differentloading conditions, and combined with failure modes found in previousstudies, stress triaxiality is introduced to describe different stress states,and the relationship between failure modes and stress triaxiality isanalysed in detail. For a given kind of rock, with decreasing stresstriaxiality the failure mechanism changes from tension fracture to localshear failure and general shear failure. Two demarcation points of stresstriaxiality exist: between tension fracture and local shear failure, andbetween local shear failure and general shear failure. The controllingparameters that dominate tension fracture, local shear failure, and generalshear failure are different. Using a reasonable assumption based on theexperimental results, a failure criterion corresponding to three distinctfailure modes is presented. This failure criterion is defined by sevenmaterial parameters. The accuracy and applicability of the proposedfailure criterion are examined using experimental data derived forsandstone in this study and published experimental data for rock salt andmarble under conventional triaxial compression tests. The data usedcovers a wide range of stress triaxiality and various failure mechanisms.The predictions from the proposed failure criterion agree well with theexperimental data.
rock mechanics, tension fracture, shear failure, stress triaxiality, failurecriterion.
* School of Civil Engineering and Architecture, Xi’anUniversity of Technology, Xi’an, China.
© The Southern African Institute of Mining andMetallurgy, 2017. ISSN 2225-6253. Paper receivedJun. 2015; revised paper received Dec. 2015.
245VOLUME 117 �
http://dx.doi.org/10.17159/2411-9717/2017/v117n3a6

An investigation of failure modes and failure criteria of rock in complex stress states
Over the past few decades, many researchers havedevoted considerable effort to the study of failure anddeformation of rock under different loading conditions fromboth the microscopic and mesoscopic points of view (Aroraand Mishra, 2015; Cai and Liu, 2009; Kittitep and Decho,2012; Loaiza et al., 2012; Tang and Hudson, 2010; Wongand Baud, 2012; Xie et al., 2012; Yang et al., 2008; Yang,Jing, and Wang., 2012; Zhong, Liu, and Ma., 2015). Whenthe confining pressure is zero or very low, macroscopicfailure is typically associated with axial splitting. As theconfining pressure is increased, the failure process changes toa macroscopic shear failure. Loaiza (2012) also observed twodeformation modes of basaltic rock under triaxial loading. Atlow confining pressure, shear localization occurs. At highconfining pressure, shear-enhanced compaction appears.Amann, Kaiser, and Button (2012) suggested that brittlefailure processes tend to be suppressed when the confiningpressure is increased beyond a threshold. Xie (2004) outlinedthe failure modes of rock under several common loadingconditions including splitting under uniaxial compression,shear failure under conventional triaxial compression withmedium confining pressure, and plastic failure under conven-tional triaxial compression with high confining pressure.Several laboratory studies on artificial materials with inclinedpre-existing flaws under uniaxial and biaxial compressiveloading conditions have been utilized to investigate theinfluence of 3 on fracture propagation and the resultingfailure mode. The results suggest that confinementsuppresses the growth of propagating tensile microcracks(Salvador, Rafael, and Alexandra, 2013; Yang, Jing, andWang, 2012). Szwedzicki (2007) asserted that the variationsin uniaxial compressive strength values of samples from thesame lithology depend on the failure mode. Within the samefailure mode, the variations may be relatively small. Whenvarious failure modes take place in similar samples,variations can often be very large. This means that the failuremode affects the resultant strength of the sample. Theseexperimental studies collectively show that the stress statehas a strong influence on the failure processes and theresulting failure mode, and the way in which the sample failsaffects the obtained strength of rock samples. This should beconsidered in the development of a failure criterion. Thestrength value is a function of the failure mode. An idealfailure criterion should be able to predict not only the stressstate at failure but also the failure mode. The dominantfactors for different failure modes also vary, so it is difficultto correctly predict different kinds of failure using a singlefailure criterion. However, the relationship between thefailure mode and strength parameters has not beeninvestigated, and a failure criterion that can incorporate theeffect of different failure modes is rarely applied. The effect ofthe stress state on the rock failure and deformability has alsobeen inadequately investigated.
It has been pointed out that a common deficiency inassessment of the rock strength is that it does not take intoaccount the failure mode of rock. This could explain the largerange of experimental results obtained on rock samples. Inthe present study, an attempt will be made to establish a newfailure criterion based on three different failure modesproposed in previous research. Here, the stress triaxiality isselected to measure different failure modes for a given type of
rock. The factors that influence the occurrence of differentfailure modes are investigated and the parameters thatcontrol failure are determined. Therefore, this failure criterionis widely applicable to different failure modes. Furthermore, itcan predict not only the stress state at failure but also thefailure mode. In the proposed criterion, seven materialparameters are used. The physical meaning of theseparameters and the procedures for determining them arepresented. The accuracy of this proposed criterion isdemonstrated by examining the experimental data onsandstone in this study and other rock types from theliterature.
Let ij be the stress tensor and 1, 2, and 3 the principalstresses, and assume that 1 2 3. The mean stress andthe equivalent (Von Mises) stress can be expressed as
[1]
[2]
We here consider an infinitesimal volume elementsubjected to a three-dimensional stress state and introducethe ( 1, 2, 3) coordinate system. The stress state ij can beconveniently represented as a point P( 1, 2, 3) in theprincipal stress space, as shown in Figure 1a. ON is a linepassing through the origin and is at equal angles with thecoordinate axes. This is known as the isoclinal line, andevery point along this line corresponds to a hydrostatic stressstate. The planes perpendicular to ON are termed isoclinalplanes, and the hydrostatic stress is constant on these planes.The plane perpendicular to ON and passing through theorigin is referred to as the plane and the hydrostatic stressis zero on this plane. Considering an arbitrary stress state atthe point P with 1, 2, and 3, the stress vector OP can bedecomposed into the components
1parallel to ON and r
1
perpendicular to ON. The magnitude of 1
and r1
can beobtained by:
[3]
[4]
where m and e are the mean stress and the equivalent stressrespectively.
To quantify the effect of the stress state on the failuremode of rocks, a dimensionless parameter called stresstriaxiality is introduced to indicate the infinitesimal volumeelement (see Figure 1a) and to reveal stress states underdifferent loading conditions. Stress triaxiality is representedR by and defined as
[5]
R is given by:
�
246 VOLUME 117

[6]
It is obvious that, for a given stress triaxiality ratio R , wehave an infinite number of stress states, each of whichcorresponds to a point on the conical surface with the axisON (Figure 1b). For a stress state with specific stresscomponents, 1, 2, and 3, R can be determined uniquely,with its value reflecting the ratio of the volumetric strain tothe elastic shear strain.
The calculation results for stress triaxiality in severaldifferent stress states are given in Table I. It should be notedthat the principal stresses in the stress states of triaxialtension and conventional triaxial compression in Table I areassumed.
As shown in Table I, with the stress states changingprogressively from triaxial tension to uniaxial tension,uniaxial compression, and triaxial compression, the value ofstress triaxiality decreases constantly. If the value of stresstriaxiality is positive, the stress state is tension and the largerthe value of stress triaxiality, the stronger the degree oftension. If the value of stress triaxiality is negative, the stressstate is compression and the smaller the value, the strongerthe degree of compression. It has been widely postulated thatthe failure mechanism depends upon the stress state for agiven type of rock. The one-to-one relationship between eachstress state and the value of its stress triaxiality is obvious
and perfect, so it can reasonably reveal the influence ofdifferent stress factors on deformation and failure of rocksand the resulting failure mechanism. For a given type of rock,within a certain range, if the stress triaxiality is large, thevolumetric deformation is relatively large due to the tension-dominated stress state, and thus the rock tends to fail bytensile fracture. If the stress triaxiality is small, the elasticshear strain is relatively large due to the compression-dominated stress state, and thus shear failure tends to takeplace. Under the stress state of triaxial equivalentcompression with the value of stress triaxiality as – , theshear stress is too little, and shear failure is difficult toachieve. This is mainly because, as is generally believed, thatit is the tension stress that causes tension fracture and theshear stress dominates in the occurrence of shear failure, butcompressive stress usually cannot lead to failure, but resultsin welding. Moreover, once stress triaxiality is introduced todescribe the stress state, there is a uniform standard forcomparing and combining the experimental results inconventional triaxial compression ( 1 2 3) with otherloading conditions where all three principal stresses differmore in value.
In following sections we present experimental andnumerical investigations to evaluate the effects of stress stateon the deformation and failure of rock. These effects will beevaluated by R .
Various failure mechanisms and failure modes of rocks havebeen put forward in many published documents (Tien, Kuo,and Juang, 2006; Wong and Baud, 2012; Xie et al., 2011).However, these different failure modes have not beenclassified, and different stress states have not beenconsidered in interpreting the experimental results, nor hasthe relationship between failure modes and strengthparameters been investigated. Laboratory testing proved thatmany factors, including loading condition, confiningpressure, and extent of microscopic discontinuities, couldcontribute to different failure modes of a rock sample.
It is known that different failure mechanisms and failuremodes will manifest under various loading conditions. Underuniaxial compressive stress, due to localized stress concen-trations around microscopic discontinuities, rock samplesmay fail in tension or in shear. In general, tension failuretends to occur in the most brittle rock, and shear failure willoccur in fine-grained rock (Szwedzicki, 2007; You, 2009).Under conventional triaxial compression with higherconfining pressures, shear failure tends to occur in most rocktypes, and this has been verified by many experiments(Tanapol, Chaowarin, and Kittitep, 2013; Tarasov and Potvin,2013; Tiwari and Rao, 2004). Shear failure has beenextensively observed in a certain stress state for a given typeof rock. Which failure mode will appear in many otherloading conditions – tension or shear failure? However, toour knowledge, this has not been reported yet. Therefore, weneed to further clarify the complex relationship betweenfailure mode and stress state.
In order to investigate the influence of stress state and itsrelationship with failure mode, conventional triaxialcompression tests were conducted on sandstone and the
An investigation of failure modes and failure criteria of rock in complex stress states
VOLUME 117 247 �
Table I
Triaxial inequivalent tension 0.5 1.67Biaxial equivalent tension 0 0.67Uniaxial tension 0 0 0.33Pure shear 0 – 0Uniaxial compression 0 0 – –0.33Conventional triaxial compression –0.2 –0.2 – –0.58Conventional triaxial compression –0.4 –0.4 – –1.00Conventional triaxial compression –0.6 –0.6 – –1.83Triaxial equivalent compression – – – –∞
Notes: The values of stress triaxiality in different stress states. In Table IR denotes the value of stress triaxiality corresponding in different stressstates, 1, 2, and 3 are the principal stresses, and it is assumed that 1≥ 2 ≥ 3 according to the positive-negative prescription of stress in elasticmechanics

An investigation of failure modes and failure criteria of rock in complex stress states
fracture surfaces of samples tested under different confiningpressures were studied by scanning electron microscopy(SEM). Sandstone specimens, from Tongchuan in ShaanxiProvince, China were chosen for the experimental study inthis research. The sandstone has a crystalline and blockystructure, which is macroscopically very homogeneous. Themain minerals in the sandstone are calcite, quartz, andfeldspar, and the main chemical components are Si and Ca.For this research, a total of 80 sandstone samples wereprepared for carrying out conventional triaxial compressiontests at confining pressures of 0, 5, 10, 15, 20, 25, 30, 35,40, 45, 50, and 55 MPa. The samples were drilled from tworectangular blocks. During drilling, the sandstone sampleswere machined along the same direction in order to avoid theinfluence of anisotropy on the experimental results. In orderto obtain exact results as well as the best comparison, all theexperiments were performed on dry specimens at roomtemperature. In accordance with the method suggested by theISRM, the length-to-diameter ratio of test samples should bein the range of 2.0–3.0 in order to minimize the influence ofthe end friction effects on the results. Therefore, all testedsandstone samples were cylindrical with 50 mm diameter and100 mm length. All the conventional compression tests wereconducted at a loading rate of 0.002 mm/s. The failure modesof tested samples under different confining pressures areshown in Figure 2.
From Figure 2, we can see that the failure modes underdifferent confining pressures are noticeably different. Crackspropagated parallel to the specimen's axis, and the samplesfailed by splitting, which represented typical brittleness withconfining pressures ranging from 0 MPa to 5 MPa, as shownin Figure 2a and Figure 2b. The failure mode wastransformed into shear failure with increasing confiningpressure. With confining pressures in the range of 10–40MPa, although the failure mode was shear failure on amacroscopic scale, most of these samples displayed traces oftension, illustrating that shear failure was influenced bytension and shear deformation acting together. Moreover,with increasing confining pressure the effect of tension onfailure declined gradually and the angle between the fracturesurface and the specimen's axis increased, as shown from
Figures 2c to 2i. When the confining pressures increased to45 MPa and higher, the failure surfaces became flat andsmooth in macroscopic view and powder-like materials wereproduced by severe friction near the shear fracture surfaces,indicating that failure was the result of shear stress. Thefracture surfaces were about 45 degrees from the specimen'saxis, as shown from Figures 2j to 2l. The axial strengthincreased with increasing confining pressure. The test resultsand calculation results under different confining pressuresare presented in Table II.
It can be seen from Table II that as the confining pressureincreased, the value of stress triaxiality decreased and thecompression degree increased, and the failure mode changedprogressively from tension fracture to local shear failure andto general shear failure. Table II indicates that two samplesfailed by splitting at axial failure stresses of 61.8 MPa and77.6 MPa respectively, and three samples failed by generalshear at axial failure stresses of 263.7, 270.1, and 275.5 MPa. The axial failure stresses of the samples that failed by
�
248 VOLUME 117
Table II
1 –61.8 –0.0 30.9 –0.33 Splitting2 –77.6 –5.0 36.3 –0.40
3 –130.3 –10.0 60.15 –0.424 –153.4 –15.0 69.2 –0.445 –176.3 –20.0 78.15 –0.466 –200.3 –25.0 87.65 –0.48 Local shear7 –216.1 –30.0 93.05 –0.498 –238.3 –35.0 101.65 –0.519 –250.6 –40.0 105.30 –0.52
10 –263.7 –45.0 109.35 –0.54General shear11 –270.1 –50.0 110.05 –0.56
12 –275.5 –55.0 110.25 –0.58
Notes: The failure parameters in conventional triaxial compression tests for sandstone. In Table II, 1, 2, and 3 are the principal stresses at failure, in conven-tional triaxial compression tests, both 1 and 2 are the confining stresses, 3 is the axial stress at failure, max is the maximal shear stress at failure, and Rdenotes the values of stress triaxiality in different stress states. The unit of 1, 2, and 3 and max is MPa, and the stress triaxiality is dimensionless

local shear are also presented in Table II. Therefore, the axialfailure stresses of samples probably depended on their failuremode. For the same failure mode, the variations in axialfailure stress may be relatively small. However, when variousfailure modes take place the variations may be very large.
Areas on fracture surfaces were examined by SEM underhigh magnification. SEM micrographs of fracture surfaces ofsamples that failed in various modes under various confiningpressures are presented in Figure 3. It can be clearly seenthat the fracture surface changed from coarse to flat andsmooth with increasing confining pressure. At zero confiningpressure the fracture surface was ragged and the fracturedirections at different points on the fracture surface werestrongly random, as shown in Figure 3a, indicating that thiskind of fracture was influenced mainly by inherent flaws inthe sandstone. When the confining pressure increased to 10MPa, although the failure mode was shear failure on amacroscopic scale (Figure 2c), the fracture at different pointsshowed a certain level of directionality (Figure 3b), thusindicating that the shear failure was influenced by theinherent cracks and flaws. As the confining pressureincreased to 30 MPa, the failure mode was also shear failureon a macroscopic scale (Figure 2g). As shown in Figure 3c,there was little random fracture initiation near the flaws andmicrocracks, and slip bands appeared among the originalcracks, leading to an enhanced directionality of the fracture atdifferent points. The failure mode shown in Figures 3b and3c was shear failure but affected by tensile stress, so it wasdefined as local shear failure. When the confining pressurecontinued to increase to 45 MPa, the failure mode was alsoshear failure (Figure 2j). Figure 3d indicates that there wasalmost no random fracture initiation near the flaws andmicrocracks, numerous slip bands appeared among originalcracks, almost all of which had the same slip direction, andthe fracture at different points showed stronger directionality.At a confining pressure of 55 MPa, numerous uniformlydistributed parabolic dimples appeared on the fracture surfacealong the same direction. The shear failure shown in Figures3d and 3e was controlled by shear stress and not affected bytensile stress, so it was defined as general shear failure. Inthis case, the samples failed in general shear failure due tothe slip of shear bands, and the failure was no longer affectedby voids and cracks.
Other researchers have reported similar changes of failuremode with stress states. Wang et al. (2012) found that thefailure behaviour of siltstone in conventional triaxialcompression tests was influenced by tension and sheardeformation acting together at low confining pressures; andwith increasing confining pressures, the effect of tension onfailure declined to an extent that failure was completelycontrolled by shear deformation. That is to say, the failuremode of siltstone was local shear failure under low confiningpressures; in this case, the volumetric strain had some effecton the failure, and this effect declined gradually withincreasing confining pressure. Once a certain confiningpressure had been reached, the failure was general shearfailure and it depended entirely on the maximum shearstress. Su and Fu (2014) showed that for sandstone, splittingoccurred under uniaxial compression; the maximum shearstress at failure increased with increasing confining pressureuntil a certain confining pressure was reached, after whichthe maximum shear stress at failure was almost constant.
An investigation of failure modes and failure criteria of rock in complex stress states
VOLUME 117 249 �
(e)
(d)
(c)
(b)
(a)

An investigation of failure modes and failure criteria of rock in complex stress states
From the above test results, three distinct failure modeswere identified for isotropic rock samples: tension fracture, inwhich tensile stress predominated; local shear failure, inwhich shear stress dominated; and general shear failure, inwhich shear stress also dominated. Both local shear failureand general shear failure fall within the scope of shear failuredominated by the shear stress. What makes them different isthat the former is dominated by shear stress and influencedby tensile stress, but the latter is dominated only by shearstress, and is not influenced by tensile stress. The experi-mental data, including conventional compression test resultsfor sandstone (Table II) and other published test results (Suand Fu, 2014; Wang et al., 2012) provides evidence that for agiven rock sample, the failure mode may change progres-sively from tension fracture to local shear to general shearfailure as loading conditions change from unixialcompression to biaxial compression and triaxial compression,and also with increasing confining pressures under conven-tional triaxial compression.
In this article, the stress triaxiality is applied to reveal thedegree of tension and compression in different stress states.Combining the calculation results in Table I, the value ofstress triaxiality decreases as the loading condition changesfrom axial compression to triaxial compression, and it alsodecreases with increasing confining pressure under conven-tional triaxial compression. Therefore, these observationsprove that the corresponding relationship between failuremodes and stress states can be as follows: for a given rocktype, as the stress state changes from tension to unixialcompression, biaxial compression, and triaxial compression,and also as the stress triaxiality decreases, the failuremechanism will change progressively from tension fracture tolocal shear failure and general shear failure. This suggeststhat the failure mode for a given rock sample is controlledmainly by the stress triaxiality at the weakest position.Moreover, two demarcation values of the stress triaxialityexist among these three failure mechanisms. We take R1 andR2 to be respectively the demarcation values of the stresstriaxiality between tension fracture and local shear failure,and between local shear failure and general shear failure.Accordingly, the complete relationship between the failuremechanism and the stress triaxiality can be written asfollows: the failure mechanisms at the weakest position willbe tension fracture when R , R1 local shear failure when R2
R < R1 and general shear failure when R < R2.
Similar to the stress state, the material characteristics alsohave a significant effect on the failure mechanism of rock.For different types of rock, different failure modes will occureven in the same stress state. Uniaxial compression tests ofred sandstone and granite were conducted in our laboratory.Under uniaxial compression, red sandstone underwent shearfailure, as shown in Figure 4a; but granite failed bylongitudinal splitting, as shown in Figure 4b. Different rockproperties result in varying failure modes. In the same stressstate, the failure mode depends upon the degree ofhomogeneity; as the rock texture becomes finer and moreisotropic the failure mechanism will change progressivelyfrom tension to shear failure. Coarse-grained rocks contain
many flaws, and the influence of these flaws is greatest inthe state of greater stress triaxiality, decreasing in the state oflower stress triaxiality. Specifically, the larger the stresstriaxiality is, the higher the probability that flaws will affectthe failure mode and strength.
The condition at failure in a rock sample can be described bythe general equation
[7]
where fc denotes the allowable value of f. When f fc, failurewill occur. The definition of f will be achieved in the form oftension fracture, local shear failure, and general shear failure,referred as to f1, f2, and f3 respectively.
The tension fracture observed in experiments can beclassified as tension fracture under tensile stress, andsplitting under uniaxial compression and triaxial compressionat low confining pressures. It is easy to understand tensionfracture under tensile stress. Splitting under uniaxialcompression and triaxial compression at low confiningpressures has been documented by various investigators(Paterson, 2005; Szwedzicki, 2007; Fakhimi and Hemami,2015), but what causes the splitting is still obscure and thereis no model for evaluating this phenomenon. In terms offailure mechanism, splitting is essentially tension fracture,but there is no tensile stress in macroscopic stress fieldsunder loading conditions of uniaxial compression and triaxialcompression at low confining pressures. Therefore,traditional failure criteria expressed by stress no longer apply.
Different rock types have unique characteristics, whichalso play a critical role in the whole failure process. Owing toits brittle nature, the capability of rock to withstand tensilestrain is very weak. When the tensile strain at certain pointreaches a critical value, the micro-crack will propagatequickly. On the other hand, due to the natural flaws andfissures inherent in rock, tension fracture is sensitive to themicrostructure, and failure is obviously influenced by thelocal effect. For these reasons, splitting is difficult to describein terms of the macroscopic stress field, or more
�
250 VOLUME 117
(a) (b)

appropriately, the strain field. The splitting observed in manyexperiments appeared initially along the direction of maximaltension strain, suggesting that the maximal tension strain 1
should be the dominant factor leading to the tension fracture.Also, the influence of other principal strains 2 and 3 ontension fracture should be included in complex stress states.Based on the above analysis, f1 can be defined in terms of 1,
2, and 3 as
[8]
Tension fracture usually occurs at the position of greateststress concentration, and failure is dominated by the maximaltensile strain. Therefore, it is assumed that the most likelyposition for tension fracture is where the stress triaxiality isgreatest in the stress field, and the direction of fractureinitiation is consistent with the maximum tensile strain atthis position. According to the newly proposed criterion fortension fracture, it is inferred that failure will occur when f1
exceeds its maximum limit value fc1. Let 1, 2, and 3
represent three principal strains at the weakest position, andassume that 1 2 and 3, b1 represents the influencecoefficient of 2 and 3 on 1 and fc1 denotes the maximumlimit value of f1. Both b1 and fc1 are constants that depend onthe rock characteristic and can be calculated from at least twosets of experimental data in the range of tension fracture. Itshould be noted that Equation [8] applies only to tensionfracture of rock; that is, under the condition of R R1 and 1
> 0 at the weakest position. A large number of experimentalresults (Fakhimi and Hemami, 2015; Su and Fu, 2014; Wanget al., 2012) indicate that Equation [8] can well explain andpredict the splitting of rock under uniaxial compression andtriaxial compression at low confining pressures.
Local shear failure is dominated by the maximal shear stressand influenced by the tensile stress. We have found that themaximal shear stress at failure among samples of the samelithology varies with the stress triaxiality. Furthermore,within the same mode of local shear failure, the influence oftensile stress on local shear failure decreases progressivelywith decreasing stress triaxiality. The relationship betweenthe maximal shear stress at failure and the stress triaxialityis, of course, not entirely linear. However, for convenience of application, a linear approximation is reasonable within a limited range of mean stress. Therefore f2 can be expressedas
[9]
where, max is the maximal shear stress at the weakestposition, fc2 denotes the limit value of f2, b2 represents theinfluence of stress state on local shear failure, and R2 is thedemarcation value between local shear failure and generalshear failure. Both b2 and fc2 are constants that depend onthe rock characteristics, and at least two experimental datapoints are required in order to determine these twoparameters. They can be obtained by conducting at least twotests in different stress states within the range of local shearfailure, and more testing for confirmation is highlyrecommended. As regards the local shear failure, becausemuch plastic deformation in the process of failure can relax
the stress concentration around the flaws and voids, thevoids are difficult to grow and coalesce along the direction ofthe maximum tensile stress. Therefore, the shape of voidswill grow into an ellipsoid or a long strip, and local shearbands will be produced among ligaments of voids. Shear-linking of voids along the direction of the maximal shearstress and the propagation of shear bands are what lead tothis kind of failure. Local shear bands usually appear in theposition with higher degrees of stress concentration and theirpropagation is dominated by the maximal shear stress.Failure is therefore modelled in terms of the maximal shearstress and the stress triaxiality, and the weakest position canalso be considered as the position where the stress triaxialityis the largest in the stress field. It is important to note thatEquation [9] can apply to local shear failure of rock onlywhen R2 R < R1.
General shear failure is caused by the propagation of shearbands. Unlike local shear failure, tension deformation has noinfluence on this kind of failure. General shear failure is notaffected by tensile stress and is dominated by the maximalshear stress. Many experimental results from rock underconventional triaxial compression (Tanapol, Chaowarin, andKittitep, 2013; Tien, Kuo, and Juang, 2006; Yang, Su, andXu, 2005) have shown that once a certain confining pressureis reached, the maximal shear stress at failure (referred to asgeneral shear failure in this article) is almost constant. Whendescribed by the stress triaxiality, in terms of general shearfailure, the maximal shear stress at failure remains almostconstant with changing stress triaxiality. Based on theconsiderations discussed above, the failure function forpredicting general shear failure is directly modelled by themaximal shear stress and can be written as
[10]
where max is the maximal shear stress at the weakestposition and fc3, a material constant, f3 denotes the limitvalue of f3 corresponding to the onset of general shearfailure. When general shear failure occurs in the specimen,the stress triaxiality is lower than in the case of local shearfailure, and more plastic deformation is produced. Thereforethere is almost no stress concentration around flaws in thewhole failure process, shear bands are caused by themaximal shear stress, and the unstable propagation of shearbands leads to general shear failure. Shear bands tend toappear in the position with higher shape deformation energy,and their propagation is controlled by the maximum shearstress. Therefore, general shear failure is modelled only bythe maximal shear stress under the assumption that theweakest position is located where the shape deformationenergy is largest in the stress field, and the direction offracture initiation is consistent with the plane of themaximum shear stress. Equation [10] can be used forgeneral shear failure of rock only when R < R2.
In Equations [8], [9], and [10], the demarcation valuesof stress triaxiality R1 and R2 are constant for the same rocktype and vary for different rock types. For a given rock type,R1 and R2 can be determined by a series of experiments withdifferent failure modes in a wide range of stress triaxiality.
An investigation of failure modes and failure criteria of rock in complex stress states
VOLUME 117 251 �
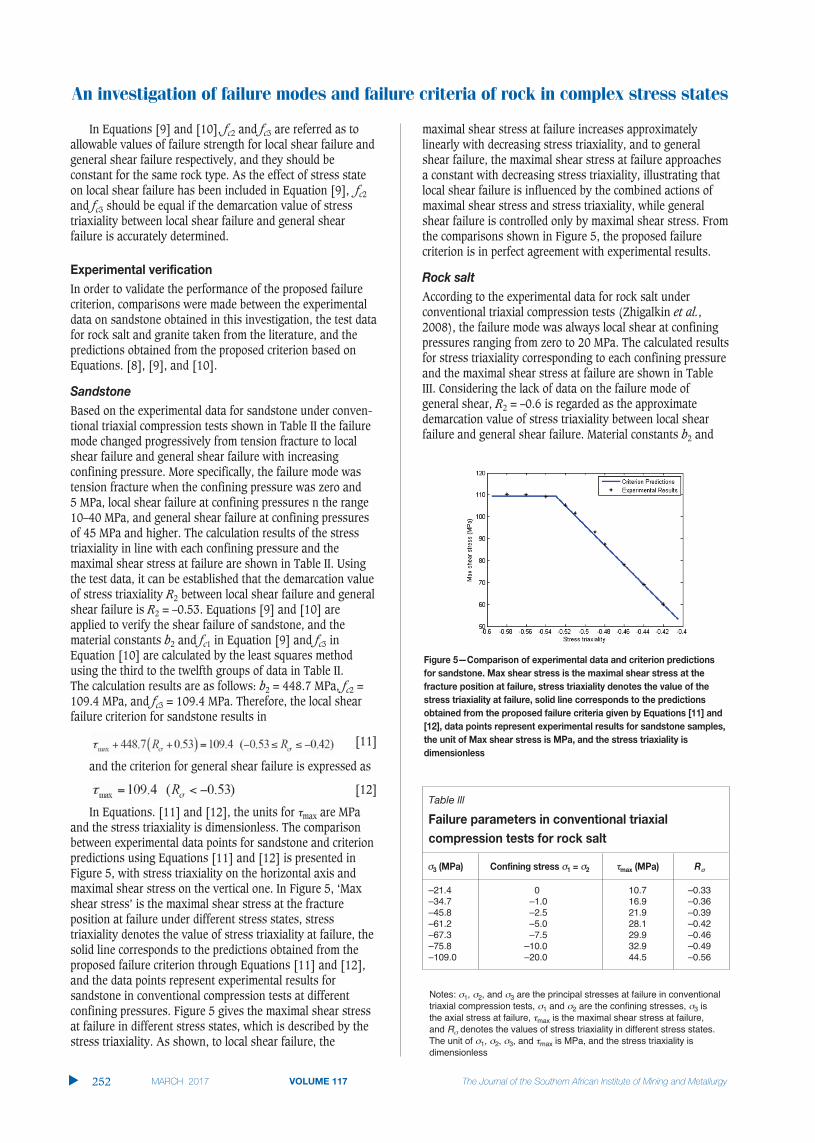
An investigation of failure modes and failure criteria of rock in complex stress states
In Equations [9] and [10], fc2 and fc3 are referred as toallowable values of failure strength for local shear failure andgeneral shear failure respectively, and they should beconstant for the same rock type. As the effect of stress stateon local shear failure has been included in Equation [9], fc2
and fc3 should be equal if the demarcation value of stresstriaxiality between local shear failure and general shearfailure is accurately determined.
In order to validate the performance of the proposed failurecriterion, comparisons were made between the experimentaldata on sandstone obtained in this investigation, the test datafor rock salt and granite taken from the literature, and thepredictions obtained from the proposed criterion based onEquations. [8], [9], and [10].
Based on the experimental data for sandstone under conven-tional triaxial compression tests shown in Table II the failuremode changed progressively from tension fracture to localshear failure and general shear failure with increasingconfining pressure. More specifically, the failure mode wastension fracture when the confining pressure was zero and 5 MPa, local shear failure at confining pressures n the range10–40 MPa, and general shear failure at confining pressuresof 45 MPa and higher. The calculation results of the stresstriaxiality in line with each confining pressure and themaximal shear stress at failure are shown in Table II. Usingthe test data, it can be established that the demarcation valueof stress triaxiality R2 between local shear failure and generalshear failure is R2 = –0.53. Equations [9] and [10] areapplied to verify the shear failure of sandstone, and thematerial constants b2 and fc1 in Equation [9] and fc3 inEquation [10] are calculated by the least squares methodusing the third to the twelfth groups of data in Table II. The calculation results are as follows: b2 = 448.7 MPa, fc2 =109.4 MPa, and fc3 = 109.4 MPa. Therefore, the local shearfailure criterion for sandstone results in
[11]
and the criterion for general shear failure is expressed as
[12]
In Equations. [11] and [12], the units for max are MPaand the stress triaxiality is dimensionless. The comparisonbetween experimental data points for sandstone and criterionpredictions using Equations [11] and [12] is presented inFigure 5, with stress triaxiality on the horizontal axis andmaximal shear stress on the vertical one. In Figure 5, ‘Maxshear stress’ is the maximal shear stress at the fractureposition at failure under different stress states, stresstriaxiality denotes the value of stress triaxiality at failure, thesolid line corresponds to the predictions obtained from theproposed failure criterion through Equations [11] and [12],and the data points represent experimental results forsandstone in conventional compression tests at differentconfining pressures. Figure 5 gives the maximal shear stressat failure in different stress states, which is described by thestress triaxiality. As shown, to local shear failure, the
maximal shear stress at failure increases approximatelylinearly with decreasing stress triaxiality, and to generalshear failure, the maximal shear stress at failure approachesa constant with decreasing stress triaxiality, illustrating thatlocal shear failure is influenced by the combined actions ofmaximal shear stress and stress triaxiality, while generalshear failure is controlled only by maximal shear stress. Fromthe comparisons shown in Figure 5, the proposed failurecriterion is in perfect agreement with experimental results.
According to the experimental data for rock salt underconventional triaxial compression tests (Zhigalkin et al.,2008), the failure mode was always local shear at confiningpressures ranging from zero to 20 MPa. The calculated resultsfor stress triaxiality corresponding to each confining pressureand the maximal shear stress at failure are shown in TableIII. Considering the lack of data on the failure mode ofgeneral shear, R2 = –0.6 is regarded as the approximatedemarcation value of stress triaxiality between local shearfailure and general shear failure. Material constants b2 and
�
252 VOLUME 117
Table
–21.4 0 10.7 –0.33–34.7 –1.0 16.9 –0.36–45.8 –2.5 21.9 –0.39–61.2 –5.0 28.1 –0.42–67.3 –7.5 29.9 –0.46–75.8 –10.0 32.9 –0.49–109.0 –20.0 44.5 –0.56
Notes: 1, 2, and 3 are the principal stresses at failure in conventionaltriaxial compression tests, 1 and 2 are the confining stresses, 3 isthe axial stress at failure, max is the maximal shear stress at failure,and R denotes the values of stress triaxiality in different stress states.The unit of 1, 2, 3, and max is MPa, and the stress triaxiality isdimensionless

fc2 in Equation [9] are calculated by the least squares methodusing all the experimental data points in Zhigalkin et al.(2008), and the calculation results are as follows: b2 = 150 MPa, and fc2 = 50.9 MPa. Therefore, the criterion forlocal shear failure of rock salt in Zhigalkin et al. (2008) canbe expressed in terms of max and R as
[13]
In Equation [13], the units for max are MPa and thestress triaxiality is dimensionless. The criterion predictionsusing Equation [13] are compared with experimental data onrock salt from the literature in Figure 6. The solid linescorrespond to the predictions obtained from the proposedfailure criterion, while the data points represent experimentalresults. As shown in Figure 6, to local shear failure, themaximal shear stress at failure increases approximatelylinearly with decreasing stress triaxiality. The proposedfailure criterion gives very good agreement with the experi-mental results.
Based on the experimental data for medium-grained marblein conventional triaxial compression tests (Yang, Su, and Xu,2005), the failure mode underwent a transition from localshear to general shear with increasing confining pressure.More specifically, the failure mode was local shear atconfining pressures in the range of 0–30 MPa, while generalshear failure occurred when the confining pressure increasedto 35 MPa and higher. Because test data for different stressstates obtained from the previous experiments is sparse, it isdifficult to accurately determine the demarcation value ofstress triaxiality R2 between local shear failure and generalshear failure. We can only conclude that the range of thedemarcation value of stress triaxiality R2 between local shearfailure and general shear failure is –0.5 R2 –0.48.However, R2 = –0.5 is obtained by fitting all the test datapoints and the result agrees well with the data. Due to thelimited data, R2 = –0.5 is estimated to be the approximatedemarcation value of stress triaxiality between local shearfailure and general shear failure. Material constants b2 and
fc2 in Equation [9] and fc3 in Equation [10], calculated by theleast squares method using all the experimental data pointsin Yang, Su, and Xu (2005), are as follows: b2 = 326 MPa, fc2 = 106.8 MPa, and fc3 = 106.8 MPa. Therefore, the localshear failure criterion for medium-grained marble has theform
[14]
and the criterion for general shear failure is expressed as [15]
In Equations [14] and [15], the units for max are MPa.The comparison between experimental data points formedium-grained marble and criterion predictions usingEquations [14] and [15] is presented in Figure 7. As shown,within the range of shear failure, the maximal shear stress atfailure also approaches a constant value with decreasingstress triaxiality.
For coarse-grained marble (Yang, Su, and Xu, 2005), thefailure mode was always local shear at the confining pressurebetween zero and 30 MPa. Due to a lack of experimentalresults on general shear failure, R2 = –0.6 is considered asthe approximate demarcation value of stress triaxialitybetween local shear failure and general shear failure. Materialconstants b2 and fc2 in Equation [9] were calculated by theleast squares method using all the experimental data pointsin Yang, Su, and Xu (2005), and the calculation results areas follows: b2 = 201.5 MPa, and fc2 = 80 MPa. Therefore, thelocal shear failure criterion for coarse-grained marble (2005)can be expressed by
[16]
In Equation [16], the units for max are also MPa. Thecomparison between experimental data points for marble withcoarse grains and criterion predictions using Equation [16] isgiven in Figure 8. As shown, to local shear failure, themaximal shear stress at failure also increases approximatelylinearly with decreasing stress triaxiality, which alsoillustrates that high stress triaxiality will speed up theoccurrence of local shear failure within a certain range.
An investigation of failure modes and failure criteria of rock in complex stress states
VOLUME 117 253 �

An investigation of failure modes and failure criteria of rock in complex stress states
The comparisons shown in Figures 5-8 prove that theproposed failure criterion is able to accurately predict thefailure strength of isotropic rock of various types in variousstress states.
As can be seen from the comparisons in Figure 7 andFigure 8, the test results for coarse-grained marble arerelatively dispersive, and the experimental data for medium-grained marble match the criterion well. Therefore thedeviation between experimental data points and criterionprediction for medium-grained marble is smaller than that forcoarse-grained marble. When the value of stress trialiaxity isreduced from -0.33 to -0.55, coarse-grained marble alwaysfails by local shear failure, but the failure mode of medium-grained marble changes from local shear to general shear. Asdiscussed above, material characteristics also have asignificant influence on the failure mechanism and failurecriteria of rock.
From the above analyses and comparisons, it can be clearlyseen that the relationship between failure mode and stressstate is well described using stress triaxiality and theproposed failure criterion can accurately predict the failure ofrock in different stress states. We previously investigated thefracture mechanisms of metals in various stress states (Li,Shi, and Tang, 2014), and found that the variation law formacroscopic fracture modes with stress triaxiality for metalsis similar to that for rock, but there appears a great differencebetween the two materials in terms of the mesoscopicmechanism. The primary factor that affects the fracturemechanism of metals is the amount of plastic deformationduring the fracture process, while the major factor thatinfluences the failure mode of rock tends to be the evolutionof flaws in different stress states.
However, there are still some limitations in this method.For example, the values of stress triaxiality in theexperiments were limited within a certain range. All theavailable data is based on conventional triaxial compressiontests on rock, hence the values of stress triaxiality can onlycover the range from -1 to -0.33 owing to the limited range of
confining pressures generated by triaxial compressionequipment. Because the values of stress triaxiality are withinthis range, failure modes are mainly local shear and generalshear, and tension fracture appears rarely. Therefore, theexperimental verification in this article is confined to theanalysis of local shear failure and general shear failure.Nevertheless, the failure criterion is based on three differentfailure mechanisms and can be applied all failure behavioursin complex stress states.
For a given rock type, demarcation values of stresstriaxiality R1 and R1 are constant and should be obtained bya series of experiments with different failure modes coveringa wide range of stress states. Due to a lack of continuousexperimental data covering a wide range of stress triaxiality,the value of R2 in this article is estimated using the availabledata. For this reason, more continuous experiments over awider range of stress triaxiality are required in order toaccurately determine the demarcation values of stresstriaxiality.
Moreover, the existence of microscopic discontinuities isresponsible for ‘size effects’, that is, strength reduction withincreased sample size. The larger the sample, the higher theprobability that the discontinuities will affect the failure modeand the strength. Therefore, the results presented in thispaper are reliable for some relatively homogeneous rocksamples that can be regarded as isotropic. On the other hand,for some anisotropic and inhomogeneous rock samples, thereare too many randomly distributed unknown flaws andmicro-cracks in the rock, and the failure mode will be greatlyinfluenced by these flaws and cracks, especially in states ofhigh stress triaxiality.
In this article, the concept of stress triaxiality was introducedto reveal different stress states, and failure mechanisms andstrengths of rock under various complex loading conditionswere investigated. The major results obtained are as follows.
1. The introduction of stress triaxiality to reveal differentstress states makes it possible to determine whetherthe rock samples fail in tension, in local shear, or ingeneral shear. For a given rock type, with decreasingstress triaxiality, the failure mechanism will changeprogressively from tension fracture to local shear andgeneral shear. Two demarcation points of stresstriaxiality, expressed as R1 and R2, exist betweentension fracture and local shear failure, and betweenlocal shear and general shear. Accordingly, the failuremode at the weakest position will be tension fracturewhen R , R1 local shear failure when R2 R < R1
and general shear failure when R < R2.2. Failure of rock by splitting under axial compression is
essentially tension fracture. However, from amacroscopic viewpoint, there is no tensile stress in aspecimen under axial compression and conventionaltriaxial compression at low confining pressures. Thesplitting fracture of rock is essentially caused bytensile strain because of rock’s high brittleness andweak capability to withstand tensile strain. For thesereasons, the splitting is difficult to describe using themacroscopic stress field, or more appropriately, thestrain field.
�
254 VOLUME 117

3. It has been proved that the way the sample fails (thefailure mode) affects the obtained strength of thesample. The controlling parameter is a function of thefailure mode. Considering tension fracture, local shearfailure, and general shear failure, different parametersthat dominate these three failure modes were takeninto account, and failure criteria corresponding tothese three failure modes were developed andpresented to evaluate the failure behaviour of rock invarious complex stress states. Furthermore,predictions of the failure criterion were compared withexperimental data for sandstone, rock salt, and marbleunder conventional triaxial compression tests. Thecomparison indicates that the newly proposed failurecriterion offers consistent results for these three rocktypes in a range of stress triaxiality from uniaxial totriaxial compression.
Understanding the effect of failure mode on the failurecriterion allows an in-depth interpretation of experimentalresults obtained in various stress states. The relationshipbetween failure mode and failure criteria of rock samples invarious stress states has been elucidated in this paper, withthe aim of inducing researchers in rock mechanics to conductfurther investigations and provide a theoretical framework togeotechnical applications.
This work was supported by the National Natural ScienceFoundation of China (Grant no. 11302167) and the researchprogramme of Shaanxi Provincial Education Department (no.2013JK0609).
ADELINET, M., FORTIN, J., SCHUBNEL, A., and GUÉGUEN, Y. 2013. Deformationmodes in an Icelandic basalt: From brittle failure to localized deformationbands. Journal of Volcanology and Geothermal Research, vol. 255. pp. 15–25.
AMANN, F., KAISER, P., and BUTTON, E.A. 2012. Experimental study of brittlebehavior of clay shale in rapid triaxial compression. Rock Mechanics andRock Engineering, vol. 45. pp. 21–33.
ARORA, S. and MISHRA, B. 2015. Investigation of the failure mode of shale rocksin biaxial and triaxial compression tests. International Journal of RockMechanics and Mining Sciences, vol. 79. pp. 109–123.
CAI, M.F. and LIU, D.M. 2009. Study of failure mechanisms of rock undercompressive–shear loading using real-time laserholography. InternationalJournal of Rock Mechanics and Mining Sciences, vol. 46. pp. 59–68.
CHANG, C.D. and HAIMSON, B. 2012. A failure criterion for rocks based on truetriaxial testing. Rock Mechanics and Rock Engineering, vol. 45. pp. 1007–1010.
FAKHIMI, A. and HEMAMI, B. 2015. Axial splitting of rocks under uniaxialcompression. International Journal of Rock Mechanics and MiningSciences, vol. 79. pp. 124–134.
HAIMSON, B. 2006. True triaxial stresses and the brittle fracture of rock. Pureand Applied Geophysics, vol. 163. pp. 1101–1130.
KITTITEP, F. and DECHO, P. 2012. Effects of cyclic loading on mechanicalproperties of Maha Sarakham salt. Engineering Geology, vol. 112. pp. 43–52.
LI, Z.H., SHI, J.P., and TANG, A.M. 2014. Investigation on fracture mechanismsof metals under various stress states. Acta Mechanica, vol. 225, pp. 1867–1881.
LIN, P., WONG, R. H.C., and TANG, C.A. 2015. Experimental study of coalescencemechanisms and failure under uniaxial compression of granite containingmultiple holes. International Journal of Rock Mechanics and MiningSciences, vol. 77. pp. 313–327.
LOAIZA, S., FORTIN, J., SCHUBNEL, A., GUEGUEN, Y., VINCIGUERRA, S., and MOREIRA,M. 2012. Mechanical behavior and localized failure modes in a porousbasalt from the Azores. Geophysical Research Letters, vol. 39. pp. L19304.
MELKOUMIAN, N.S., PRIEST, D., and HUNT, S.P. 2009. Further development of thethree-dimensional Hoek–Brown yield criterion. Rock Mechanics and RockEngineering, vol. 42. pp. 835–847.
PATERSON, M.S. 2005. Experimental Rock Deformation in the Brittle Field.Springer-Verlag, Berlin, Heidelberg. pp. 132–135.
SALVADOR, S., RAFAEL, J., and ALEXANDRA, R. 2013. Numerical simulation of theinfluence of small-scale defects on the true-triaxial strength of rocksamples. Computers and Geotechnics, vol. 53. pp. 142–156.
SU, C.D. and FU, Y.S. 2014. Experimental study of triaxial compressiondeformation and strength characteristics of sandstone. Chinese Journal ofRock Mechanics and Engineering, vol. 33. pp. 3164–3169.
SZWEDZICKI, T. 2007. A hypothesis on modes of failure of rock samples tested inuniaxial compression. Rock Mechanics and Rock Engineering, vol. 40. pp. 97–104.
TANAPOL, S., CHAOWARIN, W., and KITTITEP, F. 2013. True-triaxial compressivestrength of Maha Sarakham salt. International Journal of Rock Mechanicsand Mining Sciences, vol. 61. pp. 256–265.
TANG, C.A. and HUDSON, J.A. 2010. Rock failure mechanisms: explained andillustrated. Taylor and Francis, London. pp. 231–239.
TARASOV, B. and POTVIN, Y. 2013. Universal criteria for rock brittlenessestimation under triaxial compression. International Journal of RockMechanics and Mining Sciences, vol. 59. pp. 57–69.
TIEN, Y.M., KUO, M.C., and JUANG C.H. 2006. An experimental investigation ofthe failure mechanism of simulated transversely isotropic rocks.International Journal of Rock Mechanics and Mining Sciences, vol.43. pp. 1163–1181.
TIWARI, R.P. and RAO, K.S. 2004. Physical modeling of a rock mass under a truetriaxial stress state. International Journal of Rock Mechanics and MiningSciences, vol. 41. pp. 1–6.
TIWARI, R.P. and RAO, K.S. 2007. Response of an anisotropic rock mass underpolyaxial stress state. Journal of Materials in Civil Engineering, vol. 19.pp. 393–403.
WANG, D., LIU, C.W., WANG, D., LI, X.D., and XU, Y.H. 2012. Research on thetension-shear deformation and failure criterion of rock under complexstress. Journal of Sichuan University (Engineering Science Edition), vol. 44. pp. 31–35.
WONG, T.F. and BAUD, P. 2012. The brittle-ductile transition in porous rock: Areview. Journal of Structural Geology, vol. 44. pp. 25–53.
XIE, H.P. and CHEN, Z.H. 2004. Rock Mechanics. Science Press, Beijing. pp. 129–135.
XIE, H.P., LIU, J.F., JU, Y., LI, J., and XIE, L.Z. 2011. Fractal property of spatialdistribution of acoustic emissions during the failure process of beddedrock salt. International Journal of Rock Mechanics and Mining Sciences,vol. 48. pp. 1344–1351.
XIE, N., ZHU, Q.Z., SHAO, J.F., and XU, L.H. 2012. Micromechanical analysis ofdamage in saturated quasi brittle materials. International Journal of Solidsand Structures, vol. 49. pp. 919–928.
YANG, S.Q., JIANG, Y.Z., XU, W.Y., and CHEN, X.Q. 2008. Experimental investi-gation on strength and failure behavior of pre-cracked marble underconventional triaxial compression. International Journal of Solids andStructures, vol. 45. pp. 4796–4815.
YANG, S.Q., JING, H.W., and WANG, S.Y. 2012. Experimental investigation on thestrength, deformability, failure behavior and acoustic emission locations ofred sandstone under triaxial compression. Rock Mechanics and RockEngineering, vol. 45. pp. 583–606.
YANG, S.Q., SU, C.D., and XU, W.Y. 2005. Experimental investigation onstrength and deformation properties of marble under conventional triaxialcompression. Chinese Journal of Rock and Soil Mechanics, vol. 26. pp. 475–478.
YOU, M.Q. 2009. True-triaxial strength criteria for rock. International Journal ofRock Mechanics and Mining Sciences, vol. 46. pp. 115–127.
ZHIGALKIN, V.M., SEMENOV, V.N., USOL’TSEVA, O.M., TSOI, P.A., ASANOV, V.A.,BARYAKH, A.A., PANKOV, I.L., TOKSAROV, V.N., and EVSEEV, A.V. 2008.Deformation of quasi-plastic salt rocks under different conditions ofloading. Report II: regularities of salt rock deformation under triaxialcompression. Journal of Mining Science, vol. 44. pp. 15-23.
ZHONG, J.H., LIU, S.X., and MA, Y.S. 2015. Macro-fracture mode and micro-fracture mechanism of shale. Petroleum Exploration and Development, vol.42. pp. 269–276.
ZHOU, Y. and LIN, J.S. 2013. On the critical failure mode transition depth forrock cutting. International Journal of Rock Mechanics and MiningSciences, vol. 62. pp. 131–137.
ZHOU, Y. and LIN, J.S. 2014. Modeling the ductile–brittle failure mode transitionin rock cutting. Engineering Fracture Mechanics, vol. 127. pp. 135–147.�
An investigation of failure modes and failure criteria of rock in complex stress states
VOLUME 117 255 �

BACKGROUNDThe mining industry is faced with a number of challengesregarding the use, recycling and management of their waterresources. Some affected parties are unaware that the legislationaround the use of water has become more onerous and strictcontrols have been put in place. This includes the requirementsfor the application of water use licences.
The scarcity of water in the Southern African region is a fact andthe availability of water is a major consideration in thedevelopment of mining ventures across the sub-continent. Thewater authorities throughout the region have developed strategiesto address the needs of the mines and their surroundingcommunities.
Acid Mine Drainage has been a reality for quite some time andwith the ‘closure’ of mines on the Witwatersrand it has become amajor issue for communities in Gauteng. A number of initiativeshave been put in place to address the challenge and the enormityof the task has taken many by surprise.
The use of fresh water alone is no longer an option and usershave to consider alternatives in the treatment and recycling ofwater. Major advances have been made in the processing ofwater yet these options have not been shared with the engineerson the mines.
WATER 2017CONFERENCE
lifeblood of the mining industry
10–11 July 2017
Emperors Palace, Hotel CasinoConvention Resort Johannesburg
OBJECTIVEg To sensitise the mining and metallurgical industry to the
requirements of the new legislationg Share the overall water distribution strategy across the sub-
continent g Introduce new technology for the processing and recycling of
waterg Report on various initiatives in the reclaiming of waterg Update interested parties on the status of the Acid Mine
Drainage threat.
WHO SHOULD ATTENDg Senior and operational management of minesg Engineers responsible for mine water managementg Regional and national officials from DoE, DMR, DWS, and
DEAg Companies and individuals offering water related solutionsg Researchersg Environmentalists and NGOsg Agricultural sector.
TOPICSThe Conference will include but not be limited to the following topics: g Legal requirements, amendments, and complianceg What is required to obtain a water licenceg Acid mine drainageg Status of water supplyg New technology in proccessing and recovering of waterg Treatment plantsg Water analysisg Wetlandsg Agriculture vs. Miningg Case studiesg Research.
The Southern African Institute of Mining and Metallurgy &
Mine Metallurgical Managers Association is proud to host the
MMMA
For further information contact:Camielah Jardine Conference Co-ordinator • Saimm
P O Box 61127, Marshalltown 2107Tel: +27 (0) 11 834-1273/7 E-mail: [email protected]
Website: http://www.saimm.co.za
ConferenceAnnouncement
Sponsor

Longwall mining is an underground miningmethod that maximizes safe coal productionfrom coal beds that do not have majorgeological discontinuities. In the westernUnited States, the majority of underground-mined coal is produced through longwallmining. The initial step in developing alongwall mine is to drive development entriesaround the panel using the continuous miners,leaving behind a solid block of coal withdimensions ranging from 900–6 000 m (3 000–20 000 ft) in length and 300–500 m (1 000–1500 ft) in width. Once panel development iscomplete, longwall machinery is placed alongthe face of block and longwall mining begins.A continuous flow of fresh air is provided tothe face and working sites by the ventilationsystem. The intake side of the longwall panelis referred to as the headgate, and the
ventilation return is through the tailgate.During longwall mining operation, the coal iscontinuously cut by a shearer and extractedvia an armoured face conveyor. Followingextraction, the shield roof supports areadvanced. As the shields move forward alongthe panel, the immediate roof is allowed tocollapse into the void behind the shields. Thecollapse of roof rock forms a pile of rockfragments known as the gob. The passinglongwall face also disturbs the strata overlyingthe gob, leading to subsidence.
Methane ignition, explosion, andspontaneous combustion (‘spon-com’) aremajor safety hazards in underground longwallcoal mines. Safety systems to monitor andcontrol these hazards include; ventilationdesign, air quality monitoring systems,methane degasification, gob ventilationboreholes, and inertization of the gob.Ventilation systems must be designed toprovide sufficient air to the face for workersand to dilute hazardous gases like methane toacceptable levels. The face air can enter intothe gob by leaking past the face supportshields and may form explosive mixtures as itcombines with methane present in the gob.The methane-air mixtures in the explosiverange are called explosive gas zones andpresent an explosion and fire hazard. As theUpper Big Branch (UBB) disaster in 2010 hasshown, methane explosions can also lead tocoal dust explosions, which can spread to alarger area underground. The fatalities causedby some major methane fires and explosionsin underground coal mines of the United Statesbetween 2000 and 2010 are shown in Table I.Goodman et al. (2008) summarized the
CFD study of the effect of faceventilation on CH4 in returns andexplosive gas zones in progressivelysealed longwall gobsby S.A. Saki*, J.F. Brune*, G.E. Bogin Jr.*, J.W. Grubb*, M.Z. Emad†, and R.C. Gilmore*
The main purpose of coal mine ventilation design is to provide a sufficientquantity and quality of air to the workers and to dilute methane and othercontaminants. It is generally perceived that additional air along thelongwall face will improve methane dilution at the face and in the tailgate.However, computational fluid dynamics (CFD) modelling efforts at theColorado School of Mines (CSM) under a National Institute forOccupational Safety and Health (NIOSH) funded research project havefound that higher flow velocities along the longwall face will increase thepressure differential between the gob and longwall face and allow moremethane to be swept from the gob into the active face and tailgate area,thereby diminishing the dilution effect. Increased pressure along theheadgate side also allows more oxygen to ingress into the gob area,thereby increasing the amount of oxygen available to form explosivemethane-air mixtures in the gob and to support spontaneous combustionof the coal. In this paper, a parametric study is presented to discuss theeffect of face air quantity on methane concentrations in the tailgate andformation of explosive gas zones (EGZs) in the gob. Counter to conven-tional wisdom, increased air quantities at the longwall face may increasethe explosion hazard as they result in increased EGZ volumes in the gob,along with increased methane quantities in the tailgate return.
computational fluid dynamics, explosive gas zones, spontaneouscombustion, gob ventilation boreholes.
* Colorado School of Mines, Golden, USA.† University of Engineering and Technology, Lahore
Pakistan.© The Southern African Institute of Mining and
Metallurgy, 2017. ISSN 2225-6253. Paper receivedSep. 2015; revised paper received Apr. 2016.
257VOLUME 117 �
http://dx.doi.org/10.17159/2411-9717/2017/v117n3a7

CFD study of the effect of face ventilation on CH4 in returns and explosive gas
following recent methane ignition accidents. In July 2000, amethane gas explosion occurred in the gob at Willow Creekmine, which caused two fatalities and eight serious injuries.In September 2001, an explosion accident occurred at JimWalter Resources No. 5 mine in Alabama, though not in thegob, which resulted in 13 fatalities and 3 injured workers. In2006, an explosion in a sealed, mined-out area at the SagoMine in West Virginia caused 12 fatalities and 1 injury. InMay 2006, a similar accident at the Kentucky Darby Mineresulted in 5 deaths. The most recent explosion at Upper BigBranch in 2010 killed 29 miners. The investigation report byPage et al. (2011) revealed that methane from the gob wasignited by the shearer cutting near the tailgate and set off acoal dust explosion which spread through almost 50 miles ofmine entries.
Current methane monitoring technologies do not provideinformation on the gas distribution and flow patterns insidethe gob areas. In order to obtain information about gascompositions in the gob, the authors modelled the gas flowsinside the gob using computational fluid dynamics (CFD).CFD modelling can predict the gas flow patterns inside thegob and the formation of EGZs. It can also determine thevolume and locations of EGZs and oxygen ingress into the gob.
Various researchers have used CFD to model gas flows inlongwall gobs under different ventilation schemes. Ren,Balusu, and Humphries (2005) used CFD modelling oflongwall gobs and concluded that reduction in the face airvelocity on the intake side of the goaf will help to reduce therisk of spon-com. Krishna, Balusu, and Manoj (2012) usedCFD to study the effect of buoyancy on methane gas distri-bution in the tailgate region and concluded that a back returnsystem was helpful in reducing the tailgate methane concen-tration level to below 1%. Brune and Sapko (2012) used CFDto analyse the ventilation and potential methane accumu-lation and mixing patterns in the tailgate corner area, andrecommended keeping the immediate longwall tailgate entryopen at least to the nearest inby crosscut so that positiveventilation is maintained inby the face to dilute and carryaway any methane released behind the shields.
Researchers at the Colorado School of Mines, under aproject funded by the National Institute for OccupationalSafety and Health (NIOSH), have modelled various longwallpanels and ventilation configurations using the CFD software
FLUENT® by ANSYS. Marts et al. (2013) determined that alower face ventilation quantity will reduce the size of EGZs inlongwall gobs. They also found that nitrogen injection ismore effective from the headgate side than it is from thetailgate side, and that there is a point of diminishing returnswhere additional nitrogen injection will no longer reduce EGZvolume. Marts et al. (2013) recommended a back returnarrangement on the tailgate side, which is effective inpushing the tailgate EGZ away from face and reducing thelikelihood of ignitions near the face due to the shearer cuttinghard rock. Marts et al. (2014) also reported that the nitrogeninjection and reduction in the face air velocity can effectivelycontrol spon-com risk in the sealed gobs. Gilmore et al.(2014a) concluded that a bleeder ventilated gob will carry acontiguous explosive fringe on all sides surrounding the gob.Marts et al. (2014) found that headgate nitrogen injectionmay form a ’dynamic seal’ separating the oxygen-rich facezone from the methane-rich interior gob without forming anexplosive fringe in the case of progressively sealed gob. Inthis paper, the results of modelling studies with varyingquantities of air at the face to dilute the tailgate methane arepresented. Also, the communication of gob gases with faceair and tailgate return, and the performance of gobventilation boreholes (GVBs) under varying face airquantities, are analysed.
The CFD model grid was created using ventilation and airquality data collected from two cooperating mines in thewestern United States. The collected data consisted of minelayouts, geometric dimensions, lithology, overburden cavingcharacteristics, ventilation operating conditions, and gasconcentration measurements. The CFD model panel is 314 m(1030 ft) in width and 39 m (128 ft) in height to account forthe caved and fractured zone above the coal seam. Gobventilation boreholes (GVBs) extend into the fractured zoneand terminate at 18 m (60 ft) above the top of coal seam.GVBs are 18 m (60 ft) away from the gateroads, with the firstGVB being located about 66 m (220 ft) inby the face. Thespacing between the GVBs is 60 m (200 ft). A vertical cross-section of the model geometry is shown in Figure 1. Thecommunication of flow between the gob and the face ismodelled through shield leakage.
The CFD model was constructed with a ‘U’ ventilation designfor a progressively sealed panel, as shown in Figure 2. In theUnited States, regulations require the use of a bleeder system(Mine Safety & Health Administration, n.d). Exceptions maybe granted if the coal has a tendency to spontaneouslycombust. Many western US coals are prone to spon-com andseveral mines in this area use progressive sealing (alsoreferred to as bleederless panels) to reduce the oxygeningress into the gob. This is accomplished by progressivelysealing the headgate side crosscuts as the panel advances.Gilmore et al. (2014b) concluded that U-ventilation is aneffective method to limit oxygen ingress into the gob toprevent spon-com. The fresh intake air enters the longwallface through the headgate, travels across the face, and leavesthrough the tailgate.
�
258 VOLUME 117
Table I
2000 Willow Creek Mine 22001 Jim Walter Resources, No. 5 Mine 132003 McElroy Mine 32006 Sago and Darby Mine 172010 Upper Big Branch Mine 29

In the CFD modelling efforts, the longwall face ventilation airquantity was varied from 23 m3/s (50 000 cfm) to 61 m3/s(130 000 cfm), with nitrogen injection on both the headgateand tailgate of 0.19 m3/s (400 cfm). The GVBs were operatedat a flow rate of 0.17 m3/s (350 cfm). A rider coal seam 40 m(130 ft) above the mined horizon was modelled as methaneinlet, based on the actual stratigraphy of the cooperatingmine. The methane inlet amount for the model wasdetermined from mine measurements of methane released bythe ventilation systems and GVBs. The methane liberationrate used for the 460 m (1500 ft.) panel length is 0.5 m3/s(1040 cfm). The gob permeability is in the range of 2.0*10-7
to 5.1*10-6 m2 and the porosity is 14 to 40%, based ongeomechanical modelling using actual mine lithology, shieldloading information, as well as final and dynamic subsidencedata (Marts et al., 2014b). More information about meshing,model set-up, grid independence, turbulence, convergence,and solution is presented in a previous publication of CSMcoal mine ventilation and safety research group (Gilmore etal., 2015).
The explosive potential for the mixtures of methane and air ispresented using a colouring scheme based on Coward’striangle (Coward and Jones, 1952), as depicted in Figure 3.There are four distinct regions: the explosive region (red), afuel-rich inert region that can become explosive when freshair or oxygen is added (yellow), an inert region where noexplosive composition is possible (green and dark green),and a fuel-lean inert region (blue). The orange colour denotesan arbitrary, near-explosive zone. Worrall et al. (2012)developed an algorithm as a user-defined function (UDF) inFLUENT to correlate the methane-air mixtures with thesecolours. The contour plots for the plan view of the model areshown so as to visualize the EGZs in a plane at a height of1.5 m (5 ft) above the mine floor, which is approximately inthe middle of the coal seam height.
The authors validated the model predictions with the gasmeasurements conducted by the mine. The cooperating mineused a tube bundle gas analyser system that allowed formeasurements along the fringe of the gob. The mine alsoprovided the data for measurements of gases through sealsampling tubes and from manual readings at the face.
CFD study of the effect of face ventilation on CH4 in returns and explosive gas
VOLUME 117 259 �

CFD study of the effect of face ventilation on CH4 in returns and explosive gas
Additionally, discussions with mine personnel were used tovalidate the results. Oxygen ingress in the model wascompared with an actual mine as shown in Figure 4 at actualoperating conditions. Figure 4a shows the 12% oxygencontour plot from actual mine data, while Figure 4b showsthe oxygen contour plots from the model. The modelpredictions agree with oxygen measurements taken in themine. The general results of the CFD models agreed withoperator experience. The methane concentration at thetailgate return (0.5%) matched with the mine measurements.The methane concentration of gob ventilation boreholesexhaust predicted by the models also matched with the GVBsmethane quality at mine. According to the operator, methaneenters the face primarily at the tailgate corner as shown bythe models in Figure 8. The operator also reported lowoxygen concentration behind the shields inby the tailgatecorner, which matched the models results shown in Figure 4b.
Figure 5 shows the explosive mixture plots on the left andoxygen ingress plots on the right. All four cases use nitrogeninjection of 0.19 m3/s (400 cfm) on both the headgate andtailgate sides. Two GVBs are operating on the tailgate side.
Figure 5a shows gas mixtures at a face air quantity of 33 m3/s (70 000 cfm) and Figure 5b shows the results for aface air quantity of 61 m3/s (130 000 cfm). In Figure 5a, ayellow (fuel-rich, oxygen-deficient) zone is visible behind theshields near the tailgate corner. If the oxygen content of thisyellow zone increases, it will be capable of forming anexplosive mixture. Figure 5a also shows that the nitrogeninjection from the headgate (dark green) forms a separationbetween the oxygen-rich zone near the face and themethane-rich zone in the centre of the gob. Figure 5b showsthat with a higher quantity of air on the face (61 m3/s; 130 000 cfm), more face air ingresses into the gob and formsan explosive mixture, visible as a narrow red fringe betweenthe green and yellow areas. The explosive zone extendsbehind the shields and presents an immediate fire andexplosion hazard. The oxygen plots in Figure 5c and Figure5d show that with 33 m3/s (70 000 cfm) of air on the face,oxygen ingress into the gob is low, whereas with 61 m3/s(130 000 cfm) of air flow on the face, the oxygen ingressesmuch deeper into the gob. If the coal is present and has aspon-com propensity, such deep oxygen ingress could cause a fire, which would also present an ignition source for the EGZ. In all cases of face air variation from 23 m3/s (50 000 cfm) to 61 m3/s (130 000 cfm), the total EGZs
�
260 VOLUME 117

volume increased linearly, as shown in Figure 6. It should benoted that the yellow zone, while not explosive, still presentsa fire hazard, as fuel-rich mixtures of methane and air canburn with a diffusion flame. Most of the deeper gobs containlittle or no oxygen, as shown in oxygen contours plots inFigure 5b and Figure 5c.
The authors documented the relative volume of explosivemixtures and concentrations of methane in the tailgate returnas a function of varying face air quantity. Normally, onewould expect linear dilution of the tailgate and face methanewith increased face air quantities. However, Figure 6 showsthat there is no significant reduction of the tailgate methaneconcentration (red line) above a certain face air quantity(about 33 m3/s; 70 000 cfm in this case). Figure 6 shows thatthe EGZ volume (blue line) in the gob increases withincreasing face air quantity. This phenomenon is explainedas follows. As the face ventilation quantity is increased, ahigher pressure differential is created between the face andthe gob and more air (oxygen) will migrate into the gobthrough the gaps between the shields. Oxygen ingress intothe gob will enhance the formation of explosive mixtures.Where the coal has a high propensity for spontaneouscombustion, the oxygen ingress may also increase the spon-com potential. As shown in Figure 5b, if that EGZ is locatedjust behind the face, small changes to the gob atmosphericpressure due to a drop in barometric pressure or a roof fallcould push the EGZ into the face area.
The authors further investigated the phenomenon thatincreased air flow along the face will not lead to a propor-tional dilution in tailgate methane concentrations, as shownin Figure 6. There are two related phenomena occurring attwo different locations along the longwall face. An increase inpressure as the flow enters the active area will force moreoxygen into the gob, but as the flow is developed along thelongwall face, the higher velocity causes a greater pressure
drop, allowing methane to enter the active face furtherdownstream from the headgate towards the tailgate side.Figure 7 shows that increasing the face air quantity increasesthe volumetric flow of fresh air into the gob on the headgateside (blue line). This air ingress or leakage flow sweepsincreasing amounts of methane from the gob towards theface and into the tailgate. The red line shows the concen-tration of methane in the flow from the gob towards the face.The trend lines show a near-linear relationship between theface air quantity and the air and gas exchange phenomena inthe gob; this observed trend provides insights as to why theconcentration of methane does not drop further after a certainface air quantity. The path lines of air flow in the gob areshown in Figure 8, which confirms the flow into and out ofthe gob towards the tailgate.
The model contains two GVBs on the tailgate side that areoperated at 0.17 m3/s (350 cfm). The concentration ofmethane in the GVB exhaust from the modelling predictionsis plotted in Figure 9. Methane concentration in both GVBs isnear 100% at face air quantities of 33 m3/s (70 000 cfm) orbelow. Since GVB 1 (red line) is located near the nitrogeninjection point on the tailgate side crosscut, some nitrogenends up in the GVB, reducing the methane concentrationslightly. As the face air quantity is increased above 33 m3/s(70 000 cfm), the methane concentration in the GVBsdecreases due to the face air ingressing into the gob andmoving into the GVBs. As the face air quantity is increased,the GVBs start exhausting more air and the methane concen-tration in the exhaust subsequently decreases. GVBperformance provides additional evidence that higher face airquantities lead to deeper oxygen penetration into the gob.
The following conclusions are based on observed trends inthe above CFD parametric study on face ventilation.
� By increasing the quantity of air on the longwall face,additional air from the face is pushed into the gob near
CFD study of the effect of face ventilation on CH4 in returns and explosive gas
VOLUME 117 261 �
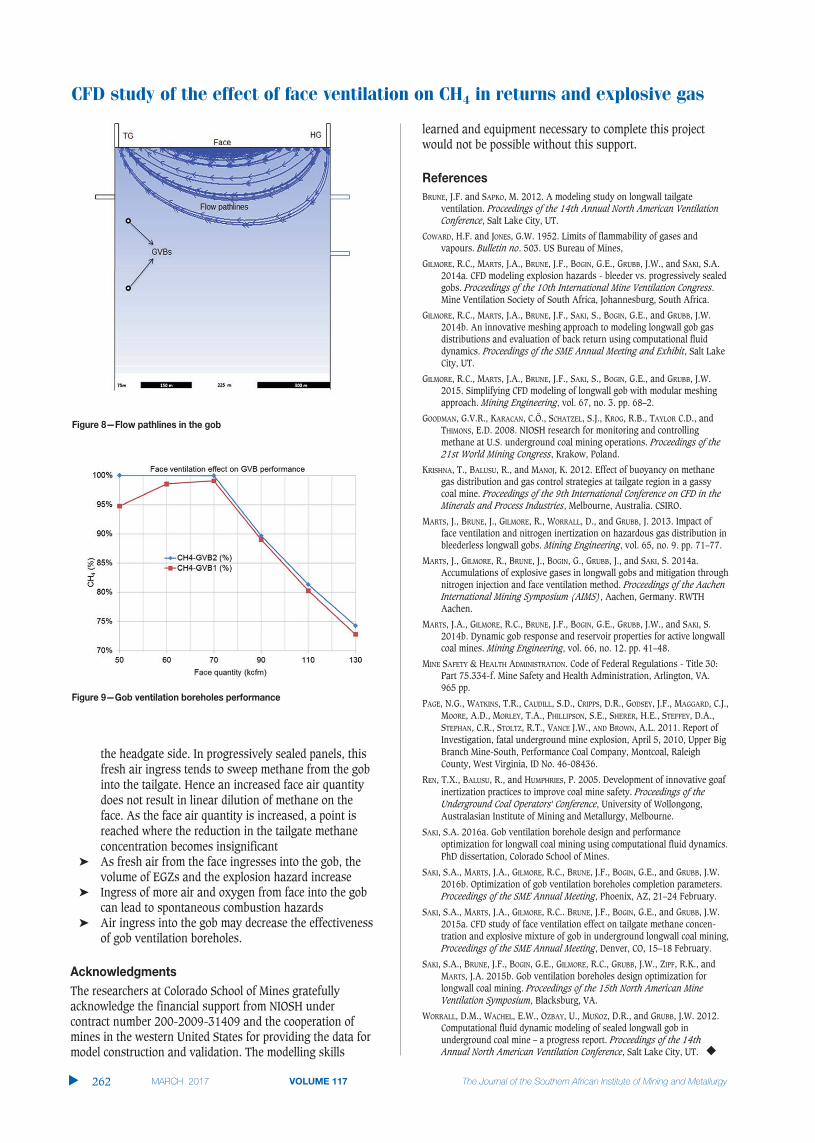
CFD study of the effect of face ventilation on CH4 in returns and explosive gas
the headgate side. In progressively sealed panels, thisfresh air ingress tends to sweep methane from the gobinto the tailgate. Hence an increased face air quantitydoes not result in linear dilution of methane on theface. As the face air quantity is increased, a point isreached where the reduction in the tailgate methaneconcentration becomes insignificant
� As fresh air from the face ingresses into the gob, thevolume of EGZs and the explosion hazard increase
� Ingress of more air and oxygen from face into the gobcan lead to spontaneous combustion hazards
� Air ingress into the gob may decrease the effectivenessof gob ventilation boreholes.
The researchers at Colorado School of Mines gratefullyacknowledge the financial support from NIOSH undercontract number 200-2009-31409 and the cooperation ofmines in the western United States for providing the data formodel construction and validation. The modelling skills
learned and equipment necessary to complete this projectwould not be possible without this support.
BRUNE, J.F. and SAPKO, M. 2012. A modeling study on longwall tailgateventilation. Proceedings of the 14th Annual North American VentilationConference, Salt Lake City, UT.
COWARD, H.F. and JONES, G.W. 1952. Limits of flammability of gases andvapours. Bulletin no. 503. US Bureau of Mines,
GILMORE, R.C., MARTS, J.A., BRUNE, J.F., BOGIN, G.E., GRUBB, J.W., and SAKI, S.A.2014a. CFD modeling explosion hazards - bleeder vs. progressively sealedgobs. Proceedings of the 10th International Mine Ventilation Congress.Mine Ventilation Society of South Africa, Johannesburg, South Africa.
GILMORE, R.C., MARTS, J.A., BRUNE, J.F., SAKI, S., BOGIN, G.E., and GRUBB, J.W.2014b. An innovative meshing approach to modeling longwall gob gasdistributions and evaluation of back return using computational fluiddynamics. Proceedings of the SME Annual Meeting and Exhibit, Salt LakeCity, UT.
GILMORE, R.C., MARTS, J.A., BRUNE, J.F., SAKI, S., BOGIN, G.E., and GRUBB, J.W.2015. Simplifying CFD modeling of longwall gob with modular meshingapproach. Mining Engineering, vol. 67, no. 3. pp. 68–2.
GOODMAN, G.V.R., KARACAN, C.Ö., SCHATZEL, S.J., KROG, R.B., TAYLOR C.D., andTHIMONS, E.D. 2008. NIOSH research for monitoring and controllingmethane at U.S. underground coal mining operations. Proceedings of the21st World Mining Congress, Krakow, Poland.
KRISHNA, T., BALUSU, R., and MANOJ, K. 2012. Effect of buoyancy on methanegas distribution and gas control strategies at tailgate region in a gassycoal mine. Proceedings of the 9th International Conference on CFD in theMinerals and Process Industries, Melbourne, Australia. CSIRO.
MARTS, J., BRUNE, J., GILMORE, R., WORRALL, D., and GRUBB, J. 2013. Impact offace ventilation and nitrogen inertization on hazardous gas distribution inbleederless longwall gobs. Mining Engineering, vol. 65, no. 9. pp. 71–77.
MARTS, J., GILMORE, R., BRUNE, J., BOGIN, G., GRUBB, J., and SAKI, S. 2014a.Accumulations of explosive gases in longwall gobs and mitigation throughnitrogen injection and face ventilation method. Proceedings of the AachenInternational Mining Symposium (AIMS), Aachen, Germany. RWTHAachen.
MARTS, J.A., GILMORE, R.C., BRUNE, J.F., BOGIN, G.E., GRUBB, J.W., and SAKI, S.2014b. Dynamic gob response and reservoir properties for active longwallcoal mines. Mining Engineering, vol. 66, no. 12. pp. 41–48.
MINE SAFETY & HEALTH ADMINISTRATION. Code of Federal Regulations - Title 30:Part 75.334-f. Mine Safety and Health Administration, Arlington, VA.965 pp.
PAGE, N.G., WATKINS, T.R., CAUDILL, S.D., CRIPPS, D.R., GODSEY, J.F., MAGGARD, C.J.,MOORE, A.D., MORLEY, T.A., PHILLIPSON, S.E., SHERER, H.E., STEFFEY, D.A.,STEPHAN, C.R., STOLTZ, R.T., VANCE J.W., AND BROWN, A.L. 2011. Report ofInvestigation, fatal underground mine explosion, April 5, 2010, Upper BigBranch Mine-South, Performance Coal Company, Montcoal, RaleighCounty, West Virginia, ID No. 46-08436.
REN, T.X., BALUSU, R., and HUMPHRIES, P. 2005. Development of innovative goafinertization practices to improve coal mine safety. Proceedings of theUnderground Coal Operators' Conference, University of Wollongong,Australasian Institute of Mining and Metallurgy, Melbourne.
SAKI, S.A. 2016a. Gob ventilation borehole design and performanceoptimization for longwall coal mining using computational fluid dynamics.PhD dissertation, Colorado School of Mines.
SAKI, S.A., MARTS, J.A., GILMORE, R.C., BRUNE, J.F., BOGIN, G.E., and GRUBB, J.W.2016b. Optimization of gob ventilation boreholes completion parameters.Proceedings of the SME Annual Meeting, Phoenix, AZ, 21–24 February.
SAKI, S.A., MARTS, J.A., GILMORE, R.C.. BRUNE, J.F., BOGIN, G.E., and GRUBB, J.W.2015a. CFD study of face ventilation effect on tailgate methane concen-tration and explosive mixture of gob in underground longwall coal mining,Proceedings of the SME Annual Meeting, Denver, CO, 15–18 February.
SAKI, S.A., BRUNE, J.F., BOGIN, G.E., GILMORE, R.C., GRUBB, J.W., ZIPF, R.K., andMARTS, J.A. 2015b. Gob ventilation boreholes design optimization forlongwall coal mining. Proceedings of the 15th North American MineVentilation Symposium, Blacksburg, VA.
WORRALL, D.M., WACHEL, E.W., OZBAY, U., MUÑOZ, D.R., and GRUBB, J.W. 2012.Computational fluid dynamic modeling of sealed longwall gob inunderground coal mine – a progress report. Proceedings of the 14thAnnual North American Ventilation Conference, Salt Lake City, UT. �
�
262 VOLUME 117

Anglo American Platinum (AAP) is constantlystriving towards safe, sustainable, productiveand cost-effective operations. There are manydifferent initiatives, among whichmechanization, and in particular, mining withultra-low profile (ULP) and extra-low profile(XLP) equipment in pre-developed stopingareas has been identified.
This paper considers the best practices thathave already been implemented in AAP’smechanized mining operations and details thenew-generation XLP and ULP equipment thatis currently in the production trial and proof-of-concept phases respectively. This equipmentis able to achieve a monthly production rate inexcess of 4000 m2, inclusive of the panel andadvanced strike drive (ASD) areas, whenoperating in the narrow-reef mechanizedmining layout that was developed by AAP.
Emphasis is placed on the higherproduction levels and greater efficiencies thatcan be achieved using this equipment. Thepaper also highlights the importance of the
mining cycle as well as the availability of theequipment. It examines the new skills sets thatare required within the industry, and willdiscuss some of the interim results that havebeen achieved during the production trials andproof-of-concept trials.
The paper builds on initial analysis andmodelling work that was conducted tounderstand and optimize AAP’s existing XLPsections. The learning outcomes were thenapplied in the development of the ULPequipment.
The extensive modelling exercisesdemonstrated that improved safety and valuecan be achieved. The layout and technologydiscussed in this paper are currently beingimplemented in test sections at AAP. Thispaper is an expanded and updated version ofthe paper presented at the Sixth InternationalPlatinum Conference in 2014, and includes theresults of the XLP production trial.
The mine design provides the parameters to beused in the layout of a new logistical miningmethod. The design criteria will be as practicalas possible, and will endeavour to conformwith and improve upon existing standards andbest mining practices. The stoping method thatwill be used is an on-reef scattered breastmining system, utilizing ULP miningequipment that has been designed to operatein stoping widths of 0.90–1.20 m. It isimportant to note that the same miningmethod can be conducted using XLP miningequipment, which is operating in stopingwidths ranging from 1.30–1.70 m.
This paper serves as a guideline to the ULPmining method; however, a ‘fit-for-purpose’study must be conducted for each mine andcircumstance prior to implementing themethod.
Narrow-reef mechanized mining layoutat Anglo American Platinumby F. Fourie*, P. Valicek*, G. Krafft†, and J. Sevenoaks†
Anglo American Platinum (AAP) is constantly striving towards safe,sustainable, productive, and cost-effective operations. There are manydifferent initiatives, one of which is mechanization, and in particular,mining with extra-low profile (XLP) or ultra-low profile (ULP) equipmentin pre-developed stoping areas.
This paper considers the best practices that have already beenimplemented within AAP’s mechanized mining operations and details new-generation XLP and ULP equipment that is anticipated to be able toachieve monthly production rates in excess of 4000 m2, inclusive of thepanel and advanced strike drive areas. The new-generation XLPequipment has completed its production trial and the ULP equipment isentering its proof-of-concept phase.
This paper will discuss the results obtained during the XLP productiontrial as well as the progress that has been made on the ULP equipment.Emphasis is placed on the higher production levels and greater efficienciesthat can be achieved using this equipment. The paper will highlight theimportance of the mining cycle as well as the availability of the equipment.It will also examine the new skills sets that will be required in theindustry.
mechanization, narrow-reef layout, extra-low profile, ultra-low profile,mining cycle.
* Anglo American Platinum.† Cyest Analytics.© The Southern African Institute of Mining and
Metallurgy, 2017. ISSN 2225-6253. Paper receivedApr. 2016.
263VOLUME 117 �
http://dx.doi.org/10.17159/2411-9717/2017/v117n3a8
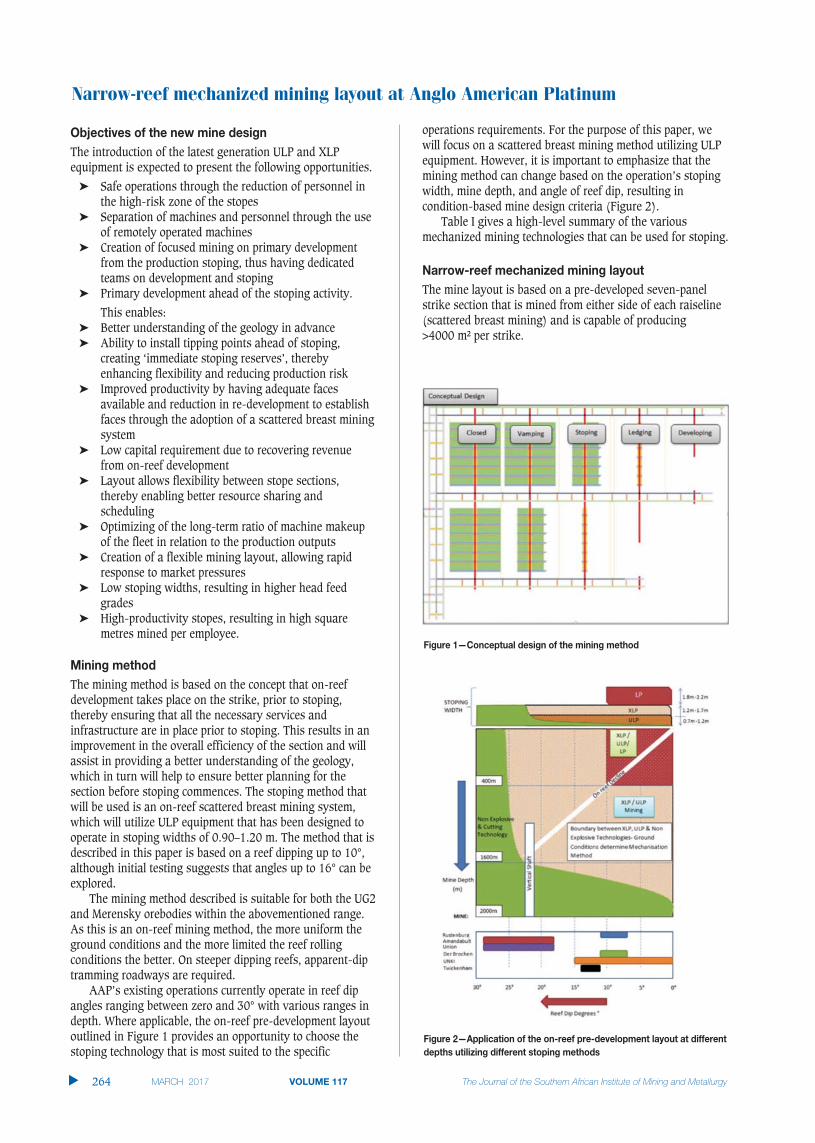
Narrow-reef mechanized mining layout at Anglo American Platinum
The introduction of the latest generation ULP and XLPequipment is expected to present the following opportunities.
� Safe operations through the reduction of personnel inthe high-risk zone of the stopes
� Separation of machines and personnel through the useof remotely operated machines
� Creation of focused mining on primary developmentfrom the production stoping, thus having dedicatedteams on development and stoping
� Primary development ahead of the stoping activity.
This enables:� Better understanding of the geology in advance� Ability to install tipping points ahead of stoping,
creating ‘immediate stoping reserves’, therebyenhancing flexibility and reducing production risk
� Improved productivity by having adequate facesavailable and reduction in re-development to establishfaces through the adoption of a scattered breast miningsystem
� Low capital requirement due to recovering revenuefrom on-reef development
� Layout allows flexibility between stope sections,thereby enabling better resource sharing andscheduling
� Optimizing of the long-term ratio of machine makeupof the fleet in relation to the production outputs
� Creation of a flexible mining layout, allowing rapidresponse to market pressures
� Low stoping widths, resulting in higher head feedgrades
� High-productivity stopes, resulting in high squaremetres mined per employee.
The mining method is based on the concept that on-reefdevelopment takes place on the strike, prior to stoping,thereby ensuring that all the necessary services andinfrastructure are in place prior to stoping. This results in animprovement in the overall efficiency of the section and willassist in providing a better understanding of the geology,which in turn will help to ensure better planning for thesection before stoping commences. The stoping method thatwill be used is an on-reef scattered breast mining system,which will utilize ULP equipment that has been designed tooperate in stoping widths of 0.90–1.20 m. The method that isdescribed in this paper is based on a reef dipping up to 10°,although initial testing suggests that angles up to 16° can beexplored.
The mining method described is suitable for both the UG2and Merensky orebodies within the abovementioned range.As this is an on-reef mining method, the more uniform theground conditions and the more limited the reef rollingconditions the better. On steeper dipping reefs, apparent-diptramming roadways are required.
AAP’s existing operations currently operate in reef dipangles ranging between zero and 30° with various ranges indepth. Where applicable, the on-reef pre-development layoutoutlined in Figure 1 provides an opportunity to choose thestoping technology that is most suited to the specific
operations requirements. For the purpose of this paper, wewill focus on a scattered breast mining method utilizing ULPequipment. However, it is important to emphasize that themining method can change based on the operation’s stopingwidth, mine depth, and angle of reef dip, resulting incondition-based mine design criteria (Figure 2).
Table I gives a high-level summary of the variousmechanized mining technologies that can be used for stoping.
The mine layout is based on a pre-developed seven-panelstrike section that is mined from either side of each raiseline(scattered breast mining) and is capable of producing >4000 m² per strike.
�
264 VOLUME 117

Twenty years ago, underground hard-rock miningtraditionally made use of conventional mining methods. Asthe technology used in open pit mining evolved, theknowledge gained was applied to develop underground hard-rock mechanized mining equipment. This resulted in theintroduction of low-profile (LP) equipment into AAP’sshallow operations (shallow operations are defined asoperations up to 400 m in depth with a dip less than 10°),and subsequently in the development of the first generationof XLP equipment. The LP equipment was used for bord andpillar mining, and over the course of the past 15 years therehave been significant improvements in both production andsafety, with the average monthly production per crewcurrently being approximately 2400 m2.
Due to the historically high capital costs of the XLPequipment, as well as the inconsistent results (one month ofhigh production followed by low production the next month)due to inefficiencies (from a logistical and geologicalperspective) in the traditional breast mining layout, the profitmargins of an XLP operation were minimal compared to LPoperations.
However, through the introduction of the latestgeneration XLP and ULP technologies as well as a clearerunderstanding of mechanized mining principles that wasgarnered through extensive analysis and modelling, XLP andULP mining below 400 m utilizing the narrow-reefmechanized mining layout has been shown to create signifi-cantly more value from both a financial and an operationalperspective, due to the extraction ratios that can be achievedusing these methods coupled with the overall efficiencies(>4000 m2 production per month) of the XLP/ULPequipment.
The focus has therefore been on:
� The change management required to introduce the newXLP and ULP technologies
� Training in mechanization best practices throughdedicated training centres
� Introduction of the narrow-reef mechanized mininglayout.
Figure 2 provides a high-level overview of the variousapplications of the narrow-reef mechanized mining layout
using various stoping methods. At present, significant workis being conducted within AAP in partnership with AngloAmerican in developing non-explosive technologies.
The layout consists of three main elements:� On-reef pre-development� Ledging� Stoping (scattered breast mining).
The on-reef pre-development is separate from the stopingactivity, which forms an integral part of the stoping layout.The mining layout is designed around the principle of havingfour active raiselines (development, ledging, stoping,sweeping and vamping) as illustrated in Figure 3. To assistwith the rapid development a mobile crushing unit has beendeveloped.
The mine design makes extensive use of mechanized miningequipment for on-reef pre-development as well as for thescattered breast mining stoping method. This sectionprovides a brief introduction to the XLP/ULP mining cycleand equipment. The XLP equipment has been availablewithin the industry for a number of years, and thereforegreater emphasis is placed on the ULP equipment.
Narrow-reef mechanized mining layout at Anglo American Platinum
VOLUME 117 265 �
Table I
Depth 0–400 m 350–1800 m 350–1800 m
Stoping width 1.8–2 m 1.3–1.7 m 0.9–1.2 m
Mining method Bord and pillar Breast mining Breast mining
Dip Approx. 10° 0–22° 0–22°
Production 2 100–3 000 m2 2 100–3 000 m2 2 000–3 000 m2
Orebody Consistent ore deposits without major faults Consistent orebody, high extraction ratio Fairly consistent orebody, high extraction ratio
Advantages Low-level operating complexity Less dilution when compared to LP High-grade ore.Less waste introduced into plant Able to deal with orebody complexities
Disadvantages High-volume tonnages. Low grade Robust equipment. Labour-intensive. Advanced technology. Highly skilledHigh operating cost. Complex infrastructure Highly skilled workforce required. workforce required. Technology in POC phase
Complex infrastructure

Narrow-reef mechanized mining layout at Anglo American Platinum
An overview of the mining cycle is given in Figure 4. It isimportant to note that the XLP/ULP equipment will be used tomine the panels and create the ventilation holings, whereasthe low-profile (LP) mechanized equipment will be requiredto develop the advance strike drives (ASDs) and sidings.
In 2003 AAP partnered with Atlas Copco, Dok-ing, andSandvik to develop equipment that was capable of operatingin stoping widths ranging between 1.2–1.4 m (Figures 5 and 6).
In 2007 the first XLP test trial was conducted atAmandebult mine. The equipment was later moved toBathopele mine, where >3000 m2 has been achieved in aproduction section using the traditional (single-sided) XLPbreast mining method.
In 2003 the first XLP dozer was trialled at AAP. Followingthis trial, the need to develop a mechanized suite ofequipment that would be able to operate in low stopingwidths (<1.2 m) was identified. In 2007 a suitable originalequipment manufacturer (OEM) was appointed and in 2011an agreement was signed by AAP to develop the first ULPfleet.
The ULP technology is currently capable of operating instoping widths ranging between 0.9–1.2 m at depths rangingfrom 350–1800 m at dip angles of up to 22°. The equipmenthas been designed to operate in fairly consistent orebodies.Figure 7 shows the ULP fleet
Key milestones in the progression of the ULP technologyare:
� Full understanding of mechanization principles� Modelling and optimization (mining cycle) of XLP and
LP mining methods� Development of a new on-reef mechanized layout
(incorporating optimal face length and number ofpanels).
The ULP dozer is designed to clean mined material fromunderground places of work and remove it into the ASD.Figure 8 illustrates the ULP dozer cleaning the panel.
The ULP roofbolter (Figure 9) is a double-boomed roofbolterthat has been designed to operate in stoping widths between0.9–1.2 m at a nominal bolting speed of less than eightminutes between collaring of successive 1.6 m holes.
�
266 VOLUME 117

The ULP drill rig (Figure 10) is a three-boomed drill rig thathas been designed to operate in stoping widths between 0.9–1.2 m.
KPIs:
� The drill rig has been designed to drill a minimum oftwo panels in a five-hour working shift
� Power for the drill rig movement and positioning isprovided by an onboard electric battery. Depending onthe deployed drilling technology and if technicallypossible, the same battery should be used as a sourceof energy for drilling. If this is not possible, an electro-hydraulic drilling system shall be deployed. In thatcase, this system shall be powered by the mine powergrid
The ULP sweeper (Figure 11) is a cleaning tool intended tofacilitate sweeping tasks in locations that the ULP dozer
cannot reach. These sweeping tasks are currently performedmanually.
KPIs:The mobile sweeper shall clean the following locations:
� The footwall of the stope between the face and the firstline of support
� The accumulated remnant broken rock between thesupport structures of the first line of support
� The corner where the rock face and the footwall meet.
The unit is thus intended to sweep 10 m behind the faceposition. The sweeper has been designed to remove remnantrock in the work area.
The orebody will be accessed via a barrel decline cluster asillustrated in Figure 12 (for the purpose of this paper, athree-barrel decline cluster has been used). The declineconsists of a centre main dip conveyor decline and twotransport declines, all of which are used for intakeventilation.
The dip of the three-barrel decline will be a maximum of10º to accommodate trackless mobile equipment (TME). Thespacing of the three-barrel decline cluster and regional andprotection pillars will be in accordance with rock engineeringrequirements.
Narrow-reef mechanized mining layout at Anglo American Platinum
VOLUME 117 267 �

Narrow-reef mechanized mining layout at Anglo American Platinum
One of the transport declines will be a dedicated mineentry transport route and the other a dedicated mine exittransport drive. The drive under the belts will connect thedecline transport system to the strike transport system.
The purpose of pre-development is to ensure that all thenecessary services and infrastructure are in place prior toledging or stoping taking place. The pre-developmentincorporates two strike drives, a raiseline, as well as pre-installed footwall (FW) tips. The layout has been designed toimprove the overall efficiency as well as the logistics withinthe section. By pre-developing the strike before stoping takesplace one is also able to gain a greater understanding of thegeology, thereby improving the overall planning for the area.
The pre-development layout comprises the followingdesign elements:
� Strike belt drives� Strike transport drives� Winze and raiselines� Connectors� Double-sided footwall tip.
The strike belt drive and transport drive are developedconcurrently at intervals above and below the seven-panelmining area with a footwall tip situated in the strike beltdrive on the top and bottom of each raiseline.
The strike belt drive is a designated drive for the belt andmine personnel, while the strike transport drive is adesignated drive for machinery. The design makes use ofconnectors (interconnecting roadways) to facilitate movementbetween the strike belt drive and strike transport drive duringpre-development. The interconnecting roadways ensure thetramming distances during the development of the strike belt,transport drive, and raiseline are kept to a minimum. This isachieved through the introduction of a mobile crushing unitfitted with a sacrificial belt, which is positioned in the strikebelt drive.
A more detailed description of the footwall tip and mobilecrushing unit is given in the section that follows; with thekey design elements summarized in Table II.
The double-sided footwall tip has been designed to establishflexibility between stope sections, thereby enabling betterresource sharing. This is achieved by placing the tip in thefootwall, thus making it accessible from either side of theraise. The tip has been designed to allow mechanized
equipment to drive over the deck plates, allowing for quickand easy access into other stope sections. The tip has beendesigned to accommodate tipping by LHDs from both theupdip and downdip sides of the raiseline. In order to reducethe tipping time as well as the need to go into thehangingwall, each LHD is fitted with a pushplate. Figures 14to 16 illustrate the footwall tip and spoon feeder assemblies.
The spoon feeder has been designed to be applied in allAAP’s underground operations. The design of the spoonfeeder allows material from underground workings to betipped onto the strike belt at a low trajectory angle by avibrating or oscillating feed. The oscillating action of thespoon feeder controls the amount of ore that is deposited onthe belt, ensuring that there will be no lumping and thusimproving the lifespan of the belt.
�
268 VOLUME 117

The tip grizzly is designed to allow blasted rock smallerthan 300 mm by 300 mm to pass through the tip into thespoon feeder (unless otherwise stipulated). The tip isequipped with a mobile pecker, which is able to breakoversized rock into manageable pieces that will fit throughthe grizzly.
Figure 16 provides a cross-section of an installed footwalltip in the strike belt drive.
The mobile crusher (Figure 17) has been designed forunderground mines, and will be installed in the centre of thestrike belt drive. The crusher is intended to feed crushedmaterial from development workings in a low-trajectory angle
Narrow-reef mechanized mining layout at Anglo American Platinum
VOLUME 117 269 �
Table II
Pre-developed and • Minimized interaction between machinery and personnel Pre-developed layout ensures logistics infrastructure is aheadproposed stoping • Designated areas for labour, machinery, and handling lines • Tips are always in placelayout • Creates safe operations through the reduction of personnel • Separate pre-development and production tipping points
in the high-risk zone of stopes • Max. distance of face to tip not exceeded• In-stope remotely operated equipment • Designated crew and fleet for primary development (focused mining)Minimizes travelling, people, and machinery in an excavation • Better appreciation of geology due to pre- development being due to development of designated drives for travelling well ahead of stopingand for the belt • Separate primary and secondary development (in conjunction with
stoping). Checkerboarding, increasing productivity and utilization• Specialist development teams• Assists planning (better geological information)• Improved m2
• Better face availability• Construction crew is part of the development crewRaiselineOptimal tramming distance of LHDs, resulting in a better utilization due to multiple tipping points (updip and downdip tips resulting in lesscongestion in the raiseline)TipsTips are able to be leapfrogged once the tip is no longer required toserve the sectionOre handling line transporting ore from primary development and stoping continuously
Mobile crusher Safety Standards Design reduces or eliminates re-handling of big rocks• Mine Health and Safety Act – Act 29 of 1996 • Mobile crusher unit• SANS 10104 • Modular design ensures that major components can be easily • ISO 7731: 2003 replaced• EN 954-1998• AFRS GUIDELINES• SRMP GUIDELINESDials and gauges are visible
Double-sided tips • Designed to create a safer environment around tip • Double-sided tips, therefore accessible either side of the raiseSafety standards: • Handles large LHDs without any delay• Mine Health and Safety Act – Act 29 of 1996 • Quick, easy, and cost-effective tip moves• SANS 10104 • Major components are easily accessible• ISO 7731: 2003 • Tips are always in place• EN 954-1:1998 • Pre-development and production tipping points are separated, • AFRS GUIDELINES therefore reducing congestion• SRMP GUIDELINES
Ventilation Equipment to use low-sulphur diesel • Ventilation-on-demand systemSufficient time to ensure the necessary ventilation • Machines equipped with catalyst, particulate filters, and Tier-2 infrastructure is in place prior to stoping. type diesel engines
Rock mechanics Pre-development layout provides the ability to • Development and stoping are separated, ensures that the supportpredict ground conditions and potholes timeously always meets the support requirements
Strike transport drive Designated drive for machinery (strike pillar Due to pre-development, roadway quality can be separates the two drives) assured, resulting in better tramming speeds and fewer breakdowns
Strike belt drive Designated drive for the belt and for mine • Dedicated area for the beltpersonnel to travel through • Services run
• Strike pillar protects the belt

Narrow-reef mechanized mining layout at Anglo American Platinum
onto the strike belt. The mobile crusher has been designed toreduce the tramming distances of the LHD, thereby improvingthe overall development cleaning cycle. The mobile crusher isaccessed from the transport drive via the interconnectingroadway as shown in Figure 18.
Figure 19 illustrates the LHD tipping onto the mobilecrusher. The LHD should be fitted with a pushplate to reducethe tipping time.
Pre-development will follow the mining cycle that is
summarized in Figure 18. It is important to note that pre-development is done parallel with and independent ofstoping.
The pre-development crew’s role is to ensure thateverything is in place for the stoping team to commence itswork. Thus the crew will be responsible for the following:
� Development ends� Cubbies� Winzing and raising of the raiseline� Satellite workshops� Crosscuts (interconnecting roadways)� Movement and installation of the tip and belts� Reticulation extension� Ventilation extension� Vent holings (if required)� Initial drainage.
� On a true dip layout the stoping team will performledging. For ledging on apparent dip a separate ledgingteam will be required
�
270 VOLUME 117

� Ledging will proceed from the top to the bottom of theraiseline
� Checkerboarding will be used for ledging to reduce longunsupported spans. The concept of checkerboarding isillustrated in Figure 21
� Off the raiseline, the ASDs and sidings will be blasted 6m in (two blasts) using LP equipment
� At each alternative ledge face, a 1 m round followed bya 3 m round will be drilled by a LP drill rig positionedin the raiseline. This will be drilled to the requiredstope height between 0.9–1.2 m
� The blast will incorporate a ramp from the bottom ASDinto the ledge so that the ULP equipment can access theledge. This will predominately be throw-blasted intothe ASD, the remainder will be cleaned with the ULPdozer
� The first 1 m of ledging will be supported using the LPbolter
� Once cleaned, the ledge will be supported using theULP roofbolter (according to rock engineering specifi-cations)
� From the third round onwards, the ULP equipment willbe used to advance the ledge until the final primarysupport has been installed
� While the ledging is taking place the ASDs are kept atleast 2 m, but not more than 10 m, ahead of the ledgeusing the LP equipment
� Permanent strike support is then installed along theraise according to rock mechanics standards
� Once the ledge is completed, then the ledge on theopposite side of the raise can be completed
� Once all ledging has been completed on either side ofthe raiseline, equipping can commence.
The mining method that has been adopted for this layout isscattered breast mining utilizing ULP equipment with stopepanels lagging the ASDs. Emulsion explosives will be usedfor charge-up and blasting.
The stoping layout described in this paper is based on amining depth of >500 m and therefore a siding has beenincorporated into the layout. The stope face is to be drilledusing at least a 2 m drill steel and advanced at the very least1.8 m per blast while operating within stoping widthsbetween 0.9–1.2 m (in this paper a stoping width of 1.1 mhas been used).
The ASDs and sidings will advance at least 2.8 m perblast and should be drilled using a 3 m drill steel. Two 12-hour shifts will be worked per day. Blasting is planned totake place on both shifts, although the layout offers anopportunity to create multi-blast conditions. Re-entry periodwill be as determined by the ventilation department. Thisresults in an effective face time of eight hours and thirtyminutes per shift.
The stope panels and ventilation holings will be drilledusing a ULP three-boom drill rig. A LP single-boom drill rigwill be used to drill the ASD and siding. The ASD will becarried 2–10 m ahead of the stope. An overview of thestoping layout is given in Figure 22 and Figure 23.
Narrow-reef mechanized mining layout at Anglo American Platinum
VOLUME 117 271 �
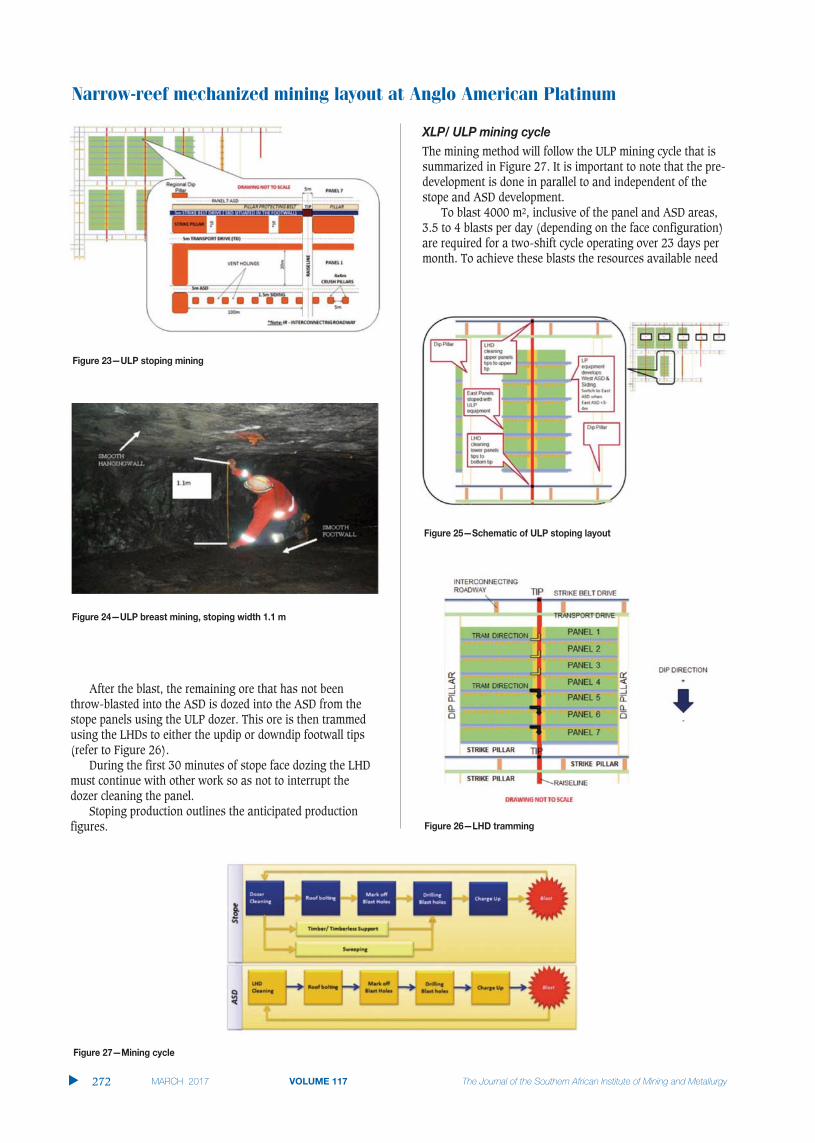
Narrow-reef mechanized mining layout at Anglo American Platinum
After the blast, the remaining ore that has not beenthrow-blasted into the ASD is dozed into the ASD from thestope panels using the ULP dozer. This ore is then trammedusing the LHDs to either the updip or downdip footwall tips(refer to Figure 26).
During the first 30 minutes of stope face dozing the LHDmust continue with other work so as not to interrupt thedozer cleaning the panel.
Stoping production outlines the anticipated productionfigures.
The mining method will follow the ULP mining cycle that issummarized in Figure 27. It is important to note that the pre-development is done in parallel to and independent of thestope and ASD development.
To blast 4000 m2, inclusive of the panel and ASD areas,3.5 to 4 blasts per day (depending on the face configuration)are required for a two-shift cycle operating over 23 days permonth. To achieve these blasts the resources available need
�
272 VOLUME 117
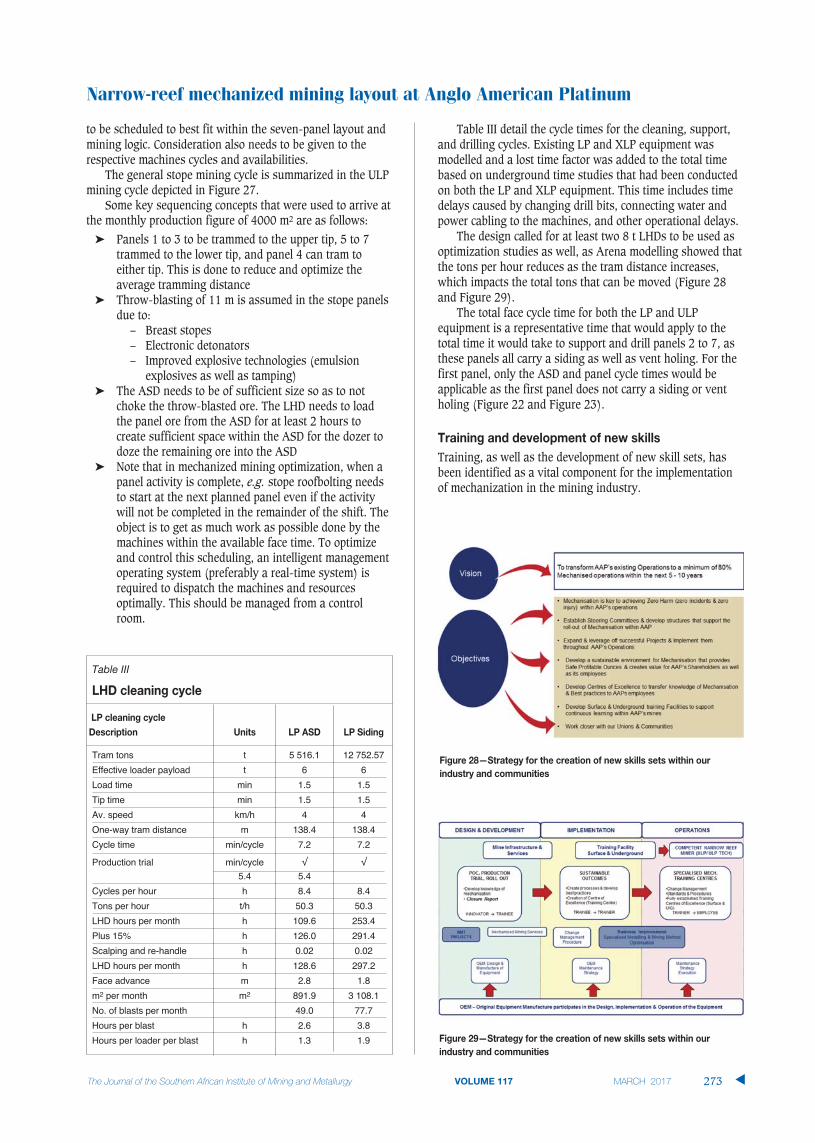
to be scheduled to best fit within the seven-panel layout andmining logic. Consideration also needs to be given to therespective machines cycles and availabilities.
The general stope mining cycle is summarized in the ULPmining cycle depicted in Figure 27.
Some key sequencing concepts that were used to arrive atthe monthly production figure of 4000 m2 are as follows:
� Panels 1 to 3 to be trammed to the upper tip, 5 to 7trammed to the lower tip, and panel 4 can tram toeither tip. This is done to reduce and optimize theaverage tramming distance
� Throw-blasting of 11 m is assumed in the stope panelsdue to:
– Breast stopes– Electronic detonators– Improved explosive technologies (emulsion
explosives as well as tamping)� The ASD needs to be of sufficient size so as to not
choke the throw-blasted ore. The LHD needs to loadthe panel ore from the ASD for at least 2 hours tocreate sufficient space within the ASD for the dozer todoze the remaining ore into the ASD
� Note that in mechanized mining optimization, when apanel activity is complete, e.g. stope roofbolting needsto start at the next planned panel even if the activitywill not be completed in the remainder of the shift. Theobject is to get as much work as possible done by themachines within the available face time. To optimizeand control this scheduling, an intelligent managementoperating system (preferably a real-time system) isrequired to dispatch the machines and resourcesoptimally. This should be managed from a controlroom.
Table III detail the cycle times for the cleaning, support,and drilling cycles. Existing LP and XLP equipment wasmodelled and a lost time factor was added to the total timebased on underground time studies that had been conductedon both the LP and XLP equipment. This time includes timedelays caused by changing drill bits, connecting water andpower cabling to the machines, and other operational delays.
The design called for at least two 8 t LHDs to be used asoptimization studies as well, as Arena modelling showed thatthe tons per hour reduces as the tram distance increases,which impacts the total tons that can be moved (Figure 28and Figure 29).
The total face cycle time for both the LP and ULPequipment is a representative time that would apply to thetotal time it would take to support and drill panels 2 to 7, asthese panels all carry a siding as well as vent holing. For thefirst panel, only the ASD and panel cycle times would beapplicable as the first panel does not carry a siding or ventholing (Figure 22 and Figure 23).
Training, as well as the development of new skill sets, hasbeen identified as a vital component for the implementationof mechanization in the mining industry.
Narrow-reef mechanized mining layout at Anglo American Platinum
VOLUME 117 273 �
Table III
Tram tons t 5 516.1 12 752.57
Effective loader payload t 6 6
Load time min 1.5 1.5
Tip time min 1.5 1.5
Av. speed km/h 4 4
One-way tram distance m 138.4 138.4
Cycle time min/cycle 7.2 7.2
Production trial min/cycle √ √
5.4 5.4
Cycles per hour h 8.4 8.4
Tons per hour t/h 50.3 50.3
LHD hours per month h 109.6 253.4
Plus 15% h 126.0 291.4
Scalping and re-handle h 0.02 0.02
LHD hours per month h 128.6 297.2
Face advance m 2.8 1.8
m2 per month m2 891.9 3 108.1
No. of blasts per month 49.0 77.7
Hours per blast h 2.6 3.8
Hours per loader per blast h 1.3 1.9

Narrow-reef mechanized mining layout at Anglo American Platinum
The results thus far achieved from the XLP productiontrial clearly demonstrate that higher production levels (>4000m2 per month) and greater efficiencies can be achieved withthe new-generation equipment that has been developed.However, in order to maximize this potential, new skill sets(Figures 28 and 29) are required to be developed within theindustry.
Operators of the future will need to be:
� Strongly focused on safety� Goal-orientated� Adaptable and flexible� Able to think and act strategically� Effective communicators� Have a strong sense of teamwork and collaboration� Visual spatial thinkers� Capable of performing maintenance on their machines.
In order to create these skills for the future AAP hasembarked on the creation of Centres of Excellence as well asexperiential learning. Coupled to this, AAP is constantlylooking at other innovative and creative ways to identify andgarner these skills within the surrounding communities aswell as applying best-practice measures taken from our peersin industry.
The following key milestones in the progression in narrow-reef mechanized mining have been met:
� Full understanding of mechanization principles� Modelling and optimization (mining cycle) of XLP and
LP mining methods� Development of a new on-reef mechanized layout
(incorporating optimal face length and number ofpanels).
The narrow-reef mechanized mining layout has beendesigned around (and focuses on) the following four keyareas:
� Safety� Sustainability� Productivity� Cost-effectiveness.
The mining layout is designed to remove personnel from thehigh-risk zone of the stopes.
� The ULP technology has been designed to separatemachines and personnel through the use of remote-controlled technology
� The layout introduces a dedicated drive for machinery(strike transport drive) as well as a dedicated drive forpersonnel and belt system (strike belt drive)
� The layout allows for future automation of the miningprocess, which will be managed using a managementoperating system based in a control room on surface
� Through pre-development the orebody is betterunderstood, resulting in better planning
� The layout requires a skilled workforce that is highlytrained and highly safety-conscious
� The mechanized mining method improves undergroundconditions through the introduction of well-controlledhangingwall and sidewall conditions.
� The layout supports concentrated and dedicated miningwithin a section by divorcing the pre-development fromthe secondary development and stoping activities. Theprimary development team is responsible for ensuringthat all the necessary services and infrastructure are inplace before stoping commences within the section. Thelayout also offers the potential to switch betweenexplosive (LP/XLP/ULP) and non-explosive stopingmethods depending on the dip, depth, and resourcewidth of the orebody
� Higher production levels and greater efficiencies can beachieved using mechanized equipment
� On-reef mechanization delivers early ounces (higherhead grade). A majority of the capital and developmentcosts are offset by revenue generated by on-reefdevelopment
� Flexible layout – the 14-panel layout has been designedto create flexibility within operations (the layoutimproves productivity by having adequate facesavailable and reduces the amount of re-developmentthat is required to re-establish faces). The mininglayout is designed around the principle of having fouractive raiselines (development, ledging, stoping, andsweeping and vamping)
� The layout incorporates logistical elements (optimaltramming distances, improved footwall conditions, tips,services, and IT infrastructure are in place prior tostoping)
� Pre-development results in upfront geologicalinformation
� The layout provides effective ventilation and support� The ULP technology is able to operate in stoping widths
of 0.9–1.2 m, thereby reducing the dilution andincreasing the grade of the feed to the plant.
Through proper planning and the understanding ofmining principles as well as the introduction of newtechnology, safer, more productive, and sustainableoperations are possible in narrow-reef tabular miningsystems.
ANGLO AMERICAN PLATINUM LIMITED. 2011. Building Foundations for the Future
through Mining. Anglo American Integrated Report 2011.
CAMBITSIS, A. and LANE, G. 2012. A framework to simplify the management of
throughput and constraints. Cyest Corp. Internal white paper
VALICEK P., FOURIE, F., KRAFFT, G., and SEVENOAKS, J. 2012. Optimization of
mechanized mining layout within Anglo American Platinum. Proceedings
of the Fifth International Platinum Conference: A Catalyst for Change, Sun
City, South Africa, 17–21 September 2012. Southern African Institute of
Mining and Metallurgy, Johannesburg. pp. 1–34.
FOURIE, F., VALICEK, P., KRAFFT, G., and SEVENOAKS, J. 2014. Narrow reef
mechanized mining layout at Anglo American Platinum. Proceedngs of the
6th International Platinum Conference, ‘Platinum–Metal for the Future’,
Sun City, South Africa, 20–22 October 2014. Southern African Institute of
Mining and Metallurgy, Johannesburg. pp. 1–20. �
�
274 VOLUME 117

Mining is the process of extracting mineralsfrom the earth, and different mining methodshave been developed over time (Lacy andLacy, 1992). Block/panel caving is anunderground mining method based on theaction of gravity for ore breakage andtransport. It has the lowest cost and thehighest production rates of undergroundmethods (Douglas, 1992; Heslop, 2000). Inaddition, block/panel caving is the safestunderground mining method, although it hasassociated operational risks such asrockbursts, air blasts, and mudrushes (Heslop,
2000). A mudrush is a sudden inflow of mudfrom drawpoints or other undergroundopenings inside the mine (Butcher et al.,2005). Mudrushes can cause damage toequipment, ore dilution, production delays,injuries, and fatalities.
In block/panel caving mines, an undercutlevel is developed in the base of the orebodyand a production level is constructed somedistance below. An arrangement of openingscalled drawbells is excavated between theundercut level and the production level, anddrawpoints are located on the bases of thedrawbells. A horizontal ore layer is extractedfrom the undercut level in order to collapse theorebody above, and broken ore then falls intothe drawbells and is managed on theproduction level. As broken ore is removedfrom drawpoints, the ore above continues tobreak and cave (Douglas, 1992). This methodis inherently susceptible to mudrushes, owingto the fact that it has all the elements that arenecessary: mud-forming material, distur-bances, discharge points, and water (Butcheret al., 2000). Mud is formed by fine granularparticles and water (Becerra, 2011; Hubert etal., 2000; Jakubec et al., 2012; Lacy and Lacy,1992; Samosir et al., 2008). Water comes fromthe surface or from underground sources, andfine granular particles come from surface orfrom abrasion of ore during caving. Thedischarge points are the drawpoints on theproduction level.
Geotechnical characterization of orerelated to mudrushes in block cavingminingby R.L. Castro*, K. Basaure*, S. Palma*, and J. Vallejos*
Mudrushes are sudden inflows of mud ore into underground miningfacilities. They may cause harm to people and equipment, productiondelays, dilution of ore, and mine closure. The aim of this work is to charac-terize, by geotechnical laboratory tests, mud from a block cave and toderive mechanical reasons for the failure of this material while it is beingdrawn. We used ore samples from extraction points closed due to mudrushpotential from the Diablo Regimiento Sector at El Teniente Mine, whichrepresent the three types of mud ore. Characterization showed that thesamples comprise gravel and sand with silt and clay grain sizes, whereasthe fine particles are classified as low-plasticity silt and clay. Only smalldifferences in fines content, density, and packing were found. The effectsof density and degree of saturation on ore strength in unconfinedconditions were evaluated. It was found that relative density is the mostrelevant variable that governs the unconfined strength. Triaxial consol-idated tests showed a linear relationship between deviatoric strength andeffective confining stress. Deviatoric strength is related to the capacity toflow under triaxial conditions, and consequently it could be related tomudrushes. Unconsolidated, saturated material exhibited a very lowdeviatoric maximum strength followed by static liquefaction, resulting inresidual strength values close to zero. In terms of mining, the geotechnicaltests were related to the draw rate and the saturation conditions: a highrate of draw could cause unconsolidated conditions as the strength of themud decreases close to zero, while a low extraction rate could be related toconsolidated conditions where the ore is allowed to release the porepressure. If the ore is under unsaturated conditions it presents a lower riskas it will develop uniaxial strength.
mudrush, block caving, geotechnical characterization.
* Univeristy of Chile, Santiago, Chile.© The Southern African Institute of Mining and
Metallurgy, 2017. ISSN 2225-6253. Paper receivedNov. 2015; revised paper received Jul. 2016.
275VOLUME 117 �
http://dx.doi.org/10.17159/2411-9717/2017/v117n3a9

Geotechnical characterization of ore related to mudrushes in block caving mining
Mudrushes are triggered by disturbances, which may bedynamic, as in blasting, equipment movements, orearthquakes (Call and Nicholas, 1998; Jakubec et al., 2012),or static as in stable arch collapse above drawbells (Butcheret al., 2000, 2005; Jakubec et al., 2012) and ore drawing(Butcher et al., 2000, 2005; Call and Nicholas, 1998; Jakubecet al., 2012). Previous investigators have postulated twomechanisms for the occurrence of mudrushes. In onemechanism, the ore loses shear strength: an increase in thewater content of mud can change its properties (Butcher etal., 2005; Jakubec et al., 2012), decreasing its shear strength.In the other mechanism, stress induces a high water pressurein the mud pores (Call and Nicholas, 1998; Hubert et al.,2000), resulting in a sudden decrease in the shear strength –a phenomenon called static liquefaction (Yamamuro andLade, 1998) or flow failure (Yoshimine and Ishihara, 1998).The proposed mechanisms have not been proven quantita-tively to date.
Call and Nicholas (1998) geotechnically characterized theore from six samples involved in mudrushes in IOZ mine,Freeport, Indonesia. They found that ore involved inmudrushes had more than 20% of particles less than 2 mm,and could be classified as ‘well graded fine gravel with coarseto fine sand’, ‘poorly graded to silty fine gravel’, and ’poorlygraded fine gravel to silty fine gravel’ depending on eachsample. They also compared the samples with other sandygravel materials and concluded that, at greater than 80%saturation, the material is prone to liquefy due to the excesspore pressure. They performed five unsaturated, consol-idated, undrained triaxial tests on a composite from two ofthe samples, using initial conditions of confining stressesfrom 50 kPa to 200 kPa, loose compaction, and watercontents from 1% to 9%. Results showed that all samplesreached 100% saturation after consolidation, and three ofthem developed liquefaction: instability with an increase inpore pressure (Yamamuro and Lade, 1998). Nevertheless,they did not establish the specific conditions in whichliquefaction occurs, because of the small number of triaxialtests and the unspecific initial set of conditions.
In the present paper we study geotechnical properties ofmud-type ore from the Diablo Regimiento Sector (DR) ofCodelco’s El Teniente Mine, Chile. The aim is to obtaingeotechnical parameters to describe the ore, characterize thestrength and behaviour under different conditions, and usethe results to evaluate and quantify the mechanisms foroccurrence of mudrushes. We first describe concepts forunderstanding the results and interpreting the experimen-tation. This is followed by a description of the materialsamples and experimental methods. Finally, we discuss theresults and the proposed mechanisms for mudrushes basedon experimental results.
Mud ore is known to be a moist, fine-sized granular material;
its void ratio and porosity are uncertain because of thedensity changes caused by the ore flowing through thecolumn and drawbells until it reaches the drawpoints, wherethe material is extracted, (Kvapil, 1992). Water content isalso a variable of mud ore in mine conditions, depending onthe permeability of the ore and water sources (Call andNicholas, 1998). In this section we discuss the physicalrelationships between water, void, and solid phases in agranular assemblage in order to describe compaction andwater content in mud ores. Also, we present concepts tounderstand the behaviour of granular materials in relation to stress and pore pressure. Minimum and maximum packingdensities are properties of granular materials that can bemeasured in a laboratory, but their values depend on theprocedure used (Lambe and Whitman, 1969). Equation [1]represents the relative density, an index used to comparepacking of different materials depending on their individualpacking properties (Lambe and Whitman, 1969). emax andemin are maximum and minimum possible void ratios for agranular material, respectively, and e is the current void ratio,where void ratio is the ratio of void volume to solid volume(Lambe and Whitman, 1969). At zero relative density thematerial is in its loosest possible packing state, and a relativedensity of 100% indicates that the material is in the densestpossible state.
[1]
Water in a granular material is retained in the voidsbetween particles, and thus the quantity of water that agranular material can hold depends on the available voids.Saturation (Equation [2]) is a concept used to quantify waterin a granular material in relation to voids available (Lambeand Whitman, 1969):
[2]
where V is the volume of water in the granular material andVV is the volume of voids between solid particles.
Equation [3] shows the relationship between void ratioand saturation, and water content and specific gravity Gs,where specific gravity is the unit weight of solid divided bythe unit weight of an equal volume of water, and the watercontent is the ratio of water weight to solid weight (Lambeand Whitman, 1969). This equation is used to describe therelationship between volume and mass indexes.
[3]
The pore pressure concept mentioned in the previoussection in relation to mudrush mechanisms refers to thepressure of water inside pores or voids of a saturatedgranular material such as soil or other aggregate. Porepressure depends on the water level above the point wherethe pore pressure is evaluated, and on the stresses acting on
�
276 VOLUME 117

the saturated granular material. Pore pressure is related tothe concept of effective stress, as presented in Equation [4],where effective stress ’ is calculated by subtracting the porepressure (u) from the total stress ( ). Additionally, itrepresents stresses supported only by the solid structure ofthe granular material.
[4]
For granular materials, there are three types of triaxialtests depending on the conditions of drainage and initialconsolidation. These are unconsolidated-undrained (UU),consolidated-undrained (CU), and consolidated-drained (CD)tests (Das, 2002). The drainage condition depends on therate of shear stress and the permeability conditions in thefield. The drained test is used for low-rate loads or high-permeability aggregates in which pore pressure can dissipatewhen the sample is under stress. The undrained test is forhigh-rate loads or low permeability, in which pore pressurecannot be dissipated or changed during the application ofstress. Consolidation is the process in which water contentdecreases, with consequent reduction in volume due to theconfining stress acting on a saturated granular material(Lambe and Whitman, 1969). Consolidation is completewhen all pore pressure has been dissipated from the material,and consequently the water content and volume stayconstant. In order to understand the mechanical behaviour,stresses developed in triaxial tests are interpreted usingdeviatoric (q) and mean stress (p), both depending on theprincipal stresses. Mean stress is the isotropic (spherical)component of stress, and deviatoric stress is the componentthat causes the shearing (Schofield and Wroth, 1968).Triaxial tests have well-defined principal stresses, withvertical compression ( v) as the major principal stress andconfining stress ( c) as the minor and intermediate principalstresses (Lambe and Whitman, 1969). Mean stress (p) canalso be expressed as mean effective stress (p’). Equations [5]and [6] show the mean effective stress and the deviatoricstress for triaxial test conditions (Schofield and Wroth,1968), respectively.
[5]
[6]
Granular materials such as silty sands can exhibitdifferent deformation behaviours, depending on the initialdensity and the confining stress. Dilative and contractivebehaviour indicate increasing or decreasing rates of volumechange, respectively. In undrained conditions, dilative andcontractive behaviour can be identified by the decrement orincrement of pore pressure respectively. Consequently,according to Equation [4], dilative and contractive behaviourare indicated by the increment or decrement in mean effectivestress respectively. Loose sand tends to contract until the
mean effective stress reaches a minimum and the behaviourchanges from contractive to dilative at a point termed thephase transformation (Yoshimine and Ishihara, 1998). Flowfailure or static liquefaction occurs when a confined loosegranular material with contractive behaviour exhibitsinstability or loss of shear strength before the phase transfor-mation (Yamamuro and Lade, 1998).
Samples for this study were obtained from Diablo Regimiento(DR) Sector at El Teniente mine, which is the largestunderground copper mine in the world. It is located 50 kmeast of Rancagua city in Chile, between 2100 and 2800 mabove sea level. The mining method is mechanizedblock/panel caving using load haul dump (LHD) machines.Mud has appeared in several drawpoints in El Teniente andthere have been seven mudrush events since 1989 (Becerra,2011). In DR, three kinds of mud ore have been identified,according to visual characterization by mine personnel: greymud associated with sulphide ores, yellow mud associatedwith oxide ores, and a mixture of yellow and grey mud. Threesamples of mud ore were collected from different drawpointsclassified as constituting a critical risk (Becerra, 2011). Eachsample is representative of one type of mud ore according tomine personnel, as shown in Table I.
Sampling was carried out by mine personnel in charge ofwater content. Samples were extracted using a hand shovel totake increments of mud on an imaginary horizontal lineacross the drawpoint 1.5 m from the floor. This method wasdeveloped by El Teniente in order to take samples that arerepresentative of ore in drawpoints. Samples weretransported in sealed plastic bags to the laboratory, wherethey were dried and prepared for testing.
Samples were tested in the Solids Laboratory facilities of theCivil Engineering Department of Universidad de Chile. Testswere carried out to obtain a geotechnical characterization anddetermine the geomechanical behaviour of mud-type ore.Given the known characteristics of mud ore, ASTM standardtests for soils were selected for geotechnical characterization,one for each sample. Table II lists a summary of the tests.
The tests listed in Table II have different objectives: grainsize distribution, specific gravity, liquid and plastic limits; the
Geotechnical characterization of ore related to mudrushes in block caving mining
VOLUME 117 277 �
Table I
1 Grey color Sulphides2 Yellow color Oxides3 Mixed color Mixture

Geotechnical characterization of ore related to mudrushes in block caving mining
maximum and minimum densities are determined to charac-terize and classify mud-type ore, and to obtain indexgeotechnical parameters for use in the geomechanical tests.Unconfined compression tests were carried out to determineunconfined and partially saturated strengths of mud ore, andhow the strength changes with different degrees of saturationand compaction. Finally, triaxial tests were performed inorder to obtain geomechanical behaviour of mud-type ore insaturated confined conditions, and determine how it changeswith different initial compaction grade, initial consolidation,and confining stress.
Grain size distributions were obtained using sieveanalysis on 32 kg subsamples separated by quartering.Material was washed with water to separate fines using a 200mesh (75 m) sieve as filter. Finally, material was placed onthe uppermost sieve and the sieve assembly was vibrated.The fines from cleaning and grains retained on sieves wereweighed in order to calculate the grain size distribution of thesamples.
Specific gravity testing was carried out using twodifferent methods, depending on the grain size. For particlesizes greater than 4.75 mm we used the water pycnometermethod, in which a volume of water is weighed, and then thesame volume is filled with a known mass of solid materialsubmerged in water. The mass difference was used to obtainthe soil density, which divided by water density gives thespecific gravity of the solid. For particle sizes over 4.75 mm, adry portion of material was weighed and then submerged andits weight under water measured; the dry weight is dividedby the difference between dry and submerged weights toobtain the specific gravity.
Liquid limit testing was performed on the fine fraction ofsamples (less than 0.425 mm). A wet layer of material isadded over a specially designed standard spoon, and a grooveis cut in the middle. The spoon is then repeatedly droppedfrom a standard height until the groove is closed. The aim ofthis procedure is to obtain the water content of two
subsamples that require from 15 to 25 drops, two from 25 to35 drops, and one close to 25 drops, then plot the number ofdrops versus water content and construct a straight linebetween the points. The liquid limit is the intercept of 25drops and the straight line. The minimum density testmethod consists of filling a container of known volume andweight with material using a pouring device to place it asloosely as possible, and then weighing the container with theloose material inside to obtain the density. This procedure isrepeated at least three times and the lowest density isselected as the minimum density.
Maximum density is carried out using the modifiedProctor test, in which a wet portion of material is compactedin layers in a container of known volume. This procedure isrepeated with different water contents to obtain themaximum wet density. Finally, the dry density is calculated from maximum wet density and water content to obtain themaximum density. Maximum and minimum void ratios arecalculated using minimum and maximum density respectivelywith specific density for each sample. The plastic limit wasdetermined only for the fine fractions of samples (less than0.425 mm). This method involves forming an ellipsoidalmass with 1.5 to 2 g of wet material and rolling it with thehand against a ground-glass plate until it has a uniformdiameter of 3.2 mm, then breaking it into several pieces andsqueezing it together to repeat the procedure. The mass ofmaterial slowly dries with each cycle, and when the masscrumbles after reaching a diameter of 3.2 mm it is placed in acontainer and its water content, which is the plastic limit ofthe sample, determined.
Three constant-head permeability tests were performedon each sample in order to determine the permeabilitycoefficient at different relative densities. Samples werecompacted to RD values of 30%, 60%, and 70%. The testconsists of measuring the time (in seconds) in which avolume (in mm) of water passes through a cylindricalpermeameter filled with a saturated sample. Water
�
278 VOLUME 117
Table II
Grain size distribution Sieve analysis D6913 1 3
Specific gravity Water pycnometer D854 1 3Water immersion C127 1 3
Liquid limit Casagrandes’s spoon D4318 1 3
Plastic limit Rolling D4318 1 3
Minimum density Pouring in cylinder of known volume D4254 1 3
Maximum density Modified Proctor D1557 1 3
Permeability coefficient Constant-head permeability D 2434 3 9
Unconfined strength Unconfined compression D2166 9 27
UU confined behaviour UU triaxial D2850 4 12
CU confined behaviour CU triaxial D4767 9 27

temperature is also measured in order to normalize the waterviscosity to 20°C. This procedure is repeated at least threetimes for each test and the results averaged.
Equations [1], [2], and [3] in combination with indexparameters are used to set different conditions of saturationdegree and compaction for unconfined and triaxialcompression tests. An unconfined compression test involvesthe axial compression of a cylindrical specimen in a strain-controlled compression device until failure. The test endswhen there is a decrease in stress or decrease of more than20% in axial strain. The maximum stress reached duringtesting is the unconfined compressive strength. Force andaxial strain are measured during testing with a precision of0.001 kN and 0.001 mm respectively. The initial cross-sectional area of the specimen is calculated as the average ofnine diameter measurements with a precision of 0.1 mm inorder to calculate the stress.
Nine combinations of relative density and saturationdegree, as in Table III, were used to perform unconfinedcompression tests. Ranges for the relative densities andsaturation degrees were selected in order to allow the correctselection of cylindrical specimens for testing in unconfinedconditions. Specimens were moulded using the knowncharacteristics of each sample to calculate, using Equations[1] and [3], the pertinent water contents. Finally, the moistsub-sample was compacted in five layers using a metalmould in order to attain the density and saturation setpreviously.
The triaxial test involves the axial compression of asaturated cylindrical specimen with constant isotropicconfining stress imparted by the water pressure until 20%axial strain is reached. The specimen is separated from theconfining water by a rubber membrane. At the base and topof the specimen, porous discs allow water drainage from theinside of the specimen. Drainage is connected to a valve inorder to allow or close water drainage. For a consolidated testthere is an initial consolidation stage in which the drainagevalve is opened and water outflow is measured with aprecision of 1 ml. In the compression test stage, the drainage
valve is closed for undrained triaxial conditions, and the porepressure is measured with precision of 0.1 kPa. Triaxial testswere carried out using three controlled variables: confiningstress, initial relative density, and consolidation. Sampleswere fully saturated for all cases. For consolidated tests, threeconfining stresses and three initial relative densities wereselected. For unconsolidated tests, pore pressure equalsconfining stress and the initial effective stress is zero for anyconfining stress. Consequently, the behaviour should notchange for different confining stresses, and only twoconfining stresses are tested to verify this. Samplescompacted to 40% relative density showed a very lowstrength (near zero), therefore tests at zero relative densitywere not performed and there are only four unconsolidatedtests for each sample. Table IV summarizes the conditions forthe 13 triaxial tests performed on each sample.
Geotechnical characterization is summarized using indexvalues from the test results. Table V shows the indexes of orefrom the three samples for each test. Grain size distributionsare presented in terms of percentage weight passing each sizein Figure 1. It can be seen that all samples have similardistributions: well-graded, with coarse sizes mostly under 50mm and fines with sizes less than 75 m comprising over10% by weight of the samples. Sample 2 contains more fines(less than 75 m) than others – over 20% by weight – andsample 1 has the lowest percentage of fines. Sample 3 hasthe largest maximum particle size, between 150 mm and 75mm, compared with the other samples whose maximumparticle size is between 75 mm and 50 mm. Specific gravityresults from Table V show small differences for the threesamples, with sample 2 having the lowest specific gravity. Wecalculated the specific gravity as the average of the resultsobtained using the coarse and fine methods, taking note of
Geotechnical characterization of ore related to mudrushes in block caving mining
VOLUME 117 279 �
Table III
20 4520 6020 7560 4560 6060 7590 4590 6090 75
Table IV
Yes 0 196Yes 0 392Yes 0 588Yes 40 196Yes 40 392Yes 40 588No 40 196No 40 588Yes 80 196Yes 80 392Yes 80 588No 80 196No 80 588

Geotechnical characterization of ore related to mudrushes in block caving mining
the minimal differences between measured values of coarseand fine specific gravity (less than 2%) for all samples.Therefore specific gravity does not depend on grain size forthe analysed material. Plastic and liquid limits are similar forall samples, which are all classified in the same groupaccording to ASTM (D2487-00) standard: low-plasticity siltand clay. However, the liquid limits of samples 2 and 3 are,
respectively 4% and 4.4% higher than the liquid limits ofsample 1, and the plastic limits of samples 2 and 3 are 4.1%and 2.2% higher than the plastic limit of sample 1. Thesedifferences mean that, with the same water content, finesfrom sample 1 are more prone to flow than the other samples.Minimum and maximum void ratios are very similar for thethree samples, with values between silty sand (from emax =0.9 to emin = 0.3) and fine to coarse sand (from emax 0.95–0.2)according to typical values (Douglas, 1992). Sample 2 hasthe highest minimum and maximum void ratios: themaximum void ratio of sample 2 is 12%, 8% higher thansamples 1 and 3. Moreover, the minimum void ratio ofsample 2 is 6%, 25% higher than samples 1 and 3. Thisindicates that sample 2 is prone to looser density states,because its both its maximum and minimum density arelower than the values for the other samples. It must be notedthat the above indexes could not be related to the strength ofthe granular mass.
Permeability results are presented in Figure 2. Thepermeability coefficient is inversely related to relative density(RD). Sample 1 has the lowest values for all RD conditions,which means water can flow faster through sample 1 at thesame compaction condition.
Unconfined compression tests were carried out at variousrelative densities and saturation levels. The results showsmall changes in strength with saturation varying in therange 45% to 75%, and larger strength changes with relativedensity variations. Averaged unconfined strength values foreach sample and RD, at different degrees of saturation, areplotted in Figure 3. For all samples, strength increases withcompaction, and the exponential model of Equation [7] isfitted to each sample:
[7]�
280 VOLUME 117
Table V
150 100% 100% 100%
75 100% 100% 98.0%
50 98.0% 99.5% 93.0%
37.5 94.0% 97.7% 85.7%
25 82.8% 94.0% 75.5%
19 Sieve analysis D6913 74.0% 90.0% 69.8%
9.5 55.0% 74.6% 54.2%
4.75 39.8% 62.8% 44.8%
2.36 29.8% 52.7% 36.7%
0.6 19.1% 37.6% 25.7%
0.3 15.9% 31.5% 21.6%
0.15 13.5% 26.6% 18.0%
0.075 11.5% 22.5% 14,8%
Specific Water D854, 2.76 2.68 2.72gravity pycnometer, C127
water immersion
Liquid limit Casagrandes’s D4318 21.7% 25.7% 26.1%spoon
Plastic limit Rolling D4318 16.9% 21.% 19.1%
Minimum Pouring in D4254 0.27 0.28 0.22void cylinder of ratio known volume
Maximum Modified D1557 0.90 1.00 0.93void ratio Proctor

where Su is unconfined strength, and are modelconstants, and RD is the relative density. Sample 2 has lessstrength than the others at high relative densities. Using theexponential models we can see that samples 1 and 3 havestrengths 30% and 49% higher than sample 2 at 95% relativedensity. Table VI contains the detail of the parameters fittedto unconfined strength values for each sample usingEquation [7].
For triaxial testing the compaction conditions in Table IVwere set. The real initial relative densities for tests conductedafter saturation compaction changes are listed in Table VII,which also shows the final relative densities after consoli-dation The triaxial test results show the same behaviour forall samples. In order to explain material behaviour, onlyresults from sample 2 are presented. In Figure 4a we observea rapid initial increase in deviatoric stress for all consolidatedtests. The deviatoric stress then stabilizes before passing 5%
axial strain, followed by a low rate of increase. In some casesdeviatoric stress reaches a maximum value and then slowlydecreases to less than 8% of the maximum. Figure 4b showsdeviatoric stress versus mean effective stress, and acontractive behaviour can be seen with an initial fast increasein deviatoric stress, which stabilizes when mean effectivestress reaches the minimum at phase transformation for eachtest. After phase transformation, a contractive behaviour isexhibited with small increases in deviatoric stress. Accordingto Figure 4a and 4b, the consolidated saturated triaxialstrength at phase transformation and maximum strengthdepends on mean effective stress. It is also possible to see arelationship between relative density and strength. Finalrelative density after consolidation depends more onconfining stress than initial relative density, as seen in Table IX, where we observe that the standard deviationvalues of initial relative density are 5 to 12 times greater thanthose of final relative density for the same confining stress.Consequently, the strength at phase transformation andmaximum strength depend only on effective confining stressfor consolidated undrained conditions. We can use Equation[8] to fit the strength at phase transformation and maximumstrength separately for each sample in a linear relationhipthat depends only on mean effective stress.
[8]
Geotechnical characterization of ore related to mudrushes in block caving mining
VOLUME 117 281 �
Table VI
1 4.660 5.742 0.9992 1.587 6.596 0.9993 1.163 7.344 0.999
Table VII
Yes 0% 196 31.0% 69.0% 24.8% 71.7% 35.5% 70.2%Yes 0% 392 27.8% 74.6% 32.4% 76.5% 29.6% 72.9%Yes 0% 588 28.0% 80.3% 30.4% 78.7% 31.1% 73.9%Yes 40% 196 40.5% 71.5% 47.2% 73.6% 41.9% 71.8%Yes 40% 392 42.0% 77.8% 40.6% 78.2% 38.8% 74.9%Yes 40% 588 45.3% 80.9% 43.3% 80.4% 40.0% 77.5%Yes 80% 196 58.7% 72.7% 62.8% 74.7% 66.1% 76.3%Yes 80% 392 68.3% 77.9% 60.5% 79.1% 64.5% 77.6%Yes 80% 588 63.0% 83.0% 59.9% 81.2% 67.9% 78.9%No 40% 196 41.4% 41.4% 42.5% 42.5% 40.1% 40.1%No 40% 588 41.0% 41.0% 42.6% 42.6% 42.3% 42.3%No 80% 196 65.5% 65.5% 62.5% 62.5% 61.9% 61.9%No 80% 588 67.0% 67.0% 60.3% 60.3% 60.4% 60.4%

Geotechnical characterization of ore related to mudrushes in block caving mining
Fitted parameters of the model for all samples arepresented in Table IX. They indicate that all samples have asimilar failure curve for strength at phase transformation andmaximum strength. The M parameter is obtained by the bestfit of Equation [8] to the results. M is 4% higher in samples 1and 3 than in sample 2 for maximum strength. On the otherhand, for residual strength, the M factor is 3% higher insample 1 than in samples 2 and 3. Unconsolidated tests for
�
282 VOLUME 117
Table IX
M (maximum) 1.547 1.489 1.544M (phase transformation) 1.493 1.447 1.448
Table VIII
196 Average 43.4% 71.0% 44.9% 73.3% 47.8% 72.8%Standard deviation 14.1% 1.9% 19.1% 1.5% 16.1% 3.2%
392 Average 46.0% 76.8% 76.8% 44.5% 44.3% 75.1%Standard deviation 20.5% 1.9% 14.4% 1.3% 18.1% 2.4%
588 Average 45.4% 81.4% 44.5% 80.1% 46.3% 76.8%Standard deviation 17.5% 1.4% 14.8% 1.3% 19.2% 2.6%

sample 2 are plotted in Figure 4c and Figure 4d. Thedeviatoric stress of unconsolidated mud increases rapidly to amaximum value and then decreases at a constant rate until itreaches almost zero strength, with maximum values around30 kPa and residual values between 0.1 kPa and 10 kPa forall samples. These results show a loss of strength after phasetransformation, consequently monotonic liquefaction or flowfailure occurs due to the high pore pressures developed.Nevertheless, maximum and residual deviatoric strengthsobtained in unconsolidated tests are minimal compared withthose of consolidated tests, and do not depend on initialcompaction or confining stress. Samples with densecompaction show a greater variation in pore pressure duringtesting, but mean effective stress is very low for all tests, dueto the similar pore pressures and confining stress values thatwere applied in the experiments. Given these points, weconclude that mud-type ore in a saturated condition is moreprone to flow under low mean effective stress than underhigh effective stress. A low mean effective stress condition ispossible in the case of low confining stress and also whenpore pressure is high according to Equation [4]. In unconsol-idated triaxial and unconfined compression conditions, theeffective confining stress is zero (or near zero for triaxialconditions). Nevertheless, the strength for unconsolidatedmaterial under triaxial conditions is comparable with only thelowest values for unconfined tests, even when packing forunconsolidated tests is medium to high. Values of unconsol-idated strength are closer to those for loose unconfined tests,which can be explained by the partial saturation ofunconfined tests. When saturation is not full, capillary forcesare developed inside the granular structure, giving the ore anapparent cohesion. On the other hand, unconsolidated testsare fully saturated, and consequently there are no capillaryforces acting. Also, high pore pressures are developed andflow failure or static liquefaction is present in this condition.
In the first sections of this paper we identified differenttriggers and mechanisms for mudrushes from severalauthors. Here, considering the experiments conducted so far,we analyse the geomechanical behaviour in order todetermine the feasibility of these different mechanisms andtriggers. Deviatoric stress has been described as the stressthat generates shear in a material, and a material ‘flows’ or deforms when the shear stresses acting on it exceed theshear strength of the material. Consequently, we assume thatthe deviatoric strength of the ore is directly related to itscapacity to flow. We presented two mechanisms by whichmud can lose sufficient shear strength to flow: liquefaction,and increase in water content. Additionally, we establishedthat Diablo Regimiento mud is affected by static liquefactionor flow failure phenomena only in an unconsolidatedcondition, which means low mean effective stress. Also, wehave shown that strength variations with saturation are
minimal compared with compaction (RD) changes, andsaturation depends not only on water content, but also onvoid ratio, as can be seen in Equation [3]. At constantsaturation, the greater the volume of voids, the greater thewater content, hence the results in Figure 3 also showindirectly an exponential increase in strength with a decreasein water content.
The shear strengths of the mud in a saturated conditionand in partial saturation depend on effective confining stressand compaction (packing), respectively. Consequently, orecan lose shear strength only if it loses effective confiningstress under saturated conditions or becomes looser underunsaturated conditions. Extraction from drawpoints involvesloosening of the flowing ore, as demonstrated by the scalemodels of Kvapil (1992). Therefore the distribution of verticalstresses in zones under draw would reach low verticalstresses or low confined conditions. The greater the massdrawn in a cycle, the less the vertical load to be expected.
This also means that the zones that are not extracted willexperience higher vertical loads, which implies compaction(for partial saturation) or consolidation (for full saturation).As mentioned previously, UU and CU conditions for triaxialtests represent extreme cases of consolidation beforeshearing. We hypothesize that, in the field, a very high rateof draw means no full consolidation of ore, and a low rate ofdraw gives enough time for full consolidation. As we haveseen previously, no consolidation means zero (or very low)effective confining stress. It is important to note that theprocess of consolidation is always occurring, and a true non-consolidated mud in the field is improbable. We can,however, have cases that are closer to non-consolidatedconditions as a result of extraction and the low permeabilityof the mud. Given these points, high rates of draw can be animportant trigger mechanism for mudrush occurrences. Tosummarize, if ore is saturated and draw is too rapid to allowconsolidation, it is then more susceptible to flow than aconsolidated ore. On the other hand, if ore is not saturated, italso loses strength with drawing due to the packingbecoming looser. Nevertheless, saturated strengths are lowerthan partial saturation strength, and ore in a saturatedcondition is always more prone to flow than in anunsaturated condition. In saturated conditions, meaneffective stress can also decrease due to increasing porepressure; this is possible if the water level is increased insideor over the drawbell owing to inhibited drainage of the waterfrom the granular mass. A very compacted mud in the base ofdrawbells is a very low-permeability medium, which favoursthe accumulation of water. It is important to realize that mudore can always flow if it is exposed to a disturbance thatexceeds its shear strength.
Geotechnical parameters have been obtained for threesamples of mud-type ore, comprising sand and gravel with
Geotechnical characterization of ore related to mudrushes in block caving mining
VOLUME 117 283 �

Geotechnical characterization of ore related to mudrushes in block caving mining
silt and clay, from Diablo Regimiento Sector, El Teniente.There are differences between samples in the finest sizefraction (less than 1 mm). The oxide sample is finer than theother two samples, and its liquid and plastic Atterberg limitsare higher, which means that it is less susceptible tochanging its state from solid to plastic and from plastic toliquid with increasing water content. This means that, giventhe differences in the samples, water content should not beconsidered as a flow parameter directly, because its influencecan change depending on the characteristics of each kind ofmud. Unconfined compression tests show no importantvariation in strength with an intermediate variation ofsaturation degree (from 45% to 75%), but a very importantincrease in strength related to an increase in packing densityis developed for all samples, which was modelled using anexponential function for each sample. Triaxial tests showed aclear correlation between deviatoric strength and effectiveconfining stress. Tests on unconsolidated material showedalmost no deviatoric strength compared with the consolidatedcondition, and material in this condition is the only one proneto suffer static liquefaction or flow failure. For a mudrush it isnecessary for the ore strength to be exceeded under a givenstress state. At a high draw rate from the drawpoint, consoli-dation is not full and stresses are also low. Therefore orestrength is lower than in the case of fully consolidated ore. Itis thus easier for a mudrush to occur with a high drawingrate. Water accumulation inside pores of ore within and overdrawbells can increase pore pressure in the ore, lowering theeffective confining stress and consequently making it easierfor its strength to be exceeded and a mudrush to develop witha high level of water over the drawbell. Research on themudrush phenomenon is in an initial stage and will require,from a geomechanical point of view, a thoroughunderstanding of stresses acting in granular media duringflow.
This work was supported by Innova Corfo with collaborationof Codelco Chile, El Teniente. The authors also acknowledgethe support of the Department of Mining Engineering and theAdvanced Mining Technology Center of the University ofChile.
BECERRA, C. 2011. Controlling drawpoints prone to pumping. Proceedings of
Geomin 2011, Session 7: Mine Production Geology / Geo-metallurgy.
BUTCHER, R., JOUGHIN, W., and STACEY, T.R. 2000. Methods of combating
mudrushes in diamond and base metal mines. SIMRAC OTH601 Project.
Safety in Mines Research Advisory Committee, Johannesburg
BUTCHER, R., STACEY, T., and JOUGHIN, W. 2005. Mud rushes and methods of
combating them. Journal of the South African Institute of Mining and
Metallurgy, vol. 105. pp. 807–824.
CALL & NICHOLAS, INC., FREEPORT MCMORAN COPPER AND GOLD, CO., and HYDROLOGIC
CONSULTANTS, INC. 1998. IOZ wet muck study.
DAS, B. 2002, Soil Mechanics Laboratory Manual (6th edn). Oxford University
Press. Chapter 18.
DOUGLAS, J. 1992. Block caving. SME Mining Engineering Handbook (2nd edn).
Society for Mining, Metallurgy and Exploration, Littleton, CO. Chapter
20.3.
HESLOP, T. 2000. Block caving — controllable risks and fatal flaws. Proceedings
of Massmin 2000, Brisbane, Australia, 29 October–2 November.
Australasian Institute of Mining and Metallurgy, Melbourne.
HUBERT, G., DIRDJOSUWONDO, S., PLAISANCE, R., and THOMAS, L. 2000. Tele-
operation at Freeport to reduce wet muck hazards. Proceedings of
Massmin 2000, Brisbane, Australia, 29 October–2 November.
Australasian Institute of Mining and Metallurgy, Melbourne.
JAKUBEC, J., CLAYTON, R., and GUEST, A. 2012. Mud rush risk evaluation.
Proceedings of Massmin 2012, Sudbury, Ontario, 10–14 June 2012.
Canadian Institute of Mining, Metallurgy and Petroleum, Montreal.
KVAPIL, R. 1992. Sublevel caving. SME Mining Engineering Handbook (2nd
edn). Society for Mining, Metallurgy and Exploration, Littleton, CO.
Chapter 20.2.
LACY, W. and LACY, J. 1992. History of mining. SME Mining Engineering
Handbook (2nd edn), Society for Mining, Metallurgy and Exploration,
Littleton, CO. Chapter 1.1.
LAMBE, W. and WHITMAN, R. 1969. Soil Mechanics. Wiley, New York. Chapters
3, 9, and 27.
SAMOSIR, E., BASUNI, J., WIDIJANTO, E., and SYAIFULLAH, T. 2008. the management
of wet muck at PT Freeport Indonesia’s Deep Ore Zone Mine. Proceedings
of the 5th International Conference and Exhibition on Mass Mining, Lulea
Sweden, 9–11 June 2008. Schunnesson, H. and Nordlund, E. (eds). Lulea
University of Technology
SCHOFIELD, A. and WROTH, P. 1968. Critical State Soil Mechanics. McGraw-Hill.
YAMAMURO, J. and LADE, P. 1998. Steady-state concepts and static liquefaction
of silty sands. Journal of Geotechnical and Geo-environmental
Engineering, vol. 124, no. 9. DOI: 10.1061/(ASCE)1090-
0241(1998)124:9(868)
YOSHIMINE, M. and ISHIHARA, K. 1998. Flow potential of sand during liquefaction.
Soils and Foundations, vol. 38, no. 3. pp. 189–198. DOI:
10.3208/sandf.38.3_189 �
�
284 VOLUME 117

Mining corporations in South Africa arecurrently adversely affected by increasingelectricity prices. Electricity is supplied mainlyby Eskom1 and, especially in remote locations,by on-site diesel generators (Boyse et al.,2014). Electricity price increases, emanatingfrom diesel price hikes and Eskom, haveescalated the total operational expenditure onelectricity by the largest mining corporationsfrom 8% to 20% of total operating costs in thepast seven years (EIUG, 2015). The reliabilityof electricity supplied by Eskom has decreaseddrastically (Govender, 2008), and the priceswill increase annually by at least 13% until
2018 (Numbi et al., 2014; Eskom, 2015b). Inaddition, the South African government plansto introduce a carbon tax on greenhouse gasemissions (Alton et al., 2014).
The use of renewable sources of energyhas the potential to be an opportunity formining corporations to reduce long-termelectricity costs, diversify energy supply, beless affected by fuel price volatility, decreasegreenhouse gas emissions, and show ‘greenleadership’ (Nicolas, 2014). The combinationof technological progress regarding renewablesources and factors in the externalenvironment, like increasing fossil fuel pricesand social pressure to become greener,increases the attractiveness of renewablesources for mining corporations (Roehrl andRiahi, 2000).
Mining corporations are relatively newcustomers for renewable energy companies,whose current target customers are mostlygovernmental organizations and smallerprivate bodies. Moreover, mining corporationshave to be more informed about renewableenergy technologies and the possible fit totheir specific needs. To optimize the learningprocess for mining corporations to understandrenewable energy technologies, and for energycompanies to learn how to approach thesepotential new customers, more research has tobe conducted (Steinhaeuser et al., 2012). Oneof the outcomes of several renewables andmining summits2 worldwide is the realizationthat mining corporations have to become bettereducated about the concept of renewableenergy sources in the context of their uniqueoperational demands (Judd, 2014).
A mining perspective on the potential ofrenewable electricity sources foroperations in South AfricaPart I–The research approach and internalevaluation processby R.G. Votteler* and A.C. Brent†
The business performance of mining corporations in South Africa isadversely affected by the constantly increasing electricity costs. The mostcommonly used power sources are the national utility supplier via a gridconnection, and on-site diesel generators. Previous research has identifiedthe renewable sources of solar photovoltaic (PV), onshore wind, andgeothermal energy in hybrid versions with current sources as possibleopportunities to counteract rising electricity costs. To provide a clearunderstanding of the new, developing market of renewable energysources, this research is divided into two papers. This first paperinvestigates the internal business structure of mining corporations in orderto evaluate electricity generating sources. The multi-criteria decisionanalysis (MCDA) method is selected as the most suitable approach for this.The paper identifies the criteria used by mining corporations to evaluatepossible electricity generation sources for self-generation by means of thecorporations’ own investment. Four mining corporations with severalmining locations were interviewed. The interviews revealed both new andidentical evaluation criteria when the findings were compared to earlierMCDA adaptations analysed in the literature review. The second paper(Part 2) combines current knowledge about the external macroeconomicenvironment with the findings about the internal environment describedhere. MCDA is adapted in Part 2 and implemented to analyse and comparecurrent to hybrid renewable sources from the perspective of mines.
Multi-criteria decision analysis, South Africa, renewable electrical energy,mining.
* School of Public Leadership, Faculty of Economicand Management Sciences, StellenboschUniversity, South Africa.
† Centre for Renewable and Sustainable EnergyStudies, Department of Industrial Engineering,Stellenbosch University, South Africa andSustainable Energy Systems, Engineering andComputer Science, Victoria University ofWellington, New Zealand.
© The Southern African Institute of Mining andMetallurgy, 2017. ISSN 2225-6253. Paper receivedSep. 2015; revised paper received Jun. 2016.
285VOLUME 117 �
http://dx.doi.org/10.17159/2411-9717/2017/v117n3a10
1. South Africa’s state-owned electricty provider (Eskom,2015a
2. Summits of mining corporations and renewable energycompanies started in 2013 to develop and discuss themarket of renewables in mining operations (Energy andMines, 2015).

A mining perspective on the potential of renewable electricity sources–Part 1
The purpose of this paper is to contribute moreknowledge to this learning process. Previous research hasbeen directed only at analysing the external macroeconomicframework for renewable sources relating to miningoperations in South Africa (Votteler and Brent, 2016). Thecontribution of this paper is to investigate the internalbusiness approach of mining corporations in evaluatingelectrical energy sources. A strategic method is used tostructure the research, as the existing theory and previousapplications create a greater research foundation throughexperience, and which ensures that all aspects are consideredin order to to achieve the research objectives. The findings ofthis paper about the internal evaluation process represent thefoundation for future research; with the aim of ultimatelycombining it with current knowledge about the externalframework.
This is the first of two papers on these topics. The reasonfor dividing the work is initially to create a solid foundation,which is reflected in the structure of this paper. The nextsection illustrates the research methodology, and this isfollowed by the selection of an appropriate research approachand an examination of how past applications can contributeto this research. The internal evaluation process of miningcorporations is then investigated. Finally, the research resultsare presented. The objectives are illustrated in Figure 1. Thesecond paper implements the selected research approach froma mining perspective, with the final result of a clearevaluation and comparison of how renewable and currentsources perform for mining corporations in South Africa.
The first objective was to identify the most suitable method.Based on the work of Petticrew and Roberts (2006), asystematic review was used to comprehensively investigatepossible options. Firstly, the paper states the requirementsthat the method has to fulfil to obtain the best possiblesolution to the main objective. Research was conducted toselect three methods that are most likely to contribute to therequirements. The three methods are introduced andanalysed according to the requirements. The last sectionintroduces the selected method and provides the reasoning.
The second objective of this paper was to identifyprevious approaches of method selection in energy planningin similar cases. Based on Petticrew and Roberts (2006), astate-of-the-art review was conducted. Firstly, previous
publications in the energy planning field were sourced andkey characteristics contained therein were tabulated. The aimwas to investigate the areas in which research had alreadybeen conducted, and those in which new adaptations had tobe made for the purpose of this research. Secondly, anoverview is provided of the results generated in thepublications identified. The overview was of assistance in theinterviews with mining corporations, as basic backgroundknowledge of applications in similar cases.
The aim was to provide a substantial overview of theselected research methods in energy planning that wereimplemented between 2001 and 2015. Subsequently, 26different papers were identified; 13 purely from a renewableenergy perspective, and 13 from a mixedconventional/renewable energy perspective.
A qualitative research focus was applied in the form of semi-structured interviews. The reason for this approach was theexploratory form of the research. The research included asample of four different mining corporations. Therespondents were decision-makers or people who knew allabout the criteria that the corporation used to evaluatepossible electricity sources. The respondents were firstlyinterviewed face-to-face to elicit the information about theevaluation process. The main part of the interview used apost-it session to generate all information in a structuredmanner. The semi-structured interview questionnaireensured that all aspects were considered in the session(Newton, 2010).
The identified criteria were used to construct a decisioncriteria table, which illustrated all the relevant criteria that themining corporation used to evaluate possible electricitysources. The transformation from the mind-map to the tablewas conducted according to the requirements for criteria,which are enumerated later. A Delphi technique was used,which meant sending the constructed table back to therespondents via e-mail to obtain confirmation that it reflectedtheir practices accurately. The Delphi technique is in essencea series of sequential rounds—interspersed with controlledfeedback – that seek to gain the most reliable consensus ofopinion of a group of experts (Powell, 2003).
A semi-structured interview questionnaire was set up tocollect the necessary information for the third researchobjective. As no approach using the selected method forenergy planning from a corporate perspective was found, aqualitative exploratory research technique was used toidentify the evaluation criteria. Firstly, the questionnairewould draw accurate information from respondents.Secondly, it would provide structure to the interview. Thirdly,it would provide standards from which facts, comments, andattitudes could be recorded. Lastly, it would facilitate dataprocessing, as answers would be recorded in a common placeon each questionnaire (Hague and Jackson, 1995).
The reason for using a strategic method as the foundation ofthis research is firstly the existing theory. Extensive academic
�
286 VOLUME 117

research has been done to ensure that the method considersall aspects regarding its overall purpose. Therefore, itprovides more assurance in respect of this research that allaspects are investigated. Secondly, previous applications insimilar cases contribute to a greater understanding of howthe objectives can be met.
This section describes the requirements of the strategicmethod to best address the main research objective of thispaper, namely: to investigate the business approach ofmining corporations in evaluating and selecting electricitysources. The requirements were to be used to find the mostappropriate basis for research. To be able to successfullyinvestigate the main objective, the strategic method needed tofulfil the following requirements:
� To provide information to mining corporations aboutthe concept of renewable energy in the context of theirown unique usage patterns. As described in theIntroduction, recent developments have increased theattractiveness of renewable energy. Consequently,research has to be conducted to illustrate to miningcorporations how this could fit their specific needs
� To add to the knowledge of renewable energycompanies about the needs and business structure ofthis new type of customer, namely mining corporations.The approach has to create a greater understanding ofrenewable energy companies and how best tocustomize the information about electricity sources tothe specifications of mining operations
� To investigate the strengths and weaknesses ofselected electricity sources. The approach has to be ableto contribute to the reasoning why a selected electricitysource has or has not been considered appropriate formining operations. The weaknesses should illustratewhat potentially has to change to make it moreattractive
� To compare different selected electricity sourcesaccording to the specific needs of mining operations. Itshould be possible to illustrate why certain sourceshave provided a better fit for mining operations thanothers. The comparison between currently used andnew technologies adds to a better understanding.
This section lists different popular methods that couldpossibly assist to structure the research. All methods listed inTable I were considered and investigated. The MCDA, thebalanced scorecard (BSC), and strategic planning methodswere found to be most likely to contribute to the
characteristics listed in the previous section. Table Iillustrates which requirements the three selected methodsfulfilled. The numbers in the top row are linked to therequirements described in the previous section.
Each of the three selected methods is briefly introduced, apossible utilization is described, and a contribution accordingto these characteristics is discussed.
A strategic planning (SP) model is a tool for businesses toorganize their current operations in order to realize thedesired future. The model can be seen as a roadmap for thebusiness to get from where it is now to where it wants to be.It is of importance for businesses to create a plan, as itprovides clarity on how to achieve the planned goal (Kingand Cleland, 1987). Every strategic planning model shouldincorporate seven elements: plan-to-plan (rarely used);mission; needs assessment; strategic objectives; outcomemeasures; strategies; and performance feed-forward (DeBeer, 2000).
The SP approach can be adapted and implementedaccording to the main research objective. A miningcorporation should express in its strategic mission statementthe aim to diversify its electricity mix and should specificallyset out its approach to adopting renewable sources(Cetindamar et al., 2013).
A shortcoming of the SP approach is that it does notidentify strengths and weaknesses, nor does it compare theselected technologies according to the specific demandrequirements of mining corporations. Furthermore, it will beinfluenced strongly by the mining corporations’ strategicaims. Another shortcoming – relevant to this paper – is themore strategic nature of the SP approach to improve acompany’s business coordination (Jakhotiya, 2013). Theobjective of this research is oriented towards a once-offdecision.
The balanced scorecard (BSC) is a tool that converts thestrategy and mission of an organization into qualitative andquantitative performance indicatorss. The indicators providethe structure for an effective, dynamic, and timely strategicmanagement and measurement system to achieve the overallstrategy (Westermann and Sehl, 2006). The scorecardapproach identifies elements and requirements that have tobe considered in order to follow the strategy with the bestpossible outcome. The original Balanced Scorecard of RobertKaplan and David Norton (1992) entails four scoring
A mining perspective on the potential of renewable electricity sources–Part 1
VOLUME 117 287 �
Table I
Multi-criteria decision analysis1 � � � �
Balanced scorecard2 � � � �
Strategic planning3 � � � �
(1) Ishizaka and Nemery, 2013; (2) Westermann and Sehl, 2006; (3) King and Cleland, 1987

A mining perspective on the potential of renewable electricity sources–Part 1
elements: financial, customer, internal business processes,and learning and growth (Linard and Yoon, 2000).
The BSC principle could have been used to fulfil the mainresearch objective of this paper, with some adaptation formining corporations that have the goal of becoming involvedin renewable energy sources. The adaptation and applicationwould contribute to providing information to miningcorporations, as it would show all the criteria that a miningcorporation has to fulfil to realize such a project. The BCSapproach would contribute to informing mining corporationsabout renewable energy by illustrating the main requirementsthat have to be fulfilled when realizing on-site renewableenergy projects. The mining corporation would be able tounderstand in which areas adjustments have to be made or,perhaps, that no realization of objectives would be possibleas the requirements are simply not achievable.
The shortcoming here is that the requirements are notbased on the specific needs of a mining corporation.Furthermore, the fact that the requirements are based onwhat the technology can supply, rather than on the demandsof the mining corporation, make comparisons difficult as therequirements might differ.
Another problem is that the BSC approach requires themining corporations to have the initial strategic goal ofgetting involved in renewable energy (Person, 2013). As themarket is still relatively new, mining corporations first haveto be informed about the possibilities of renewable energy incatering for their specific needs (Chislett, 2014).Consequently, with adapting and applying the BSC, thecriteria used are based on the technology’s specification andnot the mining corporations’ perspective, which limits theinformative data. The approach should not illustrate therequirements to realize the technology, but rather how itwould work based on the mining corporations’ needs.
Multi-criteria decision analysis (MCDA) is a method that isutilized in making complex decisions. When makingcomplicated decisions it is necessary for the decision-makersto handle a large number of criteria that influence thedecision. The MCDA method assists the decision-makers toselect the best possible alternative (Ishizaka and Nemery,2013). The MCDA process is generally divided into threemain steps: problem structuring, model building, andapproval of the model (Stewart and Belton, 2002).
It was found that the MCDA method could be adapted tothe context of the main research objective as it could illustrateto mining corporations which selection among electricitysources would be most suitable. The method would achievethis by utilizing the mining corporations’ own evaluationcriteria. Firstly, the research would identify the criteria thatmining corporations use to evaluate possible electricitysources. Secondly, the type of electricity source and possibleuncertainties in the internal and external environment wouldbe identified. Thirdly, based on the identified criteria, anMCDA method would have to be developed to analysedifferent electricity-generating technologies. The most likelyand attractive technologies could then be analysed andevaluated.
The MCDA method developed for the purpose of thisresearch would contribute to providing information to mining
corporations by indicating the possible fit of renewableenergy. The corporations would be able to understand,according to their own evaluation criteria, what the use ofrenewable energy entails. However, the method would bedeveloped according to a specific type of electricity source toensure that the same criteria can be used—which would limitthe applicability to technologies. Possible different types oftechnologies are self-generating sources, like dieselgenerators, and tri-generation systems, like combined heatand power (CHP).
The renewable energy company would gain moreunderstanding of how mining corporations evaluate suchprojects. Consequently, it would ease communication about apossible project realization, as information packages aboutthe technology can be customized from the beginning.
The MCDA method enables the mining corporation toidentify the strengths and weaknesses of the selectedtechnologies from its own point of view (Stewart and Belton,2002). A clearer understanding of how the new technologieswould perform compared to the present ones would beobtained. It would be possible to compare, according to eachcriterion, how the different alternatives perform. Closeattention has to be paid, however, to ensuring that noexternal influences are neglected.
The MCDA technique was selected as the most appropriatemethod to investigate the main research objective. Thetechnique evaluates and analyses electricity options from theperspective of mining corporations. The other two approacheswould require the initial aim of the mining corporations to beto implement renewable energy, and would not analyse thetechnologies according to the mines’ own criteria. As themarket for renewable sources of electricity is still in itsinfancy (Chislett, 2014), the MCDA method was consideredmore suitable.
The renewable energy company would be able to gain themost valuable information from the MCDA method, as itidentifies the criteria and structure that are important tomining corporations. In addition, as the technology is new formining corporations and not for the renewable energycompany, it would be more beneficial to analyse the strengthsand weaknesses and to compare the technologies from theperspective of the mining corporations.
Another reason is that the SP and BSC approaches aremore oriented towards the successful realization of abusiness strategy than of a physical project. The BSC aims tocontinually measure, according to selected criteria, how closethe performance is to the overall strategic goal. The researchcontent of this paper, on the other hand, aims for a once-offdecision.
Lastly, the SP approach involves the investigation of thedifferent technologies, the internal issues, the externalinfluences, the market potential, and a possible scenarioanalysis. As the market is still in its infancy, the key focusshould be on the education of the mining corporations.
To be able to gain an overview and an understanding of howMCDA approaches have been used in energy planning in
�
288 VOLUME 117

recent years, a literature review was conducted. Twenty-sixother approaches were identified and summarized in thesame way as the MCDA approaches were used, namelyaccording to publication year, energy alternatives selected,final ranking of alternatives, type of criteria used, types ofalternatives, main stakeholder (perspective), project size,source of criteria used, and the area of implementation. Theresults are represented in Table II.
The points below introduce each column in Table II andprovide a brief summary of the findings:
� Column 1 firstly enumerates each article of the 26articles, with the purpose of using them to review thecriteria used in energy-planning MCDA approaches(Table III). Secondly, the selection of past MCDAapproaches was divided in half: 13 mixed electricityalternatives and 13 purely renewable alternatives. Themain reason was to illustrate if there were differencesin the selection of the evaluation criteria, which areshown in Table III. Mixed alternatives, besidesrenewable energy, include other non-renewable energysources like nuclear, coal, and/or other fossil fuels
� Column 2 gives the author and the publication year ofthe study. Nineteen (73%) of the 26 articles werepublished between 2009 and 2014, with the oldestin 2001
� Columns 3 and 4 name all electricity alternatives thatwere analysed by the MCDA. In the mixed alternatives,i.e. articles 1 to 13, the most frequently nominatedalternative was wind with 12, followed by solar (11),hydro (11), gas (11), nuclear (10), and coal (9). Innine of the 13 articles, rankings and preferred choiceswere presented. A maximum of the top four choices areindicated. It is noteworthy that no non-renewablesources featured among the top four approaches. Windwas listed nine times, followed by hydro (8) and solar (6).
� The renewable energy sources (RES), i.e. articles 14 to26, most recurrently selected as an alternative werewind (10 times), followed by solar (9), hydro (9), andbiomass (8). In seven of the 13 articles, rankings andpreferred choices were presented. Again, a maximum ofthe top four choices are indicated in Table II. Wind waslisted in all seven top ratings, solar in six, and hydro intwo. Again, the same types of electricity sources as inthe mixed articles were the preferred choices
� Column 5 represents the genre of criteria that the studyused to evaluate the alternatives. However, only 16 ofthe 26 articles clearly subdivided the criteria intogenres. With 14 listings, technological andenvironmental genres are used most frequently,followed by economic (11), socioeconomic-political (6)and social (6)
� Column 6 firstly shows the size of possible projects theMCDA was dealing with. It is divided into small-scale(up to 5 MW) and utility-scale (>5 MW). Secondly, themain stakeholder for the MCDA selection is given. In19 publications the purpose was to find the best utility-scale alternative for a country’s electricity demand, andin one publication for small-scale residential buildings.The project size was utility-scale in 20 articles andsmall-scale in one. The other articles did not specify thesize or main stakeholder
� Column 7 indicates the types of decision-makers who
were involved in identifying the evaluation criteria. In19 MCDA approaches, decision-makers were notspecified and a literature review was used. The otherseven approaches used different types of decision-makers depending on the objectives
� Columns 8 and 9 state the topic of the MCDA approachand the physical area of implementation. A regionalimplementation was found in 15 publications. Turkeyhad the highest implementation rate (5), followed bySpain (2) and Greece (2). Almost half (7) were withinthe European Union.
This section provides an overview of the evaluation criteriathat were used in the MCDA approaches from articles no. 1 to26 in Table II. The listing of publications in column 1 of TableII is repeated in Table III to indicate how often criteriaappeared in the literature. The most frequently recurringcriteria are listed, and the number specifies the publication inwhich they appeared. In cases where criteria were used lessthan three times, they were categorized under ‘Other’.
The criteria in Table III are divided into categories:technical, economic, and environmental and socio-political.This was based on the results of ‘types of criteria’ in column6 of Table II. The technical category addresses the physicalcharacteristics of the electricity alternative. The economiccategory investigates the financial feasibility. Theenvironmental category evaluates the impact of thealternative on nature. Lastly, the socio-political categorymeasures the influence on the quality of life of peopleaffected by the project (Mateo, 2012).
The criteria used in the MCDA approaches are furthersubdivided into those used in approaches evaluating, on theone hand, mixed sources and on the other, only renewableenergy sources. Criteria are noted only when they occur inmore than three papers. The following provides a briefsummary of the findings.
� Technical – the criteria indicate that overall ‘efficiency’(n=10), ‘capacity factor’ (n=8), ‘reliability’ (n=8) and‘maturity’ (n=7) are most frequently evaluated. Astrong difference in application between mixed andrenewable sources can be seen with ‘maturity’. Itshows a higher regularity in the case of renewableenergy sources
� Economic – this category shows that ‘investment cost’,with n=18, is predominantly used, followed by ‘fixedand variable operation, and maintenance costs’ (n=11)and ‘electricity costs’ (LCOE). A significant differencecan be seen with the criteria ‘service life’ and‘implementation period’, which are used mostly withthe renewable energy sources
� Environmental – the most frequently used criterion is‘external costs’, with n=16. The external costs includedifferent types of emissions. Some MCDA approachesspecified the various emissions, while otherssummarized this aspect into one criterion. Furthercriteria are ‘land use’ (n=10) and ‘noise’ (n=4)
� Socio-political – the criteria illustrate that ‘socialacceptability’ and ‘job creation’ were most regularlyused, with n=10. In addition, ‘loss of life expectancy’was used in n=6. The criterion ‘social benefit’ was usedonly in mixed MCDA approaches.
A mining perspective on the potential of renewable electricity sources–Part 1
VOLUME 117 289 �

A mining perspective on the potential of renewable electricity sources–Part 1
�
290 VOLUME 117
Table II

A mining perspective on the potential of renewable electricity sources–Part 1
VOLUME 117 291 �
The purpose of this paper, as stated in the Introduction, is toinvestigate the internal evaluation process regarding possibleelectricity sources for mining corporations in South Africa.This will contribute to the foundation of an MCDA approachfor mining corporations in South Africa to optimize theevaluation of electricity generation sources. The literaturereview provides an overview of how MCDA approaches havebeen used in energy planning in past years. The followingpoints indicate how they contributed to, or affected, theidentification of the criteria of this paper.
� Not one MCDA approach in energy planning could befound from the perspective of a corporate entity.Consequently, the previously used criteria can be usedonly as an indication
� The only MCDA approach to energy planning on theAfrican continent was in Tunisia. No such approach toenergy planning was found in South Africa
� The overview of previously used evaluation criteriaassists in selecting the criteria for mining corporations.As the marketing of renewable energy to miningcorporations is relatively new, respondents might notinclude all important criteria for renewable sources.The listed criteria of energy planning serve as achecklist and might indicate that further investigationshave to be conducted
� The types of criteria used in previous publicationsprovide a solid indication about which are importantfor the evaluation of electricity generation sources
� The overall preferred selection of solar, wind, andhybrid technologies indicates the renewablealternatives that should be included in the MCDAapproach for mining corporations.
As the main purpose of this paper is to provide more
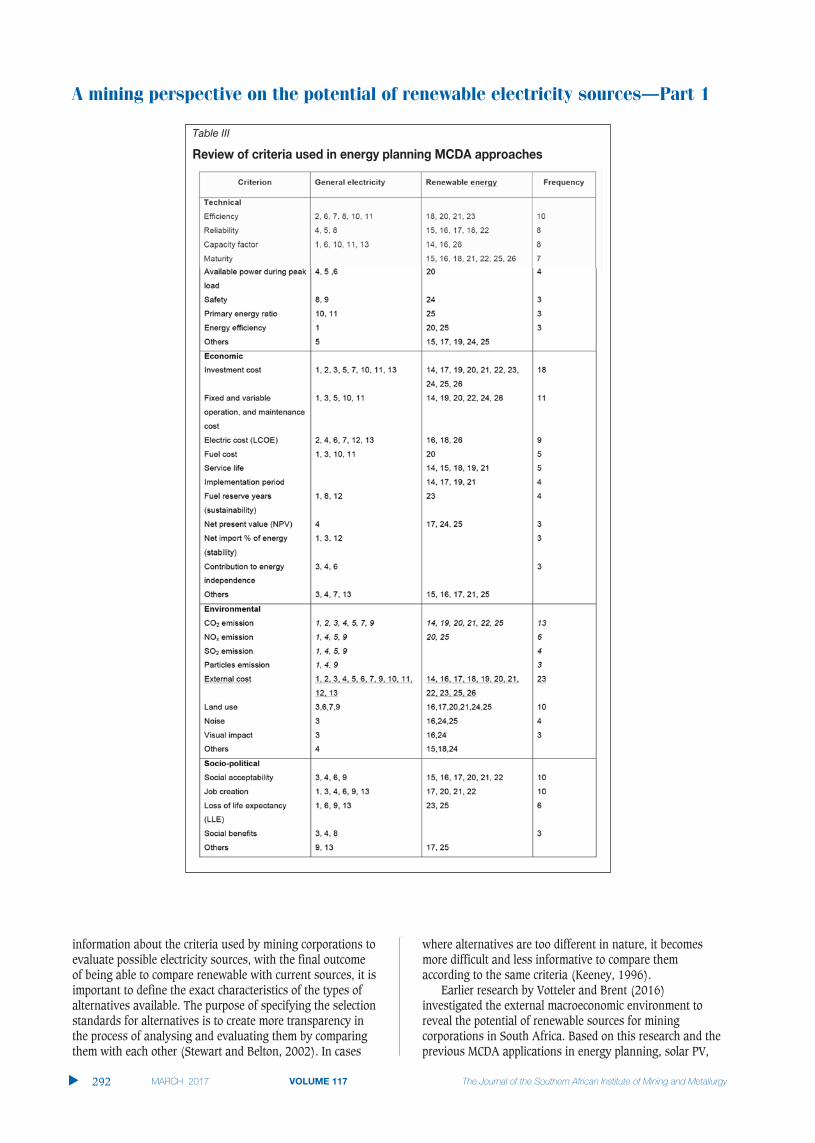
A mining perspective on the potential of renewable electricity sources–Part 1
�
292 VOLUME 117
Table III
information about the criteria used by mining corporations toevaluate possible electricity sources, with the final outcomeof being able to compare renewable with current sources, it isimportant to define the exact characteristics of the types ofalternatives available. The purpose of specifying the selectionstandards for alternatives is to create more transparency inthe process of analysing and evaluating them by comparingthem with each other (Stewart and Belton, 2002). In cases
where alternatives are too different in nature, it becomesmore difficult and less informative to compare themaccording to the same criteria (Keeney, 1996).
Earlier research by Votteler and Brent (2016)investigated the external macroeconomic environment toreveal the potential of renewable sources for miningcorporations in South Africa. Based on this research and theprevious MCDA applications in energy planning, solar PV,

onshore wind power, and ‘hot dry rock’ geothermal powerwere selected as the renewable sources with the greatestpotential. Owing to the intermittency, especially of solar PVand wind power, and the constant electricity demand ofmining operations, hybrid versions with current electricitysources were identified as the best option.
In addition, based on the current legislative andregulatory framework in South Africa, the business model ofself-generation3, in the form of own investment or a powerpurchase agreement, has the greatest potential. As thepurpose of the development of the MCDA for miningcorporations was to create more transparency, owninvestment was selected. The reason for this choice was tofocus the attention on the performance of the technology andnot on third parties (Boyse et al., 2014).
Therefore, decision-makers at mining corporations wereasked to list the evaluation criteria that they would use toevaluate the following electricity sources:
� Diesel generator
� Hybrid diesel generator / solar PV
� Hybrid diesel generator / onshore wind power
� Hybrid diesel generator / geothermal power
� Eskom grid connected
� Hybrid Eskom grid connected / solar PV
� Hybrid Eskom grid connected / onshore wind power
� Hybrid Eskom grid connected / geothermal power.
The business model has great influence on the type andnumber of stakeholders involved in establishing an electricitysource for mining operations. All stakeholders and theirinfluence on the decision-making process have to beidentified to ensure that the best possible solution can befound (Boyse et al., 2014). The selected model of self-generation and own investment involved three mainstakeholders: the mining corporation, the project developer,and the legislative and regulatory body.
The mining corporation was the main stakeholder for thepurpose of this research, as it is the decision-makerregarding a possible project realization. The decision-makershave to cover two main areas: operations and finance.Decision-makers selecting an alternative from an operationalperspective will make use of criteria that ensure that thegenerating source will satisfy the electricity demands of themine (Cookie et al., 2007). Decision-makers selecting analternative from a financial perspective will make use ofcriteria to find the most feasible alternative for electricitygeneration at the mining location (Goh et al., 2014).
The project development company is responsible for therealization of the alternative. The companies represent thedifferent electricity sources and will provide the datanecessary to feed the evaluation criteria to execute the MCDAapproach. The developer has no direct influence on thedecision-making, and can only affect the attractiveness of theproject (Lerro, 2011; Aslani, 2014).
The regulatory and legislative body in South Africadictates the framework regarding the business model of how
electricity projects will be realized. As previously stated,according to this framework the model of self-generation wasselected as the most lucrative. It further influences the actualdevelopment of the project with factors like compulsoryenvironmental assessments, which also consider thesurrounding communities (Lerro, 2011; Frost, 1995).
To reveal the criteria that mining corporations use to evaluatepossible electricity generation sources, four different miningcorporations were included in this study, as illustrated inTable IV. In three the respondents were electrical engineers,and in one case the manager of a utility supply chain withresponsibility for six mines. Emphasis was placed on gaininginformation from a variety of mines with different resources,sizes, and targets in order to gain optimal insight. Theresources mined were gold, coal, chrome, and zircon. Theaverage annual electricity consumption per mine varied from4.2 GWh to 2 752 GWh. As the Eskom tariff varies accordingto factors like season or time of day, the yearly average pricewas stated for the sake of simplicity. All mines wereconnected to the grid, with diesel generators as backupsystems. One of the mines had installed a 1 MW solar PVplant, and two other corporations were conducting solar PVand onshore wind power feasibility studies.
To structure the internal evaluation process, a decision tablewas developed. The table of mining corporations evaluatingdifferent alternatives for electricity sources had to beconstructed according to certain characteristics. The decisiontable was based on the results of the post-it mind-maps fromthe interviews with decision-makers. To be able to identify aclear structure and to use the criteria for further analysis in aMCDA approach, specific requirements had to be fulfilled byeach criterion (Stewart and Belton, 2002).
� Value relevance – the decision-maker has to be able torelate the concept to the aim of the mining corporation,which enables him or her to define a clear preferencefor the criterion
� Understandability – the criterion has to be clearlyidentified and explained. Each person involved in thedecision-making process has to know the exactmeaning to prevent any confusion and misleadingresults (Edwards et al., 2007)
� Measurability—it has to be possible to measure eachcriterion in a consistent manner according to thealternatives being analysed. As the decision table is thefoundation of an MCDA analysis, this requirement isimportant to create meaningful results
� Non-redundancy—there should not be more than onecriterion measuring the same factor. A negative resultwould be to have faulty results, e.g. one factor has toomuch weight because it was counted more than once(Edwards et al., 2007)
� Judgmental independence—one criterion should nothave significant influence on the performance ofanother criterion (Loken, 2007)
� Balancing completeness and conciseness—all aspects of
A mining perspective on the potential of renewable electricity sources–Part 1
VOLUME 117 293 �
3. The mining corporation develops its own on-site renewable generationsource (Boyse et al., 2014).

A mining perspective on the potential of renewable electricity sources—Part 1
alternatives in a decision process have to be addressedby the selected criteria. However, when selecting toomany criteria the researcher has to beware of omittingto consider the previously mentioned requirements(Edwards et al., 2007; Loken, 2007)
‰ Operationally—criteria should not be only theory-based, but should also be practically proven.
The decision criteria
The interviews with the mining corporations showed thatpossible electricity sources were evaluated based on theirbeing independent and able to supply electricity (includingthe necessary fuel) on their own, and within the investmentcapability of the corporation. The criteria are listed anddescribed in Table V. The first column provides the categoryand the second the criteria.
The economic category included two criteria thatmeasured the economic value of the electricity source,namely: levelized electricity costs and net present value.These criteria used several values as part of the calculation.The prediction of fuel costs was new in regard to theliterature review. Further new criteria were supply 24/7,service level, corporate image, and effect on community.
It is important to mention that the criteria listed in TableV represent a summary of all criteria used during theevaluation process, and that most had been applied in otherenergy planning evaluations at various points in time. Thesequence started with technological criteria, aimed to ensure
that the potential electricity source could satisfy the electricityrequirements of the mining operation. Thereafter,technologies that passed the technical criteria were analysedaccording to economic criteria. Lastly, environmental andsocial criteria were evaluated.
Mining corporations have peculiarities not found inprevious MCDA evaluations. Firstly, mining operations aremore profit-oriented in comparison to national electricityproviders. Therefore, criteria like initial investment cost,which can have a considerable influence on the balance sheetin the first years, have higher priority for mining corporationsthan for electricity providers. Secondly, owing to the limitedmix of electricity sources and the requirement of constantelectricity supply, the criteria of reliability and supply 24/7are more important to mines. Both were therefore used asprerequisites in the choice of the type of electricity source tobe evaluated in Table V. Another criterion that had to beconsidered, which did not feature in previous evaluations,was the predicted lifespan of the mine, as this factor has aconsiderable influence on the economic criteria, andconsequently on the feasibility of the project.
Conclusion
The preparation of this paper is justified by two facts. Firstly,the difficulties with current electricity sources in South Africahave increased the attractiveness of the steadily advancingrenewable technologies for mining operations in the country.
s
294 march 2017 VOLUME 117 The Journal of the Southern African Institute of Mining and Metallurgy
Table IV
Characteristics of mining corporations interviewed

A mining perspective on the potential of renewable electricity sources–Part 1
VOLUME 117 295 �
Table V

A mining perspective on the potential of renewable electricity sources–Part 1
Secondly, previous research has been directed only atinvestigating the external influences on this market.
The contribution of this paper is an investigation of theinternal business approach of mining corporations towardsevaluating electricity generation sources. This research hasshown that the MCDA method is the most suitable approach.No application of the MCDA method in energy planning fromthe perspective of corporate or mining entities could be found– most MCDA adaptations were from the perspective ofgovernmental bodies or general electricity source evaluationswithout a specific perspective. In addition, no adaptation ofMCDA methods in energy planning has been conducted in aSouth African context. Consequently, in the absence of data,qualitative interviews were conducted with four miningcorporations operating in South Africa to reveal the criteriathat these organizations applied in order to evaluate possibleelectricity sources. The differences found between theselection criteria used by the four corporations and those ofprevious approaches in the literature are the result ofdifferent perspectives. Mines are profit-oriented businessentities and electricity generation is not their core business,while previous approaches were more focused on thetechnological and environmental factors.
This paper has established the basis for evaluating andcomparing current and renewable electricity-generatingoptions from the perspective of mining corporations in SouthAfrica. The reason for subdividing the work into two paperswas to create a basis of two components: the first being thecurrent knowledge about the external framework; while thesecond reveals the internal framework. Part 2 will fuse theexternal and internal components in order to apply theadapted MCDA framework and to feed the model with real-time data.
AFGAN, N.H. and CARVALHO, M.G. 2002. Multi-criteria assessment of new andrenewable energy power plants. Energy, vol. 27, no. 8. pp. 739–755.
AHMAD, S. and TAHAR, R.M. 2014. Selection of renewable energy sources forsustainable development of electricity generation system using analytichierarchy process: A case of Malaysia. Renewable Energy, vol. 63. pp.458–466.
ALTON, T., ARNDT, C., DAVIES, R., HARTLEY, F., MARKRELOV, K., THURLOW, J., andUBOGU, D. 2014. Introducing carbon taxes in South Africa. Applied Energy,vol. 116, March. pp. 344–354.
ASLANI, A. 2014. Private sector investment in renewable energy utilization:Strategic analysis of stakeholder perspectives in developing countries.International Journal of Sustainable Energy, vol. 33, no.1. pp. 112–124.
BORAN, F.E., BORAN, K., and MENLIK, T. 2012. The evaluation of renewableenergy technologies for electricity generation in Turkey using intuitionisticFuzzy TOPSIS. Energy Sources, Part B: Economics, Planning, and Policy,vol. 7, no. 1. pp. 81–90.
BORAN, F.E., DIZDAR, E., TOKTAS, I., BORAN, K., ELDEM, C., and ASAL, Ö. 2013. Amultidimensional analysis of electricity generation options with differentscenarios in Turkey. Energy Sources, Part B: Economics, Planning, andPolicy, vol. 8, no. 1. pp. 44–55.
BOYSE, F., CAUSEVIC, A., DUWE, E., and ORTHOFER, M. 2014. Sunshine for mines:Implementing renewable energy for off-grid operations. Carbon WarRoom, Washington, DC.
BRAND, B. and MISSAOUI, R. 2014. Multi-criteria analysis of electricity generationmix scenarios in Tunisia. Renewable and Sustainable Energy Reviews,vol. 39. pp. 251–261.
CAVALLARO, F. 2009. Multi-criteria decision aid to assess concentrated solarthermal technologies. Renewable Energy, vol. 34, no. 7. pp. 1678–1685.
CETINDAMAR, D., DAIM, T.D., BEYHAN, B., and BASOGLU, N. 2013. StrategicPlanning Decisions in the High Tech Industry. Springer Verlag, London.
CHATZIMOURATIDISA, A.I. and PILAVACHI, P.A. 2008. Multicriteria evaluation ofpower plants impact on the living standard using the analytic hierarchyprocess. Energy Policy, vol. 36, no. 3. pp. 1074–1089.
CHATZIMOURATIDISA, A.I. and PILAVACHI, P.A. 2009a. Sensitivity analysis oftechnological, economic and sustainability evaluation of power plantsusing the analytic hierarchy process. Energy Policy, vol. 37, no. 3. pp.788–798.
CHATZIMOURATIDISA, A.I. and PILAVACHI, P.A. 2009b. Technological, economic andsustainability evaluation of power plants using the analytic hierarchyprocess. Energy Policy, vol. 37, no. 3. pp. 778–787.
CHISLETT, M. 2014. Cleaner energy at stable prices: The value proposition ofsolar for mines. Interview. Toronto, Energy and Mines.
COOKIE, R., CRIPPS, A., IRWIN, A., and KOLOKOTRONI, M. 2007. Alternative energytechnologies in buildings: Stakeholder perception. Renewable Energy, vol.32, no. 14. pp. 2320–2333.
CRISTOBAL, J.R.S. 2011a. A multi criteria data envelopment analysis model toevaluate the efficiency of the renewable energy technologies. RenewableEnergy, vol. 36, no. 10. pp. 2742–2746.
CRISTOBAL, J.R.S. 2011b. Multi-criteria decision-making in the selection of arenewable energy project in Spain: The Vikor method. Renewable Energy,vol. 36, no. 2. pp. 498–502.
DATTA, A., RAY, A., BHATTACHARYA, G., and SAHA, H. 2011. Green energysources (GES) selection based on multi-criteria decision analysis (MCDA).International Journal of Energy Sector Management, vol. 5, no. 2. pp.271–286.
DE BEER, A.J. 2000. The development of a generic model for strategic planningfor small and medium manufacturing enterprises in a turbulentenvironment. MBA dissertation, Stellenbosch University, South Africa.
DIAKOULAKI, D. and KARANGELIS, F. 2007. Multi-criteria decision analysis andcost-benefit analysis of alternative scenarios for the power generationsector in Greece. Renewable and Sustainable Energy Reviews, vol. 11, no.4. pp. 716–727.
�
296 VOLUME 117
Table V

EDWARDS, W., MILES, R.F., and VON WINTERFELDT, D. 2007. Advances in DecisionAnalysis: From Foundations to Applications. Cambridge University Press,Cambridge.
EIUG (Energy Intensive User Group of Southern Africa). 2015. Electricity costas a percentage of annual expenditure. http://www.eiug.org.za/about/membership/ [accessed 11 Jun. 2015].
ENERGY and MINES. 2015. Introduction to renewable energy with miningoperations. http://energyandmines.com [accessed 26 May 2015].
ERTAY, T., KAHRAMAN, C., and KAYA, I. 2013. Evaluation of renewable energyalternatives using MACBETH and fuzzy AHP multi criteria methods: Thecase of Turkey. Technological and Economic Development of Economy,vol. 19, no. 1. pp. 38–62.
ESKOM. 2015a. Company information. http://www.eskom.co.za/OurCompany/CompanyInformation/Pages/Company_Information_1.aspx [accessed 10Jun. 2015].
ESKOM. 2015b. Tariff and charges. http://www.eskom.co.za/CustomerCare/TariffsAndCharges/Pages/Tariffs_And_Charges.aspx [accessed 13 Jun.2015].
FROST, F.A. 1995. The use of stakeholder analysis to understand ethical andmoral issues in the primary resource sector. Journal of Business Ethics,vol. 14, no. 8. pp. 653–661.
GOH, H.H., LEE, S.W., CHUA, Q.S., GOH, K.C., KOK, B.C., and TEO, K.T.K. 2014.Renewable energy project management, challenges and risk. Renewableand Sustainable Energy Reviews, vol. 38. pp. 917–932.
GOVENDER, S. 2008. Energy saving mechanisms in the mining industry: A casestudy of switching off non-essential power. MBA thesis, StellenboschUniversity, South Africa.
HAGUE, P.N., and JACKSON, P. 1995. Do Your Own Market Research. Kogan Page,London.
HEO, E., KIM, J., and BOO, K. 2010. Analysis of the assessment factors forrenewable energy dissemination program evaluation using fuzzy AHP.Renewable and Sustainable Energy Reviews, vol. 14, no. 8. pp. 2214–2220.
ISHIZAKA, A., and NEMERY, P. 2013. Multi-criteria Decision Analysis, Wiley,Chichester, UK.
JAKHOTIYA, G.P. 2013. Strategic Planning, Execution, and Measurement (SPEM).Taylor & Francis, Boca Raton, FL.
JUDD, E. 2014. Sincerity and patience required for renewables in mining sector.Energy and Mines, Toronto.
KAPLAN, S., and NORTON, D.P. 1992. The balanced scorecard – measures thatdrive performance. Harvard Business Review, vol. 70, no. 1. pp 71-79.
KAYA, T., and KAHRAMAN, C. 2010. Multi criteria renewable energy planningusing an integrated fuzzy VIKOR & AHP methodology: The case ofIstanbul. (Report). Energy, vol. 35, no. 6. pp. 2517–2527.
KEENEY, R.L. 1996. Value-focused thinking: Identifying decision opportunitiesand creating alternatives. European Journal of Operational Research, vol.92, no. 3. pp. 537–549.
KING, W. and CLELAND, D. 1987. Strategic Planning and Management Handbook.Van Nostrand Reinhold, New York, NY.
LEE, A.H.I., HUNG, M., KANG, H., and PEARN, W.L. 2012. A wind turbineevaluation model under a multi-criteria decision making environment.(Report). Energy Conversion and Management, vol. 64. pp. 289–300.
LERRO, A. 2011. A stakeholder-based perspective in the value impactassessment of the project ‘‘Valuing intangible assets in Scottish renewableSMEs’’. Measuring Business Excellence, vol. 15, no. 3. pp. 3–15.
LINARD, K.L. and YOON, J. 2000. The dynamics of organizational performancedevelopment of a dynamic balanced scorecard. Proceedings of the 1stInternational Conference on Systems Thinking in Management, Geelong,Australia, 8-10 November.
LOKEN, E. 2007. Multi-criteria planning of local energy systems with multipleenergy carriers. Doctoral thesis, Norwegian University of Science andTechnology, Norway.
MAMLOOK, R., AKASH, B.A., and MOHSEN, M.S. 2001. A neuro-fuzzy programapproach for evaluating electric power generation systems. Energy, vol.26, no. 6. pp. 619–632.
MATEO, J.R.S.C. 2012. Multi Criteria Analysis in the Renewable EnergyIndustry. Springer Verlag, London.
MAXIM, A. 2014. Sustainability assessment of electricity generationtechnologies using weighted multi-criteria decision analysis. EnergyPolicy, vol. 65. pp. 284–297.
NEWTON, N. 2010. The use of semi-structured interviews in qualitative research:Strengths and weaknesses.http://www.academia.edu/1561689/The_use_of_semi-structured_interviews_in_qualitative_research_strengths_and_weaknesses[accessed 24 May 2014].
NICOLAS, F. 2014. Africa-focused miners positioned to embrace 100% renewableenergy. Mining Weekly, 21 May.http://www.miningweekly.com/article/africa-focused-miners-positioned-to-embrace-100-renewable-energy-2014-05-21 [accessed 2 Jun. 2015].
NUMBI, B.P., ZHANG, J., and XIA, X. 2014. Optimal energy management for a jawcrushing process in deep mines. Energy, vol. 68, April. pp. 337–348.
PERSON, R. 2013. Balanced Scorecards & Operational Dashboards withMicrosoft Excel. 2nd edn. Wiley, Indianapolis.
PETTICREW, M., and ROBERTS, H. 2006. Systematic Reviews in the SocialSciences: A Practical Guide. Blackwell, Oxford.
POWELL, C. 2003. The Delphi technique: Myths and realities. Journal ofAdvanced Nursing, vol. 41, no. 4. pp. 376–382.
RIBEIRO, F., FERREIRA, P., and ARAUJO, M. 2013. Evaluating future scenarios forthe power generation sector using a multi-criteria decision analysis(MCDA) tool: The Portuguese case. Energy, vol. 52. pp. 126–136.
ROEHRL, R. and RIAHI, K. 2000. Technology dynamics and greenhouse gasemissions mitigation: A cost assessment. Technological Forecasting &Social Change, vol. 63, no. 2. pp. 231–261.
STEIN, E.W. 2013. A comprehensive multi-criteria model to rank electric energyproduction technologies. (Report). Renewable and Sustainable EnergyReviews, vol. 22. pp. 640–654.
STEINHAEUSER, I., SETHIA, A., JAISWAL, S., ROCHA OLIVEIRA, G., SEKINE, Y., andALVES, L.C. 2012. Global Corporate Renewable Energy Index (CREX).Bloomberg New Energy Finance & Vestas, Copenhagen.
STEWART, T.J. and BELTON, V. 2002. Multi Criteria Decision Analysis: AnIntegrated Approach. Kluwer, Dordrecht.
STREIMIKIENE, D., BALEZENTIS, T., KRISCIUKAITIEN, A.I., and BALEZENTIS, A. 2012.Prioritizing sustainable electricity production technologies: MCDMapproach. (Report). Renewable and Sustainable Energy Reviews, vol. 16,no. 5. pp. 3302–3311.
TOPCU, Y.I. and ULENGIN, F. 2004. Energy for the future: An integrated decisionaid for the case of Turkey. Energy, vol. 29, no. 1. pp. 137–154.
TROLDBORG, M., HESLOP, S., and HOUGH, R.L. 2014. Assessing the sustainabilityof renewable energy technologies using multi-criteria analysis: Suitabilityof approach for national-scale assessments and associated uncertainties.Renewable and Sustainable Energy Reviews, vol. 39. pp. 1173–1184.
TSOUTSOS, T., DRANDAKI, M., FRANTZESKAKI, N., LOSIFIDIS, E., and KIOSSES, I. 2009.Sustainable energy planning by using multi-criteria analysis application inthe island of Crete. Energy Policy, vol. 37, no. 5. pp. 1587–1600.
VOTTELER, R.G. and BRENT, A.C. 2017. A mining perspective on the potential ofrenewable electricity sources for operations in South Africa: Part 2. Amulti-criteria decision assessment. Journal of the Southern AfricanInstitute of Mining and Metallurgy, vol. 117, no. 3. pp. 299–312.
WANG, J., JING, Y., ZHANG, C., SHI, G., and ZHANG, X. 2008. A fuzzy multi-criteriadecision-making model for trigeneration system. Energy Policy, vol. 36,no. 10. pp. 3823–3832.
WESTERMANN, G., and SEHL, I. 2006. Developing a balanced scorecard basedbenchmarking approach for tourist destinations. Proceedings of theEuropean Innovation Pressure Conference, Tampere, Finland, 15–17,March. �
A mining perspective on the potential of renewable electricity sources–Part 1
VOLUME 117 297 �

30 September–6 October 2017Cape Town Convention Centre, Cape Town
TENTATIVE PROGRAMMESaturday Sunday Monday Tuesday Wednesday Thursday Friday
30/09/2017 1/10/2017 2/10/2017 3/10/2017 4/10/2017 5/10/2017 6/10/2017
ISRM ISRM Technical SessionBoard Board Morning RefreshmentsMeeting Meeting Technical Session
Lunch Technical Session Afternoon Refreshments Technical Session
Board Network Conference Dinner Function Dinner
Tech
nical
Visit
s
Wor
ksho
pW
orks
hop
Wor
ksho
pW
orks
hop
Afr
iRock 20
17
WHO SHOULD ATTEND� Rock engineering practitioners� Researchers� Academics� Mining engineers� Civil engineers� Petroleum engineers� Engineering geologists.
TECHNICAL VISITSThe following technical visits are confirmed for the conference:� Palabora Mine� Tau Tona Mine� Chapman’s Peak
EXHIBITION/SPONSORSHIPSponsorship opportunities are available.Companies wishing to sponsor or exhibit shouldcontact the Conference Co-ordinator.
For further information contact:Raymond van der Berg, Head of ConferencingSAIMM, P O Box 61127, Marshalltown 2107
Tel: +27 (0) 11 834-1273/7 · E-mail: [email protected]: http://www.saimm.co.za
BACKGROUNDThe 2017 ISRM International Rock Mechanics Symposium is to be held inCape Town. The conference theme is ‘Rock Mechanics for Africa’. Mining has traditionally been a mainstay of African economies, while Oil andGas industries are rapidly growing throughout Africa. Infrastructure is beingdeveloped to support these industries. Rock engineering design is andtherefore will continue to be essential for the growth of the continent. Prior tothe conference, the ISRM Board, Council and Commission meetings will takeplace. Technical visits are being arranged for after the conference.
Keynote SpeakersNick Barton
Sergio FontouraLuís LamasDick Stacey
Nielen van der MerwePaul Buddery
ISRM
Com
miss
ion
Mee
tings
ISRM
Coun
cil
Mee
tings
Sponsors
ISRM International Symposium
‘Rock Mechanics for Africa’
Supported by� Palabora Mine� Tau Tona Mine� Chapman’s Peak
Recent developments in the macroeconomicenvironment necessitate an investigation ofthe internal structure of mining corporations toevaluate possible alternative electricity-generating sources (Roehrl and Riahi, 2000).To be able to combine current knowledge ofmacroeconomic factors and the internalstructure of mining corporations, the researchprocess is presented in two papers. The firstpaper (Votteler and Brent, 2016) investigatedthe internal structure and argued that astrategic tool should be used to evaluateelectricity sources from the perspective ofmining corporations. The multi-criteriadecision analysis (MCDA) approach wasselected as the most appropriate strategic tool.Based on a literature review of previoussimilar MCDA approaches in energy planning,it was concluded that no adaptation of MCDAmethods could be found from a corporate,
mining, or South African perspective. Finally,the paper investigated the internal evaluationstructure in collaboration with miningcorporations, by identifying the criteria theyuse to evaluate electricity sources.
In this second paper we set out to identifythe best MCDA method to investigate apotential fit for renewable energy sources atmining operations. We then implement theselected MCDA method. Previousmacroeconomic research identified non-grid-connected solar PV, onshore wind, andgeothermal power in hybrid versions alongwith the current on-site diesel generators andgrid connection to Eskom as the mostlucrative. The choice of these hybrid versionsis based on the constant electricity demand ofmining operations and the intermittency of therenewables. The business model identified wasself-generation via own investment (Vottelerand Brent, 2016). The first paper describes theevaluation criteria used by miningcorporations to determine this choice. Allfurther information for implementing theMAVT method was gathered in cooperationwith mining corporations and renewable andconventional energy companies in order to usereal-time data.
The purpose of this paper is to analyse andcompare the strengths and weaknesses ofthese potential electricity sources, according toa possible fit to the specific needs of miningcorporations and from their perspective. Tooptimize the learning process for miningcorporations in order to equip them with anunderstanding of renewable energytechnologies and for energy companies to learn
A mining perspective on the potential ofrenewable electricity sources for operationsin South Africa:Part 2 — A multi-criteria decision assessment
by R.G. Votteler* and A.C. Brent†
The first in this series of two papers, on the potential of renewable electricitysources for mining operations in South Africa, investigated the internalstructure of mining corporations to evaluate feasible alternative electricitysources that were identified as through earlier research. The purpose of thispaper is to combine current knowledge about the external macroeconomicand the internal environments to produce a clear picture of how renewablesources of electricity could perform from the perspective of miningcorporations in South Africa. The multi-attribute value theory (MAVT)approach was adapted to structure the research and results. The model wasfed with real-time data provided from five different energy companies andfour mining corporations operating in South Africa. The results show that theperformance of hybrid versions of the currently used electricity sources(diesel generators and Eskom grid connection) with solar PV and onshorewind is favourable compared with the current sources alone. The advantageof diesel generators is significantly greater than that of the Eskom gridconnection. By combining the macroeconomic influences with the MAVTresults, hybrid solar PV versions are identified as having the greatestpotential. In second place are hybrid wind solutions, which have theshortcoming that good wind conditions occur only in coastal regions wherethere are fewer mining activities. Geothermal hybrid versions are the leastfavourable owing to the lack of service infrastructure and high initialinvestment costs.
Multi-criteria decision analysis, multi-attribute value theory,renewable electrical energy.
* School of Public Leadership, Faculty of Economicand Management Sciences, StellenboschUniversity, South Africa.
† Centre for Renewable and Sustainable EnergyStudies, Department of Industrial Engineering,Stellenbosch University, South Africa andSustainable Energy Systems, Engineering andComputer Science, Victoria University ofWellington, New Zealand.
© The Southern African Institute of Mining andMetallurgy, 2017. ISSN 2225-6253. Paper receivedSept. 2015.
299VOLUME 117 �
http://dx.doi.org/10.17159/2411-9717/2017/v117n3a11

A mining perspective on the potential of renewable electricity sources – Part 2
how to approach these potential new customers, moreresearch has to be conducted (Steinhaeuser et al., 2012).
The research objectives are illustrated in Figure 1. Thefirst objective, to investigate the best-suited MCDA, methodwas based on a literature review. The ensuing objectiveswere based on primary research investigations. The secondobjective was to adapt the selected MCDA method. The datawas gathered in cooperation with energy companiessupplying the electricity sources and mining corporationsusing them. Based on the third objective, the results of theadapted MCDA method were analysed to identify strengthsand weaknesses of the selected sources. The last sectioninvestigated the sensitivity of the method to possible changesto the results when alternating key input data.
To conduct secondary research, data was used that wasgathered and recorded by others prior to the current project.The advantages were the assurance of readily available dataand the relatively quick and inexpensive acquisition of suchdata. The disadvantages were that the information may beoutdated, that there may have been a variation in thedefinition of terms, and that different units of measurementmay have been used. Cross-checking the data could reducethese disadvantages; this would entail comparing similar data(Zikmund and Babin, 2010). The media used for theliterature review were books, the internet, conferenceproceedings, journal articles, Master’s and doctoraldissertations, and case studies.
Petticrew and Roberts (2006) identified six differenttypes of literature review. This paper made use of a‘conceptual review’, which aims to synthesize areas ofconceptual knowledge that can contribute to a betterunderstanding of the issues studied. The objective of such areview is to provide an overview of the literature in a givenfield, including the main ideas, models, and debates.
The first objective was to identify the most suitableMCDA method for the research context of this paper, whichwas based entirely on secondary literature. The literature isdiscussed in subsequent sections. Firstly, requirements ofthis research to identify the most suitable MCDA method aregiven and explained. By fulfilling the requirements it waspossible to ensure that all the areas of the investigation wereaddressed. Secondly, the different MCDA ‘schools of thought’are introduced and their possible use according to therequirements discussed. The value measurement school ofthought was selected. The next step was to use the samerequirements to analyse the possible contribution of eachmethod. Three well-established and comprehensive methodswere investigated.
The second objective was to adapt the selected MCDAmethod to the decision structure of mining corporations,evaluating different electricity-generating sources. Thesecondary literature provided the background knowledge forthe selected MCDA method and the foundation for theadaptation.
This section describes the requirements of the MCDA methodto best address the main research objective, namely toanalyse and compare potential electricity sources for miningcorporations. The required elements were used to scandifferent MCDA categories and methods to identify the onebest-suited for adaptation in the context of this investigation.It is important to mention that it was often difficult to justifythe selection of a method. None of them are perfect, nor is itpossible to apply them to all decision problems. Each methodentails its own limitations, characteristics, principles, andperspectives (Ishizaka and Nemery, 2013). Consequently, thefollowing requirements were used to make the best possibleselection.1. Once-off decision – Specialist knowledge of thecharacteristics of the MCDA method is required in order tocontribute successfully to this type of decision. The decisionto select the best-suited electricity source has to be madeonce and is not recurring. Only after years of usage a re-evaluation may be necessary as price structures orperformance levels may have changed (Khatib, 2008) 2. Investigate the evaluation structure – The implementationof the MCDA method has to bring about a clearunderstanding of the internal evaluation structure of miningcorporations. It has to show how each criterion contributes tothe overall decision. This can contribute to renewable energycompanies having a better understanding of a potential newtype of customer, namely mining corporations3. Analyse alternatives separately – The method has todeliver the basis for a separate analysis of each alternative. Itshould be possible to illustrate and explain the strengths andweaknesses of an alternative independently of the otheralternatives. The decision-maker has to understand theimplications of selecting a certain option4. Compare alternatives – It has to be possible to comparealternatives according to their strengths and weaknesses. Theresults should demonstrate the advantages anddisadvantages of selecting one electricity source in preferenceto the others. The results ought to provide the decision-maker with the necessary information to optimize his or herselection5. Incorporate unknown alternatives – As the concept ofrenewable electricity sources is relatively new for miningcorporations in South Africa (Boyse et al., 2014), the methodhas to be able to incorporate the analysis of alternatives notknown to the decision-maker. The basis of the adaptedmethod, before implementing the data of alternatives, shouldnot include any predispositions towards a specific outcome.
The purpose of this section was to select the MCDA methodthat is best suited to contribute to the research objectives.This was achieved by investigating the categories andmethods according to the requirements listed above (seeTable I). For structural purposes the reasoning wassubdivided into the selection of the most appropriate MCDAcategory, and then the method.
�
300 VOLUME 117
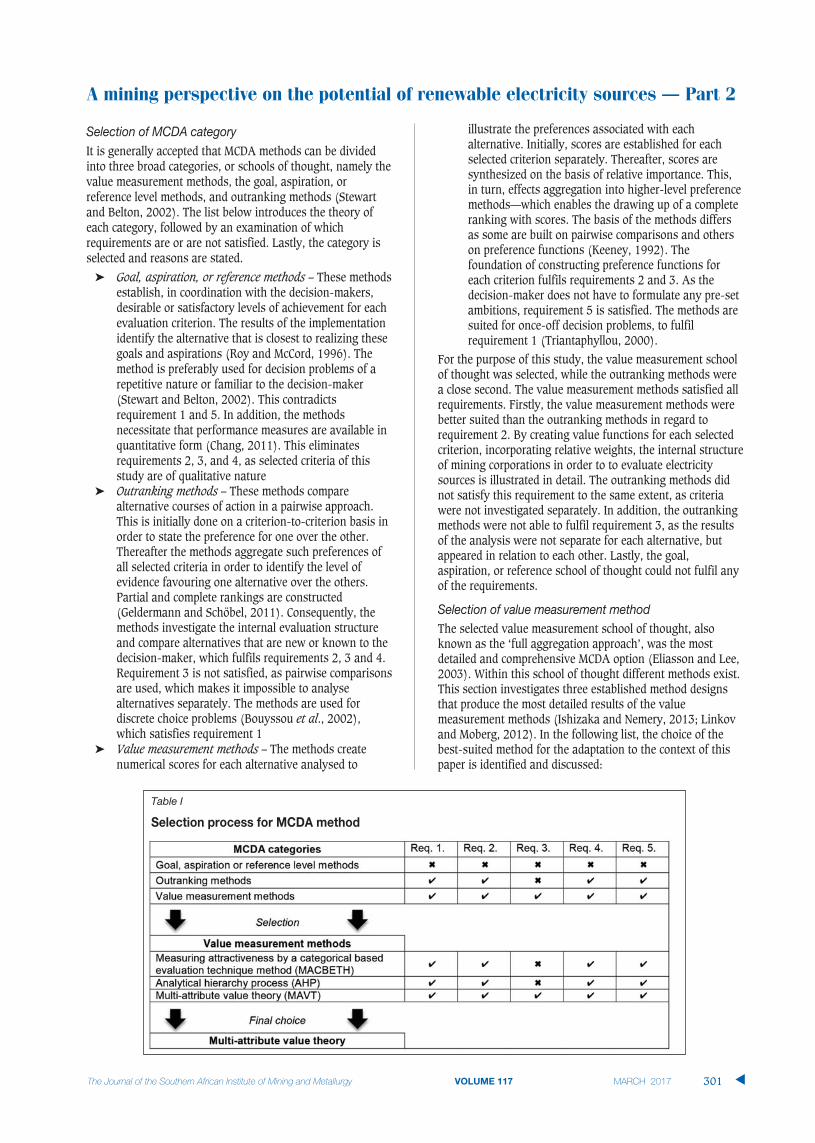
It is generally accepted that MCDA methods can be dividedinto three broad categories, or schools of thought, namely thevalue measurement methods, the goal, aspiration, orreference level methods, and outranking methods (Stewartand Belton, 2002). The list below introduces the theory ofeach category, followed by an examination of whichrequirements are or are not satisfied. Lastly, the category isselected and reasons are stated.
� Goal, aspiration, or reference methods – These methodsestablish, in coordination with the decision-makers,desirable or satisfactory levels of achievement for eachevaluation criterion. The results of the implementationidentify the alternative that is closest to realizing thesegoals and aspirations (Roy and McCord, 1996). Themethod is preferably used for decision problems of arepetitive nature or familiar to the decision-maker(Stewart and Belton, 2002). This contradictsrequirement 1 and 5. In addition, the methodsnecessitate that performance measures are available inquantitative form (Chang, 2011). This eliminatesrequirements 2, 3, and 4, as selected criteria of thisstudy are of qualitative nature
� Outranking methods – These methods comparealternative courses of action in a pairwise approach.This is initially done on a criterion-to-criterion basis inorder to state the preference for one over the other.Thereafter the methods aggregate such preferences ofall selected criteria in order to identify the level ofevidence favouring one alternative over the others.Partial and complete rankings are constructed(Geldermann and Schöbel, 2011). Consequently, themethods investigate the internal evaluation structureand compare alternatives that are new or known to thedecision-maker, which fulfils requirements 2, 3 and 4.Requirement 3 is not satisfied, as pairwise comparisonsare used, which makes it impossible to analysealternatives separately. The methods are used fordiscrete choice problems (Bouyssou et al., 2002),which satisfies requirement 1
� Value measurement methods – The methods createnumerical scores for each alternative analysed to
illustrate the preferences associated with eachalternative. Initially, scores are established for eachselected criterion separately. Thereafter, scores aresynthesized on the basis of relative importance. This,in turn, effects aggregation into higher-level preferencemethods—which enables the drawing up of a completeranking with scores. The basis of the methods differsas some are built on pairwise comparisons and otherson preference functions (Keeney, 1992). Thefoundation of constructing preference functions foreach criterion fulfils requirements 2 and 3. As thedecision-maker does not have to formulate any pre-setambitions, requirement 5 is satisfied. The methods aresuited for once-off decision problems, to fulfilrequirement 1 (Triantaphyllou, 2000).
For the purpose of this study, the value measurement schoolof thought was selected, while the outranking methods werea close second. The value measurement methods satisfied allrequirements. Firstly, the value measurement methods werebetter suited than the outranking methods in regard torequirement 2. By creating value functions for each selectedcriterion, incorporating relative weights, the internal structureof mining corporations in order to to evaluate electricitysources is illustrated in detail. The outranking methods didnot satisfy this requirement to the same extent, as criteriawere not investigated separately. In addition, the outrankingmethods were not able to fulfil requirement 3, as the resultsof the analysis were not separate for each alternative, butappeared in relation to each other. Lastly, the goal,aspiration, or reference school of thought could not fulfil anyof the requirements.
The selected value measurement school of thought, alsoknown as the ‘full aggregation approach’, was the mostdetailed and comprehensive MCDA option (Eliasson and Lee,2003). Within this school of thought different methods exist.This section investigates three established method designsthat produce the most detailed results of the valuemeasurement methods (Ishizaka and Nemery, 2013; Linkovand Moberg, 2012). In the following list, the choice of thebest-suited method for the adaptation to the context of thispaper is identified and discussed:
A mining perspective on the potential of renewable electricity sources – Part 2
VOLUME 117 301 �
Table I

A mining perspective on the potential of renewable electricity sources – Part 2
� Measuring attractiveness by the categorical-basedevaluation technique method (MACBETH) – Thismethod consists of three steps. The first step is tostructure the problem, which is followed byconstructing a judgement matrix on the basis ofinterval pairwise comparisons. If consistency of thematrix is proven, the attractiveness can be calculated(Ertay et al., 2013). As the method uses pairwisecomparisons, it is difficult to analyse alternativesseparately, which contradicts requirement 3. The otherrequirements can be fulfilled
� Analytical hierarchy process (AHP) – This methodcomprises three steps, similar to MACBETH. Firstly, theproblem is structured, followed by the creation of ajudgement matrix based on ratio pairwise comparisons.Again, if results are consistent, the attractiveness canbe calculated. A sensitivity analysis can be conductedto reduce uncertainty (Stein, 2013). As this methodalso uses pairwise comparison, even though on a ratioscale, requirement 3 is difficult to accomplish.However, all other requirements can be satisfied
� Multi-attribute value theory (MAVT) – This methodentails five steps. The first step is to structure theproblem. The second is to determine the criteria thatthe decision-maker uses to evaluate the decisionproblem. Thirdly, a scale is developed to measure eachcriterion. Fourthly, a value function is created for eachcriterion. Lastly, the data for each alternative isimplemented and results can be analysed andcompared. A sensitivity analysis can then be conducted(Stefanopoulos et al., 2014). As a preference functionis constructed for each criterion, alternatives can beanalysed separately and in comparison to each other.
The MAVT was selected as it satisfies all the requirements.The method can be used for once-off decisions (Ferretti et al.,2014). It is the most comprehensive MCDA method and themost detailed way to investigate the internal structure ofmining corporations, as a preference function is created foreach criterion. The MACBETH and AHP methods are lesssatisfying on this requirement as each criterion is not treatedseparately (Ishizaka and Nemery, 2013:6). Consequently,only the MAVT is able to analyse alternatives separately, asresults are not based on a pairwise comparison. The threemethods enable the decision-maker to choose betweenunfamiliar alternatives, as no aspirations or goals arerequired.
The first step is to structure the problem. As discussed in thepreceding paper and again briefly in the introduction of thispaper, the type of decision for mining corporations is of aonce-off nature, as the electricity source will most likely beused for the life of the mine. The implemented methodintends to assist and provide more structure in the decision-making of mining corporations in South Africa to enablethem to understand how renewable energy could perform asa solution for their unique needs. Based on pastmacroeconomic research, the choice entails the following.
� The electricity sources available were diesel generator;hybrid diesel generator/solar PV; hybrid dieselgenerator/onshore wind power; hybrid dieselgenerator/geothermal power; Eskom grid connected;
hybrid Eskom grid connected/solar PV; hybrid Eskomgrid connected/onshore wind power; hybrid Eskom gridconnected/geothermal power (Votteler and Brent,2016)
� The business model used to realize the potential projectwas self-generation in the form of own investment(Votteler and Brent, 2016).
The second step was to identify the criteria that miningcorporations are currently using to evaluate the decisionproblem stated above. The criteria, in Table II, were identifiedin the preceding paper in cooperation with four miningcorporations.
The third step was to develop a scale for each criterion. Thesescales are summarized in Table II. A local numerical scalewas established for the 11 measurable criteria. A local scaleentails all values of alternatives analysed, from the worst tothe best. An example is provided in Figure 2 in the followingsection. The reason for developing scales is the fast-changingenvironment where values, which are based on factors liketechnological progress (Stewart and Belton, 2002), alter. Thismakes it impossible to use global scales.
A global qualitative scale was developed for theremaining five criteria to make comparability possible(Stewart and Belton, 2002). A pilot study was conducted withone expert from the renewable field and one expert from themining industry to ensure that the qualitative scales wereinterpreted consistently. The data for the electricity sources tofeed all criteria and to develop the scale were revealed incooperation with four mining corporations and five differentenergy companies that have specialist knowledge of one ormore of the sources. The data was backed up withprofessional literature to ensure accuracy.
The fourth step was to develop the value functions andassess the relative importance weights of each criterion. Thevalue function reflects the preference of the miningcorporation as the decision-maker (Stewart and Belton,2002). Figure 2 provides an example of the operating andmaintenance (O&M) cost value function. The colouredsections are explained in the section ‘Criteria and valuefunctions’ below. The vertical axis represents the value to therespondent, from worst (0) to best (100). The horizontal axisgives the scale for the specific criteria. The worst value issituated on the left with zero value points while the bestvalue is situated on the right with 100 value points.
The procedure for all four mining corporations was thesame. All respondents had to go through all criteria and wereasked three questions. Firstly, they had to identify the pointon the scale that represents halfway in value (50) for them. Ifthere was no preference the point would stay in the middleand a linear function would result. In the case of theexamples, an initial cost reduction was more important –which results in a convex function. A more convex curvewould represent a stronger preference. A possible reason forthe more convex curve could be a tight budget, and thetighter the budget the more convex the function would be, asthe higher prices cannot be afforded. Question two and threefollowed the same procedure between the value points of 0
�
302 VOLUME 117

and 50, and 50 and 100. For each value function the averageof the four responses was taken. Outliers were defined as avariation of more than 15% of the numerical scale that theyare measured on. No outliers occurred. The reason fortranslating all criteria into scales from 0–100 was to revealthe respondents’ value and to equalize numbers for resultcalculations (Stewart and Belton, 2002). The value score(vertical axis) for each criterion was determined at therectangular crossing point on the value function, based on its
numerical value (horizontal axis). In Figure 2, an electricitysource with O&M costs of 15 euros would obtain a valuescore of 73.
The importance weight shows the magnitude of influencethat a single criterion contributes to the final decision. Theprocedure entailed two stages. In the first stage, theimportance weight within each category, namely economy,technology, environment, and social, was identified. Thequestioning was always conducted in the same way. The
A mining perspective on the potential of renewable electricity sources – Part 2
VOLUME 117 303 �
Table II

A mining perspective on the potential of renewable electricity sources – Part 2
respondent first had to identify the most important criterion;this received 100 points, followed by the second mostimportant with less than 100 points, depending on how muchless it was influencing the decision. The second stage entailedrating the categories themselves, again starting with the mostimportant one with 100 points. To obtain the overall relativeimportance weight, the weight of each criterion wasmultiplied with the corresponding category weight (Ishizakaand Nemery, 2013).
This investigation produced two forms of results, which are
discussed in detail in a later section. First, an overall score foreach electricity source is presented. The score was calculatedby multiplying the relative importance weight of eachcriterion with the corresponding value score. The multipliedscores of each criterion were added to obtain the overall valueof the electricity source. The scores were normalized andmeasured against the best-performing source with 100points. The second result is represented in two matrixdiagrams for each electricity source. The matrix illustrates theperformance of all criteria for each source. One matrixincludes the importance weights, and the other excludes them.
This section introduces the electricity sources that wereconsidered for possible solutions at mining operations. Asmentioned earlier, previous research by the authors arguedthat the selected renewable sources in hybrid versions withcurrent sources presently have the highest potential formining corporations in South Africa. Table III brieflydescribes each source and provides specifications of the exacttype of technology used. The energy companies participatingin this study recommended the types of technologies.
This section presents two different types of data tables. Table
�
304 VOLUME 117
Table III

IV represents the general values, which were used for allelectricity sources analysed, especially for the economiccriteria. By applying the values it was ensured that the samefoundation was used to compare sources. Owing to therelatively young market and the experimental stage in whichmining corporations find themselves regarding renewables, asmaller project size of 10 MW was selected. Each value wasdiscussed with all mining and energy companies contributingto this study and all were found to be most suitable. Whererequired, the values were double-checked with officialsources to ensure that they were in line with internationalstandards.
Table V provides the specific values for single and hybridelectricity sources. The values were used to calculate the datato feed the criteria of the MAVT method of this paper. Thevalues were again provided by the energy companies anddouble-checked with professional, official sources. It isimportant to mention that the current sources, namely dieselgenerators and the grid connection to Eskom, are consideredas the main sources. Technological standards, especially theintermittency of renewables, require the current sources tocontribute continuously to the supply to ensure a stablesystem. Diesel generators have higher ratios than the gridconnection to Eskom, because of their minimum load ratios.For illustration purposes, a 10 MW hybrid diesel-solar PVproject would entail a 10 MW diesel generator and a 7.5 MWsolar PV plant.
This section represents an overview, illustrated in Table VI, of
all relevant data regarding the adaptation of the MAVTmethod for South African mining corporations to analyse andcompare current with hybrid renewable electricity sources.The left column of Table VI shows the criteria investigated,followed by the specific data for the electricity source optionsand lastly the results for the importance weight and valuefunction. Most of the numerical measured criteria were againdouble-checked with professional, recognized official sources,including the results in Tables IV and V.
The numerical criteria data for the hybrid electricityoptions were calculated for fixed costs according to theproject ratios in Table V. For example, the investment cost fora hybrid diesel-solar PV of €1 425.00 was calculated by:1*€450.00+0,75*€1 300.00. The two variable cost criteria,namely the actual and predicted fuel costs, were calculatedaccording to the electricity contribution, where the renewableelectricity has priority and the conventional source is used tosatisfy the remaining demand. The levelized electricity costand net present value entail scenarios of both fixed andvariable costs, and consequently both were considered in thecalculations.
The relative importance weight was normalized accordingto the most important criterion, namely investment cost witha score of 100. The number indicates by how much more, orless, weight a criterion influences the final decision. Thenumber in brackets indicates the ranking for illustrationpurposes. The last column specifies the level of preference inthe value function regarding each criterion. All functionswere linear or convex, consequently the column indicates theextent to which the function is convex. The extent wascategorized into four levels, as can be seen in Figure 2. The
A mining perspective on the potential of renewable electricity sources – Part 2
VOLUME 117 305 �
Table IV
Table V

A mining perspective on the potential of renewable electricity sources – Part 2
�
306 VOLUME 117
Table VI

point moving on 50 points of the value scale was considered.For a linear function the point is in the middle of thehorizontal axis. As the point moves further to the left, theconvexity of the curve increases and therefore there is apreference not to pay the high O&M costs.
To enable understanding of all data measurements, thefollowing list introduces the criteria measured according to aqualitative scale. A global scale was used, as the scale is setand unchanging. The respondents of mining corporationswere asked to rate the corporate image and effect oncommunity criteria, as they are specific to the miningindustry. All other data for the qualitative criteria was
gathered from the energy companies, because of theirexpertise in the field. The scales that were developed andmeasured are presented in Table VII.
This section contains the analysis and evaluation of theresults of the MCDA implemented for the purposes of thispaper. The results are based on the input data introduced inthe previous sections.
A mining perspective on the potential of renewable electricity sources – Part 2
VOLUME 117 307 �
Table VII

A mining perspective on the potential of renewable electricity sources – Part 2
As explained previously, two types of results weregenerated: firstly, the overall ranking of electricity sourcesanalysed, and secondly, the individual performance matrix ofeach source based on the evaluation criteria. The overallranking is illustrated in Figure 3. The hybrid versionconsisting of Eskom with solar PV was ranked as the best-performing source, followed closely by another hybrid versionconsisting of Eskom with onshore wind, and Eskom alone.The three hybrid versions with diesel generators, and thehybrid consisting of Eskom with geothermal power had verysimilar overall scores. The lowest-performing source was adiesel generator alone.
It is important to note from the results in Figure 3 that thehybrid versions of wind and solar PV along with currentsources were always ranked more highly than current sourcesonly. The difference between hybrid applications and onlydiesel generators was marked. However, the advantage ofusing only Eskom was relatively small.
The individual performances of electricity sources arepresented in this section. For illustration purposes twosources are always represented in each figure, giving thescore for the currently used source only and for thecorresponding hybrid version. Consequently, it is possible toidentify and evaluate how exactly hybrid versions performeddifferently from the sources used currently. The solid shadedarea represents the result including the importance weights.The dotted lines represent the criteria scores only, excludingthe importance weights.
The performance matrix for diesel generators and ahybrid version with solar PV is illustrated in Figure 4. Theadvantages of diesel generators were the low initial
investment cost, the small space requirement, and the shortimplementation period. However, the running costs, includingthe expected diesel price increases, were a serious weakness.A hybrid version with solar PV increased initial investmentand lowered fuel consumption. The net present valueindicated that about €44 million can be saved over a periodof 20 years using a hybrid version. Further advantages of ahybrid version were lower levelized costs, fewer CO2
emissions, a better corporate image, and a more positiveeffect on the community.
The performance matrix for diesel generators and ahybrid version with onshore wind is illustrated in Figure 5.This hybrid was very similar to the hybrid version with solarPV above. The implementation period of 15 months for thehybrid onshore wind version was slightly longer than the 12months required for the solar PV hybrid version. Moreover,wind had a slightly lower job creation potential. The long-term net present value savings of a hybrid onshore windversion in comparison to only diesel generators amounted toabout €55 million, with a possible levelized cost reduction of€0.081.
The performance matrix of diesel and a hybrid versionwith ‘hard rock’ geothermal power in Figure 6 showeddistinctive, different characteristics from the solar PV andonshore wind hybrids. The strong advantages were superiorfuel-related costs, levelized costs, net present value, and CO2
emission benefits. One reason for the advantages was thebaseload characteristic of 85% of geothermal electricity
�
308 VOLUME 117

generation. The clear disadvantages were the extremely highinitial investment costs and an implementation period of 36months. The net present value savings amounted toapproximately €147 million. All three hybrid versions withdiesel showed very similar overall scores in Figure 3 and aconsiderably improved rating compared to only dieselgenerators.
Figures 7, 8, and 9 represent Eskom and the renewablehybrid versions. Eskom in hybrid versions with solar PV,onshore wind, and Eskom alone were the best-performingsources. As can be seen in Figure 3, the improvement whenusing Eskom alone compared with the hybrid versions wasnot particularly significant. The hybrid version withgeothermal was ranked in the second-last position andtherefore performed worse than Eskom alone.
The reason for the minimal performance improvementcan be seen in the matrix for Eskom and a hybrid versionwith solar PV. The disadvantage of the hybrid version wasagain the initial investment cost and the O&M costs. Slightimprovements can be seen in fuel costs, levelized costs, andnet present value. The hybrid version accumulated a netpresent value saving of €5 million over the timespan of 20years. Further improvements can be seen in respect of jobcreation, corporate image, effect on community, and CO2emissions.
The performance matrix for Eskom and a hybrid versionwith onshore wind is illustrated in Figure 8. The performanceon all criteria was very similar to the solar PV hybrid version,which displayed the same pattern as the diesel versions. Thewind hybrid version performed slightly better on all economiccriteria and in respect of CO2 emissions. The net presentvalue savings in comparison to Eskom were only €10million. However, worse performance, especially relating tosafety, maturity, job creation, and space requirements, movedthis option to the second ranking.
The performance matrix for Eskom and a hybrid versionwith geothermal power is shown in Figure 9. The overall poorranking can be explained as being due particularly to the veryhigh initial investment and O&M costs, which represented theworst values in comparison to the other sources, and theirhigh importance weight. However, significant long-termbenefits lay in having the lowest fuel costs, and were to behad in respect of levelized costs, net present value, and CO2emissions. Net present expenses at €55 million were thelowest, and were €15 million less than only Eskom.
The results show similar patterns for the use of renewables inhybrid versions with currently used electricity sources.Economically, the move to renewables has a long-termadvantage as it requires a shift from constant highoperational cost to an initially high capital investment withlow operational expenses, especially for mines running ondiesel generators. Considering the currently increasing Eskomtariffs, the benefits of using renewables will increase further.
In this study, solar PV had the greatest potential, as avast number of mining areas are in prime solar radiatedregions in central South Africa, the service structure is welldeveloped (Votteler and Brent, 2016), and it is the bestperforming source from the perspective of mines connected tothe Eskom grid and almost identical to all renewable hybridversions with diesel generators.
Wind power was ranked second owing to the fact that itcan be applied only on a limited scale in the coastal regions ofSouth Africa, where there are few mines. The serviceinfrastructure is also well developed (Votteler and Brent,2016) and performance from the perspective of mines is onlyslightly behind that of solar PV. However, the economicperformance of onshore wind is slightly better than that ofsolar PV.
Geothermal power had the weakest overall potential formining operations in South Africa. Although it has long-termbenefits from the perspective of mines, a considerable initialinvestment has to be made. The source did not outperform
A mining perspective on the potential of renewable electricity sources – Part 2
VOLUME 117 309 �

A mining perspective on the potential of renewable electricity sources – Part 2
Eskom alone and is only minimally ahead of the other dieselhybrid versions. The disadvantage of a relatively youngtechnology, in which there is little experience in South Africa,is that it increases the investment risk. Moreover, serviceinfrastructure has not been developed yet and areas withgood geothermal potential in the northeastern region of SouthAfrica are well connected to the Eskom grid (Votteler andBrent, 2016). Nevertheless, the study has shown a greatpotential for future development, especially for long-termsuccess, which could be realized with a growing geothermalindustry in South Africa.
The following sections address how changes in the mostinfluential input data would influence the overall results. Theselected variables are the system lifespan, the predicted fuelcost, and the forecast implementation of a CO2 tax. Thelifespan is of interest for mining corporations, as lifespans ofmines differ—which has an impact especially on theeconomic framework of the project. The prediction of tariffincreases by Eskom and fuel and diesel costs have a greatinfluence on economic criteria and were therefore double-checked with official sources. However, exact forecasts forthe next 20 years can be imperfect, which necessitates aninvestigation into consequences of the results for worst- andbest-case scenarios. Lastly, the possible impact of a CO2 taxwas considered, as all contributing mining corporationsmentioned it as a point of concern.
The lifespans considered in this section are 10 and 5 years.The criteria selected to illustrate the effect on performance arethe levelized costs and the net present value, as shown inTable VIII. The options with a diesel generator remain in thesame order for both criteria; nevertheless, the shorter thelifespan the smaller the advantage becomes. Options withEskom, on the other hand, undergo a change in ranking onthose two criteria. On a 20-year lifespan all hybrid sourcesperform better than Eskom alone. On a 10-year span only the
hybrid version with onshore wind can compete. Based on 5years, Eskom alone is the best-performing option.
Nevertheless, the overall ranking on considering allcriteria does not change significantly, as the change oflifespan affects only economic criteria and CO2 emission. Thehybrid versions of Eskom with solar PV and wind are in topposition, followed by Eskom alone. The only change is theshift of the diesel hybrid geothermal version from fourth toseventh place. The reason for this is the gain in weight ofinitial investment on a lower calculated lifespan, as there is asmaller saving on fuel costs.
Changes in fuel and tariff costs of present sources over thenext 20 years cannot be forecast precisely. As discussedpreviously, predictions were made with the aid of experts’opinions and a literature review. However, as the influence ofthe forecast on the running costs is considerable, a scenarioanalysis was conducted. The results are presented in TableIX. For illustration purposes, the levelized cost and netpresent value criteria were considered.
The costs of the diesel generator and hybrid version arepresented in the top section of Table IX. A variation of about5% of the predicted annual 7% diesel price increase wasinvestigated. The different scenarios did not affect the overallranking of the sources. The levelized costs showed a greatsensitivity to a change in the diesel price, with the costs ofthe worst-case scenario being more than double those of thebest case. The net present values showed that the usage ofrenewables lowers the sensitivity to fuel price changes. Thedifferences in value between worst and best case weresignificantly less for the hybrid versions.
Again, the overall rankings for all Eskom versions werenot affected by the changes. It is noteworthy that only thehybrid version with wind could compete with Eskom alone inthe best-case scenario based on the two criteria. In the otherscenarios Eskom is the most expensive version. The greaterindependence from tariff changes was still noticeable, but notas great as with diesel versions.
�
310 VOLUME 117
Table VIII

The possible impact of the implementation of a CO2 tax in2016 is again illustrated with the criteria of levelized costsand net present value, as the effect is the greatest. Theoverall ranking of all electricity sources was not affected. Atax of R120 per ton of CO2 was considered, with an annualincrease of 10%. As it is not yet certain how Eskom is goingto handle the tax, the full amount was calculated forillustration purposes (Mbadlanyana, 2013; The CarbonReport, 2015). As can be seen in Table X, the effect onlevelized costs for diesel and Eskom alone amounted to justover €0.01 and €10 million net present worth. The usage ofhybrid versions reduces the increase to less than €0.01 and€6 million.
The research presented in this paper is based on the resultsfrom the previous paper, in which the MCDA method wasselected as the most appropriate research framework and thecriteria that South African mining corporations used toevaluate the selected electricity sources were revealed. Thepurpose of this paper was firstly, to identify the most suitableMCDA method for adaptation, therefore the MAVT methodwas selected, and secondly to analyse and evaluate theselected sources – which was conducted in cooperation withmining and energy companies operating in South Africa.
The main results of the adapted MAVT method showedthat the hybrid versions with solar PV and onshore windwere more favourable than diesel generators or the Eskom
A mining perspective on the potential of renewable electricity sources – Part 2
VOLUME 117 311 �
Table IX
Table X

A mining perspective on the potential of renewable electricity sources – Part 2
grid connection alone. The advantages of diesel generatorswere significantly greater than those of Eskom gridconnection. As renewable sources are steadily advancing andthe currently used sources are becoming ever moreexpensive, the trend will shift further towards renewables. Incombining the macroeconomic influences with the MAVTresults of this paper, hybrid solar versions were identified ashaving the greatest potential. Hybrid wind solutions were insecond place, as good wind conditions occur only in coastalregions where there are fewer mining activities. Geothermalhybrid versions were selected as least favourable owing tothe poor service infrastructure and high initial investmentcosts.
The performance matrixes indicate that the usage ofrenewable hybrid versions contributes to long-term success,but requires an initial shift from operational to capitalexpenses. Considering the overall rankings and specificallythe levelized costs, renewables are already profitable with a5-year lifespan and diesel generators. However, for Eskomhybrid versions, only wind is profitable over a 10-year spanand the rest over 20 years.
This paper provides objective information for use by themanagement of mining corporations in South Africa. The aimis to illustrate how the relatively new opportunity ofrenewables could perform from the perspective of miningcorporations, while at the same time considering themacroeconomic influences.
BOUYSSOU, D., JACQUET-LAGREZE, E., PERNY, P., SLOWINSKI, R., VANDERPOOTEN, D.,and VINCKE, P. 2002. Aiding Decisions with Multiple Criteria: Essays inHonor of Bernard Roy. Kluwer, Dordrecht.
BOYSE, F., CAUSEVIC, A., DUWE, E., and ORTHOFER, M. 2014. Sunshine for mines:Implementing renewable energy for off-grid operations. Carbon WarRoom, Washington, DC.
CHANG, C.T. 2011. Multi-choice goal programming with utility functions.European Journal of Operational Research, vol. 215, no. 2. pp. 439–445.
EIA. 2013. Updated capital cost estimates for utility scale electricity generatingplants. US Energy Administration Information, Department of Energy,Washington, DC.
ELIASSON, B., and LEE, Y.Y. 2003. Integrated Assessment of Sustainable EnergySystems in China. Kluwer, Dordrecht.
ERTAY, T., KAHRAMAN, C., and KAYA, I. 2013. Evaluation of renewable energyalternatives using MACBETH and fuzzy AHP multi criteria methods: Thecase of Turkey. Technological and Economic Development of Economy,vol. 19, no. 1. pp. 38–62.
ESKOM. 2015a. Climate change. http://financialresults.co.za/2012/eskom_ar2012/fact-sheets/006.php#carbon [Accessed 14 July. 2015].
ESKOM. 2015b. Tariff & charges booklet 2014/2015. Eskom, Johannesburg.ETH ZÜRICH SUSTEC. 2014. Derisking renewable energy investment NAMA
finance case study exercise. United Nations Development Program, NewYork.
FERRETTI, V., BOTTERO, M., and MONDINI, G. 2014. Decision making and culturalheritage: An application of the Multi-Attribute Value Theory for the reuseof historical buildings. Journal of Cultural Heritage, vol. 15, no. 6. pp.644–655.
FRAUNHOFER ISE. 2013. Levelized cost of electricity: Renewable energytechnologies. Fraunhofer Institute for Solar Energy Systems, Freiburg.
GELDERMANN, J. and SCHOBEL, A. 2011. On the similarities of some multi-criteria decision analysis methods. Journal of Multi-Criteria DecisionAnalysis, vol. 18, no. 3-4. pp. 219–230.
IRENA. 2014a. Analysis of infrastructure for renewable power in SouthernAfrica. Abu Dhabi: International Renewable Energy Agency.
IRENA 2014b. Renewable power generation costs in 2014. InternationalRenewable Energy Agency, Abu Dhabi.
IRENA. 2013. Renewable energy and jobs. International Renewable EnergyAgency, Abu Dhabi.
ISHIZAKA, A. and NEMERY, P. 2013. Multi-criteria Decision Analysis. Wiley,Chichester, UK.
JACOBSON, N., WYDER, J., FRANKLIN, S., and MCCRACKEN, P. 2013. Data collection ofdiesel generators in South IT Power Australia, Canberra.
JONGENS, A.W.D. 2007. Environmental noise impact assessment for scopingpurposes into the establishment of a wind energy facility along the WestCoast, north of the Olifants River mouth. Savannah Environmental (Pty)Ltd, Cape Town.
JUNG, J. and TYNER, W.E. 2014. Economic and policy analysis for solar PVsystems in India. Energy Policy, vol. 74. pp. 123–133.
KAGEL, A., BATES, D., and GAWELL, K. 2007. A guide to geothermal energy andenvironment. Geothermal Energy Association, Washington, DC.
KEENEY, R.L. 1992. Value-Focused Thinking: A Path to CreativeDecisionmaking. Harvard University Press, Cambridge, MA.
KHATIB, H. 2008. Economic evaluation of projects in the electricity supplyindustry. Institute of Electrical Engineering, London.
LAZARD. 2014. Levelized cost energy analysis – version 8.0. Lazard AssetManagement, New York.
LINKOV, I. and MOBERG, E. 2012. Multi-criteria decision analysis: Environmentalapplications and case studies. Taylor & Francis, London.
MASTERS, G.M. 2013. Renewable and Efficient Electric Power Systems. 2nd edn.Wiley, Hoboken, NJ.
MATEK, B. and GAWELL, K. 2014. The economic costs and benefits of geothermalpower. Geothermal Energy Association, Bochum.
MBADLANYANA, T. 2013. The political economy of carbon tax in South Africa.Africa Insight, vol. 43, no. 1. pp. 77–90.
NREL. 2009. Land-use requirement of modern wind power plants in the UnitedStates. National Renewable Energy Laboratory, Denver, CO.
NREL. 2013. Land use requirements for solar power plants in the UnitedStates. National Renewable Energy Laboratory, Denver, CO.
OPEC. 2014. World Oil Outlook. Organization of the Petroleum ExportingCountries, Vienna:.
PETTICREW, M. and ROBERTS, H. 2006. Systematic Reviews in the Social Sciences:A Practical Guide. Blackwell, Oxford.
ROEHRL, R. and RIAHI, K. 2000. Technology dynamics and greenhouse gasemissions mitigation: A cost assessment. Technological Forecasting &Social Change, vol. 63, no. 2. pp. 231–261.
ROY, B., AND MCCORD, M.R. 1996. Multicriteria Mythology for Decision Aiding.Kluwer, London.
SAPVIA. 2013. NERSA consultation on refit rates. South African PhotovoltaicIndustry Association, Johannesburg.
SARS. 2015. Corporate income tax. http://www.sars.gov.za/TaxTypes/CIT/Pages/default.aspx [Accessed 14 July 2015].
SOUTH AFRICAN RESERVE BANK. 2015. Inflation targets and results. https://www.resbank.co.za/MonetaryPolicy/DecisionMaking/Pages/TargetsResult.aspx [Accessed 10 July 2015].
STEFANOPOULOS, K., YANG, H., GEMITZI, A., and TSAGARAKIS, K.P. 2014. Applicationof the multi-attribute value theory for engaging stakeholders ingroundwater protection in the Vosvozis catchment in Greece. Science ofthe Total Environment, vol. 470–471. pp. 26–33.
STEIN, E.W. 2013. A comprehensive multi-criteria model to rank electric energyproduction technologies. Renewable and Sustainable Energy Reviews, vol.22. pp. 640–54.
STEINHAEUSER, I., SETHIA, A., JAISWAL, S., ROCHA OLIVEIRA, G., SEKINE, Y., andALVES, L.C. 2012. Global corporate renewable energy index (CREX).Bloomberg New Energy Finance and Vestas, Copenhagen.
STEWART, T.J. and BELTON, V. 2002. Multi Criteria Decision Analysis: AnIntegrated Approach. Kluwer, Dordrecht.
THE CARBON REPORT. 2015. The proposed South African carbon tax. http://www.thecarbonreport.co.za/the-proposed-south-african-carbon-tax/[Accessed 20 July 2015].
TRIANTAPHYLLOU, E. 2000. Multi-criteria Decision Making Methods: AComparative Study. Kluwer, Dordrecht.
VESTAS. 2015. Technical specifications V100-2.0MW. Vestas Wind, Denmark. VOTTELER, R.G. and BRENT, A.C. 2017. A mining perspective on the potential of
renewable electricity sources for operations in South Africa: Part 1. Theresearch approach and internal evaluation process. Journal of the SouthernAfrican Institute of Mining and Metallurgy, vol. 117, no. 3. pp. 285–297.
WAISSBEIN, O., GLEMAREC, Y., BAYRAKTAR, H., and SCHMIDT, T.S. 2013. DeriskingRenewable Energy Investment. United Nations Development Program,New York.
WOUTER, F. 2014. Energy management AGA. Presentation. AngloGold Ashanti,Johannesburg.
ZIKMUND, W.G. and BABIN, B.J. 2010. Exploring Marketing Research. 10th edn.Thomson,.Mason, OH. �
�
312 VOLUME 117

The Journal of the Southern African Institute of Mining and Metallurgy MARCH 2017 svii
20 April 2017 — Proximity Detection and Collision AvoidanceSystems in Mining Colloquium 2017Striving for zero harm from mining mobile machineryEmperors Palace, Hotel Casino Convention Resort, JohannesburgContact: Camielah JardineTel: +27 11 834-1273/7, Fax: +27 11 838-5923/833-8156 E-mail: [email protected],Website: http://www.saimm.co.za9–12 May 2017 — 6th Sulphur and Sulphuric Acid 2017 ConferenceSouthern Sun Cape Sun, Cape TownContact: Camielah JardineTel: +27 11 834-1273/7, Fax: +27 11 838-5923/833-8156 E-mail: [email protected], Website: http://www.saimm.co.za20–27 May 2017 — ALTA 2017 Nickel-Cobalt-Copper,Uranium-REE and Gold-PM Conference and ExhibitionPan Pacific Perth, AustraliaContact: Allison TaylorTel: +61 (0) 411 692 442 E-mail: [email protected]: http://www.altamet.com.au/conferences/alta-2017/6–7 June 2017 —Mine Planning Colloquium 2017Mintek, Randburg, South AfricaContact: Camielah JardineTel: +27 11 834-1273/7, Fax: +27 11 838-5923/833-8156 E-mail: [email protected], Website: http://www.saimm.co.za7–8 June 2017 —AIMS - Aachen International MiningSymposia Second International Conference: Mining in EuropeAachen, GermanyContact: Iris SchümmerTel: +49-(0) 241-80 95673, Fax: +49-(0) 241-80 92272 E-mail: [email protected]: http://www.aims.rwth-aachen.de19–20 June 2017 —Chrome Colloquium 2017What’s next for Chrome? A debate on the tough questionsMintek, Randburg, South AfricaContact: Camielah JardineTel: +27 11 834-1273/7, Fax: +27 11 838-5923/833-8156 E-mail: [email protected], Website: http://www.saimm.co.za25–28 June 2017 — Emc 2017: European MetallurgicalConferenceLeipzig, GermanyContact: Paul-Ernst-StraßeTel: +49 5323 9379-0, Fax: +49 5323 9379-37E-mail: [email protected], Website: http://emc.gdmb.de
27–29 June 2017 —4th Mineral Project Valuation ColloquiumMine Design Lab, Chamber of Mines Building, The University of the Witwatersrand, JohannesburgContact: Camielah JardineTel: +27 11 834-1273/7, Fax: +27 11 838-5923/833-8156 E-mail: [email protected],Website: http://www.saimm.co.za10–11 July 2017 — Water 2017 ConferenceLifeblood of the Mining IndustryEmperors Palace, Hotel Casino Convention Resort, JohannesburgContact: Camielah JardineTel: +27 11 834-1273/7, Fax: +27 11 838-5923/833-8156 E-mail: [email protected],Website: http://www.saimm.co.za
25–26 July 2017 — Entrepreneurship in Mining ForumA Focus on new Business in the Value ChainJohannesburgContact: Camielah JardineTel: +27 11 834-1273/7, Fax: +27 11 838-5923/833-8156 E-mail: [email protected], Website: http://www.saimm.co.za
3–4 August 2017 — Building a Robust Mineral IndustryThriving under prolonged low commodity price environmentMandel Training Centre, Marlborough, HarareContact: Camielah JardineTel: +27 11 834-1273/7, Fax: +27 11 838-5923/833-8156 E-mail: [email protected],Website: http://www.saimm.co.za
7–9 August 2017 —Rapid Underground Mine & Civil AccessConference 2017Emperors Palace, Hotel Casino Convention Resort, JohannesburgContact: Camielah JardineTel: +27 11 834-1273/7, Fax: +27 11 838-5923/833-8156 E-mail: [email protected], Website: http://www.saimm.co.za15–16 August 2017 —The SAMREC and SAMVAL CodesAdvanced Workshop: Can you face your peers?Emperors Palace, Hotel Casino Convention Resort, JohannesburgContact: Camielah JardineTel: +27 11 834-1273/7, Fax: +27 11 838-5923/833-8156 E-mail: [email protected],Website: http://www.saimm.co.za
22–24 August 2017 — The biennial Southern African CoalProcessing Society Conference and Exhibition‘Coal Processing – the key to profitability’Graceland Hotel, Casino and Country Club, SecundaContact: Gerda Craddock, Tel: +27 11 432-8918, E-mail:[email protected], Website: www.sacoalprep.co.za30 August–1 September 2017 — MINESafe Conference 2017Striving for Zero Harm—Driving Excellence through ComplianceEmperors Palace, Hotel Casino Convention Resort, JohannesburgContact: Camielah JardineTel: +27 11 834-1273/7, Fax: +27 11 838-5923/833-8156 E-mail: [email protected],Website: http://www.saimm.co.za11–15 September 2017 — Uranium 2017 InternationalConference Extraction and Applications of Uranium — Present and FutureSwakopmund Hotel, Swakopmund, NamibiaContact: Camielah JardineTel: +27 11 834-1273/7, Fax: +27 11 838-5923/833-8156 E-mail: [email protected],Website: http://www.saimm.co.za30 September–6 October 2017 — AfriRock 2017: ISRMInternational Symposium—Rock Mechanics for AfricaCape Town Convention Centre, Cape TownContact: Camielah JardineTel: +27 11 834-1273/7, Fax: +27 11 838-5923/833-8156 E-mail: [email protected],Website: http://www.saimm.co.za17–20 October 2017 — AMI Precious Metals 2017 The Precious Metals Development Network (PMDN)Protea Hotel Ranch Resort, PolokwaneContact: Camielah JardineTel: +27 11 834-1273/7, Fax: +27 11 838-5923/833-8156 E-mail: [email protected],Website: http://www.saimm.co.za18–20 October 2017 — 7th International Platinum ConferencePlatinum—A Changing IndustryProtea Hotel Ranch Resort, PolokwaneContact: Camielah JardineTel: +27 11 834-1273/7, Fax: +27 11 838-5923/833-8156 E-mail: [email protected], Website: http://www.saimm.co.za
25 October 2017 — 14th Annual Student ColloquiumJohannesburgContact: Camielah JardineTel: +27 11 834-1273/7, Fax: +27 11 838-5923/833-8156 E-mail: [email protected], Website: http://www.saimm.co.za
INTERNATIONAL ACTIVITIES
2017

s
viii MARCH 2017 The Journal of the Southern African Institute of Mining and Metallurgy
Company AffiliatesThe following organizations have been admitted to the Institute as Company Affiliates
3M South Africa (Pty) Limited
AECOM SA (Pty) Ltd
AEL Mining Services Limited
Air Liquide (PTY) Ltd
AMEC Foster Wheeler
AMIRA International Africa (Pty) Ltd
ANDRITZ Delkor (Pty) Ltd
Anglo Operations (Pty) Ltd
Arcus Gibb (Pty) Ltd
Aurecon South Africa (Pty) Ltd
Aveng Engineering
Aveng Mining Shafts and Underground
Axis House Pty Ltd
Bafokeng Rasimone Platinum Mine
Barloworld Equipment -Mining
BASF Holdings SA (Pty) Ltd
BCL Limited
Becker Mining (Pty) Ltd
BedRock Mining Support Pty Ltd
Bell Equipment Limited
Blue Cube Systems (Pty) Ltd
CDM Group
CGG Services SA
Concor Mining
Concor Technicrete
Cornerstone Minerals Pty Ltd
Council for Geoscience Library
Cronimet Mining Processing SA (Pty) Ltd
CSIR Natural Resources and theEnvironment (NRE)
Data Mine SA
Department of Water Affairs and Forestry
Digby Wells and Associates
DRA Mineral Projects (Pty) Ltd
DTP Mining - Bouygues Construction
Duraset
Elbroc Mining Products (Pty) Ltd
eThekwini Municipality
Expectra 2004 (Pty) Ltd
Exxaro Coal (Pty) Ltd
Exxaro Resources Limited
Filtaquip (Pty) Ltd
FLSmidth Minerals (Pty) Ltd
Fluor Daniel SA (Pty) Ltd
Franki Africa (Pty) Ltd-JHB
Fraser Alexander Group
Geobrugg Southern Africa (Pty) Ltd
Glencore
Goba (Pty) Ltd
Hall Core Drilling (Pty) Ltd
Hatch (Pty) Ltd
Herrenknecht AG
HPE Hydro Power Equipment (Pty) Ltd
IMS Engineering (Pty) Ltd
Ivanhoe Mines SA
Joy Global Inc.(Africa)
Kudumane Manganese Resources
Leco Africa (Pty) Limited
Longyear South Africa (Pty) Ltd
Lonmin Plc
Magotteaux (Pty) Ltd
MBE Minerals SA Pty Ltd
MCC Contracts (Pty) Ltd
MD Mineral Technologies SA (Pty) Ltd
MDM Technical Africa (Pty) Ltd
Metalock Engineering RSA (Pty) Ltd
Metorex Limited
Metso Minerals (South Africa) Pty Ltd
MineRP Holding (Pty) Ltd
Mintek
MIP Process Technologies (Pty) Ltd
MSA Group (Pty) Ltd
Multotec (Pty) Ltd
Murray and Roberts Cementation
Nalco Africa (Pty) Ltd
Namakwa Sands (Pty) Ltd
Ncamiso Trading (Pty) Ltd
New Concept Mining (Pty) Limited
Northam Platinum Ltd - Zondereinde
PANalytical (Pty) Ltd
Paterson & Cooke Consulting Engineers(Pty) Ltd
Perkinelmer
Polysius A Division Of ThyssenkruppIndustrial Sol
Precious Metals Refiners
Rand Refinery Limited
Redpath Mining (South Africa) (Pty) Ltd
Rocbolt Technologies
Rosond (Pty) Ltd
Royal Bafokeng Platinum
Roytec Global Pty Ltd
RungePincockMinarco Limited
Rustenburg Platinum Mines Limited
Salene Mining (Pty) Ltd
Sandvik Mining and Construction Delmas(Pty) Ltd
Sandvik Mining and Construction RSA(Pty)Ltd
SANIRE
Schauenburg(Pty) Ltd
SENET (Pty) Ltd
Senmin International (Pty) Ltd
Smec South Africa
SMS group Technical Services South Africa(Pty) Ltd
Sound Mining Solution (Pty) Ltd
South 32
SRK Consulting SA (Pty) Ltd
Technology Innovation Agency
Time Mining and Processing (Pty) Ltd
Tomra (Pty) Ltd
Ukwazi Mining Solutions (Pty) Ltd
Umgeni Water
Webber Wentzel
Weir Minerals Africa
WorleyParsons RSA (Pty) Ltd

2017� COLLOQUIUM
Proximity Detection and Collision Avoidance Systems Colloquium 201720 April 2017, Emperors Palace, Hotel Casino Convention Resort, Johannesburg
� CONFERENCE6th Sulphur and Sulphuric Acid 2017 Conference9–12 May 2017, Southern Sun Cape Sun, Cape Town
� COLLOQUIUMMine Planning Colloquium 20176–7 June 2017, Mintek, Randburg
� COLLOQUIUMChrome Colloquium 201719–20 June 2017, Mintek, Randburg
� COLLOQUIUM4th Mineral Project Valuation Colloquium27–29 June 2017, Mine Design Lab, Chamber of Mines Building, The University of theWitwatersrand, Johannesburg
� CONFERENCEWater 2017: Lifeblood of the Mining Industry Conference 201710–11 July 2017, Emperors Palace, Hotel Casino Convention Resort, Johannesburg
� FORUMEntrepreneurship in Mining Forum25–26 July 2017, Johannesburg
� CONFERENCEBuilding a Robust Mineral Industry3–4 August 2017, Mandel Training Centre, Marlborough, Harare
� CONFERENCERapid Underground Mine & Civil Access 2017 Conference7–9 August 2017, Emperors Palace, Hotel Casino Convention Resort, Johannesburg
� WORKSHOPThe SAMREC and SAMVAL Codes—Advanced Workshop: Can you face your peers?15–16 August 2017, Emperors Palace, Hotel Casino Convention Resort, Johannesburg
� CONFERENCEMINESafe Conference 201730 August–1 September 2017, Emperors Palace, Hotel Casino Convention Resort,Johannesburg
� CONFERENCEUranium 2017 International Conference11–15 September 2017, Swakopmund Hotel, Swakopmund, Namibia
� SYMPOSIUMAfriRock 2017: ISRM International Symposium ‘Rock Mechanics for Africa’30 September–6 October 2017, Cape Town Convention Centre, Cape Town
� CONFERENCEAMI Precious Metals 2017 ‘The Precious Metals Development Network (PMDN)’17–20 October 2017, Protea Hotel Ranch Resort, Polokwane
� CONFERENCE7th International Platinum Conference18–20 October 2017, Protea Hotel Ranch Resort, Polokwane
� COLLOQUIUM14th Annual Student Colloquium25 October 2017, Johannesburg
SAIMM DIARY
For further information contact:Conferencing, SAIMM
P O Box 61127, Marshalltown 2107Tel: (011) 834-1273/7
Fax: (011) 833-8156 or (011) 838-5923E-mail: [email protected]
For the past 123 years, theSouthern African Institute ofMining and Metallurgy, has
promoted technical excellencein the minerals industry. Westrive to continuously stay at thecutting edge of newdevelopments in the mining andmetallurgy industry. The SAIMMacts as the corporate voice forthe mining and metallurgyindustry in the South Africaneconomy. We activelyencourage contact andnetworking between membersand the strengthening of ties.The SAIMM offers a variety ofconferences that are designedto bring you technicalknowledge and information ofinterest for the good of theindustry. Here is a glimpse ofthe events we have lined up for2017. Visit our website for moreinformation.
EXHIBITS/SPONSORSHIP
Companies wishing to sponsor
and/or exhibit at any of these
events should contact theconference co-ordinator
as soon as possible

MIP Process Technologies
topline
MIP Process is one of few Level 1 BEE Contributors in the industry they serve. We are proud of this and have strategies in place
In order to strengthen the staff complement, a General Manager was appointed together with experienced engineers
proved to be successful if one looks at the amount of repeat customers we have, says Hoff.
MIP Process has executed numerous projects outside the
MIP recently supplied an order for counter-current decantation (CCD) thickeners for a Copper Project in the DemocraticRepublic of Congo, which has expanded MIP’s thickenersolutions offering.
2013, enhanced MIP’s product range and they offer the
dry cyclones.
plants, for the removal of sulphur dioxide, was recently supplied for two different Copper/Cobalt projects in the DRC.
A contract for the supply of a taphole extraction system, for
presently being executed.
MIP Process will be exhibiting at Electra Mining again in 2016.
and is one of the biggest of its kind in the world. “MIP Process
THE
matters…of an upswing in the market.
Our Current product range includes:
- Agitators
- Cyclones for dust extraction- Depressant Pumps
- Mixers- Reagent Make-up Plants
This has been one of the key pillars of the success of MIP Process during the last few years. We are able to maximise our resources and
says Philip Hoff, Managing Director
MIP Process Technologies (Pty) Ltd.