Volume XXVII Number 3 2015 - Chiriotti Editori
139
ISSN 1120-1770 Volume XXVII Number 3 2015
-
Upload
khangminh22 -
Category
Documents
-
view
1 -
download
0
Transcript of Volume XXVII Number 3 2015 - Chiriotti Editori

ISSN 1120-1770
Volume XXVIINumber 3
2015

REVIEW
Ital. J. Food Sci., vol. 27 - 2015 277
- Keywords: molecular distillation, purification, separation, short-path, vacuum -
APPLICATIONS OF MOLECULAR DISTILLATION TECHNIQUE
IN FOOD PRODUCTS
O. KETENOgLU* and A. TEKINDepartment of Food Engineering, Ankara University, Diskapi 06110, Ankara, Turkey
*Corresponding author: Tel. +90 312 2033300/3642, Fax +90 312 3178711,email: [email protected]
AbStrAct
there are several separation techniques -including conventional distillation- for extracting heat sensitive compounds from food products. However, some compounds may have high boiling points at which other compounds might be adversely affected. Vacuum application is also need-ed for such kinds of foods. Molecular distillation is an advanced vacuum distillation method per-formed by short-path evaporators. Distance between evaporator and condenser is extremely re-duced which results in minimized pressure drop. Heat sensitive material meets heat for a short time under high vacuum, thus low or no decomposition occurs. this review aims to discuss the basics and uses of molecular distillation in foods.
278 Ital. J. Food Sci., vol. 27 - 2015
INtroDuctIoN
Distillation is a simple physical separation process of liquid mixtures based on differenc-es in boiling points of components in the mix-ture. Very first usage of distillation dates back to 1st century (ForbeS, 1970). Further experi-ments leaded to new knowledge that is known as fundamentals of distillation now. In 1830, Aeneas coffey - an Irish inventor - patented his distillation column (GAISer et al., 2002). cof-fey’s column (a.k.a “continuous still”, “patent still” or “coffey still”) achieved to reach higher concentrations of alcohol. In 20th century, some special distillation equipments and techniques were produced in correlation with increasing in-novations in petrochemical industry. especial-ly in chemical and food research, demand for extracting compounds with high purity leaded to development of computer aided systems. to-day, several distillation techniques are present for various purposes. Appropriate distillation method should be chosen depending on prop-erties of liquid mixture and distillation equip-ment. Some of the specific distillation methods could be listed as:• repeated evaporation-condensation cycles,
known as fractional distillation.• Steam distillation of heat sensitive materials
(Harwood and Moody, 1989)• Vacuum distillation of heat sensitive materi-
als under reduced pressure.• reactive distillation• Azeotropic distillation• extractive distillation• catalytic distillation• Molecular distillation, an advanced vacuum
distillation method.
General information on molecular distillation
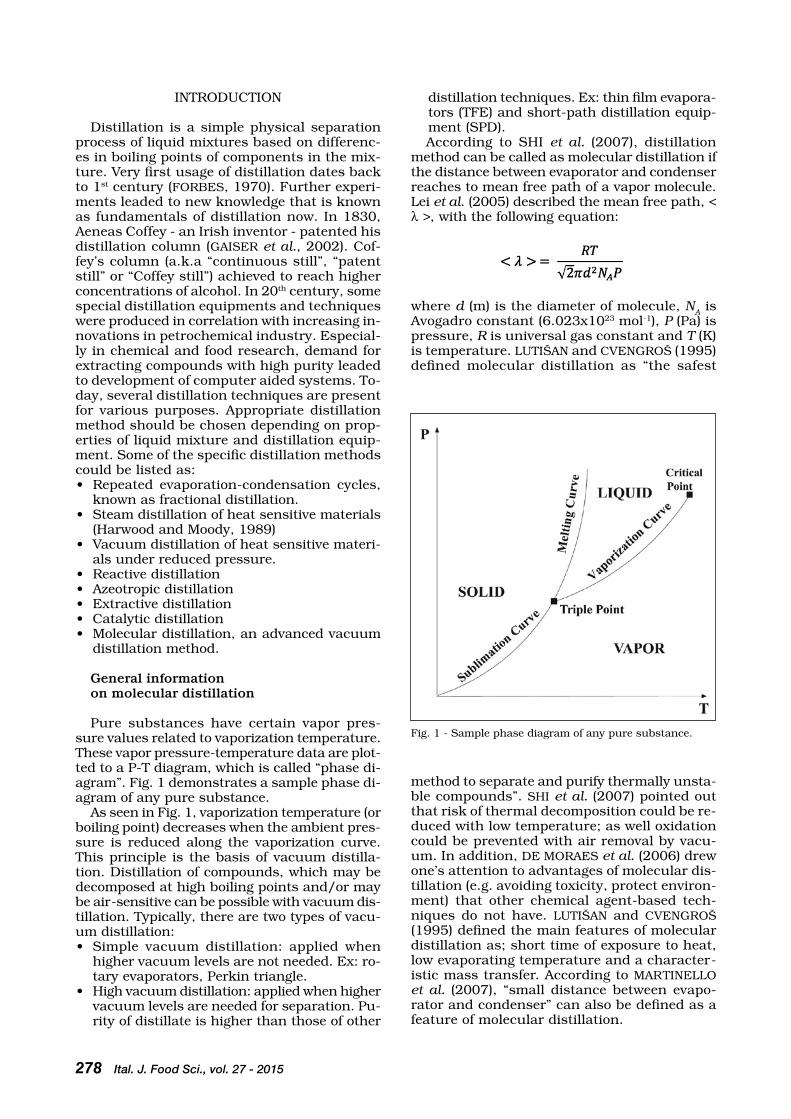
Pure substances have certain vapor pres-sure values related to vaporization temperature. these vapor pressure-temperature data are plot-ted to a P-t diagram, which is called “phase di-agram”. Fig. 1 demonstrates a sample phase di-agram of any pure substance.
As seen in Fig. 1, vaporization temperature (or boiling point) decreases when the ambient pres-sure is reduced along the vaporization curve. this principle is the basis of vacuum distilla-tion. Distillation of compounds, which may be decomposed at high boiling points and/or may be air-sensitive can be possible with vacuum dis-tillation. typically, there are two types of vacu-um distillation:• Simple vacuum distillation: applied when
higher vacuum levels are not needed. ex: ro-tary evaporators, Perkin triangle.
• High vacuum distillation: applied when higher vacuum levels are needed for separation. Pu-rity of distillate is higher than those of other
distillation techniques. ex: thin film evapora-tors (tFe) and short-path distillation equip-ment (SPD).According to SHI et al. (2007), distillation
method can be called as molecular distillation if the distance between evaporator and condenser reaches to mean free path of a vapor molecule. Lei et al. (2005) described the mean free path, < λ >, with the following equation:
where d (m) is the diameter of molecule, NA is
Avogadro constant (6.023x10²³ mol-1), P (Pa) is pressure, R is universal gas constant and T (K) is temperature. LutIšAN and cVeNGroš (1995) defined molecular distillation as “the safest
Fig. 1 - Sample phase diagram of any pure substance.
method to separate and purify thermally unsta-ble compounds”. SHI et al. (2007) pointed out that risk of thermal decomposition could be re-duced with low temperature; as well oxidation could be prevented with air removal by vacu-um. In addition, De MorAeS et al. (2006) drew one’s attention to advantages of molecular dis-tillation (e.g. avoiding toxicity, protect environ-ment) that other chemical agent-based tech-niques do not have. LutIšAN and cVeNGroš (1995) defined the main features of molecular distillation as; short time of exposure to heat, low evaporating temperature and a character-istic mass transfer. According to MArtINeLLo et al. (2007), “small distance between evapo-rator and condenser” can also be defined as a feature of molecular distillation.

Ital. J. Food Sci., vol. 27 - 2015 279
HIGH VAcuuM AND MoLecuLAr DIStILLAtIoN equIPMeNt
there are typically two types of evaporators used in high vacuum distillation, i.e. thin film evaporators (tFe) and short-path evaporators (SPe). these equipments have similar designs with few differences. In both evaporators, feed is agitated with a rotor-wiper system and high vac-uum is produced by vacuum pumps. In tFe, op-erating pressure can be reduced to 1-100 mbar (uIc GmbH, 2014) and there is no other unit be-tween vacuum and condenser (PILoDISt, 2014). Fig. 2 shows an illustration of a tFe.
In SPe, condenser is placed in the centre of evaporator unit, so distance between boiling and condensation surface is extremely reduced and pressure drop is minimized. the operating pressure can be reduced up to 0.001 mbar. Dis-tillation performed by a short-path evaporator is also called as “molecular distillation” (buss-SMS-canzler GmbH, 2014a; buss-SMS-canzler GmbH, 2014b; PILoDISt, 2014; tecHNoForce, 2014). Fig. 3 shows an illustration of a SPe.
there are many parameters that can affect distillation yield and molecular evaporation rate. Molecular evaporation rate, k
i, can be cal-
culated by Langmuir-Knudsen equation (roS-SI et al., 2011):
where tS is evaporation temperature, R is uni-versal gas constant, M
i is molecular weight of
evaporating component and Pvi is vapor pres-sure of component. Xu et al. (2002) describes the most important parameters of molecular distil-lation as evaporator temperature, flow rate, vac-uum and wiper speed. Flow rate has an impor-tant effect on the contact time of the molecules with hot surface during evaporation. Higher flow rates reduce the residence times of molecules being vaporized. Wiper speed affects film thick-ness and viscosity. Feed becomes highly tur-bulent with intensive agitation, which leads to high heat transfer coefficients (buss-SMS-can-zler GmbH, 2014c).
MoLecuLAr DIStILLAtIoN IN FooD ProceSSING: SoMe eXAMPLeS
oF receNt StuDIeS
Molecular distillation has many application areas in food industry. Some of these applica-tions can be summarized as but not limited to: concentration of ω-3 fatty acids, distillation of monoglycerides from di- and triglycerides, con-centration of tocopherols and tocotrienols (buss-SMS-canzler GmbH, 2014d), fractionation of squalene (SuN et al., 1997), recovery of carot-
enoids (bAtISteLLA and WoLF-MAcIeL, 1998). As distillation is a separation process, studies about molecular distillation generally focus on either removal of undesired compounds or con-centration of valuable compounds.
Removal of undesired compounds
In a study about removal of cholesterol from butter and lard by using molecular distillation (LANzANI et al., 1994), researchers reported that cholesterol content of lard was reduced from 988 ppm to 105 ppm in the residue after 2 hours of distillation under 10-4 torr pressure and 250oc evaporator temperature.
Molecular distillation can also be used for physical deacidification. MArtINS et al. (2006) separated free fatty acids (FFA) from vegetable oil deodorizer distillate. they achieved to reduce
Fig. 2 - Illustration of a tFe unit.
Fig. 3 - Illustration of a SPD unit.

280 Ital. J. Food Sci., vol. 27 - 2015
FFA content to 6.4% from initial FFA content of raw material with 57.8% at 160oc evaporator temperature, under 10-6 bar pressure and 10.4 g min-1 feed flow rate. they also noted that con-centration of tocopherol in residue stream was found 18.3%, while initial tocopherol concen-tration was 8.97%. FFA elimination was 96.16% and tocopherol recovery was found 81.23%.
WANG et al. (2010) aimed to separate FFAs and diacylglycerols (DAG) from enzimatically hydro-lyzed soybean oil. they achieved to increase the removal of FFAs from 88.8% to 99.44% by in-creasing evaporator temperature from 125oc to 160oc, under 0.5-1.0 Pa process pressure, 200 mL h-1 feed rate and 300 rpm wiper speed.
oLLI et al. (2013) studied removal of organic pol-lutants in fish oils. their SPD system, which has an evaporator temperature of approx. 220oc and operating pressure below 0.03 mbar, achieved to remove total amount of chlorinated pesticides (some of them are DDt and HcH) from 215.07 ng g-1 to 21.95 ng g-1, corresponding to 89% reduction.
According to Meyer et al. (2011), total pesti-cide traces in rapeseed deodorizer distillate were dropped below 0.05 mg kg-1 from an initial content of 0.968 mg kg-1 by achieving more than 94.8% reduction. SPD evaporator temperature was set to 110oc, feed flow rate was 200 mL h-1 and pres-sures were between 0.006 and 0.01 mbar. re-searchers stated that it would be a mistake to affirm that all types of pesticides were removed by using SPD according to this reduction data, because many different types of pesticides might be present before distillation and analysis of ef-fects on specific compounds has to be performed.
Concentration and/or fractionation of compounds
bAtISteLLA and WoLF-MAcIeL (1998) studied the recovery of carotenoids from palm oil by us-ing a molecular distillator and after a set of dis-tillation trials, they achieved to increase caro-tene concentration to 19500 ppm from an ini-tial feed concentration of 600 ppm under 9x10⁻⁵
torr pressure and 170oc evaporator temperature.SuN et al. (1997) fractionated squalene from
alkali-refined amaranth seed oil and their high-est recovery of squalene was 67.8% with SPD conditions of 100 mtorr pressure and 180oc dis-tillation temperature.
campos et al. (2003) fractionated milk fat by SPD and recorded distillate yields (w/w) as a function of temperature. they observed that distillate yield was 0.3% at 125oc process tem-perature; however a 42.7% recovery was ob-served when process temperature was increased to 250oc, which meant a significant and posi-tive effect of temperature on process efficiency.
SPD was performed on lemongrass essential oil by toVAr et al. (2011) and researchers report-ed that they were able to increase citral concen-tration in distillate stream from 17.658 mg mL-1
to 33.576 mg mL-1 when evaporator temperature was increased from 60oc to 120oc with a feed flow rate of 1.5 mL min-1 and pressure of 5 Pa.
Mono and diglyceride (MDG) concentration and production are also possible with molecular distillation. FreGoLeNte et al. (2010) produced partial glycerides from soybean oil by using mo-lecular distillation. concentration of monoglyc-eride (MG) in distillate stream increased with el-evated evaporator temperature. At 250oc with 10 mL min-1 feed flow rate, MG concentration was increased from initial feed value of 12.75% to 80.00% in distillate stream under 24 Pa op-erating pressure. they also pointed that lower flow rate increased recovery of MG, because mol-ecules contacted with hot evaporator surface for a longer period of time. recovery for any compo-nent is defined with following equation:
zHANG et al. (2013) studied effects of evapo-ration temperature, feeding rate, feeding tem-perature and wiper speed on concentration of ω-3 fatty acids by molecular distillation and optimized these parameters with response sur-face methodology (rSM). researchers reported the optimum conditions as 110.4oc evaporator temperature, 78.7 mL h-1 feeding rate, 350 rpm wiper speed, 10 Pa operating pressure and 80oc feed temperature.
coNcLuSIoNS
Separation techniques such as extraction, evap-oration, distillation etc. are accepted as unit op-erations in food industry. Vacuum distillation is frequently used both in chemical and food indus-tries; however simple vacuum distillation might not be capable of separation of heat-sensitive ma-terials from food products. In that case, molecu-lar distillation (short-path distillation) should be used for separation of these materials. Molecular distillation has been used more in pharmaceu-tical, chemical and petrochemical applications, but nowadays importance of molecular distilla-tion has increasingly been understood in food in-dustry. Separation, concentration and purifica-tion of commercially valuable food constituents can be easily performed by molecular distillation; furthermore, healthier food products can be pro-duced by removal of some health damaging com-pounds such as excess cholesterol, organic pol-lutants. Authors expect an increasing trend in us-age of molecular distillation in food industry when taking all these applications into consideration.
AcKNoWLeDGeMeNtS
this review article has not been funded by any organization.

Ital. J. Food Sci., vol. 27 - 2015 281
reFereNceS
batistella c.b. and Wolf-Maciel M.r.1998. recovery of ca-rotenoids from palm oil by molecular distillation. com-puters & chemical engineering 22(Supplement 1): S53-S60.
buss-SMS-canzler GmbH. Molecular Distillation. Availa-ble at: http://www.sms-vt.com/en/technologies/short-path-evaporator/molecular-distillation.html (accessed 20 May 2014a).
buss-SMS-canzler GmbH. Short Path evaporator. Available at: http://www.sms-vt.com/en/technologies/short-path-evaporator.html (accessed 20 May 2014b).
buss-SMS-canzler GmbH. General Description of thin Film Distillation. Available at: http://www.sms-vt.com/en/technologies/thin-film-evaporator/thin-film-distillation.html (accessed 20 May 2014c).
buss-SMS-canzler GmbH. typical applications of short path distillation. Available at: http://www.sms-vt.com/en/technologies/short-path-evaporator/typical-applica-tions.html (accessed 20 May 2014d).
campos r.J., Litwinenko J.W. and Marangoni A.G. 2003. Fractionation of milk fat by short-path distillation. Jour-nal of Dairy Science 86(3): 735-745.
De Moraes e.b., Martins P.F., batistella c.b., Alvarez M.e.t., Maciel Filho r. and Wolf-Maciel M.r. 2006. Molecular dis-tillation. Applied biochemistry and biotechnology 132(1-3): 1066-1076.
Forbes r.J. 1970.A Short History of the Art of Distilla-tion: From the beginnings up to the Death of cellier blu-menthal.brill:the Netherlands, pp. 57, 89.
Fregolente P.b.L., Pinto G.M.F., Wolf-Maciel M.r. and Ma-ciel Filho r.2010. Monoglyceride and diglyceride produc-tion through lipase-catalyzed glycerolysis and molecu-lar distillation. Applied biochemistry and biotechnology 160(7): 1879-1887.
Gaiser M., bell G.M., Lim A.W., roberts N.A., Faraday D.b.F., Schulz r.A. and Grob r. 2002.computer simulation of a continuous whisky still. Journal of Food engineering 51(1): 27-31.
Harwood L.M. and Moody c.J. 1989.experimental organ-ic chemistry: Principles and Practice.blackwell Scientif-ic Publications:oxford, pp. 151-153.
Lanzani A., bondioli P., Mariani c., Folegatti L., Venturini S., Fedeli e. and barreteau P. 1994. A new short-path dis-tillation system applied to the reduction of cholesterol in butter and lard. Journal of the American oil chemists’ Society 71(6):609-614.
Lei z., chen b. and Ding z. 2005.Special Distillation Pro-cesses (1st ed.).elsevier b.V.: the Netherlands, p. 350.
Lutišan J. and cvengroš J.1995.Mean free path of mole-cules on molecular distillation. the chemical engineer-ing Journal and the biochemical engineering Journal 56(2): 39-50.
Martinello M., Hecker G. and carmen Pramparo M.d. 2007. Grape seed oil deacidification by molecular distillation: Analysis of operative variables influence using the re-
sponse surface methodology. Journal of Food engineer-ing 81(1): 60-64.
Martins P.F., Ito V.M., batistella c.b. and Wolf-Maciel M.r. 2006. Free fatty acid separation from vegetable oil deodor-izer distillate using molecular distillation process. Sepa-ration and Purification technology 48(1): 78-84.
Meyer F., eggers r., oehlke K., Harbaum-Piayda b., Schwarz K. and Siddiqi M.A. 2011. Application of short path dis-tillation for recovery of polyphenols from deodorizer dis-tillate. european Journal of Lipid Science and technol-ogy 113(11): 1363-1374.
olli J.J., breivik H. and thorstad o. 2013. removal of per-sistent organic pollutants in fish oils using short-path distillation with a working fluid.chemosphere 92(3): 273-278.
Pilodist. thin-Film-evaporation. Available at: http://www.pilodist.de/distillation-by-thin-film-evaporation (accessed 21 May 2014).
rossi P.c., carmen Pramparo M.d., Gaich M.c., Grosso N.r. and Nepote V. 2011. optimization of molecular distilla-tion to concentrate ethyl esters of eicosapentaenoic (20 : 5 ω-3) and docosahexaenoic acids (22 : 6 ω-3) using sim-plified phenomenological modeling. Journal of the Science of Food and Agriculture 91(8): 1452-1458.
Shi J., Posada L.r., Kakuda y. and Xue S.J. 2007. Molecu-lar distillation of palm oil distillates: evaporation rates, relative volatility, and distribution coefficients of tocot-rienols and other minor components. Separation Science and technology 42(14): 3029-3048.
Sun H., Wiesenborn D., tostenson K., Gillespie J. and rayas-Duarte P.1997.Fractionation of squalene from am-aranth seed oil.Journal of the American oil chemists’ So-ciety.74(4):413–418.
technoforce. Short Path (Molecular) Distillation units. Avail-able at: http://www.technoforce.net/short-path-molecu-lar-distillation-units.html (accessed 18 May 2014).
tovar L.P., Pinto G.M.F., Wolf-Maciel M.r., batistella c.b. and Maciel Filho r. 2011. Short-path-distillation pro-cess of lemongrass essential oil: Physicochemical char-acterization and assessment quality of the distillate and the residue products. Industrial & engineering chemis-try research 50(13): 8185-8194.
uIc GmbH. thin Film evaporation. Available at: http://www.uic-gmbh.de/en/basics/thin-film-evaporation.html (ac-cessed 20 May 2014).
Wang y., zhao M., Song K., Wang L., Han X., tang S. and Wang y. 2010. Separation of diacylglycerols from enzy-matically hydrolyzed soybean oil by molecular distillation. Separation and Purification technology 75(2): 114-120.
Xu X., Jacobsen c., Nielsen N.S., Heinrich M.t. and zhou D. 2002. Purification and deodorization of structured lip-ids by short path distillation. european Journal of Lipid Science and technology 104(11): 745-755.
zhang G.y., Liu J. and Liu y.F. 2013. concentration of ome-ga-3 polyunsaturated fatty acids from oil of Schizochy-trium limacinum by molecular distillation: optimization of technological conditions. Industrial & engineering chemistry research 52(10): 3918-3925.
Paper Received July 7, 2014 Accepted September 23, 2014

PaPer
282 Ital. J. Food Sci., vol. 27 - 2015
- Keywords: antibiotic resistance; Lactobacillus; gastrointestinal tolerance; plasmid; probiotic -
ANTIbIOTIC SUSCEPTIbILITy OF POTENTIALLy PRObIOTIC LactobaciLLus STRAINS
JUNHUA HANa, DAHUAN CHENa, SHANSHAN LIc, XINgFENg LIa, WEN-WEN ZHOUd, bOLIN ZHANgb,*, yINgMIN JIAa,*
aCollege of Biological Science and Engineering, Hebei University of Science and Technology, Shijiazhuang, Heibei, 050018, China
bSchool of Biological Science and Biotechnology, Beijing Forestry University, Beijing, 100083, Chinac Dongcheng District Center For Disease Control And Prevention, Beijing, 100009, China
dSchool of Biosystems Engineering and Food Science, Zhejiang University, Hangzhou Zhejiang, 310058, China
*Corresponding authors:Yingmin Jia, Tel. +86 311 81668010, [email protected]
Bolin Zhang, Tel. +86 10 62338221, [email protected]
AbStrAct
Susceptibility of 29 Lactobacilli to 13 antibiotics was assayed by paper disc diffusion method. Plasmids and gastrointestinal tolerance were detected. the relationship between plasmids and antibiotic resistance was discussed. the results showed that all of the strains were resistant to bacitracin, polymyxin b, kanamycin, and nalidixic acid. Many strains were relatively sensitive to chloramphenicol and tetracycline. Six strains contained plasmids and showed good gastrointesti-nal tolerance. β-lactam resistance gene blr was found in the plasmid of L. plantarum cIcc 23180 by Pcr. the study will be helpful to promote the safety evaluation and development of potential-ly probiotic lactic acid bacteria.

Ital. J. Food Sci., vol. 27 - 2015 283
1. INtroDuctIoN
Due to the claimed benefits, Lactobacillus bacteria are widely used in food, feed, medical and health related fields. Many lactic acid bac-teria (LAb), such as Streptococcus thermophi-lus and Lactobacillus delbruekii subsp. bulga-ricus, have been used safely for a long history. they are agreed to be secure and do not have the possibility of pathogenic. currently, new beneficial bacteria are being developed contin-uously and will enter the market. However, the security of these new strains has caused great concern. evaluation of antibiotic sensitivity is an important part of safety assessment.
Now, overuse of antibiotics has become a serious social problem. this led to the emer-gence of a large number of antibiotic-resistant strains. once the resistance-related factors are tranferred to other microorganisms, especial-ly pathogens via food carrier, it will cause tre-mendous problems. the evolution of antibiotic-resistant foodborne pathogens has been widely reported (tHreLFALL et al., 2000; WALSH et al., 2008; WHIte et al., 2002). Moreover, the resist-ance and resistance-related genes of Bifidobac-terium, Lactobacillus and Pediococcus strains to different antibiotics were studied systematical-ly (HuMMeL et al., 2007; HuyS et al., 2004; MA-rIA et al., 2007). the tetM gene transfer of tet-racycline resistance in Lactobacillus plantar-um among strains was reported by NIAMH et al. (2010).
In this study, 29 Lactobacillus strains isolat-ed from the food environment with potentially probiotic effects (JIN et al., 2009; LI et al., 2009; LIu et al., 2011; SuN et al., 2009; zHAo et al., 2013) were used. these strains were assayed for susceptibility to 13 antibiotics by agar disc dif-fusion method. Furthermore, some strains with higher resistance were analysed for the presence of plasmids. then, the tolerance of the plasmid-containing strains under simulated gastroin-
testinal conditions was investigated. by plas-mid elimination and Pcr, the relationship be-tween the plasmid profiles and resistance pat-terns of the strains was explored. this will pro-vide a reference for the safety evaluation meth-od and also will be helpful to improve the eval-uation system of probiotics.
2. MAterIALS AND MetHoDS
2.1 Bacterial strains and cultivation
29 Lactobacillus strains used in the study were listed in table 1. Lactobacillus strains were cultured in MrS (De Man, rogosa, and Sharpe) medium at 37°c for 18h under anaer-obic condition.
quality control strain recommended by clin-ical and Laboratory Standards Institute (cLSI) in the antibiotic sensitivity test was E. coli Atcc25922 purchased from the Institute of Mi-crobiology, chinese Academy of Sciences. the E. coli Atcc25922 was activated and cultivat-ed in Lb medium (yeast extract 5 g/L, tryptone 10 g/L, Nacl 10 g/L) at 37°c.
2.2 Testing of antibiotic susceptibility
13 kinds of antibiotics paper discs were pur-chased from the National Institute for the con-trol of Pharmaceutical and biological Products (table 2), each piece with a diameter of 6.5 mm. the quality was fully complied with the WHo criteria.
Antibiotic susceptibility was semi-quantita-tively determined with K-b method by antibiot-ic paper disc diffusion referring to the cLSI as described by cHArterIS et al. (1998a).
briefly, 1.0 mL Lactobacillus suspension (ap-proximately 1.5×10⁸ cFu/mL) was added to sterile petri dish with diameter of 90 mm, and then mixed with a 15 mL MH (Muller Hinton, MH) agar (beef extract powder 6g/L, casein ac-
table 1 - Source of the tested strains for antibiotic susceptibility test.
Species Source (original number)
Lactobacillus plantarum CICCa 23124 (L11), CICC 23131 (B31), CICC 23135 (B37), CICC 22195 (C35), CICC 23166 (ZJ1), CICC 23138 (C8-1), CICC 23180 (CH8)Lactobacillus rhamnosus CICC 23119 (1132), CICC 22175 (LL), ATCCb 7469, CICC 22151 (LK-Mt), CICC 22173 (R11)Lactobacillus salivarius CICC 23182 (CH-10)Lactobacillus acidophilus CICC 22162 (CH-2)Lactobacillus casei CICC 23184 (Y5-2b)Lactobacillus helveticus CICC 22154 (LLB)Lactobacillus pentosus CICC 23116 (SN23), CICC 22161 (Lp-4), CICC 22160 (Lp-5), CICC 22159 (Lp-B), CICC 22156 (Ind-3), CICC 22157 (Lp-A)Lactobacillus paralimentarius CICC 22148 (412), CICC 22149 (413)Lactobacillus delbrueckii CICC 22153 (LB), CICC 22163 (LC)Lactobacillus paracasei CICC 22165 (5M1), CICC 22167 (5M7), CICC 23183 (D-400)
aCICC, China center of industrial culture collection. bATCC, American type culture collection.
284 Ital. J. Food Sci., vol. 27 - 2015
ids hydrolysate 17.5 g/L, soluble starch, 1.5 g/L, agar 17 g/L, pH 7.3±0.1) until the medi-um solidified. the antibiotic paper discs were pasted closely onto the solidified medium with sterile tweezers after 5min at room temper-ature. three discs were pasted in each dish. the distance was more than 24 mm of each disc center and more than 15 mm from disc edge to the inner edge of dish. Next, the dishes were placed at room temperature for 1.5 h and then incubated at 37°c. After 24 h, the inhibi-tion zone diameter was measured around the antibiotic disc with vernier caliper and record-ed. For one tested strain, each antibiotic disc was done 3 times. the inhibition zone diame-ter was averaged
Standard sensitive strain of E. coli Atcc25922 was used as the control. the operation was the same as the above.
the antibiotic susceptibility of the tested strains was evaluated according to the cLSI cri-teria (table 2).
2.3 Plasmid DNA extraction
10 mL of Lactobacillus suspension cultured overnight was centrifugated at 10000 rpm for 5 min. then the precipitation was suspended with 500 μL of lysozyme solution (10 mg/mL). the mixture was placed in a water bath for 45 min at 37°c. then plasmid DNA of Lactobacilli strains was extracted and purified with DNA ex-traction and purification kit of tiangen biotech (beijing) co., LtD. Plasmid DNA was observed by agarose gel electrophoresis.
Antibiotic susceptibility and plasmid stabil-ity were tested after cultivated 30 generations at 37°c in MrS medium according to the above methods.
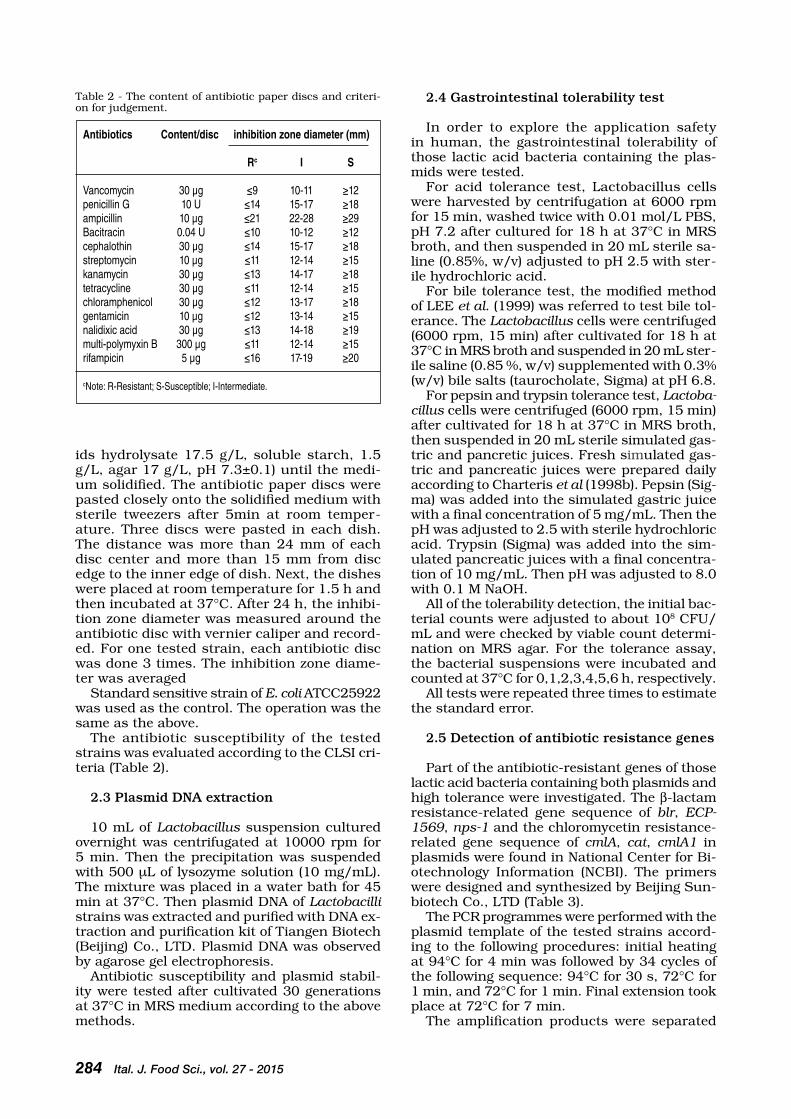
table 2 - the content of antibiotic paper discs and criteri-on for judgement.
Antibiotics Content/disc inhibition zone diameter (mm)
Rc I S
Vancomycin 30 μg ≤9 10-11 ≥12penicillin G 10 U ≤14 15-17 ≥18ampicillin 10 μg ≤21 22-28 ≥29Bacitracin 0.04 U ≤10 10-12 ≥12cephalothin 30 μg ≤14 15-17 ≥18streptomycin 10 μg ≤11 12-14 ≥15kanamycin 30 μg ≤13 14-17 ≥18tetracycline 30 μg ≤11 12-14 ≥15chloramphenicol 30 μg ≤12 13-17 ≥18gentamicin 10 μg ≤12 13-14 ≥15nalidixic acid 30 μg ≤13 14-18 ≥19multi-polymyxin B 300 μg ≤11 12-14 ≥15rifampicin 5 μg ≤16 17-19 ≥20
cNote: R-Resistant; S-Susceptible; I-Intermediate.
2.4 Gastrointestinal tolerability test
In order to explore the application safety in human, the gastrointestinal tolerability of those lactic acid bacteria containing the plas-mids were tested.
For acid tolerance test, Lactobacillus cells were harvested by centrifugation at 6000 rpm for 15 min, washed twice with 0.01 mol/L PbS, pH 7.2 after cultured for 18 h at 37°c in MrS broth, and then suspended in 20 mL sterile sa-line (0.85%, w/v) adjusted to pH 2.5 with ster-ile hydrochloric acid.
For bile tolerance test, the modified method of Lee et al. (1999) was referred to test bile tol-erance. the Lactobacillus cells were centrifuged (6000 rpm, 15 min) after cultivated for 18 h at 37°c in MrS broth and suspended in 20 mL ster-ile saline (0.85 %, w/v) supplemented with 0.3% (w/v) bile salts (taurocholate, Sigma) at pH 6.8.
For pepsin and trypsin tolerance test, Lactoba-cillus cells were centrifuged (6000 rpm, 15 min) after cultivated for 18 h at 37°c in MrS broth, then suspended in 20 mL sterile simulated gas-tric and pancretic juices. Fresh simulated gas-tric and pancreatic juices were prepared daily according to charteris et al (1998b). Pepsin (Sig-ma) was added into the simulated gastric juice with a final concentration of 5 mg/mL. then the pH was adjusted to 2.5 with sterile hydrochloric acid. trypsin (Sigma) was added into the sim-ulated pancreatic juices with a final concentra-tion of 10 mg/mL. then pH was adjusted to 8.0 with 0.1 M NaoH.
All of the tolerability detection, the initial bac-terial counts were adjusted to about 108 cFu/mL and were checked by viable count determi-nation on MrS agar. For the tolerance assay, the bacterial suspensions were incubated and counted at 37°c for 0,1,2,3,4,5,6 h, respectively.
All tests were repeated three times to estimate the standard error.
2.5 Detection of antibiotic resistance genes
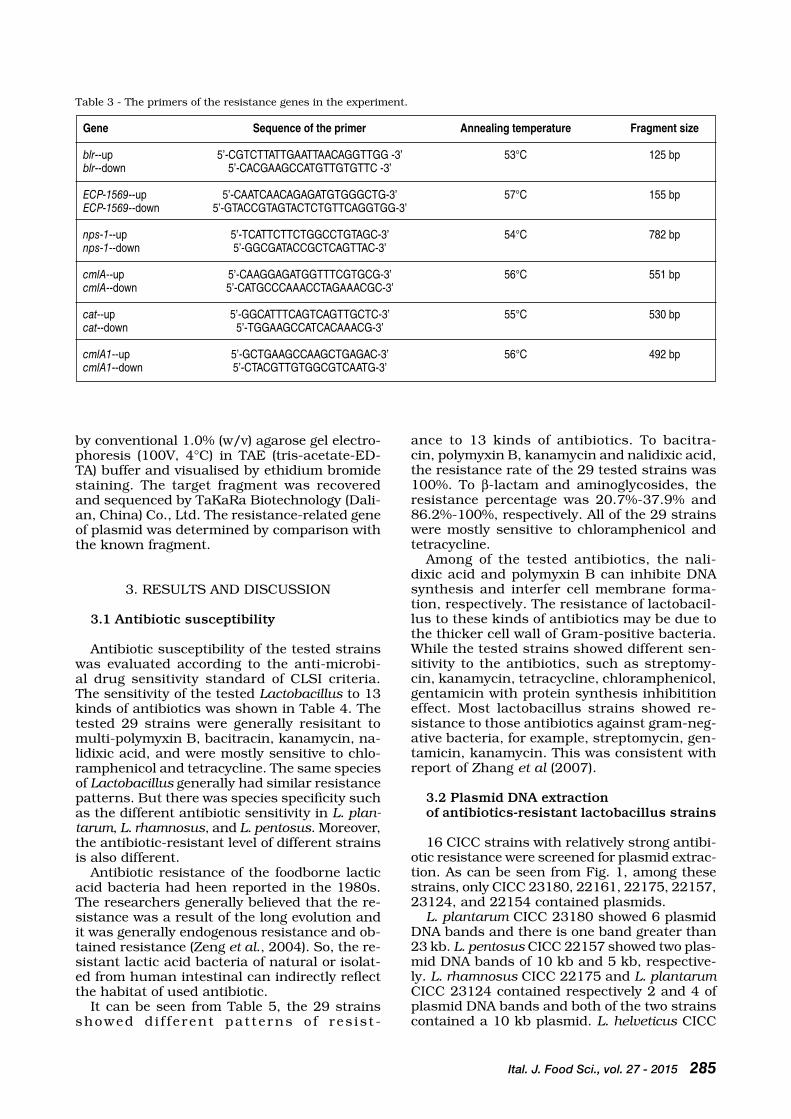
Part of the antibiotic-resistant genes of those lactic acid bacteria containing both plasmids and high tolerance were investigated. the β-lactam resistance-related gene sequence of blr, ECP-1569, nps-1 and the chloromycetin resistance-related gene sequence of cmlA, cat, cmlA1 in plasmids were found in National center for bi-otechnology Information (NcbI). the primers were designed and synthesized by beijing Sun-biotech co., LtD (table 3).
the Pcr programmes were performed with the plasmid template of the tested strains accord-ing to the following procedures: initial heating at 94°c for 4 min was followed by 34 cycles of the following sequence: 94°c for 30 s, 72°c for 1 min, and 72°c for 1 min. Final extension took place at 72°c for 7 min.
the amplification products were separated
Ital. J. Food Sci., vol. 27 - 2015 285
by conventional 1.0% (w/v) agarose gel electro-phoresis (100V, 4°c) in tAe (tris-acetate-eD-tA) buffer and visualised by ethidium bromide staining. the target fragment was recovered and sequenced by taKara biotechnology (Dali-an, china) co., Ltd. the resistance-related gene of plasmid was determined by comparison with the known fragment.
3. reSuLtS AND DIScuSSIoN
3.1 Antibiotic susceptibility
Antibiotic susceptibility of the tested strains was evaluated according to the anti-microbi-al drug sensitivity standard of cLSI criteria. the sensitivity of the tested Lactobacillus to 13 kinds of antibiotics was shown in table 4. the tested 29 strains were generally resisitant to multi-polymyxin b, bacitracin, kanamycin, na-lidixic acid, and were mostly sensitive to chlo-ramphenicol and tetracycline. the same species of Lactobacillus generally had similar resistance patterns. but there was species specificity such as the different antibiotic sensitivity in L. plan-tarum, L. rhamnosus, and L. pentosus. Moreover, the antibiotic-resistant level of different strains is also different.
Antibiotic resistance of the foodborne lactic acid bacteria had heen reported in the 1980s. the researchers generally believed that the re-sistance was a result of the long evolution and it was generally endogenous resistance and ob-tained resistance (zeng et al., 2004). So, the re-sistant lactic acid bacteria of natural or isolat-ed from human intestinal can indirectly reflect the habitat of used antibiotic.
It can be seen from table 5, the 29 strains showed d i f f e rent pat te rns o f res is t -
table 3 - the primers of the resistance genes in the experiment.
Gene Sequence of the primer Annealing temperature Fragment size
blr--up 5’-CGTCTTATTGAATTAACAGGTTGG -3’ 53°C 125 bpblr--down 5’-CACGAAGCCATGTTGTGTTC -3’
ECP-1569--up 5’-CAATCAACAGAGATGTGGGCTG-3’ 57°C 155 bpECP-1569--down 5’-GTACCGTAGTACTCTGTTCAGGTGG-3’
nps-1--up 5’-TCATTCTTCTGGCCTGTAGC-3’ 54°C 782 bpnps-1--down 5’-GGCGATACCGCTCAGTTAC-3’
cmlA--up 5’-CAAGGAGATGGTTTCGTGCG-3’ 56°C 551 bpcmlA--down 5’-CATGCCCAAACCTAGAAACGC-3’
cat--up 5’-GGCATTTCAGTCAGTTGCTC-3’ 55°C 530 bpcat--down 5’-TGGAAGCCATCACAAACG-3’
cmlA1--up 5’-GCTGAAGCCAAGCTGAGAC-3’ 56°C 492 bpcmlA1--down 5’-CTACGTTGTGGCGTCAATG-3’
ance to 13 kinds of antibiotics. to bacitra-cin, polymyxin b, kanamycin and nalidixic acid, the resistance rate of the 29 tested strains was 100%. to β-lactam and aminoglycosides, the resistance percentage was 20.7%-37.9% and 86.2%-100%, respectively. All of the 29 strains were mostly sensitive to chloramphenicol and tetracycline.
Among of the tested antibiotics, the nali-dixic acid and polymyxin b can inhibite DNA synthesis and interfer cell membrane forma-tion, respectively. the resistance of lactobacil-lus to these kinds of antibiotics may be due to the thicker cell wall of Gram-positive bacteria. While the tested strains showed different sen-sitivity to the antibiotics, such as streptomy-cin, kanamycin, tetracycline, chloramphenicol, gentamicin with protein synthesis inhibitition effect. Most lactobacillus strains showed re-sistance to those antibiotics against gram-neg-ative bacteria, for example, streptomycin, gen-tamicin, kanamycin. this was consistent with report of zhang et al (2007).
3.2 Plasmid DNA extraction of antibiotics-resistant lactobacillus strains
16 cIcc strains with relatively strong antibi-otic resistance were screened for plasmid extrac-tion. As can be seen from Fig. 1, among these strains, only cIcc 23180, 22161, 22175, 22157, 23124, and 22154 contained plasmids.
L. plantarum cIcc 23180 showed 6 plasmid DNA bands and there is one band greater than 23 kb. L. pentosus cIcc 22157 showed two plas-mid DNA bands of 10 kb and 5 kb, respective-ly. L. rhamnosus cIcc 22175 and L. plantarum cIcc 23124 contained respectively 2 and 4 of plasmid DNA bands and both of the two strains contained a 10 kb plasmid. L. helveticus cIcc

286 Ital. J. Food Sci., vol. 27 - 2015
table
4 -
th
e se
nsi
tivi
ty r
esu
lts
of 2
9 L
act
oba
cillu
s st
rain
s to
13 a
nti
bio
tics
.
L. p
lantar
um
L. pen
tosus
L. rha
mnos
us
L. sali
varius
L. ac
idoph
ilus
L. case
i L. h
elveti
cus
L. para
casei
L. d
elbrue
ckii
L. para
limen
tarius
CIC
C CIC
C CIC
C CIC
C CIC
C CIC
C CIC
C CIC
C CIC
C CIC
C CIC
C CIC
C CIC
C CIC
C CIC
C AT
CC
CICC
CICC
CICC
CICC
CICC
CICC
CICC
CICC
CICC
CICC
CICC
CICC
CICC
23
166
2313
1 23
180
2313
5 23
124
2313
8 22
195
2216
1 22
157
2216
0 22
159
2215
6 23
116
2217
5 23
119
7469
2215
1 22
173
2318
2 22
162
2318
4 22
154
2216
5 22
167
2318
3 22
153
2216
3 22
148
2214
9
Vanc
omyci
n R
R R
R R
R R
R R
R R
R R
R R
R R
R R
S R
R R
R R
S S
R R
penic
illin G
R
R S
R R
R R
S R
I R
S S
I R
R I
I S
S S
S S
S S
S S
S R
ceph
alothi
n R
R R
R S
S S
I R
I I
S S
R S
I I
I I
I S
S S
S S
S S
I I
Bacitr
acin
R R
R R
R R
R R
R R
R R
R R
R R
R R
R R
R R
R R
R R
R R
Ram
picillin
R
I I
I I
I I
I I
R I
R I
R I
I R
I R
I I
R I
I R
I I
R R
Multip
olymy
sin B
R R
R R
R R
R R
R R
R R
R R
R R
R R
R R
R R
R R
R R
R R
Rstr
eptom
ycin
R R
R R
R R
R R
R R
R R
R R
R R
I R
R R
R R
R R
R R
I R
Rkan
amyci
n R
R R
R R
R R
R R
R R
R R
R R
R R
R R
R R
R R
R R
R R
R R
tetrac
ycline
R
I S
R S
I I
I S
S S
S I
R S
S S
S S
S S
S S
S S
S S
S S
chlor
amph
enico
l I
S R
S S
S S
R S
I I
I I
R S
I I
I I
S I
I S
S S
S S
I S
genta
micin
R
R R
R R
R R
R R
R R
R R
R R
R I
R R
R R
R R
R S
S I
R R
nalidi
xic ac
id R
R R
R R
R R
R R
R R
R R
R R
R R
R R
R R
R R
R R
R R
R R
rifamp
icin
R R
R I
R R
S R
I R
I S
S I
S S
S S
R R
S S
S S
S S
S S
R
table 5 - the percentage of the antibiotic resistance of 29 Lactobacillus strains.
Antibiotics Quantity Percentage of resistant strains of resistance (%)
vancomycin 26 89.7penicillin G 11 37.9cephalothin 6 20.7bacitracin 29 100ampicillin 10 34.5multi-polymyxin B 29 100streptomycin 27 93.1kanamycin 29 100tetracycline 3 10.3chloramphenicol 3 10.3gentamicin 25 86.2nalidixic acid 29 100rifampicin 10 34.5
Fig. 1 - the plasmids in Lactobacillus (1.cIcc 23180, 2.cIcc 22161, 3.cIcc 22175, 4.cIcc 22157, 5.cIcc 23124, 6.cIcc 22154. M. λHindIII marker).
22154 showed only one plasmid DNA band of about 10 kb.
Lactic acid bacteria generally contain plas-mids. the plasmid size was usually 1.9 kb-84.8 kb. Most of the plasmid was less than 20 kb (WANG and Lee, 1997). In the culture process from generation to generation, many plasmids might disappear from the bacterial cell, but most of the plasmids were stable. In the study, the plasmids of the above six strains and the anti-biotic susceptivity showed no changes after cul-tivated 30 generations.
3.3 Gastrointestinal tolerability
resistance to gastrointestinal stress is very important for one strain to play the potential probiotic function (GuGLIeLMottI et al., 2007). If the strains have a high tolerance to gastroin-testinal stress, it will have the chance to sur-vive and play the probiotic effects in the gastro-intestinal environment.
the tolerance of the selected six strains to low

Ital. J. Food Sci., vol. 27 - 2015 287
pH, bile salt, pepsin and trypsin is presented in Fig. 2. As shown in Fig. 2A, the viable counts of L. pentosus cIcc 22161 strain reduced to be-low 106 cFu/mL after 4 h and 1.32 × 10⁴ cFu/mL after 6 h. However, the viable numbers of L. helveticus cIcc 22154, L. pentosus cIcc 22157, L. plantarum cIcc 23124, 23180 and L. rhamnosus cIcc 22175 were still more than 106 cFu/mL after 6 h in the gastric acid of pH 2.5. thus, these five strains showed higher tol-erance in acid environment.
For bile tolerance, except the L. pentosus cIcc 22161, the viable counts of the other five strains were still more than 106 cFu/mL after 6 h in the medium containing bile salt (Fig. 2b). However, the viable cells of L. pentosus cIcc 22161 had decreased to 2.0×10⁶ cFu/mL within 3 h. And it declined to only 1.8 × 10⁴ after 6 h.
For pepsin tolerance, among of six strains, the viable cells of L. pentosus cIcc 22161 and L. helveticus cIcc 22154 decreased significant-ly in 6 h and it is less than 104 cFu/mL and 106
cFu/mL after 6 h exposure to 5 mg/mL pepsin solution (pH 2.5), respectively (Fig. 2c).
For trypsin tolerance, as can be seen in Fig. 2D,
the viable counts of the tested six strains still re-mained at 106 cFu/mL or more after 6 h exposure to 10 mg/mL trypsin solution (pH 8.0).
3.4 Detection of Resistance genes
According to the above results, except strain L. pentosus cIcc 22161 and L. helveticus cIcc 22154, the tested strains may be able to sur-vive in the simulated gastrointestinal environ-ment. However, if the above strains contain an-tibiotics-resistant plasmids, there is the possi-bility of resistance transfer to other bacteria, es-pecially pathogenic bacteria. It will be a poten-tial hazard to human health and be a serious so-cial problem. So, the plasmid-determined resist-ant gene should be checked firstly before sub-sequent utilization.
After 0.02% SDS combined with heat treat-ment of the four strains (cIcc 22175, 22157, 23124, 23180), only the plasmids of L. plantar-um cIcc 23180 were removed and the resist-ance to cephalothin and chloromycetin disap-peared simultaneously (unpublished results). So, the primers of β-lactam resistance-relat-
Fig. 2 - the viable counts of strains ccIcc 22154, 22175, 22161, 22157, 23180 and 23124 in the gastrointestinal environ-ment after 6 hs at 37°c.A: pH 2.5; b: 3 mg/mL bile; c: 5mg/mL pepsin; D: 10 mg/mL trypsin.

288 Ital. J. Food Sci., vol. 27 - 2015
ed genes including blr, ECP-1569 and nps-1 as well as chloromycetin resistance-related genes including cmlA, cat and cmlA1 were designed. the plasmid-determined resistant genes of L. plantarum cIcc 23180 were detected by Pcr. As shown in Fig. 3, the plasmid of L. plantar-um cIcc 23180 contained β - lactam resist-ance gene blr, excluding other resistant genes. blr gene encodes beta-lactamase, which can hydrolyze β-lactam ring and then make the β-lactam antibiotic inactivation. this is proba-bly the main reason of the bacteria resistant to β-lactam antibiotics. In the present study, the successful amplification of blr gene in L. plan-tarum cIcc 23180 indicated that its cefalotin
Fig. 3 - the Pcr result in the genome and plasmid of cIcc 23180.M. Marker; 1. blr; 2. ecP-1569; 3. nps; 4. cmlA; 5. cat; 6. cmlA1; 7.control.
uct types. And studies have shown that more genes associated with antibiotic resistance are located in plasmids and transposons (Doucet et al., 1992; MAyyA et al., 2011). but unlike the chromosome DNA, both plasmids and transpo-sons can provide the possibility of transferabili-ty for resistance genes between bacteria. PIer et al. (2003) proved the high transferability of plas-mid pcF10 that encodes tetracycline resistance from Enterococcus faecalis oG1rf to Enterococ-cus faecalis bF3098c during cheese and sausage fermentation. JoANNA et al. (2008) reported the transferability of erythromycin resistant plasmid (pAMβ1) from Lactococcus lactis SH4174 to Lac-tococcus lactis bu2-60. A similar study also indi-cated that the transferability of tetracycline re-sistance in E. italicus LMG 22195 from ferment-ed milk (MIrIAM et al., 2010).
So, the assessment of antibiotic resistant of potentially probiotic lactic acid bacteria used in food industry, especially the resistance-relat-ed genes and the transferability are very neces-sary. We can also say that, exploring the pro-biotic property and safety of lactic acid bacte-ria are equally important.
4. coNcLuSIoNS
the tested 29 strains of potential probiotic lac-tobacillus showed different resistance to antibi-otics. those resistant strains containing both plasmids and high tolerance to gastrointesti-nal condition may cause food safety problems. So these strains need to be re-assessed carefully. the study found that the plasmid of L. plantar-um cIcc 23180 exactly carried the cephaloth-in-related gene blr. However, the transferibility of the resistance-related gene remains to be fur-ther studied. this study provides a reference in investigating the relationships between antibi-otic resistance spectrum and the plasmids and evaluating the safety of probiotics.
AcKNoWLeDGeMeNtS
this work was supported by the Science and technolo-gy research youth Fund Project (2010240) and the Natu-ral Science Foundation of Hebei Province (c2013208161, c2010000863). Authors also thank National High-tech Pro-ject (“863 Plan”, No. 2011AA100902) from chinese Ministry of Science and technology for part fund.
reFereNceS
charteris W.P., Kelly P.M., Morelli L., collins J.K. 1998a. An-tibiotic susceptibility of potentially probiotic Lactobacillus species. Journal of Food Protection. 61: 1636.
charteris W.P., Nelly P.M., Morelli L., collins J.K. 1998b. Development of an in vitro methodology to determine the transit tolerance of potentially probiotic Lactobacillus and bifidobacterium species in the upper human gastroin-testinal tract. Journal of Applied bacteriology. 84: 759.
Doucet P.F., trieu c.P., Andremont A., courvalin P. 1992.
resistance may be due to the effect of the beta-lactamase to β-lactam antibiotics.
While in the study, the genes of cat, cmlA and cmlA1 were not detected in the plasmids of L. plantarum cIcc 23180. However, L. plantarum cIcc 23180 strain was resistant to chloram-phenicol. At the same time, plasmid elimination and Escherichia coli transformant test showed that chloramphenicol resistance-related genes should be present in plasmid DNA of L. plantar-um cIcc 23180 (unpublished results). there-fore, the plasmid of the cIcc 23180 strain may contain other genes encoding chloramphenicol resistance.
In recent years, more studies have been done on antibiotic resistance of probiotics. It was shown that the antibiotic resistance was varia-ble, species-dependent and related to the prod-
Ital. J. Food Sci., vol. 27 - 2015 289
conjugal transfer of plasmid DNA from Enterococcus fae-calis to Escherichia coli in digestive tracts of gnotobiotic mice. Antimicrobial Agents and chemotherapy. 36(2): 502.
Franz c.M.A.P., Hummel A.P., Holzapfel W.H. 2005. Prob-lems related to the safety assessment of lactic acid bacte-ria starter cultures and probiotics. Mitteilungen aus Leb-ensmitteluntersuchung und Hygiene. 96: 39.
Guglielmotti D.M., Marco´ M.b., Golowczyb M., treinherim-er J.A., quiberoni A.L. 2007. Probiotic potential of Lac-tobacillus delbrueckii strains and their phage resistant mutants. International Dairy Journal. 17: 916.
Hummel A., Holzapfel W.H., Franz c.M. 2007. character-isation and transfer of antibiotic resistance genes from enterococci isolated from food. Systematic and Applied Microbiology. 30: 1.
Huys G., D’Haen K.D., collard J.M., Swings J. 2004. Prev-alence and molecular characterization of tetracycline re-sistance in enterococcus isolates from food. Applied and environmental Microbiology. 70: 1555.
Jin S., zhang G.L., Ji D.D., zhang b.L. 2009. Study on lac-tic acid bacteria on inhibiting mutagenic and carcino-genic substances. Science and technology of Food In-dustry. 30(12): 165.
Joanna L., Louise F., Aine M., Niamh t., Susanne S., bod-il J., Hilko van der Voet, Sigrid r.A., Declan b., Henk A., Karen A.K., Andrea W., Jacek b. 2008. A standardized conjugation protocol to asses antibiotic resistance trans-fer between Lactococcus species. International Journal of Food Microbiology. 127: 172.
Klare I., Konstabel c., Werner G., Huys G., Vankerck-hoven V., Kahlmeter G., Hildebrandt b., Sibylle Müller-bertling S., Wolfgang W.W., Goossens H. 2007. Antimi-crobial susceptibilities of Lactobacillus, Pediococcus and Lactococcus human isolates and cultures intended for probiotic or nutritional use. Journal of Antimicrobiology chemotherapy. 59: 900.
Lee y.K., Nomoto K., Salminen S., Gorbach S.L. 2009. Se-lection and maintenance of probiotic microorganisms. In: Lee, y.K. and Salminen, S. (2nd, ed.), Handbook of probiotics. John Wiley & Sons, New york, pp 177-188.
Li Sh.y., Li .PF., Shi J.H., Lei Sh.ch., zhang y.y., zhang K.P. 2008. Isolations of the bifidobacterium from cows and their resistance characteristics to given antibacteri-al drugs. Dairy Industry china. 1: 1.
Li ch., Wang S., zhan H.N., zhao H.F., Pei J.W., zhang b.L. 2009. roles of Lactobacillus paralimentarius 412 in sourdough fermentation. Food and Fermentation Indus-tries. 35(5): 99.
Liu y.q., zhou F., zhao H.F., zhan H.N., zhang b.L. 2011. Factors affecting the production of folic acid by lactic acid bacteria. china Dairy Industry. 39(3): 10.
Maria r.D., Monica M., bruno b. 2007. Antibiotic resistance of lactic acid bacteria and bifidobacterium spp. isolated from dairy and pharmaceutical products. International Journal of Food Microbiology. 115: 35.
Mayya P., zhosephine G., Sofia M. 2011. tn5045, a novel integron-containing antibiotic and chromate resistance transposon isolated from a permafrost bacterium. re-search in Microbiology. 162: 337.
Miriam z., Geert H., Giorgio G. 2010. Molecular basis and transferability of tetracycline resistance in Enterococcus italicus LMG 22195 from fermented milk. International Journal of Food Microbiology. 142: 234.
Niamh t., Declan b., Se´amus F. 2010. characterisation and transferability of antibiotic resistance genes from lactic acid bacteria isolated from Irish pork and beef abattoirs. research in Microbiology. 161(2): 127.
Pier S.c., Daniela c., Simona G. 2003 Gene transfer of van-comycin and tetracycline resistances among Enterococcus faecalis during cheese and sausage fermentations. Inter-national Journal of Food Microbiology. 88: 315.
Sun X.q., zhang X.L., Wang S., zhang b.L. 2009. optimized production and application of ePS by Lactobacillus pen-tosus strains in fermented milks. Journal of Dairy Sci-ence and technology. 5: 212.
threlfall e.J., Ward L.r., Frost J.A., Willshaw G.A. 2000. the emergence and spread of antibiotic resistance in food-borne bacteria. International Journal of Food Mi-crobiology. 62: 1.
Wang t.F., Lee b.H. 1997. Plasmids in Lactobacillus. criti-cal reviews in biotechnology. 17(3): 227.
hite D.G., zhao S., Simjee S., Wagner D.D., McDermott P.F. 2002. Antimicrobial resistance of foodboe pathogens. Mi-crobes and Infection. 4: 405.
zeng H.y., qin L.K., Jiang P. 2004. Development review on acquired antibiotic resistance in lactic acid bacteria from food. Food Science. 25(12): 189.
zhang z.y., Liu c., Guo X.K. 2007. research progress of an-tibiotics resistance in lactic acid bacteria. chinese Jour-nal of Microecology. 19(5): 478.
zhao H.F., zhou F., qi y.q., Dziugan P., bai F.L., Walczak P., zhang b.L. 2013. Screening of Lactobacillus strains for their ability to bind benzo(a)pyrene and the mech-anism of the process. Food and chemical toxicology. 59: 67.
Paper Received January 16, 2014 Accepted August 25, 2014

PaPer
290 Ital. J. Food Sci., vol. 27 - 2015
- Keywords: meat quality, postmortem ageing, sensory panel, tenderness, veal calves -
EFFECT OF AgEINg TIME IN vACUUM PACKAgE ON vEAL LONgISSIMUS DORSI AND bICEPS FEMORIS PHySICAL AND SENSORy TRAITS
g. bALDI*, S. RATTI, C. E. M. bERNARDI, v. DELL’ORTO, C. CORINO, R. COMPIANI and C. A. SgOIFO ROSSI
Department of Health, Animal Science and Food Safety, University of Milan, Via G. Celoria 10, 20133 Milan, Italy
*Corresponding author: [email protected]
AbStrAct
Study evaluated the effects of vacuum ageing (2, 4, 6, 8, 10, 12, 16 days) on veal loin (longissi-mus dorsi; LD) and silverside (biceps femoris; bF) physical and sensory characteristics. Ageing did not affect cooking loss, increased LD pH and L*, a* and b* in both muscles. Shear force (SF) de-creased until day 6 in LD and day 10 in bF. Aroma, flavor and taste were not affected, while tex-ture traits were improved. SF was negative correlated with tenderness and juiciness and positive correlated with bF fibrousness and stringy sensation. Ageing improved texture properties with-out altering other sensory traits.
Ital. J. Food Sci., vol. 27 - 2015 291
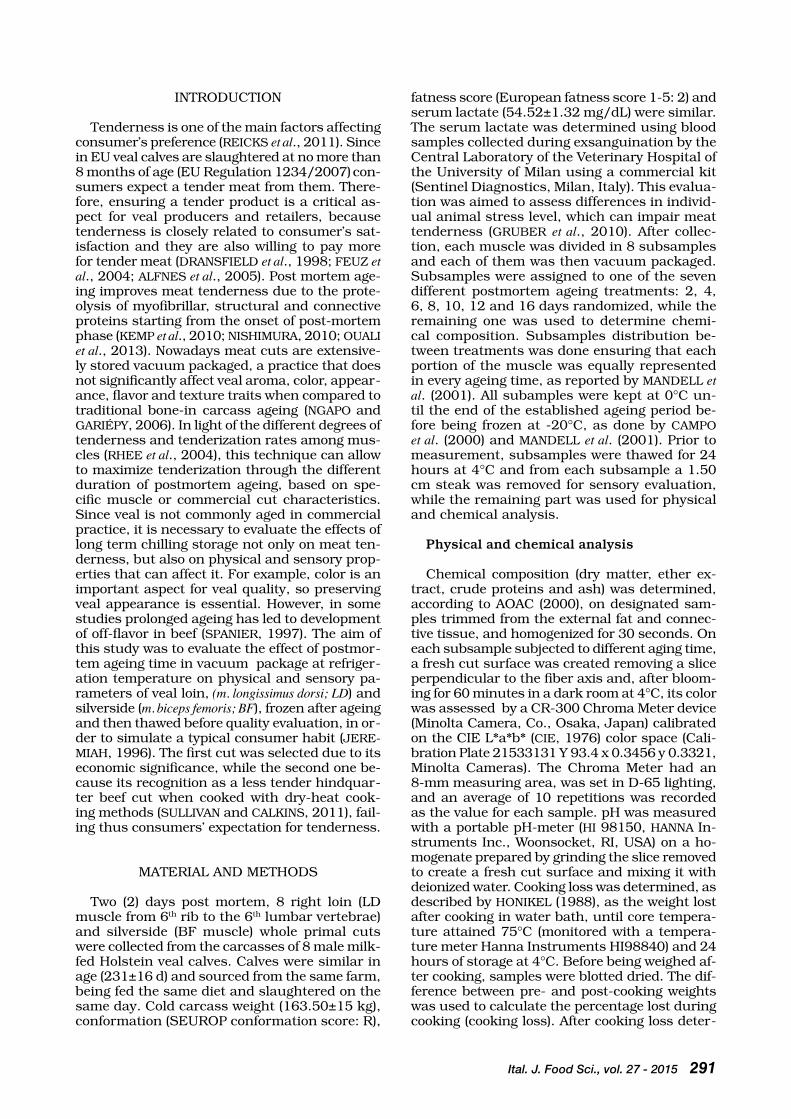
INtroDuctIoN
tenderness is one of the main factors affecting consumer’s preference (reIcKS et al., 2011). Since in eu veal calves are slaughtered at no more than 8 months of age (eu regulation 1234/2007) con-sumers expect a tender meat from them. there-fore, ensuring a tender product is a critical as-pect for veal producers and retailers, because tenderness is closely related to consumer’s sat-isfaction and they are also willing to pay more for tender meat (DrANSFIeLD et al., 1998; Feuz et al., 2004; ALFNeS et al., 2005). Post mortem age-ing improves meat tenderness due to the prote-olysis of myofibrillar, structural and connective proteins starting from the onset of post-mortem phase (KeMP et al., 2010; NISHIMurA, 2010; ouALI et al., 2013). Nowadays meat cuts are extensive-ly stored vacuum packaged, a practice that does not significantly affect veal aroma, color, appear-ance, flavor and texture traits when compared to traditional bone-in carcass ageing (NGAPo and GArIéPy, 2006). In light of the different degrees of tenderness and tenderization rates among mus-cles (rHee et al., 2004), this technique can allow to maximize tenderization through the different duration of postmortem ageing, based on spe-cific muscle or commercial cut characteristics. Since veal is not commonly aged in commercial practice, it is necessary to evaluate the effects of long term chilling storage not only on meat ten-derness, but also on physical and sensory prop-erties that can affect it. For example, color is an important aspect for veal quality, so preserving veal appearance is essential. However, in some studies prolonged ageing has led to development of off-flavor in beef (SPANIer, 1997). the aim of this study was to evaluate the effect of postmor-tem ageing time in vacuum package at refriger-ation temperature on physical and sensory pa-rameters of veal loin, (m. longissimus dorsi; LD) and silverside (m. biceps femoris; BF), frozen after ageing and then thawed before quality evaluation, in or-der to simulate a typical consumer habit (Jere-MIAH, 1996). the first cut was selected due to its economic significance, while the second one be-cause its recognition as a less tender hindquar-ter beef cut when cooked with dry-heat cook-ing methods (SuLLIVAN and cALKINS, 2011), fail-ing thus consumers’ expectation for tenderness.
MAterIAL AND MetHoDS
two (2) days post mortem, 8 right loin (LD muscle from 6th rib to the 6th lumbar vertebrae) and silverside (bF muscle) whole primal cuts were collected from the carcasses of 8 male milk-fed Holstein veal calves. calves were similar in age (231±16 d) and sourced from the same farm, being fed the same diet and slaughtered on the same day. cold carcass weight (163.50±15 kg), conformation (SeuroP conformation score: r),
fatness score (european fatness score 1-5: 2) and serum lactate (54.52±1.32 mg/dL) were similar. the serum lactate was determined using blood samples collected during exsanguination by the central Laboratory of the Veterinary Hospital of the university of Milan using a commercial kit (Sentinel Diagnostics, Milan, Italy). this evalua-tion was aimed to assess differences in individ-ual animal stress level, which can impair meat tenderness (Gruber et al., 2010). After collec-tion, each muscle was divided in 8 subsamples and each of them was then vacuum packaged. Subsamples were assigned to one of the seven different postmortem ageing treatments: 2, 4, 6, 8, 10, 12 and 16 days randomized, while the remaining one was used to determine chemi-cal composition. Subsamples distribution be-tween treatments was done ensuring that each portion of the muscle was equally represented in every ageing time, as reported by MANDeLL et al. (2001). All subamples were kept at 0°c un-til the end of the established ageing period be-fore being frozen at -20°c, as done by cAMPo et al. (2000) and MANDeLL et al. (2001). Prior to measurement, subsamples were thawed for 24 hours at 4°c and from each subsample a 1.50 cm steak was removed for sensory evaluation, while the remaining part was used for physical and chemical analysis.
Physical and chemical analysis
chemical composition (dry matter, ether ex-tract, crude proteins and ash) was determined, according to AoAc (2000), on designated sam-ples trimmed from the external fat and connec-tive tissue, and homogenized for 30 seconds. on each subsample subjected to different aging time, a fresh cut surface was created removing a slice perpendicular to the fiber axis and, after bloom-ing for 60 minutes in a dark room at 4°c, its color was assessed by a cr-300 chroma Meter device (Minolta camera, co., osaka, Japan) calibrated on the cIe L*a*b* (cIe, 1976) color space (cali-bration Plate 21533131 y 93.4 x 0.3456 y 0.3321, Minolta cameras). the chroma Meter had an 8-mm measuring area, was set in D-65 lighting, and an average of 10 repetitions was recorded as the value for each sample. pH was measured with a portable pH-meter (HI 98150, HANNA In-struments Inc., Woonsocket, rI, uSA) on a ho-mogenate prepared by grinding the slice removed to create a fresh cut surface and mixing it with deionized water. cooking loss was determined, as described by HoNIKeL (1988), as the weight lost after cooking in water bath, until core tempera-ture attained 75°c (monitored with a tempera-ture meter Hanna Instruments HI98840) and 24 hours of storage at 4°c. before being weighed af-ter cooking, samples were blotted dried. the dif-ference between pre- and post-cooking weights was used to calculate the percentage lost during cooking (cooking loss). After cooking loss deter-

292 Ital. J. Food Sci., vol. 27 - 2015
mination, from 2.5 cm thick cooked samples six cylindrical cores (1.27 cm in diameter), parallel to fiber orientation, were obtained and used for shear force (SF) evaluation with a Warner-bratzler shear force texture analyzer (model 4466; Instron corp., canton, MA). Peak force (kg/cm2) was re-corded for each core and the average of six values per sample was used for the statistical analysis.
Sensory analysis
Steaks of bF and LD samples were cut to 1.5 cm thick and cooked for 60 seconds at the great-est power (200°c) on double-plated grills, before being cut into 1.5 cm cubes. core temperature was monitored with a thermocouple (Pentronic Ab,198 Gunnebobruk, Sweden) and it was not allowed to exceed 68°c. Sensory evaluation was performed by 10 expert and trained judges (uNI eN ISo 13299:2010), confident with meat sen-sory evaluation, on each sample aged for 2, 4, 8, 10 and 16 days. three cubes per samples were presented on white plastic plates to each pan-elist, which during training and sampling, had access to unlimited water and unsalted crack-ers and each sample was identified by 3-digit codes. Judges were trained in two tasting ses-sion with the aim to allow them to find and famil-iarized with sensory descriptors relative to veal aroma, taste, flavor and texture. At each judge was asked to evaluate the intensity of each at-tribute by assigning a score between 1 (absence of the sensation) and 9 (extremely intense sen-sation). Descriptors (table 1) includes the main beef sensory parameters and some of the defects that could affect vacuum packaged aged meat.
Statistical analysis
Statistical analysis was performed using SAS® 9.3 (SAS Institute Inc., 2012 cary Nc) software. Data from the physical analysis was analyzed by
one-way ANoVA, considering post mortem age-ing time as the main effect. Data from sensory profile were analyzed by three-way ANoVA con-sidering the effects of judge, replications and ageing time and their interactions. Least square means were compared according to F test, with the level of significance set at P≤0.05. Pearson correlation analysis was also performed to eval-uate the relationship between SF and sensory texture characteristics.
reSuLtS AND coNcLuSIoNS
Physical and chemical characteristics
the average chemical composition of LD and bF muscles is summarized in table 2. results are consistent with data reported for lean veal meat in some national food composition data-bases (Denmark: National Food Institute, 2009; uSA: united States Department of Agriculture, 2011). Although a significant effect (P=0.05) of ageing time on LD pH was found (table 3), it in-crease only from 2 to 8 days of ageing, while no significant differences were evident since the day 4 of ageing. regarding bF, its pH was not affect-ed by ageing time. this last data is consistent with other studies that found no differences in veal pH during 7 (reVILLA et al., 2006) or 14 days of ageing (oLIete et al., 2006), and the review by
table 1 - Descriptors, definitions and standards for sensory analysis.
Attribute Definition
Aroma Veal Aroma associated with cooked veal loin Metallic Aroma associated with blood or rare meat Off flavor Aroma associated with meat at the end of shelf life
Taste Salty Salty taste Sweet Sweet taste
Flavor Veal Flavor associated with cooked veal loin Metallic Flavor associated with blood or rare meat Off flavor Flavor associated with meat at the end of shelf life
Texture Tender The force needed to masticate the meat ready for swallowing (chewing 5 times) Fibrous Presence of fibers during swallowing Juicy The degree of juice released while chewing the meat Stingy Production of a large quantity of saliva for swallowing
table 2 - Average chemical composition of the muscles sam-pled for the trial (least square means±SD).
Trait Longissimus dorsi Biceps femoris
Moisture, g kg-1 751.72±5.12 754.91±3.32Ash, g kg-1 12.34±1.04 11.72±0.65Crude Protein, g kg-1 211.50±3.22 212.24±3.96Ether extract, g kg-1 24.52±3.24 21.20±2.47

Ital. J. Food Sci., vol. 27 - 2015 293
table 3 - effect of ageing time on veal LD and bF physical traits (least square means±SeM).
Ageing time 2 d 4 d 6 d 8 d 10 d 12 d 16 d p pH
LD 5.54±0.04 a 5.62±0.04 ab 5.63±0.04 ab 5.70±0.04 b 5.68±0.04 b 5.71±0.04 b 5.70±0.04 b 0.05BF 5.60±0.04 5.59±0.04 5.63±0.04 5.63±0.04 5.68±0.04 5.68±0.04 5.67±0.04 NS
cooking loss, %
LD 25.41±0.53 26.16±0.53 25.72±0.53 25.96±0.53 25.98±0.53 25.79±0.53 25.66±0.53 NSBF 28.81±0.11 28.55±0.11 29.87±0.11 28.81±0.11 29.85±0.11 27.62±0.11 28.77±0.11 NS L*
LD 48.20±0.68 a 50.32±0.47 b 51.00±0.54 bc 52.91±0.93 cd 52.80±0.90 cd 52.49±0.86 cd 53.08±0.90 d ≤0.01BF 48.51±0.53 a 50.46±0.43 b 50.71±0.52 b 52.74±0.75 c 53.04±0.55 c 53.12±0.56 c 53.88±0.55 c ≤0.01 a*
LD 9.71±0.47a 10.27±0.34 a 12.82±0.40b 12.49±0.68 b 12.52±0.66 b 12.57±0.63 b 12.53±0.66 b ≤0.01BF 10.85±0.25 a 11.27±0.20 a 13.70±0.25b 14.86±0.34 b 14.87±0.27 b 14.11±0.25 b 14.03±0.26 b ≤0.01 b*
LD 9.86±0.25 a 10.52±0.17 b 11.97±0.20c 12.22±0.34 c 12.41±0.33 c 12.73±0.31 c 12.87±0.33 c ≤0.01BF 10.58±0.25 a 11.23±0.20 b 12.46±0.25c 13.62±0.34 d 13.65±0.27 d 13.39±0.25 d 13.22±0.26 d ≤0.01 SF, kg
LD 2.89±0.15 a 2.59±0.11 ab 2.42±0.16 bc 2.21±0.15 c 2.12±0.18 c 2.09±0.21 c 2.05±0.17 c ≤0.01BF 2.89±0.13 a 2.73±0.09 ab 2.65±0.13 ab 2.45±0.13 bc 2.22±0.11 cd 2.19±0.11 cd 1.96±0.11 d ≤0.01
a,b,c,d in the same row indicates significant differences between the different ageing times.
NGAPo and GAryéPI (2006), that suggests post-mortem ageing did not increase veal pH. Howev-er, although the reported slight differences in LD pH values across post mortem times, it fell within the normal range (5.40-5.70) for both muscles. cooking loss (table 3) was not affected by ageing time in either muscle. Findings are in agreement with other works (KLoNt et al. 2000; MANDeLL et al. 2001), even if is difficult to make a compari-son with the previous study due to the different cooking methods and endpoint temperatures to between studies. However, for both muscles, re-sults of the present study are intermediate be-tween the cooking loss values reported by the previous authors (19.1-38.2%). regarding color parameters (table 3), ageing increased lightness (L*), redness (a*) and yellowness (b*) in both muscles (P≤0.01). this concurs with MANDeLL et al. (2001), which suggested color parameters tended to increase only during the first week of ageing, before becoming stable. INSAuStI et al. (1999) also found L* to increase during vacuum storage in longissimus dorsi of young cattle. Light-ness increasing can be attributed, as reported by KLoNt et al. (2000), to the increasing of meat light scatter properties due to post mortem pro-
tein denaturation and degradation. oLIete et al. (2006) found an increasing of a* and b* meas-ured 1 hour after blooming in vacuum packaged veal and young cattle longissimus dorsi. these stud-ies attributed the increasing in redness to the faster blooming of aged meat. Indeed, the more meat is aged the faster it blooms because of the reduced activity of enzyme that compete for ox-ygen with Mb. the rising of yellowness was, in-stead, attributed the increasing of metmyoglo-bin formation during storage time. A lightness increasing can exert a positive effect on veal ap-pearance, while an improvement of redness can represent a negative factor. Indeed, in several studies on veal carcasses, a decreasing in light-ness and an increasing in redness moving from lightest to darkest veal was reported, while b* was not related to color score (DeNoyeLLe and berNy, 1999; HuLSeGGe et al. 2001; LAGoDA et al. 2002; VANDoNI and SGoIFo roSSI, 2009). the magnitude of L*, a* and b* increasing, higher than those found in the study of MANDeLL et al. (2001), could be promoted by the combination of freezing and thawing and blooming time, this latter not applied by MANDeLL et al. (2001), that can have exacerbated the impact of ageing on

294 Ital. J. Food Sci., vol. 27 - 2015
meat color stability. Indeed, freezing and thaw-ing promote myoglobin denaturation, increase susceptibility to oxidation and reduce the activi-ty of metmyoglobin reducing enzymes. these ef-fects, coupled with the loss of NADH (cofactor of these enzymes) in the exudate, reduce meat color and oxidative stability as reviewed by Ley-GoNIe et al. (2012).
Post mortem ageing of LD reduced SF (P≤0.01), but there were no further improvements in ten-derness after 8 days of ageing (table 3). these findings are consistent with MANDeL et al. (2001), who reported decreases in SF for LD and semimembranosus muscles comparing veal aged for 2 days with veal aged for at least 7 days, but the same study found no differences in SF for ageing periods beyond 7 days. Furthermore, re-VILLA et al. (2006) also found a reduction in SF loin during 7 days of ageing. eight days of age-ing was needed to significantly decrease SF val-ues for 2 days aged bF; there was no further im-provement in SF values until bF was aged for 16 days. this slower tenderization rate of bF com-pared to LD agrees with data relative to this mus-cle collected from lean beef carcasses graded as uSDA quality grade Select (Gruber et al., 2006).
Sensory analysis
the F values of ageing time for aroma, taste, flavor and texture parameters of LD and bF sen-sory profile are reported in table 4 and table 5, respectively. results indicated that postmortem
ageing time affected (P ≤0.01) sensory texture of both LD and bF. In particular, postmortem age-ing improved LD sensory tenderness (P≤0.01). tenderness was higher at day 4 days in com-parison with day 2, and at day 16 in compari-son to day 4 (tab. 4). Increasing ageing from 2 to 4 days also improved juiciness (P≤0.01) and re-duced stringy sensation (P≤0.01). Improvements in eating quality associated with ageing were also perceived for fibrousness, with significant re-duction (P≤0.01), starting from the 8th days post mortem. these results are consistent with Man-dell et al. (2001), which found an increase in per-ceived LD tenderness comparing samples aged 2 days with the average of the values recorded for samples aged 7 and 14 days, while no sig-nificant difference was detected increasing age-ing period from 7 to 14 days. bF sensory analy-sis (table 5), showed that perceived tenderness significantly increased with ageing (P≤0.01) from days 2 and 4 to day 8, and also between 8 to 16 days post mortem. Juiciness was improved (P≤0.01) from 2 to 8 days of ageing, but no fur-ther. Fibrousness was also reduced (P≤0.01) from 2 to 8 days and from 8 to 16 days of ageing and stringy sensation decreased (P≤0.01) from 2 to 4 days and from 4 to 10 days of ageing, but no fur-ther. the improvement of perceived tenderness and juiciness, as well as reductions in fibrous-ness and stringy rankings, are common when sensory panels evaluate the effects of postmor-tem ageing on beef palatability attributes (Jere-MIAH and GIbSoN, 2003; MILLer et al. 1997 and
table 4 - effect of ageing time on LD sensory profile (least square means).
Descriptors F value 2 d 4 d 8 d 10 d 16 d SEM p ageing time
Aroma
Veal 1.47 6.98 6.77 6.62 6.92 6.65 0.20 N.S.Metallic 1.32 4.18 4.29 4.59 4.17 4.87 0.32 N.S.Off flavor 3.02 2.33 2.15 2.52 2.37 2.87 0.22 N.S.
Taste Sweet 1.14 4.67 5.27 5.07 5.20 5.38 0.32 N.S.Salty 1.47 3.81 4.32 3.83 3.68 4.22 0.30 N.S.
Flavor Veal 0.89 6.62 6.82 6.50 6.82 6.95 0.24 N.S.Metallic 1.56 4.12 4.61 4.34 3.92 4.77 0.32 N.S.Off flavor 1.64 2.97 2.21 2.96 2.88 3.08 0.31 N.S.
Texture Tender 16.21 4.92 a 6.35 b 6.77 bc 6.88 bc 6.94 c 0.23 ≤0.01Juicy 10.82 4.75 a 5.79 b 5.95 b 6.34 b 6.33 b 0.26 ≤0.01Fibrous 4.94 5.05 a 3.95 b 3.87 b 3.70 b 3.57 b 0.30 ≤0.01Stringy 3.89 4.68 a 3.96 ab 3.62 b 3.32 b 3.34 b 0.29 ≤0.01
a,b,c in the same row indicates significant differences between the different ageing times.

Ital. J. Food Sci., vol. 27 - 2015 295
cAMPo et al. 1999). In the latest study a multi-variate approach (Principal component Analy-sis) was used to differentiate aged from unaged meat. this indicated that aged meat was char-acterized by tenderness and juiciness sensa-tion, while unaged meat was characterized by fibrousness and residue (similar to stringy sen-sation) ones. In the present study post mortem ageing did not affect aroma, flavor and taste for both muscle. this disagrees with MANDeLL et al.
(2001), where meat flavor was improved by age-ing veal more than 7 days. there was a low in-cidence for the panel detecting undesirable pal-atability attributes such as metallic aroma and flavor and off flavor. this concurs with JereMI-AH and GIbSoN (2003), that found low levels of off flavor and metallic aroma/flavor attributes in beef, regardless of post mortem ageing time. Furthermore, the same authors, did not find dif-ferences in off or metallic aroma and salt and metallic flavor prolonging ageing time until 28 days. the lack of effect of ageing time on negative sensory descriptors is an important outcome, as some past studies have reported increases in un-desirable flavor and aroma defects for beef after prolonged ageing (SPANIer et al. 1997 and MoN-SóN et al. 2005).
Correlation between SF and texture sensory traits
based on Pearson correlation coefficients to examine the relationship of sensory texture char-
acteristics and SF for both muscles, there was a negative relationship between SF and sen-sory tenderness (r=-0.67; P≤0.01 and r=-0.83; P≤0.001 for LD and bF respectively) and juic-iness (r=-0.53; P≤0.05 and r=-0.72; P≤0.01 for LD and bF respectively). the negative correla-tion between SF and sensory tenderness is in agreement to the findings of SHAcKeLForD et al. (1999) in beef and MoNteIro et al. (2013) in veal. Positive correlations were found between SF and fibrousness (r= 0.78; P≤0.01) as well as SF and stringy sensation (r= 0.78; P≤0.01) for bF. these findings agrees with the positive correlation be-tween fibrousness and SF found by caine et al. (2003) and the negative correlation between SF and juiciness found by MoNteIro et al. (2013). the lack of relationship between SF with stringy and fibrousness rankings for LD muscle in re-spect to bF muscle could be explained by the lower collagen content of LD relative to bF (rHee et al. 2004). Indeed, fibrousness and stringy sen-sation were lower in LD muscle and the lower detectability could have been at the basis of the lack of significant interaction.
our results indicate that postmortem ageing under vacuum conditions improved the instru-mental and sensory tenderness rankings for veal m. longissimus dorsi and m. biceps femoris, without any negative effects on the main meat sensory traits such as aroma, flavor, taste and juiciness meas-ured after frozen storage and thawing. Ageing, coupled with freezing and thawing, have, howev-er, reduced oxidative stability in both muscles,
table 5 - effect of ageing time on bF sensory profile (least square means).
Descriptors F value 2 d 4 d 8 d 10 d 16 d SEM p ageing time
Aroma Veal 1.00 6.69 6.60 6.80 7.04 6.93 0.18 N.S.Metallic 1.50 4.15 4.43 4.31 3.81 3.71 0.29 N.S.Off flavor 0.19 2.31 2.40 2.42 2.35 2.26 0.19 N.S.
Taste Sweet 0.74 5.00 5.12 5.34 5.41 5.31 0.27 N.S.Salty 2.27 3.73 3.84 4.33 3.88 4.33 0.28 N.S.
Flavor Veal 1.47 6.38 6.48 6.67 6.94 6.52 0.20 N.S.Metallic 2.47 4.04 4.78 4.44 4.25 4.36 0.29 N.S.Off flavor 1.54 3.04 3.00 2.58 3.27 2.29 0.22 N.S.
Texture Tender 15.43 3.80 a 4.52 a 5.65 b 6.38 bc 6.64 c 0.31 ≤0.01Juicy 5.83 4.27 a 4.57 ab 5.13 b 5.80 b 5.80 b 0.29 ≤0.01Fibrous 9.88 6.58 a 5.34 b 4.78 bc 4.15 cd 3.76 d 0.33 ≤0.01Stringy 21.37 6.64 a 5.81 ab 5.00 bc 4.41 cd 3.39 d 0.30 ≤0.01
a,b,c,d in the same row indicates significant differences between the different ageing times.

296 Ital. J. Food Sci., vol. 27 - 2015
without affecting other veal technological proper-ties as cooking loss and pH. there were different postmortem tenderization trends for each mus-cle evaluated in the study. the improvements in LD tenderness and related sensory traits oc-curred mainly during the first week of postmor-tem ageing, while in bF postmortem ageing ef-fects were also evident until the tenth day. At these experimental conditions, a minimum pe-riod of 4 days for LD muscle and 8 days for bF muscle was necessary to obtain a perceivable tenderizing effect. A prolonged ageing, for at least one week for veal LD and two weeks for veal bF can be applied for frozen veal, mainly destined for ho.re.ca market, in which product appear-ance is a secondary trait, while tenderness is the primary goal. Vacuum ageing could be also ap-ply for fresh veal market, considering indeed its potentially lower impact than that emerged in this study on oxidative stability, as veal will not undergone to freezing and thawing process be-fore being prepared for retail exposition.
AcKNoWLeDGeMeNtS
Authors age grateful to Vercelli s.p.a. (Formigliana, Italy) for technical assistance and meat samples provided.
reFereNceS
Alfnes F., rickertsen K. and uelend Ø. experimental evi-dence of risk aversion in consumer markets: the case of beef tenderness. Paper No. 24553, presented at 11th In-ternational congress of european Association of Agricul-tural economists, copenhagen, Denmark, August 24-27.
AoAc. 2000. “official Methods of Analysis” 17th ed. Asso-ciation of official Analytical chemists, Washington, Dc.
caine W.r., Aalhus J.L., best D.r. Dugan M.e.r. and Jer-emiah L.e. 2003. relationship of texture profile analysis and Warner-bratzler shear force with sensory character-istics of beef rib steaks. Meat Sci. 64:333.
campo M.M., Santolaria P. ,Sañudo c., Lepetit J., olleta J.L., Panea b. and Albertí P. 1999. Assessment of breed type and ageing time effects on beef meat quality using two different texture devices. Meat Sci. 55:371.
campo M.M., Sañudo c., Panea b., Albertí P. and Santola-ria P. 1999. breed type and ageing time effects on sensory characteristics of beef strip loin steaks. Meat Sci. 51:383.
cIe. 1976. International commission on Illumination, col-orimetry: official recommendation of the Internation-al commission on Illumination. Publication cIe No. (e-1.31). Paris, France: bureau central de la cIe.
Denoyelle c. and berny F. 1999. objective measurement of veal colour for classification purposes. Meat Sci. 53:203.
Devina c.e., bell r.G., Lovatt S., chrystall b.b. and Jer-emiah L.e. 1996. red meat ch. 2. in “Freezing effects on food quality”. L.e. Jereiah (ed.), p.51. Marcel Dek-ker Inc. New york.
Dransfield e., zamora F. and bailey M.c. 1998. consum-er selection of steaks as influenced by information and price index. Food qual. Pref. 9:321.
european community. council regulation (ec) No 1234/2007 of 22 october 2007 establishing a com-mon organisation of agricultural markets and on spe-cific provisions for certain agricultural products (Single cMo regulation). official Journal of the european un-ion, 16.11.2007.
Feuz D.M., umberger W.J., calkins c.r. and bethany S. 2004. u.S. consumers’ willingness to pay for flavor and tenderness in steaks as determined with an experimen-tal auction. J. Agr. resour. economy 29:501.
Gruber S.L., tatum J.D., engle t.e., chapman P.L., belk K.e. and Smith G.c. 2010. relationships of behavioral and physiological symptoms of preslaughter stress to beef longissimus muscle tenderness. J. Anim. Sci. 88:1148.
Gruber S.L., tatum J.D., Scanga J.A., chapman P.L., Smith G.c. and belk K.e. 2006. effects of postmortem aging and uSDA quality grade on Warner-bratzler shear force values of seventeen individual beef muscles J. Anim. Sci. 84:3387.
Honikel K.o. 1998. reference methods for the assessment of physical characteristics of meat. Meat Sci. 49:447.
Hulsegge b., engel b., buist W., Merkus G.S.M. and Klont r.e. 2001. Instrumental colour classification of veal car-casses. Meat Sci. 57:191.
Insausti K., beriaín M.J., Purroy A., Albertí P., Lizaso L. and Hernández b. 1999. colour stability of beef from differ-ent Spanish native cattle breeds stored under vacuum and modified atmosphere. Meat Sci. 53:241.
International Standardization organization (ISo), 2010. eN ISo 13299 Sensory analysis – methodology – general guid-ance for establishing a sensory profile.
Jeremiah L.e. and Gibson L.L. 2003. the effects of postmor-tem product handling and aging time on beef palatabili-ty. Food res. Int. 36:929.
Kemp c.M., Sensky P.L., bardsley r.G., buttery P.J. and Parr t. 2010. tenderness – An enzymatic view. Meat Sci. 84:248.
Klont r.e., barnie V.M., van Dijk A., Smulders F.J., Hov-ing-bolink A.H., Hulsegge b. and eikelenboom G. 2000. effects of rate of pH fall, time of deboning, aging period, and their interaction on veal quality characteristics. J. Anim. Sci. 78:1845.
Lagoda H.L., Wilson L.L., Henning W.r., Flowers S.L. and Mills e.W. 2002. Subjective and objective evaluation of veal lean colour. J. Anim. Sci. 80:1911.
Leygonie c., britz t.J. and Hoffman L.c. 2012. Impact of freezing and thawing on the quality of meat: review. Meat Sci. 91:93.
Mandell I.b., Maclaurin t. and buttenhan S. 2001. effects of carcass weight class and postmortem aging on carcass characteristics and sensory attributes in grain-fed veal. J. Food Sci. 66:762.
Miller M.F., Kerth c.r., Wise J.W., Lansdell J.L., Stowell J.e. and ramsey c.b. 1997. Slaughter plant location, uSDA quality grade, external fat thickness, and ageing time ef-fects on sensory characteristics of beef loin strip steak. J. Anim. Sci. 75:662.
Monsón F., Sañudo c. and Sierra I. 2005. Influence of breed and ageing time on the sensory meat quality and consumer acceptability in intensively reared beef. Meat Sci.71:471.
Monteiro A.c.G., Gomes e., barreto A.S., Silva M.F., Fontes M.A., bessa r.J.b. and Lemos J.P.c. 2013. eating quali-ty of “Vitela tradicional do Montado”-PGI veal and Mer-tolenga-PDo veal and beef. Meat Sci. 94:63.
National Food Institute. 2009. National Food Institute - tech-nical university of Denmark (Dtu) Danish Food compo-sition Databank - ed. 7.01. http://www.foodcomp.dk Ac-cessed on-line April 24, 2014.
Ngapo t.M. and Gariépy c. 2006. Factors affecting the meat quality of veal. J. Sci. Food Agr. 86:1412.
Nishimura t. 2010. the role of intramuscular connective tissue in meat texture. Anim. Sci. J. 81:21.
oliete b., carballo J.A., Varela A., Moreno t., Monserrat L. and Sanchez L. 2006. effect of weaning status and stor-age time under vacuum upon physical characteristics of meat of the rubia Gallega breed. Meat Sci. 73:102.
ouali A., Gagaoua M., boudida y., becila S., boudjellal A., Herrera-Mendez c.H. and Sentandreu M.A. 2013. bio-markers of meat tenderness: Present knowledge and per-spectives in regards to our current understanding of the mechanisms involved. Meat Sci. 95:854.

Ital. J. Food Sci., vol. 27 - 2015 297
Spanier A.M., Flores M., McMillin K.W. and bidner t.D. 1997. the effect of post-mortem aging on meat fla-vor quality in brangus beef. correlation of treatments, sensory, instrumental and chemical descriptors. Food chem. 59:489.
Sullivan G.A. and calkins c.r. 2011. ranking beef mus-cles for Warner-bratzler shear force and trained sen-sory panel ratings from published literature. J. Food qual. 34:195.
united States Department of Agriculture. 2011. Nation-al Nutrient Database for Standard reference. http://ndb.nal.usda.gov/ndb/foods accessed on-line April 24, 2014.
Vandoni S. and Sgoifo rossi c. A. 2009. Instrumental objec-tive measurement of veal calves carcass colour at slaugh-terhouse. Ital. J. Anim. Sci. 8(2):552.
Paper Received January 16, 2014 Accepted August 25, 2014
reicks A.L., brooks J.c., Garmyn A.J., thompson L.D., Ly-ford c.L and Miller M.F. 2011. Demographics and beef preferences affect consumer motivation for purchasing fresh beef steaks and roasts. Meat Sci. 87:403.
revilla I. and Vivar-quintana A.M. 2006. effect of breed and ageing time on meat quality and sensory attributes of veal calves of the ‘‘ternera de Aliste’’ quality Label. Meat Sci. 73:189.
rhee M.S., Wheeler t.L., Shackelford S.D. and Koohm-araie M. 2004. Variation in palatability and biochemical traits within and among eleven beef muscles. J. Anim. Sci. 82:534.
Shackelford S.D., Wheeler t.L. and Koohmaraie M. 1999. evaluation of slice shear force as an objective method of assessing beef longissimus tenderness. J. Anim. Sci. 77:2693.

PaPer
298 Ital. J. Food Sci., vol. 27 - 2015
- Keywords: chicken burger, inulin, quality, vegetable oil, wheat fiber -
QUALITy CHARACTERISTICS OF CHICKEN bURgERS
ENRICHED WITH vEgETAbLE OILS, INULIN AND WHEAT FIbER
A. CEgIEŁKAa*, M. CHMIELa, E. KRAJEWSKA-KAMIŃSKAb
and E. HAĆ-SZyMAŃCZUKc
aWarsaw University of Life Sciences, SGGW, Faculty of Food Sciences, Department of Food Technology, Division of Meat Technology, 159c Nowoursynowska Street,
02-787 Warsaw, PolandbWarsaw University of Life Sciences, SGGW, Analytical Centre, 8 Ciszewskiego Street,
02-786 Warsaw, PolandcWarsaw University of Life Sciences, SGGW, Faculty of Food Sciences,
Department of Biotechnology, Microbiology and Food Evaluation, Division of Biotechnology and Microbiology, 159c Nowoursynowska Street, 02-787 Warsaw, Poland
*Corresponding author: email: [email protected]
AbStrAct
the aim of the study was to modify the composition of chicken burgers in terms of nutritional value by substitution of 20% of pork jowl with a mixture of rapeseed oil and linseed oil, and ad-dition of inulin (1%) or wheat fiber (3%). Substitution of pork jowl with vegetable oils resulted in significant increase in polyunsaturated fatty acids, and rosemary extract retarded the oxidation process of lipids. Addition of wheat fiber was helpful in maintaining the thermal processing yield and texture of burgers. Microbiological quality of vacuum packed burgers subjected to 21-day storage at +4°c±1 and -20°c±1 was satisfactory.

Ital. J. Food Sci., vol. 27 - 2015 299
INtroDuctIoN
Despite the constant dissemination of knowl-edge in the field of proper nutrition, consum-ers do not always consider it when choosing foods. results of research over a composition of a daily diet of the average Polish consumer indicated, among others, that the consump-tion structure of fatty acids and the level of in-take of fiber were not consistent with nutrition-al recommendations (DybKoWSKA et al., 2004; rADzyMIŃSKA et al., 2005). therefore, in recent years scientists and manufacturers have taken actions towards reformulation of various food products aimed at improving their nutrition-al value (WASzKoWIAK et. al., 2001; KoWALSKI and Pyrcz, 2009).
Since meat products provide considerable amounts of fat to the diet (GIVeNS et al., 2006), practical strategies of modifying their nutri-tional value include enrichment with polyun-saturated fatty acids (PuFA) (JIMéNez-coL-MeNero, 2007; Pyrcz et al., 2007; VALeN-cIA et al. 2006; ÖzVurAL and VurAL, 2008). Fatty acid (FA) composition of meat products may be changed by introducing of vegeta-ble or fish oil into the composition of formu-la or by replacing some animal fatty raw ma-terial with vegetable oil. However, the substi-tution of the animal fatty raw material with vegetable oil may have negative effect on the technological quality and sensory desirabili-ty of the product, among others, the increase of thermal loss, the acceleration of fatty acid oxidation process (NItScH, 2007; ANDréS et al., 2009; DecKer and PArK, 2010). In order to prevent adverse changes in quality of meat products prepared with vegetable oil, addition of other ingredients of natural origin may be applied. Potential deterioration of structure or sensory attributes of such products could be avoided by using both vegetable oil and fiber preparation (VurAL et al., 2004; JAVIDIPour et al., 2005). the effective method for retarda-tion of the FA oxidation of meat products en-riched with unsaturated fatty acids is the ad-dition of antioxidants of natural origin, such as plant extracts (GeorGANteLIS et al., 2007; ForeLL et al., 2010).
recently, ready-to-eat meat products have grown in popularity with Polish consumers (StANGIerSKI and KIJoWSKI, 2002; GórSKA-WArSeWIcz, 2007). therefore, the main ob-jective of the present study was to develop a popular in Poland ready-to-eat meat product, which is chicken burger, with improved nutri-tional value. Launching such a product into market would facilitate composing a quotidian diet without necessity of changing eating hab-its or giving up favourite meals. this work in-cludes determination of the effect of 20% sub-stitution of pork jowl with a mixture of vegeta-ble oils (rapeseed oil and linseed oil in mass ra-
tio 7 to 3) and addition of inulin (1%) or wheat fiber (3%) on physical, chemical, and microbi-ological of chicken burgers.
MAterIALS AND MetHoDS
Materials
raw materials: chilled chicken thigh meat and pork jowl, were collected from the local meat processing plant (Karczew near Warsaw, Poland). Pork jowl (about 10 kg) was purchased once, then coarse ground in a laboratory grind-er Mesko WN60 (Mesko, Skarżysko-Kamienna, Poland) equipped with a plate with three kid-ney-shaped orifices. the ground jowl was divid-ed into four lots, which were vacuum packed and stored at -20°c±1 until further use. chick-en meat (about 4 kg) was purchased prior to the each replication of experiment.
Fiber preparations were obtained from the manufacturers: inulin orafti® HPX from be-neo-orafti Ltd. (tienen, belgium) and wheat fib-er Vitacel WF400® from J. rettenmeier & Söhne GmbH + co. (rosenberg, Germany). cold pressed unrefined vegetable oils: rapeseed oil and lin-seed oil, and spices were obtained from the lo-cal supermarket.
About 24 h prior to the production of chick-en burgers, inulin gel was prepared: 1 part of inulin powder was dissolved in 3 parts of water using an electric blender braun Multiquick 7 (braun GmbH, Kronberg, Germany). the solu-tion was heated to boiling. Heating was contin-ued until a clear solution was obtained. the in-ulin solution was chilled at the room tempera-ture for 60 min, then placed in a laboratory re-frigerator (4°c±1).
A mixture of vegetable oils was used in the production process of burgers in the form of an emulsion with soy protein. the emulsion was prepared directly before the onset of pro-duction of burgers. rapeseed oil and linseed oil were used in a mass ratio 7 to 3, to prepare the mixture of oils. Soy protein isolate SPI 733 (Solae ™, St. Louis, Mo, uSA) was rehydrated (1 part of dry preparation: 4 parts of water) using water provided in the composition of formula. to obtain the emulsion the mixture of oils was mixed with hydrated soy protein using the elec-tric blender (braun Multiquick 7) at low speed. the mass ratio of oils, rapeseed and linseed oil, was adopted on the basis of literature data on the nutritional properties of oils and the appli-cability of them as ingredients in meat prepa-rations, as well as own calculation (KuNAcHo-WIcz et al., 2005; MIŃKoWSKI et al., 2010). the calculation suggested that the content of poly-unsaturated fatty acids (PuFA) in chicken burg-ers, as a result of modification of the recipe com-position, should not be less than 1.5 g per 100 g of product.

300 Ital. J. Food Sci., vol. 27 - 2015
Fig. 1 - thiobarbituric acid reactive substances (tbArS) values of chicken burgers formulated with different combinations of pork jowl, vegetable oils and dietary fiber preparations, during 21 days of storage at +4°c±1 (a) and at -20°c±1 (b).For product description see table 1.a-cMeans in the same figure (a, b) without a common lowercase letter differ significantly (p < 0.05) – influence of recipe com-position of burgers (product formula) on tbArS value of burgers stored in different periods.A-DMeans in the same figure (a, b) without a common lowercase letter differ significantly (p < 0.05) – influence of storage time on tbArS value of burgers of each formula.
table 1 - composition of chicken burgers containing different combinations of pork jowl, vegetable oils, and dietary fiber preparation.
Ingredient Product formulaa
PC PO POI POW
Chicken thigh meat (%) 85.0 85.0 85.0 85.0Pork jowl (%) 15.0 12.0 12.0 12.0Mixture of rapeseed and linseed oil (%) - 3.0 3.0 3.0Total raw materials (%) 100.0 100.0 100.0 100.0Waterb (%) 10.0 10.0 10.0 10.0Sodium chloridec (%) 1.8 1.8 1.8 1.8Soy protein isolatec (%) 1.5 1.5 1.5 1.5Black pepperc (%) 0.3 0.3 0.3 0.3Rosemary extractc (%) - 0.03 0.03 0.03Inulinc (%) - - 1.0 -Wheat fiberc (%) - - - 3.0
aProduct formula: PC - control burgers; PO, - burgers formulated with substitution of 20% of pork jowl by mixture of vegetable oils; POI - burgers formulated with substitution of 20% of pork jowl by mixture of vegetable oils, and added inulin; POW - burgers formulated with substitution of 20% of pork jowl by mixture of vegetable oils, and added wheat fiber. bIn re-lation to the mass of chicken meat and pork jowl (total raw materials). cIn relation to the mass of chicken meat, pork jowl and water.

Ital. J. Food Sci., vol. 27 - 2015 301
Chicken burger preparation
Four formulas of chicken burgers with dif-ferent combinations of pork jowl, vegetable oils, and dietary fiber preparation (Pc, Po, PoI, PoW) were prepared (table 1). the level of substitu-tion of pork jowl with the mixture of vegetable oils and the addition level of inulin or wheat fib-er were adopted on the basis of previous stud-ies results (ceGIeŁKA and PĘczKoWSKA, 2008; ceGIeŁKA, 2011).
before the production of burgers, pork jowl was thawed (4°c±1, 12 h). chicken meat and pork jowl were ground using a laboratory grind-er Mesko WN60 equipped with a plate having 5 mm diameter orifices. Meat batters were pre-pared in laboratory mixers Kenwood KM 070 (Kenwood Ltd., Havant, england). After mixing of chicken meat with Nacl (about 5 min) fatty raw materials were added: pork jowl only (Pc) or pork jowl and emulsion of oils with soy pro-tein isolate (Po, PoI, PoW). rosemary extract Flavour Guard P GIN:601331 (chr. Hansen A/S, Hørsholm, Denmark) was added to bat-ters containing oils. After the next 5 min, oth-er ingredients were added: black pepper, hy-drated soy protein isolate (Pc), and – depend-ing on the product formula – inulin gel (PoI) or wheat fiber (PoW). Mixing was continued un-til a homogenous distribution of all the ingre-dients was obtained (about 10 min).
burgers (100 g±1) were formed using a ham-burger mould (about 10.0 cm diameter and 1.0 cm high) and placed in laboratory refrigera-tor (-28°c±2) for 30 min, in order to maintain the shape. burgers were cooked in a commer-cial electric grill (unox S.p.A., Vigodarzere-Pa-dova, Italy) preheated to reach the temperature of 200°c. cooking was continued until the in-ternal temperature of burger reached 72°c. the temperature of burgers was monitored using a portable skewer digital thermometer HI 98804 (Hanna Instruments, Woonsocket, rI, uSA). the burgers were then cooled at room temperature (about 30 min) over absorbent paper.
After cooling, chicken burgers of each formu-la were divided into two lots: the first one was left in the refrigerator at 4°c±1 until next day (about 24 h), and the second one was devoted to storage research.
the procedure was replicated four times.
Storage conditions
before the storage chicken burgers of each formula were vacuum packed in bags in lots of four and then stored at +4°c±1 and -20°c±1 for a maximum of 21 days.
Yield after thermal processing
yield after thermal processing of chicken burg-ers was determined by weight, after cooking and
chilling the products to about 4°c, in relation to the weight of raw burgers.
Chemical analysis
chemical analyzes were carried out on cooked and chilled (4°c±1, 24 h) chicken burgers.
content of moisture, protein, total fat, salt, and ash was determined using analytical tech-niques according to AoAc (1990). All analyzes were done in 2 replications.
Analysis of texture
Measurements of texture were conducted on cooked and chilled (4°c±1, 24 h) chicken burg-ers. the measurements were taken using the universal testing machine zwicki 1120 (zwick GmbH & co., ulm, Germany) equipped with the Warner-bratzler blade. Shear force (N), the max-imum value of the force registered during move-ment of the blade through the sample, was es-timated at the speed of cross-head of 50 mm/min. burger samples were prepared by cutting the products into cuboid-shaped pieces (9 mm high, 30 mm wide and 90 mm long). Five repli-cates were measured from five burger samples of each formula.
Fatty acid composition
Fatty acid (FA) composition was determined in cooked and chilled (4°c±1, 24 h) chicken burg-ers and in chicken burgers stored at +4°c±1 and -20°c±1 for 21 days.
to determine the contents of FA the lipid ex-tracts of the burgers were analyzed by gas chro-matography. Procedure proposed by FoLcH et al. (1957) was used for lipid extraction from the sample. Fatty acid methyl esters (FAMe) were obtained according to method of MorrI-SoN and SMItH (1964). chromatographic ana-lyzes of FAMe were performed using an Agilent 7890A Gc System gas chromatograph (Agilent technologies, Santa clara, cA, uSA) equipped with a split-spiltless injector and a flame ioniza-tion detector, using a fused silica capillary col-umn rt®-2330 (0.25 mm internal diameter and 105 m long; restek corp., bellefonte, PA, uSA). the mobile phase consisted of helium at a flow of 1.2 mL/min. the FAMes were identified by comparing their retention times with FAMes of the reference standards (Supleco 37 compo-nent Fame Mix; Sigma-Aldrich, St. Louis, Mo, uSA). quantification of FA was done by deter-mining the surface areas of their peaks. All an-alyzes were done in 2 duplicates.
Lipid oxidation
Lipid oxidation was assessed in cooked and chilled (4°c±1, 24 h) chicken burgers and in chicken burgers stored at +4°c±1 and -20°c±1

302 Ital. J. Food Sci., vol. 27 - 2015
for 7, 14 and 21 days. the 2-thiobarbituric acid (tbA) test was carried out in each sample in du-plicate. thiobarbituric acid reactive substances (tbArS) values were determined by an extrac-tion method according to the procedure of SHA-HIDI (1990). A constant coefficient of 2.34 was employed for converting the absorbance units to tbArS values, which were expressed as mg malondialdehyde/kg sample (mg MAD/kg).
Microbiological analysis
Microbiological analyzes were carried out in cooked and chilled (4°c±1, 24 h) chicken burg-ers and in chicken burgers stored at +4°c±1 and -20°c±1 for 7, 14 and 21 days.
the analyzes were conducted in Analytical center of Warsaw university of Life Sciences - SGGW (Warsaw, Poland) in conditions accord-ant to requirements of PN-eN ISo 7218:2008 standard (PcS, 2008). the microbiological cul-ture media were prepared according to PKN-ceN ISo/tS 11133-1:2009 standard (PcS, 2009). the preparation of test samples for microbiolog-ical analyzes, initial suspension and decimal di-lutions was carried out according to PN-eN ISo 6887-2:2005 (PcS, 2005b). For quantitative an-alyzes, 10 g of the sample from central part of burger was collected. Next, the first decimal di-lution was performed by dosing physiological solution with peptone according to PN-eN ISo 6887-1:2000 (PcS, 2000). Determination of to-tal bacteria count (tbc) was conducted accord-ing to PN-eN ISo 4833:2004+Ap1:2005 standard (PcS, 2005a) using PcA culture medium (Plate count Agar) of bio-rad company (bio-rad Lab-oratories, Inc., Herkules, cA, uSA). Determina-tion of coliform bacteria was conducted accord-ing to PN-ISo 8432:2007 standard (PcS, 2007) using VrbL medium (Violet red bile Lactose Agar; bio-rad) and bGbbL (bile Green brilliant Lactose broth; bio-rad). the presence of Sal-monella ssp. in 25 g of product was determined according to PN-eN ISo 6579:2003 standard
(PcS, 2003) using MKttn selective media (Mül-ler-Kauffman’s medium with tetrathionate and novobiocin), rVS (medium acc. to rappaport-Vassilliads with soya), XLD (xylose lysine deox-ycholate) and Hektoen of bio-rad company. the colonies typical for Salmonella ssp. and suspi-cious colonies were confirmed using API 20e bi-ochemical tests of bioMérieux company (bioMé-rieux Sp. z o.o., Warsaw, Poland).
Statistical analyses
Microbiological data was analyzed using Sta-tistica 6.0 (StatSoft Inc., tulsa, okla., u.S.A.). All the other data was analyzed using Statgraph-ics Plus 4.1. (StSc Inc., rocville, MD, u.S.A.) by means of the one-way ANoVA test. Differ-ences between burger formulas were tested by the tukey HSD test. Pearson’s correlation coef-ficients (r) were calculated to determine the lin-ear correlation between chosen quality attrib-utes of chicken burgers.
reSuLtS AND DIScuSSIoN
Yield after thermal processing, chemical composition and texture
yield after thermal processing of chicken burg-ers ranged from 82.0 to 88.4% and was not af-fected (p > 0.05) by applied modifications of the composition of formula (table 2).
the results obtained in this study are in agree-ment with those obtained by ANDréS et al. (2009) who showed that an introduction of squid oil into the composition of formula of frankfurters instead of beef tallow did not affect thermal loss of the product. Pyrcz et al. (2007), LóPez-LóPez et al. (2009), and youSSeF and bArbut (2011) proved, in turn, that thermal loss of scalded sau-sages increased as the result of replacement of some animal fat with vegetable oil. Decrease in processing yield of meat products enriched with
table 2 - Processing yield, chemical composition, and shear force of chicken burgers formulated with different combinations of pork jowl, vegetable oils, and dietary fiber preparation.
Characteristic Product formula1
PC PO POI POW
Processing yield (%) 88.4±3.9a 84.5±3.6a 82.0±2.8a 87.7±4.6a
Moisture (%) 62.3±0.2a 62.8±0.7a 62.3±0.1a 62.6±0.6a
Protein (%) 18.0±0.5a 18.4±0.6a 18.7±0.1a 18.3±0.1a
Fat (%) 14.5±0.6a 13.3±1.7a 13.0±1.3a 13.7±0.8a
Chlorides (%) 2.3±0.1a 2.3±0.1a 2.2±0.1a 2.3±0.1a
Ash (%) 2.7±0.1a 2.7±0.2a 2.7±0.2a 2.8±0.2a
Shear force (N) 31.1±2.6b 23.7±1.6a 21.9±2.5a 29.9±1.1b
1Product formula: see Table 1.a, bMeans within a raw without a common lowercase letter differ significantly (p < 0.05).

Ital. J. Food Sci., vol. 27 - 2015 303
oil may be counteracted - like in this study - by an application of oil in form of an emulsion with hydrated vegetable protein (youSSeF and bAr-but, 2011) or combined addition of oil and fib-er preparation (VurAL et al., 2004; JAVIDIPour et al., 2005).
chemical composition of chicken burgers for-mulated with different combinations of pork jowl, vegetable oils, and dietary fiber prepara-tion is shown in table 2. the content of any of the analyzed chemical component of burgers was not differentiated significantly (p > 0.05) by the applied modifications the composition of for-mula. Slightly lower fat content in burgers pre-pared with a contribution of vegetable oils (Po, PoI, PoW), when compared to control product (Pc), could have been caused by poorer oil main-tenance in protein matrix of the product, and as a consequence its loss during thermal treatment.
the results obtained in this study are in agreement with those presented by KAyAArDI and GÖK (2003), MuGuerzA et al. (2003), PeL-Ser et al. (2007) and cÁcereS et al. (2008) who also showed that replacement of some animal fatty raw material with oil did not exert any in-fluence on the chemical composition of scald-ed sausages and raw fermented sausages. In contrast, GArMIeNe et al. (2007), and LóPez-LóPez et al. (2009) found in studies on frank-furters and scalded sausages, respectively, that substitution of some animal fatty raw material with oil resulted in a significant increase in wa-ter content and decrease in protein content in these meat products.
enrichment of ready-to-eat meat prod-ucts with wheat fiber: beef burgers (ceGIeŁKA and boNDerSKI, 2010) and poultry burgers (ceGIeŁKA and PĘczKoWSKA, 2008), did not differentiate the chemical composition of these products when compared to their counterparts prepared without the fiber. It was also shown that the application of inulin did not affect the chemical composition of turkey meat balls (erGÖNÜL et al., 2009).
Mean values of shear force measured in chick-en burgers ranged from 21.9 N to 31.1 N (ta-ble 2). Measurements of shear force of chicken burgers revealed that the texture of products was impacted (p < 0.05) by the applied modifi-cations the composition of formula (table 2). It was found that substitution of 20% of pork jowl with vegetable oils (Po) or application of both oils and inulin (PoI) resulted in a significant (p < 0.05) decrease of shear force when compared to the control product (Pc). the product enriched with oils and wheat fiber (PoW) was character-ized by a comparable (p > 0.05) shear force to the control product (Pc).
In contrast to the results of this study, in-strumental measurements of texture of scalded sausages showed that substitution of some ani-mal fat with vegetable oil significantly decreased hardness of these products (AMbroSIADIS et al.,
1996; Pyrcz et al., 2007; ÖzVurAL and VurAL, 2008). However, in studies on raw sausages it was reported that the deterioration of texture of sausages prepared with oil could be counteract-ed by addition of dietary fiber preparation (Vu-rAL et al., 2004; JAVIDIPour et al., 2005).
Some literature findings suggest that die-tary fiber preparations could help to obtain the desired texture of ready-to-eat meat products. It was found that the addition of wheat fib-er increased the shear force of poultry burgers (ceGIeŁKA and PĘczKoWSKA, 2008) and beef burgers (ceGIeŁKA and boNDerSKI, 2010). In other studies erGÖNÜL et al. (2009) showed that inulin addition did not affect significantly the in-strumental hardness of turkey meat balls. the above mentioned products, however, did not con-tain vegetable oil in the composition of formula.
Fatty acid composition
the share of main FA in the overall FA pool of chicken burgers is shown in tables 3, 4 and 5. the results obtained showed that substitution of 20% of pork jowl with a mixture of vegetable oils did not totally changed fatty acid profile of chicken burgers, but improved nutritional value of them in terms of the share of saturated and polyunsaturated fatty acids (SFA and PuFA).
Products enriched with vegetable oils, irre-spectively of an addition of fiber preparation (Po, PoI, PoW), contained significantly (p < 0.05) less saturated fatty acids (SFA) than the control prod-uct (Pc; table 3). In burgers of all the formulas, palmitic acid (c16:0) and stearic acid (c18:0) were present in the highest amounts among SFA, and their contents were significantly (p < 0.05) higher in the Pc product when compared to burgers prepared with vegetable oils. Introduc-tion of a mixture of vegetable oils into the compo-sition of formula of chicken burgers did not sig-nificantly (p > 0.05) increase the share of mono-unsaturated fatty acids (MuFA) in the overall FA pool (table 4), but Po, PoI, and PoW products contained significantly (p < 0.05) more PuFA, in-cluding nutritionally valuable PuFA n-3, when compared to the Pc product (table 5). Among MuFA, oleic acid (c18:1 n-9) was predominant is the products of all the formulas. In burgers prepared with oils, significantly lower (p < 0.05) amounts of myristoleic (c14:1) and elaidic acid (c18:1t) were found when compared to the Pc product.
the content of polyunsaturated fatty acids (PuFA) in chicken burgers with oils (Po, PoI, PoW) was higher than 2.5 g per 100 g of prod-uct. Irrespectively of the burger formula, the highest share in PuFA pool had linoleic acid (LA; c18:2 n-6). the LA content in burgers was not significantly (p > 0.05) differentiated by appli-cation of vegetable oils. chicken burgers of all the formulas contained relatively high amounts of linolenic (c18:3 n-3), arachidonic (c20:4 n-6)

304 Ital. J. Food Sci., vol. 27 - 2015
table 3 - SFA of chicken burgers (g/100 g total FA) formulated with different combinations of pork jowl, vegetable oils, and dietary fiber preparations, with different storage conditions, during 21 days of storage.
FA/FA group Storage conditions Product formula1
PC PO POI POW
Capric C10:0 +4°C±1, 24 h 0.081aA 0.070aA 0.046aA 0.062aA
+4°C±1, 21 d 0.083aA 0.073aA 0.044aA 0.060aA
-20°C±1, 21d 0.079aA 0.066aA 0.041aA 0.076aA
Lauric C12:0 +4°C±1, 24 h 0.648aA 0.562aA 0.522aA 0.512aA
+4°C±1, 21 d 0.643aA 0.545aA 0.512aA 0.511aA
-20°C±1, 21d 0.643aA 0.531aA 0.476aA 0.516aA
Myristic C14:0 +4°C±1, 24 h 1.466bA 1.212aA 1.185aA 1.152aA
+4°C±1, 21 d 1.367abA 1.218abA 1.188aA 1.154aA
-20°C±1, 21d 1.469bA 1.206abA 1.163aA 1.158aA
Palmitic C16:0 +4°C±1, 24 h 21.576bA 18.350aA 18.114aA 17.638aA
+4°C±1, 21 d 21.740bA 18.550aA 18.244aA 17.868aA
-20°C±1, 21d 21.733bA 18.579aA 18.392aA 17.915aA
Stearic C18:0 +4°C±1, 24 h 8.633bA 7.352aA 7.351aA 7.023aA
+4°C±1, 21 d 8.672bA 7.395aA 7.334aA 7.112aA
-20°C±1, 21d 8.656bA 7.537aA 7.604aA 7.256aA
Arachidic C20:0 +4°C±1, 24 h 0.130aA 0.179bA 0.179bA 0.193bA
+4°C±1, 21 d 0.129aA 0.180bA 0.177bA 0.184bA
-20°C±1, 21d 0.129aA 0.181bA 0.182bA 0.195bA
Behenic C22:0 +4°C±1, 24 h ND2 0.073aA 0.076aA 0.085aA
+4°C±1, 21 d ND2 0.069aA 0.076aA 0.081aA
-20°C±1, 21d ND2 0.073aA 0.079aA 0.085aA
SFA +4°C±1, 24 h 32.944bA 28.142aA 27.827aA 27.007aA
+4°C±1, 21 d 33.128bA 28.378aA 27.930aA 27.315aA
-20°C±1, 21d 33.120bA 28.518aA 28.294aA 27.533aA
1Product formula: see Table 1. 2ND - not detected (the content of the FA was lower than 0.05 g/100 g of total FA). abcMeans within a row without a common low-ercase letter differ significantly (p < 0.05) – influence of product formula on FA content in burgers stored in different conditions. AMeans within a column with a common uppercase letter do not differ significantly (p < 0.05) – influence of storage conditions on FA content in burgers of different formula.
table 4 - MuFA of chicken burgers (g/100 g total FA) formulated with different combinations of pork jowl, vegetable oils, and dietary fiber preparations, with different storage conditions, during 21 days of storage.
FA/FA group Storage conditions Product formula1
PC PO POI POW
Myrictoleic C14:1 +4°C±1, 24 h 0.133bA 0.114aA 0.113aA 0.115aA
+4°C±1, 21 d 0.132bA 0.108aA 0.112aA 0.114aA
-20°C±1, 21d 0.135bA 0.108aA 0.112aA 0.113aA
Palmitoleic C16:1 +4°C±1, 24 h 3.456aA 2.874aA 2.824aA 2.876aA
+4°C±1, 21 d 4.438bcA 2.860aA 2.800aA 2.853aA
-20°C±1, 21d 3.446cA 2.821aA 2.870abA 2.847aA
Elaidic C18:1t +4°C±1, 24 h 0.372bA 0.282abA 0.288abA 0.271aA
+4°C±1, 21 d 0.542bA 0.311aA 0.325aA 0.305aA
-20°C±1, 21d 0.455abA 0.306aA 0.317aA 0.306aA
Oleic C18:1 (n-9) +4°C±1, 24 h 40.237abA 40.837abA 39.712aA 42.830bA
+4°C±1, 21 d 40.429aA 41.096aA 39.810aA 40.911aA
-20°C±1, 21d 40.313aA 40.953aA 39.499aA 40.779aA
Eicosanoic C20:1 +4°C±1, 24 h 0.734aA 0.770aA 0.744aA 0.773aA
+4°C±1, 21 d 0.731aA 0.774aA 0.741aA 0.779aA
-20°C±1, 21d 0.731aA 0.778aA 0.747aA 0.767aA
Eruic C22:1 +4°C±1, 24 h 0.054aA 0.084aA 0.055aA 0.061aA
+4°C±1, 21 d 0.045bA 0.018aA 0.017aA 0.017aA
-20°C±1, 21d 0.038bA 0.019aA 0.039bA 0.019aA
MUFA +4°C±1, 24 h 45.959aA 45.960aA 44.720aA 47.926aA
+4°C±1, 21 d 48.297aA 48.234aA 46.749aA 48.066aA
-20°C±1, 21d 48.143aA 48.113aA 46.544aA 47.705aA
1Product formula: see Table 1. 2ND - not detected (the content of the FA was lower than 0.05 g/100 g of total FA). abcMeans within a row without a common low-ercase letter differ significantly (p < 0.05) – influence of product formula on FA content in burgers stored in different conditions. AMeans within a column with a common uppercase letter do not differ significantly (p < 0.05) – influence of storage conditions on FA content in burgers of different formula.

Ital. J. Food Sci., vol. 27 - 2015 305
and eicosatrienoic acid (c20:3 n-3). the signifi-cant (p < 0.05) increase in the share of PuFA in overall FA pool in Po, PoI, and PoW products - when compared to Pc product - was mainly de-termined by an increased content of linolenic acid. the presence of valuable nutritionally long-chain PuFA n-3 acids: eicosapentaenoic (ePA) and docosahexaenoic acid (DHA), was not ob-served in the products prepared with oils. this was possibly due to the fact that the share of vegetable oils in the recipe composition of burg-ers was relatively low.
the ratio of PuFA to SFA and the ratio of PuFA n-6 to PuFA n-3 are often used in nutri-tional characteristics of lipids in food. the val-
table 5 - PuFA of chicken burgers (g/100 g total FA) formulated with different combinations of pork jowl, vegetable oils, and dietary fiber preparations, with different storage conditions, during 21 days of storage.
FA/FA group Storage conditions Product formula1
PC PO POI POW
Linoleic C18:2 (n-6) +4oC±1, 24 h 13.341aA 14.939aA 15.508aA 15.555aA
+4oC±1, 21 d 13.054aA 14.730aA 15.433aA 15.400aA
-20oC±1, 21d 13.274aA 14.700aA 15.403aA 15.515aA
γ- Linolenic C18:3 (n-6) +4oC±1, 24 h 0.081aA 0.072aA 0.072aA 0.068aA
+4oC±1, 21 d 0.077aA 0.071aA 0.072aA 0.068aA
-20oC±1, 21d 0.080aA 0.070aA 0.069aA 0.071aA
Linolenic C18:3 (n-3) +4oC±1, 24 h 1.631aA 5.353bA 6.410bA 6.092bA
+4oC±1, 21 d 1.599aA 5.248bA 6.480bA 6.932bA
-20oC±1, 21d 1.587aA 5.211bA 6.362bA 6.015bA
Eicosadienoic C20:2 (n-6) +4oC±1, 24 h 0.327aA 0.291aA 0.275aA 0.280aA
+4oC±1, 21 d 0.324aA 0.290aA 0.271aA 0.280aA
-20oC±1, 21d 0.324aA 0.296aA 0.289aA 0.285aA
Eicosatrienoic C20:3 (n-6) +4oC±1, 24 h 0.110aA 0.103aA 0.101aA 0.098aA
+4oC±1, 21 d 0.112aA 0.099aA 0.096aA 0.098aA
-20oC±1, 21d 0.114aA 0.104aA 0.104aA 0.101aA
Eicosatrienoic C20:3 (n-3) +4oC±1, 24 h 0.158aA 0.155aA 0.134aA 0.140aA
+4oC±1, 21 d 0.140aA 0.115aA 0.107aA 0.110aA
-20oC±1, 21d 0.124aA 0.115aA 0.106aA 0.107aA
Arachidonic C20:4 (n-6) +4oC±1, 24 h 0.198aA 0.212aA 0.202aA 0.195aA
+4oC±1, 21 d 0.196aA 0.173aA 0.179aA 0.172aA
-20oC±1, 21d 0.216aA 0.226aA 0.218aA 0.179aA
Eicosapentaenoic (EPA) C20:5 (n-3) +4oC±1, 24 h ND2 ND2 ND2 ND2
+4oC±1, 21 d ND2 ND2 ND2 ND2
-20oC±1, 21d ND2 ND2 ND2 ND2
Docosahexaenoic (DHA) C22:6 (n-3) +4oC±1, 24 h ND2 ND2 ND2 ND2
+4oC±1, 21 d ND2 ND2 ND2 ND2
-20oC±1, 21d ND2 ND2 ND2 ND2
PUFAs +4oC±1, 24 h 15.862aA 21.125bA 22.701bA 22.427bA
+4oC±1, 21 d 15.501aA 20.726bcA 22.639cA 22.058cA
-20oC±1, 21d 15.720aA 20.722bcA 22.569cA 22.271cA
1Product formula: see Table 1. 2ND - not detected (the content of the FA was lower than 0.05 g/100 g of total FA). abcMeans within a row without a common low-ercase letter differ significantly (p < 0.05) – influence of product formula on FA content in burgers stored in different conditions. AMeans within a column with a common uppercase letter do not differ significantly (p < 0.05) – influence of storage conditions on FA content in burgers of different formula.
ues of these ratios for control burgers (Pc) were 0.48 and 7.91, respectively (table 6). the intro-duction of mixture of vegetable oils into the for-mula composition of burgers resulted in signif-icant (p < 0.05) changes in the value of both ra-tios. For the Po, PoI, and PoW burgers the ra-tios of PuFA to SFA ranged from 0.75 to 0.83, and the ratios of PuFA n-6 to PuFA n-3 varied between 2.47 and 2.84. the significant (p < 0.05) increase in the PuFA to SFA ratio, and decrease in the PuFA n-6 to PuFA n-3 ratio in burgers for-mulated with oils - when compared to the con-trol product - was the positive effect indicating improvement of the nutritional value of fat in these products.

306 Ital. J. Food Sci., vol. 27 - 2015
regardless of the temperature of 21-day stor-age no significant (p > 0.05) changes in the con-tent of any FA were found in any of the burgers.
the results obtained confirm the thesis put forward by JIMéNez-coLMeNero (2007), who - based on the literature data - reported that sub-stitution of some animal fatty raw material with oil was an effective method of improvement of FA composition in a wide range of meat prod-ucts. usefulness of linseed oil and rapeseed oil in improvement to nutritional value of lipids in meat products, expressed by increased contri-bution of uFA and PuFA n-3, was confirmed by GArMIeNe et al. (2007), MAKAŁA and JerzeWS-KA (2008) in scalded sausages, and by PeLSer et al. (2007) in fermented sausages. It has been also found that the FA composition of meat prod-ucts may be modified by the application of ol-ive oil (KAyAArDI and GÖK, 2003), soybean oil (MuGuerzA et al., 2001), or mixture of vegeta-ble oils (ÖzVurAL and VurAL, 2008; LoPéz-Lo-Péz et al., 2009). Mixture of oils was also used for an improvement in nutritional value of li-pids in ready-to-eat meat products: beef burg-ers (ForeLL et al., 2010) and pork patties (Lee et al., 2006).
Lipid oxidation
changes in tbArS value in chicken burg-ers subjected to storage at the temperature of +4°c±1 and -20°c±1 are presented in Figs. 1a and 2b, respectively. the highest tbArS values were observed in control burgers (Pc), irrespec-tively of the storage temperature and time. Sig-nificantly lower (p < 0.05) tbArS values were observed in burgers prepared with vegetable
oils (Po, PoI, PoW), which meant inhibition of the oxidation process of lipids when compared to the Pc product. It should be noted that en-richment of burgers with oils was accompanied by addition of rosemary extract, which was in-tended to protect FA against oxidation.
the results obtained confirmed that, irrespec-tively of product formula, freezing was better method of storage than refrigerating. Although lowering the temperature of the storage from +4 to -20 degrees did not stop completely the oxi-dation process of FA in burgers, it was inhibit-ed significantly.
When compared to the results presented by other authors (FerNÁNDez-LóPez et al., 2005; PIetrzAK and MyroN, 2008; ForeLL et al., 2010), the tbArS values in chicken burgers were relatively low, both after manufacturing (24 h) and 21 days of storage.
Incorporation of oil into the formula compo-sition of meat product may influence the oxi-dative stability of lipids in the product. Accord-ing to KAyAArDI and GÖK (2003), the adverse changes of lipids in beef sausage were caused by the partial replacement of beef tallow with olive oil. In turn, MuGuerzA et al. (2003), and PeLSer et al. (2007) reported that replacement of some animal fatty raw material with vegeta-ble oil in fermented sausages did not intensify the adverse changes in lipids, such as oxidation and hydrolysis. MAKAŁA and JerzeWSKA (2008) also found that the quality of frankfurters en-riched with linseed oil, in terms of lipids oxida-tive changes, was satisfactory even after 8-week of refrigerating storage.
In order to extend the storage stability of chicken burgers with enriched oils, an anti-
table 6 - Proportions of PuFA : SFA and PuFA n-6 : PuFA n-3 in chicken burgers formulated with different combinations of pork jowl, vegetable oils, and dietary fiber preparations, with different storage conditions, during 21 days of storage.
FA group Storage conditions Product formula1
PC PO POI POW
PUFA n-6 +4°C±1, 24 h 14.056aA 15.617aA 16.157aA 16.196aA
+4°C±1, 21 d 13.762aA 15.363aA 16.052aA 16.018aA
-20°C±1, 21 d 14.010aA 15.397aA 16.082aA 16.160aA
PUFA n-3 +4°C±1, 24 h 1.806aA 5.508bA 6.544bA 6.231bA
+4°C±1, 21 d 1.739aA 5.364bA 6.587bA 6.041bA
-20°C±1, 21 d 1.711aA 5.362bA 6.487bA 6.122bA
PUFA : SFA +4°C±1, 24 h 0.48aA 0.75bA 0.82bA 0.83bA
+4°C±1, 21 d 0.47aA 0.73bcA 0.81cA 0.81cA
-20°C±1, 21 d 0.48abA 0.73bcA 0.80cA 0.81cA
PUFA n-6 : PUFA n-3 +4°C±1, 24 h 7.91bA 2.84aA 2.4747aA 2.60aA
+4°C±1, 21 d 7.91bA 2.86aA 2.44aA 2.65aA
-20°C±1, 21 d 8.19bA 2.89aA 2.48aA 2.64aA
1Product formula: see Table 1. abcMeans within a row without a common lowercase letter differ significantly (p < 0.05) – influence of product formula on FA con-tent in burgers stored in different conditions. AMeans within a column with a common uppercase letter do not differ significantly (p < 0.05) – influence of storage conditions on FA content in burgers of different formula.

Ital. J. Food Sci., vol. 27 - 2015 307
oxidant additive of natural origin, which was rosemary extract, was used. the effectiveness of this component in the inhibition of lipid ox-idation had already been confirmed in studies on ready-to-eat meat products (NISSeN et al., 2004; FerNÁNDez-LóPez et al., 2005; GeorG-ANteLIS et al., 2007; ForeLL et al., 2010; KoNG et al., 2010).
Microbiological analysis
the changes in tbc in chicken burgers stored at the temperature of +4°c±1 and -20°c±1 are shown in Figs. 2a and 2b, respectively. It was found that 24 h after preparing, tbc in burgers was as follows: 2.54 log cfu/g for Pc product, 2.73 log cfu/g for PoI product, 2.78 log cfu/g for Po product, and 2.88 log cfu/g for PoW prod-uct, and was not significantly (p < 0.05) differen-tiated by the applied modifications of the com-position of formula.
After the 21-day storage at +4oc±1, the tbc increased to the level of: 5.32 log cfu/g for PoI product, 5.61 log cfu/g for PoW product, 7.40
log cfu/g for Po product, and 8.21 log cfu/g for Pc product. the increase of tbc during the whole period of storage was statistically signif-icant (p < 0.05) only in the Pc and Po product.
After the 21-day storage at -20oc±1 the tbc increased to the level of: 2.54 log cfu/g for PoI product, 2.65 log cfu/g for PoW product, 2.79 log cfu/g for Po product, and 2.80 log cfu/g for Pc product. the tbc of any of the frozen prod-ucts was not significantly (p < 0.05) differentiat-ed during the whole period of storage. For chick-en burgers of each formula the tbc was signifi-cantly (p < 0.05) higher in the refrigerated prod-uct than in the frozen one after 21 days of stor-age (results not showed).
the presence of Salmonella ssp. was not found in chicken burgers, and the number of coliform bacteria was lower than 10 cfu/g during the whole storage period, regardless of the prod-uct formula and storage conditions (tempera-ture and time).
the results obtained proved that the microbi-ological quality of chicken burgers of all the four formulas fulfilled the requirements mentioned
Fig. 2 - total bacteria count of chicken burgers formulated with different combinations of pork jowl, vegetable oils and die-tary fiber preparations, during 21 days of storage in refrigerator (a) or freezer (b).For product description see table 1.

308 Ital. J. Food Sci., vol. 27 - 2015
in ec reGuLAtIoN (2007) with respect to Sal-monella ssp. Despite the fact that the regulation does not require determination of coliform bacte-ria nor total bacteria count in ready-to-eat meat products from poultry meat, it should be noticed that they may influence both health safety and shelf-life of these products.
the results obtained are in agreement with these obtained ANDréS et al. (2009) who showed that microbiological quality of poultry frankfurt-ers containing squid oil instead of beef tallow was not significantly differentiated when compared to the control product. Similarly, LoPéz-LoPéz et al. (2009), on the basis of determination of total bacte-ria count and lactic bacteria count, found that mi-crobiological quality of pork frankfurters enriched with olive or algae oil did not differ significantly during storage. tbc in frankfurters after manu-facturing ranged - depending on product formu-la - from 2.64 to 4.18 log cfu/g, and was compa-rable to the results obtained in the present study.
coNcLuSIoNS
After summarizing the results of this study it was found that 20% substitution of pork jowl with a mixture of vegetable oils in the composi-tion of formula of chicken burgers resulted in an improvement in nutritional quality in terms of FA composition. chicken burgers enriched with oils contained significantly less SFA and more PuFA, including nutritionally valuable PuFA n-3, than the control product, what means the im-provement in nutritional value of lipids in these products. the oxidation process of lipids in prod-ucts containing vegetable oils could be retard-ed significantly by the addition of 0.03% of rose-mary extract. the results of measurements of the shear force of burgers indicated that addition of 3% of wheat fiber to product prepared with the mixture of vegetable oils as the 20% substitute of pork jowl counteracted the changes in texture. Microbiological quality of vacuum-packed burg-ers subjected to 21-day storage at the temper-ature of +4°c±1 and -20°c±1 was satisfactory.
AcKNoWLeDGeMeNtS
this work was financially supported by the Polish Ministry of Science and Higher education in 2009-2011 (grant No N N312 210936).
reFereNceS
Ambrosiadis J., Kyriakos P.V. and Georgakis S.A. 1996. Phys-ical, chemical and sensory characteristics of cooked meat emulsion style products containing vegetable oils. Int. J. Food Sci. & technol. 31: 189-194.
Andrés S.c., zaritzky N.e. and califano A.N. 2009. Innova-tions in the development of healthier chicken sausages formulated with different lipid sources. Poultry Sci. 88: 1755-1764.
AoAc. Association of official Analytical chemists. 1990. of-ficial methods of analysis. (15th ed.). Washington: AoAc.
cáceres e., Garciá M.L. and Selgas M.D. 2008. effect of pre-emulsified fish oil – as source of PuFA n-3 – on microstruc-ture and sensory properties of mortadella, a Spanish bo-logna-type sausage. Meat Sci. 80: 183-193.
cegiełka A. 2011. Wpływ stopnia wymiany podgardla wiepr-zowego mieszaniną olejów roślinnych na jakość burgerów drobiowych. zeszyty Naukowe uniwersytetu ekonomicz-nego w Poznaniu. 205: 158-166.
cegiełka A. and bonderski M. 2010. Wpływ dodatku pre-paratów błonnika pszennego na jakość hamburgerów wołowych. zeszyty Problemowe Postępów Nauk rolnic-zych. 552: 29-37.
cegiełka A. and Pęczkowska M. 2008. Wpływ wielkości dodat-ku preparatu błonnika pszennego na jakość hamburger-ów drobiowych. roczniki Instytutu Przemysłu Mięsnego i tłuszczowego. 46(2): 75-82.
Decker e.A. and Park y. 2010. Healthier meat products as functional foods. Meat Sci. 86: 49-55.
Dybkowska e., Waszkiewicz-robak b. and Świderski F. 2004. Assessment of n-3 and n-6 polyunsaturated fatty acid in-take in the average Polish diet. Pol. J. Food Nut. Sci. 13/54 (4): 409-414.
ec. european commission. 2007. commission regulation (ec) No 1441/2007 of 5 December 2007 amending regu-lation No 2073/2005 on microbial criteria for foodstuffs. official Journal of european union, L322, 1-12.
ergönül b., ergönül P.G. and obuz e. 2009. Funktionelle ei-genschaften prebiotischer zutaten in Fleischprodukten: chemische, physikalische und sensorische eigenschaften von mit Inulin und oligofruktose hergestellten Hackfleis-chbällchen. Fleischwirtschaft. 89(2): 140-143.
Fernández-López J., zhi N., Aleson-carbonell L., Perez-Alva-rez J.A. and Kuri V. 2009. Antioxidant and antibacteri-al activities of natural extracts: application in meatballs. Meat Sci. 69: 371-380.
Folch J., Lees M. and Stanley G.H.S. 1957. A simple method for the isolation and purification of total lipids from ani-mal tissues. J. biol. chem. 226: 497-509.
Forell S.c.P., ranalli N., zaritzky N.e., Andrés S.c. and cal-ifano A.N. 2010. effect of type of emusifiers and antioxi-dants on oxidative stability, colour and fatty acid profile of low-fat beef burgers enriched with unsaturated fatty ac-ids. Meat Sci. 86: 364-370.
Garmiene G., zaborskiene G., Salasaviciene A. and Liutkie-vicius A. 2007. Analyse der bildung von oxidations- und Hydrolyseprodukten: untersuchungen zu oxidations- und Hydrolyseprozessen in Fleischprodukten mit wertvollen zutaten. Fleischwirtschaft. 87(8): 100-103.
Georgantelis D., bekas G., Katikou P., Ambrosiadis I. and Fletouris D. 2007. effects of rosemary extract, chitosan and α-tocoferol on lipid oxidation and colour stability dur-ing frozen storage of beef burgers. Meat Sci. 75: 256-264.
Givens D.I., Kliem e. and Gibbs r.A. 2006. the role of meat as a source of n-3 polyunsaturated fatty acids in the hu-man diet. Meat Sci. 74: 209-218.
Górska-Warsewicz H. 2007. Żywność wygodna w sektorze mięsnym. Przem. Spoż. 61(4): 36-38.
Javidipour I., Vural H., Özbaş Ö.Ö. and tekin A. 2007. ef-fects of interesterified vegetable oils and sugar beet fibre on the quality of turkish-type salami. Int. J. Food Sci. & technol. 40: 177-185.
Jiménez-colmenero F. 2007. Healthier lipid formulation ap-proaches meat-based functional foods: technological op-tions for replacement of meat fats by non-meat fats. trends Food Sci. & technol. 18: 567-578.
Kayaardi S. and Gök V. 2003. effect of replacing beef fat with olive oil on quality characteristics of turkish soudjouk (sucuk). Meat Sci. 66: 249-257.
Kong b., zhang H. and Xiong y.L. 2010. Antioxidant activity of spice extracts in a liposome system and in cooked pork pat-ties and the possible mode action. Meat Sci. 85: 772-778.
Kowalski r., Pyrcz J. 2009. Innowacyjne dodatki technolog-iczne w przemyśle mięsnym. Przem. Spoż. 63(3): 28-32.
Kunachowicz H., Nadolna I., Przygoda b. and Iwanow K. 2005.

Ital. J. Food Sci., vol. 27 - 2015 309
tabele składu i wartości odżywczej żywności. PzWL, War-szawa, 91-148, 167-185.
Lee S., Faustman c., Djordjevic D., Faraji H. and Decker e.A. 2006. effect of antioxidants on stabilization of meat prod-ucts fortified with n-3 fatty acids. Meat Sci. 72: 18-24.
López-López I., cofrades S. and Jiménez-colmenero F. 2009. Low-fat frankfurters enriched with n-3 PuFA and edible seaweed: effect of olive oil and chilled storage on physic-ochemical, sensory and microbial characteristics. Meat Sci. 83: 148-154.
Mińkowski K., Jerzewska M., Grześkiewicz S. and ro-pelewska M. 2010. oleje roślinne – cenne źródło kwasów tłuszczowych o budowie trienowej oraz innych bioakty-wnych składników. tłuszcze Jadalne 45(1-2): 31-39.
Morrison W.r. and Smith M.L. 1964. Preparation of fatty acid methyl esthers and dimethylaccetates from lipid with bo-ron trifluoride methanol. J. Lipid res. 5: 600-608
Muguerza e., Ansorena D. and Astiasarán I. 2003. Improve-ment of nutritional properties of chorizo de Pamplona by replacement of pork backfat with soy oil. Meat Sci. 65: 1361-1367.
Nissen L.r., byrne D.V., bertelsen G. and Skibsted L.H. 2004. the antioxidative activity of plant extracts in cooked pork patties as evaluated by descriptive sensory profiling and chemical analysis. Meat Sci. 68: 485-495.
Nitsch P. 2007. Auf die Mischung kommt es an: omega-3-Fett-sauren als funktioneller zusatz in Fleischerzeugnissen. Fleischwirtschaft. 87(2): 46-51.
Özvural e.b. and Vural H. 2008. utilization of interesteri-fied oil blends in the production of frankfurters. Meat Sci. 78: 211-216.
PcS. Polish committee for Standardization. 1998. Polish Standard PN-ISo 41219:1998. Sensory analysis: Meth-odology: Valuation of foodstuffs using scaling methods. Warsaw, PcS.
PcS. Polish committee for Standardization. 2000. Polish Standard PN-eN ISo 6887-1:2000. Microbiology of food and animal feeding stuffs: Preparation of test samples, initial suspension and decimal dilutions for microbio-logical examination - Part 1: General rules for the prep-aration of the initial suspension and decimal dilutions. Warsaw, PcS.
PcS. Polish committee for Standardization. 2003. Polish Standard PN-eN ISo 6579:2003. Microbiology of food and animal feeding stuffs: Horizontal method for detection of Salmonella ssp. Warsaw, PcS.
PcS. Polish committee for Standardization. 2005a. Pol-ish Standard PN-eN ISo 4833:2004+Ap1:2005. Pol-ish Standard. Microbiology of food and animal feeding stuffs: Horizontal method for enumeration of microor-
ganisms: Plate method at the temperature of 30 degrees c. Warsaw, PcS.
PcS. Polish committee for Standardization. 2005b. Polish Standard PN-eN ISo 6887-2:2005. Microbiology of food and animal feeding stuffs: Preparation of test samples, in-itial suspension and decimal dilutions for microbiological examination - Part 2: Specific rules for the preparation of meat and meat product. Warsaw, PcS.
PcS. Polish committee for Standardization. 2007. Polish Standard PN-ISo 8432:2007. Microbiology of food and an-imal feeding stuffs: Horizontal method for enumeration of coliform bacteria: Plate method. Warsaw, PcS.
PcS. Polish committee for Standardization. 2008. Polish Standard PN-eN ISo 7218:2008. Microbiology of food and animal feeding stuffs: General requirements and rules for the microbiological examinations. Warsaw, PcS.
PcS. Polish committee for Standardization. 2009. Polish Standard PKN-ceN ISo/tS 11133-1:2009. Microbiolo-gy of food and animal feeding stuffs: Guidelines on prep-aration and production of culture media - Part 1: Gener-al guidelines on quality control of culture media prepared in labaratorium. Warsaw, PcS.
Pelser W.M., Linssen J.P.H., Legger A. and Houben J.H. 2007. Lipid oxidation in n-3 fatty acid enriched Dutch style fer-mented sausages. Meat Sci. 75: 1-11.
Pietrzak D., Myron M. 2008. Wpływ dodatku ekstraktu z rozmarynu na jakość hamburgerów drobiowych. rocz. Inst. Przem. Mięsn. tł. 46(3): 43-49.
Pyrcz J., Kowalski r. and Danyluk b. 2007. Jakość kutrow-anych kiełbas parzonych produkowanych z udziałem tłuszczów roślinnych. Med. Wet. 63(1): 118-122.
radzymińska M., borejszo z., Smoczyński S.S. and Kurzyńska M. 2005. Skład kwasów tłuszczowych w całodziennych posiłkach dzieci, uczniów i studentów. zywn-Nauk. tech-nol. Ja. 12(2): 118-125.
Shahidi F. 1990. the 2-thiobarbituricacid (tbA) methodolo-gy for the evaluation of warmed-over flavour and oxidative rancidity in meat products. In Proceedings of 36th Int. con-gress of Meat Sci. & techn. Havana, cuba, pp. 1008-1014.
Stangierski J., Kijowski J. 2002. Żywność wygodna z mięsa drobiowego. Mięso i Wędliny. 7: 12-20.
Valencia I., Ansorena D. and Astiasarán I. 2006. Nutrition-al and sensory properties of dry fermented sausages en-riched with n-3 PuFAs. Meat Sci. 72: 727-733.
Vural H., Javidipour I. and ozbas o.o. 2004. effects of inter-esterified vegetable oils and sugarbeet fiber on the quali-ty of frankfurters. Meat Sci. 67: 65-72.
Waszkowiak K. and Górecka D., Janitz W. 2001. Wpływ pre-paratu błonnika pszennego na jakość sensoryczną potraw mięsnych. zywn-Nauk. technol. Ja. 8(3): 53-61.
Paper Received July 10, 2014 Accepted September 18, 2014

PaPer
310 Ital. J. Food Sci., vol. 27 - 2015
- Keywords: anthocyanins, biogenic amines, co-inoculation, procyanidin, sequential inoculation, wine -
MANAgEMENT OF MALOLACTIC FERMENTATION AND INFLUENCE
ON CHEMICAL COMPOSITION OF AgLIANICO RED WINES
S. SURIANO*, M. SAvINO, T. bASILE, L. TARRICONE and D. DI gENNAROCRA Consiglio per la Ricerca e la Sperimentazione in Agricoltura,
Unità di ricerca per l’uva da tavola e la vitivinicoltura in ambiente mediterraneo, Cantina Sperimentale di Barletta, Via Vittorio Veneto 26, 76121 Barletta, Italy
*Corresponding author: Tel.+39 088 352 1346, Fax +39 088 352 8955,email: [email protected]
AbStrAct
A study has been carried out to determine the effects of lactic acid bacteria inoculation time on the fundamental components, procyanidins and biogenic amines content of Aglianico wines pro-duced in Apulia region. three different malolactic fermentation (MLF) techniques were compared: the co-inoculation, the sequential inoculation, and the traditional technique (spontaneous MLF). In the co-inoculation technique there was a delayed start and a late finish of the alcoholic fer-mentation. the colour intensity of the wine obtained with a spontaneous MLF was higher both at racking and after 12 months. Significant changes in content of flavan-3-ols were found in wines made with different MLF managements. the levels of catechin monomers ((+)-catechin, (-)-epicat-echin, (-)-epicatechin-o-gallate) and procyanidin oligomers (b1-b4, and trimer c1) were lower in the co-inoculation wine. In the wine produced with a spontaneous MLF, the content of biogenic amines was significantly higher compared to the other two wines.

Ital. J. Food Sci., vol. 27 - 2015 311
INtroDuctIoN
the most important microbial activity that is responsible for the conversion of must into wine is the alcoholic fermentation (AF), which is carried out by Saccharomyces yeasts. the malolactic fermentation (MLF) typically follows alcoholic fermentation and is carried out by in-digenous lactic acid bacteria (LAb) or induced by inoculation with selected bacterial starters. It is a decarboxylation of L-malic acid, a dicar-boxylic acid, with formation of a monocarbox-ylic acid, the L-lactic acid and carbon diox-ide, which is catalyzed by malolactic enzymes which are NADP dependent and require diva-lent cations such as manganese or magnesium ions (VINceNzINI et al., 2005). the MLF caus-es a significant evolution of wine and produc-es remarkable changes in its phenolic compo-sition and sensorial characteristics (coSteLLo et al., 2012; cAbrItA et al., 2008; LòPez et al., 2011; SurIANo et al., 2012). In addition to the reduction of the acidity of the wine, MLF in-creases the aromatic complexity and smooth-ness (VerSArI et al., 1999; coStANtINI et al., 2009; LoPez et al., 2011). Generally the MLF is favoured in red wines, in novello wines, in white wines aged in barrique, or in some spar-kling base wines (cAVAzzA et al., 2003). on the other hand, this fermentation produces a small amount of acetic acid and sometimes may also generate unpleasant odours, bitter-tasting com-pounds or substances that may be dangerous to consumers’ health, such as biogenic amines or precursors of ethyl carbamate (LoNVAuD-Fu-NeL, 1999). It has been verified by analysis that the concentration of biogenic amines in wine at the end AF is always quite low, while increas-es after MLF (GAFNer, 2005). Moreover, it was found that wines which undergo spontaneous MLF often have higher biogenic amine concen-tration than those in which the MLF is conduct-ed by select malolactic bacteria (cerrutI et al., 1987; MASquè et al., 2008). biogenic amines are synthesized by microorganism through de-carboxylation of amino acids. between the main biogenic amines in wines there are tyramine, histamine, putrescine, cadaverine and pheny-lethylamine, synthesized by the decarboxyla-tion of the amino acids tyrosine, histidine, or-nithine, lysine and phenylalanine. these com-pound can cause adverse physiological reac-tions in susceptible individuals. Histamine can cause headaches, allergies, diarrhoea, palpita-tions and vomiting (StocKLey, 2004; boDMer et al., 1999), while tyramine is strongly vaso-constrictive (SILLA-SANtoS, 1996). these ef-fects may be enhanced by alcohol, which pre-vents the organism’s detoxifying mechanisms from working properly and by the presence of other amines such as putrescine and cadaver-ine (LANDete et al., 2005), both associated with poor sanitary quality of grapes (LeItAo et al.,
2005) and responsible for major sensory defects in wines (LeHtoNeN, 1996). usually, the LAb used for MLF belong to the oenococcus oeni species, anyway, it is possible to also find oth-er bacteria of the Lactobacillus, Leuconostoc and Pediococcus species (DIcKS et al., 1995). However, even for the most resistant bacteria the conditions found in wine are close to the limits of survival, so that the transformation of 4-5 g/L of malic acid may requires even 15-20 days (cAVAzzA et al., 2003). Several times, this process may take several months, may oc-cur in some barrels and tanks but not in oth-ers and may be responsible for the occurrence of problems related to indigenous LAb species carrying out the MLF (LoNVAuD-FuNeL, 2001) which may cause a range of undesirable chang-es to wine sensory properties, altered wine col-our, and may even lead to the generation of bio-genic amines (DAVIS et al., 1985). Such a long time can be especially critical for those wines (such as novello wines) that must be processed and placed on the market in a short time, and moreover could be a risk since in the season in which the MLF takes place there may be sud-den temperature drops which may determine an arrest of the process until the next spring. there are advantages subsequent to an early and fast MLF such as: a more efficient utiliza-tion of fermentation tank in the busy posthar-vest period, thus a decrease of energetic costs resulting in optimization of the winemaking process; moreover it is possible a decrease of the microbiological risks reducing the growth of undesired microorganism and also allows an early commercialization of wines (JuSSIer et al. 2006). It is therefore of fundamental im-portance a correct management of MLF. In this paper the influence of inoculation of lactic bac-teria on changes occurring on the polyphenol-ic characteristics, colour, biogenic amines and proanthocyanidin in Aglianico red wines was investigated by comparing the techniques of co-inoculation and sequential inoculation to a spontaneous MLF.
MAterIALS AND MetHoDS
Experimental design and winemaking
this research was conducted during the 2012 harvest on Aglianico grape variety, grown in a vineyard trained on espalier training system with Guyot pruning and cultivated according to the principles of organic viticulture. concern-ing the different possibilities of MLF manage-ment, in the Le.Vin.Sud company of cerignola (Foggia, Southern Italy) were carried out three experimental tests in order to evaluate the in-fluence of the timing of lactic bacteria inocula-tion, comparing the technique of co-inoculation (inoculation of bacteria 24 hours after the yeast

312 Ital. J. Food Sci., vol. 27 - 2015
inoculation), sequential inoculation (at the end of the AF) and the traditional technique without inoculation of any LAb, i.e. a spontaneous MLF, which was favoured by acting on certain oeno-logical practices, as further explained. the Agli-anico grapes were first destemmed and crushed, subsequently the mass of must and pomace was mixed, homogeneized and introduced in three different steel tank. From each steel tank, 3 x 100 Kg (in triplicate) of must with pomace was utilized for each of the three winemaking tech-niques adopted, with the aim to determine the repeatability of the differences among the com-pared treatments. the different batches of must and pomace were subjected to the following win-emaking protocols:
- co-inoculation or simultaneous inoculation of LAb (SIM). After crushing and destemming of grapes 40 mg/L of So2 was added. After two hours, Saccharomyces cerevisiae strain Lalvin r7 (Lallemand Inc, castel D’Avezzano-Verona – Italia) previously hydrated in water for 15 min at 38 °c was inoculated in the must (20 g/hL, about 6 x 10⁶ cfu/mL.). After 24 hours a lac-tic bacterial culture of Lactobacillus plantarum V22tM (Lallemand Inc, Verona-Italy) was inocu-lated. the inoculation rate was 1g/hL (2 x 10⁷ cfu/mL) must/wine prior re-hydrated in chlo-rine free water at 20°c for 15 min. the alcohol-ic fermentation took place under controlled tem-perature by cooling the mass if the temperature exceeded the threshold of 26°c.
- Sequential inoculation post alcoholic fer-mentation of LAb (PAF). the only difference from the previous protocol was the time of addition of the bacteria. the lactic bacteria were added at racking, which was performed at the end of the alcoholic fermentation (10 day pomace con-tact). the doses of yeast and bacteria employed were the same. After the inoculation of bacteria, at a dosage of 20 g/hL opti’Malo Plus bacteri-al nutrient (Lallemand Inc, Verona –Italy) were added at wine in according to the manufactur-ers instructions.
- Spontaneous MLF (control). this MLF pro-cess was used as a comparison test for the oth-ers processes. After crushing and destemming of grapes were added about 40 mg/L of So2, and then 20 g/L of previously hydrated Saccharomy-ces cerevisiae (Lalvin r7) yeast were inoculated. Also for this thesis, at racking/post alcoholic fer-mentation were added 20 g/hL of opti’Malo Plus bacterial nutrient.
All the vinification were carried out at 26°c ± 1. During the fermentative pomace contact period (10 days in all vinifications) the cap was pumping over three times a day and the temper-ature and must density were recorded. At the end of this period, all wines were pressed at 2 bars, racked with no added sulphur dioxide for encourage MLF (in control and PAF) and stored at 25°c. After MLF, the wines were racked again and 20 mg/L sulphur dioxide was added. the
wines were cold stabilised (-4°c) for 1 month and then bottled without filtration. All analyses were made in triplicate at racking and after 6 months in the bottle (12 months after racking).
AF was monitored by ethanol production and sugar depletion. MLF was monitored by l-mal-ic acid degradation and l-lactic acid production. AF and MLF were considered complete when re-sidual sugars were less than 2.5 g/L and l-mal-ic acid was less than 0.12 g/L.
Wine composition
total acidity, volatile acidity, reducing sug-ars, pH, total So2, alcohol and total dry extract were all determined on wine according to eec regulation 2676/90.
Chemicals and reference compounds
Standards, including trans-caffeoyl-tartar-ic acid, trans-p-coumaroyl-tartaric acid, caffeic acid, ferulic acid, p-coumaric acid, quercetin, myricetin, kaempferol, were supplied by Sigma Aldrich. While standard of (+)-catechin, (-)-epi-catechin, procyanidin b1, procyanidin b2, ep-igallocatechin, epigallocatechin gallate were supplied by extrasynthese. the purities of the standards were all over 95%. All the solvents (methanol, acetonitrile, ethyl acetate) were HPLc grade. All the solutions were obtained with dis-tilled deionised water using carlo erba reagents.
Spectrophotometric analysis
Phenolic compounds were determined by spectrophotometric methods (DI SteFANo et al., 1989; Di Stefano et al., 1997) using a uV/VIS Mod Lambda 25 double beam Spectropho-tometer (Perkin elmer S.p.A.). the total antho-cyanins index was expressed as malvidin 3-glu-coside and calculate by the following expression: emaxvis x 16.17 x d (d=dilutions). the monomeric anthocyanins after separation and absorption on a c18 Set Pak cartridge were eluted with 5 ml of acetonitrile and then diluted with hydrochlo-ric ethanol and calculated by: emaxvis x 16.17 x d (d=dilutions). the total polyphenols index ex-pressed as (+)-catechin was measured by: e1cm, 75 0nm x 186.5 x d (d=dilutions). the total fla-vonoids index was expressed as (+)-catechin and calculate with the graphic method of DI SteFA-No (1989). the flavanols reactive to vanillin (fla-vonols vanillin assay) were expressed as (+)-cat-echin = Δe x 290.8 x d (Δe=absorbance differ-ence between tests with and without vanillin; d=dilution). the proanthocyanidin content was determined after hot acid hydrolysis (bate-Smith reaction) using a ferrous salt (FeSo4) as catalyst and expressed as cyanidin chloride. colour in-tensity and hue were estimated by measuring absorbance at 420, 520 and 620 nm according to eu regulation 1990.

Ital. J. Food Sci., vol. 27 - 2015 313
HPLC analysis
the fixed acids of wine (tartaric, malic, lac-tic, citric and shikimic acids) were determined by an HPLc isocratic elution (HPLc 1100 series Agilent technologies) with a Phenomenex Syner-gi 4u Hydro-rP 80A (250x4.60 mm, 4 micron) with guard column, a mobile phase of phos-phoric acid 10-3 M, 0.7 mL/min flow rate, 25°c and a uV detector set at 210 nm (cANe, 1990).
For flavans determination, the wine was sep-arated into two fractions containing, respective-ly, individual catechins and oligomeric proan-thocyanidins, using a c18 1g Sep-Pak cartridge as described by SuN et al. (1999). About 5 ml of wine was adjusted to pH 7 and then filtered through a Sep-Pak cartridge preconditioned with H2o. elution was carried on with 10 mL of H2o to eliminate phenolic acids. After drying the cartridges with N2, elution was carried out with 15mL of ethyl acetate to elute catechins and oligomeric proanthocyanidins (F I + F II). each fraction was evaporated to dryness and dissolved in methanol, followed by HPLc anal-ysis. A thermo oDS rP-c18 Hypersil 200x2.1 (5 μm) column with a guard column was used for flavans analysis. two ml of each extract-ed fraction were filtered on a 0.45 μm nylon membrane and immediately inject according to Squadrito’s method (2007). Separation was carried out at 30°c, the flow rate was 0.25 mL/min and the injection volume 10 μL. the detec-tion was set at 280 nm, using phosphoric acid 10-3 M (solvent A) and acetonitrile (solvent b). the gradient elution program was: from 91 to 86% A in ten minutes; from 86 to 82% A in ten minutes; from 82 to 60% A in ten minutes; from 60 to 40% A in five minutes; from 40 to 91% A in five minutes; equilibration time of five min-utes. the peaks identification was performed comparing the retention times and absorption spectra of pure compounds (supplied from ex-trasynthese) and were found analogues to val-ues reported in the literature (bAoSHAN et al., 1998; rIcArDo et al., 1991).
the determination of biogenic amines (bA) in wine was carried out by HPLc/FLD. A Hewl-ett-Packard (Agilent technologies Palo Alto, cA, uSA) 1100 series HPLc instrument was used, with a fluorescence detector set at excitation and emission wavelengths of 340 and 450 nm, respectively. the samples were subjected to an automatic pre-column derivatization pro-cedure using o-phthalaldehyde (oPA reagent, Agilent technologies, Palo Alto, cA, uSA). All separations were performed on a 200 x 4.6 mm, 5-µm Alltima c18 column (Alltech, Deerfield, IL, uSA), protected by a 7.5x4.6 mm guard car-tridge of the same type. Samples were injected into the column after being filtered through a 0.2 mm rc filter (Schleicher and Schuell, Keen, NH, uSA). the two eluents used as mobile phas-es were sodium acetate 50 mM (pH 7.2)/tHF
(96:4) v/v (eluent A) and methanol (eluent b). the elution gradient programme followed the method described by NIcoLINI (2003). From a stock solution of 200 mg/L containing ag-matine, cadaverine, phenylethylamine, hista-mine, putrescine, and tyramine (standards pur-chased by Sigma-Aldrich) in methanol, four di-luted solution were prepared and injected: 2.5, 5.0, 10.0, 20.0 mg/L. quantification of the bA was performed with an internal standard of 10mM of norvaline solution.
Statistical analysis
Multivariate statistical analysis was per-formed using r Statistical Software (r core team (2013), r Foundation for Statistical comput-ing, Vienna, Austria). chemical analyses were repeated three times for each sample and the data are presented as mean ± SD. the one way analysis of variance (ANoVA), and Duncan mul-tiple comparison test to measure variation be-tween treatments at a probability level of p<0.05 were performed.
reSuLtS AND DIScuSSIoN
Wines composition
the musts collected from the steel tanks had the following chemical/physical charac-teristics: control (spontaneous MLF) 210 g/L of reducing sugars, pH 3.30 and total acid-ity 6.40 g/L; SIM: 205 g/L of reducing sug-ars, pH 3.27 and total acidity 6.52 g/L; PAF: 214 g/L of reducing sugars, pH 3.35 and to-tal acidity 6.24 g/L. the winemaking process began on the 12th of october with the crush-ing and destemming of grapes and the yeasts inoculation for all the three experimental pro-cesses. the kinetics of AF and malic acid deg-radation are reported in Figs. 1 and 2 respec-tively. In table 1 it is reported the time re-quired for the AF and the MFL for each wine-making. the duration of the fermentation pro-cess was identical for the PAF and the con-trol (both 8 days), while it was longer for the SIM (about 10 days). However, all alcohol-ic fermentations were regular and complete. LAb in the SIM were able to perform MLF in 23-24 days from the beginning of winemak-ing. the wine obtained by sequential inoc-ulation (PAF) carried out the degradation of malic acid in 40-41 days from the beginning of the winemaking. Instead, the wine under-went a spontaneous MLF, despite the absence of added LAb, has finished the MLF after 57 days from the beginning of the vinification. therefore, the wine obtained by the SIM tech-nique has finished the MLF 33-34 days before of control wine. this data is important since time is a key factor from an economic, techni-

314 Ital. J. Food Sci., vol. 27 - 2015
Fig. 1 - Kinetics of alcoholic fermentation.
Fig. 2 - time course of malic acid degradation from the start of alcoholic fermentation.
table 1 - time required to complete AF and MLF.
Treatment Time for AF Time for malic acid degradation Vinification time (days) (days after bacterial inoculation) † AF + MLF (days) ‡
Co-inoculation (SIM) 10±0 23±1 24±1Sequential inoculation (PAF) 8±0 33±4 41±4Spontaneous MLF (Control) 8±0 NA 57±4
† MLF was considered complete when malic acid concentration was below 0.12 g/L.‡Vinification time is the time from destemming/crushing to completion of AF and MLF.
cal and practical point of view, for a good or-ganizational management of the winery. ta-ble 2 shows the results of the chemical/phys-ical analysis of wines at the end of alcohol-ic fermentation (racking) and 12 months af-
ter racking. Differences were observed in the alcohol content, acidic profile, pH and total acidity. the SIM wine after alcoholic fermen-tation showed obvious signs of the beginning of MLF. Indeed, the malic acid content (1.44

Ital. J. Food Sci., vol. 27 - 2015 315
g/L) was less than control (1.61 g/L) and PAF (1.64 g/L) wines. In SIM wine the partial transformation of malic acid has produced a certain amount of lactic acid already at rack-ing. Moreover, SIM wine showed a lower to-tal acidity and a higher pH compared to con-trol and PAF wines. this was mainly due to the transformation of a diprotic acid (malic acid) with two acidic functional groups into a monoprotic acid (lactic acid) with only one acidic functional group, with a correspond-ing decrease in acidity and an increase of pH. It was observed a difference in the alcohol content of wines, in particular the SIM wine showed the lowest alcohol content. Probably, since the sugar content of the must subjected to the SIM process was slightly smaller thus less alcohol was produced. Another possible explanation is linked to the lactic acid bacte-ria that could have used part of the reducing sugars, in addition to malic acid, as nutrients for their metabolism. this not only may have influenced the alcohol content of wine, but furthermore had furnished an increased en-ergy for the cellular development of the bac-teria resulting in the production of more vol-atile compounds and greater amounts of ace-tic acid, as it was found in SIM wine. Indeed, the volatile acidity expressed as acetic acid was slightly higher in the SIM wine than in the other two wines. both possibilities may have contributed to the lower alcoholic con-
table 2 - Wines composition after AF (racking) and after MLF (12 months after racking).
At racking 12 months after racking
Control SIM PAF Control SIM PAF
Alcohol (Vol. %) x 12.39 ab 12.06 b 12.48 a 12.40 a 12.10 b 12.42 a s 0.08 0.07 0.08 0.12 0.08 0.09Residual sugars (g/L) x 2.40 a 2.40 a 2.40 a 2.35 b 2.42 a 2.45 a s 0.18 0.15 0.20 0.22 0.25 0.20Total dry extract (g/L) x 30.50 a 29.40 b 30.50 a 30.20 a 29.80 b 30.40 a s 2.50 1.80 2.10 2.08 2.18 2.10pH x 3.35 b 3.53 a 3.36 b 3.45 b 3.61 a 3.44 b s 0.02 0.03 0.02 0.03 0.02 0.02Total acidity (g/L) x 7.65 a 6.15 b 7.50 ab 5.63 a 5.03 c 5.10 b s 0.38 0.42 0.45 0.35 0.40 0.39Volatile acidity (mg/L) x 0.54 b 0.60 a 0.56 b 0.55 b 0.60 a 0.50 c s 0.03 0.02 0.03 0.07 0.08 0.06Total SO2 (mg/L x 24.05 a 22.10 b 22.04 b 32.10 b 58.10 a 30.10 c s 4.10 3.80 3.50 2.90 3.50 2.80Tartaric acid x 3.04 b 2.90 c 3.20 a 2.91 a 2.86 ab 2.62 b s 0.28 0.22 0.18 0.4 0.38 0.25L-malic acid (g/L) x 1.61 ab 1.44 b 1.64 a 0.12 a 0.05 b 0.06 b s 0.09 0.10 0.12 0.01 0.00 0.00L-lactic acid (g/L) x 0.10 b 0.60 a 0.12 b 1.45 b 1.52 a 1.41 b s 0.00 0.01 0.00 0.08 0.06 0.05Citric acid (g/L) x 0.25 b 0.27 ab 0.28 a 0.23 b 0.30 a 0.25 ab s 0.02 0.02 0.04 0.01 0.02 0.02
x, mean of three replicates; s, standard deviation.Mean values followed by the same letter in a row are not significantly different at the 0.05 level of significance.
tent, as it is confirmed by the findings of some other authors which have observed a delay of alcoholic fermentation and a use of the sug-ars of must by LAb (LAFoN-LAFourcADe et al., 1983). After one year of storage, the SIM wine still has a lower acid strength, represent-ed by a higher pH and a lower total acidity compared to the other wines. the content of sulfur dioxide, in order to favour the MLF es-pecially in the control, has been deliberately kept low. there were no significant differenc-es in respect of tartaric acid and citric acid.
Polyphenolic composition and wine colour
table 3 shows the polyphenolic composi-tion and chromatic characteristics of wines af-ter alcoholic fermentation and 12 months af-ter racking. the effects of different MLF starts showed a marked change in the content of polyphenols in SIM wine already at the end of the AF. Indeed, the index of total polyphe-nols, the total flavonoids, the total and mon-omeric anthocyanins contents are higher in the SIM wine, with variations ranging from 5 to 17%, than in the other wines. the differenc-es in tannins (proanthocyanidins and flavans reacting with vanillin) content between wines were not significant. After 12 months from racking, all the wines had finished the MLF thus a natural reduction of the polyphenolic compounds (total flavonoids, flavans, and an-

316 Ital. J. Food Sci., vol. 27 - 2015
thocyanins) was observed. Anyway, the total anthocyanins were still slightly higher in the SIM wine compared to control and consider-ably higher compared to PAF wine. From the other side, the content of proanthocyanidins (high molecular weight tannins) was signifi-cantly higher in the control than in the oth-er wines. therefore, an early MLF as for the SIM and PAF processes, causes greater losses over time of higher molecular weight tannins (proanthocyanidins). the increase in pH ob-served at racking for SIM wine has promoted the polymerization processes of high molecu-lar weight tannins leading to a partial precip-itation and thus their removal by pouring op-erations. Some authors (cAroLINe and eVe-LINe, 2011; coSteLLo et al., 2012) in tests of management of MLF have observed similar ef-fects in respect of these compounds. It is well known that MLF can reduce the colour inten-sity in red wines due to numerous factors as-sociated with the MLF (burNS et al., 2013). Indeed, the Aglianico wines obtained with the SIM process, already at the end of alcoholic fermentation (table 3), showed a colour in-tensity of 8.84 which was significantly lower than PAF and control wines. usually, this in-dex is positively correlated to the anthocyanin content, in this case, considered that in SIM wine there was an increase in pH mostly due to the partial MLF, despite a slightly higher an-thocyanin content respect to the other wines,
table 3 - Phenolic composition and chromatic characteristics of Aglianico wines after AF (racking) and after MLF (12 months after racking).
At racking 12 months after racking
Control SIM PAF Control SIM PAF
Total phenols (mg/L) x 1812 b 2062 a 1831 b 1674 b 1793 a 1652 ab s 66 66 37 49 52 41Total flavonoids (mg/L) x 1982 c 2388 a 2008 b 1466 b 1585 a 1583 a s 73 74 45 42 44 36Vanillin index (mg/L) V x 1026 a 1013 b 1017 b 829 b 935 a 659 c s 38 39 23 19 33 21Proanthocyanidins (mg/L) L x 2489 a 2490 a 2398 b 2135 a 1693 b 1533 c s 71 77 59 67 55 38Total anthocyanins (mg/L) x 321 ab 338 a 315 b 223 b 242 a 169 c s 15 16 19 12 12 15Monomeric anthocyanins (mg/L) x 232 ab 251 a 227 b 90 b 110 a 92 ab s 12 9 12 4 6 8D.O. 420 nm (P.O. 1cm) x 3.49 a 2.82 c 3.06 b 2.84 a 2.54 b 2.47 ab s 0.07 0.07 0.06 0.06 0.05 0.05D.O. 520 nm (P.O. 1cm) x 7.16 a 5.17 c 6.23 b 4.03 a 3.69 b 3.39 c s 0.20 0.16 0.18 0.10 0.01 0.01D.O. 620 nm (P.O. 1cm) x 1.06 a 0.85 c 0.94 b 0.75 c 0.78 b 0.99 a s 0.03 0.02 0.03 0.02 0.03 0.04Colour intensity (P.O. 1cm) x 11.71 a 8.84 c 10.23 b 7.62 a 7.01 b 6.85 c s 0.20 0.10 0.14 0.10 0.12 0.08Tint (E420/E520) x 0.49 0.54 0.49 0.70 0.69 0.73V/L index x 0.41 0.41 0.44 0.39 0.55 0.43
x, mean of three replicates; s, standard deviation.Mean values followed by the same letter in a row are not significantly different at the 0.05 level of significance.
a change in the balance of the pH-dependent anthocyanin pigments has determined a cer-tain loss of the red colour. the colour reduc-tion may also be due to the precipitation of the free anthocyanins molecules with polysaccha-rides and potassium bitartrate. twelve months after racking, the differences in colour inten-sity, although reduced, remained quite sig-nificant and the control wine still showed the highest value. Also the 420 nm and 520 nm absorbances were higher in the control wine, while the hue did not show significant differ-ences between wines.
the composition of monomeric catechins and oligomeric procyanidins is shown in table 4. A common feature to all wines is the predomi-nance of the (+)-catechin among all monomeric flavanols. Among dimeric procyanidins b2 and b4 are present in greater quantities. the trim-eric procyanidins were detected in all wines but in small quantities. At racking, the SIM wine dif-fered from the other two wines because of the lowest content of almost all the flavan-3-ols, with the exception of a few gallic acid esters such as epicatechin gallate, epigallocatechin gallate and procyanidin b2 gallate. Less difference were found between the control and PAF. After one year from racking, all wines showed a reduc-tion in the content of (+)-catechin, (-)-epicate-chin, epigallocatechin, procyanidin b1, b3 and b4, while there was a general increase of procy-anidin b2, gallic acid esters and trimeric procy-
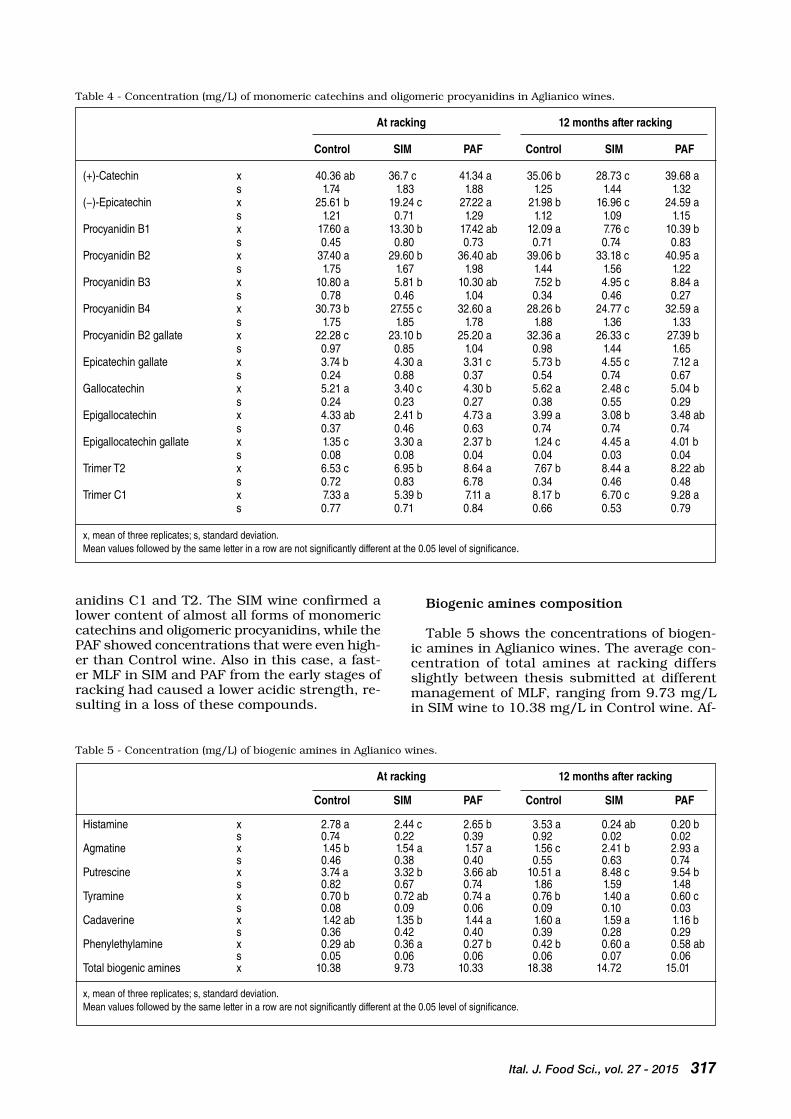
Ital. J. Food Sci., vol. 27 - 2015 317
anidins c1 and t2. the SIM wine confirmed a lower content of almost all forms of monomeric catechins and oligomeric procyanidins, while the PAF showed concentrations that were even high-er than control wine. Also in this case, a fast-er MLF in SIM and PAF from the early stages of racking had caused a lower acidic strength, re-sulting in a loss of these compounds.
table 5 - concentration (mg/L) of biogenic amines in Aglianico wines.
At racking 12 months after racking
Control SIM PAF Control SIM PAF
Histamine x 2.78 a 2.44 c 2.65 b 3.53 a 0.24 ab 0.20 b s 0.74 0.22 0.39 0.92 0.02 0.02Agmatine x 1.45 b 1.54 a 1.57 a 1.56 c 2.41 b 2.93 a s 0.46 0.38 0.40 0.55 0.63 0.74Putrescine x 3.74 a 3.32 b 3.66 ab 10.51 a 8.48 c 9.54 b s 0.82 0.67 0.74 1.86 1.59 1.48Tyramine x 0.70 b 0.72 ab 0.74 a 0.76 b 1.40 a 0.60 c s 0.08 0.09 0.06 0.09 0.10 0.03Cadaverine x 1.42 ab 1.35 b 1.44 a 1.60 a 1.59 a 1.16 b s 0.36 0.42 0.40 0.39 0.28 0.29Phenylethylamine x 0.29 ab 0.36 a 0.27 b 0.42 b 0.60 a 0.58 ab s 0.05 0.06 0.06 0.06 0.07 0.06Total biogenic amines x 10.38 9.73 10.33 18.38 14.72 15.01
x, mean of three replicates; s, standard deviation.Mean values followed by the same letter in a row are not significantly different at the 0.05 level of significance.
table 4 - concentration (mg/L) of monomeric catechins and oligomeric procyanidins in Aglianico wines.
At racking 12 months after racking
Control SIM PAF Control SIM PAF
(+)-Catechin x 40.36 ab 36.7 c 41.34 a 35.06 b 28.73 c 39.68 a s 1.74 1.83 1.88 1.25 1.44 1.32(−)-Epicatechin x 25.61 b 19.24 c 27.22 a 21.98 b 16.96 c 24.59 a s 1.21 0.71 1.29 1.12 1.09 1.15Procyanidin B1 x 17.60 a 13.30 b 17.42 ab 12.09 a 7.76 c 10.39 b s 0.45 0.80 0.73 0.71 0.74 0.83Procyanidin B2 x 37.40 a 29.60 b 36.40 ab 39.06 b 33.18 c 40.95 a s 1.75 1.67 1.98 1.44 1.56 1.22Procyanidin B3 x 10.80 a 5.81 b 10.30 ab 7.52 b 4.95 c 8.84 a s 0.78 0.46 1.04 0.34 0.46 0.27Procyanidin B4 x 30.73 b 27.55 c 32.60 a 28.26 b 24.77 c 32.59 a s 1.75 1.85 1.78 1.88 1.36 1.33Procyanidin B2 gallate x 22.28 c 23.10 b 25.20 a 32.36 a 26.33 c 27.39 b s 0.97 0.85 1.04 0.98 1.44 1.65Epicatechin gallate x 3.74 b 4.30 a 3.31 c 5.73 b 4.55 c 7.12 a s 0.24 0.88 0.37 0.54 0.74 0.67Gallocatechin x 5.21 a 3.40 c 4.30 b 5.62 a 2.48 c 5.04 b s 0.24 0.23 0.27 0.38 0.55 0.29Epigallocatechin x 4.33 ab 2.41 b 4.73 a 3.99 a 3.08 b 3.48 ab s 0.37 0.46 0.63 0.74 0.74 0.74Epigallocatechin gallate x 1.35 c 3.30 a 2.37 b 1.24 c 4.45 a 4.01 b s 0.08 0.08 0.04 0.04 0.03 0.04Trimer T2 x 6.53 c 6.95 b 8.64 a 7.67 b 8.44 a 8.22 ab s 0.72 0.83 6.78 0.34 0.46 0.48Trimer C1 x 7.33 a 5.39 b 7.11 a 8.17 b 6.70 c 9.28 a s 0.77 0.71 0.84 0.66 0.53 0.79
x, mean of three replicates; s, standard deviation.Mean values followed by the same letter in a row are not significantly different at the 0.05 level of significance.
Biogenic amines composition
table 5 shows the concentrations of biogen-ic amines in Aglianico wines. the average con-centration of total amines at racking differs slightly between thesis submitted at different management of MLF, ranging from 9.73 mg/L in SIM wine to 10.38 mg/L in control wine. Af-
318 Ital. J. Food Sci., vol. 27 - 2015
tion in almost all the amines investigated with respect to the control (spontaneous MLF). After 12 months from racking, the average total con-tent of biogenic amines was lower in the wine underwent sequential inoculation compared to the co-inoculation.
AcKNoWLeDGMeNtS
the authors thank Apulia region for the financial support in the regional Development Program 2007/2013, Axis I Improvement of competitiveness in agricultural and forestry sectors, Integrated Projects of the Production chain - Meas-ure 124. Authors also thank Le.Vin.Sud company for grapes and for support in vinification.
reFereNceS
Abrahamse c.e. and bartowsky e.J. 2012. timing of malo-lactic fermentation inoculation in Shiraz grape must and wine: influence on chemical composition. World J. Micro-biol. biotechnol (2012) 28:255-265.
bodmer S., Imark c. and Kneubuhl M. 1999. biogenic amines in foods: histamine and food processing. Inflamm. res. 48:296-300.
burns t.r., and osborne J.P. 2013. Impact of Malolactic Fermentation on the color and color Stability of Pinot noir and Merlot Wine. Am. J. enol. Vitic. 64(3):370-377.
cabrita M.J., torres M., Palma V., Alves e., Patão r. and costa Freitas A.M. 2008. Impact of malolactic fermenta-tion on low molecular weight phenolic compounds. ta-lanta 74:1281-1286.
cane P. 1990. Il controllo della qualità dei vini mediante HPLc: Determinazione degli acidi organici. L’enotecni-co, 26(1-3):69-72.
capozzi V., russo P., Ladero V., Fernández M., Fiocco F., Alvarez M., Grieco F. and Spano G. 2012. biogenicami-nes degradation by Lactobacillus plantarum: toward a potential application in wine. Frontiers in Microbiology - Food Microbiology. April 2012, Volume 3, Article 122, 6
cavazza A., Poznanski e., chiodini A. and zini c. 2003. bat-teri per la fermentazione Malolattica: una selezione da vini trentini. terra trentina, 24-28.
cerutti G., Margheri G. and bongini F. 1987. Sulla correlazi-one tra fermentazione malolattica ed ammine biogene vas-oattive. Vigne vini n. 14(11):39-42.
costantini A., Garcìa Moruno e. and Moreno-Arribas M.V. 2009. biochemical transformations produced by malol-actic fermentation. In: Wine chemistry and biochemis-try. eds. M.V. Moreno-Arribas and M.c. Polo (Springer Sience business Media: New york), pp. 25-57.
costello P.J., Francis I.L. and bartowsky e.J. 2012. Varia-tions in the effect of malolactic fermentation on the chem-ical and sensory properties of cabernet Sauvignon wine: interactive influences of oenococcusoeni strain and wine matrix composition. Aust. J. Grape Wine res. 18:287-301.
coton, M., romano, A., Spano, G., ziegler, K., Vetrana, c., Desmarais, c., Lonvaud-Funel, A., Lucas P. and coton e., 2010. occurrence of biogenic amine-forming lactic acid bacteria in wine and cider. Food Microbiol. 27, 1078-1085.
Gazzetta ufficiale ce L 272 del 03/10/1990 (eec regula-tion 2676/90).
Davis c.r.D., Wibowo D., eschenbruch r., Lee t.H. and Fleet G.H. 1985. Practical implications of malolactic fermenta-tion: A review. Am. J. enol. Vitic. 36:290-301.
Jussier D., Morneau A.D. and De ordunal r. M. 2006. ef-fect of Simultaneous Inoculation with yeast and bacte-ria on Fermentation Kinetics and Key Wine Parameters of cool-climate chardonnay. Applied and enviromental Microbiology, p. 221-227 Vol. 72, No. 1.
Dicks L.M.t., Dellaglio F. and collins M.D. 1995. Proposal to
ter 12 months of storage, when wines had al-ready reached a chemical/physical and biolog-ical stabilization, it was observed an increase in the bA content. the differences found be-tween the different winemaking protocols were significant. the average content of total biogen-ic amines in the wine obtained from spontane-ous MLF (18.38 mg/L) was higher than co-in-oculation (14.72 mg/L) and sequential inocula-tion (15.01 mg/L) wines. In percentage the in-crease was 77.0% in control, 51.3% in SIM and 45.3% in PAF wine. this higher percentage in the control wine could be ascribed to a release of amino acids as a consequence of yeast lysis during AF and to the proliferation of LAbs with carboxylase activity during spontaneous MLF. Putrescine was the most abundant amine, with control showing the highest amount at racking (3.74 mg/L before MFL) and also 12 months af-ter racking (10.51 mg/L). Histamine, which is thought to be the cause of various adverse reac-tions to wines (tAyLor et al., 1989; WANtKe et al., 1996), after 12 months increased its concen-tration in the wine produced with spontaneous MLF (control) wine and vice versa decreased in SIM and PAF wines. Indeed, after 12 months his-tamine was almost absent in wines subjected to inoculation of LAb (0.24 mg/L in SIM and 0.20 mg/L in PAF), while the control wine showed an higher value (3.53 mg/L) which was anyway very similar to values reported by other authors (IzquIerDo-cAñAS et al., 2008; PrAMAteF-tAKI et al., 2006). Probably the histidine decar-boxylase activity was present and active in wine produced with spontaneous MLF for the whole period of aging, instead was absent or not active in wines subjected to inoculation of LAb.
coNcLuSIoN
the simultaneous inoculation with yeast and bacteria (SIM) has reduced the duration of MLF of about 33 days compared to the wine obtained without the addition of any LAb (control). the simultaneous inoculation already at the end of the AF showed evident signs of the onset of MLF. After 12 months from racking, there was a weakening of differences in phenolic compounds content, but the wine underwent a spontaneous MLF (control) remained more colourful and more rich in high molecular weight tannins. concern-ing the content of monomeric catechins and ol-igomeric procyanidins it was observed the pre-dominance of (+)-catechin among the monomer-ic flavanols and the procyanidin b2 among the dimeric procyanidins. these compounds were lower in the co-inoculation wine compared to the other two wines. the different MLF manage-ments led to a different evolution in the content of biogenic amines. the simultaneous (SIM) and the sequential (PAF) inoculation of lactic acid bacteria for the MLF led to a significant reduc-

Ital. J. Food Sci., vol. 27 - 2015 319
reclassify Leuconostoc oenos as Oenococcus oeni [corrig.] gen. nov., comb. nov.. Int. J. Syst. bacteriol. 45:395-397.
Di Stefano r., cravero M.c. and Gentilini N. 1989. Metodi per lo studio dei polifenoli dei vini. L’enotecnico, 25(5):83-89.
Di Stefano r., ummarino I. and Gentilini N. 1997. Alcuni aspetti del controllo di qualità nel campo enologico. Lo stato di combinazione degli antociani. Ann. Istit. Sperim. enol. Asti: 105-121.
Gafner J. 2005. Stabilità biologica e amine biogene. Vinidea.net, rivista Internet tecnica del Vino. N. 2/1.
Izquierdo-cañas P.M., García-romero e., Gómez-Alonso S., González M.F. and Palop-Herreros M.L. 2008. Amino ac-ids and biogenic amines during spontaneous malolactic fermentation in tempranillo red wines. J. Food compos. Anal. 21(8):731-735.
Lafon-Lafourcade S., carre e. and ribéreau-Gayon P. 1983. occurrence of lactic acid bacteria during the different stages of vinification and conservation of wines. Appl. environ. Microbiol. 46:874-880.
Landete J.M., Ferrer S., Polo L. and Pardo I. 2005. biogen-ic amines in wines from three Spanish regions. J. Ag-ric. Food Chem. 53:1119-1124.
Leitao M., Marques A. P. and San romao M. V. 2005. A sur-vey of biogenic amines in commercial Portuguese wines. Food control 16:199-204.
Lonvaud-Funel A. 1999. Lactic acid bacteria in the quali-ty improvement and depreciation of wine. Anton, Leeuw, 67:317-331.
Lonvaud-Funel A. 2001. biogenic amines in wines: role of lactic acid bacteria. FeMS Microbiol. Lett. 199:9-13.
Lòpez r., Lòpez-Alfaro I., Gutièrrez A. r., tenorio c., cari-jo P., Gonzàles-Arenzana L. and Santamarìa P. 2011. Malolactic fermentation of tempranillo wine: contribu-tion of the lactic acid bacteria inoculation to sensory quality and chemical composition. Int. J. Food Science tech. 46:166-174.
Masqué M.c., romero S.V., rico S., elórduy X., Puig A., cap-devila F., Suárez c., Heras J.M. and Palacios A.t. 2008. coinoculo di lieviti e batteri: effetti sulla qualità e sulle amine biogene. www.infowine.com, rivista internet di vit-icoltura ed enologia, N. 8/2.
Nicolini G., Larcher r., and bertoldi D. 2003. Indagine sul tenore di ammine libere in mosti d’uve di varietà autoc-tone. riv.Viti. enol. 1:15-27.
Pramateftaki P.V., Metafa M., Kallithraka S. and Lanaridis P. 2006. evolution of malolactic bacteria and biogenic amines during spontaneous malolactic fermentations in a Greek winery. Lett. in Appl. Microbiol. 43:155-160.
ricardo da Silva J.M., bourzeix M., cheynie V. and Mout-ounet M. 1991. Procyanidin composition of chardon-nay, Mauzac and Grenache blanc grapes. Vitis 30:245-252.
Silla-Santos M.H. 1996. biogenic amines: their importance in foods. Int. J. Food Microbiol. 29:213-231.
Squadrito M., corona o., Ansaldi G. and Di Stefano r. 2007. relazione fra i percorsi biosintetici degli HctA, dei fla-vonoli e degli antociani nella buccia dell’uva. riv. Vit. enol. 3:59-70.
Sun b.S., Pinto t., Leandro M.c., ricardo-Da-Silva J.M. and Spranger I. 1999. transfer of catechins and proanthocy-anidins from solid parts of the grape cluster into wine. Am. J. enol. Vitic. 50(2):179-183.
Suriano S., ceci G. and tamborra P. 2012. Impact of differ-ent winemaking techniques on polyphenolic compounds of Nero di troia wine. Italian Food & beverage technol-ogy 70:5-15.
Stockley c.S. 2004. can histamine in wine cause adverse re-actions for consume. Australian and New zealand Grape-grower and Winemaker 485(77):79-82.
taylor S.L., Stratton J.e. and Nordlee J.A. 1989. Histamine Poisoning (Scombroid Fish Poisoning): An Allergy-Like In-toxication. clinical Intoxication. 27(4-5):225-240.
Versari A., Parpinello G.P. and cattaneo M. 1999. Leuconos-toc Oenos and malolactic fermentation in wine: a review. J. Ind. Microbiol. biotechnol. 23:447-455.
Wantke F., Hemmer W., Haglmüller t., Götz M.,·and Jari-sch r. 1996. Histamine in Wine. Int. Arch. Allergy Im-munol. 110:397-400.
zùniga M., Pardo I. and Ferrer S. 1993. An improved medi-um for distinguishing between homofermentative and het-erofermentative lactic acid bacteria. International Jour-nal of Food Microbiology, 18: 37-42.
Paper Received July 11,2014, Accepted September 23, 2014
PaPer
320 Ital. J. Food Sci., vol. 27 - 2015
- Keywords: agrobiodiversity, plum, quality, nutraceutical compounds -
QUALITy OF AUTOCHTHONOUS SICILIAN PLUMS
F. SOTTILEa, v. gIRgENTIb, N.R. gIUggIOLIb, M.b. DEL SIgNOREa and C. PEANOb
aDipartimento Scienze Agrarie e Forestali, University of Palermo, Viale delle Scienze 11, 90128 Palermo, Italy
bDipartimento di Scienze Agrarie, Forestali e Alimentari, University of Torino, Largo Paolo Braccini 2, 10095 Grugliasco, TO, Italy
*Corresponding author: Tel. +39 011 6708646, Fax +39 011 6708658,email: [email protected]
AbStrAct
thirty four plum local varieties and accessions obtained from different growing area of the Si-cilian island were analyzed for their qualitative and nutraceutical properties and three commer-cial cultivar were used as references. these properties included the fruit fresh weight (g), the pulp firmness (FFF), the total soluble solids (tSS), the titratable acidity (tA), the total anthocyanins, the phenolics content and the antioxidant activity.
this preliminary study showed significantly differeces among the plums; zuccarato giallo and Prunu Niuru presented tSS higher than the commercial cultivars (24.9 and 21.6 °brix respec-tively) and interesting data obtained on the nutraceutical compounds values suggested these lo-cal cultivars as sources of polyphenols (zuccarato giallo with 663 mg GA/100 gFW) and natural antioxidants (Pruno regina with 47.46 Fe2+/100 gFW). the characterization of these plums could represent also an important resource for the international activity in the genetic improving and the collection of the more interesting quality traits could be useful for improving the Prunus da-tabase actually in use.

Ital. J. Food Sci., vol. 27 - 2015 321
1. INtroDuctIoN
the varietal diversity is one of the agricultur-al biodiversity (HeyWooD, 1999) and the man-agement by farmers at the local community level is one of the factors involved to preserve it. the International treaty on Plant Genetic resources for Food and Agriculture approved in 2001 has assigned to all joined Nations the duty to take specific local actions in terms of preservation of genetic resources, particularly those that are di-rectly related with the food and agriculture, ie. agrobiodiversity. Since that, many national ini-tiatives have been set up aiming at the recovery and characterization of the genetic autochtho-nous resources as well as the enhancement in both nutritional and nutraceuticals traits.
the need to maintain, to protect and to man-age agobiodiversity is increasing; the identifica-tion of the composition of locally cultivated food as sources of nutraceutical compounds is essen-tial to promote a more food-base approach to nu-trition and health (ScooNeS, 1992). Plums are the most taxonomically diverse of stone fruits (DAS et al., 2011) and the varietal diversity is strongly related to the high percentage of self-incompatibility that led over the centuries to various cross-pollinations with recombinations of characters (SottILe et al., 2010a). the man-agement in situ is one of the commonly recom-mended germplasm conservation approaches (MAXteD et al., 2010) and in Sicily plum fruits were cultivated since the sixteenth and sevet-eenth centuries as reported in literature (cuPA-NI, 1696; NIcoSIA, 1735) due the propitious pe-doclimatic conditions of the territory for their development and genetic diversification (IMPAL-LArI et al., 2010). the most representative areas for the diffusion of plum trees are described by these authors as the Palermo and trapani Prov-ince which today have an important rule to im-prove and to diffuse the cultivation of the specie by using its natural and favorable climatic con-ditions. the characterization and identification of plum varieties usually is performed on mor-phological data (SottILe et al., 2010b), pheno-totic traits (HorVAtH et al., 2011) and more re-cently on some molecular markers (GreGor et al., 1994; ortIz et al., 1997; GHArb et al., 2014), but the study of the nutraceutical compounds (SottILe et al., 2010b), represent today an im-portant tool to improve the collected data and to describe better the varietal diversity (VASAN-tHA ruPASINGHe et al., 2006; DíAz-MuLA et al., 2009). the replacement of local cultivars with the new one introduced by genetic improvement programs, due to a higher productivity, as well as resistance or tolerance to pests and diseas-es, or to abiotic stress, has caused a strong ge-netic erosion of the indigenous fruit tree species germplasm (IMPALLArI et al., 2010). As a conse-quence of the globalization process, the homolo-gation involved the fruit consumption and deep-
ly contributed in the loss of the unique taste of these fruits.
Many studies have showed that the locally available cultivars, varieties and wild underu-tilized ecotypes; JAbLoNSKA-ryS et al., 2009; PetrucceLLI et al., 2013;) are in many cases more rich in nutrients than similar commercial-ly foods, confirming the old ecotypes as genetic resources of fruit nutritional traits.
Plums have the potential to contribute great-ly to human nutrition because of their richness in fiber and antioxidants (StAceWIcz-SAPuNt-zAKIS et al., 2001; SottILe et al., 2010b). In many cases the genetic resources with a high-er relevance in terms of nutraceutical facts are related to old varieties and reported with a high risk of erosion. to limit the loss of biodiversity and to adopt collaborative conservation strat-egies it is necessary to improve the knowledge of the genetic resources and their horticultur-al aspects. the reduction in the genetic varia-bility is increasing from the past century so as established by international approaches to bi-odiversity preservation protocols, each coun-try is responsible for its own genetic resources (DAS et al., 2011). No detailed study concerning physical and nutritional properties of old Sicil-ian plum ecotypes have been performed up to now, so the aim of this study was to determine some qualitative and nutritional traits of plum fruits belonging to some local cultivars identi-fied in the Sicily island.
2. MAterIALS AND MetHoDS
2.1 Plant material and collection of data
one hundred forty-three georeferenced plum cultivars and accessions were identified in the Sicilian island from existing bibliography and a territorial investigation but in this preliminary study only thirty-seven varieties are consid-ered. In the table 1 the total 37 local cultivars and accessions of plums used for the qualita-tive and nutraceutical analysis on fruits are re-ported. these included 34 plum trees from dif-ferent locations in the Sicily region and 3 com-mercial varieties respectively of Prunus domesti-ca L. (cv. Stanley) and Prunus salicina Lindl. (cv. Shiro and cv. Angeleno), as references. the in-vestigated area is located both in the West and in the eastern part of Sicily. For each local cul-tivars and accession 30 fruits randomly collect-ed from the entire production were used.
the plants of the Sicilian germplasm were maintained on site in their natural habitat where they are routinely grown by local farmers. In all cases minimal cultural techniques have been applied, without any fruit thinning. All culti-vars produce primarily on spurs and pruning is not commonly carried out. An integrated pest management approach is ordinary adopted by

322 Ital. J. Food Sci., vol. 27 - 2015
growers by following the regional governmental rules for plum.
the fruits were picked by hand at the ripe stage (table 2). the fruits damaged were re-moved, were graded for color and size uniformi-ty and they were immediately transported to the pomological laboratory for analysis.
2.2 Fruit quality traits
the weight was obtained measuring individ-ually 30 fruits per each local cultivars and ac-cessions. the data were expressed as the mean ± Se. Fruit weight (g) was performed using an electronic balance (Se622, WVr, uSA) with an accuracy of 0.01 g.
the fresh fruit firmness (FFF) was measured using an effegi hand-held penetrometer (turoni, Italy) with a 5-mm-diameter plunger in accor-dance with standard industry practice. the skin of the fruits was partially removed before mea-suring. two measurements (30 fruits) were made on opposite sides of the central zone of the fruits and then averaged to yield a mean value for the fruit. the measurements were reported in kg force (kgf) cm−2.
After the firmness measurements for the to-tal soluble solids (tSS) and the titratable acidi-ty (tA) determination, the same fruits were com-pletely hand-peeled and skin and pulp were cut in small pieces to obtain homogeneous samples. For tSS and tA determination 10 g of pulp sam-ples were squeezed using a commercial blend-er and the extracted juice was later sieved and centrifuged at 8,000 × g for 20 min (Sigma 3-18 K, osterode and Harz, Germany). An aliquot of this supernatant was used to determine tSS with a digital pocket refractometer Atago PAL-1 (Atago co. Ltd., Japan) calibrated at 20°c to 0% with distilled water, and expressed as per-
table 1 - List of cultivars and accessions plums collected from the local germplasm of Sicily and sampling locations.
Authoctonous cultivars Location* and accession name
1 69SUS005P Messina (ME) 2 Lazzarino Palermo (PA) 3 Sanacore Tardivo Palermo (PA) 4 Zuccarino Rosa Messina (ME) 5 Prunu Nucidda Messina (ME) 6 Cuore di Bue Catania (CT) 7 Pruno Regina Catania (CT) 8 107SUS009E Trapani (TP) 9 107SUS008B Trapani (TP)10 107SUS007B Trapani (TP)11 Rapparinu Russu Trapani (TP)12 Sanacore Palermo (PA)13 Prunu Niuru Catania (CT)14 Ariddo di Core Palermo (PA)15 Occhio di Bue Catania (CT)16 Ranco’ Nero Catania (CT)17 Don Ciccino Catania (CT)18 Cugghiuni di Mulu Catania (CT)19 Papale Catania (CT)20 71SUS028B Catania (CT)21 President Catania (CT)22 Pruna di S. Antonio Messina (ME)23 Susine Nere Messina (ME)24 Nivuru Purmintia Messina (ME)25 Nivuru Messina (ME)26 Pruna i Sceccu Messina (ME)27 Santu Vitu Messina (ME)28 66SUS052P Messina (ME)29 Prunu Ciraseddu Catania (CT)30 Prugnolo rosso Messina (ME)31 Pruno Rosa Palermo (PA)32 Primintio Palermo (PA)33 Prunu Nivuru Codulusu Trapani (TP)34 Zuccarato Giallo Messina (ME)35 Shiro Palermo (PA)36 Stanley Palermo (PA)37 Angeleno Palermo (PA)
*Data on geographical position (latitude and longitude) are available for all plums.
Fig. 1 - total anthocyanins of local Sicilian plums

Ital. J. Food Sci., vol. 27 - 2015 323
table
2 -
Harv
esti
ng
date
s fo
r th
e au
thoc
hto
nou
s S
icilia
n p
lum
s.
Plu
ms
Jun
eJu
lyA
ug
ust
Sep
tem
ber
510
1520
2530
510
1520
2530
510
1520
2530
510
1520
2530
69S
US
005
PL
azza
rin
o
S
anac
ore
Tar
div
o
Z
ucc
arin
o R
osa
P
run
u N
uci
dd
aC
uo
re d
i Bu
e P
run
o R
egin
a 10
7SU
S0
09E
10
7SU
S0
08B
10
7SU
S0
07B
R
app
arin
u R
uss
u
San
aco
reP
run
u N
iuru
A
rid
do
di C
ore
Occ
hio
di B
ue
Ran
co’ N
ero
D
on
Cic
cin
o
Cu
gg
hiu
ni d
i Mu
luP
apal
e 71
SU
S02
8B
Pre
sid
ent
Pru
na
di S
. An
ton
io
Su
sin
e N
ere
Niv
uru
Pu
rmin
tia
Niv
uru
P
run
a i S
cecc
u
San
tu V
itu
66S
US
052P
Pru
nu
Cir
ased
du
P
rug
no
lo r
oss
o
Pru
no
Ro
saP
rim
inti
oP
run
u N
ivu
ru C
od
ulu
su
Zu
ccar
ato
Gia
llo
Sh
iro
Sta
nle
yA
ng
elen
o

324 Ital. J. Food Sci., vol. 27 - 2015
table 3 - Fruit quality traits of 37 authochtonous Sicilian plums.
Fruit weight FFF TSS TA MI (g) kgf cm-2 °Brix g malic acid L-1
Plums69SUS005P 34.20±4.51 G-I 0.88±0.21 D-I 19.6±0.21 B-E 7.76±1.74 G-O 2.5LAZZARINO 16.77±2.90 O-S 0.58±0.26 L-R 16.5±1.47 F-I 6.28±0.41 I-Q 2.6SANACORE TARDIVO 28.98±7.13 L-M 0.80±0.22 G-N 15.3±0.06 H-N 7.72±0.26 G-P 2.0ZUCCARINO ROSA 13.67±1.99 R-U 0.31±0.12 S-U 15.1±0.70 H-N 9.02±0.14 F-L 1.7PRUNO NUCIDDA 12.06±4.32 S-U 1.14±0.36 D 21.2±0.28 B-C 9.00±0.13 F-L 2.4CUORE DI BUE 83.79±9.02 A 0.76±0.21 H-O 13.3±0.21 L-P 12.21±1.22 C-E 1.1PRUNO REGINA 33.62±3.58 H-I 0.76±0.22 H-O 18.4±0.21 C-G 7.95±0.09 G-N 2.3107SUS009E 21.07±7.06 N-O 0.63±0.20 I-Q 11.5±0.21 O-Q 16.56±0.57 B 0.7107SUS008B 14.26±2.44 Q-U 0.40±0.12 Q-T 12.8±0.00 M-P 11.97±1.02 C-E 1.1107SUS007B 14.93±3.43 P-U 0.40±0.11 Q-T 15.5±0.42 G-N 10.56±0.15 E-H 1.5RAPPARINU ROSSO 13.75±2.25 Q-U 0.58±0.21 L-R 15.7±1.91 G-N 4.27±0.75 M-Q 3.7SANACORE 19.26±5.86 O-Q 0.93±0.30 D-H 16.0±1.06 F-L 7.98±0.43 G-M 2.0PRUNU NIURU 26.36±4.44 L-N 0.69±0.15 G-P 21.6±1.49 B 4.93±0.25 M-Q 4.4ARIDDO DI CORE 16.75±3.19 O-S 1.07±0.35 D-F 20.1±2.03 B-D 6.13±0.76 I-Q 3.3OCCHIO DI BUE 41.76±8.28 E-F 0.55±0.10 N-S 15.6±0.28 G-N 4.86±0.08 M-Q 3.2RANCO’ NERO 44.13±5.39 E 0.60±0.10 L-R 16.6±0.07 E-I 7.29±0.09 H-P 2.3DON CICCINO 37.22±5.92 F-H 0.47±0.06 P-S 19.1±0.28 B-F 10.12±0.21 E-I 1.9CUGGHIUNI DI MULU 61.53±8.92 C 0.56±0.13 M-S 14.6±0.06 I-O 8.24±0.39 G-M 1.8PAPALE 45.19±6.46 D-E 0.57±0.17 M-R 15.4±0.10 G-N 9.60±1.17 E-I 1.671SUS028B 49.99±8.77 D 0.55±0.07 N-S 16.7±0.15 E-I 7.67±0.24 G-P 2.271SUS024C 66.52±12.77 B-C 0.87±0.27 E-I 13.7±0.06 I-P 12.78±0.33 C-E 1.166SUS006S 16.16±4.37 O-T 0.65±0.17 I-Q 14.8±0.07 H-N 9.43±0.91 E-I 1.6SUSINE NERE 9.48±1.69 U 0.52±0.05 O-S 14.2±0.07 I-O 11.83±0.99 C-E 1.2NIVURU PRIMINTIA 40.70±7.23 E-F 0.82±0.17 F-M 14.5±0.96 I-O 10.84±0.26 E-G 1.3NIVURU 15.21±2.91 P-T 0.69±0.26 H-P 14.9±0.07 H-N 9.65±1.26 E-I 1.5PRUNA I SCECCU 39.79±7.30 E-G 0.83±0.31 F-L 11.0±0.28 P-Q 22.62±0.59 A 0.5SANTU VITU 20.41±2.48 O-P 0.52±0.25 O-S 14.0±3.02 I-P 4.45±0.45 P-Q 3.166SUS052P 65.64±10.75 B-C 1.04±0.64 D-G 12.8±0.35 N-Q 14.56±0.47 B-C 0.9PRUNU CIRASEDDU 14.21±2.05 Q-U 0.35±0.04 R-U 10.1±0.14 Q 3.60±0.18 Q 2.8PRUGNOLO ROSSO 18.45±2.07 O-R 1.10±0.27 D-E 17.7±0.78 D-H 6.76±0.42 I-P 2.6PRUNO ROSA 17.90±3.32 O-R 0.55±0.26 N-S 16.2±0.74 F-L 8.66±1.07 G-L 1.9PRIMINTIO 21.09±5.33 N-O 0.46±0.17 P-S 15.7±1.44 G-N 10.94±2.15 D-G 1.4PRUNU NIVURU CODULUSU 10.78±1.68 TU 0.12±0.04 U 16.7±0.07 E-I 14.23±0.40 B-D 1.2ZUCCARATO GIALLO 13.57±2.89 R-U 0.16±0.05 T-U 25.0±0.35 A 5.86±0.27 L-Q 4.3SHIRO 36.62±5.16 F-H 1.57±0.09 C 15.0±0.40 G-M 10.63±0.81 E-H 1.4STANLEY 40.10±3.35 E-F 2.46±0.10 B 15.9±0.36 G-M 5.23±0.20 L-Q 3.0ANGELENO 67.70±9.80 B 4.33±0.39 A 21.2±1.28 B-C 4.64±0.61 P-Q 4.6
Data are means ± SD. Values with the same letter at the column level are not statistically different with the Tukey’s test (0.05).
centage (°brix). tA was determined in 1 mL of the above supernatant diluted in 25 mL of dis-tilled water by titration with 0.1 N NaoH up to pH 8.1, using an automatic titration device (484 titrino plus, Metrohm, Switzerland) and results expressed as grams of malic acid L−1. three rep-licates per measurement were used and the data reported are the mean ± Se.
the tSS:tA ratio was calculated for individ-ual fruit from the tSS and tA results and it ex-pressed the maturity index (MI).
2.3 Total anthocyanins, phenolic content and antioxidant activity
to determine the total anthocyanin content, the total phenolic content and the total antiox-idant capacity, fruit extract was obtained using 10 g of fruit added to 25 ml of extraction buffer
(500 ml methanol, 23.8 ml deionized water and 1.4 ml hydrochloric acid 37%). After 1 h in the dark at room temperature, the samples were thoroughly homogenized for a few minutes with an ultra turrax (IKA, Staufen, Germany) and cen-trifuged for 15 min at 3,000 rpm. the clear su-pernatant fluid was collected and stored at -20 °c until analysis.
the total anthocyanin content was quanti-fied according to the pH differential method of cHeNG and breeN (1991). Anthocyanins were estimated by their difference of absorbance at 510 and 700 nm in a buffer at pH 1.0 and pH 4.5, where Atot = (A515 - A700) pH 1.0 - (A515 - A700) pH 4.5. the results are expressed as milligrams of cyanidin-3-glucoside (c3G) equivalent per 100 g of fresh weight (fw).
the total phenolics content was measured using a Folin-ciocalteu reagent with gallic acid

Ital. J. Food Sci., vol. 27 - 2015 325
as a standard at 765 nm following the meth-od of SLINKArD and SINGLetoN (1977). the re-sults are expressed as milligrams of gallic acid equivalents (GAe) per 100 g of fresh weight (fw).
the antioxidant activity was determined using the FrAP (Ferric reducing Antioxidant Power) assay, according to beNzIe and StrAIN (1996) method modified by PeLLeGrINI et al. (2003). the antioxidant capacity of the dilute fruits extract was determined by its ability to reduce ferric iron to ferrous iron in a solution of 2,4,6-tris(2-pyridyl)-s-tri-azine (tPtz) prepared in sodium acetate at pH 3.6. the reduction of iron in the tPtz–ferric chloride solution (FrAP reagent) re-sults in the formation of a blue-coloured prod-uct (ferrous tripyridyltriazine complex), the ab-sorbance of which was read spectrophotometri-cally at 595 nm 4 min after the addition of ap-propriately diluted fruits extracts or antioxidant standards to the FrAP reagent. the results were expressed as mmol Fe2+ equivalents per kilogram of fresh fruits.
All of these analyses were performed using a uV-Vis spectrophotometer 1600-VWr. three replicates per measurement were used.
2.4 Statistical analysis
the data obtained were treated with one-way analysis of variance (ANoVA) using SPSS for Windows version 20.0 and the means were sep-arated using the tuckey test (P ≤ 0.05).
3. reSuLtS
3.1. Quality parameters
In the table 3 the qualitative traits studied for the different plums are reported.
As already reported, fruit size is an important quality parameter to evaluate the economic val-ue for the consumption of fresh fruits (Petruc-ceLLI et al., 2013) and to determine the catego-ry of the ranges of marketability of many fruits. It is affected by a number of variables, includ-ing source–sink relationship (SNeLGAr et al., 1998), water availability (INtrIGLIoLo and cAS-teL, 2006) as well as temperature and grow-ing conditions in general. In our study a great variability on fruit weight has been reported among the different plums suggesting a differ-ent fruit surface/volume (eIFert et al., 2006), a fruit size distribution into different classes and a different correlation to physical-chemical pa-rameters, such tSS and tA. Fruits with greater weight would have a greater proportion of edi-ble flesh (FrANco-MorA et al., 2009). the fresh weight of all plums analysed revealed a mean value of 30.91 g ranging from 83.79 to 9.48 g; the maximum value was observed for the cuo-re di bue cultivar while the lowest was observed for the Susine Nere plums. Less than half of the
plums (sixteen) showed higher values than the mean value. the Don ciccino cultivar was the only one to show the weight (37.22 g) similar to the values of the commercial cv. Shiro (36.62 g) while Nivuru Primintia and occhio di bue with respectively 40.70 and 41.76 g showed similar weight to the commercial cv. Stanley (40.10 g). All plums showed statistically differences from the commercial cv. Angeleno which weight was of 67.70 g.
Flesh firmness is a key quality parameter, since it is directly related to fruit ripeness, and is often a good indicator of shelf-life potential (VALero et al., 2007). the highest pulp firm-ness was observed for all the three commercial cultivars, the cv. Angeleno with 4.33 (kgf) cm−2
was the higher value followed by the cv. Stanley with 2.46 (kgf) cm−2 and the cv. Shiro with 1.57
(kgf) cm−2. All autochthonous plums (34) showed statistically differences from these last and only 11% of them showed FFF value major than 1(kgf) cm−2. the mean value was of 0.82 (kgf) cm−2, the lowest value was reached by the Prunu Nivuru codulusu probably due to the low weight (10.78 g), while the highest was observed for the Pruno Nucidda (1.14) (kgf) cm−2.
the physical-chemical parameters, such tSS and tA, strongly influence the consumer pref-erence for stone fruit quality and the aromatic profile for the plums consumption (crISoSto et al., 2007).
the zuccarato giallo and the Prunu Niuru showed the highest tSS content (25.0 and 21.6 °brix, respectively) while the lowest tSS value (10.1 °brix) was scored by the Prunu ciraseddu cultivar. observing the table 2 there is a ten-dency for late season plums to have higher tSS than early season plums.
Less than half of the plums (43%) showed the tSS content greater than the mean value (16.6°brix). the 69SuS005P, Pruno Nucidda, Pruno regina, Prunu Niuru, Ariddo di core and Don ciccino authoctonous plums showed simi-lar values to the commercial cv. Angeleno (21.2 °brix) and no statistically significant differences were observed between these fruits. the 66% of the plums showed value not statistically differ-ent from the commercial cv. Shiro and Stanley which scored 15.0 and 16.0 °brix respectively. the tSS values measured in the local cultivars and accession are quite high when compared to the value find in the literature; in fact tSS be-tween 14% and 16% (WeStWooD, 1978) or 10 and 15% (DíAz-MuLA et al., 2009) could suggest edible fruit ready for consumption.
the tA mean value was of 9.10 g malic acid L-1 and the 58% of the local plums showed tA values inferior to the average. the lowest acidity was for the Prunu ciraseddu (3.60 g malic acid L-1) while the highest value was for the Pruna i Sceccu (22.62 g malic acid L-1).
the variations observed in tSS and tA affect-ed the values of the maturity index (MI). Great
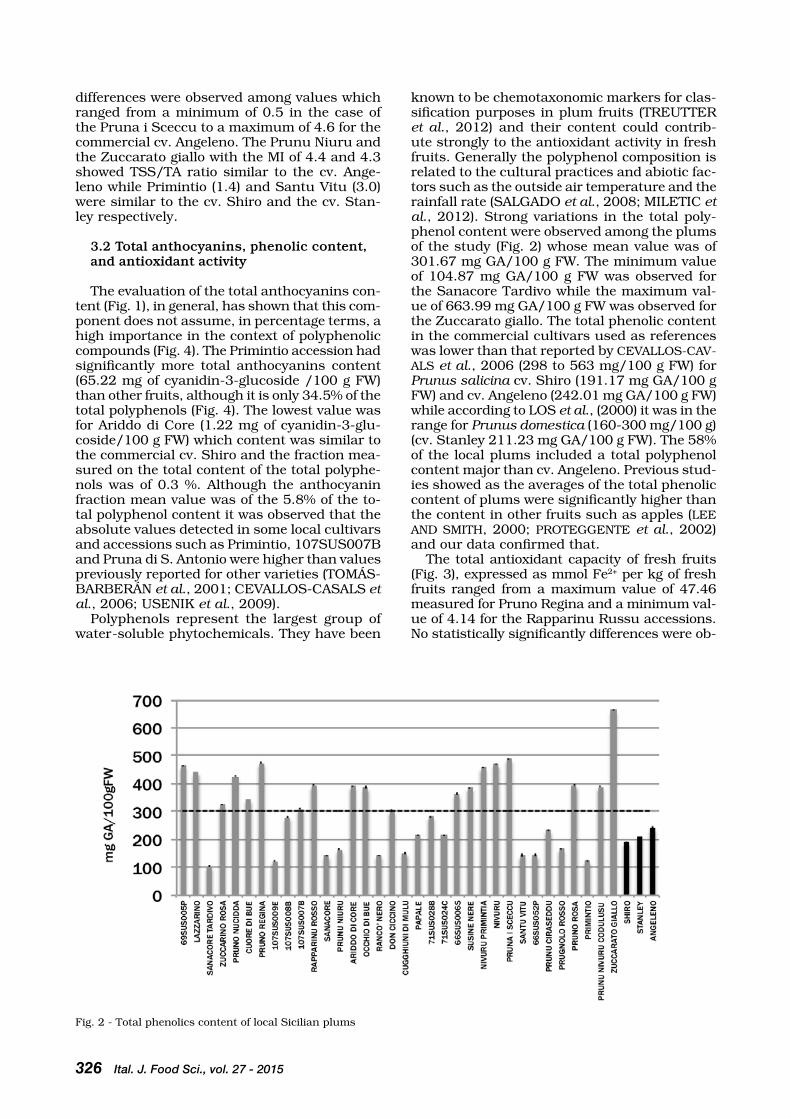
326 Ital. J. Food Sci., vol. 27 - 2015
differences were observed among values which ranged from a minimum of 0.5 in the case of the Pruna i Sceccu to a maximum of 4.6 for the commercial cv. Angeleno. the Prunu Niuru and the zuccarato giallo with the MI of 4.4 and 4.3 showed tSS/tA ratio similar to the cv. Ange-leno while Primintio (1.4) and Santu Vitu (3.0) were similar to the cv. Shiro and the cv. Stan-ley respectively.
3.2 Total anthocyanins, phenolic content, and antioxidant activity
the evaluation of the total anthocyanins con-tent (Fig. 1), in general, has shown that this com-ponent does not assume, in percentage terms, a high importance in the context of polyphenolic compounds (Fig. 4). the Primintio accession had significantly more total anthocyanins content (65.22 mg of cyanidin-3-glucoside /100 g FW) than other fruits, although it is only 34.5% of the total polyphenols (Fig. 4). the lowest value was for Ariddo di core (1.22 mg of cyanidin-3-glu-coside/100 g FW) which content was similar to the commercial cv. Shiro and the fraction mea-sured on the total content of the total polyphe-nols was of 0.3 %. Although the anthocyanin fraction mean value was of the 5.8% of the to-tal polyphenol content it was observed that the absolute values detected in some local cultivars and accessions such as Primintio, 107SuS007b and Pruna di S. Antonio were higher than values previously reported for other varieties (toMÁS-bArberÁN et al., 2001; ceVALLoS-cASALS et al., 2006; uSeNIK et al., 2009).
Polyphenols represent the largest group of water-soluble phytochemicals. they have been
known to be chemotaxonomic markers for clas-sification purposes in plum fruits (treutter et al., 2012) and their content could contrib-ute strongly to the antioxidant activity in fresh fruits. Generally the polyphenol composition is related to the cultural practices and abiotic fac-tors such as the outside air temperature and the rainfall rate (SALGADo et al., 2008; MILetIc et al., 2012). Strong variations in the total poly-phenol content were observed among the plums of the study (Fig. 2) whose mean value was of 301.67 mg GA/100 g FW. the minimum value of 104.87 mg GA/100 g FW was observed for the Sanacore tardivo while the maximum val-ue of 663.99 mg GA/100 g FW was observed for the zuccarato giallo. the total phenolic content in the commercial cultivars used as references was lower than that reported by ceVALLoS-cAV-ALS et al., 2006 (298 to 563 mg/100 g FW) for Prunus salicina cv. Shiro (191.17 mg GA/100 g FW) and cv. Angeleno (242.01 mg GA/100 g FW) while according to LoS et al., (2000) it was in the range for Prunus domestica (160-300 mg/100 g) (cv. Stanley 211.23 mg GA/100 g FW). the 58% of the local plums included a total polyphenol content major than cv. Angeleno. Previous stud-ies showed as the averages of the total phenolic content of plums were significantly higher than the content in other fruits such as apples (Lee AND SMItH, 2000; ProteGGeNte et al., 2002) and our data confirmed that.
the total antioxidant capacity of fresh fruits (Fig. 3), expressed as mmol Fe2+ per kg of fresh fruits ranged from a maximum value of 47.46 measured for Pruno regina and a minimum val-ue of 4.14 for the rapparinu russu accessions. No statistically significantly differences were ob-
Fig. 2 - total phenolics content of local Sicilian plums

Ital. J. Food Sci., vol. 27 - 2015 327
served among the cv. Shiro, Stanley and Angele-no which values ranged between 4.86 and 9.59 mmol Fe2+/100 g FW and the 20% of the fruits showed values major than the average (13.45 mmol Fe2+/100 g FW). As described by FrAN-KeL and MAyer (2000), the measure of fruit an-tioxidant capacity is influenced by the analyti-cal method used and this could represent a lim-it for the evaluation. According to MILetIc et al., (2012), fruits containing the highest total phenols do not necessarily exhibit the highest antioxi-dant capacity. In fact the highest value observed
Fig. 3 - total antioxidant activity of local Sicilian plums
for the Pruno regina accession is related to the relative high phenolic content but the same cor-relation wasn’t observed for the zuccarato giallo which corresponded the highest phenolic content (663.99 mg GA/100 g FW) but the low total an-tioxidant activity of 11.86 mmol Fe2+/100 g FW.
comparing the total antioxidant activity of the studied plums to the total FrAP of other fruits reported in previous work (Guo et al., 2003) it is interesting to observe the high values find that could suggest interesting uptake of plums for the human diet.
Fig. 4 - total anthocyanins and phenolics distribution (%) in authochtonous Sicilian plums.

328 Ital. J. Food Sci., vol. 27 - 2015
4. coNcLuSIoNS
this study provides important data for quali-tative and nutraceutical properties of the fruits.
the results obtained by this preliminary study reveals that the authocthonous Sicilan plums contains important amounts of anthocy-anins and phenols; often their concentrations is higher than found not only in the commercial cultivars but also in fruits that are reported in literature to have high content of nutraceuti-cal compounds. considerable and significantly different among the plums were observed and the environmental conditions and the activity of propagation and exchange of genetic mate-rial results of the local farmers could be both responsible for the differentiation of the germ-plasm collected in the investigated areas of the Sicilian territory.
the maintaining of local genetic materials is important for the biodiversity and the action of localization and characterization of old fruits cul-tivar and accessions is fundamental to improve the management of the european Prunus Data-base for Plum (ePDP) making them available for research and genetic improvement.
the knowledge of the qualitative traits of fruits represent a good opportunity not only for the health advantages but also for the general con-sumption; in fact the enhancement and the safe-guarding of these fruits can be thought as an opportunity of new marketing channel but more studies need to be undertaken about the evo-lution of the qualitative and nutraceutical com-pounds during storage to answer the consum-er’s demands and expectations.
AcKNoWLeDGeMeNtS
this work is part of the activity funded by the Sicilian re-gional Government with the project “risorse Genetiche Veg-etali Sicilia’ – Scientific coordinator Francesco Sottile, uni-versity of Palermo.
reFereNceS
benzie I.F.F. and Strain J.J. 1996. the ferric reducing abil-ity of plasma (FrAP) as a measure of ‘Antioxidant Pow-er’: the FrAP assay. Anal. biochem. 239: 70.
cevallos-casals b.A., byrne D., okie W. r. and cisneros-zevallos L. 2006. Selecting new peach and plum geno-types rich in phenolic compounds and enhanced func-tional properties. Food chem. 96: 273.
cheng G.W. and breen P.J. 1991. Activity of phenylalanine ammonia-lyase (PAL) and concentrations of anthocyanins and phenolics in developing strawberry fruit. J. Am. Soc. Hortic. Sci. 116: 865.
crisosto G.M., crisosto c.H., echeverria G. and Puy J. 2007. Segregation of plum and pluot cultivars according to their organoleptic characteristics. Postharvest biol. technol. 44: 271.
cupani F., 1696. Hortus catholicus, 2nd ed. benzi, Napoli.Das b., Ahmed N. and Singh P. 2011. Prunus diversity. ee-
arly and present development: A review. Intern. J. of bi-odiversity and conservation 3: 721.
Díaz-Mula H.M., zapata P.J., Guillen F., Martinez-romero D., castillo S., Serrano M. and Valero D. 2009. changes in hydrophilic and lipophilic antioxidant activity and re-lated bio-active compounds during postharvest storage of yellow and purple plum cultivars. Postharvest biol. technol. 51: 354.
eifert J. D., Sanglay G. c., Lee D.J., Sumner S. S. and Pierson M. D. 2006. Prediction of raw produce surface area from weight measurement. J. Food eng. 74: 552.
Franco-Mora V.H., Franco-Mora o., Lopez-Sandoval J.A., de Jesus Perez-Lopez D. and balbuena-Melgarejo A. 2009. characterization of wild plum (Ximenia americana L. var. americana; olacaceae) fruit growing at tepexi de rodri-guez, Puebla, Mexico. Genet. resour. crop. evol. 56: 719.
Frankel e. N. and Meyer A. S. 2000. the problems of us-ing one-dimensional methods to evaluate multifunc-tional food and biological antioxidants. J. Sci. Food Ag-ric. 80: 1925.
Gharb o., Wünsch A. and rodrigo J. 2014. characterization of accessions of ‘reine claude Verte’ plum using Prunus Srr and phenotypic traits. Sci. Hortic. 169: 57.
Gregor D., Hartman W. and Stosser r. 1994. cultivar iden-tification in Prunus domestica using random amplified polymorphic DNA markers. Acta Hortic. 359: 33.
Heywood V.H. 1999. trends in agricultural biodiversity. In: “Perspectives on new crops and new uses”. Janick J. (ed.), ASHS Press, Alexandria, VA., p.151.
Guo c., yang J., Wei J., Li y., Xu J. and Jiang y. 2003. Anti-oxidant activities of peel, pulp and seed fractions of com-mon fruits as determined by FrAP assay. Nutrition re-search. 23: 1719.
Horvath A., balsemin e., barbot J.c., christmann H., Man-zano G., reynet P., Laigret F. and Mariette S., 2011. Phe-notypic variability and genetic structure in plum (Prunus domestica L.), cherry plum (P. cerasifera ehrh.) and sloe (P. spinosa L.). Sci. Hortic. 129: 283.
Impallari F.M., Monte M., Girgenti V., Del Signore M.b. and Sottile F. 2010. biodiversity of Sicilian fruit trees: Stud-ies on Plum. Acta Hortic. 874: 37.
Intrigliolo D.S. and castel J.r. 2006. Performance of various water stress indicators for prediction of fruit size response to deficit irrigation in plum. Agri. Water Manage. 83: 173.
Los J., Wilska J.J. and Pawlak M. 2000. Polyphenolic com-pounds of plums (Prunus domestica). Pol. J. Food Nutr. Sci. 50: 35.
Jablonska-rys e., zalewska-Korona M. and Kalbarczyk J. 2009. Antioxidant capacity, ascorbic acid and phenolics content in wild edible fruits. J. of Fruit and ornamental Plant research 17: 115.
Lee c. y. and Smith N. L. 2000. Apples: an important source of antioxidants in the American diet. New york Fruit quarterly. 8:15.
Maxted N., Kell S., toledo Á., Dulloo e., Heywood V., Hodg-kin t., Hunter D., Guarino L., Jarvis A. and Ford-Lloyd b. 2010. A global approach to crop wild relative conser-vation: securing the gene pool for food and agriculture. Kew bulletin 65: 561.
Miletic N., Popovic b., Mitrovic o. and Kandic M. 2012. Phenolic content and antioxidant capacity of fruits of plum cv. ‘Stanley’ (Prunus domestica L.) as influenced by maturity stage and on-tree ripening. AJcS 6: 681.
Nicosia F. 1735 Il podere fruttifero e dilettevole, ed. Felicel-la, Palermo.
ortiz A., renaud r., calzada I. and titter e. 1997. Analysis of plum cultivars with rAPD markers. J. Hortic. Sci. 72: 1.
Pellegrini N., Serafini M., colombi b., Del rio D., Salvato-ra S. and bianchi M. 2003. total antioxidant capacity of plant foods, beverages and oils consumed in Italy by three different in vitro assays. J. Nutr. 133: 2812.
Petruccelli r., Ganino t., ciaccheri L., Maselli F. and Mariotti P. 2013. Phenotypic diversity of traditional cherry acces-sions present in the tuscan region. Sci. Hortic. 150: 334.
Proteggente A. r., Pannala A. S., Paganga G., Van buren L., Wagner e., Wiseman S., van de Put F., Dacombe c. and rice-evans c. A. 2002. the antioxidant activity of reg-ularly consumed fruit and vegetables reflects their phe-
Ital. J. Food Sci., vol. 27 - 2015 329
nolic and vitamin c composition. Free radical research 36: 217.
Salgado P.r., Favarin J.L., Leandro r.A. and de Lima Fil-ho o.F. 2008. total phenol concentrations in coffee tree leaves during fruit development. Sci Agric. 65: 354.
Scoones I., Melnyk M. and Pretty J.N. 1992. the Hidden Har-vest: Wild Foods and Agricultural Systems, a Literature review and Annotated bibliography. International Insti-tute for environment and Development, London. p.260.
Slinkard K. and Singleton V.L. 1977. total phenol analysis: Automation and comparison with manual methods. Am. J. enol.Vitic. 28: 49.
Snelgar W.P., Hopkirk G., Seelye r.J., Martin P.J., Man-son P.J. 1998. relationship between canopy density and fruit quality of kiwifruit. N.z.J. crop Hortic. Sci. 26: 223.
Sottile F., e. bellini, V. Nencetti, Peano c., Palara u., Pi-razzini P., b. Mezzetti, F. capocasa, Mennone c., cata-lano L. 2010a. Plum production in Italy, state of the art and perspectives. Acta Hortic. 874: 25.
Sottile F., Impallari M., Peano c., Giuggioli N., 2010b. An-tioxidant compounds and qualitative traits in europe-an (Prunus domestica L.) and Japanese (P. triflora) plum fruits as affected by cold storage. Acta Hortic. 877: 1145.
Stacewicz-Sapuntzakis M., bowen P.e., Hussain e.A., Da-
Paper Received June 26, 2014 Accepted September 26, 2014
mayanti-Wood b.I. and Farnsworth N.r. 2001. chemi-cal composition and potential health effects of prunes: a functional food? crit. rev. Food Sci. Nutr.41: 251.
tomás-barberán F. A., Gil M. I., cremin P., Waterhouse A. L., Hess-Pierce b. and Kader A. A. 2001. HPLc-DAD-eSIMS analysis of phenolic compounds in nectarines, peaches and plums. J. Agric. Food chem. 49: 4748.
treutter D., Wang D., Farag M. A., Argueta baires G. D., rühmann S. and Neumüller M. 2012. Diversity of phe-nolic profiles in the fruit skin of Prunus domestica plums and related species. J. Agric. Food chem. 60: 12011.
usenik V., štampar F. and Veberic r. 2009. Anthocyanins and fruit colour in plums (Prunus domestica L.) during ripening. Food chem. 114: 529.
Valero c., crisosto c.H. and Slaughter D. 2007. relation-ship between nondestructive firmness measurements and commercially important ripening fruit stages for peaches, nectarines and plums. Postharvest biol. technol. 44: 248.
Vasantha rupasinghe H.P., Jayasankar S. and Lay W. 2006. Variation in total phenolics and antioxidant capacity among european plum genotypes. Sci. Hortic. 108: 243.
Westwood M.N. 1978. temperate-zone-Pomology (Posthar-vest, Storage and Nutritional Value), New york: W.N. Free-man and company, p. 428.

PaPer
330 Ital. J. Food Sci., vol. 27 - 2015
- Keywords: chemical-sensory quality, marinating, shad, shelf life -
DIFFERENT PACKAgINg METHODS EFFECTS ON SENSORy QUALITy
AND CHEMICAL CRITERIA OF MARINATED SHAD (aLosa immacuLata, b., 1838)
M.E. ERDEM*a, S. KORALb and S. IŞIDANc
aSinop University, Fisheries Faculty, Depertmant of the Fish Processing Technology, 57000 Akliman Sinop, Turkey
bRize Recep Tayyip Erdogan University, Fisheries Faculty, Depertmant of the Fish Processing Technology, Fener Mah., 53100 Rize, Turkey
cSivas Directorate of Provincial Food Agriculture and Livestock*Corresponding author: [email protected]
AbStrAct
In this study the sensory and chemical parameters of marinated shad (Alosa immaculata, ben-nett, 1838) were determined. Fish were marinated with different package methods (in brine, oil and vacuum packed) and stored at 4±1°c. During the storage period, diffusion of proximate com-position, acetic acid and sodium chloride into the fish fillets were determined. At the end of 7 months storage period, tVb-N were 8.05, 16.81 and 17.56 (mg/100 g), tMA were 2.28, 2.53 and 2.73 (mg/100 g), tbA were 7.08, 7.13 and 6.05 (mg malonaldehyde/kg) and pH were 4.42, 4.72 and 4.77 for brine, oil and vacuum packed samples, respectively. throughout the storage peri-od, effect of different package methods on tVb-N, tMA, tbA, pH, aw, acetic acid, sodium chlo-ride and sensory issues were significant (p<0.05).

Ital. J. Food Sci., vol. 27 - 2015 331
INtroDuctIoN
Fish is really healthy food and is known as the only food having a life-sustaining balanced ra-tio of protein, fat, carbohydrates, vitamins and minerals, which are essential to maintain good health. In addition, because of having low fat content, cholesterol and calories, fish meat is preferable for consumers (KorAL, 2006).
Shad is a close relative to sardines has an av-erage length of 30-33 cm. shad are a black Sea fish, but it can be found in the Marmara, Aege-an and the Mediterranean seas. Shad live close to the coast as herd by shoal, they enter in the river to spawn at reproduction time in the spring. today, shad is also heavily fished in the united States and around. According to turkish Statis-tical Institute-tSI (2013), 1699 tons shad were caught in turkey at 2012. turkish consumers generally prefer as fresh, salted or smoked shad.
Marinating is traditionally a fish preserva-tion method. Meat tenderization and flavoring are consequences of the marinating process. Sodium chloride, polyphosphates, sugars spic-es and sauces are considered important ingre-dients of marinades and they improve meat ten-derness and flavor (SINDeLAr et al., 2003; Su-DerMAN, 1993). the purpose of bringing rigidi-ty to the marinated product, enriching the meat flavor and preserving the meat longer (cHeN, 1982; reSurreccIóN, 2003). the immersion of meat in the marinating solution is done not only in turkey.
the physical characteristics of fish change in acid and salt in several days. Muscle tissue softens; skin and bones can be removed easily. Marinate generally contains 4-5% vinegar and 7-10% salt. Acetic acid leads to breakdown of structural proteins and enables the tearing of muscle membrane (Meyer, 1965; erDeM et al., 2005). Muscle tissue, which has been softened during initial days by the joint effect of acid and salt, lost 15-20% of raw material weight at the end of the process (ALPArSLAN et al., 2013).
the aim of the present study is to determine the sensory and chemical changes of marinat-ed and brine, oil and vacuum packed shad fil-lets. therefore, the use of shad as an alterna-tive to the other fish species used in marinade production will be investigated.
MAterIALS AND MetHoDS
A total of 186 pontic shad (Alosa immaculata) samples with an average weight of 191.53±33.63 g and average length of 28.71±1.58 cm were purchased from a local fish market in trab-zon, turkey. they were stored in a thermally insulated container, brought to the laboratory and stored at –30°c with the purpose of elimi-nating the risk of parasites until the marinat-ing process.
Marination process
before marinating process, fishes were cleaned at the head, and the integral organs, after that fillet and washed with clean water. Approximately 36 kg fillets were immersed into the following different marinating solutions for 48 h (1:2 fish:solution ratio) in a refrigerator. After two days of storage in refrigerator, the fil-lets were dipped in 4.5% acetic acid, 0.2% cit-ric acid and 10% salt marination solutions, the marinated fishes were divided into tree groups (brine, sunflower oil and vacuum packaging). 70 grams of marinated shad fillets were packed into plastic box of 250 mL capacity with 150 mL brine, 150 mL sunflower oil, vacuum packaged and than were stored at 4±1°c for 7 months. Proximate, chemical quality and sensory anal-yses were performed in triplicate on days 1, 30, 90, 150, and 210th.
Chemical analysis
Samples were homogenized and subjected to moisture and ash analyses using AoAc (1990) methods. crude protein content was calculated by converting the nitrogen content according to Kjeldahl’s method (AoAc 1990), and lipid con-tent was determined according to the method of the bLIGH and Dyer (1959). thiobarbituric acid (tbA) amounts were determined using the meth-od of tArLADGIS et al., (1960), expressed as mg malonaldehyde/kg sample using a conversion factor of 7.8. the pH was determined from ho-mogenates of minced samples in distilled water in a ratio of 1:10 (w/v) by using a digital pH meter (Hanna, Germany) (currAN et al., 1980). total volatile basic nitrogen (tVb-N) was determined on steam distillation using the Kjeldahl distilla-tion apparatus and until red color was titrated, for clarification (ANtoNocoPouLuS 1973). the method of AoAc (1990) was used for trimethyl-amine nitrogen (tMA-N) analysis.
the water activity determination Aqualab 3 te (0.100 to 1.000 ± 0.003), were measured by u.S. brand equipment. Salt content was meas-ured using the method proposed by KArL (1994). 20 g fish were homogenized for 5 minutes with 100 mL distilled water, and than 150 mL dis-tilled water was added and it was filtered. to this solution was added 2.5 mL of 10% K2cro4. until red color was titrated with AgNo3 0.1 N and ac-cording to the following formula amount of salt (%) was calculated:
Nacl (%) = A x 0.00585 x 100 x 500 / Amount of sample (g) x 50
A: AgNo3 consumption (mL)
For the sensory evaluation of the marinated products five panelists were used. Sensory anal-ysis to assess appearance, odor, flavor and tex-ture criteria were used, and analyises results,

332 Ital. J. Food Sci., vol. 27 - 2015
which were scored on a scale of 1 to 9. In the scoring system points from 9 to 7 indicates “very good”, from 4.1 to 6.9 indicates “good”, 4 indi-cates “expendability” (4 is the rejection line), and from 1 to 3.9 indicates unacceptability (VArLIK et al., 1993).
Statistical analysis
the statistical analysis was performed using Minitab release 13.20 (Minitab Inc., State col-lege, PA, uSA). Differences were analyzed by one-way analysis of variance and tukey’s test. In all statistical tests, P<0.05 was considered as statistically different (SuMbuLoGLu and SuMb-uLoGLu, 2000).
reSuLtS AND DIScuSSIoN
the proximate composition of the shad fillet in each stage of the process is shown in table 1. these results are wet fish sample and marinat-ed shad. Protein, lipid, dry matter and ash of fresh shad fillets were 17.41%, 18.98%, 39.15% and 2.17%, respectively. At the end of the stor-age, all of these values have increased. Maximum protein value was brining sample (18.83%) while maximum values at the lipid and dry matter were 20.30% and 47.11% at oil marinated and brin-ing, respectively. GuNer et al. (1998), and bo-rAN and KArAcAM (2011) reported 22.42% and 19.80% for protein and 15.91% and 9.34% li-pid in fresh shad fillets, respectively. In another experiment, at the end of the brining stage the protein and lipid content were 18.32 g.100 g–1 and 3.20 g.100 g–1 of fish fillets (yeANNeS and cASALeS 2008). the results of proximate anal-ysis of fresh shad fillets were in agreement with our study.
tVb-N of raw material was 14.01( mg/100 g) (table 2). At the end of 7 months storage period for marinated shad that were packaged different-ly in brine, oil and vacuum packed, tVb-N val-ues were 8.05, 16.81 and 17.56 (mg/100 g), re-spectively. Statistically difference was found be-tween the brine group with the other groups on tVb-N value (P<0.05). ÖzDeN and erKAN (2006) reported that tVb-N in fresh fish and marinat-ed trout were 7.35 mg/100 g and 6.78 mg/100
g, respectively. tVb-N values increased to 12.08 mg/100 g and 11.98 mg/ 100 g at the end of storage in vacuum and oil packed samples, re-spectively. Similar results obtained in marinat-ed fish packaged in vacuum and stored in re-frigerator at a different time (AKSu et al., 1997, MetİN et al., 2000 and ArIK et al., 2001).
tbA was 0.99 malonaldehyde/kg at the be-ginning of the this study (table 2). this value increased to 7.08 in the brine, 7.13 in the oil and 6.05 mg malonaldehyde/kg in the vacu-um packaged group on the last day (210th day) of storage. Statistically difference was found be-tween the vacuum group with the other groups on tbA value (P<0.05). tbA value is an impor-tant indicator and is excessively used to deter-mine the level of lipid oxidation in fish (SALLAM 2007; cADuN et al., 2008; turHAN et al., 2009). VArLIK et al. (1993) reported that a consuma-ble limit was between 7-8 mg malonaldehyde/kg tbA in sea fish.
ÖzDeN and erKAN (2006) reported 0.45 mg malonaldehyde/kg tbA values for fresh rainbow trout and 2.8 mg malonaldehyde/ kg tbA val-ues for marinated fish after 90 days, while 9.5 mg malonaldehyde/kg for vacuum and 10.26 mg malonaldehyde/kg for oil packaged marinated trout fillets were determined.
Water activity (aw) of the raw material changed from 0.98 to 0.99, indicating that, it is the most suitable period for microbial growth (table 2). the water activities (aw) at the marination were 0.93-0.94 between each group. the findings re-garding to the aw value are in compliance with borGStroM’S (1968) with yeANNeS and cA-SALeS (2008).
In this study, pH level was 4.42, 4.72 and 4.77 in the brine, oil and vacuum packaged samples at 210 days, respectively and there were no sig-nificant differences between groups (p>0.05). the pH of fresh raw fish was initially approxi-mately 6.30 and then changed during the mat-uration process to 4.29 after 90 days (ÖzDeN and erKAN 2006). In another study, pH values in anchovy marinated with 2% and 4% acetic acid increased was changed from 4.25 to 4.53 (AKSu et al., 1997).
the sodium chloride content of the fillet re-mained stable during the marinating stage while the salt level becomes richer in the brin-
table 1 - the proximate composition in percentage of fresh and different marinating process of shad (Alosa immaculata,) fil-lets during storage.
Storage days Protein (%) Lipid (%) Dry Matter (%) Ash (%)
Fresh fish 17.41±0.51a 18.98±0.66a 39.15±0.15 a 2.17±0.16a
Brine 18.83±0.28b 20.14±0.11c 47.11±0.16 b 10.28±0.04c
Oil Marinated 18.06±0.33b 20.30±0.19c 47.05±0.70 b 8.68±0.11c
Vacuum Marinated 18.16±0.15b 20.21±0.33c 47.05±0.02 b 8.12±0.07b
Data are expressed as means±standard deviation.
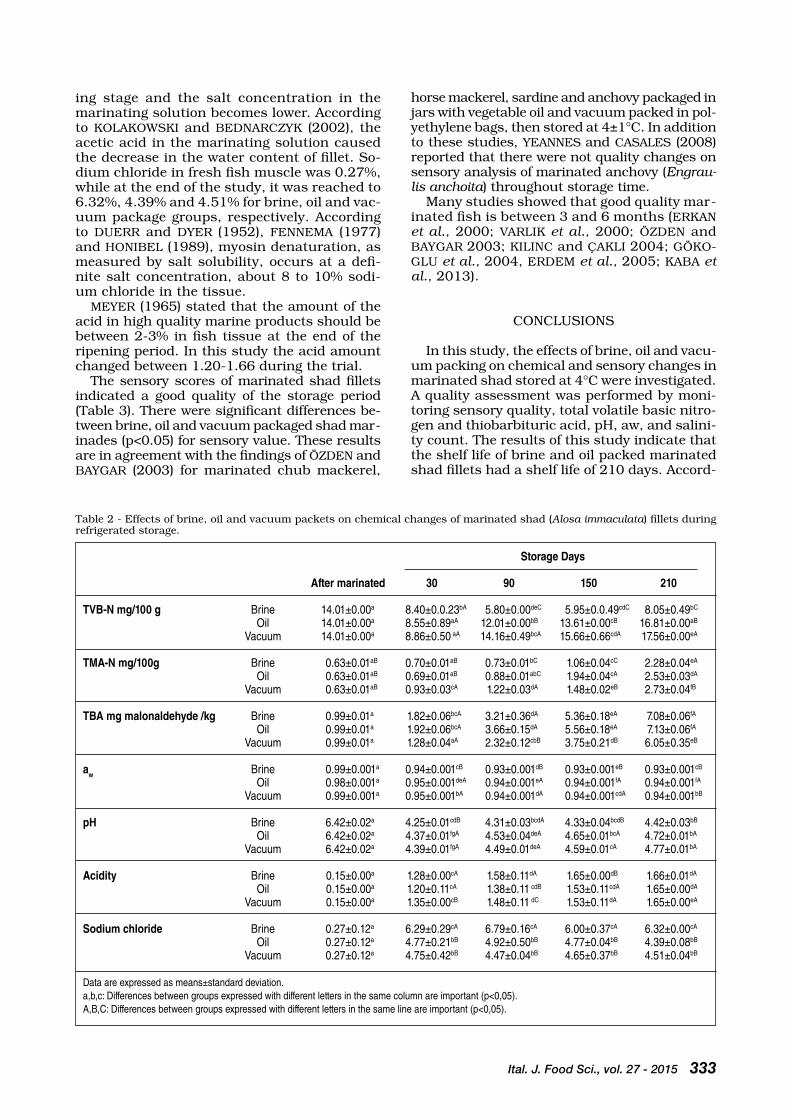
Ital. J. Food Sci., vol. 27 - 2015 333
table 2 - effects of brine, oil and vacuum packets on chemical changes of marinated shad (Alosa immaculata) fillets during refrigerated storage.
Storage Days
After marinated 30 90 150 210
TVB-N mg/100 g Brine 14.01±0.00a 8.40±0.0.23bA 5.80±0.00deC 5.95±0.0.49cdC 8.05±0.49bC
Oil 14.01±0.00a 8.55±0.89aA 12.01±0.00bB 13.61±0.00cB 16.81±0.00aB
Vacuum 14.01±0.00a 8.86±0.50 aA 14.16±0.49bcA 15.66±0.66cdA 17.56±0.00eA
TMA-N mg/100g Brine 0.63±0.01aB 0.70±0.01aB 0.73±0.01bC 1.06±0.04cC 2.28±0.04eA
Oil 0.63±0.01aB 0.69±0.01aB 0.88±0.01abC 1.94±0.04cA 2.53±0.03dA
Vacuum 0.63±0.01aB 0.93±0.03cA 1.22±0.03dA 1.48±0.02eB 2.73±0.04fB
TBA mg malonaldehyde /kg Brine 0.99±0.01a 1.82±0.06bcA 3.21±0.36dA 5.36±0.18eA 7.08±0.06fA
Oil 0.99±0.01a 1.92±0.06bcA 3.66±0.15dA 5.56±0.18eA 7.13±0.06fA
Vacuum 0.99±0.01a 1.28±0.04aA 2.32±0.12cbB 3.75±0.21dB 6.05±0.35eB
aw Brine 0.99±0.001a 0.94±0.001cB 0.93±0.001dB 0.93±0.001eB 0.93±0.001cB
Oil 0.98±0.001a 0.95±0.001deA 0.94±0.001eA 0.94±0.001fA 0.94±0.001fA
Vacuum 0.99±0.001a 0.95±0.001bA 0.94±0.001dA 0.94±0.001cdA 0.94±0.001bB
pH Brine 6.42±0.02a 4.25±0.01cdB 4.31±0.03bcdA 4.33±0.04bcdB 4.42±0.03bB
Oil 6.42±0.02a 4.37±0.01fgA 4.53±0.04deA 4.65±0.01bcA 4.72±0.01bA
Vacuum 6.42±0.02a 4.39±0.01fgA 4.49±0.01deA 4.59±0.01cA 4.77±0.01bA
Acidity Brine 0.15±0.00a 1.28±0.00cA 1.58±0.11dA 1.65±0.00dB 1.66±0.01dA
Oil 0.15±0.00a 1.20±0.11cA 1.38±0.11 cdB 1.53±0.11cdA 1.65±0.00dA
Vacuum 0.15±0.00a 1.35±0.00cB 1.48±0.11 dC 1.53±0.11dA 1.65±0.00eA
Sodium chloride Brine 0.27±0.12a 6.29±0.29cA 6.79±0.16cA 6.00±0.37cA 6.32±0.00cA
Oil 0.27±0.12a 4.77±0.21bB 4.92±0.50bB 4.77±0.04bB 4.39±0.08bB
Vacuum 0.27±0.12a 4.75±0.42bB 4.47±0.04bB 4.65±0.37bB 4.51±0.04bB
Data are expressed as means±standard deviation.a,b,c: Differences between groups expressed with different letters in the same column are important (p<0,05).A,B,C: Differences between groups expressed with different letters in the same line are important (p<0,05).
ing stage and the salt concentration in the marinating solution becomes lower. According to KoLAKoWSKI and beDNArczyK (2002), the acetic acid in the marinating solution caused the decrease in the water content of fillet. So-dium chloride in fresh fish muscle was 0.27%, while at the end of the study, it was reached to 6.32%, 4.39% and 4.51% for brine, oil and vac-uum package groups, respectively. According to Duerr and Dyer (1952), FeNNeMA (1977) and HoNIbeL (1989), myosin denaturation, as measured by salt solubility, occurs at a defi-nite salt concentration, about 8 to 10% sodi-um chloride in the tissue.
Meyer (1965) stated that the amount of the acid in high quality marine products should be between 2-3% in fish tissue at the end of the ripening period. In this study the acid amount changed between 1.20-1.66 during the trial.
the sensory scores of marinated shad fillets indicated a good quality of the storage period (table 3). there were significant differences be-tween brine, oil and vacuum packaged shad mar-inades (p<0.05) for sensory value. these results are in agreement with the findings of ÖzDeN and bAyGAr (2003) for marinated chub mackerel,
horse mackerel, sardine and anchovy packaged in jars with vegetable oil and vacuum packed in pol-yethylene bags, then stored at 4±1°c. In addition to these studies, yeANNeS and cASALeS (2008) reported that there were not quality changes on sensory analysis of marinated anchovy (Engrau-lis anchoita) throughout storage time.
Many studies showed that good quality mar-inated fish is between 3 and 6 months (erKAN et al., 2000; VArLIK et al., 2000; ÖzDeN and bAyGAr 2003; KILINc and ÇAKLI 2004; GÖKo-GLu et al., 2004, erDeM et al., 2005; KAbA et al., 2013).
coNcLuSIoNS
In this study, the effects of brine, oil and vacu-um packing on chemical and sensory changes in marinated shad stored at 4°c were investigated. A quality assessment was performed by moni-toring sensory quality, total volatile basic nitro-gen and thiobarbituric acid, pH, aw, and salini-ty count. the results of this study indicate that the shelf life of brine and oil packed marinated shad fillets had a shelf life of 210 days. Accord-

334 Ital. J. Food Sci., vol. 27 - 2015
table 3 - effects of different package methods on sensory property of marinated shad (Alosa immaculata) fillets during stor-age time.
Storage Days
After marinated 30 90 150 210
Appearance Brine 9.55±0.38aA 9.00±0.38 aA 7.05±0.69 bA 6.40±0.98 cA 5.00±0.32 dA
Oil 9.57±0.41 aA 8.50±0.55 aB 7.13±0.52 bA 6.04±0.39 cA 4.53±0.52 dB
Vacuum 9.65±0.35 aA 930±0.61 aC 7.47±0.41 aB 5.81±0.32 dA 4.20±0.32 dB
Odor Brine 9.25±0.25aA 8.58±0.49 abA 7.42±1.02 bcA 5.92±0.92 cA 4.28±0.35 dA
Oil 9.52±0.61 aA 8.60±0.41 abA 7.08±0.92 bA 6.25±0.76 cA 4.57±0.75 dB
Vacuum 9.61±0.41 aA 8.70±0.32 abA 7.83±0.41 cdA 5.97±0.26 dA 3.91±0.29 aC
Flavor Brine 9.63±0.05aA 8.75±0.35 abA 7.25±0.15 cA 5.90±0.10 dA 4.13±0.18 eA
Oil 9.63±0.05aA 8.50±0.20 bB 7.25±0.20 cA 6.00±0.15 dA 4.50±0.06 eB
Vacuum 9.63±0.05aA 9.25±0.09 abC 7.75±0.18 bA 4.75±0.15 cB 3.50±0.00eC
Texture Brine 9.85±0.39aA 8.58±0.41 bA 7.08±0.44 cA 6.00±0.33 dA 4.20±0.13 eA
Oil 9.88±0.37aA 8.79±0.20 bA 7.67±0.21 cAB 5.58±0.27 dA 4.40±0.15 eA
Vacuum 9.93±0.23aA 9.71±0.26 aB 7.93±0.24 bB 5.33±0.15 cB 4.00±0.21dB
a,b,c Differences between groups expressed with different letters in the same column are important (p<0,05).A,B,C Differences between groups expressed with different letters in the same line are important (p<0,05).
ing to this study, fishbones of the shad which has a large number of them melted as a result of the marination process.
AcKNoWLeDGMeNtS
this study was supported by the Scientific research coordi-nation unit of recep tayyip erdogan university, rize, tur-key (Project Number: rÜbAP 2008.103.03).
reFereNceS
Aksu H., erkan N., Çolak H., Varlık c., Gökoglu N. and ugur M. 1997. Farklı Asit-tuz Konsantrasyonlarıyla Hamsi Marinatı Üretimi esnasında olusan bazı Degisiklikler ve raf Ömrünün belirlenmesi. university of 100.yıl.. J. Vet. Fac. 8 (1-2): 86.
Alparslan y., baygar t., Hasanhocaoglu H. and Metin c. 2013. effects of scale and skin on chemical and sensory quality of marinated sea bass filets (Dicentrarchus labrax, L. 1758) in sunflower oil during storage at 4ºc. emir. J. Food Agric., 25(7): 516.
Antonacopoulos N. and Vyncke W. 1989. Determination of volatile basic nitrogen in fish. z. Lebensm. unters. Forsch. 189: 309.
AoAc, 1990. official Methods of Analysis, 15th ed. Asso-ciation of the official Analytical chemists, Washington, Dc, uSA.
Arık F., Fiedler F., v.Lukowicz M.V., Sperner b. and Stolle A. 2001. untersuchungen zur Haltbarkeit von be- und verarbeiteten Süsswasserfischen. Arch. Lebensmittel-hyg. 52: 34.
bligh e.G. and Dyer W.J., 1959. A rapid method of total li-pid extraction and purification. can. J. biochem. Phys. 37: 911.
boran G. and Karaçam H. 2011. Seasonal changes in Prox-imate composition of Some Fish Species from the black Sea. turk. J. of Fish. and Aquat. Sci., 11: 01-05.
borgstrom G. 1968. chemical preservation. In: Principles of Food science. Food technology. New york: Academic Press, v. 1, p. 290.
cadun A., Kısla D. and Çaklı S. 2008. Marination of deep-water pink shrimp with rosemary extract and the deter-mination of its shelf-life. Food chem., 109(1): 81.
chen t.c. 1982. Studies on the marination of chicken parts for deep-fat frying. J. Food Sci., 47: 1016.
curran c.A., Nicoladies L., Poulter r.G.and Pors J. 1980. Spoilage of Fish from Hong Kong at Different Storage temperatures. trop Sci , 22, 367.
Duerr J.D. and Dyer W.J. 1952. Proteins in fish muscle IV. Denaturation by salt. Atlantic Fisheries experimen-tal Station, Halifax, N.S. J. Fish res. bd. can, 8(5): 325.
erdem M.e., bilgin S. and Çaglak e. 2005. quality chang-es of processed with marinade, brine and spice horse mackerel (Trachurus mediterraneus, Steindachner, 1868) during storage. J. of Fac. Agric., ondokuzmayıs univer-sity, 20(3): 1.
erkan N., Mol S., Varlık c., baygar t., Özden Ö., Gün H. and Kalafatoglu, H. 2000. Modifiye Atmosferle Paketlemenin (MAP) Paneli Alabalık Marinatlarının raf Ömrü Üzerine etkisi. turk. J.Vet.Anim. Sci, 24: 585.
Fennema o. 1977. Water and protein hydration. In: Foods Proteins. AVI Publishing company. p. 50.
Gökoglu N. 2004. changes in biogenic Amines during Mat-uration of Sardine (Sardina pilchardus) Marinade. Fish-eries Sci., 69: 823.
Güner S., Dinçer b., Alemdag N., colak A. and tüfekci, M. 1998. Proximate composition and selected mineral con-tent of commercially important fish species from the black Sea. J. Sci. Food Agric., 78: 337.
Honibel K.o. 1989. the meat aspects of water and food quality in water and food quality. elsevier Applied Science. p. 277.
Kaba N., Çorapcı b., yüce, S. and eryasar K. 2013. Deter-mining shelf life in refrigerator conditions of marinated meat ball produced with smoked bonito (Sarda sarda, bloch 1793). Journal of New results in Science, 3: 10.
Karl H.1994. “Überlegungen zur berechnung der Salz – und Sauregehalte im Fishgewebewasser von Marinierten Fis-chereierzeugnissen”. Infn Fisch., 47-59.
Kılınç b. and Çaklı S. 2004. chemical, microbiological and sensory changes in thawed frozen fillets of sardine (Sardi-na pilchardus) during marination. Food chem., 88: 275.
Kolakowski e. and bednarczyk b. 2002. Physical and sen-sory changes in headed and gutted baltic herring dur-ing inmersed salting in brine with the addition of acetic acid. Part 1. Weight losses, color of flesh and its sensory
Ital. J. Food Sci., vol. 27 - 2015 335
properties. electronic Journal of Polish Agricultural uni-versities, 5-2, p. 1.
Koral S., 2006. Investigating the quality changes of raw and smoked pacific mullet (Mugil so-iuy, basilewski, 1855) and bonito (Sarda sarda, bloch, 1838) at ambient and re-frigerated temperatures, Ktu Fen bilimLeri enst., Mas-ter’s thesis.
Metin S., erkan N., Varlık c., Özden Ö., baygar t., Kalafatoglu H. and Gün H. 2000. the effect of modified atmosphere packaging (MAP) on the shelf-life of mari-nated and breaded rainbow trout. turk. J. Vet. Anim. Sci., 24(6), 585.
Meyer V. 1965. Marinades. In: borgstrom, G. (ed.). Fish as Food. Processing: Part 1. New york: Academic Press, v. 3, p. 165.
Özden Ö. and erkan N. 2006. effect of different packing methods on the shelf life of marinated rainbow trout, Archiv für Lebensmittelhygiene, 57: 69.
Özden Ö. and baygar t. 2003. the effect of different pack-aging methods on some quality criteria of marinated fish. turk. J.Vet. Anim. Sci. 27: 899.
resurrección A.V.A. 2003. Sensory aspects of consumer choices for meat and meat products. Meat Sci. 66: 11.
Sallam Kh.I., Ahmed A.M., elgazzar M.M. and eldaly e.A. 2007. chemical quality and sensory attributes of mari-
nated Pacific saury (Cololabis saira) during vacuum-pack-aged storage at 4 °c. Food chem., 102: 1061.
Sindelar J.J., Prochaska F., britt J., Smith G.L. and osburn W.N. 2003. Strategies to eliminate a typical flavors and aromas in sow Loins. II consumer acceptance of Loins marinated with sodium tripolyphosphate and sodium bi-carbonate. Meat Sci., 65:1223.
Suderman D.r. 1993. Selecting flavoring and seasoning for batter and breading systems. cereal Foods World, 38: 689.
Sümbüloglu K. and Sümbüloglu V. 2000. biostatistics, Hat-iboglu Press:53, 9th edition, Ankara, p. 269.
tarladgis b., Watts b.M. and yonathan M. 1960. Distilla-tion method for determination of malonaldehyde in ran-cidity food. J. Am. oil chem. Soc. 37: 44.
t.S.I. (turkish Statistical Institute) 2013. tuIK, Ankara.yeannes M.I. and casales M.r. 2008. Modifications in the
chemical compounds and sensorial attributes of Engrau-lis anchoita fillet during marinating process, ciênc. tec-nol. Aliment., campinas, 28(4): 798.
Varlık c., ugur M., Gökoglu N. and Gün H. 1993. Princi-ple and methods of quality control in sea products. Food technology Association Press 17, 174 p., Ankara.
Varlık c., erkan N., Metin S., baygar t. and Özden Ö. 2000. Determination of the shelf-life of marinated fish balls. turk. J. Vet. Anim. Sci., 24(6): 593.
Paper Received June 26, 2014 Accepted October 10, 2014

PaPer
336 Ital. J. Food Sci., vol. 27 - 2015
- Keywords: foodborne pathogens, Bacillus cereus, Escherichia coli, proteolytic enzymes, 16SrRNA -
PREvALENCE AND ANTIbIOTIC RESISTANCE OF FOOD bORNE bACTERIAL CONTAMINATION
IN SOME EgyPTIAN FOOD
SAMy SELIM1,2*, MONA WARRAD3, EL FATIH EL DOWMA1
and MOHAMED AbDEL AZIZ2
1Department of Clinical Laboratory Sciences, College of Applied Medical Sciences, Aljouf University, Sakaka, P.O 2014, Saudi Arabia
2Botany Department, Faculty of Science, Suez Canal University, Ismailia, P.O. 41522, Egypt3Department of Medical Laboratory Sciences, College of Applied Medical Science in Al qurait,
Aljouf University, Al qurait, Saudi Arabia*Corresponding author: [email protected]
AbStrAct
this study was undertaken to investigate the prevalence and antibiotic resistance of food borne bacterial contamination in some egyptian food. total viable bacteria and total coliform bacteria were isolated from different sources of food; carbohydrates (bread, flour and basbousa), vegetables (outer and inner tissues of potato and outer and inner tissues of cucumber) and proteins (minced meat, cheese and milk). the study resulted in maximum value of total viable bacteria found in outer tissue of potato 68X104±1.0, while the minimum value found in inner tissues of potato and cucumber. the study resulted in total coliform was maximum value in minced meat 6.4X10³±0.3. basbousa and inner tissue of potato and cucumber were free from coliforms. the ability of isolates to producing proteolytic enzymes was tested, we found that 326 isolate (63.92%) from all isolates had this ability, thus we selected most 2 potent proteolytic isolates. the two isolates were identi-fied as Bacillus cereus and Escherichia coli. the identification confirmed by microlog 34.20 system and 16SrrNA for two isolates and the same result was founded. Sensitivity tested for the most po-tent proteolytic species to 12 of the most commonly used antibiotics in the egyptian pharmacy. the results showed that all species were sensitive to most of antibiotics, except B. cereus which was strongly susceptible to azteronam and ceftazidim. the data showed that raw meat, cooked food products, and raw milk were most commonly contaminated with foodborne pathogens and many pathogens were resistant to different antibiotics. the study provided useful information for assessment of the possible risk posed to consumers, which has significant public health impact.

Ital. J. Food Sci., vol. 27 - 2015 337
INtroDuctIoN
It has been estimated that as many as 30% of people in industrialized countries suffer from a food borne disease each year and in 2000 at least two million people died from diarrheal disease worldwide (WHo, 2002a). Foods are not only of nutritional value to those who con-sume them but often are ideal culture media for microbial growth, chemical reactions that cause offensive and sensory changes in foods are mediated by bacteria that use food as car-bon and energy source. Some of the major bac-terial genera which cause food born infection and intoxication (PuNDIr and JAIN, 2011). con-tamination of food can affect a large number of populations. About 2.5 million people die every year from water born diseases. More than 40% of total population of Indonesia & 60% in thai-land suffered from gastroenteritis per year. A total of 32.7% outbreak was involved with res-taurant catering bakery products (NAzIr and ISLAM, 2007).
Fruits and vegetables carry microbial flo-ra while passing from the farm to the table. the produce is exposed to potential microbi-al contamination at every step including culti-vation, harvesting, transporting packing, stor-age and selling to the final consumer (FDA, 2000). Sources of environmental microbial contamination include raw materials, process-ing equipment, manufacturing activities, san-itation and maintenance practices, workers, waste, animal and insect pests, and microbi-al growth niches embedded in equipment and in structural components of the building. the survival and growth of microorganisms in a food-processing environment may lead to con-tamination of the finished product that may, in turn, result in a reduction of microbiologi-cal safety and quality. Most food plants have locations that can promote the growth of path-ogens and spoilage microorganisms that may be transferred directly on to product or car-ried into additional niches. the origins of these growth habitats are mainly unhygienic design, construction, and maintenance and repair ac-tivities that prevent easy cleaning and disin-fection. the presence of water and nutrients (food product) is required to form a microbial growth niche and the chemical composition of the food and conditions of water activity, pH, temperature, etc., will select the “normal” or-ganisms that can grow there. Microbial growth niches may be established when water is used to clean dry processing environments not de-signed for wet cleaning and not all points in the equipment are promptly and completely dried (JAy, 1996, teSFAye et al., 2011). VAN-DerzANt and SPLIttStoeSSer, (1992) dem-onstrated that the microbial growth on equip-ment for processing perishable foods is gov-erned mainly by the ecology of the food, the
process, packing room temperature, presence of food residue on the equipment, and efficacy of cleaning and disinfection. recontamination of a biocidaly treated food may increase the risk of foodborne illness if the food is not heat-ed to destroy pathogens before consumption. Perishable foods that do not receive a biocid-al treatment in the final container may be de-contaminated by spoilage microorganisms be-fore packing (VANDerzANt and SPLIttStoeSS-er, 1992, HAILeSeLASSIe et al., 2013).
the research project will deal with investigate the prevalence and antibiotic resistance of Ba-cillus cereus, Escherichia coli contamination in some egyptian food.
2. MAterIALS AND MetHoDS
2.1. Food samples
All food samples were collected from Mansoura city, egypt. they collected from different shops, super market, groceries and butchers. ten sam-ples were taken from each of bread, flour, bas-bousa, potatoes, cucumber, minced meat, cheese and milk.
2.2. Preparation of samples
twenty five grams of each of the following sam-ples bread, flour, basbousa, outer tissue and in-ner tissue of potatoes and cucumber, minced meat, cheese and ten ml of raw milk (unboiled/unpasteurized) was homogenized in 225 ml ster-ile physiological saline solution (0.85% Nacl) in 500 ml conical flask using a plender for 1-2 minutes, then decimal dilutions were prepared.
2.3. Isolation of bacteria
one ml of appropriate dilution was inoculat-ed on both of Nutrient agar medium and Mac-conkey agar medium; the plates were incubat-ed aerobically for 24h at37oc. total viable bac-teria (t.V.b) were enumerated on Nutrient agar medium using pour plate technique. total col-iform (t.c) bacteria were counted on Macco-nkey agar medium by using pour plate tech-nique also. the plates were incubated aerobi-cally for 24h at 37oc.
2.4. Purification
After the incubation period (24h), the grow-ing colonies were enumerated for counting. Af-ter counting a sterile wire loop was used to pick the isolate from the plate and was streaked on freshly prepared nutrient agar medium then in-oculated for 24h at 37oc in order to get pure cul-ture. the growing colonies were purified and ex-amined by using cultured morphological appear-ance and Gram reaction.

338 Ital. J. Food Sci., vol. 27 - 2015
2.5. Proteolytic assay
Proteolytic activity was carried out according to casein - Pholine method (rAMALAKSHMI et al., 2012). culture media was centrifugated at 7200 rpm for 10 min and supernatant was used as enzyme source. However, 1% casein (in 0.1 M phosphate buffer and pH 7.0) was used as sub-strate. 1 mL each of enzyme and substrate was incubated at 50°c for 60 min. the reaction was terminated by adding 3 mL of trichloroacetic acid (tcA). one unit of protease activity was de-fined as the increase of 0.1 unit optic density at 1 h incubation period. then it was centrifuged at 5000 rpm for 15 min. From this, 0.5 mL of su-pernatant was taken, to this 2.5 ml of 0.5M so-dium carbonate was added, mixed well and in-cubated for 20 min. then it was added with 0.5 ml of folin phenol reagent and the absorbance was read at 660 nm using Spectrophotometer. the amount of protease produced was estimated and expressed in microgram of tyrosine released under standard assay conditions. based on the tyrosine released the protease activity was ex-pressed in microgram of tyrosine released by 1 mL of enzyme in 30 minutes at 300c on tyros-ine equivalent.
2.6. Identification of bacterial isolates
2.6.1. conventional methods
the appearance of cultures, cell morphologi-cal characteristics and physiological character-istics of the purified selected identified isolates were studied. Media and reagent were prepared according to standard and procedures as de-scribed by (MAcFADDIN, 1980). the identifica-tion was carried out by traditional characters and biochemical tests for isolates according to (Krieg et al., 1994) and confirmed out by biolog micolog 34.20 system for most potent proteo-lytic bacterial species. characterization of the most potent isolates were completed and con-firmed by biolog Microlog 34.20 system at the unit of Identification of Microorganisms and bi-ological control unit of Agriculture reasearch center, Giza, egypt.
2.6.2. Molecular method
the polymerase chain reaction (Pcr) meth-ods based on 16S rrNA gene for identification of isolates were used. Genomic DNA was ex-tracted and purified by using qiagen kit (qia-gen company). the purity was assessed from the A260/A280 ratios: cultures of bacteria were streaked on tryptic soy agar medium and incubated at 37°c for 24 h. A single colony of each pathogen was grown in (Lb) broth medi-um in erlenmeyer flask and incubated at 37°c for 24 h. culture was harvested by centrifuga-tion at 4°c for 10 min, DNA was extracted from
pellets according qiagen kit instructions. Full length 16S rrNA (1500 bp) were amplified from isolates by Pcr using universal forward prim-er 518F (5’–ccAGcAGccGcGGtAAtAcG-3’) and 800r (5’-tAccAGGGtAtctAAtcc-3’). op-timum conditions (denaturation 94-1 min, an-nealing 63-45 s and extension 72-2 min, 35 cycles). Amplified 16S rrNA was purified from 0.8% melting point agarose gel. bands ob-tained from Pcr product were eluted and pu-rify by (qiagen elution kit) Pcr instructions, DNA band desired was excised from ethidi-um bromide stained agarose gel with a razor blade, transferred to ependorf tube. DNA was sequenced directly using specific primer with concentration 20 pmol Macrogen Sequencing company, Korea.
2.7. Antibiotic susceptibility test
2.7.1. Antibiotic disks
Antimicrobial susceptibility profile of identi-fied bacterial species, Bacillus cereus and E.coli against different antibiotics ampicillin, aztreon-am, cefadroxil, ceftazidime, chloramphenicol, ciprofloxacin, erythromycin, imipenem, neomy-cin, norfloxacin, streptomycin and vancomy-cin were studied. the antibiotic discs used in this research were purchased from oxoid LtD., england.
2.7.2. Disc diffusion agar method
Antibiotic susceptibility test for the bacterial isolates was carried out by disc diffusion tech-nique according to bAure et al., (1966). the technique was done by inoculation of pure col-onies of the tested organism into 5 mL of sterile nutrient broth and incubation at 37°c for 24h. then 0.1ml of bacterial suspension (0.5 McFar-land turbidity) was spreading by sterile swabs on nutrient agar plates. Duplicate plates were prepared for the strain. Antibiotic discs were ap-plied to the surface of plates at constant distanc-es. the plates were incubated at 37°c for 24h. At the end of incubation period zones of inhibi-tion were measured as (mm). the entire diame-ter of the zone was measured including the di-ameter of the disc. the end point of the reading was taken as complete inhibition of the growth to the naked eye. our (+++) or (++++) indicate high inhibitory effect (large diameter of clearing zone) and (-) indicate no inhibitory effect (good growth).
2.8. Statistical analysis the variations between experiments were es-
timated by standard deviations, and statistical significance of changes was estimated by stu-dent’s t-test. only the probability P ≤ 5% was regarded as indicative of statistical significance.

Ital. J. Food Sci., vol. 27 - 2015 339
3. reSuLtS
3.1. Isolation of total viable bacteria from different types of food
All growing isolates were enumerated, collect-ed, purified and tabulated. All growing isolates were collected from investigated types of food. ta-ble 1 includes the isolates numbers and sourc-es of collected isolates. total viable bacterial counts (tVb) and total coliform bacterial count (tcb) of three main groups of food were tabulat-ed in table 4. In carbohydrates, the highest count
40.5x10³cfu/gm was recorded in bread. the to-tal viable bacterial count in flour was 35.3x10³c-fu/gm. the lowest count 1.1x10³ cfu/gm was re-corded in basbousa. both Fig. 1 and table 4 show these results. the count of total coliform bacteria (tcb) was 5.4x10³ and 5.3x10³ cfu/gm in flour and bread respectively. this group of bacteria (tcb) was not recorded in basbousa (table 1). the counts of t.V.b were 68x104 and 52.7x10⁴ cfu /ml in the epidermis of both of potato and cucumber respectively. While the count was re-duced to a lowest count 1.0x10² cfu /mL of the inner tissues of both potato and cucumber. It
table 1 - counts of total viable bacteria (t.V.b) and total coliform (t.c.b) & Log10 cfu/ ml for samples of food collected from Al-Mansoura city, egypt.
T.C.B T.V.B Types of Food
Counts Log 10 Counts Log 10 (cfu/ml) (cfu/ml)
I-CarbohydratesBread 40.5x10³± 0.5 4.61 5.3x10³± 0.4 3.72Flour 35.3x10³± 0.9 4.55 5.4x10³± 0.4 3.73Basbousa 1.1x10³± 0.1 3.03 0.0 0.0
II-VegetablesPotatoOuter tissue 68x104± 1.0 5.83 3.2x10³± 0.3 3.51Inner tissues 0.1x10³± 0.1 1.98 0.0 0.0CucumberOuter tissue 52.7x10⁴± 2.5 5.72 1.8x10³± 0.2 3.26Inner tissues 0.1x10³± 0.0 2.0 0.0 0.0
III-ProteinsMinced meat 28x103± 3.5 4.44 6.4x10³± 0.3 3.80Cheese 42.7x10⁴± 2.3 5.63 2.1x10³± 0.2 3.32Milk 39.7x10⁴± 0.6 5.60 2.33x10³± 2.5 3.37
All values are the means of triplicate plate.
Fig. 1 - the percentage of proteolytic and non-proteolytic isolates from different kinds of food is

340 Ital. J. Food Sci., vol. 27 - 2015
is important to notice that tcb was not record-ed in inner tissues of potato and cucumber. the counts of tcb were 3.2x10³ and 1.8x10³ cfu/mL from the outer tissue of potato and cucum-ber respectively. the total viable bacterial count in milk was 39.7x10⁴cfu/mL while the tcb was 2.33x10³ cfu/mL. From table (1) we notice that the highest count of total viable bacteria was 42.7x10⁴ in cheese. And also the lowest count of tcb was 2.1x10³cfu/mL in cheese. From table 4, the count of t.V.b was 28x103 cfu/mL, while the count of tcb was 6.4x10³ cfu/mL.
3.2. Screening test for detection of most potent proteolytic bacterial species
Fig. 1 showed the potency of proteolytic activ-ities of all purified isolates. the proteolytic iso-lates were 326 isolates (63.92%), while the non-proteolytic isolates were 184 isolates (36.08%). It also shows that the largest clearing zone was 21 mm in case of isolates 62 and 412 (Fig. 2). this indicates that these isolates were the most potent of proteolytic activity.
3.3. Presumptive and confirmation identification
the cultural study, morphological appear-ance, Gram reaction and physiological charac-teristics of four most potent proteolytic isolates
table 2 - Morphological and biochemical features of strains 62 and 412.
Character and biochemical tests Code of Isolate 62 412
Growth Aerobic or Facultative anaerobic Facultative anaerobicMorphology of colony Colony smooth, convex, circular and creamy in color Colony smooth, convex, circular and creamy in colorGram stain + -Cell shape Straight rods, arranged in paires Straight rods, arranged singly or in pairsMotility Motile MotileFlagella arrangement Peritrichous PeritrichousOxidase --Gelatine hydrolysis + -D-Glucose, acid production + +D-Glucose, gas production - +Nitrate reduction + +Catalase production + +Oxidation- fermentation F FVoges-Proskaure NT -Arginine dihydrolase NT -Acid production:L-Arabinose - +Lactose NT +Maltose NT +Trehalose NT +D-Mannitol - +D-Xylose - +Indole production NT +Methyle red NT +Citrate (Simmons) NT -H2S production NT -
NT= not tested for this isolate because of results of another biochemical tests, F= fermentative.
Fig. 2 - example of proteolytic activity of isolated species.
were studied according to KrIeG et al. 1994. these results were tabulated in table 2. the pre-sumptive identification of the two most potent proteolytic activities. Isolate numbers 62 and 410 were identified as Bacillus cereus and Es-cherichia coli respectively. the most potent bac-terial isolates were confirmed by using biolog Mi-crolog 34.20 system for identification. 16S rrNA gene bands which were detect by specific prim-er at 1500 bp. the 16S rrNA sequences for two isolates were blasted with genebank sequence

Ital. J. Food Sci., vol. 27 - 2015 341
database (table 3) and found closet to the same isolates identified by conventional methods.
3.4. Antibiotic susceptibility test of different antibiotics
the antibiotic susceptibility test was obtained on the bacterial isolates by using 12 different an-tibiotics by disc diffusion method (table 4). Ba-cillus cereus was resistant (non susceptible) to Aztreonam and ceftazidime. Escherichia coli (gram negative bacteria) were resistant (non suscepti-ble) to vancomycin. While gram positive organ-isms Bacillus cereus was non susceptible (resist-ant) to vancomycine. Bacillus cereus was resist-ant to ampicillin, while Escherichia coli was sus-ceptible (sensitive) to ampicillin. Bacillus cere-us was resistant to ampicillin while Escherichia coli was non susceptible (sensitive) to ampicillin. the studied bacterial species both gram positive and gram negative were sensetive to 8 antibiot-ics (chloramphenicol, cephadroxil, erythromycin, norfloxacin, imipenem, neomycin, ciproloxacin and streptomycin). Escherichia coli was sensitive to three more (ampicillin, aztreonam and ceftazi-dime) i.e. it was sensitive to 11 antibiotics, thus Escherichia coli was the most sensitive bacterial species. Bacillus cereus was sensitive to one more vancomycin and ampicillin respectively i.e. each of them was sensitive to 9 antibiotics. the small-est inhibition zone was 8mm which was record-ed in Escherichia coli due to the effect of erythro-mycin and ceftazidime respectively.
table 4 - Antimicrobial susceptibility profile of studied mi-croorganisms against different antibiotics expressed as di-ameter of clearing zones.
Antibiotics (Conc.) Bacillus Escherichia cereus coli
Ampicillin AM10 0 10Aztreonam ATM30 0 17Cefadroxil CFR30 22 16Ceftazidime CAZ30 0 8Chloramphenicol C30 23 24Ciprofloxacin CIP5 20 20Erythromycin E15 23 13Imipenem IPM10 37 25Neomycin N30 20 17Norfloxacin NOR10 21 20Streptomycin S10 20 15Vancomycin VA30 17 0
table 3 - bLASt analysis of 16S rrNA sequences of the representative isolates.
Closest Validly Described Species Identities
Isolate Description Accession number Match Total % Similarity
62 Bacillus cereus KM007-1 KF055368 481 485 99412 Escherichia coli Xuzhou21 CP001925 1465 1469 99
4. DIScuSSIoN
the bacterial count is considered an index of quality that gives an idea about the hygien-ic measures during processing and helps in the determination of keeping quality of the product (AberLe et al., 2001). this work will emphasize on the counts and characteristics of bacteri-al genera that is considered to be important in healthy foods giving an attention to their classifi-cation and identification. the main scope of this work is to count the different bacterial species found in the different food sources and study the antibiotic susceptibility patterns of these bac-terial species which are isolated from Al-Man-soura city, egypt. bacterial counts of foods in-cludes t.V.b and t.c.b are similar with the re-sults of PrADNyA and SoNALI (2008) who found the counts of t.V.b and t.c.b were in range 9-10 log cfu/mL for local open market in India. All isolated bacterial species are common compo-nents of the bacterial flora of mammals, birds, insects’ reptiles and are commonly found in soil, on plants, water and foods as normal flora (GIL-More et al., 2013).
these groups of bacteria were isolated by PrADNyA and SoNoLI, 2008; NAzIr and IS-LAM, 2007; eASA, 2010; oLuFeMI and AKINy-erA, 2011; KuDJAWu et al., 2011. Presence of Escherichia coli and t.c.b in food usually indi-cates lack of hygiena in handling and post pro-cess contamination, therefore Escherichia coli & t.c.b enumeration are used as food quality parameter (GoNzALz et al., 2003). the present study was initiated by collection of food samples. All isolates were selected and purified and ini-tial morphologically identified (cocci 46.7% and rods 53.3%) and (Gram’s stain as gram posi-tive rods & cocci 60.3% and Gram negative rods 39.7%). For some species, the range is wide and the growth occurs in a variety of substrates (as a true for coliform bacteria) but for others (e.g. many of pathogens) can grow in limited kinds of substrates. thus, the bacteria found in food differ according to their ability of utilization of energy. the foods that are most often involved in Staphylococcal food poisoning differ widely from one country to another (beNNett and LAN-cette, 1995). the present study was concerned with isolation of the bacterial content of differ-ent food samples, which collected from open markets in Al-Mansoura city, egypt. All isolates were selected, purified and initial morphological-

342 Ital. J. Food Sci., vol. 27 - 2015
ly identified by shape and gram stain as 46.7% cocci and 53.3% rods and gram positive cocci and rods 60.3% and gram negative rods 39.7%.
16S rrNA gene sequencing will continue to be the gold standard for the identification of bacte-ria, and the automation of the technique could enable it to be used routinely in clinical micro-biology laboratories, as a replacement of the tra-ditional phenotypic tests. Modern technologies have made it possible to construct a high den-sity of oligonucleotide arrays on a chip with ol-igonucleotides representing the 16S rrNA gene sequence of various bacteria. Such a design will facilitate automation of the annealing and de-tection of the Pcr products of 16S rrNA gene amplification, and hence routine identification of most clinical isolates will be possible. the use of 16S rrNA gene sequencing has several advan-tages. First, the turnaround time is short. be-cause amplification of the 16SrrNA gene takes only four to six hours, and the annealing and detection of Pcr products takes only another few hours, theoretically the identification can be completed within one day. Second, it can be used for slow growing bacteria, unlike most commer-cially available kits that are based on phenotyp-ic tests that require the detection of growth of the organism in the presence of certain specific substrates, and hence the slow growing bacte-ria are usually ‘‘unidentified’’ when the growth control shows a negative result. third, the prob-lem of ‘‘unidentifiable strains’’ will be overcome and there would be minimal misidentification – the identification of a clinical strain is clearly de-fined by the number of base differences between it and the existing species. Fourth, oligonucleo-tides representing all bacterial species, includ-ing those rarely encountered clinically, can be included in the array, making it easy to identify the rare species. Lastly, such a technique will be applicable not only to pyogenic bacteria, but also to other organisms such as mycobacteria (eL-HADeDy and Abu eL-Nour, 2012).
Antibiotic resistance (Gram positive and Gram negative bacterial species) from food sources are important and serious problem in clinical field (eL-AIDy, 2007). the antibiotic sensitivity against bacteria is assayed by disc-diffusion method and in our study as well (SeLIM, 2011; SeLIM et al., 2012; 2013)). In this study, the antibiotics sus-ceptibility patterns of potent proteolytic bacteri-al species (Bacillus cereus and Escherichia coli) against 12 different antibiotics were investigat-ed. Antibiotics include ampicillin (AM), aztreon-am (AtM), cefadroxil (cFr), ceftazidime (cAz), chloramphenicol (c), ciprofloxacin (cIP), eryth-romycin (e), imipenem (IPM), neomycin (N), nor-floxacin (Nor), streptomycin (S) and vancomy-cin (VA). In this study Bacillus cereus was re-sistant to 3 antibiotics (ampicillin, azactam and cerazdime). beta-lactam antibiotics also bind to inhibit the action of other cytoplasmic pro-teins that had a role in peptidoglycan synthesis
and turn over (AbIGAL and DIXe, 1994). trans-peptidation reactions that cross links the pep-tide side chain of polysaccharide peptidoglycan back bone. transpeptidase and other proteins were called “penicillin binding protein”. the net result of beta- lactam binding to this protein was to stimulate endogenous enzyme that degrade peptidoglycan (AbIGAL and DIXe, 1994). the in-hibitory effect of vancomycin was similar to the effect of beta-lactam antibiotic.
our results showed that Bacillus cereus and Escherichia coli were sensitive to cefadroxil, chlo-ramphenicol, ciprofloxacine, erythromycin, imi-penem, neomycin, norfloxacin and streptomy-cin. Neomycin, aminoglycoside antibiotic; eryth-romycin, as macrolid antibiotic have the ability to bind to the 50S or 30S ribosomal subunit (in-hibit protein synthesis). Also, inhibitory effect of ciprofloxacin and norfloxacin, as quinolones an-tibiotic, may be due to having the ability to in-hibit bacteria by interfering with their ability to make DNA with diverse targets DNA gyrase, this inhibition effect leads to preventation of multiply of bacteria. the present results showed that all tested Escherichia coli strains were resistant to vancomycin antibiotic, while Srinivasona et al., (2007) who found that all tested Escherichia coli strains were resistant to two or more antimicro-bial used in veterinary medicine. Bacillus cere-us was resistant to aztreonam and ceftazidime.
Antibiotic resistance can be categorized in three types: natural or intrinsic resistance; mu-tational resistance and extrachromosomal or aquired resistance. the resistance of isolates to beta-lactam antibiotic may be due to drug inac-tivation: i.e. Ampc cephalosporinase (beta lac-tamase enzyme that open the beta-lactam (ring) as an intrinsic resistance. target site modifica-tion (i.e. change in PbPs- penicillin binding pro-teins-) as mutational resistance represented in drug inactivation (AbIGAIL and DIXIe, 1994). Moreover the resistance of isolates to aminogly-coside antibiotic and erythromycin macrolides antibiotics may be due to inaccessibility of the target as an intrinsic resistance, reduced perme-ability or uptake as mutational resistance and aquired resistance represented in drug activa-tion (DIAb et al., 2002; 2004). the resistance of isolates to furadantine antibiotic may be due to chromosomal or plasmide mediated and inhi-bition of nitrofuran reductase. Also the resist-ance of isolates to fluoroquinolones antibiotics may be due to reduced permeability or uptake as mutational resistance (FANGe et al., 2009). the mode of action of ciprofloxacin and norflox-acine as a quinolones antibiotic as accumulat-ed with the explanation of FANGe et al., (2009).
In our present study, four studied bacterial species which isolated from food sources were investigated to all selected antibiotics. Most of the selected antibiotics represent the following classes ; beta-lactam, aminoglycoside, macrolide and quinlones. total bacterial counts is con-

Ital. J. Food Sci., vol. 27 - 2015 343
sidered an index of quality which gives an idea about the higienic measures during processing and help in the determination of keeping qual-ity of the product (AberLe et al., 2001). In this study, the identified bacterial species were Ba-cillus cereus (13.72%) and Escherichia coli (18.3). these results had a strong support of many re-searches. these bacterial species are common components of the microbial flora community. Generally, the methods of production, transpor-tation, handling and sale of food entirely unhy-gienic and entirely depend on the traditional system, such system could pose favorable en-vironment for bacterial contamination. the ex-istences of these bacterial species which isolat-ed in different food sources. these results are agreement with FDA, 2000. Moreover the stud-ied food sources are considered as reservoir for some pathogenic bacteria (MANGeS et al., 2006).
the Bacillus species are of the soil origin and may contaminate bread through the raw mate-rial and bakery requirements used. Bacillus ce-reus is widely distributed in the environment and is found almost everywhere including, dust, water and decaying matter. the microbiotas in dried traditional vegetables sold in open market in parts of Ghana are dominant by aerobic mes-ophilic bacteria including mainly bacillus, lactic acid bacteria, coliform and moulds. Many stud-ies provided evidence that Escherichia coli is a frequently occurring organism in milk (SooM-ro et al., 2002), this evidence agrees with the obtained results. Presence of Escherichia coli and t.c in food usually indicates lack of hy-giene in handling, storing food and production inadequate storage and post process contamina-tion. therefore Escherichia coli and t.c enumer-ation are used as food quality parameter (GAN-zALez et al., 2003). Escherichia coli was isolat-ed from the samples and also has been detect-ed in many studies
reFereNceS
Aberle e.D., Forrest J., Gerrard D.e. and Mills e.W. 2001. Principles of meat Science (4th ed). Hunt Puplishing co., Kendall, uSA.
Abigail A.S. and Dixie D.W. 1994. Antibiotics: Mechanisms of action and mechanism of bacterial resistance. In: bac-terial pathogenesis a molecular approach: Abigail, A. S. and Dixie, D. W. (eds); (ASM Press), 8th ed. 97-110.
bauer A.W., Kirby W.M.M., Sheriss J.c. and turck M. 1966. Antibiotic susceptibility testing by standarised single method. Am. J. clin. Pathol., 45:493-6.
bennett r.W. and Lancette G.A. 1995. Staphylococcus au-reus. In : bacteriological Analytical Manual. 8 ed. Gaith-ersburg. P. 12.01-12.05.
Diab A.M., Abdel Aziz M.A. and Selim, S.A. 2002. Plasmid encoded transferable antibiotic resistance in gram-nega-tive bacteria isolated from drinking water in Ismailia city. Pak J biol Sci. 5(7):774-779.
Diab A.M., Abdel Aziz M.H., Selim S.A., el-Alfay S. and Mou-sa M.A. 2004. Distribution, Involvement and Plasmid characterization of Aeromonas spp. Isolated from Food Staffs and Human Infections. egyptian Journal of biol-ogy 6:12-20.
easa S.M.H. 2010. Microorganisms found in fast and tradition-al fast food. Journal of American Science 6(10):515-531.
el-Aidy e.F. (2007). Antibiotic resistance of some microor-ganisms isolated from cancer patients. M.Sc thesis, Fac-ulty of Science, zagzig uni. egypt.
el-Hadedy D. and Abu el-Nour S. (2012). Identification of Staphylococcus aureus and Escherichia coli isolated from egyptian food by conventional and molecular meth-ods. Journal of Genetic engineering and biotechnolo-gy 10:129-135.
Fange D., Nilsson K., tenson t. and ehrenberg M. 2009. Drug efflux pump deficiency and drug targets resistance masking in growing bacteria Proc. Natl. Acad. Sci. uSA 106:8215-8220.
FDA (Food and Drug Administration) 2000. Guide to min-imize microbial food safety hazards for fresh fruits and vegetable.
Gilmore M.S., Lebreton F. and van Schaik W. 2013. Genom-ic transition of enterococci from gut commensals to lead-ing causes of multidrug-resistant hospital infection in the antibiotic era. curr opin Microbiol. 16(1):10-16.
Gonzalez r.D., tamagnini L.M., olmos P.D. and de Sousa G.b. 2003. evaluation of a chromogenic medium for to-tal coliforms and Escherichia coli determination in ready-to-eat foods. Food Microbiology. 20:601-604.
Jay J.M. 1996. Modem food microbiology, 5th. ed. Interna-tional thomson Publishing New york, 661.
Haileselassie M., taddele H., Adhana K. and Kalayou S. 2013. Food safety knowledge and practices of abattoir and butchery shops and the microbial profile of meat in Mekelle city, ethiopia. Asian Pacific Journal of tropical biomedicine. 3(5):407-412.
Krieg r.N., Holt G.J., Sneath P.H.A. and Williams S.t. 1994. bergey’s Manual of determinative bacteriology. Williams & Wilkins baltimore u.S.A. Ninth eddition.
Kudjawu b., Sakyi-Dawson e. and Amoa-Awua W.K. 2011. the microbiota of dried traditional vegetables produced in the Sudan Savannah and Guinea Savannah agro-eco-logical zone of Ghana. International Food research Jour-nal 18:101-108.
MacFaddin, J.F. 1980. biochemical tests for identification of medical bacteria. the Williams & Wilkins company, baltimore. u.S.A.
Manges A.r., Natarajan P., Solberg o.D., Dietrich P.S. and riley L.W. 2006. the changing prevalence of drug-resist-ant Escherichia coli clonal groups in a community: evi-dence for community outbreaks of urinary tract infec-tions. epidemiol Infect. 134:425-31.
Nazir K. H. and Islam t. 2007. Association of bacteria in stored bakery foods of retailers’ shops in Mymensin-gh, bangladesh. J bangladesh Soc Agric Sci technol. 4(1&2):21-24.
olufemi A. and Akinyera b. 2011. Microbial quality of prawns offered for sales at some locations and sales outlets in Ibadan South Western Nigeria. J. Microbiol biotech res. 1 (1):46-51.
Pradnya A.J. and Sonali P.P. 2008. Microbiological analy-sis of fresh vegetables & fruits and effect of anti-micro-bial agents on microbial load. Department of microbiol-ogy, birla college of Arts, Science and commerce, Kaly-an-421 304, India.
Pundir r.K. and Jain P. 2011. evaluation of five chemical food preservatives for their antibacterial activity against bacterial isolates from bakery products and mango pick-les. J. chem. Pharm. res. 3(1): 24-31.
ramalakshmi N., Narendra D., ramalakshmi M., roja S., Archana b.K.N., Maanasa G. 2012. Isolation and charac-terization of protease producing bacterial from soil and estimation of protease by spectrophotometer. the exper-iment 1 (1):1-7.
Selim S.A. 2011. chemical composition, antioxidant and an-timicrobial activity of the essential oil and methanol ex-tract of the egyptian lemongrass Cymbopogon proximus StAPF. International Journal of Fats and oils (Grasas y Aceites) 62 (1):55-61.
Selim S.A., el Alfy S., Al-ruwaili M., Abdo A., Al Jaouni S. 2012. Susceptibility of imipenem-resistant Pseudomonas
344 Ital. J. Food Sci., vol. 27 - 2015
aeruginosa to flavonoid glycosides of date palm (Phoe-nix dactylifera L.) tamar Growing in Al Madinah, Saudi Arabia. African Journal of biotechnology 11(2):416-422.
Selim S.A., Abdel Aziz M.H, Mashait M.S., Warrad M.F. 2013. Antibacterial activities, chemical constitutes and acute toxicity of egyptian Origanum majorana L., Peganum har-mala L. and Salvia officinalis L. essential oils. Journal of pharmacy and pharmacology 7(13):725-735.
Soomro A.H., Arian, M.A., Khaskheli M. and bhutto b. 2002. Isolation of Escherichia coli from raw milk and milk products in relation to Public Health Sold under mar-ket conditions at tandojam. Pakistan Journal of Nutri-tion 1(3):151-152.
Srinivasana V., Gillespiea b.e., Lewisa M.J., Nguyena L.t., Headricka S.I., Schukkenb y.H. and olivera S.P. 2007. Phenotypic and genotypic antimicrobial resistance pat-
Paper Received January 28, 2014 Accepted October 21, 2014
terns of escherichia coli isolated from dairy cows with mastitis. Food Scien. and technol. 50(7):767-773.
tesfaye A., Mehari t. and Ashenafi M. 2011. Inhibition of some foodborne pathogens by pure and mixed LAb cul-tures during fermentation and storage of ergo, A tradi-tional ethiopian fermented milk. ArPN J Agric biolog Sci 6 (4):13-19.
todar K. 2008. todar’s online textbook of bacteriology. uni-versity of Wisconsin Madison Department of bacteriology.
Vanderzant c. and Splittstoesser F.D. 1992. compendium of Methods for the Microbiological examination of Foods. 3 rd. ed. American Public Health association, Washing-ton, Dc., 1219.
WHo (World Health organization) 2002a. Food safety and foodborne illness. World Health organization Fact sheet, Geneva, 237.
PaPer
Ital. J. Food Sci., vol. 27 - 2015 345
- Keywords: bread, flour, potato starch, wheat -
bREAD QUALITy SUbSTITUTED by POTATO STARCH INSTEAD OF WHEAT FLOUR
F. NEMAR1*, A. DILMI bOURAS1, M. KOICHE1, N-E. ASSAL2, A. MEZAINI1 and J. PRODHOMME2
1Laboratory of Natural Local Bio-Resources, Department of Biology, Faculty of Science, Hassiba Benbouali University, Chlef, BP. 151, Chlef 02000, Algeria
2Lactamel Group, Sidi Bel Abbes, Algeria*Corresponding author: Tel. +213 559 932507,
email: [email protected], [email protected]
AbStrAct
Wheat bread constitutes the most regularly consumed food in the World, the internation-al market for wheat undergoes strong pressure and prices are unceasingly increasing. the aim of this study is to substitute wheat flour by potato starch in bread preparation. Mixtures flours were characterized for composition, damaged starch, and Alveograph properties. Accord-ing to the results of alveograph parameters, they decrease with the rate of incorporation of po-tato starch. this decrease can be corrected by adding vital gluten. the results of physicochem-ical analysis showed a decrease in protein levels, an increase in moisture content (about 2%) and carbohydrates levels due to the composition of potato starch. However, sensory analysis (p ≤ 0.05) showed that the addition 80% of potato starch leads to bread with better characteris-tics: taste, colour and odour, based on that, it is highly advisable as an ingredient in the stand-ard preparation of wheat bread.
346 Ital. J. Food Sci., vol. 27 - 2015
INtroDuctIoN
bread is an important component of the Algerian diet, while wheat production in the country is insufficient. therefore, substan-tial quantities of this cereal must be imported every year. Making bread by partial substitu-tion of wheat is not a new idea and it is worth-while to reveal some of the efforts made in the past to make bread from local materials, such as cereal flour or root starches. Potato occu-pies the fourth place in the World list of food crops, after wheat, rice and corn, with an an-nual World production of approximately 300 million Mg (cIP, 2008). the country now pro-duces enough potatoes and its price is also within affordable limits of average people. So potato appears to be one of the most promising substitutes in bread making in order to help reduce dependence on wheat flour.
Potato starch is an important raw materi-al in the food industry because its properties and their proportions vary according to the environment and genotypes of potato (VASAN-tHAN et al., 1999; KAur et al., 2002; zAIDuL et al., 2007). Potato starch is largely used in food and non-food fields (paper, cardboard, textiles, mining, drilling, adhesives, etc.). originally, it was produced for baking by adding it to ce-real flour (rouSSeL et al., 1996; SINGH et al., 2003). the addition of modest amounts of pota-to starch helps preserve the freshness of bread and it also confers a distinctive character and a pleasant flavor (yANez et al., 1981; WILLArD and HIX, 1987).
the aim of this work is to evaluate the possibil-ity of substituting wheat flour for high percentag-es of potato starch in bread making process and to evaluate the physical, chemical, nutritional and sensory properties of the produced bread.
MAterIAL AND MetHoDS
Raw material
Algerian wheat flour was obtained from NeKHLA mill, Algeria. Ingredients like sugar, salt, instant active dry yeast and shortening were purchased from the local market, while Potato starch was ob-tained from Michel come, rambouillet, France.
Methods
Physical and chemical composition
Moisture content
the moisture content of samples was deter-mined according to the AAcc official Methods 46-30, where a sample of 5 g is weighed and placed in a moisture dish. the sample is warmed to 130°c in an air oven during 2 hours; then
the residue is cooled to room temperature and weighed (AFNor, 1991).
Ash content
It was determined according to the AAcc offi-cial Methods 08-01 (AAcc, 1995). Where a sam-ple of 3-5 g is weighed and placed in an ash cup, then the sample is heated at 900°c in an ash oven until complete combustion of the organic matter, and the residue is cooled to room tem-perature and then weighed (AAcc, 1995).
Protein content
Protein content is determined by the Kjeldahl distillation method (by analyzing total nitrogen contents). two grams of dry sample are weighed and placed with hot concentrated sulfuric acid. the ammonia liberated from the resulting am-monium sulphate, after adding sodium hydrox-ide was distilled into 1 M boric acid then titrat-ed with 0.1 M Hcl. the nitrogen value estimated was multiplied by 5.7 (protein factor) to obtain the value of crud protein. this is expressed as the percentage of dry sample mass (AAcc, 1995).
Fat content
According to uGrINoVItS et al. (2004) the crude fats were determined by the Soxhlet meth-od. they are extracted from 10 g of each sample using a Soxhlet apparatus with low boiling point petroleum ether (40-60°c) as solvent. A rotary-evaporator was used to evaporate the solvent af-ter each extraction.
Falling Number Test
the level of enzyme activity was measured by the Falling Number test (standard method AAcc 56-81b), and this is to evaluate the α-amylase activity of the flour by measuring the consisten-cy of the gelatinized starch.
Seven grams of the sample is weighed and combined with 25 mL of distilled water in a glass falling number tube with a stirrer and shaken to form a slurry. then, it is placed in the falling number instrument (AAcc, 1995).
Alveograph characteristics
An amount of 250 g of the sample with salty solution was mixed in the alveograph mixer. After 8 minutes of kneading, the passage was opened and the extraction began. the dough patty was cut as soon as it arrived at a mark on the extrac-tion plate. the dough patty was rolled and cut with the cutter and then was placed in the oven of the dough pieces at 25.5°c. After 28 minutes, each dough patty was inflated with air and its individual characteristics (P, L, W) were meas-ured (AAcc, 1995).

Ital. J. Food Sci., vol. 27 - 2015 347
W: the work of the deformation energy (baking strength);L: the length of the curve (extensibility);P: Maximum height (tenacity);P / L: ratio curve configuration.
Bread making
the conventional straight-dough method for pan bread was performed according to the pro-cedure developed by AAcc. the formula used to make bread is given in table 1. the level of substitution of wheat flour by potato starch was 80%.
to make bread, the dry ingredients were man-ually mixed and then added to a mix containing water. the components were thoroughly knead-ed with the mixer for 5 min at low speed. the mixing speed was then changed to high speed for 5 min. the dough was divided into pieces of 100 g, rounded by hand and allowed to relax for 25 min. the dough was moulded then panned and fermented for 90 min at 30°c in a fermen-tation cabin.
Gas retention during fermentation was evalu-ated using an indicator of growth containing 25 g of dough which was subjected to fermentation in the same conditions as the dough.
the bread was baked at 220°c/20 min in an electric oven. Subsequently, the baked bread samples were then depanned and cooled to eval-uate their external and internal properties by a 1h at room temperature, packed in polyethylene bags used for further analyses.
Bread evaluation
Loaves were organoleptically evaluated for their external and internal properties by a jury of twenty tasters. the method of 5 point score (in a hedonistic qualification scale) was used (AMer-INe et al., 1973). the panel members were asked to score for crust colour, crumb colour, texture, flavour and overall acceptability.
Statistical analysis
In this study, all experiments were performed in triplicate. Statistical analysis was performed using XLStAt program to compare the results. the level of significance was considered at p ≤ 0.05.
reSuLtS AND DIScuSSIoN
Physical and chemical composition
the result of proximate composition analysis of wheat flour and potato starch is as shown in table 2. the wheat flour protein content used in this study was about 10%, this result is sim-ilar to that reported by LINDAHL and eLIASSoN (1992). According to uGrINoVItS et al. (2004) the strength of the flour is partially determined by its wet gluten content.
the wet gluten content of potato starch is about 1.72% where as wet gluten content of wheat flour is 30.08%, which is a normal level, potato starch contained lower proteins (trace) and higher carbohydrate than wheat flour. How-ever this value of wet gluten, added to the vi-tal gluten in the mixture allows compensating for the deficit of protein potato starch (32.77%).
the results of baking test show that potato starch alone is not enough to produce bread, and the same result was found for the mixture with high level. It might be due to the value of gluten that is lower. therefore, it is necessary to add a percentage of vital gluten.
However, the value of the falling number of the
table 1- bread mix formula.
Formula
Wheat flour 500 gSalt 10 gSugar 5 gYeast 10 gWater 300 mLDough improver 0.1 g
table 2 - Physical and chemical characteristics of mixtures.
Parameter\Product 100% 100% S.P 20% F 80% S.P
Wh.G G
Moisture (%) 15.80±0.026 17.80±0.035 17.60±0.011 16.21±0.015Mineral (Ash) (%) 0.53±0.025 0.18±0.02 0.19±0.0152 0.27±0.01Wet Gluten (%) 30.10±0.155 / 1.72±0.092 32.77±0.196Falling number (s) 312 220 181 126Protein content (%) 10 Trace / /Fat content (%) 0.9 Trace / /
F: Wheat Flour; S.P: Potato Starch; Wh.G: Without Gluten; G: With Gluten.

348 Ital. J. Food Sci., vol. 27 - 2015
mix is lower (220) than that of wheat flour and also lower than the optimal standards for bread which is 200 to 300 seconds (GoDoN and LoI-SeL, 1997). this might be due to the decreased resistance of potato starch to enzymatic degra-dation. Also, the fact that the gelatinization tem-perature is lower than that of wheat flour can be considered as another reason.
Alveograph characteristics
the results of Alveograph test, summarized in table 3, make it possible to predict baker qual-ity of flour. this test is an interesting practice which is very appreciated by professionals of the second transformation, due to the fact that it re-flects through alveographic parameters meas-ured the ability of flour to be managed accord-ing to its baking strength for a specific purpose (rouSSeL and cHIroN, 2002).
the Alveograph parameters of wheat flour and mixtures (with 80% of potato starch) showed (table 3), that overpressure (P), a measure of dough tenacity, which is an indi-cator of gas retention by the dough as indi-cated by WANG et al. (2002), varied from 58 to 150 mm.
the measure of Alveograph dough extensi-bility (L), ranged from 45 to 116 mm. the val-ues for curve configuration ratio, indicating the configuration ratio of the Alveograph curve, varied from 1.09 to 2.25. the index of swelling (G) varied from 6.9 to 19.10 cm and the baking strength representing the energy necessary to inflate the dough bubble to the point of rupture ranged from 10 to 210*10-4 J. these differenc-es of results are due to the addition of gluten which controls these parameters, where the P value increases to 99mm H2o. It is higher than the limit of 80 mm.
these results show that the composite pota-to starch and wheat flour lead to dough which is less resistant to deformation and low exten-sibility for rate incorporation of 80%.
Mixed baking test In order to know the influence of the substi-
tution of wheat flour by potato starch (20/80), several tests were carried out in the laborato-ry and other tests at the bakery with the as-
sistance of a French expert in bakery (J. ProD-HoMMe).
the experimental baking studies showed that the concentration of 80% potato starch with the addition of gluten did not affect the handling of dough except for some defects of extensibil-ity during shaping. this similarity in results is due to the role of the added gluten; the essen-tial element for baking (especially during knead-ing and shaping), which plays a very significant role in increasing the uptake of water and the resistance of the dough. A significant criterion observed during almost all stages of baking, is the stickiness of the dough.
In a similar vein, the properties of gas reten-tion within the composite dough are followed by measurement of the volume of the dough dur-ing fermentation using the indicator of growth containing 25g of dough subjected to fermenta-tion under the same conditions as the loaves of bread. the results obtained are highly signifi-cant (p ≤ 0.05), they show that the pastes incor-porate up to 80 % of potato starch, which expe-rience less raising during fermentation, but re-main comparable with those obtained with 100 % of wheat flour (Fig. 1).
external and internal aspects of breads ob-tained are shown in Figs. 2 and 3. the incor-poration of potato starch at levels of 80% gives breads with optimal characteristics.
the breads resulting from the potato starch have a good appearance, presenting regular and smooth crusts similar to the breads resulting from wheat flour.
As for the coloration of the crust, bread with potato starch presents a less dark coloring com-pared to bread with wheat flour. DuPIN et al. (1992) and boyAcIoGLu and D’APPoLoNIA (1994) showed that the dark coloration of bread is in-fluenced by the rise of the rate of both damaged starch and total sugars present in flour, which were highest in starch potato.
concerning the appearance of the crumb re-lated to (Fig. 2), bread has aired cells, badly dis-persed and not homogeneous. that can be ex-plained by the irregular distribution or the in-corporation of α-amylases.
As for the appearance of crumbs (Fig. 3), bread has aired cells, poorly dispersed and not homo-geneous. Again, that can be explained by the bad distribution or the incorporation of α-amylases.
table 3 - rheological characteristics of the flours (with and without addition of vital gluten).
Rheological characteristics Rate of incorporation of the potato starch
0% 80% without gluten 80% with gluten
Alveographic measurements P (mm) 81 20 99 G (cm) 19.1 06.7 14.8 P/L 01.09 06.68 02.25 W (10-4 J) 210 10 193

Ital. J. Food Sci., vol. 27 - 2015 349
Bread evaluation
the approximate composition of bread made from potato starch and wheat flour is shown in table 4.
the control bread obtained shows a protein rate of 10.5 %, a rate 60.4% of sugar of and 0.9 % of fat. these values are similar to the values given by cAbroL (2006).
However, bread prepared containing pota-to starch 80% present a reduction in proteins
Fig. 1 - Influence incorporation of potato starch on the pro-files of gas retention.
Fig. 2 - Appearance of the crust of potato starch bread (80%).
Fig. 3 - Appearance of the crumb of potato starch bread (80%).
(6.87%) and fat (0.37%). this result might be due to the composition of potato starch that, in fact, is rich in sugar and low in fat and proteins.
the sensory quality statistics reveal that po-tato starch influences the crumb of bread (Fig. 4). bread with potato starch 80% acquires a very white coloration, and therefore receives the high-est score compared to control bread. Meanwhile, the texture of bread is more developed than that of the control bread.
However, we observed that there is significant difference (p ≤ 0.05) in the P value therefore stat-ing the sensory characteristics of potato starch bread 80% are not affected.
coNcLuSIoNS
the aim of this study was to analyze sam-ples of bread at 80% of potato starch and com-pared with control bread produced from wheat flour under the same conditions for their nutri-tional, physicochemical and sensory character-istics. the formulation of our bread was made as follows: potato starch, wheat flour, gluten, yeast, salt and a dough improver. the results show that the loaves can be prepared by po-tato starch even at high percentage (80%) and gluten. breads obtained by this formula were nutritionally, physically, chemically and at the
table 4 - Nutritional composition of breads.
Products Humidity % Glucids (%) Protein (%) Fat (%) Fibre (%)
Wheat bread 28.20 60.4 10.5 0.9 -Potato starch bread 31.33 61.36 6.87 0.37 0.07
Fig. 4 - evaluation of some characters of quality of the po-tato starch bread 80% and wheat bread prepared in bakery.

350 Ital. J. Food Sci., vol. 27 - 2015
sensorial level comparable to the control bread. A high percentage of consumers said they saw no difference.
these results support the partial substitu-tion of wheat flour by potato starch in wheat-based food products to minimize costs. Future studies are needed to investigate the pasting properties of mixtures of wheat flour and po-tato starch (by rVA), to determine the inter-action between wheat flour and potato starch and also to interpret their rheological proper-ties by differential scanning calorimeter and rheometer.
AcKNoWLeDGeMeNtS
Financial support was received from the Lactamel Group, Sidi bel Abbes, Algeria.
reFereNceS
AAcc. 1995. “Approved methods of the AAcc”. 9th ed. Amer-ican Association of cereal chemists, Paul, Minnesota.
AFNor.1991. “recueil de normes-contrôle de la qualité des produits alimentaires: céréales et produits céréaliers” 3rd ed. Association Française de Normalisation, Paris.
Amerine M.A., Pangborn rM. and roseller eb.1973. Prin-ciples of Sensory evaluation of Food. New york and Lon-don: Academic Press.
boyacioglu M.H. and D’Appolonia b.L. 1994. characteri-zation and utilization of durum wheat for breadmaking. Study of flour blends and various additives. J. cereal chemistry, 71(1): 28-34.
cabrol c. 2006. observatoire du pain [en ligne]. La com-position nutritionnelle des pains français. Disponi-ble sur: <http://www.observatoiredupain.fr/Default.asp?IDr=110985 >.
cIP. 2008. “the international year of the potato, IPc”. <http://www.cipotato.org>.
Dupin H., cuq J.L., Malewiak M.I., Leynaud-rouaud c. and berthier A.M. 1992. Alimentation et nutrition humaines. ed. eSF éditeur, Paris. P56, 745-747.
Godon b. and Loisel W. 1997.Guide pratique d’analyses dans
les industries des céréales. technologie et Documenta-tion. Paris. P 819.
Liu c.y., Shepherd K.W. and rathjen A.J. 1996. Improve-ment of durum wheat pastamaking and breadmaking qualities. J. cereal chemistry, 73:155-166.
Lindahl L. and eliasson A.c. 1992. A comparison of some rheological properties of durum and wheat flour doughs. J. cereal chemistry, 69: 30-34.
Lovedeep K., Singh N. and Sodhi N.S .2002. Some properties of potatoes and their starches II. Morphological, thermal and rheological properties of starches. J. Food chemis-try, 79: 183-192.
roussel P. and chiron H. 2002. Les pains français : évolu-tion, qualité, production.2, France : MAe-ertI editeurs. ISbN/2-84601-693-3.
roussel P., robert y. and crosnier J.c. 1996. La pomme de terre. Paris, France. INrA. ISbN 2-7380-0676-0.
Singh J., Sing N., Kaur L., Sodhi N.S. and Gill b.S. 2003. Morphological, thermal and rheological properties of starches from different botanical sources. J. Food chem-istry, 81(2): 219-231.
ugrinovits M.S., Arrigoni e., Dossenbach A., Haberli G., Han-ich H., Schwerzenbach J., richemont L., rychener M., thormann H. and Stalder u. 2004. céréales, Produits de L’industrie Meunière, Prémélanges pour four, Mélanges de Farines Instantanées. ch. 14. In: “Manuel suisse des denrées alimentaires”. ed MSDA.
Vasanthan t., bergthaller W., Driedger D., yeung J. and Sporns P. 1999. Starch from Alberta potatoes: Wet-iso-lation and some physicochemical properties. J. Food re-search International, 32: 355-365.
Wang J., rosell c.M. and barber c.b. 2002. effect of the ad-dition of different fibres on wheat dough performance and bread quality. Food chemistry, 79: 221-226.
Willard M. J. and Hix V.M. 1987. Potato flour. In: “Potato Processing”. W. F. talburt and o. Smith (4th ed.), pp. 665-681. New york: Van Nostrand reinhold.
yadav A.r., Guha M., reddy S.y., tharanathan r.N. and ramteke r.S. 2007. Physical Properties of Acetylated and enzyme-Modified Potato and Sweet Potato Flours. J. Food Science, 72(5): e249-e253.
yanez e., ballester D., Wuth H., orrego W., Galtas V. and es-tay S. 1981. Potato flour as partial replacement of wheat flour in bread: baking studies and nutritional value of bread containing graded levels of potato flour. J. Food technology, 16: 291-298.
zaidul I.S.M., yamauchi H., Kim S.J., Hashimoto N. and Noda t. 2007. rVA study of mixtures of wheat flour and potato starches with different phosphorus contents. J. Food chemistry, 102(4): 1105-1111.
Paper Received February 25, 2014 Accepted October 30, 2014

PaPer
Ital. J. Food Sci., vol. 27 - 2015 351
- Keywords: cooking, egg, florfenicol, florfenicol amine, residue, storage -
THE EFFECT OF COOKINg AND STORAgE ON FLORFENICOL AND FLORFENICOL AMINE
RESIDUES IN EggS
AyHAN FILAZI1*, UFUK TANSEL SIRELI2, bEgUM yURDAKOK DIKMEN1, FARAH gONUL AyDIN1 and ASLI gUL KUCUKOSMANOgLU1
1Department of Pharmacology and Toxicology, Faculty of Veterinary Medicine, Ankara University, 06110 Diskapi, Ankara, Turkey
2Department of Food Hygiene and Technology, Faculty of Veterinary Medicine, Ankara University, 06110 Diskapi, Ankara, Turkey
*Corresponding author: [email protected]
AbStrAct
the aim of this study was to evaluate the effects of storage conditions (room temperature, re-frigerator) and cooking methods (frying, boiling) on florfenicol (FF) and florfenicol amine (FFA) resi-due levels in eggs. Without any significant difference between storage conditions at 20˚c and +4˚c, residue levels decreased within days, but were still present on day 28. Frying and boiling for 1 and 5 min yielded similar results to the storage conditions just described; there was a significant decrease in residue levels, but still not enough for decomposing. these findings indicate that FF and FFA residues are heat-labile.

352 Ital. J. Food Sci., vol. 27 - 2015
INtroDuctIoN
When veterinary drugs are administered to farm animals, either therapeutically or to pro-mote growth, residues remain in their meat, milk or eggs if proper precautions are not fol-lowed (botSoGLou and FLetourIS, 2001). An-tibiotics play an important role among such drugs. In addition to their positive effects, they can also cause health problems, including drug hypersensitivity (PAIGe et al., 1999; DoNoGHue, 2003). Antibiotics not only threaten food safe-ty, but also cause the development of some re-sistant bacterial strains from among sensitive bacteria even when used at moderate doses for long periods of time (PAIGe et al., 1999; FILAzI et al., 2005).
testing for drug residues are ordinarily per-formed on raw products. Almost no edible ani-mal products or byproducts are consumed raw, but require some type of processing or cooking, such as frying, boiling, or roasting, before con-sumption. these processes can cause denatura-tion of proteins, elevation of temperature, loss of water and fat, and pH variations that can even-tually result in alteration to the concentration, chemical nature, chemical reactions, and solu-bility of drug residues in a particular food item. Many drugs are chemically unstable to varying degrees, and therefore may undergo degradation during storage, cooking or processing in consum-able foods (botSoGLou and FLetourIS, 2001).
In general, the temperatures achieved during cooking are assumed to degrade antibiotic res-idues in food; however, ordinary cooking proce-dures are unreliable for degrading or inactivat-ing several commonly used veterinary drugs. ear-lier studies have indicated that sulfamethazine (roSe et al., 1995; PAPAPANAGIotou et al., 2005) chloramphenicol (botSoGLou and FLetourIS, 2001), streptomycin (INGLIS and KAtz, 1978; o’brIeN et al., 1980), neomycin (KAtz and LeV-IN, 1978), gentamicin (SIreLI et al., 2006), fluo-roquinolones (bAyDAN et al., 2000a, b; bAyDAN et al., 2002), penicillin G (NouWS and zIV, 1976; boISoN et al., 1992), nitrofurantoin (cooPer and KeNNeDy, 2007), oxacillin, clindamycin, novo-biocin, trimethoprim, vancomycin, and azlocil-lin are heat-stable (trAub and LeoNHArD, 1995), whereas oxytetracycline (KIttS et al., 1992) and amphenicols (FrANJe et al., 2010) heat-labile. on the other hand, several β-lactams including am-picillin and amoxicillin are partially heat-labile (trAub and LeoNHArD, 1995). Antibiotics of the same class were reported to vary in heat stabil-ity according to the type of matrix and heating treatment involved (KIttS et al., 1992; roSe et al., 1996; FrANJe et al., 2010). As such, the ef-fect of different matrices on the stability of every veterinary drug should be investigated.
Although most edible animal products are consumed after cooking or some type of pro-cessing, for the licensing of veterinary drugs
research concerning the effects of storage and cooking of the drugs on different matrices are lacking. Most data on drug residues in edible an-imal products and government regulation con-cern raw products. It is therefore essential to de-termine the effect of processing on all veterinary drugs when assessing human exposure to drug residues in animal food products (IbrAHIM and MoAtS, 1994; MoAtS, 1988; MoAtS 1999; bot-SoGLou and FLetourIS, 2001).
Florfenicol (FF) is a wide-spectrum, synthetic antibacterial that is structurally related to D(−) threo-chloramphenicol; however, FF differs from chloramphenicol in that FF contains a p-methyl sulfonyl group instead of a p-nitro group and it contains a fluorine atom instead of a hydrox-yl group in the terminal primary alcohol group (eMeA, 1999). FF has not been approved for use in laying hens; however it is used in cattle, swine, poultry, and fish (eMeA, 2000).
FF is metabolized into florfenicol amine (FFA), florfenicol oxamic acid, florfenicol alcohol, and mono-chloroflorfenicol in animals. FFA is the longest-lived metabolite in the bovine liver; therefore, FFA can be used as a marker for the calculation of withdrawal time (ANADoN et al., 2008; XIe et al., 2011).
In light of the apparent advantages over chlo-ramfenicol and its availability as an additive, the potential for off label use of FF is high. Due to its broad spectrum antibacterial activity, ready avail-ability and low cost, it remains a possibility that FF residues will continue to be found in such ani-mal food products as eggs. For example, Xie et al. (2011) analyzed 50 egg samples obtained from a local supermarket in china and reported 19 ppb of FF and 36 ppb of FFA in only 1 egg. FILAzI et al. (2014) reported that the concentration of FF and FFA in eggs were 0.1%, 0.08% respectively regardless of the route of administration.
Data on the heat stability of FF is essential for food safety; however, the literature contains few data regarding its heat-stability during cooking. under environmental conditions FF is stable at 25 °c, yet photodegradation occurs at varying rates in water under various lighting conditions (Ge et al, 2009). FF was shown to rapidly de-grade to FFA in the deep sediment of marine en-vironments via biodegradation (HeKtoeN et al, 1995). A few studies on the residue of FF and FFA in eggs have been published (XIe et al. 2011; FILAzI et al., 2014); but the data are insufficient. FrANJe et al. (2010) reported that amphenicols exhibit differential behavior in terms of heat-induced degradation in solutions and protein matrices. Although the level of amphenicol deg-radation in soybean sauce and meat was high, heating may generate product with antimicro-bial activity; therefore, heating amphenicol res-idues in food cannot always be considered safe. FF is the most commonly used veterinary anti-microbial agent in turkey, particularly so due to its illegally use in laying hens. Nonetheless,

Ital. J. Food Sci., vol. 27 - 2015 353
few studies have examined FF residue levels in eggs. An earlier study reported that FF and FFA were detected in the eggs of hens administered with FF (FILAzI et al., 2014)
chicken eggs are widely used in the prepara-tion of many types of food, including many baked goods. Some of the most common preparation methods include fried in oil, hard-boiled, soft-boiled and omelets. Data regarding FF and its main metabolites in cooked and stored eggs are lacking. As such, the aim of the present study was to determine the effects of different stor-age conditions (room temperature and refriger-ation) on FF residue levels in eggs stored up to 28 days and to determine the effect the differ-ent cooking methods (frying and boiling) on FF and FFA residue levels.
MAterIALS AND MetHoDS
Animals
the study protocol was approved by the Anka-ra university ethics committee (2007-15-45). the study included 50 ISA brown laying hens aged 48 weeks and weighing 1.9-2.4 kg. the hens were housed individually in fiber cages (30x35x45 cm), in a ventilated room maintained at 20°c under 14 h day light condition. the hens received standard commercial layer mash (120 g/d) and water ad libitum. the hens were fed for 1 week and their eggs were collected for preliminary analysis to de-termine if they were analyte-free.
Trials
A veterinary drug containing 300 mg of FF in 1 mL was used (Mediflor 30% oral Solution, Medicavet company, turkey) for the clinical tri-als. FF was administered at a dose of 20 mg/kg/day via gavage for 3 days to the 50 laying hens, and then their eggs were collected daily thereaf-ter. the effect of storage procedures on the res-
idues was determined on the first day using 44 eggs. the effects of cooking procedures were de-termined on the second day using 32 eggs. In all, 20 of the eggs collected on the first day were kept at 4°c in a refrigerator, and 20 were kept at 15-20°c (room temperature). In addition, 4 eggs were analyzed on day 4, 7, 14, 21, 28 of storage to determine FF and FFA residue levels. Lastly, 4 uncooked eggs collected on day 1 were ana-lyzed as a control group; of the eggs collected on day 2, 8 uncooked, 8 fried in oil, 8 undercooked (1 min in boiling water) and 8 overcooked (5 min in boiling water) were then analyzed.
Sample preparation and analysis
FF and FFA were extracted from homogenized eggs via phosphate buffer (pH:7) and ethyl ace-tate. Following purification, the samples under-went high-performance liquid chromatography (HPLc) using a photodiode array detector (PDA) and c18 column; the method was validated ac-cording to IcH guidelines, as described elsewhere (FILAzI et al., 2014). According this method, limits of detection and of quantitation values were 1.94 and 6.45 ppb for FF, respectively, and 0.48 and 1.58 ppb for FFA, respectively. relative standard deviation values of intra-day and inter-day var-iation below 11% also confirmed the usefulness of the method for analysing FF and FFA in eggs.
StAtIStIcAL ANALySIS
Variance analysis was performed with all data and a multiple range test was used to determine the differences between groups. All analyses were performed using SPSS v. 17.0 for Windows.
Results and Conclusion
the effects of different storage temperatures and durations on FF and FFA residue levels in
table 1 - Mean±SD* concentration (in ppb) of florfenicol and florfenicol amine residues in eggs stored at room temperature (15-20°c) and in a refrigerator (+4°c).
Days Florfenicol Florfenicol amine
(n=4) Room temperature Refrigerator Room temperature Refrigerator (15-20°C) (+4°C) (15-20°C) (+4°C)
0 290.65±11.02a 290.65±11.02a 91.79±6.77a 91.79±6.77a
4 151.24±10.69b 167.43±8.18b 58.26±5.98b 58.61±5.85b
7 79.65±9.43cx 105.10±4.25cy 28.95±5.03c 35.40±2.33c
14 68.23±8.74dx 87.84±5.01dy 20.52±3.92d 24.37±1.20d
21 29.43±4.91ex 61.82±2.11ey 10.42±1.54e 8.54±1.04e
28 18.57±3.48f 22.14±0.03f 6.74±0.79f 7.06±1.21f
*SD: Standard Deviation.abcdef: Differences between values with different letters in the same columns are significant (P<0.05).xy: Differences between values with different letters in the same rows are significant (P<0.05).

354 Ital. J. Food Sci., vol. 27 - 2015
eggs are shown in table 1. both FF and FFA amine residue levels in eggs were observed on day 28, though their levels had decreased signif-icantly (P<0.05). HeKtoeN et al. (1995) report-ed that FF rapidly depurated in the sediment of marine environments and that its metabolite (FFA) was isolated from the sediment. this find-ing suggests that FF is degraded to FFA in the sediment via metabolization or leaching; howev-er, the present study FF residues in eggs follow-ing storage for 28 day at room temperature and in a refrigerator were observed. FF residue lev-els in eggs were higher than FFA residue levels in the present study, which indicates that the in vitro degradation of FF might occur at a very low level or that it differs from its biological deg-radation. Further research would be required to understand the effect of storing on the FF and FFA residues in the eggs.
FrANJe et al. (2010) studied the heat stabili-ty of amphenicols in chicken meat and reported that 5-min heating of amphenicols in water in a microwave oven generated a comparable per-centage of degradation as did boiling in a water bath for 30 min 1 h; FF produced thiampheni-col (tAP) as a product of its breakdown, but not FFA. It was reported that although a higher lev-el of degradation of amphenicols was observed in soybean sauce, heating treatment might still generate product with antimicrobial activity (FF to tAP) and as such, heating amphenicol resi-dues in food cannot always be safe.
FF was reported to be hydrolytically stable and to have a hydrolysis half-life > 1 year at 25°c in natural waters (HAyeS et al., 2003; PouLIqueN et al., 2007; Ge et al., 2009). Ge et al. (2009) per-formed photodegradation experiments on tAP and FF in aqueous solutions under irradiation from different light sources. they reported that under uV-Vis irradiation (λ>200 nm) photodeg-radation in seawater was fastest, followed by pure water and freshwater, whereas under so-lar or simulated sunlight (λ > 290 nm), photo-degradation occurred only in freshwater. under uV-Vis irradiation, cl- (dominant sea water con-stituent) was observed to promote singlet oxy-gen formation and accelerated the photodegra-dation of phenicols, whereas phenicols did not photolyze under simulated solar irradiation, ir-respective of the presence of cl-.
In contrast, HAyeS et al. (2003) reported that
FF was stable under a range of simulated field conditions, including various pipe materials and conditions of hard and soft and chlorinated or non-chlorinated water at low or high pH; there-fore not only cl- but also some other minerals might effect the stability of FF.
the effects of different cooking procedures on FF and FFA residues in eggs observed in the present study are shown in table 2. even though, none of the cooking methods complete-ly destroyed FF or FFA residues in eggs, there was a significant decrease in the level of detect-able FF and FFA residues (P<0.05). concentra-tions of both analytes were reduced by 78%-97% via frying and boiling. these findings sug-gest that FF and FFA heat labile in eggs, which indicates that both do not bind to proteins in eggs with high affinity. FrANJe et al. (2010) re-ported that amphenicol degradation was appar-ent following as little as 30 min of heating and that it was correlated with the length of heat-ing, implying that as cooking time increased the degree of residual drug present in samples de-creased; as such, it could be assumed that there was a strong correlation between the decrease in FF and FFA concentrations in observed eggs during different cooking methods and the dura-tion of cooking (P<0.05, table 2). SHAKILA et al. (2006) studied the stability of chloramphenicol (cHP) residues in white shrimp (Penaeus indicus) subjected to cooking (100 °c) for 10, 20 and 30 min as well as retorting (121°c) for 10 and 15 min, based on a microbial assay method using Photobacterium leiognathi as the test organism. they reported that the loss of cHP increased as temperature and duration of heating increased, where the drug could be completely destroyed. on the other hand botSoGLu and FLeutorIS (2010) reported that cHP was quite stable un-der heating conditions when added to water or milk; after 2 h of boiling, it was decreased by <8%. these findings indicate that the heat sta-bility of amphenicols is matrix dependent, where results from different matrices could not be at-tributed to eggs when interpreting.
even though, FF is not approved for use in laying hens, its off label use for severe indica-tions can result in antibiotic residues in eggs that both farmers and consumers should be in-formed about. As such, drug withdrawal periods should be extended prior to poultry slaughter
table 2 - Mean±SD*, quantity of florfenicol and florfenicol amine residues (in ppb) after different cooking methods.
Residues (n=8) Raw Fried Undercooked Overcooked (1 minute) (5 minutes)
Florfenicol 265.45±13.67a 56.51±9.68b 35.67±4.57c 5.68±1.17d
Florfenicol amine 110.31±12.73a 19.77±4.71b 10.20±1.72c 4.57±0.92d
*SD: Standard Deviation.abcd: Differences between values with different letters in the same row are significant (P<0.05).

Ital. J. Food Sci., vol. 27 - 2015 355
or egg distribution to avoid antimicrobial resis-tance. thermal treatments may reduce the con-centration of veterinary drug residues in foods and thereby might reduce the pharmacological and/or toxic effects of these compounds. (HSIeH et al., 2011). In the current study, FF and FFA were observed to be heat labile in chicken eggs, the level of which depended on cooking meth-od and duration.
the findings show that FF and FFA residue levels in eggs from treated laying hens were not completely eliminated via cooking or of up to 28 d; however, cooking did significantly decreased the level of the drug in eggs.
AcKNoWLeDGeMeNtS
Authors sincerely thank Ankara university Scientific re-search committee for supporting this study by Ankara uni-versity Scientific research Projects Funding (Project No: 10b3338003).
this study was presented as a poster pres-entation in the 12th International congress of the european Association for Veterinary Phar-macology and toxicology (eAVPt 2012), 8-12 July2012, Noordwijkerhout, the Netherlands where the abstract only (not the full text) as a Special Issue appears in Journal of Veterinary Pharmacology and therapeutics (35(3): 78) which is modified for the current publication.
the authors declare no competing financial interest.
reFereNceS
Anadón A., Martínez M.A., Martínez M., ríos A., caballero V., Ares I. and Martínez-Larrañaga M.r. 2008. Plasma and tissue depletion of florfenicol and florfenicol amine in chickens. J. Agric. Food. chem. 56: 11049-11056.
baydan e., Akkaya r., tras b., bilgili A., tanyıldızı S., Filazi A., yarsan e. and ozdemir M. 2002. the effects of cook-ing, freezing and some similar processes on the veteri-nary drug residues in broiler tissues: 1. research of some antibacterials group of sulfonamide, 2. research of some antibacterials group of quinolone. etlik Vet. Mikrobiyol Derg. 13: 56-76.
baydan e., Filazi A., Kum c. and Sekkin S. 2000a. the ef-fects of cooking and freezing applications on drug resi-dues at the broiler: 1. effects of cooking and different freezing times on enrofloxacine residues. Vet. Hekim. Der. Derg. 71: 19-22.
baydan e., Filazi A., Kum c. and Sekkin S. 2000b. the ef-fects of cooking and freezing applications on drug resi-dues at the broiler: 1. effects of cooking and different freezing times on danofloxacine residues. Vet. Hekim. Der. Derg. 71: 33-36.
boison J. o., Korsrud G.o., MacNeil J.D. and yates W.D.G. 1992. effect of cold-temperature storage on stability of benzylpenicillin residues in plasma and tissues of food-producing animals. J. AoAc Int. 75: 974-978.
botsoglou N.A. and Fletouris D. J. 2001. “Drug residues in Food”. Marcel Dekker, Inc. New york, Ny.
cooper K.M. and Kennedy D.G. 2007. Stability studies of the metabolites of nitrofuran antibiotics during storage and cooking. Food Addit. contam. 24: 935-942.
Donoghue, D.J. 2003. Antibiotic residues in poultry tis-sues and eggs: human health concerns? Poult.Sci. 82: 618-621.
eMeA. 1999. committee for veterinary medicinal products: Florfenicol (extension to chicken). Summary report (3). eMeA/MrL/589/99-Final. http://www.emea.euro-pa.eu/docs/en_Gb/document_library/Maximum_resi-due_Limits_-_report/2009/11/Wc500014277.pdf, Ac-cess: 10.09.2011.
eMeA. 2000. committee for veterinary medicinal prod-ucts: Florfenicol (extension to fish). Summary report (5). eMeA/MrL/760/00-Final. http://www.ema.euro-pa.eu/docs/en_Gb/document_library/Maximum_resi-due_Limits_-_report/2009/11/Wc500014280.pdf, Ac-cess: 15.10.2014.
Filazi A., Sireli u.t. and cadirci o. 2005. residues of gen-tamicin in eggs following medication of laying hens. br. Poult. Sci. 46: 580-583.
Filazi A., Sireli u.t., yurdakok b., Aydin F.G. and Kucu-kosmanoglu A. 2014. Depletion of florfenicol and flor-fenicol amine residues in chicken eggs. br. Poult.Sci. 55: 460-465.
Franje c.A., chang S.K., Shyu c.L., Davis J.L., Lee y.W., Lee r.J., chang c.c. and chou c.c. 2010. Differential heat stability of amphenicols characterized by structural deg-radation, mass spectrometry and antimicrobial activity. J. Pharm. biomed. Anal. 53: 869-877.
Ge L., chen J., qiao X., Lin J. and cai X. 2009. Light-source-de-pendent effects of main water constituents on photodeg-radation of phenicol antibiotics: mechanism and kinet-ics. environ Sci. technol. 43:3101-3107.
Hayes J.M., eichman J., Katz t. and Gilewicz r. 2003. Stability of florfenicol in drinking water. J AoAc Int. 86: 22-29.
Hektoen H., berge J.A., Hormazabal V., yndestad M. 1995. Persistence of antibacterial agents in marine sediments. Aquaculture, 133:175-184.
Hsieh M.K., Shyu c.L., Liao J.W., Franje c.A., Huang y.J., chang S.K., Shih P.y. and chou c.c. 2011. correlation analysis of heat stability of veterinary antibiotics by struc-tural degradation, changes in antimicrobial activity and genotoxicity. Vet Med (Praha), 56: 274-285.
Ibrahim A. and Moats W.A. 1994. effect of cooking proce-dures on oxytetracycline residues in lamb muscle. J. Ag-ric. Food. chem. 42: 2561-2563.
Inglis J.M. and Katz S.e. 1978. Determination of streptomy-cin residues in eggs and stability of residues after cook-ing. J.Assoc. off. Anal. chem. 61: 1098-1102.
Katz S.e. and Levine P.r. 1978. Determination of neomycin residues in eggs and stability of residues after cooking. J.Assoc. off. Anal. chem. 61: 1103-1106.
Kitts D.D., yu c.W., burt r.G. and Mcerlane K. 1992. oxy-tetracycline degradation in thermally processed. J. Ag-ric. Food chem. 140: 1977-1981.
Moats W.A. 1988. Inactivation of antibiotics by heating in foods and other substrates. A review. J. Food. Prot. 51: 491-497.
Moats W.A. 1999. the effect of processing on veterinary res-idues in foods. Adv. exp. Med. biol. 459: 233-241.
Nouws J.F.M. and ziv G. 1976. the effect of storage at 4°c on antibiotic residues in kidney and meat tissues of dairy cows. tijdschr. Diergeneesk. 101: 1145.
o’brien J.J., campbell N. and conaghan t. 1980. Antibi-otic residues in meat: cooking and cold storage effects. Vet. rec. 106: 365.
Paige J.c., tollefson L. and Miller M.A. 1999. Health implica-tions of residues of veterinary drugs and chemicals in ani-mal tissues. Vet. clin. North Am. Food Anim. Pract. 15: 31.
Papapanagiotou e.P., Fletouris D.J. and Psomas e.I. 2005. effect of various heat treatments and cold storage on sul-phamethazine residues stability in incurred piglet muscle and cow milk samples. Anal. chim. Acta. 529: 305-309.
Pouliquen H., Delepeel r., Larhantec-Verdier M., Morva M. L. and Le bris H. 2007. comparative hydrolysis and pho-tolysis of four antibacterial agents (oxytetracycline oxo-linic acid, flumequine and florfenicol) in deionised water,
356 Ital. J. Food Sci., vol. 27 - 2015
freshwater and seawater under abiotic conditions. Aqua-culture, 262: 23-28.
rose M.D., bygrave J., Farrington W.H.H. and Shearer G. 1996. the effect of cooking on veterinary drug residues in food. 4. oxytetracycline. Food Addit. contam. 13: 275-286.
rose M.D., Farrington W.H.H. and Shearer G. 1995. the ef-fect of cooking on veterinary drug residues in food. III: Sulphamethazine (sulphadimidine). Food Addit. con-tam. 12: 739-750.
Shakila r.J., Vyla S.A.P., Kumar r.S., Jeyasekaran G. and Jasmine G.I. 2006. Stability of chloramphenicol residues in shrimp subjected to heat processing treatments. Food Microbiol. 23: 47-51
Sireli u.t., Filazi A. and cadirci o. 2006. effect of cooking and storage times on gentamicin residues in eggs. Ital. J. Food. Sci. 18: 441-446.
traub W.H. and Leonhard b. 1995. Heat stability of the an-timicrobial activity of sixty-two antibacterial agents. J. Antimicrob. chemother. 35: 149-154.
Xie K., Jia L., yao y., Xu D., chen S., Xie X., Pei y., bao W., Dai G., Wang J.and Liu z. 2011. Simultaneous de-termination of tiamphenicol, florfenicol and florfeni-col amine in eggs by reversed-phase high-performance liquid chromatography with fluorescence detection. J. chromatogr. b. Analyt technol. biomed Life Sci. 879: 2351-2354.
Paper received May 7, 2014 Accepted November 3, 2014

PaPer
Ital. J. Food Sci., vol. 27 - 2015 357
- Keywords: camel milk, kefir, grain, traditional method, chemical properties, microbial properties, flavor profile analysis -
KEFIRS MANUFACTURED FROM CAMEL (cameLus dramedarius)
MILK AND COW MILK: COMPARISON OF SOME CHEMICAL AND MICRObIAL PROPERTIES
g. KAvASDepartment of Dairy Technology, Faculty of Agriculture, Ege University, 35100 İzmir, Turkey
*Corresponding author: Tel. +90 232 3111420, email: [email protected]
AbStrAct
this study examined the production possibilities of kefir from fresh camel milk fermented with grain. the findings were then compared with kefir manufactured from cow’s milk. cow’s milk was fermented with 2.5% grains. the 1% (v/w) glucose enriched camel’s milk was fermented with 10% grains and left in an incubator at 25°c. Physical-chemical and sensorial analyses of the kefir sam-ples were measured on day one (18 hours) of storage and microbiological analyses were meas-ured on days one, three and five. Some physical-chemical parameters were found to be higher in camel milk and its kefir than in cow milk and its kefir, some were found to be close and some were found to be lower. Addition of 1% glucose and 10% grains to the camel milk affected the ti-tration acidity and viscosity of kefir to significant levels. the kefir produced from camel milk was perceived as sourer, whereas its other properties were found to be close to those of cow milk. the cholesterol levels of camel milk and its kefir were detected to be higher when compared to those of cow milk and its kefir, but the cholesterol level decreased in both examples after the produc-tion of kefir. In terms of the composition of fatty acids, it was determined that SFA and the small, medium chain fatty acids ratio was low in camel milk and its kefir, but MuFA and the long chain fatty acids ratio was high. PuFA ratio was high in camel milk but low in its kefir. In microbiolog-ical analysis, yeast levels increased in kefir samples with the Lactobacillus ssp. strains, and the increase in the number of yeasts was higher than in the cow milk kefir. In kefir samples, Lacto-bacillus ssp. strains increased on day one and three of storage, but diminished after day three.

358 Ital. J. Food Sci., vol. 27 - 2015
INtroDuctIoN
Kefir is a dairy product that has been pro-duced for years in eastern europe and Mon-golia, before spreading to caucasia (GAWAre et al., 2011). Kefir is produced by adding specif-ic amounts of the kefir grain (traditional meth-od) or the modified culture (industrial method) manufactured from this grain (PoGAČIĆ et al., 2013) into the milk of various animals. ethyl alcohol and lactic acid fermentations are de-veloped together during the product formation, thus causing it to taste somewhat acidic. Kefir grains are off-white and slightly yellowish, irreg-ular in shape and with a circumference taken up by polysaccharide matrixes that (JIANzHoNG et al., 2009) compose 25% of the dry weight solu-ble in water (PoGAČIĆ et al., 2013), and a diame-ter of 0.3cm -2 cm (beSHKoVA et al., 2002). Ho-mofermentative lactobacilli make up 65-80% of the flora. In the grain flora, homofermentative and heterofermentative lactic acid streptococ-ci make up 20%, and lactose-fermentative and non-fermentative yeasts make up a further 5%. the percentage of acetic acid bacteria (in pro-duction with grain) is relatively small (IrIGoy-eN et al., 2005). Species of the microorganisms in the grain, their proportion to each other and their numbers change according to the origin of the grain and conditions of use (FerreIrA et al., 2010). today, kefir is regarded as a fermented dairy beverage that is anti-bacterial and anti-inflammatory (LoPItz-otSoA et al., 2006), an-ti-tumoral (SHIoMI et al., 1982), anti-apoptotic (MAtSuu et al., 2003), anti-allergic (uMeDA et al., 2005), anti-oxidant, and anti-mutagenic (LIu et al., 2005). It also lowers systolic and diastolic blood pressure and bad cholesterol (AGerbAeK et al., 1995), adjusts lactose dyspepsia (Hert-zLer and cLANcy, 2003), and contains bioactive peptides, exopolysaccharides and their bacterio-sis, and has a strong probiotic effect on human health (rAttrAy and o’coNNeLL, 2011).
camel milk differs from the milk of other rumi-nant animals in its composition and physiolog-ical properties. camel milk is rich in long chain fatty acids, but contains low amounts of short chain fatty acids (GorbAN and IzzeLDIN 1999). Vitamins A, b2, e, c and minerals ca, Na, K, zn, Mg and Fe are far more abundant in camel’s milk than in cow’s milk. Lactose intolerant people (eL-HAtMI et al., 2007) can consume camel milk. Due to camel milk not containing β-lactoglobulin and some casein derivatives, it is similar to human milk with its hypoallergenic (SHAbo et al., 2005), immunoglobulin content. It is anti-diabetic effec-tive (HAMAD et al., 2011) and because it contains more peptidoglycan recognition proteins (PGrP) and natural protective proteins than other ru-minant milk, it has an antimicrobial and antivi-ral effect (eL-AGAMy et al., 1992). Not to mention that camel milk is anti-carcinogenic and anti-hy-pertensive (HAMAD et al., 2011) and renoprotec-
tive, it reinforces immunity, increases metabo-lism and muscle mass, is bone-forming and also has therapeutic effects on some diseases such as hepatitis b, autism (LAILA et al., 2013) and tuberculosis (AGrAWAL et al., 2004). today, we know that yoghurt, probiotic yoghurt (AttIA et al., 2001; eL-AGAMy et al., 1992), stabilizer aug-mented yoghurt (MuLIor et al., 2013) and many mild cheeses whose clotting is poor due to enzy-matic coagulation (MeHAIA, 1993; rAMet, 1987) can be produced from camel milk.
our research utilized kefir that was man-ufactured from camel (Camelus dramedarius) milk (caM). Kefir made from cow’s milk (coM) was used as the control sample. the physical-chemical properties in raw milks were analyzed, along with these properties in the cow milk ke-fir (coMK) and camel milk kefir (caMK) sam-ples. Sensorial tests were conducted as of the eighteenth hour of day one and microbiological analyses were made on day one, three and five of storage.
MAterIALS AND MetHoDS
Camel milk, kefir grain
camel (Camelus dramedarius) milk was procured from a native camel farm in Deniz-li Sarayköy (turkey). cow milk and kefir grain were procured from the Department of Dairy technology Pilot Dairy Plant, ege university Ag-ricultural Faculty.
Kefir production
In this study, kefir was produced from camel and cow milk using the traditional (grain) meth-od as shown in Fig. 1.
Physical-chemical analyses
In the raw milk and kefir samples, dry matter (binder eD-53 Germany) and ash (Protherm PFL 110/6 turkey) were calculated via a gravimeter, fat with the Gerber method, pH value of the ti-tration acidity in terms of lactic acid with a SS-3 zeromatic (beckman Instruments Inc., califor-nia, uSA) brand pH meter, protein with the Kjel-dahl method (AoAc, 1990), lactose value with an Atago Polax x 2L (Japan) model polarimeter (HorWItz, 1965), viscosity value with a brook-field Digital Viscometer, MoDeL DV-II+Pro (uSA) model viscometer as cP [at speed 180 mPa, be-tween 15.7% and 67.7% torque].
Determining the fatty acid composition in samples and preparation of fat extraction and fatty acid methyl esters
each homogenized sample was extracted us-ing the Gerber method, thus fat was obtained

Ital. J. Food Sci., vol. 27 - 2015 359
Fig. 1 - Kefir Production with the traditional (Grain) Method.** the glucose and grain ratio added to camel milk and cow milk was determined as a result of preliminary study.***physical-chemical and sensorial analyses were measured at day one (18 hours) of storage and microbiological analyses were measured at days one, three and five.
(ISo 11870:2009 - IDF 152:2009) and fatty acid methyl esters were prepared pursuant to AocS (2009), after which they were examined in the gas chromatograph (Gc). [chromatography is a Supelco SP-2380 fused silica capillary column (60 m 0.25 mm i.d., 0.2 mm film thickness; Su-pelco Inc., bellefonte, PA, uSA) and flame ioniza-tion detector Hewlett-Packard Gc (model 6890). Injection volume was 1 µL. Gc furnace temper-ature was set to reach 220°c from 100°c when 4°c/minute. Injector and detector temperature
was 300°c, carrier gas was Helium and the flow rate was 1 mL/min].
Determining the cholesterol level in samples
In samples, the cholesterol level was ana-lyzed according to the findings of oSSA et al., (1995); and then examined by gas chromatog-raphy (Gc). [chromatography was a HP-5 silica capillary column (25 m 0.32 mm i.d., 0.52 mm film thickness; Hewlett-Packard, uSA) and FID

360 Ital. J. Food Sci., vol. 27 - 2015
(flame ionization detector) Hewlett-Packard Gc (model 6890). Injection volume was 1µl. Gc fur-nace temperature was set to 300°c, injector tem-perature to 280°c, colon temperature to 270°c for 15 minutes. carrier gas was Helium and the flow rate was 1.5 mL/min.
Microbiological analyses
For counting Lactobacillus ssp., De Mann ro-gosa Sharpe (MrS) Agara (Merck Darmstadt, Germany) (SHArPe et al., 1966) was used. Lac-tococcus ssp. was cultured on Ml7 Agara (Mer-ck Darmstadt, Germany) (terzAGHI and SAND-INe, 1975). For yeast, Glucose-Salt Agara (ANoN-yMouS, 1990) plantation was done. Isolation and census of lactic acid bacteria were conduct-ed according to IDF Standard 149 A (1997) and IDF Standard 163 (1992). yeasts were incubat-ed at 25°c for three to five days. After this peri-od, colonies that had developed in petri dishes were counted as cfu/mL on days one, three and five of storage.
Sensory evaluation
the sensory evaluation was made by a panel of nine individuals who evaluated kefir samples in terms of consistency and flavor on a scale from 1 to 5. For ALtuĞ and eLMAcI (2011), the method of Flavor Profile Analysis was utilized.
Statistics
two different milk and two different kefir sam-ples were analyzed in three parallels and two rep-etitions. SPSS statistics analysis software (IbM SPSS Statistics) was used. Data that gained im-portance were analyzed using the variance anal-ysis ANoVA based on the Duncan multiple com-parison test on a p<0.01 level.
reSuLtS AND coNcLuSIoNS
In the caM sample, compared to the coM sample, fat and lactose values were found to be
table 1 - Physical-chemical properties of raw camel milk, raw cow milk and of kefirs produced from these milks.
Analyses Milk samples Kefir samples
CaM CoM CaMK CoMK
Dry matter 12.73±0.12A 12.80±0.09B 11.10±0.02C 10.70±0.03D
Fat (%) 3.60±0.08A 3.50±0.06B 3.20±0.02C 3.30±0.01D
Titratable Acidity 0.127±0.02A 0.132±0.02B 0.92±0.01C 0.81±0.02D
pH 6.46±0.32A 6.44±0.27B 4.10±0.10C 4.55±0.14D
Protein (%) 3.05±0.03A 3.21±0.03B 2.82±0.03C 3.09±0.03D
Ash (%) 2.932±0.10A 1.461±0.09B 1.423±0.05C 1.068±0.05D
Lactose (%) 6.22±0.05A 6.20±0.51B 3.45±0.07C 3.54±0.02D
A, B, C, D: The differences between the values in the same rows are statistically significant (p < 0.01).
higher; there was twice as much ash and similar pH and dry matter values. In addition, protein, titration acidity in terms of lactic acid (table 1) and viscosity values were detected to be lower.
In the research, it was determined that results regarding the pH value 6.46 pH, fat (3.60%), pro-tein (3.05%), lactose (6.22%), total dry matter (12.73%), ash (2.932%) and titratable acidity in terms of lactic acid (0.12%) of camel milk were within the boundaries found in the literature, and that the lactose and ash levels were high-er in our studies (FAo, 1982; eL-AMIN and WIL-coX, 1992). PH values of kefir samples were de-termined to correspond with the turkish Food codex (2009/25) and WSzoLeK et al. (2006). Lac-tic acid was detected to be higher in the caMK sample (0.92%LA) than in the coMK sample (0.81%LA), whereas for viscosity, it was vice ver-sa. With the addition of 1% (v/w) glucose into the caM sample, simulating the development of lactic acid bacteria, we aimed to increase the ti-tration acidity and viscosity. to this end, the ef-fect that the addition of 1% glucose (v/w) and 10% grain into the caM sample has on titration acidity and viscosity was found to be significant (p<0.01), and lactic acid and viscosity were de-tected to have increased. However, viscosity in the caMK sample was lower than the coMK sam-ple. In addition, the glucose and grain ratio added to camel milk was determined as a result of pre-liminary study. In that preliminary study, some portion of the caM sample was inoculated with yeast grains in ratios of 2.5%, 5%, 7.5% and 10% without the addition of glucose, while the other portion of the sample had the same process with the addition of glucose. Afterwards, viscosity val-ues and titration acidity were detected in kefir samples, and viscosity values are given in tables 2 and 3. Grain being added into camel milk by 2.5% did not have a major effect, and since the 2.5% grain addition into the coMK sample pro-vided the desired viscosity value, other grain ra-tios were not tested. All in all, with the 1% glucose (v/w) and 10% grain addition into camel milk, a four times greater increase was reached in vis-cosity than in the one with just the grain addi-tion, and the titration acidity diminished from

Ital. J. Food Sci., vol. 27 - 2015 361
4.78 pH (in the sample with grain addition only) to 4.10 pH. results correspond with the litera-ture (LeWIS, 1986).
In this study, problems that might occur in fer-mentation were associated with low viscosity val-ue obtained from the caMK sample, lower serum protein content of camel milk than cow milk (FA-rAH, 1996), poor interaction between denature serum proteins of camel milk and k-casein, lack of β-lactoglobulin from serum proteins and dif-ferent derivatives of β-casein, low amounts of ca-
table 2 - Viscosity values of the kefir samples produced by injecting grain in certain amounts in caM with/without glucose addition and the ones produced from coM without glucose addition (cP).
Grain ratio (%) CaMK (Gra) CaMK (Gra+G) CoMK (Gra) viscosity (cP) viscosity (cP) viscosity (cP) 2.5 5.21aA 5.87 aB 111.475C
5 5.46bA 8.44 bB NT 7.5 7.12cA 18.81 cB NT 10 9.28dA 37.18 dB NT
NT:Not-tested ; Gra: Grain ;G+Gra: Glucose +Grain a, b, c, d, e: The differences between the values in the same column are statistically significant (p < 0.01).A, B, C, D: The differences between the values in the same rows are statistically significant (p < 0.01).
sein and its derivatives (LALeye et al., 2008) and the anti-bacterial effect of camel milk (HASHIM and KHALIL, 2004). Many factors (content of pro-tein and denature serum proteins, casein ratio and its content, interactions between denature serum proteins and k-casein) may affect viscos-ity (PuVANeNtHIrAN et al., 2002). based on the pH change, these factors might also affect the micelle surface area and size, micelle content and water binding capability in casein micelles (ANeMA and KLoStMeyer, 1996; DALGLeISH and
table 3 - Fatty acid compositions of kefir samples made from camel/cow milk (g/100g)
Name of Fatty Acid Methyl Ester (g/100g) and Formula of Molecule CoM CoMK CaM CaMK
Butyric Acid Methyl Ester (C4:0) 0.064 0.043 ND NDCaproic Acid Methyl Ester (C6:0) 0.264 0.422 0.140 0.121Caprylic Acid Methyl Ester (C8:0) 0.037 0.024 0.003 0.002Capric Acid Methyl Ester (C10:0) 0.085 0.061 0.004 0.003Undecanoic Acid Methyl Ester (C11:0) 0.007 0.009 ND NDLauric Acid Methyl Ester (C12:0) 0.127 0.101 0.021 0.021Tridecanoic Acid Methyl Ester (C13:0) 0.002 0.017 0.005 0.004Myristic Acid Methyl Ester (C14:0) 0.386 0.303 0.321 0.309Myristoleic Acid Methyl Ester (C14:1) 0.051 0.034 0.050 0.050Pentadecanoic Acid Methyl Ester (C15:0) 0.021 0.013 0.029 0.029cis-10- Pentadecanoic Acid Methyl Ester (C15:1) 0.012 0.036 0.013 0.010Palmitic Acid Methyl Ester (C16:0) 0.901 0.740 1.049 0.967Palmitoleic Acid Methyl Ester (C16:1) 0.063 0.027 0.292 0.268Heptadecanoic (Margaric) Acid Methyl Ester (C17:0) 0.015 0.011 0.020 0.018cis-10-Heptadecanoic Acid Methyl Ester (C17:1) 0.016 0.074 0.024 0.019Stearic Acid Methyl Ester (C18:0) 0.430 0.361 0.507 0.457Oleic Acid Methyl Ester (C18:1n9c) 0.840 0.581 0.843 0.715Linoleic Acid Methyl Ester (C18:2 n6c) 0.088 0.072 0.107 0.099γ-Linolenic Acid Methyl Ester (C18:3 n6) 0.034 0.177 0.053 0.036Arachidic Acid Methyl Ester (C20:0) 0.028 0.017 0.028 0.023cis-11- Eicosenoic Acid Methyl Ester (C20:1) ND ND 0.013 0.010cis-11,14-Eicosadienoic Acid Methyl Ester (C20:2) ND ND 0.009 0.005Arachidonic Acid Methyl Ester (C20:4n6) 0.012 0.067 0.028 0.017Behenic Acid Methyl Ester (C22:0) 0.016 0.094 0.023 0.009 Other fatty acids ND 0.017 0.017 0.007Short-chain fatty acids (4-6C) 0.33 0.46 0.14 0.12Medium-chain fatty acids (8-12C) 0.26 0.20 0.03 0.03Long-chain fatty acids (>12C) 2.92 2.62 3.41 3.05Saturated fatty acids (SFA) 2.38 2.22 2.15 1.96Monounsaturated fatty acids (MUFA) 0.98 0.75 1.24 1.07Polyunsaturated fatty acids (PUFA) 0.13 0.32 0.20 0.16
ND: Non-detected.
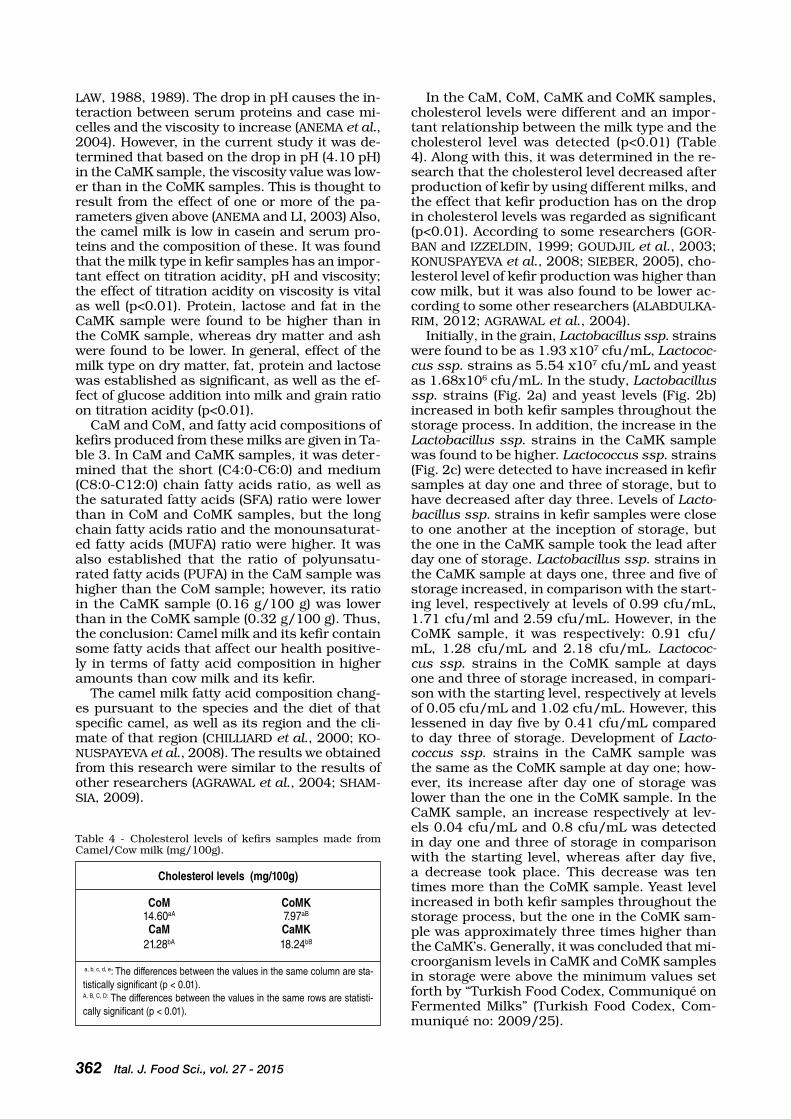
362 Ital. J. Food Sci., vol. 27 - 2015
LAW, 1988, 1989). the drop in pH causes the in-teraction between serum proteins and case mi-celles and the viscosity to increase (ANeMA et al., 2004). However, in the current study it was de-termined that based on the drop in pH (4.10 pH) in the caMK sample, the viscosity value was low-er than in the coMK samples. this is thought to result from the effect of one or more of the pa-rameters given above (ANeMA and LI, 2003) Also, the camel milk is low in casein and serum pro-teins and the composition of these. It was found that the milk type in kefir samples has an impor-tant effect on titration acidity, pH and viscosity; the effect of titration acidity on viscosity is vital as well (p<0.01). Protein, lactose and fat in the caMK sample were found to be higher than in the coMK sample, whereas dry matter and ash were found to be lower. In general, effect of the milk type on dry matter, fat, protein and lactose was established as significant, as well as the ef-fect of glucose addition into milk and grain ratio on titration acidity (p<0.01).
caM and coM, and fatty acid compositions of kefirs produced from these milks are given in ta-ble 3. In caM and caMK samples, it was deter-mined that the short (c4:0-c6:0) and medium (c8:0-c12:0) chain fatty acids ratio, as well as the saturated fatty acids (SFA) ratio were lower than in coM and coMK samples, but the long chain fatty acids ratio and the monounsaturat-ed fatty acids (MuFA) ratio were higher. It was also established that the ratio of polyunsatu-rated fatty acids (PuFA) in the caM sample was higher than the coM sample; however, its ratio in the caMK sample (0.16 g/100 g) was lower than in the coMK sample (0.32 g/100 g). thus, the conclusion: camel milk and its kefir contain some fatty acids that affect our health positive-ly in terms of fatty acid composition in higher amounts than cow milk and its kefir.
the camel milk fatty acid composition chang-es pursuant to the species and the diet of that specific camel, as well as its region and the cli-mate of that region (cHILLIArD et al., 2000; Ko-NuSPAyeVA et al., 2008). the results we obtained from this research were similar to the results of other researchers (AGrAWAL et al., 2004; SHAM-SIA, 2009).
In the caM, coM, caMK and coMK samples, cholesterol levels were different and an impor-tant relationship between the milk type and the cholesterol level was detected (p<0.01) (table 4). Along with this, it was determined in the re-search that the cholesterol level decreased after production of kefir by using different milks, and the effect that kefir production has on the drop in cholesterol levels was regarded as significant (p<0.01). According to some researchers (Gor-bAN and IzzeLDIN, 1999; GouDJIL et al., 2003; KoNuSPAyeVA et al., 2008; SIeber, 2005), cho-lesterol level of kefir production was higher than cow milk, but it was also found to be lower ac-cording to some other researchers (ALAbDuLKA-rIM, 2012; AGrAWAL et al., 2004).
Initially, in the grain, Lactobacillus ssp. strains were found to be as 1.93 x10⁷ cfu/mL, Lactococ-cus ssp. strains as 5.54 x10⁷ cfu/mL and yeast as 1.68x10⁶ cfu/mL. In the study, Lactobacillus ssp. strains (Fig. 2a) and yeast levels (Fig. 2b) increased in both kefir samples throughout the storage process. In addition, the increase in the Lactobacillus ssp. strains in the caMK sample was found to be higher. Lactococcus ssp. strains (Fig. 2c) were detected to have increased in kefir samples at day one and three of storage, but to have decreased after day three. Levels of Lacto-bacillus ssp. strains in kefir samples were close to one another at the inception of storage, but the one in the caMK sample took the lead after day one of storage. Lactobacillus ssp. strains in the caMK sample at days one, three and five of storage increased, in comparison with the start-ing level, respectively at levels of 0.99 cfu/mL, 1.71 cfu/ml and 2.59 cfu/mL. However, in the coMK sample, it was respectively: 0.91 cfu/mL, 1.28 cfu/mL and 2.18 cfu/mL. Lactococ-cus ssp. strains in the coMK sample at days one and three of storage increased, in compari-son with the starting level, respectively at levels of 0.05 cfu/mL and 1.02 cfu/mL. However, this lessened in day five by 0.41 cfu/mL compared to day three of storage. Development of Lacto-coccus ssp. strains in the caMK sample was the same as the coMK sample at day one; how-ever, its increase after day one of storage was lower than the one in the coMK sample. In the caMK sample, an increase respectively at lev-els 0.04 cfu/mL and 0.8 cfu/mL was detected in day one and three of storage in comparison with the starting level, whereas after day five, a decrease took place. this decrease was ten times more than the coMK sample. yeast level increased in both kefir samples throughout the storage process, but the one in the coMK sam-ple was approximately three times higher than the caMK’s. Generally, it was concluded that mi-croorganism levels in caMK and coMK samples in storage were above the minimum values set forth by “turkish Food codex, communiqué on Fermented Milks” (turkish Food codex, com-muniqué no: 2009/25).
table 4 - cholesterol levels of kefirs samples made from camel/cow milk (mg/100g).
Cholesterol levels (mg/100g)
CoM CoMK 14.60aA 7.97aB
CaM CaMK 21.28bA 18.24bB
a, b, c, d, e: The differences between the values in the same column are sta-tistically significant (p < 0.01).A, B, C, D: The differences between the values in the same rows are statisti-cally significant (p < 0.01).

Ital. J. Food Sci., vol. 27 - 2015 363
Fig. 2 - Lactobacillus ssp. (a), yeast (b) and Lactococcus ssp. (c) levels in kefirs produced from camel and cow milks.
research helped discover an important rela-tionship between the milk type and the storage period on microorganism levels. In addition, the effect that glucose has on microorganism devel-opment was established as significant (p<0.01). In the caMK sample produced with the addi-tion of 1% glucose, increase in the Lactobacillus ssp. strains was higher than in the coMK sam-ple, but this was vice versa for the increase in the yeast level. Progress of the increase (Lactobacillus ssp., yeast), also the decrease (Lactococcus ssp.) in the microorganism levels in the caMK sample after day three of storage show parallels with the coMK sample (KoroLeVA et al., 1978; KoroLeVA and bAVINA, 1978; oNer et al., 2010). In the re-search, microbial flora in the caMK sample went through a different development. this result cor-responds with the literature data regarding oth-er fermented dairy products of camel milk (Abu-tArbouSH, 1996; AttIA et al., 2001; JuMAH et al., 2001; AbDeL rAHMAN et al., 2009). In addition, the research pinpointed that the usage of grain in producing kefir from camel milk was more ef-fective (Abu-tArbouSH, 1996; AbDeL rAHMAN et al., 2009; MeHAIA, 1993).
In the flavor profile evaluation of kefir sam-ples, panelists determined that sour, sweet, salty, bitter, fermented milk, cream, greasy, cheesy, sharp, gas, alcohol, metallic and burnt milk flavor densities were perceived differently between the caMK and coMK samples (Fig. 3). In the flavor profile evaluation, it was detected that the caMK sample was sourer, cheesier and had a sharper aroma than the coMK sample. con-sistency and appearance in the caMK sample were detected to be lower than the coMK sam-ple. In general, the caMK sample was appreci-ated by the panelists and was defined as “sour-er” than the coMK sample.
Fig. 3 - Flavor profile evaluation of the caMK and coMK samples.

364 Ital. J. Food Sci., vol. 27 - 2015
coNcLuSIoNS
In the current research, an increase was ob-tained in the viscosity value in the kefir produced by adding 1% (v/w) glucose and 10% grain into camel milk. Dry matter, ash and titratable acid-ity in the camel milk kefirs were higher than in cow milk kefirs; whereas fat, pH, protein and lac-tose values were lower. cholesterol level of camel milk and its kefir product was found to be high-er than that of cow milk and its kefir. Along with this, it was detected in this study that propor-tion of camel milk and its kefir to cow milk and its kefir in terms of SFA is low. However, it is high in terms of MuFA. the PuFA ratio of cam-el milk is high compared to cow milk. However, the PuFA ratio in the camel milk kefir was de-fined to be lower than the one in the cow milk kefir. Lastly, it was also confirmed in the study that some compounds, which have positive ef-fects upon metabolism in camel milk and its ke-fir, have a higher impact than on the cow milk kefir’s metabolism.
reFereNceS
Abdel rahman İ.A., Dirar, H.A. and osman M.A. 2009. Mi-crobiological and biochemical changes and sensory evalu-ation of camel milk fermented by selected bacterial start-er cultures. Afr. J. Food Sci. (12)3: 398-405
Abu-tarboush H.M. 1996. comparison of associative growth of yogurt starter in whole milk from camels and cows. J. Dairy Sci. 79 (3): 366-371.
Agerbaek M., Gerdes L.u. and richelsen b. 1995. Hypocho-lesterolaemic effect of a new fermented milk product in healthy middle-aged men. eur. J. clin. Nutr. 49: 346-52.
Agrawal r.P., Kochar D.K., Sahani M.S., tuteja F.c. and Ghrui S.K. 2004. Hypoglycaemic activity of camel milk in streptozotocin induced diabetic rats. Int. J. Diab. Dev. countries. 24: 47-49.
Alabdulkarim b. 2012. effect of camel milk on blood glu-cose, cholesterol, triglyceride and liver enzymes activ-ities in female albino rats. World App. Sci. J. 17 (11): 1394-1397.
Altug t. and elmacı y. 2011. Sensorial evaluation in food. No :010-1b. Sidas Medya Ltd.Sti., İzmir, turkey 27s.
Anema S.G. and Klostmeyer H. 1996. δ Potentials of casein Micelles from reconstitued Skim milk Heated at 120ºc. I. Dairy J. 6: 673-687.
Anema S.G. and Li y. 2003. Association of Denaturated Whey Proteins with casein Micelles in Heated reconsti-tuted Skim milk and Its effect on casein Micelle Size. J. Dairy res. 70: 73-83.
Anema S.G., Lowe e.K. and Li y. 2004. effect of pH on the viscosity of heated reconstituted skim milk. I. Dairy J. 14: 541-548.
Anonymous. 2001. FAo/WHo. coDeX Standard for Fer-mented Milks. 243.
Anonymous. 1990. Milk and milk products enumeration of yeast and moulds colony count technique at 25°c. IDF Standart 94.
AoAc (Association of official Analytical chemists) 1990. official Methods of Analysis of the Association of official Analytical chemists. thirteenth edition. Association of official Analytical chemists (publisher), Washington, Dc 20044, uSA, 1018 p.
AocS, 2009. AocS American oil chemists’ Society offi-cial Method. ce 2-66. Preparation of Methyl esters of Fatty Acids.
Attia H., Kherouatou N. and Dhouib A. 2001. Dromedary milk lactic acid fermentation: microbiological and rheo-logical characteristics. J. Industrial Microbiol. biotech-nol. 26(5): 263-270.
beshkova D.M., Simova e.D., Simov z.I., Frengova, G.I. and Spasov z.N. 2002. Pure cultures for Making kefir. Food Microbiol. 19: 537-544.
chilliard y., Ferlay A., Mansbridge r.M. and Doreau M. 2000. ruminant milk fat plasticity: nutritional control of sat-urated, polyunsaturated, trans and conjugated fatty ac-ids, Ann. zootech. 49: 181-205.
Dalgleish D.G. and Law A.J.r. 1988. pH induced dissocia-tion of casein micelles. I. Analysis of liberated caseins. J. Dairy res. 55: 529-538
Dalgleish D.G. and Law A.J.r. 1989. pH induced dissoci-ation of casein micelles. II. Mineral solubilization and its relation to casein release. J. Dairy res. 56: 727-735
el-Agamy e.I., ruppanner r., Ismail A., champagene c.P. and Assaf r. 1992. Antimicrobial and antiviral activity of camel milk protective proteins. J. Dairy res., 59: 169-175.
el-Amin F.M. and Wilcox c.J. 1992. Milk composition of Ma-jaheem camels. J. Dairy Sci. 75: 3153-3157.
el-Hatmi H., Girardet J.M., Gaillard J.L., yahyaoui M.H. and Attia H. 2007. characterisation of whey proteins of camel (Camelus dromedarius) milk and colostrum. Small rum. res. 70: 267-271.
FAo. 1982. camels and camel milk. Food and agrıculture organızatıon of the unıted Nations. rome.
Farah z. 1996. camel milk properties and products, 1st edi-tion. Swiss centre for Development. cooperation in tech-nology and Management, Vadianstrasse 42, cH- 9000 St. Gallen, Switzerland.
Ferreira I.M., Pinho o., Monteiro D., Faria S., cruz S., Per-reira A., roque A.c and tavares P. 2010. effect of kefir grains on protolysis of major milk protins. J. Dairy Sci. 93: 27-31.
Gaware V., Kotade r. and Dolas K. 2011. the magic of kefir: a review History of Kefir. Pharmacologyonline. 1: 376-386.
Gorban A.M.S. and Izzeldin o.M. 1999. Study on cholesteryl ester fatty acids in camel and cow milk lipid, Int. J. Food Sci. technol. 34: 229-234.
Goudjil H., torrado S., Fontecha J.,Martinez-castro I., Fra-ga J. and Juarez M. 2003. composition of cholesterol and its precursor in ovine milk, Lait 83: 153-160.
Hamad e.M., Abdel-rahim e.A. and romeih e.A. 2011. beneficial effect of camel milk Liver and kidneys func-tion in diabetic sprague-dawles rats. I. J. Dairy Sci. 6 (3): 190-197.
Hashim I.b. and Khalil A.H. 2004. Dairy Sci. J. 87 suppl. 1: 282-386. International Dairy Federation (IDF) (1988). Fer-mented milks, Science and technology. IDF bulletin 227.
Hertzler S.r. and clancy S.M. 2003. Kefir improves lactose digestion and tolerance in adults with lactose maldiges-tion. J. Am. Diet. Assoc. 103: 582-7.
Horwitz W. 1965. official methods of analysis of the asso-ciation of official agricultural chemists. 10th ed., p. 224, Publishing by the association official agricultural chem-ists. benjamin Franklin Station, Washington D.c. 20044.
IDF Standard 149 A. 1997. Dairy Starter cultures of Lac-tic Acid bacteria (LAb) – Standard of Identity. brussels, belgium: International Dairy Federation.
IDF Standard 163 1992. General Standard of Identity for Fermented Milks. brussels, belgium: International Dairy Federation.
Irigoyen A., Arana I., castiella M., torre P. and Ibánez F.c. 2005. Microbiological, Physicochemical and Sensory characteristic of Kefir During Storage. Food chem. 90: 613-620.
ISo 11870:2009 (IDF 152:2009). Milk and milk products- Determination of fat content-General guidance on the use of butyrometric methods.
Jianzhong z., Xiaoli L., Hanhu J. and Mingsheng D. 2009. Analysis of the microflora in tibetan kefir grains using denaturing gradient gel electrophoresis Food Microbiol. 26: 770-775.

Ital. J. Food Sci., vol. 27 - 2015 365
Jumah r.y, Shaker r.r. and Abu-Jdayil b. 2001. effect of milk source on the rheological properties of yoghurt dur-ing the gelation process. J. Dairy tech. 54(3): 89.
Konuspayeva G., Lemarie e., Faye b., Loiseau G. and Montet D. 2008. Fatty acid and cholesterol composition of camel’s (Camelus bactrianus, Camelus dromedarius and hybrids) milk in Kazakhstan. Dairy Sci. technol. 88: 327-340.
Koroleva N.S., bavına N.A. and rozhkova I.V. 1978. chang-es in the Microflora of kefir during storage XX. Int. Dairy cong France-1978 Publishing by congrilait Paris 1978 Vol. e. (844).
Koroleva N.S. and bavina N.A. 1978. basıc Factors Affect-ing the Microflora and quality of Kefir. XX Int. Dairy cong France 1978. Publishıng by congrılait Paris 1978. Vol. e (844).
Laila y. Ayadhi A.L. and elamin N.e. 2013. camel Milk as a Potential therapy as an Antioxidant in Autism Spectrum Disorder (ASD). evidence based complementary and Al-ternative Medicine 8: 11-17
Laleye L.c., Jobe b. And Wasesa A.A.H. 2008. comparative study on heat stability and functionality of camel and bovine milk whey proteins. J. Dairy Sci. 91: 4527-4534.
Lewis J.M. 1986. Physical properties of dairy products. In: Modern dairy technology (ed. r.K. robinson) elsevier Ap-plied Science Publishers, London, uK.
Liu J.r., chen M.J. and Lin c.W.2005. Antimutagenic and antioxidant properties of milk-kefir and soymilk-kefir. J. Agric. Food chem. 53: 2467-74.
Lopitz-otsoa F., rementeria A., elguezabal N. and Garaizar J. 2006. Kefir: A symbiotic yeast-bacteria commu¬nity with alleged healthy capabilities. revista Iberoamerica-na de Micologia. 23: 67-74.
Maeda H., zhu X., Suzuki S., Suzuki K. and Kitamura S. 2004. Structural characterization and biological activi-ties of an exopolysaccharide kefiran produced by Lacto-bacillus kefiranofaciens Wt-2bt. J. Agric. Food chem. 52: 5533-5538
Marshall V.M. and cole W.M. 1985. Methods for making kefir and fermented milks based on kefir. J. Dairy res. 52: 451-456
Matsuu M., Shichijo K., okaichi K., Wen c.y., Fukuda e., Nakashima M., Nakayama, t., Shirahata S., tokumaru S. and Sekine I. 2003. theprotective effect of ferment-ed milk kefir on radiation-induced apoptosis incolonic crypt cells of rats. J. Dairy res. (tokyo) 44(2): 111-115.
Mehaia M.A. 1993. Fresh soft white cheese (Domiati type) from camel’s milk: composition, yield and sensory eval-uation. J. Dairy Sci. 20: 2845-2855.
Muliro P.S., Shalo P.L. and Kutima P.M. 2013. optimization
of camel milk coagulum formation and consumer prefer-ence. Afr. J. Food Sci. and tech. 4(8): 176-181.
oner z. and Karahan A.G., Çakmakçı M.L. 2010. effects of different milk types and starter cultures on kefır. Food J. 35 (3): 177-182.
ossa e.M., Huber W., Molero A. and Pereyra c. 1995. De-termination of cholesterol in milk fat by supercritical flu-id chromatography. J. chromatography A. 715:333-336.
Pogačić t., šinkoS., zamberlin S. and Samaržija D. 2013. Microbiota of kefir grains. Mljekarstvo 63(1): 3-14.
Puvanenthiran A., Williams r.P.W. and Augustin M.A. 2002. Structure and visco-elastic properties of set yo-ghurt with altered casein to whey protein ratios. I. Dairy J. 12: 383-391
ramet J.P. 1987. use of bovine calf rennet to coagulate raw camel milk. World Anim. rev. 61: 11-26.
rattray F.P. and o’connell M.J. 2011. Kefir. encyclopedia of Dairy Science., elsevier, Ltd. 518-524.
Shabo y., barzel r., Margoulis M. and yagil r. 2005. cam-el milk for food allergies in children. Immunol. and Al-lergy .7 :796-798.
Shamsia S.M. 2009. Nutritional and therapeutic properties of camel and human milks. I. J. Genetics and Molecular biol. 1(2): 052-058.
Sharpe M.e., Fryer t.F. and Smith D.c. 1966. Identifica-tion of the Lactic Acid bacteria. In: Gibbs b.M. and Skin-ner P.A.: Identification Methods for Microbiologists, Part A, 65-79.
Shiomi M., Sasaki K., Murofushi M. and Aibara K. 1982. An-titumor activity in mice of orally administered polysaccha-ride from Kefir grain. Jpn. J. Med. Sci. biol. 35: 75-80.
Sieber r. 2005. oxidised cholesterol in milk and dairy prod-ucts. Int. Dairy J. 15:191-206.
terzaghi b.e. and Sandine W.e. 1975. Improved medium for Lactic Streptococci and their bacteriophages. App. Mi-crobiol. 29 (6): 807-8l3.
turkish Food codex. 2009. communiqué no: 2009/25. Femented milk product. 6.02.2009-27143 teblig No: 2009/25
umeda c., Sonoyama K., yamaguchi N., Saito r., Akashi K., Motoshima, H. and Kawabata J. 2005. oral administra-tion of freeze-dried kefir reduces intestinal permeation of and oral sensitization to ovalbumin in mice. biosci bio-technol biochem. 69(1): 249-251.
Wszolek M., Kupiec-teahan b., Skov Guldager H. and tamime A.y. 2006. Production of kefir, koumiss and other related products. In: tamime A.y. (ed.) Fermented milks. blackwell Science Ltd, oxford, pp. 174-198.
Paper Received September 4, 2014 Accepted November 5, 2014

PaPer
366 Ital. J. Food Sci., vol. 27 - 2015
- Keywords: gelatin, gel strength, extraction, temperature, swim bladder, yellowfin tuna -
CHARACTERISTICS OF gELATIN FROM SWIM bLADDER OF yELLOWFIN TUNA (thunnus
aLbacores) AS INFLUENCED by EXTRACTINg TEMPERATURES
O. KAEWDANg1, S. bENJAKUL1*, T. PRODPRAN2, T. KAEWMANEE3
and H. KISHIMURA4
1Department of Food Technology, Faculty of Agro-Industry, Prince of Songkla University, Hat Yai, Songkhla 90112, Thailand
2Department of Material Product Technology, Faculty of Agro-Industry, Prince of Songkla University, Hat Yai, Songkhla 90112, Thailand
3Department of Food Science and Nutrition, Faculty of Science and Technology, Prince of Songkla University, Pattani 94000, Thailand
4Laboratory of Marine Products and Food Science, Research Faculty of Fisheries Sciences, Hokkaido University, Hakodate, Hokkaido 041-8611, Japan*Corresponding author: Tel. 66 7428 6334, Fax 66 7455 8866
email: [email protected]
AbStrAct
Gelatin was extracted from the swim bladder of yellowfin tuna (Thunnus albacores) at differ-ent temperatures (60, 70 and 80°c) with the extraction yields of 35.6%, 41.1% and 47.3% (dry weight basis), respectively. the α-chains of gelatin decreased with increasing extraction tempera-tures. Similar amino acid compositions were noticeable among all gelatins, in which glycine con-stituted the major amino acid. Imino acids ranged from 169 to 172 residues/1,000 residues. the gel strength of gelatin extracted at lower temperature was higher than that of gelatins extracted at higher temperatures. Gelling and melting temperatures for swim bladder gelatin were 11.07-15.24 and 20.36-22.33°c, respectively. Higher gelling and melting points were observed for gel-atin extracted at lower temperatures. Microstructure of gel of gelatin extracted at 60°c was finer with smaller voids, compared with others. FtIr spectra of obtained gelatins revealed the signifi-cant loss of molecular order of the triple-helix. thus, extraction temperatures showed the direct impact on characteristics of gelatin from swim bladder.

Ital. J. Food Sci., vol. 27 - 2015 367
INtroDuctIoN
Gelatin is a fibrous protein obtained by par-tial denaturation or hydrolysis of collagen. Gela-tin represents biopolymer with many applications in food, materials (for edible and biodegradable packaging), cosmetic, pharmaceutical and pho-tographic industries (JeLLouLI et al., 2011). the source, type of collagen and processing conditions have the influence on the properties of the result-ing gelatin (KIttIPHAttANAbAWoN et al., 2010). Different types of gelatins have varying thermal and rheological properties such as gel strength, melting and gelling temperatures (beNJAKuL et al., 2012). these properties are governed by sev-eral factors such as chain length or molecular weight distribution, amino acid composition and hydrophobicity, etc. (GóMez-GuILLéN et al., 2002; NorzIAH et al., 2009).
commercial gelatins are produced mainly from porcine and bovine skins and bones by alkaline or acidic extraction (beNJAKuL et al., 2009). Howev-er, both Judaism and Islam forbid the consump-tion of any pork-related products, while Hindus do not consume cow-related products. Addition-ally, bovine gelatin has a high risk for bovine spongiform encephalopathy (NAGArAJAN et al., 2012). Furthermore, the need to exploit the fish processing byproducts has led to the production of gelatin as an alternative to mammalian coun-terpart (GóMez-GuILLéN et al., 2011). Fish gela-tin has been extracted mainly from fish skin such as seabass (SINtHuSAMrAN et al., 2014), cobia (SILVA et al., 2014) skipjack tuna, dog shark and rohu (SHyNI et al., 2014) and unicorn leatherjack-et (KAeWruANG et al., 2013), etc.
Among fish processing industries, canned tuna industry is economically important. tuna includ-ing yellowfin, skipjack and tongol have been the important species for canning in thailand with a large volume of raw materials used. Approximate-ly two-thirds of the whole fish are utilized and the remainings involving the viscera, head, bone and swim bladder become the byproducts (KLoMKLAo et al., 2004). Fish swim bladders can be used for production of “isinglass” (Weber et al., 2009). re-cently, KAeWDANG et al., (2014) reported that alka-line pretreatment was essential for gelatin extrac-tion from yellowfin tuna swim bladder. However, no information on the effect of extracting temper-ature on characteristics and properties of gelatin has been reported. therefore, the objectives of this investigation were to extract and characterize gel-atin from the swim bladder of yellowfin tuna us-ing different extraction temperatures.
2. MAterIALS AND MetHoDS
2.1. Chemicals
All chemicals were of analytical grade. Sodium dodecyl sulphate (SDS), coomassie blue r-250
and N,N,N’,N’-tetramethylethylenediamine (te-MeD) were procured from bio-rad Laborato-ries (Hercules, cA, uSA). High-molecular-weight markers were purchased from Ge Healthcare uK Limited (buckinghamshire, uK). Food grade bovine bone gelatin with the bloom strength of 150-250 g was obtained from Halagel (thailand) co., Ltd., (bangkok, thailand).
2.2. Collection and preparation of swim bladder
Swim bladders of yellowfin tuna (Thunnus al-bacares) were obtained from tropical canning Public co., Ltd., Songkhla, thailand. Swim blad-ders with the length of 8-12 cm were placed in polyethylene bags, inserted in ice using a sam-ple/ice ratio of 1:2 (w/w) and transported to the Department of Food technology, Prince of Songkla university, Songkhla. upon arrival, swim bladders were washed with distilled water and cut into pieces with the length of approxi-mately 2 cm. the prepared samples were then placed in polyethylene bag and frozen at -20°c. the samples were stored at -20°c until used. the storage time was not longer than 3 months. Prior to extraction, frozen swim bladders were thawed using running water until the tempera-ture was 0-2°c
2.3. Extraction of gelatin from swim bladder
Prior to gelatin extraction, swim bladders were pretreated with alkaline solution as per the method of KAeWDANG et al. (2014). Pre-pared swim bladders were added with the mixed alkaline solution (Na2co3:NaoH; 7:3) having the concentration of 4% (w/v) at a ratio of 1:10 (w/v). the mixture was stirred for 12 h at room temperature (28-30°c) using an overhead stir-rer model W20.n (IKA®-Werke GmbH & co.KG, Stanfen, Germany). the alkaline solution was changed every 6 h. the residues were washed with tap water until a neutral or faintly basic pH was obtained.
to extract gelatin, alkali pretreated samples were soaked in distilled water with different temperatures (60, 70 and 80°c) using a swim bladder/water ratio of 1:5 (w/v) in a tempera-ture-controlled water bath (W350, Memmert, Schwabach, Germany) for 24 h with a contin-uous stirring at a speed of 150 rpm. the mix-tures were then filtered using a buchner fun-nel with a Whatman No. 4 filter paper (What-man International, Ltd., Maidstone, england). the filtrates were freeze-dried using a freeze-dryer (coolSafe 55, ScanLaf A/S, Lynge, Den-mark). the dry gelatin extracted from swim bladder from yellowfin tuna at 60, 70 and 80 °c was referred to as ‘G60’, ‘G70’ and ‘G80’, respectively. All gelatin samples were weighed, calculated for extraction yield and subjected to analyses.
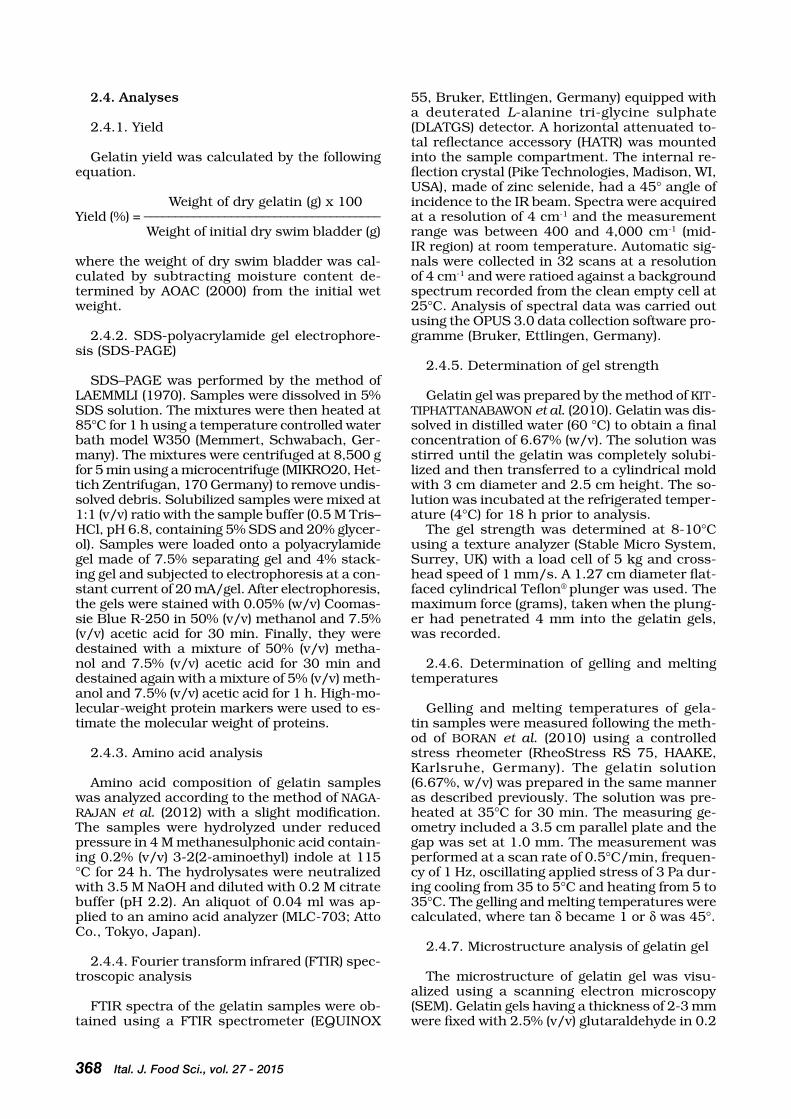
368 Ital. J. Food Sci., vol. 27 - 2015
2.4. Analyses
2.4.1. yield
Gelatin yield was calculated by the following equation.
Weight of dry gelatin (g) x 100 yield (%) = ______________________________________
Weight of initial dry swim bladder (g)
where the weight of dry swim bladder was cal-culated by subtracting moisture content de-termined by AoAc (2000) from the initial wet weight.
2.4.2. SDS-polyacrylamide gel electrophore-sis (SDS-PAGe)
SDS–PAGe was performed by the method of LAeMMLI (1970). Samples were dissolved in 5% SDS solution. the mixtures were then heated at 85°c for 1 h using a temperature controlled water bath model W350 (Memmert, Schwabach, Ger-many). the mixtures were centrifuged at 8,500 g for 5 min using a microcentrifuge (MIKro20, Het-tich zentrifugan, 170 Germany) to remove undis-solved debris. Solubilized samples were mixed at 1:1 (v/v) ratio with the sample buffer (0.5 M tris–Hcl, pH 6.8, containing 5% SDS and 20% glycer-ol). Samples were loaded onto a polyacrylamide gel made of 7.5% separating gel and 4% stack-ing gel and subjected to electrophoresis at a con-stant current of 20 mA/gel. After electrophoresis, the gels were stained with 0.05% (w/v) coomas-sie blue r-250 in 50% (v/v) methanol and 7.5% (v/v) acetic acid for 30 min. Finally, they were destained with a mixture of 50% (v/v) metha-nol and 7.5% (v/v) acetic acid for 30 min and destained again with a mixture of 5% (v/v) meth-anol and 7.5% (v/v) acetic acid for 1 h. High-mo-lecular-weight protein markers were used to es-timate the molecular weight of proteins.
2.4.3. Amino acid analysis
Amino acid composition of gelatin samples was analyzed according to the method of NAGA-rAJAN et al. (2012) with a slight modification. the samples were hydrolyzed under reduced pressure in 4 M methanesulphonic acid contain-ing 0.2% (v/v) 3-2(2-aminoethyl) indole at 115 °c for 24 h. the hydrolysates were neutralized with 3.5 M NaoH and diluted with 0.2 M citrate buffer (pH 2.2). An aliquot of 0.04 ml was ap-plied to an amino acid analyzer (MLc-703; Atto co., tokyo, Japan).
2.4.4. Fourier transform infrared (FtIr) spec-troscopic analysis
FtIr spectra of the gelatin samples were ob-tained using a FtIr spectrometer (equINoX
55, bruker, ettlingen, Germany) equipped with a deuterated L-alanine tri-glycine sulphate (DLAtGS) detector. A horizontal attenuated to-tal reflectance accessory (HAtr) was mounted into the sample compartment. the internal re-flection crystal (Pike technologies, Madison, WI, uSA), made of zinc selenide, had a 45° angle of incidence to the Ir beam. Spectra were acquired at a resolution of 4 cm-1 and the measurement range was between 400 and 4,000 cm-1 (mid-Ir region) at room temperature. Automatic sig-nals were collected in 32 scans at a resolution of 4 cm-1 and were ratioed against a background spectrum recorded from the clean empty cell at 25°c. Analysis of spectral data was carried out using the oPuS 3.0 data collection software pro-gramme (bruker, ettlingen, Germany).
2.4.5. Determination of gel strength
Gelatin gel was prepared by the method of KIt-tIPHAttANAbAWoN et al. (2010). Gelatin was dis-solved in distilled water (60 °c) to obtain a final concentration of 6.67% (w/v). the solution was stirred until the gelatin was completely solubi-lized and then transferred to a cylindrical mold with 3 cm diameter and 2.5 cm height. the so-lution was incubated at the refrigerated temper-ature (4°c) for 18 h prior to analysis.
the gel strength was determined at 8-10°c using a texture analyzer (Stable Micro System, Surrey, uK) with a load cell of 5 kg and cross-head speed of 1 mm/s. A 1.27 cm diameter flat-faced cylindrical teflon® plunger was used. the maximum force (grams), taken when the plung-er had penetrated 4 mm into the gelatin gels, was recorded.
2.4.6. Determination of gelling and melting temperatures
Gelling and melting temperatures of gela-tin samples were measured following the meth-od of borAN et al. (2010) using a controlled stress rheometer (rheoStress rS 75, HAAKe, Karlsruhe, Germany). the gelatin solution (6.67%, w/v) was prepared in the same manner as described previously. the solution was pre-heated at 35°c for 30 min. the measuring ge-ometry included a 3.5 cm parallel plate and the gap was set at 1.0 mm. the measurement was performed at a scan rate of 0.5°c/min, frequen-cy of 1 Hz, oscillating applied stress of 3 Pa dur-ing cooling from 35 to 5°c and heating from 5 to 35°c. the gelling and melting temperatures were calculated, where tan δ became 1 or δ was 45°.
2.4.7. Microstructure analysis of gelatin gel
the microstructure of gelatin gel was visu-alized using a scanning electron microscopy (SeM). Gelatin gels having a thickness of 2-3 mm were fixed with 2.5% (v/v) glutaraldehyde in 0.2

Ital. J. Food Sci., vol. 27 - 2015 369
M phosphate buffer (pH 7.2) for 12 h. the sam-ples were then rinsed with distilled water for 1 h and dehydrated in ethanol with a serial con-centration of 25%, 50%, 70%, 80%, 90% and 100% (v/v). Dried samples were mounted on a bronze stub and sputter-coated with gold (Sput-ter coater SPI-Module, West chester, PA, uSA). the specimens were observed with a scanning electron microscope (JeoL JSM-5800 LV, to-kyo, Japan) at an acceleration voltage of 20 kV.
2.4.8. Determination of color of gelatin gel
the color of gelatin gels (6.67% w/v) was measured with a Hunter lab colorimeter (color Flex, Hunter Lab Inc., reston, VA, uSA). L*, a* and b* values indicating lightness/brightness, redness/greenness and yellowness/blueness, respectively, were recorded. the colorimeter was warmed for 10 min and calibrated with a white standard. the total difference in color (ΔE*) was calculated according to the following equation. (GeNNADIoS et al., 1996):
where ΔL*, Δa* and Δb* are the differences be-tween the corresponding color parameter of the sample and that of the white standard (L* = 93.6, a*= -0.94 and b* = 0.40).
2.5. Statistical analysis
All experiments were run in triplicate, using three different lots of samples. Data were sub-jected to analysis of variance (ANoVA) and mean comparisons were carried out using a Duncan’s multiple range test (SteeL and torrIe, 1980). Statistical analysis was performed using the Sta-tistical Package for Social Sciences (SPSS for windows: SPSS Inc., chicago, IL, uSA).
3. reSuLtS AND DIScuSSIoN
3.1. Extraction yield
yield of gelatin from the swim bladder of yel-lowfin tuna extracted at various temperatures was different. Increasing yield was obtained when the extraction temperatures increased (P < 0.05). yield of 35.6%, 41.1% and 47.3% (on dry weight basis) was found for G60, G70, and G80, respectively. this result was in agreement with KAeWruANG et al. (2013), DuAN et al. (2011) and KIttIPHAttANAbAWoN et al. (2010) who re-ported the increasing yield of gelatin as the ex-traction temperature increased with higher tem-peratures, the bondings stabilizing α-chains in the native mother collagen were destroyed to a higher extant. As a consequence, the triple he-lix structure became amorphous and could be extracted into the medium with ease, leading to
the higher yield (SINtHuSAMrAN et al., 2014). In addition, the higher energy applied could induce thermal hydrolysis of peptide chains, resulting in the formation of shorter peptides. As a result, those small peptides could be easily extracted into water. the yield and characteristics of gel-atin are associated with the type of raw materi-al and gelatin extraction process, including the pretreatment process and extraction tempera-tures. (NAGArAJAN et al., 2012; KIttIPHAttAN-AbAWoN et al., 2010; MoNtero and GóMez-GuILLéN, 2000).
3.2. Protein patterns
Protein patterns of gelatin from the swim blad-der of yellowfin tuna extracted at different tem-peratures are shown in Fig. 1. the band inten-sity of α1-chain and α2-chain decreased with in-creasing extraction temperature. the decreas-es in α1-chain band intensity were observed in G70 and G80, in comparison with that found in G60. Among all gelatin samples, G80 possessed the lowest α-chain band intensity. this might be caused by the degradation induced by the ther-mal process. therefore, the extraction tempera-tures played a major role in protein components of resulting gelatin. KIttIPHAttANAbAWoN et al. (2010) reported that the gelatins extracted from the skins of brownbanded bamboo shark and blacktip shark with higher extraction tempera-ture contained more peptides with the MW less than α-chain and the lower proportion of high MW (greater than β-chain) fractions, compared with those obtained from lower temperature ex-traction. Gelatins from splendid squid skin with higher extraction temperatures contained a low-er band intensity of the α-chains than those ob-tained with lower extraction temperature (NAGA-
Fig. 1 - Protein patterns of gelatins from the swim blad-der of yellowfin tuna extracted at different temperatures. M: high molecular weight markers. G60, G70 and G80 rep-resent gelatin extracted from swim bladder at 60, 70 and 80°c, respectively.

370 Ital. J. Food Sci., vol. 27 - 2015
rAJAN et al., 2012). on the other hand, gelatin from skin of unicorn leatherjacket extracted at higher temperature (65-75°c) had α-chain re-tained at higher level than that extracted at low-er temperature (KAeWruANG et al., 2013). this was due to the thermal inactivation of indige-nous proteases in the skin of unicorn leather-jacket at high temperature. Generally, gelatins with a higher content of α-chains showed better functional properties including gelling, emulsi-fying and foaming properties (GóMez-GuILLéN et al., 2002). In general, the formation of pep-tide fragments is associated with lower viscosi-ty, low melting point, low setting point, high set-ting time, as well as decreased bloom strength of gelatin (MuyoNGA et al., 2004a). the results suggested that G70 and G80, which were ex-tracted at higher temperatures, had the shorter chains as indicated by lower content of α-chain.
3.3. Amino acid composition
Amino acid compositions of gelatins from the swim bladder of yellowfin tuna extracted at dif-ferent temperatures are shown in table 1. Gly-cine was the predominant amino acid in all gel-atin samples, ranging from 305 to 314 resi-dues/1000 residues. this implied that gela-tin obtained was derived from its mother colla-gen. collagen consists of one-third glycine in its molecule (bALtI et al., 2011). It was noted that G80 had the higher glycine content than G60 and G70. the higher glycine in G80 might be caused by free glycine, which was released to a high extent during extraction at high tempera-ture. Alanine (121-122 residues/1000 residues) was found at high content. Alanine plays a role in viscoelastic property of gelatin (GIMéNez et al., 2005). Low contents of cysteine (1 residues/1000 residues), tyrosine (5-6 residues/1000 residues), histidine (7-8 residues/1000 residues) and hy-droxylysine (10 residues/1000 residues) were observed in all gelatin samples. For imino acids, all gelatins contained proline and hydroxypro-line contents of 95–99 and 72–74 residues/1000 residues, respectively. reGeNSteIN and zHou (2007) reported that glycine, alanine, proline and hydroxyproline are four of the most abundant amino acids in gelatin. the properties of gelatin are largely influenced by the amino acid com-position and their molecular weight distribution (GóMez-GuILLéN et al., 2009). When comparing the content of imino acids (proline and hydroxy-proline), gelatin from swim bladder had the lower imino acid content than those from seabass skin (198-202 residues/1000 residues) (SINtHuSAM-rAN et al., 2014) and from carp skin (188-190 residues/1000 residues) (DuAN et al., 2011). the imino acid content of fish collagens and gelatins correlates with the water temperature of their normal habitat (FoeGeDING et al., 1996; re-GeNSteIN and zHou, 2007). It has been known that imino acid content, especially hydroxypro-
line content, affected functional properties of gel-atin, especially gelling property (AeWSIrI et al., 2008; beNJAKuL et al., 2009). therefore, amino acid composition of gelatin from swim bladder was governed by extraction temperature.
3.4. Fourier transform infrared (FTIR) spec-troscopy
FtIr spectra of gelatins extracted using differ-ent temperatures are shown in Fig. 2. FtIr spec-troscopy has been used as a well-established technique to monitor the functional groups and secondary structure of gelatin (KoNG and yu,
table 1 - Amino acid compositions of gelatins from the swim bladder of yellowfin tuna extracted at different temperatures.
Amino acids Number of residues/1000 residues
G60 G70 G80
Alanine 121 121 122Arginine 52 52 53Aspartic acid/asparagine 49 48 46Cysteine 1 1 1Glutamic acid /glutamine 80 80 78Glycine 307 305 314Histidine 7 8 7Isoleucine 14 14 13Leucine 29 30 28Lysine 26 26 26Hydroxylysine 10 10 10Methionine 17 16 16Phenylalanine 16 16 16Hydroxyproline 74 72 73Proline 95 99 99Serine 41 41 40Threonine 30 30 30Tyrosine 6 6 5Total 1000 1000 1000Imino acids 169 171 172
Fig. 2 - Atr-FtIr spectra of gelatins from the swim blad-der of yellowfin tuna extracted at different temperatures (see Fig. 1 caption).

Ital. J. Food Sci., vol. 27 - 2015 371
2007). the absorption bands were situated in the amide region. the absorption in the amide-I re-gion, owing to c=o stretching vibration, is prob-ably the most useful for infrared spectroscopic analysis of the secondary structure of proteins (beNJAKuL et al., 2009). It depends on the hy-drogen bonding and the conformation of the pro-tein structure (beNJAKuL et al., 2009; urIArte-MoNtoyAetAL et al., 2011). G60, G70 and G80 exhibited the amide-I bands at the wavenumbers of 1652.8, 1653.7 and 1652.9 cm-1, respective-ly. the characteristic absorption bands of G60, G70 and G80 in amide-II region were noticeable at the wavenumbers of 1544.6, and 1545.5 and 1543.5 cm-1, respectively. Amide-II arises from bending vibration of N-H groups and stretching vibrations of c-N groups. In addition, amide-III was detected at the wavenumbers of 1241.9, 1241.3 and 1240.8 cm-1 for G60, G70 and G80, respectively. the amide-III represents the com-bination peaks between c-N stretching vibra-tions and N-H deformation from amide linkages as well as absorptions arising from wagging vi-brations from cH2 groups from the glycine back-bone and proline side-chains (JAcKSoN et al., 1995). G80 had the lowest amplitude, whereas G60 exhibited the highest amplitude at amide-III region. this indicated that the greater disor-der of molecular structure due to transforma-tion of an α-helical to a random coil structure occurred at higher temperature. these chang-
es were associated with loss of triple-helix state as a result of denaturation of collagen to gela-tin (MuyoNGA et al., 2004b). the result recon-firmed the higher degradation of gelatin extract-ed at higher temperatures.
Amide-A band, arising from the stretching vi-brations of the N-H group, appeared at 3338.3, 3339.1 and 3339.3 cm-1 for G60, G70 and G80, respectively. Amide-A represents NH-stretch-ing coupled with hydrogen bonding. Normal-ly, a free N-H stretching vibration is found in the range of 3400-3440 cm-1 (MuyoNGA et al., 2004b). When the N-H of a peptide is involved in a hydrogen bond, the position shifts to lower frequencies (DoyLe et al. 1975). In amide-A re-gion, the lower wavenumber was found in G60, suggesting the hydrogen bonding involvement of N-H in α-chain. on the other hand, the low-er wavenumber with the concomitantly higher amplitude of amide-A observed in G80 could be associated with the higher degradation of gel-atin and higher free amino groups. the amide b was observed at 3082.1, 3080.9 and 3081.8 cm-1 for G60, G70 and G80, respectively. Amide b corresponds to asymmetric stretch vibration of =c-H as well as –NH3
+. thus, the secondary structure of gelatins obtained from the swim bladder of yellowfin tuna was affected to some degree by extraction temperature.
3.5. Gel strength
Gel strength of gelatin from the swim bladder of yellowfin tuna extracted at different temperatures is presented in Fig 3. G60, G70 and G80 had the gel strength of 72, 64 and 51 g, respectively. the difference in gel strength between the samples could be due to the differences in intrinsic charac-teristics, especially molecular weight distribution. Protein degradation resulted in the formation of peptides with shorter chain length, which might show the lower ability to from the junction zone or anneal each other. the longer chains in G60 could undergo aggregation to form gel network more effectively than G70 and G80. As a result, a stronger gel network could be formed as indi-cated by the higher gel strength. bloom strength of commercial gelatins ranges from 100 to 300, but gelatins with bloom values of 250-260 are
Fig. 3 - Gel strength of gelatin from the swim bladder of yel-lowfin tuna with different temperatures. Different upper-case letters on the bars denote significant differences (P< 0.05). bars represent the standard deviations (n = 3). (see Fig. 1 caption).
table 2 - Gelling and melting temperatures and gel color of gelatin from the swim bladder of yellowfin tuna extracted at dif-ferent temperatures.
Samples Melting point Gelling point Colour
(C˚) (C˚) L* a* b* ΔE*
G60 22.33±0.42A 15.24±0.27A 27.98±0.57C -2.07±0.02C 8.21±0.11C 66.09±0.57A
G70 22.05±0.45A 14.86±0.24A 42.79±0.47B -0.76±0.10B 16.79±0.24B 53.39±0.42B
G80 20.36±0.27B 11.07±0.58B 45.79±0.78A -0.34±0.05A 19.03±0.20A 51.32±0.80C
Mean ±SD (n = 3).Different uppercase superscripts in the same column indicate significant differences (P < 0.05).

372 Ital. J. Food Sci., vol. 27 - 2015
the most desirable (HoLzer, 1996). Different gel strength was reported for gelatin from skin of dif-ferent species including splendid squid (85–132 g) (NAGArAJAN et al., 2012), brownbanded bam-boo shark and blacktip shark (206–214 g) (KIt-tIPHAttANAbAWoN et al., 2010) and bigeye snap-per (108 g) (bINSIA et al., 2009).
3.6. Gelling and melting temperatures
the gelling temperatures of all the gelatin samples were in the range of 11.07-15.24°c (ta-ble 2). thermal transitions were monitored by changes in the phase angle (δ) of dissolved gel-atins during cooling (35-5°c) and subsequent heating (5-35°c). It was found that G80 had the lowest gelling point (11.07°c) (P < 0.05), while no difference in gelling point were observed between G60 and G70 (P > 0.05). In general, fish gela-tin is not able to form gel at room temperature (NorLAND, 1990). It has been known that imino acid content is an essential factor governing ge-lation of getatin (GILSeNAN and roSS-MurPHy, 2000). However, the similar amino acid content was observed among all samples (169-172 resi-dues/1000 residues). the result indicated that the gelling temperature was affected by the ex-traction temperature, more likely related with varying chain length.
As a thermoreversible gel, gelatin gel starts melting when the temperature increases above a certain point, which is called the gel melting point (KArIM and bHAt, 2009). the melting tem-peratures of gelatin gel from swim bladder were in the range of 20.36-22.33°c. G80 had the low-est melting point (20.36°c) (P < 0.05). Neverthe-less, G60 and G70 showed similar melting points (P > 0.05). typical melting points for fish gela-tins ranged from 11 to 28°c (KArIM and bHAt, 2009). GóMez-GuILLéN et al. (2002) reported that melting points of cod, hake, sole and me-grim were 13.8, 14, 19.4 and 18.8°c, respec-tively. Melting points of red and black tilapia skin gelatins were 22.4 and 28.9°c, respective-ly (JAMILAH and HArVINDer, 2002). there was a relationship between melting point and molecu-lar weight of gelatin. Low molecular weight gela-tins melt at lower temperature than high molec-ular weight counterparts (GILSeNAN and roSS-MurPHy, 2000). the results suggested that lower melting point of G80 was attributed to the low-er molecular weight of peptide chains. temper-ature of the environment also affects the gel-ling and melting temperatures of gelatin (GuD-MuNDSSoN, 2002). Poorer gel strength of G80 (Fig. 3) was in accordance with lower gelling and melting points.
3.7. Microstructures of gelatin gels
the microstructures of gelatin gels from swim bladder with different extraction temperatures are illustrated in Fig. 4. In general, the conformation
Fig. 4 - Microstructures of gelatin gel from the swim bladder of yellowfin tuna extracted at different temperatures. Mag-nification: 3000 (see Fig. 1 caption).

Ital. J. Food Sci., vol. 27 - 2015 373
and chain length of the proteins in gel matrix di-rectly contributed to the gel strength of gelatin (beNJAKuL et al., 2009). Gelatin extracted at 60°c showed the finest gel network with small voids. conversely, the coarser networks with the larg-er voids were found in gel of the gelatin extract-ed at higher temperatures. the fine gel structure of gelatin extracted at lower temperature was in accordance with the higher gel strength (Fig. 3). It has been known that the microstructure of the gel is related to the physical properties. the gel-atin gel network was governed by the pretreat-ment conditions (yANG et al., 2008) and gelatin concentration (yANG and WANG, 2009). Gelatin extracted at lower temperatures had the lower degradation, in which proteins with higher chain length were present. As a result, junction zones could be formed to a greater extent. this led to the high aggregation with a strong and ordered network. In the first stage of gel network forma-tion, there is competition between intramolecular folding and intermolecular aggregate formation (yANG and WANG, 2009). For gelatin extracted at lower temperature, longer chains might under-go aggregation to a higher extent. thus, the ar-rangement of peptides in the network during ge-lation as determined by chain length directly af-fected gel properties of gelatin.
3.8. Color
color of the gelatin gel from swim bladder with different extraction temperatures expressed as L*, a* and b* is shown in table 2. Gel of gelatin extracted at lower temperatures (G60) showed the lower L*-value (lightness) than others (G70 and G80) (P < 0.05). the higher redness (a*-val-ue) and yellowness (b*-value) were found in the latters (P < 0.05). Generally, the increases in L*, a* and b*-value of gelatin increased with increas-ing extraction temperatures. For yellowness (b*-value), an increase was observed in all gelatin gels when the extraction temperatures increased (P < 0.05). this might be due to a non-enzymat-ic browning reaction taken place at the higher temperature, especially when the extraction time increased (AJANDouz and PuIGSerVer, 1999). Among all the gelatin samples, those extracted at a lower temperature (60˚c) showed the highest total difference in the color value (ΔE*) (66.09) with the lowest lightness (L*-values). these re-sults showed that the extraction temperatures had the impact on color of gelatin extracted from the swim bladder of yellowfin tuna.
4. coNcLuSIoN
Swim bladder from yellowfin tuna could be an alternative source of gelatin. Gelatin extracted at a higher temperature had the highest extrac-tion yield, but possessed the poorer gel proper-ties. extraction conditions also affected the color
of resulting gelatin. the appropriate extraction temperature for gelatin from swim bladder was 60 °c, providing the highest gel strength.
AcKNoWLeDGeMeNtS
the authors would like to express their sincere thanks to the Graduate School of Prince of Songkla university and PSu halal center, Pattani campus, for the financial sup-port. the trF Distinguished research Professor Grant was also acknowledged.
reFereNceS
Aewsiri t., benjakul S., Visessanguan W. and tanaka M. 2008. chemical compositions and functional proper-ties of gelatin from pre-cooked tuna fin. Int. J. Food Sci. technol. 43: 685.
Ajandouz e.H. and Puigserver A. 1999. Nonenzymatic brown-ing reaction of essential amino acids: effect of pH on car-amelization and Maillard reaction kinetics. J. Agric. Food chem. 47: 1786.
AoAc. 2000. official methods of analysis. Arlington: Asso-ciation of official Analytical chemists Inc.
balti r., Jridi M., Sila A., Souissi N., Nedjar-Arroume N., Guillochon D. and Nasri M. 2011. extraction and func-tional properties of gelatin from the skin of cuttlefish (Se-pia officinalis) using smooth hound crude acid protease-aided process. Food Hydrocolloids 25: 943.
benjakul S., Kittipahattanabawon P. and regenstein J.M. 2012. Fish gelatin. In “Food biochemistry and Food pro-cessing. b.K. Simpson, L.M.L. Nollet, F. toldrá S. ben-jakul, G. Paliyath and y.H. Hui (ed.), p. 388. John Wiley & Sons, Inc. Ames.
benjakul S., oungbho K., Visessanguan W., thiansilakul y. and roytrakul S. 2009. characteristics of gelatin from the skins of bigeye snapper, Priacanthus tayenus and Priacanthus macracanthus. Food chem. 116: 445.
binsi P.K., Shamasundar b.A., Dileep A.o., badii F. and How-ell N.K. 2009. rheological and functional properties of gel-atin from the skin of bigeye snapper (Priacanthus hamrur) fish: Influence of gelatin on the gel-forming ability of fish mince. Food Hydrocolloids. 23: 132.
boran G., Mulvaney S.J. and regenstein J.M. 2010. rhe-ological properties of gelatin from silver carp skin com-pared to commercially available gelatins from different sources. J. Food Sci. 75: 565.
Duan r., zhang J., Xing F., Konno K. and Xu b. 2011. Study on the properties of gelatins from skin of carp (Cyprinus carpio) caught in winter and summer season. Food Hy-drocolloids 25: 368.
Foegeding e.A., Lanier t.c. and Hultin H.o. 1996. charac-teristics of edible muscle tissues. In “Food chemistry”. o.r. Fennema (ed.), p. 879. Marcel Dekker, New york.
Gennadios A., Weller c.L., Hanna M.A. and Froning G.W. 1996. Mechanical and barrier properties of egg albumen films. J. Food Sci. 61: 585.
Gilsenan P. and ross-Murphy S. 2000. rheological charac-terisation of gelatins from mammalian and marine sourc-es. Food Hydrocolloids 14: 191.
Giménez b., turnay J., Lizarbe M., Montero P. and Gómez-Guillén M. 2005. use of lactic acid for extraction of fish skin gelatin. Food Hydrocolloids 19: 941.
Gómez-Guillén M.c., Giménez b., López-caballero M.e. and Montero M.P. 2011. Functional and bioactive properties of collagen and gelatin from alternative sources: A review. Food Hydrocolloids 25: 1813.
Gómez-Guillén M.c., Pérez-Mateos M., Gómez-estaca J., López-caballero e., Giménez b. and Montero P. 2009. Fish gelatin: a renewable material for developing active biodegradable films. trends Food Sci. technol. 20: 3.

374 Ital. J. Food Sci., vol. 27 - 2015
Gómez-Guillén M., turnay J., Fernández-Diaz M., ulmo N., Lizarbe M. and Montero P. 2002. Structural and physi-cal properties of gelatin extracted from different marine species: a comparative study. Food Hydrocolloids 16: 25.
Gudmundsson M. 2002. rheological properties of fish gel-atins. J. Food Sci. 67: 2172.
Holzer D. 1996. Gelatin production. uS patent. 5,484,888.Jackson M., choo L., Watson P.H., Halliday W.c. and Man-
tsch H.H. 1995. beware of connective tissue proteins: as-signment and implications of collagen absorptions in in-frared spectra of human tissues. biochim. biophy. Acta 1270: 1.
Jamilah b., Harvinder K. 2002. Properties of gelatins from skins of fish-black tilapia (Oreochromis mossambicus) and red tilapia (Oreochromis nilotica). Food chem. 77: 81.
Jellouli K., balti r., bougatef A., Hmidet N., barkia A. and Nasri M. 2011. chemical composition and characteris-tics of skin gelatin from grey triggerfish (Balistes capriscus). LWt-Food Sci. technol. 44: 1965.
Kaewdang o., benjakul S., Kaewmanee t. and Kishimura H. 2014. characteristics of gelatin extracted from the swim bladder of yellowfin tuna (Thunnus albacores) as affected by alkaline pretreatments.
Kaewruang P., benjakul S., Prodpran t. and Nalinanon S. 2013. Physicochemical and functional properties of gela-tin from the skin of unicorn leatherjacket (Aluterus monocer-os) as affected by extraction conditions. Food biosci. 2: 1.
Karim A. and bhat r. 2009. Fish gelatin: properties, chal-lenges, and prospects as an alternative to mammalian gelatins. Food Hydrocolloids 23: 563.
Kittiphattanabawon P., benjakul S., Visessanguan W. and Shahidi F. 2010. comparative study on characteristics of gelatin from the skins of brownbanded bamboo shark and blacktip shark as affected by extraction conditions. Food Hydrocolloids 24: 164.
Klomklao S., benjakul S. and Visessanguan W. 2004. com-parative studies on proteolytic activity of splenic extract from three tuna species commonly used in thailand. J. Food biochem. 28: 355.
Kong J. and yu S. 2007. Fourier transform infrared spec-troscopic analysis of protein secondary structures. bio-chim. biophys. Acta. 39: 549.
Laemmli u.K. 1970. cleavage of structural proteins dur-ing the assembly of the head of bacteriophage. t4. Na-ture. 227: 680.
Montero P. and Gómez-Guillén M.c. 2000. extracting con-ditions for megrim (Lepidorhombus boscii) skin collagen af-fect functional properties of the resulting gelatin. J. Food Sci. 65: 434.
Muyonga J., cole c. and Duodu K. 2004a. extraction and physico-chemical characterisation of Nile perch (Lates niloticus) skin and bone gelatin. Food Hydrocolloids 18: 581.
Muyonga J., cole c. and Duodu K. 2004b. Fourier trans-form infrared (FtIr) spectroscopic study of acid solu-ble collagen and gelatin from skins and bones of young and adult Nile perch (Lates niloticus). Food chem. 86: 325.
Nagarajan M., benjakul S., Prodpran t., Songtipya P. and Kishimura H. 2012. characteristics and functional prop-erties of gelatin from splendid squid (Loligo formosana) skin as affected by extraction temperatures. Food Hydrocol-loids 29: 389.
Norland r.e. 1990. Fish gelatin. In: “Fisheries technolo-gy and biotechnology for In-creased Profitability”. M.N. Voight and J.K. botta (ed.), p. 325. teechnomic Publish-ing co., Lancaster, PA.
Norziah M., Al-Hassan A., Khairulnizam A., Mordi M. and Norita M. 2009. characterization of fish gelatin from surimi processing wastes: thermal analysis and effect of transglutaminase on gel properties. Food Hydrocol-loids 23: 1610.
regenstein J.M. and zhou P. 2007. collagen and gelatin from marine by-products. In “Maximising the value of marine by-products” F. Shahidi (ed.), p. 279. Woodhead Publishing Limited, cambridge.
Shyni K., Hema G.S, Ninan G., Mathew S., Joshy c. and Lakshmanan P. 2014. Isolation and characterization of gelatin from the skins of skipjack tuna (Katsuwonus pe-lamis), dog shark (Scoliodon sorrakowah), and rohu (La-beo rohita). Food Hydrocolloids 39: 68.
Silva r.S., bandeira S.F. and Pinto L.A. 2014. characteristics and chemical composition of skins gelatin from cobia (Ra-chycentron canadum). LWt-Food Sci. technol. 57: 580.
Sinthusamran S., benjakul S. and Kishimura H. 2014. char-acteristics and gel properties of gelatin from skin of sea-bass (Lates calcarifer) as influenced by extraction condi-tions. Food chem. 152: 276.
Steel r.G.D. and torrie J.H. 1980. Principles and proce-dures of statistics: A biometrical approach 2nd ed. New york, McGraw-Hill.
uriarte-Montoya M.H., Santacruz-ortega H., cinco-Moroy-oqui F.J., rouzaud-Sández o., Plascencia-Jatomea M. and ezquerra-brauer J.M. 2011. Giant squid skin gela-tin: chemical composition and biophysical characteriza-tion. Food res. Int. 44: 3243.
Weber P., Steinhart H. and Paschke A. 2009. competitive in-direct eLISA for the determination of parvalbumins from various fish species in food grade fish gelatins and isin-glass with PArV-19 anti-parvalbumin antibodies. J. Ag-ric. Food chem. 57: 11328.
yang H. and Wang y. 2009. effects of concentration on na-nostructural images and physical properties of gelatin from channel catfish skins. Food Hydrocolloids 23: 577.
yang H., Wang y., zhou P. and regenstein J.M. 2008. ef-fects of alkaline and acid pretreatment on the physical properties and nanostructures of the gelatin from chan-nel catfish skins. Food Hydrocolloids 22: 1541.
Paper Received September 17, 2014 Accepted November 7, 2014
PaPer
Ital. J. Food Sci., vol. 27 - 2015 375
- Keywords: fruit, grape must, health, juice, sensory analysis -
EFFECT OF THE ADDITION OF FRUIT JUICESON gRAPE MUST
FOR NATURAL bEvERAgE PRODUCTION
L. CHIUSANO1,2 *, M. C. CRAvERO1, D. bORSA1, C. TSOLAKIS1, g. ZEPPA2 and v. gERbI2
1CREA Consiglio per la ricerca in agricoltura e l’analisi dell’economia agrariaCentro di Ricerca per l’Enologia, Via Pietro Micca 35, 14100 Asti, Italia
2Università degli Studi di Torino, Dipartimento di Scienze Agrarie, Forestali e Alimentari, L.go P. Braccini 2, 10095 Grugliasco, Torino, Italy
*Corresponding author: Tel. + 39 0141 433814, Fax + 39 0141 436829, e-mail: [email protected]
AbStrAct
the consumer attention for products with healthy properties is increased in time, and fruit juic-es, for their ease of consumption, can satisfy this demand providing them bioactive compounds. the grape juice has numerous health benefits demonstrated by several studies such as, among other, the antioxidant activities and the positive functions of their phenolic compounds. this work is aimed at blending grape and others fruits in a new fruit juice made only with natural ingredi-ents of local production. the grape juice (cv barbera) has substituted water and its percentage was fixed (70%). It was mixed with apple (cv Golden delicious), pear (cv Williams) and peach (cv red Haven) juices to obtain 25 different prototypes. In each of these at least two fruit juices were present and added in a percentage variable from 0 to 25%, with a step of 5%. the objectives of this study were to check the feasibility of the mixing process and the evaluation of the samples overall pleasantness.
other sensory aspects of samples were also evaluated by consumers with a JAr (just-about-right) structured scale. the results didn’t reveal particular technological problems regarding the blending process. the brix mean value of the samples was about 15.3, with a significant reduc-tion compared to that of the grape juice (about 19). the pH mean value of the samples (3.44) was significantly higher than that of the grape juice (3.36). the titrable acidity and the antioxidant ca-pacity mean value of the samples was, namely, 6.22 g L-1 and 535.18 mg L-1. the penalty analy-sis of the liking test pointed out the importance of the persistence in mouth. the overall pleasant-ness was significantly (p≤0,01) positively correlated with the °brix/acid ratio (r=0.54) and sam-ples with the highest percentage of pear juice were generally preferred.
376 Ital. J. Food Sci., vol. 27 - 2015
INtroDuctIoN
Fruit consumption has a positive impact on health (o’NeIL et al., 2011) and, including also vegetables, five are their daily servings (FSA, 2010), though this advice is generally ignored (WoottoN-beArD and ryAN, 2011). In this re-gard, the “Dietary Guidelines for Americans” consider the 100% fruit juice as alternative to whole fruit (uSDA, 2010). Indeed, fruit juic-es in general are deemed as one of the main sources of bioactive compounds for diet (roD-ríGuez-roque et al., 2014). even if the link between weight and sweetened beverages, in-cluding fruit juice 100%, must to be taken into account, referring to these latters, there is no consistent association (o’NeIL et al., 2011) and, actually, these have demonstrated to improve nutrient adequacy among children and adoles-cents of 2-18-year-olds (o’NeIL et al., 2012). Also grape has proved to have numerous health benefits, such as antioxidant activity and the functions of flavonoid compounds (VISLocKy and FerNANDez, 2010; WoottoN-beArD and ryAN, 2011). Grape-based products may pre-vent cardiovascular deseases, decrease oxida-tive stress and protect against atherosclero-sis. results from animal models suggest that especially purple grape juice more effective-ly improves blood lipids (VISLocKy and Fer-NANDez, 2010). From a organoleptic and sen-sory perspective, grape juice is characterised by a high concentration of sugars and acids, a low pH and, generally, a very poor odour/aroma. thus, grape juice has a high-energy value, which reduces the nutritional, while its high acidity and low odour/aroma intensi-ty can reduce consumer preference. oJeDA et al. (2009) highlighted the too high sugar con-tent of the pure grape juice and, for this rea-son, it is important to reach a right sugar/ac-ids balance to develop appreciable grape juice. to reach this result it is necessary to use the optimal grape variety and/or mixing it with other fruit. the blending, indeed helps to im-prove flavour, taste, and nutritive value and it reduces the cost of production, improves stor-ability and inhibits microbial growth (bHArD-WAJ and PANDey, 2011). As reported by bAteS and MorrIS (2001), the reasons for producing blends are many and all attributable to ad-just and improve acceptability. the aim of this work was to develop an innovative concept of fruit juice obtained by mixing grape with oth-er fruit juices to reduce its sugar concentra-tion, acidity and to improve its olfactory pro-file. the tested fruit juices (peach, pear and ap-ple) were chosen based on their appreciation by consumers, low acidity and sugar content, high antioxidant activity and high odour/aro-ma intensity. the use of grape must would also help to reduce the wine surplus that, current-ly, amounts to, approximately, 30 million hec-
tolitres world wide (rAMoS et al., 2012; AyL-WArD, 2012).
MAterIALS AND MetHoDS
Juice production
the grape juice (cv barbera) was provided by terre dei Santi (castelnuovo Don bosco, Asti, Italy), while the other fruit juices were provided by Valter Valle Farm (San Damiano d’Asti, Asti, Italy). the apple, pear and peach juices were ob-tained from the Golden delicious, Williams and red Haven cultivars, respectively. For juice pro-duction, fruits were directly pressed, and the juice was filtered and stored at +1°c until use. because the aim of this study was to develop a new grape-based juice, the percentage of grape juice was fixed (70%) and the other fruit juices were added in percentages from 0 to 25%, with a step of 5% (table 1).
table 1 - experimental plan of blending.
Sample code Barbera juice (%) Fruit juices (%)
Pear Peach Apple
S-1 70 0 5 25S-2 70 0 10 20S-3 70 0 15 15S-4 70 0 20 10S-5 70 0 25 5S-6 70 5 0 25S-7 70 5 5 20S-8 70 5 10 15S-9 70 5 15 10S-10 70 5 20 5S-11 70 5 25 0S-12 70 10 0 20S-13 70 10 5 15S-14 70 10 10 10S-15 70 10 15 5S-16 70 10 20 0S-17 70 15 0 15S-18 70 15 5 10S-19 70 15 10 5S-20 70 15 15 0S-21 70 20 0 10S-22 70 20 5 5S-23 70 20 10 0S-24 70 25 0 5S-25 70 25 5 0
this ratio was defined taking into account that, generally, in a fruit juice, the fruit/wa-ter ratio is approximately 35:65 (FÜGeL et al., 2005) and in this study water was replaced by grape juice. because for each beverage at least two fruit juices must be present, a total of 25 mixed juices were obtained. the proto-types were then bottled, pasteurised (105°c, 25 min) and stored at ambient temperature.

Ital. J. Food Sci., vol. 27 - 2015 377
three replicates for each of the 25 recipes are been prepared.
Reagents
Folin-ciocalteu reagent, sodium hydroxide, glucose, fructose, phosphoric acid, methanol, sulphuric acid, caesium chloride, tartaric, mal-ic and citric acids were purchased from Sigma-Aldrich (Milano, Italy). ultrapure water was ob-tained from a Milli-q gradient A10 instrument (Millipore corporation, billerica, uSA).
Analyses
Density, extract, pH, sulphur dioxide, titrable acidity, total sugars, glucose, fructose, ashes and potassium of grape must were determined in accordance with the commission regula-tion (eec) No. 2676/90 of 17 September 1990, while tartaric, malic and citric acids were de-termined by HPLc (cANe, 1990). the polyphe-nolic composition of the grape must and fruit juices (total polyphenols, anthocyanin and fla-vonoid contents) was determined by spectro-photometry (DI SteFANo et al., 1989). the glu-cose, fructose, total sugars, ashes, titrable acidity, pH, tartaric acid, malic acid, citric acid and potassium of the fruit juices and beverag-es were determined in accordance with Italian Standard Methods (DM 03/02/1989). the fruit juice antioxidant capacity, expressed as Vita-min-c equivalent Amount or VeAc Index, was determined according to KIM et al. (2002). the colour was measured using a Konica Minolta spectrophotometer cM-5 (Minolta corp, osa-ka, Japan) in the cIeLab colour system with a D65 illuminant. the parameters measured were L* (whiteness or brightness/darkness), a* (redness/greenness) and b* (yellowness/blue-ness). each sample was evaluated in a 40-mL cuvette (1-cm thickness). All evaluations were performed in triplicate.
Liking test
As reported by MAMMASSe and ScHLIcH (2014), literature recommend a range from 50 to 100 consumers in hedonic tests and gener-ally no replication are needed. taking into ac-count this and the limited quantity of samples, the liking test was executed once by recruiting 50 consumers (22 males and 28 females, aged 26-65 years).
they have received an invitation and volun-tarily have participated to the tests. All tests were conducted individually, and social interac-tion was not permitted. the test was performed inside an air-conditioned meeting room with white light. the temperature was approximately 21 °c, and the relative humidity was approxi-mately 50%. tests were performed from 11 a.m. over 5 days. For each session, five experimental
beverage samples (approximately 30 mL each) were presented in a completely randomised and balanced order. the samples were offered to the consumers in coded plastic cups. Natural bottled water was provided to each participant for palate cleansing. to decrease fatigue, there was a 5 minutes break between each sample. During each break, the consumers rinsed their mouths with water. All beverages were evalu-ated for specific parameters by consumers on a Just-about-right (JAr) structured scale, and then the consumers were asked to express the overall pleasantness of each product.
For JAr evaluation, consumers rated the samples on a 5-point JAr scale (1 = much too low, 2 = a little too low, 3 = just about right-JAr, 4 = a little too much, and 5 = much too much) for five sensory parameters: colour, odour, aro-ma, sweet taste and persistence in the mouth. For the overall pleasantness evaluation, a seg-ment of known length (100 mm), limited to the extremes of two adjectives of opposite mean-ing (bipolar scale) was used. consumers were asked to mark the line that corresponded to their degree of overall pleasantness. the data were collected on a paper card. According to PAGèS et al. (2014), the 5 JAr variables were reduced to 3 for data evaluation: “not enough” (by grouping the “much too low” and “a little too low” responses), “JAr” and “too much” (by grouping the “much too much” and “a little too much” responses). this grouping of variables leads to simpler analyses, and it allows for ob-taining more stable results because non-JAr categories are associated with higher frequen-cies (PAGèS et al., 2014).
Statistical analysis
compositional data and overall pleasantness were examined by one-way analysis of variance (ANoVA) with tukey’s test (p≤0.05) as a multiple range test with XLStAt 2011 (Addinsoft SArL, california, uSA) and then used for a Principal component Analysis, also performed with XL-StAt 2011 (Addinsoft SArL, california, uSA). the °brix/acid ratio and the overall pleasant-ness were subjected to Pearson’s test (r). the JAr data were subjected to a penalty analysis with XLStAt-MX 2014.2.07 (Addinsoft SArL, california, uSA).
reSuLtS AND DIScuSSIoN
Compositional aspects
the compositions of grape and fruit juices used for beverage production are reported in ta-ble 2, while the composition of the obtained bev-erages are reported in tables 3 and 4.
As highlighted by MorALeS-De LA PeNA et al. (2010), the overall quality of a fruit juice

378 Ital. J. Food Sci., vol. 27 - 2015
is evaluated by a few parameters such as sol-uble solids, pH and acidity. the grape juice displayed a total soluble solids content of 19 °brix with approximately 170 g L-1 of sugars, while the peach, apple and pear juices exhibit-ed 11.5, 11.0 and 13.5 °brix, respectively. the mean value of °brix for new beverages was ap-proximately 15.3, with a significant reduction with respect to grape juice, approximately 19. the obtained value is similar to that of a fruit juice (GuNAtHILAKe et al., 2014) and ideal for the formulation of nutraceutical food beverages (SArAVANAN and ArADHyA, 2011a). the content of fructose in apple juice (approximately 62 g L-1) was higher than that reported by Wu et al. (2007) but lower than that reported by WILL et al. (2008) and MArKoWSKI et al. (2009). Addi-tionally, the fructose content of pear juice (ap-proximately 75 g L-1) was higher than that re-ported by coLArIc et al. (2006). Acidity is one of the most important quality parameters for fruit juices (bHArDWAJ and PANDey, 2011), as confirmed by AL bIttAr et al. (2013), who in-cluded this factor in the sensory analysis of an innovative grape juice enriched in polyphe-nols. Nevertheless, LIu et al. (2006) highlight-ed that: “high acidity has a negative influence on the palatability of table grapes, as well as the suitability for wines”. the value of the total acidity, expressed as tartaric acid, of the grape juice used in this study (6.26 g L-1) is compa-rable to that reported for juices made with dif-ferent grape cultivars (MArSeLLéS-FoNtANet et al., 2013; LIu et al., 2006; Soyer et al., 2003). the main organic acid in grape is tartaric acid, which has a pK1 of 3.04, followed by malic acid, which has a pK1 of 3.40 (LIu et al., 2006). the
table 2 - composition of grape and fruit juices used for beverages production. Data are expressed as mean ± SD.
Fruit juices Grape juice
Pear Peach Apple
Glucose (g L-1) 19.08±0.2 39.78±0.2 20.41±0.2 Glucose (g L-1) 86.94 ±0.2Fructose (g L-1) 75.43±0.4 41.59±0.5 61.94±0.2 Fructose (g L-1) 94.82 ±0.09Ashes (g Kg-1) 2.6±0.03 4.3±0.02 2.7±0.02 Ashes (g L-1) 3.4 ±0.1Potassium (mg Kg-1) 1720±0.2 3542±6 1540±0.4 Potassium (mg Kg-1) 1223±5°Brix 13.5±0.4 11.5±0.3 11±0.2 °Brix 19±0.3Total Acidity (g L-1) 4.3±0.2 4.85±0.3 4.13±0.1 Total Acidity (g L-1) 6.26±0.04pH 3.73±0.03 3.79±0.01 3.76±0.01 pH 3.36±0.05Tartaric acid (g L-1) 0.281±0.01 0.233±0.02 0.26±0.03 Tartaric acid (g L-1) 2.73±0.02Malic acid (g L-1) 0.312±0.03 0.892±0.02 1.028±0.01 Malic acid (g L-1) 2.35±0.03Citric acid (g L-1) 0.588±0.03 0.788±0.04 nd Citric acid (g L-1) 0.1 ±0.01Polyphenols (mg Kg-1) 126.7±5 81.9±4 96.5±4 Polyphenols (mg L-1) 446 ±6 Density (g L-1) 1.07715 ±0.0004 Extract (g L-1) 206.6±0.4 Free Sulphur Dioxide (mg L-1) nd Total Sulphur Dioxide (mg L-1) 11.2±0.4 Anthocyanins (mg L-1) 228 ±1.74
(nd – not determined).
grape juice had a tartaric acid content of 2.73 g L-1, similar to juice reported by LIu et al. (2006). the pH value also plays an important role in the preparation of beverages (bHArDWAJ and PAN-Dey, 2011). the blending process here studied is aimed to increase the pH value of grape must (3.36). our obtained results indicated that the addition of fruit juice with pH values of 3.79 (peach), 3.76 (apple) and 3.73 (pear) increased the pH of grape juice so that it reached a mean value of 3.44 in the prepared beverages. In his research on the properties of fruit juices used for functional beverages, GuNAtHILAKe et al. (2014) reported a pH of 3.60 for apple juice, while ANDréS et al. (2014) in their evaluation of the bioactive compounds in non-fermented beverages highlighted that the pH ranged be-tween 3.20 and 4.01, in agreement with SAAre-LA et al. (2011). typically, the pH values of fruit juices are below 4, or even 3, depending on the fruits used. the amount of organic acids in the fruit juices depended on the cultivar: apple dis-played the highest amount of malic acid, with a content of 1.028 g L-1, while pear juice had the highest citric acid content (0.588 g L-1). AGuI-LAr-roSAS et al. (2007) reported a malic acid content below 0.35 g L-1 for the same cultivar, whereas buroN-MoLeS et al. (2014) reported a malic acid content of 1.4 g L-1. For beverag-es, the most abundant organic acid was malic acid, with a mean content of 2.84 g L-1, while the mean tartaric acid amount in these samples was 2.39 g L-1. For this compound, the concen-tration was similar among all of the beverages because the same quantity of grape must was used and because the quantity of tartaric acid is very low for fruit juice. the highest values were

Ital. J. Food Sci., vol. 27 - 2015 379
table
3 -
com
pos
itio
n o
f sa
mple
s ob
tain
ed b
y m
ixin
g gr
ape
juic
e an
d fru
it ju
ices
of pea
r, p
each
an
d a
pple
an
d r
esu
lts
of A
nov
a w
ith
tu
key
’s t
est.
Data
are
exp
ress
ed a
s m
ean
± S
D.
For
sam
ple
s co
de
see
table
1. Valu
es in
each
col
um
n h
avi
ng
dif
fere
nt
lett
ers
are
sig
nifi
can
tly
dif
fere
nt
at
p<0.0
5.
Sam
ple c
ode
Extra
ct
°Brix
Gl
ucos
e Fr
ucto
se
Acid
ity
pH
Or
gani
c acid
s (g
L-1)
As
hes
Pota
ssiu
m
°Brix
/
(g L
-1)
(g
L-1)
(g L
-1)
(g L
-1)
(g kg
-1)
(mg
kg-1)
acid
ratio
ta
rtaric
m
alic
citric
S-1
167.8
5±0.
21
15.7
5±0.
35 b
66
.19±0
.01 d
ef
80.3
±0.7
1 cd
6.
00±0
.00
j 3.
44±0
.01 fg
h 2.
52±0
.00
ab
3.45
±0.0
0 ab
0.
55±0
.03
cdef
g 2.
6±0.
01 b
c 12
43±1
.68
bcde
fg
26.2
5S-
2 17
7.90±
0.00
17
.00±
0.00
a
71.4
0±1.4
1 ab
cd
85.10
±1.5
6 bc
6.
15±0
.00
h 3.
45±0
.01 cd
efg
2.51
±0.0
0 ab
3.
32±0
.09
ab
0.73
±0.0
2 de
fg
2.7±
0.02
bc
1298
±4.15
abc
def
27.6
4S-
3 18
1.80±
0.00
17
.00±
0.00
a
75.5
3±0.
62 a
b 87
.44±
0.55
ab
6.49
± 0.
06 e
f 3.
43±0
.01gh
i 2.
69±0
.03
ab
3.54
±0.0
5 a
0.94
±0.0
4 ab
cde
2.8±
0.01
bc
1385
±9.7
2 ab
c 26
.19S-
4 18
3.10
±0.0
0 17
.00±
0.00
a
76.18
±0.8
1 a
85.9
5±0.
78 a
bc
6.75
±0.0
0 c
3.45
±0.0
0 de
fg
2.76
±0.3
4 a
3.60
±0.2
6 a
1.32±
0.30
ab
3.1±
0.01
abc
14
24±2
.64
ab
25.19
S-5
181.4
5±0.
21
17.2
0±0.
00 a
75
.47±
0.18
ab
83.01
±0.0
9 bc
6.
94±0
.00
b 3.
44±0
.01 fg
h 2.
66±0
.18 a
b 3.
47±0
.20
ab
0.28
±0.0
2 fg
3.
2±0.
01 a
b 14
64±2
.51
a 24
.78
S-6
176.
25±0
.21
16.8
0±0.
00 a
68
.45±
0.64
cde
85.7
8±0.
82 b
c 7.2
0±0.
00 a
3.
43±0
.00
ghi
2.47
±0.01
ab
3.22
±0.0
2 ab
c 0.
18±0
.00
g
2.6±
0.01
c 11
61±5
.66
cdef
g 23
.33
S-7
174.
30±0
.00
16.8
0±0.
00 a
70
.39±
1.42
bcd
85.0
2±1.5
6 bc
6.
45±0
.00
f 3.
45±0
.01 d
efg
2.51
±0.0
4 ab
3.
21±0
.06
abc
0.20
±0.0
2 g
2.7±
0.01
bc
1233
±0.6
9 bc
defg
26
.05
S-8
178.
05±0
.21
16.9
0±0.
14 a
73
.62±
3.69
abc
87
.18±2
.48
ab
6.60
±0.0
0 d
3.45
±0.01
def
g 2.
37±0
.18 a
b 3.
18±0
.01 a
bcd
0.22
±0.0
3 g
3.2±
0.00
ab
1275
±0.6
5 ab
cdef
25
.61
S-9
180.
50±0
.00
16.8
±0.0
0 a
73.3
3±1.8
2 ab
c 86
.15±0
.62
ab
6.51
±0.0
3 e
3.43
±0.01
ghi
2.64
±0.0
5 ab
3.
30±0
.07
ab
1.18±
0.00
ab
3.1±
0.01
abc
13
04±0
.16 a
bcde
f 25
.81
S-10
18
1.70±
0.14
17
.00±
0.00
a
75.7
0±0.
82 a
b 86
.54±
0.41
ab
6.64
±0.0
0 d
3.40
±0.0
0 j
2.47
±0.13
ab
3.22
±0.01
abc
0.
27±0
.03
fg
3.2±
0.03
ab
1370
±3.0
8 ab
cd
25.6
0S-
11
182.
10±2
.23
17.0
0±0.
00 a
76
.33±
1.14
a 84
.12±1
.20
bc
6.75
±0.0
0 c
3.40
±0.0
0 j
2.60
±0.0
0 ab
3.
09±0
.09
abcd
e 0.
21±0
.00
g 3.
5±0.
01 a
13
28±5
.83
abcd
e 25
.19S-
12
148.
60±0
.00
14.6
5±0.
21 c
51.4
6±0.
10 g
75
.87±
0.57
de
5.55
± 0.
00 o
3.
39±0
.00
j 2.
30±0
.04
ab
2.87
±0.0
4 bc
def
0.35
±0.2
7 ef
g 2.
6±0.
01 c
1059
±9.9
2 g
26.4
0S-
13
134.
00±0
.00
13.10
±0.14
e
45.2
1±0.
16 h
i 68
.31±
0.29
fg
5.70
± 0.
00 m
3.
48±0
.01 a
bc
2.21
±0.0
4 ab
2.
60±0
.06
cdef
g 0.
79±0
.14 b
cdef
g 2.
6±0.
01 c
1156
±9.7
2 ef
g 22
.98
S-14
13
2.90
±0.0
0 13
.00±
0.00
e
45.6
8±0.
25 h
i 66
.86±
0.44
g
5.63
±0.0
0 n
3.50
±0.0
0 a
2.38
±0.0
9 ab
2.
65±0
.08
cdef
g 0.
93±0
.07
abcd
e 2.
8±0.
01 b
c 11
57±1
.59
efg
23.0
9S-
15
136.
00±0
.00
13.10
±0.14
e
48.3
3±0.
66 g
hi 67
.92±
0.91
fg
5.93
±0.0
0 k
3.48
±0.01
abc
2.
33±0
.04
ab
2.62
±0.0
7 cd
efg
1.14±
0.06
abc
3±
0.00
abc
12
22±3
.08
bcde
fg
22.0
9S-
16
138.
50±0
.14
13.2
0±0.
00 e
50
.76±0
.04
gh
68.9
2±1.0
2 fg
6.
00±0
.00
j 3.
48±0
.00
ab
2.29
±0.0
3 ab
2.
59±0
.03
cdef
g 1.5
1±0.
20 a
3.
1±0.
01 a
bc
1245
±3.9
4 bc
defg
22
.00
S-17
13
4.60
±0.14
13
.20±
0.00
e
44.5
1±0.
35 i
70.6
3±0.
42 e
fg
5.55
±0.0
0 o
3.46
±0.0
0 bc
def
2.27
±0.0
2 ab
2.
66±0
.13 d
efg
0.72
±0.0
3 bc
defg
2.
6±0.
03 b
c 11
18±1
.57
efg
23.7
8S-
18
135.
9±0.
14
13.2
0±0.
00 e
45
.69±
0.09
hi
69.9
0±0.
37 fg
5.
55±0
.00
o 3.
47±0
.00
bcd
2.19
±0.0
2 ab
2.
38±0
.01 fg
0.
85±0
.04
bcd
ef
2.6±
0.03
bc
1121
±0.4
9 ef
g 23
.78
S-19
13
8.75
±0.2
1 13
.30±
0.14
e
46.9
8±0.
12 g
hi 69
.41±
0.31
fg
6.08
±0.0
0 i
3.47
±0.01
bcd
e 2.
11±0
.12 a
b 2.
25±0
.13 g
1.0
0±0.
02 a
bc
2.9±
0.01
abc
11
71±3
.66
defg
21
.88
S-20
13
9.55
±0.2
1 13
.20±
0.00
e
47.2
65±0
.32
ghi
67.7
7±0.
11 fg
6.
08±0
.00
i 3.
46±
0.00
bcd
ef
2.02
±0.2
9 b
2.08
±0.3
6 g
1.06±
0.10
abc
3±
0.01
abc
12
01±3
.64
cdef
g 21
.71
S-21
14
1.10±
0.0
0 13
.80±
0.00
d
45.3
8±0.
10 h
i 72
.92±
0.30
ef
5.78
±0.0
0 l
3.44
±0.0
0 ef
gh
2.04
±0.18
b
2.08
±0.18
g
0.76
±0.2
1 bc
defg
2.
7±0.
03 b
c 10
98±1
.96
fg
23.8
8S-
22
168.
20±0
.00
15.8
0±0.
00 b
60
.86±
1.21
f 82
.54±
1.05
bc
6.15
±0.0
0 h
3.44
±0.0
0 ef
gh
2.33
±0.0
4 ab
2.
51±0
.09
efg
0.72
±0.0
4 bc
defg
2.
8±0.
01 b
c 11
22±1
0.78
efg
25
.69
S-23
16
9.80
±0.0
0 15
.80±
0.00
b
62.9
7±0.
71 e
f 82
.58±
0.52
bc
6.3±
0.00
g
3.42
±0.01
hij
2.40
±0.0
0 ab
2.
49±0
.10 e
fg
1.19±
0.05
ab
3±0.
01 a
bc
1242
±2.3
9 bc
defg
25
.08
S-24
17
2.25
±0.2
1 16
.10±
0.14
b
62.6
4±0.
49 f
85.6
5±0.
63 b
c 6.
30±0
.00
g 3.
44±0
.00
efgh
2.
37±0
.03
ab
2.41
±0.0
2 fg
1.1
2±0.
17 a
bc
3±0.
01 a
bc
1195
±0.9
9 cd
efg
25.5
6S-
25
176.
50±0
.14
17.0
0±0.
00 a
70
.34±
4.38
bcd
91
.74±5
.41
a 6.
49±0
.00
ef
3.41
±0.01
ij 2.
32±0
.08
ab
2.35
±0.0
6 fg
0.
21±0
.05
g 2.
9±0.
02 a
bc
1251
±8.6
8 ab
cdef
g 26
.19
found for beverages S-3 and S-4, which contained higher quantities of apple juice. the brix/acid ratio (table 3) is an important parameter usual-ly used to control fruit quali-ty. In this study a positive cor-relation (r = 0.54, p≤0.01.) re-sulted between it and the over-all pleasantness in accordance with JAyASeNA AND cAMer-oN (2007). these authors re-ported that the °brix/acid ra-tio compared with the °brix alone demonstrated a higher degree of association with the consumer acceptability and it appeared a very useful matu-rity indicator. the peach juice exhibited the highest potassi-um content. this characteris-tic determined an increase in the content of this important component in the beverages containing high percentages of peach, e.g., sample S-5. the lowest value was determined for sample S-12, which was obtained without peach juice. the total polyphenols content ranged between 265.5 mg L-1 for beverage S-5 and 407 mg L-1 for beverage S-24, with a mean value of 359.30 mg L-1. According to the total poly-phenol contents of fruit juic-es, higher values were exhib-ited by beverages with high percentages of pear juice. the same beverage also displayed some of the highest values for the flavonoid content (627.5 mg L-1 , the highest) and an-tioxidant capacity (585 mg L-1 , the second highest one). For this parameter, the result for S-24 was similar to that of beverage S-1 (593 mg L-1). the lowest value for the anti-oxidant capacity (464.41 mg L-1) was displayed by beverage S-5. these results highlight-ed that the most interesting findings were obtained with a high quantity of apple or pear juice in the beverage, while a high content of peach juice led to a reduction of this param-eter. the ANoVA and tukey’s test performed for each pa-rameter of the beverages dis-played high variability among all samples and strictly corre-

380 Ital. J. Food Sci., vol. 27 - 2015
table 4 - Polyphenol composition (PHeN - total polyphenols; tAI - anthocyanins; tFI - flavonoids; VceAc - antioxidant ca-pacity) and cIeLab values of samples obtained by mixing grape juice and fruit juices of pear, peach and apple and results of ANoVA analysis with tukey’s test. Data are expressed as mean ± SD. For sample code see table 1. Values in each column having different letters are significantly different at p<0.05.
Sample PHEN TAI TFI VCEAC L*(D65) a*(D65) b*(D65)code (mg L-1) (mg L-1) (mg L-1) (mg L-1)
S-1 384.5±4.95 cd 84±1.41 abc 540.5±44.55 cdefgh 593.83±10.40 a 68.14±2.86 ab 32.18±0.46 11.20±0.43S-2 389.5±2.12 bcd 84.5±2.12 abc 478±4.24 ghijkl 578.38±1.04 ab 64.75±0 .01 b 33.9±0.10 11.675±0.15S-3 366±1.41 efg 82±2.82 abcd 407.5±20.51 l 526.17±4.16 abcd 66.28±0.45 ab 33.56±0.19 11.36±0.26S-4 362±0.7 gh 82.5±1.06 abc 497±4.95 fghijk 468.09±20.28 cd 66.63±0.19 ab 32.72±0.51 10.52±0.27S-5 265.5±6.36 o 80±0.00 abcde 447±2.83 ijkl 464.41±10.40 d 66.65±1.98 ab 34.84±1.72 11.23±0.30S-6 402.5±4.95 ab 88.5± 0.71 a 612.5±0.71 abc 534.26±48.87 abcd 64.89±0.25 b 32.94±0.40 11.31±0.28S-7 405.5±3.54 a 88±0.00 ab 576±1.41 abcd 476.91±7.28 cd 64.13±0.93 b 32.75±0.07 10.89±0.01S-8 385.5±2.12 cd 80.5±0.71 abcde 546.5±7.78 bcdefg 492.35±47.83 bcd 63.85±1.52 b 33.52±2.33 10.97±1.19S-9 380.5±2.12 de 81.5±0.71 abcd 545±5.66 cdefg 530.59±29.12 abcd 65.63±1.25 ab 33.85±0.76 11.46±0.59S-10 362.5±2.12 fgh 80.5±0.71 abcde 517±1.41 defghi 480.59±10.40 cd 66.21±3.21 ab 34.4±2.77 11.25±1.00S-11 338.5±4.95 ijk 79.5±0.71 abcde 490.5±.71 fghijk 537.94±18.72 abcd 67.96±2.23 ab 33.8±1.33 10.9±0.72S-12 377±1.41 def 82±0.00 abcd 581±1.41 abcd 577.65±0.00 ab 66.62±0.40 ab 33.49±1.94 9.45±0 .47S-13 334±0.00 jkl 67.5±0.71 gh 515.5±4.95 defghi 551.18±0.00 abcd 67.5±2.21 ab 31.66±0.46 9.81±0.01S-14 325±4.24 klm 63.5±2.12 h 493.5±4.95 fghijk 510±2.08 abcd 68.51±1.62 ab 32.66±1.77 10.04±0.04S-15 314.5±0.71 mn 68.5±2.12 gh 430±15.56 kl 506.32±11.44 abcd 70.09±0.14 ab 30.79±1.81 9.77±0.95S-16 309.5±0.71 n 65.5±0 .71 gh 436±9.90 jkl 510.74±15.60 abcd 74.03±4.72 a 31.21±1.16 9.26±1.27S-17 350±4.24 hi 72±1.41 efgh 552.5±6.36 bcdef 583.53±12.48 a 66.6±0.62 ab 32.86±1.14 11.09±0.09S-18 342±1.42 ij 69.5±2.12 fgh 514±2.83 defghi 551.17±33.28 abcd 68±2.18 ab 33.46±1.28 10.93±0.60S-19 333±1.14 jkl 67±0.00 gh 503±0.00 efghij 540.88±6.24 abcd 69.48±1.60 ab 32.71±1.05 10.76±0.69S-20 321±1.41 lmn 64.5±2.12 gh 469±8.49 hijkl 551.18±29.12 abcd 67.82±2.71 ab 33.63±2.10 9.95±0.09S-21 365±4.24 fg 68±0.00 gh 571±1.41 abcde 546.76±12.48 abcd 67.49±0.49 ab 32.6±1.43 10.56±1.41S-22 395.5±0.71 abc 80±7.07 abcde 618±49.5 ab 576.91±7.28 ab 63.95±1.63 b 34.42±0.86 11.88±0.30S-23 376±2.83 defg 73±1.41 defg 556±0.00 abcdef 548.24±0.00 abcd 70.73±5.76 ab 32.09±1.22 10.05±1.86S-24 407±7.07 a 78±1.41 cdef 627.5±4.95 a 585±37.43 a 65.57±1.23 ab 32.27±0.23 11.68±0.23S-25 390.5±7.78 bcd 79±5.66 bcde 576±46.67 abcd 556.32±1.04 abcd 66.51±0.28 ab 32.82±0.91 10.89±0.59
lated with the composition of each single fruit juice and the different percentages used for bev-erage production. In fact, there were no differ-ences between the beverages for the cIeLab pa-rameters a* and b* only, and this is due to the high grape must percentage used.
Sensory aspects
concerning the overall pleasantness, the ANo-VA highlighted significant differences among the 25 experimental beverages (table 5).
even if the content of grape juice was kept constant in all of the beverages at 70%, the dif-ferent percentages of other fruit juices can in-fluence the acceptability. the most appreciated samples (S-22, S-24 and S-23) had the highest pear juice percentages, while the least appre-ciated (S-14, S-12, S-1 and S-16) had the low-est pear juice concentrations. the least appre-ciated was beverage S-14, which was obtained with a mix of apple, pear and peach juices at the same percentage (10%). Penalty analysis was used because with this test it is possi-ble to identify the sensory attributes that have the largest influence on consumer liking and provides directions for product reformulation (AreS et al., 2014) and also allows one to de-termine if a specific product attribute is “just about right” (tAyLor, 2013). Penalty analysis combines JAr variables and overall liking tests
to find correlations between a decrease in con-sumer acceptance and attributes not at the JAr level. this analysis, based on multiple compar-isons, is aimed to identify and determine if the rankings on the JAr scale are related to sig-nificantly different results in the liking scores for each sensory attribute studied on the JAr scale. this can be achieved by evaluating the mean decrease in overall liking versus percent-age of not-JAr variables (i.e., the low percentage of not-JAr evaluation determines a low mean decrease in overall liking). When some not-JAr categories receive at least 20% (Pareto princi-ple) responses for an attribute, this becomes a candidate for penalty analysis. Penalty analy-sis uses the 20% cut-off theory on the percent-age of not-JAr consumers based on the Pareto principle (i.e., the Pareto principle recognises that “80% of effects occur from 20% of causes” or the 80-20 rule) and signifies several common occurrences in everyday phenomena. therefore, the 20% cut-off is used as a general rule for pen-alty analysis (NArAyANAN et al., 2014). In Fig. 1 are reported the JAr scores for each param-eter used in the beverage evaluation.
the colour was judged “just right” by 50% of the consumers, odour by 37%, aroma by 38% and persistence in the mouth by 39%. In gen-eral, the “JAr” value was chosen by a high-er number of assessors: the higher frequen-cy was highlighted by the “a little too low” val-

Ital. J. Food Sci., vol. 27 - 2015 381
table 5 - Mean values of overall pleasantness and results of ANoVA and tuckey’s test. Data are expressed as the mean ±SD. Values with different letters are significantly different at p<0.05.
Sample code Fruit juices Overall Tuckey test pleasantness (p< 0.05) pear (%) peach (%) apple (%)
S-22 20 5 5 56.98 aS-24 25 0 5 55.3 abS-23 20 10 0 55.14 abS-8 5 10 15 54.18 abcS-9 5 15 10 54.08 abcS-2 0 10 20 54.04 abcS-25 25 5 0 53.07 abcdS-5 0 25 5 53.36 abcdeS-11 5 25 0 52.36 abcdefS-3 0 15 15 50.82 abcdefgS-4 0 20 10 50.56 abcdefgS-6 5 0 25 50.54 abcdefgS-7 5 5 20 49.72 abcdefgS-10 5 20 5 48.9 abcdefgS-21 20 0 10 48.38 abcdefgS-15 10 15 5 46.36 abcdefghS-20 15 15 0 45.7 bcdefghS-17 15 0 15 43.8 cdefghS-18 15 5 10 42.9 defghS-19 15 10 5 42.68 efghS-13 10 5 15 42.6 efghS-16 10 20 0 42.46 fghS-1 0 5 25 41.96 fghS-12 10 0 20 40.86 ghS-14 10 10 10 36.36 h
Fig. 1 - Distribution of JAr scores for each sensory attribute evaluated.
ue for only the odour. Fig. 1 also demonstrates that the “much too much” and “much too low”, although they may affect the overall pleasant-ness, do not weigh significantly on it because of their low frequency in the responses of con-
sumers. the variables can then be grouped into two main groups with “a little too much” or “a little too low”. the first group corresponds to “much too much”, while the second corre-sponds to “not enough” for the parameters of

382 Ital. J. Food Sci., vol. 27 - 2015
colour, aroma, sweet taste and persistence in the mouth. In Fig. 2 are displayed the distribu-tion of frequency and then their effect on the mean drop in overall pleasantness.
Sweet taste, aroma and persistence in mouth exhibited a higher effect on the overall pleasant-ness if classified as “not enough”. Also impor-tant for determining the overall pleasantness was the odour, if classified as “not enough”.
Fig. 2 - Penalty analysis from JAr data. Not-JAr data with a frequency <20% of total re-sponses are not considered signif-icant.
When the sensory parameters were classified as “too much”, they had less impact on the over-all pleasantness. A principal component analy-sis was also performed to highlight the correla-tion between chemical-physical parameters and overall pleasantness. the first two components explained 72.82% of the variance (Fig. 3).
the first component explained 50.74% of the variance and was mainly correlated with the to-
Fig. 3 - Distri-bution on plane
defined by the first two compo-nents of chemi-cal-physical pa-rameters, over-
all pleasantness and beverage
samples.

Ital. J. Food Sci., vol. 27 - 2015 383
tal soluble solids, glucose and fructose contents, which corresponded to 12.1, 11.8 and 11.2%, respectively, of the total variance explained by this axis. the second component that explained 22.08% of the total variance is associated with the flavonoids, total polyphenols and antiox-idant capacity, accounting for 20.7, 16.7 and 13.5%, respectively, of the total variance ex-plained by this axis. the overall pleasantness was positively correlated with the contents of the total soluble solids and fructose and nega-tively correlated with the pH, citric acid content and L*. because the overall pleasantness is lo-cated in the upper right graph quadrant, all of the beverages placed in the same quadrant are the most appreciated. In particular, the highest appreciation was found for the S-22, S-24 and S-23 samples, as also demonstrated by table 5. the less appreciated samples are on the lower left side of the graph. they can be grouped into two groups: S-16, S-15, S-14, S-20 and S-19 in the lower left quadrant of the PcA graph and S-13, S-18, S-17, S-21 and S-12 in the upper left quadrant. the first group exhibited a more transparent colour, with a high value for L* and higher pH and citric acid contents. the second group demonstrated a low overall pleasantness but a high antioxidant capacity. In this group, it must be highlighted that beverage S-14, with the same percentages of fruit juice (10-10-10), had the lowest appreciation and the highest pH.
coNcLuSIoNS
one of the first internationally accepted de-scriptions of functional food has been provided by DIPLocK et al. (1999) according to which: “a food product can be considered functional if together with the basic nutritional impact it has beneficial effects on one or more functions of the human or-ganism...”. taking this into account, and also of the scientific evidence regarding the benefits of the products based on grapes to human health, the re-sults obtained in this study have shown that these experimental fruit juices have functional charac-teristics. Additionally, as reported by bHArDWAJ and PANDey (2011), it may be concluded that the formulation of mixed beverages can satisfy con-sumer tastes and preferences. In particular, the overall pleasantness results indicate a tenden-cy of consumers to prefer samples with the high-est percentage of pear juice, followed by samples containing mixtures of peach and apple juices.
AcKNoWLeDGeMeNtS
this study was funded by regione Piemonte through the “regional operational Programme” - regional competi-tiveness and employment – F.e.S.r. 2007/2013. the au-thors thank all of the consumers and the technical opera-tor, Mrs. Maria rosa Lottero - crA-eNo, for her collabora-tion in the liking test.
reFereNceS
Aguilar-rosas S.F., ballinas-casarrubias M.L., Nevarez-Moorillon G.V., Martin-belloso o. and ortega-rivas e. 2007. thermal and pulsed electric fields pasteurization of apple juice: effects on physicochemical properties and flavour compounds. J. Food eng. 83: 41.
Al bittar S., Périno-Issartier S., Dangles o. and chemat F. 2013. An innovative grape juice enriched in polyphenols by microwave-assisted extraction. Food chem. 141: 3268.
Andrés V., Villanueva M.J., Mateos-Aparicio I. and teno-rio M.D. 2014. colour, bioactive compounds and antiox-idant capacity of mixed beverages based on fruit juices with milk or soya. J. Food Nutr. res. 1 (53): 71.
Ares G., Dauber c., Fernández e., Giménez A. and Varela P. 2014. Penalty analysis based on cAtA questions to iden-tify drivers of liking and directions for product reformu-lation. Food qual. Prefer. 32: 65.
Aylward D. 2012. Demarcation: a dynamic methodology for quality grading within the Australian wine industry. Int. J. qual. Innov. 2:18.
bates r.P. and Morris J.r. 2001. Juices and beverages blends. ch. 9. In: “Principles and practices of small and medium scale fruit juice processing”. bates r.P., cran-dall P.G. and Morris J.r.. (ed. FAo), p. 95-100. FAo Ag-ricultural Services bulletin - rome.
bhardwaj r.L. and Pandey S. 2011. Juice blends—A way of utilization of under-utilized fruits, vegetables, and spic-es: a review. crit. rev. Food Sci. 51: 563.
buron-Moles G., torres r., Amoako-Andoh F., Vinas I., teix-idó N., usall J., Keulemans W. and Davey M.W. 2014. Analysis of changes in protein abundance after wounding in ‘Golden Delicious’ apples. Postharvest biol. tec. 87: 51.
cane P. 1990. Il controllo della qualità dei vini mediante HPLc: determinazione degli acidi organici. enotecni-co 26: 67.
colaric M., Stampar F., Solar A. and Hudina M. 2006. Influence of branch bending on sugar, organic acid and phenolic content in fruits of ‘Williams’ pears (Pyrus com-munis L.). J. Sci. Food Agr. 86: 2463.
commission regulation (eec) No. 2676/90 of 17 Septem-ber 1990 determining community methods for the anal-ysis of wines.
D.M. 03/02/89 - Approvazione dei metodi ufficiali di anali-si per le conserve vegetali - parte generale.
Di Stefano r., cravero M.c. and Gentilini N. 1989. Meto-di per lo studio dei polifenoli dei vini. enotecnico 25: 83.
Diplock A.t., Aggett P.J., Ashwel M., bornet F., Fern e.b. and roberfroid M.b. 1999. Scientific concepts of func-tional foods in europe: consensus Document – brit. J. Nutr. 81 S1-S27. Supplement Number 1.
Food Standard Agency. 2010. eatwell: 8 tips for making healthier choices. Available from:http://www.food.gov.uk/multimedia/pdfs/publication/eatwell0708.pdf. Ac-cessed 2014 August 8.
Fügel r., carle r. and Schieber A. 2005. quality and au-thenticity control of fruit purees, fruit preparations and jams—a review. trends Food Sci. tech. 16: 433.
Gunathilake K.D.P.P., yu L.J. and Vasantha rupasinghe H.P. 2014. reverse osmosis as a potential technique to improve antioxidant properties of fruit juices used for functional beverages. Food chem. 148: 335.
Kim D.o., Ki W.L., Lee H.J., Lee c.y. 2002. Vitamin c equiv-alent Antioxidant capacity (VeAc) of phenolic phytochem-icals. J. Agric. Food chem. 50: 3713.
Jayasena V. and cameron I. 2007. °brix/Acid ratio as a predictor of consumer acceptability of crimson seedless table grapes. J. Food quality. 31: 736.
Liu H.F., Wu b.H., Fan P.G., Li S.H. and Li L.S. 2006. Sugar and acid concentrations in 98 grape cultivars analyzed by principal component analysis J. Sci. Food Agric. 86: 1526.
Mammasse N., Schlich P. 2014. Adequate number of con-sumers in a liking test. Insights from resampling in sev-en studies. Food qual. Prefer. 31: 124.
Markowski J., baron A., Mieszczakowska M. and Płocharski

384 Ital. J. Food Sci., vol. 27 - 2015
W. 2009. chemical composition of French and Polish cloudy apple juices. J. Hortic. Sci. biotech. ISAFruIt, Special Issue: 68.
Marsellés-Fontanet Á.r., Puig-Pujol A., olmos P., Mínguez-Sanz S. and Martín-belloso o. 2013. A comparison of the effects of pulsed electric field and thermal treatments on grape juice. Food bioprocess technol. 6: 978.
Morales-de la Peña M., Salvia-trujillo L., rojas-Graű M.A. and Martìn-belloso o. 2010. Impact of high intensity pulsed electric field on antioxidant properties and quali-ty parameters of a fruit juice–soymilk beverage in chilled storage. Food Sci. technol.-Leb. 43: 872.
Narayanan P., chinnasamy b., Jin L. and clark S. 2014. use of just-about-right scales and penalty analysis to de-termine appropriate concentrations of stevia sweeteners for vanilla yogurt. J. Dairy Sci. 97: 3262.
ojeda H., escudier J.L., Albagnac G., Sivry A. and Guyot P. 2009. Diversification des produits de la vigne: création d’une filière « Jus de raisin ». revue des Œnologues 30.
o’Neil c.e. and Nicklas t.A. 2012. Fruit juice consumption is associated with improved nutrient adequacy in chil-dren and adolescents: the National Health and Nutri-tion examination Survey (NHANeS) 2003-2006. Public Health Nutr. 15: 1871.
o’Neil c.e., Nicklas t.A., zanovec M. and Fulgoni V.L. III. 2011. Diet quality is positively associated with 100% fruit juice consumption in children and adults in the unit-ed States: NHANeS 2003-2006. Nutr. J. Available from: http://www.nutritionj.com/content/10/1/17.
Pagès J., berthelo S., brossier M. and Gourret D. 2014. Sta-tistical penalty analysis. Food qual. Prefer. 32: 16.
ramos V., ramalho P., Vivas c. and Sousa A. 2012. Global competitive dynamics and innovation in the brazilian wine sector: an analysis of Vale do São Francisco pole. con-ference Proceedings of 35th World congress of Vine and Wine; Izmir, turkey, 18 - 22 June 2012. Paris, France: the International organization of Vine and Wine (oIV).
rodríguez-roque M.J., rojas-Graü M.A., elez-Martínez P., Martín-belloso o. 2014. In vitro bioaccessibility of health-related compounds as affected by the formulation of fruit juice- and milk-based beverages. Food res. Int. 62: 771.
Saarela M., Alakomi H.L., Mättö J., Ahonen A.M., Puhakka A. and tynkkynen S. 2011. Improving the storage sta-bility of Bifidobacterium breve in low pH fruit juice. Int. J. Food Microbiol. 149: 106.
Saravanan K. and Aradhya S.M. 2011a. Potential nutraceu-tical food beverage with antioxidant properties from ba-nana plant bio-waste (Pseudostem and rhizome). Food Funct. 2: 603.
Soyer y., Koca N. and Karadeniz F. 2003. organic acid profile of turkish white grapes and grape juices. J. Food com-pos. Anal. 16: 629.
taylor K.b.S. 2013. evaluation of flavor variation in Swiss cheese from five factories using selected ion flow tube mass spectrometry (sift-ms), descriptive sensory anal-ysis, and consumer testing. thesis. Graduate Program in Food Science and Nutrition. the ohio State universi-ty. columbus.
u.S. Department of Agriculture, u.S. Department of Health and Human Services. 2010. Dietary Guidelines for Amer-icans, 2010. 7th edition, Washington, Dc: u.S. Govern-ment. Printing office, December 2010.
Vislocky L.M. and Fernandez M.L. 2010. biomedical effects of grape products. Nutr. rev. 68: 656.
Will F., roth M., olk M., Ludwig M. and Dietrich H. 2008. Processing and analytical characterization of pulp-en-riched cloudy apple juices. Food Sci. technol.-Leb. 41: 2057.
Wootton-beard P.c. and ryan L. 2011. Improving public health?: the role of antioxidant-rich fruit and vegetable beverages. Food res. Int. 44: 3135.
Wu J., Gao H., zhao L., Liao X., chen F., Wang z. and Hu X. 2007. chemical compositional characterization of some apple cultivars. Food chem. 103: 88.
Paper received September 11, 2014 Accepted November 18, 2014

PaPer
Ital. J. Food Sci., vol. 27 - 2015 385
- Keywords: kiwi, kiwi puree powder, freeze drying, maltodextrin, vitamin C -
FREEZE DRyINg OF KIWI (actinidia deLiciosa) PUREE AND THE POWDER PROPERTIES
güLŞAH ÇALIŞKAN, KADRIyE ERgüN* and S. NUR DIRIMDepartment of Food Engineering, Ege University, Bornova, 35100, Izmir, Turkey
*Corresponding author: [email protected]
AbStrAct
In this study, it was intended to investigate the production of freeze dried kiwi (Actinidia delici-osa) puree in the form of powder that can be used as a natural alternative to synthetic additives used in food products such as pudding, instant tea, and sauces for improving their flavour. In or-der to obtain the powder product, kiwi puree as plain and with maltodextrin (Dextrose equivalence of 10-12, as 10 % by weight) addition were freeze dried. Drying behaviour of plain kiwi puree and kiwi puree with MD were explained by Logarithmic model (r2=0.994, rMSe=0.024, χ2=0.0008) and Wang and Singh model (r2=0.999, rMSe=0.012, χ2=0.0002), respectively. the effective moisture diffusivity (Deff) value was calculated as 7.3x10⁻¹⁰ m2/s and it was observed that it was not affect-ed by the addition of MD. the vitamin c content of fresh kiwi fruit was evaluated as 66.3 mg/100 g kiwi and there was a loss of 17.1% for plain and 19.8% for MD containing powders respective-ly after freeze drying. It was also observed that, the addition of maltodextrin decreased cohesive-ness, on the other hand, increased bulk and tapped densities, average time values for wettability and solubility, and glass transition temperature of the powder products.

386 Ital. J. Food Sci., vol. 27 - 2015
INtroDuctIoN
Kiwi fruit contains high amounts of vitamins (vitamin c (100-400 mg vitamin c/100 g), A, b2, and e), minerals (calcium, iron, copper, phos-phorus, magnesium, and potassium), carote-noids (beta carotene, lutein, and xanthophyll), phenolic compounds (flavonoids and anthocya-nins) and antioxidant compounds (cASSANo et al., 2006). Kiwi fruit is being processed to ob-tain juice, frozen food, wine, jam, marmalade, and canned and dried slices. Drying might be a suitable technique to prolong the shelf life of kiwi, which is susceptible for microbial spoil-age and softening due to its high moisture con-tent. Fruit juices, purees and powders are be-ing marketed due to an increased demand for ready-to-eat foods. In addition, powder products, with a long-term ambient shelf life and micro-biological stability can reduce the transporta-tion, and storage costs as well (JINAPoNG et al., 2008). thus, alternatives to conventional pro-cessing technologies are being explored to pro-duce better quality products. Due to high con-tent of vitamin c, it is essential to protect vita-min c during drying of kiwi (KAyA et al., 2010). Freeze drying is an important process for the protection of sensitive compounds such as vi-tamin c, phenolic compounds, biological activ-ity, appearance, color, texture, aroma, and nu-tritional values of foods which compensates its high operating costs for drying of foods (zeA et al., 2013; WANG et al., 2006). In addition, Fer-NANDeS et al. (2011) reported that for producing whole fruit powder, drying fruits at low temper-ature and reduced pressure with low amounts of carrier is apparently the best alternate. be-cause, there exist some difficulties for drying of food extracts, juices, and purees because of the stickiness problems resulted by low glass tran-sition temperatures of their components such as sugars and organic acids. In order to prevent problems in drying and obtaining powder prod-ucts with acceptable properties, the drying aids that have high tg is to be used. the use of dry-ing agents such as gum arabic, maltodextrin, whey protein, sucrose etc. improves the drying process, and leads to an effective drying (NA-DeeM et al., 2011).
Numerous studies were carried out with freeze drying of foods which contain sensitive com-pounds such as carrot (LIN et al., 1998), pump-kin (que et al., 2008), kiwi (erGÜN, 2012) mango (SHoFIAN et al., 2011) pineapple (Marques et al., 2011), papaya (SHoFIAN et al., 2011; MArqueS et al., 2011) and guava (WANG et al., 2006). Sev-eral researchers studied on drying of kiwi fruits such as convective, microwave, vacuum mi-crowave, and freeze drying (KAyA et al., 2010; erGÜN, 2012; DoyMAz et al., 2009; KIrANouDIS et al., 1997) methods.
Describing dehydration kinetics is important in the design and optimisation of drying process-
es (SIMAL et al., 2005). thin layer drying models, generally means to dry as one layer of sample which provide uniform temperature assumption and suitable for lumped parameter models, are important in mathematical modelling of drying. Although, models depend on the process condi-tions, they are practical and provide sufficiently good results (erbAy and IcIer, 2009). the prop-erties of food powders such as bulk density, hy-groscopicity, degree of caking, dispersibility, wet-tability, solubility, particle size, and size distri-bution are useful for design, and control of pro-cessing, handling, storage operations, and prod-uct quality control. Properties of powder prod-ucts are usually studied in two groups such as particle properties (particle size, shape, distribu-tion, density and morphological properties), and bulk properties (bulk density, wettability, solu-bility, porosity, cohesiveness, and flowability).
In this study it was intended to investigate the production of freeze dried kiwi (Actinidia de-liciosa) puree in the form of powder that can be used as a natural alternative to synthetic addi-tive used in food products such as pudding, in-stant tea, and sauces for improving their flavour. Also, an alternative product with the advantages of high nutritional value, long durability, easi-ness for usage in dry mixture formulations, be-ing portable easily, and a healthier food additive for the consumers consumption will be obtained. In addition to the mentioned purposes: it was also aimed to determine the drying behaviour of kiwi puree (pure and with 10% MD) during freeze drying and the effect of maltodextrin ad-dition and the properties of the powder product.
MAterIAL AND MetHoDS
the fresh kiwi fruits were obtained from a local supermarket in Izmir, turkey. they were peeled and grounded into puree by using a home type blender (tefal Smart, Mb450141, turkey). In or-der to obtain the puree with maltodextrin addi-tion, maltodextrin (MD) with Dextrose equiva-lence (De) value of 10-12 (AS chemical Indus-try and commerce Limited company, turkey) was added directly to puree in suitable amounts (10% by weight).
Freeze drying
the freeze drying experiments were performed in a pilot scale freeze dryer (Armfield, Ft 33 Vac-uum Freeze Drier, england). Prior to drying kiwi puree was frozen in a layer of 3 mm in the petri dishes at - 40ºc in an air blast freezer (Frigos-candia, Helsinborg, Sweden) for two hours, then freeze dried under vacuum (13.33 Pa ab-solute pressure), at - 48ºc condenser tempera-ture. the temperature of the heating plate was set to 30ºc, which was constant during the dry-ing process. the powder was obtained by grind-

Ital. J. Food Sci., vol. 27 - 2015 387
ing the dried material, obtained as pellets of di-ameter of petri size, in a blender (tefal Smart, Mb450141, turkey), and powder was stored in glass jars in the dark at 20±1ºc until further tests were carried out.
Physical and chemical analyses
the moisture content of kiwi puree and freeze dried kiwi puree powders (KPP) were determined according to AoAc (2000). For this process, each experiment for increasing time periods was car-ried out with new samples of equal mass, and moisture loss was determined gravimetrically by using a digital balance with 0.01 precision (ohaus Ar2140, uSA). Moisture ratio was cal-culated according to equation (1).
(1)
Where the Mt, M0 and Me are the moisture con-tent at any time, initial, and equilibrium mois-ture content (kg water/ kg dry matter), respective-ly. Drying data was fitted to ten well-known thin layer drying models (Lewis, Page, Modified Page I, Henderson and Pabis, Logarithmic (Asymptot-ic), Midilli, Modified Midilli, two-term, two-term exponential, and Wang and Singh) (erbAy and IcIer, 2009). Nonlinear regression analysis was used to evaluate the parameters of the selected model by using statistical software SPSS 16.0 (SPSS Inc., uSA). the goodness of fit was deter-mined using the coefficient of determination (r2), root mean square error (rMSe), and the reduced chi-square (χ2) that can be described by the equa-tions given by erbAy and IcIer, 2009.
Where Mrexp,i and Mrpre,i is the experimental, and predicted moisture ratio at observation i; N is number of the experimental data points, and n is number of constants in model.
the effective moisture diffusivity (Deff) of freeze dried kiwi slices were calculated by Fick’s diffu-sion model (eq. 2).
(2)
Where t is the time (s), Deff is the effective dif-fusivity (m2/s) and L is the thickness of sam-ples (m). For long drying times, a limiting case of eq. (3) is obtained, and expressed in a loga-rithmic form;
(3)
the effective diffusivity was calculated by plot-ting experimental moisture ratio in logarithmic form versus drying time. From eq.(3), a plot of ln Mr versus drying time gives a straight line with a slope of:
(4)
Water activity was measured by using testo-AG 400, Germany, water activity measurement device. the pH values of kiwi puree and the pow-ders were measured using a pH meter (Inolab WtW pH 720, Germany) directly and after dis-solving the powder in deionised water (1 g/1 g) respectively.
the color values (L*, a*, and b* values) of fresh kiwi fruits, and the powders were measured with Minolta cr-400 colorimeter, Japan, calibrated with white standard plate three times and results as the average of three measurements were ex-pressed in accordance with the cIe Lab. System. the L* value, is a measure of lightness which ranges between 0 and 100. Increases in a* val-ue in positive, and negative scales correspond to increases in red or green color, respectively. the b* value represents color ranging from yel-low (+) to blue (-).
the vitamin c content of fresh kiwi fruits was determined according to HIşIL (2007). Freeze dried powders were rehydrated to the initial moisture content prior to the analysis. the in-dication principle of vitamin c value is based on extraction with 10% oxalic acid afterwards adding of 2,6-dichlorophenolindophenol solu-tion. the absorbance was measured at 518 nm by a Varian cary 50 uV/Vis spectrophotometer.
Glass transition temperature
Glass transition temperature of the powder samples was determined by a Differential Scan-ning calorimeter (tA Instruments, q10, uSA) equipped with a thermal analysis station. An empty sealed aluminum pan was used as a ref-erence in each test. Nitrogen gas at a flow rate of 50 ml/min was used as the purge gas to avoid water condensation around the samples. About ten milligrams of kiwi sample was sealed in alu-minum pans and cooled from room temperature to -40°c at 10°c/min for formation of glassy state in kiwi sample and equilibrated for 10 min. the heating rate was 10°c/min and the temper-ature range varied between -40 and 120°c, de-pending on sample moisture content. DSc ther-mograms, presenting the heat flow (W/g) and temperature relationship were used to analyze the thermal transitions in samples during heat-ing and cooling. tA Instruments universal anal-ysis software was used to analyze the onset, mid and end points of the glass transition. the glass transition temperature (tg) was calculated as the average of the onset and end point values.
Thermo gravimetric analysis
thermo Gravimetric Analysis (tGA) was car-ried out by Perkin elmer Diamond tG/DtA (canada) under nitrogen flow. the assay con-

388 Ital. J. Food Sci., vol. 27 - 2015
ditions were as follows: isotherm at 30 °c and heating from 30.00°c to 1000.00°c at 10.00°c/min. Five milligrams of equilibrated samples was introduced into the apparatus and the measure-ments were plotted during the heating.
Scanning electron microscope (SEM)
the morphology of the powder samples, pre-pared by placing the powders on aluminium stubs using a double-sided adhesive tape and then coating with gold, were examined with a scanning electron microscope (SeM- Phillips XL-30S FeG, eindhoven, Netherlands) operating at 5kV accelerating voltage.
Analysis of the powder properties
For the determination of bulk density, the method explained by JINAPoNG et al. (2008) was used. the average wettability and solubili-ty times of freeze dried kiwi puree powders were determined by using the method explained by GoNG et al. (2008) and GouLA and ADAMoPou-LoS (2008), respectively. Flowability and cohe-siveness values of the powders were evaluat-ed in terms of carr index (cI) and Hausner ra-tio (Hr), respectively. both cI and Hr were cal-culated from the bulk (ρbulk), and tapped (ρtapped) densities of the powder as shown below eqs. (5) and (6), respectively.
(5)
(6)
Statistical analysis
Data were analyzed by using statistical soft-ware SPSS 16.0 (SPSS Inc., uSA). the data were subjected to analysis of variance (ANoVA), and Duncan’s multiple range test (α=0.05) to deter-mine the difference between means. the drying experiments were replicated twice and all the analyses were triplicated.
reSuLtS AND DIScuSSIoN
Results of physical and chemical analyses
Kiwi is harvested through a long season. How-ever, due to its high moisture content, storage period and its direct use in food compositions are limited and this makes necessary the drying to obtain pure, minimally processed, decreased in volume and easy to use form of the kiwi. the results of the experimental study showed that, it was possible to dry the fresh kiwi puree un-der the freeze drying condition. In order to im-prove the drying process, to see the effect of
maltodextrin addition and to obtain a more sta-ble powder, maltodextrin was used as a drying aid. the amount of MD to be used to prevent quality losses during drying and to obtain pow-der which has almost the same properties with fresh kiwi was determined by the preliminary tests. For this purpose, MD with amounts of 5, 10, 15, and 20% of the puree weight were add-ed to the fresh kiwi puree. the addition of MD as 5% of the puree weight was not suitable since there was no decrease in the drying time of kiwi puree. For the MD amounts being more than 10 %, the powders lost their quality character-istics such as specific color, vitamin c content etc. Similar results were observed by queK et al. (2007). It was reported that after addition of the 10% MD watermelon powders lost their red-orange color. therefore, as a result of the prelim-inary tests, the concentration of MD in the pu-ree necessary for successful drying and powder production was determined as %10 of the puree weight. zeA et al. (2013) reported that powder obtained by freeze drying of guava and pitaya pulp was found to be very hygroscopic and diffi-cult to compact. In order to minimize this prob-lem the researchers added 10% maltodextrin to guava and pitaya mash.
the drying behaviour of the freeze drying pro-cess was determined from the mass loss in sam-ples of known initial moisture content. For the drying process, the total drying time was deter-mined to be nine and ten hours respectively for the samples of kiwi puree, and kiwi puree with maltodextrin until getting constant weight of the samples. Similar results were obtained by MArqueS and FreIre (2005) in their freeze drying study on pulps of tropical fruits as ten to thirteen hours.
the average values of the experimental results of the analysis applied on fresh kiwi puree and freeze dried powders are given in table 1. the initial moisture content of kiwi puree was found to be as 81.19 % (wet basis, wb), and this result was consistent with KAyA et al. (2010) (81% wb). the final moisture content of kiwi powder is 9.55 % (wb) after removal of 88.24% of water. For the sample with MD, 94.31% of water was removed where the initial dry matter content of the sample was higher than the plain sample due to malto-dextrin addition and the amount of water to be removed at the same drying time decreased. the residual moisture in the powder decreased, and the moisture content of the sample with MD was found to be 56% lower than the plain sample, and this differences between samples was found to be statistically significant (P<0.05).
the moisture ratio were calculated by us-ing the determined moisture content values and the data were fitted to ten thin layer dry-ing models (Lewis, Page, Modified Page I, Hen-derson and Pabis, Logarithmic, Midilli, Modified Midilli, two-term, two-term exponential, and Wang and Singh). the coefficient of correlation
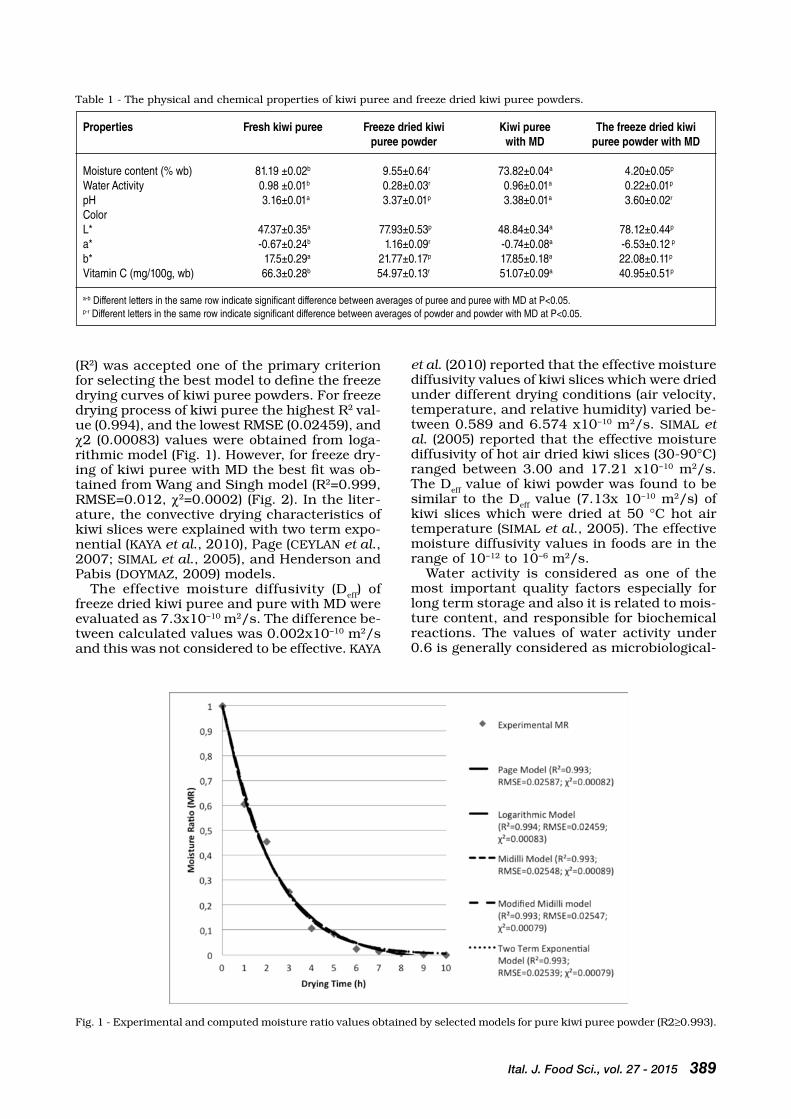
Ital. J. Food Sci., vol. 27 - 2015 389
table 1 - the physical and chemical properties of kiwi puree and freeze dried kiwi puree powders.
Properties Fresh kiwi puree Freeze dried kiwi Kiwi puree The freeze dried kiwi puree powder with MD puree powder with MD
Moisture content (% wb) 81.19 ±0.02b 9.55±0.64r 73.82±0.04a 4.20±0.05p
Water Activity 0.98 ±0.01b 0.28±0.03r 0.96±0.01a 0.22±0.01p
pH 3.16±0.01a 3.37±0.01p 3.38±0.01a 3.60±0.02r
ColorL* 47.37±0.35a 77.93±0.53p 48.84±0.34a 78.12±0.44p
a* -0.67±0.24b 1.16±0.09r -0.74±0.08a -6.53±0.12 p
b* 17.5±0.29a 21.77±0.17p 17.85±0.18a 22.08±0.11p
Vitamin C (mg/100g, wb) 66.3±0.28b 54.97±0.13r 51.07±0.09a 40.95±0.51p
a-b Different letters in the same row indicate significant difference between averages of puree and puree with MD at P<0.05.p-r Different letters in the same row indicate significant difference between averages of powder and powder with MD at P<0.05.
(r2) was accepted one of the primary criterion for selecting the best model to define the freeze drying curves of kiwi puree powders. For freeze drying process of kiwi puree the highest r2 val-ue (0.994), and the lowest rMSe (0.02459), and χ2 (0.00083) values were obtained from loga-rithmic model (Fig. 1). However, for freeze dry-ing of kiwi puree with MD the best fit was ob-tained from Wang and Singh model (r2=0.999, rMSe=0.012, χ2=0.0002) (Fig. 2). In the liter-ature, the convective drying characteristics of kiwi slices were explained with two term expo-nential (KAyA et al., 2010), Page (ceyLAN et al., 2007; SIMAL et al., 2005), and Henderson and Pabis (DoyMAz, 2009) models.
the effective moisture diffusivity (Deff) of freeze dried kiwi puree and pure with MD were evaluated as 7.3x10⁻¹⁰ m2/s. the difference be-tween calculated values was 0.002x10⁻¹⁰ m2/s and this was not considered to be effective. KAyA
et al. (2010) reported that the effective moisture diffusivity values of kiwi slices which were dried under different drying conditions (air velocity, temperature, and relative humidity) varied be-tween 0.589 and 6.574 x10⁻¹⁰ m2/s. SIMAL et al. (2005) reported that the effective moisture diffusivity of hot air dried kiwi slices (30-90°c) ranged between 3.00 and 17.21 x10⁻¹⁰ m2/s. the Deff value of kiwi powder was found to be similar to the Deff value (7.13x 10⁻¹⁰ m2/s) of kiwi slices which were dried at 50 °c hot air temperature (SIMAL et al., 2005). the effective moisture diffusivity values in foods are in the range of 10−12 to 10−6 m2/s.
Water activity is considered as one of the most important quality factors especially for long term storage and also it is related to mois-ture content, and responsible for biochemical reactions. the values of water activity under 0.6 is generally considered as microbiological-
Fig. 1 - experimental and computed moisture ratio values obtained by selected models for pure kiwi puree powder (r2≥0.993).

390 Ital. J. Food Sci., vol. 27 - 2015
ly stable (queK, 2007) and between 0.20, and 0.40 ensure the stability of the product against browning, and hydrolitical reactions, lipid oxi-dation, auto-oxidation, and enzymatic activity (AMrqueS et al., 2007). the water activity val-ues of freeze dried kiwi puree powders (plain powder and powder with MD) were found to be as 0.287, and 0.225, respectively. In literature water activity values around 0.28 was also ex-pressed for freeze dried guava and pitaya pow-ders with 10% MD (zeA et al., 2013). Drying process and addition of MD showed the signifi-cant effects on the water activity of freeze dried kiwi puree powders (P<0.05).
the pH value of kiwi puree was measured as 3.16. SouFLeroSA et al. (2001) reported that the pH value of kiwi ranges between 3 and 4, due to the content of including the acids such as gluconic, galacturonic, oxalic, succinic, fumar-ic, oxcaloacetic, and p-coumaric acids. HArDer et al. (2009) and ArroquI et al. (2004) meas-ured the pH value of kiwi nectar and puree as 3.50 and 3.41, respectively. the pH values of powders (kiwi puree powder and powder with MD) were found to be as 3.37 and 3.60, respec-tively. results showed that the drying process and addition of MD caused a significant in-crease in the pH value of powders (P<0.05). the increase in the pH values was found as 6.65% and 6.51% for plain and MD containing pow-ders, respectively. this increase was compara-ble with the increase in 3.64% in freeze drying of guava concentrate MAHeNDrAN (2010) and the reason for the increase can be explained with the loss of some acidic compounds dur-ing drying.
color of the dried products is an import-ant quality factor, which reflects the senso-ry attractiveness, and the quality of the pow-
ders (queK et al., 2007). thus, the color of the processed products should ideally remain unchanged after production. the color values (L*, a* and b*) of kiwi puree were measured as 47.37, -0.67, and 17.5 respectively. these values are quite different than the measure-ments of ANcoS (1999) reporting the color val-ues (L*, a*, and b*) of kiwi puree 36.01, -12.35 and 23.03, respectively and this shows the dif-ferences between the cultivars and the stor-age time after harvest. the variation of color values for plain and MD containing samples depending on the drying time were shown in Figs. 3 and 4, respectively. As shown in Fig. 3, the L*, b* and a* values of freeze dried kiwi puree powder increased throughout the drying period and reached the final values as 77.93, 1.16, and 21.77, respectively. cHoPDA and bArrett (2001) reported that the increase in L* (brightness), a* (redness) and b* (yellow-ness) values following production of guava pu-ree powder was most likely a result of non-en-zymatic browning during freeze drying which produced a darker product. the addition of MD in freeze drying, increased the L* (78.12), and b* (22.08) values, but decreased a* val-ue (-6.53) (table 1). results showed that, dry-ing process increased the brightness values of samples (P<0.05); addition of MD caused su-perior bright color but it was not found to be statistically significant (P>0.05). the same ef-fect was also observed for yellow-blue (b*) val-ue. Nevertheless, both drying process, and ad-dition of MD showed a significant effect on the green-red (a*) value of the samples (P<0.05).
For the determination of vitamin c, freeze dried powders were rehydrated to the initial moisture content prior to the analysis to obtain comparable results. the vitamin c content of kiwi was found
Fig. 2 - experimental and computed moisture ratio values obtained by selected models for kiwi puree powder with MD (r2≥0.994).

Ital. J. Food Sci., vol. 27 - 2015 391
Fig. 3 - the variation of color values of plain samples depending on the drying time.
to be as 66.3±0.28 mg/ 100 g (wb) kiwi. the freeze drying process caused a significant (17.1%) de-crease on the vitamin c content of kiwi powder (P<0.05). the vitamin c loss during drying is sim-ilar to losses of 18.8% (MAHeNDrAN, 2010) and 16% (MArqueS et al. 2006) during freeze drying of some other fruit concentrate and pulps. Also, the addition of MD caused an insignificant loss in the vitamin c content (19.82%) (P>0.05). this decrease may occur due to the dilution effect. exposure to heat, light, oxygen and metals may also lead to vitamin c losses. LIN et al. (1998) did not observed significant loss of Vitamin c in freeze-dried carrots. the vitamin c losses can be due to not only the freeze drying, but also by the operations before drying such as cutting, slicing and freezing. therefore, grinding process, prepa-
Fig. 4 - the variation of the color values of samples with MD depending on the drying time.
ration of maltodextrin and kiwi puree blend may cause more vitamin c losses for the kiwi puree. MArqueS et al. (2011) reported that the vita-min c losses for freeze dried fruits are consider-ably smaller when compared the vitamin c loss-es caused to others drying methods due to the low temperatures, and to the use of vacuum in the process.
Glass transition temperature
In order to have safety storage, and stability of powders, the powders should be kept below glass transition temperature (tg). So the tg val-ue of kiwi powders was determined. Kiwi pow-der exhibited well defined tg (average -18°c) rep-resented by an endothermic change in the base

392 Ital. J. Food Sci., vol. 27 - 2015
line (Fig. 5). Moisture content and water activi-ty are the main factors affecting tg of materials. However, in the consideration of food materials with similar moisture content and water activi-ty values, the high acid and sugar content may decrease the tg value. the increases in tg val-ues of kiwi puree powders with carriers possi-bly due to the addition of carriers, and the low-er moisture content of carrier-incorporated pow-ders. tg of kiwi puree powders with MD (tg aver-age -5°c) was found to be higher (Fig. 6). SILVA et al. (2006) reported that, addition of 30% MD (w/w, De20) increased tg of freeze dried camu-
Fig. 5 - DSc thermogram for freeze dried kiwi puree powders.
camu pulp from -58.8°c to -40.1°c for the mois-ture content values between 0.2 to 0.5 (g dry sol-id/ g sample). After this value, tg increased rap-idly with decreasing moisture content. In their study, MoSquerA et al. (2010) observed an in-crease in tg with the addition of MD and this increase was slightly more where MD with low De was used.
Thermo gravimetric analysis
the results of the analysis of the samples of kiwi puree powders by tGA are shown in
Fig. 6 - DSc thermogram for freeze dried kiwi puree powders with MD.

Ital. J. Food Sci., vol. 27 - 2015 393
the Figs. 7 and 8. these spectra determine the changes of weight in relation to change of tem-perature that the samples experiment when exposed to heating from room temperature to 1000°c. tGA spectra showed that the loss of matter began around 50°c for both samples but the kinetics of thermal decomposition is differ-
Fig. 7 - the variation of the weight of freeze dried kiwi puree powder with respect to time.
ent for them. At 100°c, the sample with 10% MD lost around 6.5% of its own weight, but the sample that was dried without MD lost around 8.5% of its own weight. their components were considerably stable until 150°c because the loss of matter is not significant. However, between 100 and 220°c, reactions such as Maillard’s
Fig. 8 - the variation of the weight of freeze dried kiwi puree powder with MD with respect to time.

394 Ital. J. Food Sci., vol. 27 - 2015
reaction or the condensation between phenolic acids and proteins may occur. As of 150°c, the loss of matter is significant, and the phenome-na are exothermic for all samples.
Scanning Electron Microscope (SEM)
Selected images from the SeM microstructure analysis of the freeze dried kiwi puree powders were shown in Fig. 9 (a and b). the microstruc-tures of freeze-dried kiwi powder had a skele-tal-like structure with void spaces previously oc-cupied by ice prior to freeze drying. this is be-cause the absence of liquid phase in the mate-rial during freeze drying process suppressed the transfer of liquid water to the surface and the ice was converted to vapor without passing the liquid state (KroKIDA and MArouLIS, 1997). Mi-crographs revealed that powder particles of all
Fig. 9 - Scanning electron micrographs of freeze dried plain (a) and MD containing (b) kiwi puree powder at 500x magnification.
powders were irregular in shape. Irregular shape of powder particles may due to the fibrous and porous nature of the kiwi fruit powders since powder was prepared from whole fruits (zeA et al., 2013).
Powder properties
the powder properties of freeze dried kiwi pu-ree powders are given in table 2. the tapped and bulk densities of freeze dried kiwi puree pow-der were found to be as 0.257 and 0.161 g/ml, and the addition of MD significantly increased the tapped and bulk densities of powder (0.416 and 0.316 g/ml) (P<0.05). MArqueS et al. (2006) reported that, apparent density of the studied pulps has presented a linear relationship with moisture content where the apparent densities of fruit pulps decreased linearly with moisture
table 2 - the powder properties of freeze dried kiwi puree powders.
Powder Properties Freeze dried kiwi puree powder Freeze dried kiwi puree powder with MD
Tapped Density (g/mL) 0.26±0.01a 0.42±0.02b
Bulk Density (g/mL) 0.16±0.01a 0.32±0.01b
Solubility (s) 26±3a 290 ±48b
Wettability (s) 78.5±2a 186 ±0.71b
Flowability (CI) 38±3b (Bad) 24.04±2.87a (Fair)Cohesiveness (HR) 1.60±0.08b (High) 1.32± 0.05a (Intermediate)
a-bDifferent letters in the same row indicate significant difference between averages at P<0.05.

Ital. J. Food Sci., vol. 27 - 2015 395
content (dry basis) during freeze drying and the real density increased. the researchers report-ed that the remaining solids after moisture re-moval have higher densities than water and the overall solid density tends to increase as mois-ture is removed. MAHeNDrAN (2010) dried the guava concentrate with different drying meth-ods (freeze drying, tunnel drying and spray dry-ing with the 30, 40, 50 and 60% concentrations of MD) and the bulk density of guava powders were measured as 0.63 g/mL; 0.69 g/mL and 0.61, 0.60, 0.57 and 0.54 g/mL, respectively. In this study, on the contrary of the results given by MAHeNDrAN (2010) the bulk density increased with the addition of the MD. Lower density of the dried product is recommended to increase its attractiveness for consumers (DurANce and WANG, 2002).
the average solubility time of the freeze dried kiwi puree powder was found to be as 26 sec-onds. the reason for the addition of MD was to improve the drying process and at the same time maltodextrin is highly soluble in the wa-ter to be used as a carrier. However, addition of maltodextrin caused a significant increase in the average solubility time of the powder (290s) (P<0.05). In a study by MAHeNDrAN (2010) gua-va concentrate was dried with spray, tunnel, and freeze driers and the freeze dried guava powder was found highly soluble (96%) com-pared with the other drying methods. the solu-bility of the powder is related with moisture con-tent, particle size, and chemical conversions in the material (GouLA and ADAMoPouLoS, 2008). Wettability is the ability of the powder particles to overcome the surface tension between them-selves, and water. Wettability depends on par-ticle size, density, porosity, surface tension, surface area, and surface activity of particle. besides the effects of physical properties, the chemical composition of the powders also in-fluences wettability depending on the content of fats, proteins, and carbohydrates on their surface (FANG et al., 2008). Also, GouLA and ADAMAPouLoS (2008) reported that the resid-ual moisture content of the powder affects the bulk density, wettability, flowability, and co-hesiveness. the residual moisture content of powders is significantly affected the operational conditions, and carrier concentrations. the av-erage wettability time of freeze dried kiwi pow-der was found to be as 78.5 seconds. Addition of MD caused a significant increase in the av-erage wettability time as 186s (P<0.05).
Flow difficulties and caking are common prob-lems in industries producing food powders. the flowability and cohesiveness properties of kiwi powders in terms of carr Index and Hausner ratio were evaluated. the classification of pow-der flowability based on carr index (cI) is very good (<15), good (15-20), fair (20-35), bad (35-45), and very bad (>45). the powder cohesive-ness based on Hausner ratio (Hr) is classified
as low (<1.2), intermediate (1.2-1.4), and high (>1.4) (JINAPoNG et al., 2008). Kiwi powder with higher moisture content showed bad flowabili-ty (37.15±3.15) and high (1.59±0.08) cohesive-ness. However, addition of MD caused a signifi-cant decrease in cohesiveness (1.29), and signif-icant increase in flowability (22.36) behaviours of powder (P<0.05). the kiwi powder containing MD with low moisture content showed superior flow properties compared to kiwi powder.
coNcLuSIoNS
the present work describes the possibility of producing kiwi puree powder by freeze dry-ing, and the changes in some physicochemical and powder properties of powders which were affected by drying process and addition of MD. the results showed that freeze drying can sat-isfactorily be applied for drying of kiwi puree to obtain powders that can be used as an ingredi-ent which have high vitamin c content for fla-voring and improving nutritional value purpos-es. the possible uses of this dried product as a food supplement with valuable constituents of kiwi fruits and storage test might be studied in future projects.
reFereNceS
Ancos b. (1999). effects of microwave heating on pigment composition and colour of fruit purees. Journal of the Science of Food and Agriculture 79: 663-70.
AoAc (2000). official methods of analysis. 17th ed. Gaith-ersburg, MD, uSA: Association of official Analytical chemists.
Arroqui c., Messagie I., Nguyen M.t., Van Loey A. and Hen-drickx M. (2004). comparative study on pressure and temperature stability of 5-Methyltetrahydrofolic Acid in model systems and in food products. Journal of Agricul-tural and Food chemistry 52: 485-92.
cassano A., Figoli A., tagarelli A., Sindona G. and Drio-li e. (2006). Integrated membrane process for the pro-duction of highly nutritional kiwi fruit juice. Desalina-tion 189: 21-30.
ceylan I., Aktas M. and Dogan H. (2007). Mathematical mod-eling of drying characteristics of tropical fruits. Applied thermal engineering 27: 1931-1936.
chopda c.A. and barrett D.M. (2001). optimization of guava juice and powder production. Journal of Food Process-ing and Preservation 25(6): 411-430.
Doymaz I. (2009). Mathematical modelling of thin-layer dry-ing of kiwifruit slices. Journal of Food Processing and Preservation 33: 145-160.
Durance t.D. and Wang J.H. (2002). energy consumption, density, and rehydration rate of vacuum microwave and hot air convection dehydrated tomatoes. Journal of Food Science 67(6): 2212-2216.
erbay z. and Icier F. 2009. A review of thin layer drying of foods: theory, modeling, and experimental results. criti-cal reviews in Food Science and Nutrition 50: 441-464.
ergün K. (2012). Investigation of the effects of cooking Methods and Formulation on the quality characteris-tics of cakes Prepared by the Addition of Freeze Dried Kiwi Puree Powder, M.S. thesis, ege university, Graduate School of Natural and Applied Science 170p. (in turkish).
Fang y., Selomulya c. and chen X.D. (2008). on measure-

396 Ital. J. Food Sci., vol. 27 - 2015
ment of food powder reconstitution properties. Drying technology 26: 3-14.
Fernandes A.F.N., rodrigues S., Law c.L. and Mujumdar A.S. (2011) Drying of exotic tropical fruits: a comprehen-sive review. Food and bioprocess technology 4: 163-185.
Gong z., zhang M., Mujumdar A.S. and Sun J. (2008). Spray drying and agglomeration of instant bayberry powder. Drying technology 26: 116-1121.
Goula A.M. and Adamopoulos K.G. (2008). effect of malto-dextrin addition during spray drying of tomato pulp in dehumidified air: II. powder properties. Drying technol-ogy 26: 726-737.
Harder M.N.c., De toledo t.c.F., Ferreira A.c.P. and Arthur V. (2009). Determination of changes induced by gamma radiationin nectar of kiwi fruit (Actinidia deliciosa). ra-diation Physics and chemistry 78: 579-582.
Hısıl y. (2007). the Analysis of Instrumental Food Analysis Laboratory. I
.zmir: ege university engineering Depart-
ment Academic Press. 41 p. (in turkish). Jinapong N., Suphantharika M. and Jamnong P. (2008).
Production of instant soymilk powders by ultrafiltration, spray drying and fluidized bed agglomeration. Journal of Food engineering 84: 194-205.
Kaya A., Aydın o. and Kolaylı S. (2010). effect of different drying conditions on the vitamin c (ascorbic acid) con-tent of Hayward kiwifruits (Actinidia deliciosa Planch). Food and bioproduct Processing 88: 165-73.
Kiranoudis c.t., tsami e., Maroulis z.b. and Marinos-Kouris D. (1997). Drying kinetics of some fruits. Drying tech-nology 15: 1399-1418.
Krokida M.K. and Maroulis z.b. (1997). effect of drying method on shrinkage and porosity. Drying technology 15(10): 2441-2458.
Lin t.M., Durance t.D. and Scaman c.H. (1998). character-ization of vacuum microwave, air and freeze dried carrot slices. Food research International 31: 111-17.
Mahendran t. (2010). Physico-chemical properties and senso-ry characteristics of dehydrated guava concentrate: effect of drying method and maltodextrin concentration. trop-ical Agricultural research and extension 13(2): 48-54.
Marques L.G. and Freire J.t. (2005). Analysis of freeze-dry-ing of tropical fruits. Drying technology 23: 2169-2184.
Marques L.G., Silveira A.M. and Freire J.t. (2006). Freeze-drying characteristics of tropical fruits. Drying technol-ogy 24: 457-463.
Marques L.G., Ferreira M.c. and Freire J.t. (2007). Freeze-
drying of acerola (Malpighia glabra L.). chemical engi-neering and Processing 46: 451-457.
Marques L.G., Prado M.M. and Freire J.t. (2011). Vitamin c content of freeze-dried tropical fruits. Internation-al congress on engineering and Food, May 22-26, Ath-ens, Greece.
Mosquera L.H., Moraga G. and Martínez-Navarrete N. (2010). effect of maltodextrin on the stability of freeze-dried boro-jó (borojoa patinoi cuatrec.) powder. Journal of Food en-gineering 97: 72-78.
Nadeem H.S., torun M. and ozdemir F. (2011). Spray dry-ing of the mountain tea (Sideritis strica) water extract by using different hydrocolloid carriers. LWt-Food Science technology 44: 1626-1635.
Shofian N.M., Hamid A.A., osman A., Saari N., Anwar F., Dek M.S.P. and Hairuddin M.r. (2011). effect of freeze-drying on the antioxidant compounds and antioxidant activity of selected tropical fruits. International Journal of Molecular Science 12: 4678-4692.
Silva M.A., Sobral P.J.A. and Kieckbusch t.G. (2006). State diagrams of freeze-dried camu-camu (Myrciaria dubia (HbK) Mc Vaugh) pulp with and without maltodextrin ad-dition. Journal of Food engineering 77: 426-432.
Simal S., Femenia A., Garau M.c. and rossell c. (2005). use of exponential, Page’s and diffusional models to simulate the drying kinetics of kiwi fruit. Journal of Food engi-neering 66: 323-328.
Souflerosa e.H., Pissa I., Petridis D., Lygerakisb M., Mermel-as boukouvalas G. and tsimitakisb e. (2001). Instrumen-tal analysis of volatile and other compounds of Grek kiwi wine; sensory evaluation and optimisation of its compo-sition. Food chemistry 75: 487-500.
que F., Mao L., Fang X. and Wu t. (2008). comparison of hot air- drying and freeze-drying on the physicochemi-cal properties and antioxidant activities of pumpkin (cu-curbita moschata Duch.) flours. International Journal of Food Science and technology 43: 1195-1201.
quek S.y., chok N.K. and Swedlund P. (2007). the phys-icochemical properties of spray-dried watermelon pow-ders. chemical engineering and Processing 46: 386-92.
Wang z.L., Finlay W.H., Peppler M.S. and Sweeney L.G. (2006). Powder formation by atmospheric spray-freeze-drying. Powder technology 170: 45-52.
zea L.P., yusof y.A., Aziz M.G., Ling c.N. and Amin N.A.M. (2013). compressibility and dissolution characteristics of mixed fruit tablets made from guava and pitaya fruit powders. Powder technology 247: 112-119.
Paper Received March 25, 2014 Accepted December 1, 2014

PaPer
Ital. J. Food Sci., vol. 27 - 2015 397
- Keywords: date fibre, ice cream, elemental composition, nutraceutical ingredient -
MINERAL CONTENTS AND PHySICAL, CHEMICAL, SENSORy PROPERTIES OF ICE CREAM ENRICHED
WITH DATE FIbRE
FILIZ yANgILARErzincan University School of Health Department of Nutrition and Dietetics,
24100, Erzincan, TurkeyTel. +90 446 2266669, Fax: +90 446 2265862
email: [email protected]
AbStrAct
Date samples of Amber cultivar straining from Medina region (Saudi Arabia) were analysed for their chemical compositions and physicochemical properties of date fibre in the present study. Fi-bre rich date pieces were found to contain 80.2 g/100 g total dietary fibre, 16.32 g water/g sample water-holding capacity while 9.50 g oil/g sample oil-holding capacity. It can be stated from these results that fibre content of date is a valuable dietary fibre source and used in food production as an ingredient. effects of the addition of date fibres at different concentrations (1, 2, 3 and 4%) were investigated on the physical, chemical, sensory properties and mineral content of ice cream in the present study. It was found that elemental composition of ice cream samples was affected significantly by the addition of date fibre concentrations (p<0.05) and the rates of K, Mg and zn especially increased in the samples depending on the content of date fibre while the content of ca and P decreased. It was determined from the sensory results that ice cream sample containing date fibre in the rate of 1 and 2% received the highest score from panellists.

398 Ital. J. Food Sci., vol. 27 - 2015
INtroDuctIoN
Dietary fibre as a class of compounds includes a mixture of plant carbohydrate polymers, both oligosaccharides and polysaccharides (cellulose, hemicelluloses, pectic substances, gums, resis-tant starch, inulin) that may be associated with lignin and other non-carbohydrate components (polyphenols, waxes, saponins, cutin, phytates, resistant protein; eLLeucH et al., 2011). over the last decades, knowledge on dietary fibre has increased considerably, both in the physiolog-ical and analytical areas. Health benefits of di-etary fibre are associated with bowel function, reduced risk of coronary heart diseases, type 2 diabetes and improved weight maintenance (AGoStoNI et al., 2010; HAuNer et al., 2012; WeSteNbrINK et al., 2012). In addition, dietary fibre can provide a multitude of functional prop-erties when they are incorporated in food sys-tems. Several advantages of using fruit fibres in ice cream production are improvement in body due to the fibrous framework and melting prop-erties, reduction of cold impression, reduction of recrystallization causing prolonged shelf-life, and enhancing mixed viscosities allowing freez-ing at higher overrun, causing no negative ef-fect on the ice crystal sizes, and leading to a more homogenous air-bubble formation (ANoN-yMouS, 2000; DerVISoGLu and yAzIcI, 2006). thus, fibre addition contributes to the modifi-cation and improvement of the texture, sensory characteristics and shelf-life of food due to their water binding capacity, gel-forming ability, fat mimetic, anti-sticking, anti-clumping, texturis-ing and thickening effects (DeLLo StAFFoLo et al., 2004; GeLrotH and rANHotrA, 2001; tHe-bAuDIN et al., 1997, chap. 23; SouKouLIS et al., 2009). there is little data dealing with the study of the functionality of dietary fibre in ice creams (SouKouLIS et al., 2009). Date (Phoe-nix dactylifera L.) provides a good source of di-etary fibre content, is also considered to be a commercially important agricultural commodi-ty as well as vital element of the daily diet and a nutritious food in the Arabian world (KHAN et al., 2008; AL-FArSI and Lee, 2008) general-ly being consumed fresh or processed into var-ious products (SINGH et al., 2013). Annual pro-duction rate of date all across the world in 2010 was about 7.91 million tons, which increased in the rate of 6.6% in when compared to 2009 (FAo, 2011; AHMeD et al., 2013). Different vari-eties of date vary in their chemical composition especially in sugars and dietary fibre (MuStAFA et al., 1986; AHMeD et al., 1995; rAHMAN and AL-FArSI, 2005; SINGH et al., 2013). the impor-tance of date in human nutrition comes from its rich composition of carbohydrates (70-80%), salts and minerals, dietary fibres, vitamins, fat-ty acids, antioxidants, amino acids and protein (eL-beLtAGy et al., 2009; AL-SHAHIb and MAr-SHALL, 2003; eL-NAGGA and AbD eL–tAWAb,
2012; AL-FArSI et al., 2005, 2007; bIGLArI et al., 2008; HoNG et al., 2006; MANSourI et al., 2005; VAyALIL, 2002; KcHAou et al., 2013). In fact, date fruit has been used in traditional medicine as immune system stimulator (PurI et al., 2000), and as treatment for various infectious diseas-es (DuKe, 1992; MArtíN-SÁNcHez et al., 2013).
However, such a valuable nutrient is gener-ally discarded or used in animal feeding. A se-rious economic loss can be experienced unless such a useful fruit and its products are used in human diet and food since it is rich in bio-active compounds, which can be extracted and used as value added materials. Development of new food products using date flesh is the topic of very limited number of studies. the objective of the present study is to characterize and eval-uate the functional properties of the us date fi-bre (DF) taking into account the quality and nu-tritional content of ice cream.
MAterIALS AND MetHoDS
Materials
cows’ milk and cream were obtained by the research and Application Farm of Atatürk university. Amber dates were purchased from the palm garden in Medina city of Saudi Ara-bia. Sugar, salep and emulsifier (mono- and di-glycerides) were obtained from local markets. Skim milk powder was supplied by Pınar Dairy Products co. (turkey).
Preparation of date flour
Date fibre concentrates were extracted from the Medina cultivar ‘Amber’ as described pre-viously (eLLeucH et al., 2008). DF from whole fruits were extracted in boiling water for 15 min, using a magnetic stirrer. After solubilisation of the sugars (sucrose, glucose and fructose), date fibres and pits were recovered through filtration using a 0.2 mm sieve. the pits were then re-moved. the fibres were concentrated by succes-sive rinsing (water at 40°c) and filtration until the residue was free of sugar as described. the residues obtained were pressed dried, in oven at 65°c for 24 h and milled in a Mill Laboratory at 2890 rpm, then at 5000 rpm until they could pass through a 0.2 mm sieve to recover the date fibre concentrate, and stored at -18°c for sub-sequent physicochemical analyses and incorpo-ration studies.
Chemical composition
Moisture content was determined according to the Association of official Analytical chemists (AoAc, 1997) method. Ash was analysed by com-busting the sample in a muffle furnace at 550°c for 4 h. the residue was dissolved in HNo3 and

Ital. J. Food Sci., vol. 27 - 2015 399
the mineral constituents (ca, K, Na, Mg, P and Fe) were determined using an inductively cou-ple plasma spectrophotometer (Perkin-elmer, optima 2100 DV, IcP/oeS, Shelton, ct, uSA). the bligh and Dyer method (HANSoN and oL-Ley, 1963) was used to determine the lipid con-tent. Protein content was determined by micro kjeldahl method (AoAc, 1990) and expressed as: % N2x6,23. total sugars were extracted through ethanol (80%) (NINIo et al., 2003). After centrif-ugation, the supernatant was collected and the total sugar content was analysed using phenol/sulphuric acid reagent (DuboIS et al., 1956). the total phenolic content was analysed accord-ing to the Folin-ciocalteu method developed by AL-FArSI et al. (2005). the extract (200 μL) was mixed with 1.5 mL of Folin-ciocalteu reagent (previously diluted 10-fold with distilled water) for 5 min at room temperature. 1.5 mL of aque-ous sodium bicarbonate (60 g/L) was added and the mixture was vortexed and allowed to stand at room temperature. After 90 min, the absorbance was measured at 725 nm. the total phenol con-centration was expressed as the mean ± SD as mg of gallic acid equivalent (mg GAe) per 100 g of fresh weight of date for two replicates. AoAc enzymatic-gravimetric official method (991.43; AoAc, 1995) was used to determine dietary fi-bres while dry matter content, fat, ash, acidity (ºSH) and pH of ice cream samples were deter-mined as in DeMIrcI and GuNDuz (1994). Min-eral contents (ca, K, Na, P, S, Mg, Fe, Mn, zn, Ni) of ice cream samples were determined using an Inductively couple plasma spectrophotome-ter (Perkin-elmer, optima 2100 DV, IcP/oeS, Shelton, ct, uSA) and following the method de-scribed by GuLer (2007). Samples were decom-posed in a microwave oven (berghof speed wave MWS-2, eningen, Germany). For this purpose, about 0.5 g ice cream sample was weighed into the digestion vessels, added concentrated nitric acid (10 mL) and digestion process was realized over each sample at 210°c and under 176 psi pressure for 10 min. After cooling, the carousels were removed from the oven, 30% hydrogen per-oxide (2 mL) was added to samples and then sec-ond digestion was applied at 195°c and under 95 psi pressure for 5 min. the vessels were im-mediately closed after the addition of oxidants. At the end of the digestion process, the samples were diluted in with distilled water to an appro-priate concentration and filtered through What-man No. 42 filter paper. All diluted digests were eventually analysed using an Inductively couple plasma spectrophotometer (IcP-oeS).
Water and oil holding capacities, and pH of fibre
Water and oil holding capacities (WHc and oHc) of the fibres were determined according to the methods of MAc-coNNeLL et al. (1997) and cAPrez et al. (1986), respectively. WHc and oHc
values represented the amount of water and oil absorbed per gram of sample, respectively. pH of DF was measured using a pH meter (WtW 340-1) and following the method described by SuN-tHArALINGAM and rAVINDrAN (1993).
Ice cream manufacture
the ice cream samples were prepared in the Pilot Plant of Food engineering Department, Ag-riculture Faculty, Atatürk university. Initially, the fat ratio of cows’ milk was adjusted to 6% by adding cream. then, the milk was divided into five equal parts of 2 kg. For each mix, skim milk powder (125 g), sugar (405 g), salep (stabilizer) (16.2 g), emulsifier (mono- and di-glycerides) (6.75 g) were added to each mix. then prepared date fibres were added at four different concen-trations: 1, 2, 3 and 4% to mixture weight. the mixes were pasteurized at 85°c for 25 min and stored at 4°c for 24 h. then, they were iced in ice cream machinery (-5°c; ugur cooling Ma-chineries co., Nazilli, turkey) and hardened at -22°c for 24 h and stored at -18°c and used for physical, chemical, mineral and sensory analyses. Ice cream samples were produced in duplicate.
Ice cream analysis
Physical measurements. overrun was deter-mined using a standard 100 mL cup, according to the equation [(volume of ice cream)-(volume of mix)/volume of mix×100] given by JIMeNez-FLo-rez et al. (1993). First dripping and complete melting times were measured according to Gu-VeN and KArAcA (2002) 25 g of tempered sam-ples were left to melt (at room temperature, 20ºc) on a 0.2 cm wire mesh screen above a beaker. First dripping and complete melting times of the samples were accepted to be seconds. the vis-cosities of the ice cream mixes were determined at 4ºc using a digital brookfield Viscometer, Model DV-II (brookfield engineering Laborato-ries, Stoughton, MA, uSA). before measuring the viscosity, the samples were stirred gently to re-move the air from the mixes (AKIN et al., 2007). the color analyses (L*, a* and b* values) of the ice cream mix were carried out using in Minol-ta colorimeter (chroma Meter, cr-200, osaka, Japan; ANoNyMouS, 1979). the colorimeter was calibrated using a white reference plate before measurements. Light source for the colorime-ter was standard daylight (c) and the standard observer was 2°.
Sensory evaluation
eight professional panellists from the Food engineering Department of Atatürk university, erzurum, turkey, participated in the study to determine some properties using a score test for flavour, body and texture, color and appearance,

400 Ital. J. Food Sci., vol. 27 - 2015
resistance to melting and general acceptability. Hardened ice cream samples were tested at a serving temperature of -10ºc and scored their sensory characteristics in a scale ranging from 1 (poor) to 9 (excellent). Warm water and bread were also provided to the panellists to cleanse their palates between samples. All panellists were non-smokers, had prior testing experience with a variety of dairy products including milk, cheese and ice cream and had previously used flavour profile procedures adapted from roLAND et al. (1999).
Statistical analysis
All statistical analysis was performed using SAS for windows (SAS, 1998). Analysis of vari-ance was performed using the routine Proc ANo-VA. Significant treatment was separated using Duncan’s Multiple range test (DuzGuNeS et al., 1987).
reSuLtS AND DIScuSSIoN
Physical and chemical characteristics of date fibre
Dry matter, fat, acidity (oSH) and pH values of milk, skim milk powder and cream used in the production of the ice cream are given in table 1. Date and date fibre were analyzed for mois-ture, ash, fat, total sugars, color, total phenol-ic content, WHc and oHc (table 2). Date fibres are rich in protein (9.01 g/100 g). earlier, eL-LeucH et al. (2008) reported 9 g/100 g protein contents for tunisian dates and similar to the present work. Presence of high protein content in fruit fibres (11.6-14.4 g/100 g) is reported in the literature (brAVo and SAurA-cALIXto, 1998; SAurA-cALIXto, 1998). In the present study, cal-cium, sodium, potassium and magnesium con-
tents of date fibre were measured to be 1925, 56.5, 981 and 1807 mg/kg, respectively. AHMeD et al. (2013) reported that the sodium content was significantly lower than other minerals (55-86 mg/kg); however, the fibres were rich in po-tassium. the barhee cultivar possessed excep-tionally higher amount of potassium (2600 mg/kg), and the maximum sodium was found in ow-adi cultivar. these results are significantly differ-ent from the reported values for date flesh (eL-LeucH et al., 2008). the variation could origi-nate from the cultivar, and agro-climatic as well as environmental conditions.
Date contains high proportions of total die-tary fibre (80.2 g/100g) similarly to those re-ported in Deglet-Nour and Allig (two varieties of date) between 88 and 92%, respectively (eL-LeucH et al., 2008). In addition, the contents of dietary fibre in dried apricots, prunes, figs, and raisins were 7.7, 8.0, 12.2, and 5.1 g/100 g, re-spectively (cAMIre and ouGHerty, 2003; MAr-Lett et al., 1994; VINSoN, 1999). thus, dates and their by-products serve as good sources of fibre compared with syrups and other fresh and most dried fruits. In addition, these DF con-tents are close to levels measured for DF prep-arations from apple (Liberty cultivars) (89.8%), but notably higher than those of other fruit DF concentrates reported for grapefruit, lemon, or-ange, apple and mango (28-78.2%) (FIGueroLA et al., 2005; VerGArA-VALeNcIA et al., 2007),
table 1 - the gross chemical, physical properties and min-eral contents of raw milk, skim milk, cream.
Analysis Milk Skim milk powder Cream
Dry matter (%) 11.37 95.17 63.76Fat (%) 3.5 1.00 65.00Ash (%) 0.67 - -Acidity (oSH) 5.81 - 13.98pH 6.40 - 4.95
Minerals (mg kg-1)Ca 1224.00K 1397.00Mg 91.67P 869.54Na 327.90Fe 13.56
- Not determined.
table 2 - chemical and physical properties of date fibre and date.
Chemical analysis Date Date fibre
Moisture (g/100 g) 13.61±0.11 3.87±0.13Ash (g/100 g) 1.79±0.07 2.06±0.04pH 6.00±0.21 5.71±0.02Protein (g/100 g) 1.23±0.16 9.01±0.75Fat (g/100 g) 3.41±0.03 0.98±1.21Total sugars 78.20 0Total phenolic contentc 186±2.30 0.73±0.01Total dietary fibre (g/100 g) 8.75±0.96 80.2±1.06
Minerals (mg kg-1)Ca 23.40±0.51 1925±1.84K 428±0.14 981±2.04Mg 84.51±0.22 1807±0.82P 90.19±1.36 1325±0.51Na 17.65±0.12 56.5±0.05Fe 2.03±0.07 24.82±1.36
Physical AnalysisL* 23.8±0.04 61.08±0.05a* 11.0±0.03 6.35±0.01b* 8.9±0.07 14.72±0.01WHCa - 16.32±0.47OHCb - 9.50±0.23
aWater holding capacity (g water/g, sample);bOil holding capacity (g oil/g, sample);cg/100 g of DF concentrates;L* = lightness; a* = redness (+) and blueness (–); b* = yellowness.

Ital. J. Food Sci., vol. 27 - 2015 401
grape skins (54.1–64.6%) (brAVo and SAurA-cA-LIXto, 1998; SAurA-cALIXto, 1998), citrus peel (57%; cHAu and HuANG, 2003), or fibre from lime peels (66.7% and 70.4%; ubANDo et al., 2005) and mango peel (71%; LArrAurI et al., 1996).
WHc was found to be 16.32 (g water/g, sam-ple) in date fibre in the present study. WHc in of date fibres was reported to be significantly higher than those of fruit and vegetable fibres (FeMeNIA et al., 1997; GAN and LAtIFF, 2011; LoPez et al., 1996; VerGArA-VALeNcIA et al., 2007; AHMeD et al., 2013), but similar to those found in date (15.5 g/g, dry matter) by eLLeucH et al. (2008). oHc is another functional proper-ty of some ingredients used in formulated food. In general, date fibre showed significantly high-er oHc (9.5 g oil/g, sample) when compared to other fruit and vegetable derived fibres (GAN and LAtIFF, 2011; VerGArA-VALeNcIA et al., 2007). the highest oHc was observed for Allig culti-var (9.9 g oil/g sample) followed by eLLeucH et al. (2008). Higher oHc of date fibre indicated that it could be used as an ingredient to stabi-lize foods with a high percentage of fat (eLLeucH et al., 2008; AHMeD et al., 2013). the mean L*, a* and b* values were found to be 61.08, 6.35
and 14.72, respectively. this could be due, on the one hand, to the wash operations during the extraction and concentration of DF and, on the other hand, to the solubility of pigments re-sponsible for the dark units of color. eLLeucH et al. (2008) reported that L*, a* and b* values were 61.92, 7.11 and 14.85, respectively for Al-lig, which are convenient with the present study. GoñI et al. (2009) informed that PP associated with polysaccharides and proteins in cell walls are significant constituents of date fibre. ta-ble 2 shows date fibre polyphenol (PP) contents (0.73 g/100 g).
Physical and chemical characteristics of ice cream samples
the results of some physical, chemical anal-yses and mineral contents of ice cream sam-ples are given in tables 3 and 4. the dry-mat-ter content of control sample was lower than other samples at statistically significant levels (p<0.05). the dry matter rates of ice cream in-creased with the addition of DF concentration. the highest fat and acidity ratios were found to be in control sample (4.63%). pH values of ice
table 3 - Some chemical and physical properties of ice cream samples with date fibre.
Analysis C DF1 DF2 DF3 DF4
Moisture (%) 33.15±0.02a 33.32±0.29b 33.49±0.10a 33.63±0.36b 34.05±0.01cAsh (%) 0.89±0.01a 0.92±0.01ab 0.95±0.01b 1.06 ±0.02c 1.10±0.01cFat (%) 4.63±1.41d 4.17±0.14c 4.15±0.03c 3.91±0.01b 3.86±0.02aAcidity(oSH) 8.99±0.00e 6.23±0.02a 6.38±0.01b 6.54±0.01c 6.73±0.02dpH 6.20±0.02e 5.62±0.02d 5.56±0.01c 5.23±0.03b 5.09±0.01aL* 83.33±0.01d 82.26±0.04d 80.27±0.03c 77.64±0.91b 75.45±0.07aa* 1.62±0.05a 2.54±0.04b 2.73±0.01c 3.21±0.04d 3.90±0.01eb* 9.15±0.02a 9.20±0.01a 11.60±0.14b 12.40±0.01c 12.50±0.02cOverrun (%) 40.51±0.00e 39.32±0.21d 37.20±0.01c 32.24±0.19b 29.87±0.06aComplete melting time (s) 0.43±0.02b 0.50±0.00c 0.46±0.02b 0.35±0.01a 0.38±0.00a
Mean values followed by different letters in the same row are significantly different (p<0.05).C: Control (without date fibre); DF1: ice cream with made date fibre 1% (w/w); DF2: ice cream with date fibre 2% (w/w); DF3: ice cream with date fibre 3% (w/w); DF4: ice cream with date fibre 4% (w/w).
table 4 - elemental composition (mg kg-1) of the ash in ice cream with date fibre.
Concentrations of minerals C DF1 DF2 DF3 DF4
Ca 1844.36±12.72e 1623.25±2.82d 1547±2.12c 1481.40±2.12a 1514.06±7.77bK 1669.56±21.20a 1913.06±4.15b 1939.18±1.33bc 2043.46±80.63cd 2135.46±49.95dNa 537.68±6.37b 572±0.04c 690±0.70d 528.5±0.70a 573±0.01cP 1100.86±0.01c 1257.05±4.24d 1019±2.12b 1100±0.71c 1006±2.82aS 875.24±1.41a 938.50±17.67b 980±0.70c 1015±7.07d 1103±2.12eMg 159.31±1.39a 161.32±1.15a 164.78±0.72b 171.06±0.12c 183.33±1.59dFe 10.82±0.24a 11.17±0.05b 14.73±0.02c 21.02±0.01d 29.65±0.22eMn 0.32±0.01b 0.35±0.07c 0.26±0.02a 0.30±0.01b 0.40±0.01dZn 57.84±0.86a 70.82±0.95b 84.03±0.89c 91.13±1.36d 94.56±3.93dNi 0.97±0.06a 1.20±0.14b 1.14±0.01ab 1.70±0.01c 1.61±0.01c
Mean values followed by different letters in the same row are significantly different (p<0.05).C: Control (without date fibre); DF1: ice cream with made date fibre 1% (w/w); DF2: ice cream with date fibre 2% (w/w); DF3: ice cream with date fibre 3% (w/w); DF4: ice.

402 Ital. J. Food Sci., vol. 27 - 2015
cream samples were not statistically different maybe due to pH of date (6.00).
Viscosity is one of the most important proper-ties of an ice-cream mixture since it can result in a desirable body and texture in ice creams. therefore, the measurement of viscosity is im-portant to know the effect of DF on the charac-teristics of ice-cream mixtures. It could be seen in the present study that the addition of DF sig-nificantly (p<0.05) affected the viscosity behav-iour of ice cream samples (Fig. 1). Viscosity of ice-cream samples increased significantly by adding DF (3 and 4%). As shown in Fig. 1, the lowest and highest viscosity rates value were ob-tained in DF1 sample the sample with 4% DF. the control sample had an average of 5175 vis-cosity. Similar results were reported in grape wine lees added in ice cream by HWANG et al. (2009), in frozen yogurt by GuVeN and KArAcA (2002), in cape gooseberry (Physalis peruviana L.) added in ice cream by erKAyA et al. (2012) and the citrus fibre added in ice cream mixes by DerVISoGLu and yAzIcI (2006).
Ice cream color was affected by the addition of DF. the date fibre had a brownish color. Ice cream fortified with date fibre had significant-ly higher a* and b* values and lower L* values compared to the control sample. Lightness (L*) values of ice cream samples were closer to each of dietary fibre but with DF1 and DF2 samples, it was found to be significantly higher than the
Fig. 1 - the obtain of date fibre and production of ice cream.
other samples (table 3). All samples had neg-ative a* values and DF3 and DF4 samples had close but significantly higher values than other samples. Increase in the concentration of date fibre contributed to the color values of the sam-ples (p<0.05). the addition of date fibre increased the b* values of all samples. the lowest b* val-ue was obtained in DF1 samples while the high-est b* was obtained in the DF4 samples. DerVI-SoGLu and yAzIcI (2006) reported that the ad-dition of citrus fibre increased the color prop-erties similarly to the results of present study.
overrun and melting time are associated with the amount of air incorporated during the man-ufacturing process. these features can define the structure of the end final product since the presence of air gives the ice cream an agreeable light texture and influences the physical proper-ties of melting and hardness of the end product (SoFJAN and HArteL, 2004; cruz et al., 2009; DAGDeMIr, 2011). All ice cream samples had normally lower overrun values (29.87-40.51%) than those reported in literature (80-120%). Al-though the rate of DF lowered the overrun values of the ice-cream samples, control samples had higher overrun values than the DF added sam-ples (table 3). Since the viscosity of ice cream increased in DF added samples, it was possible that less air was incorporated in the ice cream mix with DF during batch freezing, which re-sulted in lower overrun than for control (with-

Ital. J. Food Sci., vol. 27 - 2015 403
out DF). the decrease of overrun values for ice creams with DF was in agreement with the re-sults indicated in literature (DerVISoGLu et al., 2005; teMIz and yeSILSu, 2010). eL-SAMAHy et al. (2009) reported that the decrement of over-run in ice cream containing concentrated cac-tus pear pulp might be attributed to increment of mix’s viscosity that extremely affects whip-ping rate of mixes. HWANG et al. (2009) reported that the overrun values of ice-cream samples de-creased significantly when grape wine lees was added. It was found by SuN-WAterHouSe et al. (2013) that overrun rate of ice – cream contain-ing green kiwi fruit was 90.5% and higher than that found in the present study. However, similar results with the present study were found with cape gooseberry (Physalis peruviana L.) added in ice cream by erKAyA et al. (2012).
As can be seen in table 3, the complete melt-ing times of the ice cream samples were signif-icantly longer for DF4 samples (0.50 g min-1) and the period got longer as the fibre content increased. this is due possibly to some com-pounds existent in DF4, which have the ability of water absorption. AKIN et al. (2007) reported that the decrease in melting rate of ice cream with inulin might originate from its ability to reduce the free movement of water molecules. DF (3 and 4%) concentration affected the first dripping times positively (Fig. 2). results of the present study indicated that the first dripping times were prolonged as the fibre contents in-creased in the ice cream samples (p<0.05). It was found by DerVISoGLu and yAzIcI (2006) that citrus fibre samples extended dripping times. these findings were similar to those in the pre-sent study. Statistically significant differences (p<0.05) were found in terms of major element contents such as ca, K, Mg and S between the samples except for Mn concentration in all ice cream samples. Dairy products are known to be
excellent sources of ca, P and Mg and supply dietary fibre a significant amount of calcimine, a bioavailable form (McKINLey, 2005). Addition of date fibre lowered ca content of the samples in the present study (table 4). the highest ca was found to be 1844.36 mg/kg in control sam-ples. Mg and S values of ice cream samples in-creased with the addition of date fibre (p<0.05). Increasing K in human diet may provide protec-tion from hypertension in people who are sen-sitive to high levels of Na. the highest rate of S and Na was fibre detected in the samples with 4% and 2% DF to be 1103 and 690 mg/kg, re-spectively, while the lowest rates were 875.24 in control and 528.5 mg/kg with 3% DF, respec-tively. elements like Fe, zn and Mn are classi-fied as micro-nutrients. the addition of DF sig-nificantly increased Fe, zn and Mn contents of the ice-cream samples (p<0.05). Similar results were reported by erKAyA et al. (2012) in cape gooseberry (Physalis peruviana L.) added ice cream samples. It can be suggested by consid-ering such a result that date fibre may be a good source to enhance dairy products such as ice-cream, which is poor in minor elements like Fe and zn. Wu et al. (2005) reported that zn acts as a non-enzymatic antioxidant, so that its con-sumption helps to prevent oxidative damage of the cell. the ice cream sample with 4% DF had the highest zn content (94.56 mg/kg).
Sensory evaluations
results of the sensory evaluation of the ice cream samples on a scale from 1 (poor) to 9 (ex-cellent) are shown in a radar plot in Fig. 3. For-tifying ice cream with DF had a significant effect on all sensory properties except sweetness. All the fibre-enriched samples received lower scores for total evaluation in terms of sensory charac-teristics (p<0.05). Ice cream enriched with up to
Fig. 2 - Viscosity values of ice cream containing date fibre and control.
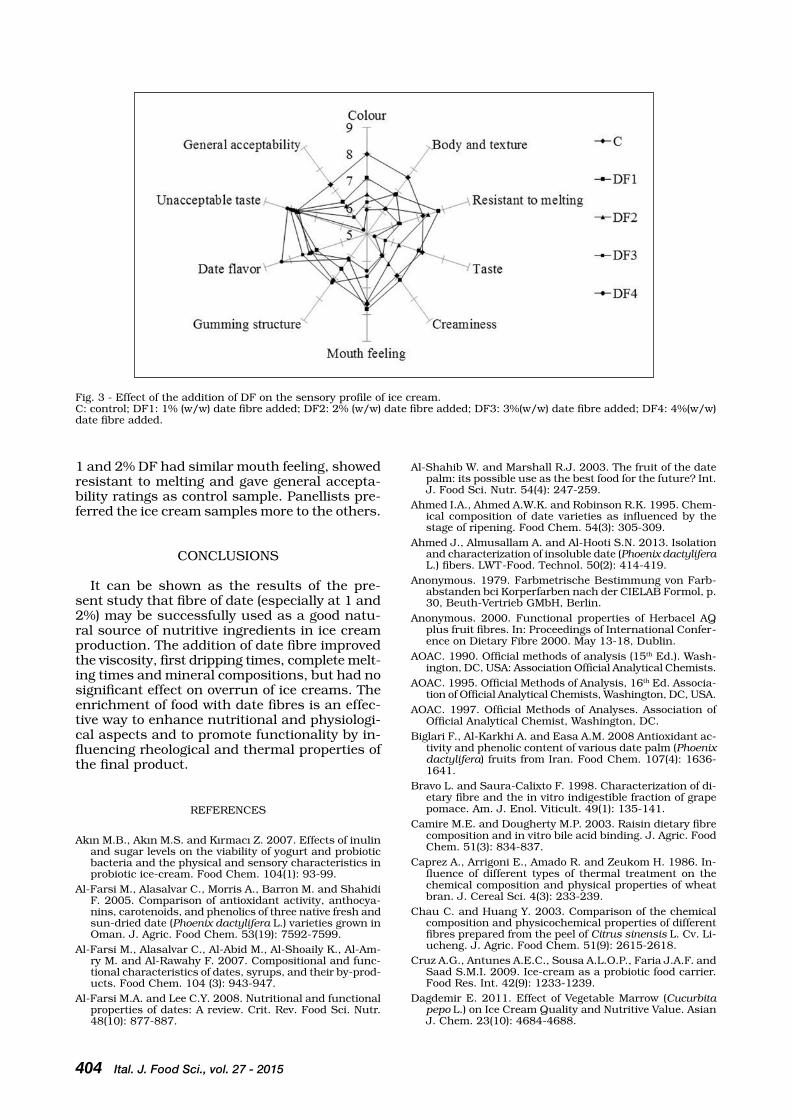
404 Ital. J. Food Sci., vol. 27 - 2015
Fig. 3 - effect of the addition of DF on the sensory profile of ice cream.c: control; DF1: 1% (w/w) date fibre added; DF2: 2% (w/w) date fibre added; DF3: 3%(w/w) date fibre added; DF4: 4%(w/w) date fibre added.
1 and 2% DF had similar mouth feeling, showed resistant to melting and gave general accepta-bility ratings as control sample. Panellists pre-ferred the ice cream samples more to the others.
coNcLuSIoNS
It can be shown as the results of the pre-sent study that fibre of date (especially at 1 and 2%) may be successfully used as a good natu-ral source of nutritive ingredients in ice cream production. the addition of date fibre improved the viscosity, first dripping times, complete melt-ing times and mineral compositions, but had no significant effect on overrun of ice creams. the enrichment of food with date fibres is an effec-tive way to enhance nutritional and physiologi-cal aspects and to promote functionality by in-fluencing rheological and thermal properties of the final product.
reFereNceS
Akın M.b., Akın M.S. and Kırmacı z. 2007. effects of inulin and sugar levels on the viability of yogurt and probiotic bacteria and the physical and sensory characteristics in probiotic ice-cream. Food chem. 104(1): 93-99.
Al-Farsi M., Alasalvar c., Morris A., barron M. and Shahidi F. 2005. comparison of antioxidant activity, anthocya-nins, carotenoids, and phenolics of three native fresh and sun-dried date (Phoenix dactylifera L.) varieties grown in oman. J. Agric. Food chem. 53(19): 7592-7599.
Al-Farsi M., Alasalvar c., Al-Abid M., Al-Shoaily K., Al-Am-ry M. and Al-rawahy F. 2007. compositional and func-tional characteristics of dates, syrups, and their by-prod-ucts. Food chem. 104 (3): 943-947.
Al-Farsi M.A. and Lee c.y. 2008. Nutritional and functional properties of dates: A review. crit. rev. Food Sci. Nutr. 48(10): 877-887.
Al-Shahib W. and Marshall r.J. 2003. the fruit of the date palm: its possible use as the best food for the future? Int. J. Food Sci. Nutr. 54(4): 247-259.
Ahmed I.A., Ahmed A.W.K. and robinson r.K. 1995. chem-ical composition of date varieties as influenced by the stage of ripening. Food chem. 54(3): 305-309.
Ahmed J., Almusallam A. and Al-Hooti S.N. 2013. Isolation and characterization of insoluble date (Phoenix dactylifera L.) fibers. LWt-Food. technol. 50(2): 414-419.
Anonymous. 1979. Farbmetrische bestimmung von Farb-abstanden bci Korperfarben nach der cIeLAb Formol, p. 30, beuth-Vertrieb GMbH, berlin.
Anonymous. 2000. Functional properties of Herbacel Aq plus fruit fibres. In: Proceedings of International confer-ence on Dietary Fibre 2000. May 13-18, Dublin.
AoAc. 1990. official methods of analysis (15th ed.). Wash-ington, Dc, uSA: Association official Analytical chemists.
AoAc. 1995. official Methods of Analysis, 16th ed. Associa-tion of official Analytical chemists, Washington, Dc, uSA.
AoAc. 1997. official Methods of Analyses. Association of official Analytical chemist, Washington, Dc.
biglari F., Al-Karkhi A. and easa A.M. 2008 Antioxidant ac-tivity and phenolic content of various date palm (Phoenix dactylifera) fruits from Iran. Food chem. 107(4): 1636-1641.
bravo L. and Saura-calixto F. 1998. characterization of di-etary fibre and the in vitro indigestible fraction of grape pomace. Am. J. enol. Viticult. 49(1): 135-141.
camire M.e. and Dougherty M.P. 2003. raisin dietary fibre composition and in vitro bile acid binding. J. Agric. Food chem. 51(3): 834-837.
caprez A., Arrigoni e., Amado r. and zeukom H. 1986. In-fluence of different types of thermal treatment on the chemical composition and physical properties of wheat bran. J. cereal Sci. 4(3): 233-239.
chau c. and Huang y. 2003. comparison of the chemical composition and physicochemical properties of different fibres prepared from the peel of Citrus sinensis L. cv. Li-ucheng. J. Agric. Food chem. 51(9): 2615-2618.
cruz A.G., Antunes A.e.c., Sousa A.L.o.P., Faria J.A.F. and Saad S.M.I. 2009. Ice-cream as a probiotic food carrier. Food res. Int. 42(9): 1233-1239.
Dagdemir e. 2011. effect of Vegetable Marrow (Cucurbita pepo L.) on Ice cream quality and Nutritive Value. Asian J. chem. 23(10): 4684-4688.

Ital. J. Food Sci., vol. 27 - 2015 405
Dello Staffolo M., bertola N., Martino M. and bevilaqcua A. 2004. Influence of dietary fibre addition on sensory and rheological properties of yogurt. Int. Dairy J. 14(3): 263–268.
Demirci M. and Gündüz H.H. 1994 Dairy technology Hand book. Hasad Publ., Istanbul, p.66.
Dervisoglu M., yazici F. and Aydemir o. 2005. the effect of soy protein concentrate addition on the physical, chem-ical, and sensory properties of strawberry flavored ice cream. eur. Food res. technol. 221(3-4): 466-470.
Dervisoglu M. and yazıcı F. 2006. Note. the effect of cit-rus Fibre on the Physical, chemical and Sensory Proper-ties of Ice cream. Food Sci. technol. Int. 12(2): 159-164.
Dubois M., Gilles K.A., Hamilton J.K., rebers P.A. and Smith F. 1956. colorimetric method for the determination of sug-ars and related substances. Anal. chem. 28(3): 350-356
Duke J.A. 1992. Handbook of phyto-chemical of GrAS herbs and other economic plants. boca raton, Fl.
Düzgünes o., Kesici t., Kavuncu o. and Gürbüz F. 1987. experimental Design Methods, Ankara university Agri-culture Faculty, Ankara, turkey, p. 381.
Agostoni c.V., bresson J.L., Fairweather-tait S., Flynn A., Golly I. and Korhonen H. et al. 2010. Scientific opinion on dietary reference values for carbohydrates and die-tary fibre. eFSA J. 8(3).
el-beltagy A.e., Nassar A.G., el-Ghobashy A.K. and yousef H.y.M. 2009. Microwave a potent date syrup producing method. egypt J. Appl. Sci. 24(8b): 454-464.
elleuch M., besbes S., roiseux o., blecker c., Deroanne c., Drira N.e. and Attia H. 2008. Date flesh: chemical com-position and characteristics of the dietary fibre. Food chem. 111(3): 676-682.
elleuch M., bedigian D., roiseux o., besbes S., blecker c. and Attia H. 2011. Dietary fibre and fibre-rich by-prod-ucts of food processing: characterisation, technological functionality and commercial applications: A review. Food chem. 124(2): 411-412.
el-Nagga e.A. and Abd el-tawab y.A. 2012. composition-al characteristics of date syrup extracted by different methods in some fermented dairy products. Ann. Agr. Sci. 57(1): 29-36.
el-Samahy S.K., youssef K.M. and Moussa-Ayoub t.e. 2009. Producing ice cream with concentrated cactus pear pulp: A preliminary study. J. PAcD 11: 1-12.
erkaya t., Dagdemir e. and Sengül M. 2012. Influence of cape gooseberry (Physalis peruviana L.) addition on the chemical and sensory characteristics and mineral con-centrations of ice cream. Food res. Int. 45(1): 331-335.
FAo. 2011. Statistical databases. http://faostat.fao.org Ac-cessed 08.02.11.
Femenia A., Lefebvre c., thebaudin y., robertson J. and bourgeois c. 1997. Physical and sensory properties of model foods supplemented with cauliflower fibre. J. Food Sci. 62(4): 635-639.
Figuerola F., Hurtado M.L., estévez A.M., chiffelle I. and Asenjo F. 2005. Fibre concentrates from apple pomace and citrus peel as potential fibre sources for food enrich-ment. Food chem. 91(3): 395-401.
Gan c.y. and Latiff A.A. 2011. Antioxidant Parkia speciosa pod powder as potential functional flour in food applica-tion: physicochemical properties characterization. Food Hydrocolloid. 25(5): 1174-1180.
Gelroth J. and ranhotra G.S. 2001. Food uses of fibre. In: S. Sungsoo cho & M.S. Dreher (eds.), Handbook of die-tary fibre. New york: taylor and Francis.
Goñi I., Díaz-rubio M.e., Pérez-Jiménez J. and Saura-ca-lixto F. 2009. towards an update methodology for meas-urement of dietary fibre, including associated polyphe-nols, in food and beverages. Food res. Int. 42(7): 840-846.
Güler z. 2007. Levels of 24 mineral elements in local goat milk, strained yoghurt and salted yoghurt (tuzlu yogurt). Small ruminant res. 71(1-3): 130-137.
Güven M. and Karaca o.b. 2002. the effects of varying sug-ar content and fruit concentration on the physical prop-erties of vanilla and fruit ice-cream-type frozen yogurts. Int. J. Dairy technol. 55(1): 27-31.
Hanson S.W.F. and olley J. 1963. Application of the bligh and Dyer method of lipid extraction to tissue homogen-ates. biochem. J. 89(3): 101-102.
Hauner H., bechthold A., boeing H., brönstrup A., buyken A., Leschik-bonnet e., Linseisen J., Schulze M., Strohm D. and Wolfram G. 2012. evidence-based guideline of the German nutrition society: carbohydrate intake and prevention of nutrition-related diseases. Ann. Nutr. Me-tab. 60(1): 1-58.
Hong y.J., tomas-barberan F.A., Kader A.A. and Mitchell A.e. 2006. the flavonoid glycosides and procyanidin com-position of Deglet Noor dates (Phoenix dactylifera). J Ag-ric. Food chem. 54(6): 2405-2411.
Hwang J.y., Shyu y.S. and Hsu c.K. 2009. Grape wine lees improves the rheological and adds antioxidant proper-ties to ice cream. LWt-Food Sci. technol. 42(1): 312-318.
Jimenez-Florez r., Klipfel N.J. and tobias J. 1993. In: ed. y.H. Hui, Ice cream and Frozen Desserts. In: Dairy Sci-ence and technology Handbook, (p. 159), Product Man-ufacturing, Newyork.
Kchaou W., Abbès F., blecker c., Attia H. and besbes S. 2013. effects of extraction solvents on phenolic contents and antioxidant activities of tunisian date varieties (Phoe-nix dactylifera L.). Ind. crop Prod. 45: 262-269.
Khan M.N., Sarwar A., Wahahb F. and Haleem r.2008. Phys-ico-chemical charac-terization of date varieties using mul-tivariate analysis. J. Sci. Food Agr. 88(6): 1051-1059.
Larrauri J.A., rupérez P., borroto b. and Saura-calixto F. 1996. Mango peels as a new tropical fibre: Preparation and characterisation. LWt-Food Sci. technol. 29(8): 729-733.
Lopez G., ros G., rincon F., Periago M.J., Martinez M.c. and ortuno J. 1996. relationship between physical and hy-dration properties of soluble and insoluble fibre of artich oke. J. Agric. Food chem. 44(9): 2773-2778.
Mac-connell A.A., eastwood A. and Mitchell W.D. 1997. Physical characterisation of vegetable foodstuffs that could influence bowel function. J. Sci. Food Agr. 25(12): 1457-1464.
Mansouri A., embarek G., Kokalou e. and Kefalas P. 2005. Phenolic profile and antioxidant activity of the Algerian ripe date palm fruit (Phoenix dactylifera). Food chem. 89(3): 411-420.
Marlett J.A., Hosig K.b., Vollendorf N.W., Shinnick F.L., Haack V.S. and Story J.A. 1994. Mechanism of serum cholesterol reduction by oat bran. Hepatology 20(6): 1450-1457.
Martín-Sánchez A.M., ciro-Gómez G., Sayas e., Vilella-esplá J., ben-Abda J. and Pérez-Álvarez J.A. 2013. Date palm by-products as a new ingredient for the meat industry: Application to pork liver pâté. Meat Sci. 93(4): 880-887.
Mckinley M.c. 2005. the nutrition and health benefits of yoghurt. Int. J. Dairy technol. 58(1): 1-12.
Mustafa A.b. Harper D.b. and Johnston D.e. 1986. bio-chemical changes during ripening of some Sudanese date varieties. J. Sci. Food Agr. 37(1): 43-53.
Ninio r., Lewinsohn e., Mizrahi y. and Sitrit y. 2003. chang-es in sugars, acids, and volatiles during ripening of kou-bo (Cereus peruvianus (L.) Miller) fruits. J. Agric. Food chem. 51(3): 797-801.
Puri A., Sahai r., Singh K.L., Saxena r.P., tandon J.S. and Saxena K.c. 2000. Immunostimulant activity of dry fruits and plant materials used in Indian traditional medical system for mothers after child birth and invalids. J. eth-nopharmacol. 71(1-2): 89-92.
rahman M.S. and Al-Farsi S.A. 2005. Instrumental texture profile analysis (tPA) of date flesh as a function of mois-ture content. J. Food eng. 66(4): 505-511.
roland A.M., Phillips L.G. and boor K.J. 1999. effects of fat content on the sensory properties, melting, color, and hardness of ice cream. J. Dairy Sci. 82(1): 32-38.
SAS. 1998. SAS/StAt Guide for Personal computers, Ver-sion 6.12. SAS Institute, cary, Nc.
Saura-calixto F. 1998. Antioxidant dietary fibre product: A new concept and a potential food ingredient. J. Agric. Food chem. 46(10): 4303-4306.
406 Ital. J. Food Sci., vol. 27 - 2015
Singh V., Guizani N., Al-Alawi A., claereboudt M. and rah-man M.S. 2013. Instrumental texture profile analysis (tPA) of date fruits as a function of its physico-chemical properties. Ind. crop Prod. 50: 866-873.
Sofjan r.P. and Hartel r.W. 2004. effects of overrun on structural and physical characteristics of ice cream. Int. Dairy J. 14(3): 255-262.
Soukoulis c., Lebesi D. and tzia c. 2009 enrichment of ice cream with dietary fibre: effects on rheological proper-ties, ice crystallisation and glass transition phenomena. Food chem. 115(2): 665-671.
Sun-Waterhouse D., edmonds e., edmonds L., Wadhwa S.S. and Wibisono r. 2013. Producing ice cream using a sub-stantial amount of juice from kiwifruit with green, gold or red flesh. Food res. Int. 50(2): 647-656.
Suntharalingam S. and ravindran G. 1993. Physical and bi-ochemical properties of green banana flour. Plant Food Hum. Nutr. 43(1): 19-27.
temiz H. and yesilsu A.F. 2010. effect of pekmez addition on the physical, chemical, and sensory properties of ice cream. czech J. Food Sci. 28(6): 538-546.
thebaudin J.y., Lefebre A.c., Harrington M. and bourgeois
c.M.1997. Dietary fibre: nutritional and technological in-terest. trends Food Sci. tech. 8(2): 41-48.
ubando J., Navarro A. and Valdivia M.A. 2005. Mexican lime peel: comparativestudy on contents of dietary fi-bre and associated antioxidant activity. Food chem. 89(1): 57-61.
Vayalil P.K. 2002. Antioxidant and antimutagenic proper-ties of aqueous extract of date fruits (Phoenix dactylif-era L. Arecaceae). J. Agric. Food chem. 50(3): 610-617.
Vergara-Valencia N., Granados-Pereza e., Agama-Acevedo e., tovarb J., rualesc J. and bello-Perez L.A. 2007. Fibre concentrate from mango fruit: characterization, associat-ed antioxidant capacity and application as a bakery prod-uct ingredient. LWt-Food Sci. technol. 40(4): 722-729.
Vinson J.A. 1999. the functional properties of figs. cereal Food World 44: 82-87.
Westenbrink S., brunt K. and van der Kamp J.W. 2012. Die-tary fibre: challenges in production and use of food com-position data. Food chem. 140(3): 562-567.
Wu S.J., Ng L.t., Huang y.M., Lin D.L., Wang S.S., Huang S.N. and Lin c.c. 2005. Antioxidant activities of Physalis peruviana. biol. Pharm. bull. 28(6): 963-966.
Paper Received January 12, 2015 Accepted March 9, 2015

Ital. J. Food Sci., vol. 27 - 2015
ITALIAN JOURNAL OF FOOD SCIENCE (RIVISTA ITALIANA DI SCIENZA DEGLI ALIMENTI) 2nd series
Founded By Paolo Fantozzi under the aeges of the University of PerugiaOfficial Journal of the Italian Society of Food Science and Technology
Società Italiana di Scienze e Tecnologie Alimentari (S.I.S.T.Al)Initially supported in part by the Italian Research Council (CNR) - Rome - Italy
Recognised as a “Journal of High Cultural Level”by the Ministry of Cultural Heritage - Rome - Italy
Editor-in-Chief:Paolo Fantozzi - Dipartimento di Scienze Economico-Estimative e degli Alimenti, Università di Perugia,
S. Costanzo, I-06126 Perugia, Italy - Tel. +39 075 5857910 - Telefax +39 075 5857939-5857943 - e-mail: [email protected]
Co-Editors:gallina Toschi Tullia - Alma Mater Studiorum - Università di Bologna, e-mail: [email protected] Saverio - Università degli Studi di Milano, e-mail: [email protected] Paola - Università degli Studi di Teramo, e-mail: [email protected] Carlo - Università degli Studi di Milano, e-mail: [email protected] Luca - Università degli Studi di Torino, e-mail: [email protected] Milena - SIMTREA - Università degli Studi di Foggia, e-mail: [email protected]
Publisher:Alberto Chiriotti - Chiriotti Editori srl, Viale Rimembranza 60, I-10064 Pinerolo, Italy - Tel. +39 0121 393127 -
Fax +39 0121 794480 e-mail: [email protected] - URL: www.chiriottieditori.it
Aim: The Italian Journal of Food Science is an international journal publishing original, basic and applied papers, reviews, short communications, surveys and opinions on food science and technology with specific reference to the Mediterranean Region. Its expanded scope includes food production, food engineering, food management, food quality, shelf-life, consumer acceptance of foodstuffs. food safety and nutrition, and environmental aspects of food processing.
Reviews and surveys on specific topics relevant to the advance of the Mediterranean food industry are particularly welcome.
Upon request and free of charge, announcements of congresses, presentations of research institutes, books and proceedings may also be published in a special “News” section.
Review Policy: The Co-Editors with the Editor-in-Chief will select submitted manuscripts in relationship to their
innovative and original content. Referees will be selected from the Advisory Board and/or qualified Italian or foreign scientists. Acceptance of a paper rests with the referees.
Frequency: Quarterly - One volume in four issues. Guide for Authors is published in each number and annual indices are published in number 4 of each volume.
Impact Factor: 5-Year Impact Factor: 0.489 published in 2013 Journal of Citation Reports, Institute for Scientific Information; Index Copernicus Journal Master List 2009 (ICV): 13.19
IJFS is abstracted/indexed in: Chemical Abstracts Service (USA); Foods Adlibra Publ. (USA); Gialine - Ensia (F); Institut Information Sci. Acad. Sciences (Russia); Institute for Scientific Information; CurrentContents®/AB&ES; SciSearch® (USA-GB); Int. Food Information Service - IFIS (D); Int. Food Information Service - IFIS (UK); EBSCO Publishing; Index Copernicus Journal Master List (PL).
IJFS has a publication charge of € 350.00 each article.
Subscription Rate: IJFS is now an Open Access Journal and can be read and downloaded free of charge at http://www.chiriottieditori.it/ojs/index.php/ijfs/index
Journal sponsorship is € 1,2010.00
Ital. J. Food Sci., vol. 27 - 2015
ITALIAN JOURNAL OF FOOD SCIENCE
ADVISORY BOARD
SCIENTISTS
R. AmarowiczEditor-in-Chief Polish J. Food and Nutrition Sci. Olsztyn, Poland
A. bertrandInstitut d’Oenologie Université de Bordeaux Talence Cedex, France
L.b. bullermanDept. of Food Science and Technology University of Nebraska-Lincoln Lincoln, NE, USA
F. DevlieghereDept. Food Technology and Nutrition Faculty of Agricultural and Applied Biological Sciences Gent UniversityGent, Belgium
S. garattiniIst. di Ricerche Farmacologiche “Mario Negri” Milano, Italy
J.W. KingDept. Chemical Engineering University of Arkansas Fayetteville, AR, USA
T.P. LabuzaDept. of Food and Nutritional Sciences University of Minnesota St. Paul, MN, USA
A. LeclercInstitut Pasteur Paris, France
C. LeeDept. of Food Science and Technology Cornell University, Geneva, NY, USA
g. MazzaAgriculture and Agri-Food Canada Pacific Agri-Food Research Centre Summerland, BC, Canada
J. O’brienHead, Quality and Safety Dept.Nestle Research CentreLausanne, Switzerland
J. PiggottDepartamento de Alimentos e NutriçãoUniversidade Estadual PaulistaAraraquara, Brasil
J. SamelisDairy Research Institute National Agricultural Research Foundation Ioannina, Greece
M. SumanFood Research Lab Barilla C.R. F.lli spa Parma, Italy
M. TsimidouSchool of Chemistry, Artisotle University Thessaloniki, Greece
Prof. Emeritus J.R. WhitakerDept. of Food Science and Technology University of California Davis, CA, USA
REPRESENTATIVES of CONTRIBUTORS
R. CoppolaDipartimento di Scienze e Tecnologie Agroalimentari e Microbiologiche (DI.S.T.A.A.M.), Università del Molise, Campobasso, Italy
M. FontanaSoremartec Italia, Ferrero GroupAlba, Italy
v. gerbiDipartimento di Valorizzazione e Protezione delle Risorse Agroforestali (DI.VA.P.R.A.)Sezione Microbiologia ed Industrie Agrarie, Università di Torino, Torino, Italy
S. PorrettaAssociazione Italiana di Tecnologie Alimentari (AITA) Milano, Italy
M. RossiDeFENS, Department of Food, Environmental and Nutritional SciencesUniversità di Milano, Milano, Italy

Ital. J. Food Sci., vol. 27 - 2015
gUIDE FOR AUTHORSITALIAN JOURNAL OF FOOD SCIENCE -IJFS
Publication Ethics and Publication Malpractice
Italian Journal of Food Science is committed to upholding the highest standards of publica-tion ethics and takes all possible measures against any publication malpractices. All Authors submitting their works to Italian Journal of Food Science for publication as original articles at-test that the submitted works represent their Authors’ contributions and have not been copied or plagiarized in whole or in part from other works. the Authors acknowledge that they have disclosed all and any actual or potential conflicts of interest with their work or partial benefits associated with it. In the same manner, Italian Journal of Food Science is committed to objec-tive and fair editor(s) review of the submitted for publication works and to prevent any actual or potential conflict of interests between the editorial personnel and the reviewed material. Any departures from the above-defined rules should be reported directly to the editor-in-chief, who is unequivocally committed to providing swift resolutions to any of such a type of problems.
1. Manuscript Submission
Manuscripts must submitted as an electronic version by e-mail to [email protected]. the word processor used to generate the file should be indicated and the files should be saved in format “text only”; graphs, pictures and diagrams must be saved at 300 dpi in TIF, JPG or EPS formats (not included in MsWord documents).
Manuscripts must be typed, double-spaced and pages should be in A4 format using times New roman 12 pt as the advised font. top, bottom and side margins should be 25 mm. Pages and lines on all pages, including those for references and figure legends, must be electroni-cally numbered in the left margin.
english is the official language. the editor-in-chief and/or co-editors reserve the right to make literary corrections and to make suggestions to improve brevity, but the paper must be previously revised for English by the authors. If english is not the mother tongue of authors, they must seek help from one of the following agencies (or other similar official agencies):
www.journalexperts.comwww.sciencedocs.comwww.internationalscienceediting.comwww.writescienceright.comwww.genedits.com
2. Manuscript Preparation
(1) the paper should be divided under the following headings in this order:Title. Informative of the content of the article (<50 characters + spaces).Author(s). Initials and Surname, omit professional and official titles. the institute and ad-
dress where the research was carried out and the current address of each author should be given on the title page.
Abstract. clearly state the objective of the study, give a concise description of experiment(s), observations, results and conclusions. No references should be cited. Do not exceed 100 words.
Key words. up to six words, in alphabetical order, which describe the document must be given to aid data retrieval and indexing.
Introduction. review pertinent previous work and cite appropriate references. State the purpose of the investigation.
Materials and Methods. Indicate apparatus, instruments, reagents, etc., giving sufficient detail to allow the work to be repeated.
Results and Conclusions. results and conclusions may be presented together or separate-ly. concisely present results using tables and figures to help justify conclusions (do not present the same information in both forms). use statistical analysis when appropriate. unsupported hypotheses should be avoided. conclusions should point out the significance of the findings and, if possible, relate the new findings to some problem in Food Science and technology.
Acknowledgments. Acknowledgments of assistance are appropriate provided they are not related to analyses or other services performed for a fee. Financial support, thanks for assist-ance, artic1e number or thesis fulfilment may be included.
Units. A list of units particular to the paper may be included.

Ital. J. Food Sci., vol. 27 - 2015
References. references in the reference list should be arranged alphabetically (initials of first name, only), and, for the same author, should be arranged consecutively by year, typed double-spaced. each individual reference should begin flush left (no indentation). refer to at-tached examples taken from “Style Guide for research Papers” by the Institute of Food tech-nologists (chicago - I1linois - uSA). Literature citations in the text should be referred to by Surname and year in parentheses. If there are more than two authors, give the surname of the first author and add et al. and the year in parentheses. examples: (SMItH, 2007), (SMItH and JoNeS, 2008) (SMItH et al., 2008).
(2) tables should be as few and as simple as possible and include only essential data. each table must be saved and printed on a separate sheet and have an Arabic number, e.g. table 4 Not tab.
4. Legends must be self-explanatory and on a separate sheet. use lower-case letters for foot-notes in tables and explain below the table in the order in which they appear in the table.
(3) Figures must be prepared and saved separately in TIF, JPEG, EPS (300 dpi resolu-tion). they should be prepared so that on 50% reduction, lines, figures and symbols will be clearly legible and not overcrowded. All figures must be given Arabic numbers, e.g. Fig. 3. Legends for figures must be self-explanatory and should be typed on a separate sheet under “Legends to Figures”.
(4) Standard usage, Abbreviations and units. the concise oxford and Webster’s english Dic-tionaries are the references for spelling and hyphenation. Statistics and measurements should always be given in figures, e.g. 10 min, except when the number begins a sentence. When the number does not refer to a unit of measurement it should be spelled out unless it is 100 or greater. Abbreviations should be used sparingly, only when long or unwieldy names occur frequently, and never in the title; they should be given at the first mention of the name. International Standard abbreviations should generally be used except where they conflict with current practice or are con-fusing. For example, 3 mm rather than 3x10⁻³ m. Abbreviations should be defined the first time they are used in the text and they should be used consistently thereafter. temperatures should be expressed in the celsius (centigrade) scale. chemical formulae and solutions must specify the form used, e.g. anhydrous or hydrated, and the concentration must be in c1early defined units.
common species names should be followed by the Latin binomial (italics) at the first men-tion. For subsequent use, the generic name should be contracted to a single letter if it is un-ambiguous.
3. Editorial and Review Policy
Scientific contributions in one of the following forms may be submitted:Reviews –they can be submitted directly to the editor-in-chief or articles can be requested
directly by the editor-in-chief.Short Communications, Surveys and Opinions – they do not need to have the formal or-
ganization of a research paper; they will receive priority in publication; maximum of five pages allowed.
Papers – the paper must follow the guidelines as specified under the section Manuscript Preparation.
reviews, Papers, Short communications and Surveys will be subjected to critical review by referees.
(1) Manuscripts will be processed in the order received. the editor-in-chief will select papers to enter into the reviewing system based on originality and innovation. A letter will be sent to the authors acknowledging receipt of the manuscript along with a Declaration form stating that it has Not been previously published, accepted or submitted for publication elsewhere and agree-ing to the page charges upon acceptance of the paper. on receipt of the signed Declaration form, the editor-in-chief will send the manuscript to a co-editor and/or referees for evaluation.
(2) Authors may suggest to IJFS possible referees. the editor-in-chief and co-editors re-serve the right of their utilization.
(3) referees may not be from the same institution as the author. referees should make their comments and questions in detail and return the paper to the editor-in-chief and/or co-editor as soon as possible, usually within two weeks. the identity and report of the referees are made know to the editor-in-chief, but only the anonymous referee report is sent to the author(s). If all referees recommend acceptance or rejection, the decision stands. If the opin-ions of the referees tie, the editor-in-chief and/or co-editors have the freedom to decide upon acceptance or rejection of the paper.

Ital. J. Food Sci., vol. 27 - 2015
(4) the results of the refereeing process, accompanied by a letter from the editor-in-chief or the co-editor, will be sent to the author(s). Papers needing revision must be returned to the co-editor within the timeframe suggested, otherwise the paper will be considered as with-drawn. A letter announcing acceptance of the manuscript will be sent to the author(s) upon acceptance by the referees.
(5) the authors will receive galley proofs of the manuscript along with the invoice for the page charges (stated on the first page of each issue) which must be paid in order to allow for publication. the proofs will be sent to the corresponding author as a PDF file by e-mail, only. A hard copy will be sent by mail only if the author makes this request when the paper is accepted for publication.
the revised galley proofs must be returned by fax or mail to chiriotti editori – 10064 Pinerolo (to) – Italy –Fax: +39 0121 794480; e-mail: [email protected]
Italian Journal of Food Science would like to thank all the referees who have contributed to keep up the value of the journal with their important work.
For this reason, all the referees can download free of charge all the issues of the Italian Jour-nal of Food Science from our website.
reFereNce eXAMPLeS
EXAMPLES of use in a Reference list are given below. the bold-faced parenthetical type of citation above the example is indicated oNLy for information and is Not to be included in the reference list.
(Anonymous)Anonymous. 1982. tomato product invention merits
ctrI Award. Food technol. 36(9): 23.
(book)AoAc. 1980. “official Methods of Analysis” 13th ed.
Association of official Analytical chemists, Wash-ington, Dc.
Weast, r.c. (ed.). 1981 “Handbook of chemistry and Physics” 62nd ed. the chemical rubber co. cleveland, oH.
(bulletin, circular)Willets c.o. and Hill, c.H. 1976. Maple syrup pro-
ducers manual Agric. Handbook No. 134, u.S. Dept. of Agriculture, Washington, Dc.
(Chapter of book)Hood L.F. 1982. current concepts of starch struc-
ture. ch. 13. In “Food carbohydrates”. D.r. Line-back and G.e. Inglett (ed.), p. 217. AVI Publishing co., Westport, ct.
(Journal)cardello A.V. and Maller o. 1982. Acceptability of
water, selected beverages and foods as a function of serving temperature. J. Food Sci. 47: 1549.
IFt Sensory evaluation Div. 1981a. Sensory evalua-tion guide for testing food and beverage products. Food technol. 35 (11): 50.
IFt Sensory evaluation Div. 1981b. Guidelines for the prepaation and review of papers reporting sensory evaluation data. Food technol. 35(4): 16.
(Non-English reference)Minguez-Mosquera M.I., Franquelo camacho A, and
Fernandez Diez M.J. 1981. Pastas de pimiento. Normalizacion de la medida del color. Grasas y Aceites 33 (1): 1.
(Paper accepted)bhowmik S.r. and Hayakawa, K. 1983. Influence of
selected thermal processing conditions on steam consumption and on mass average sterilizing val-ues. J. Food Sci. In press.
(Paper presented)takeguchi c.A. 1982. regulatory aspects of food ir-
radiation. Paper No. 8, presented at 42nd Annual Meeting of Inst. of Food technologists, Las Vegas, NV, June 22-25.
(Patent)Nezbed r.I. 1974. Amorphous beta lactose for tablet-
ing u.S. patent 3,802,911, April 9.
(Secondary source)Sakata r., ohso M. and Nagata y. 1981. effect of
porcine muscle conditions on the color of cooked cured meat. Agric. & biol. chem. 45 (9): 2077. (In Food Sci. technol. Abstr. (1982) 14 (5): 5S877).
Wehrmann K.H. 1961. Apple flavor. Ph. D. thesis. Michigan State univ., east Lansing. quoted in Wehrmann, K.H. (1966). “Newer Knowledge of Ap-ple constitution”, p. 141, Academic Press, New york.
(Thesis)Gejl-Hansen F. 1977. Microstructure and stability of
Freeze dried solute containing oil-in-water emul-sions Sc. D. thesis, Massachusetts Inst. of tech-nology, cambridge.
(Unpublished data/letter)Peleg M. 1982. unpublished data. Dept. of Food en-
gineering., univ. of Massachusetts, Amherst.bills D.D. 1982. Private communication. uSDA-ArS.
eastern regional research center, Philadelphia, PA.

Ital. J. Food Sci., vol. 27 - 2015
CONTRIBUTORS
Gratitude is expressed to the following entities for contributing to the realization
of the Journal by being supporting subscribers for 2014.
ASSOCIATIONS and COMPANIES
Associazione Italiana di Tecnologia Alimentare (A.I.T.A.) - Parma Fax +39-0521-230507 www.aita-nazionale.it
Società Italiana di Scienze e Tecnologie Alimentari (S.I.S.T.Al) - Perugia Fax +39-075-5857939 www.sistal.org
RESEARCH INSTITUTES
Dipartimento di Valorizzazione e Protezione delle Risorse Fax +39-011-6708549
Agroforestali (DI.VA.P.R.A.), Sezione Microbiologia
ed Industrie Agrarie, Università di Torino, Grugliasco
Biblioteca di Agraria, Fax +39-02-50316427
Università degli Studi di Milano, Milano

Ital. J. Food Sci., vol. 27 - 2015
ITALIAN JOURNAL OF FOOD SCIENCERivista Italiana di Scienza degli Alimenti
DIRETTORE RESPONSABILE: Alberto ChiriottiAUTORIZZAZIONE: n. 3/89 in data 31/1/1989
del Tribunale di PerugiaTIPOGRAFIA Giuseppini - Pinerolo
ISSN 1120-1770 © 2015
CHIRIOTTI EDITORI srl - 10064 Pinerolo - Italy
publishes the technical magazines:

VOLUME XXVII No. 3, 2015
CONTENTS
reVIeW
Applications of Molecular Distillation technique in Food ProductsO. Ketenoglu and A. Tekin .................................................................................................................................277
PAPerS
Antibiotic Susceptibility of Potentially Probiotic Lactobacillus StrainsJunhu Han, Dahuan Chen, Shanshan Li, Xingfeng Li, Wen-Wen Zhou, Bolin Zhang, Yingmin Jia ...................282
effect of Ageing time in Vacuum Package on Veal Longissimus Dorsi and biceps Femoris Physical and Sensory traitsG. Baldi, S. Ratti, C.E.M. Bernardi, V. Dell’Orto, C. Corino, R. Compiani and C.A. Sgoifo Rossi .........................290
quality characteristics of chicken burgers enriched with Vegetable oils, Inulin and Wheat Fiber .....................298A. Cegiełka, M. Chmiel, E. Krajewska-Kamińska and E. Hać-Szymańczuk
Management of Malolactic Fermentation and Influence on chemical composition of Aglianico red WinesS. Suriano, M. Savino, T. Basile, L. Tarricone and D. Di Gennaro .....................................................................310
quality of Autochthonous Sicilian PlumsF. Sottile, V. Girgenti, N.R. Giuggioli, M.B. Del Signore and C. Peano ................................................................320
Different Packaging Methods effects on Sensory quality and chemical criteria of Marinated Shad (Alosa Immaculata, b., 1838)M.E. Erdem, S. Koralb and S. Işidan ..................................................................................................................330
Prevalence and Antibiotic resistance of Food borne bacterial contamination in Some egyptian FoodSamy Selim, Mona Warrad, El Fatih El Dowma and Mohamed Abdel Aziz .......................................................336
bread quality Substituted by Potato Starch Instead of Wheat FlourF. Nemar, A. Dilmi Bouras, M. Koiche, N-E. Assal, A. Mezaini And J. Prodhomme .............................................345
the effect of cooking and Storage on Florfenicol and Florfenicol Amine residues in eggsAyhan Filazi, Ufuk Tansel Sireli, Begum Yurdakok Dikmen, Farah Gonul Aydin and Asli Gul Kucukosmanoglu .........................................................................................................................351
Kefirs Manufactured from camel (Camelus Dramedarius) Milk and cow Milk: comparison of Some chemical and Microbial PropertiesG. Kavas ..........................................................................................................................................................357
characteristics of Gelatin From Swim bladder of yellowfin tuna (Thunnus Albacores) as Influenced by extracting temperaturesO. Kaewdang, S. Benjakul, T. Prodpran, T. Kaewmanee and H. Kishimura ........................................................366
effect of the Addition of Fruit Juices on Grape Must for Natural beverage ProductionL. Chiusano, M. C. Cravero, D. Borsa, C. Tsolakis, G. Zeppa And V. Gerbi .........................................................375
Freeze Drying of Kiwi (Actinidia Deliciosa) Puree and the Powder PropertiesGülşah Çalışkan, Kadriye Ergün and S. Nur Dirim ............................................................................................385
Mineral contents and Physical, chemical, Sensory Properties of Ice cream enriched with Date FibreFiliz Yangılar ....................................................................................................................................................397