Volume 3, Issue 2
37
Sustainable Development Law & Policy Volume 3 Issue 2 Summer/Fall 2003 Article 1 Volume 3, Issue 2 Sustainable Development Law & Policy Follow this and additional works at: hp://digitalcommons.wcl.american.edu/sdlp Part of the Environmental Law Commons , and the International Law Commons is Entire Issue is brought to you for free and open access by the Washington College of Law Journals & Law Reviews at Digital Commons @ American University Washington College of Law. It has been accepted for inclusion in Sustainable Development Law & Policy by an authorized administrator of Digital Commons @ American University Washington College of Law. For more information, please contact [email protected]. Recommended Citation Sustainable Development Law and Policy, Summer/Fall 2003, 1-36.
-
Upload
khangminh22 -
Category
Documents
-
view
0 -
download
0
Transcript of Volume 3, Issue 2
Sustainable Development Law & PolicyVolume 3Issue 2 Summer/Fall 2003 Article 1
Volume 3, Issue 2Sustainable Development Law & Policy
Follow this and additional works at: http://digitalcommons.wcl.american.edu/sdlp
Part of the Environmental Law Commons, and the International Law Commons
This Entire Issue is brought to you for free and open access by the Washington College of Law Journals & Law Reviews at Digital Commons @American University Washington College of Law. It has been accepted for inclusion in Sustainable Development Law & Policy by an authorizedadministrator of Digital Commons @ American University Washington College of Law. For more information, please [email protected].
Recommended CitationSustainable Development Law and Policy, Summer/Fall 2003, 1-36.
CONTENTSEDITOR’S NOTE: AVOIDING ANOTHER BLACKOUT...............................................................................................2
LITIGATION UPDATE: EPA’S ADMINISTRATIVE COMPLIANCE ORDERS RULED UNCONSTITUTIONAL..........................3
LITIGATION UPDATE: THE SILVERY MINNOW: RIO GRANDE’S CANARY IN THE COAL MINE....................................3
FEATURE ARTICLE: EMPOWERING THE WIND: OVERCOMING OBSTACLES TO WIND ENERGY
DEVELOPMENT IN THE UNITED STATES..................................................................................................................5
NEWS UPDATE: MULTILATERAL ENVIRONMENTAL AGREEMENTS AND WORLD TRADE...........................................20
PRACTITIONER’S CORNER: A CONVERSATION WITH NRDC’S GREG WETSTONE................................................21
ARTICLE: THE CHICAGO CLIMATE EXCHANGE: CAN GREENHOUSE GASES BE SIGNIFICANTLY
REDUCED ABSENT GOVERNMENT MANDATES?.....................................................................................................23
BOOK REVIEW: DAVID, GOLIATH, AND THE BEACH CLEANING MACHINE BY BARBARA WOLCOTT................................28
WORLD NEW BITS..........................................................................................................................................29
INTERNATIONAL CALENDAR................................................................................................................................31
AMERICAN UNIVERSITY
WASHINGTON COLLEGE OF LAW4801 MASSACHUSETTS AVE., N.W.
WASHINGTON, D.C. 20016
SUSTAINABLE
DEVELOPMENT
LAW & POLICY
VOLUME III, ISSUE 2 SUMMER/FALL 2003
EXPLORING ENVIRONMENTAL LAW & POLICY ISSUES AROUND THE GLOBE
SUMMER/FALL 2003 2
North America experienced the largest power outage inhistory this past summer. From New York to Detroit,people gazed into the starry night - unobstructed by
light pollution -wondering what could have caused such a hugefailure. The problem was traced back to a few downed powerlines in Ohio and an overburdened and increasinglyinterconnected transmission grid. Almost immediately,politicians and civic leaders were calling for the heads of thoseresponsible. Unfortunately, the blame was placed almostexclusively on the nation’s aging transmission grid rather thanon the nation’s gluttonous over-consumption of power.
With the blackout’s root cause misleadingly diagnosed,most of the proposed solutions have been extremely limitedand, in some cases, wrongheaded. The Bush Administrationand the electric industry insist that the answer to our energywoes is increased supply – in this case, spending billions ofdollars of ratepayers’ money upgrading and modernizing thenation’s power grid. In a mantra that has become all too familiarfrom this Administration, no attention is paid to reducing therate of consumption as a way of minimizing the stress on ourexisting energy infrastructure.
In fact, the Administration has consistently worked toundermine such efforts, whether by slashing funding for EnergyStar – the program dedicated to increasing appliance efficiency– or by exempting over 17,000 energy facilities fromcompliance with the Clean Air Act. When asked whetherAmericans should cut back on energy consumption, PressSecretary Ari Fleischer summed up the Administration’s positionas follows: “That’s a big no. The president believes that it’s anAmerican way of life…the American way of life is a blessedone. And we have a bounty of resources in this country.”
To be sure, we must invest in upgrading our crumblinginfrastructure. But, this is only part of the equation. We mustalso begin using and generating energy more wisely throughgreater efficiency and conservation and a greater reliance onrenewable sources of energy. Especially important is the useof decentralized clean power sources like solar cells and windturbines that can create power at or close to the point ofconsumption, thus avoiding reliance on the transmission gridaltogether.
Before we commit to spending billions of dollars ofratepayers’ money on merely expanding what we currentlyhave, we must consider the alternatives. For example, byadjusting electricity rates according to the level of consumption– as California utilities began doing during the 2001 energycrisis – efficiency and conservation is rewarded by way oflower-than-ordinary rates for the power that is consumed.Myriad other practical examples exist for reducing energydemand: from more efficient building design to the use ofpower-saving lighting and appliances. As decreased demandlowers the stress on the existing infrastructure and the moneyrequired for maintaining the grid, more money can be made
available for tax credits and other incentives for renewableenergy investments. This more sustainable energy path wouldnot only prevent future catastrophic power failures, but wouldalso lead to cleaner air, a healthier environment, and thedevelopment of new industries and jobs.
Dave NewmanEditor-in-Chief
EDITOR’S NOTE
Sustainable Development Law & Policy (SDLP) is a joint publication ofthe Environmental Law Society of American University’s WashingtonCollege of Law and the Center for International Environmental Law(CIEL). CIEL is a public interest, not-for-profit environmental lawfirm founded in 1989 to strengthen international and comparativeenvironmental law and policy around the world. CIEL and WCLestablished the Joint Research Program for International and ComparativeEnvironmental Law at WCL in 1990. No portion of this publicationmay be reprinted without the express written permission of SDLP. Allcorrespondence, reprinting, and subscription requests, and articles submittedfor publication may be sent to: SDLP, Washington College of Law,American University, 4801 Massachusetts Ave., NW, Washington, D.C.20016. E-mail: [email protected]. Phone: 202.274.4430. Fax:202.274.4130. The views expressed in SDLP are those of the authorsand do not necessarily reflect those of the SDLP staff, WCL, or CIEL.
Senior Articles EditorMelissa Frisk
Faculty AdvisorsJames Salzman
Durwood Zaelke
© Copyright Sustainable Development Law & Policy, 2003. All rights reserved.
Editor-in-ChiefDave Newman
Articles EditorsMatt Brown
Melissa DasguptaMary Margaret McCleroy
Melanie NakagawaRoger Phillips
SUMMER/FALL 2003 3
On June 24, 2003, the Eleventh Circuit Court of Appealsdeclared the Environmental Protection Agency’s(“EPA”) authority to issue legally binding
administrative compliance orders (“ACOs”) unconstitutional.1This decision could foreshadow a broader movement toweaken EPA’s ability to enforce the broad range ofenvironmental and public health statutes that it is responsiblefor implementing. While this decision undermines EPA’s abilityto enforce ACOs, it does not leave EPA completely helpless toenforce environmental laws.
When the EPA obtains information that an individual,business, or agency is violating a law, it has four options toenforce compliance.2 First, the EPA can request the AttorneyGeneral to enforce a criminal prosecution.3 Second, the EPAcan file suit in district court for injunctive relief to temporarilystop an action (or non-action) until a trial on the merits can beheard.4 Third, the EPA can adjudicate liability under theAdministrative Procedures Act (“APA”) and assess civil penaltiesagainst the violators.5 All of these actions are subject to judicialreview and none of them are affected by the Eleventh Circuit’sruling.
The EPA’s fourth option is to issue an ACO directingcompliance.6 If the violator continues to ignore the law, thenthe EPA may assess fines and penalties against the violator.7The Eleventh Circuit argues that ACOs are not a final agencyaction and are therefore not subject to judicial review.8 Aviolation of an ACO is its own violation, leading to fines andimprisonment.9 The Eleventh Circuit claims that ACOs, whichin themselves have the status of law with their own civil finesand criminal penalties, are not subject to adjudication aboutany EPA violations, they therefore are unconstitutional.10
Because ACO receivers are not afforded an opportunity torepresent themselves in a neutral tribunal, ACOs violate theviolation of the Due Process Clause of the constitution.11
Furthermore, because ACOs have the status of law and carrytheir own fines, civil penalties, and criminal punishment, ACOsfurthermore violate the separation-of-power principal betweenthe judicial branch and the executive branch in the EPA.12
Whether ACOs are truly unconstitutional is a subjectfor debate. In a separate case, the EPA filed a Supreme Courtbrief on July 16, 2003, in which the EPA claims that the EleventhCircuit’s reasoning for determining that ACOs areunconstitutional was flawed.13 First, the EPA claims that all
EPA orders, including ACOs, are subject to judicial revieweither on petition for review or in an action brought by theEPA to enforce the order in court.14 Secondly, the EPA claimsthat the Eleventh Circuit’s understanding of the Due ProcessClause was erroneous; the Due Process Clause does not requirea formal evidentiary hearing in all circumstances.15
The Supreme Court will ultimately decide the constitutionalityof EPA ACOs. However, even without ACOs the EPA stillhas three methods of enforcement at its disposal. The EPAwill still be able to initiate criminal prosecutions, injunctive relief,assessment of liability, and civil penalties. If the Supreme Courtdeems that ACOs are unconstitutional, the EPA will expendmore time, money, and court resources than would have beenconserved during an informal ACO process. The absence ofACOs does not render the EPA defenseless or void; it still hasthe ultimate avenues of statutory enforcement available- thecourts.
By Mary Margaret McCleroy*
LITIGATION UPDATEEPA’s Administrative
Compliance Orders RuledUnconstitutional
The Silvery Minnow:Rio Grande’s Canary in
the Coal Mine
In a highly anticipated ruling released on June 12, 2003, the10th Circuit Court of Appeals in Denver, Colorado,upheld a New Mexico District Court’s decision allowing
the Bureau of Reclamation (“BOR”) to release water fromdams along the Middle Rio Grande River to preserve theendangered silvery minnow.1 This case has become a “show-down in the West” between man’s need for water versusanimals’, in this case a protected species under the EndangeredSpecies Act (“ESA”).2 It set legal precedents for water rights inNew Mexico and other arid areas of the United States andmay have saved the endangered silvery minnow fromextinction.3
The controversy at issue arose from two acts ofCongress: The Sam Juan-Chama Project (“SJCP”) and theMiddle Rio Grande Project (“MRGP”).4 The SJCP authorizedthe Secretary of the Interior, acting on behalf of the Bureauof Reclamation, to enter into a contract with the City ofAlbuquerque to furnish water for municipal, domestic, andindustrial uses for which the city would pay the costs forconstructing the Heron Dam, the enlargement of the El VadoDam, and general water use for the city.5 The United Statesagreed to construct operate, and maintain the MRGC Projectworks in exchange for their repayment of construction andmaintenance costs.6 Both of these contracts ensure perpetualwater deliveries to the city of Albuquerque, New Mexico, whoseunderground aquifer continues to shrink as its desert population
SUMMER/FALL 2003 4
LITIGATION UPDATEcontinues to grow at unprecedented rates.7
The silvery minnow was listed as an endangered speciesin 1994.8 This once prosperous species, one of the last fivenative species left in the river, now occupies less than 5% of itshistoric range.9 The 10th Circuit Court of Appeals quotedAletta Belin, attorney for Plaintiffs-Appellees, that the silveryminnow is the Rio Grande’s equivalent of a canary in a coalmine; in effect, the silvery minnow is the litmus test for thehealth of the Rio Grande ecosystem.10
The main issue before the Court of Appeals waswhether the BOR had the ability to negotiate the amount ofwater it supplies to New Mexico by complying with the ESAin releasing more water for the Rio Grande, the designatedcritical habitat for the silvery minnow.11 The BOR maintainedthat because their contracts were enacted before 1973 andcontain no express clause that permits the BOR to reducedeliveries of project water below their fixed amounts that theywere unable to comply with the ESA.12 BOR cited Sierra Clubv. Babbitt to support this argument, which holds that Congressdid not intend for section 7 of the ESA to apply to an agreementfinalized before passage of the ESA where the federal agencylacks the discretion to influence private activity for the benefitof the protected species.13
The Court of Appeals distinguished the case fromSierra Club based on several distinctive clauses contained in theBOR contracts.14 BOR limited its liability in case of drought“or other causes” which might affect “the quantity of wateravailable from the reservoir storage complex.15 The contractfurther recognizes that if the actual water supply is less thannormal yield, that the non-federal parties will share what wateris available.16 Therefore, the Court of Appeals held that theBOR retained discretion to determine the amount of availablewater that would be made, including diverting water in timesof scarcity to protect the habitat of an endangered species.17
By affirming, the Court of Appeals also upheld andaffirmed the landmark 1978 decision of TVA v. Hill, placingendangered species at the highest level of priorities in ourcountry. TVA v. Hill prioritized the continued existence of theendangered snail darter above the economic benefits of a nearly-completed dam. The 10th Circuit Court of Appeals decisionin this case sends a strong message to the United States toconserve and use our water and other natural resources insustainable ways.
However, recent legislation proposed by Senator PeteDomenici (NM), may thwart any chances of survival that thesilvery minnow won by its victory in court. Public opinionafter the 10th Circuit’s ruling coupled with an unprecedenteddrought in New Mexico prompted Senator Domenici tosubmit his bill as “an effort to stop any radical interpretationof the ESA on the Rio Grande,” by mandating that the SJCPand the MRGP water contracts supercede the ESA.18 Althoughsome environmentalists think that the Bush administration willencourage this bill, others feel that Domenici’s bill is an
exaggerated and emotional reaction to the current conditionsin New Mexico.19
If Domenici’s bill passes, it could, in one fatal blow,effectively render the ESA moot after a thirty-year history ofprotecting and promoting endangered and threatened species.The destiny of the Rio Grande silvery minnow is not solelyabout the survival of one species of fish, but the largerproblems our world is only beginning to face: overpopulation,scarce natural resources, urban sprawl, and sustainabledevelopment.
(EPA ACO Endnotes)* Mary Margaret McCleroy is a JD candidate at AU Law, degree expected Spring2004.1 TVA v. Whitman, 2003 U.S. App. LEXIS 12830, at *2 (11th Cir. June 24, 2003).2 Id. at *6.3 Clean Air Act, 42 U.S.C. § 7413 (a)(3)(D), (c) (2003).4 42 U.S.C. § 7413 (b).5 42 U.S.C. § 7413 (d).6 42 U.S.C. § 7413 (a)(3)(B).7 42 U.S.C. § 7413 (a)(1).8 TVA, 2003 U.S. App. LEXIS 12830, at *8.9 42 U.S.C. § 7413 (d).10 TVA, 2003 U.S. App. LEXIS 12830, at *9, *10.11 See Id.12 42 U.S.C. § 7413 (c)(1), (d); TVA, 2003 U.S. App. LEXIS 12830 *10.13 Respondent’s Brief for the EPA at *12, Alaska Dep’t of Env’t Conservation v. EPA(No. 02-658).14 Respondent’s Brief at *19, Alaska Dep’t of Env’t Conservation (No. 02-658).15 See Id.
(Silvery Minnow Endnotes)1 Rio Grande Silvery Minnow v. Keys, D.C. No. CIV-99-1320 JP/RLP, 2003 U.S.App. LEXIS 11672, at *5-6 (10th Cir. N.M. June 12, 2003).2 See Douglas Jehl, Take City’s Water or Let Minnow Die, N.Y. Times, Jan. 19, 2003, atA1 (This case poses the most direct confrontation yet between the ESA...andthe waters rights held by cities like Albequerque in Western states where wateris becoming increasingly scarce...”).3 Kate Nash, City, Fish See Fates in Court, Albuquerque Tribune, Jan. 13, 2003,available at: http://www.abqtrib.com/archives/news03/011303_news_fish.shtml.4 Rio Grande Silvery Minnow, 2003 U.S. App. LEXIS 11672, at *31.5 Colorado River Storage Project Act, 43 U.S.C. § 620 (2003).6 Flood Control Acts of 1948 and 1950, 33 U.S.C. §§ 701(s), 701(f)-(2) (2003).7 See Rio Grande Silvery Minnow, 2003 U.S. App. LEXIS 11672, at *31.8 50 C.F.R. § 17.11 (1999).9Appellate Court Affirms Bureau of Reclamation’s Responsibility to Conserve Rio GrandeEcosystem, available at: http://www.fguardians.org/news/pr030612.html.10 See Id.11 50 C.F.R. 17.11; See Rio Grande Silvery Minnow, 2003 U.S. App. LEXIS 11672, at*5.12 See Rio Grande Silvery Minnow, 2003 U.S. App. LEXIS 11672, at *48-50.13 Id.14 See Id. at *55.15 Id.16 Id.17 Id.18 Thomas Hargrove, Domenici Move in Minnow Case a Credible Threat to EndangeredSpecies Act, Enviros Say, ALBUQUERQUE TRIBUNE, June 20, 2003, available at: http://www.abqtrib.com/archives/news03/062103_news_minnow.shtml.19 See Id.
SUMMER/FALL 2003 5
EMPOWERING THE WIND:OVERCOMING OBSTACLES TO WIND ENERGY DEVELOPMENT
IN THE UNITED STATESBy Dave Newman *INTRODUCTION
Imagine a world in which power plants andautomobiles produce zero pollution, where climate changebecomes a manageable problem instead of a growing threat,where farmers and ranchers harvest energy crops alongsideagricultural ones, and the Great Plains displaces the MiddleEast as the main source of energy in the United States. With acombination of policies, incentives, and market transformation,this dream could become a reality within many of our lifetimes.
Wind energy is poised to serve as the foundation ofthis new clean and sustainable energy economy. Energy derivedfrom wind produces no pollution, very little environmentalimpact, and has become cost competitive with othercommercial energy sources. Since 1995, wind energy has grownat about 30% throughout the world, faster than any other energysource.1 Although this growth is encouraging, wind still onlyaccounts for a tiny fraction of world energy supplies and manyobstacles continue to block broader adoption of windtechnologies.2
Tapping into this unlimited resource would also serveto stabilize U.S. energy supply and reduce dependence onforeign sources of energy. The continuous flow of windpower could serve as a hedge against the volatility of naturalgas, oil and other world energy supplies. In addition, miningclean sources of domestic energy would reduce our dependenceon countries that harbor or finance terrorist activities.
Abundant and cheap wind energy could also be usedto electrolyze water to create hydrogen. This would serve as aclean and dependable source of fuel for clean-burning fuel cellengines that are expected to begin displacing internalcombustion engines over the next two decades. As these newtechnologies develop, the United States (“U.S.”) could utilizeits vast wind resources to lead the world to a cleaner energyfuture.
This paper analyzes the development of the windindustry in the United States and the policies and programsthat have been used to spur its growth. Section One discussesthe economic and environmental benefits of wind energy todayand tracks its recent growth within the U.S. and around theworld. Section Two identifies and explains many of theobstacles to growth, including price distortions, discriminatorytransmission policies, infrastructure limitations, and localopposition. Section Three includes a discussion of the federaland state incentives in place today and analyzes their impact onwind energy development throughout the country. SectionFour provides case studies of several states that have led the
way in promoting and developing their wind energy resources.Finally, Section Five presents policy recommendations tomaximize wind energy growth in the future.I. ENVIRONMENTAL AND ECONOMICBENEFITS TO WIND
A combination of energy efficiency programs andlarge-scale renewable energy development would significantlyreduce a number of environmental and public health problemswhile spurring substantial economic growth. Improving energyefficiency is widely accepted as the cheapest, fastest, and mostenvironmentally benign way to meet energy demand.Unfortunately, U.S. utilities have moved away from energyefficiency over the past decade, cutting efficiency programs by45% from 1993 through 1998.3 The U.S. could produce thesame amount of goods and services using 30% less energy byusing energy as efficiently as the European Union.4A. Environmental Dividends
Increasing the global share of wind and otherrenewables in the overall energy supply would significantlyreduce the public health and environmental costs of fossil fueland nuclear energy. Coal-burning power plants cause severepublic health problems ranging from summer smog alerts toasthma, respiratory disease, and even death.5 Reliance on coalalso creates enormous environmental impacts including acidrain and the pollution resulting from mining.6 Nuclear powerpresents a unique set of concerns, including waste disposal,radioactive exposure, and security.7
Wind energy produces no greenhouse gasses or otherpollutants and could help the U.S. and other large pollutersbegin mitigating the potentially disastrous effects of climatechange.8 Unless significant steps are taken to reduce greenhousegasses, the United States could expect to lose up to 14,000square miles of coastal land by the end of this century due torising sea levels.9 The Bush Administration’s most recent reportto the United Nations Framework Convention on ClimateChange anticipates the following impacts associated with humaninduced climate change: temperature rises of 5–9°F, ecosystemshifting, widespread water shortages, loss of forest services,excacerbated water and air pollution, and more volatile anddisruptive storms.10
Wind is a clean, renewable, and domestic source ofenergy that could supply the entire U.S. with electricity.11 If theU.S. replaced about 8600 Megawatts (“MW”) of fossil fuelpower with wind and other non-polluting energy sources overthe next 10 years (about double U.S. installed capacity at theend of 2001), U.S. greenhouse gas emissions could be stabilized
FEATURE ARTICLE
SUMMER/FALL 2003 6
at current levels.12 The seven windiest states in the countryhave the potential to produce nearly 100 times that installedcapacity.13 And when these goals are combined with improvedenergy efficiency and a cleaner burning automobile fleet, it isentirely possible to see how the U.S. could reduce its greenhousegas emissions to well below what would have been requiredunder the Kyoto Protocol.B. Wind Energy Makes Economic Sense
In addition to its environmental benefits, wind energyhas increasingly become a wise economic investment.Technology breakthroughs combined with beneficialgovernment incentives has driven down costs from $0.35/kWh in 1980 to about $0.04/kWh today.14 The Departmentof Energy (“DOE”) and the Electric Power Research Instituteprojects that continued technological advances will drive theprice down to $0.03/kWh by 2004 in high wind areas andbetween $0.03-$0.04/kWh at more moderate wind sites by2007-2015.15
Several other factors account for the drop in the costof utility-scale wind power. Improved wind mapping andturbine siting has enabled wind developers to take advantageof better wind conditions, which drives down costsexponentially. Relatively minor increases in average wind speedcan dramatically boost output and lower costs. For example, alarge power plant in an area that has an average of 7.15 mpswind produces energy at about double the cost of a windfarm with an average of 9.32 mps wind.16
Inexpensive computing technology has alsocontributed to reducing the cost of wind power over the pasttwo decades. Such advanced technology has enabled designersto use extremely sophisticated models to improve machinedesigns, reduced and streamlined manufacturing costs whileimproving quality, and allowed operators the ability to remotelymonitor and control turbines and more efficiently conductroutine preventative maintenance.17
In addition to wind speed, the size of the wind farmalso affects the cost of the power generated. In general, afacility with more installed generating capacity will producepower more cheaply than a smaller facility. This results fromthe larger facility’s ability to spread the cost of transmission,interconnection to the grid, and other fixed costs over a largernumber of power producing turbines. The American WindEnergy Association estimates that a 51MW wind facility cangenerate electricity $0.023/kWh cheaper than a 3MW facility.18
In most cases, that price differential is the difference between aparticular project’s commercial viability.
Another factor affecting the cost of electricity fromwind is project financing. A wind power project’s initialconstruction costs can be up to 40% cheaper when built andfinanced internally by a public utility as compared with a privatelyowned and financed independent power producer.19 Thisresults in part from more restrictive financing terms forprivately owned and financed projects. Such restrictions arenot imposed when a utility is financing its own project.
Wind energy also makes economic sense for thecommunities in which it is harnessed. Farmers and ranchers,whose land might generate $120 worth of grain or $20 worthof beef per acre, can make $2,000 or more by leasing theirland to wind developers.20 In addition, wind turbines can co-
exist with farming, ranching and other rural land-uses, usingonly about 5% of the landmass on which they are installed.21
As farmers and ranchers find it increasingly difficult to stayafloat, wind energy could become a clean cash crop that couldhelp to revive sagging rural economies throughout the country.A recent study estimated that the 240 MW of wind powerinstalled in Iowa from 1998-99 created 200 short-termconstruction jobs, 40 new permanent jobs, $2 million in newlocal tax revenue, and $640,000 annually in lease payments tolandowners.22
C. Recent GrowthThe modern wind energy industry has matured
significantly over the last decade. The industry had total salesof $5.2 billion in 2001 and is expected to nearly double withinthe next 5 years.23 Since 1990, worldwide wind energy hasgrown from just under 2000 MW installed capacity to nearly30,000 MW, enough power to meet the demand ofapproximately 35 million people at typical consumption ratesin economically developed countries.24
Given the beneficial environmental and economicattributes of wind, it is not surprising that it has become thefastest growing energy source in the world today. In the mid-1990’s Europe surpassed the U.S. as the global leader in windenergy production. Today, nearly three-quarters of the world’swind power is generated in the European Union (“E.U.”).25
After a lull in new wind generating capacity throughout themid-1990’s in the U.S., capacity expanded by more than 66%in 2001 to a total of 4260 MW.26 Despite this huge jump incapacity, wind energy still only produces 0.3% of the nation’selectricity supply.27
A large reason why the U.S. is falling behind the E.U.in new wind energy development is their divergent policies onglobal warming. Despite being the world’s top emitter ofgreenhouse gasses, the Bush Administration has withdrawn theUnited States from the Kyoto Protocol on Climate Change.Ignoring the fact that the U.S. has some of the most abundantuntapped wind and solar resources in the world, current U.S.climate change policy instead follows a voluntary approachthat does not strive for overall greenhouse gas reductions. Infact, the U.S. DOE currently projects a 17% increase in U.S.emissions by 2012, an average increase of 26.63 million metrictones per year.28
In sharp contrast to the U.S., the E.U. and its membernations have ratified the Kyoto Protocol, with a commitmentto reduce its greenhouse gas emissions by 8% below 1990 levelsby 2008-12.29 The European Climate Change Program hasbeen created to coordinate the actions of its member nationsand to establish an emissions trading system.30 On September27, 2001, the E.U. issued a renewable energy directivedemonstrating its commitment to increasing its reliance onrenewables as a way to combat climate change and to promote“the security and diversification of energy supply, environmentalprotection and social and economic cohesion.”31
The U.S. has abundant sources of wind that, ifharnessed, could more than supply the nation’s energy needs.However, the windiest states in the country currently take littleadvantage of their vast wind resources. The windiest 7 stateshave nearly 68% of nation’s wind potential but only produce23% of the nation’s wind power today. 32 In contrast, the top7 producing states have only 24% of the nation’s wind energy
SUMMER/FALL 2003 7
potential but currently produce almost 80% of the nation’swind energy.33
II. OBSTACLES TO GROWTHModern wind energy development has been
inconsistent in the U.S. over the past thirty years. Following theenergy crises of the 1970’s, the state of California single-handedly put large-scale wind power on the map. Favorableregulations and relatively high long-term electricity prices helpedto sustain wind energy growth in California until the early 1990’s.
In the 1990’s, wind energy began to boom throughoutthe world due to technological improvements and lower costs.At the same time, development stalled in the U.S. because ofthe expiration of favorable long-term contracts and a plentifulsupply of cheap fossil fuels. Ironically, the promising, cleantechnology that was pioneered in the U.S. was becoming bigbusiness overseas while the U.S. sat on the sidelines. By the endof the 1990’s, a number of factors led to a revival in U.S. windenergy development. These included renewable energyprovisions attached to electric deregulation legislation in manystates, the effect of state and federal incentives, and a growingawareness of and concern over global warming.
Although wind energy has grown cost competitivewith other more traditional sources of power over the pastdecade, several obstacles impede progress towards windbecoming a major component of the nation’s energy portfolio.These obstacles include price distortion, discriminatorytransmission policies, infrastructure limitations, and localopposition.
Removing these barriers would unleash powerfulmarket forces and spur significant job creation, sustainableeconomic growth, dramatic reductions of smog, soot, andgreenhouse gas emissions, and increased U.S. energyindependence. Fortunately, the collective experiences of severalof the nation’s leading wind-producing states as well as theinnovative policies of the European Union and some itsmember countries provide a blueprint for creating effectivepolicies that create opportunities for growth.A. Price Distortion: External Costs and Market-SkewingSubsidies
Even at near-competitive prices, the cost of windenergy remains artificially high because it does not reflect manyof its beneficial environmental attributes. Every MW of powerproduced by wind reduces the environmental and societal costof pollution from fossil or nuclear power plants. If theseexternal costs were adequately reflected in the price of energy,the cost of wind energy would appear significantly cheaperthan it does at currently calculated prices.
According to Lester Brown, director of the EarthPolicy Institute, “the key to sustaining economic growth is tellingthe ecological truth.”34 Unfortunately, unbalanced subsidiescombined with current accounting methods that externalizeenvironmental and public health costs prevent energy marketsfrom accurately reflecting the ecological truth in the cost ofenergy.35 The disproportionate allocation of governmentsupport for non-renewable energy artificially lowers the marketprice of energy generated from these sources. This distortsthe relative cost of energy from different sources and limits orexpands the ability for certain technologies to developcommercially.
A study done by the Renewable Energy Policy Projectfound that fission-related nuclear power received subsidiesamounting to $15.30/kWh during the first 15 years (1947-61)of federal support, whereas wind received only $0.46/kWhover the course of its first 15 years (1975-89).36 Theseunbalanced subsidies have allowed a comparativelyuneconomical nuclear energy source to defy market influencesby artificially concealing its true cost. In 2002, fossil fuelsreceived approximately ten times and nuclear power more thantwo and a half times the total amount of tax breaks andsubsidies as renewable energy.37 Notwithstanding the federalgovernment’s relative lack of support for wind energy, thetechnology and the markets have managed to develop to thepoint where wind is nearly economically competitive despitethese market distortions.Source: See Note 75
In addition to unbalanced subsidies, the externalenvironmental and public health costs of polluting non-renewables are also not currently reflected in consumer prices.Examples of such externalities include: health care costs fromincreased respiratory disease, loss of productivity stemmingfrom absenteeism at work and school, the loss of forest servicesdo to acid rain and other pollutants, water pollution from fuelextraction, and the impact on fisheries from mercury and otherairborne pollutants. If these costs were incorporated into themarket price of energy, the cost of wind and other cleanrenewables would remain level while the cost of coal, oil andother polluting fuels would increase substantially.B. Discriminatory Transmission Policies & InfrastructureLimitations
This section discusses how transmission issues impedeprogress towards more wind power development byconsidering the following: how certain transmission policiesdiscriminate against wind power; how system inefficiencies limitthe availability of transmission services; and the impact oflimited transmission infrastructure near some of the nation’swindiest sites.
1. Discriminatory Scheduling andInterconnection PoliciesPerhaps the greatest impediment to the development
of wind resources in the U.S. today is an outdated transmissioninterconnection policy that discriminates against intermittentpower producers like wind and solar. This, in part, is the resultof a regulatory framework that was created by and formonopoly-controlled utilities with traditional fossil and nuclearpower plants in mind. Although deregulation has brought withit a promise of true competition and customer choice, progresshas been slow towards realizing that goal.
a. Scheduling PenaltiesThe most difficult transmission obstacle for wind
producers are scheduling penalties that charge generatorswhenever they deviate from pre-set delivery schedules. In 1996,the Federal Energy Regulatory Commission (“FERC”) issuedan Order requiring that utilities under their jurisdiction opentheir transmission lines to a wider range of wholesalecustomers.38 The Order established rules for open access thatfavored traditional large fossil fuel and nuclear plants at theexpense of wind, solar, and other intermittent resources. Inorder to ensure system stability, reliability, and predictability theOrder established rules that severely penalize scheduling
SUMMER/FALL 2003 8
deviations regardless of whether the result of intentionalmanipulation or due to the intermittence of the energyresource.39
The American Wind Energy Association and otherspropose a variety of solutions that promote non-discriminatoryscheduling policies while simultaneously ensuring overall systemstability. These include real-time balancing markets, theelimination of scheduling penalties, and allowing electricitygenerators to schedule as close to real time as possible.40 Real-time balancing markets charge or credit wholesalers fordeviations based on the value of the energy at the time of thedeviation. This allows for market based efficiencies to influencewholesalers’ behavior and eliminates unfair and arbitrarypenalties for those, like wind producers, who cannot controlprecisely when they will be generating power.41
b. Interconnection Fees & AgreementsInterconnection fees that are based on peak output as
opposed to overall transmission usage severely limit windpower’s access to the grid. Although such a fee structure makessense in allocating charges to an energy producer that is sendinga steady and constant flow of electricity at or close to peakcapacity over the grid, it unfairly penalizes wind energyproducers that rarely achieve peak output. These fees put windat a competitive disadvantage with more traditional, pollutingsources of power because they are forced to recover the costof these fees over fewer kWh’s than their competition.42
Complex interconnection agreements often stand inthe way of small-scale (less than 2 MW) power producers fromdeveloping their projects. Unless utilities are required to simplifythe process of connecting to the grid with simpler, standardizedcontracts, they have little incentive to accommodate these smallproducers. Some states, like Minnesota, have successfullypressured utilities to adopt such standard interconnectionagreements, which enable more small wind producers to comeon line.43
c. Embedded CostsAnother concern for wind power producers relying
on the grid is the way in which the embedded costs requiredfor construction and operation of the existing transmissioninfrastructure are distributed amongst users. In some parts ofthe country, transmission owners charge these embedded coststo generators based upon the distance between the generatingfacility and the nearest “load center.”44 Because wind generationoften occurs in remote locations far from where the energywill ultimately be consumed, wind generators aredisproportionately penalized by such cost allocations.
d. “Pancaking” (Duplicative) FeesA fourth problem for wind energy is the current
structure in use throughout most of the country whereby theaccess fees charged by transmission operators “pancake” ontop of each other. This requires generators that aregeographically distant from their customers to pay thecumulative fees charged by any transmission owner whose linesthey are using instead of paying one fee relative to their overalluse of the grid.45
2. Availability of Limited TransmissionCapacity for WindAnother transmission obstacle to wind power is that
existing transmission capacity is limited due to systeminefficiencies and a lack of transmission infrastructure in many
of the country’s windiest locations. In some states, limitedinterstate transmission capacity has not only dissuadedinvestments in wind power but has also led to strong industryopposition to adoption of state-wide incentives and programsto study and encourage wind energy development. Forexample, energy interests in South Dakota, an electricityexporting state with tremendous wind resources, have blockedefforts to increase wind energy development because they fearthat it would compete with existing electricity exports generatedmainly from coal.46 As a result, the windiest state in the countrycurrently produces only 3 MW of wind power.47
Thermal, voltage, and system operating constraintsstemming from outdated technology create inefficiencies thatseverely limit the amount of power that can safely be transmittedover the grid.48 As wind generators and other power producerscompete for an increasingly limited amount of transmissioncapacity, alleviation of these constraints will allow more powerto flow over the grid and reduce the need for new transmissionconstruction. Upgrading the transmission infrastructure toincrease capacity is also cheaper than building new power lines.49
Other improvements and upgrades such as replacing mechanicalswitching systems with fiber optics and integrated computersystems would allow system operators the ability to move morepower more quickly without sacrificing quality or safety.50 Suchimprovements could lead to an increase in productivity andefficiency of the energy system by at least 30%.51
3. Stringing Wires – Expanding the GridA common concern regarding transmission obstacles
to new wind development is the need to string wires out toremote locations with the best wind resource availability. Thereare two major issues related to this concern: the environmentaland social impact of new power lines and identifying whoshould be responsible for installing and managing these interstateregional routes.
The impacts of new power lines and transmissionfacilities, however, must be balanced against the impacts ofexisting polluting and fuel-intensive power plants. Theenvironmental and public health costs of building newtransmission infrastructure out to clean renewable energysources is a tiny price to pay in relation to the benefits of reducedair and water pollution, decreased respiratory illness, and lowergreenhouse gas emissions. The emphasis must not only be onincreasing the overall amount of wind and other renewableenergy that is generated, but also on dramatically increasingenergy efficiency so that renewables become an increasingpercentage of overall energy use.C. Local Opposition
Despite economic and environmental benefits of windpower, some wind projects face local grassroots oppositionto development. This opposition usually stems fromenvironmental concerns such as wind turbines’ impact onmigratory bird flyways or fisheries (in the case of offshoreturbines) and visual and noise disturbance.
Cape Cod has recently become a hotbed of localopposition to a proposed wind farm in Nantucket Sound.The $500 million project would be the largest wind facility inthe country: consisting of 170 turbines approximately 5 milesoff shore that would stretch over 25 square miles and producea peak output of 420 MW (enough to power over half of theCape).52 The Alliance to Protect Nantucket Sound is organizing
SUMMER/FALL 2003 9
opposition to the project claiming that it will create a“permanent industrial facility in a pristine natural environment.”53
To assuage public concerns and minimize environmentalimpacts, wind energy projects must be subject to publicparticipation.
Indeed, utility scale wind farms can have seriousenvironmental impact if they are sited improperly. A commonconcern is the impact wind facilities have on birds. Althoughavian deaths continue to occur due to collisions andelectrocution, the numbers are very small relative to avianmortality resulting from other human structures like vehiclesand plate glass.54 Even these deaths can be minimized, however,with careful siting of turbines, proper study of birds sight andflight patterns, and reducing the number of wind measurementtowers.55 It also should be kept in mind that the environmentalimpacts of wind facilities are extremely small when comparedwith those of fossil fuel and other traditional polluting plants,in addition to the impact caused extracting and transportingfuel and waste.III. OPPORTUNITIES FOR GROWTH
Many of the obstacles discussed in the preceding sectioncan be addressed by implementing and strengthening policiesand incentives supporting wind energy. For example, mandatesthat require utilities to develop wind energy projects force thoseutilities to become strong advocates for ensuring that theirregional transmission policy is favorable to wind. And oncetransmission policy is reformed, an increasing number of windprojects would become commercially viable independent ofgovernment mandates.
Myriad policy tools have been used throughout thecountry in an effort to spur this type of growth, although notoften in an integrated and comprehensive fashion. While somestates such as Minnesota, Texas and California have taken anactive approach to encouraging renewables, others have donelittle. In addition, effective federal policies such as the ProductionTax Credit have been enacted only for short periods, allowedto expire, and then reenacted for another short term. Thisinconsistent approach has created boom and bust cycles ofinvestment rather than encouraging a stable and long-terminvestment environment that would best benefit the growthof these nascent renewable energy industries.
Support and incentives from federal programs areuniformly available throughout the country. However, stateand local policies and incentives for wind are by no meansuniform. In fact, much of the disparity in wind productionbetween particular states can be attributed to the degree towhich state incentives and programs actively promote thetechnology. Creating an appropriate, efficient, and effectivegovernance structure is an essential step towards widespreadand pervasive renewable energy development. Policymakersmust choose wisely among a broad array of options byharmonizing the policies of different governmental entities andacross competing energy industry sectors. These range frommarket based mechanisms such as ecological tax reform toregulatory approaches such as stricter pollution controls. Absenta more integrated and comprehensive approach, the enactmentof disjointed and uncoordinated renewable energy policies runsthe risk of redundancy, impotence, and a lack of popularsupport. The following is a discussion of a variety of renewable
energy policies that have been used within the United Statesand Europe. The list is not exhaustive.A. Governmental Support for Market Stimulation &Commercialization
1. Research Development & Demonstration(RD&D)The U.S. DOE’s Wind Energy Program provides
support for research and development of wind energytechnologies and serves as a clearinghouse of importantinformation for industry and government decision-makers,public interest organizations, and the general public. Theprogram is run through the National Renewable EnergyLaboratory’s National Wind Technology Center in Golden,Colorado and the Sandia National Laboratories in Albuquerque,New Mexico. The Program is divided into three research areas:Applied Research, Turbine Research, and Cooperative Researchand Testing.56
The Applied Research division focuses on developingtechnological breakthroughs in turbine engineering andmanufacturing. To accomplish this, they analyzes wind dynamics,aerodynamic and structural design, and work to develop moresophisticated control systems and components.57
The Turbine Research division develops public-privatepartnerships to research, design, build, test and refinecommercial wind energy systems. Private partners are invitedto participate based on a competitive solicitation process and,once chosen, share in part of the cost of the project.58
The Cooperative Research division works to educateand involve the public to help foster broader market acceptanceof wind energy. The division also works to help the electricindustry integrate wind into the energy supply.59
In total, the Wind Energy Program received $40 millionin FY2001 to carry out its work.60 By contrast, federal R&Dfunding for coal was $170 million in FY2001.61
2. Public Benefits Funds/System BenefitsChargesPublic Benefits Funds (“PBF”) are typically used to
ensure continual financial support for state renewable energyprograms, energy efficiency programs, and low-income energyassistance. The funds are supported by small charges that areregularly assessed on electricity consumption in the state. Fifteenstates currently have some sort of PBF in place and all but one(Maine) require mandatory charges.62
Massachusetts established a Public Benefits Fund thatwill direct $150 million over five years to renewable energyprograms.63 The fund’s resources are currently being focusedon development of green buildings, distributed renewablepower, and a green power development program.64 The fundalso provides grant money for projects developing renewablepower technologies and for the purchase of green power.65
Oregon’s Public Benefits Fund assesses a 3% surchargeon all electricity users inthe state.66 This raises $60 million peryear, 13% of which has been earmarked for renewable energyprograms.67
California leads the nation with its $540 millionrenewable energy trust fund.68 Of that amount, $240 millionwill be spent on the development and maintenance of existingrenewable projects and $161 million on new projects.69 As ofthe fall of 2001, funding made available under the program
SUMMER/FALL 2003 10
has supported the development of over 900MW of new windgenerating capacity in the state.70
3. Government Green Power Purchases/AggregationOne of the most effective ways government entities
can support growth in renewable energy markets is throughGreen Power Purchases whereby they commit to purchase largequantities of renewable energy over an extended period oftime. By directing its purchases in this way, governments candramatically increase demand for renewables, thereby helpingto create economies of scale that reduce price and increasereliability. Directed government purchasing has been one ofthe most effective ways of establishing viable commercialmarkets for recycled paper and other materials.
The U.S. government is the largest single energy userin the country, spending over $4 billion annually on electricity.71
Several federal pilot projects have begun where certaingovernment agencies have agreed to purchase renewable energy.States and municipalities throughout the country have also agreedto such purchases. The city of Santa Monica, California becamethe first city in the country to switch over to 100% renewablesin June 1999.72 The agreement calls for approximately 5MWof green power for which the city will pay a 5% premium.73
The energy is provided by The Geysers – the world’s largestgeothermal resource.74
B. Financial Policy1. Production Tax CreditsOriginally passed into law as part of the Energy Policy
Act of 1992, the Renewable Energy Production Tax Credit(“PTC”) allows wind energy producers a $0.015/kWh creditfor ten years after a qualified facility enters service.75 Adjustedfor inflation, the credit is worth $0.018/kWh today. Theavailability of the PTC has served as an essential tool in enablingwind energy producers to secure financing for projects thatotherwise may not have been available to them. Because thecredit depends on production instead of a facility’s ratedcapacity, it creates incentives for increased efficiency in designand operating productivity.
Although originally set to expire at the end of 2001, inMarch of 2002, Congress extended the credit for two yearsuntil the end of 2003.76 Legislation currently pending wouldfurther extend the credit to the end of 2006.77 The DOE’sEnergy Information Administration predicts that the availabilityof the extended tax credit would result in a 17.24% increase inthe non-hydroelectric renewable share of the total U.S. electricitymarket by 2020.78
The PTC has been one of the most important marketdrivers for wind energy over the past decade, enabling windto compete economically with more traditional forms ofsubsidized energy like gas, coal, and nuclear. However,uncertainty surrounding the availability of the credit over thelong-term has undermined some of its beneficial effect. Winddevelopers and their financial backers continually struggle toplan projects beyond the current deadline of the credit becausethey are unsure if the political environment will support yetanother extension.
2. Production IncentivesSimilar to the PTC, the Renewable Energy Production
Incentive (“REPI”) provides direct financial support for windenergy development. REPI is available to government-owned
wind production facilities as well as not-for-profit electriccooperatives. Instead of a tax credit, however, qualified facilitiesare eligible for annual incentive payments of $0.018/kWh(inflation adjusted) for the first ten years of operation andpayments are subject to the availability of annually appropriatedfunds. The program has paid out $2,440,907 to wind energyproducers from 1995 through 2001 for over 150 million kWhgenerated.79
In addition to the federal production incentive (REPI),13 states also currently provide some form of renewableenergy production incentive.80 Minnesota’s “Wind EnergyGeneration Incentive” establishes a production payment of$0.015/kWh for facilities under 2MW.81 The payment wasimplemented to help developers of small wind farms whomay not have a large enough tax liability to take advantage ofthe federal tax credit. Qualifying renewable energy facilities inthe state may receive the payment in addition to the $0.018/kWh credit available at the federal level.82
3. Electricity Feed LawsElectricity Feed Laws (“EFL”) mandate fixed payments
by utilities for renewableenergy generated by independent power producers. Germany,Denmark, and Spain have relied on such laws over the pastdecade to spur the development of well over half of the world’swind energy generating capacity within those countries.83
Enacted in 1990, Germany’s EFL specified rates thatwere calculated as a percentage of average electricity pricesand were set differently depending on the source of the power.84
By requiring utilities to purchase renewable energy fromindependent power producers at commercially attractive rates,the economic climate for renewable investments in Germanystabilized and became predictable, thereby ushering in an eraof serious investment opportunities. As a result, Germanyexperienced a 5000-fold increase in wind energy capacity since1990.85
In 1997, Spain enacted energy legislation setting a goalof doubling the nation’s renewable energy supply to 12% by2010.86 The law requires utilities to acquire all renewable energyfrom approved projects and mandates premium payments forrenewable energy.87 For example, electricity produced fromwind or hydro power will receive a premium of approximately$0.03/kWh until 2007.
4. Ecological Tax Reform / Carbon TaxMore comprehensive than production tax credits, feed
laws, or subsidies, Ecological Tax Reform (“ETR”) increasestaxes on polluting energy sources while simultaneously reducingthe tax burden on employment, thus reducing demand forpolluting sources of energy and stimulating job creation. In1999, Germany embarked on three-stage tax reform policy asa way of promoting employment and sustainable economicgrowth while also protecting natural resources. The policy’srationale is to shift the tax burden from employment to energyin order to spur efficiency, innovation, job creation.88 The firststage imposed a new tax on electricity, fuels, heating oil, andnatural gas.89 Although the new tax policy does not distinguishbetween electricity from renewable sources and that frompolluting sources, the expected revenue generated from thetax on renewable power will be diverted back into a greenenergy fund dedicated to promoting renewable energyinvestments.90
SUMMER/FALL 2003 11
Although the goals and overall policy of ETR inGermany are consistent with internalizing externalenvironmental costs, the polluter pays principle, and sustainabledevelopment generally, some have argued that it does not gofar enough and fails to harmonize with other inconsistent policyobjectives being furthered in Germany. For example, the taxreform does not eliminate or even reduce subsidies currentlybeing provided to the German coal industry due to pressurefrom coal miners in the Ruhr region.91 In addition, lowerenvironmental tax rates have been built into the ETR forcompanies in the manufacturing, agricultural, and forestrysectors in order to limit the short-term economic burden oneconomic growth.92
Despite these inefficiencies, the German Institute forEconomic Research has concluded that the German ETR willresult in a 2-3% reduction in CO2 emissions in the mediumterm and create 250,000 new jobs by 2010.93 Despite theemployment benefits of the ETR, economists fear that theshort term increase in energy prices imposed by the increase intaxes could create a drag on gross domestic product andeconomic expansion.94 In response to this concern, someeconomists have advocated diverting a portion of the revenuegenerated by the tax into increased R & D for domesticindustries.95 One such study found that using 15% of newrevenues for such purposes could ameliorate the negative dragon GDP without significantly reducing the benefits toemployment growth and the reduction in CO2 emissions.96
5. Tax Deductions / ExemptionsStates employ a variety of tax-based incentives to
promote renewable energy investments. Over half providesome type of corporate income tax deduction, 28 states allowfor property tax breaks for property with installed renewables,and 18 states cut or eliminate sales tax on renewable energyequipment.97
Some states, like Massachusetts, allow a sales taxexemption on the sale of renewable equipment that will beused for residential purposes.98 Others, like Minnesota, exemptsales tax for any purchaser of renewable equipment,commercial or residential.99 States also differ in what type ofequipment they will exempt from sales tax. Iowa, for example,allows for the total cost of the wind energy equipment as wellas any materials used to manufacture that equipment.100
A range of corporate tax credits and deductions areavailable that allow a corporation to deduct up to 35% of thecost of renewable energy equipment and/or the cost ofinstallation of such equipment. Some states limit these incentivesto facilities with installed generating capacity above or below acertain rated power threshold.101
C. Market Obligations / Renewable Portfolio Standards(RPS)
Renewable Portfolio Standards require that energygenerators produce a specified portion of their electricity fromrenewable resources. Utilities can choose to generate the powerthemselves, purchase it from another producer, or secure theequivalent quantity through Renewable Energy Credits(“RECs”). Over time, the percentage of energy that must comefrom renewable sources increases as a percentage of the state’senergy portfolio.
REC’s represent a specified unit of renewableelectricity that has been consumed in the state, regardless of
who actually produces the power. The credits enable utilitiesin areas without good wind resources to meet their renewablerequirement by purchasing credits from power producers inwindy areas. This encourages the most promising renewableresources to be developed by ensuring that there is a marketfor their energy product.
This is a hybrid approach that relies on both statemandates and market mechanisms to achieve its goal ofincreasing the percentage of renewables used in the state. Manyof the ideas behind the trading system stem from the existingClean Air Act permit system that has successfully reduced sulfurdioxide across the country. For an RPS to effectively increasethe use of renewables, however, the definition of “renewableenergy” included in the standard must be limited to resourcesthat are truly renewable like wind, solar, and geothermal. Bychoosing what types of renewables will satisfy the RPS mandate,states can dictate their energy portfolios while relying on marketforces to determine how the standards will be met. At the endof a specified period (usually every year), utilities and otherelectricity retailers must have a certain amount of REC’s ormust be forced to pay a penalty.
Fifteen states have adopted portfolio standards as away of ensuring that renewables comprise an increasing portionof electricity consumed within the state.102 For example,Massachusetts created an RPS in its 1997 deregulation legislationthat mandates 4.5% renewables by 2009 and then increases 1%per year thereafter.103 Under the program, generators maypurchase renewable energy credits from a corporation set upby the state’s Renewable Energy Trust.104 For 2003, a 1MWcredit will cost $50 (or $0.05/kWh) which is expected to bemore than the incremental cost of installing new renewablepower sources.105 This provides an incentive for utilities tosupport new renewable energy projects instead of simplypurchasing more expensive credits in order to meet theirobligations under the RPS.Texas established its RPS and credit program through a ruleissued by the state’s Public Utilities Commission in Decemberof 1999.106 The program requires 2000MW of new renewableenergy by 2009 and allocates each retailer a share based uponits share of the state’s retail market.107 Since the RPS wasannounced, Texas has added over 915MW of wind generatingcapacity, with immediate plans for at least 220 more.108
In addition to statewide programs, momentum is building forthe creation of a national RPS. Such a program would promoterenewable energy evenly throughout the country, therebyencouraging the most efficient means of generating power. Inaddition, a national program would help to spur a regionallybased approach to overcoming many of the transmissionlimitations impeding growth in wind energy development inthe windiest locations like the Dakotas and Great Plains states.According to a report by the Union of Concerned Scientists, aNational RPS requiring 20% renewables by 2020 would create$80 billion in new capital investments, generate $5 billion innew local tax revenues, and create $1.2 billion in lease paymentsto farmers, ranchers and other rural landowners for windenergy.109
D. Green Power Marketing1. Green Power PricingGreen power pricing strives to increase renewable
energy development by allowing consumers to pay a premium
SUMMER/FALL 2003 12
in exchange for an environmentally preferable energy product.Although 40 million American homes had been given this choiceas of October 2001, only 350,000 have chosen to buy it.Consumer demand for green power amongst non-residentialcustomers is even lower.110
Some states have required that energy providers givetheir customers a green power option. As of October 2001,electric utilities in Minnesota are required to provide a greenpower option and may charge a premium amount no morethan the difference between the cost of the renewable energyand the same amount of nonrenewable energy.111
Some have theorized that the market share of greenpower pricing will increase over time in much the same waythat bottled water and organic foods have. The expectation isbased on the idea that choosing an electricity provider is stillforeign to many, but as consumers become more familiar withthe concept and more knowledgeable of their options, morepeople will choose the green power option.112
The comparison between premium priced greenpower and organic food is incongruous, however, because theformer depends on a minority of dedicated people to pay theadded cost for benefits that are distributed broadly throughoutsociety. By contrast, people choose to pay extra for organicfood because they personally can reap the benefits. Greenpower, however, does not work this way. In many cases, theenvironmental benefits of the renewable facility being supportedby increased rates may not be directly noticeable to thatconsumer.
Broad social benefits that are felt by all should not relyon the good will and foresight of a few exceptionally motivatedindividuals. The costs associated with such benefits should beas equally distributed as the benefits themselves.
In theory, green power pricing allows market forcesto dictate which energy resources are utilized. Unfortunately,there are many practical problems that often prevent this theoryfrom being realized. Relative costs and benefits of wind versusmore polluting energy sources are not accurately reflected inthe market price. When consumers are given a choice between$0.03/kWh for coal power or $0.045/kWh for wind, theseprices do not account for health care costs for respiratorydisease stemming from the coal plant’s emissions or the valueof coastal land swallowed up by rising sea levels. If thesecosts were internalized into the price of power for theconsumer, there would be no need to market wind as anenvironmentally preferable choice, because it would simply bea cheaper option.
Despite these practical problems, in some cases greenpricing programs have provided a hedge against the volatilityof natural gas and other nonrenewable energy sources. Forexample, the city of Austin, Texas established a Green ChoiceProgram in 2000 that offered consumers the option to pay a$0.0285/kWh power charge replacing the current $0.0268/kWh fossil charge to purchase their power from a newly installed59 turbine 40MW wind farm. The higher green power chargewas guaranteed to remain at that level for 10 years even if thecost of fossil energy rose above that. Within 10 months, theprogram was fully subscribed with 3075 participants. Theaddition of this wind power will raise the percentage ofrenewable power in the city of Austin from 0.5% to 2.5%.113
2. Green Energy CertificatesGreen Energy Certificates (“GECs”) represent the
beneficial environmental attributes of power that is generatedfrom a renewable energy source. Instead of paying a premiumfor green power, people who purchase green tags are payingfor the environmental benefits of renewable energy investmentsoccurring regionally or even across the country. GEC programsallow consumers to pay to help make up the increased cost ofrenewables in another state, region, or even country. They canhelp overcome some of the physical barriers to large-scalerenewable generation in many locations, alleviate regionaltransmission limitations, and compensate for discriminatorymarket forces.
However, with these potential benefits, there are alsomany potential problems associated with GEC’s. Much ofthis stems from the fact that the certificates do not actuallyrepresent a physical commodity like a fixed amount of windenergy. Instead, they represent the beneficial attributes associatedwith the energy generation. In other words, the externalenvironmental benefits of producing energy from clean,renewables are captured within the certificate. Creating marketsfor these certificates allows these benefits to be internalized bythe marketplace. However, the abstract nature of the certificatesand what they represent can create confusion amongstconsumers and invite fraud amongst green marketers.114
In order to protect consumers against fraud, it isimperative to establish central registries that track issuances ofrenewable energy certificates. Some states, such as Texas, havealready done so as part of their Renewable Portfolio Standardtracking system. In addition to tracking, sellers of REC’s mustbe required to fully disclose what it is they are selling to ensurethat consumers are not misled. This can be accomplishedthrough labeling and mandatory disclosure requirements.115
PG&E’s National Energy Group developed PureWindto market the environmental attributes of wind facilities in NewYork and California. 116 PG&E’s Madison, New York windfacility is located over a 120 acre privately owned farm andcame on line at the end of 2000. The facility producesapproximately 24,000 mWh annually, which flows directly intothe New York Independent System Operator grid and isconsumed throughout the state.117
Consumers may purchase PureWind Certificates for$40 per MWH. Compared with polluting, non-renewablesources of energy, each PureWind certificate represents a savingsof 5 lbs. sulfur dioxide, (SO2), 2 lbs. nitrogen oxide, (NOx),and 1000 lbs. carbon dioxide (CO2) emissions.118 3.Environmental Generation Disclosure
Environmental disclosure requirements force energyproviders to disclose pertinent information to their customersregarding price, fuel mix, emissions data and otherenvironmental costs by fuel type. As retail competition andconsumer choice increases across the country mandatorydisclosure requirements provide essential information toconsumers. More than 20 states have enacted some sort ofmandatory disclosure rule.119 The type of programs that havebeen adopted and the information that is required to bedisclosed varies quite a bit from state to state.
For example, since 1998 electric retailers inMassachusetts are required to provide customers with astandard disclosure label every quarter. The label must include
SUMMER/FALL 2003 13
information on price, fuel mix, emissions, and laborcharacteristics of generating facilities. The emissions data mustbe presented in a format that compares to the regional averagefor SOx, NO2, and CO2. In addition, all advertisements mustinclude a notice that such information is available uponrequest.120
E. Reforming the Transmission System1. FERC’s Solution: Regional TransmissionOrganizationsThe Federal Energy Regulatory Commission (“FERC”)
is responsible for regulating the transmission and wholesalesale of electricity in interstate commerce. In 1999, FERC beganto establish a new policy that would “eliminate any residualdiscrimination in transmission services that can occur when theoperation of the transmission service remains in the controlof a vertically integrated utility.”121
The new policy seeks to establish Regional TransmissionOrganizations (“RTOs”) that would manage the transmissioninfrastructure as an entity independent of interested utilities andother wholesale electricity providers. In principle, RTO’s areintended to encourage wholesale competition by removingtransmission barriers for many wholesalers includingintermittent power producers like wind. According to FERC,RTO’s must have the following characteristics to be approvedas such: independence from market participants; appropriatescope and characteristics; operational authority over transmissionfacilities within its region; and exclusive power to maintain short-term reliability. 122 In order to achieve this role, RTO’s wouldbe responsible for the following: designing and administeringits own tariff; managing congestion; taking primary responsibilityfor planning and expanding transmission infrastructure; andparticipating in inter-regional coordination and reliabilitypractices.123
Although many of the goals behind the RTO structureare sound in principal, FERC’s plan still presents many potentialproblems. These include the voluntary nature of its membership,allowing for-profit transmission companies to serve as RTO’s,the standardization of interconnection between RTO’sthroughout the country, and ensuring that consumer andenvironmental concerns are adequately represented in RTOdecisions. FERC’s “voluntary” approach may not effectivelyachieve these goals. The FERC Order defining the new policy(“Order 2000”) simply required that all public utilities dealingin interstate commerce submit a plan describing how it wouldsupport the establishment of an RTO in its region. Once anRTO has been established and is approved by FERC, individualtransmission owners and operators within the region retain theoption of not joining the RTO.
Many of these problems are apparent in the December2001 FERC Order approving the first RTO in the country inthe Midwest. The new Midwest RTO is comprised ofmembers with vested interests in the energy industry. Memberspay an initial $15,000 fee to join along with $1,000 annual dues.Members elect a board of directors that is responsible formaintaining system reliability, ensuring open access to competingwholesalers, and planning and development of the transmissioninfrastructure. Although under the guise of an independentorganization, the ability of local special interests to determinewho sits on the board severely limits the ability of broader
consumer, environmental, and other public interests to affectthe decisionmaking process.124
FERC may also be organizationally unfit to implementand administer the transition to the transmission infrastructureas envisioned by its Order 2000. The GAO recently released astinging appraisal of FERC’s capacity to carry out its mission:“Absent an effective regulatory and oversight approach, FERClacks assurance that today’s energy markets are producinginterstate wholesale electricity rates that are just andreasonable.”125 One of FERC’s biggest weaknesses is its inabilityto issue meaningful civil penalties for non-compliance. Inaddition, FERC has no authority over many parts of the countrythat do not fall under its jurisdiction – either because they donot deal in interstate commerce like the Electricity ReliabilityCouncil of Texas (“ERCOT”), or because they are part ofsome independent federal entity like the Tennessee ValleyAuthority.
2. A Public Power GridConcerned about the efficacy of FERC’s voluntary
RTO policy, some have called for the development of a trulypublic power grid, owned and managed by electricityconsumers. Public Citizen, a public interest watchdog group,advocates for a non-profit, consumer-owned transmissionsystems that would provide non-discriminatory open accessto all energy generators.126 The plan proposes developing non-profit transmission companies that would buy out currentowners. Unlike RTO’s, the board of directors would becomprised of consumer advocates, environmentalists, andother community stakeholders who would be charged withmanaging the transmission system in a way that minimizes costand environmental impact.
3. Progress Towards ReformDespite these institutional and regulatory shortcomings,
however, progress is still being made in certain parts of thecountry to remove unfair interconnection policies. Severalindependent service operators (“ISOs”) have begun addressingthe discriminatory scheduling policies that inhibit wind facilitiesfrom efficiently (if at all) connecting to the grid. For example,on March 27, 2002 FERC strongly endorsed the CaliforniaIndependent Service Operator (Cal-ISO) scheduling tariffamendment.127 Under the new rule, scheduling deviations fromintermittent energy producers will be netted monthly anddeviation penalties will be waived.128 In addition, Cal-ISO willconduct near real-time forecasts of potential wind energygeneration (paid for by a small fee on the wind generators)that will be used by wind generators to set their generationschedules.129
Other ISO’s around the country have also begun toadopt fairer scheduling policies. NY-ISO completely exemptsall intermittent energy generators from scheduling penalties,ERCOT currently allows a 50% deviation from schedules forwind generators, and PJM-ISO (PA, NJ, and MD) has adoptedthe FERC Order 2000 proposal allowing all deviations to besettled at real-time prices without penalties.130
F. Distributed Energy IncentivesThe vast majority of all U.S. wind-generating capacity
is currently located on centralized wind farms that connect oneor more utility-scale turbine to the grid.131 Despite this,significant amounts of wind energy could be generated from
SUMMER/FALL 2003 14
smaller distributed sources to be used for on-site consumptionwith excess energy fed back into the grid.
Distributed energy generation has many advantagesover a centralized grid. Power loss along long-distancetransmission lines is eliminated when power is produced whereit is used. Distributing the energy-generating infrastructure alsoreduces opportunities for terrorists to disrupt the nation’s powersystem by targeting centralized power plants. In addition, theaesthetic and environmental impacts of transmission lines, sub-stations, and large-scale energy facilities are lessened asdependence on the grid decreases. Clean distributed generationcan also reduce peak loads on the transmission infrastructure,thereby improving the system’s overall reliability.
Many barriers stand in the way of increasing distributedgeneration capacity across the country. Kurt Yeager, presidentand chief executive officer of the industry-funded ElectricPower Research Institute summarized many of these obstaclesas follows:One of the big problems with increasing “distributedgeneration” – is that you still need to interconnect with theutilities. Yet the utilities view you as competition. So it’s hardto get interconnection agreements. They come up withridiculous standby charges that make it uneconomic. We needto think of utilities like the automobile industry: It takes a lawto make something happen. We didn’t get seat belts, pollutioncontrol, or better mileage without laws.132
1. Net MeteringNet metering allows consumers who generate their
own renewable electricity on site to feed excess energy backinto the utility at times of excess capacity. This energy is creditedto their account by the utility and is used to offset power soldto them at times when their demand outstrips their generationcapacity. Most states require utilities to offer a net meteringoption to all their customers (commercial, industrial, andresidential), although the amount of distributed generatingcapacity that is allowed to be connected is usually capped at nomore than 10-50 KW. Most net metering policies require thatany excess energy credits that have accrued at the end of theyear are granted back to the utility and not carried over for thenext year.133
2. Wind Easements and Access LawsWind easements and access laws allow those with
available wind resources on their land to protect that resourcefrom being obstructed or limited by projects or constructionon neighboring parcels of land. Nebraska and Montana allowproperty owners to create wind easements that are conveyedwith the transfer of real property ownership. In Wisconsinand Oregon, landowners may apply for special permits thatprevent others from obstructing wind resources available ontheir land.134
IV. CASE STUDIES: STATE SNAPSHOTSA. Texas: The Lone Star State Leading the Nation
Texas is fast becoming the nation’s leader in windenergy development, installing over 915 MW in 2001 (21.5%of the nation’s total installed wind generation to date.)135 Texashas a combination of factors working in its favor. First, Texashas great wind potential and many wide-open spaces. Texasranks 2nd in the nation behind North Dakota as the windieststate, estimated to have the potential to produce 1,190 billionkWh’s from wind energy alone.136 To put this in perspective,
total electricity consumption throughout the country was 3,706billion kWh’s in 1999.137
Second, the Texas legislature passed one of the mostfar-reaching RPS in the country in 1999, mandating 400MWof new renewables by 2003 and 2000MW by 2009.138 Thegeneration requirement mandates that electricity generators eitherproduce a percentage of the state mandate themselves orpurchase renewable energy credits to meet their requirement.The size of the RPS targets has been credited with providinglong-term security to investors to finance large projects, thuscreating economies of scale that have allowed many of thesenew facilities to deliver power at rates as cheap as $0.03/kWh.139
The law creating the state RPS was the result of yearsof coordinated and sophisticated efforts by a coalition ofconsumer, environmental, public health and religious groups.140
The first step towards victory came with the results of a seriesof intensive polls taken by the state’s utilities. The results shockedmany in industry and government: 83% said that air pollutionwas a serious or very serious problem; 76% said that they werewilling to pay $5 or more per month for non-polluting,renewable energy; and 67% said that they wanted the Legislatureto require power producers to reduce pollution.141
The coalition followed this demonstration of publicsupport with a focused media campaign. They regularlyreleased reports highlighting the problems associated withpolluting energy and met with the editorial boards of the state’snewspapers. The groups also worked to educate and organizethe grassroots and hired top-named lobbyists to take their caseto the highest levels of state policymaking.
The third factor contributing to the explosion in winddevelopment in Texas in 2001 was the fact that the 10-year,$0.018/kWh federal production tax credit for wind was set toexpire at the end of the year. Unsure whether the tax creditwould be extended, many developers rushed to bring facilitieson-line. (The credit was extended in early 2002 for 2 years).
The fourth factor favoring wind energy in Texas is thefact that its transmission infrastructure is entirely within stateregulatory jurisdiction. Unlike most of the rest of the countrythat is interconnected interstate and therefore under theregulatory authority of FERC, Texas oversees its owntransmission system – the Electric Reliability Council of Texas(“ERCOT”). This has many short-term advantages allowingthe state to synchronize transmission access regulations with itsother mandates supporting renewable energy. For example,the state mandated non-discriminatory open-access prices andpolicies for wholesale generators as part of its electricityrestructuring legislation in 1999. They replaced the old accessfee which was calculated by the distance between the generatorand consumer with a “postage stamp” policy that charges aflat fee to any generator accessing the transmissioninfrastructure.142
In addition to fairer access fees for wholesalegenerators in the state, ERCOT also adopted rules that allowunplanned transmission access at a flat-rate of $0.15/MWH.143
This removes the concern over scheduling penalties that hasinhibited wind power in other parts of the country. The finaltransmission policy favoring wind energy in Texas is the factthat the cost of new transmission construction is paid for byall users of the grid, not the particular generators who will relyon the infrastructure expansions.
SUMMER/FALL 2003 15
The combination of great resource potential, a clearRPS mandate and credit trading program, the availability of afavorable production tax credit, and the adoption of non-discriminatory transmission prices and policies have enabledTexas to lead the nation in wind energy. By the end 2001,Texas had already installed 915 MW of new wind power, morethan doubling the goal of 400 MW by the beginning of 2003mandated under the state RPS.144
This new wind development has mainly occurred inWest Texas, across the state from most of the state’s load centers.Although enough available transmission capacity has been“mined” to enable these projects to come on line, the existingtransmission capacity has nearly reached its potential. Inresponse, ERCOT is developing plans to expand thetransmission system. Unfortunately, the timeframe for bringingnew wind facilities on-line is much shorter (12-18months) thanthe time it will take to plan and construct the transmission linescapable of delivering this power to market.145
B. Oregon & Washington: Shaping the Wind with WaterWind power development has also progressed in the
Northwest. In April 2002, the largest wind farm in theNorthwest, the Stateline Project, began generating enoughpower for more than 21,000 homes.146 That same month, theworld’s largest wind turbine manufacturer, Vestas, announcedplans to construct its largest manufacturing plant in Portland,OR.147 Despite signs of progress, however, many obstaclescontinue to impede wind power development in the Northwest.
From early 2000 to mid-2001, skyrocketing wholesaleenergy prices and severe energy shortages in California and theNorthwest made wind energy a comparatively cheaper option,thus overshadowing many of these obstacles. In an effort tostabilize wholesale supply and prices the Bonneville PowerAdministration (BPA) issued a request for proposals for atleast 1000MW of new wind power. The response to the RFPwas tremendous, with 25 proposals totaling over 2600 MW.148
Unfortunately, as wholesale energy prices began to drop, sodid BPA’s interest in many of these new wind projects. Fromthe original seven projects selected in July 2001 totaling 830MW, three have been withdrawn by the developers. AlthoughBPA still plans to go forward with remaining 4 projects(430MW), it is doing so on a relaxed timeframe.149
As recent events illustrate, the growth of wind energyin the Northwest is extremely dependant on the policies andinitiative of the BPA. BPA owns and or controls about 75%of the high-voltage transmission grid in the Pacific Northwest,providing service throughout Oregon, Washington, Idaho,Western Montana, and small portions of several other states.150
Federal subsidies have enabled the BPA to deliver power to itscustomers at some of the cheapest rates in the country. Withouta proactive commitment by the BPA to wind power that willnot vacillate with short-term energy prices, wind energy growthcould be extremely difficult in the region. Importantly, noneof the states that serve as BPA’s primary service territory havemandated Renewable Portfolio Standards that require utilitiesto deliver a percentage of renewable power. As a result,Northwest utilities and the BPA are under much less pressureto expedite the process of removing the obstacles that inhibitwidespread wind power development.
Nonetheless, BPA and others in the region continue toadvance a process that addresses and removes many of the
barriers. Their two greatest concerns are the total cost andpower system impacts of additional wind resources.151
BPA’s Generation Imbalance Service Rate has, like manyother transmission policies throughout the country, severelylimited wind’s potential. The existing rules impose a penaltyon power generators if delivery deviates more than 1.5% or2MW (whichever is greater) from the schedule. The penalty,$100/MWh is the difference between commercial viability formany wind operations. Under pressure from renewable energyadvocates, BPA recently decided to exempt wind producersfrom the imbalance penalty. In place of the penalty, windgenerators will only have to reimburse BPA for its costs inbalancing the intermittency of wind power within the powergrid.152 BPA explained that the exemption for wind wasnecessary because “wind generation resources are not able toaccurately predict their generation output to avoid applicationof the penalty rate…so they are not able to respond to the rateas an incentive to accurately schedule generation output.”153
In addition to efforts by BPA, the state of Oregon hasalso implemented policies to encourage renewable energy. Aspart of its electric restructuring law, Oregon established a 3%public benefits charge on customers of the state’s two largestutilities. The fund is being managed by the Energy Trust ofOregon and will go towards promoting energy efficiency andrenewable projects. The newly formed Trust has set ambitiousgoals of reducing energy use by 300MW by 2012 and increasingthe percentage of renewable energy to 15% by that date.154
C. Minnesota: Encouraging Small and Large Scale WindProjects
Minnesota is the 9th windiest state in the country andcurrently ranks 4th in installed wind capacity with 320MW.155
Most of the growth can be attributed to a 1997 compromisewith the owners of the Prairie Island nuclear facility requiringthem to invest in renewables in exchange for allowances tostore more nuclear waste on site. The mandate required 425MWof wind by 2002 and an additional 400MW by 2013.156 XCELenergy, the current owner of Prairie Island, has already installedor contracted out more than enough wind power to meet the2002 deadline.157
In 2001, the state enacted a Renewable EnergyObjective (“REO”) and a mandatory green pricing program.158
The REO is like a voluntary RPS that sets a goal of producing10% of the state’s energy from renewables by 2015. To meetthe objective, MN would have to install roughly 3400MW ofnew renewables by that date.159
The REO is non-binding and only requires that utilitiesmake a “good-faith” effort to meet the goal.160 Despite effortsby a coalition of environmental and consumer activists to adopta mandatory RPS, utilities and other opponents defeated theproposal. The opponents instead pushed for green pricingprograms that rely on consumer preference in order to drivenew renewable development in the state. Unfortunately, this islikely to have a much more limited impact than a RPS wouldhave.
Minnesota has been as active as any state in the countryat promoting small-scale (less than 2MW) wind projectdevelopment. It is currently the only state to have a RenewableProduction Incentive that pays eligible developers $0.015/kWh.This is on top of the Federal Production Tax Credit that mayalso be available for such projects. Qualifying facilities include
SUMMER/FALL 2003 16
small businesses, tribal councils, non-profit corporations, orprivate projects that are owned and operated by thelandowner.161
In addition to the production payment, small facilitiesalso benefit from a standardized interconnection agreementand tariff. Unlike many other small wind developers throughoutthe country, developers in Minnesota do not have to negotiateunique agreements with utilities each time they want to connectto the grid. Instead, upon request, they are presented with aboilerplate agreement that they or their lawyers can easily reviewbefore signing. The agreement is simple and the interconnectionfees are reasonably calculated.D. California: Returning to its Roots
California gave birth to the modern wind energyindustry in the early 1980’s in response to the energy crisis ofthe prior decade. A combination of high long-term energyprices, generous fiscal incentives, and other aggressive statepolicies and programs helped to create an atmosphere thatwas ripe for adoption of the technology.
In addition to fiscal incentives for renewables,California also aggressively pursued increased renewabledevelopment in other ways. Under pressure fromenvironmental groups and then Governor Jerry Brown, thestate’s Public Utilities Commission pressured the three largestutilities to implement recent changes in federal law requiringmonopoly utilities to purchase power from independentlyowned renewable energy plants.162 The purchases were madethrough long-term contracts based on anticipated avoided costsof power, which were projected to be higher than they actuallyturned out to be.163
The California Public Utilities Commission also helpedto develop standard power purchase contracts (“standard offercontracts”). These standard contracts simplified the processof connecting to the grid and ensured reasonable charges forinterconnection.164
This combination of policies, programs and incentivesled to an average growth of over 64% in wind energyproduction in California from 1983 to 1994.165 Unfortunately,this impressive growth skidded to a sudden halt in the mid-1990’s due to the expiration of favorable long-term contracts.Energy prices for natural gas and petroleum had fallen andwere at levels unanticipated when many of the contracts wereoriginally signed. As a result, the utilities’ avoided costs alsofell, meaning that long-term contracts being offered toindependent wind energy producers were significantly lowerthan a decade earlier.
In 1996, California passed sweeping electricityderegulation legislation that promised competitive markets,cheaper rates, and consumer choice. Unfortunately, none ofthese promises were fulfilled. Instead, the stage was set forunprecedented wholesale price manipulation that led toskyrocketing wholesale energy prices that ultimately bankruptedone of the State’s largest utilities. The ensuing energy crisis andthe State’s concern over meeting energy demand led GovernorDavis to sign extremely expensive long-term energy contracts.Efforts are underway to re-negotiate these contracts with theState claiming that they should be invalidated because they wereunder duress when they signed them.
Despite these serious obstacles to renewable energyfacing the state, the state has implemented several far-reaching
programs to promote the technology. Whether these programsare enough to overcome the obstacles is unclear.
Along with the 1996 deregulation, the State createdseveral programs supporting renewable energy and otherprograms. The Public Interest Energy Research Program(PIER) annually awards up to $62 million for a variety ofprograms related to bringing environmentally safe andaffordable energy technologies to the marketplace.166
The second program was the creation of the largestPublic Benefits Fund in the country. The funds are collectedfrom a fee on energy users throughout the state and are allocatedto several different accounts. The New and Existing RenewableResource Accounts provide qualifying projects with aproduction payment of up to $0.015 kWh.167 For residentialand small business customers, the state has established a Buy-Down program that will pay $4,500 per kW or 50% of theproject (whichever is less) for wind turbines under 10 kW.168
The State’s Renewables Program also allocated fundsto help develop green markets, although these programs havebeen suspended since September 2001, when the statesuspended customer choice in response to the problems relatedto its flawed deregulation process.
Perhaps most significantly, on September 12, 2002,California adopted the most ambitious renewable portfoliostandard in the country, requiring the state’s utilities to produceat least 20% of their electricity from renewables by 2017.169
Based upon the effectiveness of RPS policies in other statesand California’s pioneering experience with wind energy, thefuture of wind energy development in the state looks bright.V. RECOMMENDATIONSA. Leveling the Playing Field
1. Long-Term InitiativesIf the environmental costs of energy were reflected in
the price rather than externalized, then wind energy wouldbecome a more economical option. The best way toaccomplish this is by the elimination of disproportionatelyallocated subsidies and by shifting the tax burden to internalizeenvironmental costs on the polluter. Phase out all energysubsidies over an extended period of time. This would allowcompanies and markets to slowly transition to reliance on thecheapest energy sources.
The most economically sound way to help promotemore environmentally benign energy sources like wind isthrough comprehensive tax shifting. This would involve shiftingthe tax burden on society away from things that are beneficial,such as work and capital investment, and onto things that aredetrimental, such as pollution and other unsustainable practices.This rewards those things that we want to encourage andpenalizes those things that we want to discourage.
One way to accomplish this within the energy sector isto implement a carbon tax. The tax would add cost to everyunit (BTU) of carbon consumed. Because wind and othernon-polluting energy sources, consume no carbon, they wouldescape the tax altogether.
2. Short-Term ProposalsComprehensive tax shifting and the elimination of all
energy subsidies is not a realistic short-term goal due to theenormous political opposition garnered by these proposals.Fortunately, there are many short-term proposals that canrealistically be pursued. They include:
SUMMER/FALL 2003 17
♦ Extending the Renewable Energy Production TaxCredit indefinitely.
♦ Shifting energy subsidies away from fossil fuels andnuclear power towards renewables and energyefficiency.
♦ Creating a national RPS and national REC tradingsystem modeled on successful state programs.
♦ Creating state RPS and REC programs in all 50 states.This would encourage renewable energy developmentmore evenly throughout the country.
♦ Mandating federal, state, and local governmentpurchases of renewable energy.
♦ Extending and harmonizing state tax credits andexemptions.
B. Helping Wind Get Grid ConnectedThe new “open-access” era must begin living up to its
name. Despite FERC proclamations in support of non-discriminatory access to the grid for wind and other renewableenergy, many policies continue to restrict fair access.
1. Reforming or Replacing FERCReforming or replacing FERC’s oversight of the
interstate transmission system is central to the process ofeliminating many of these obstacles. Such reforms shouldinclude the following:♦ Authorizing FERC to issue meaningful penalties for
non-compliance with its Orders.♦ Consolidating the regulatory authority over transmission
policy within the Bonneville Power Administration, theTennessee Valley Authority, and those transmissionorganizations currently under FERC’s jurisdiction.
♦ Mandating uniform transmission policy throughout thecountry regarding connecting wind energy to the grid.
♦ Requiring that consumer and environmental concernsare fairly represented within the decision-making bodiesof Regional Transmission Organizations andIndependent Service Operators.
2. Adopting Non-Discriminatory SchedulingPoliciesIn addition to reforming or replacing FERC, the
following policies should be adopted by the country’s variousTransmission Operators:♦ Eliminating scheduling penalties for intermittent energy
generators.♦ Allowing real-time balancing markets that settle
payments or charges related to scheduling deviationsbased on real-time prices at the time of the deviation.
♦ Implementing a system for conducting anddisseminating wind forecasting information to reducescheduling deviations.
♦ Promoting geographical aggregation of wind facilitiesto help create a more reliable wholesale powerproduct.
3. Adopting Equitable Interconnection Fees♦ Basing the interconnection fee on monthly or annual
average usage rather than on a facilities nameplate (peak)capacity.
♦ Standardizing and simplifying interconnectionagreements and fees for small wind producers.
♦ Financing maintenance (embedded costs) andexpansion of the transmission grid by fees paid byelectricity consumers rather than by charges to energygenerators.
♦ Adopting a “postage stamp” fee that charges a fixedinterconnection fee regardless of how manytransmission systems are used to deliver power to theend user.
4. Increasing Transmission Capacity Availablefor Wind
♦ Upgrading the transmission infrastructure to reducethermal and voltage operating constraints.
♦ Replacing antiquated mechanical switches with a newintegrated fiber-optic network.
♦ Ensuring that wind projects are fairly represented indecisions to expand the transmission infrastructure.
CONCLUSIONElectricity consumption has grown by 23.5% over the
last decade in the U.S. with a continual over-reliance on fossilfuel and nuclear energy sources.170 Our understanding of thecauses and effects of climate change and other environmentalconsequences has also grown. Wind energy and otherrenewables, along with increased conservation and efficiencyprograms, could enable us to respond to these growingproblems while also providing energy security for futuregenerations.
Although quite possible, transitioning to a clean,renewable energy economy will not be easy. To date, acombination of innovative policymaking and entrepreneurialcreativity has enabled wind energy to begin competing withtraditional sources of energy in the commercial marketplace.Yet there remains an enormous untapped potential for windenergy in the U.S., one that will remain largely untapped withoutthe introduction of more aggressive and consistent policiesthroughout the country.
(Endnotes)* J.D., expected 2004, American University’s Washington College of Law.1 BTM CONSULT APS, INT’L WIND ENERGY DEV.: WORLD MKT. UPDATE 2001, 3 (2002).2 In 2001, utility-scale wind turbines generated approximately 56 billion kW/h worldwide, which is 0.4% of the 13,934 billion kW/h total electricityproduced that year. U.S. DEPT. OF ENERGY, ENERGY INFORMATION ADMINISTRATION,INTERNATIONAL ENERGY ANNUAL 2001; American Wind Energy Association, UtilityScale Wind, available at http://www.awea.org/utilityscale.html.3 Union of Concerned Scientists, Bush Administration Exploits Energy Issue toAssault Environment, available at http://www.ucsusa.org/releases/03-22-01.html.4 LESTER R. BROWN, ECO-ECONOMY: BLDG. AN ECONOMY FOR THE EARTH, at 100 (2001).5 A recent Harvard School of Public Health study linked emissions fromtwo coal-fired power plants in Massachusetts to more than 43,000 asthmaattacks, nearly 300,000 incidents of upper respiratory symptoms, and 159premature deaths per year. Harvard University Gazette, Report Focuses on Impactof Power Plant Pollution, at http://www.news. harvard.edu/gazette/2000/05.11/air.html.6 Mountaintop mining – a process in which entire mountaintops are blownoff and surrounding river valleys are filled with debris – continues todecimate the ranges of West Virginia and other states. In the process,ecosystems are buried and communities are put in jeopardy of beinginundated by mudslides and other “natural” disasters.7 Momentum is building to allow the shipment of nuclear waste through 44states to a storage facility under Yucca Mountain, Nevada. This wouldrequire over 105,000 truckloads of radioactive waste across the country over
SUMMER/FALL 2003 18
the next 40 years. In addition to the threat posed by terrorists targeting thesemoving nukes, the DOE estimates that over 300 of these shipments wouldbe involved in accidents. U.S. PUB. INTEREST RESEARCH GROUP, RADIOACTIVE ROADS& RAILS: HAULING NUCLEAR WASTE THROUGH OUR NEIGHBORHOODS (June 2002).8 Every MW of installed wind energy capacity can power approximately 437(non-electric heat) homes while reducing 1765 tons of CO2 emissions.UNION OF CONCERNED SCIENTISTS, WIND POWER: CLEAN, SUSTAINABLE, AND AFFORDABLE,available at http://www.ucsusa. org/energy/w01.html; see also RENEWABLEENERGY WORLD, SERIOUS MEGAWATTS: THE U.S. TAPS INTO WIND’S ENORMOUS POTENTIAL,available at http://www.jxj.com/magsandj/ rew/2002_02/serious_megawatts.html.9 BROWN, supra note 4, at 35.10 U.S. DEPT. OF STATE, U.S. CLIMATE ACTION REPORT 2002, at 89 (May 2002),available at http://yosemite.epa.gov/OAR/globalwarming.nsf/content/ResourceCenterPublicationsUSClimateActionReport.html.11 The three windiest states (North Dakota, Texas, and Kansas) alone couldsupply nearly enough electricity to meet U.S. demand. ENERGY INFO. ADMIN.,U.S. DEPT. OF ENERGY, EIA ANNUAL ENERGY REVIEW 2000 - TABLE 8.1: ELEC.OVERVIEW 1949-2001 (total U.S. retail elec. sales for 1999 was 3,706 billionkWh), available at http://www.eia.doe.gov/aer/txt/ tab0801.htm; see also D. L.ELLIOT, L. L. WENDELL, G. L. GOWER, PAC. NORTHWEST LAB., U.S. DEPT. OF ENERGY,AN ASSESSMENT OF THE AVAILABLE WINDY LAND AREA AND WIND ENERGY POTENTIAL INTHE CONTIGUOUS UNITED STATES (1991), (the combined total wind generatingpotential for ND, TX, and KS is 3,470 billion kWh) microformed on PNL-7789DE91 018887.12 Am. Wind Energy Ass’n (“AWEA”), Wind Energy & Climate Change: AProposal for a Strategic Initiative (every 10,000 MW of installed wind generatingcapacity reduces CO2 emissions by about 31MMT), available at http://www.awea.org/policy/ccwp.html.13 D. L. ELLIOT, L. L. WENDELL, G. L. GOWER, PACIFIC NORTHWEST LABORATORY, U.S.DEPT. OF ENERGY, AN ASSESSMENT OF THE AVAILABLE WINDY LAND AREA AND WINDENERGY POTENTIAL IN THE CONTIGUOUS UNITED STATES (1991), microformed on PNL-7789 DE91 018887.14 STANLEY D. CALVERT AND SUSAN M. HOCK, NAT’L RENEWABLE ENERGY LAB., U.S.DEPT. OF ENERGY, UNITED STATES WIND ENERGY GROWTH AND POLICY FRAMEWORK, at 4(July 2001).15 Id.16 AWEA, THE ECONOMICS OF WIND (March 2002).17 Peter A. Gish, Project Financing of Renewable Energy Projects in Europe, 22 SUFFOLKTRANSNAT’L L. REV. 405, 411 (Summer 1999).18 AWEA, WIND ENERGY FACT SHEET: COMPARATIVE COST OF WIND AND OTHERENERGY SOURCES (2001).19 EDWARD KAHN AND RYAN WISER, LAWRENCE BERKELEY NAT’L LAB., ALTERNATIVEWINDPOWER OWNERSHIP STRUCTURES: FINANCING TERMS AND PROJECT COSTS, LBNL-38921 (May 1996).20 Lester R. Brown, Earth Policy Inst., U.S. Farmers Double Cropping Corn andWind Energy (June 2000), available at http://www.earth-policy.org/Alerts/Alert3. htm.21 Nat’l Renewable Energy Lab., Dept. of Energy, Wind Energy, available athttp://www.nrel.gov/clean_energy/wind.html.22 JEFFREY FEHRS AND VIRINDER SINGH, RENEWABLE ENERGY POLICY PROJECT, THE WORKTHAT GOES INTO RENEWABLE ENERGY, at 16 (Nov. 2001), available at http://www.crest.org/articles/static/1/binaries/LABOR_FINAL_REV.pdf.23 BTM CONSULT APS, supra note 1, at 29.24 European Wind Energy Ass’n., Wind Energy: Clean Power for Generations, at 3,available at http://www.ewea.org/doc/Wind%20Power%20-%20The%20New%20Global%20Energy%20Source.pdf.25 AWEA, Briefing (Nov. 2002), available at http://www.ewea.org/doc/20gw%20briefing.pdf.26 AWEA, Wind Energy Projects Throughout the United States, available at http://www.awea.org/projects/index.html.27 NAT’L RENEWABLE ENERGY LAB., DEPT. OF ENERGY, WIND POWER TODAY: 2001 THEYEAR IN REVIEW (2001), http://www.nrel.gov/docs/fy02osti/31583.pdf.28 ENERGY INFO. ADMIN., U.S. DEPT. OF ENERGY, EIA EMISSIONS OF GREENHOUSE GASESIN THE U.S. 2000 DOE/EIA-0573 (2000) (1990 and 2000 greenhouse gasemissions were reported at 1677.9 and 1906.3 million metric tons,respectively, which is an average 1.3% annual increase. Projecting a 1.3%annual increase until 2012 amounts to 2225.89 MMT by 2012, which is a 17%increase from 2000 emissions), available at http://www.eia.doe.gov/oiaf/1605/ggrpt/emission. html.29 European Union, Climate Change, at http://europa.eu.int/comm/environment/climat/home_en.htm.30 European Union, European Climate Change Programme, at http://europa.eu.int/comm/environment/climat/eccp.htm.31 European Parliament, Directive 2001/77/EC of the European Parliamentand of the Council of 27 September 2001 on the Promotion of Electricityfrom Renewable Energy Sources in the Internal Electricity Market (OfficialJournal L 283 of 27.10.2001] (reaffirming the E.U.’s goal of deriving 12% ofits gross inland energy consumption and 22% of its electricity from
renewables by 2010), available at http://europa.eu.int/scadplus/leg/en/lvb/l27035.htm.32 ELLIOT, WENDALL, AND GOWER, supra note 13; see also AM. WIND ENERGY ASS’N,supra note 20.33 Id.34 BROWN, supra note 4, at 233-34.35 Over the past 50 years, fossil fuels and nuclear energy has benefited from7.7 times more federal R&D support than renewable energy has. GREENSCISSORS COALITION, PAYING FOR POLLUTION: HOW TAXPAYERS SUBSIDIZE DANGEROUS ANDPOLLUTING ENERGY PROGRAMS, at 1 (2000) (Between 1948 and 1998, the federalgovernment spent $112 billion on energy research and developmentprograms. Of this amount: 60 percent, or $66 billion was dedicated tonuclear energy research; 23 percent, or $26 billion, was directed to fossilfuel energy research; 11%, or $12 billion, was spent on renewable energyprograms; and 6%, or $8 billion, was spent for energy efficiency researchand development).36 Marshall Goldberg, Renewable Energy Policy Project, Federal EnergySubsidies: Not All Technologies Are Created Equal, 3 RESEARCH REPORT 11 (July 2000).37 JOINT COMMITTEE ON TAXATION, ESTIMATES OF FEDERAL TAX EXPENDITURES FORFISCAL YEARS 2002- 2006, JCS-1-02 (Jan. 17, 2002); see also OFFICE OF MANAGEMENTAND BUDGET, BUDGET OF THE U.S. FISCAL YEAR 2003, ANALYTICAL PERSPECTIVES (2002)(Combined Totals: renewable energy: $80 million (tax breaks and credits) and$396 million (total discretionary spending); fossil fuels: $3760 million (taxbreaks and credits) and $582.7 million (total discretionary spending); andnuclear: $20 million (tax breaks and credits) and between $1278 and $4412million) (total discretionary spending); see also Anthony Heyes and CatherineListon-Heyes, Department of Economics, University of London, England,Liability Capping and Financial Subsidy in North American Nuclear Power : SomeFinancial Results Based on Insurance Data (estimating the cost of the federalinsurance program for the nation’s 106 civilian nuclear reactors (PriceAnderson Act) at $3.45 million/reactor/year), available at http://www.akf.dk/som/pdf/som32/ 5heyes.pdf; see also Jeffrey Dubin and Geoffrey Rothwell, Subsidyto Nuclear Power Through Price Anderson Liability Limit, CONTEMPORARY POLICY ISSUES(July 8, 1990) (estimating the cost of federal insurance at $33 million/reactor/year).38 FEDERAL ENERGY REGULATORY COMM’N (“FERC”), DEPT. OF ENERGY, Order 888:Promoting Wholesale Competition Through Open Access Non-discriminatory Transmission Services by Public Utilities; Recovery ofStranded Costs by Public Utilities and Transmitting Utilities, 61 Fed. Reg.21540-01 (1996).39 Id.40 AWEA, FAIR TRANSMISSION ACCESS FOR WIND: A BRIEF DISCUSSION OF PRIORITY ISSUES,at 7 (2002).41 Id.42 AWEA, supra note 40, at 12-13.43 Telephone Interview with Mike Taylor, Energy Div., MN Dept. ofCommerce (July 23, 2002).44 AWEA, supra note 40, at 4-5.45 Id. at 8-9.46 NAT’L WIND COORDINATING COMM., WIND POWER TRANSMISSION CASE STUDIESPROJECT, Appendix 3, at 4 (2000), available at http://www.nationalwind.org/pubs/trans/casestudies.pdf.47 AWEA, Wind Energy projects Throughout the U.S.A., at http://www.awea.org/projects/index.html.48 Energy Info. Admin., Dep’t of Energy, Upgrading Transmission for WholesaleElectric Power Trade, available at http://www.eia.doe.gov/cneaf/pubs_html/feat_trans_capacity/w_sale.html.49 For example, upgrading a 115 kV line from single-circuit to double-circuitcosts about $130,000 per mile, compared to $400,000 per mile for a newlyconstructed line. Id.50 Marilyn Berlin Snell, Power Lunch, SIERRA, at 36 (July/Aug 2002) (interviewwith Kurt Yeager, President and CEO of the Electric Power Research Inst.).51 Id.52 Cape Wind, Project at a Glance, at http://www.capewind.org/ learning/pglan02.htm.53 Alliance to Protect Nantucket Sound, at http://www.saveoursound.org/index.html.54 AWEA, Facts About Wind Energy and Birds, at http://www.awea.org/pubs/factsheets/WEandBirds.pdf.55 Id.56 NAT’L RENEWABLE ENERGY LAB, supra note 27.57 Id.58 Id.59 Id.60 CALVERT AND HOCK, supra note 14, at 4.61 Green Scissors 2001, Coal Research and Development Smoke and Mirrors, athttp://www.greenscissors.com/energy /coalresearch.htm.62 DSIRE, Summary Tables: Rules, Regulations, and Policies, at http://www.dsireusa.org/dsire/summarytables/reg1.cfm?&CurrentPageID=7.
SUMMER/FALL 2003 19
63 MA Technology Collabortive, Renewable Energy: Frequently Asked Questions, athttp://www.mtpc.org/RenewableEnergy/faq.htm.64 Id.65 Id.66 Energy Trust of OR, at http://www.energytrust.org/about_energy_trust/renewables.67 DSIRE, OR Incentives for Renewable Energy, at http://www.dsireusa.org/dsire/library/includes/incentive2.cfm?Incentive_Code=OR05R&state=OR&CurrentPageID=1.68 CA Energy Commission, Renewable Energy Public Benefits Program, at http://www.energy.ca.gov/renewables/00-REN-1194/index.html.69 Id.70 CA Energy Comm’n, New Renewable Resources Account, at http://www.energy.ca.gov/renewables/new_renewables.html.71 CALVERT AND HOCK, supra note 14, at 4.72 ENVIRONMENTAL NEWS NETWORK, Renewable Energy to Power Santa Monica, March8, 1999, available at http://www.enn.com/enn-news-archive/1999/03/030899/smene_2003.asp.73 CITY OF SANTA MONICA, SUSTAINABLE CITY PROGRESS REPORT UPDATE, at 29(October 1999), available at http://www.ci.santa-monica.ca.us/environment/policy/SCPRU99Full.PDF.74 Id.75 Energy Policy Act of 1992, Title XII Sec. 1212. Pub. L. No. 102-486.76 Job Creation and Worker Assistance Act of 2002, Pub. L. No. 107-147 (ThePresident signed the bill (HR 3090) on March 9, 2002).77 Bipartisan Renewable, Efficient Energy with Zero Effluent (BREEZE)Act, S.530, (107th Congress).78 ENERGY INFO. ADMIN., DEPT. OF ENERGY, ANNUAL ENERGY OUTLOOK 2002 WITHPROJECTIONS TO 2020 - LEGISLATION AND REGULATION, DOE/EIA-0383(2002) (Dec.21, 2001), available at http://www.eia.doe .gov/oiaf/aeo/leg_reg.html.79 Office of Power Technologies, Dept. of Energy, Renewable Energy ProductionIncentive, available at http://www.eere.energy.gov/power/repi.html.80 DSIRE, Summary Tables: Financial Incentives, at http://www. dsireusa.org/dsire/summarytables/financial.cfm?&CurrentPageID=7.81 Id.82 Id.83 HOWARD GELLER, ENERGY REVOLUTION: POLICIES FOR A SUSTAINABLE FUTURE, at 57(2003).84 Germany Info, Promoting Renewable Energy Sources, available at http://www.germany-info.org/relaunch/info/archives/background/renewable.html.85 Gordon Feller, Energy Exploits: The CHP Law May be Making Current Headlinesin Germany, But Promoting Renewable Energy Sources is High up on The Agenda, 27EUROPEN POWER NEWS 3 (Mar. 1, 2002).86 Spanish Electric Power Act (unofficial English Translation), (Law 1997,42)(Nov. 27, 1997)(National Electric Regulatory Commission (CNSE), Madrid,Spain).87 United Kingdom Dept. of Trade and Industry, Market DevelopmentOpportunities, available at http://www.dti.gov.uk/renewable/marketdev.html#spain.88 Germany Info, Germany’s Ecological Tax Reform, available at http://www.germany-info.org/relaunch/business/taxes/eco_tax.html.89 Id.90 PAUL WELFENS, ET AL., ENERGY POLICIES IN THE EUROPEAN UNION: GERMANY’SECOLOGICAL TAX REFORM, at 87 (2001).91 Planetark, E.U. Ministers Clear German Coal Subsidies (However, under E.U.law, Germany will phase these subsidies out by 2010.), available at http://www.planetark.com/dailynewsstory.cfm/newsid/16354/story.htm.92 Germany Info, supra note 88.93 Deutches Institut fur Wirtschaftsforschung, DIW Institute, Universities ofOsnobruck and Oldenburg (2001).94 WELFENS, supra note 90, at 89.95 Id.96 Id at 89-94.97 DSIRE, supra note 80.98 MA Div. Of Energy Resources, Massachusetts Renewable Energy Tax Incentives,at http://www.state.ma.us/doer/programs/renew/renew.htm#taxcred.99 DSIRE, Minnesota Incentives for Renewable Energy: Wind Sales Tax Exemption, athttp://www.dsireusa.org/library/includes/incentive2.cfm?Incentive_Code=MN10F&state=MN&CurrentPageID=1.100 DSIRE, Iowa Incentives for Renewable Energy: Wind Energy Equipment Exemption,at http://www.dsireusa.org/library/includes/incentive2.cfm?Incentive_Code=IA01F&state=IA&CurrentPageID=1.101 DSIRE, supra note 80.102 Id.103 MA Technology Collaborative, at http://www.mtpc.org/RenewableEnergy/green_power/rps_facts.htm.104 Id.105 DSIRE, MA Incentives for Renewable Energy: Renewable Portfolio Standard , athttp://www.dsireusa.org/library/includes/
incentive2.cfm?Incentive_Code=MA05R&state=MA&CurrentPageID=1.106 DSIRE, TX Incentives for Renewable Energy: Renewable Generation Requirement, athttp://www.dsireusa.org/library/includes/incentive2.cfm?Incentive_Code=TX03R&state=TX&CurrentPageID=1.107 Id.108 Am. Wind Energy Ass’n, supra note 18.109 Union of Concerned Scientists, Renewing Where We Live: A Nat’l RenewablePortfolio Standard Will Benefit America’s Econ., at http://www.ucsusa.org/energy/rps_national.pdf.110 NAT’L RENEWABLE ENERGY LAB. (“NREL”), DEPT. OF ENERGY, FORECASTING THEGROWTH OF GREEN POWER MARKETS IN THE UNITED STATES, NREL-TP-620-30101(Oct. 2001).111 DSIRE, MN Incentives for Renewable Energy, athttp://www.dsireusa.org/dsire/library/includes/incentive2.cfm?Incentive_Code=MN05R&state=MN&CurrentPageID=1).112 NREL, supra note 110.113 AUSTIN ENERGY, GreenChoice <http://www.austinenergy.com/ greenchoice/.114 Center for Resource Solutions, Renewable Energy Credits Trading: The Potentialand the Pitfalls, at http://www.resourcesolutions.org/CRSprograms/trec/trc.pdf.115 THE REGULATORY ASSISTANCE PROJECT, GREEN POWER NEWSLETTER, at 8 (July2001), available at http://www.rapmaine.org/ gpnews8.htm.116 PG&E Nat’l, Pure Wind (comparing emissions with the average emissionsof all New York State power generation facilities), available at http://www.purewind.net.117 Id.118 Id.119 DSIRE, supra note 80.120 The Green Power Network, Dept. of Energy, Summary of State DisclosurePolicies, available at http://www.eren.doe. gov/greenpower/disclosetxt.shtml#ca.121 Order 2000: Regional Transmission Organizations 3, 65 Fed. Reg. 12088-01 (2000).122 FERC, supra note 38, at 12089.123 Id.124 FERC, Order Granting RTO Status, Midwest Indep. Transmission System Operator,Inc., 97 FERC 61,326 (Dec. 20, 2001).125 GEN. ACCOUNTING OFFICE, ENERGY MARKETS: CONCERTED ACTIONS NEEDED BYFERC TO CONFRONT CHALLENGES THAT IMPEDE EFFECTIVE OVERSIGHT, 9 GAO 02-256(June 2002), available at http://www.gao.gov/new.items/ d02656.pdf.126 Charlie Higley, The Transmission Solution: Non-Profit, Consumer-OwnedTransmission Companies, PUBLIC CITIZEN (June 2000).127 Federal Energy Regulatory Commission, Order Accepting in Part and Rejectingin Part Tariff Amendment No. 42 and Dismissing Complaint, Docket Nos. ER02-922-000 and EL02-51-000, 98 FERC 61,327 (March 27, 2002).128 Press Release, AWEA, FERC Endorses Fair Treatment of Wind in WholesaleElectricity Markets: Commission Order Backs California ISO in Providing Access toTransmission System at Reasonable Cost (March 28, 2002), available at http://www.awea.org/news/news020328ferc.html.129 AWEA, supra note 40, at 64.130 Id.131 Telephone Interview with Jaime Steve, AWEA (June 21, 2002).132 Snell, supra note 50, at 35.133 DSIRE, Summary Tables: Net Metering Rules, at http://www.dsireusa.org/dsire/library/includes/type.cfm?Type=Net&Back=regtab&CurrentPageID=7&Search=TableType.134 DSIRE, Summary Tables: Solar and Wind Access Laws, at http://www.dsireusa.org/dsire/library/includes/type.cfm?Type=Access&Back=regtab&CurrentPageID=7&Search=TableType.135 AWEA, Texas Wind Energy Projects, at http://www.awea.org/projects/texas.html.136 ELLIOT, WENDELL, GOWER, supra note 13.137 ENERGY INFORMATION ADMIN., DEPT. OF ENERGY, EIA ANNUAL ENERGY REVIEW2000 - TABLE 8.1: ELECTRICITY OVERVIEW 1949-2001, available at http://www.eia.doe. gov/aer/txt/tab0801.htm.138 DSIRE, Texas Incentives for Renewable Energy, at http://www.dsireusa.org/library/includes/incentive2.cfm?Incentive_Code=TX03R&state=TX&CurrentPageID=1.139 OLE LANGNISS AND RYAN WISER, LAWRENCE BERKELEY NAT’L LAB., THERENEWABLES PORTFOLIO STANDARD IN TEXAS: AN EARLY ASSESSMENT (Nov. 2001).140 Telephone Interview with Tom Smith, Public Citizen Texas (July 19, 2002).141 Peter Altman, Texans Want Deregulated Electric Industry to Reduce Pollution, Too,AUSTIN AMERICAN-STATESMAN, at A15 (Oct. 18, 1996).142 NAT’L WIND COORDINATING COMM., WIND POWER TRANSMISSION CASE STUDIESPROJECT, Appendix 1 (2000), available at http://www.nationalwind.org/pubs/trans/casestudies.pdf.143 Id.144 AWEA, Texas: Wind Energy Development, at http://www.awea.org/projects/texas.html.
SUMMER/FALL 2003 20
145 Telephone Interview with Andy Curtis, Public Utilities Comm’n of TX(July 1, 2002).146 Renewable Northwest Project, Stateline Wind Project(the 263 MW projectsaddles the WA OR border and employs 380 660 kW Vestas turbines. FPLEnergy built the project for about $300 million), at http://www.rnp.org/htmls/stateline.htm.147 Michelle Cole, Forces Gather to Reap the Wind, PORTLAND OREGONIAN ( June 3,2002), 2002 WL 3961587 (reporting that the new plant expects to employ1,000 people).148 Northwest Becoming Haven for Wind Power as BPA, Others Firm Up Projects, POWERMARKETS WEEK, (July 9, 2002), 2002 WL 10442476.149 Telephone interview with George Darr, Mgr., Renewable ResourceProgram, BONNEVILLE POWER ADMIN., DEPT. OF ENERGY (July 18, 2002).150 Renewables: Managing Pricing Risks of Intermittency Could be Windpower’s LastChallenge, UTILITY ENVIRONMENT RPT. (June 14, 2002), available in 2002 WL11408721.151 GEORGE D. DARR, BONNEVILLE POWER ADMIN., DEPT. OF ENERGY, NO PAIN, NOGAIN: BPA’S EFFORTS TO OVERCOME BARRIERS TO WIND POWER DEVELOPMENT IN THEPACIFIC NORTHWEST (June 2002).152 Renewables, supra note 150.153 BONNEVILLE POWER ADMIN., DEPT. OF ENERGY, TRANSMISSION GENERATION IMBALANCESERVICE RATE PROPOSAL, GI-02-A-02 (July 15, 2002).154 Energy Trust of Oregon, Inc., Introducing the Energy Trust, at http://www.energytrust.org/who/index. html.155 AWEA, supra note 26.156 DSIRE, MN Incentives for Renewable Energy, at http://www.dsireusa.org/library/includes/map2.cfm?CurrentPageID=1&State=MN.157 Telephone Interview with Mike Taylor, Energy Div., MN Dept. ofCommerce (July 23, 2002).158 DSIRE, supra note 156.159 Taylor, supra note 157.160 Renewable Energy Objectives, MINN. STAT. §216B.1691 (2001).161 Renewable Energy Production Incentive, MINN. STAT. §216C.41 (2001).162 The Public Utilities Regulatory Policies Act of 1978 (PURPA) mandatedthat utilities buy power from independent power producers at a price equalto the utility’s own cost of meeting the energy demand (full avoided cost).See LOUISE GUEY-LEE, ENERGY INFO. ADMIN., DEPT. OF ENERGY, RENEWABLEELECTRICITY PURCHASES: HISTORY AND RECENT DEVELOPMENTS (1998), available athttp://www.eia.doe.gov/cneaf/solar.renewables/rea_issues/renewelec_art.pdf.163 Id.164 Shi-Ling Hsu, Reducing Emissions from the Electricity Generating Industry: Can WeFinally Do It?, 14 TUL. ENV. L. REV. 427, 440 (2001).165 Cal. Energy Comm’n, Electricity Analysis Office, 1983-2001 CaliforniaElectricity Generation (May 17, 2002), available at http://www.energy.ca.gov/electricity/ELECTRICITY_GEN_1983-2001.XLS.166 Cal. Energy Comm’n Pub. Interest Energy Research, at http://www.energy.ca.gov/pier/index.html.167 Cal. Energy Comm’n, Renewable Energy Programs, at http://www.energy.ca.gov/renewables/index.html.168 California Energy Comm’n, California’s Renewable Energy Buydown Program, athttp://www.consumerenergycenter.org/buydown/program.html.169 DSIRE, California Incentives for Renewable Energy: Renewable Portfolio Standard, athttp://www.dsireusa.org/library/includes/incentive2.cfm?Incentive_Code=CA25R&state=CA&CurrentPageID=1.170 Utility retail sales have grown from 2,762,003 million kWh’s in 1991 to3,412,766 million kWh’s in 2000. ENERGY INFO. ADMIN., DEPT. OF ENERGY, ELECTRICPOWER ANNUAL VOL. I, Table A4 (2000), available at http://www.eia.doe.gov/cneaf/electricity/epav1/ta4p1.html.
Multilateral EnvironmentalAgreements & World
TradeBy Melanie Nakagawa*
NEWS UPDATE
In September 2003, the Fifth Ministerial Conference of theWorld Trade Organization (“WTO”) will meet in Cancun,Mexico. Cancun may provide an opportunity to reconcile
many tensions between trade and the environment, although itseems likely that environmental concerns will remainmarginalized. NGOs, governments, and other environmentalagencies are eagerly waiting to see what happens at Cancun.
At the Fourth WTO Ministerial Conference in Doha,Qatar, governments mandated the WTO to unilaterally clarifythe relationship between trade rules and trade measures thatenforce MEAs. The Doha mandate, however, established thatthe outcome of any negotiations “shall not diminish the rightsand obligations of Members under existing WTO agreements,”thus continuing to subjugate environmental concerns to thoseof trade.1 Many developing nations favor prioritizing economicdevelopment over complying with MEAs. They considerGATT Article XX, the list of exceptions, adequate for handlingthe MEA-WTO issue.2 Other nations, mainly developedeconomic powers, support clarifying the MEA-WTOrelationship.3
Two areas of potential progress are increasedcooperation and information exchange, and laying out the legalframework for the relationship between MEAs and tradeagreements. A major limiting factor, however, is the fact thatthe negotiations leading up to Cancun have largely excludedmany environmental perspectives from the discussion. Currentlythe WTOs Committee on Trade and Environment meets withsecretariats of MEAs once or twice a year to discuss trade-related provisions and dispute resolution mechanisms in MEAs.4Thus, new negotiations could expand the existing cooperationbetween the WTO and trade-related MEAs.5
(Endnotes)1 Doha Round Briefing Series, Developments Since the Fourth WTO MinisterialConference, International Center for Trade and Sustainable Development andInternational Institute for Sustainable Development, PUB. Vol. 1 No. 9 of 13,TRADE AND ENVIRONMENT 1 (2003).2 WTO, WTO Symposium: Challenges Ahead on The Road to Cancun, June 16Session I: The Relationship Between MEAs and the WTO: Where are NegotiationsHeading, available at http://www.wto.org/english/tratop_e/dda_e/symp03_sum_devel_country_e.doc.3 Doha Round Briefing Series, supra note 1.4 Report by the Chairperson of the Special Session of the Committee onTrade and Environment to the Trade Negotiations Committee. Trade andEnvironment Negotiations: State of Play 1 (TN/TE/7) (10 July 2003, WorldTrade Organization).5 Paul E. Hagen and Daniel M. Krainin, Trade and Environment Update: AnIntroduction to the Rules of the World Trade Organization and Their Relationship toEnvironmental, Health, and Safety Measures, SG056 ALI ABA 301 (2002).
SUMMER/FALL 2003 21
PRACTITIONER’S CORNERA Conversation With NRDC’s Greg
WetstoneInterviewed by Dave Newman
Greg Westsone is the Director of Programs for theNatural Resources Defense Council (“NRDC”) andhas been with NRDC since 1995. Before that he worked
for Representative Henry Waxman, a California congressman.
SDLP: What does NRDC do?
Wetstone: We play a key role in the effort to grapple with ourmost serious environmental challenges. These days we arespending a lot of time trying to hold onto the very importantbedrock structure that has worked since 1970. NRDC playeda huge role in getting these laws into the books and now weare fighting like hell to hold onto them.
SDLP: EPA just released a state of the environment reportwhich basically hails many of the victories of the last 30 yearsand attributes much of that success to the nation’s environmentallaws. It seems quite ironic that the Bush Administrationsimultaneously praises the efficacy of the nation’s environmentallaws as it works to weaken them. Are you surprised that there’snot more of a backlash against Administration’s environmentalpolicies?
Wetstone: I think there will be. I think there has been. I thinkwe’re living in a time where the Administration is relying largelyon distraction and almost recognizes that they have almost noreal ability to make a public case with any sort of credibledetail. I think there is right now a very systematic effort to tryto undermine the very infrastructure that makes these laws workand it’s a brazen disregard for science and a brazen disregardfor law and a brazen disregard for public opinion. I think thetruth will come out. History shows that these things tend to becyclical and public attention will turn inward as I think it alreadyhas.
SDLP: One of the surprising things post 9-11 was the lackof discussion around the connection between our foreign policyand our dependence on unsustainable forms of energy. Doyou see a more coherent foreign policy that incorporatesenvironmental sustainability as one of the key components?Do you see that articulated in any context across the politicalsocial spectrum? Do you hear anyone speaking about that?
Wetstone: I think that there are a lot of people who arespeaking to the importance of the connection betweensustainable energy policy and national security because by
reducing our reliance on unstable regions of the world forenergy, we are also reducing our reliance on an energy paththat leads us to greater pollution, greater global warming - andthat is not something we can sustain over the long term if wewant to protect the planet’s climate. You could point to JohnKerry, Joe Lieberman, John McCain in the Senate. HenryWaxman and Sherry Boehlert in the House. A number ofchampions of provisions that reduce reliance on foreign oilover time. I think the country after 9-11 was looking to thePresident for leadership and had the President been willing toshow leadership, to ask for sacrifice, to urge Americans toreduce reliance on imported oil, to take that provision toCongress, I think we’d have a law today that would help withthese problems. Unfortunately, where we have been is a verydifferent place, where, in many ways, the financial rewards foroil companies has been a more important factor than the longterm public interest in either environment or security.
SDLP: Some people have said that 9-11 created an incrediblemoment and an opportunity to create a sea change in our nation’senergy policy. Do you think there is still an opportunity tomake those kind of grand sweeping changes and pull the countryalong from this point?
Wetstone: Yeah, I do. I think that we need leadership thatshares the objective of reducing our reliance on foreign oil andI think that it is clear that there is a high price to pay including inhuman life for continuing to bolster instead of reduce ourreliance on foreign oil. In the long term, if we want to leave aplanet to our children that’s better than the one we came into,we’ve got some work to do and this is an important part of it.
SDLP: On the domestic front, with all of the attacks that weare currently seeing on environmental laws and regulations, is ithard to keep moving forward trying to build upon theenvironmental successes of the past 30 years while you areplaying such a defensive role?
Wetstone: That’s one of the great tragedies of the time we’rein. While it has never been more important to be movingforward, we are forced to devote tremendous attention andresources simply to keep from moving backward on programsthat are broadly popular and broadly successful and that weshould be building on. Instead we see constant efforts toundermine these programs. It is hard to keep moving forward,but we are looking at other places. For example, we have
SUMMER/FALL 2003 22
PRACTITIONER’S CORNERlegislation in California on motor vehicles’ contribution to globalwarming that’s very important. We are looking for opportunitiesto change the dynamic and elevate this as an issue and really getfocused on how to make progress.
SDLP: If you were a member of Congress, what would bethe first piece of legislation that you would introduce?
Wetstone: I have the continual opportunity to work withmembers of Congress to get the kind of legislation that weneed. We have good legislation in Congress, it just doesn’t goanywhere. The issue is really the leadership in Congress andthe leadership in the White House. We need the ability to moveus forward on these issues. Drafting the bill and getting it outthere isn’t the hard part.
SDLP: How do you see the tactics used by most environmentalorganizations like NRDC evolving in the future to meet thegrowing opposition and sophistication of the tools used bythe opposition?
Wetstone: I think we’re doing a much better job than we everhad with the resources that we have. I think we’re being morestrategic, that we’re relying on new tools that are bring us along.The Internet and the tremendous network of activists that we’vedeveloped in the last 5 years is something that we didn’t have.More sophisticated message development and that kind ofthing and much better collaboration amongst groups, but we’refacing a lot more money, more than we ever have. I think thefoxes have taken over the henhouse. We have people runningthe White House and running the Congress who are basicallywilling to do precisely the bidding of not just corporatepolluters, but the absolute least responsible, worst elements onevery issue, be it logging, air pollution, or global warming.That’s the problem.
SDLP: Many economics have argued that we could do awaywith a lot of the regulation if we simply internalized the externalcosts of pollution into the costs of goods and services that weuse. We have seen some encouraging results in some very limitedcases that have taken this approach. But how do you popularizesuch a complex kind of explanation for raising prices on goodsand services?
Wetstone: I think it becomes an academic discussion. Yes, itwould be a more efficient system if we could internalize thecosts, but what is the true cost? How much is a clear dayworth? How much is it worth for your child to not haveasthma? Where we have this kind of economic analysis playinga role we see tremendous data manipulation. We see that nowat the White House, where their efforts to promote approaches
that devalue the lives of senior citizens, we see proposals thatonly look to the lost value in monetary terms and don’t considerquality of life, don’t consider what it’s worth to protectwilderness, to have a clear day, what’s it worth to have a baldeagle.
The problem with these theories is that they put you in astructure that can easily be manipulated and we have a systemthat has dramatically improved our quality of life, as EPA’sReport seeks to document, in reducing the pollution in ourcities, cleaning up our rivers, protecting animals on the vergeof extinction, protecting the ozone layer. All of which, by theway, is at risk by proposals moving in the current Administration.We have a structure that has basically worked and we shouldbuild on it, rather than tear it down. That’s the problem, we’relooking to tear down the foundation that we should be buildingon, and when we build on that foundation, we can do it ineconomically efficient ways.
SUMMER/FALL 2003 23
By Angie Farleigh *The Chicago Climate Exchange (“CCX”) is a voluntary tradablepermit program for reducing greenhouse gas emissions. Theprogram includes voluntary emissions reductions and tradingfor all six greenhouse gases. Trading in carbon dioxide isexpected to generate the most interest. Member companiesmake a legally binding agreement to reduce their emissions ofgreenhouse gases by 4% below the average of their 1998-2001emissions by 2006.1 This figure was reached during the designphase, through consensus among the founding membercompanies. It was a goal that all of the companies felt theycould reach, but CCX representatives note that it is possiblethis number will change once the program is up and running.2It is unclear whether this was a reduction that many of thecompanies were going to achieve through other means,regardless of their participation in the CCX.
CCX was initially funded by a $347,600 Joycefoundation grant, administered by the Kellogg Graduate Schoolof Management at Northwestern University. EnvironmentalFinancial Products, LLC performed the principle research forthe study. The exchange will be regulated by the NationalAssociation of Securities Dealers (“NASD”) and N.M.Rothschild & Son Ltd. will provide investment banking services.
Program Structure
The program is presumably modeled after the U.S.acid rain (“SO2”) trading program which CCX Chairman andCEO, Richard L. Sandor, helped design. Participants can receivecredits by reducing emissions, or generate “offset” credits byengaging in offset projects.3 The market would consist oftradable commodities, in the form of a ton of carbon dioxideequivalent that could be bought and sold like shares of stock.4The participants will use a web-based system regulated by theNASD to buy and sell the credits.5 Each participating companywill have an account on the CCX registry containing tradableemission allowances based on the 1% per year reduction goals.Members will use the website to exchange bids and offers, butwill not know counterparties’ identities until trades clear.6 Anymember that achieves greater reductions than the stated goalwould be granted a credit slip, which could be traded tocompanies that did not meet their goals. A participatingcompany must surrender one allowance or offset for everyton of CO2 emitted over its limit.
The exchange will be available to greenhouse gasemission sources, farm and forest carbon sinks, offset projectsand liquidity providers in the United States, as well as to offset
providers in Brazil. Emission sources and offset projects inCanada and Mexico will also be integrated into the programafter trading begins.7 The advisory board hopes to eventuallyexpand the program to include other international sources.The program will be run principally by the CCX Board ofDirectors, assisted by a small CCX staff. Richard Sandor willserve as CCX’s CEO and Chairman.8 Maurice Strong, formerChairman of the Earth Council, a Canadian NGO, will serveas a Vice-Chairman of CCX.9 Mr. Strong is also the formerUnder-Secretary General of the United Nations responsiblefor the 1992 Earth Summit in Rio de Janeiro, Brazil. The otherVice-Chairman of the exchange will be Les Rosenthal, aprincipal of the Chicago-based commodities and futurestrading firm, Rosenthal Collins.10 Mr. Rosenthal is a formerChairman of the Chicago Board of Trade. Finally, formerIllinois Governor James R. Thompson, current Chairman ofWinston and Strawn, will serve as Director of CCX.11
CCX will also have a “high level” advisory boardconsisting of a mixture of academics, scientists, policy experts,and industry representatives.12 The role of the advisory boardis to provide “input as needed.”13 As the name suggests, theirfunction will be to give advice and not to participate in thedecision-making process.
Program Governance
In order to be a member of CCX, participants mustsign a contract promising to meet the stated emissions reductionsand to trade only on the CCX exchange for the four-year pilotperiod.14 Like other commodity exchanges, the NASD willlook to verify reductions and has worked with the CCX todevise compliance procedures for the program.15 The NASDwill be in charge of enforcing the caps and ensuring that thecredits traded in the exchange represent real, permanentemissions reductions.16 To accomplish this goal, CCX and theNASD have based much of the verification system on theGreenhouse Gas Protocol Initiative (“GHG Protocol”), whichwas developed by the World Resources Institute in 1998 inorder to standardize and legitimize GHG emissions fromcompanies around the world.17 The GHG Protocol helpscompanies calculate and report their GHG emissions byproviding standards for accounting, setting reporting boundariesfor the company, setting baseline emissions levels and reportingthe emissions data.18 It also provides guidance to companieson calculating GHG emissions, managing their inventory quality
THE CHICAGO CLIMATE EXCHANGE:CAN GREENHOUSE GASES BE REDUCED ABSENT GOVERNMENT
MANDATES?
ARTICLE
SUMMER/FALL 2003 24
and verifying their GHG emissions data.19 The GHG protocolincludes calculation tools that represent a “best practice” foremissions calculation.20 In order to calculate its GHG emissions,a company must input data on its activities into an Excelspreadsheet and then select the appropriate emissions factors,based on the Protocol’s step-by-step guidance. Emission factorsand calculation methods vary depending on the type of GHG,the type of industry, and other site-specific activity data.21
The GHG Protocol, although helpful in designing averification system, was not a perfect fit for a trading programlike CCX.22 CCX is in the final stages of developing a newprotocol23 that will be approximately eighty percent based onthe GHG Protocol, and about twenty percent “custom fit” tothe needs of the program and its members.24 The result willbe a standardized emission submission protocol that allmembers of the CCX must follow in order to participate inthe exchange. Standardizing the data that is submitted to theCCX will ensure that all members are held to the same standardand will make it easier for the NASD to audit the submissions.Most of the initial member companies are large multinationalcorporations that have already been tracking their GHGemissions since 1990, either through the GHG Protocol orsome other comparable means.25 All of the companiesparticipating in the CCX pilot program already have emissionsinventories built up and will be able to meet the new CCXemission submission standards. Because CCX is still in thepilot phase, officials have yet to develop procedures for smallercompanies that may want to join in the future, but do not havethe systems in place to meet the CCX rules.26
Once the protocol is in place, the NASD will verifycompliance with the rules by auditing each of the membercompanies.27 Auditors from the NASD will look at theunderlying data and documents that support the baseline andemission numbers that the companies submit to the CCX.These documents will include invoices, deliveries, receipts andany other paperwork that the company used to establish itsbaseline number and emissions.28
The NASD will also use its market surveillancetechnologies to monitor trading activity for fraud andmanipulation.29 CCX is the final arbiter of the treatment ofthe submitted data, not the NASD.30 The NASD scores thesubmissions for accuracy and reports its findings to the CCX.Any violations, whether through fraud or negligence, will bepoliced by peer review under the same kind of enforcementprovisions for defaults on the stock exchanges.31 Companiesthat fail to meet their commitments may face sanctions. Sandorsays he expects peer review to be effective and does notanticipate the kind of market manipulation that has occurredin the energy markets.32 Apparently, NASD officials shareSandor’s faith in the honesty of the CCX members. One NASDrepresentative stated that, although there is always a risk offalsifying documents, because most of the members of CCXare huge corporations, they didn’t have to worry about fraudas much as they would with smaller businesses.33
The Current Market for CCX Credits
Like other commodities, the buyers and sellers willdetermine the price of the credits. Trading is expected to havebegun early in the summer of 2003. A few companies have
already conducted a handful of bilateral trades for greenhousegas emissions. CCX says that carbon trades have alreadysurpassed $100 million, and, with the start of CCX, annualtrading could increase to the tens of billions.34
Most of the participants seem to be companies whohave experience with other pollution exchanges, either abroad35
or with the U.S. SO2 trade allowances. Some of thesecompanies hope that participating in the CCX will allow themto learn better ways to meet mandates abroad.36
One of the purposes of the exchange is to allowcompanies that are subject to mandatory emissions reductionsin other jurisdictions, to take credit for the reductions made inthe United States. To this end, the designers of CCX willcreate a registry of reductions claimed by each participant. Theyhope to make the registry sufficiently accurate/adequate to gaininternational credibility? a high enough quality that other programsin other countries will accept it.37 However, acceptance willstill be on a case-by-case basis.
For the immediate future, the program’s pollutioncredits will only be valid in parts of the U.S., Canada, Mexico38
and, to a limited extent, Brazil.39 None of these countries havemandatory GHG programs.
Incentives to Participate
There are currently no mandatory Federal lawsrequiring companies to reduce their greenhouse gas emissions.This raises the question of why the CCX members areparticipating in the program in the absence of a legal requirementto do so. There are several possible reasons. Companies mayhope to develop a “green” reputation among stockholdersand the general public (i.e. potential stockholders). Additionally,they may hope to reduce operating costs by reducing energycosts and raising productivity.
The most likely reason is that companies may want toget a head start in anticipation of any mandatory emissionsprograms that the Bush Administration may implement.Participation in the CCX, will not only reduce long-term costsof controlling emissions, but it will also build the members’GHG management and trading skills thus putting them in aposition to shape future policy debate.40 CCX companies willalso have strong grounds to ask U.S. lawmakers to recognizeemissions credits retroactively in the event that mandatoryreductions are ever implemented.41
Additionally, many multinational corporations mightwant to get involved in this program because they may alreadybe feeling the effects of the Kyoto Protocol even though theU.S. has not adopted it. In today’s global society, corporationsare increasingly interacting in foreign jurisdictions and are subjectto the laws of those jurisdictions, namely the provisions setforth in the Kyoto Protocol.42 Therefore, many U.S.-basedcompanies that are forced to reduce GHGs in a foreignjurisdiction could either buy additional credits in the foreignjurisdiction, or decrease production in the foreign jurisdictionor in the U.S.43
However, the much-touted perks of the program maynot be beneficial to all companies. For instance, TXU Corp.was one of the companies that participated in the design ofthe program, but has since decided not to participate in thetrading because it was not sure if it would be financially
SUMMER/FALL 2003 25
beneficial.44
Evaluating the Effectiveness of the CCX Program
A. The General Theory of Tradable PermitSystems
There are two types of tradable permit systems. First,there is the cap-and-trade program where a total resource accesslimit is defined and then allocated among users. This iscommonly thought to be the most effective program becausethe fixed upper limits guarantee that, even if there is an increasein pollution sources, there will not be an increase in pollution.45
The second type of program is the tradable credit program,which establishes an individual baseline for each user, usuallybased on an existing technology-based standard.46 This typeof program is less effective because it only establishes a limitfor each source of pollution without setting an overall limit.47
Therefore, more sources can mean more pollution. CCX ismore similar to a tradable credit program because eachparticipating company has pledged to reduce their GHGemissions 4% below their original baseline. This approachmakes the most sense given that CCX involves only a smallpercentage of the total U.S. emission sources. A cap and tradeprogram would be more reasonable if the responsibility formeeting an overall GHG limit were divided amongst all sourcesin the U.S. Regardless of the type of system, because no emissionsource in the U.S. is currently required to reduce GHG emissions,any participation in voluntary programs such as CCX will resultin increased environmental protection.
In theory, a tradable permit system can be an effectiveapproach to dealing with many environmental problems.Market driven policies are advantageous because they caninternalize the costs of compliance and lower the costs forgovernments.48 In a perfectly competitive market, the permitsor credits will flow toward their highest value. 49 A systemsuch as CCX can optimize the value of the target resource—inthis case, the resource would be a GHG-free atmosphere. Suchpermit systems will not achieve this goal if the market conditionsare not right.50 For instance, the system needs to be designedto minimize the possibilities for market power and the presenceof high transaction costs or large uninternalized externalities.51
Furthermore, without government involvement there must bea reliable system of private sector independent audits andverification procedures in place.52
In a report by the National Academies of Science entitled,The Drama of the Commons, Professor Elinor Ostromrecommends several factors by which to assess the effectivenessof such a system.53 Ostrom suggests analyzing the feasibilityof implementing the system, evaluating the environmentaleffects on the resource as well as other affected resources, andconsidering the economic effects on the regulated industry andthose who use the resource.54
B. Implementation Feasibility
No matter how lofty the goals of a trading programmay be, it will not accomplish anything if it is not feasible toimplement. To determine implementation feasibility, one mustfirst analyze the method by which the resource is allocated
among the users. For instance, some systems use a “first come,first served” approach, while some allocate permits randomlylike a lottery.55 The most common method of allocating accessrights is a method known as “grandfathering.” Grandfatheringbases the initial allocation on historic emissions so that existingsources only have to purchase any additional credits they mayneed over and above the initial allocation.56 Because the costsof implementing a tradable permits system are typically large,the grandfathering approach has commonly been a necessaryingredient in building the political support necessary toimplement the system.57 Accordingly, the CCX system allocatesan emissions amount equal to 4% below historic emissionslevels to participating companies. If they do not meet that 4%goal, they will have to purchase credits that will bring theiremissions levels down to the 4% allocation.
The second factor in analyzing implementationfeasibility is whether a system has sufficient monitoring andenforcement mechanisms. Insufficient monitoring andenforcement can lead to increased emissions because theaggregate limit could be breached, either on accident orpurposely.58 In order to increase compliance, many membersof the academic community feel it is important that the regulatedcommunity have a substantial role in the “co-management” ofenvironmental resources.59 Some argue this is because thegovernment is not efficient at verifying and monitoring suchsystems and should, therefore, let the private sector implementthe system once the government has set the rules.60 Despitetheir arguments, the most common form of governance inthe U.S. today is a system of top-down management wherethe regulated community plays a small role.61 CCX, on theother hand, has no government input whatsoever and is runsolely by “the regulated community.” Although CCX has anadvisory board of non-industry representatives, it has nodecision-making power. This raises obvious concerns overthe credibility of the monitoring and enforcement of the CCX.It is unclear what incentives the designers of CCX have toensure that the system is properly monitored and enforcedand is otherwise free from fraudulent activities. The most likelyincentive is that, if the CCX program is sufficiently credible,participants will be able to trade their credits on exchanges inforeign jurisdictions, or they can receive credit for them if theU.S. ever adopts mandatory GHG reductions.
Assuming CCX designers wanted to ensure sufficientmonitoring and enforcement, they would first need to ensurethere was a proper monitoring system in place. Every successfulmonitoring system must be able to identify the data needed tomonitor the trading and operations of the program, but alsogather, interpret and act on this information.62 The monitoringsystem for CCX was designed partly by experienced staff atthe NASD, and was based in part on the widely-accepted GHGProtocol. It will also utilize the NASD’s state-of-the-art marketsurveillance technologies. Assuming that the final CCXemissions submission protocol does not differ too much fromthe GHG Protocol, it seems that CCX has an adequate systemin place to properly monitor the program. However, anotherimportant component in a sufficient monitoring system is tohave an integrated computer system where all users can accessthe trading system on a real-time basis.63 The CCX will operateon a web-based system which will make monitoring easier.However, the system will only be open to registered members
SUMMER/FALL 2003 26
of the exchange. The only information that will be publiclyavailable on the website will be the price of the credits andother “nonproprietary” information.64 This creates a weaknessin the monitoring system as the companies are not under anypublic pressure to report accurate information. Public scrutinyis especially crucial in this case because it seems that both CCXand the NASD have placed a lot of trust in the honesty ofthese companies to report accurately. This seems unreasonableafter such recent scandals as Enron and WorldCom.
The most problematic element of the CCX programis its enforcement mechanism. Even if the monitoring systemwas fail-proof and caught every mistake and deception, it isstill unclear how the rules will be enforced. Member companiesmust sign a contract promising to abide by the rules, and mayface sanctions if they violate the contract. It is unclear if thesesanctions will ever be imposed. Even if the NASD finds thata company has purposely submitted false data, the final arbiteris the CCX itself. It is unclear how lenient the CCX will be ondefaulting members.
C. Environmental Effects
In order to be effective, a tradable permit system muststart by defining a sustainable target.65 This target might notnecessarily be efficient for many of the effected pollutionsources. In many cases, it provides the only opportunity toachieve an environmentally beneficial outcome. The CCXmembers agreed to reduce their GHG emissions to 4% belowthe average of their 1998-2001 emissions. This is a modestgoal considering that the framers of the Kyoto Protocol agreedthat the world’s emission sources would need to reduce theirGHG emissions by at least 7% below 1990 levels if there wasany hope of curbing global warming.66 The few members ofthe CCX, with their modest 4% goal, are not likely to reducethe world’s GHG emissions to a “sustainable” level. If runproperly, the program can still produce positive environmentalresults.
Carbon dioxide and other GHGs are arguably thebest pollutants for a credit trading program such as CCX.67
Carbon dioxide is not toxic so it does not endanger the healthof local communities if an emission source chooses to buycredits to emit more CO2 at a specific plant. Furthermore,reductions made at local sources can make a differenceworldwide. Even though the CCX is currently localized to afew companies, mostly in the U.S., any reductions that resultfrom the exchange will have a positive effect on reducing globalwarming.
Trading programs such as CCX also give flexibility tocompanies on how they propose to meet their reduction goals.This flexibility makes it more likely that participants will actuallymeet their goal.68 However, there is always the danger ofuninternalized externalities, like protecting one resource at theexpense of another.69 For example, CCX would not beenvironmentally beneficial if the companies chose to reducetheir GHG emissions by installing technologies that caused themto increase their nitrogen oxide emissions. However, this isunlikely in such a program because climate change programstend to result in reductions of other pollutants as a side effect.70
D. Economic Effects
In evaluating the effectiveness of a pollution preventionprogram, one must also evaluate the economic effects of theprogram. For the regulated industry (or in this case, theparticipating companies), there is a risk that the program willinvolve high transaction costs, making voluntary participationunlikely. Tradable permit programs, if adequately enforced,tend to “increase the value of the commons to which thepermits apply.”71 Thus air pollution programs such as the CCXwill probably make it cheaper to meet the pollution controltargets.72
There is also the possibility that such a program canbecome too economically beneficial for some sources, creatingmarket power in a few companies.73 The fact that the creditsare transferable allows the opportunity for some groups toaccumulate permits and to use them to gain economic powerin other markets. Typically, other programs have protectionsagainst such activities and may put a limit on the amount ofcredits one source can accumulate.74 Such programs are alsotypically reviewed by the Department of Justice (“DOJ”) tocheck for possible antitrust violations.75 The CCX does nothave any such limit on credit accumulation, nor has it ever beenreviewed by the DOJ. This may cause problems once thetrading actually begins.
Conclusion
In theory, the CCX is an admirable concept. It can helpreduce GHG emissions from the U.S. immediately, even if thefederal government does not adopt any GHG reductionmeasures. However, the CCX has some significant weaknessesthat would need to be resolved in order for the program to beeffective. The monitoring system appears adequate, but it isunclear how strictly violations will be enforced. Furthermore,although any reductions in GHG emissions would be beneficial,the program would need to significantly increase the 4% goalin order to reach a sustainable level of GHG emissions. Finally,the internal operations of the CCX seem to be hidden fromthe public view. The CCX will have to open its doors to publicscrutiny if it hopes to receive respect from environmentalistsand other critics. Despite a few necessary improvements, theCCX is an excellent learning tool. Overall, the CCX is moreuseful as a learning tool to help pave the way for a morecomprehensive, mandatory emissions trading program.
(Endnotes)* Angie Farleigh graduated from AU Law in 2003 and is currently an associateat the DC firm of Beveredge & Diamond.1 The timeline for reductions is: 1% from baseline in 2003; 2% in 2004; 3% in2005; 4% in 2006.2 Telephone Interview with Rafael Marques, Economist, CCX (April 11, 2003)(noting that the CCX is in the process of developing a “rule book” which wouldcover the rules for such changes, but the rule book is not available to thepublic).3 Examples of offset projects include: reforestation or renewable energy systemssuch as wind and solar; energy efficiency process innovations; carbonsequestration such as no-till farming, agricultural grass and tree plantings;switching to less greenhouse gas intensive fuels; recovery and use of agriculturaland landfill methane; and vehicle fleet efficiency improvements.
SUMMER/FALL 2003 27
4 Smog for Dollars, Pilot Plan Uses Markets to Set Pollution’s Price, SpurCleanup, DALLAS MORNING NEWS, Dec. 5, 2002.5 Chicago Climate Exchange to Trade Greenhouse gases; Opens in Spring,ELECTRIC UTILITY WEEK, Jan. 20, 2003.6 Id.7 Telephone Interview with Rafael Marques, Economist, CCX (May 7, 2003)8 Press Release, CCX, Leaders from Environment, Business and Governmentto Serve as Directors of New Exchange (April 15, 2003) available at http://www.chicagoclimateX.com/html/CCXDirectors.pdf.9 Id.10 Id.11 Id.12 The advisory board includes: Warren Batts, Adjunct Professor at the Universityof Chicago Graduate School of Business, and former CEO of TupperwareCorporation, Premark International and Mead; David L. Boren, President ofthe University of Oklahoma, former OK Governor and U.S. Senator; ErnstBrugger, Chairman of Brugger Hanser & Partner Ltd. in Switzerland, and aprofessor at the University of Zurich; Lucien Bronicki, chairman of OrmatInternational; Paula DiPerna, former President of the Joyce Foundation andVice-President for International Affairs for The Cousteau Society; ElizabethDowdeswell, former Executive Director of the United Nations EnvironmentProgramme (UNEP); Jeffrey E. Garten, dean of the Yale School ofManagement, and former undersecretary of commerce for international tradein the first Clinton Administration; Donald P. Jacobs, former Dean of theKellogg Graduate School of Management and former Chairman of the Boardof Amtrak; Joseph P. Kennedy II is Chairman and President of Boston-basedCitizens Energy Group, and former Congressman; Israel Klabin, president ofthe Brazilian Foundation for Sustainable Development, former chairman ofKlabin, SA forestry company, and former mayor of Rio de Janeiro; Bill Kurtis,news anchor; Jonathan Lash, president of the World Resources Institute; ThomasE. Lovejoy, world-renowned tropical and conservation biologist; Dr. R.K.Pachauri, Director-General of the Tata Energy Research Institute (TERI) andVice-Chairman of the Intergovernmental Panel on Climate Change; DavidMoran, vice president of ventures for the Electronic Publishing group of DowJones & Company and president of Dow Jones Indexes; Sir Brian Williamson,Chairman of the London International Financial Futures and Options Exchange(LIFFE); Robert K. Wilmouth, President and CEO of National FuturesAssociation (NFA); Klaus Woltron, Vice President of the “Club of Vienna “think tank and former CEO of Simmering Graz Pauker (SGP) and GeneralManager of ABB Austria; Michael Zammit Cutajar, former Executive Secretaryof the United Nations Framework Convention on Climate Change.13 Telephone Interview with Rafael Marques, Economist, CCX (April 11,2003).14 CCX will not release copies of such contracts to the general public because itclaims they are “intellectual property”. Telephone Interview with RafaelMarques, Economist, CCX (April 11, 2003).15 Trading Hot Air, THE ECONOMIST, Oct. 17, 2002.16 Id.17 GHG Protocol Initiative, About the GHG Protocol Initiative, at http://www.ghgprotocol.org/ (last visited April 24, 2003).18 GHG Protocol Initiative, Corporate GHG Accounting and Reporting, athttp://www.ghgprotocol.org/standard/index.htm (last visited April 24, 2003).19GHG Protocol Initiative, GHG Calculation Tools, at http://www.ghgprotocol.org/standard/tools.htm (last visited April 24, 2003).30 Id.20 Id.21 Telephone Interview with Pierre McDonnaugh, Futures Policy Analyst,NASD (April 23, 2003).22 Michael J. Walsh, Ph.D., at CCX and Pierre McDonnaugh, Futures PolicyAnalyst, at NASD, have been the two people most involved in the developmentof this verification system. Id.23 Id.24 Id. See also GHG Protocol Initiative, Who’s Using the GHG Protocol?, athttp://www.ghgprotocol.org/standard/users.htm (last visited April 24, 2003)(reporting that Ford Motor Company, Baxter Int’l, Int’l Paper,STMicroelectronics, and StoraEnso are already voluntarily using the GHGProtocol).25 Id.26 Telephone Interview with De’Ana Dow, Director and Chief Counsel forFutures Policy, NASD (April, 23, 2003).27 Id.28 Press Release, NASD, NASD and the Chicago Climate Exchange ReachHistoric Agreement (Sept. 23, 2002) at http://www.nasdr.com/news/pr2002/release_02_046.html.29 Telephone Interview with Pierre McDonnaugh, Futures Policy Analyst,NASD (April 23, 2003).30 Morning Edition, NATIONAL PUBLIC RADIO, Jan. 17, 2003.31 Megawatt Daily, Jan. 17, 2003.
32 Telephone Interview with De’Ana Dow, Director and Chief Counsel forFutures Policy, NASD (April, 23, 2003).33 Smog for Dollars, Pilot Plan Uses Markets to Set Pollution’s Price, SpurCleanup, DALLAS MORNING NEWS, Dec. 5, 2002.34 For example, Denmark and Britain have greenhouse gas markets and Canadais currently piloting one. Trading Hot Air, THE ECONOMIST, Oct. 17, 2002.35 Morning Edition, NATIONAL PUBLIC RADIO, Jan. 17, 2003.36 Telephone Interview with Rafael Marques, Economist, CCX (April 11,2003).37 Exchange in Pollution Credits Formed, CHICAGO SUN-TIMES, Jan. 17, 2003.38 CCX members will initially work with the Brazilian Foundation for SustainableDevelopment to develop offset projects. Thirteen Companies, ChicagoEstablish Greenhouse Gas Trading Exchange, Energy Daily, Jan. 17, 2003.39 Climate Change: Companies Launch GHG Trading System, Pledge to CutEmissions, GREENWIRE, Jan. 17, 2003.40 Smog for Dollars, Pilot Plan Uses Markets to Set Pollution’s Price, SpurCleanup, DALLAS MORNING NEWS, Dec. 5, 2002.41 John F. Temple, The Kyoto Protocol: Will It Sneak Up on the U.S.?, 28BROOK. J. INT’L L. 213, 245 (2002).42 Id., at 248.43 First last name of Author, Smog for Dollars, Pilot Plan Uses Markets to SetPollution’s Price, Spur Cleanup, DALLAS MORNING NEWS, Dec. 5, 2002.44 ELINOR OSTROM, ET AL., NATIONAL ACADEMY OF SCIENCES, THE DRAMA OF THE COMMONS204 (2002).45 Id.46 Id.47 Bob Page, Address at the Earth Technologies Forum, Washington, DC (April22, 2003).48 OSTROM, at 200.49 Id.50 Id. at 200-01.51 Bob Page, Address at the Earth Technologies Forum, Washington, DC (April22, 2003).52 OSTROM, at 200.53 Id. at 216.54 Id. at 208.55 Id.56 Id. at 216 (explaining that the approach causes less disruptions from historicalpatterns and reduces the financial burden on parties).57 Id. at 212.58 Id. at 202 (explaining that in the U.S., there is more co-management infisheries and water programs (where both parties stand to benefit fromprotecting the resource) than in air pollution programs (where only victimscare how much pollution is being emitted)).59 Bob Page, Address at the Earth Technologies Forum, Washington, DC (April22, 2003).60 OSTROM, at 202.61 Id.62 Id.63 Telephone Interview with Rafael Marques, Economist, CCX (May 7, 2003).64 OSTROM, at 206.65 DURWOOD ZAELKE, ET AL., INTERNATIONAL ENVIRONMENTAL LAW AND POLICY 630(Foundation Press 2d ed. 2002) (1998).66 Bob Page, Address at the Earth Technologies Forum, Washington, DC (April22, 2003).67 OSTROM, at 218.68 Id. at 201.69 Id. at 220.70 Id.71 Id.72 Id. at 209.73 Id. at 210.74 Id. at 203.
SUMMER/FALL 2003 28
DAVID, GOLIATH AND THE BEACH CLEANINGMACHINE: HOW A SMALL CALIFORNIA TOWN
FOUGHT AN OIL GIANT—AND WON!Barbara WolcottCapital Books; 232 pg. $25.00.Reviewed By Matt Brown
BOOK REVIEW
What does a lawyer, two years out of law school,running on a dirty beach on the central coast ofCalifornia have to do with a major lawsuit against an
oil giant? That’s the question that Barbara Wolcott answers inDavid, Goliath and the Beach Cleaning Machine: How a Small CaliforniaTown Fought an Oil Giant—And Won!
Wolcott’s book focuses on the small town of AvilaBeach and how its citizens, upon learning that they were sittingon top of a large oil plume, fought to have Unocal, the companythat had supported the town for so long, clean up the mess.At the center of the action are the lawyers and the bureaucratswho go up against the mighty corporation. The book describeshow the environmental lawyers, the water experts, county andstate politicians, state and county bureaucrats, the U.S. ArmyCorps of Engineers, the California Attorney General’s Officeamong others gathered their forces and used the full legal andregulatory arsenal at their disposal to hold Unocal responsible.Unocal, as it could be imagined, using its mantra of “spend nodime before its time” fought these gathered forces tooth andnail not to be held responsible for the oil plume. They usedmoney, paper work, obfuscation, public relations campaigns,political pressure and, of course, legal maneuvering all in attemptto thwart the tiny town’s efforts to force the oil company totake responsibility. In the end, when all the data was collectedand the all facts surrounding leaks in the company’s oil pipelineswere known, Unocal decided to settle and the lawyers,bureaucrats, and townspeople got what they wanted—anenvironmentally clean and safe Avila Beach.
Or did everyone get what they wanted? In thebackground are Avila Beach’s citizens—a collection of the oldand young, the working class and the professional, broughttogether in this experience. During the suit their homes lostvalue. Because Avila Beach was a “company town” the townwas divided between those that worked and were loyal toUnocal and those opposed to the environmental hazards thatthe company had created. The citizens of Avila Beach alsolived in fear for their health, as conflicting answers were givenas to the possible affects of the pollution. This was onlyexacerbated by the arrival of Ed Masry and his sidekick ErinBrockovich (both of whom Wolcott criticizes harshly) whoplayed on the fears of the residents of Avila Beach. For thosethat called Avila Beach home, the legal triumph was a disaster
as some lost their businesses and still others lost their homes.As a result of the settlement, Avila Beach’s downtown had tobe destroyed—a downtown that had been the focal point andheart of town life. Wolcott highlights this tragedy in theaftermath of the environmental catastrophe. As the town wasslowly dismantled, the town celebrated its past and it saidgoodbye to its landmarks.
In Wolcott’s exploration of Avila Beach’s struggle, thebook provides a great introduction to the ins and outs ofwhat happens in an environmental lawsuit for the novice lawyer.In its chronicling Unocal’s tactics, it provides the inexperiencedlawyer with insight into the roadblocks that will be thrown in aplaintiff ’s way. Wolcott also grimly illustrates the sometimesharsh costs of winning—the destruction of the heart of a town,the loss of residents, businesses, and tourists, and in the case ofAvila Beach—a bit of the “funkiness” that the town cherished.David, Goliath and the Beach Cleaning Machine, may not be as rivetingor compelling a read as A Civil Action, but it stands on its ownas a further exploration of how the law helps us bring aboutenvironmental justice.
SUMMER/FALL 2003 29
Americas
Amazon Deforestation Rate Jumps 40%A group of environmental experts warned that four
infrastructure projects in the Amazon have caused a rush ofdeforestation even before building has begun. The report onthe world’s largest tropical forest, by international environmentalexperts charged with advising Brazil and rich countries donatingto a program which has channeled $350 million to conservingthe Amazon, came after data in June showed the Amazondeforestation rate jumped 40 percent last year. Profitable soyfarming is seen as a special threat. Roughly 15 percent of theAmazon - an area larger than western Europe of continuoustropical forest that is home to up to 30 percent of the world’sanimal and plant species - has so far been cut down. AnnualAmazon deforestation rose to 9,840 square miles last year, anarea slightly smaller than Haiti, from 7,010 square miles in 2001.The report recommended that the projects be reconsidered totake into account long-term environmental impacts and urgedthat the wide-scale problem of illegal land deeds in the Amazonbe formalized, which could make monitoring considerablyeasier for the government.1
Ecuadorian Indians Sue Chevron TexacoEcuadorian Indians filed a billion dollar lawsuit
demanding that ChevronTexaco clean-up Amazon jungle afterallegedly dumping toxins that destroyed rivers and made peoplesick. Lawyers for the Indians filed the suit at the Superior Courtin Lago Agrio, marking the first time the decade-old case willbe heard in Ecuador after years of U.S. court battles overjurisdiction. Plaintiffs accuse subsidiary Texaco Petroleum Co.of dumping water laden with oil and metal salts like mercuryand cadmium into Amazon rivers from 1972 to 1992 insteadof reinjecting these waters into the ground. Indians also sayTexaco dumped this oily wastewater into pits that seeped toxinsinto the soil, damaging crops, killing farm animals and causingcancer in local communities, according to a copy of the lawsuitprovided by the plaintiffs. The case was first filed in the UnitedStates in 1993. But the U.S. Second Circuit Court of Appealslast year affirmed a ruling that Ecuador was a more appropriatevenue. Lawyers, who say they represent 30,000 people, allegeTexaco dumped roughly 18.5 billion gallons of oil-laden waterduring operations and demand that the company pay for aclean-up estimated $1 billion.2
Africa
Beetles Save Money For BeninTwo species of beetle are credited with saving the
economy of Benin in West Africa $260 million over 20 years.Between them, they have overpowered an aquatic super-weedthat kills fish, interferes with boats and changes the ecology oflakes. Floating mats of the water hyacinth can double in size inless than two weeks, with the sheer density of its foliage makingfishing and boating all but impossible. In addition, it gives coverto crocodiles, making it hazardous for local people to collectwater.
Harvesting of the weed has proved futile because itgrows so fast. In the late 1980s, Nigeria spent $1.75 million onmachinery to chew up the plants, without making any impact.Pesticides are another option, but they pollute the water andkill other plants. The most effective weapons, though, havebeen the weevils Neochetina eichhorniae and N. bruchi, whicheat water hyacinth and nothing else. Setting them onto the weedcan cut coverage by up to 90 per cent. The beasts were firstintroduced to Sudan, but have now been deployed acrossAfrica.3
Corporate Misfeasance Blamed For Starvation in LesothoAs two million people in Lesotho are in need of
international food aid to avoid starvation, a criminal convictionsuggests that irresponsible corporate conduct may contributeto such development problems. Last May, a Maseru courtsentenced the former head of the Lesotho Highlands WaterProject, Mauspha Sole, to 18 years in prison for bribery. Thecourt found Sole accepted $3 million from Western companiesin exchange for lucrative contracts on the massive dam schemewhich was meant to provide electricity and water to SouthAfrica downstream. Lesotho’s hope is that by prosecuting themultinational construction and engineering conglomerates whopaid the kickbacks will serve as a cautionary tale to Westerncontractors.4
Zambia Adopts Biosafety MeasuresSeven months after Zambia rejected genetically
modified foods and banned American transgenic fooddonations from entering its territory, the Zambian governmenthas developed a National Biosafety and Biotechnology StrategyPlan. The five year plan, from 2003 to 2007, addresses theproliferation of genetically modified organisms (GMOs) inthe country. It also sets the pace for Zambia to develop biosafety
WORLD NEWS BITSBy Roger Phillips
SUMMER/FALL 2003 30
WORLD NEWS BITS
regulations to protect the country’s unique biodiversity. Thenew biosafety and biotechnogy framework identifies seven coreprogram areas. These include environment and biodiversity,which aims at conserving the genetic diversity of Zambia’scrops. Other program areas are livestock, fish, and the controlof environmental pollution. The plan also aims at enactinglegislation that will govern the research, development, andutilization of genetically modified organisms.5
Middle East
Bush Provides Immunity to Oil Industry Work in IraqA executive order signed by President Bush more than
two months ago is raising concerns that U.S. oil companiesmay have been handed blanket immunity from lawsuits andcriminal prosecution in connection with the sale of Iraqi oil. Incountries such as Nigeria, law suits have been used to preventoil companies from destroying the environment and using militiasto quell local protest of corporate practice. However, if thelanguage of the new executive order is given its plain meaning,it could completely shield oil companies from liability – evenif it could be proved that they had committed human rightsviolations, bribed officials or caused great environmental damagein teh course of their Iraqi-related business.6
Asia
Three Gorges Dam Resettles 1.3 MillionThe 1.4 mile wide Three Gorges dam closed its gates
in an effort to provide electricity and flood control forcommunities downstream. The Chinese government willresettle 1.3 million Chinese to make room for the expected600 foot deep, 365 mile long lake. However, there remainsignificant criticisms of the projects ability to fulfill its purpose.Some criticize that it will become a slow-moving cesspoolchoked with sediment and toxic pollutants and that the rapidaccumulation of silt will limit power production and floodcontrol and reduce the dam’s lifespan to just 50 years.7
Tokyo Warned of Power Shortage Without NukesJapan’s trade and industry minister warned that the
Tokyo area could suffer power shortages if Tokyo ElectricPower Co Inc is unable to restart more nuclear reactors.TEPCO, the world’s largest stock exchange-listed power utility,has been forced to successively close down its reactors forsafety checks since last September after it acknowledgedfalsifying some data on past inspections. A large obstacle toTEPCO restarting its reactors is the Japanese public’s concerns
about safety, which have been stoked by a series of accidentsat nuclear plants. TEPCO has turned to thermal power plantsto cover the void left by the loss of nuclear power, whichtypically accounts for a little over 40 percent of its power supply.TEPCO’s reliance on thermal power has also forced a hugerise in the company’s consumption of fossil fuels.8
(Endnotes)1 Axel Bugge, Environmentalists Warn of Roads, Dams in Amazon, REUTERS NEWSSERVICE available at http://www.planetark.org/dailynewsstory.cfm/newsid/20708/story.htm2 Amy Taxin, Ecuador Indians Sue Texaco Over Polluted Water, REUTERS NEWS SERVICEavailable at http://www.planetark.org/dailynewsstory.cfm/newsid/20745/story.htm.3 James Randerson, Weevils Save Lakes From Water Hyacinth, NEW SCIENTIST, May10, 2003, at 10.4 Jason Beaubien, Bribery Scandal in Lesotho, MORNING EDITION NPR, May 19, 2003available at 2003 WL 4857618.5 Singy Hanyona, Zambia Develops Biotechnology Strategy, ENS NEWS SERVICE, April29, 2003 available at http://ens-news.com/ens/apr2003/2003-04-29-01.asp.6 Lisa Girion, Immunity For Iraqi Oil Dealings Rasises Alarm; Some Contend Bush’sOrder Grants U.S. Firms a Broad Exemption, A View The Government Rejects,L.A. TIMES, August 7, 2003 available at WL 2425952.7 Editorial, Determined Disaster, THE BALTIMORE SUN, June 4, 2003 available at 2003WL 57161345.8 Taiga Uranaka, Rising Fuel Costs Bludgeon Tepco Profits, THE JAPAN TIMES, May 21,2003.
SUMMER/FALL 2003 31
INTERNATIONAL CALENDAR
2-5 - Brisbane, AustraliaSixth International River Symposium 2003Web: http://www.riverfestival.com/au/symposium
5-7 - Cancun, Mexico18th Session of the Global Biodiversity Forum: “Biodiversity,Trade and Sustainable Development”Web: http://www.gbf.ch
6-9 - Muscat, OmanInternational Conference on Waste Management & Pest &Rodent ControlWeb: [email protected]
8-17 - Durban, South AfricaThe 5th World Parks Congresshttp://www.iucn.org/themes/wcpa/wpc2003/
9-12 - Delft, the NetherlandsSixth Water Information SummitWeb: http://www.nieindia.org/conferences.htm
9 - Cozumel, MexicoHigh Level Ministerial Dialogue on Trade and Environment—closed meetingWeb: [email protected]
10-11 - PragueInternational Conference for a Sustainable FutureWeb: http://www.unesco.org/iau
15-18 - St. Michielsgestel, The NetherlandsInformation to Support Sustainable Water Management: fromLocal to Global LevelsWeb: http://www.mtm-conference.nl
17-21 - Pantanal, BrazilInterlinkages: Water Resources Management in the PantanalWetlandWeb: http://www.ias.unu.edu
17-19 - Catania, ItalySecond International Conference on the Impact of EnvironmentalFactors on HealthWeb: http://www.wessex.ac.uk/conferences/2003/healthrisk03/index.html
21-28 - Quebec, Canada12th World Forestry CongressWeb: http://www.cfm2003.org
21-23 - Porquerolles, FranceInternational Workshop on Sustainable Fisheries andBiodiversityWeb: http://iucn.org/places/medoffice/indexEN.htm
23-30 - New Delhi, IndiaInternational Conference on EcorestorationWeb: http://www.nieindia.org/conferences.htm
25 - Quebec City, CanadaCertification and World ForestryWeb: http://www.CertificationWatchConference.org
29 SEPT. - 3 OCT. - Moscow, Russian FederationThe Third World Conference on Climate ChangeWeb: http://www.meteo.ru/wcc2003.econc.htm
OCTOBER2 - Toronto, CanadaRound Table: “An Unwelcomed Dimension of Trade: The Impactof Alien Invasive Species in North America”Web: http://www.cec.org
3 - 6 - Sydney, AustraliaThe 3rd International Conference on Wildland Fire andInternational Wildland Fire SummitWeb: http://www.wildlandfire03.com/home.asp
4 - 10 - Tsukuba, JapanForum on Biodiversity Information: Building Capacity in Asiaand OceaniaE-mail: [email protected]
5 - 8 - Marburg, GermanyInternational Workshop “Biological Resources and Migration”Web: http://staff-www.uni0marburg.de/~werner
5 - 9 - Madrid, SpainXI World Water Congress - Water Resources Management the21st CenturyWeb: http://www.cedex.es/iwracongress2003/en/hoja2_en.htm
6 - 10 - Japan7th Governing Board Meeting of the Global BiodiversityInformationWeb: http://www.gbif.org
SEPTEMBER
SUMMER/FALL 2003 32
INTERNATIONAL CALENDAR
6 - 10 - Vienna, AustriaInternational Symposium on Application of Gene-basedTechnologies for Improving Animal Production and Health inDeveloping CountriesWeb:http://www.fao.org/ag/age/d3/mtc/symposium2003.html
14 - 15 - Dubrovnik, CroatiaGroups of Experts on Emerald Network and Pan-EuropeanEcological NetworkWeb: http://www.coe.int/T/E/Cultural_Cooperation/Environment/
15 - Montreal, CanadaIndigenous Peoples’ Contributions to Understanding GlobalEnvironmental ChangeWeb: http://www.cine.mcgill.ca
16 - 18 - Montreal, Canada2003 Open Meeting of the Human Dimensions of GlobalEnvironmental Change Research CommunityWeb: http://sedac.ciesin.columbia.edu/openmeeting
16 - 17 - Dubrovnik, Croatia4th International Symposium of the Pan-European EcologicalNetwork on the theme: “ Marine and Coastal BiologicalDiversity and Protected Areas”Web: http://www.coe.int/T/E/Cultural_Cooperation/Environment/
20 - 24 - Geneva, SwitzerlandSecond Meeting of the Open-ended Working Group of theBasel Convention on the Control of Transboundary Movementsof Hazardous Wastes and Their Disposal (OEWG 2)Web: http://www.basel.int
22 - 24 - Christchurch, New ZealandGreening the City: Bringing Biodiversity Back into the UrbanEnvironmentWeb: http://www.rnzih.org.nz/pages/conference2003.htm
25 - 28 - Ottawa, CanadaSymposium: Biodiversity and Health, Using and SustainingMedicinal ResourcesWeb: http://www.synapse.net/~tropical
27 - 30 - Kiev, Ukraine30th Pacem in Maribus. A Year after Johannesburg, OceanGovernance and Sustainable Development: Ocean andCoastas - a Glimpse into the FutureWeb: http://www.30pim.sevinfo.net
28 - 29 - Geneva, SwitzerlandWTO Committee on Trade and EnvironmentWeb: http://www.wto.org
NOVEMBER
1 - 7 - Bangkok, ThailandFourth Session of the Intergovernmental Forum on ChemicalSafety (IFCS)Web: http://www.ifcs.ch
3 - 7 - Ft. Lauderdale, USAInvasive Plants in Natural and Managed Systems: LinkingScience and Management and 7th International Conference onthe Ecology and Management of Alien Plant InvasionsWeb: http://esa.org/ipinams-emapi7/
3 - 8 - Yokohama, Japan35th Session of the International Tropical Timber CouncilWeb: http://www.itto.or.jp
4 - 7 - Rome, Italy2nd Session of the Intergovernmental Working Group on PlantGenetic Resources for Food and Agriculture (ITWG/PGRA)Web: http://www.fao.org
6 - 9 - Piura, PeruFirst International Congress in Dry ForestWeb: http://www.udep.edu/pe/upadi
6 - 8 - Montreal, CanadaInternational Workshop on Forest Protected AreasWeb: http://www.biodiv.org
10 - 14 - Nairobi, Kenya15th Meeting of the Parties to the Montreal ProtocolWeb: http://www.unep.org/ozone
10 - 12 - Glasgow, UKThe BCPC International Congress - Crop Science &Technology 2003Web: http://www.bcpc.org/Congress2003/About/index.asp
12 - 15 - Florence, ItalyMonitoring and Indicators of Forest Biodiversity in EuropeWeb: http://www.efi.fi/events/2003/Monitoring_and_indicators/
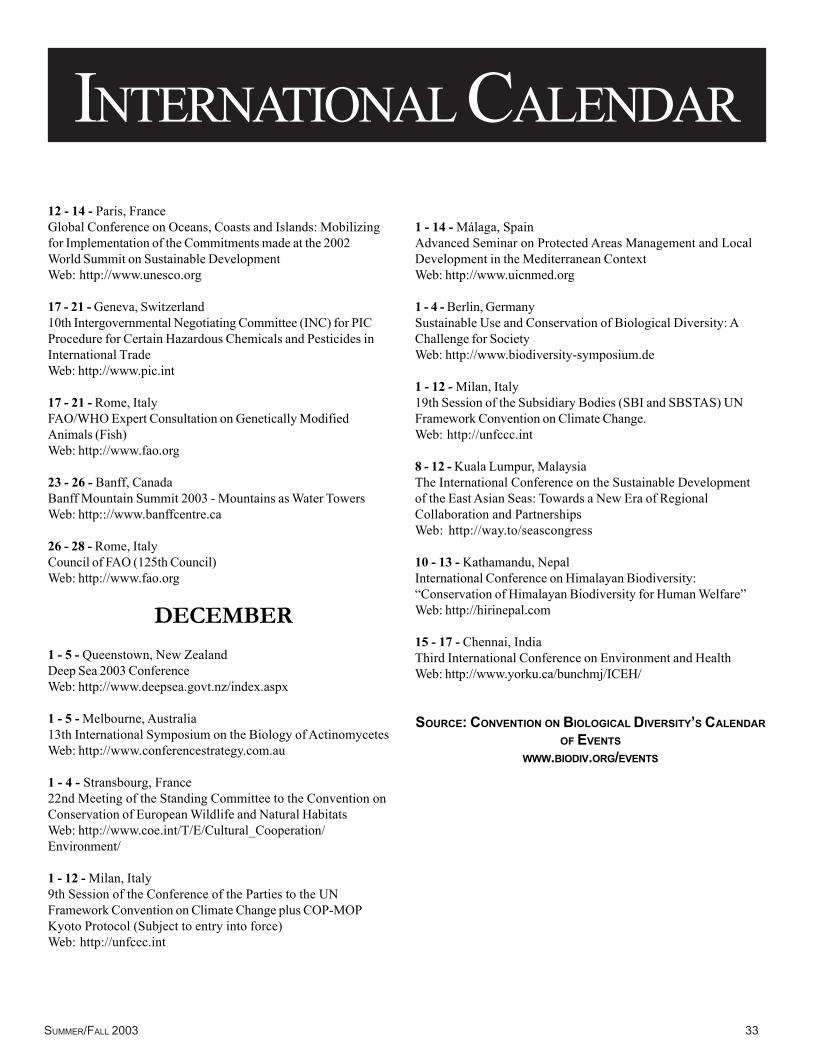
SUMMER/FALL 2003 33
INTERNATIONAL CALENDAR
12 - 14 - Paris, FranceGlobal Conference on Oceans, Coasts and Islands: Mobilizingfor Implementation of the Commitments made at the 2002World Summit on Sustainable DevelopmentWeb: http://www.unesco.org
17 - 21 - Geneva, Switzerland10th Intergovernmental Negotiating Committee (INC) for PICProcedure for Certain Hazardous Chemicals and Pesticides inInternational TradeWeb: http://www.pic.int
17 - 21 - Rome, ItalyFAO/WHO Expert Consultation on Genetically ModifiedAnimals (Fish)Web: http://www.fao.org
23 - 26 - Banff, CanadaBanff Mountain Summit 2003 - Mountains as Water TowersWeb: http:://www.banffcentre.ca
26 - 28 - Rome, ItalyCouncil of FAO (125th Council)Web: http://www.fao.org
DECEMBER1 - 5 - Queenstown, New ZealandDeep Sea 2003 ConferenceWeb: http://www.deepsea.govt.nz/index.aspx
1 - 5 - Melbourne, Australia13th International Symposium on the Biology of ActinomycetesWeb: http://www.conferencestrategy.com.au
1 - 4 - Stransbourg, France22nd Meeting of the Standing Committee to the Convention onConservation of European Wildlife and Natural HabitatsWeb: http://www.coe.int/T/E/Cultural_Cooperation/Environment/
1 - 12 - Milan, Italy9th Session of the Conference of the Parties to the UNFramework Convention on Climate Change plus COP-MOPKyoto Protocol (Subject to entry into force)Web: http://unfccc.int
1 - 14 - Málaga, SpainAdvanced Seminar on Protected Areas Management and LocalDevelopment in the Mediterranean ContextWeb: http://www.uicnmed.org
1 - 4 - Berlin, GermanySustainable Use and Conservation of Biological Diversity: AChallenge for SocietyWeb: http://www.biodiversity-symposium.de
1 - 12 - Milan, Italy19th Session of the Subsidiary Bodies (SBI and SBSTAS) UNFramework Convention on Climate Change.Web: http://unfccc.int
8 - 12 - Kuala Lumpur, MalaysiaThe International Conference on the Sustainable Developmentof the East Asian Seas: Towards a New Era of RegionalCollaboration and PartnershipsWeb: http://way.to/seascongress
10 - 13 - Kathamandu, NepalInternational Conference on Himalayan Biodiversity:“Conservation of Himalayan Biodiversity for Human Welfare”Web: http://hirinepal.com
15 - 17 - Chennai, IndiaThird International Conference on Environment and HealthWeb: http://www.yorku.ca/bunchmj/ICEH/
SOURCE: CONVENTION ON BIOLOGICAL DIVERSITY’S CALENDAROF EVENTS
WWW.BIODIV.ORG/EVENTS

SUMMER/FALL 2003 34

SUMMER/FALL 2003 35
SDLP Non-Profit Org.AMERICAN UNIVERSITY U.S. PostageWASHINGTON COLLEGE OF LAW4801 MASSACHUSSETTS AVENUE, NW PAIDWASHINGTON, DC 20016 Permit No. 1158
Washington, D.C.RETURN POSTAGE GUARANTEEDFORWARDING SERVICE REQUESTED
SUSTAINABLE
DEVELOPMENT
LAW & POLICY
VOLUME III, ISSUE 2 SUMMER/FALL 2003
EXPLORING ENVIRONMENTAL LAW & POLICY ISSUES AROUND THE GLOBE