Published paper JAGR VOLUME 3 ISSUE 7
80
Journal of Applied Global Research ISSN 1938-2073 Volume 3, Issue 7 Published and Sponsored by: Intellectbase International Consortium
-
Upload
sunymaritime1 -
Category
Documents
-
view
3 -
download
0
Transcript of Published paper JAGR VOLUME 3 ISSUE 7

Journal of Applied Global Research
ISSN 1938-2073
Volume 3, Issue 7
Published and Sponsored by: Intellectbase International Consortium

Editor-in-Chief Dr. David King, Tennessee State University, USA
Dr. David King holds a Ph.D in Computer Information Systems and over 15 years experience in Applied Research. He is also a Certified Cisco Systems Instructor, Microsoft Certified Professional, Certified Novell Administrator and has recently achieved Diplomas in Medical & Dental and Pharmacy academic programs. Dr. King’s educational background expands across Australia, Europe, Africa and North America. He is keen in teaching Networking Systems, Computer Systems Security, Applied Information Technology, Relational Database Management Systems, Management Information Systems, E-business strategies, Knowledge Management, Data Mining, Artificial Intelligence, Business Process Reengineering and ERP Application Systems.
Dr. King’s research work is in the areas of: Computer-Mediated-Communication, The Internet and Psychology, E-Learning and Distance Education, The Internet and Global Collaboration, Foreign Aid Projects in Developing Nations, Accounting Information Systems, Knowledge Management, Intelligence & Homeland Security Systems, Health Information Science & Management, Research Methods and Design. He has published in several top Information Systems Conference Proceedings and Journals (IFIP, ACIS, PACIS, IRMA, JAGR, JISTP, etc.). In addition, Dr King serves on several editorial boards in the research community. He has received several research presentation “Best Paper” awards in Seattle, USA, Bangalore, India, Las Vegas, USA, and Venice, Italy. As new research disciplines develop, Dr. King expands his horizons, investigates, experiments and contributes to intellectual consortiums and forums. He serves as the Chair for the Intellectbase International Consortium conferences and leads the Editors Excellence Review Panel (EERP) for the International Handbook of Academic Research & Teaching (IHART) Proceedings. In addition, he currently serves as the Program Coordinator for International Institute of Academic Research.
Contributing Editors
Dr. Frank Cheng Assistant Editor
Central Michigan University, USA
Mrs. Karina Dyer, Managing Editor
Intellectbase International Consortium Australian Affiliate
Dr. Kong-Cheng Wong Assistant Editor
Governors State University, USA
Senior Advisory Board
Dr. Brett Sims, Associate Editor Grambling State University, USA
Dr. Jeanne Kuhler, Associate Editor Auburn University, USA
Dr. Stephen Kariuki, Associate Editor Nipissing University, Canada
Journal of Applied Global Research
Volume 3, Issue 7
ISSN: 1940-1833 Print ISSN: 1938-2073 Online ISSN: 1940-1841 CD-ROM
Copyright ©2010 Intellectbase International Consortium (IIC). Permission to make digital or hard copies of all or part of this journal for
personal or classroom use is granted without fee provided that copies are not made or distributed for profit or commercial use. All copies must bear this notice and full citation. Permission from the Editor is required to post to servers, redistribute to lists, or utilize in a for-profit or commercial use. Permission requests should be sent to Journal of Applied Global Research, 1615 Seventh Avenue North, Nashville,
TN, 37208.

8
Published by Intellectbase International Consortium (IIC) 1615 Seventh Avenue North, Nashville, TN 37208, USA
Editor’s Message
My sincere gratitude goes to the Intellectbase International Consortium (IIC) program committee for their hard work in producing Volume 3, Issue 7. In addition, I want to thank all of the members of the Reviewers‘ Task Panel (RTP), Executive Editorial Board (EEB), Senior Advisory Board (SAB), and the Contributing & Managing Editors (CME) for their efforts, which have made JAGR a successful and indexed academic Journal. They work hard to review, comment on and format the various research papers to fulfill accreditation standards. The articles in this issue offer intellectual contributions and focus on the broadening of academic resources, a continuous development and exchange of ideas among global research professionals.
The Journal of Applied Global Research provides a forum for academics, scientists, practitioners and decision makers to advance their presumptions in a scholarly exertion that has both national and international orientation. The Journal is committed to articles that engage global research and philosophical judgment, with significant practical issues in a range of hard and soft sciences, which identify societal benefits and establishments. JAGR seeks research innovation & creativity and presents original topics. The focus of the journal is to substantiate professional practice, teaching and learning that exemplify global research and collaboration. The Journal attracts ideas of high quality which explore the relationship between expertise in both interpretivist and positivist frames of reference.
We continue to look for individuals interested in becoming a reviewer for IIC conference proceedings and Journals. Potential reviewers should send a self-nomination to the editor at [email protected]. Reviewers may also be asked to be part of the Executive Editorial Board after they have established a positive record of reviewing articles in their discipline.
Intellectbase is one of the world's leading publishers of high-quality multi-disciplinary research in both Academia and Industry. Intellectbase International Consortium has an unwavering commitment to providing methodical Journal content and presenting it in a comprehensible format.
In the areas of integrity and journalism excellence, Intellectbase maintains a high editorial standard. Intellectbase publications are based on the most current research information available and are reviewed by members of the Executive Editorial Board (EEB) and Reviewers‘ Task Panel (RTP). When there is lack of research competence on a topic (technical or exploratory), together the EEB and RTP provide extensive feedback (based on what is known and accurate) to author(s).
For upcoming Intellectbase International Consortium (IIC) conferences, please visit the IIC website at:
www.intellectbase.org
A COMMITMENT TO ACADEMIC EXCELLENCE Articles published in the Journal of Applied Global Research (JAGR) have undergone rigorous
blind review.
www.intellectbase.org

Reviewers Task Panel and Executive Editorial Board
Dr. David White Dr. Dennis Taylor
Roosevelt University, USA RMIT University, Australia
Dr. Danka Radulovic Dr. Harrison C. Hartman
University of Belgrade, Serbia University of Georgia, USA
Dr. Sloan T. Letman, III Dr. Sushil Misra
American Intercontinental University, USA Concordia University, Canada
Dr. Jiri Strouhal Dr. Avis Smith
University of Economics-Prague, Czech Republic New York City College of Technology, USA
Dr. Joel Jolayemi Dr. Smaragda Papadopoulou
Tennessee State University, USA University of Ioannina, Greece
Dr. Xuefeng Wang Dr. Burnette Hamil
Taiyun Normal University, China Mississippi State University, USA
Dr. Jeanne Kuhler Dr. Alejandro Flores Castro
Auburn University, USA Universidad de Pacifico, Peru
Dr. Babalola J. Ogunkola Dr. Robert Robertson
University of the West Indies, Barbados Southern Utah University, USA
Dr. Debra Shiflett Dr. Sonal Chawla
American Intercontinental University, USA Panjab University, India
Dr. Cheaseth Seng Ms. Katherine Leslie
Paññāsāstra University of Cambodia, Cambodia Chicago State University, USA
Dr. R. Ivan Blanco Dr. Shikha Vyas-Doorgapersad
Texas State University – San Marcos, USA North-West University, South Africa
Dr. Tahir Husain Dr. James D. Williams
Memorial University of Newfoundland, Canada Kutztown University, USA
Dr. Jifu Wang Dr. Tehmina Khan
University of Houston Victoria, USA RMIT University, Australia
Dr. Janet Forney Dr. Werner Heyns
Piedmont College, USA Savell Bird & Axon, UK
Dr. Adnan Bahour Dr. Mike Thomas
Zagazig University, Egypt Humboldt State University, USA
Dr. Rodney Davis Dr. William Ebomoyi
Troy University, USA Chicago State University, USA
Dr. Mumbi Kariuki Dr. Khalid Alrawi
Nipissing University, Canada Al-Ain University of Science and Technology, UAE

Reviewers Task Panel and Executive Editorial Board (Continued)
Dr. Mohsen Naser-Tavakolian Dr. Joselina Cheng
San Francisco State University, USA University of Central Oklahoma, USA
Dr. Rafiuddin Ahmed Dr. Natalie Housel
James Cook University, Australia Tennessee State University, USA
Dr. Regina Schaefer Dr. Nitya Karmakar
University of La Verne, USA University of Western Sydney, Australia
Dr. Ademola Olatoye Dr. Anita King
Olabisi Onabanjo University, Nigeria University of South Alabama, USA
Dr. Dana Tesone Dr. Lloyd V. Dempster
University of Central Florida, USA Texas A & M University - Kingsville, USA
Dr. Farhad Simyar Dr. Bijesh Tolia
Chicago State University, USA Chicago State University, USA
Dr. John O'Shaughnessy Dr. John Elson
San Francisco State University, USA National University, USA
Dr. Stephen Kariuki Dr. Demi Chung
Nipissing University, Canada University of Sydney, Australia
Dr. Rose Mary Newton Dr. James (Jim) Robbins
University of Alabama, USA Trinity Washington University, USA
Dr. Mahmoud Al-Dalahmeh Dr. Jeffrey (Jeff) Kim
University of Wollongong, Australia University of Washington, USA
Dr. Shahnawaz Muhammed Dr. Dorothea Gaulden
Fayetteville State University, USA Sensible Solutions, USA
Dr. Brett Sims Dr. Gerald Marquis
Grambling State University, USA Tennessee State University, USA
Dr. Suwannee Adsavakulchai Dr. Debra Stephens
University of the Thai Chamber of Commerce, Thailand University of Portland, USA
Dr. John Tures Dr. David Davis
LaGrange College, USA The University of West Florida, USA
Dr. Mary Montgomery Dr. Peter Ross
Jacksonville State University, USA Mercer University, USA
Dr. Frank Cheng Dr. Van Reidhead
Central Michigan University, USA University of Texas-Pan American, USA
Dr. Vera Lim Mei-Lin Dr. Denise Richardson
The University of Sydney, Australia Bluefield State College, USA

Reviewers Task Panel and Executive Editorial Board (Continued)
Dr. Robin Latimer Dr. Reza Vaghefi
Lamar University, USA University of North Florida, USA
Dr. William Root Dr. Jeffrey Siekpe
Augusta State University, USA Tennessee State University, USA
Dr. Michael Alexander Dr. Greg Gibbs
University of Arkansas at Monticello, USA St. Bonaventure University, USA
Dr. Kehinde Alebiosu Dr. Mike Rippy
Olabisi Onabanjo University, Nigeria Troy University, USA
Dr. Gina Pipoli de Azambuja Dr. Steven Watts
Universidad de Pacifico, Peru Pepperdine University, USA
Dr. Andy Ju An Wang Dr. Ada Anyamene
Southern Polytechnic State University, USA Nnamdi Azikiwe University, Nigeria
Ms. Alison Duggins Dr. Nancy Miller
Vanderbilt University, USA Governors State University, USA
Dr. Dobrivoje Radovanovic Dr. David F. Summers
University of Belgrade, Serbia University of Houston-Victoria, USA
Dr. George Romeo Dr. Robert Kitahara
Rowan University, USA Troy University – Southeast Region, USA
Dr. Natalie Weathers Dr. Brandon Hamilton
Philadelphia University, USA Hamilton's Solutions, USA
Dr. Linwei Niu Dr. William Cheng
Claflin University, USA Troy University, USA
Dr. Nesa L’Abbe Wu Dr. Taida Kelly
Eastern Michigan University, USA Governors State University, USA
Dr. Shahrina Mohd Nordin Dr. Denise de la Rosa
Universiti Technologi PETRONAS, Malaysia Grand Valley State University, USA
Dr. Kathleen Quinn Dr. Kimberly Johnson
Louisiana State University, USA Auburn University Montgomery, USA
Dr. Josephine Ebomoyi Dr. Sameer Vaidya
Northwestern Memorial Hospital, USA Texas Wesleyan University, USA
Dr. Douglas Main Dr. Pamela Guimond
Eastern New Mexico University, USA Governors State University, USA
Dr. Sonya Webb Dr. Vivian Kirby
Montgomery Public Schools, USA Kennesaw State University, USA

Reviewers Task Panel and Executive Editorial Board (Continued)
Dr. Angela Williams Dr. Randall Allen
Alabama A&M University, USA Southern Utah University, USA
Dr. Carolyn Spillers Jewell Dr. Claudine Jaenichen
Fayetteville State University, USA Chapman University, USA
Dr. Kingsley Harbor Dr. Richard Dane Holt
Jacksonville State University, USA Eastern New Mexico University, USA
Dr. Chris Myers Dr. Barbara-Leigh Tonelli
Texas A & M University – Commerce, USA Coastline Community College, USA
Dr. Kevin Barksdale Dr. William J. Carnes
Union University, USA Metropolitan State College of Denver, USA
Dr. Michael Campbell Dr. Faith Anyachebelu
Florida A&M University, USA Nnamdi Azikiwe University, Nigeria
Dr. Thomas Griffin Dr. Donna Cooner
Nova Southeastern University, USA Colorado State University, USA
Dr. James N. Holm Dr. Kenton Fleming
University of Houston-Victoria, USA Southern Polytechnic State University, USA
Dr. Joan Popkin Dr. Zoran Ilic
Tennessee State University, USA University of Belgrade, Serbia
Dr. Rhonda Holt Dr. Edilberto A. Raynes
New Mexico Christian Children's Home, USA Tennessee State University, USA
Dr. Yu-Wen Huang Dr. Cerissa Stevenson
Spalding University, USA Colorado State University, USA
Dr. Christian V. Fugar Dr. Donna Stringer
Dillard University, USA University of Houston-Victoria, USA
Dr. John M. Kagochi Dr. Lesley M. Mace
University of Houston-Victoria, USA Auburn University Montgomery, USA
Dr. Yong-Gyo Lee Dr. Cynthia Summers
University of Houston-Victoria, USA University of Houston-Victoria, USA
Dr. George Mansour Dr. Rehana Whatley
DeVry College of NY, USA Oakwood University, USA
Dr. Peter Miller Dr. Jianjun Yin
Indiana Wesleyan University, USA Jackson State University, USA
Dr. Ted Mitchell Dr. Carolyn S. Payne
University of Nevada, USA Nova Southeastern University, USA

Reviewers Task Panel and Executive Editorial Board (Continued)
Dr. Alma Mintu-Wimsatt Dr. Veronica Paz
Texas A & M University – Commerce, USA Nova Southeastern University, USA
Dr. Liz Mulig Dr. Terence Perkins
University of Houston-Victoria, USA Veterans' Administration, USA
Dr. Robert R. O'Connell Jr. Dr. Dev Prasad
JSA Healthcare Corporation, USA University of Massachusetts Lowell, USA
Dr. P.N. Okorji Dr. Kong-Cheng Wong
Nnamdi Azikiwe University, Nigeria Governors State University, USA
Dr. James Ellzy Dr. Azene Zenebe
Tennessee State University, USA Bowie State University, USA
Dr. Padmini Banerjee Dr. Sandra Davis
Delaware State University, USA The University of West Florida, USA
Dr. Aditi Mitra Dr. Yvonne Ellis
University of Colorado, USA Columbus State University, USA
Dr. Myna German Dr. Elizabeth Kunnu
Delaware State University, USA Tennessee State University, USA
Dr. Robin Oatis-Ballew Dr. Brian A. Griffith
Tennessee State University, USA Vanderbilt University, USA
Dr. Dirk C. Gibson Mr. Corey Teague
University of New Mexico, USA Middle Tennessee State University, USA
Dr. Susan McGrath-Champ Dr. Joseph K. Mintah
University of Sydney, Australia Azusa Pacific University, USA
Dr. Bruce Thomas Dr. Raymond R. Fletcher
Athens State University, USA Virginia State University, USA
Dr. William Seffens Dr. Don Bergman
Clark Atlanta University, USA Tennessee State University, USA
Dr. Kathy Weldon Dr. Svetlana Peltsverger
Lamar University, USA Southern Polytechnic State University, USA
Dr. Shahram Amiri Dr. Caroline Howard
Stetson University, USA TUI University, USA
Dr. Virgil Freeman Dr. Philip H. Siegel
Northwest Missouri State University, USA Augusta State University, USA
Dr. Larry K. Bright Dr. William A. Brown
University of South Dakota, USA Jackson State University, USA

Reviewers Task Panel and Executive Editorial Board (Continued)
Dr. Barbara Mescher Dr. Don Good
University of Sydney, Australia East Tennessee State University, USA
Dr. Jennifer G. Bailey Dr. Ronald De Vera Barredo
Bowie State University, USA Tennessee State University, USA
Dr. Julia Williams Dr. Samir T. Ishak
University of Minnesota Duluth, USA Grand Valley State University, USA
Mr. Prawet Ueatrongchit Dr. Stacie E. Putman-Yoquelet
University of the Thai Chamber of Commerce, Thailand Tennessee State University, USA
Dr. Stephen Szygenda Dr. Curtis C. Howell
Southern Methodist University, USA Georgia Southwestern University, USA
Dr. Brad Dobner Dr. E. Kevin Buell
Tennessee State University, USA Augustana College, USA
Dr. Reza Varjavand Dr. Simon S. Mak
Saint Xavier University, USA Southern Methodist University, USA
Dr. Stephynie C. Perkins Dr. Ibrahim Kargbo
University of North Florida, USA Coppin State University, USA
Dr. Robert Robertson Mrs. Donnette Bagot-Allen
Saint Leo University, USA Judy Piece – Monteserrat, USA
Dr. Kim Riordan Dr. Michael D. Jones
University of Minnesota Duluth, USA Kirkwood Community College, USA
Mrs. Patcharee Chantanabubpha Dr. Eileen J. Colon
University of the Thai Chamber of Commerce, Thailand Western Carolina University, USA
Dr. Neslon C. Modeste Mr. Jeff Eyanson
Tennessee State University, USA Azusa Pacific University, USA
Mr. Wayne Brown Dr. Eleni Coukos Elder
Florida Institute of Technology, USA Tennessee State University, USA
Dr. Tina Y. Cardenas Dr. Brian Heshizer
Paine College, USA Georgia Southwestern University, USA
Dr. Ramprasad Unni Dr. Thomas K. Vogel
Portland State University, USA Stetson University, USA
Dr. Thomas Dence Dr. Hisham M. Haddad
Ashland University, USA Kennesaw State University, USA
Dr. Ralph Harper Jr. Dr. Uche Nwabueze
Florida Institute of Technology, USA University of Houston – Victoria, USA

Reviewers Task Panel and Executive Editorial Board (Continued)
Dr. Jay Sexton Dr. Kiattisak Phongkusolchit
Tennessee State University, USA University of Tennessee at Martin, USA
Ms. Lauren Colline Razzore Dr. Yvette Bolen
William Paterson University, USA Athens State University, USA
Dr. Frank Elston Dr. Chrisila Pettey
Metropolitan State College of Denver, USA Middle Tennessee State University, USA
Dr. Barbara Fralinger Dr. Catherine Matos
Rowan University, USA Clayton State University, USA
Dr. José Villacís González Dr. Sue-Jen Lin
University San Pablo-CEU, Spain I-Shou University, Taiwan
Dr. Yajni Warnapala Dr. Zulkipli Ghazali
Roger Williams University, USA Universiti Teknologi PETRONAS, Malaysia
Dr. Zufni Yehiya Dr. Rena Ellzy
Tree Foundation, London, USA Tennessee State University, USA
Dr. Reza Shafiezadehgarousi Dr. Wendy Cowan
Azad University, Iran Athens State University, USA
Mrs. Ghada Mahdi Dr. Ron Sardessai
University of South Dakota, USA University of Houston-Victoria, USA
Dr. Ralph Butler Dr. Jasmin Hyunju Kwon
Middle Tennessee State University, USA Middle Tennessee State University, USA
Dr. Jakir Hossen Dr. Ronald Mano
Multimedia University, Malaysia Weber State University, USA
Dr. William Howard Kazarian Dr. David Hansen
Hawaii Pacific University, USA Texas Southern University, USA
Mr. David Battista Dr. Nan Chuan Chen
Kennesaw State University, USA Meiho institute of Technology, Taiwan
Dr. Juss Eyanson Dr. Edgar Ferrer
Azusa Pacific University, USA Turabo University, USA
Dr. Marisra Baramichai Dr. Jose Gerardo Martinez Martinez
University of the Thai Chamber of Commerce, Thailand Universidad de Puerto Rico, USA
Dr. Frank Tsui Dr. Jeffrey Campbell
Southern Polytechnic State University, USA Stephen F. Austin State University, USA
Dr. Hetal Jasani Dr. Mary Hudachek-Buswell
Northern Kentucky University, USA Clayton State University, USA

Reviewers Task Panel and Executive Editorial Board (Continued)
Dr. Lee Pickler Dr. Carl Pfaffenberg
Nova Southeastern University, USA University of Tennessee, USA
Dr. Michael Jones Dr. Laura Hansen-Brown
University of Wollongong, Australia Webster University, USA
Dr. Mohammed Halib Dr. Penn Wu
Universiti Teknologi PETRONAS, Malaysia Cypress College, USA
Dr. Jiekwan Kim Dr. Reed Geertsen
Changwon National University, Korea Utah State University, USA
Dr. Youngjin Park Dr. Francis Daniel
Inpack Global Inc., Korea Tennessee State University, USA
Dr. Scott Norman Dr. Gulshan Kumar
Azusa Pacific University, USA Global B-School, India
Dr. Christopher Brown Mr. Fong-Woon Lai
University of North Florida, USA Universiti Teknologi PETRONAS, Malaysia
Dr. Norma Ortiz Dr. Arthur Shriberg
University of Puerto Rico-Mayagüez Campus, USA Xavier University, USA
Dr. Carol Costello Dr. Tanti Irawati Muchlis
University of Tennessee, USA Widyatama University, Indonesia
Dr. Manfred Maute Dr. Ramon Gomez
York University, Canada Florida International University, USA
Dr. Agnes Gathumbi Dr. Retta Guy
Kenyatta University, Kenya Tennessee State University, USA
Dr. Joseph Armour Dr. Ruben Gely
University of Houston – Victoria, USA International Insurance Center – Puerto Rico, USA
Dr. Marcelline Fusilier Dr. Gary Clark
Northwestern State University of Louisiana, USA Saginaw Valley State University, USA
Dr. Chunxing Fan Dr. Ronald Salazar
Tennessee State University, USA University of Houston- Victoria, USA
Mr. Andrew Leidner Dr. Valbona Bejleri
Texas A&M University - College Station, USA University of the District of Columbia, USA
Dr. Michael Lau Dr. Madison Holloway
Sam Houston State University, USA Metropolitan State College of Denver, USA
Dr. Jack Elson Dr. Jun Yang
TUI University, USA The University of Mississippi, USA

Reviewers Task Panel and Executive Editorial Board (Continued)
Dr. Siva Somasundaram Dr. Medha Talpade
University of Houston-Victoria, USA Clark Atlanta University, USA
Dr. Tiffany Jordan Prof. Lana Brackett
Nova University, USA Roger Williams University, USA
Dr. M. N. Tripathi Dr. Kelly Waters
Xavier Institute of Management – Bhubaneswar, India University of South Carolina Upstate, USA
Dr. Marcia Lamkin Dr. Mark Crowley
University of North Florida, USA Bridgewater State College, USA
Dr. Jason Caudill Dr. Vojko Potocan
Carson-Newman College, USA University of Maribor, Slovenia
Dr. Yuxia Zhao Dr. Carrie Hurst
Shandong Administration Institute, China Tennessee State University, USA
Mr. Jesse Cox Dr. Richard Douglass
Metropolitan State College of Denver, USA Eastern Michigan University, USA and Ashesi University, Ghana
The Journal of Applied Global Research (JAGR) is published semi-annually by Intellectbase International Consortium (IIC). The goal of the Journal of Applied Global Research (JAGR) is to provide relevant information to the business, government, and academic communities by helping to promote the interdisciplinary exchange of ideas on a global scale. Articles published in this Journal do not necessarily represent the opinions of Intellectbase International Consortium (IIC) or any of the editors or reviewers. JAGR is listed in Cabell’s Directory of Publishing Opportunities in Educational Technology and Library Science, ProQuest, Ulrich’s Directory and JournalSeek. In addition, JAGR is in the process to be listed in the following databases: ABI Inform, CINAHL, ERIC, EconLit, ACADEMIC JOURNALS DATABASE, ABDC, Thomson SCI and Thomson SSCI.

TABLE OF CONTENT
INFLUENCES OF AGRICULTURAL ACTIVITIES AND SOIL
NITRATE-ADSORPTION TO THE LEVELS OF NITRATE IN
VEUVE RIVER, ONTARIO CANADA
Stephen Kariuki and Kimberly Caruso ..................................................... 1
THE ENVIRONMENTAL IMPACT OF MERCURY
William Emanuel .................................................................................... 12
IMPACT OF GLOBALIZATION ON HIV/AIDS PANDEMICS
AND THE CHALLENGES OF COMPULSORY LICENSING AND
PARALLEL IMPORTATION
E. William Ebomoyi ................................................................................ 23
A COMPARISON OF COMPUTER-BASED AND TRADITIONAL
COLLEGE ALGEBRA COURSES
Ningjun Ye and Sherry S. Herron .......................................................... 40
DEFENDING AGAINST BOTNETS
Somasheker Akkaladevi and Ajay K Katangur ...................................... 50

S. Kariuki and K. Caruso JAGR - Volume 3, Issue 7 (2010), pp. 1-11
1
INFLUENCES OF AGRICULTURAL ACTIVITIES AND SOIL NITRATE-ADSORPTION TO THE LEVELS OF NITRATE IN VEUVE RIVER,
ONTARIO CANADA
Stephen Kariuki and Kimberly Caruso Nipissing University, Canada
ABSTRACT
This study was designed to investigate whether the agricultural activities situated along the Veuve River influence the nitrate levels in that river. The Veuve River is located in Northern Ontario and it drains into Lake Nipissing. Three sites along the river were chosen for the study. Two of these sites are located in an agricultural region and the other site is located upstream, where farming is not practiced. The analysis of the nitrate concentration in the three locations was accomplished by the cadmium-reduction method. Samples of water from the three sites had been collected on a monthly frequency during the months of June to November 2009. The study revealed that the nitrate levels in the non-agricultural region were pretty much about the same to the nitrate levels at the other two sites situated at an agricultural region. This suggests that for the period the sampling was carried out, the agricultural activities do not appear to have been enhancing the amount of nitrate in the Veuve River. The “titanous chloride method” was also investigated for its suitability in the analysis of nitrate. The results obtained using this method appears erroneous and therefore unreliable. The extent to which nitrate-adsorbs to the soil in the agricultural region has been studied. The current study shows that nitrate does not adsorb to the soils collected from the three sites where water samples were analyzed for nitrate-concentration. Keywords: Nitrate Analysis, Nitrate-Leaching, Titanous Chloride Method, Cadmium-Reduction
Method, Nitrate-Adsorption.
1. INTRODUCTION
Farmers apply nutrients such as phosphorus, nitrogen, and potassium in the form of chemical fertilizers, manure, and sludge. They may also grow legumes and leave crop residues to enhance production. When these sources exceed plant needs, or are applied just before it rains, nutrients can wash into aquatic ecosystems. High concentrations of nitrate in drinking water can cause methemoglobinemia, a potentially fatal disease in infants, also known as blue baby syndrome. In addition, nitrates can also cause cancer in the digestive tract because they can form N-nitrosamines which are one of the most potent carcinogens in mammals (Alonso and Camargo, 2005). Work done by Taiz and Zeiger (2006) has shown that many plants only use up less than half of the amount of fertilizer they are given. Battaglin and Goolsby (1997) have also shown that there are elevated levels of nitrates in fall, winter, and spring months in the Midwestern United States. Therefore, use of fertilizers creates a substantial
Full Article Available Online at: Intellectbase and EBSCOhost │ JAGR is indexed with Cabell‘s, JournalSeek, etc.
JOURNAL OF APPLIED GLOBAL RESEARCH
Journal Homepage: www.intellectbase.org/journals │ ©2010 Published by Intellectbase International Consortium, USA
Influences of Agricultural Activities and Soil Nitrate-Adsorption to the Levels of Nitrate in Veuve River, Ontario Canada
2
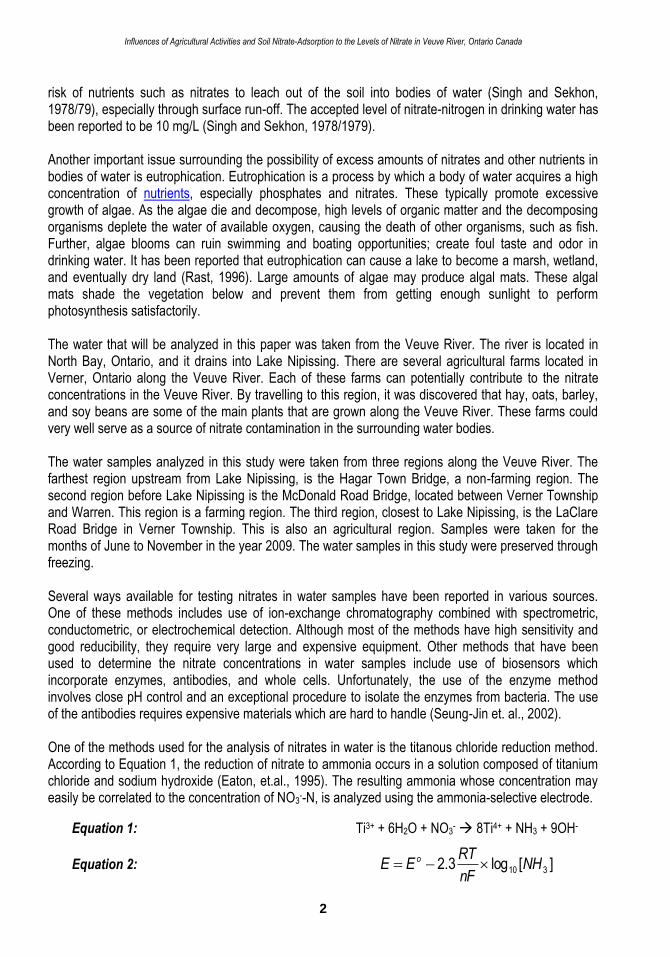
risk of nutrients such as nitrates to leach out of the soil into bodies of water (Singh and Sekhon, 1978/79), especially through surface run-off. The accepted level of nitrate-nitrogen in drinking water has been reported to be 10 mg/L (Singh and Sekhon, 1978/1979). Another important issue surrounding the possibility of excess amounts of nitrates and other nutrients in bodies of water is eutrophication. Eutrophication is a process by which a body of water acquires a high concentration of nutrients, especially phosphates and nitrates. These typically promote excessive growth of algae. As the algae die and decompose, high levels of organic matter and the decomposing organisms deplete the water of available oxygen, causing the death of other organisms, such as fish. Further, algae blooms can ruin swimming and boating opportunities; create foul taste and odor in drinking water. It has been reported that eutrophication can cause a lake to become a marsh, wetland, and eventually dry land (Rast, 1996). Large amounts of algae may produce algal mats. These algal mats shade the vegetation below and prevent them from getting enough sunlight to perform photosynthesis satisfactorily. The water that will be analyzed in this paper was taken from the Veuve River. The river is located in North Bay, Ontario, and it drains into Lake Nipissing. There are several agricultural farms located in Verner, Ontario along the Veuve River. Each of these farms can potentially contribute to the nitrate concentrations in the Veuve River. By travelling to this region, it was discovered that hay, oats, barley, and soy beans are some of the main plants that are grown along the Veuve River. These farms could very well serve as a source of nitrate contamination in the surrounding water bodies. The water samples analyzed in this study were taken from three regions along the Veuve River. The farthest region upstream from Lake Nipissing, is the Hagar Town Bridge, a non-farming region. The second region before Lake Nipissing is the McDonald Road Bridge, located between Verner Township and Warren. This region is a farming region. The third region, closest to Lake Nipissing, is the LaClare Road Bridge in Verner Township. This is also an agricultural region. Samples were taken for the months of June to November in the year 2009. The water samples in this study were preserved through freezing. Several ways available for testing nitrates in water samples have been reported in various sources. One of these methods includes use of ion-exchange chromatography combined with spectrometric, conductometric, or electrochemical detection. Although most of the methods have high sensitivity and good reducibility, they require very large and expensive equipment. Other methods that have been used to determine the nitrate concentrations in water samples include use of biosensors which incorporate enzymes, antibodies, and whole cells. Unfortunately, the use of the enzyme method involves close pH control and an exceptional procedure to isolate the enzymes from bacteria. The use of the antibodies requires expensive materials which are hard to handle (Seung-Jin et. al., 2002). One of the methods used for the analysis of nitrates in water is the titanous chloride reduction method. According to Equation 1, the reduction of nitrate to ammonia occurs in a solution composed of titanium chloride and sodium hydroxide (Eaton, et.al., 1995). The resulting ammonia whose concentration may easily be correlated to the concentration of NO3
--N, is analyzed using the ammonia-selective electrode.
Equation 1: Ti3+ + 6H2O + NO3- 8Ti4+ + NH3 + 9OH-
Equation 2: ][log3.2 310 NHnF
RTEE o

S. Kariuki and K. Caruso JAGR - Volume 3, Issue 7 (2010), pp. 1-11
3
The ammonia electrode detects ammonia gas when the latter diffuses through its hydrophobic gas-permeable membrane and reaches a partial pressure equilibrium on either side of the membrane. As ammonia crosses the membrane, the potential develops across the membrane. The resulting potential may be correlated to the ammonia concentration as demonstrated in the Nernst equation (Equation 2), (Fisher Scientific, 2006). The symbol E in Equation 2 represents the potential, E0 the standard electrode potential, R the gas constant, T the temperature, n the number of moles of electrons, and F the Faraday constant. The ammonia-gas selective electrode method is said to be faster than some other nitrate-determination methods. The method is also described as being accurate and having a detection limit of 0.01-10 mg NO3-N/L (Eaton, et.al., 1995). The second method for nitrate analysis used by the authors of the current work is the ―cadmium-reduction method‖. The method uses copper-cadmium granules packed in a glass reduction column to reduce the nitrate in the water samples to nitrite. The resulting nitrite is then analyzed colorimetrically. The method is recommended especially when other methods do not provide appropriate sensitivity (Eaton, et.al., 1995). It has a detection limit of 0.01-1.0 mg NO3-N/L. As the results will demonstrate, the agricultural activities along River Veuve do not appear to contribute enhanced nitrate levels to the river through leaching. Soil samples collected from the Veuve River agricultural regions have also been investigated for their potential of having nitrate-adsorption. Such adsorption could minimize leaching of nitrate into the river and thereby help explain why agricultural activities in areas with such soils may reduce nitrate amounts in the run-offs. A study by Rhoades (1992) has shown that nitrate does not adsorb to soil particles because of the latter being negatively charged. However, many authors have reported observing adsorption of nitrate to some types of soil (Kinjo and Pratt, 1971; Kovrigo and Iryanova, 1982; Wang et al., 1987; Wong et al., 1990a,b; Cahn et al., 1992; Gonzalezpradas et al., 1993; Herbel and Spalding, 1993; Reynolds-Vargas et al., 1994). Adsorption of such anions has been associated with presence of positive charges that tend to be pH dependent (Metson, 1979). In the current study, the adsorption of nitrate to soil was assessed using a column method, as described elsewhere by Wong et al. (1990a,b) and Herbel and Spalding (1993). The main objective of the present study was to establish if the Veuve River is in fact being contaminated with nitrates from the crop fields along this section of the river.
2. MATERIALS AND METHODS
2.1. Water Sample Collection
Water samples were collected using a trip mechanism with the help of an apparatus was made by WILDCO (Bloomfield, Connecticut). For safety reasons, all the samples were collected from sites that had bridges. The trip apparatus used had a capacity of more than one liter of water. The water samples were collected in one-liter bottles made of propylene. Before collection of the water samples, the bottles were washed with soap, rinsed with distilled water, then rinsed with 1 M HNO3, and finally rinsed again with nitrate free water. The bottles were then air dried by leaving them inverted to drain for two days. The water samples were collected monthly from June to November of 2009 from three different sites. The first site was situated in a non-agricultural region at 7292 Ontario 35 Hagar Town Bridge. The second and the third sites are both agricultural regions and they are at 14 McDonald Road and at 386 Laclare Road. The sites are shown in Figure 1.

Influences of Agricultural Activities and Soil Nitrate-Adsorption to the Levels of Nitrate in Veuve River, Ontario Canada
4
Figure 1: The Hagar Town, McDonald road, and the Laclare road sampling sites (http://maps.google.ca/maps/ms?hl=en&ie=UTF8&msa=0&msid=105448828794383044420.00048397921cfcadc6d55&ll=46.435491,-80.266113&spn=0.265001,0.439453&t=h&z=11).
2.2. Ammonia-Selective Electrode Method
2.2.1. Calibration Curve
Standards of ammonia whose concentrations ranged from 10-4 to 10-1 M were prepared using ammonium chloride (Fisher Scientific Canada). To a 50-mL aliquot of each standard, 5 mL of a solution consisting of 10 M NaOH and 1 M disodium ethylenediamine tetraacetic acid was added. NaOH solution made the solution alkaline and disodium ethylenediamine tetraacetic acid complexed any cations contained in the standards or the water samples that were analyzed. The cations are known to potentially cause some interference at the electrode. A 1-mL TiCl3 (VWR Canada) aqueous solution (15% w/w) was further added to the resulting solution as a reducing agent for nitrate to ammonia, as shown in Equation 1. The ammonia gas-sensing electrode was immersed into the solution and the potential measured after stabilization. A calibration curve was created using the data collected.

S. Kariuki and K. Caruso JAGR - Volume 3, Issue 7 (2010), pp. 1-11
5
2.2.2. Potential Measurement Using Ammonia Selective Electrode
Samples were run through a vacuum filtration system first using a Whatman No. 4 filter paper followed by a 0.45 micrometer filter paper. Any water samples that happened to have been highly coloured were decolorized using a small amount of activated charcoal. A 50-mL aliquot of the resulting water sample was placed in a 250-mL beaker and treated in a manner similar to the way the standards were treated for the potential measurements.
2.3. Cadmium Reduction Method
2.3.1. Preparation of the Solutions
The nitrate-colour developing reagent was prepared by first adding a 100-mL aliquot of 85% phosphoric acid and 10 g sulfanilamide to 800 mL of water. Once sulfanilamide was completely dissolved, 1 g of N-(1-naphthyl)-ethylenediamine dihydrochloride (Fisher Scientific Canada) was added and mixed until it dissolved. The resulting solution was diluted to 1 L with nitrate-free water. An ammonium chloride-EDTA solution was prepared by adding 13 g of NH4Cl (Fisher Scientific Canada) and 1.7 g of disodium ethylenediamine tetraacetate to 900mL of water. The resulting solution was diluted to 1 L with nitrate-free water. A dilute ammonium chloride-EDTA solution was also made by mixing 300 mL of the above ammonium chloride-EDTA solution with 200 mL of nitrate-free water. A 2% (w/v) copper sulfate solution was prepared by making a 1-L aqueous solution of 20 g of CuSO4
.5H2O. A nitrate-stock solution was prepared by making a 1-L aqueous solution containing 0.7218 g of oven dried KNO3. An intermediate nitrate solution was prepared by diluting 100 mL of the stock nitrate solution to 1000 mL with nitrate-free water. A further working nitrate solution with a 5 µg/mL of NO3
—N concentration was prepared by diluting 50 mL of the intermediate nitrate solution to 500 mL with nitrate-free water.
2.3.2. Preparation of the Reduction Column
A 50 mL volumetric pipette was used to make the cadmium-reduction column. As shown in Figure 2, the tip of the pipette as well as the top of the protruding section of the pipette was cut off. Glass wool was inserted into the end of the column to act as a plug. The column was then filled with water followed by copper-cadmium granules, prepared by shaking cadmium granules with a 2% (w/v) copper sulfate solution, a procedure described fully by Eaton et al. (1995). The copper-cadmium granules were loaded on the narrow bore of the pipette, up to a level of 18.5 cm. A similar cadmium-reduction column made from a 100-mL pipette is shown in Figure 2 (Eaton et. al, 1995). The buffer used in the column was kept above the granule level to prevent air bubbles getting trapped in the column. After washing the column with 200 mL of the dilute NH4Cl-EDTA solution, the column was activated by eluting it with 100 mL of a solution that was composed of 25% of 7 mg/L NO3
--N standard and 75% of the diluted NH4Cl-EDTA solution, at a rate of 7-10 mL/min.

Influences of Agricultural Activities and Soil Nitrate-Adsorption to the Levels of Nitrate in Veuve River, Ontario Canada
6
Figure 2: A cadmium-reduction column made from a 100 mL volumetric pipette (Eaton, et.al., 1995).
2.3.3. Reduction of Samples and Measurement
A 25-mL aliquot of a filtered water sample was diluted in a 100-mL volumetric flask to the mark using the diluted NH4Cl-EDTA solution. The resulting solution was then gently poured into the reduction column and eluted. The first 50 mL of the eluate was collected and discarde. The next 50 mL of the eluate was collected in two portions each having a volume of 25 mL. A 20-mL aliquot of each of the eluate collected was transferred to another beaker and 0.8-mL of the colour reagent was added to it. The resulting solution was mixed well and allowed to sit for 20 minutes before absorbance was measured at a wavelength of 543 nm against a distilled-water blank. The absorbance values recorded were then evaluated using a calibration curve of standards of concentration ranging from 0.05 to 1.0 mg NO3-N/L that had been reduced the same way as the samples.
2.4. Nitrate-Adsorption to Soil Samples
Soil samples were obtained at various locations of the agricultural region along the Veuve River. The samples were pooled together, air dried, ground, and sieved to 75 microns prior to their analyses. With the help of a powder-funnel, 100 g of an air-dried filtered soil sample were loaded into a 2-cm internal diameter column (Figure 3), to which a plug of glass wool had been placed at the bottom of the column. The column was then half-filled with water to reduce chances of air being trapped in the column when

S. Kariuki and K. Caruso JAGR - Volume 3, Issue 7 (2010), pp. 1-11
7
loading the soil sample. Once loaded in the column, the soil sample was flushed with 100 mL of nitrate-free water. To reduce the chances of having air trapped in the column, the level of water or solution used in the column was not allowed to go below the level of the soil sample. A 100-mL aliquot of 1 mg/L of NO3
--N was eluted through the column. The first 25 mL of the eluate was discarded. Two consecutive portions of 30-mL of eluate were collected and analyzed for NO3
--N concentration using the cadmium reduction method, as discussed above.
Figure 3: 2-cm internal diameter column
3. RESULTS AND DISCUSSIONS
3.1. Water Samples
The data in Table 1 gives the NO3--N concentrations in the water samples collected from the three
different locations along the Veuve River. The results were obtained using the ammonia-selective electrode method. As the data shows, the concentrations of NO3
--N found using this method range from 6.3 to 888 mg/L. The range of this data is unusually large. Further, some of the values such as 888 ppm NO3
--N appear to simply be way off the reality. Work done by Jing et al. (2001) has shown that the ammonia-nitrogen (NH3-N) concentration of 14 mg/L was observed in polluted river waters. This value is much smaller than the 888 mg/L of NO3
—N, obtained using the electrode method used in this work. A review by Meybeck (1982) has shown what the average nitrogen values for the unpolluted world rivers are generally low. He reports that the average concentration of the dissolved inorganic nitrogen (DIN) such as NH3-N over several rivers is 0.12 mg/L. Further, Meybeck (1982) has indicated that the average concentration for the dissolved organic carbon (DON) is 0.26 mg/L. The experimental values obtained in our lab using the electrode method are listed Table 1. Based on the reports by other workers, the results we obtained using the electrode method appear questionable. The authors of this work believe that even though the technique used to obtain these results has been well documented (Eaton et. al, 1995), there is a major problem with the technique. In one of the steps involving this method, many bubbles of gas appeared to develop at the ammonia-selective electrode during the potential measurement. We believe that the bubbles adsorbed onto the ammonia-selective electrode

Influences of Agricultural Activities and Soil Nitrate-Adsorption to the Levels of Nitrate in Veuve River, Ontario Canada
8
might have lead to erroneous potential values, as reported elsewhere by Eigeldinger and Vogt (2000). These two authors (Eigeldinger and Vogt) specifically report that gas bubbles adhering to an electrode are known to exert substantial effect on mass of particles to the membrane.
Table 1: Average nitrate concentrations for the water river samples taken from Veuve River
Date of Sampling Sampling Site Average Concentration (mg NO3-N/L)
7th July, 2009 386 Laclare Rd. at Bridge 888.0
7292 Ontario 35 Hagar Town Bridge 686.8
14 McDonald Rd. at Bridge 298.6
23rd Aug, 2009 7292 Ontario 35 Hagar Town Bridge 6.330
30th Sept, 2009 386 Laclare Rd. at Bridge 217.2
7292 Ontario 35 Hagar Town Bridge 102.2
14 McDonald Rd. at Bridge 191.5
12th Nov, 2009 386 Laclare Rd. at Bridge 811.3
For the nitrate ion (NO3
-) to be responsive to the ammonia selective electrode, it should be reducable to ammonia (NH3). In this work, titanous chloride (TiCl3) was used as the reducing agent for the nitrates as shown in Equation 1 above. The authors of this work observed that it was during this step that many bubbles whose identity is yet to be determined were forming at the electrode. When the ammonia standards prepared from ammonium chloride were analyzed using the ammonia electrode method, a linear correlation was obtained (Figure 4). Such a well-fitting correlation curve was not obtained when nitrate standards were analyzed using the method described above. This observation underscores the fact that the reduction process of the nitrate to ammonia appears suspect and should therefore be a subject of further investigation.
Figure 4: The potential readings obtained when titanous chloride and ISA solution was added to the ammonium ion standards in the titanous chloride reduction method.

S. Kariuki and K. Caruso JAGR - Volume 3, Issue 7 (2010), pp. 1-11
9
Figure 5 shows the standard calibration graph of NO3--N, obtained using the cadmium reduction
method. This graph yielded the regression line that was used to find the concentrations of the unknown water samples. The results obtained from the unknown water samples for July to November 2009 are presented in Figure 6. It appears that the concentration of the nitrates in the regions that were sampled were relatively stable over the period of the testing. In addition, the samples collected during the month of August at the Hagar Town Bridge location, as well as in October at the LaClare Road location and at the McDonald Road location appear to have had higher NO3
--N levels than the other samples tested throughout the study.
Figure 5: Standard calibration graph obtained using the cadmium reduction method for standards with concentrations of 0.05, 0.1, 0.2, 0.5, and 1.0 mg/L of NO3
--N.
Figure 6: Concentrations of NO3
--N found at various sites (a = 386 Laclare Rd, Verner, ON; b = 14 McDonald Rd located between Verner and Warren, ON; c = 7292 Ontario 35 Haga, ON) along the Veuve River during different times of the year.

Influences of Agricultural Activities and Soil Nitrate-Adsorption to the Levels of Nitrate in Veuve River, Ontario Canada
10
3.2. Soil Samples
The recovery of NO3--N from the standards that were analyzed is shown in Table 2. As the results
indicate, the soil samples analyzed do not appear to adsorb nitrate.
Table 2: Percentage recovery of NO3--N from soil samples from River Veuve farming region
Concentration of NO3--N, mg/L 0.1 0.2 0.5 1.0
Percentage recovery of NO3--N 98.2 99.8 99.4 99.1
4. CONCLUSION
The data presented in this study using the ammonia-selective electrode and the cadmium-reduction methods suggests that further investigation aimed at exploring the shortcomings of the well documented ammonia-selective electrode method (Eaton, et. al, 1995) requires further investigation. The latter method gave suspect concentration values of NO3
--N in samples collected from Veuve River possibly due to the ineffectiveness of titanous chloride as a reducing agent for nitrate to ammonia. On the other hand, the cadmium-reduction method appears to have provided reliable data of the NO3
--N concentration in the Veuve River. Generally, it appears that the NO3
--N concentration in the Veuve River over the July of 2009 through November of 2009 period was below 0.1 mg/L. This observation points to a high likelihood that the nitrates used as fertilizers in the Veuve River farming region do not leach into the river. This conclusion is supported by our results that show that the extent to which the soil in the agricultural region adsorbs nitrate could only be minimal. Whether microbial activities contribute to the low level of nitrate leached into the river may be a subject of further investigation. The spikes in October may be due to runoff from the agricultural land. The rainfall data from the weather in North Bay, Ontario for 2009 (Environmental Canada, 2010) appears to legitimize this claim. The month of October 2009 had a total of 148.8 mm of rainfall. July, August, September, and November of the year 2009 had a total rainfall of 153.6 mm, 80.0 mm, 50.4 mm, and 47.4 mm, respectively. The high amount of rainfall in October likely caused some fertilizer-leach to run off into the Veuve River. It is worthwhile noting that the data upon which the above conclusion has been drawn is based on a few months of data collection. A thorough study involving water-sampling over several months and perhaps years probably provide more conclusive information.
5. REFERENCES
Alonso, A; Camargo, J. Nitrate Toxicity to Aquatic Animals: A Review with New Data for Freshwater Invertebrates, (2005). Chemosphere Vol. 58, pp. 1255-1267.
Battaglin, W; Goolsby, D. Statistical Modeling of Agricultural Chemical Occurrence in Midwestern Rivers, (1997). Journal of Hydrology Vol. 196, pp. 1-25.
Cahn, M.D; Bouldin, D.R; Cravo, M.S. Nitrate sorption in the profile of an acid soil, (1992). Plant and Soil Vol. 143, pp. 179-184.
Eaton, A; Clesceri, L; Greensberg, A. Standard Methods for the Examination of Water and Wastewater, (1995). American Public Health Association. Washington, DC 20005.
Eigeldinger, J; Vogt, H. The bubble coverage of gas-evolving electrodes in a flowing electrolyte, (2000). Electrochimica Acta Vol. 45, pp. 4449-4456.

S. Kariuki and K. Caruso JAGR - Volume 3, Issue 7 (2010), pp. 1-11
11
Environment Canada. National Climate Data and Information Archive. http://www.climate.weatheroffice.gc.ca/climateData/monthlydata_e.html?timeframe=3&Prov=CA&StationID=4201&Year=2009&Month=4&Day=19, (20 April 2010).
Fisher Scientific. Instruction Manual for the Accumet Ammonia Combination Ion Selective Electrode. Printed; April 2006.
Gonzalezpradas, E; Villafrancassanchez, M; Socciasviciana, M. Phosphate and nitrate sorption on calcareous soils from Spain, (1993). Arid Soil Res. Rehab. Vol. 7, pp. 181-190.
Herbel, M.J; Spalding, R.F. Vadose zone fertilizer-derived nitrate and extracts, (1993). Ground Water Vol. 31, pp. 376-382.
Jing, S; Lin, Y; Lee, D; and Wang, T. Nutrient removal from polluted river water by using constructed wetlands, (2001). Bioresource Technology Vol. 76(2), pp. 131-135.
Kinjo, T; Pratt, P.F. Nitrate adsorption. I. In some acid soils of Mexico and South America, 1971). Soil Sci. Soc. Am. Proc. (Vol. 35, pp. 722-725.
Kinjo, T; Pratt, P.F; Page, A.L. Nitrate adsorption: III. Desorption movement and distribution in Andepts, (1971). Soil Sci. Soc. Am. Proc. Vol 35, pp. 728-732.
Kovrigo, V.P;Iryanova, Y.M; Adsorption of nitrates by soil, (1982). Sov. Soil Sci. Vol. 14; pp. 728-732. Metson, A.J. Sulphur in New Zealand soils. I. A review of sulphur in soils with particular reference to
adsorbed sulphate-sulphur, (1979). N.Z. J. Agric. Res. Vol. 22, pp. 95-114. Meybeck, M. Carbon, Nitrogen, and Phosphorus Transport by world rivers, (1982). American Journal of
Science Vol. 282, pp. 401-450. Rast, W. Trends in Eutrophication Research and Control, (1996). Hydrological Processes Vol. 10; pp.
295-313. Reynolds-Vargas, J.S; Richter, D.D; Bornemisza, R. Environmental impacts of nitrification and nitrate
adsorption in fertilized Andisols in the Valle Central of Costa Rica, (1994). Soil Sci. Soc. Am. Proc. Vol. 38, pp. 44-45.
Rhoades, J.D. Cation exchange capacity. Pages 149-157 in Page A.L. et al. (Eds). Methods of soil analysis, part 2. Chemical and microbiological properties 2nd ed. Agornomy No. 9. American Society of Agronomy, Madison, WI.
Seung-Jin, C; Isao, K; Kazunori, I; Satoshi, S. A Simple Nitrate Sensor System Using Titanium Trichloride and an Ammonium Electrode, (2002). Sensors and Actuators B: Chemical Vol. 85, Issue 1-2, pp. 120-125.
Singh, B; Sekhon, G. Nitrate Pollution of Groundwater from Farm Use of Nitrogen Fertilizers – A Review, (1978/1979). Agriculture and Environment Vol. 4, pp. 207- 225.
Taiz, L; Zeiger, E. Plant Physiology. 4th ed. Sinauer Associates Inc., Sunderland, Massachusets, 2006. Wang, P.G; Ji, G.L; Yu, T.R. Adsorption of chloride and nitrate by variable charge soils in relation to the
electric charge of the soil, (1987). Z. Planzenernahr. Bodenkd. Vol. 150, pp. 17-23. Wong, M.T.F; Hughes, R; Rowell, D.L. Retarded leaching of nitrate in acid soils from the tropics:
measurement of the effectiveness of the anion exchange capacity, (1990a). J. Soil Sci. Vol. 41, pp. 655-663.
Wong, M.T.F; Rowell, D.L; Hughes, R. The retention of nitrate in acid soils from the tropics, (1990b). Soil Use Manage. Vol. 6, pp. 72-74.

W. Emanuel JAGR - Volume 3, Issue 7 (2010), pp. 12-22
12
THE ENVIRONMENTAL IMPACT OF MERCURY
William Emanuel Morgan State University, USA
ABSTRACT
In light of understanding the Green House Effect, PCBs, Acid Rain, CFCs and the hole over the Ozone in the Antarctic. One can realize that these problems and issues are far beyond what we think. All these issues are a direct correlation with the introduction of the industrial revolution and the technologies implemented. This paper will look at some of the consequences for not implementing a sustainable system that is in harmony with our eco-system. This lays the foundation for engineers and scientists to see the need to develop sustainable systems that take into account the life cycle of their products and processes. Keywords: Bioaccumulation, Methyl-Mercury, Neosynephrine, Toxicokinetics, Neurotoxic,
Immunopathology, Neurodevelopmental Diseases.
MERCURY’S CHEMICAL NATURE
Mercury is a heavy metal of which some forms are known to be highly toxic. Though mercury occurs naturally in the environment it is now mainly released by human activities. Mercury is sometimes known as quicksilver that occurs naturally in the environment in different chemical forms. The pure form, elemental mercury, is liquid at room temperature and slowly forms a vapor in the air. Forms more commonly found in nature are inorganic mercury and organic mercury (UEP, 2002). As with other potentially-toxic trace elements, the environmental impact of mercury depends in part on the availability of the element, and its chemical form, in addition to its concentration in the environment. Unlike most other heavy metals, mercury exhibits a substantial vapor pressure and can develop significant gaseous concentrations. In addition, mercury can be subject to processing by microorganisms, and its methylation to organic forms is particularly important with respect to its environmental toxicity. The cycling of mercury through the various environmental compartments is particularly active and complicates the understanding of source, transport, fate, and environmental impact of this heavy metal (Lechler, 2003) In the environment, mercury can migrate between various media, such as air, soil and water. Conceptually, movements of mercury between these different environmental "compartments" are commonly known as "fluxes", and the quantities of mercury in the various compartments are often referred to as "pools". These fluxes and pools are studied in order to help assess the global mercury budget. Quantifying human versus natural mercury fluxes can be challenging because mercury deposited from anthropogenic releases can be re-emitted from land and water, undergo long-range
Full Article Available Online at: Intellectbase and EBSCOhost │ JAGR is indexed with Cabell‘s, JournalSeek, etc.
JOURNAL OF APPLIED GLOBAL RESEARCH
Journal Homepage: www.intellectbase.org/journals │ ©2010 Published by Intellectbase International Consortium, USA

W. Emanuel JAGR - Volume 3, Issue 7 (2010), pp. 12-22
13
transport in the atmosphere, be re-deposited elsewhere, and so on. This process of emission and re-emission is the reason why animals and peoples in remote areas with no local mercury releases, such as in the Arctic, may have elevated mercury levels. Mercury exists as a gas and in a range of organic and inorganic forms that vary in toxicity and persistence in living organisms. In the environment, mercury is transformed through complex biogeochemical interactions that affect environmental and biological forms and concentrations. Some mercury compounds are more easily absorbed by living organisms than elemental mercury itself. When atmospheric mercury falls to earth, it may be altered by bacterial or chemical action into an organic form known as methyl-mercury. Methyl-mercury is much more toxic than the original metal molecules that drifted in the air, and has the ability to migrate through cell membranes and "bio-accumulate" in living tissue. Bioaccumulation is the process by which a substance builds up in a living organism from the surrounding air or water, or through the consumption of contaminated food. Bioaccumulation will vary for different species and will depend on emission sources as well as local factors like water chemistry and temperature. In the following figure, the concept of accumulated methyl-mercury is illustrated by the dots, however the dots are not to scale. (If the concentration of methyl-mercury in lake water is considered to have an absolute value of 1, then approximate bioaccumulation factors for microorganisms like phytoplankton are 105; for macro-organisms like zooplankton and planktivores are 106 ; and for piscivores like fish, birds and humans are 107.
(Source: Environment Canada, 2007 - http://www.ec.gc.ca/mercure-mercury/default.asp?lang=En&n=D721AC1F-1)
The bioaccumulation of methyl-mercury in natural ecosystems is of environmental concern because it inflicts increasing levels of harm on species higher up in the food chain. This occurs through a process known as "bio-magnification", whereby persistent substances like methyl-mercury will increase in

The Environmental Impact of Mercury
14
concentration from microorganisms, to fish, to fish eating predators like otters and loons, and to humans. Elevated methyl-mercury levels may lead to the decline of affected wildlife populations and may affect human health when people consume significant quantities of fish or other contaminated foods. The most infamous case of this impact occurred in Minimata, Japan, where local residents consumed fish with toxic levels of methyl-mercury originating from an industrial sewer discharge, leading to the deaths of more than 1000 people. This type of exposure has now come to be known as Minamata disease (EC, 2009).
MERCURY SOURCES FOUND IN NATURE
Mercury deposits are globally distributed in 26 mercury mineral belts. Three types of mercury deposits occur in these belts: silica-carbonate, hot-spring, and Alma den. Mercury is also produced as a by-product from several types of gold-silver and massive sulfide deposits, which account for 5% of the world's production. Other types of mineral deposits can be enriched in mercury and mercury phases present are dependent on deposit type. During processing of mercury ores, secondary mercury phases form and accumulate in mine wastes. These phases are more soluble than cinnabar, the primary ore mineral, and cause mercury deposits to impact the environment more so than other types of ore deposits enriched in mercury. Release and transport of mercury from mine wastes occur primarily as mercury-enriched particles and colloids. Production from mercury deposits has decreased because of environmental concerns, but by-product production from other mercury-enriched mineral deposits remains important (Rytuba, 2000) Mercury is released into the environment through both natural processes (e.g. volcanic activity, weathering of rocks) and human activities (e.g. mining, fuel use, products and processes). Once released, mercury enters air, water and soil, and moves from one to another until it comes to rest in sediments or landfills. Mercury deposited from the atmosphere at any particular place comes from both local and global sources. Human activity is now the main source of mercury being released into the environment. Much is released unintentionally from processes where mercury is an unwanted impurity. Emissions into the air, mainly from fossil fuel power plants and waste incinerators, are expected to increase unless other energy sources are used or emissions are better controlled. However, mercury mining is decreasing and therefore releases from mining and mercury use may be in decline (UEP, 2002). Weathering and evaporation from mercury-rich rocks and soils lead to natural mercury release, as do forest fires and volcanic activity. Although natural emissions are difficult to determine, current estimates suggest that less than 50% of total mercury releases come from natural sources (UEP, 2002). Since industrialization, the amount of mercury found in the environment has increased by a factor of 2 to 4, largely because of human activities. Mercury has always been emitted from natural sources such as volcanic eruptions, the weathering of soils and rocks and vaporization from the oceans; however, scientists believe that more than half of the mercury in the environment today is from anthropogenic sources. Canadian anthropogenic emissions of mercury to the atmosphere in 2000 are estimated to have been approximately 8 tonnes, while the U.S.A. and global emissions were approximately 120 and 2200 tonnes respectively during 1995. In addition to industrial releases, mercury can be found in thermometers, dental fillings, fluorescent light bulbs, and other consumer products (EC, 2009).

W. Emanuel JAGR - Volume 3, Issue 7 (2010), pp. 12-22
15
HOW DID MERCURY GET INTO THE ENVIRONMENT?
Mercury sold on the world market comes mainly from cinnabar mines in Spain, China, Kyrgyzstan and Algeria. It can also be recycled from industrial processes (UEP, 2002). Mercury in the air may settle into water bodies and affect water quality. This airborne mercury can fall to the ground in raindrops, in dust, or simply due to gravity (known as ―air deposition‖). After the mercury falls, it can end up in streams, lakes, or estuaries, where it can be converted to methyl-mercury through microbial activity (EPA, 2010). Mine drainage from mercury mines in the California Coast Range mercury mineral belt is an environmental concern because of its acidity and high sulfate, mercury, and methyl-mercury concentrations. Two types of mercury deposits are present in the mineral belt, silica-carbonate and hot-spring type. Mine drainage is associated with both deposit types but more commonly with the silica-carbonate type because of the extensive underground workings present at these mines. Mercury ores consisting primarily of cinnabar were processed in rotary furnaces and retorts and elemental mercury recovered from condensing systems. During the roasting process mercury become more soluble than cinnabar are formed and concentrated in the mine tailings, commonly termed calcines. Differences in mineralogy and trace metal geochemistry between the two deposit types are reflected in mine drainage composition. Silica-carbonate type deposits have higher iron sulfide content than hot-spring type deposits and mine drainage from these deposits may have extreme acidity and very high concentrations of iron and sulfate. Mercury and methyl-mercury concentrations in mine drainage are relatively low at the point of discharge from mine workings. The concentration of both mercury species increases significantly in mine drainage that flows through and reacts with calcines. The soluble mercury phases in the calcines are dissolved and sulfate is added such that methylation of mercury by sulfate reducing bacteria is enhanced in calcines that are saturated with mine drainage. Where mercury mine drainage enters and first mixes with stream water, the addition of high concentrations of mercury and sulfate generates a favorable environment for methylation of mercury. Mixing of oxygenated stream water with mine drainage causes oxidation of dissolved iron(II) and precipitation of iron oxyhydroxide that accumulates in the streambed. Both mercury and methyl-mercury are strongly adsorbed onto iron oxyhydroxide over the pH range of 3.2–7.1 in streams impacted by mine drainage. The dissolved fraction of both mercury species is depleted and concentrated in iron oxyhydroxide such that the amount of iron oxyhydroxide in the water column reflects the concentration of mercury species. In streams impacted by mine drainage, mercury and methyl-mercury are transported and adsorbed onto particulate phases. During periods of low stream flow, fine-grained iron hydroxide sediment accumulates in the bed load of the stream and adsorbs mercury and methyl-mercury such that both forms of mercury become highly enriched in the iron oxyhydroxide sediment. During high-flow events, mercury- and methyl-mercury-enriched iron hydroxide sediment is transported into larger aquatic systems producing a high flux of bio-available mercury (Rytuba, 2002).
The Environmental Impact of Heavy Metals
One significant source of emissions of heavy metals to air is waste incineration. Consumer batteries contributes significantly to this problem, as well as to heavy metal leakage to groundwater from landfill deposits. The situation in Sweden is used as an example to describe how the deposition from the atmosphere still is increasing the load of heavy metals, like mercury, cadmium and lead, in top soils and aquatic sediments. Critical factors effect levels for Hg, Cd, Pb, Cu, Zn and As. (Lindqvist, 2002).

The Environmental Impact of Mercury
16
North American pollutant release and transfer registries have been continuously developing with an eye to understanding source/receptor relationships and ensuring that the polluter-paid principle is applied to the appropriate parties. The potential contribution of mercury to the Great Lakes Basin arising from the re-release of historic mercury pollution from contaminated aquatic and terrestrial media is poorly understood and the subject of concern. Although a considerable amount of data may be available on the atmospheric component of mercury releases to the Basin, further inventory work is needed to quantify the re-release of the historic mercury. Much of the related existing inventory information is either not derived from direct measurement or not bounded by a mass-balance accounting. Critical to this determination is an increased confidence in the inventories of mercury from past and current practices. This may be enhanced through comprehensive and thorough surveys of contributions from specific products and their life-cycle assessments. An even greater challenge is to determine the bioavailability of the mercury emanating from land-based sources and from aquatic media. The interplay among the sources and receptors of mercury provides a quantitative assessment of current Canadian contributions of mercury as a contaminant to the Great Lakes (Trip, Luke, Bender, Tonya & Niemi, David, 2003).
HEALTH EFFECTS OF MERCURY
Mercury (Hg) contamination from a variety of point and non-point sources, including atmospheric inputs, is currently considered to be the most serious environmental threat to the well being of fish and wildlife resources in the southeastern United States. Fish consumption advisories have been issued in all ten states comprising the U.S. Fish and Wildlife Service's Southeast Region. Both freshwater and marine species have been affected with levels ranging as high as 7.0 ppm in some individuals. Many other species, including various species of reptiles, birds and mammals (including humans) are also contaminated. Impacts noted range from reproductive impairment to mortality (Netherlands, 1995). The primary pathway of mercury from the environment to humans is through the consumption of fish. The mercury in fish is thought to be >95% organic mercury which is essentially 100% absorbed by humans during consumption. Little mercury is currently being released to the environment in its organic form, but certain environmental conditions promote the conversion of inorganic forms to the more toxic organo-mercurials. In fact, modern studies show that there is little relationship between total mercury in the environment and its accumulation in fish and subsequently in humans. More important is the biogeochemical cycling that results in availability of organic mercury. Conversely, natural and human-induced environmental conditions or modifications can suppress the solubility, availability, and chemical form of mercury. An understanding of these factors is critical to assessing the environmental danger of mercury in discrete areas and in guiding environmental manipulations that can suppress its environmental impacts (Lechler, 2003). Methyl-mercury accumulates in fish at levels that may harm the fish and the other animals that eat them. Mercury deposition in a given area depends on mercury emitted from local, regional, national, and international sources. The amount of methyl-mercury in fish in different water-bodies is a function of a number of factors, including the amount of mercury deposited from the atmosphere, local non-air releases of mercury, naturally occurring mercury in soils, the physical, biological, and chemical properties of different water-bodies and the age, size and types of food the fish eats. This explains why fish from lakes with similar local sources of methyl-mercury can have significantly different methyl-mercury concentrations (EPA, 2010).

W. Emanuel JAGR - Volume 3, Issue 7 (2010), pp. 12-22
17
(Source – EPA, 2010)
Birds and mammals that eat fish are more exposed to methyl-mercury than any other animals in water ecosystems. Similarly, predators that eat fish-eating animals are at risk. Methyl-mercury has been found in eagles, otters, and endangered Florida panthers. Analyses conducted for the Mercury Study Report to Congress suggest that some highly-exposed wildlife species are being harmed by methyl-mercury. Effects of methyl-mercury exposure on wildlife can include mortality (death), reduced fertility, slower growth and development and abnormal behavior that affect survival, depending on the level of exposure. In addition, research indicates that the endocrine system of fish, which plays an important role in fish development and reproduction, may be altered by the levels of methyl-mercury found in the environment (EPA, 2010). In this issue of Alternative Therapies in Health and Medicine, McGinnis, puts forth a theory of autism based on oxidative stress. In the conference it was proposed that mercury might be a key part to understanding autism and the toxin induced. The presentations ranged from an analysis of the global cycle of mercury to the methylation cycles impaired by mercury (Hyman, 2009). Clewell reviewed the epidemiologic studies from the Seychelles and Faroe islands. He presented a continuum of risk model for mercury exposures. Nearly all human exposures to methyl mercury derive from fish. In the Seychelles Islands, there seemed be little effect from mercury on the population; however, the islander‘s fish consumption was predominately from low-risk, small reef fish. Maternal-fetal transmission was analyzed in the Faroe Islands. Elevated levels of mercury in umbilical cord blood correlated with decrements in neurologic studies in 5/17 tests in 917 mother-infant pairs. The mean umbilical cord blood level contained 22.9 micrograms per liter. A major source of their fish consumption was whale blubber, which contains over 3 parts per million of mercury. The health effects from methyl-

The Environmental Impact of Mercury
18
mercury upon infants and children depend on the dose, with severe symptoms presenting with exposure to doses of 100 mcg/kg/day, mild symptoms with greater than 10 mcg/kg/day, and sub-clinical symptoms with less than 1 mcg/kg/day. Symptoms include late development in walking and talking, and decreased performance on neurological tests. Clewell reviewed the limitations of various forms of testing for mercury. Methyl-mercury is found predominately in red blood cells. Inorganic mercury from amalgams is found in plasma but is rapidly cleared. Methyl-mercury is converted to inorganic mercury in the body and is the main form of mercury in the brain (Hyman, 2009). Ratard, reviewed the health effects of mercury upon infants and newborns. Sources of exposure are widespread and include mercury vapors in ambient air, ingestion via drinking water, fish, vaccines, occupational exposures, home exposures including fluorescent light bulbs, thermostats, batteries, red tattoo dye, skin lightening creams, and over-the-counter products such as contact lens fluid and neosynephrine, dental amalgams, and more. Amalgam exposure is estimated to be from 3 to 17 micrograms per day from slow corrosion, chewing, brushing and grinding. The toxicokinetics of mercury were reviewed. Absorption is about 80% for mercury vapor and nearly 100% for oral absorption. It is primarily distributed in the kidneys and brain and readily transferred to the fetus via the placenta. It is eliminated via the urine, feces, expired air, and breast milk. Ratard reported that the major toxicity is from mercury‘s ability to covalently bind to sulfhydryl groups of enzymes in microsomes and mitochondria and other enzyme binding sites including carboxyl, amide, amine, and phosphoryl groups. Clinical manifestations were reviewed, including the historical context of mercury poisoning epidemics such as the Minamata Bay exposures in Japan, acrodynia or pink disease in children from calomel (Hg Cl) used in teething powder, mad hatter syndrome or erethism, and methyl-mercury fungicide grain seed exposures in Iraq and Pakistan. The clinical manifestations are varied and mimic many other conditions. Central Nervous System (CNS) toxicity includes erythrism with symptoms of shyness, emotional ability, nervousness, insomnia, memory impairment, and inability to concentrate. Other CNS symptoms may include encephalopathy, peripheral neuropathy, Parkinsonian symptoms, tremor, ataxia, impaired hearing, tunnel vision, dysarthria, headache, fatigue, impaired sexual function, and depression. Renal toxicity includes proteinuria, renal syndrome, and acute renal failure. Gastrointestinal symptoms include nausea, vomiting, diarrhea, and colitis. Dermal toxicity includes allergic dermatitis, chelitis, gingivitis, stomatitis, and excessive salivation (Hyman, 2009). El Dahr, reported on the increase in autism in the last decade, its correlation with the change in the vaccine schedule and explored in detail the autism-mercury hypothesis. She discussed the immunological parallels with autism and reviewed the epidemiological and toxicological research on thimerosa. In California, rigorous standards for reporting of autism were in place because social benefits were tied to the accurate diagnosis, so the increases are very likely to be real. During the first 25 years, 6,527 cases of autism were reported; but it took only three years during the 1990s to add 6,596 additional cases. From 1987 to 1998 there was a 273% increase in autism cases in California. The Centers for Disease Control and Prevention (CDC) and American Academy of Autism released an ―Autism Alarm‖ stating that one in 166 children in the U.S. have autistic spectrum disorder (ASD). Currently, one-sixth of all children under the age of 18 have a developmental disability. That is nearly 20% of the population who may not be able to be productive members of society. Much of the data she presented is available on www.safeminds.org. The mercury-autism hypothesis was proposed in part due to the analysis of the actual doses of thimerosal received by children after the change in the vaccination schedule. In individuals with a genetic susceptibility, such as a defect in the enzymes responsible for detoxifying heavy metals, prenatal and early postnatal exposure to mercury leads to neurologic damage resulting in autistic symptoms. Acrodynia or pink baby syndrome from exposure to

W. Emanuel JAGR - Volume 3, Issue 7 (2010), pp. 12-22
19
calomel or mercury in teething powder presented similarly to autism. Other potential sources of early exposure in the fetus or infant include maternal amalgams, fish consumption, eardrops, and nasal drops. Vaccines present a significant source of exposure in RhoGam, influenza vaccines during pregnancy, and childhood immunizations. The maximum exposure in the first six months of life is 187.5 micrograms of mercury, far exceeding limits set by the World Health Organization (WHO) and the Environmental Protection Agency (EPA). These limits are set for methyl-mercury primarily from fish, not for ethyl-mercury from vaccines (Hyman, 2009). Questions remain about the relative toxicity of each. According to the EPA, the ―safe‖ daily level of mercury exposure for a 5 kg, 2-month-old infant is 0.5 micrograms or 0.1 micrograms per kg. The typical 2-month vaccination schedule includes diphtheria and tetanus (DtaP), Haemophilus influenza type B (Hib), and hepatitis B vaccines. Combined, these vaccines contain 62.5 micrograms of mercury or 125 times the EPA limits for a single-day exposure. It should be remembered that, like lead, there may be no safe level and children are more susceptible to toxic effects than adults. Dahr advises us that there may be large variations in genetic susceptibility to exposures. She also argues that there is a strong biologic plausibility to the mercury-autism hypothesis. Symptoms of mercury toxicity parallel autism. Beside the neurotoxic effects, there appears to be correlation between the immunopathology of both autism and mercury toxicity. She defines immunopathology to include immune deficiency and dysfunction with defective or ineffective responses, hypersensitivity with an overactive response out of proportion to potential damage and autoimmunity or inappropriate reaction to self. These specific immune abnormalities have been found in 30%-70% of autistic children. She also reviewed the problematic Institute of Medicine recommendations and analysis of the thimerosal issue (Hyman, 2009). Cave has treated over 2,300 children with autistic spectrum disorder. In her recent book, What Your Doctor May Not Tell You About Children‘s Vaccinations, outlines the data and debate in this highly charged field. Cave also reported on the increased incidence of autism in the last 30 years from 1/10,000 children to 1/150 children and 1/30 males in the United States (Hyman, 2009). Nash reviewed mercury-associated diseases, mechanisms, controversies, and therapeutic options. Major sources of mercury exposure include dental amalgams (vapor), fish (methyl-mercury), and vaccines (ethylmercury). Toxic effects, he suggests, spread across a broad spectrum of diseases including autism, Alzheimer‘s disease, ALS, multiple sclerosis, Parkinson‘s disease, neurodevelopmental diseases, nephrotoxicity, and cancer. Reporting on the review in the New England Journal of Medicine, he reports that the fetal brain is more susceptible than the adult brain to mercury-induced damage including the division and migration of neuronal cells and disruption of the cytoarchitecture of the developing brain. The mechanism of mercury toxicity in the adult brain may be related to proteins involved in mercury excretion including glutathione, glutathione transferase, metallothionine, and Apo E. Glutathione carries Hg through biliary transport for excretion. Hg2+ rapidly oxidizes glutathione. Glutathione transferase is an enzyme that may be implicated in Alzheimer‘s disease (Hyman, 2009). However, most interesting were recent findings that Apo E 4 may increase risk for Alzheimer‘s disease because it has an impaired ability to bind mercury and transport it from the brain. Apo E 4 has no binding sites for mercury because it contains arginine at both positions 112 and 158 of the lipoprotein. Apo E 2 has cysteine at both those sites enabling it to bind and transport mercury from the brain. Nash suggests that most if not all aberrant biochemistry in the Alzheimer‘s brain can be mimicked by mercury. The diagnostic hallmarks of the Alzheimer‘s brain can be produced by Hg concentrations

The Environmental Impact of Mercury
20
lower than reported in human brain tissues. He further concludes that the biological plausibility of Hg as a causal factor in Alzheimer‘s disease is more complete than thimerosal causation of autism (Hyman, 2009). Regarding amalgam fillings, Dr. Nash concludes that due to the enhancement of mercury toxicity and retention by factors found in the diet, antibiotics, other toxicants such as cadmium and lead, and genetic susceptibilities, no level of mercury exposure from amalgams can be considered without risk. He also reviewed the literature linking mercury and cardiovascular disease. Two studies have reported increased risk of myocardial infarction while another has showed no risk. However, the data presented on idiopathic cardiomyopathy was among the most compelling. Biopsy samples found 12,000 times the level of antimony and 22,000 times the level of mercury in idiopathic cardiomyopathy compared to controls with viral, ischemic or hypertensive cardiomyopathy. Mechanisms of toxicity include damage to DNA, RNA, mitochondria, enzymes, immunopathology and autoimmunity, and generation of oxidative stress. Mercury can act as a metabolic uncoupler, hapten or immune sensitizing small molecule, enzyme inhibitor. It also depletes glutathione and ascorbate, and inhibits thiamine (B1) and pyridoxine (B6). Mercury can also affect the CNS by concentrating in the CSF and the kidney by reducing concentrating capacity. It can also inhibit GTP binding affecting brain tubulin microtubules reducing nerve function and communication, which can lead to the development of neurofibrillary tangles. Mercury also inhibits nerve growth, and passes easily through the placental barrier. Dopamineric activity in the brain is reduced with mercury. Dr. Nash concluded on an optimistic note. First he suggests that there appears to be a subset of the population that cannot effectively excrete mercury and is at greater risk than the general population, and that this susceptibility is likely due to genetic differences, diet, exposure to other toxicants, antibiotics, etc. Given that susceptibility, he argues that mercury is a risk factor in many diseases, but can be safely measured, and the body detoxified, mitigating some of its toxic effects. He calls for more research and improved detoxification agents (Hyman, 2009).
METHODS OF REMEDIATION FROM THE ENVIRONMENT
The challenge for governments is to ensure that the levels of mercury in the environment do not exceed the concentrations which we would expect from natural processes. As the dangers of mercury and its compounds become more apparent, governments are working with concerned citizens, industries and environmental organizations to examine a range of mercury management tools. In Canada, mercury is managed by federal legislation and guidelines, various programs and research groups, and through participation in international initiatives. Provincial and territorial governments have also established tools for reducing the impact of mercury pollution. Several Canada-wide standards have been endorsed by Environment Ministers from provinces, territories, and the federal government to ensure that efforts are consistent across the country. Educational programs are being created to answer the question, "what can I do?" in order to inform people of appropriate reduction measures that can be used in the home, cars, schools and the workplace. In addition to providing information on the topics outlined above, this website provides a selection of resources for visitors, including an extensive list of links, fish consumption advisories, steps for cleaning up small mercury spills, information about mercury disposal, and a glossary of terms related to mercury (UEP, 2002). The reduction of mercury (Hg) releases to the environment, particularly airborne mercury emissions, is currently a major focus of both US state and federal regulatory agencies. While mercury emissions from

W. Emanuel JAGR - Volume 3, Issue 7 (2010), pp. 12-22
21
hazardous waste incinerators and fossil-fuel power plants have been and continue to be regulated under the Resource Conservation and Recovery Act (RCRA) and the Clean Air Act (CAA), non-hazardous waste cement kilns are currently excluded from regularly controls. However, the US Environmental Protection Agency (EPA) continues to assess the need for possible mercury emission controls nationwide, under the CAA, and for specific facilities, through the Total Maximum Daily Load (TMDL) Program of the Clean Water Act. The EPA's major concern appears to be the potential impacts the bioaccumulation of mercury in fish and other aquatic organisms may have on humans and wildlife that consume them. This paper uses fate and transport modeling to evaluate whether mercury emissions from cement kilns could pose unacceptable risks to fish-consuming populations in the area of a source because of high levels of methyl mercury that could accumulate in fish. Emphasis is placed on assessing the effects that parameter variability and the lack of the parameter specificity for environmental conditions have on risk assessment results. The key parameters that are evaluated include emission rates, mercury speciation, methylation rates, and watershed and water body configurations. The results of this assessment indicate that mercury emissions from cement kilns pose much less of a risk to fish consumers than mercury emissions from other types of combustion sources; however, there is substantial uncertainty in the risk estimates. These uncertainties in the EPA model for mercury emissions indicate that this model is only refined enough currently to screen risks from combustion facilities (to identify facilities that pose no significant risk of mercury exposure), but is insufficient to characterize risks for populations at any specific site. Finally, prior to any attempt at regulating Portland cement kiln mercury emissions, the EPA should refine and validate its models based on mercury emission and fish concentration data for actual sites (Richter & Sheehan, 2005).
CONCLUSION
In light of understanding the health effects caused by Mercury on humans, animals, fish and the eco-system; one can easily realize that the effects of mercury are far beyond what most people think. All or most of these issues can be minimized and avoided if engineers and scientists could implement a sustainable system that is in harmony with our eco-system.
REFERENCES
EC (2009). Environment Canada. Mercury and the Environment. Retrieved September 2, 2009: http://www.ec.gc.ca/mercury/en/bf.cfm
(EPA, 2010). Fate and Transport and Ecological Effects of Mercury. Retrieved September 22, 2009. http://www.epa.gov/mercury/eco.htm
Hyman, Mark H, MD, (2009). Retrieved September 22, 2009. http://www.drhyman.com/pdf/hyman_at.pdf
Lechler, Paul J., (2003). Retrieved September 2, 2009 Crucial Factors in the Environmental Impacts of Mercury. http://gsa.confex.com/gsa/2003NC/finalprogram/abstract_48965.htm
Lindqvist, Oliver. (2002). Environmental impact of mercury and other heavy metals. Retrieved September 22, 2009. http://www.sciencedirect.com/science?_ob=ArticleURL&_udi=B6TH1-3YYTHMW-1&_user=10&_rdoc=1&_fmt=&_orig=search&_sort=d&_docanchor=&view=c&_search StrId=1019326453&_rerunOrigin=scholar.google&_acct=C000050221&_version=1&_urlVersion=0&_userid=10&md5=ccc01af454dc71d6f73a68767d9f6a23
Netherlands, Springer (1995). Assessing Impacts of mercury contamination in the southeastern United States. Retrieved September 22, 2009. http://www.springerlink.com/content/r01621391jp35460/
The Environmental Impact of Mercury
22
Richter, R.O. Sheehan, P.J. (2005). IEEE Xplore. Potential environmental impact of mercury emissions from Portland cement kilns. Retrieved September 2, 2009. http://ieeexplore.ieee.org/xpl/freeabs_all.jsp?arnumber=1516358
Rytuba James J. (2000) Mercury from mineral deposits and potential environmental impact. Retrieved September 2, 2009: http://cat.inist.fr/?aModele=afficheN&cpsidt=14596030
Rytuba, James J. (2002) Science direct. Mercury mine drainage and processes that control its environmental impact. Retrieved September 22, 2009. http://www.sciencedirect.com/science?_ob= ArticleURL&_udi=B6V78-417F9X3-6&_user=10&_rdoc=1&_fmt=&_orig=search&_sort=d&_doca nchor=&view=c&_searchStrId=1019307358&_rerunOrigin=scholar.google&_acct=C000050221&_version=1&_urlVersion=0&_userid=10&md5=c4fa7d5c276d8b65e59e2271cc030002
Trip, Luke, Bender, Tonya and Niemi, David (2003). Assessing Canadian inventories to understand the environmental impacts of mercury releases to the Great Lakes region. Retrieved September 22, 2009. http://www.sciencedirect.com/science?_ob=ArticleURL&_udi=B6WDS-4BHJVSC-1&_user=10&_rdoc=1&_fmt=&_orig=search&_sort=d&_docanchor=&view=c&_searchStrId=1019328533&_rerunOrigin=scholar.google&_acct=C000050221&_version=1&_urlVersion=0&_userid=10&md5=1c823358840de2035369344ec58098df
(UEP, 2002) United Nations Environment Programme. Scientific Facts on Mercury. Retrieved September 2, 2009: http://www.greenfacts.org/en/mercury/mercury-1.htm#3

E. W. Ebomoyi JAGR - Volume 3, Issue 7 (2010), pp. 23-39
23
IMPACT OF GLOBALIZATION ON HIV/AIDS PANDEMICS AND THE CHALLENGES OF COMPULSORY LICENSING AND PARALLEL IMPORTATION
E. William Ebomoyi
Chicago State University, USA
ABSTRACT
This project focuses on the impact of globalization on HIV pandemics specifically, in the developing and the least-developed nations. The legal ramifications of compulsory licensing and parallel importation are critically examined. The salient benefits and limitations of the World Trade Organizations’ stipulations are critically explored and the advantages for developing nations to invest their resources in research and pharmaceutical industries and the efficient management of their bio-processing are delineated. Keywords: Globalization, HIV/AIDS, Pandemics, UNAIDS Efforts, Parallel Importation, Compulsory
Licensing and Bio-Processing, HIV/AIDS Drugs Manufacturing Companies.
INTRODUCTION
The concept of globalization is not new, even in the 18th Century; economic globalization existed in the process of international trade and other social and political interactions among nations. However, in the 21st Century, economic globalization has assumed different dimensions which demand the technological and educational preparedness of individuals within each nation to compete and participate in this global economic market. To a large measure, globalization has become the outcome of human innovation and technological progress. It also refers to the integration of economies internationally, specifically through trade and financial flow1. The movements of business entrepreneurs, intellectually astute and academically qualified itinerants who migrate across international borders have been most opportune to reap the benefits of globalization. Globalization has created an international economic force with such a momentum that no one nation can impede. On the one hand, in the developed nations, the exiting strong academic base, state-of- the -art technological infrastructure, and the broad spectrum of venture capitalists, innovators and start-up companies serve as buffers to absorb the impact of globalization. On the other hand, in the developing nations of East Asia which was regarded as one of the most impoverished areas of the world some 40 years ago, the GDP has risen tremendously and the living standards have risen to an impressive level2. But those of African nations, south of the Sahara, which adopted inward socio-economic policies, have stagnated. Massive corruption by military and civilian politicians have exacerbated poverty and high inflation rates, youth unemployment, restive population, increased urban violence and the practice of survival sexual intercourse, prostitution and child pornography which enable impoverished females to elk their living. As a result of the on-going global economic slump and the existing mind-numbing abject
Full Article Available Online at: Intellectbase and EBSCOhost │ JAGR is indexed with Cabell‘s, JournalSeek, etc.
JOURNAL OF APPLIED GLOBAL RESEARCH
Journal Homepage: www.intellectbase.org/journals │ ©2010 Published by Intellectbase International Consortium, USA

Impact of Globalization on HIV/AIDS Pandemics and the Challenges of Compulsory Licensing and Parallel Importation
24
poverty in many of the developing and least-developed nations, the study reported here was designed to meticulously:
Assess Impact of globalization on HIV/AIDS pandemics in developing nations;
Assess the impact of HIV/AIDS in the regions of the world with the worst socio-economic indicators and educational resources to combat the deadly virus;
Assess the origin of the World Trade Organization and the philosophical underpinning of compulsory licensing and parallel importation; and
Accentuate the need for developing nations to invest in medical, pharmaceutical and educational research to combat HIV/AIDS in their nations.
CHARACTERISTICS OF GLOBALIZATION
Globalization is not just a historical process, but the result of human innovation, technological progress and the application of scientific knowledge to combat socio-economic hardships and the outbreak of emerging diseases in the society. Therefore, globalization connotes broader cultural, economic political and human innovative response to ecological challenges in the society. The historical trajectory of globalization is not the focus of this project, but our emphasis is how deeply integrated are the developing nations in international trade, capital flow, movement of people and the diffusion of knowledge to combat the upsurge of diseases particularly the lethal HIV/AIDS pandemic. Based on the United Nations Human Development Indicator (UNHDI), which takes life expectancy and educational level into account, the income level in the technologically developed nations outstrips those of the developing areas3,4. Although life expectancy may have increased, in many developing nations, the quality of life in many of developing and under-developed nations has not improved. With the outbreak of HIV/AIDS pandemics and the existing object poverty in developing nations without adequate medical, pharmaceutical resources to combat the virus, life expectancy continue to diminish. The spread of HIV/AIDS in Africa has eroded the appreciable gain made the life-expectancy about 30 years ago3,4. Because globalization has not improved the socio-economic status of the preponderance of people in developing nations, living with HIV/AIDS continues to exacerbate economic burden and decimate the lives of those within the cohort of economic productive workforce. The endemic corruption perpetrated by military leaders and politicians have ruined macroeconomic stance to create efficient conditions for investment and the development of well thought out policies to promote efficiency through trade and investment. Strong institutions and effective government are necessary to facilitate pristine governance, education training and visionary development to promote productivity and financial management to ensure adequate resources for sustainable development.
IMPACT OF GLOBALIZATION ON HIV/AIDS PANDEMICS
In nations where state-of-the science technologies had been developed with stable academic institutions, the forces of globalization were deeply integrated. Financial markets were enhanced by modern electronic communication. This phenomenon led to unparallel economic growth in the 20th century. The global per capital GDP increased almost five-fold whereas the less developed nations continue to seek for financial assistance, which they received, without plying such resources to develop academic institutions, fund meaningful research. Today, the global challenge is the glaring contrast and technological disparities. There is glittering wealth in many of the developed nations whereas in the underdeveloped nations particularly in Sub-Sahara Africa and Asia there is mind-numbing abject

E. W. Ebomoyi JAGR - Volume 3, Issue 7 (2010), pp. 23-39
25
poverty. Chanda5 has observed that 3 billion people –about half of world population live on less than two dollars a day. The situation in Sub Saharan Africa and South Asia is quite grave. To say the least, incessant poverty, unemployment, corruption by elected officials in Sub-Sahara African nations has exacerbated inter-ethnic violence, religious and multiple inhumane killing of innocent traders who just make their living. A chaotic and violence-prone society does not society does not create conducive environment for research and technological growth of any nation. It is therefore axiomatic that the culture of poverty breeds ignorance, HIV-rated diseases due to prostitution and survival sexual activities and low literacy rate (Table 1).
Table 1: Selected Socio-Economic Indicators among selected developed and developing nations
Nations GDP Per Capita
GDP IMR/1000
Live Births
Life expectancy Literacy Rate %
HIV Rate % Male Female
U.S. $14.3 tril $46,900 6.3/1000 75.3 81.1 99.0 0.6
Denmark $203.6 bil $37,100 4.2/1000 75.8 80.6 99.0 0.2
Japan $4.3 tril $34,000 2.8/1000 78.7 85.6 99.0 NA
UK $2.2 tril $36,000 4.9/1000 76.4 81.5 99.0 0.2
Switzerland $316.7 bil $41,800 4.2/1000 77.9 83.7 99.0 0.6
China $8 tril $6,000 21.2/1000 71.4 75.2 93.3 0.1
India $3.3 tril $2,900 32.3/1000 66.9 71.9 66.0 0.3
Brazil $2 tril $10,200 23/1000 68.2 75.5 90.5 0.6
Nigeria $335.4b $2,300 95/1000 45.8 47.3 72.0 3.1
Uganda $39.4b $1,300 66/1000 51.3 53.4 73.6 5.4
Zaire $17.5b $1,500 101/1000 38.5 38.7 68 15.2
Kenya $61.5b $1,600 56/1000 56.4 56.9 73.6 NA
Tanzania $54.3b $1,300 70/1000 50.1 52.9 72.3 6.2
Lesotho $3.3b $1,500 78.6/1000 41 39.3 82.2 23.2
Malawi $111.8b $800 90.5/1000 43.7 43.1 71.8 11.9
Ethiopia $68.8b $800 82.6/1000 52.5 57.5 35.9 2.1
Eritrea $3.9b $700 44.3/1000 59.4 63.5 44.3 1.3
Swaziland $5.7b $5,100 69.6/1000 31.7 32.3 79.6 26.1
S. Africa $491b $10,100 45.1/1000 49.6 48.1 88.0 18.1
Source: Janssen, 8 (2010) The World Almanac and book of facts, New York, NY World Almanac Book PP 766-768, 789-790, 796, 823, 847-848.

Impact of Globalization on HIV/AIDS Pandemics and the Challenges of Compulsory Licensing and Parallel Importation
26
INADEQUATE ACCESS TO INTERNET AND OTHER COMMUNICATIONS NETWORKS
From the authorization by the U.S. Department of Defense in 1969, the internet became available for public use. Internet communication network is an intricate global web of hundreds of thousands of computers. These networks were linked by conventional telephone lines and modem. By 1980‘s the U.S. National Science Foundation (NSF) created equipment which facilitated use of other computer networks to connect to government larger network system. This breakthrough created a wealth of information to anyone with a computer, modem and a basic monthly fee. In 1993, over three million people worldwide were connected to the internet. By 2007, internet users approach 1.2 billion. In 2010, internet users globally have increased by leaps and bounds. Currently, internet and the web have systematically transformed academic, commercial and other routine mundane users. In 2008, the frequency of internet users in the world is summarized in table 2. The frequency of Asians using the internet is highest users.
Table 2: Ranking of Nations with the Most Personal Computers in Use, 2008
Rank PC in Use (in Millions) Total in % Worldwide
1. U.S. 264.10 22.19
2. China 98.67 8.29
3. Japan 86.22 7.24
4. Germany 61.96 5.21
5. UK 47.04 3.95
6. France 43.11 3.62
7. Russia 36.42 3.06
8. Italy 35.69 3.00
9. South Korea 34.87 2.93
10. Brazil 33.30 2.80
11. India 32.03 2.69
12. Canada 27.63 2.32
13. Mexico 19.13 1.61
14. Australia 17.01 1.43
15. Spain 16.71 1.40
Top 15 countries 853.90 71.70
World total 1,190.10 100.00
Professor M.G.K. Menon6 of United Nations has intuitively noticed; as we enter the next millennium a quarter of nations worldwide does not have tele-density.

E. W. Ebomoyi JAGR - Volume 3, Issue 7 (2010), pp. 23-39
27
The Middle East, Oceania/Australia and Africa had relatively fewer users. However, regarding a rank order of fifteen top users of the internet, United States, China, India and other European nations were highly ranked. African nations in the Sub-Sahara areas were not among the top fifteen. In mid 1998, the developed nations which make up only 15 percent of the world‘s population had 85% of internet users. North America alone had more than 450% of internet users. By contrast, South Asia, which has over 20% of the world population, had less than 1% internet users. The report from Africa is even more deplorable6. Without access to the internet, scientific and other academic knowledge can be severely impeded. Access to the internet is most crucial in honing one‘s skills about innovative technology, to control HIV/AIDS and the applications to primary prevention of diseases, health promotion activities and the epidemiology of new and emerging diseases. Globalization made access to the internet a worldwide learning tool. Regions of the world with resources to build computers through copy engineering have been able to use the technology to create employments for their youth and educate the masses about ways to prevent, treat HIV/AIDS and cure other diseases so as to improve their DI and their life expectancies. Unfortunately, in SSA nations, the impact of this innovative technology has had very little impact in the living conditions of the masses.
GLOBAL HIV/AIDS STATISTICS
The regional HIV/AIDS statistics is summarized in Table 3. Based on UN/AIDS data, it is estimated that there were 33.4 million people living with HIV/AIDS worldwide at the end of 20087. Approximately 2.7 million patients were newly infected with HIV in 2008 and UNAIDS epidemiologist reported the death of 2 million people in 2008. The regions of the world where HIV/AIDS has its greatest toll on human lives are areas where the medical and pharmaceutical infrastructures are weak and underdeveloped. In these developing nations, less than 5% of the people living with the virus can afford drugs. At the emergence of HIV/AIDS in 1981, homosexual males were detected to be predominant patients. As surveillance data became available, intravenous (IV) drug users, recipient of blood or blood products (e.g.) hemophiliacs) infants born to sero-positive mothers, and prostitute formed discrete groups of individuals at high risk of being infected with HIV-17. Currently, Sub-Saharan Africa (SSA) is the region most affected and it serves as the geographic epicenter with over 67% of all individuals living with HIV worldwide. Pediatric AIDS case in the region is 91% of all new infections in SSA, the disease has orphaned more than 14 million children. The frequency of HIV positive expectant mothers who receive treatment to prevent material-child transmission increased from 33% in 2007 to 45% in 2008. With the recently announced global pullback from AIDS funding by the developed nations, a death sentence for people in developing nations7,8.
UNAIDS has warned that less than 40% of young school-age people have basic information about HIV and fewer than 40% of the people living with the virus know their status. The number of new HIV infections continues to outstrip the number on HIV/AIDS treatment. Among every 5 people starting treatment, a further five become infected with HIV8.
AIDS OPPORTUNISTIC INFECTIONS
The key feature of AIDS, involves a weakened immune system which enables a broad spectrum of deadly infections to create diseases in the affected patients. A large number of patients encounter signs

Impact of Globalization on HIV/AIDS Pandemics and the Challenges of Compulsory Licensing and Parallel Importation
28
and symptoms that invade various parts of the body. According to the Federal Centers for Disease Control and Prevention (CDC), AIDS is the summative stage of HIV infections. The main cause of death in AIDS adult patients is Pneumocystis Carinii Pneumonia (PCP). The most common fungal infections in AIDS patients are candidiasis and Cryptococcosis. The latter is central nervous system infections. Most patients also suffer from Mycobacterium tuberculae Avium complex. In adult HIV-infected patients, most of them suffer from unexplained weight loss, chronic diarrhea, prolong fever, generalized purities, dermatitis, oropharyngeal candidiasis, recurrent herpes simplex infections, generalized kaposi‘s sarcoma or cryptococcal meningitis. In Pediatric AIDS cases, the major killer of infants is lymphocytic interstitial pneumonia (LIP). The major health problems are severe weight loss, chronic diarrhea, prolong fever, generalized lymphadenopathy, orophanygeal candidiasis, persistent cough and generalized dermatitis.
HIV/AIDS THERAPIES
Existing drugs for the management of HIV/AIDS were developed principally by the major pharmaceutical companies in Europe and United States. These drugs which are very expensive include the nucleoside analogs which are: dideoxyinosine (AZT), cobivir (AZT plus3TC) by Glaxo welcome, lamivudine (3TC), zalcitabine (ddC) by Roche, retrovir / zidovudine (ZDV or AZT) by Glazo, Trizivir (AZT plus), 3tcplus abacavir videx (didanosine or ddi), zerit stavudine (d4T), ziagen (abacavir) by Glaxo9.
The non-nucleoside anti-retroviral adjuncts include: rescriptor (delavidine) or DLV, developed by Agouron, sustiva etavirenz by Dupont, viramune (nevirapine) or NVP, hydrea (hydroxyurea) or HU. The exclusive protease inhibitors consist of the following: Agenerase (amprenavir) by Glaxo, crixivan (indinavir or IDV) by Merck, fortovase (saquinavir) soft gel capsule and invirase, kaletra (lopinavir/ritonavir) by Roche, norvir (ritonavir) or RTV and kaletra lopinavir/ritonavir by Abbott pharmaceutical company. The pharmaceutical companies listed above are the principal developers of HIV/AIDS medications worldwide. They invest colossal sum of money to initiate, research and produce these drugs which are used for medical treatment of HIV positive patients and those with full-blown AIDS and the incipient AIDS opportunistic infections which are life-threatening infections9.

E. W. Ebomoyi JAGR - Volume 3, Issue 7 (2010), pp. 23-39
29
Table 3: Regional statistics on HIV/AIDS Pandemic
People living with HIV New HIV infections 2008
AIDS-related deaths 2008
Adult HIV prevalence (%)
Sub-Saharan Africa 22.4 million
[20.8- 24.1 million]
1.9 million
[1.6-2.2 million]
1.4 million
[1.1-1.7 million]
5.2%
[4.9%-5.4%]
South and South-East Asia
3.8 million
[3.4-4.3 million]
280 000
[240 000-320 000]
270 000
[220 000-310 000]
0.3%
[0.2%-0.3%]
East Asia 850 000
[700 000-1.0 million]
75 000
[58 000-88 000]
59 000
[46 000-71 000]
<0.1%
[<0.1%]
Latin America 2.0 million
[1.8-2.2 million]
170 000
[150 000-200 000]
77 000
[66 000-89 000]
0.6%
[0.5%-0.6%]
North America 1.4 million
[1.2-1.6 million]
55 000
[36 000-61 000]
25 000
[20 000-31 000]
0.4%
[0.3%-0.5%]
Western and Central Europe
850 000
[710 000-970 000]
30 000
[230 00-35 000]
13 000
[10 000-15 000]
0.3%
[0.2%-0.3%]
Eastern Europe and Central Asia
1.5 million
[1.4-1.7 million]
110 000
[100 000-130 000]
87 000
[72 000-110 000]
0.7%
[0.6%-0.8%]
Caribbean 240 000
[220 000-260 000]
20 000
[16 000-24 000]
12 000
[9300-14 000]
1.0%
[0.9%-1.1%]
Middle East and North Africa
310 000
[250 000-380 000]
35 000
[24 000-46 000]
20 000
[15 000-25 000]
0.2%
[<0.2%-0.3%]
Oceania 59 000
[51 000-68 000]
3900
[2900-5100]
2000
[1100-3100]
0.3%
[<0.3%-0.4%]
Total 33.4 million
[31.1-35.8 million]
2.7 million
[2.4-3.0 million]
2 million
[1.7-2.4 million]
0.8%
[<0.8%-0.8%]
Source: UNAIDS AIDS epidemic update December 2009

Impact of Globalization on HIV/AIDS Pandemics and the Challenges of Compulsory Licensing and Parallel Importation
30
Table 4: Antiretroviral therapy (ART) coverage, 2008
Geographical region People receiving ART, Dec. 2008
People needing ART, 2008
ART coverage, Dec 2008
People receiving ART, Dec. 2007
People needing ART, 2007
ART coverage, Dec. 2007
Sub-Saharan Africa 2.9 million 6.7 million 44% 2.1 million 6.4 million 33%
Latin America and the Caribbean
445 000 820 000 54% 390 000 770 000 50%
East, South and South-East Asia
565 000 1.5 million 37% 420 000 1.5 million 29%
Europe, Central Asia
85 000 370 000 23% 54 000 340 000 16%
Middle East, North Africa
10 000 68 000 14% 7000 63 000 11%
Total 4 million 9.5 million 42% 2.97 million 9 million 33%
Source: Towards universal access: scaling up priority HIV/AIDS interventions in the health sector: progress report 2009, WHO/UNAIDS/UNICEF, September 2009
Summarized in Table 5 are the four major stages of HIV infections in human patients.

E. W. Ebomoyi JAGR - Volume 3, Issue 7 (2010), pp. 23-39
31
Table 5: Four Major Stages of HIV Infections in human patients
Clinical Stage I:
Asymptomatic Persistent generalized lymphadenopathy
Clinical Stage II:
Moderate unexplained* weight loss (under 10%
of presumed or measured body weight)**
Recurrent respiratory tract infections (sinusitis,
tonsillitis, otitis media, pharyngitis)
Herpes zoster
Angular chelitis
Recurrent oral ulceration
Papular pruritic eruptions
Seborrhoeic dermatitis
Fungal nail infections
Clinical Stage III:
Unexplained* severe weight loss (over 10% of
presumed or measured body weight)**
Unexplained* chronic diarrhoea for longer than
one month
Unexplained* persistent fever (intermittent or
constant for longer than one month)
Persistent oral candidiasis
Oral hairy leukoplakia
Pulmonary tuberculosis
Severe bacterial infections (e.g. pnuemonia,
empyema, pyomyositis, bone or joint infection,
meningitis, bacteraemia)
Acute necrotizing ulcerative stomatitis, gingivitis
or periodontitis.
Unexplained* anemia (below 8g/dl), neutropenia
(below 0.5 billion/l) and/or chronic
thrombocytopenia (below 50 billion/l).
Clinical Stage IV: ***
HIV wasting syndrome
Pneumocystis pneumonia
Recurrent severe bacterial pneumonia
Chronic herpes simplex infection (orolabial,
genital or anorectal of more than one month‘s
duration or visceral at any site).
Oesophageal candidiasis (or candidiasis of
trachea, bronchi or lungs)
Extrapulmonary tuberculosis
Kaposi sarcoma
Cytomegalovirus infection (retinitis or infection
of other organs)
Central nervous system toxoplasmosis
HIV encephalopathy
Extrapulmonary cryptococcosis including meningitis
Disseminated non-tuberculous mycobacteria
infection
Progressive multifocal leukoencephalopathy
Chronic cryptosporidiosis
Disseminated mycosis (extrapulmonary
histoplasmaosis, coccidiomycosis)
Recurrent septicaemia (including non-typhoidal
Salmonella)
Lymphoma (cerebral or B cell non-Hodgkin)
Invasive cervical carcinoma
A typical disseminated leichmaniasis
Symptomatic HIV-associated nephropathy or
HIV-associated cardiomyopathy.
* Unexplained refers to where the condition is not explained by other conditions. ** Assessment of the body weight among pregnant woman needs to consider the expected weight gain of pregnancy. *** Some additional specific conditions can also be included in regional classifications (such as the reactivation of American
trypanosamiasis [meningoencphalitis and/or myocarditis] in the WHO Region of the Americas and penicilliosis in Asia)
10,11.
The major drugs applied in the management of HIV/AIDS are antiviral. The current principal drugs approved by the United States Food and drug administration are listed in Table 6.

Impact of Globalization on HIV/AIDS Pandemics and the Challenges of Compulsory Licensing and Parallel Importation
32
Table 6: List of Drugs for the Management of HIV/AIDS developed in the industrialized Nations12,13,14
Brand Name Common Name
Manufacturing/ Pharmaceutical Company
Clamivudine/zidovudine or 3TC/AZT Combivir GlaxoSmithKline
Lamivudine or 3TC Epivir GlaxoSmithKline
Zidovudine, AZT or ZDC Retrovir GlaxoSmithKline
Tenofovir Df/emtricitabine or TDC/FTC Truvada Gilead Sciences
Tenofovir disopril Fumarate or TDF Viread Gilead Sciences
Abacavir sulfate or ABC ziagen GlaxoSmithKline
Etravirine, or ETV intelence Tibotec/Dupont
Efavirence, or EFV sustiva Bristol_Myers Squibb
Tipranavir or TPV Aptivus Boenhring ingelheim
Saquinnavir, or SQV Invirase Roche
Fos-amprinavir calcium or FPV Lexiva GlaxoSmithKline
Darunavir or Drv Presista Tibotec Pharmaceutical LTD
Nelfinavir or NFV Viracept Originally, Roche
Enfuvirtide, T-20 or ENF Fuzeon Genentech/Roche
Emtricitabine or PTC Emtriva Gilead Sciences
Abacavir/lamivudine/Zidovudine or ABC/3TC Epzicom GlaxoSmithKline
Didanosine or ddi Videx EC GlaxoSmithKline
Stavudine or d4T Zerit Bristol-Myer Squibb & Gilead Sciences
Efavirenz/tenofavir/DF/emtricitabine or EFV/TDF/FTC
Atripla Bristol-Myers Squibb& Gilead Sciences
Delavirdine or DLV Rescriptor Agouron
Nevirrapine or NVP Viramune Boehringer Ingelheim
Indinavir or IDV Crixivan Merck & Co
Lopinovir/ritonavir or LPV kaletra Abbott
Ritonavir or RTV and Kaletra lopinavir/ritonavir Norvir Abbott
Ataltegravir sulfate or ATV Reyataz Bristol-Myers Squibb & Gilead
Raltegravir, oral Isentress Merck & Co
Maraviroc or MVC Selezntry Pfizer
HIV/AIDS DRUG DEVELOPMENT PROCESS
The technologies for developing drugs for the treatment of HIV/AIDS are not only expensive but also the process of drug manufacturing laborious and time-consuming. There are six major classifications of HIV drugs described as antiretroviral. The specific classifications are based on the stage of HIV life cycle that they target. They include the CCR5 antagonists, (that is the entry inhibitors) and the integrase inhibitors. The (NNRTI) therapeutic process involves the nucleoside and non-nucleoside reverse transcriptase inhibitors. The NNRTI prevents viral RNA from converting to viral DNA which regularly infects healthy human cells. The NNRTIs are powerful medications with minimal long-term side effects.

E. W. Ebomoyi JAGR - Volume 3, Issue 7 (2010), pp. 23-39
33
The non-nucleoside inhibitors reverse transcriptase inhibitors (nRTI) bind to the transcriptase enzyme and interrupts with its functions of converting HIV RNA into DNA. The nucleoside and nucleoside reverse transcriptase inhibitors (NRTI) were the only drugs available before 1996. Before then, the case fatality rate from HIV/AIDS was over 90%. These drugs are still being used in combination with the new ones which were recently developed since the approval of AZT in the early 1980s11. The protease inhibitors impede HIV replication by preventing the enzyme protease from cutting the virus into shorter strands that it requires to make copies of itself. Therefore, incomplete defective copies are formed which are unable to infect human healthy cells. Epidemiologists therefore celebrate 1996 as the year of protease inhibitors. These PIs are the drug regimen that changed the life expectancy of HIV positive patients. PIs promptly eliminated the symptoms and manifestation of AIDS opportunistic infections in HIV infected patients in Europe and American. But in Africa South of the Sahara and other least-developed nations, these AIDS opportunistic infections are the commonly observed pain and suffering of most AIDS patients. In fact, after the development of PIs, physicians could now provide more treatment than just boosting the CD4 counts of most AIDS patients for just a few years. PIs converted the life of HIV positive patients to basic chronic and manageable conditions like diabetes, cancer, cardiovascular and other complex diseases. There are other Interventions such as entry-inhibitors which blocks HIV‘s ability to enter into CD4 cells before HIV has any chance to insert its viral particles into healthy human cells, the stages include: 1. Attachment of the virus to CD4 cells, 2. The virus binds to a target on the cells (either CCRS or CXCR4). Recently, FDA approved the first CCR5 antagonist. Finally, in stage 3, HIV fuses with the membrane of CD4 cells, a step which is blocked by fuzeon; a fusion inhibitor and finally in stage 4, the integrase inhibitors block the insertion of HIV DNA into human DNA11. The USFDA has stringent requirements for drug development. At the initial stage, a sponsor is asked to provide unequivocal evidence that a compound has therapeutic benefits against HIV. Therefore, the sponsor must submit for inspection data showing that the drug is reasonably safe for initial, small-scale clinical studies. To fulfill this requirement a sponsor must (1) couple existing non-clinical data from previous in vitro laboratory or animal studies on the compound. This might involve primate such as experimental monkeys or baboons. (2) A sponsor is asked to compile data from previous clinical studies or marketing of the drug in the United States or another nation whose population is relevant to the US population. (3) A sponsor is made to undertake new preclinical studies designed to provide valid evidence to support the safety of administering the compound to humans. At this preclinical phase, the US FDA demands that the sponsors develop a pharmacological profile of the drug. (2) assess the acute toxicity of the drug in at least two species of animals and (3) conduct short-term toxicity studies ranging from 2 weeks to 3 months, depending on the proposed durations of use of the substance in the proposed clinical studies15.
For Investigational New Drug Application (IND) there are three pertinent stages which are (1) animal pharmacology and toxicology studies (2) Manufacturing information. This component focuses on academic qualifications of the clinical investigators. They prefer expertise is a physician-scientist. Clinical trials are in four phases. To reiterate, HIV/AIDS drug development is a rigorous process. Developing these drugs can take up to 15 or 20 years, before they are approved for human consumption. Besides, their development involves

Impact of Globalization on HIV/AIDS Pandemics and the Challenges of Compulsory Licensing and Parallel Importation
34
reviewing thousand of compounds to identify which ones are active against HIV. The United States Food and Drug Administration (USFDA) maintains that only 1 out of 1000 compound, makes it from the pharmaceutical laboratory to clinical trial in humans. From there, only 1 out of 5 drugs is approved as a therapeutic regimen15,16.
The initial preparatory stage is the pre-clinical stage whereby specific HIV/AID drug candidate is clinically identified by testing it against existing drug. This process is characterized as screening. Recently, developed innovative approach is rational drug design, whereby pharmacologist, ―build‖ drug molecules to inhibit the pathogenic activities of HIV in specific ways. Once the therapeutic benefits of this drug are identified, it goes into the next stage of pre-clinical testing in vitro and vivo. These clinical assessments potentially, will reveal if the drug has HIV-related therapeutic benefits. The toxic effects if any are recorded. This stage must be meticulously assessed before trying the drug in human subjects15. There are four phases of clinical trials. In phase one, pharmacologists and other scientists test the experimental drug in a small group of subjects (20-80), for the first time to determine the safety of the drug; evaluate the safety of the drug, evaluate a safe dosage range and identify the side effects. In this phase (one), detailed information about the drugs pharmacokinetics and pharmacological effects are required to enable USFDA to permit the design of authentic controlled scientifically valid phase 2 studies. At this initial phase, drug metabolism, structure-activities and the mechanism of actions in humans are recorded. At this phase and in the case of adverse researchers, the Center for Drugs Evaluation and Research (CDER) can impose clinical hold that is, prohibiting the study from procedure or stop a trial that started for safety reasons. The other reason could be that the sponsor refused to accurately disclose the risk of study to investigators. In the second phase, the clinical trial involves the ―experimental study drug‖ given to a large cohort of people (100-300), to determine if it is effective and to continue monitoring the possibility of its safety. At this phase, early chemical studies are conducted to obtain adequate preliminary data on effectiveness of the drug for a particular indicator or adverse reactions from experimental patients with a disease such as HIV/AIDS. This phase also assesses short-term side-effects and associated risks with the drug. In the third phase (clinical trial), the experimental drug is given to larger group of subjects of about 1000-3000. The intent is to confirm the effectiveness of the drug and to continue to monitor any side effects. The drug is also compared to other commonly used drug, and the data collected are meant to enable USFDA authorities to allow the drug to be used safely. Phase 3 also provides adequate rationale for extrapolating the results to the general population. Also at this stage information could be transmitted in the physician labeling. In phase four (clinical trial), post-marketing studies are put in place to delineate additional information about the risks and benefits of the drug. If the experimental subjects were predominantly Caucasians, comments for other ethnic groups are compiled and used to enhance the therapeutic effectiveness/benefits of the drug15. A relatively detailed account was provided to illustrate the processes that pharmaceutical companies undergo in complying with USFDA regulations is the development of HIV/AIDS drugs. On the other hand, compliance with these FDA regulations gave rise to the establishment of WTO and the enactment of complicated agreement, for developing nations to abide by in order to access the expensive drugs for the engagement of HIV/AIDS.

E. W. Ebomoyi JAGR - Volume 3, Issue 7 (2010), pp. 23-39
35
WORLD TRADE ORGANIZATION (WTO) AND THE LEGAL UNDERPINNINGS OF COMPULSORY LICENSING
The World Trade Organization (WTO) was established in 1994 and the members came from developed, developing and the least-developed nations. The WTO Agreement on Trade-Related Aspects of intellectual Property Rights (TRIPS Agreement) were developed to be key components of the wider national and international actions to address the magnitude of public health concerns affecting developing and the least-developed nations. This resolution emanated from the lethal consequences of deadly pathogens like HIV/AIDS, and tuberculosis, among others17.
The declaration on TRIPS agreement and the relevance of public health concerns accentuated the need for members to recognize that intellectual property protection is important for scientific innovations and the development of new medicines. The other pertinent concerns focused on TRIPS agreement and its impact on prices. It also emphasized how TRIPS agreement should be interpreted and implemented in ways which are supportive of WTO members‘ right to protect public health and the survival of societies in regard to promoting access to medicines which are vital to those who need them.
The implementation of TRIPS has been fraught with challenges and multiple litigations. Two major components of TRIPS agreement are the issues of compulsory licensing and parallel importation. The first concept is a situation whereby compulsory licensing gives developing nations the legal right to use, import and manufacture their own duplicate (generic) versions of patented medicine. Compulsory licensing involves using legal intervention to restrict the monopoly rights of existing patent holder and make generic drugs readily available. In the French Laws, compulsory licensing may be issued for medicines when these patented medications are only available to the public in insufficient quantity or quality or at abnormally high prices such as we find with HIV/AIDS combination therapy today.
On the other hand, without the enactment and compliance with TRIPS stipulations regarding patent protection, a nation cannot be a bona-fide member of WTO. Compulsory licensing is permitted under TRIPS agreement in times of health emergencies involving deadly pathogens. On the other hand, parallel importation involves bringing in drugs from another country at a relatively inexpensive price. To illustrate, under parallel importation, a nation can purchase drugs from a third party in another country from a manufacturer. The purchaser can take advantage of the fact that pharmaceutical companies sometimes charge extremely inexpensive price in one country than another. In 1998 a study conducted by consumer product on technology discovered that Smithkline Beechman‘s version of Armoxil was $8 in Pakistan, $14 in Canada, $16 in Italy $22 in New Zealand, $29 in The Philippines and $36 in Malaysia, $40 in Indonesia, $50 in Germany.
In the developing and least-developed nations, parallel importation enables these nations to purchase critical HIV/AIDS drugs from the cheapest sources. Parallel importing is allowed under article 6 of the TRIPS agreement. This process is widely used for importation and purchase of medicines from most of the European nations. It is most prudent for developing and the least-developed nations to enact TRIPS-compliant laws that permit compulsory licensing and parallel importation so as to assist people in their nations who live with HIV/AIDS (PLWA). The other advantage is compliant with both CL and PI will create more leverage when negotiating with foreign manufacturing companies in Europe and United States.

Impact of Globalization on HIV/AIDS Pandemics and the Challenges of Compulsory Licensing and Parallel Importation
36
ADVANTAGE OF CL AND PI
Recently, Rwanda became the first nation to make use of CL provisions which are proposed to become article 31bis of WTO intellectual Property Rights. The Canadian pharmaceutical company Apotex has been awarded an export license under the provisions to supply a combination AIDS medication to satisfy the health needs of Rwanda. Since Rwanda is among the least developing nations, Apotex does not have any major concern about this humanitarian marketing gesture. Seven million pills were sent to Rwanda18,19. This is the first time that a manufacturing company will engage in this humanitarian gesture after Medicines Sans Frontieres appealed to Apotex to produce generic version of several costly brand-name antiretroviral medications which combines three drugs into one pill called Apotrivir. One pill cost $19.5 cents in United States less than the cost of buying the brand-name medication separately. The implementation of this humanitarian gesture involved Elie Betito, the corporate affairs officer at Apotex who negotiated with Boehringer Ingelheim which holds the patent for nevirapine and GlaxoSmithkline, patent holder for nevirapine and Zidovudine for voluntary license20,21. In the same vein, in Latin America, Ecuador issued its first licensee of compulsory license for Lopinavir, an effective medication for treating HIV/AIDS. It is believed that other Latin American governments could use compulsory licenses to procure drugs and access to essence medications.
LITIGATIONS AGAINST MANY DEVELOPING NATIONS
Among the developing nations with enhanced technology such as Argentina, Brazil, China, India and South Africa, compliance with the rules and regulations of WTO has been controversial. For example, the drugs-patent issue recently became litigious as 39 pharmaceutical companies from the develop nations garnered their resources and sued South African government for introducing a law that simplified and facilitated the issuing of CL and PI for HIV/AIDS medicine. Similarly, United States took another case to WTO against Brazil in relation to its law on CL. Before 1995, when TRIPS was not in existence, about 50 nations had excluded drugs from patentability. Currently, such option is now prohibited as TRIPS obliges all WTO members to allow medicines to be patented. As a result many non-government organizations (NGO) have expressed their outrage against pharmaceutical companies in the rich-industrialized, nations for aggressively trying to prevent developing nations from exercising their rights to override patents through legitimate means as TRIPS22. Although it is a fact that pharmaceutical companies own the exclusive rights to manufacture and sell their products, such monopoly has allowed these drug companies to exclude competitors, particularly those from the scientifically, progressive developing nations. Most of these companies in the industrialize nations have increased the price of these life-saving HIV/AIDS medication.
INDUSTRIALIZED NATIONS’ (G8) FAILURE TO MEET AID PROMISES TO AFRICA.
Recently, Ogunkeye22 reported how the world seven most industrialized national have fallen short on their assistance to the developing and least-developed African nations. At the 2005 summit in Gleneagles, Scotland, the G7 leaders promised to increase their financial assistance by up to $50 billion from $25 billion, at the same time eliminate the debts owed by 18 of the world most impoverished nations. They also promised to cut trade subsidies and tariffs under the Doha round of global trade negotiations.

E. W. Ebomoyi JAGR - Volume 3, Issue 7 (2010), pp. 23-39
37
A review of the final verdict revealed that the resolution of Gleneagles target which will be publicized by 2011 indicates it had enough data to confirm that the G7-Britain, United States, Germany, France, Canada, Italy and Japan had fallen short of their promises. In previous years when aids were provided such resources where used to purchase drugs to treat HIV/AIDS patents and to reduce deaths from malaria which is a deadly pathogen in Africa. At the American University College of Law, a group described as ―Program on Information Justice and Intellectual Property‖ (PIJIP) and Health Global Access Project (Health GAP), European Community Advisory Board (ECAB); has called for humans‘ right review of United States medicine policy. The submission of this vociferous group revealed that ―the United States has been using trade agreements, foreign aid, technical assistance and diplomatic pressure to promote intellectual property rights at the expense of human right‖23. The report pinpointed the intellectual property sanctions that the United States had placed on developing nations like Brazil, India, Thailand and Guatemala which drastically reduced global access to affordable medications. As a drastic measure, the report further accentuated how U.S. policies have led to the removal of affordable generic medications against HIV/AIDS from its assistance to the developing nations. This measure has increased the price of HIV/AIDS drugs by over 800%23. As a result of the US stringent sanctions, over 100 non-government organizations (NGO) (Oxfam, Third World Network and Medicines Sans Frontier) present a NGO statement asking the government of the WTO to:
Adopt a pro-public health stand confirming that TRIPS allows countries to use measures (such as compulsory license and parallel importation) to locally make, or import and export cheaper versions of patented medicine. Enable governments to grant compulsory licensing on a ―fast-track‖ basis for health purposes, by removing burdensome conditions imposed by TRIPS.
Stop putting pressure on developing countries aimed at preventing them from exercising their rights to take measures to obtain cheaper medicines. Agree not to take up complaints in the WTO‘s despite system against developing nations for such measures allow developing countries to exclude medicines from being granted patents to ensure that medicines are more affordable to the poor.
URGENT NEED TO INVEST IN PHARMACEUTICAL RESEARCH AND BIO-PROCESSING
To eliminate the monopoly in the production of sale of HIV/AIDS drugs, the developing nations must collaborate with their indigenous healers in the identification of plants with healing properties. Many of the AIDS opportunistic infections can be cured with such herbal remedies even as HIV remains insidious. The developing and least-developed nations must revise the medical and pharmaceutical curricula inherited from their colonial administrator over 60 years ago. Medical, pharmaceutical institutions and technologically-oriented disciplines must be willing to eliminate the existing barriers between scientific and the behavioral disciplines. Both developing and the least-developed nations must create an environment which is conductive to innovation. Incentives must be provided to train scientists build well furnished Universities where trained
Impact of Globalization on HIV/AIDS Pandemics and the Challenges of Compulsory Licensing and Parallel Importation
38
pharmacologists, pharmacist, pharmacognocists and molecular biologists can work as a team to develop drugs to meet the needs of their societies. The governments of the developing and least developed nations must offer incentives to both foreign and domestic companies to produce pharmaceutical products which can meet the health needs of their societies: prevent dry skin wrinkles, chapped and sunburned skins and related dermatitis routinely observed in HIV/AIDS patients. The developing and least developed nations must aggressively invest and garner the sources of their scientists to harness local resources to combat HIV/AIDS; while seeking the collaboration of the International NGOs to assist them to simplify and facilitate the complex rules and regulations associated with WTO‘s parallel importing and compulsory licensing. The rich tropical ecologic biomes in many of the developing nations constitute a significant advantage to seek the assistance of traditional healers in identification of plants with healing properties. To illustrate, the extract from corms of Sauromatum guttatum was analyzed by Khan et al24 to have antibacterial activity against many of the etiological agents of AIDS opportunistic infections. Such infections include dermatitis, respiratory systems infections and gastrointestinal diseases Parkia biglobosa was identified by the investigator in rural Kwara State of Nigeria to prevent dry skin, wrinkles, chapped and sunburned skins and related dermatitis. The developing and least-developed nations must aggressively invest and garner the resources of their scientists to combat HIV/AIDS. International collaboration of the NGOs is needed to simplify and facilitate the complex rules and regulations associated with WTO parallel importing and compulsory licensing.
ACKNOWLEDGEMENT
I write to thank Dr. Elmer J. Gentry of the College of Pharmacy at the Chicago State University for his comprehensive explanation of the drug development procedures at the United States Food and Drug Administration and the international implications about the issue of compulsory licensing and parallel importation.
ABOUT THE AUTHOR
Dr. Ebomoyi is a professor in the Department of Health Studies at the Chicago State University, Chicago, Illinois. He holds a post-doctorate Certificate in Epidemiological science from the National Institutes of Health, Bethesda, MD., and a Ph.D. in Community health and statistics from the University of Illinois at Urbana-Champaign, Illinois. He serves as a consultant in International Health for the American Public Association (APHA), Washington, D.C.
REFERENCES
1. Coovadia, H. M. and Hadingham J. (2005) HIV/AIDS: Global Trends, Global Funds and Delivery, Globalization and Health, 1(13), Accessed online July 30, 2010: http://www.globalizationandhealth.com/content/1/1/13.
2. IMF Staff (2002) Globalization: Threat or opportunity?, pp. 1-12, Accessed online http://www.imf.org/external/np/exr/ib/2000/041200to.htm.
3. Janssen, S. (2010) The World Almanac and book of facts, New York, NY, World Almanac Books. 4. Crafts, N. (2000) Globalization and growth in the twentieth Century, IMF working paper, WP/00/44,
Washington DC, Accessed online: http://www.imf.org/external/pubs/ft/wp/2000/wp0044.pdf.

E. W. Ebomoyi JAGR - Volume 3, Issue 7 (2010), pp. 23-39
39
5. Chanda, N. (2005) The Digital Divide, accessed online March, 2010: http://www.feer.com/article 2000/0010_19free/p50biynor.html
6. Menon, M. G. K. (1999) Science and technology for development, accessed online http://www.indiaembassy.org/policy/trade/eco_fin_oct_11_99.htm
7. UNAIDS (2010) Global HIV/AIDS cases for 2010, UNAIDS reports. 8. Wroughton, L. (2010) Rich nations failing to meet the aid promises to Africa, accessed online
5/25/2010: http://www.reuters.com/article/idUSN248314120100525, Pp. 1-2. 9. Gallant, J. (2010) Mix and Match: With as many as six drugs categories more than ever, how to
treat HIV can become a matter of strategy, Positively Aware, March/April 2010. 10. Castro, K. G., Ward, J. W., Slutsker, L., Buehler, J. W., Jaffe, H. W., Berkelman, R. L. and Curran,
J. W. (1992) ―1993 Revised Classification System for HIV infection and Expanded Surveillance Case Definition for AIDS Among Adolescents and Adults, CDC Report 18 December, 1992, accessed online http://www.cdc.gov/MMWR/preview/MMWRhtml/00018871.htm.
11. WHO (7 August 2006) WHO case definitions of HIV for surveillance and revised clinical staging and immunological classification of HIV-related disease in adults and children, accessed online http://www.who.int/hiv/pub/guidelines/hivstaging/en/index.html.
12. Mehta, S. & Vazquez, E. (2010) The 14th Annual HIV Drug Guide, Positively Aware, March/April 2010.
13. HIV Drug Chart (2010), Positively Aware, March/April 2010. 14. Ebomoyi, E. W., Abdelghani, A. A., Cherry, F. F., Gaskin, D. and Maloney, B. J. ( 1998)
Community Medicine: A Global Perspective, Star Press, Belmont, CA. 15. AIDS Research Alliances (2010) Making medicine - The drug development process, Accessed
Online: http://www.Aidsresearch.org/learning/process.htmlpp1-2. 16. United States Food and Drug Administration (n.d.) Overview of the FDA new drug approval
process, Retrieved from http://www.FDA.org. 17. Perriens, J. (1999) UNAIDS report on compulsory licensing and access to HIV drugs, Conference
on Community and Home Care for People with HIV Infection, Paris, Accessed online: http://lists.essential.org/pharm-policy/msg00355.html.
18. Royle M (2007) Compulsory licensing and access to drugs-the Rwanda experience, thepharmaletter, Dec. 17, 2007, accessed online: http://www.thepharmaletter.com/file/84013/ compulsory-licensing-and-access-to-drugs-the-rwanda-experience-by-matthew-royle.html.
19. Duckett, M. (1999) Compulsory Licensing and Parallel Importing: What Do They Mean? Will They Improve Access to Essential Drugs for People Living With HIV/AIDS?, International Council of Aids Serviced Organization (ICASCO) (July 1999).
20. Perez-Casa, C. (2000) HIV/AIDS medicine pricing report setting objectives: Is there a political will?, accessed online: http://www.msfaccess.org/fileadmin/user_upload/key-publication/Durban% 20report%20update%20dec%202000.pdf.
21. Cullet, P. (2003) Patents and medicines: the relationship between trps and the human right to health, International Affairs, 79(1), pp. 139-160.
22. Ogunkeye, O. (2003) HIV/AIDS: Between generic and patented drugs, accessed online: http://www.thisdayonline.com/archive/2003/12/02/20031202law03.html.
23. TWN Third World Network (2010) US access-to-drugs policy contravenes human rights, accessed online: http://twnside.org.sg/title2/health.info/2010/health20100501.htm.
24. Khan, T., Ahmad, M., Khan, R., Khan, H., Ejaz, A. and Choudhary, M. I. (2006) Evaluation of phytomedicinal potentials of selected plants of Pakistan, American Laboratory, 38(9), pp. 20-22.

N. Ye and S. Herron JAGR - Volume 3, Issue 7 (2010), pp. 40-49
40
A COMPARISON OF COMPUTER-BASED AND TRADITIONAL COLLEGE ALGEBRA COURSES
Ningjun Ye1 and Sherry S. Herron2
1Presbyterian Christian School, USA and 2University of Southern Mississippi, USA
ABSTRACT
University of Southern Mississippi piloted the Math Zone in Spring 2007, a computer-based program in teaching MAT 101 and MAT 099 in order to improve student performance. This research determined the effect of the re-design of MAT 101 on student achievements in comparison to a traditional approach to the same course. Meanwhile, the study investigated possible effects of the Math Zone program on students’ attitude toward studying mathematics. This study shows that there was no statistically significant difference on MAT101 final exam scores between the Math Zone students and the Classroom students in Fall 2007, Spring 2008 and Fall 2008. At the same time, the study also shows that there was no statistically significant difference in students’ attitude toward math between the two groups in each of the three semesters. However, this study reveals a significant relationship between the hours the students spent in the Math Zone and the scores they made on the final exam in Spring 2008 and Fall 2008.
INTRODUCTION
College algebra reform is taking place in higher education across the country. The focus of a traditional college algebra course has been on the students who intend to take calculus afterwards, and this traditional style has dominated for more than four decades (Elington, 2005). Changes are being made to ensure that the college algebra course can provide a worthwhile quantitative experience for students who are not planning a career requiring higher level mathematics while also preparing others for calculus. Computer programs have been focused on mathematics education since they were first created. In fact, mathematics software is one of the most popular categories of software (TERC, 1999). The implementation of these programs in the classroom has been a long-term goal for many researchers and the arguments concerning the effect of computer-based mathematics courses on student outcomes are still critical (Brynes, 2001). Computer-based learning has three components: hardware, software and ‗underware‘, the pedagogy that underpins its development. The latter is the most important, as the approach adopted will influence the creation of computer-based learning materials and determine the way in which students engage with subject matter. The computer-based class allows students to access assignments and participate in activities, manipulate problems, verbalize mathematical processes, and get immediate feedback
Full Article Available Online at: Intellectbase and EBSCOhost │ JAGR is indexed with Cabell‘s, JournalSeek, etc.
JOURNAL OF APPLIED GLOBAL RESEARCH
Journal Homepage: www.intellectbase.org/journals │ ©2010 Published by Intellectbase International Consortium, USA

N. Ye and S. Herron JAGR - Volume 3, Issue 7 (2010), pp. 40-49
41
about why certain answers are correct while others are not (Bottino, 2004). Teachers are responsible for the quality of their courses and have a vital role in helping to develop the most appropriate electronic learning activities that will facilitate students to acquire the knowledge and skills necessary for clinical practice. Therefore, they need to have an awareness of what contributes to educationally effective, computer-based learning materials (Adams, 2004). The University of Southern Mississippi (USM) began to implement a computer-based instruction program for College Algebra (MAT 101) in the spring of 2007. Mathematics has embarked on a re-design using MyMathLab (Pye, 2007). MyMathLab is a software program from textbook publisher Wiley, providing instruction on mathematics contents, homework drill, quizzes, and tests. The computer lab at USM, named the Math Zone, is equipped with 60 computers and is staffed 50-70 hours per week by mathematics faculty, adjunct instructors, graduate students and undergraduate students. A student working at a computer in the Math Zone can get almost instantaneous help from one of the lab workers. Students have several resources to use when doing their homework. ―Help Me Solve This‖ guides students from one problem to another step by step, providing more exercises to do if they want to try. ―View an Example‖ shows a similar problem in another screen. ―Similar Exercise‖ allows students to do the same type of problems as many times as they want until they understand it completely. ―Animation‖ provides a lecture like a PowerPoint presentation for each section. ―Textbook Pages‖ gives students an opportunity to find the exact page of the textbook that contains their current homework problem. ―Ask My Instructor‖ allows students to email their instructors whenever they need. ―Video Lectures‖ for each section gives students opportunities to ―listen to the teacher‖ to experience the traditional learning method. ―Tracked Tutorial Exercises‖ allows students to make a study plan to ensure that they understand each mathematical topic covered. Students who enroll in the Math Zone class are required to spend at least 3 hours in the Math Zone and to attend a lecture once a week in the classroom by their instructor. The purpose of this study was to determine the effect of the Math Zone program. Three questions were addressed: 1. Is there a difference in MAT101 final exam scores between the students using Math Zone as the instructional delivery method and those experiencing the traditional method of classroom delivery? 2. What are the attitudes of students toward math in both of the Math Zone and traditional classes? 3. Do the hours students spend in the Math Zone have a positive correlation to the scores they make on the final exam? This study had both quantitative and qualitative components.
QUANTITATIVE STUDY
The quantitative study tested the effect of this program on achievement and on confidence levels of students. The first two hypotheses on achievement and attitudes were analyzed by independent sample t-tests and the third hypothesis on the relation between the final exams scores and the lab hours was analyzed by a linear regression method. The data were directly collected from 458 students enrolled in Fall 2007 Semester, 426 in Spring 2008 Semester and 885 in Fall 2008. The final exam scores of the Math Zone class (experimental group) were compared to the traditional class (control group) during the consecutive three semesters; Both groups were learning the same subject during the same semester by using the same final exam at the same time (Saturday, 9:00—11:30). The final exam contained 37 multiple choice questions, and 4 word problems made by the Developmental Math Committee. The perfect score of the exam was 105. The results for achievement comparisons were shown in Table 1. ―N‖ represents the population of the students, ―Min‖ means the

A Comparison of Computer-Based and Traditional College Algebra Courses
42
minimum final exam score, ―Max‖ means the maximum final exam score, ―Mean‖ is the average scores of the whole class. ―SD‖ is the standard deviation. ―Average‖ is the average number and score of the three semesters.
Table 1: Comparison of Achievement Scores
Variables Control Group Experimental Group
Final Exam n Min Max Mean SD n Min Max Mean SD
Fall 07 339 0 105 65.36 30.75 119 0 104 65.51 32.31
Spring 08 192 0 105 56.26 28.69 234 0 105 51.91 29.20
Fall 08 621 0 103 61.40 29.31 264 0 105 63.53 33.80
Average 384 0 105 61.00 29.58 205 0 105 60.31 31.77
The result of the quantitative data analysis of the final exam scores is provided for the first hypothesis:
H01: There is no statistically significant difference on MAT 101final exam scores between Math Zone class and Traditional class.
This hypothesis was not rejected for Fall 2007 classes. There was no statistically significant difference on MAT 101 final exam scores between the two groups: t(456) = 0.04, p = 0.964. The mean of the Math Zone class was 65.51, which was close to 65.36, the mean of the Traditional class. This hypothesis was not rejected for Spring 2008 classes. There was no statistically significant difference on MAT 101 final exam scores between the two groups: t(424) = -1.55, p = 0.124. The mean of the Math Zone class was 51.91, which was slightly lower than 56.26, the mean of the Traditional class. This hypothesis was not rejected for Fall 2008 groups. There was no statistically significant difference on MAT 101 final exam scores between the two groups: t(883) = 0.89, p = 0.346. The mean of the Math Zone class was 63.53, which was a slightly higher than 61.40, the mean of the Traditional class. The confidence level of students in learning and understanding college algebra was determined using the attitudinal survey. The 29 questions were assigned points ranging from 1 to 6 with 1 meaning the least confident and 6 meaning the most confident. Therefore, the score of the most confident student should be 174. The results were shown in Table 2.
Table 2: Comparison of Confidence Levels
Variables Control Group Experimental Group
N Min Max Mean SD N Min Max Mean SD
Fall 07 186 38 171 112.94 30.69 65 62 171 119.68 25.39
Spring 08 119 30 169 107.99 30.93 111 47 167 110.52 27.02
Fall 08 330 35 173 115.77 31.90 103 42 172 117.09 29.85
Average 635 34 171 112.23 31.17 93 50 170 115.76 27.42
The result of the quantitative data analysis of the confidence levels is provided for the second hypothesis:

N. Ye and S. Herron JAGR - Volume 3, Issue 7 (2010), pp. 40-49
43
H02: There is no statistically significant difference in students‘ attitude toward math between Math Zone class and Traditional class.
This hypothesis was not rejected for the Fall 2007 classes. There was no statistically difference in students‘ attitude toward math between the two groups: t(249) = 1.589, p = 0.113. The mean of the Math Zone class was 119.68, which was slightly higher than 112.94, the mean of the Traditional class. .This hypothesis was not rejected for the Spring 2008 classes. There was no statistically significant difference in students‘ attitude toward math between the two groups: t(228) = 0.659, p = 0.511. The mean of the Math Zone class was 110.52 which was slightly higher than 107.99, the mean of the Traditional class. This hypothesis was not rejected for the Fall 2008 classes. There was no statistically significant difference in students‘ attitude toward math between the two groups: t(431) = 0.384, p = 0.711. The mean of the Math Zone students was 117.09 which was slightly higher than 115.77, the mean of the Traditional class. The study also shows whether there is a positive linear relation between the lab hours and the final exam scores during the three semesters. See Table 3.
Table 3 Regression
Variables Fall 07 Spring 08 Fall 08
Correlation (Beta) 0.16 0.42 0.49
R Square 0.025 0.177 0.236
P Value 0.084 **0.000 **0.000
The result of the quantitative data analysis of the linear regression is provided for the third hypothesis:
H03: There is no relationship between the hours the students spend in the Math Zone and the scores they make on the final exam.
This hypothesis was not rejected for the Fall 2007 data. The regression showed that the two variables had no strong linear relation: p is 0.084, and r square is 0.025. This hypothesis was rejected for the Spring 2008 data. The regression showed that the two variables were strongly linearly related: p < 0.001, and r square is 0.177. This hypothesis was rejected for the Fall 2008 data. The regression gave the same significant result as Spring 2008: p < 0.001, and r square is 0.236. In summary, there was no significant difference on MAT 101 final exam scores between the Math Zone class and the Traditional class in Fall 2007, Spring 2008, and Fall 2008. Meanwhile, there was no significant different in students‘ attitudes toward math between the two groups in each of the three semesters. However, there was a significant relationship between the hours the students spent in the Math Zone and the scores they made on their final exams in Spring 2008 and Fall 2008.
QUALITATIVE STUDY
Qualitative analysis consisted of two parts: the survey of students and the interviews with the instructors. Analysis was conducted to answer research question 3: What are the attitudes of students toward math in both of the Math Zone and traditional classes? For the Math Zone students, 70 were

A Comparison of Computer-Based and Traditional College Algebra Courses
44
randomly selected from 90 surveyed in Fall 2007, 60 were randomly selected from 111 in Spring 2008 and 70 were randomly selected from 103 in Fall 2008. For the Traditional class, 70 were randomly selected from 186 surveyed in Fall 2007; 60 were randomly selected from 119 in Spring 2008 and 70 were randomly selected from 330 in Fall 2008. Interviews were conducted with seven instructors: two in Fall 2007, two in Spring 2008 and three in Fall 2008. Content coding and major themes were used to analyze the survey and interview data. Questions from the surveys and interviews were divided into four categories:
1. General Attitude Toward Math 2. Confidence in the Ability to Learn by Themselves 3. Confidence in Their Ability to Succeed in This Class 4. Whether or Not the Math Zone Program Helps the Students Learn More Effectively
The five survey questions were analyzed and distributed among their respective category. Survey Question 1: What is your general attitude toward math? Please describe how you feel about
math in general. --- General Attitude toward Math (1) Category 1 included Survey Question 1. The responses to this question were compiled and then categorized as being positive, negative toward math or a combination of both (mixed). The responses were also categorized as being not challenging, hard or it depends on the teacher. Following the average result of the three semesters together with the examples listed below, the numbers and percentages of the responses in Category 1 are shown in Figure 1.
Positive (30% from the traditional class, 31% from the Math Zone):
1. 1 Math is very enjoyable. I like to use formulas to solve problems. 2. I have always enjoyed math although upper level math is difficult.
Negative (23% from the traditional class, 17% from the Math Zone):
1. To be honest, I hate math, in my view it is useless. 2. I hate math. It makes me want to cry.
Mixed (28% from the traditional class, 34% from the Math Zone):
1. Math is challenging, but it is something that comes easy to me. We do it everyday. 2. Math is interesting and challenging. It can be extremely easy or very hard.
Not challenging (5% from the traditional class, 8% from the Math Zone):
1. I enjoy math, but sometimes I feel as if I am not challenged enough and get bored. 2. Math is slightly boring because I have done this before.
Hard (7% from the traditional class, 6% from the Math Zone):
1. It is hard and complicated. 2. Math is hard. It doesn't come easy for me.
Teacher (6% from the traditional class, 4% from the Math Zone):
1. I think it really depends on the teacher because I am not so strong in math. 2. It is easy as long as I have a good teacher. My attitude is somewhat neutral.

N. Ye and S. Herron JAGR - Volume 3, Issue 7 (2010), pp. 40-49
45
Figure 1: The above figure compares the percentages of responses to Survey Question 1 organized by categories between the two groups on an average of the three consecutive semesters. The blue color represents the Traditional class and the purple color represents the Math Zone class.
Survey Question 2: What grade did you expect to earn in this class? Please describe the reason.---
Confidence of Their Ability to Succeed in This Class (3) Category 3 included Survey 2. The responses to Survey Question 2 were directly obtained as A, B, C or D. The numbers and percentages were displayed in Figure 2. On an average of the three semesters, the responses from the traditional class are: 34% A, 37% B, 24% C, and 3% D. The responses from the Math Zone class are: 38% A, 34% B, 30% C, and 6% D.
Figure 2: The above figure compares the percentages of responses to Survey Question 2 between the two groups in an average of the three semesters. The blue color represents the Traditional class and the purple color represents the Math Zone class.
05
101520253035
Traditional
Math Zone
0
5
10
15
20
25
30
35
40
A B C D
Traditional
Math Zone
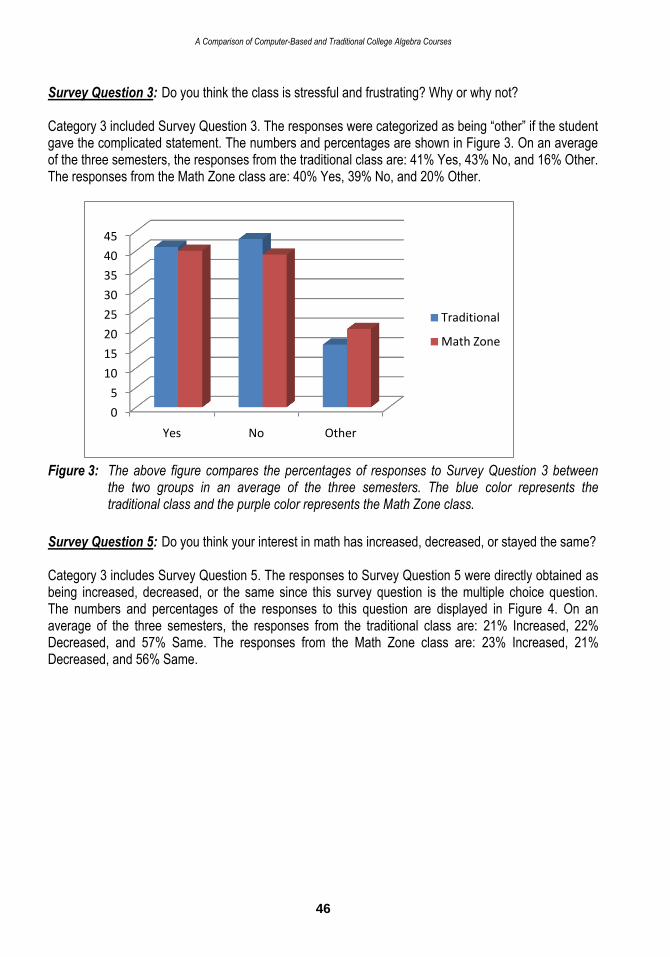
A Comparison of Computer-Based and Traditional College Algebra Courses
46
Survey Question 3: Do you think the class is stressful and frustrating? Why or why not? Category 3 included Survey Question 3. The responses were categorized as being ―other‖ if the student gave the complicated statement. The numbers and percentages are shown in Figure 3. On an average of the three semesters, the responses from the traditional class are: 41% Yes, 43% No, and 16% Other. The responses from the Math Zone class are: 40% Yes, 39% No, and 20% Other.
Figure 3: The above figure compares the percentages of responses to Survey Question 3 between the two groups in an average of the three semesters. The blue color represents the traditional class and the purple color represents the Math Zone class.
Survey Question 5: Do you think your interest in math has increased, decreased, or stayed the same? Category 3 includes Survey Question 5. The responses to Survey Question 5 were directly obtained as being increased, decreased, or the same since this survey question is the multiple choice question. The numbers and percentages of the responses to this question are displayed in Figure 4. On an average of the three semesters, the responses from the traditional class are: 21% Increased, 22% Decreased, and 57% Same. The responses from the Math Zone class are: 23% Increased, 21% Decreased, and 56% Same.
0
5
10
15
20
25
30
35
40
45
Yes No Other
Traditional
Math Zone

N. Ye and S. Herron JAGR - Volume 3, Issue 7 (2010), pp. 40-49
47
Figure 4: The above figure compares the percentages of responses to Survey Question 5 between the two groups in an average of the three semesters. The blue color represents the traditional class and the purple color represents the Math Zone class.
Survey Question 7: Do you think you are an independent learner? Why or why not? --- Confidence in
the Ability to Learn by Themselves (2) Category 2 included Survey Question 7. The responses were categorized as being ―other‖ if the student gave the complicated statement instead of ―yes‖ or ―no.‖ The numbers and percentages of responses are shown in Figure 5. On an average of the three semesters, the responses from the traditional class are: 51% Yes, 32% No, and 16% Other. The responses from the Math Zone class are: 62% Yes, 23% No, and 14% Other.
Figure 5: The above figure compares the percentages of responses to Survey Question 7 between
the two groups in an average of the three semesters. The blue color represents the Classroom students and the purple color represents the Math Zone students.
0
10
20
30
40
50
60
Increased Decreased Same
Traditional
Math Zone
0
10
20
30
40
50
60
70
Yes No Other
Traditional
Math Zone

A Comparison of Computer-Based and Traditional College Algebra Courses
48
The instructors responded 8 interview questions and 4 of them were analyzed. See Table 9 for the result. All of the seven instructors answered ―Yes‖ to Question 4, 7 and 8. Five of them answered ―Yes‖ to Question 6 and two of them responded ―No‖ to the same question. The questions are distributed among their respective categories which are listed below:
a. Interview Question 6: Do you think the students in this program are more motivated than the traditional class students? Why or why not? --- General Attitude toward Math(1)
b. Interview Question 7: Do you think this program is better in training the students to be more of an independent learner than traditional math classes? Why or why not ?--- Confidence in the Ability to Learn by Themselves (2)
c. Interview Question 4: Is the Math Zone program practical so far? Why or why not?--- Whether or not the Math Zone Program Helps the Students Learn More effectively (4)
d. Interview Question 8: Do you think the Math Zone program helps the students learn more effectively? Why or why not? --- Whether the Math Zone Program Helps the Students Learn More effectively (4)
Table 9: Numbers of Responses to the Interview Questions from Instructors
Question Number Yes No Other
Q4 7 0 0
Q6 5 2 0
Q7 7 0 0
Q8 7 0 0
In summary, the Math Zone students‘ attitude toward math was more positive on an average of the three consecutive semesters according to the responses to the Survey Question 1 (Category 1). The result of the Survey Question 6 and Interview Question 7 (Category 2) told us that the Math Zone students were more independent learners in each semester. In answering Survey Questions 2, 3 and 5 (Category 3), the Math Zone students showed more confidence in their ability to succeed in this math class. Seven instructors‘ responses to the interview questions including Question 8 (Category 4) indicated the Math Zone program is practical which helps the students learn more effectively.
DISCUSSION
This research shows that students, in general, performed well in the Math Zone class, a computer-based college algebra program. The research also shows the significance between the lab hours and the students‘ final exam scores. Both quantitative and qualitative studies show that in the three semesters, the students enrolled in the Math Zone class scored higher in attitudes than those who enrolled in the traditional class although there was no significant difference. More Math Zone students claimed that they were independent learners. Interviewed instructors answered Question 7 related to this theme. They all thought that the students using Math Zone program were more independent learners than those in the traditional classes. It is expected that significance could be possible in the future if something is done such as adding more lab hours or hiring more effective tutors, etc. As a result, students have to adjust their roles, duties and responsibilities and so do the instructors who are no longer ―the sage on the stage‖ but ―the coach of the team.‖ Once a computer-based mathematics course has been implemented, the role of the instructor becomes that of a facilitator (Villarreal, 2003). Teachers who wish to make good use of the Math Zone should take this into consideration: many

N. Ye and S. Herron JAGR - Volume 3, Issue 7 (2010), pp. 40-49
49
students do not take advantage of the resources available in MyMathLab. Instructors teaching Math Zone classes need training so that they can show students how to use and learn from the resources available in MyMathLab. Many of the students felt the class frustrating not because of the math but because of the computer. The rapid growth and improvement in technology exceed current knowledge of how to effectively use technology in schools and the impact of technology is different than it was in the past (Allen,2001). Because the number of hours spent in the computer lab is the predictor of students‘ outcome, it is necessary for the individual student to have the self-discipline to be engaged through the software and persist in doing the work independently (Snyder, 2004). After the researcher analyzed the results of this study, the following suggestions were made:
1. Additional studies should be conducted in other academic institutions. This would give more insight about the effect of the Math Zone program in diverse settings.
2. Additional studies should be conducted in other mathematics disciplines. This would give a better picture of the difference in the effect of the Math Zone between introductory and advanced levels of math.
3. Studies should pay more attention to the faculty attitudes and pedagogy (the underware) of computer assisted learning.
REFERENCE
Adams, A.M. (2004). Pedagogical underpinnings of computer-based learning Background. Journal of Advanced Nursing46 (1), 5–12
Allen, R. (2001). Technology and learning: How school map routes to technology‘s Promised Land. ASCD Curriculum Update, 1-3, 6-8.
Bottino, R. (2004). The evolution of ICT-based learning environments: Which perspectives for the school of. the future? British Journal of Educational Technology, 35, 553-67.
Byrnes, J. P. (2001). Cognitive development and learning in instructional contexts (2nd ed.). Needham Heights, MA: Allyn & Bacon
Ellington, A.J. (2005). A modeling-based college algebra course and its effect on student achievement. Retrieved August 28, 2007 fromhttp://www.contemporarycollegealgebra.org/resources/PrimusPreprint.pdf
Pye, W.C.(2007). The Math Zone. MathLetter, Spring 2007(A publication of the Southern Miss Mathematics Department).
Snyder, K. (2004). Roles of students and instructors in a pilot computer-based college algebra course. Retrieved August 1, 2007 from http://www.umaine.edu/center/MST/SnyderThesis.pdf
TERC. (1999). Technology meets math education: Envisioning a practical future in education. [Electronic version]. Cambridge, MA: Rubin, A. Retrieved October 2, 2005, from ERIC database.
Villarreal, L. M. (2003). A step in the positive direction: integrating a computer laboratory Component into developmental algebra courses. Mathematics and Computer Education,37 - eric.ed.gov. Retrieved August 1, 2007 from http://server.math.uoc.gr/~ictm2/Proceedings/pap318.pdf

S. Akkaladevi and A. K. Katangur JAGR - Volume 3, Issue 7 (2010), pp. 50-61
50
DEFENDING AGAINST BOTNETS
Somasheker Akkaladevi1 and Ajay K Katangur2 1Virginia State University, USA and 2Texas A&M University - Corpus Christi, USA
ABSTRACT
Botnets and their attacks pose a significant threat to the Internet. If these are launched simultaneously at a large number of systems, they pose greater risks. Botnet is a collection of software agents, or robots, that run autonomously and automatically under the control of a head bot or herder to launch an attack. They are most commonly associated with malicious software, but it can also refer to a network of computers using distributed computing software. Bots are generally designed to carry out a variety of attacks like spamming, traffic sniffing, harvesting information etc. Although much has been written on various aspects of botnets, this paper concentrates on exploring the ease of recruiting bots, operating a botnet, and also discusses the threats of such botnets. As detection techniques improve, botnet design will continue to evolve to evade detection; thus, it is important to predict potential future botnet models for the purpose of developing defense mechanisms. This paper presents several strategies for botnet defense mechanisms and activities which should be carried out in order to establish successful defense. Keywords: Botnets, Computer Security, Malware, Network Security.
INTRODUCTION
Bots and botnets have become one of the most serious threats to Internet security in recent years. Compared with other malware like virus and worms, bot behavior can be very stealthy, making their detection extremely difficult. For example, a bot can stay inactive without any dramatic activities for a long time. Oftentimes, a bot generates only a small amount of traffic, which is hidden among legitimate traffic. Large number of the Internet attacks that happening are directed toward exploitation of individuals and organizations in order to earn money, and that often causes financial losses. The continued growth of the Internet has lead to an explosive increase in the number of Internet attacks. There is, however, a shift in the motive for the attack from curiosity and recognition towards financial benefit [Choo, 2007]. This shift is attributed to the increasing sophistication of attack tools, thereby calling for a more secure world. Lately, a large number of articles and journals discuss the devastating criminal activity of botnets. Botnets has risen to be one of the scariest, continuously evolving and widely discussed blended threats to the Internet world today. Bot, short for robot, is a software script that automatically installs on a victim machine without any user intervention and carries out commands sent from another machine. Bots are not inherently evil. Infact, Google uses a search bot called Googlebot that gathers documents across the Web in response to search requests. However, in this paper, we are only concerned with vicious botnets that perform a whole bunch of major attacks and cause a violation of the security policy.
Full Article Available Online at: Intellectbase and EBSCOhost │ JAGR is indexed with Cabell‘s, JournalSeek, etc.
JOURNAL OF APPLIED GLOBAL RESEARCH
Journal Homepage: www.intellectbase.org/journals │ ©2010 Published by Intellectbase International Consortium, USA

S. Akkaladevi and A. K. Katangur JAGR - Volume 3, Issue 7 (2010), pp. 50-61
51
A botnet refers to a set of compromised machines also known as zombies that work together to intensify the effect of their attacks. These compromised computers can be located anywhere in the world such as homes, schools, businesses, etc. Attackers may use these zombies as anonymous proxies to hide their real identities and can easily amplify their attacks. The individual bots are software programs that run on a host computer allowing the other bots to control the actions of the host. A host itself may be infected by several bots and be a member of several botnets. Controllers can use these bots to perform various types of attacks including distributed denial of service (DDOS), email spamming, key logging, abusing online advertisements, installation of spyware, spreading new malware, and identity theft [Andreea, 2010]. Figure 1 shows the last 2 years botnet status. It is evident from the figure that the botnets are constantly increasing over time.
Figure 1: Botnet status for the period of October 2008 – October 2010 (Source: Shadow Server,
http://shadowserver.org)
Botnets can cause business disruption, network damage, information theft and harm to an organization‘s reputation [Sophos, 2006]. Business disruption: Organizations network administrators are often unaware that there is a botnet on their network until the organization is listed as a spammer on a domain name server block list (DNSBL). This can cause corporate email failure, thereby crippling regular business functions. Network damage: Botnets or Zombies aggressively attempt to infect other computers in an organization, slowing down internal networks. They can also store pirated software and other programs and hack into other organizations, consuming all the network resources. Information theft: Personal and confidential information such as in customer databases and user personal account passwords are at risk of being stolen by zombies. Even encryption cannot protect information, since a zombie can install spyware (such as a keylogger) to capture every stroke made on a keyboard before sending the information to hackers.

Defending Against Botnets
52
Damage to reputation: The illegal actions of zombies on computers can damage the reputation, image and brand value of an organizations business if it is seen as sending spam or facilitating other crimes. An infected computer (zombie), while carrying out malicious code, spends the resources and obeys certain commands without permission and knowledge of the owner and that activity causes the computer to slow down, display mysterious messages or it can even cause the system to collapse [Symantec, 2009]. The biggest problem with botnets appears when they are used for an attack. Botnet of a million robots, with uploading speed of 128 Kbps per infected computer (zombie), can reach a size of 128 gigabits in traffic. It is enough to put out of function 500 companies and several countries by applying DDoS attacks. If several big botnets unite, they could threaten functioning of national infrastructure of most countries [Ken, 2006]. Botnet can be either small or big, depending on complexity, sophistication of the robots and number of computers involved. The value of a botnet depends on its ability to use distributed computer power and its ability to retain anonymity through the use of a multi-tier command and control (C&C) structure. While researchers are improving the detection and defense schemes, bot developers are also constantly making bots more stealthy. Due to the scrutiny on IRC channels, today‘s bots are bound to other popular applications (e.g., Web browsers) or protocols (e.g., HTTP) [Daswani, 2007]. Distributed P2P-based botnets, which are much more difficult to detect and shut down than centralized botnet architectures, have also been developed. Advanced bots like Spam-Mailbot [Chiang, 2007] have applied encryption to defeat traffic scanning. In this paper, we look at several aspects of botnets, life cycle of a general botnet infection, various C&C mechanisms such as IRC, and a few botnet infection methods. A variety of widely and newly discovered approaches for defending botnets will be presented. This involves strategies at different stages such as prevention stage, detection stage and response stage.
BOT ATTACK MECHANISM
A typical bot attack can be considered as three indispensable phases:
Automatic startup
Different from those virus or worms (e.g., email worms) that rely on user intervention, a bot can be started automatically by modifying the automatic startup process list or registry entries. This is essential for the bot to actively initialize the command and control channel with the botmaster in order to receive commands.
Command and control channel establishment
In spite of various bot hiding techniques, existing bots all need to build a command and control channel. In a large network environment, it is impractical for a botmaster to actively trace all of its bots. To evade detection, a botmaster normally does not actively contact or scan all bots, particularly when the botnet contains a large number of bots behind firewalls or NAT that would not freely allow incoming traffic.
Information dispersion/harvesting
Sooner or later, a bot will be ordered to take some actions through the established command and control channel1. A bot can be asked to collect sensitive information from the local machine

S. Akkaladevi and A. K. Katangur JAGR - Volume 3, Issue 7 (2010), pp. 50-61
53
(information harvesting), or participate in organized attacks, such as spamming and DDoS attacks, against a third party (information dispersion).
BOTNET COMMUNICATION METHODS
Centralized Model
Distributed computing allows a user to divide the work for accomplishing a task across the resources of many hosts. A DDOS attack by a botnet comprised of several hundred thousand bots could cripple any computer defense. A botnet composed of a million or more hosts could be used as an attack by terrorists or as an act of war against a nation to cripple its network infrastructure. [Staniford, 2002] By using a multi-tiered C&C structure the bot herder is able to hide its identity. A bot does not perform any action of its own. Instead, it waits for commands from the botmaster that it follows promptly. The botmaster is most likely a human operator who issues commands to the bots via a C&C server. Typically, the commands are of two types: attacks and updates. While the attack command instructs bots to perform an attack, the update command instructs bots to download a file from the Internet and later execute it. Bots propagate to other machines by exploiting vulnerabilities. Additionally, most bots also have an executable packer, which encrypts and compresses the actual binary executable, hiding it from the general anti-virus software. Figure 2 shows the distribution of botnet C&C servers (as dots) across the world as captured by Shadowserver Foundation [Shadowserver 2009], a group of security professional volunteers who gather and report botnet activity, as of December 5, 2009. The size of the dot represents the relative number of C&C centers in that region. Evidently from the picture, the largest number of C&C centers is located in the United States of America, indicating that it has the most bot-infected machines.

Defending Against Botnets
54
Figure 2: Botnet C&C Servers Map (Source: Shadow Server, http://shadowserver.org)
Decentralized Model (P2P)
Besides botnets which mostly use centralized command and control, there are botnets which use peer-to-peer control (P2P), and in that case there is not a central controller (Botmaster) [SANS, 2009]. After the initial attack begins, these botnets create a ―chain reaction‖ causing ―Storm‖ and that‘s why these botnets are called ―Storm‖ [Carlton, 2008]. P2P botnet communication has several advantages over centralized networks. P2P communication system is much harder to break up compared to other type of communication systems. It means single bot compromise will not destroy the entire botnet. However, the design of P2P communication systems is very complex and there are no guarantees on message delivery or latency. There is another type of botnet called the random botnets. Table 1 provides information about the various types of botnets.

S. Akkaladevi and A. K. Katangur JAGR - Volume 3, Issue 7 (2010), pp. 50-61
55
Table 1: Classification of C&C Models Based on Communication Method
C&C Model Description Pros Cons
Centralized A central C&C server communicates with all its bots
1. Low message latency due to well known hops
2. System design is simple
1. Easier to detect since all bots connect to the same server
2. Single point of failure, so easy to pull off
P2P Every machine acts as both client and server
1. Relatively harder to disrupt
1. System design is Complex 2. Message delivery is not
guaranteed
Botnets can also be described on the basis of the protocols they use. The most commonly used virtual C&C center for botnet propagation is Internet Relay Chat (IRC). IRC is an Internet protocol that enables real-time text messaging, it is a text-based open protocol developed for users to ―teleconference‖. IRC, created in 1988 by Jarkko Oikarinen, is an open protocol that is mainly used for group communication in discussion forums called channels [Srdjan, 2009]. Many IRC networks have been established at universities and other institutes. The program mIRC and other IRC clients are readily available to anyone who wants to use the IRC networks. A typical IRC network consists of IRC clients that connect to the IRC server. IRC servers are interconnected to other IRC servers and are mainly responsible for transferring messages between their clients. Each discussion on the IRC server occurs on a different channel. IRC bots run on victim user machines and join the pre-configured channels where they wait for commands from the IRC server. The IRC server is usually a compromised machine that the attacker uses to launch attacks. IRC is the most common technology used by attackers to propagate bots. The main advantage of using IRC as C&C is that it is very easy to use and implement. Moreover, a large number of public IRC networks already exist, requiring minimal effort from the attacker. Private IRC servers are usually hosted on bulletproof hosting services that can never go down. Web based C&C servers are the second type in this classification. Here, the attackers use a Web interface to monitor and control their botnets. The last type in this classification is a DNS based C&C server, which allows the attacker to send commands over a covert channel in DNS. Since the DNS traffic is permitted through firewalls, the C&C traffic looks genuine and cannot be recognized. Some botnets also use HTTP protocols.
LIFE CYCLE OF BOTNET INFECTION
Figure 3 illustrates five common stages found in a typical IRC botnet infection. In the first stage, a Bot looks for additional victims by exploiting vulnerabilities in the victim‘s machine. Most Bots look for security holes in the operating systems. Once vulnerability is found, the victim is tricked into downloading a script called shellcode that causes the bot binary to install and automatically start each time the victim restarts his machine.

Defending Against Botnets
56
Figure 3: Life-cycle of IRC Botnet Infection (Source: Abu, 2006)
The bot then tries to connect to the C&C center, which in this case is the IRC server. It typically has to go through a DNS server to resolve the name of the IRC server. This additional step will enable the botmaster to hold on to its botnet even though its IP address is blacklisted. Generally, the bot is required to authenticate itself to both the IRC server and the channel it is trying to get into. The passwords for these authentication phases are already available within the bot binary. Additionally, the botmaster has to authenticate to all its botnets. This phase is required to ensure that the botmaster has not been seized by other botnets. When a bot joins a channel, the botmaster updates the IRC with commands for the bot to execute.
BOTNET ATTACKS
If anyone wants to bring down a country‘s network infrastructure and without anyone knowing who did it, the weapon of choice is a distributed denial of service attack. Using rented botnets, one can launch hundreds of thousands or even millions of infobombs at a target, all while maintaining total deniability. An extensive list of attacks has been discussed in [Keizer 2008] [Larkin 2008] [Ianelli 2007] [Romano 2005] and [Puri 2003]. This list is growing everyday as new capabilities are incorporated into bots. Understanding the botnet attacks will help in analyzing botnet defenses in a better way. This section will describe some of the common attacks. hackers are using more sophisticated technologies, such as cross-site scripting, SQL injection, and frame hijacking that can be exploited because of Web 2.0 capabilities. DDoS (Distributed Denial of Service): The goal of this attack is to exhaust the resources of a server in such a way that the server will be unable to process any further requests from genuine clients. Variants of DDoS include ICMP, SYN and UDP flooding. DDoS attacks are similar to DoS attacks where someone is simply sending packets as fast as possible, but DDoS attacks can originate from thousands of computers at once.
S. Akkaladevi and A. K. Katangur JAGR - Volume 3, Issue 7 (2010), pp. 50-61
57
Spamming: The most ideal way to propagate Spam is through the use of botnets. Spam mail is transmitted to the bot and later to other machines. Phishing: As more people are becoming victims to phishing attacks, bots now have in-built ability to redirect users to fake websites where they would be asked to enter personal and confidential information Host illegal data: Attackers use the victim machines to host illegal software, movies and files. Even if the victim machine is traced for illegal activity, the attacker is safe and can re-host the files on another victim machine. DDoS extortion: This attack is a sample DDoS threat to a commercial server. The goal is to obtain extortion money for not extending the sample attack to a real one. Click fraud: This attack tricks the user into clicking a Web link that is directed to Internet advertisements of affiliates there by increasing the affiliate revenues paid by advertisers. Gateway and proxy functions: Sometimes attackers host server class services to avoid being detected. In generic port redirection where all incoming traffic is redirected to another machine. The idea here is to obfuscate the real location of the attacker. Keylogging and sniffing: Bots can be programmed to capture all the data entered via the keyboard, which usually is confidential. Similarly, bots can sniff the traffic to intercept valuable information. Screen capture: A bot can capture screens on the trigger of an event. Some bots are capable of capturing audio as well as video feeds.
BOTNET DEFENSE MECHANISMS
Botnet attacks can be defended at three stages: prevention, detection and response. All the Internet users are responsible for defense, starting from home or business computer users, system administrators, developers, and up to Web service/application administrators. Preventing computers from becoming part of a botnet, i.e., avoiding infection by Internet worms and other malicious software will be the most effective defense. To prevent a botnet, security awareness must be spread among users. In addition, users should implement multi layer security and start using secure operating systems with updated patches. Bots always try to use security failures in operating system and other software, it is necessary to update and install the patches in the operating system once they are available. It is a good idea to use automatic updating feature in the operating system. Setting the auto-patch update facility will free the user from the burden of manually updating patches each time it is dispatched. Turning on the firewall will add another layer of security. It is necessary to have Top-Rated anti-virus, anti-Trojan and Personal Firewall installed with auto updates in order to be protected against Bots. Users should learn to safely handle web browsers and e-mail applications. Turning off the support for scripting languages such as JavaScript, VBScript and ActiveX or at least control of their usage, reduces the risk of automatic Bot installing activities. One has to maintain Internet Broswer security level to high to reduce the infection by a Bot. According to the needs limiting the internet user‘s rights reduces possibility of Bot installations on computers. This procedure can be carried out by creation of very low privileges level of user account which is used when using Internet.

Defending Against Botnets
58
Usually network administrators can define network Policies for their networks and can carry out the measures mentioned above to reduce the risk to which computers in the network are exposed to. Disabling external access, such as ports which gives pathways for file transfers in and out of the computer system, is also useful in preventing botnet attacks. Many of these solutions are traditional and rely on pre-existing knowledge of a threat for protection. But this does little to protect against zero-day exploit vulnerabilities. To detect a botnet attack, a user can use a third-party online resource for scanning the machine, or use commands like netstat to monitor any malicious traffic. System administrators should monitor logs generated by Intrusion Detection Systems (IDS) and look for traffic anomalies. In response to a botnet attack, a user must disconnect from the machine and update anti-virus software. Any confidential information stored on the machine should be changed immediately. System administrators should take an additional step to avoid spreading of the botnet on the network. Honeynet [Krasser, 2005] is an advanced technique used to track and analyze botnet activity. Honeynet is a collection of honeypots. Honeypots are systems designed with vulnerabilities ready to be attacked. Honeypots are meant to collect information about attacks and later analyze the data to design better techniques to protect against threats. A honeynet has three parts to it: data control, data capture and data analysis. Data control refers to the containment of activity i.e., not allowing it to harm other non-honeynet systems. Data control can be implemented using multiple layers of protection to avoid the consequences of a single point of failure. Data capture is the process of monitoring the botnet activity within the honeynet. Data analysis is the extraction of valuable information from the data captured. An additional requirement is data collection, which is applicable only to organizations that have honeynets distributed in multiple locations. Such organizations are required to collect the data into a central location before they can start analyzing it. Figure 4 shows the main components of a typical honeynet. The firewall logs all incoming and outgoing connections, provides Network Address Translation (NAT) services, and some protection against DoS attacks. The IDS also logs all the network traffic and looks for known attacks and exploits. A syslog computer logs all the activity and commands carried out in the attack. This information is then stored in a remote syslog computer to avoid loss of data in case of compromise of the local syslog computer. The last component is the honeypot. It serves as a mirror of a production system. A honeynet usually contains more than one honeypot and it not only gathers information for analyzing but also alerts security organizations when new attacks are detected.

S. Akkaladevi and A. K. Katangur JAGR - Volume 3, Issue 7 (2010), pp. 50-61
59
Figure 4: Structure of a Classic Honeynet (Source: http://honeynetindia.wordpress.com/)
Bots based on P2P architecture could be detected by analyzing and monitoring bots features. In the P2P botnets one can monitor specific range of ports, network traffic etc. Significant evidence to identify the existence of botnet will be IP address lists used by the botnet and also connection failures of bots in the infection step. Since each bot in P2P architecture attempts to link to others, it establishes a number of traffic connections in order to find bot peer and to exchange information. Furthermore, these generated traffic connections by bot have similar degree of fluctuating fixed information. This fixed form is useful to categorize TCP and UDP packets and to group the data which is used to classify the activities of bots. Large botnets are frequently used to launch DoS attacks also called as super-botnets. To bring down an e-commerce website or to prevent an organizations networking capabilities, these attacks require several resources, such as a botnet army. Unlike large botnets flooding a network to deny service, micro-botnets are less likely to be detected. Micro-botnets utilize fewer slave computers, and in turn send fewer data packets, and are superior at evading traditional botnet-detection capabilities in firewalls and intrusion detection systems. An organization, to protect itself from micro-botnets must allocate more resources toward detecting botnets rather than focusing solely on preventing them. To detect botnets an organization needs to monitor for any abnormal spikes in network traffic, weird open ports, and accounts suddenly gaining elevated permissions. If a pattern scanner is used, sensitivity level should be turned up and extra time should be spent on determining what is or is not a false positive. Good network hygiene is to exercise log analysis to know what's really happening on the network.

Defending Against Botnets
60
A filter-based DoS defense system can also be used as a defense mechanism. This can enable a receiver to install a network filter that blocks the undesired traffic it receives. One solution to the threat of super-botnets is centralized defense. When anti-virus software locates a super-botnet infection with routing information, it could pass the routing information along to a central defense location. Given enough disinfections, this tactic should reveal a sizeable portion of the super-botnet‘s structure. In fact, given enough information, a centralized defense location may be able to locate the adversary commanding the super-botnet. If communication logs are available from the disinfected C&C servers of the individual botnets, potential suspects to be the adversary are all those machines for which routing information has not been collected at the central defense location, but which have sent a super-botnet command to a disinfected machine. After all, a command sent by the adversary looks just like a command passed on to one individual botnet from another, except that no botnet has routing information pointing to the adversary. Botnets are polymorphic i.e., their signatures change with each new infection. Also, most bots now include rootkit facility, which hide them from security tools. Hence, using anti-virus software will not help to a large extent. Most popular websites are now capable of spreading malware stealth fully. Therefore it is not just sufficient to be careful while surfing. An effective approach to reduce the botnet activity is to force-feed security upgrades and patches into machines connected to the Internet. It is also very essential to educate users on the importance of security and steps they need to take to keep their machines secure, considering that users are the weakest link in the security chain. Honeynets is a certainly a promising way to analyze and defend botnet attacks. However, it again depends on how the honeynet is implemented and to what extent it can contain and track the botnet activity.
CONCLUSION
Botnets pose challenges for the Internet community. It is a constantly evolving threat that is causing devastating effects on the Internet. The study of botnets shows the growing trend of criminal activities. Bots running on infected machines can use automated methods to propagate and perform a number of nasty deeds like sending Spam, and launching DDoS attacks. The motive behind such criminal activities is to propagate infection to more number of users in a stealth way. With the growth in the use of mobile platforms for all kinds of applications, security issues are not far behind. Trends indicate that the next targets for botnets will most likely be mobile devices. Botnet armies are at large caused by lack of user awareness and vulnerabilities in operating systems, specifically in the Windows family of operating systems. Although many sophisticated defenses are being proposed and implemented, minor solutions to improve Internet security are being overlooked. One approach to reduce the effect of botnets is to force-feed security upgrades and patches into machines connected to the Internet. It is also very essential to educate users on the importance of security and steps they need to take to keep their machines secure. A thorough and updated security checklist should be provided to users on a timely basis. Users who do not pass a minimum security check should be cut off from the Internet. The goal of our study is to understand how botnets work, its effects, and defense mechanisms. Future work will concentrate heavily on the defense mechanisms.
REFERENCES
Andreea Ancuta Onofrei, Yacine Rebahi, Thomas Magedanz, Preventing Distributed Denial-of-Service Attacks on the IMS Emergency Services Support through Adaptive Firewall Pinholing, The International Journal of Next Geneartion Network (IJNGN), Vol.2, No.1, March 2010.

S. Akkaladevi and A. K. Katangur JAGR - Volume 3, Issue 7 (2010), pp. 50-61
61
Carlton R. Davis_, Jose M. Fernandez, Stephen Neville, John McHugh, Sybil attacks as a mitigation strategy against the Storm botnet, Proceedings of 3rd International Conference on Malicious and Unwanted Software, 2008, pp. 32-40.
Chiang, K., Lloyd, L.: A case study of the rustock rootkit and spam bot. In: Proceedings of the First Workshop on Hot Topics in Understanding Botnets, Cambridge, MA (April 2007)
Choo, K. R., and Australian Institute of Criminology. 2007 Zombies and botnets / Kim-Kwang Raymond Choo Australian Institute of Criminology, Canberra.
Daswani, N., Stoppelman, M.: The Google Click Quality, and Security Teams. The anatomy of clickbot.a. In: Proceedings of the First Workshop on Hot Topics in Understanding Botnets, Cambridge, MA (April 2007)
Ken Baylor, Chris Brown, Killing Botnets, McAfee, October 2006 Krasser, S., Grizzard, B.J., and Owen, H.L. 2005. The use of honeynets to increase computer network
security and user awareness. Journal of Security Education, vol. 1, no. 2/3, pp. 23-37 Shadowserver. (2009), Report on Botnet Detection, The Free Encyclopedia, from
http://www.shadowserver.org Sophos white paper (2006), Stopping zombies, botnets and other email- and web-borne threats
http://www.sophos.com Srdjan Stanković, Dejan Simić, Defense Strategies Against Modern Botnets, (IJCSIS) International
Journal of Computer Science and Information Security, Vol. 2, No. 1, 2009. S. Staniford, V. Paxson, N. Weaver, ―How to 0wn the Internet in Your Spare Time‖, Proceedings of the
11th USENIX Security Symposium (Security '02) 2002 Symantec Corporation, Bots and Botnets - A Growing Threat, Symantec, 2009.
(http://www.symantec.com/norton/theme.jsp?themeid=botnet) Top Ten Cyber Security Menaces for 2008, SANS Institute, 2009. (http://www.sans.org/2008menaces/)

Call for Article Submissions Journal of Applied Global Research
The Journal of Applied Global Research (JAGR) seeks submissions of original articles focusing on one of two dimensions: Hard Science and Soft Science. The hard research work will discuss quantitative aspects of issues whereas soft deals with qualitative. This journal is committed to publishing papers that engage global research and philosophical judgments, with significant practical issues in an unlimited range of social applications and establishments. It seeks research innovation & creativity and presents original topics.
All articles are refereed by a rigorous evaluation process involving at least three blind reviews by qualified academic, industrial, or governmental professionals. Submissions will be judged not only on the suitability of the content, but also on the intellectual framework and significance to society in general. All papers are peer reviewed.
The Executive Editorial Board (EEB) of the Journal of Applied Global Research (JAGR) strongly encourages authors to submit their article(s) to an IIC conference prior to Journal consideration. Author‘s who submit their articles to an IIC conference receive the benefit of feedback from the IIC Reviewers‘ Task Panel (RTP) and conference attendees. This feedback generally improves the quality of submissions to the Journal of Applied Global Research (JAGR). Articles that are accepted for presentation at an IIC conference have a higher likelihood of being published in JAGR.
JAGR solicits only original contributions that have not been previously published or submitted elsewhere; with the exception of a submission to IIC refereed conference proceedings. Note! IIC refereed proceedings are a partial fulfillment of Intellectbase International Journals. Papers awaiting presentation or already presented at IIC conferences must be revised (ideally taking advantage of feedback obtained at the conference) to be considered for journal inclusion. All manuscripts selected for publication must maintain a high standard of content, style and value to the readership. An important criterion for acceptance of a manuscript for publication is the relevance of the work to the applied research environment and its potential usefulness for advancing the quality of global research.
JAGR REVIEW PROCESS The author submits his/her paper electronically and the paper is sent to the Managing Editor. A confirmation of receipt will be e-mailed to the author(s), usually within 2 days of your submission. The Managing Editor assigns the paper an ID number, removes author(s) names and affiliations, and sends the paper to reviewers. Reviewers usually have 2 weeks to perform the review; however, on occasions the reviewer may take up to 4 weeks to complete a review. Once review comments are returned, the Managing Editor puts them together and provides the original paper and the reviews to the Editor-in-Chief. The Editor-in-Chief, based on the comments of the reviewers and his reading of the manuscript, forms an overall recommendation regarding publication. On occasion, the Editor-in-Chief will consult the Senior Advisory Board and if necessary, request that an additional review be performed. Once the Editor-in-Chief has formed an opinion on the acceptability of the paper, an email will be sent to the corresponding author of the outcome of the review process. The full review process currently takes anywhere from 1-4 weeks from receipt of manuscript.
SUBMISSION INSTRUCTIONS JAGR only accepts electronic submissions of manuscripts. To submit a manuscript for the review process, you should send an email with the paper as an attachment to [email protected]. In the body of your email message include the author(s) name(s), contact information for the corresponding

author, and the title of your submission. Your submission will be acknowledged via return email. All submissions must be in English and in Word format.
Intellectbase International Consortium prioritizes papers that are selected from Intellectbase conference proceedings for Journal publication. Papers that have been published in the conference proceedings, do not incur a fee for Journal publication. However, papers that are submitted directly to be considered for Journal publication will incur a $195 fee to cover the cost of processing, reviewing, compiling and printing if accepted.
Page 1 of your submission should contain the title of the paper and should identify all authors, including authors‘ names, mailing addresses, and email addresses. Authors‘ names should not appear anywhere else in the manuscript, except possibly as part of the reference list. Author details should be followed by an Abstract of 200-500 words. Following the Abstract, Key Words should be identified and the Key Words are followed by the text of the paper.
The manuscript must be single-spaced, contain a single column, utilize 11 point Arial Narrow justified font, and contain 1‖ margins on all sides.
TITLE Centered across the top of the first page, 16 point Arial Narrow bold font, all letters capitalized.
MAJOR HEADINGS
14 point Arial Narrow bold font, left aligned, all letters capitalized.
First Level Sub-Headings
13 point Arial Narrow bold font, left aligned, capitalize each word.
Second level sub-headings
12 point Arial Narrow bold italic font, left aligned, capitalize each word.
Third level sub-headings
12 point Arial Narrow italic font, left aligned, first word capitalized.
No blank line is to appear between a sub-heading and the text. Tables and figures should be included in the text, approximately where the author thinks that they should appear. Manuscripts must be edited for spelling and grammar.
Reference citation ordering and format must follow Harvard (or APA) Style referencing. Reference entries should be ordered alphabetically (in text and Reference section) according to authors‘ or editors‘ last names, or the title of the work for items with no author or editor listed. Any reference contained in the text must be included in the Reference section and vice versa.
References in the text should be of the format: (Harris et al., 1995; Johnson, 1996). Quotes from a source should include the page number (Johnson, 1996, pp. 223). References must be complete.
The paper should not normally exceed 15 single-spaced pages, including all sections, figures, tables, etc. However, the Editor-in-Chief reserves the right to consider longer articles of major significance. Electronic submissions should be sent to [email protected]. Please visit the Intellectbase International Consortium website: www.intellectbase.org for further information.

CALL FOR ACADEMIC PAPERS AND
PARTICIPATION Intellectbase International Consortium Academic Conferences
San Antonio, TX – USA March Nashville, TN – USA May Atlanta, GA – USA October Puerto Rico – USA July Las Vegas, NV – USA December International Locations Spring & Fall
Abstracts, Research-in-Progress, Full Papers, Workshops, Case Studies and Posters are invited!!
All Conceptual and Empirical Papers are very welcome.
Email all papers to: [email protected]
Intellectbase International Consortium provides an open discussion forum for Academics, Researchers, Engineers and Practitioners from a wide range of disciplines including, but not limited to the following: Business, Education, Science, Technology, Management, Administration, Political, Social - BESTMAPS.
All submitted papers are peer reviewed by the Reviewers Task Panel (RTP) and accepted papers are published in a refereed conference proceeding. Articles that are recommended to the Executive Editorial Board (EEB) have a high chance of being published in one of the Intellectbase double-blind reviewed Journals. For Intellectbase
Journals and publications, please visit: www.intellectbase.org/Journals.php
All submitted papers must include a cover page stating the following: location of the conference, date, every author(s) name, phone, e-mail, full affiliation, a 200 - 500 word Abstract and Keywords. Please send your submission in Microsoft Word format.
For more information concerning conferences and Journal publications, please visit the Intellectbase website at www.intellectbase.org. For any questions, please do not hesitate to contact the Conference Chair at [email protected]
MULTI-DISCIPLINARY
FOUNDATIONS &
PERSPECTIVES
EDUCATION
BUSINESS
SOCIAL
POLITICAL
ADMINISTRATION
MANAGEMENT
TECHNOLOGY
SCIENCE
B E S T M A P S

Journal of Applied Global Research Individual Subscription Request
Please enter my subscription for the Journal of Applied Global Research Name ________________________________________________________________________________
Title _________________________________________ Telephone ( _____ ) ________________________
Mailing Address _________________________________________________________________________
______________________________________________________________________________________
City ________________________________ State _________________ Zip Code ____________________
Country ____________________________________ Fax ( _____ ) ___________________
E-mail ________________________________________________________________________________
Please check the appropriate categories:
Within the United States Outside the United States
□ Annual Individual Subscription - US$105 □ Annual Individual Subscription - US$135
Begin the annual subscription with the: □ Current Issue □ Next Issue
□ Single Issue - US$55 □ Single Issue - US$70
If you are requesting a single issue, which issue (Volume, and Issue) are you requesting ? ______________
Payment by check in U.S. Dollars must be included. Make check payable to: Intellectbase International Consortium Send this Subscription Request and a check to:
JAGR Subscription Intellectbase International Consortium 1615 Seventh Avenue North Nashville, TN, 37208, USA
All e-mail enquiries should be sent to: [email protected]

Journal of Applied Global Research Library Recommendation
(Please complete this form and forward it to your Librarian)
Dear ___________________________________ (Librarian‘s name)
I recommend that ________________________________________ (Library‘s name) subscribe to the following publication.
□ Journal of Applied Global Research (JAGR) ISSN: 1940-1833 (US$225 /Year)
I have indicated the benefits of the above journal to our library: (1=highest benefit; 2=moderate benefit; 3=little benefit)
1 2 3 REFERENCE: For research articles in the field of natural and social sciences.
1 2 3 STUDENT READING: I plan to recommend articles from the above to my students.
1 2 3 PUBLICATION SOURCES: This journal is suitable to my current research agenda.
1 2 3 PEER EVALUATION: This journal is highly regarded by my peers around the world.
Name ________________________________________________________________________________
Title _______________________________________ Telephone ( ______ ) ________________________
Mailing Address ________________________________________________________________________
______________________________________________________________________________________
City _________________________________ State ____________________ Zip Code _______________
Library Subscriptions: Within the US - US$225
Outside the US (includes air mail postage) - US$255
Payment by check in U.S. Dollars must be included. Make check payable to: Intellectbase International Consortium Send this Subscription Request and a check to:
JAGR Subscription Intellectbase International Consortium 1615 Seventh Avenue North Nashville, TN, 37208, USA
Tel: +1 (615) 944-3931; Fax: +1 (615) 739-5124 www.intellectbase.org
All e-mail enquiries should be sent to: [email protected]

For information about the following Journals, please visit www.intellectbase.org
B E S T M A P S
MULTI-DISCIPLINARY
FOUNDATIONS
& INTELLECTUAL
PERSPECTIVES
EDUCATION
BUSINESS
SOCIAL
POLITICAL
ADMINISTRATION
MANAGEMENT
TECHNOLOGY
SCIENCE
IJEDAS-International Journal of
Electronic Data Administration
and Security
JIBMR-Journal of International
Business Management &
Research
JOIM-Journal of Organizational
Information Management
JISTP-Journal of Information
Systems Technology and
Planning
JWBSTE-Journal of Web-Based
Socio-Technical Engineering
JKHRM-Journal of Knowledge
and Human Resource
Management
JGIP-Journal of Global
Intelligence and Policy
IHPPL-Intellectbase Handbook
of Professional Practice and
Learning
RHESL-Review of Higher
Education and Self-Learning
IJAISL-International Journal of
Accounting Information
Science and Leadership
RMIC-Review of Management
Innovation and Creativity
IJSHIM-International Journal of
Social Health Information
Management