
Volume 10 Issue 12 (2019) - International Transaction Journal ...
218
Volume 10 Issue 12 (2019) ISSN 2228-9860 eISSN 1906-9642 http://TuEngr.com READINESS FOR ORGANIZATIONAL CHANGE THROUGH DYNAMIC CAPABILITIES AND ROUTINIZATION: A STUDY OF THREE INDUSTRIAL ESTATES WATER PERMEABILITY OF CONCRETE MIXING ASH AND CRUSHED DUST A STUDY OF URBAN DESIGN ELEMENTS IN STRUCTURED VILLAGE AT GELUGOR, PENANG AN ANALYSIS OF RESEARCH AREAS IN PRECISION AGRICULTURE AN INVESTIGATION ON STAKEHOLDERS' PERCEPTION REGARDING EFFECTIVENESS OF SOCIAL MEDIA IN PAKISTAN'S HIGHER EDUCATION INFLUENCES OF THE IODINE-POLYMER PREPARATION "MONCLAVIT-1" ON THE HORMONAL, MORPHOLOGICAL AND BIOCHEMICAL STATUS OF THE BLOOD OF LAMBS OF WEST SIBERIAN MEAT BREED LAND-USE/LAND COVER CLASSIFICATION ANALYSIS USING PIXEL BASED METHODS: CASE OF TAROM CITY, IRAN ANALYSIS OF RUSSIAN MIGRATION FLOWS WITH SOCIO-ECONOMIC DEVELOPMENT CONSIDERATION THE INFLUENCE OF MUGHAL ARCHITECTURE ON MASJID ZAHIR: CASE STUDY ON FIVE RURAL MOSQUES IN KEDAH, MALAYSIA AN APPRAISAL OF POLICIES OF LAND ACQUISITION AND RESETTLEMENT OF INVOLUNTARY DISPLACED PEOPLE IN SHANGHAI (1978-2005) EFFICIENCY IMPROVEMENT ON FUNCTIONING AND DEVELOPMENT OF PASSENGER MOTOR TRANSPORT SERVICES IN URBAN AGGLOMERATIONS A COMPETENCY-BASED SUCCESSION PLANNING MODEL WITH RESPECT TO ADJUSTING ROLE OF ORGANIZATIONAL CULTURE IN TELECOMMUNICATION INFRASTRUCTURE COMPANY OF IRAN (TICIR) RESOURCE-SAVING WASTE-FREE PRODUCTION AS AN INNOVATIVE METHOD OF IMPROVING ENTERPRISES’ BUSINESS PERFORMANCE IN THE MEAT PRODUCTION PERSONALITY AND POST-PURCHASE CONSUMER REGRET EXPERIENCED AFTER IMPULSE BUYING: A CROSS-THEORETICAL APPROACH WITH INDIVIDUAL DIFFERENCES MODERATOR DETERMINATION OF SUB-SOIL SHEAR WAVE VELOCITY ( ) IN LAYERED SOIL WITH FEM IN RELATION TO APPROXIMATED AND ANALYTICAL RESULTS SOLVING FUZZY FRACTIONAL DIFFERENTIAL EQUATIONS BY ADOMIAN DECOMPOSITION METHOD USED IN OPTIMAL CONTROL THEORY AN EDUCATIONAL EFFECTIVENESS MODEL DEVELOPMENT BASED ON HUMAN RESOURCE STRATEGIES BY GROUNDED THEORY IN DISTRICT 7 OF IRANIAN GAS TRANSMISSION COMPANY EFFECTS OF SEED PLANTS ON QUANTITATIVE AND QUALITATIVE YIELDS OF VETCH AND BARLEY IN DIFFERENT MIXING RATIOS
-
Upload
khangminh22 -
Category
Documents
-
view
0 -
download
0
Transcript of Volume 10 Issue 12 (2019) - International Transaction Journal ...
Volume 10 Issue 12 (2019)
ISSN 2228-9860 eISSN 1906-9642
http://TuEngr.com
READINESS FOR ORGANIZATIONAL CHANGE THROUGH DYNAMIC CAPABILITIES AND ROUTINIZATION: A STUDY OF THREE INDUSTRIAL ESTATES
WATER PERMEABILITY OF CONCRETE MIXING ASH AND CRUSHED DUST
A STUDY OF URBAN DESIGN ELEMENTS IN STRUCTURED VILLAGE AT GELUGOR, PENANG
AN ANALYSIS OF RESEARCH AREAS IN PRECISION AGRICULTURE
AN INVESTIGATION ON STAKEHOLDERS' PERCEPTION REGARDING EFFECTIVENESS OF SOCIAL MEDIA IN PAKISTAN'S HIGHER EDUCATION
INFLUENCES OF THE IODINE-POLYMER PREPARATION "MONCLAVIT-1" ON THE HORMONAL, MORPHOLOGICAL AND BIOCHEMICAL STATUS OF THE BLOOD OF LAMBS OF WEST SIBERIAN MEAT BREED
LAND-USE/LAND COVER CLASSIFICATION ANALYSIS USING PIXEL BASED METHODS: CASE OF TAROM CITY, IRAN
ANALYSIS OF RUSSIAN MIGRATION FLOWS WITH SOCIO-ECONOMIC DEVELOPMENT CONSIDERATION
THE INFLUENCE OF MUGHAL ARCHITECTURE ON MASJID ZAHIR: CASE STUDY ON FIVE RURAL MOSQUES IN KEDAH, MALAYSIA
AN APPRAISAL OF POLICIES OF LAND ACQUISITION AND RESETTLEMENT OF INVOLUNTARY DISPLACED PEOPLE IN SHANGHAI (1978-2005)
EFFICIENCY IMPROVEMENT ON FUNCTIONING AND DEVELOPMENT OF PASSENGER MOTOR TRANSPORT SERVICES IN URBAN AGGLOMERATIONS
A COMPETENCY-BASED SUCCESSION PLANNING MODEL WITH RESPECT TO ADJUSTING ROLE OF ORGANIZATIONAL CULTURE IN TELECOMMUNICATION INFRASTRUCTURE COMPANY OF IRAN (TICIR)
RESOURCE-SAVING WASTE-FREE PRODUCTION AS AN INNOVATIVE METHOD OF IMPROVING ENTERPRISES’ BUSINESS PERFORMANCE IN THE MEAT PRODUCTION
PERSONALITY AND POST-PURCHASE CONSUMER REGRET EXPERIENCED AFTER IMPULSE BUYING: A CROSS-THEORETICAL APPROACH WITH INDIVIDUAL DIFFERENCES MODERATOR
DETERMINATION OF SUB-SOIL SHEAR WAVE
VELOCITY (𝑽𝑺𝟑𝟎
) IN LAYERED SOIL WITH FEM IN RELATION TO APPROXIMATED AND ANALYTICAL RESULTS
SOLVING FUZZY FRACTIONAL DIFFERENTIAL EQUATIONS BY ADOMIAN DECOMPOSITION METHOD USED IN OPTIMAL CONTROL THEORY
AN EDUCATIONAL EFFECTIVENESS MODEL DEVELOPMENT BASED ON HUMAN RESOURCE STRATEGIES BY GROUNDED THEORY IN DISTRICT 7 OF IRANIAN GAS TRANSMISSION COMPANY
EFFECTS OF SEED PLANTS ON QUANTITATIVE AND QUALITATIVE YIELDS OF VETCH AND BARLEY IN DIFFERENT MIXING RATIOS
International Transaction Journal of Engineering, Management, & Applied Sciences & Technologies
http://TuEngr.com
International Editorial Board Editor-in-Chief Ahmad Sanusi Hassan, PhD Professor Universiti Sains Malaysia, MALAYSIA
Executive Editor Boonsap Witchayangkoon, PhD Associate Professor Thammasat University, THAILAND
Editorial Board: Assoc. Prof. Dr. Mohamed Gadi (University of Nottingham, UNITED KINGDOM) Professor Dr.Hitoshi YAMADA (Yokohama National University, JAPAN) Professor Dr. Chuen-Sheng Cheng (Yuan Ze University, TAIWAN ) Professor Dr.Mikio SATOMURA (Shizuoka University, JAPAN) Professor Dr.Chuen-Sheng Cheng (Yuan Ze University, TAIWAN) Emeritus Professor Dr.Mike Jenks (Oxford Brookes University, UNITED KINGDOM ) Professor Dr.I Nyoman Pujawan (Sepuluh Nopember Institute of Technology, INDONESIA) Professor Dr.Toshio YOSHII (EHIME University, JAPAN) Professor Dr.Neven Duić (University of Zagreb, CROATIA) Professor Dr.Dewan Muhammad Nuruzzaman (University Malaysia Pahang MALAYSIA) Professor Dr.Masato SAITOH (Saitama University, JAPAN)
Scientific and Technical Committee & Editorial Review Board on Engineering, Technologies and Applied Sciences: Associate Prof. Dr. Paulo Cesar Lima Segantine (University of São Paulo, BRASIL) Associate Prof. Dr. Kurt B. Wurm (New Mexico State University, USA ) Associate Prof. Dr. Truong V.B.Giang (Vietnam National University, Hanoi, VIETNAM) Associate Prof. Dr. Fatemeh Khozaei (Islamic Azad University Kerman Branch, IRAN) Assistant Prof.Dr. Zoe D. Ziaka (International Hellenic University, GREECE) Associate Prof.Dr. Junji SHIKATA (Yokohama National University, JAPAN) Assistant Prof.Dr. Akeel Noori Abdul Hameed (University of Sharjah, UAE) Assistant Prof.Dr. Rohit Srivastava (Indian Institute of Technology Bombay, INDIA) Assistant Prof. Dr.Muhammad Yar Khan (COMSATS University, Pakistan) Assistant Prof. Dr. David Kuria (Kimathi University College of Technology, KENYA ) Dr. Mazran bin Ismail (Universiti Sains Malaysia, MALAYSIA ) Dr. Salahaddin Yasin Baper (Salahaddin University - Hawler, IRAQ ) Dr. Foong Swee Yeok (Universiti Sains Malaysia, MALAYSIA) Dr.Azusa FUKUSHIMA (Kobe Gakuin University, JAPAN) Dr.Yasser Arab (Ittihad Private University, SYRIA).
2019 International Transaction Journal of Engineering, Management, & Applied Sciences & Technologies.

i
:: International Transaction Journal of Engineering, Management, & Applied Sciences & Technologies
Volume 10 Issue 12 (2019) ISSN 2228-9860 http://TuEngr.com eISSN 1906-9642
FEATURE PEER-REVIEWED ARTICLES READINESS FOR ORGANIZATIONAL CHANGE THROUGH DYNAMIC CAPABILITIES AND ROUTINIZATION: A STUDY OF THREE INDUSTRIAL ESTATES
10A12A
WATER PERMEABILITY OF CONCRETE MIXING ASH AND CRUSHED DUST 10A12B
A STUDY OF URBAN DESIGN ELEMENTS IN STRUCTURED VILLAGE AT GELUGOR, PENANG
10A12C
AN ANALYSIS OF RESEARCH AREAS IN PRECISION AGRICULTURE 10A12D AN INVESTIGATION ON STAKEHOLDERS' PERCEPTION REGARDING EFFECTIVENESS OF SOCIAL MEDIA IN PAKISTAN'S HIGHER EDUCATION
10A12E
INFLUENCES OF THE IODINE-POLYMER PREPARATION "MONCLAVIT-1" ON THE HORMONAL, MORPHOLOGICAL AND BIOCHEMICAL STATUS OF THE BLOOD OF LAMBS OF WEST SIBERIAN MEAT BREED
10A12F
LAND-USE/LAND COVER CLASSIFICATION ANALYSIS USING PIXEL BASED METHODS: CASE OF TAROM CITY, IRAN 10A12G
ANALYSIS OF RUSSIAN MIGRATION FLOWS WITH SOCIO-ECONOMIC DEVELOPMENT CONSIDERATION 10A12H
THE INFLUENCE OF MUGHAL ARCHITECTURE ON MASJID ZAHIR: CASE STUDY ON FIVE RURAL MOSQUES IN KEDAH, MALAYSIA 10A12I
AN APPRAISAL OF POLICIES OF LAND ACQUISITION AND RESETTLEMENT OF INVOLUNTARY DISPLACED PEOPLE IN SHANGHAI (1978-2005)
10A12J
EFFICIENCY IMPROVEMENT ON FUNCTIONING AND DEVELOPMENT OF PASSENGER MOTOR TRANSPORT SERVICES IN URBAN AGGLOMERATIONS
10A12K
A COMPETENCY-BASED SUCCESSION PLANNING MODEL WITH RESPECT TO ADJUSTING ROLE OF ORGANIZATIONAL CULTURE IN TELECOMMUNICATION INFRASTRUCTURE COMPANY OF IRAN (TICIR)
10A12L
©2019 International Transaction Journal of Engineering, Management, & Applied Sciences & Technologies.

ii
RESOURCE-SAVING WASTE-FREE PRODUCTION AS AN INNOVATIVE METHOD OF IMPROVING ENTERPRISES’ BUSINESS PERFORMANCE IN THE MEAT PRODUCTION
10A12M
PERSONALITY AND POST-PURCHASE CONSUMER REGRET EXPERIENCED AFTER IMPULSE BUYING: A CROSS-THEORETICAL APPROACH WITH INDIVIDUAL DIFFERENCES MODERATOR
10A12N
DETERMINATION OF SUB-SOIL SHEAR WAVE VELOCITY (𝑽𝑽𝑺𝑺𝟑𝟑𝟑𝟑
) IN LAYERED SOIL WITH FEM IN RELATION TO APPROXIMATED AND ANALYTICAL RESULTS
10A12O
Solving Fuzzy Fractional Differential Equations by Adomian Decomposition Method Used In Optimal Control Theory
10A12P
AN EDUCATIONAL EFFECTIVENESS MODEL DEVELOPMENT BASED ON HUMAN RESOURCE STRATEGIES BY GROUNDED THEORY IN DISTRICT 7 OF IRANIAN GAS TRANSMISSION COMPANY
10A12Q
EFFECTS OF SEED PLANTS ON QUANTITATIVE AND QUALITATIVE YIELDS OF VETCH AND BARLEY IN DIFFERENT MIXING RATIOS 10A12R
Contacts: Professor Dr.Ahmad Sanusi Hassan (Editor-in-Chief), School of Housing, Building and Planning, UNIVERSITI SAINS MALAYSIA, 11800 Minden, Penang, MALAYSIA. Tel: +60-4-653-2835 Fax: +60-4-657 6523, [email protected], [email protected] Associate Professor Dr.Boonsap Witchayangkoon (Executive Editor), Faculty of Engineering, THAMMASAT UNIVERSITY, Klong-Luang, Pathumtani, 12120, THAILAND. Tel: +66-2-5643005 Ext 3101. Fax: +66-2-5643022 [email protected]
Managing Office TUENGR Group 88/244 Moo 3, Moo Baan Saransiri, Klong#2, KlongLuang, Pathumtani, 12120, THAILAND. Tel/WhatsApp: +66-995535450.
Postal Paid in MALAYSIA/THAILAND.
*Corresponding author (Abdul Salam Khuhro). E-mail: [email protected] ©2019 International Transaction Journal of
Engineering, Management, & Applied Sciences & Technologies. Volume 10 No.11 ISSN 2228-9860 eISSN 1906-9642 CODEN:
ITJEA8 Paper ID:10A12A http://TUENGR.COM/V10A/10A12A.pdf DOI: 10.14456/ITJEMAST.2019.150 1
International Transaction Journal of Engineering, Management, & Applied Sciences & Technologies
http://TuEngr.com
PAPER ID: 10A12A
READINESS FOR ORGANIZATIONAL CHANGE THROUGH
DYNAMIC CAPABILITIES AND ROUTINIZATION: A STUDY
OF THREE INDUSTRIAL ESTATES
Abdul Salam Khuhro a*
, Asad Afzal Humayon a
, Muhammad Sajjad a
,
Rafique Ahmed Khuhro b, Muhammad Irfan
a
a
COMSATS University Islamabad, Vehari Campus, PAKISTAN. b University of Haripur, PAKISTAN
A R T I C L E I N F O
A B S T R A C T Article history:
Received 24 May 2019
Received in revised form 19
July 2019 Accepted 26 July 2019
Available online 01 August
2019
Keywords: China Pakistan Economic Corridor (CPEC); Strategic Sense Making Capacity; Timely Decision Making
Capacity; Change Implementation Capacity; Structural Equation Modeling; AMOS.
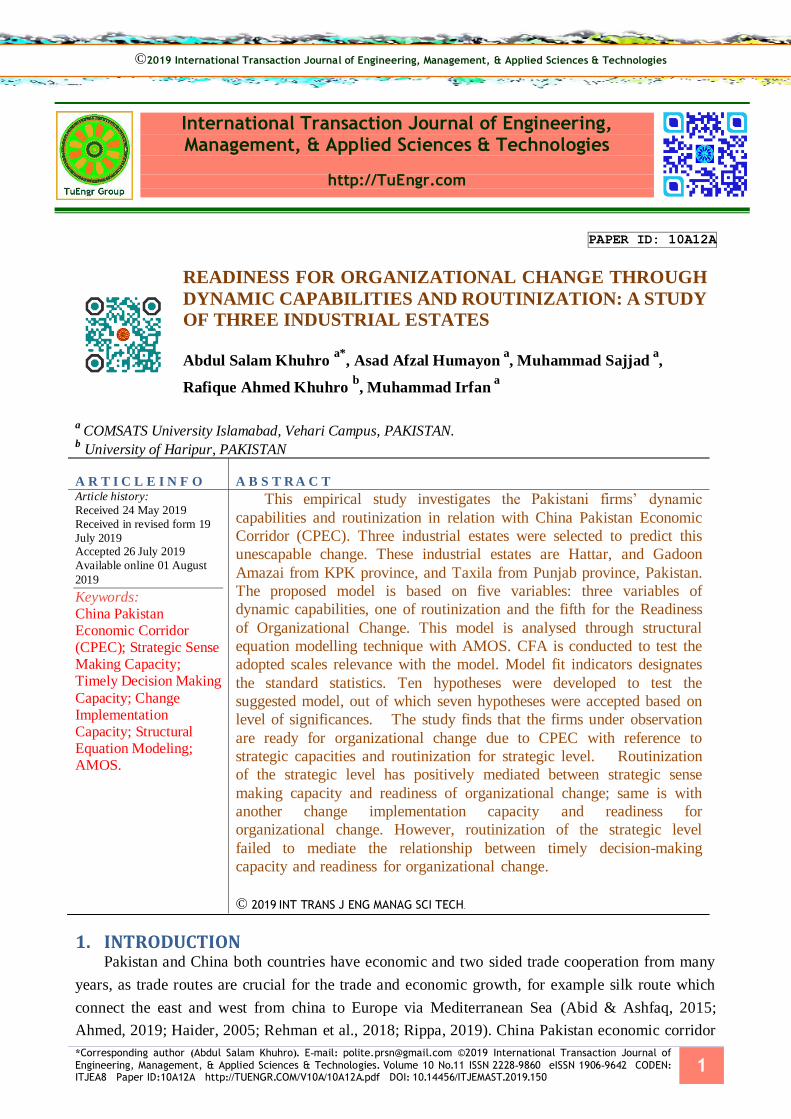
This empirical study investigates the Pakistani firms’ dynamic
capabilities and routinization in relation with China Pakistan Economic
Corridor (CPEC). Three industrial estates were selected to predict this
unescapable change. These industrial estates are Hattar, and Gadoon
Amazai from KPK province, and Taxila from Punjab province, Pakistan.
The proposed model is based on five variables: three variables of
dynamic capabilities, one of routinization and the fifth for the Readiness
of Organizational Change. This model is analysed through structural
equation modelling technique with AMOS. CFA is conducted to test the
adopted scales relevance with the model. Model fit indicators designates
the standard statistics. Ten hypotheses were developed to test the
suggested model, out of which seven hypotheses were accepted based on
level of significances. The study finds that the firms under observation
are ready for organizational change due to CPEC with reference to
strategic capacities and routinization for strategic level. Routinization
of the strategic level has positively mediated between strategic sense
making capacity and readiness of organizational change; same is with
another change implementation capacity and readiness for
organizational change. However, routinization of the strategic level
failed to mediate the relationship between timely decision-making
capacity and readiness for organizational change.
© 2019 INT TRANS J ENG MANAG SCI TECH.
1. INTRODUCTION Pakistan and China both countries have economic and two sided trade cooperation from many
years, as trade routes are crucial for the trade and economic growth, for example silk route which
connect the east and west from china to Europe via Mediterranean Sea (Abid & Ashfaq, 2015;
Ahmed, 2019; Haider, 2005; Rehman et al., 2018; Rippa, 2019). China Pakistan economic corridor
©2019 International Transaction Journal of Engineering, Management, & Applied Sciences & Technologies

2 Abdul Salam Khuhro, Asad Afzal Humayon, Muhammad Sajjad, Rafique Ahmed Khuhro, Muhammad Irfan
(CPEC) is being considered a game changer for Asia, Middle East and Europe including Pakistan.
For Pakistan, it is a collection of projects which are under construction with estimated cost of $46
billion. It expands the Pakistani infrastructure through road, rail, pipelines and air transportation to
enhance the economic links between Pakistan and China. It will also enhance the free exchange of
growth, regional knowledge sharing, cultural activities, people to people contact and understanding
via academic(Ministry of Planning, 2015). Pakistani officials expect 700,000 direct jobs between
2015 to 2030 from the result of this project and two to two point five percent increases in Pakistan’s
economic growth annually (Sial, 2014).
The study of dynamic capabilities adapts the new environmental requirements and to change the
operations that has been taken in the debate on premeditated management (Teece, 2018; Di Stefano et
al., 2010; Helfat & Peteraf, 2003; Zollo & Winter, 2002; Teece et al., 1997). Another consideration is
that the ability of firm to build and integrate the external and internal competences in order to facing
the rapid change in environments of the firms (Leonard‐Barton, 1992). A growing numbers of
scholars in the last decade have considered the dynamic capabilities as: “value creation, core firm
strategy and competitive advantage (Lin et al., 2016; Eisenhardt & Martin, 2000; Helfat & Martin,
2015; Teece, 2007; Teece et al., 1997; Wohlgemuth & Wenzel, 2016)”.
It is the fact that Chinese firms are more efficient than Pakistani firms, either at strategic or
operational level (Di Stefano et al., 2010; Ahmed Sheikh & Wang, 2011). This study is to analyse the
Pakistani firms which are the first major touch to CPEC. Are they ready for future change or not? The
future change predicts via dynamic capabilities and routinization.
2. THEORETICAL FRAMEWORK AND HYPOTHESES
2.1 STRATEGIC SENSE MAKING CAPACITY Strategic Sense Making Capacity (SSMC) is defined as “it is a process which consist of scanning,
action and then interpretation ” (Thomas et al., 1993). Originally the authors introduced the concept
of SSMC, established the linkage of these phases with sense making and to the performance of firms.
Daft & Weick (1984) discussed about the three phases of learning, interpretation and the scanning
which are connected via a responsive loop. The scanning, action and interpretation are not merely
involved with the outer environment but it also considered the experiences which were enhanced via
action. The feedback relationship exist in-between the action and interpretation which is also
dependent on an interested question that what come first either sense making or the action.
Gioia & Chittipeddi (1991) suggested that change in strategy for a firm was possible only when
sense making was interpreted as an initiator of action. Therefore, sense making is seemed to be a
process of cognition, which take the information from internal learning and the external environment
with purposeful action which ultimately lead to change. Also, their work introduced the concept of
sense making which links the collective and individual level of cognition. Even though it cannot be
said straightway that the solely domain of sense making is the collective or an individual action. It
proposed that the intervention is required to relocate the initial sense making from an individual to a
smaller and then to a larger network. Through this technique firm is capable of to implement the
change. This perspective is focusing on that how inauguration of a purposeful action is taking place
and why firms participate in the initial phase of strategic sense making which takes place in the

*Corresponding author (Abdul Salam Khuhro). E-mail: [email protected] ©2019 International Transaction Journal of
Engineering, Management, & Applied Sciences & Technologies. Volume 10 No.11 ISSN 2228-9860 eISSN 1906-9642 CODEN:
ITJEA8 Paper ID:10A12A http://TUENGR.COM/V10A/10A12A.pdf DOI: 10.14456/ITJEMAST.2019.150 3
beginning. Sense making is a process in which organizations acts and interprets on information which
consists on its environment (Pandza & Thorpe, 2009; Weick, 1995).
In the changing environment it is better to respond and to deploy the resources to enhance the
ability of firms to configure in an effective way (Eisenhardt & Martin, 2000). Ravasi and Schultz
(2006) analysed firm concentrated with sense making process as: It is the re-action to the exterior
change which implied individual’s engagement with the sense making to handle with the
uncertainties and to resolve the causal uncertainty.
2.2 TIMELY DECISION MAKING CAPACITY (TDMC) Timely decision making capacity’ (TDMC) is defined as “It is the phenomenon which readily
formulate, assess and select the strategic orientation for timely adjustment with the environment
fluctuations” (Sharfman & Dean, 1997). For making decisions which should be aligned with the
changing environment, organizations must build suitable and effective information system. This
system may be comprised of tangible or intangible stuff, but it should assist the information
technology for timely decision making. In fact, information technology provide an effective and
efficient platform for making right and adequate decisions (Aydiner et al., 2019; Sher & Lee, 2004).
In the strategic process of decision making, firms should also quickly deal with different
dilemmas to quickly adopt the remedies for the unsatisfactory situations. Eisenhardt (1989a, 1989b)
conducted the research about the decision making speed and the availability of alternate decisions. It
was found the results were positively related with the decision speed while the availability of
alternative decisions boost the cognitive processing. It was also found that the presence of
experienced analysts provided confidence to top management for speeding up the decisions and act
quickly (Cvitanovic et al., 2016; Eisenhardt, 1989a, 1989b).
Timely decisions or faster decisions are made by the experienced boards rather than the
inexperienced because the formers know a little bit more about their organizations and industries and
can more quickly focus on the strategic issues because of their experience. Time is a precious element
in which organizations regulate their decision making process. In practice, some organizations take
too much time and others take very few time for timely decision making (Ariely & Zakay, 2001). But
ultimately those firms have the advantage who consume less or moderate time for decision making.
2.3 CHANGE IMPLEMENTATION CAPACITY Change Implementation Capacity’ (CIC) is defined as “it is the capability to coordinate and
making strategic decisions for bringing change in the firm. This activity involved various
organizational and managerial processes which depends on the required tasks and objectives to be
achieved” (Harreld et al., 2007; Helfat et al., 2009).
Change implementation capacity is front of the managerial as well as academic environment
(Pettigrew, Woodman, & Cameron, 2001). The capacity to implement the change has been increased
and provoked the thoughtfulness of management researchers as a number of articles has grown and
published dramatically in recent years (Buchanan et al., 1999; Schreyögg & Noss, 2000). Though
wider array of confusing, conflicting theories and approaches happen in the literature for change
management and its implementation (Burnes, 2004; Cummings & Worley, 2009; Thames & Webster,
2009).

4 Abdul Salam Khuhro, Asad Afzal Humayon, Muhammad Sajjad, Rafique Ahmed Khuhro, Muhammad Irfan
Doyle (2002) suggested that the current practice breaks the unrestricted assumptions regarding
the organizational change with respect to its nature. Today organizations face the complexity,
increase the stride and unpredictable about the change (Kerber & Buono, 2005; Miller, 2004). The
diverse nature of internal or external factors prompted for change and force the organizations to
change its way of doing day to day operations, structure, size or the shapes (Balogun & Hailey, 2008;
Luecke, 2003). In order to succeed and survive in present contemporary and highly competitive
business environment the change implementation capacity is crucial for the successful management
(Lawrence et al., 2006).
2.4 ROUTINIZATION OF THE STRATEGIC LEVEL Zollo and Winter (2002) defined the Routinization of the Strategic Level (RSL) as “The high
level collection of routine/routines that utilizes the input flows with its implementation together. It
convenes upon organizations management with certain set of options or decisions for obtaining
significant outputs of a specific type”. Wohlgemuth and Wenzel (2016) suggested that for strategic
level routinization has a significant and positive effect on readiness for organizational change and for
dynamic capabilities which supports hypotheses of H4, H5 and H6. Zollo and Winter (2002)
proposed in the literature that these routines are the stable patterns at the strategic level. The literature
of routines reveals that the concept of routines previously fits into the theories of economic change
and the theories of organizational change (Becker, 2004; Wohlgemuth & Wenzel, 2016).
2.5 READINESS FOR ORGANIZATIONAL CHANGE Lewin (1947) explained Readiness for Organizational Change’ (ROC) as “an individual’s
progression through change with the three stages of unfreezing, moving, and refreezing”. Via this
pioneer idea of Lewin researchers have set to further elaborate the organizational change and
contribute in the literature through these stages. Holt et al. (2007) proposed that: change is appropriate
for the organization, and it is also beneficial to organizational members. Armenakis et al. (1993)
proposed “that readiness was a precursor of resistance and adoption behaviours”. The readiness
concept have been initially introduced by Jacobson (1957). The groundwork for readiness as it is a
unique construct which embedded with the different theoretical models that describes the change
(Van de Ven & Poole, 1995).
Figure 1: Hypothesized research model.

*Corresponding author (Abdul Salam Khuhro). E-mail: [email protected] ©2019 International Transaction Journal of
Engineering, Management, & Applied Sciences & Technologies. Volume 10 No.11 ISSN 2228-9860 eISSN 1906-9642 CODEN:
ITJEA8 Paper ID:10A12A http://TUENGR.COM/V10A/10A12A.pdf DOI: 10.14456/ITJEMAST.2019.150 5
2.6 HYPOTHESES OF THIS STUDY
Hypothesis is the conjecture or an intelligent guess that usually involved in proposing a
relationship among independent and dependent variables. It is a precise and testable statement that a
researcher predicts for the outcome of the study (Mcleoad, 2018).
Following are the hypotheses of the study
H1a: Strategic Sense Making Capacity positively effects the Readiness for Organizational Change
H1b: Strategic Sense Making Capacity positively effects the Routinization of the Strategic Level
H2a: Timely Decision Making Capacity has positively affects the Readiness for Organizational
Change
H2b: Timely Decision Making Capacity has positively effects the Routinization of the Strategic
Level
H3a: Change Implementation Capacity has positively effects the Readiness for Organizational
Change
H3b: Change Implementation Capacity has positively effects the Routinization of the Strategic
Level
H4: Routinization of the Strategic Level has positively effects the Readiness for Organizational Change
H5: Routinization of the Strategic Level positively mediates between Strategic Sense Making
Capacity and Readiness for Organizational Change
H6: Routinization of the Strategic Level positively mediates between Timely Decision Making
Capacity and Readiness for Organizational Change
H7: Routinization of the Strategic Level positively mediates between Change Implementation
Capacity and Readiness for Organizational Change
3. METHOD
The data for this study was accessed from Pakistani firms. To investigate and find out the
readiness for organizational change through routinization and dynamic capabilities of the strategic
level in the perspective of CPEC, three industrial estates were approached through a survey from the
Gadoon Amazai, Hattar and the Taxila Industrial Estates. From 200 distributed questionnaires,
researchers received 170 filled questionnaires. Out of these 170 responses, 2 questionnaires were
discarded as found ineligible. Hence, the total response rate is 84%. The relationships among
variables or their effects are measured and tested by structural regression modelling using SPSS and
its extension of AMOS.
Convenience sampling was employed and self-administered questionnaires had been used as an
instrument of the study. The questionnaires includes the demographical and proposed model
constructs questions. All are close ended questions however respondents are given open ended area at
the end to write anything they fell about the readiness for change due to CPEC.
Questionnaire consisted of three parts, one is descriptive in nature, second is Likert scale

6 Abdul Salam Khuhro, Asad Afzal Humayon, Muhammad Sajjad, Rafique Ahmed Khuhro, Muhammad Irfan
questions which measure the constructs of the study while third is open ended section for respondents
to give their own opinion on readiness for change due to CPEC. From first part, researchers observed
the profile of the respondents, from second part the model of the study was tested while the third part
was used for the future insight recommendations. The scale is adopted with minor changes as per
environmental and cultural aspects. The construct are Strategic Sense-Making Capacity (SSMC),
Timely Decision-Making Capacity (TDMC), Change Implementation Capacity (CIC) from (Li &
Liu, 2014); Routinization of the Strategic Level RSL from (Wohlgemuth & Wenzel, 2016) and
Readiness for Organizational Change (ROC) from (Cunningham et al., 2002).
4. DATA ANALYSIS AND ITS RESULTS
4.1 CONFIRMATORY FACTOR ANALYSIS (CFA) Exploratory factor analysis was not applies as the scales used in this study are already used in
other research works and have been found reliable in measuring the targeted constructs. Hence,
confirmatory factor analysis (CFA) was preceded (Tabachnick & Fidell, 1996; 2007). There are five
variables presented in the measurement model, SSMC, TDMC, CIC, RSL and Readiness for
Organizational Change due to CPEC. In different studies researchers have been used the various fit
indices for reporting the SEM i.e., structural equation modeling but currently researcher are using the
CFI, CMIN, TLI and RMSEA as suggested by Schreiber et al. (2006). The fit indexes threshold is
like this: CMIN/df (< 0.08 good), TLI (> 0.90 good), CFI (> 0.90 good) and RMSEA (< 3 good).
4.2 MEASUREMENT MODEL FOR CFA In this study the measurement model consists of five variables which are: SSMC, TDMC, CIC,
RSL and ROC. Thus, the CFA was measured altogether and the fit indices were spotted as per
standard. Over all model of the study revealed the good fit indices as shown below in Table 1.
Table 1: Fit indices of Confirmatory Factor Analysis (CFA) Study Model RMSEA TLI CFI CMIN/df
This study model consists of five indicators of SSMC, three
of TDMC, four of CIC, two of RSL and six of ROC 0.051 0.903 0.910 2.083
Table 2: Standard Regression Weights: Factor loading
Estimate Factor loading Estimate
SSMC5 SSMC .597 CIC2 CIC .881
SSMC4 SSMC .803 CIC1 CIC .874
SSMC3 SSMC .744 RSL2 RSL .726
SSMC2 SSMC .840 RSL1 RSL .767
SSMC1 SSMC .841 ROC6 ROC .810
TDMC3 TDMC .558 ROC5 ROC .895
TDMC2 TDMC .796 ROC4 ROC .850
TDMC1 TDMC .810 ROC3 ROC .780
CIC4 CIC .691 ROC2 ROC .650
CIC3 CIC .689 ROC1 ROC .650
Factor loadings of all items, factors and constructs were checked thoroughly. Kline (2011)
suggested that the factor loading for standardized coefficients must be higher than > 0.50. By
following this suggestion, the study has found factor loading of all items more than .05 except the
TDMC 4, which was already removed and CFA was conducted again to see the results. The
*Corresponding author (Abdul Salam Khuhro). E-mail: [email protected] ©2019 International Transaction Journal of
Engineering, Management, & Applied Sciences & Technologies. Volume 10 No.11 ISSN 2228-9860 eISSN 1906-9642 CODEN:
ITJEA8 Paper ID:10A12A http://TUENGR.COM/V10A/10A12A.pdf DOI: 10.14456/ITJEMAST.2019.150 7
standardized factor loading or factor weights of the model is presented in Table 2.
4.3 RELIABILITY AND VALIDITY OF THE MEASUREMENT MODEL Reliability and validity scales were assessed after conducting the confirmatory factor analysis.
Researcher has used the composite reliability (CR), similar to Cronbach's , and has got the standard
values of the constructs which is more than 0.7. Convergent validity is assessed via average variance
extracted (AVE), the standard value would be greater than 0.5. All the constructs have convergent
validity in acceptable range. The discriminant validity of the model can be checked via the
“maximum squared shared variance” denoted by (MSV). The discriminant validity occurs whenever
the AVE’s value is higher than squared shared variance i-e, MSV. In this case all constructs have
standard discriminant validities. The complete picture of results is presented in Table 3.
Table 3: Reliability and validity of the model Variable CR AVE
(Convergent Validity)
MSV
(Discriminant Validity)
RSL 0.716 0.558 0.481
SSMC 0.851 0.655 0.407
TDMC 0.770 0.534 0.311
CIC 0.867 0.623 0.311
ROC 0.901 0.606 0.581
4.4 HYPOTHESES TESTING THROUGH STRUCTURAL REGRESSION MODEL To test the hypotheses in multiple regression analysis majority of the previous studies used the
structural equation modeling (SEM) and opted only for Confirmatory Factor Analysis (CFA) but this
study used the structural regression (SR) technique to test all hypothesis while using SEM. As per
Preacher & Hayes (2008), using SR models in the SEM has the advantage to test all the hypotheses
simultaneously while the latter can only measure the hypotheses separately.
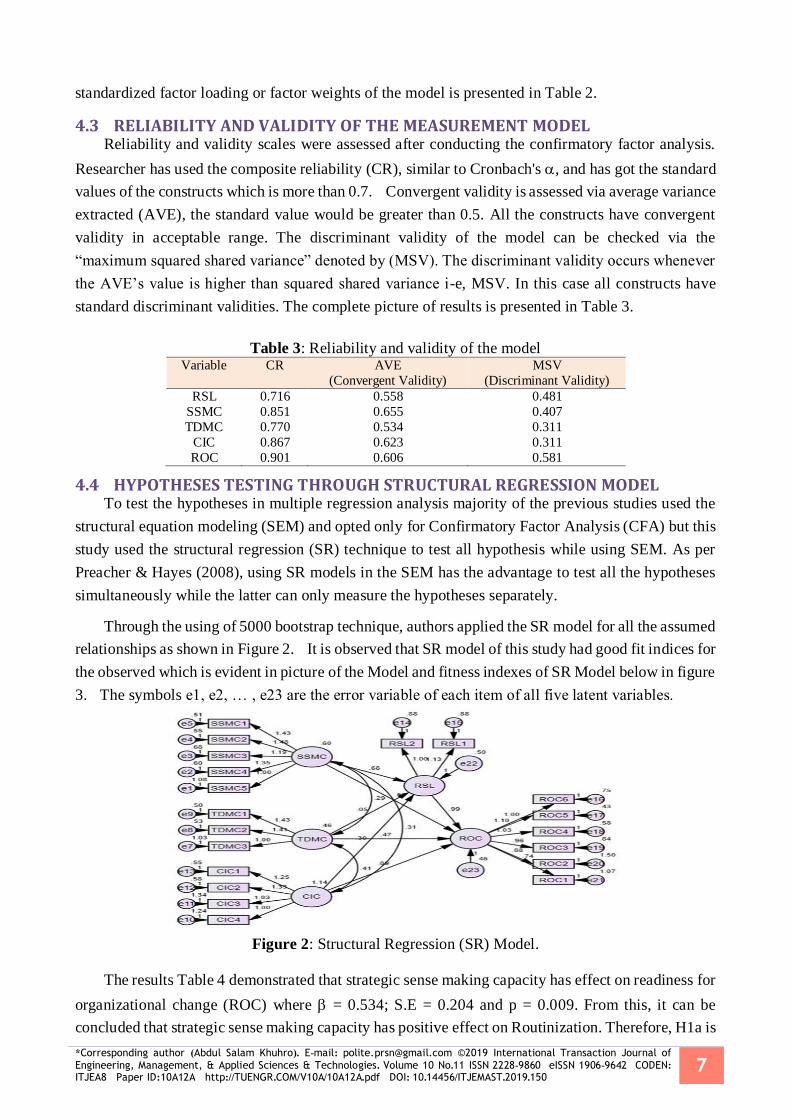
Through the using of 5000 bootstrap technique, authors applied the SR model for all the assumed
relationships as shown in Figure 2. It is observed that SR model of this study had good fit indices for
the observed which is evident in picture of the Model and fitness indexes of SR Model below in figure
3. The symbols e1, e2, … , e23 are the error variable of each item of all five latent variables.
Figure 2: Structural Regression (SR) Model.
The results Table 4 demonstrated that strategic sense making capacity has effect on readiness for
organizational change (ROC) where = 0.534; S.E = 0.204 and p = 0.009. From this, it can be
concluded that strategic sense making capacity has positive effect on Routinization. Therefore, H1a is

8 Abdul Salam Khuhro, Asad Afzal Humayon, Muhammad Sajjad, Rafique Ahmed Khuhro, Muhammad Irfan
supported that Strategic Sense Making Capacity has positive effect on Readiness for Organizational
Change. For routinization of the Strategic Level (RSL) where = 0.683; S.E = 0.155 and p = <0.001,
H1b is supported that Strategic Sense Making Capacity has positive effect on Routinization of the
Strategic Level. The results in Table 4 also explicitly stated that timely decision making capacity
has positive effect on readiness for organizational change for ROC where = 0.472; S.E = 0.206 and
p = 0.022. It has also positive effect for RSL where = 0.046; S.E = 0.183 and p = 0.803. From this,
it can be concluded that H2a is supported while H2b is not supported. Results also disclosed that
Change Implementation Capacity has positive effect on readiness for organizational change (ROC)
where = 0.086; S.E = 0.117 and p = 0.464. While for Routinization of the Strategic Level change
(RSL) = 0.302; S.E = 0.101 and p = 0.003. Therefore, H3a and H3b both are supported. Further, the
mediating variable Routinization of the Strategic Level change has positive effect on dependent
variable readiness for organizational change where = 0.995; S.E = 0.201and p = 0.000. Therefore,
H4 is also supported and it can be said that Routinization of the Strategic Level has positive effect on
Readiness for Organizational Change due to CPEC.
Table 4: Results of Structural Regression (SR) Model RSL ROC
Variables P.E S.E p-value P.E S.E p-value
SSMC .683 .155 <0.001 .534 .204 0.009
TDMC .046 .183 0.803 .472 .206 0.022
CIC .302 .101 0.003 .086 .117 0.464
RSL .995 .201 <0.001 R² 0.492 0.675
Note: P.E = Standardized Point of Estimate (β), S.E = Standard Error, p-value = Probability or significance level, SSMC= Strategic Sense Making Capacity, TDMC = Timely Decision-Making Capacity,
CIC= Change Implementation Capacity, RSL= Routinization of the Strategic Level,
ROC = Readiness for Organizational Change
4.5 ROUTINIZATION OF THE STRATEGIC LEVEL AS AN UNDERLYING MEDIATION TOOL BETWEEN INDEPENDENT VARIABLES (SSMC, TDMC AND CIC) AND DEPENDENT VARIABLE (READINESS FOR ORGANIZATIONAL CHANGE)
Mediation mechanism was tested through AMOS software. It was hypothesized that the
Routinization of the Strategic Level mediates between the independent variables (SSMC, TDMC and
CIC) and dependent variable. Readiness for Organizational Change was tested with 5000 bootstrap
samples. This is the appropriate methodology for calculating the explicit indirect effect of each
mediator separately with the help of AMOS. Table 5 shows the results of analysis of mediation, using
5000 bootstraps, for measuring the indirect effects of strategic sense making capacity (SSMC), t imely
decision making capacity (TDMC) and Change Implementation Capacity (CIC) on readiness for
organizational change via Routinization of the Strategic Level.
Hypothesis (H5) states that Routinization of the Strategic Level positively mediates between
Strategic Sense Making Capacity and Readiness for Organizational Change. For this analysis, authors
used SR model with 5000 bootstrapping’ technique as suggested by (Preacher & Hayes, 2008). In
table 5, the results showed that the Strategic Sense Making Capacity indirectly effect the Readiness
for Organizational Change. This relationship is significant and support the hypothes
S.E = 0.347; p = 0.001) which defines that Routinization of the Strategic Level is playing as a
mediating role between Strategic Sense Making Capacity and Readiness for Organizational Change.
*Corresponding author (Abdul Salam Khuhro). E-mail: [email protected] ©2019 International Transaction Journal of
Engineering, Management, & Applied Sciences & Technologies. Volume 10 No.11 ISSN 2228-9860 eISSN 1906-9642 CODEN:
ITJEA8 Paper ID:10A12A http://TUENGR.COM/V10A/10A12A.pdf DOI: 10.14456/ITJEMAST.2019.150 9
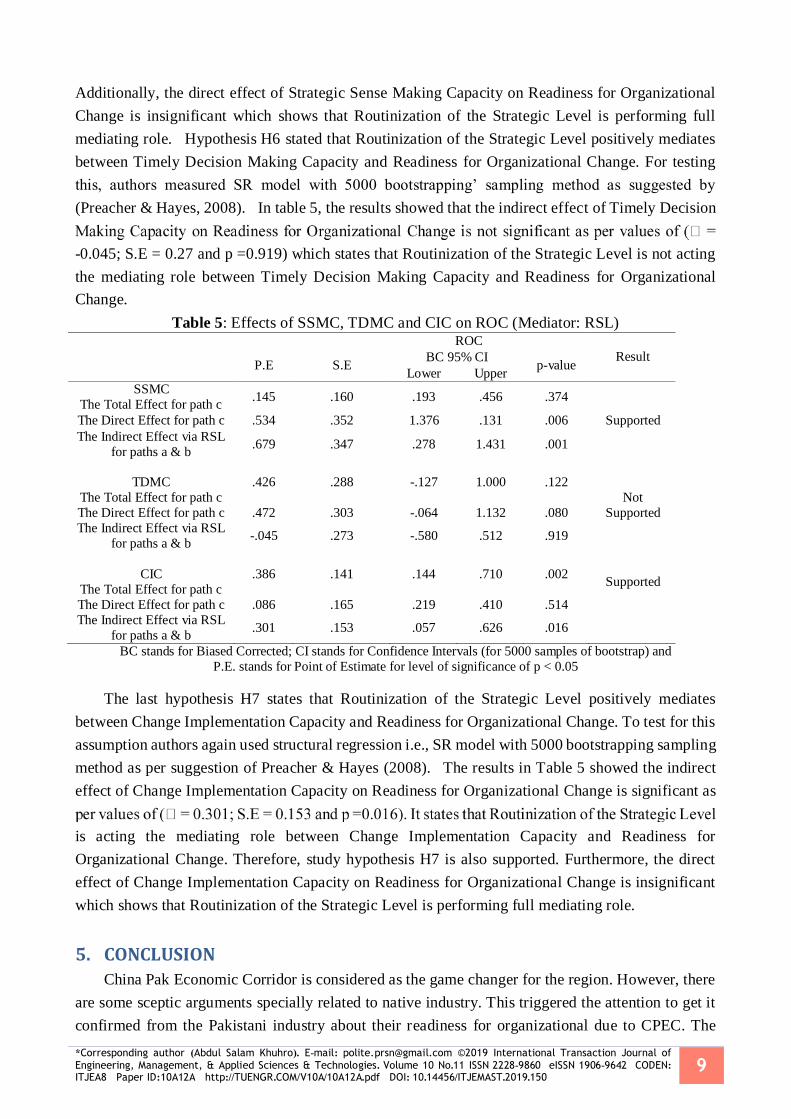
Additionally, the direct effect of Strategic Sense Making Capacity on Readiness for Organizational
Change is insignificant which shows that Routinization of the Strategic Level is performing full
mediating role. Hypothesis H6 stated that Routinization of the Strategic Level positively mediates
between Timely Decision Making Capacity and Readiness for Organizational Change. For testing
this, authors measured SR model with 5000 bootstrapping’ sampling method as suggested by
(Preacher & Hayes, 2008). In table 5, the results showed that the indirect effect of Timely Decision
-0.045; S.E = 0.27 and p =0.919) which states that Routinization of the Strategic Level is not acting
the mediating role between Timely Decision Making Capacity and Readiness for Organizational
Change.
Table 5: Effects of SSMC, TDMC and CIC on ROC (Mediator: RSL)
ROC
Result P.E S.E
BC 95% CI p-value
Lower Upper
SSMC
The Total Effect for path c .145 .160 .193 .456 .374
Supported The Direct Effect for path c .534 .352 1.376 .131 .006
The Indirect Effect via RSL
for paths a & b .679 .347 .278 1.431 .001
TDMC
The Total Effect for path c
.426 .288 -.127 1.000 .122
Not
Supported The Direct Effect for path c .472 .303 -.064 1.132 .080
The Indirect Effect via RSL
for paths a & b -.045 .273 -.580 .512 .919
CIC
The Total Effect for path c
.386 .141 .144 .710 .002 Supported
The Direct Effect for path c .086 .165 .219 .410 .514
The Indirect Effect via RSL
for paths a & b .301 .153 .057 .626 .016
BC stands for Biased Corrected; CI stands for Confidence Intervals (for 5000 samples of bootstrap) and
P.E. stands for Point of Estimate for level of significance of p < 0.05
The last hypothesis H7 states that Routinization of the Strategic Level positively mediates
between Change Implementation Capacity and Readiness for Organizational Change. To test for this
assumption authors again used structural regression i.e., SR model with 5000 bootstrapping sampling
method as per suggestion of Preacher & Hayes (2008). The results in Table 5 showed the indirect
effect of Change Implementation Capacity on Readiness for Organizational Change is significant as
is acting the mediating role between Change Implementation Capacity and Readiness for
Organizational Change. Therefore, study hypothesis H7 is also supported. Furthermore, the direct
effect of Change Implementation Capacity on Readiness for Organizational Change is insignificant
which shows that Routinization of the Strategic Level is performing full mediating role.
5. CONCLUSION
China Pak Economic Corridor is considered as the game changer for the region. However, there
are some sceptic arguments specially related to native industry. This triggered the attention to get it
confirmed from the Pakistani industry about their readiness for organizational due to CPEC. The
10 Abdul Salam Khuhro, Asad Afzal Humayon, Muhammad Sajjad, Rafique Ahmed Khuhro, Muhammad Irfan
readiness for organizational change could be confirmed through the organizational capabilities and
routinization. Same has been researched and a theoretical model is created after thorough literature
review. With the support of previous research and considering the problem at hand researchers had
developed hypothesis which could disclose the Pakistani industry readiness for organizational
change. Industry was asked to provide the response on the prepared instrument that was through
questionnaire. The questionnaire was prepared to collect the descriptive and scaled data. Scales are
adopted from previous studies and have been modified as per local context and research problem.
Collected data was analysed through multivariate tests. Apart from descriptive statistics,
researchers had used the confirmatory factor analysis and structural equational modelling to test the
hypothesis and the model as a whole. The software used for data analysis was AMOS.
There were seven hypothesis and hypothesis one, two and three were divided in two sub
hypothesis a & b by considering the paths of SEM. The total number of hypothesis in research were
ten, three are not supported while seven are supported. Out of three mediations two are supported
while the mediating effect of RSL between CIC and ROC is not supported.
Referring the model fitness and SEM relationship results, it can be claimed that Pakistani firms
are ready for organizational change due to CPEC. There is positive relationship between SSMC with
RSL and ROC and CIC with RSL. However, there is lack of timely decision making capacity and CIC
effect on ROC which needs to be improved.
This research work has contributed in the literature as the theoretical relations are tested with
mediating effect for the first time. The study also provided the practical implications which are
related with the burning issue of CPEC and local business concerns. Although, there needs to be
further studies which could bring the more depth analysis about the firms’ readiness for
organizational change due to CPEC, however, this research can be used by the policy makers as first
step to understand the firms’ behaviour to forthcoming change.
6. AVAILABILITY OF DATA AND MATERIAL The data used or generated from this study is available upon request to the corresponding author.
7. REFERENCES
Abid, M., & Ashfaq, A. (2015). CPEC: Challenges and Opportunities for Pakistan. Pakistan Vision, 16(2).
Ahmed Sheikh, N., & Wang, Z. (2011). Determinants of capital structure: An empirical study of firms in
manufacturing industry of Pakistan. Managerial Finance, 37(2), 117-133.
Ahmed, Z. S. (2019). Impact of the China–Pakistan Economic Corridor on Nation-Building in Pakistan.
Journal of Contemporary China, 28(117), 400-414.
Ali, R., & Abbas, M. (2019). User’s E-Readiness for E-Health and Traditional Healthcare: A Case of Dera Ismail Khan, Khyber Pakhtunkhwa, Pakistan. International Transaction Journal of
Engineering, Management, & Applied Sciences & Technologies. 10(5), 607-615.
Ariely, D., & Zakay, D. (2001). A timely account of the role of duration in decision making. Acta
psychologica, 108(2), 187-207.
Armenakis, A. A., Harris, S. G., & Mossholder, K. W. (1993). Creating readiness for organizational
change. Human relations, 46(6), 681-703.
*Corresponding author (Abdul Salam Khuhro). E-mail: [email protected] ©2019 International Transaction Journal of
Engineering, Management, & Applied Sciences & Technologies. Volume 10 No.11 ISSN 2228-9860 eISSN 1906-9642 CODEN:
ITJEA8 Paper ID:10A12A http://TUENGR.COM/V10A/10A12A.pdf DOI: 10.14456/ITJEMAST.2019.150 11
Aydiner, A. S., Tatoglu, E., Bayraktar, E., & Zaim, S. (2019). Information system capabilities and firm
performance: Opening the black box through decision-making performance and business-process
performance. International Journal of Information Management, 47, 168-182.
Balogun, J., & Hailey, V. H. (2008). Exploring strategic change. Pearson Education.
Becker, M. C. (2004). Organizational routines: a review of the literature. Industrial and Corporate Change, 13(4), 643-678.
Buchanan, D., Claydon, T., & Doyle, M. (1999). Organisation development and change: the legacy of the
nineties. Human Resource Management Journal, 9(2), 20-37.
Burnes, B. (2004). Kurt Lewin and the planned approach to change: a re‐appraisal. Journal of Management studies, 41(6), 977-1002.
Cummings, T. G., & Worley, C. G. (2009). Organization development and change: Cengage learning.
Cunningham, C. E., Woodward, C. A., Shannon, H. S., MacIntosh, J., Lendrum, B., Rosenbloom, D., &
Brown, J. (2002). Readiness for organizational change: A longitudinal study of workplace,
psychological and behavioural correlates. Journal of Occupational and Organizational
psychology, 75(4), 377-392.
Cvitanovic, C., McDonald, J., & Hobday, A. (2016). From science to action: principles for undertaking
environmental research that enables knowledge exchange and evidence-based decision-making.
Journal of Environmental Management, 183, 864-874.
Daft, R. L., & Weick, K. E. (1984). Toward a model of organizations as interpretation systems. Academy
of management review, 9(2), 284-295.
Di Stefano, G., Peteraf, M., & Verona, G. (2010). Dynamic capabilities deconstructed: a bibliographic investigation into the origins, development, and future directions of the research domain.
Industrial and Corporate Change, 19(4), 1187-1204.
Doyle, M. (2002). From change novice to change expert: Issues of learning, development and support.
Personnel Review, 31(4), 465-481.
Eisenhardt, K. M. (1989a). Agency theory: An assessment and review. Academy of management review, 14(1), 57-74.
Eisenhardt, K. M. (1989b). Making fast strategic decisions in high-velocity environments. Academy of
Management journal, 32(3), 543-576.
Eisenhardt, K. M., & Martin, J. A. (2000). Dynamic capabilities: what are they? Strategic management
journal, 21(10-11), 1105-1121.
Gioia, D. A., & Chittipeddi, K. (1991). Sensemaking and sensegiving in strategic change initiation.
Strategic management journal, 12(6), 433-448.
Haider, Z. (2005). Sino-Pakistan relations and Xinjiang's Uighurs: Politics, trade, and Islam along the
Karakoram highway. Asian Survey, 45(4), 522-545.
Harreld, J. B., O'Reilly, C. A., & Tushman, M. L. (2007). Dynamic capabilities at IBM: Driving strategy
into action. California Management Review, 49(4), 21-43.
Helfat, C. E., & Martin, J. A. (2015). Dynamic managerial capabilities: Review and assessment of
managerial impact on strategic change. Journal of management, 41(5), 1281-1312.
Helfat, C. E., Finkelstein, S., Mitchell, W., Peteraf, M., Singh, H., Teece, D., & Winter, S. G. (2009). Dynamic capabilities: Understanding strategic change in organizations: John Wiley & Sons.
Holt, D. T., Armenakis, A. A., Feild, H. S., & Harris, S. G. (2007). Readiness for organizational change
the systematic development of a scale. Journal of applied behavioral science, 43(2), 232-255.

12 Abdul Salam Khuhro, Asad Afzal Humayon, Muhammad Sajjad, Rafique Ahmed Khuhro, Muhammad Irfan
Jacobson, E. H. (1957). The effect of changing industrial methods and automation on personnel. Paper
presented at the symposium on preventive and social psychology, Washington, DC.
Kerber, K., & Buono, A. F. (2005). Rethinking organizational change: Reframing the challenge of change
management. Organization Development Journal, 23(3), 23.
Kline, R. B. (2011). Convergence of structural equation modeling and multilevel modeling: na.
Lawrence, T. B., Dyck, B., Maitlis, S., & Mauws, M. K. (2006). The underlying structure of continuous change. MIT Sloan Management Review, 47(4), 59.
Leonard‐Barton, D. (1992). Core capabilities and core rigidities: A paradox in managing new product
development. Strategic management journal, 13(S1), 111-125.
Lewin, K. (1947). Frontiers in group dynamics II. Channels of group life; social planning and action research. Human relations, 1(2), 143-153.
Li, D.-y., & Liu, J. (2014). Dynamic capabilities, environmental dynamism, and competitive advantage:
Evidence from China. Journal of Business Research, 67(1), 2793-2799.
Lin, H.-F., Su, J.-Q., & Higgins, A. (2016). How dynamic capabilities affect adoption of management
innovations. Journal of Business Research, 69(2), 862-876.
Luecke, R. (2003). Managing change and transition. Vol. 3. Harvard Business Press.
Miller, D. (2004). Building sustainable change capability. Industrial and Commercial Training, 36(1), 9-12.
Ministry of Planning, D. R. (2015). CPEC Introduction. Retrieved from
http://cpec.gov.pk/introduction/1
Pandza, K., & Thorpe, R. (2009). Creative search and strategic sense‐making: missing dimensions in the concept of dynamic capabilities. British Journal of Management, 20, S118-S131.
Pettigrew, A. M., Woodman, R. W., & Cameron, K. S. (2001). Studying organizational change and
development: Challenges for future research. Academy of management journal, 44(4), 697-713.
Preacher, K. J., & Hayes, A. F. (2008). Asymptotic and resampling strategies for assessing and comparing
indirect effects in multiple mediator models. Behavior research methods, 40(3), 879-891.
Ravasi, D., & Schultz, M. (2006). Responding to organizational identity threats: Exploring the role of
organizational culture. Academy of Management journal, 49(3), 433-458.
Rehman, A. U., Hakim, A., Khan, K., & Khan, I. U. (2018). Role of CPEC in development of trade, transport and economy of Pakistan. Romanian Journal of Transport Infrastructure, 7(1), 77-92.
Rippa, A. (2019). Cross-Border Trade and “the Market” between Xinjiang (China) and Pakistan. Journal
of Contemporary Asia, 49(2), 254-271.
Schreiber, J. B., Nora, A., Stage, F. K., Barlow, E. A., & King, J. (2006). Reporting structural equation
modeling and confirmatory factor analysis results: A review. Journal of educational research, 99(6), 323-338.
Schreyögg, G., & Noss, C. (2000). Von der Episode zum fortwährenden Prozess–Wege jenseits der
Gleichgewichtslogik im organisatorischen Wandel. Management for schung, 10, 33-62.
Sharfman, M. P., & Dean Jr, J. W. (1997). Flexibility in strategic decision making: informational and
ideological perspectives. Journal of Management Studies, 34(2), 191-217.
Sher, P. J., & Lee, V. C. (2004). Information technology as a facilitator for enhancing dynamic capabilities through knowledge management. Information & management, 41(8), 933-945.
*Corresponding author (Abdul Salam Khuhro). E-mail: [email protected] ©2019 International Transaction Journal of
Engineering, Management, & Applied Sciences & Technologies. Volume 10 No.11 ISSN 2228-9860 eISSN 1906-9642 CODEN:
ITJEA8 Paper ID:10A12A http://TUENGR.COM/V10A/10A12A.pdf DOI: 10.14456/ITJEMAST.2019.150 13
Sial, S. (2014). The China-Pakistan Economic Corridor: an assessment of potential threats and
constraints. Conflict and Peace Studies, 6(2), 24.
Tabachnick, B. G., & Fidell, L. S. (1996). Using Multivariate Statistics (3rd ed.). New York: Harper
Collins.
Tabachnick, B. G., & Fidell, L. S. (2007). Using multivariate statistics (5 ed.). Boston: Pearson Education.
Teece, D. J. (2007). Explicating dynamic capabilities: the nature and microfoundations of (sustainable)
enterprise performance. Strategic management journal, 28(13), 1319-1350.
Teece, D. J. (2018). Business models and dynamic capabilities. Long Range Planning, 51(1), 40-49.
Teece, D. J., Pisano, G., & Shuen, A. (1997). Dynamic capabilities and strategic management. Strategic
management journal, 509-533.
Thames, B., & Webster, D. W. (2009). Chasing change: Building organizational capacity in a turbulent environment. John Wiley & Sons.
Thomas, J. B., Clark, S. M., & Gioia, D. A. (1993). Strategic sensemaking and organizational
performance: Linkages among scanning, interpretation, action, and outcomes. Academy of
Management journal, 36(2), 239-270.
Van de Ven, A. H., & Poole, M. S. (1995). Explaining development and change in organizations. Academy of management review, 20(3), 510-540.
Weick, K. E. (1995). Sense-making in organizations. Vol. 3: Sage.
Wohlgemuth, V., & Wenzel, M. (2016). Dynamic capabilities and routinization. Journal of Business
Research, 69(5), 1944-1948.
Zollo, M., & Winter, S. G. (2002). Deliberate learning and the evolution of dynamic capabilities.
Organization science, 13(3), 339-351.
Abdul Salam Khuhro did his MS in Management Sciences from COMSATS University Islamabad, Vehari Campus. His main areas of research interest are strategic management, Dynamic Capabilities, Organizational Change, Routinization and
Blue Ocean Strategies.
Dr.Asad Afzal Humayon is a Principal Research Officer at COMSATS University Islamabad, Vehari Campus. He has a PhD in Management Sciences. His research is related to Management Sciences.
Dr.Muhammad Sajjad is an Assistant Professor at COMSATS University Islamabad, Vehari Campus, Pakistan. He has a PhD
in Management Sciences. His researches are Management, HRM, Technology Adoption, Entrepreneurship.
Rafique Ahmed Khuhro is an Assistant Professor at University of Haripur. Also, he is Director, Office of Research,
Innovation and Commercialization, University of Haripur. He is a Lecturer at COMSATS Institute of Information
Technology. He has an MS (Marketing). His researches are Marketing, Customer Services, Branding, BoP Markets
Dr.Muhammad Irfan is an Assistant Professor at COMSATS University Islamabad, Vehari Campus, Pakistan. He has a PhD
in Economics from Federal Urdu University of Arts Science and Technology Islamabad, Pakistan. He researches are Applied Econometrics, Natural Resource Economics, Ecological Economics, Econometric Analysis, Econometric Modeling,
Non-Market valuation, Climate Change Economics, Climate Change Adaptation, Environmental Resources Management,
Environmental Awareness, Health Economics, Environmental Economics, and Urban Economics.
Trademarks Disclaimer: All products names including trademarks™ or registered® trademarks mentioned
in this article are the property of their respective owners, using for identification purposes only . Use
of them does not imply any endorsement or affiliation.
*Corresponding author (P.Sornchomkaew). E-mail: [email protected]. ©2019 International Transaction Journal of
Engineering, Management, & Applied Sciences & Technologies . Volume 10 No.12 ISSN 2228-9860 eISSN 1906-9642 CODEN:
ITJEA8 Paper ID:10A12B http://TUENGR.COM/V10A/10A12B.pdf DOI: 10.14456/ITJEMAST.2019.151 1
International Transaction Journal of Engineering, Management, & Applied Sciences & Technologies
http://TuEngr.com
PAPER ID: 10A12B
WATER PERMEABILITY OF CONCRETE MIXING ASH AND
CRUSHED DUST
Phongphoom Sornchomkaewa*
, Kritsada Anantakarn b, and
Thongchai Phothong c
a Department of Civil Engineering, Faculty of Engineering, Rajamangala University of Technology Rattanakosin, THAILAND.
b Department of Civil Engineering, Faculty of Engineering, Rajamangala University of Technology Tawan-ok, THAILAND
c Department of Civil Engineering, Faculty of Engineering, King Mongkut’s University of Technology
Thonburi, THAILAND
A R T I C L E I N F O
A B S T R A C T
Article history: Received 19 April 2019
Received in revised form 11
July 2019
Accepted 22 July 2019 Available online 05 August
2019
Keywords: Palm-oil waste ash;
Cement replacement; Natural pozzolan material; Concrete mix design; Pozzolan ash.
The objectives of the research studied the use of pozzolan and
crushed dust as admixtures in general concrete for permeability. The
replacement of Portland cement with palm oil waste ash by 0, 10, 20,
and 30 percent by weight respectively, and replacement sand with
crushed dust at levels of 100, 90, 80, and 70 percent by weight were
determined. After 28 days of curing, the results showed suitable
quantities of replacing cement with pozzolan waste ash is 30 percent
by weight, and 100 percent replacement sand with crushed dust can
improve the physical and mechanical properties of concrete. Ash and
crushed dust can decrease the permeability of concrete by 1.50–3.30
time. Concrete replacement sand with crushed dust 100, 90, 80, and 70
percent by weight can decrease the permeability of concrete by 20
percent. The rate of the permeability in concrete is reduced in
proportion to the increase of pozzolan ash and crushed dust.
© 2019 INT TRANS J ENG MANAG SCI TECH.
1. INTRODUCTION The use of natural rocks in the construction industry must be processed to be suitable to use. The
limestone mountain must be blown, and then the rocks come into the milling process to obtain the
required sizes. This process produces crushed dust which is very small and cannot pass through the
sieve, the crushed dust will be blown out to pile aside as waste dust causing waste and cost keeping it
in the place and carry away. Effects of replacement were studied e.g. by Sornchomkaew et al.
(2018). by replacing natural sand in concrete mixture with rice hull ash, dark husk ash, and crushed
dust.
The residue of palm fruit from agriculture which considered as waste can be used as fuel for
©2019 International Transaction Journal of Engineering, Management, & Applied Sciences & Technologies

2 Sultan Alsharari, Aznan Che Ahmad, and Saleh Aljohani
steaming of water to generate electricity. This process leaves over the ash which has to carry away as
this ash is dusty and disperse around. The ash may cause air pollution in surrounded environment
area which cost money to solve this problem. Many recent pieces of the research reported that this
dust could be used as a pozzolan in concrete work to replace cement. So this research was purposed
to study the permeability in concrete mixed with bio-ash and crushed dust which encourage the
compressive strength well. The concrete texture which had a mixture of dust, as observed, was
rougher and had more porosity than the normal concrete. Hence, it was possible that this concrete
might resist the water permeability less which is not a good concrete property. This research had
tested by steady flow water passed through the concrete as the water could not pass through the
concrete or could pass through slowly, meant the water had less damage to concrete. Since the fluid
can pass through the concrete less, steel inside the concrete will cause less rusty as well.
Figure 1: Palm-oil ash obtained from the production process
2. MATERIALS
2.1 PALM-OIL ASH The palm-oil ash used in this research study was derived from the burning process for the fuel
production in the palm-oil mill in Chon Buri Province. The result from physical properties analysis
found that the specific gravity of palm-oil ash was 2.25 and the moisture content was 45.31%.
Considering the physical characteristic of the palm-oil ash using high magnification by Scanning
Electron Microscope: SEM of palm-oil shell ash from X-Ray Fluorescence Analysis (XRF) from the
laboratory of the Department of Science Service which magnified of 100 times. It was found that the
particles from palm-oil ash were in uncertain shape, lumpy, non-layered round, and porous. When the
palm-oil shell as was magnified at 1,000 times, it was found the ash appeared as round grains, rugged
surface, and porous.
Table 1: Chemical property of palm-oil ash. Oxide Percent by weight (%)
Palm-oil ash
SiO2 54.05
Al2O3 13.06
Fe2O3 1.02
CaO 7.85
MgO 5.24
SO3 2.32
Other oxides -
LOI. 10.80

*Corresponding author (P.Sornchomkaew). E-mail: [email protected]. ©2019 International Transaction Journal of
Engineering, Management, & Applied Sciences & Technologies . Volume 10 No.12 ISSN 2228-9860 eISSN 1906-9642 CODEN:
ITJEA8 Paper ID:10A12B http://TUENGR.COM/V10A/10A12B.pdf DOI: 10.14456/ITJEMAST.2019.151 3
From the chemical properties analysis of palm-oil ash in Table 1, whereas the sum of silicon
dioxide SiO2, aluminum oxide AI2O2 and iodide oxide Fe2O3 in palm-oil ash; the amount was 68.1%,
the sulfur trioxide SO3 was 2.32% and the loss on ignition was 10.80%. Considering the chemical
composition of the palm-oil ash according to ASTM C628 standard, it can be classified as Class N
pozzolan which is natural pozzolan material.
Figure 2: Physical appearance of palm-oil ash.
2.2 CRUSHED DUST AND SAND
Crushed dust which was used in this research study had tested properties according to ASTM
C628 standard by testing the grain size analysis of fine aggregate with the sieve analysis which
resulted in values of Cu = 24 and Cc = 3.58. The test of organic impurities in fine aggregate for
organic matter determination by using indicator papers comparing with bottle liquid, from comparing
the color of indicator papers of 3 % concentrated sodium hydroxide over the crushed dust samples
with the standard color, resulting in a lighter color than the standard color. Hence, this crushed dust
was appropriate to use.
Figure 3: Crushed dust.
The sand used in this research had the following chemical properties; SiO2 = 98.8%, AI2O3 =
0.2%, Fe2O3 = 0.07%, Cao = 0.4% and MgO = 0.08%. From the grain size analysis of fine aggregate
by sieve analysis to compare the standard size of fine aggregate and crushed dust was showed the
beginning of the line and the end of the line showed the similar value of the standard and crushed dust.

4 Sultan Alsharari, Aznan Che Ahmad, and Saleh Aljohani
But the value in the middle hold more space which meant that in the beginning the crushed dust
remained the same as standard value in the sieve and then hold more space in the middle when the
crushed dust had bigger grain sizes, after that it came close to standard value again at the end since
that it had similar percentage value of size as both crushed dust and sand shared the similar quantities.
3. EXPERIMENTAL DETAILS
3.1 CONCRETE MIX DESIGN To test the concrete permeability, the sample concrete was mixed and cast as the trial-and-error
design of water proportion toward palm-oil ash and crushed dust. The designed compressive strength
was 250 Kilogram per square centimeter (ksc) and the concrete slump was from 5cm to 10cm
according to ACI211 standard as shown in Table 2
Table 2: Proportion of Concrete Mixtures
Code Mixture Material (kg/m
3)
Cement Palm-oil ash Sand Crushed Dust Stone Water
C-PC 347 - 842 - 881 215
C-100-0 347 - - 842 881 204
C-100-10 312 35 - 842 881 205
C-100-20 278 69 - 842 881 206.5
C-100-30 243 104 - 842 881 208
C-90-0 347 - 84 758 881 204.5
C-90-10 312 35 84 758 881 205
C-90-20 278 69 84 758 881 206
C-90-30 243 104 84 758 881 208
C-80-0 347 - 168 674 881 205
C-80-10 312 35 168 674 881 206.5
C-80-20 278 69 168 674 881 208
C-80-30 243 104 168 674 881 210
C-70-0 347 - 253 589 881 205.5
C-70-10 312 35 253 589 881 207
C-70-20 278 69 253 589 881 208
C-70-30 243 104 253 589 881 210
3.2 WATER PERMEABILITY OF CONCRETE The testing of concrete permeability in the concrete sample aged 28 days, the cylindrical
concrete sample was cut at a longitudinal center with a thickness of 4 centimeters. The casted epoxy
of 2.5 cm thickness around the side surface of the cut concrete sample and left for 24 hours. After that,
the block shell was assembled underwater with the pressure of 5 bars, then brought to set at the testing
machine as shown in Figures 4, 5, 6.
Figure 4: Assembled Epoxy.

*Corresponding author (P.Sornchomkaew). E-mail: [email protected]. ©2019 International Transaction Journal of
Engineering, Management, & Applied Sciences & Technologies . Volume 10 No.12 ISSN 2228-9860 eISSN 1906-9642 CODEN:
ITJEA8 Paper ID:10A12B http://TUENGR.COM/V10A/10A12B.pdf DOI: 10.14456/ITJEMAST.2019.151 5
Figure 5: Underwater assembled block shell. Figure 6: Settled block shell at a testing machine
4. DISCUSSION The result of concrete permeability which was the main objective of this research was concluded
in Table 3. It was found that the controlled concrete C-PC code 28 days of curing, the coefficient of
permeability was 1.202 10-2 m/s. Whereas, the concrete which mixed with 0% palm-oil ash and
100, 90, 80, 70 % of crushed dust replacement of sand showed the coefficient of permeability of
concrete 28 days of curing at C-100-0, C-90-0, C-80-0, and C-70-0 code. At 28 days of curing
concrete, the coefficient of permeability was 9.708 10-13
, 9.810 10-13
, 9.903 10-13
and 1.001
10-12
m/s respectively. To explain this result, the permeability was decreased because crushed dust
had more fine particles than the fine aggregate which helped to fill the void in the concrete and
resulting in higher density in concrete mixed by crushed dust as shown in Table 3.
Table 3: Results of permeability testing in concrete with all cement mixture
and with crushed dust mixture instead of sand Code Water Permeability of Concrete at 28 days (m/s)
C-PC 1.202 x 10⁻¹²
C-100-0 9.708 x 10⁻¹³
C-90-0 9.810 x 10⁻¹³
C-80-0 9.903 x 10⁻¹³
C-70-0 1.001 x 10⁻¹²
In addition, it was found that the concrete using palm-oil ash instead of cement at 0, 10, 20, and
30 mixed with all crushed dust instead of sand could decrease the coefficient permeability at the code
of C-100-0, C-100-10, C-100-20 and C-100-30 was 9.708 10-13
, 6.104 10-13
, 4.583 10-13
, and
3.645 10-13
m/s respectively. Because of the finer particles of palm-oil ash and calcium silicate
hydrate which reacted with pozzolan helped fill the void and resulted in concrete mixed with palm-oil
ash and crushed dust to obtained more density and higher impermeability as shown in Table 4.
Table 4: Result of permeability testing of concrete mixed
with 100 % crushed dust instead of sand
Code Water Permeability of Concrete at 28days (m/s)
C-PC 1.202 10-12
C-100-0 9.708 10-13
C-100-10 6.104 10-13
C-100-20 4.583 10-13
C-100-30 3.645 10-13

6 Sultan Alsharari, Aznan Che Ahmad, and Saleh Aljohani
5. CONCLUSION The research studies the permeability in concrete that mixed with pozzolan as palm-oil ash
instead of cement and crushed dust instead of sand. The study finds that the replacement of crushed
dust instead of fine aggregate at 100%, 90%, 80%, and 70% by weight in concrete with 28 days of
curing could make less coefficient of permeability than in controlled concrete at 1.20 to 1.24 times.
Also, the replacement of palm-oil ash and crushed dust instead of cement and fine aggregate in
concrete with 28 days of curing could make less coefficient of permeability than in controlled
concrete at 1.50 to 3.30 times. From the laboratory experiment, the best proportion of using palm-oil
ash instead of cement and crushed dust instead of fine aggregate to obtain well impermeability was
30% of palm-oil ash and 100% of crushed dust by weight.
6. DATA AVAILABILITY STATEMENT The used or generated data and the result of this study are available upon request to the
corresponding author.
7. REFERENCES Ababneh, A., Benboudjema, F., & Xi, Y. (2003). Chloride penetration in nonsaturated concrete.
Journal of Materials in Civil Engineering, 15(2), 183-191.
American Society for Testing and Materials. (2010). Annual Book of ASTM Standards, Vol 04.02,
Philadelphia: ASTM International.
Boddy, A. Hooton, RD. and Gruber, KA. (2001). Long-term testing of chloride-penetration
resistance of concrete containing high-reactivity metekaolin. Cement and Concrete
Research, 31(5), 759-765.
Care, S. (2008). Effect of temperature on porosity and on chloride diffusion in cement pastes.
Construction and Building Materials, 22(7), 1560-1573.
Chindaprasirt, P., Homwuttiwong, S., & Jaturapitakkul, C. (2007). Strength and water permeability
of concrete containing palm oil fuel ash and rice husk–bark ash. Construction and Building
Materials, 21(7), 1492-1499.
Dhir, R. K., & Jones, M. R. (1999). Development of chloride-resisting concrete using fly ash. Fuel,
78(2), 137-142.
El-Dieb, A. S., & Hooton, R. D. (1995). Water-permeability measurement of high performance
concrete using a high-pressure triaxial cell. Cement and Concrete Research, 25(6),
1199-1208.
Homwuttiwong, S., Chindaprasirt, P., and Jaturaitakkul, C. (2006). Water Permeability of Concrete
Containing Various Pozzolan. International Conference on Pozzolan, Concrete and
Geopolymer, 226-236.
Hooton, R. D., & Titherington, M. P. (2004). Chloride resistance of high-performance concretes
subjected to accelerated curing. Cement and Concrete Research, 34(9), 1561-1567.
Khatri, R. P., & Sirivivatnanon, V. (1997). Methods for the determination of water permeability of
concrete. Materials Journal, 94(3), 257-261.
Ludirdja, D., Berger, R. L., & Young, J. (1989). A simple method for measuring water permeability
of concrete. Materials Journal, 86(5), 433-439.
*Corresponding author (P.Sornchomkaew). E-mail: [email protected]. ©2019 International Transaction Journal of
Engineering, Management, & Applied Sciences & Technologies . Volume 10 No.12 ISSN 2228-9860 eISSN 1906-9642 CODEN:
ITJEA8 Paper ID:10A12B http://TUENGR.COM/V10A/10A12B.pdf DOI: 10.14456/ITJEMAST.2019.151 7
Poon, C. S., Kou, S. C., & Lam, L. (2006). Compressive strength, chloride diffusivity and pore structure
of high-performance metakaolin and silica fume concrete. Construction and building materials,
20(10), 858-865.
Sornchomkaew, P., Witchayangkoon, B., & Sirimontree, S. (2018). Chloride Infiltration Effects by Replacing Natural Sand in Concrete Mixture with Rice Hull Ash, Dark Husk Ash, and Crushed
Dust. International Transaction Journal of Engineering Management & Applied Sciences &
Technologies, 9(1), 43-48.
Phongphoom Sornchomkaew is a Lecturer at Department of Civil Engineering, Faculty of Engineering and
Architecture, Rajamagala University of Technology Rattanakosin Wang Klai Kang Won Campus, Prachaup Kiri Kan, Thailand. He holds a Master of Engineering degree from Thammasat University. His research focuses on technology
applications to facilitate and foster civil engineering study.
Dr. Kritsada Anantakarn is a Lecturer at the Department of Civil Engineering Technology, Faculty of Engineering and
Architectures, Rajamongala University of Technology Tawan-ok, Uthenthawai Campus, Thailand. He earned his
Bachelor of Engineering (Civil Engineering) from Faculty of Engineering Rajamangala Institute of Engineering, and a Master’s degree in of Urban and Environmental Planning from King Mongkut's Institute of Technology Ladkrabang, and
a PhD from Thammasat University. He is interested in GPS/GNSS and spatial technology.
Dr. Thongchai Phothong is a Lecturer at Department of Civil Engineering Department, Faculty of Engineering, King
Mongkut's University of Technology Thonburi (KMUTT). He is at KMUTT. He earned his Bachelor Degree (Civil Engineering) from King Mongkut's University of Technology Thonburi (KMUTT), Thailand, and Master Degree in
Geotechnical Engineering also from KMUTT. He earned his PhD from Thammasat University. He is interested in
spatial technology and applications.

*Corresponding authors 1.(Lee Phei Qie). Tel: +60-11-19119511, [email protected]. 2.(Lai Chi Mun). Tel: +60-17-6774923. [email protected]. ©2019 International Transaction Journal of Engineering, Management, & Applied Sciences & Technologies. Volume 10 No.12 ISSN 2228-9860 eISSN 1906-9642 CODEN: ITJEA8 Paper ID:10A12C http://TUENGR.COM/V10A/10A12C.pdf DOI: 10.14456/ITJEMAST.2019.152
1
International Transaction Journal of Engineering, Management, & Applied Sciences & Technologies
http://TuEngr.com
PAPER ID: 10A12C
A STUDY OF URBAN DESIGN ELEMENTS IN STRUCTURED
VILLAGE AT GELUGOR, PENANG
Lee Phei Qie a*
, Lai Chi Mun a*
, Ahmad Sanusi Hassan a,
Asif Ali a,b
, Boonsap Witchayangkoon c
a School of Housing, Building & Planning, Universiti Sains Malaysia, MALAYSIA b Architecture Section, University Polytechnic of Aligarh Muslim University, INDIA c Department of Civil Engineering, Thammasat School of Engineering, Thammasat University, THAILAND.
A R T I C L E I N F O
A B S T R A C T Article history: Received 19 April 2019
Received in revised form 10
July 2019
Accepted 15 July 2019
Available online 05 August
2019
Keywords: Town image; Gridiron
layout; Mental mapping;
Structured village; Urban
circulation; Urbanization.
This paper analyses the town image and the mental mapping of the
structured village at Gelugor, Penang, on five urban design elements,
which are the path, edge, district, node, and landmark. Observation,
data collection and fieldwork survey are the methods applied in the
study. The study finds that Taman Tun Sardon and structural village
in Gelugor have a masterplan with gridiron design, which makes the
site systematically arranged. The gridiron concept forms primary road
networks and linkages with vehicular paths, which make the site well
connected. The path becomes the most dominant element in this study.
This study shows that structured village at Gelugor has an urban design
with regular gridiron urban layout, which provides good circulation in
the area. The gridiron pattern then becomes distortion at Taman Tun
Sardon area due to the hilly topography of the site. The paths formed
by the gridiron layout have enabled a clear definition of the district in
the structured village at Gelugor. The path is the most dominant
element in the study area. Besides, the study shows that there is a lack
of quality nodes and landmarks available in the study area.
© 2019 INT TRANS J ENG MANAG SCI TECH.
1. INTRODUCTION This paper analyses and identifies the five major design elements and principles namely paths,
edges, districts, nodes and landmarks which are implemented in the case study area, structured village
at Gelugor, Penang based on understanding on urban design elements within of the local traditional
built environment in Malaysia (Khashim et al., 2017) referring to the theories of Kevin Lynch (1962).
Penang is one of the states in Peninsular Malaysia. It is situated in northwest coast, comprising of
Penang Island, and also Seberang Perai. George Town (Figure 1) is the capital city of Penang, with
Gelugor (Figure 2) as a suburb in its southern part. The urbanisation of Gelugor (Figure 2) started by
©2019 International Transaction Journal of Engineering, Management, & Applied Sciences & Technologies

2 Lee Phei Qie, Lai Chi Mun, Ahmad Sanusi Hassan, Asif Ali and Boonsap Witchayangkoon
residential development since early of the 1960s. Sumatra fishermen populates Gelugor (Figure 2)
since the late 18th century. The land use in Gelugor then was transformed into agricultural use to
plant rubber and nutmeg by Captain Francis Light’s partner, named David Brown.
Figure 1: Key plan of the study
The urban study area (Figure 3) is structured villages at Gelugor (Figure 2) which comprise of
Taman Tun Sardon and Kampung Sungai Gelugor. The area is situated 7.7km from George Town,
linked by Jalan Sultan Azlan Shah from Batu Uban to Batu Dumbar. It is consisting of residential
area, with some mixture of commercial, governmental, religious and educational zones. Kampung
Sungai Gelugor still maintain its traditional Malay village structure and elements although it is
surrounded by the drastically high rise residential development. It is 68 acres with 5 acres of
government land, located near to the Penang Bridge which is gateway of Penang. The study also
covers 5.5 acres of low cost landed residential neighbourhood of Taman Tun Sardon with a garden
city concept from England (Khashim et al., 2017). Taman Tun Sardon is located 5.7km from
Georgetown. The main road which linked Taman Tun Sardon is Jalan Hilir Pemancar.
2. LITERATURE REVIEW
2.1 IRREGULAR GRIDIRON URBAN LAYOUT The study area covers two parts of Gelugor town, Kampung Sungai Gelugor, and Taman Tun
Sardon. The most significant characteristic is the urban layout of the area. The building blocks are
neatly in a grid formation (Zakaria, 2018). This urban layout design is a basic planning masterplan
embraced by the British colonial administration (Hassan, 2009). During the British’s colonial era,
divide and rule concept has been implemented into the formation of urban pattern to allocate different
ethnic groups into separated settlements (Hassan, 2017). This concept has indirectly affected the
urban circulation and town image of the study area. The urban gridiron layout is designed in the
irregular pattern due to the alignment with the topography of the study area.
2.2 STRUCTURED VILLAGE Part of the study area, Kampung Sungai Gelugor is formed by the structured village concept. The
structured village is to accommodate Bumiputera (indigenous) people. The urban design is based on a
concept of high-density low-rise type residential development (Hassan, 1999; Hassan & Ku Hassan,
2001). It is a planned village that focuses on providing socio-economic livelihood and benefit of
villagers in the urban area, equipped with basic infrastructures and services as one of the decent
examples (Bentley et al., 1985).

*Corresponding authors 1.(Lee Phei Qie). Tel: +60-11-19119511, [email protected]. 2.(Lai Chi Mun). Tel: +60-17-6774923. [email protected]. ©2019 International Transaction Journal of Engineering, Management, & Applied Sciences & Technologies. Volume 10 No.12 ISSN 2228-9860 eISSN 1906-9642 CODEN: ITJEA8 Paper ID:10A12C http://TUENGR.COM/V10A/10A12C.pdf DOI: 10.14456/ITJEMAST.2019.152
3
2.3 URBAN DESIGN ELEMENTS Lynch (1960) discusses urban design by observing the visual and physical form of a city at an
urban scale. The principle composes five urban design elements, which are the path, edge, district,
node, and landmark. With this approach, the urban design elements are to analyse the impact of urban
design of a city to its function, history, name or the meaning (Larice & Macdonald, 2013).
Figure 2: Location plan Figure 3: Layout plan of the study area.
2.4 BACKGROUND OF CASE STUDY This study site (Figure 3) consists of two neighborhood areas, Kampung Sungai Gelugor, and
Taman Tun Sardon. The total of 73.5 acres of site compromises the elements of the structured village
as its traditional arrangement approach (Elmagalta et al., 2010). There are many public facilities and
institutions located in the site, including Taman Tun Sardon Pavilion, Market place dan Gelugor
Community Hall, GIATMARA, Sungai Gelugor Jamek Mosque, State Fishery Department, Sungai
Gelugor Primary School, Sungai Gelugor Hall, Hindu temple, post office, and banks. From 68 acres
of Kampung Sungai Gelugor, 5 acres is government land, while 63 acres of it is originally owned by
Malay citizen, which then sold to a foreigner named Brown, a businessman which manage both
plantations of rubber and nutmeg in Gelugor (Figure 2). The land is being used for agricultural by
Brown when he owns the land, but then he returns the land to the Malay citizens when he decided to
go back to his own country, England (Jawatankuasa, 2007). Relocation of the people from another
place to this residential area name Kampung Sungai Gelugor was developed by the government once
the land use is being converted again to residential after Brown left the place. According to the 2016
local resident interview, Refurbishment Program of Poor People House is being proposed and carried
out by the Penang government to refurbish the house of poor residents in Kampung Sungai Gelugor.
Currently, the land is populated by almost 1020 families, mostly Malay people (Jawatankuasa, 2007).
In 1826, a primary school of Sekolah Rendah Sungai Gelugor was built in Kampung Sungai Gelugor
and becoming the oldest Malay school in Malaysia. Taman Tun Sardon is a low-cost housing
neighbourhood scheme being developed by the Penang government to solve the issues of housing
affordability by the poor people located at Lot 482 in Penang (Pejabat Rancangan Perumahan Taman
Tun Sardon, 1982). The Lot 482 land was owned by 92 Temporary Occupation License (TOL)

4 Lee Phei Qie, Lai Chi Mun, Ahmad Sanusi Hassan, Asif Ali and Boonsap Witchayangkoon
holders but then sold to the government by relocated 88 of the 92 TOL holder in Taman Tun Sardon,
while another four holders to longhouse in Paya Terubong (Pejabat Rancangan Perumahan Taman
Tun Sardon, 1982). This development starts in early 1977 and completed in the year 1982. The site
includes in the study only consists the landed housing development which 139 units of double storeys
residential houses are built on the 5.5 acres of land from March 1977 to May 1978 with a cost of RM
4 million (Pejabat Rancangan Perumahan Taman Tun Sardon, 1982). Information from the interview
of the local resident in 2018 notes that currently, most residents had renovated their houses.
3. METHODOLOGY
This research design approach identifies the mental mapping of the selected site by utilising five
urban design elements (Yasin et al., 2017) according to the theory of Kevin Lynch. The urban design
elements are district, path, edge, node, and landmark. Figure-ground plan of the area involved is
drawn in AutoCAD to gain an initial understanding of the case study. Preliminary study on history
and background of the site is conducted to obtain fundamental information of the site. A site survey is
later carried out to gain a more accurate understanding of the site. Detailed information is then
obtained through a visit to Majlis Perbandaran Pulau Penang (MBPP) and Taman Tun Sardon
Housing Planning Office. The quality of the key urban design elements is identified during the site
survey. The data collected from the site is analyzed based on Kevin Lynch’s urban mapping theory.
The scale of measurement of the urban design elements are as follow:
o Paths
The width and length of the paths are under the study to analyse its relation to the function,
importance, accessibility of the paths at the site.
o Edges
The edges are determined based on the physical features and function of the edges that could become
boundary at the site.
o Districts
The background and history, age, size, land use, and dominance are analysed for the district elements.
o Nodes
The function, attraction, and placemaking of the nodes are studied to analyse the importance of the
nodes at the site.
o Landmark
The popularity, scale, and attraction of the landmarks are observed to study their effects onto the site.
4. RESULTS AND ANALYSIS
4.1 PATHS
4.1.1 VEHICULAR PATH
Figure 5, Jalan Sultan Azlan Shah is the Sultan Azlan Shah Boulevard. In Taman Tun Sardon,
Pintasan Pemancar 1 refers to Pemancar Shortcut 1, Lengkok Pemancar refers to Pemancar Arc. Hilir
Pemancar refers to Pemancar Downstream, Tingkat Pemancar refers to Pemancar Level while Jalan
Molek refers to Molek Road. In Kampung Sungai Gelugor, Jalan Akuarium refers to Akuarium Road,
Tingkat Sungai Gelugor is the Sungai Gelugor Level, Persiaran Sungai Gelugor refers to Sungai

*Corresponding authors 1.(Lee Phei Qie). Tel: +60-11-19119511, [email protected]. 2.(Lai Chi Mun). Tel: +60-17-6774923. [email protected]. ©2019 International Transaction Journal of Engineering, Management, & Applied Sciences & Technologies. Volume 10 No.12 ISSN 2228-9860 eISSN 1906-9642 CODEN: ITJEA8 Paper ID:10A12C http://TUENGR.COM/V10A/10A12C.pdf DOI: 10.14456/ITJEMAST.2019.152
5
Gelugor Sight, Jalan Ismail Nagore is Ismail Nagore road while Lengkok Sungai Gelugor refers to
Sungai Gelugor Arc. There are five main entrances on the site. Two entrances linked to Taman Tun
Sardon while the other three linked to Kampung Sungai Gelugor. All the entrances are double way
entrances accepting the flow of traffic from both inlet and outlet.
Figure 5: Vehicular Path plan of the study area.
Traffic lights are spotted at the entrance linking to Jalan Ismail Nagore, which act as a guide of
traffic flow and divert the traffic load for the vehicles that enter or exit the site. There is only one
arterial road in the site, which is Jalan Sultan Azlan Shah. It is a 20 meters’ double way vehicular path
consists of three lanes each side, connecting the site to Batu Urban from the north and also Jelutong
from the south. The road is aligned in between commercial area, separated from the residential area
by the collector roads. Jalan Sultan Azlan Shah is being linked to many collector roads such as
Lengkok Pemancar and Hilir Pemancar from its west, Jalan Akuarium and Jalan Ismail Nagore from
its east. From the vehicular statistics, Figure 6, Jalan Sultan Azlan Shah can be considered as a good
arterial pathway as it serves no traffic jam even at the peak period of 7.00 pm as the traffic flow is
smooth. Thirty collector roads are spotted in the study area, mainly 6 meters in length, with double
way traffic flow one lane each side. In Taman Tun Sardon, collector of Lengkok Pemancar is linked
to another collector road, Jalan Pemancar and interconnected with Hilir Pemancar, while Hilir
Pemancar is connected with Jalan Molek. Most of the collector roads in the site of Kampung Sungai
Gelugor line between the residential units such as Tingkat Sungai Gelugor 1 until Tingkat Sungai
Gelugor 10, Lengkok Sungai Gelugor 1 and Lengkok Sungai Gelugor 2. The local roads are the
4-meter vehicular path which serves the private community. There are 18 local roads on the site. One
of the local roads from Lengkok Pemancar separates Pasar Rakyat Gelugor and Astaka Taman Tun
Sardon, by allowing only one lane traffic flow along the road. The local road from Tingkat Sungai

6 Lee Phei Qie, Lai Chi Mun, Ahmad Sanusi Hassan, Asif Ali and Boonsap Witchayangkoon
Gelugor 5 to dead-end covered by residential units, creating a cul-de-sac, while another local road
acts as a back lane of the commercial shophouse units. The local road which linked from Jalan Molek
poses a small loop circulation of a cul-de-sac along with the residential units.
Figure 6: Arterial road of Jalan Sultan Azlan Shah (left)
and collector road of Tingkat Sungai Gelugor 6 (right)
4.1.2 PEDESTRIAN PATH
Figure 7: Pedestrian Path Plan of the study area.
The pedestrian pathways are only found along both of the side of Jalan Sultan Azlan Shah,
mainly interlocking pathway, Figure 7. There are no pedestrian pathways spotted in the residential
area and this leads to less pedestrian in the residential areas. Figure 8, the pathways along Jalan
Sultan Azlan Shah connect two pedestrian link bridge serving across the road, one is linked to the
commercial shop lots from Taman Tun Sardon and Kampung Sungai Gelugor, while another
pedestrian link bridge is used to connect the residential areas from Taman Tun Sardon and School of

*Corresponding authors 1.(Lee Phei Qie). Tel: +60-11-19119511, [email protected]. 2.(Lai Chi Mun). Tel: +60-17-6774923. [email protected]. ©2019 International Transaction Journal of Engineering, Management, & Applied Sciences & Technologies. Volume 10 No.12 ISSN 2228-9860 eISSN 1906-9642 CODEN: ITJEA8 Paper ID:10A12C http://TUENGR.COM/V10A/10A12C.pdf DOI: 10.14456/ITJEMAST.2019.152
7
SK Sungai Gelugor. Two bus stops are situated at site serving two ways of a public transportation
route, one in front of Taman Tun Sardon, another at Kampung Sungai Gelugor.
Figure 8: Pathway along Jalan Sultan Azlan Shah (left) Linkbridge connecting Taman Tun Sardon
and Kampung Sungai Gelugor (right).
Figure 9: Edges of the study area.
4.2 EDGES The dominant edge unites the site is the main road edge by the arterial road of Jalan Sultan Azlan
Shah, it set a barrier in between of two main residential districts of Kampung Sungai Gelugor and also
Taman Tun Sardon which is in the different urban sprawl, Figure 9. Kampung Sungai Gelugor is a
gridiron arrangement of the settlements while Taman Tun Sardon utilizes the Garden City concept.
Another major road edge is Lebuhraya Tun Dr Lim Chong Eu (Tun Dr. Lim Chong Eu Highway),
separating the residential district of Kampung Sungai Gelugor to the reclaimed land residential

8 Lee Phei Qie, Lai Chi Mun, Ahmad Sanusi Hassan, Asif Ali and Boonsap Witchayangkoon
development of The Light. A minor road edge at the side of Tingkat Sungai Gelugor 10 sets a
boundary between residential units in Kampung Sungai Gelugor and the government quarters.
The commercial edges are being separated from the residential area by the collector road of
Tingkat Pemancar for Taman Tun Sardon and Tingkat Sungai Gelugor 2 for Kampung Sungai
Gelugor; it is defined as an edge because of its façade style which is different from the residential
units. There is a natural edge which is the river edge that set up by Sungai Gelugor. It distinguishes
the boundary of Kampung Sungai Gelugor.
4.3 DISTRICTS
Figure 10: Districts of the study area.
The most dominant district of the site is residential areas, followed by the commercial area,
then government quarters, educational area and lastly the recreational area, Figure 10. Residential
area all belongs to the landed property including terrace house, semi-detached house, bungalow with
different hierarchy from the single storey until three storeys residential units. Taman Tun Sardon
belongs to Garden City residential district as the housing layout is being organically arranged
according to the different contour of the slope while Kampung Sungai Gelugor is gridiron residential
district as it is developed according to gridiron arrangement. Most of them are relocated under the
housing program for low-cost housing. Some of the houses have been renovated into a modern style
of architecture while some remain their traditional style. There are two main commercial districts,
separated by Jalan Sultan Azlan Shah. One of the commercial districts situated at Taman Tun Sardon,
while another at Kampung Sungai Gelugor, separating the residential district from the arterial road,
setting up the boundaries between private zones and public zones. Both of the commercial districts
comprise of shop lots selling a variety of services or items such as laundry, hotel, restaurants and mini
markets. The government quarters are basically used for the residential and office for members in the
Royal Malaysian Navy (TLDM). Quarters of single-storey terrace units are built on this district for
the occupants. Educational districts are identified in the site of study. The school of SK Sungai

*Corresponding authors 1.(Lee Phei Qie). Tel: +60-11-19119511, [email protected]. 2.(Lai Chi Mun). Tel: +60-17-6774923. [email protected]. ©2019 International Transaction Journal of Engineering, Management, & Applied Sciences & Technologies. Volume 10 No.12 ISSN 2228-9860 eISSN 1906-9642 CODEN: ITJEA8 Paper ID:10A12C http://TUENGR.COM/V10A/10A12C.pdf DOI: 10.14456/ITJEMAST.2019.152
9
Gelugor is situated at the south region of Kampung Sungai Gelugor, serving not only primary
education but also pre-primary school education. Recreational area includes empty land for
multipurpose use such as any sports activities or meeting point. There is a big empty land along Jalan
Ismail Nagore, while a court is situated along Persiaran Sungai Gelugor 2.
Figure 11: Residential District of the study area
4.4 NODES
Figure 12: Nodes of the study area.
The nodes (Figure 12) that can be found on the site are mainly activity areas or amenities
provided in the neighbourhood because there are two residential areas at the site, which are Taman
Tun Sardon and Kampung Sungai Gelugor. Besides, stop of public transport has also become one of
the nodes at the site. The bus stop naturally becomes a node when people are waiting at the bus stop,
especially during peak hour. These nodes are introverted nodes as they give little directional sense.
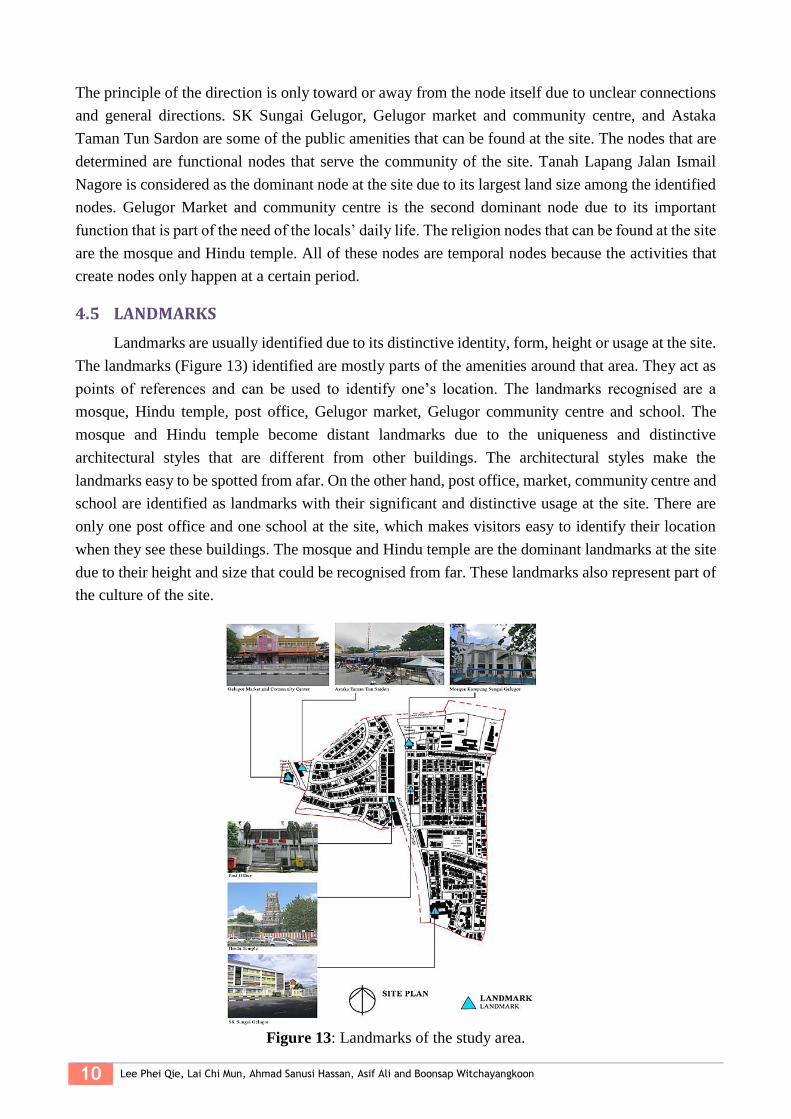
10 Lee Phei Qie, Lai Chi Mun, Ahmad Sanusi Hassan, Asif Ali and Boonsap Witchayangkoon
The principle of the direction is only toward or away from the node itself due to unclear connections
and general directions. SK Sungai Gelugor, Gelugor market and community centre, and Astaka
Taman Tun Sardon are some of the public amenities that can be found at the site. The nodes that are
determined are functional nodes that serve the community of the site. Tanah Lapang Jalan Ismail
Nagore is considered as the dominant node at the site due to its largest land size among the identified
nodes. Gelugor Market and community centre is the second dominant node due to its important
function that is part of the need of the locals’ daily life. The religion nodes that can be found at the site
are the mosque and Hindu temple. All of these nodes are temporal nodes because the activities that
create nodes only happen at a certain period.
4.5 LANDMARKS
Landmarks are usually identified due to its distinctive identity, form, height or usage at the site.
The landmarks (Figure 13) identified are mostly parts of the amenities around that area. They act as
points of references and can be used to identify one’s location. The landmarks recognised are a
mosque, Hindu temple, post office, Gelugor market, Gelugor community centre and school. The
mosque and Hindu temple become distant landmarks due to the uniqueness and distinctive
architectural styles that are different from other buildings. The architectural styles make the
landmarks easy to be spotted from afar. On the other hand, post office, market, community centre and
school are identified as landmarks with their significant and distinctive usage at the site. There are
only one post office and one school at the site, which makes visitors easy to identify their location
when they see these buildings. The mosque and Hindu temple are the dominant landmarks at the site
due to their height and size that could be recognised from far. These landmarks also represent part of
the culture of the site.
Figure 13: Landmarks of the study area.

*Corresponding authors 1.(Lee Phei Qie). Tel: +60-11-19119511, [email protected]. 2.(Lai Chi Mun). Tel: +60-17-6774923. [email protected]. ©2019 International Transaction Journal of Engineering, Management, & Applied Sciences & Technologies. Volume 10 No.12 ISSN 2228-9860 eISSN 1906-9642 CODEN: ITJEA8 Paper ID:10A12C http://TUENGR.COM/V10A/10A12C.pdf DOI: 10.14456/ITJEMAST.2019.152
11
5. DISCUSSION
5.1 PATHS The path is the most dominant urban design element in the site of the study area. Paths in the site
are interconnecting with each other according to its hierarchy, separating the zoning of the site by its
function and privacy (Ewing & Handy, 2009). Vehicular pathway poses high accessibility as the
arterial road is interconnected to the local roads by the collector roads, slowing down and reducing
the traffic loads at the residential area from the commercial area. The relation between the pathways
smoothen the traffic flow and reduce the traffic load at the main arterial road by providing a few
entrances to each of the residential areas. Traffic lights are spotted on-site for controlling the traffic
flow of the main arterial road of Jalan Sultan Azlan Shah. Several cul-de-sacs are spotted in the
residential area, providing loop circulation or dead-end of the local roads to increase the privacy of
the residential units aligned with them. For pedestrian pathway, it poses low accessibility as the paths
are only provided along the main arterial road of Jalan Sultan Azlan Shah, aligned with the
commercial shop lots in front of Taman Tun Sardon and Kampung Sungai Gelugor, but not linked to
the residential area. The pedestrian pathways are linked by the pedestrian link bridges, providing
access across the main arterial road of Jalan Sultan Azlan Shah without stopping the traffic. Bus stops
are provided at both sides of the arterial road for accessibility of public transportation.
5.2 EDGES The main edge linking the whole site is the road edge of Jalan Sultan Azlan Shah, connecting the
two main residential districts of Taman Tun Sardon and Kampung Sungai Gelugor. Another road
edge of Lebuhraya Tun Dr Lim Chong Eu defines the boundary of Kampung Sungai Gelugor,
separating it with another residential district from the east, and provides privacy between the
residential units. There is a river edge of Sungai Gelugor which also separates Kampung Sungai
Gelugor from Markas Rejimen 2 KOR Polis Tentera Diraja situated at its southern region. While
commercial edges are found aligned with the main arterial road of Jalan Sultan Azlan Shah,
separating the road from residential areas, creating a buffer to the private zone from the sound
pollution of traffic at the road.
5.3 DISTRICTS The district is another dominant urban element in the site of study. There are mainly residential
areas, one at Taman Tun Sardon while another at Kampung Sungai Gelugor, each of the districts is
being separated from the main arterial road of Jalan Sultan Azlan Shah by commercial districts. The
commercial districts are located along the arterial road, setting up at the centre region where most
pedestrian and traffic will pass by to attract the flow of customers. There is a government quarters at
the northern region of Kampung Sungai Gelugor which serves as both residential and official
management areas of the government for members in Royal Malaysian Navy (TLDM). The
recreational district is being set on an empty land along Jalan Ismail Nagore for assembly spot and
also some of the recreational activities.
5.4 NODES Node is one of the less dominant elements in the study area. Nodes at the site are mostly open
spaces formed by thematic concentration and breakpoints of public transportation. The nodes (Figure

12 Lee Phei Qie, Lai Chi Mun, Ahmad Sanusi Hassan, Asif Ali and Boonsap Witchayangkoon
12) found at the site are facilities of the housing area. We can see that the scale of the land used as
activity areas are larger compared to the surrounding residential lots. With this characteristic, it
becomes a node and able to accommodate people and acts as a gathering point of the locals. These
nodes that formed by the amenities encourage social interaction among the locals. However, the
nodes only form at certain period due to the activities; for example, the religion nodes will form only
at prayer period. Permanent nodes are lacking at the site. There are no nodes at the junction of roads.
This situation is due to fast moving traffic at the site and poor pedestrian connectivity at the site.
Besides, the identified nodes are not vibrant. This situation could be caused by the improper planning
of the activity area. Most of the nodes at the site are introverted nodes because it is difficult to
recognise from far. These nodes can hardly be used as a directional reference to other locations.
5.5 LANDMARKS Landmark is one of the less dominant elements in the study area. Landmark (Figure 13) is very
limited at the site. The landmarks that can be found are mainly neighbourhood facilities due to its
location in the housing area. The site is a lack of directional landmarks that could help in determining
or spotting location. Visual landmarks that are spotted at the site are both religion landmarks. The
mosque and Hindu temple can stand out from the surrounding building due to the architectural styles
that are affected by religion. The styles form a strong contrast with the surrounding building. The
other landmarks are distinctive due to their functions or usage, which are different from housings at
the site. The most dominant landmark in the study area is Mosque due to its unique architectural style
and size at the site, followed by Gelugor Market because it is the daily necessity of the locals.
6. CONCLUSION
The site of the case study is a housing area that involves Taman Tun Sardon and a structural
village in Gelugor, which is Kampung Sungai Gelugor. Most dominant element at the study area is a
path that forms the urban pattern, then follow by district and edge. The landmark and node contribute
less in building up the town image of the study area. The urban planning and layout of the site is a
distorted gridiron layout. This type of urban layout design provides a systematical structure to the
housing area. The layout provides effective circulation of vehicular pathways, which are good for
wayfinding. Efficient coordination of hierarchical paths is formed by the gridiron layout of the
circulation. The edges created by the highway and river have formed a distinctive boundary around
the site. The dominant district at the site is residential district supported by the commercial district,
which is part of the facilities of the housing area. However, landmarks and nodes are limited which
causes lack of point of reference at the site. The site is less community-friendly due to limited
potential space and place that could become landmark and node. These two elements are the main
elements that act as the meeting or gathering point for the community. More nodes should be
introduced to the site to strengthen the sense of community at the site. The site is very unique due to it
has the background of a traditional village. It transformed to suit the current need. With its
background as a traditional village, the Malay culture and identity could easily be observed through
the architectural style and facilities provided at the housing area.

*Corresponding authors 1.(Lee Phei Qie). Tel: +60-11-19119511, [email protected]. 2.(Lai Chi Mun). Tel: +60-17-6774923. [email protected]. ©2019 International Transaction Journal of Engineering, Management, & Applied Sciences & Technologies. Volume 10 No.12 ISSN 2228-9860 eISSN 1906-9642 CODEN: ITJEA8 Paper ID:10A12C http://TUENGR.COM/V10A/10A12C.pdf DOI: 10.14456/ITJEMAST.2019.152
13
7. DATA AVAILABILITY STATEMENT
The used or generated data and the result of this study are available upon request to the
corresponding author.
8. ACKNOWLEDGEMENT
We would like to express our sincere appreciation to Universiti Sains Malaysia for a support to
this study with a Bridging Grant, Number 304.PPBGN.6316521. We also feel thankful to all of the
respondents that took part in this research during the data collection.
9. REFERENCES
Bentley, I., Alcock, A., Murrain, P., McGlynn, S. & Smith, G. (1985). Responsive Environments: A
Manual for Designers. Abingdon: Architectural Press.
Elmagalta, A.M., Hassan, A.S. & Ku Hassan, K.A. (2010). Resort Architecture in Langkawi. Malaysia.
Penang: USM Press.
Ewing, R., & Handy, S. (2009). Measuring the unmeasurable: Urban design qualities related to
walkability. Journal of Urban design, 14(1), 65-84.
Hassan, A.S. & Ku Hassan, K.A. (2001). Konsep Perumahan Tradisional Berkelompok dan Berdensiti
Tinggi di Pantai Barat Semenanjung Malaysia (High Density Traditional Clustered Housing
Concept at Western Coastal Area in Peninsular Malaysia). Penang: USM Press.
Hassan, A.S. (1999). Corak Penempatan Perumahan Tradisional Berkepadatan Tinggi. Journal of
Housing, Building and Planning. Penang: USM Press.
Hassan, A.S. (2009). The British Colonial ‘Divide and Rule’ Concept in Inner City of George Town.
Penang: Its Influence to Irregular Layout of the Transport Access. International Journal of
Transportation, Springer Science + Business Media LLC., 36(3), 309-324.
Hassan, A.S. (2017). Amalan Tebusguna Tanah, Reka Bentuk Bandar dan Seni Bina di Malaysia. Penang:
USM Press.
Jawatankuasa Kerja Kampung Sungai Gelugor (2007), Menelusuri sejarah awal Kampung Sungai
Gelugor, Retrieved on 24 April 2019 at http://jkkksggelugor.tripod. com/id1.html.
Khashim, N. F., Ismail, M., Hassan, A. S., & Al-Ashwal, N. T. (2017). A Study on Kevin Lynch's Urban
Design Elements: Precinct 9 East Putrajaya. International Transaction Journal of Engineering
Management & Applied Sciences & Technologies, 8(3), 153-167.
Khashim, N.F., Ismail, M., Hassan, A.S. & Al-Ashwal, N.T. (2017). A Study on Kevin Lynch’s Urban
Design Elements: Precinct 9 East Putrajaya, International Transaction Journal of Engineering,
Management, & Applied Sciences & Technologies, 23 (7): 6140-6143.
Larice, M. & Macdonald, E. (2013). The Urban Design Reader. New York: Routledge.
Lynch, K. (1960). The Image of the City. Massachusetts: The MIT Press.
Pejabat Rancangan Perumahan Taman Tun Sardon. (1982), Taman Tun Sardon (Unpublished Report).
School of Housing, Building and Planning, Universiti Sains Malaysia.
Phei Qie, Lee et al. (2018), Urban Street Study in Gelugor (Unpublished Report). School of Housing,
Building and Planning, Universiti Sains Malaysia.

14 Lee Phei Qie, Lai Chi Mun, Ahmad Sanusi Hassan, Asif Ali and Boonsap Witchayangkoon
Yasin, N. M., Hassan, A. S., & Al-Ashwal, N. T. (2017). Investigation of Mental Mapping in Urban
Design: Case of Queensbay, Penang. International Transaction Journal of Engineering
Management & Applied Sciences & Technologies, 8(4), 261-273.
Zakaria, M.H., Ismail, M., Hassan, A.S. & Al-Ashwal, N.T.. (2018). Urban Design Study on Kota Bharu
City Centre, Kelantan, Malaysia . The Arab World Geographer. 21(3). 193-208.
Lee Phei Qie is a postgraduate student of Master of Architecture in Universiti Sains Malaysia. She obtained her degree of Bachelor of Architecture in Science School of Housing, Building and Planning, Universiti Sains Malaysia (USM), Penang, Malaysia. Her current interests involve architectural design development, sustainable housing structure and urban planning design.
Lai Chi Mun is a postgraduate student of Master of Architecture in Universiti Sains Malaysia. She received her Bachelor of Architecture in Science from Taylor's University in 2018. Chi Mun's current interests include housing development design and urban planning design.
Professor Dr.Ahmad Sanusi Hassan is a Professor in Architecture Programme at the School of Housing, Building and Planning, Universiti Sains Malaysia (USM), Penang, Malaysia. He obtained a Bachelor and Master of Architecture degrees from University of Houston, Texas, USA, and Doctor of Philosophy (PhD) degree from University of Nottingham, United Kingdom. His research focuses on Sustainable Architecture and Urban Design Development for Southeast Asia, history and theory of Architecture, Computer Aided Design (CAD) and Computer Animation.
Asif Ali is an Assistant Professor of Architecture in the University Polytechnic of Aligarh Muslim University,India. He received his B.Arch. from Aligarh Muslim University with Honors in 1998. He did his M. Arch.from Aayojan School of Architecture, Jaipur, India. Asif Ali's current interests include Sustainable Development and Islamic Architecture in India. Presently he is pursuing his PhD at School of Housing, Building and Planning, University of Science, Malaysia.
Dr.Boonsap Witchayangkoon is an Associate Professor of Department of Civil Engineering at Thammasat University. He received his B.Eng. from King Mongkut’s University of Technology Thonburi with Honors. He continued his PhD study at University of Maine, USA, where he obtained his PhD in Spatial Information Science & Engineering. Dr. Witchayangkoon current interests involve Applications of Emerging Technologies to Engineering.

*Corresponding author (A.Sadov) E-mail: [email protected] ©2019 International Transaction Journal of Engineering, Management, & Applied Sciences & Technologies. Volume 10 No.10 ISSN 2228-9860 eISSN 1906-9642 CODEN: ITJEA8 Paper ID:10A12D http://TUENGR.COM/V10A/10A12D.pdf DOI: 10.14456/ITJEMAST.2019.131
1
International Transaction Journal of Engineering, Management, & Applied Sciences & Technologies
http://TuEngr.com
PAPER ID: 10A12D
AN ANALYSIS OF RESEARCH AREAS
IN PRECISION AGRICULTURE
A.S.Gusev a, G.A.Beznosov a, N.V. Ziablitckaia b, M.V. Kholmanskikh a,
L.A. Novopashin a, L.V. Denyozhko a, A.A. Sadov a* a Federal State Budgetary Educational Institution of Higher Education «Ural State Agrarian University»
(FGBOU VO Uralsky GAU) Ekaterinburg, ul. Karl Liebknecht, 42, RUSSIAN FEDERATION. b South Ural State University, Chelyabinsk, pr.Lenina, 76, RUSSIAN FEDERATION.
A R T I C L E I N F O
A B S T R A C T Article history: Received 01 May 2019
Received in revised form 18
July 2019
Accepted 29 July 2019
Available online 05 August
2019
Keywords: Agriculture technology;
Web of Science;
Precision farming;
Precision livestock
farming (PLF); Precision
agriculture research.
This article discusses the key research areas in precision farming
and precision agriculture. The bibliographic method is used as a research
tool. The average level of precision farming technologies in the USA is
30-50%, in the Russian Federation 10%. Despite the fact that precision
agriculture technologies are aimed primarily at reducing costs by
increasing the intensity of production and the level of resource output,
the studies show that the resource intensity of agricultural production in
Russia is still too high to speak about success in resource conservation.
The 2014-2018 articles contents in the bibliographic database Web of
Science are analyzed, totaling 4662 articles. In the most highly cited
articles native English speakers (USA, UK, Australia) often use the term
“precision farming”, while other countries scientists (China, India, EU,
Iran, etc.) use the term “precision agriculture”. The considerable leaders
in the total number of publications on the subject are countries with
traditionally developed agriculture, such as the USA (20.0% of the
number of articles reviewed), Brazil (8.8%), China (17.5%), and Spain
(7.3%). The leader among scientific journals with publications on the
problem is “Computers and electronics in agriculture”; it has 4.9% of all
articles. The leading research organizations include the US Department
of Agriculture (USDA), the Chinese academy of Sciences, Consejo
Superior de Investigaciones Cientificas CSIC (Spain). The average
level of introduction of precision farming technologies in the USA is
estimated at 30-50%, while at large farms the level of technology use is
twice the small ones. Its most common elements are: a computer with
high-speed Internet access, an analysis of soil samples (98%); yield
maps, yield monitors, GPS navigation systems (about 80%); differential
fertilization technologies (60%); satellite images and a vegetative index
analysis - (no more than 30%) of farmers. All the listed technologies
should be developed intensively both in the world and in Russia, with
the increased investments in precision agriculture research.
© 2019 INT TRANS J ENG MANAG SCI TECH.
©2019 International Transaction Journal of Engineering, Management, & Applied Sciences & Technologies
2 A.S.Gusev, G.A.Beznosov, N.V. Ziablitckaia, M.V. Kholmanskikh, L.A. Novopashin, L.V. Denyozhko, A.A. Sadov
INTRODUCTION
Entrepreneurship in the agrarian sector is making significant efforts to reduce the costs of major
resources. One of the solutions based on various technological breakthroughs in the digital industry is
precision agriculture technologies.
There is an opinion that the concept of “precision agriculture” is associated with the concepts of
“precision farming” and “precision livestock farming” (PLF). The scientific literature uses the
following synonyms of the category “precision farming”: coordinate farming, information
technology, GPS technologies, etc. For the first time, there were the elements of the precision farming
system with GPS to determine the position to which any measured parameter of the field should be
linked [1]. Precision farming technologies began to be used in the late 1980s in the United States and
Australia [2,3,4]
The application of the precision farming system became possible due to advances in such
technologies as global positioning systems (GPS), geographic information systems (GIS), remote
sensing and simulation modeling, and robotics. These technological breakthroughs have made
opportunities for assessing and managing spatial and temporal variability using various methods. The
combination of these concepts is traditionally referred to as precision farming (precision agriculture)
or crop and soil management.
Precision animal husbandry can be defined as “the application of principles and methods of
technological design in animal husbandry for automatic monitoring, modeling, and management of
animal husbandry” [5]. These technologies in animal husbandry make the production more
cost-effective [6], socially and environmentally sustainable, and this can be achieved by observing,
interpreting the behavior [8] and, if possible, individual control after animals [9].
METHODOLOGY
The relevance of precision farming has resulted in an increase of publications in recent years.
However, there is no structured analysis of this published material. This study attempts to analyze the
scientific results of research on problems of precision agriculture published in 2014–2018. With the
bibliometric method, mainly based on the use of network analysis tools, it became possible to explore
the main aspects of this research area. This will discover the trends in publications and areas of
research, as well as their geographical distribution. In the Web of Science database, 4,662 scientific
publications were found over a specified period. The number of publications has increased after 2014
significantly, which underlines the relevance of the research topic.
The study aims to determine the directions and prospects for the use of precision agriculture
systems by analyzing the publications on this topic.
The bibliographic method was used as a methodological research tool. At the first stage, the
content of publications on the systems of precision agriculture was analyzed. The review of
publications was carried out on the basis of a system approach. A literature screening was performed
and the text was analyzed to clarify whether the selected articles were relevant to the research
problems. As a result, the most relevant publications in peer-reviewed research journals were chosen.
The rest of the publications were irrelevant to the research problem, as they were related to the

*Corresponding author (A.Sadov) E-mail: [email protected] ©2019 International Transaction Journal of Engineering, Management, & Applied Sciences & Technologies. Volume 10 No.10 ISSN 2228-9860 eISSN 1906-9642 CODEN: ITJEA8 Paper ID:10A12D http://TUENGR.COM/V10A/10A12D.pdf DOI: 10.14456/ITJEMAST.2019.131
3
precision agriculture indirectly and, thus, were excluded from further analysis. The review concerns a
comparison of the research areas of “precision farming” and “precision agriculture”, the specific
nature and frequency of occurrence of particular research sub-areas in the world scientific literature
according to the Web of Science database.
The results of the study can be used by the executive authorities in the development of programs
on innovative agricultural development and technical modernization of the industry.
RESEARCH RESULT
The concept of “Precision agriculture” can be defined as a characteristic of soil conditions at the
field level for land management [10]. There are other approaches, in particular, “Precision
Agriculture”, that is a management concept based on observation, measurement, and response to
variability within fields in crops [11].
There are three main stages in the precision farming system. Firstly, it is a primary exploratory
analysis, which is collecting information about the economy, field, culture, and region. Secondly,
there is an analysis of the results of monitoring, followed by the adoption of relevant management
decisions. And the third stage is the development of a field treatment strategy for a specific agrarian
operation or in general for the next year, and relevant agro-technological operations [12, 13].
There are various estimates of the level of introduction of precision farming systems into
agricultural production. The average level of introduction of precision farming technologies in the
USA is estimated at the level of 30-50%, while at large farms the level of technology use is 2 times
higher than at small ones. Its most common elements are: a computer with high-speed Internet access,
an analysis of soil samples (98%); yield maps, yield monitors, GPS navigation systems (about 80%);
differential fertilization technologies (60%); satellite images and a vegetative index analysis - (no
more than 30%) of farmers.
The precision livestock farming is a kind of precision agriculture; its essence is the economical
and accurate use of material resources: fuel, seeds, feed, electricity, introduction of the latest
scientific advances in the production of animal origin products using modern technical equipment
with electronics for optimal results with the best cost recovery with the products. Moreover, if in
precision farming, the implementation of the technology requires not only electronics but also spatial
positioning with space navigation systems, in precision livestock farming this task is simplified due to
the use of electronic animal identification systems. The effectiveness of precision animal husbandry
is in the availability of a complex of precision technologies and technical means with electronic
control.
According to scientists’ opinion, a key requirement to precision machine technologies in animal
husbandry is providing the specified parameters for the implementation of technological processes
and living conditions in rooms and in choosing modes of interaction of machines with biological
objects to produce a high-quality product with desired properties. They include such operations as
preparation of balanced feed mixtures, individual feed dosing systems, automatic milking machines
and equipment, means for deep cooling of milk, systems for automatic control of climate parameters
in livestock housings, systems for sorting and packaging finished products.

4 A.S.Gusev, G.A.Beznosov, N.V. Ziablitckaia, M.V. Kholmanskikh, L.A. Novopashin, L.V. Denyozhko, A.A. Sadov
For this reason, precision agriculture is widespread only in large areas of the United States,
Germany, Denmark, the Netherlands, and the United Kingdom. Such technologies are beginning to
be introduced in Russia.
There is a serious difference in the assessment of the current level of application of precision
farming technologies in Russia. So, according to the Ministry of Agriculture of Russia, the elements
of precision farming are used in 1591 farms of the country on an area of 7521 thousand hectares.
According to the Ministry of Agriculture, the leading regions in terms of the number of farms are the
Lipetsk, Oryol, Samara, Kurgan, Voronezh, and Tyumen regions. The share of coverage with various
communication technologies of agricultural land in 2018 was at the level of 10% [14]. At the same
time, there are assessments of scientists of the Kuban State Agrarian University (Figure 1).
Figure 1: Region of Russia applying precision farming technology.
According to the Ministry of Agriculture, the leading regions by the number of farms are the
Lipetsk, Oryol, Samara, Kurgan, Voronezh, and Tyumen regions. The share of coverage of
agricultural lands with various communication technologies in 2018 is at the level of 10%.
At the same time, the concept of "Scientific and technological development of digital agriculture
"Digital Agriculture", developed under the Ministry of Agriculture of the Russian Federation by such
competent organizations as the Russian Academy of Sciences, Moscow State University by M.V.
Lomonosov, "Higher School of Economics" and others reports that the share of agricultural
enterprises which use the Internet of things, precision farming, digital herd, and smart greenhouses by
the end of 2018 is less than 1%. But the target indicators have an ambitious goal to increase this
number in 20 times by 2021, and 60 times by 2024. Regional Departments and Ministries have
already joined the implementation of these plans, at least through increasing the share of such
enterprises by considering certain technological operations as precision farming technologies, which
can hardly be considered justified. Such work gave a leading position in the application of precision
farming technologies in agriculture to the subsidized Kurgan region, Lipetsk, Oryol, Samara,
Voronezh and Tyumen regions. This proves the absence of a fundamental scientific and regulatory
framework and may result in distortion of the real situation in the development of precision farming
182
77
139 141
68
39
121
27 21 14 21 19 163
64 54 47
163
0
40
80
120
160
200
Nu
mb
er o
f p
ub
lica
tion
s, p
iece
s
Region

*Corresponding author (A.Sadov) E-mail: [email protected] ©2019 International Transaction Journal of Engineering, Management, & Applied Sciences & Technologies. Volume 10 No.10 ISSN 2228-9860 eISSN 1906-9642 CODEN: ITJEA8 Paper ID:10A12D http://TUENGR.COM/V10A/10A12D.pdf DOI: 10.14456/ITJEMAST.2019.131
5
technologies that are dangerous for the Russia economy as a whole.
Despite the fact that precision agriculture technologies are aimed primarily at reducing costs by
increasing the intensity of production and the level of resource output, the studies show that the
resource intensity of agricultural production in Russia is still too high to speak about success in
resource conservation. Table 1 exhibits resource intensity for the Kurgan region of Russia.
Table 1: Resource intensity of production by the example of agricultural enterprises of grain
specialization in the Kurgan region.
№ Total
resources
Gross Production Resource
intensity
Considering
thousand
rubles Specific
Land
intensity
Labour
intensity
Capital
intensity
Materials
intensity
1 0.533 47091 0.108 4.943 0.849 0.204 2.820 1.071
2 0.138 13563 0.031 4.435 1.369 0.472 1.261 1.334
3 0.095 8298 0.019 4.976 1.779 0.974 0.501 1.722
4 0.364 35564 0.081 4.468 1.190 1.231 1.160 0.887
5 0.029 2235 0.005 5.706 1.641 1.507 1.540 1.018
6 0.979 152546 0.349 2.802 0.756 0.640 0.565 0.841
7 0.221 16929 0.039 5.711 0.974 2.526 0.947 1.263
8 0.154 11483 0.026 5.846 1.684 2.948 0.238 0.977
9 0.124 6941 0.016 7.801 1.799 3.178 1.845 0.979
10 0.126 9300 0.021 5.898 1.352 1.630 1.700 1.217
11 0.182 9860 0.023 8.067 1.588 4.184 0.993 1.302
12 0.046 3479 0.008 5.795 2.057 1.888 0.832 1.019
13 0.280 32032 0.073 3.815 1.228 1.109 0.313 1.165
14 0.124 15447 0.035 3.510 1.055 0.654 0.774 1.028
15 0.138 10425 0.024 5.763 1.248 2.067 1.274 1.173
16 0.074 7693 0.018 4.178 1.170 0.350 1.767 0.891
17 0.185 29298 0.067 2.760 0.577 0.655 0.594 0.934
18 0.130 14777 0.034 3.832 0.793 0.684 1.354 1.001
19 0.079 9674 0.022 3.578 1.254 0.714 0.554 1.056
Total 4.000 436636 1.000 – – – – –
To determine the level of regulatory resource intensity with consideration of the qualitative
characteristics of the soil and intensity of resource use, we use the following formula,
Pnorm = 12.39 – 0.08x1 + 1.39x2 + 0.83x3- 3.63 x4,
where
x1 – soil assessment grade, x2 – the intensity of labour use, thousand-person – hour/ha;
x3 – intensity of fixed production facilities use, thousand rubles/ha;
x4 –intensity of material resources use, thousand rubles/ha.
The coefficient of regulatory resource intensity development shows an average level of resource
use in the analyzed agricultural enterprises of grain specialization depending on the soil quality,
intensity use of labour, fixed capital and material resources (Table 2).
Ranking of the analyzed agricultural enterprises of grain specialization by a degree of
development of the regulatory resource intensity shows that the first nine of them do not develop the
possible level of resource intensity. thus. having large reserves for the production of additional
products (Table 3).
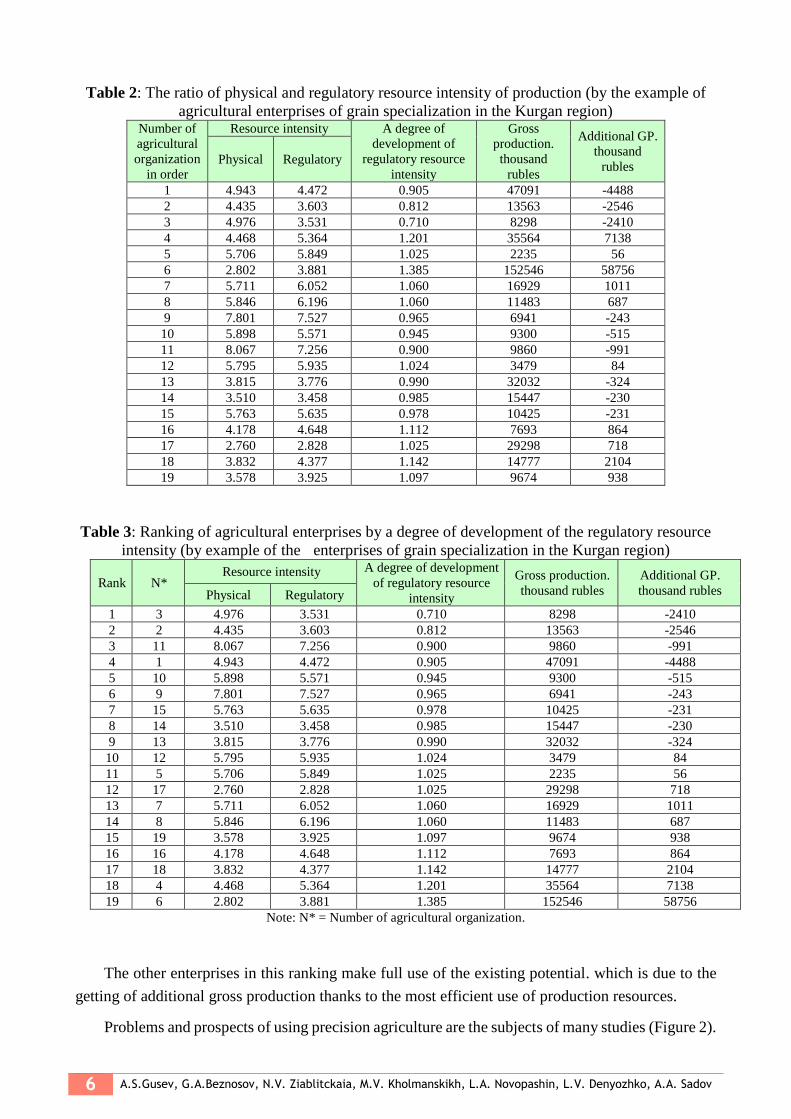
6 A.S.Gusev, G.A.Beznosov, N.V. Ziablitckaia, M.V. Kholmanskikh, L.A. Novopashin, L.V. Denyozhko, A.A. Sadov
Table 2: The ratio of physical and regulatory resource intensity of production (by the example of
agricultural enterprises of grain specialization in the Kurgan region) Number of
agricultural
organization
in order
Resource intensity A degree of
development of
regulatory resource
intensity
Gross
production.
thousand
rubles
Additional GP.
thousand
rubles Physical Regulatory
1 4.943 4.472 0.905 47091 -4488
2 4.435 3.603 0.812 13563 -2546
3 4.976 3.531 0.710 8298 -2410
4 4.468 5.364 1.201 35564 7138
5 5.706 5.849 1.025 2235 56
6 2.802 3.881 1.385 152546 58756
7 5.711 6.052 1.060 16929 1011
8 5.846 6.196 1.060 11483 687
9 7.801 7.527 0.965 6941 -243
10 5.898 5.571 0.945 9300 -515
11 8.067 7.256 0.900 9860 -991
12 5.795 5.935 1.024 3479 84
13 3.815 3.776 0.990 32032 -324
14 3.510 3.458 0.985 15447 -230
15 5.763 5.635 0.978 10425 -231
16 4.178 4.648 1.112 7693 864
17 2.760 2.828 1.025 29298 718
18 3.832 4.377 1.142 14777 2104
19 3.578 3.925 1.097 9674 938
Table 3: Ranking of agricultural enterprises by a degree of development of the regulatory resource
intensity (by example of the enterprises of grain specialization in the Kurgan region)
Rank N* Resource intensity A degree of development
of regulatory resource
intensity
Gross production.
thousand rubles
Additional GP.
thousand rubles Physical Regulatory
1 3 4.976 3.531 0.710 8298 -2410
2 2 4.435 3.603 0.812 13563 -2546
3 11 8.067 7.256 0.900 9860 -991
4 1 4.943 4.472 0.905 47091 -4488
5 10 5.898 5.571 0.945 9300 -515
6 9 7.801 7.527 0.965 6941 -243
7 15 5.763 5.635 0.978 10425 -231
8 14 3.510 3.458 0.985 15447 -230
9 13 3.815 3.776 0.990 32032 -324
10 12 5.795 5.935 1.024 3479 84
11 5 5.706 5.849 1.025 2235 56
12 17 2.760 2.828 1.025 29298 718
13 7 5.711 6.052 1.060 16929 1011
14 8 5.846 6.196 1.060 11483 687
15 19 3.578 3.925 1.097 9674 938
16 16 4.178 4.648 1.112 7693 864
17 18 3.832 4.377 1.142 14777 2104
18 4 4.468 5.364 1.201 35564 7138
19 6 2.802 3.881 1.385 152546 58756
Note: N* = Number of agricultural organization.
The other enterprises in this ranking make full use of the existing potential. which is due to the
getting of additional gross production thanks to the most efficient use of production resources.
Problems and prospects of using precision agriculture are the subjects of many studies (Figure 2).
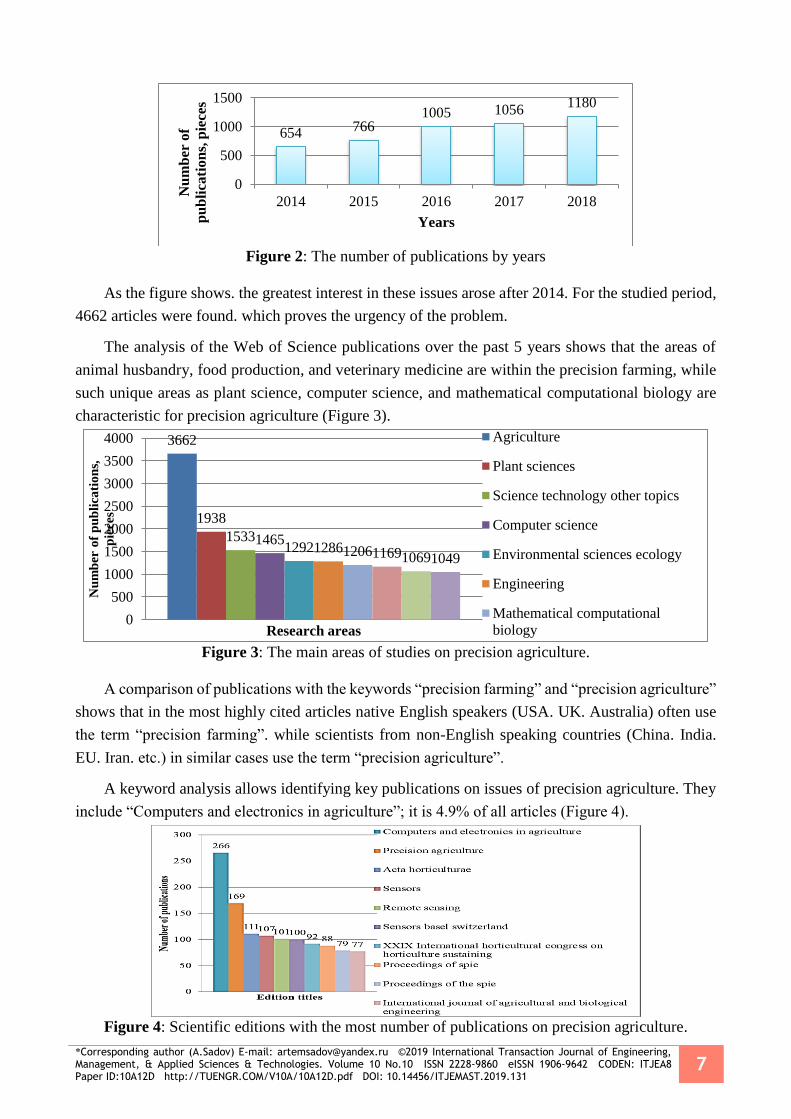
*Corresponding author (A.Sadov) E-mail: [email protected] ©2019 International Transaction Journal of Engineering, Management, & Applied Sciences & Technologies. Volume 10 No.10 ISSN 2228-9860 eISSN 1906-9642 CODEN: ITJEA8 Paper ID:10A12D http://TUENGR.COM/V10A/10A12D.pdf DOI: 10.14456/ITJEMAST.2019.131
7
Figure 2: The number of publications by years
As the figure shows. the greatest interest in these issues arose after 2014. For the studied period,
4662 articles were found. which proves the urgency of the problem.
The analysis of the Web of Science publications over the past 5 years shows that the areas of
animal husbandry, food production, and veterinary medicine are within the precision farming, while
such unique areas as plant science, computer science, and mathematical computational biology are
characteristic for precision agriculture (Figure 3).
Figure 3: The main areas of studies on precision agriculture.
A comparison of publications with the keywords “precision farming” and “precision agriculture”
shows that in the most highly cited articles native English speakers (USA. UK. Australia) often use
the term “precision farming”. while scientists from non-English speaking countries (China. India.
EU. Iran. etc.) in similar cases use the term “precision agriculture”.
A keyword analysis allows identifying key publications on issues of precision agriculture. They
include “Computers and electronics in agriculture”; it is 4.9% of all articles (Figure 4).
Figure 4: Scientific editions with the most number of publications on precision agriculture.
654 7661005 1056
1180
0
500
1000
1500
2014 2015 2016 2017 2018
Nu
mb
er o
f
pu
bli
cati
on
s, p
iece
s
Years
3662
1938
15331465129212861206116910691049
0
500
1000
1500
2000
2500
3000
3500
4000
Nu
mb
er o
f p
ub
lica
tio
ns,
pie
ces
Research areas
Agriculture
Plant sciences
Science technology other topics
Computer science
Environmental sciences ecology
Engineering
Mathematical computational
biology
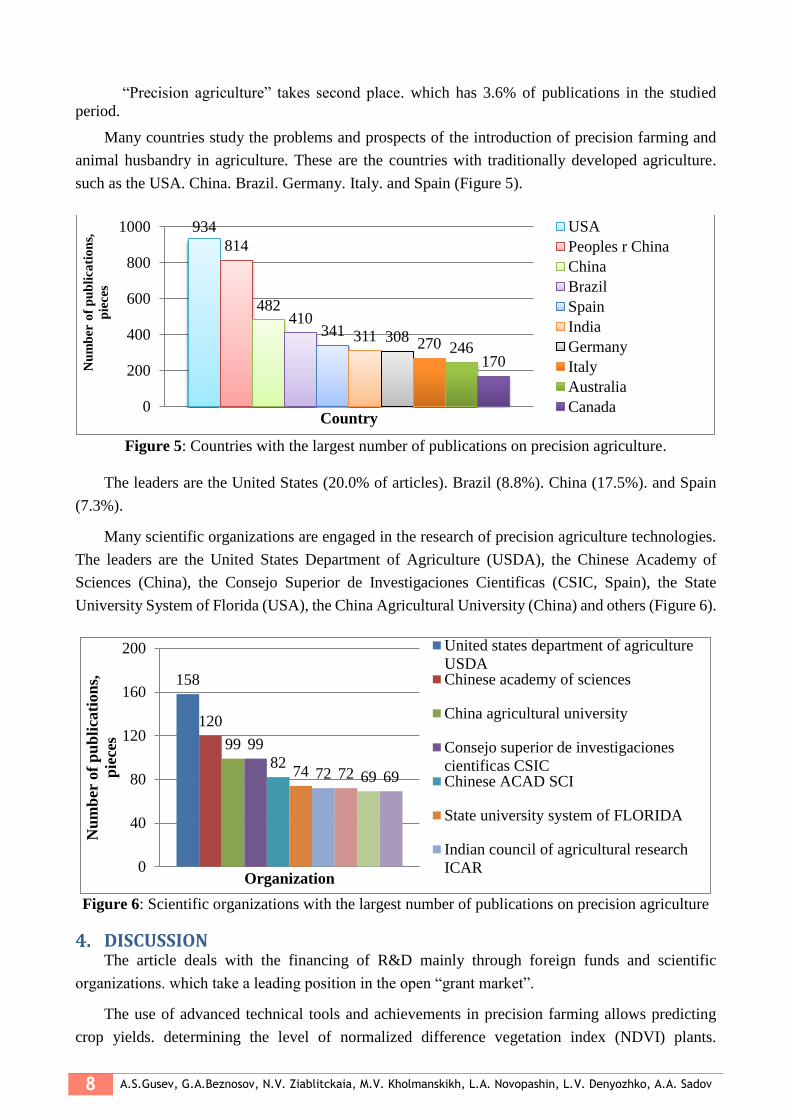
8 A.S.Gusev, G.A.Beznosov, N.V. Ziablitckaia, M.V. Kholmanskikh, L.A. Novopashin, L.V. Denyozhko, A.A. Sadov
“Precision agriculture” takes second place. which has 3.6% of publications in the studied
period.
Many countries study the problems and prospects of the introduction of precision farming and
animal husbandry in agriculture. These are the countries with traditionally developed agriculture.
such as the USA. China. Brazil. Germany. Italy. and Spain (Figure 5).
Figure 5: Countries with the largest number of publications on precision agriculture.
The leaders are the United States (20.0% of articles). Brazil (8.8%). China (17.5%). and Spain
(7.3%).
Many scientific organizations are engaged in the research of precision agriculture technologies.
The leaders are the United States Department of Agriculture (USDA), the Chinese Academy of
Sciences (China), the Consejo Superior de Investigaciones Cientificas (CSIC, Spain), the State
University System of Florida (USA), the China Agricultural University (China) and others (Figure 6).
Figure 6: Scientific organizations with the largest number of publications on precision agriculture
DISCUSSION The article deals with the financing of R&D mainly through foreign funds and scientific
organizations. which take a leading position in the open “grant market”.
The use of advanced technical tools and achievements in precision farming allows predicting
crop yields. determining the level of normalized difference vegetation index (NDVI) plants.
934
814
482410
341 311 308 270 246170
0
200
400
600
800
1000
Nu
mb
er o
f p
ub
lica
tio
ns,
pie
ces
Country
USA
Peoples r China
China
Brazil
Spain
India
Germany
Italy
Australia
Canada
158
120
99 99
8274 72 72 69 69
0
40
80
120
160
200
Nu
mb
er o
f p
ub
lica
tion
s,
pie
ces
Organization
United states department of agriculture
USDAChinese academy of sciences
China agricultural university
Consejo superior de investigaciones
cientificas CSICChinese ACAD SCI
State university system of FLORIDA
Indian council of agricultural research
ICAR

*Corresponding author (A.Sadov) E-mail: [email protected] ©2019 International Transaction Journal of Engineering, Management, & Applied Sciences & Technologies. Volume 10 No.10 ISSN 2228-9860 eISSN 1906-9642 CODEN: ITJEA8 Paper ID:10A12D http://TUENGR.COM/V10A/10A12D.pdf DOI: 10.14456/ITJEMAST.2019.131
9
performing analysis and considering the variability of the level of moisture supply. which is of great
importance in crop growing. Modern large-scale agricultural production cannot be imagined without
precision farming technologies. which are possible on the basis of the use of indicator systems,
sensors, and lidars, various prediction algorithms and artificial intelligence.
The development of precision farming technologies is associated with ever-increasing demands
for economic efficiency and ecological safety of farming. There is a need to reduce the cost of
expensive fertilizers and plant protection products as well as fuel and lubricants.
CONCLUSION The use of the elements of precision agriculture makes a huge commercial market for the
development of the agro-industrial sector throughout the world. We have been proposed the
coefficient of regulatory resource intensity development shows an average level of resource use in the
analyzed agricultural enterprises of grain specialization depending on the soil quality. intensity use of
labour. fixed capital and material resources. In recent years. the leading countries have invested great
amounts of money and have made great efforts to take advantage of this industry. The leaders in these
studies are the countries with developed agriculture such as the United States, China, Brazil, Spain,
etc. It is obvious that all these technologies should be developed intensively in Russia but this should
be associated with increased investments in research in the field of precise agriculture.
AVAILABILITY OF DATA AND MATERIAL The data used is included in this article. No data is generated from this study.
CONFLICT OF INTERESTS The authors confirm that the revealed information does not contain a conflict of interest.
ACKNOWLEDGMENT The work was carried out with the support (FGBOU VO) the Ural State Agrarian University.
REFERENCES [1] .Comparetti. Antonio. (2011). Precision Agriculture: Past. Present and Future
[2] Pierce. F. J.. & Nowak. P. (1999). Aspects of precision agriculture. Advances in Agronomy. 67. 1–85
[3] Cook. S. E.. & Bramley. R. G. V. (1998). Precision agriculture opportunities. benefits and pitfalls of
site-specific crop management in Australia. Animal Production Science. 38(7). 753–763
[4] Staford. J. V. (2000). Implementing precision agriculture in the 21st century. Journal of Agricultural
Engineering Research. 76(3). P.267–275.
[5] Tullo. Emanuela; Finzi. Alberto; Guarino. Marcella Review: Environmental impact of livestock
farming and Precision Livestock Farming as a mitigation strategy. Science of the total environment.
2019. 650(2): 2751-2760. DOI: 10.1016/j.scitotenv.2018.10.018
[6] Anestis. V.; Bartzanas. T.; Kittas. C. The life cycle inventory analysis for the milk produced in a
Greek commercial dairy farm-the link to precision livestock farming. PREC LIV FARM 2015. P.:
670-680. 2015 Precision Livestock Farming 2015
[7] Bartzanas. T., Papanastasiou. D. K., Skoufos. I., et al. Environmental friendly poultry production
using novel precision livestock techniques. 7 EC PLF 2015: 811-819. Precision Livestock Farming
2015
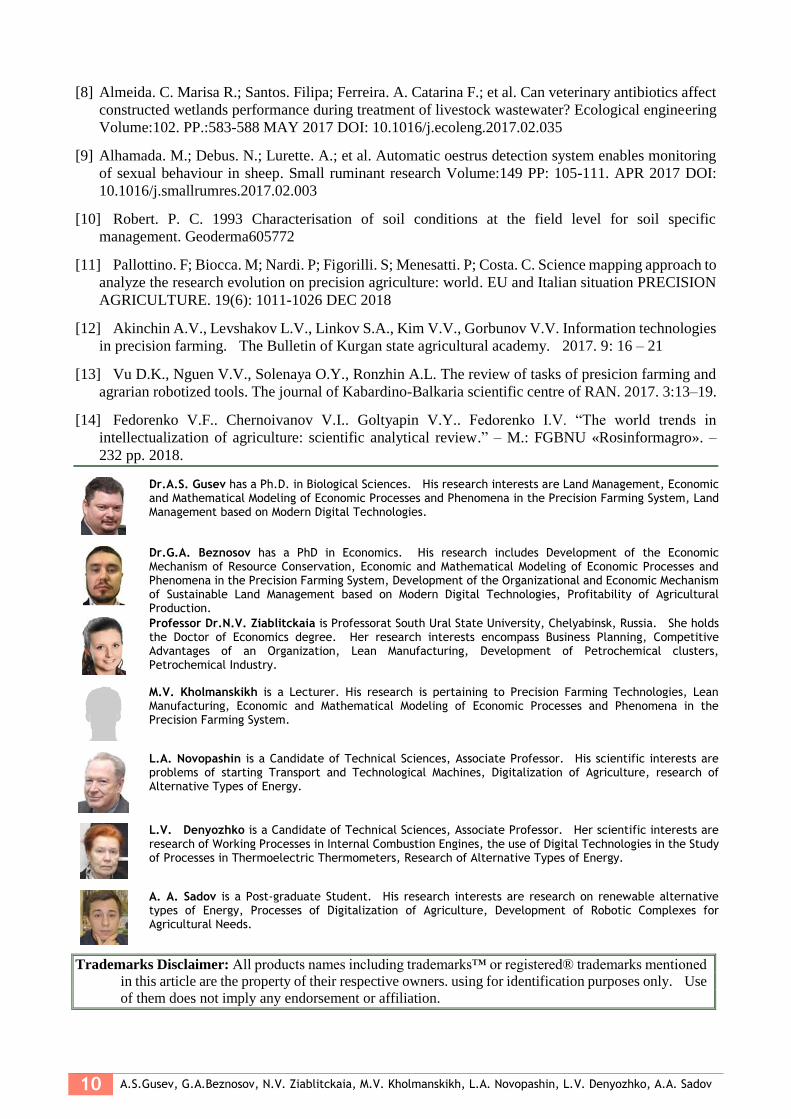
10 A.S.Gusev, G.A.Beznosov, N.V. Ziablitckaia, M.V. Kholmanskikh, L.A. Novopashin, L.V. Denyozhko, A.A. Sadov
[8] Almeida. C. Marisa R.; Santos. Filipa; Ferreira. A. Catarina F.; et al. Can veterinary antibiotics affect
constructed wetlands performance during treatment of livestock wastewater? Ecological engineering
Volume:102. PP.:583-588 MAY 2017 DOI: 10.1016/j.ecoleng.2017.02.035
[9] Alhamada. M.; Debus. N.; Lurette. A.; et al. Automatic oestrus detection system enables monitoring
of sexual behaviour in sheep. Small ruminant research Volume:149 PP: 105-111. APR 2017 DOI:
10.1016/j.smallrumres.2017.02.003
[10] Robert. P. C. 1993 Characterisation of soil conditions at the field level for soil specific
management. Geoderma605772
[11] Pallottino. F; Biocca. M; Nardi. P; Figorilli. S; Menesatti. P; Costa. C. Science mapping approach to
analyze the research evolution on precision agriculture: world. EU and Italian situation PRECISION
AGRICULTURE. 19(6): 1011-1026 DEC 2018
[12] Akinchin A.V., Levshakov L.V., Linkov S.A., Kim V.V., Gorbunov V.V. Information technologies
in precision farming. The Bulletin of Kurgan state agricultural academy. 2017. 9: 16 – 21
[13] Vu D.K., Nguen V.V., Solenaya O.Y., Ronzhin A.L. The review of tasks of presicion farming and
agrarian robotized tools. The journal of Kabardino-Balkaria scientific centre of RAN. 2017. 3:13–19.
[14] Fedorenko V.F.. Chernoivanov V.I.. Goltyapin V.Y.. Fedorenko I.V. “The world trends in
intellectualization of agriculture: scientific analytical review.” – M.: FGBNU «Rosinformagro». –
232 pp. 2018.
Dr.A.S. Gusev has a Ph.D. in Biological Sciences. His research interests are Land Management, Economic and Mathematical Modeling of Economic Processes and Phenomena in the Precision Farming System, Land Management based on Modern Digital Technologies.
Dr.G.A. Beznosov has a PhD in Economics. His research includes Development of the Economic Mechanism of Resource Conservation, Economic and Mathematical Modeling of Economic Processes and Phenomena in the Precision Farming System, Development of the Organizational and Economic Mechanism of Sustainable Land Management based on Modern Digital Technologies, Profitability of Agricultural Production.
Professor Dr.N.V. Ziablitckaia is Professorat South Ural State University, Chelyabinsk, Russia. She holds the Doctor of Economics degree. Her research interests encompass Business Planning, Competitive Advantages of an Organization, Lean Manufacturing, Development of Petrochemical clusters, Petrochemical Industry.
M.V. Kholmanskikh is a Lecturer. His research is pertaining to Precision Farming Technologies, Lean Manufacturing, Economic and Mathematical Modeling of Economic Processes and Phenomena in the Precision Farming System.
L.A. Novopashin is a Candidate of Technical Sciences, Associate Professor. His scientific interests are problems of starting Transport and Technological Machines, Digitalization of Agriculture, research of Alternative Types of Energy.
L.V. Denyozhko is a Candidate of Technical Sciences, Associate Professor. Her scientific interests are research of Working Processes in Internal Combustion Engines, the use of Digital Technologies in the Study of Processes in Thermoelectric Thermometers, Research of Alternative Types of Energy.
A. A. Sadov is a Post-graduate Student. His research interests are research on renewable alternative types of Energy, Processes of Digitalization of Agriculture, Development of Robotic Complexes for Agricultural Needs.
Trademarks Disclaimer: All products names including trademarks™ or registered® trademarks mentioned
in this article are the property of their respective owners. using for identification purposes only. Use
of them does not imply any endorsement or affiliation.

*Corresponding author (Muhammad Junaid Siraji) E-mail: [email protected] ©2019 International Transaction Journal of Engineering, Management, & Applied Sciences & Technologies. Volume 10 No.12 ISSN 2228-9860 eISSN 1906-9642 CODEN: ITJEA8 Paper ID:10A12E http://TUENGR.COM/V10A/10A12E.pdf DOI: 10.14456/ITJEMAST.2019.155
1
International Transaction Journal of Engineering, Management, & Applied Sciences & Technologies
http://TuEngr.com
PAPER ID: 10A12E
AN INVESTIGATION ON STAKEHOLDERS’ PERCEPTION
REGARDING EFFECTIVENESS OF SOCIAL MEDIA IN
PAKISTAN’S HIGHER EDUCATION
Muhammad Junaid Siraji a*
, Liaquat Hussain a
a
Institute of Education & Research, Gomal University, Dera Ismail Khan, KP, PAKISTAN.
A R T I C L E I N F O
A B S T R A C T Article history: Received 15 April 2019
Received in revised form 22
July 2019
Accepted 30 July 2019
Available online 05 August
2019
Keywords: Social media
effectiveness; Higher
educational institutions;
Parents’ perception;
Students' perception;
Teachers’ perception.
In the contemporary era, social media is considered as a vital tool
for providing opportunities to different groups of stakeholders to get
them informed about shared interests. It helps stakeholders in sharing
views, organizing demands and managing their interventions. The
effectiveness of social media has become vital phenomenon which needs
further exploration in different context including higher education. The
stakeholders’ perception (students, parents & teachers) about social
media effectiveness has developed the leading and burning issue in the
context of higher education. These concepts have been extracted from
the existing research studies which were transformed into theoretical
framework wherein hypotheses were developed. The perceptions of the
said stakeholders were analyzed by collecting primary data from
students, parents, and teachers hailing from the higher educational
institutions of Khyber Pakhtunkhwa. The results of study provide
significant information in deciding relationships between research
concepts.
© 2019 INT TRANS J ENG MANAG SCI TECH.
INTRODUCTION 1.
In the modern age of globalization, social media has played critical role by sharing information
over digital technologies thereby connecting diverse group of individuals for certain well-defined
motives. The social media is the main channel of communicating information over the advanced
technologies which is helpful in creating and sharing ideas, information and expression around virtual
groups (Greenhow et al., 2006). The social media talk about applications of diverse tools and
techniques by visiting diverse websites over internet that are designed to allow different individuals
to share information more quickly and effectively (Hemmi et al., 2009). Social media played critical
role in developing interactions by linking like-minded people who have similar interests. The
effectiveness and vitality of social media become imperative in each domain and context but its role
in higher education becomes phenomenal due to application and adaptability of the digital
technologies (Sharda et al., 2013).
©2019 International Transaction Journal of Engineering, Management, & Applied Sciences & Technologies

2 Muhammad Junaid Siraji, Liaquat Hussain
The higher educational institutions being the highest seats of the learning and teaching are
responsible to deliver quality education to students thus producing competent and committed future
workforces to different sectors of economy (Mukhaini et al., 2014). In higher education, different
stakeholders (students, parents & teachers) are frequently held liable in maintaining the mission and
values which are mostly related to the long-lasting objectives and standards of institutions (Gemma &
Marín, 2015). The stakeholders are accountable for the sole educational experiences, so, letting them
offer distinctive social media involvements just seems right. They can play pivotal role by sharing the
institutional standards and values over social media to up-bring the standing along with norms and
values of the concerned institutions (Akhmad et al., 2018). In same line, stakeholders over effective
utilization of social media might overwhelm the situation at pat to international standards.
THEORETICAL DEVELOPMENT 2.
In the contemporary competitive era, the emergent role of social media has become dynamic in
each domain like society, politics, economics, and education (Sharda et al., 2013). Certainly, there
exists some new opportunities with regard to applications of various social media networks like social
networking websites, content communities, shared projects, wikis, blogs and other different forums
which have their momentous impact upon the educational process for all the stakeholders (teachers,
students and parents) (Gemma & Marín, 2015). Social media, with the introduction and application of
advanced technologies, gain continuous admiration in the contemporary era (Christin & Harney,
2017). The effective social media use bring along certain wide-ranging positive values as it is pool of
the diverse connected communications networks committed to community-based ideas, interaction,
content sharing and collaboration (Akhmad et al., 2018). These collaborations might have certain
benefits for stakeholders (students, parents & teachers) when used in context of the teaching and
learning environment especially in the higher institutions.
2.1 STAKEHOLDERS’ PERCEPTION The present study is a response to the widespread use of social media by different stakeholders
for academic-related commitments. This study might highlight social media as effective teaching and
learning instrument in higher education. With respect to the higher education, different stakeholders
are associated with institutions in which students, parent, and teachers are foremost. These are real
shareholders who are ultimate beneficiaries of educational quality and might have wide-ranging
contribution in enriching educational standards. The social media might be sources of academic
interaction among the students which might be helpful in inspiring their potentials towards
shortcomings in their academic activities. Conversely, social media has gained attention of parents as
they are worried about time spent by children on social media regarding negative and positive
consequences. Equally, teachers are only source who through motivation can inspire students and
parents towards the positive usages of social media for educational purposes.
2.1.1 PERCEPTION OF STUDENTS
In the students’ lifetime, the most prominent dynamic forces are learning by studying to gain
certain knowledge to become the individuals of honorable characters. But nowadays, the teaching and
learning process is totally threatened by students fetching captured by maneuvers of social
networking (Isman & Dabaj, 2004). On one hand, students are able to obtain updated knowledge by

*Corresponding author (Muhammad Junaid Siraji) E-mail: [email protected] ©2019 International Transaction Journal of Engineering, Management, & Applied Sciences & Technologies. Volume 10 No.12 ISSN 2228-9860 eISSN 1906-9642 CODEN: ITJEA8 Paper ID:10A12E http://TUENGR.COM/V10A/10A12E.pdf DOI: 10.14456/ITJEMAST.2019.155
3
using the social media networking but on other hand, students ignore their studies by disbursing their
time on different websites of social networking instead of learning academic credentials and
interacting with those people who have ample knowledge in this regard (Hamid et al., 2011).
Consequently, the active and frequent partaking in social media networking might adversely mark
academic successes by hindering their journeys towards future careers (Hamid et al., 2015). Students
have diverse perceptions about social media usages about positive and negative consequences
associated with use of social media networking for diverse drives (social interaction & academic
information) (Akhmad et al., 2018).
2.1.2 PERCEPTION OF PARENTS
The literature revealed that parents have diverse responses around the usage of social media as
social networking is sometimes helpful in accommodating students in academic conversation but
most of time it is considered as time-wasting activities (Greenhow et al., 2006). Most of the parents
perceive that students are using social media for social interaction and not for academic collaboration
which in turn greatly affects their academic performance and achievements (Funk et al., 2009).
Further revealed that issues of social media usage results in rigid conversations among the students
and parents as both of them view social media at both the ends (positive & negative dimensions)
(Allen et al., 2013). Similarly, due to rapid technological changes, the parents frequently fall overdue
their children in understanding the digital technologies' practices (Christin & Harney, 2017). Since
students know often more about different websites of social media rather than their parents, students
are often at risk of learning problematic behaviors by using social media from different websites.
2.1.3 PERCEPTION OF TEACHERS
The teachers’ perception matter a lot with regard to the usages of social media by their students
as the teachers are always of the opinion that the social media has both positive and negative impact
on students’ behaviors, learning activities along with academic performance and successes (Gulbahar
& Hunain, 2008). Networking (social media) can encourage students to effect linguistic problems and
can improve student engagement in their academic curriculum. As the dominance of technologies
(social) is fast-growing, so, teachers must comprehend how it is disturbing the students’ morale so,
there is dire need to educate students about the consequences of social media (Gemma & Marín,
2015). The core aim of research is to explore capabilities of teachers that how effective social media
has established in the cognitive and affective growth of students (Christin & Harney, 2017). In this
regard, diverse social media networking like Twitter, Facebook, LinkedIn, and other applications
might be the best sources of the learning and teaching when used by students under the guidance of
the teachers (Akhmad et al., 2018).
2.2 SOCIAL MEDIA EFFECTIVENESS In past, the sharing of thoughts and information communication among different groups of
individuals was constrained by different dynamics like long-distance, availability of resources,
accessibility of different means and lack of different channels for communication (Greenhow et al.,
2006). There exist solid prospects that effective utilization of social media technologies mechanisms
confirm constant expansion and quality control in higher education. The social media effectiveness is
linked to focused agility and is considered the best source of international and regional merger of

4 Muhammad Junaid Siraji, Liaquat Hussain
diverse procedures and processes (Hemmi et al., 2009). This, in turn, rises necessity for active
contrivances for professional gratitude of higher education credentials. In education sector, social
media networking offering students prospect to link with other students, alumni and teachers
regarding both within and outside domain (Allen et al., 2013). The social-networking applications
have capacity to attract, encourage and involve students in the extensive communicative practices
(Akhmad et al., 2018).
2.3 THEORETICAL FRAMEWORK Figure 1 shows the theoretical framework used in this study. The correlation and regression
analysis are used to explore the effectiveness of social media.
Figure 1: the theoretical framework regarding social media effectiveness.
2.4 HYPOTHESES OF STUDY Hypotheses are given as
H#1: There is a positive and significant association between stakeholders’ (students, parents &
teachers) perception and social media effectiveness (correlation analysis).
H#2: There is a significant and positive impact of the stakeholders’ (students, parents & teachers)
perception on the social media effectiveness (regression analysis).
RESEARCH METHODOLOGY 3.
The research methodology is the detailed procedures and methods which are used to identify,
select, process and analyze information about research issues. The methodology section permits
readers to critically appraise the whole trajectory of the research study. This section mainly answers
two queries, one relates to how the data will be collected and the second relates to, how the collected
data will be analyzed by using different statistical tools and techniques.
3.1 RESEARCH DESIGN The research design of this study is both descriptive as well as exploratory to explore/examine
phenomenon under considerations more systematically by using the descriptive statistics and the
inferential statistics, according to Creswell & Williams (2012).
3.2 SURVEY APPROACH The survey approach is the best technique as recommended and used by various researchers for
data collection in the form of different questions/statements from the respondents. As compared to
other approaches (experimentation and direct observation) surveys produce a wider range of
information about the research phenomenon (Vehovar & Lozar, 2008). For this purpose, usually the
researchers used questionnaire to ask different questions from different dimensions from the

*Corresponding author (Muhammad Junaid Siraji) E-mail: [email protected] ©2019 International Transaction Journal of Engineering, Management, & Applied Sciences & Technologies. Volume 10 No.12 ISSN 2228-9860 eISSN 1906-9642 CODEN: ITJEA8 Paper ID:10A12E http://TUENGR.COM/V10A/10A12E.pdf DOI: 10.14456/ITJEMAST.2019.155
5
respondents about the research phenomena under consideration (Sekaran & Bougie, 2013). In this
study, the researcher used survey approach by collecting primary data over questionnaire to ask
different questions about the research variables.
3.3 POPULATION & SAMPLE The population in the current study comprises the students, parents, and teachers hailing from
higher educational institutions of Khyber Pakhtunkhwa. From this population, sample was drawn by
using stratified sampling that is usually “used probability method that is superior to random sampling
because it reduces sampling error”. This study used the sampling formula as presented by Black and
Champion (1976), giving a sample of 230 respondents.
3.4 DATA COLLECTION METHODS The data collection is an essential feature of any kind of research in social sciences. The
incomplete and way-out data collection can influence outcomes of study and eventually leads to
worthless outcomes. The data is always collected from different sources likewise the secondary and
primary data collection (Lave & March, 1993). The secondary data was collected from diverse online
databases including the research journals and digital libraries while for primary data, researchers
mostly used diverse tools like observations, interviews, questionnaires and surveys (Lescroël et al.,
2014). The researcher used questionnaire tool for primary data collection.
3.5 TOOLS FOR DATA ANALYSIS After the data collection, both secondary and primary, data analysis is the next phase to evaluate
the data and to obtain the desired results. For data analysis, two tools are most significant which are
widely used in social research studies (Tabachnick & Fidell, 2007). In this regard, a descriptive tool is
used to analyze the data description of variables while the testing of hypotheses relates to examining
relationships among the variables of research. Therefore, the present study will have to use both the
descriptive and inferential tools to analyze the data (Adèr & Mellenbergh, 2008).
3.6 QUESTIONNAIRE DESIGN & MEASUREMENT The questionnaire is a research instrument comprising diverse questions asked from respondents
to collect desired data about research concepts that are used for statistical analysis (Oppenheim,
2000). The use of questionnaires has certain advantages over certain other survey types like it is
inexpensive, less time-consuming tool and has homogenous responses that mark it meek to assemble
the data (Munn & Drever, 2004). The questionnaires are limited sharply with fact that respondents
might “be able to read questions and respond” accordingly (Gillham, 2008).
DATA ANALYSIS & DISCUSSION 4.
This is the main section wherein the results obtained through hypotheses testing by using diverse
statistical procedures thereby reaching conclusion more comprehensively. It comprises two sections
like the descriptive and the inferential analysis. The inferential analysis provided the “data about the
relationships among the research variables” through the statistical procedures. For this purpose, two
tools were used as the correlation and regression.
4.1 CORRELATION ANALYSIS The correlation analysis provided data about association, strength, and direction of relationships

6 Muhammad Junaid Siraji, Liaquat Hussain
between the predicting variables (stakeholders’ perceptions) and a criterion variable (social media
effectiveness).
Table 1 Correlation Analysis (Hypothesis H#1) (N=224) Students
Perception
Parents
Perception
Teachers
Perception
Students Perception Pearson Correlation 1 0.373**
0.534**
Sig. (2-tailed) <0.001 <0.001
Parents Perception Pearson Correlation 0.373**
1 0.517**
Sig. (2-tailed) <0.001 <0.001
Teachers Perception Pearson Correlation 0.534**
0.517**
1
Sig. (2-tailed) <0.001 <0.001
Social Media Effectiveness Pearson Correlation 0.653**
0.508**
0.751**
Sig. (2-tailed) <0.001 <0.001 <0.001
**. Correlation is significant at the 0.01 level (2-tailed).
To examine the association between stakeholders (students, parents & teachers) perception about
social media effectiveness, the correlation procedure was used so as to examine the strength and
direction of relationship. The correlation shows that all predictors are positively and significantly
correlated (associated) with the criterion variable (social media effectiveness). Likewise, the
correlation between the students perception and criterion variable (R=.653 & P-value =<0.001), the
parents perception and criterion variable (R=.508 & P-value =<0.001) and the teachers perception
and criterion variable (R=.751 & P-value =<0.001). Therefore, from the above results, the hypothesis
# 1 is accepted. These findings are inlined with the findings of previous research studies (Isman &
Dabaj, 2004; Hemmi et al., 2009; Hamid et al., 2011; Hamid et al., 2015). Therefore, the results of
this study have been validated through the results obtained from the previous research studies.
4.2 REGRESSION ANALYSIS The regression analysis provided the data about the cause-and-effect relationships of the
predicting variables (stakeholders’ perceptions) on the criterion variable (social media effectiveness).
Is helps the researchers regarding the predictability of the criterion variables through predictors.
Table 2 Regression Analysis (Hypothesis H#2) (Model Summary) Model R R Square Adjusted R Square Std. Error Estimate F Sig.
1 0.814a 0.663 0.658 0.373 142.97 <0.001
b
Table 2a Regression Analysis (Hypothesis H#2) (Coefficient of Regression) Model Unstandardized
Coefficients
Standardized
Coefficients
t Sig.
B Std. Error Beta
1 (Constant) -0.028 0.170 -0.163 0.871
Students Perception 0.351 0.049 0.336 70.160 0.020
Parents Perception 0.102 0.040 0.189 20.860 0.041
Teachers Perception 0.566 0.056 0.510 100.035 0.017
a. Predictors: Students Perception, Parents Perception, Teachers Perception b. Dependent Variable: Social Media Effectiveness
To examine the predictability of social media effectiveness through predictors (students, parents
& teachers) perceptions, the regression procedure was used. The result in Table 2 showed that the
predictors are responsible to bring about 66% change/variation in criterion variable (social media
effectiveness) supported by p-values significant on all the independent variables. Likewise, the
coefficient of regression in Table 2a shows that all the predictors have significant impact on the

*Corresponding author (Muhammad Junaid Siraji) E-mail: [email protected] ©2019 International Transaction Journal of Engineering, Management, & Applied Sciences & Technologies. Volume 10 No.12 ISSN 2228-9860 eISSN 1906-9642 CODEN: ITJEA8 Paper ID:10A12E http://TUENGR.COM/V10A/10A12E.pdf DOI: 10.14456/ITJEMAST.2019.155
7
criterion variables (students’ perception = 0.020), (parents perception = 0.041) and (teachers
perception = 0.017). Therefore, the students' and teachers' perceptions have strong impact on social
media effectiveness as compared to the parents’ perception. These results also supported the results
obtained from the correlation wherein the correlation between students' and teachers' perceptions is
higher than the parents’ perception. Thus, the hypothesis H#2 is accepted. These results are inlined
“with the results of the previous research studies” (Gemma & Marín, 2015; Hamid et al., 2015;
Christin & Harney, 2017; Akhmad et al., 2018). Therefore, results of this study have been similar to
the results obtained from the previous research studies on similar issues in similar context.
CONCLUDING REMARK 5.
In research, it is common aphorism that results are useless when not communicated properly in
the manner of compacted standard for readers and upcoming researchers. From the results from the
analysis in this study, the following conclusions have emerged:
o The hypothesis H#1 was tested over correlation procedure wherein the results showed that
students' and teachers' perception (0.653 & 0.751 respectively) have high correlation with the
effectiveness of social media as compared to parents' perception (0.508). The main reason
behind is the worriedness of parents about the children (students) continuous usages of social
networking as the students spent most of the time in social interaction on the social media
websites thereby ignoring their curriculum activities. These unintended consequences are the
main causes that why many parents seem to be worried about the usages of social media.
o The hypothesis H#2 was tested through the regression procedure to observe the impact of
predictors (students, parents, and teachers) perceptions on social media effectiveness. The
results revealed that again the student's and teachers' perception has significant impact on the
social media effectiveness (0.020 & 0.017 respectively) while the significance level of parents'
perception was somehow weak (0.041). The possible reason of said significance level might be
the conscious efforts of parents for protecting their children from harmful consequence of
social media as is not surprising that parents are worried about their children activities on the
social media networking sites.
The stakeholders (students, parents & teachers) are direly needed to be aware of the positivity
and negativity of the social media usages. Moreover, students are required to spend their precious
time in curriculum-related activities thereby ignoring the social interaction on the social media
websites which might help them in focusing their academic activities thereby achieving the desired
academic status. Similarly, parents are required to be well abreast towards applications of the social
media tools and their ultimate influences on the attitudes and behaviors of their children. Likewise,
parents are required to motivate children in a friendly environment about positive aspects of social
media usages thereby intimating then about negative dimensions. Finally, the teachers are required to
put more emphasis on the effective usage of social media on the part of the students thereby obtaining
desirous information through social media.
AVAILABILITY OF DATA AND MATERIAL 6.
The used and generated data is available upon request to the corresponding author.

8 Muhammad Junaid Siraji, Liaquat Hussain
REFERENCES 7.
Adèr, H. J., & Mellenbergh, G. J. (2008). Advising on research methods: A consultant's companion. Huizen, the Netherlands: Johannes van Kessel Publishing.
Akhmad, H., Amirul, M., Yatim, R., & Ferdiaz, S. (2018). Building an online community: Student
teachers’ perceptions on the advantages of using social networking services. Turkish Online Journal of Distance Education, 19 (1), 46-61.
Allen, M., Wicks, R. H., & Schulte, S. (2013). Online environmental engagement among youth: Influence of parents, attitudes and demographics. Mass Communication & Society, 16(5), 661-686.
Christin, T., & Harney, P. (2017). Parental Perception of Mobile Device Usage in Children and Social Competency. Walden Dissertations and Doctoral Studies, Walden University.
Creswell, J. W., & Williams, P. (2012). Educational research: Planning, conducting and evaluating
quantitative and qualitative research. Upper Saddle River, NJ: Prentice-Hall.
Funk, J., Brouwer, J., Curtiss, K., & McBroom, E. (2009). Parents of preschoolers: Expert media
recommendations and ratings knowledge, media-effects beliefs, and monitoring practices.
Pediatrics, 123(3), 981-988.
Gemma, T., & Marín, V. (2015). Enhancing learning with the social media: student, teachers’ and parents
perceptions on a debate activity. New Approaches in Educational Research, 4 (1). 46-53.
Gillham, B. (2008). Developing a questionnaire (2nd Ed.). London, UK: Continuum International
Publishing Group Ltd.
Greenhow, C., Robelia, B., & Hughes, J. E. (2006). Learning, teaching, and scholarship in a digital age. Educational Researcher, 38(4), 246-258.
Gulbahar, Y., & Hunain, H. (2008). Improving the technology integration skills of prospective teachers
through perception and practice: A case study. The Turkish Online Journal of Educational Technology, 7(4), 71-81.
Hamid, S., Kurnia, S., Waycott, J., & Chang, S. (2015). Understanding students' perceptions of the
benefits of online social networking use for teaching and learning. Internet and Higher Education, 26, 1–9.
Hemmi, A., Bayne, S., & Land, R. (2009). The appropriation and repurposing of social technologies in higher education. Journal of Computer Assisted Learning, 25(1), 19–30.
Isman, A., & Dabaj, F. (2004). Attitudes of students towards Internet. Journal of Technology and Teacher Education, 11(4), 549-577.
Lave, C. A., & March, J. G. (1993). An introduction to models in the social sciences. Lanham, Md:
University Press of America.
Lescroël, A., Ballard, G., Authier, M., & Ainley, D. (2014). Data Collection and Analysis by Dr. Roger
Sapsford, Victor Jupp ISBN 0-7619-5046-X.
Mukhaini, E., Qayoudhi, W., & Badi, A. (2014). Adoption of social networking in education: A study of
the use of social networks by higher education students in Oman. Journal of International Education Research, 10(2), 143.
Munn, P., & Drever, E. (2004). Using questionnaires in small-scale research: A beginner's guide. Glasgow, Scotland: Scottish Council for Research in Education.
Oppenheim, A. N. (2000). The questionnaire design, interviewing and attitude measurement (New Ed.). London, UK: Continuum International Publishing Group Ltd.
Sekaran, U., & Bougie, R. (2013). Research Methods for Business: A Skill-Building Approach (6th Ed.). John Wiley and Sons, Inc.

*Corresponding author (Muhammad Junaid Siraji) E-mail: [email protected] ©2019 International Transaction Journal of Engineering, Management, & Applied Sciences & Technologies. Volume 10 No.12 ISSN 2228-9860 eISSN 1906-9642 CODEN: ITJEA8 Paper ID:10A12E http://TUENGR.COM/V10A/10A12E.pdf DOI: 10.14456/ITJEMAST.2019.155
9
Sharda, G., Anita, D., & Pragya, G. (2013). Social Media in Quality Enhancement in Higher Education.
International Journal of Research and Development, 2 (1), 2319–5479.
Tabachnick, B. G., & Fidell, L.S. (2007). Using Multivariate Statistics, 5th Edition. Boston: Pearson Education, Inc./Allyn and Bacon,
Vehovar, V., & Lozar, M. K. (2008). Overview: Online Surveys. In Fielding, N., Lee, R. M., Blank, G.
The SAGE Handbook of Online Research Methods. London: SAGE. pp. 177–194.
Muhammad Junaid Siraji is a Ph.D. scholar at the Institute of Education & Research, Gomal University, Dera Ismail Khan, Khyber Pakhtunkhwa, Pakistan. He is working as Assistant Director Admissions, Gomal University, Dera Ismail Khan. His research area is Social Media Effectiveness in Higher Education.
Dr. Liaqat Hussain is an Assistant Professor at the Institute of Education & Research, Gomal University, Dera Ismail Khan, Khyber Pakhtunkhwa, Pakistan. He got his Ph.D. Degree from Institute of Education & Research, Gomal University. His research is focused on Computer Literacy in Education.
Trademarks Disclaimer: All product names including trademarks™ or registered® trademarks mentioned
in this article are the property of their respective owners. using for identification purposes only. The
use of them does not imply any endorsement or affiliation.

*Corresponding author (Sarychev Vladislav Andreevich). E-mail: [email protected] ©2019 International Transaction Journal of Engineering, Management, & Applied Sciences & Technologies. Volume 10 No.10 ISSN 2228-9860 eISSN 1906-9642 CODEN: ITJEA8 Paper ID:10A12F http://TUENGR.COM/V10A/10A12F.pdf DOI: 10.14456/ITJEMAST.2019.156
1
International Transaction Journal of Engineering, Management, & Applied Sciences & Technologies
http://TuEngr.com
PAPER ID: 10A12F
INFLUENCES OF THE IODINE-POLYMER PREPARATION
"MONCLAVIT-1" ON THE HORMONAL, MORPHOLOGICAL
AND BIOCHEMICAL STATUS OF THE BLOOD OF LAMBS OF
WEST SIBERIAN MEAT BREED
Afanasyeva Antonina Ivanovna a*
, Sarychev Vladislav Andreevich b
,
Katamanov Sergey Grigorievich c
, Loretts Olga Gennadievna d
, Neverova Olga Petrovna d
a Faculty of Biology and Technology, Altai State Agrarian University, RUSSIA
b Department of General Biology, Physiology, and Morphology of Animals, Altai State Agrarian University,
RUSSIA c Administration of the Rodinsky District of the Altai Territory, RUSSIA
d Ural State Agrarian University RUSSIA
A R T I C L E I N F O
A B S T R A C T Article history: Received 25 March 2019
Received in revised form 18 June 2019
Accepted 12 July 2019
Available online 05 August 2019
Keywords: Protein; carbohydrate,
lipid metabolism of
lambs; blood morphological
parameters; Iodine
deficiency; thyroid
hormones.
To increase the economic efficiency of sheep farming and produce
high-quality mutton, in 2011 in the Altai Territory a West Siberian meat
breed of sheep was created (patent No. 5728, 11.01.2011), characterized
by endurance, precocity, high reproductive qualities, and fertility (160 %).
Sheep are distinguished by a long, thick, white-colored grease coat and
noble crimpiness with wool fineness 21–24 microns. The yield of washed
wool is 57–58%, with wool length 9cm in uterus to 11.5cm in rams. The
slaughter yield reaches more than 50%. Biogeochemical features of their
breeding area are the limiting factor in the breed improvement process. In
particular, the Altai Territory is deficient in iodine. Iodine deficiency leads
to a decrease in the functional activity of the thyroid gland, metabolic
disorders, changes in the morpho-biochemical composition of the blood
and reduced productivity. In connection with this, a scheme of application
has been studied to study the effect of the iodine-polymer preparation
Monklavit-1 on the hormonal, morphological and biochemical status of
the blood of lambs of the West Siberian meat breed. It was established that
the drug contributes to the preservation of the physiological status of
lambs by increasing the level of thyroid hormones (T3 and T4) by 13.1
and 12.3 (P <0.01)%, respectively, as a result of which the
protein-synthetic function of the liver is activated, increases the
concentration of proteins in the blood of plastic values - albumin by 6.9%,
energy metabolism normalizes, which affected the increase in glucose
level by 15.7% (P <0.01) and decrease in cholesterol concentration by
25.0%; groups; the number of erythrocytes and hemoglobin increased by
8.1 and 9.7 (P <0.01), respectively, leukogram stabilized.
©2019 INT TRANS J ENG MANAG SCI TECH.
© 2019 International Transaction Journal of Engineering, Management, & Applied Sciences & Technologies

2 Afanasyeva A.I., Sarychev V.A., Katamanov S.G., Loretts O.G., Neverova O.P.
1. INTRODUCTION Modern Russian sheep breeding is traditional for many regions of the country, but due to the
rapid growth in the synthetic fibers production, wool production, on which sheep breeding was
mainly based, has decreased significantly [1]. Therefore, the problem of increasing the economic
efficiency of sheep breeding is solved by increasing the meat productivity of sheep raised in the
regions [2], as well as creating new breeds of sheep of intensive meat productivity [3]. At the Altai
Territory (Western Siberia) in 2011 after long-term breeding work, was bred the West Siberian meat
breed of sheep (patent number 5728, 11.01.2011), well adapted to breeding in harsh climatic
conditions with a long winter, low temperatures, sharply continental climate. Sheep are characterized
by endurance, precocity, high reproductive qualities, and fecundity (160%). Animals have a long,
thick, white-colored grease coat and noble crimpiness with wool of fineness 21–24 microns. The
output of scoured wool is 57–58%, with a hair length of 9 cm in uterus to 11.5 cm in rams, the
slaughter yield reaches more than 50%. The breed is in demand in many regions of the Russian
Federation.
Figure 1: West Siberian Meat Breed.
Despite the high productive indicators of these sheep, the biogeochemical characteristics of
their breeding area are the limiting factor in the process of improving the breed; in particular, the
Altai Territory belongs to the regions deficient in iodine.
In recent years, there has been a decrease in the content of bio elements in the soil and plants
throughout the world, including iodine [4]. Iodine is essential to trace elements that are part of
biologically active substances, it is necessary for the organism of animals and humans [5, 6].
The main role of iodine is its presence in the composition of thyroid hormones, which regulate
the basal metabolism, the consumption of carbohydrates, proteins and fats in the body, the
processes of heat formation, affect growth, development, and the function of reproduction [7].
Neogenesis, metabolic processes, resistance, hemopoiesis, growth and development of young
animals, processes of ruminal digestion are regulated by thyroid hormones [8, 9]. Lack of iodine in
animals leads to severe damage to the thyroid gland and disruption of growth and development, as
well as reduced product quality [10, 11]. In this regard, it is necessary to introduce
iodine-containing preparations and additives into the rations of sheep, however, the most common
inorganic iodine salts are not effective enough because of their instability and easy oxidation in air.

*Corresponding author (Sarychev Vladislav Andreevich). E-mail: [email protected] ©2019 International Transaction Journal of Engineering, Management, & Applied Sciences & Technologies. Volume 10 No.10 ISSN 2228-9860 eISSN 1906-9642 CODEN: ITJEA8 Paper ID:10A12F http://TUENGR.COM/V10A/10A12F.pdf DOI: 10.14456/ITJEMAST.2019.156
3
That’s why one of the promising areas in meeting the physiological needs for iodine of farm
animals is the use of organic forms of iodine [6], which is the iodine-polymer preparation
“Monklavit-1”.
In this regard, the purpose of our research was to study the effect of the iodine-polymer
preparation “Monklavit-1” on the hormonal, morphological and biochemical status of the blood of
lambs of West Siberian meat breed in the conditions of the Altai Territory.
2. MATERIAL AND RESEARCH METHODS
The research was performed in accordance with the thematic plan-task for the implementation
of research works (No. AAAA-A18-118090300003-7; from 03.09.2018) by order of the Ministry of
Agriculture of Russia. The experimental part of the work was carried out in LLC “Mayak” of the
Rodinsky district of the Altai Territory.
In our experience as an iodinating agent was used a wide spectrum of the iodine-polymer
medicine for animals, Monklovit – 1. It is an aqueous-polymer system based on iodine in the form
of a complex of poly-N-vinylamidecyclosulfoiodide.
The study of the effectiveness of the use of the drug "Monclavit-1" in the raising of lambs was
carried out on 20 rams at the age of 4 months, formed into groups after weaning from ewes: control
and experimental 10 heads each, with an average live weight of 27.1 ± 0.47 kg.
In the control group, lambs received the main ration, and in the experimental group, the main
ration and additionally the iodine-polymer preparation “Monclavit – 1” were added to the feed
immediately before feeding.
The drug was used in a dose of 1 ml per kg of live weight, 1 time per day, during the weaning
period - for 10 days and after 1 month for 10 days. Blood for research was obtained at the age of 4
and 12 months.
The level of thyroid hormones (triiodothyronine, thyroxin) and adrenal cortex (cortisol) in the
blood serum of animals was determined by immunoenzyme method on a Bio-rad photometer for
microplate (Model 680 Microplate Reader) using the “Thyroid IFA – thyroxin 01” using reagent kit
“Syrophi-Iph” 01 ", "SteroidIFA - cortisol 01 ".
A study of the morphological parameters of blood (the number of red blood cells, leukocytes,
and hemoglobin) was conducted on a veterinary hematology analyzer MicroCC-20Plus using
hematological reagents CDS (Clinical Diagnostic Solutions (Russia).
The smears were painted using the combined Popenheim method using May-Grunwald and
Romanovsky-Giemssee dyes. Counting and differentiation of leukocytes using a MICROMED-3
trinocular microscope with a ToupCam video eyepiece.
Blood biochemical parameters (total protein, albumin, glucose, calcium, phosphorus,
cholesterol, triglycerides, alkaline phosphatase) were studied on a BioChemSA analyzer using
“Vital” reagent diagnostic kits.
The determination of serum protein fractions (albumin, globulins, α-globulins β-globulins,
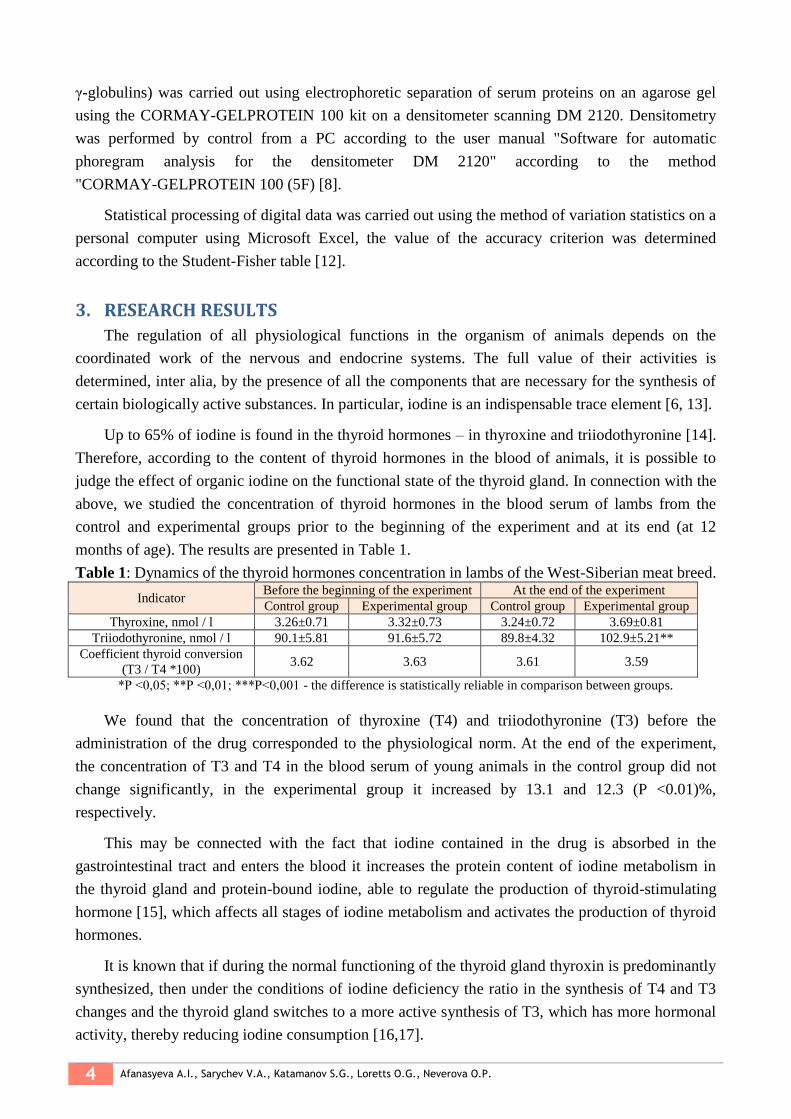
4 Afanasyeva A.I., Sarychev V.A., Katamanov S.G., Loretts O.G., Neverova O.P.
γ-globulins) was carried out using electrophoretic separation of serum proteins on an agarose gel
using the CORMAY-GELPROTEIN 100 kit on a densitometer scanning DM 2120. Densitometry
was performed by control from a PC according to the user manual "Software for automatic
phoregram analysis for the densitometer DM 2120" according to the method
"CORMAY-GELPROTEIN 100 (5F) [8].
Statistical processing of digital data was carried out using the method of variation statistics on a
personal computer using Microsoft Excel, the value of the accuracy criterion was determined
according to the Student-Fisher table [12].
3. RESEARCH RESULTS
The regulation of all physiological functions in the organism of animals depends on the
coordinated work of the nervous and endocrine systems. The full value of their activities is
determined, inter alia, by the presence of all the components that are necessary for the synthesis of
certain biologically active substances. In particular, iodine is an indispensable trace element [6, 13].
Up to 65% of iodine is found in the thyroid hormones – in thyroxine and triiodothyronine [14].
Therefore, according to the content of thyroid hormones in the blood of animals, it is possible to
judge the effect of organic iodine on the functional state of the thyroid gland. In connection with the
above, we studied the concentration of thyroid hormones in the blood serum of lambs from the
control and experimental groups prior to the beginning of the experiment and at its end (at 12
months of age). The results are presented in Table 1.
Table 1: Dynamics of the thyroid hormones concentration in lambs of the West-Siberian meat breed.
Indicator Before the beginning of the experiment At the end of the experiment
Control group Experimental group Control group Experimental group
Thyroxine, nmol / l 3.26±0.71 3.32±0.73 3.24±0.72 3.69±0.81
Triiodothyronine, nmol / l 90.1±5.81 91.6±5.72 89.8±4.32 102.9±5.21**
Coefficient thyroid conversion
(T3 / T4 *100) 3.62 3.63 3.61 3.59
*Р <0,05; **Р <0,01; ***Р<0,001 - the difference is statistically reliable in comparison between groups.
We found that the concentration of thyroxine (T4) and triiodothyronine (T3) before the
administration of the drug corresponded to the physiological norm. At the end of the experiment,
the concentration of T3 and T4 in the blood serum of young animals in the control group did not
change significantly, in the experimental group it increased by 13.1 and 12.3 (P <0.01)%,
respectively.
This may be connected with the fact that iodine contained in the drug is absorbed in the
gastrointestinal tract and enters the blood it increases the protein content of iodine metabolism in
the thyroid gland and protein-bound iodine, able to regulate the production of thyroid-stimulating
hormone [15], which affects all stages of iodine metabolism and activates the production of thyroid
hormones.
It is known that if during the normal functioning of the thyroid gland thyroxin is predominantly
synthesized, then under the conditions of iodine deficiency the ratio in the synthesis of T4 and T3
changes and the thyroid gland switches to a more active synthesis of T3, which has more hormonal
activity, thereby reducing iodine consumption [16,17].

*Corresponding author (Sarychev Vladislav Andreevich). E-mail: [email protected] ©2019 International Transaction Journal of Engineering, Management, & Applied Sciences & Technologies. Volume 10 No.10 ISSN 2228-9860 eISSN 1906-9642 CODEN: ITJEA8 Paper ID:10A12F http://TUENGR.COM/V10A/10A12F.pdf DOI: 10.14456/ITJEMAST.2019.156
5
In our studies, this was reflected in a higher thyroid conversion rate in the control group of
lambs at the end of the experiment. A higher level of T3 and T4 in the lambs of the experimental
group contributes to the strengthening of metabolic processes.
It is known that thyroid hormones have a significant impact on the processes of hemopoiesis
[18]. In this regard, we analyzed the morphological parameters of the blood of experimental lambs
(Table 2).
Table 2: Dynamics of morphological parameters of the blood of rams of the West-Siberian meat
breed when using the drug "Monklavit-1".
Indicator
Group
Before the beginning of the experiment At the end of the experiment
control experimental control experimental
Erythrocyte, 1012
/l 7.58±0.24 7.68±0.31 7.4± 0.37 8.0±0.35
leukocyte,109/l 11.7± 1.14 11.3±1.09 11.2±1.07 12.3±1.73
Hemoglobin, g/l 103.2±2.33 104.0±2.50 91.0±4.24 100.0±4.62*
Leukogram, %
Basophils - - 0.3±0.01 0.4±0.01
Eosinophils 0.2±0.02 0.2±0.03 0.2±0.03 0.3±0.03
Band neutrophils 1.6±0.7 1.7±0.6 1.5±0.5 1.6±0.8
Segmentonuclear
neutrophils 32.3±1.9 32.4±1.7 35.7±1.8 34.5±2.1
Monocytes 2.6±0.18 2.7±0.19 2.4±0.16 2.2±0.2
Lymphocytes 63.3±1.24 63.1±1.27 58.5±1.7 61.0±1.2
*Р <0,05; **Р <0,01;***Р<0,001 - the difference is statistically reliable in comparison between groups.
The morphological composition of blood in the rams of the control and experimental groups at
the age of 4 months before using the drug corresponded to the physiological norm. At 12 months
age, the red blood cells, hemoglobin, and leukocytes were lower by 2.4; 11.8 and 4.2%,
respectively, than at 4 months of age. In the young stock of the experimental group, an increase in
the number of erythrocytes and leukocytes was found by 4.2 and 8.8%, respectively, and a decrease
in hemoglobin concentration by 3.8%, in comparison with the values established in 4 months old
animals.
The number of erythrocytes, hemoglobin and leukocytes in the 12 months old rams of the
experimental group was higher by 8.1 and 9.7 (P <0.01) and 9.8%, respectively, than in the control
group of analogs, which is probably because of a sufficient level iodine provision, which has a
significant impact on the functional state of the thyroid gland and provides the hormonal profile that
contributes to a more active process of erythropoiesis [19].
Blood leukocytes in the body of animals perform protective, trophic, transport and other
functions, stimulate tissue regeneration and participate in intermediate metabolism. The blood
leukogram reflects the degree of functional stress of the organism, so we determined the number
and ratio of different types of leukocytes in lambs of the control and experimental groups [20].
The leukogram of the rams of the experimental groups had some peculiarities. In the blood of
lambs of the control group, were recorded higher rates of the band and segmentonuclear neutrophils
by 6, 2 and 3 and 4%, monocytes by 8.6 and 15.3%, in comparison with the same indicators
established in the rams of the experimental group. In the experimental group, the values of
eosinophils, basophils, and lymphocytes were higher by 33.4; 25 and 4.1%.
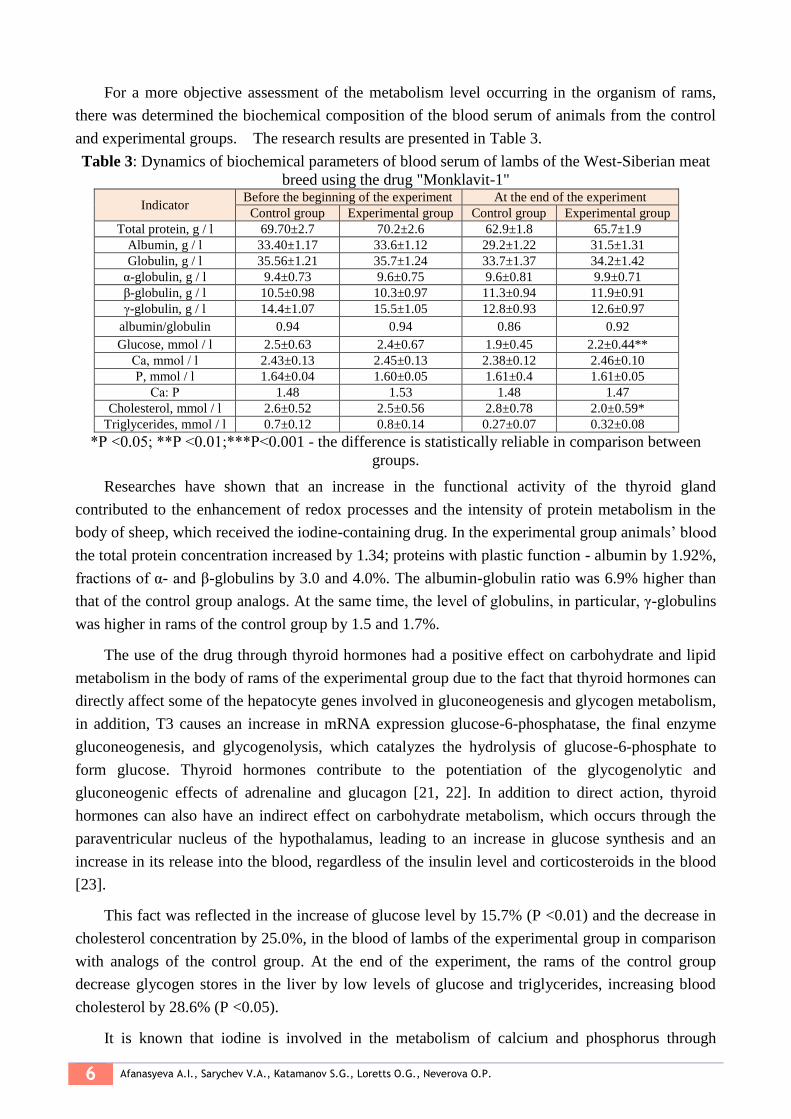
6 Afanasyeva A.I., Sarychev V.A., Katamanov S.G., Loretts O.G., Neverova O.P.
For a more objective assessment of the metabolism level occurring in the organism of rams,
there was determined the biochemical composition of the blood serum of animals from the control
and experimental groups. The research results are presented in Table 3.
Table 3: Dynamics of biochemical parameters of blood serum of lambs of the West-Siberian meat
breed using the drug "Monklavit-1"
Indicator Before the beginning of the experiment At the end of the experiment
Control group Experimental group Control group Experimental group
Total protein, g / l 69.70±2.7 70.2±2.6 62.9±1.8 65.7±1.9
Albumin, g / l 33.40±1.17 33.6±1.12 29.2±1.22 31.5±1.31
Globulin, g / l 35.56±1.21 35.7±1.24 33.7±1.37 34.2±1.42
α-globulin, g / l 9.4±0.73 9.6±0.75 9.6±0.81 9.9±0.71
β-globulin, g / l 10.5±0.98 10.3±0.97 11.3±0.94 11.9±0.91
γ-globulin, g / l 14.4±1.07 15.5±1.05 12.8±0.93 12.6±0.97
albumin/globulin 0.94 0.94 0.86 0.92
Glucose, mmol / l 2.5±0.63 2.4±0.67 1.9±0.45 2.2±0.44**
Са, mmol / l 2.43±0.13 2.45±0.13 2.38±0.12 2.46±0.10
Р, mmol / l 1.64±0.04 1.60±0.05 1.61±0.4 1.61±0.05
Са: Р 1.48 1.53 1.48 1.47
Cholesterol, mmol / l 2.6±0.52 2.5±0.56 2.8±0.78 2.0±0.59*
Triglycerides, mmol / l 0.7±0.12 0.8±0.14 0.27±0.07 0.32±0.08
*Р <0.05; **Р <0.01;***Р<0.001 - the difference is statistically reliable in comparison between
groups.
Researches have shown that an increase in the functional activity of the thyroid gland
contributed to the enhancement of redox processes and the intensity of protein metabolism in the
body of sheep, which received the iodine-containing drug. In the experimental group animals’ blood
the total protein concentration increased by 1.34; proteins with plastic function - albumin by 1.92%,
fractions of α- and β-globulins by 3.0 and 4.0%. The albumin-globulin ratio was 6.9% higher than
that of the control group analogs. At the same time, the level of globulins, in particular, γ-globulins
was higher in rams of the control group by 1.5 and 1.7%.
The use of the drug through thyroid hormones had a positive effect on carbohydrate and lipid
metabolism in the body of rams of the experimental group due to the fact that thyroid hormones can
directly affect some of the hepatocyte genes involved in gluconeogenesis and glycogen metabolism,
in addition, T3 causes an increase in mRNA expression glucose-6-phosphatase, the final enzyme
gluconeogenesis, and glycogenolysis, which catalyzes the hydrolysis of glucose-6-phosphate to
form glucose. Thyroid hormones contribute to the potentiation of the glycogenolytic and
gluconeogenic effects of adrenaline and glucagon [21, 22]. In addition to direct action, thyroid
hormones can also have an indirect effect on carbohydrate metabolism, which occurs through the
paraventricular nucleus of the hypothalamus, leading to an increase in glucose synthesis and an
increase in its release into the blood, regardless of the insulin level and corticosteroids in the blood
[23].
This fact was reflected in the increase of glucose level by 15.7% (P <0.01) and the decrease in
cholesterol concentration by 25.0%, in the blood of lambs of the experimental group in comparison
with analogs of the control group. At the end of the experiment, the rams of the control group
decrease glycogen stores in the liver by low levels of glucose and triglycerides, increasing blood
cholesterol by 28.6% (P <0.05).
It is known that iodine is involved in the metabolism of calcium and phosphorus through

*Corresponding author (Sarychev Vladislav Andreevich). E-mail: [email protected] ©2019 International Transaction Journal of Engineering, Management, & Applied Sciences & Technologies. Volume 10 No.10 ISSN 2228-9860 eISSN 1906-9642 CODEN: ITJEA8 Paper ID:10A12F http://TUENGR.COM/V10A/10A12F.pdf DOI: 10.14456/ITJEMAST.2019.156
7
thyroid hormones [24; 25]. Thyroid hormones affecting osteoblasts through the signaling system of
nuclear receptors (TR-α1, TR-α2, TR-β1), inducing the expression of the ligand of the nuclear
activator receptor κB with subsequent binding and activation of the RANKL receptor (Receptor
Activator of Nuclear κB factor Ligand) on precursors of osteoclasts, leading to the stimulation of
osteoclastogenesis [26; 27].
In our studies, it was found that the use of the drug did not have a significant effect on the level
of Ca and P in the blood of animals, which coincides with the results of F. Kh. Kamilova et al. [27].
Thus, the use of iodine-polymer drug "Monclavit-1" in growing of the West-Siberian meat
breed sheep contributes to maintaining the physiological status of lambs by increasing the level of
thyroid hormones, as a result of which the protein-synthetic function of the liver is activated, the
concentration of plastic proteins in the blood increases -albumin values, energy metabolism
normalizes; the number of erythrocytes and hemoglobin increases, the leukogram is stabilized.
4. CONCLUSION
The drug contributes to the preservation of the physiological status of lambs by increasing the
level of thyroid hormones (T3 and T4) by 13.1 and 12.3 (P <0.01)%, respectively. This is as a result
of which the protein-synthetic function of the liver is activated, increases the concentration of
proteins in the blood of plastic values - albumin by 6.9%, energy metabolism normalizes, which
affected the increase in glucose level by 15.7% (P <0.01) and decrease in cholesterol concentration by
25.0%; groups; the number of erythrocytes and hemoglobin increased by 8.1 and 9.7 (P <0.01),
respectively, leukogram stabilized.
5. REFERENCES
[1] Selionov M.I. From the history of Russian sheep breeding and its scientific support: Monograph. / M.I. Selonov. - M.; FGBNU VNIIOK, 2017. 238 p.
[2] Amerkhanov Kh.A., A new breed of sheep - Russian meat merino / Kh.A. Amerkhanov, M.V.
Egorov, M.I. Selionova, S.N. Shumaenko, N.I. Efimova // Agricultural Journal.-2018.-T. 1.-№ 11.-p. 50-56.
[3] Kulikova A. Ya., Chemical composition and biological value of the meat of young sheep of different
breeds / A.Ya. Kulikova, A.N. Ulyanov, S.G. Katamanov, Yu.G. Kotomanov // Collection of
scientific works SKNIIZH.-2014.-№3.- P.85-90
[4] Braverman L.E. Iodine and the thyroid: 33 years of study / L.E. Braverman // Thyroid, 1994. - Vol. 4. - P.351-356.
[5] Veldanova M.V., Iodine - familiar and unfamiliar / M.B. Veldanova. A.V Skalny M .: IntelTek., 2004 - 192 p.6.
[6] Ji, Chen. Salt intake and iodine status around the world. University of Warwick Thesis (Ph.D.). 2013.
327p.
[7] Gerasimov G.A., Iodine deficiency diseases in Russia. A simple solution to a complex problem / G.А.
Gerasimov, V.V. Faziev, N.Yu.Siridenko. - Adamant, 2002. - 168 p.
[8] Georgievsky V.I., Mineral nutrition of animals / V. I. Georgievsky, B. N. Annenkov, V. T. Samokhin.
- M .: Kolos, 1979. P. 471

8 Afanasyeva A.I., Sarychev V.A., Katamanov S.G., Loretts O.G., Neverova O.P.
[9] Azimov G.I., Influence of processes in the rumen and in the thyroid gland on the fat content of dairy /
G.I. Azimov, V.V. Arepiev // Livestock. - №6. - 1965. - p. 18-24
[10] Spiridonov A. A., Enrichment of livestock products with iodine. Norms and technologies / Spiridonov A. A., Murashova E. V., Kislova O. F. - St. Petersburg, 2014. - 105 p.
[11] Shirokova V.I., Iodine insufficiency: diagnosis and correction. / V.I. Shirokova, V.I. Golodenko, V.F. Demin // Pediatrics, № 6 - 2005.-P.23-27.
[12] Korosteleva N.I. Biometrics in animal husbandry: textbook / N.I. Korosteleva, I.S. Kondrashkova, N.M. Rudishin, I.A. Camardina. - Barnaul: Publishing house AGAU, 2009. - 210 p.
[13] Delange F. Iodine requirements during pregnancy, lactation and the neonatal period and indicators of optimal iodine nutrition // Public Health Nutr. - 2007 - Vol 10 - P 1571-158
[14] Afanasyev A.I., Hormonal mechanisms of seasonal adaptive changes in goats of the Gorno-Altai
downy breed, Siberian Journal of Agricultural Science. - 2005. - №4. - P. 121-126.
[15] Gromova O.A., Molecular synergists of iodine: new approaches to effective prevention and
treatment of iodine-deficient diseases in pregnant women // OA Gromova, I.Yu. Torshin, N.G. Kosheleva / breast cancer. Mother and child .-2011.-T. 19.-№ 1.-S. 51-58.
[16] Kubasova E.D., Physiological characteristics of the bioelement status and its effect on the thyroid
gland of children in the Arkhangelsk region: Author. dis ... to-that biol. sciences. - Arkhangelsk, 2007-18 p.
[17] Kubasova E.D., Modern ideas about the role of environmental factors and imbalance of bioelements
in the formation of endemic goiter / E.D. Kubasova, R.V. Kubasov // Successes of Modern Biology.-2009. -T. 129.-№2. p. 181-191
[18] Dzhambulatov M., Effect of feeding of sheep by sulphate of copper on the activity of some redox
enzymes / M. Dzhambulatov, S.G. Luganov, Sh.K. Salikhov, G.I. Gireyev // Problems of development of the agro-industrial complex of the region - 2011. No. 6. P.12-16.
[19] Mikhaylenko, A. K., Papshuova, R. D., Chizhova, L. N. The hormonal status of sheep depending on
age and iodine availability // Proceedings of the VNIIOK. 2010. №1. URL:
https://cyberleninka.ru/article/n/gormonalnyy-status-ovets-v-zavisimosti-ot-vozrasta-i-yodnoy-obespechennosti (дата обращения: 04.09.2018).
[20] Spiridonov A. A., Murashova E. V., Kislova O. F. Iodine enrichment of livestock products. Norms and technologies / Spiridonov A. A., Murashova E. V., Kislova O. F. - St. Petersburg, 2014. - 105 p.
[21] Weinberg MB, Utter MF. Effect of thyroid hormone on the turnover of rat liver pyruvate carboxylase and pyruvate dehydrogenase. J Biol Chem 1979;254(19):9492-9499.
[22] Feng X, Jiang Y, Meltzer P, Yen PM. Thyroid hormone regulation of hepatic genes in vivo detected by complementary DNA microarray. Mol Endocrinol 2000;14(7):947-55.
[23] Klieverik LP, Janssen SF, van Riel A, et al. Thyroid hormone modulates glucose production via a
sympathetic pathway from the hypothalamic paraventricular nucleus to the liver. Proc. Natl. Acad. Sci. U. S. A. 2009; 106:5966–5971.
[24] Baldaev, SN, Biochemistry of metabolic disorders in sheep and their prevention / S.N. Baldaev, S.A. Kirilov.- Ulan-Ude: Buryat book publishing house, 1991.- p.160
[25] Baymatov V.N., Changes in clinical and biochemical parameters in cows with iodine deficiency /
V.N. Baimatov, V.E. Adamushkin, A.F. Khannanova // Veterinary Medicine. - 2006. - № 8. - p. 45-47.
[26] NichollsJ.J., Brassill N.J., Williams G.R., BassertJ.H. The skeletal consequences of thyrotoxicosis. J.
Endocrinol. 2012; 213: 209–211. DOI: 10.1530/JOE-12-0059.

*Corresponding author (Sarychev Vladislav Andreevich). E-mail: [email protected] ©2019 International Transaction Journal of Engineering, Management, & Applied Sciences & Technologies. Volume 10 No.10 ISSN 2228-9860 eISSN 1906-9642 CODEN: ITJEA8 Paper ID:10A12F http://TUENGR.COM/V10A/10A12F.pdf DOI: 10.14456/ITJEMAST.2019.156
9
[27] Kamilov F. Kh., Effect of experimental hypothyroidism on bone tissue metabolism and mineral
metabolism / F. Kh. Kamilov, V.N. Kozlov, T.I. Ganeev, R.R. Yunusov // Kazan med.zh .. 2017. №6.
https://cyberleninka.ru/article/n/vliyanie-eksperimentalnogo-gipotireoza-na-metabolizm-kostnoy-tka
ni-i-mineralnyy-obmen (дата обращения: 10.01.2019).
Professor Dr. Antonina Ivanovna Afanasyeva is Professor and Dean of the Faculty of Biology and Technology, Altai State Agrarian University. She has a Doctor of Biological Sciences degree. Her scientific interests pertains to the study of Physiological Adaptation Mechanisms (Hormonal Status, Morphological And Biochemical Blood Parameters, Productive Indicators) of Farm Animals of the Southern Region of Russia and Import Selection to New Natural and Climatic Conditions of the Altai Territory; ability study of the use of Adaptogens, Immunomodulators, Probiotics for the Prevention of the Negative Effects of Stress and Increasing the Quantitative and Qualitative Indicators of Productivity.
Vladislav Andreevich Sarychev is a Candidate of Biological Sciences, Department of General Biology, Physiology, and Morphology of Animals, Altai State Agrarian University, Russia. His scientific interests include the study of the Adaptive Capacity of Imported Livestock (Hormonal Status, Morphological and Biochemical Blood Parameters, Productive Indicators and Reproductive Ability); Ability study of the use of Adaptogens, Immunomodulators, Probiotics for the Prevention of the Negative Effects of Stress and Increasing the Quantitative and Qualitative Indicators of Productivity.
Dr. Sergey Grigorievich Katamanov holds a Doctor of Agricultural Sciences degree. His scientific interests encompass Breeding and Selection of Fine-Wool and Meat-Wool Sheep; Improving the Qualitative and Quantitative Indicators of Wool and Meat Productivity; Reproductive Ability of Sheep.
Professor Dr. Olga Gennadievna Loretts is Professor and Rector of the Ural State Agrarian University, Russia. She got a Doctor of Biological Science sdegree. She also got a degree in Psychology from Ural State Pedagogical University. Her areas of scientific interests are Biotechnology, Selection and Genetics of Farm Animals, Biology, Processing of Agricultural Products.
Olga Petrovna Neverova is a Candidate of Biological Sciences, Ural State Agrarian University RUSSIA. Her scientific interests are related to the Development of Resource-Saving Technologies in Poultry Farming for obtaining Environmentally Friendly Products.

*Corresponding authors (Ali Saremi). Tel.+98-9124212672 E-mail: [email protected] ©2019 International Transaction Journal of Engineering, Management, & Applied Sciences & Technologies. Volume 10 No.12 ISSN 2228-9860 eISSN 1906-9642 CODEN: ITJEA8 Paper ID:10A12G http://TUENGR.COM/V10A/10A12G.pdf DOI: 10.14456/ITJEMAST.2019.157
1
International Transaction Journal of Engineering, Management, & Applied Sciences & Technologies
http://TuEngr.com
PAPER ID: 10A12G
LAND-USE/LAND COVER CLASSIFICATION ANALYSIS USING
PIXEL BASED METHODS: CASE OF TAROM CITY, IRAN
Seyyed Behrouz Hosseini a
, Ali Saremi a*
, Mohammad Hossein Noori Gheydari b,
Hossein Sedghi a
, Alireza Firoozfar c
a Department of Water Science and Engineering, Science and Research Branch, Islamic Azad University,
Tehran, IRAN. b Department of Water Engineering, Faculty of engineering and technology, Islamic Azad University, Zanjan
Branch, Zanjan, IRAN c Department of Civil Engineering, University of Zanjan, Zanjan, IRAN
A R T I C L E I N F O
A B S T R A C T Article history
Received 06 May 2019
Received in revised form 05
July 2019
Accepted 19 July 2019
Available online 05 August
2019
Keywords: Atmospheric
Correction; Tarom
basin; Maximum
Likelihood
Classification;
Supervised
Classification
Methods; Land-use
map; Landsat-8.
This research inspects the convenience of Landsat-8 imagery in
generating Land-use Land Cover (LULC) maps based on RGB and NIR
bands dates back to August 8th, 2017, and at the same time to reveal
which type of LULC in Tarom basin can be utilized with maximum
accuracy considering the comparison of results with ground samples.
Besides necessary preprocessing, land-use classification was done after
atmospheric corrections (via FLAASH Algorithm). LULC maps were
generated using three pixel-based supervised classification methods,
Maximum Likelihood (ML), Support Vector Machine (SVM), and
Artificial Neural Networks (ANNs). Results proved that imagery
precision based on Kappa statistics and overall accuracy for ML
classification method were 0.88 and 91.55, respectively. The acquired
outcome indicated that Landsat-8 OLI data, present satisfying LULC
classification in the waterbody, mountain and rock, bare land, vegetation,
and forest classes. In addition, as the results indicated, it can be stated that
all three methods of classification in a region of considerable
heterogeneity in terms of elevation (between 280-3000 m), land-use and
vegetation such as Tarom, can have significant results. In comparison
with the other two methods, classification with the ML method had higher
speed and lower complexity for execution in achieving the required maps.
© 2019 INT TRANS J ENG MANAG SCI TECH.
1. INTRODUCTION A modern country must have sufficient information on a multitude of interrelated complex
aspects of its activities in order to make decisions. A modern country to have an advanced
management system should have proper detailed data on different aspects of socio-economic
activities. One of these cited aspects is known as land-use and land cover (LULC), which has become
important in recent years. These two mentioned terms are often used interchangeably, but it should be
noted that each of them has a unique definition and meaning. Land-use refers to human methods and
©2019 International Transaction Journal of Engineering, Management, & Applied Sciences & Technologies
2 S.Behrouz Hosseini, A.Saremi, M.H.Noori Gheydari, Hossein Sedghi, Alireza Firoozfar
purposes in utilizing land with different usages and resources. Among which agriculture, wildlife,
and recreation can be outlined. Also, the observed biological, physical, or biophysical envelopment of
the surface of the earth is called land cover (e.g., waterbody, vegetation, soil, and urban infrastructure.
When these terms used together as LULC, it refers to the categorization of natural elements and
human activities on the earth. Regarding this, it can be clearly understood that, on a daily basis,
existing lands will undergo changes in the types of land-use and land covers.
In order to get over the issue of casual development, desertification, erosion, destruction of
wildlife, and marshes, we need accurate data of the pattern of LULC in the study area. LULC is
interdependent, so when people start to use lands for human activities, the cover of those lands
changes and this process influences its properties (De Sherbinin, 2002). In addition, as Young (1998)
believes, the identical section of land can just be used for one objective at a time; so this limitation
leads to competition among diverse activities which depends on the availability of lands. One of the
important data for controlling the development of the region and land-use dependent activities is the
information on the pattern of the existing land-use.
Cultivable lands are becoming a scarce resource due to the increasing hustle of agriculture and
population growth. Hence, possession of adequate data can lead to optimal use and management of
the available resources to meet the essential needs.
With the help of satellite imagery, we can observe the earth from up above, and the effect of our
activities on natural resources and use obtained data to assess the changes and utilize it for future
management purposes. The multi-temporal high-resolution data and the remote sensing (RS)
technology, has been broadly used to gather information on existing LULC and for mapping LULC
over time. To create these maps, the RS data can be obtained from various types of satellites such as
Landsat, Sentinel, and Spot series. Periodic, acquisition of free, fast, rapid, and accurate data is
possible; for example, in the case of Landsat 8, it is every16 days (Topaloglu, et al., 2016).
2. RS AND LULC MAPS
Satellite data can play an effective role in the development of LULC maps due to its specific
characteristics, including the wide coverage, repeatability, diversity of LULC, and continuous uptime
capabilities. As mentioned before, producing LULC maps has gained significance for land
management, convenient planning of resources and climate-related researches in recent years
(Turner, et al., 2001, Mejía and Hochschild, 2012). Owning information about the changes in LULC
over time, grant us precise data on sustainable resource management. (Mejía and Hochschild, 2012).
Remote sensing tech is a robust instrument in order to have constant management of natural resources
and land scout (Cetin, 2009; Van, et al., 2017). Acquired satellite data are converted into a land-use
map by the utilization of this technology. There are various kinds of the algorithm used in the
abovementioned conversion process, which has become much more accurate in time and their
technological advancements.
Landsat-8 OLI is a recently operational new generation earth observation satellite. Therefore, in
the presented research, the OLI and TIRS sensors data (acquired from Landsat-8 satellite) were used
as a data source. It should be mentioned that in addition to Landsat data, there are other satellite
dataset resources such as Sentinel and Spot. Numerous studies have been made to determine which
imagery has better and accurate results in generating the land-use maps (Jia, et al., 2014; Liu, et al.,

*Corresponding authors (Ali Saremi). Tel.+98-9124212672 E-mail: [email protected] ©2019 International Transaction Journal of Engineering, Management, & Applied Sciences & Technologies. Volume 10 No.12 ISSN 2228-9860 eISSN 1906-9642 CODEN: ITJEA8 Paper ID:10A12G http://TUENGR.COM/V10A/10A12G.pdf DOI: 10.14456/ITJEMAST.2019.157
3
2015; Elhag and Boteva, 2016; Pirotti, et al., 2016; Marangoz, et al., 2017).
Akar and Güngör (2012) used the Random Forest Algorithm (RFA) to evaluate the classified
land-use maps from multispectral images. To assess the performance of RFA, the results are
compared with the results obtained from other classification methods such as Maximum Likelihood
Classification (MLC) and Support Vector Machine (SVM). Manandhar, et al., (2009), by using a
post-classification enhancement on Landsat images, determined the accuracy of LULC maps. These
researchers applied the MLC method to classify the Landsat imagery for 1985, 1995, and 2005 data.
Their results showed that the MLC, as a widely used classifier, could not yield satisfactory results in
Built-up areas.
Duarte, et al., (2016), made the comparison of three supervised classification methods (MLC,
MD, and ANN) using Unmanned Air Vehicle (UAV) data in Viçosa-MG, Brazil.
They reported that the classification that best delimited the different features present in the image
was the classification by Artificial Neural Networks. In order to prove the classification efficiency
statistically, the validation was carried out through the Kappa index and visual analysis. Zomlot, et
al., (2017), used trajectory analysis to improve LULC maps. They also tried to assess the impact of
LULC changes on the amount of groundwater resupply in the Flanders region, Belgium.
Their results showed that the amount of groundwater recharge decreased by about 35% in this
region due to urbanization. Sekertekin, et al., (2017), studied pixel-based classification analysis of
LULC using two kinds of imagery (Sentinel-2 and Landsat-8) in Zonguldak area, Turkey. Their
findings showed that the LULC images conducted by MSI sensor of Sentinel-2 data are more accurate
than LULC images by OLI sensor of Landsat-8 in sea and waterbody classes.
Increase in the wastewater of the industrial regions in Tarom Basin, growth of the vegetated
regions- which were previously in the form of bare land or grasslands in hillsides- and population
growth have caused socio-economic damages to this region. Due to water transfer from the main river
passing from the area Ghizil-Ozan through stable or mobile water pumps, a significant number of the
abrupt regions and highlands in Tarom province, which were previously utilized as grasslands are
severely affected and have been changed into gardens or have got agronomic uses. Typically, two
types of trees (i.e., olive and pomegranate) in length with the cultivated species (i.e., garlic and
celery) are planted in most parts of this region and are irrigated by Ghizil-Ozan River. However, since
water transfer is done through illegal piping systems and pumps an exact amount of water withdrawal
cannot be provided. In comparison with other fruit trees of the area, olive with extensive
compatibility and 12600 ha has the most amount of area under cultivation. The results of the
temperature compatibility model conducted in 10 hydrometric stations. In olive-growing areas, and a
control station indicated that Tarom is one of the best areas for expansion of growing olive. For the
reasons mentioned above, land-use change from grasslands and bare lands to the olive orchard are
obvious in locations where water can be transferred from the river, and it has got an ascending trend.
Thus, land-use maps should be created annually by means of satellite imageries. Planting fruit trees
on bare land may increase the afforested area, and protect the land against flood or erosion but where,
when, and how much abandonment and tree farming have occurred remains unclear. By using three
pixel-based methods (MLC, ANN, and SVM), OLI sensor data have been transformed into the
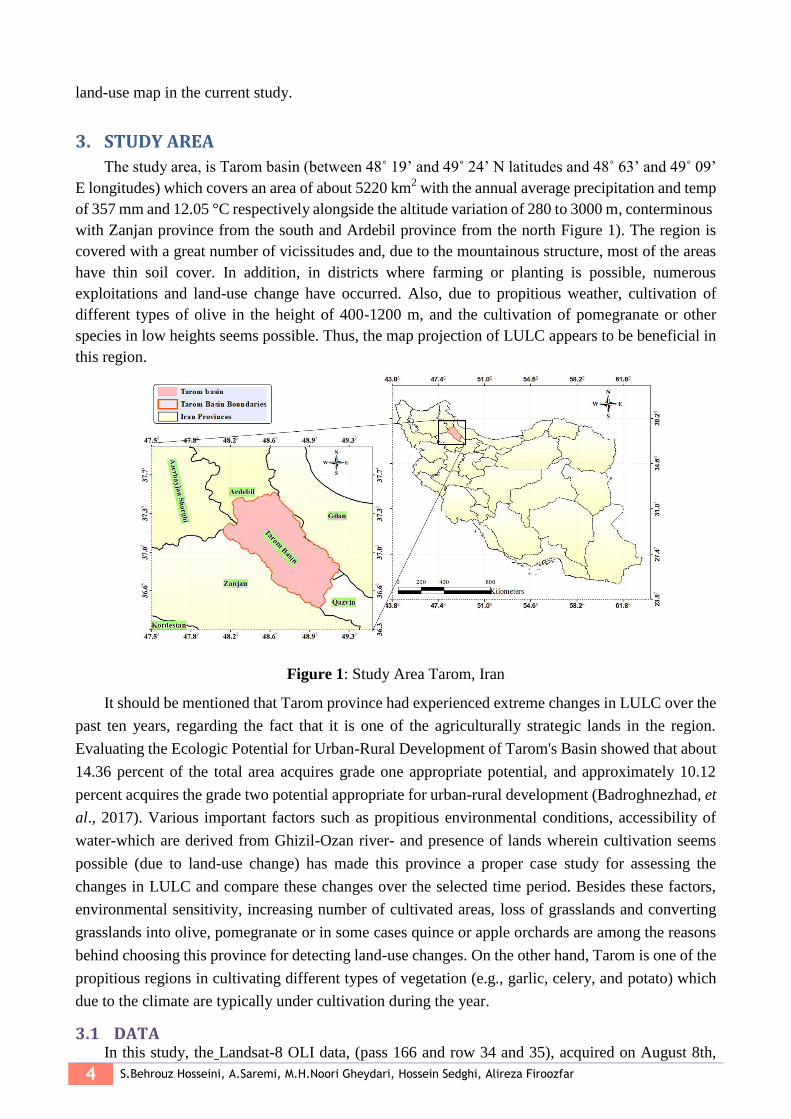
4 S.Behrouz Hosseini, A.Saremi, M.H.Noori Gheydari, Hossein Sedghi, Alireza Firoozfar
land-use map in the current study.
3. STUDY AREA
The study area, is Tarom basin (between 48˚ 19’ and 49˚ 24’ N latitudes and 48˚ 63’ and 49˚ 09’
E longitudes) which covers an area of about 5220 km2 with the annual average precipitation and temp
of 357 mm and 12.05 °C respectively alongside the altitude variation of 280 to 3000 m, conterminous
with Zanjan province from the south and Ardebil province from the north Figure 1). The region is
covered with a great number of vicissitudes and, due to the mountainous structure, most of the areas
have thin soil cover. In addition, in districts where farming or planting is possible, numerous
exploitations and land-use change have occurred. Also, due to propitious weather, cultivation of
different types of olive in the height of 400-1200 m, and the cultivation of pomegranate or other
species in low heights seems possible. Thus, the map projection of LULC appears to be beneficial in
this region.
Figure 1: Study Area Tarom, Iran
It should be mentioned that Tarom province had experienced extreme changes in LULC over the
past ten years, regarding the fact that it is one of the agriculturally strategic lands in the region.
Evaluating the Ecologic Potential for Urban-Rural Development of Tarom's Basin showed that about
14.36 percent of the total area acquires grade one appropriate potential, and approximately 10.12
percent acquires the grade two potential appropriate for urban-rural development (Badroghnezhad, et
al., 2017). Various important factors such as propitious environmental conditions, accessibility of
water-which are derived from Ghizil-Ozan river- and presence of lands wherein cultivation seems
possible (due to land-use change) has made this province a proper case study for assessing the
changes in LULC and compare these changes over the selected time period. Besides these factors,
environmental sensitivity, increasing number of cultivated areas, loss of grasslands and converting
grasslands into olive, pomegranate or in some cases quince or apple orchards are among the reasons
behind choosing this province for detecting land-use changes. On the other hand, Tarom is one of the
propitious regions in cultivating different types of vegetation (e.g., garlic, celery, and potato) which
due to the climate are typically under cultivation during the year.
3.1 DATA In this study, the Landsat-8 OLI data, (pass 166 and row 34 and 35), acquired on August 8th,

*Corresponding authors (Ali Saremi). Tel.+98-9124212672 E-mail: [email protected] ©2019 International Transaction Journal of Engineering, Management, & Applied Sciences & Technologies. Volume 10 No.12 ISSN 2228-9860 eISSN 1906-9642 CODEN: ITJEA8 Paper ID:10A12G http://TUENGR.COM/V10A/10A12G.pdf DOI: 10.14456/ITJEMAST.2019.157
5
2017 and were taken from the USGS website (http://earthexplorer.usgs.gov) and used as the data
source. Due to the maximum amount of greenness in plants and harvesting products such as olive, the
proposed date was chosen.
From the downloaded datasets, four common spectrums of Red, Green, Blue, and NIR were
selected to use in the classification process. Full detailed information for enthusiasts are available in
Sekertekin, et al., (2017).
3.2 PRE-PROCESSING OF SATELLITE IMAGES Since the fundamental purpose of RS technology is to recognize and segregate the earthborn
phenomenon, the most significant step in analyzing the data achieved from various estimates is the
process of classification of satellite imageries. Prior to the classification procedure, preprocessing
operations (atmospheric and radiometric corrections) were done on the downloaded data sets (Song,
et al., 2001). Eventually, four mentioned bands (RGB and NIR) gathered in one data set by layer
stacking command. By considering the fact that two simultaneous imageries could cover the area
under investigation, at first, the multispectral bands were mosaicked together and then the same
process was repeated for thermal bands.
Figure 2: Spectral Bands before (a) and after (b) mosaicking.
3.3 MOSAICKING IN ENVI Mosaicking technique combines two aforementioned data sets into a single georeferenced
composite image the covering complete study area. Since the two imageries covered the area under
investigation, the multispectral and thermal bands of the imageries were merged (mosaicking). We
used a seamless Mosaic tool (in ENVI software), for combining multispectral RGB (Figure 2(a) and
2(b)) and thermal Band (NIR) of two images (Figure 3(a), and 3(b)). It should be noted that the red
and green polygons shows the imagery for 166*34, and 166*35 row and paths respectively.
This mosaicked composite image, as shown in Figure 4, stacked and clipped by the study area
boundaries through “Subset data from ROI” tool. Different methods exist for providing land-use
maps that have their pros and cons. In addition, any of these methods have different preprocessing
stages, which makes the results more accurate Zhou, et al., 2018; Zhu, et al., 2016; Song, et al.,
2001). For instance, in land segregation by the ML method, using the FLAASH algorithm for primary
processing is recommended.
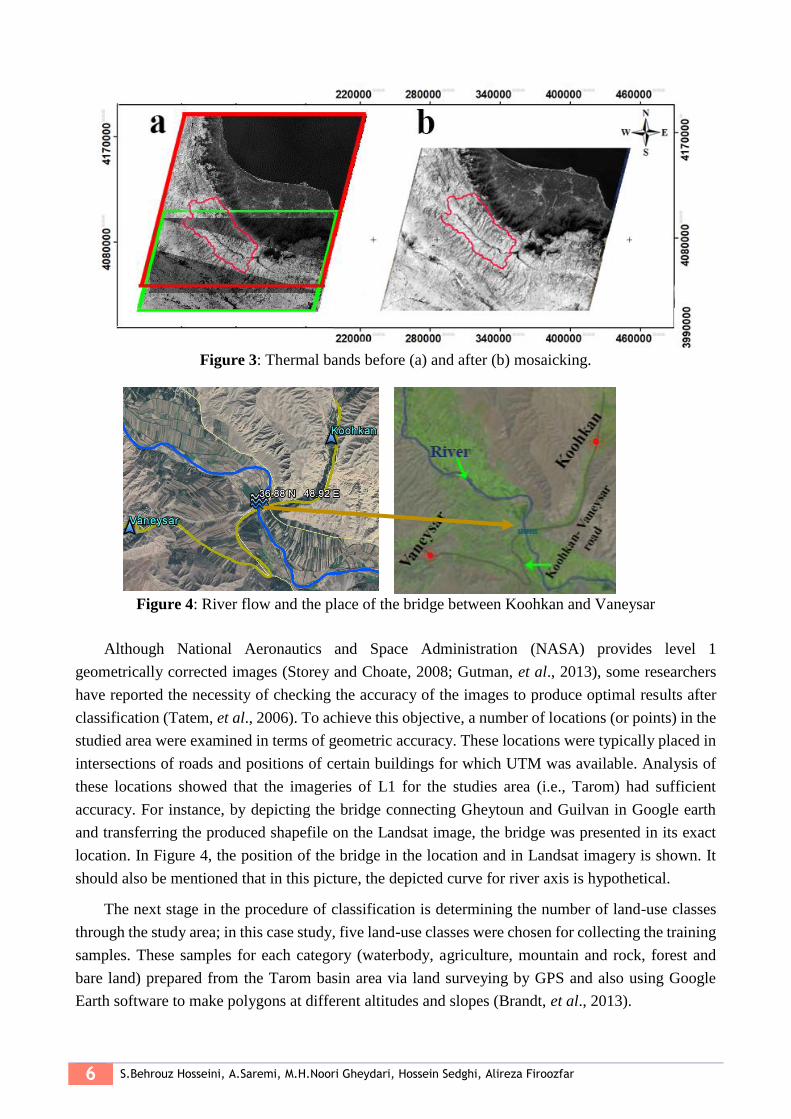
6 S.Behrouz Hosseini, A.Saremi, M.H.Noori Gheydari, Hossein Sedghi, Alireza Firoozfar
Figure 3: Thermal bands before (a) and after (b) mosaicking.
Figure 4: River flow and the place of the bridge between Koohkan and Vaneysar
Although National Aeronautics and Space Administration (NASA) provides level 1
geometrically corrected images (Storey and Choate, 2008; Gutman, et al., 2013), some researchers
have reported the necessity of checking the accuracy of the images to produce optimal results after
classification (Tatem, et al., 2006). To achieve this objective, a number of locations (or points) in the
studied area were examined in terms of geometric accuracy. These locations were typically placed in
intersections of roads and positions of certain buildings for which UTM was available. Analysis of
these locations showed that the imageries of L1 for the studies area (i.e., Tarom) had sufficient
accuracy. For instance, by depicting the bridge connecting Gheytoun and Guilvan in Google earth
and transferring the produced shapefile on the Landsat image, the bridge was presented in its exact
location. In Figure 4, the position of the bridge in the location and in Landsat imagery is shown. It
should also be mentioned that in this picture, the depicted curve for river axis is hypothetical.
The next stage in the procedure of classification is determining the number of land-use classes
through the study area; in this case study, five land-use classes were chosen for collecting the training
samples. These samples for each category (waterbody, agriculture, mountain and rock, forest and
bare land) prepared from the Tarom basin area via land surveying by GPS and also using Google
Earth software to make polygons at different altitudes and slopes (Brandt, et al., 2013).
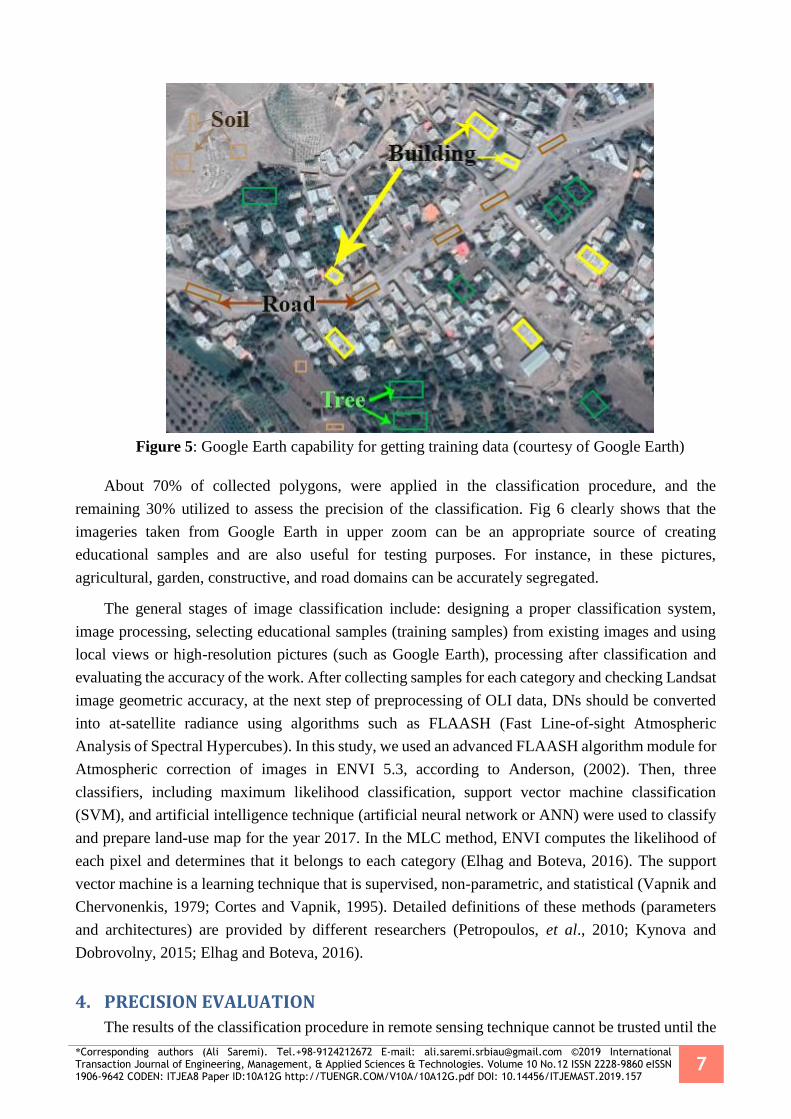
*Corresponding authors (Ali Saremi). Tel.+98-9124212672 E-mail: [email protected] ©2019 International Transaction Journal of Engineering, Management, & Applied Sciences & Technologies. Volume 10 No.12 ISSN 2228-9860 eISSN 1906-9642 CODEN: ITJEA8 Paper ID:10A12G http://TUENGR.COM/V10A/10A12G.pdf DOI: 10.14456/ITJEMAST.2019.157
7
Figure 5: Google Earth capability for getting training data (courtesy of Google Earth)
About 70% of collected polygons, were applied in the classification procedure, and the
remaining 30% utilized to assess the precision of the classification. Fig 6 clearly shows that the
imageries taken from Google Earth in upper zoom can be an appropriate source of creating
educational samples and are also useful for testing purposes. For instance, in these pictures,
agricultural, garden, constructive, and road domains can be accurately segregated.
The general stages of image classification include: designing a proper classification system,
image processing, selecting educational samples (training samples) from existing images and using
local views or high-resolution pictures (such as Google Earth), processing after classification and
evaluating the accuracy of the work. After collecting samples for each category and checking Landsat
image geometric accuracy, at the next step of preprocessing of OLI data, DNs should be converted
into at-satellite radiance using algorithms such as FLAASH (Fast Line-of-sight Atmospheric
Analysis of Spectral Hypercubes). In this study, we used an advanced FLAASH algorithm module for
Atmospheric correction of images in ENVI 5.3, according to Anderson, (2002). Then, three
classifiers, including maximum likelihood classification, support vector machine classification
(SVM), and artificial intelligence technique (artificial neural network or ANN) were used to classify
and prepare land-use map for the year 2017. In the MLC method, ENVI computes the likelihood of
each pixel and determines that it belongs to each category (Elhag and Boteva, 2016). The support
vector machine is a learning technique that is supervised, non-parametric, and statistical (Vapnik and
Chervonenkis, 1979; Cortes and Vapnik, 1995). Detailed definitions of these methods (parameters
and architectures) are provided by different researchers (Petropoulos, et al., 2010; Kynova and
Dobrovolny, 2015; Elhag and Boteva, 2016).
4. PRECISION EVALUATION
The results of the classification procedure in remote sensing technique cannot be trusted until the
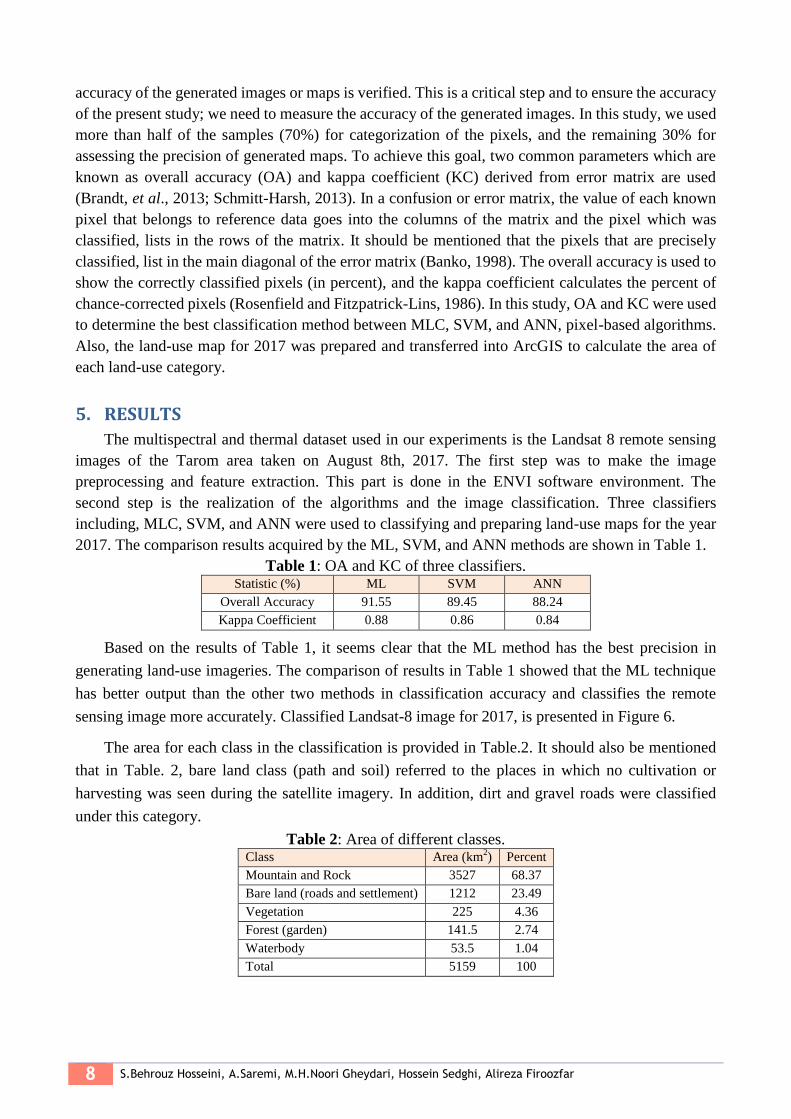
8 S.Behrouz Hosseini, A.Saremi, M.H.Noori Gheydari, Hossein Sedghi, Alireza Firoozfar
accuracy of the generated images or maps is verified. This is a critical step and to ensure the accuracy
of the present study; we need to measure the accuracy of the generated images. In this study, we used
more than half of the samples (70%) for categorization of the pixels, and the remaining 30% for
assessing the precision of generated maps. To achieve this goal, two common parameters which are
known as overall accuracy (OA) and kappa coefficient (KC) derived from error matrix are used
(Brandt, et al., 2013; Schmitt-Harsh, 2013). In a confusion or error matrix, the value of each known
pixel that belongs to reference data goes into the columns of the matrix and the pixel which was
classified, lists in the rows of the matrix. It should be mentioned that the pixels that are precisely
classified, list in the main diagonal of the error matrix (Banko, 1998). The overall accuracy is used to
show the correctly classified pixels (in percent), and the kappa coefficient calculates the percent of
chance-corrected pixels (Rosenfield and Fitzpatrick-Lins, 1986). In this study, OA and KC were used
to determine the best classification method between MLC, SVM, and ANN, pixel-based algorithms.
Also, the land-use map for 2017 was prepared and transferred into ArcGIS to calculate the area of
each land-use category.
5. RESULTS
The multispectral and thermal dataset used in our experiments is the Landsat 8 remote sensing
images of the Tarom area taken on August 8th, 2017. The first step was to make the image
preprocessing and feature extraction. This part is done in the ENVI software environment. The
second step is the realization of the algorithms and the image classification. Three classifiers
including, MLC, SVM, and ANN were used to classifying and preparing land-use maps for the year
2017. The comparison results acquired by the ML, SVM, and ANN methods are shown in Table 1.
Table 1: OA and KC of three classifiers. Statistic (%) ML SVM ANN
Overall Accuracy 91.55 89.45 88.24
Kappa Coefficient 0.88 0.86 0.84
Based on the results of Table 1, it seems clear that the ML method has the best precision in
generating land-use imageries. The comparison of results in Table 1 showed that the ML technique
has better output than the other two methods in classification accuracy and classifies the remote
sensing image more accurately. Classified Landsat-8 image for 2017, is presented in Figure 6.
The area for each class in the classification is provided in Table.2. It should also be mentioned
that in Table. 2, bare land class (path and soil) referred to the places in which no cultivation or
harvesting was seen during the satellite imagery. In addition, dirt and gravel roads were classified
under this category.
Table 2: Area of different classes. Percent Area (km
2) Class
68.37 3527 Mountain and Rock
23.49 1212 Bare land (roads and settlement)
4.36 225 Vegetation
2.74 141.5 Forest (garden)
1.04 53.5 Waterbody
100 5159 Total
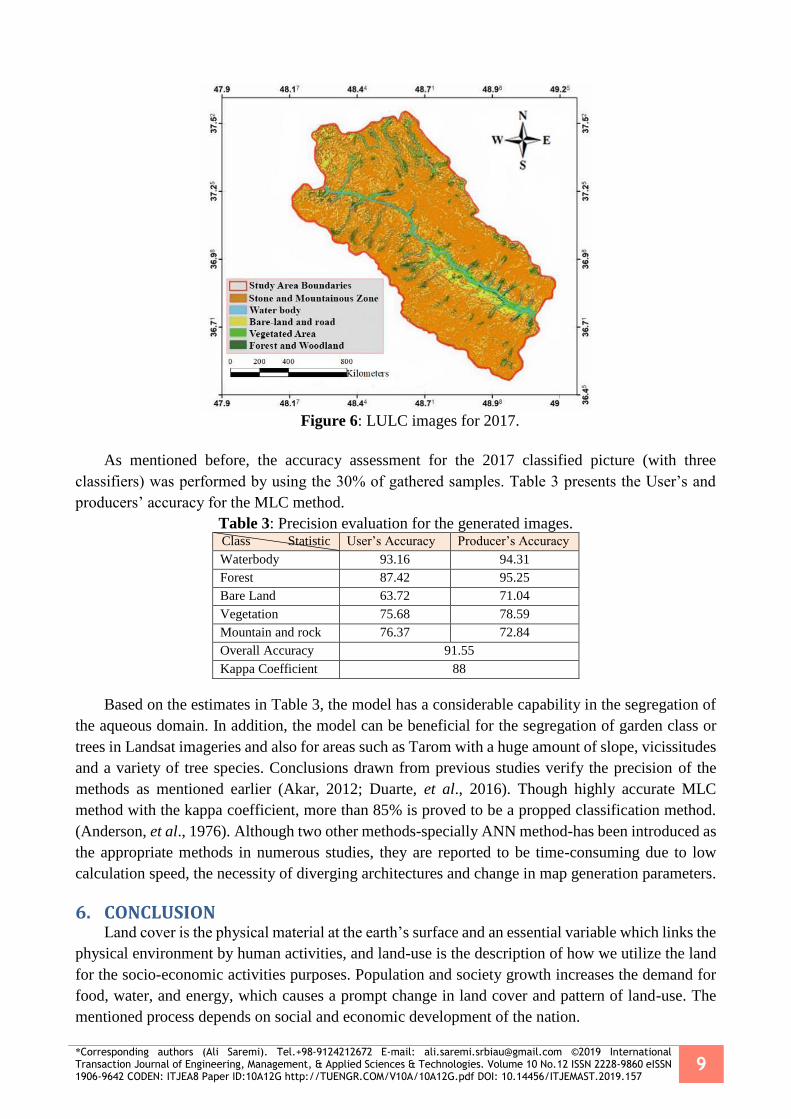
*Corresponding authors (Ali Saremi). Tel.+98-9124212672 E-mail: [email protected] ©2019 International Transaction Journal of Engineering, Management, & Applied Sciences & Technologies. Volume 10 No.12 ISSN 2228-9860 eISSN 1906-9642 CODEN: ITJEA8 Paper ID:10A12G http://TUENGR.COM/V10A/10A12G.pdf DOI: 10.14456/ITJEMAST.2019.157
9
Figure 6: LULC images for 2017.
As mentioned before, the accuracy assessment for the 2017 classified picture (with three
classifiers) was performed by using the 30% of gathered samples. Table 3 presents the User’s and
producers’ accuracy for the MLC method.
Table 3: Precision evaluation for the generated images. Class Statistic User’s Accuracy Producer’s Accuracy
Waterbody 93.16 94.31
Forest 87.42 95.25
Bare Land 63.72 71.04
Vegetation 75.68 78.59
Mountain and rock 76.37 72.84
Overall Accuracy 91.55
Kappa Coefficient 88
Based on the estimates in Table 3, the model has a considerable capability in the segregation of
the aqueous domain. In addition, the model can be beneficial for the segregation of garden class or
trees in Landsat imageries and also for areas such as Tarom with a huge amount of slope, vicissitudes
and a variety of tree species. Conclusions drawn from previous studies verify the precision of the
methods as mentioned earlier (Akar, 2012; Duarte, et al., 2016). Though highly accurate MLC
method with the kappa coefficient, more than 85% is proved to be a propped classification method.
(Anderson, et al., 1976). Although two other methods-specially ANN method-has been introduced as
the appropriate methods in numerous studies, they are reported to be time-consuming due to low
calculation speed, the necessity of diverging architectures and change in map generation parameters.
6. CONCLUSION Land cover is the physical material at the earth’s surface and an essential variable which links the
physical environment by human activities, and land-use is the description of how we utilize the land
for the socio-economic activities purposes. Population and society growth increases the demand for
food, water, and energy, which causes a prompt change in land cover and pattern of land-use. The
mentioned process depends on social and economic development of the nation.
10 S.Behrouz Hosseini, A.Saremi, M.H.Noori Gheydari, Hossein Sedghi, Alireza Firoozfar
In order to have appropriate and unrestrictive management of natural resources (water and soil),
it is a necessity to have complete information about the pattern of land-use and its alteration pattern
over time. Thus, it can be concluded that remote sensing is a proper technique to investigate the
land-use changes using satellite imagery. Spatiotemporal analyses of LULC help us to manage the
environmental changes, which are an appropriate tool for decision-makers on water resources’ to
enhance their decisions.
In the presented study, LULC map for Tarom basin, Iran, acquired from OLI sensor data sets
(Landsat-8) by applying three pixel-based classification method (MLC, SVM, and ANN) with the aid
of remote sensing technology. The finding results that are presented in this study proved the
usefulness, effectiveness and also convenience of the MLC technique for generating land-use maps
by using the free archive of Landsat data and processing the digital images through the ENVI
software. Accuracy assessment using OA and KC for MLC algorithm (the best classifier), was
91.55% and 0.88 respectively. But then, the OA for SVM Algorithm was 89.45%, and the calculated
kappa coefficient was 0.86. Finally, for the third classifier (ANN), the OA and KC values were
88.24%, and 0.84, respectively.
Anderson, et al., 1976 have also recited the approval of the USGS kappa coefficient of 85% in
their article as the minimum requirement for land-use classification with Landsat data. However,
some researchers stated lower than standard kappa coefficient in their study, for example, Rozenstein
and Karnieli (2010), reported 53% for MLC method, which is lower than the standard 85% which has
been approved by USGS. Some researchers stated that SVM classification method performs better
than ANN (Halder, et al., 2011; Yousefi, et al., 2015). Obtained data from the study area showed the
dominant coverage of the area is belong to mountain and rock category in Tarom basin covering
about 3527 Km2. The latter considerable type of land cover in this basin was bare land, including bare
lands, roads, and settlement areas (225 Km2).
What matters most in this regard is the accuracy, speed, and quality of land-use maps. In the
present study, it was shown that due to high speed and accuracy in generating land-use maps of
Tarom, ML method, can act as the best classification method in this area. However, it is suggested to
classify the data by using other methods and compare the results with image output provided by
Landsat 8 satellite. In addition, it is also recommended to generate maps for different time periods
(e.g., five years ago) and evaluate land-use change classes in order to have a better understanding of
changes' patterns (Panda, et al., 2018). So at the same time, we are able to provide a number of
strategies to preserve the fields which may result in prevention from detrimental or unstructured
land-use in Tarom. Finally, as some researchers stated, due to altitudinal structure, and a variety in
LULC classes in each study area, a unique guideline for choosing the best classification method
cannot be applied to all areas (Xie, et al., 2010; Schulz, et al., 2010; Zhou, et al., 2018).
7. AVAILABILITY OF DATA AND MATERIAL Data used or generated from this study is available upon request to the corresponding author.
8. REFERENCES Akar, O., Güngör, O. (2012). Classification of multispectral images using Random Forest algorithm. Journal
of Geodesy and Geoinformation, 1(2), 105-112.

*Corresponding authors (Ali Saremi). Tel.+98-9124212672 E-mail: [email protected] ©2019 International Transaction Journal of Engineering, Management, & Applied Sciences & Technologies. Volume 10 No.12 ISSN 2228-9860 eISSN 1906-9642 CODEN: ITJEA8 Paper ID:10A12G http://TUENGR.COM/V10A/10A12G.pdf DOI: 10.14456/ITJEMAST.2019.157
11
Anderson, J.R., Hardy, E.E., Roach, J.T., Witer, R.E. (1976). A land-use and land cover classification system
for use with remote sensor data. USGS Numbered Series, A revision of the land-use classification
system in Circular 671, Land Cover Institute.
Anderson, G.P., Felde, G.W., Hoke, M.L., Ratkowski, A.J., et al. (2002). MODTRAN4-based atmospheric
correction algorithm: FLAASH (fast line-of-sight atmospheric analysis of hyperspectral cubes). In
Algorithms and Technologies for Multispectral, Hyperspectral, and Ultra spectral Imagery VIII
(Proceedings of SPIE); Shen, S.S., Lewis, P.E., Eds.; Society of Photo Optics: Orlando, FL, USA, 65–
71.
Badroghnezhad, A., Mosazadeh, H., Sarli, R., sari Mohamad li, H.R. (2017). Evaluating the Ecologic Potential
for Urban-Rural Development of Tarom’s Basin, Zanjan Province Using the Analytic Hierarchy
Process (AHP). Geographical Engineering of Territory, 1(1), 102-112.
Banko, G. (1998). A Review of Assessing the Accuracy of Classifications of Remotely Sensed Data and
Methods Including Remote Sensing Data in Forest Inventory. Interim Report. International Institute
for Applied Systems Analysis, IR-98-081
Brandt, J.S., Haynes, M.A., Kuemmerle, T., Waller, D.M., Radeloff, V.C. (2013): Regime shift on the roof of
the world: alpine meadows converting to shrublands in the southern Himalayas. Biological
Conservation, 158: 116–127.
Cetin, M. (2009): A satellite-based assessment of the impact of urban expansion around a lagoon. International
Journal of Environmental Science and Technology, 6(4), 579–590.
Cortes, C., Vapnik, V. (1995). Support vector networks. Machine Learning, 20, 273-297
De Sherbinin, A.A. (2002). CIESIN Thematic Guide to Land-Use and Land-Cover Change (LUCC); Center
for International Earth Science Information Network (CIESIN) Columbia University Palisades:
Palisades, NY, USA, Available online: http://sedac.ciesin.columbia.edu/guides (accessed on
November 28th, 2017).
Duarte, D.C.O., Zanetti, J., Junior, J.G., Medeiros, N.G. (2016). Comparison of supervised classification
methods of Maximum Likelihood image, Minimum Distance, Parallelepiped, and Neural network in
images of Unmanned Air Vehicle (UAV) in Viçosa-MG. Proceedings XVII GEOINFO, November
27-30, Campos do Jord˜ao, Brazil.
Elhag, M., Boteva, S. (2016). Mediterranean land-use and land cover classification assessment using high
spatial resolution data. In IOP Conference Series: Earth and Environmental Science, 44(4), 1-13.
Gutman, G., Huang, C., Chander, G., Noojipady, P., Masek, J.G. (2013). Assessment of the NASA-USGS
global land survey (GLS) datasets. Remote Sensing of Environment, 134, 249–265.
Halder, A., Ghosh, A., Ghosh, S. (2011). Supervised and unsupervised land-use map generation from remotely
sensed images using ant-based systems. Applied Soft Computing Journal, 11(8), 5770–5781.
Jia, K., Wei, X., Gu, X., Yao, Y., Xie, X., Li, B. (2014). Land cover classification using Landsat 8 operational
land imager data in Beijing, China. Geocarto International, 29(8), 941-951.
Kynova, A., Dobrovolny, P. (2015). A Neural Nets Urban Land Cover Classification: A Case Study of BRNO
(Czechia). AUC Geographica, 50(20), 153-163.
Liu, J., Heiskanen, J., Aynekulu, E., Pellikka, P.K.E. (2015). Seasonal variation of land cover classification
accuracy of Landsat 8 images in Burkina Faso. In: The International Archives of Photogrammetry,
Remote Sensing and Spatial Information Sciences, Berlin, Germany, Vol: XL-7/W3, 455-460.
Manandhar, R., Odeh Inakwu, O.A., Ancev, T. (2009). Improving the Accuracy of Land-use and Land Cover
Classification of Landsat Data Using Post-Classification Enhancement. Remote Sensing, 1, 330-344.
Marangoz, A.M., Sekertekin, A., Akcin, H. (2017). Analysis of Land-use Land Cover Classification Results
Derived from Sentinel-2 Image. 17th International Multidisciplinary Scientific GeoConference
SGEM, Albena, Varna, Bulgaria, 25- 32.

12 S.Behrouz Hosseini, A.Saremi, M.H.Noori Gheydari, Hossein Sedghi, Alireza Firoozfar
Panda, Ch.B., Moharir, K.K., Khadri, S.F.R., Patil, S. (2018). Study of land-use classification in an arid region
using multispectral satellite images. Applied Water Science, 8: 123 https://doi.org/10.1007/s1320
Petropoulos, G.P., Vadrevu, K.P., Xanthopoulos, G., Karantoun, G., Scholze, M. (2010). A Comparison of
Spectral Angle Mapper and Artificial Neural Network Classifiers Combined with Landsat TM
Imagery Analysis for Obtaining Burnt Area Mapping. Sensors, 10, 1967-1985.
Pirotti, F., Sunar, F., Piragnolo, M. (2016). Benchmark of Machine Learning Methods for Classification of a
Sentinel-2 Image. In: International Archives of the Photogrammetry, Remote Sensing and Spatial
Information Sciences, Prague, Czech Republic, Vol: XLI-B7, 335-340.
Rosenfield, G., Fitzpatrick-Lins, K. (1986): A coefficient of the agreement as a measure of thematic
classification accuracy. Photogrammetric Engineering and Remote Sensing, 52(2), 223–227.
Rozenstein, O., Karnieli, A. (2010): Comparison of methods for land-use classification incorporating remote
sensing and GIS inputs. Applied Geography, 31(2), 533-544.
Schmitt-Harsh, M. (2013): Landscape change in Guatemala: driving forces of forest and coffee agroforest
expansion and contraction from 1990 to 2010. Applied Geography, 40, 40-50.
Schulz, J.J., Cayuela, L., Echeverria, C., Salas, J. (2010): Monitoring land cover change of the dryland forest
landscape of Central Chile (1975-2008). Applied Geography, 30(3), 436-447.
Sekertekin, A., Marang, M., Akcin, H. (2017). Pixel-based classification analysis of land-use and land cover
using Sentinel-and Landsat-8 data. 4th International GeoAdvances Workshop, 14–15 October,
Safranbolu, Karabuk, Turkey.
Song, C., Woodcock, C.E., Seto, K.C., Lenney, M.P., Macomber, S.A. (2001). Classification and change
detection using Landsat TM data: When and how to correct atmospheric effects? Remote Sensing of
Environment, 75, 230–244.
Storey, J., Choate, M. (2008). Geometric Performance Comparison between the OLI and ETM+. Pecora 17–
The Future of Land Imaging. Going Operational November 18–20, Denver, Colorado.
Tatem, A.J., Nayar, A., Hay, (2006). Scene selection and the use of NASA's global orthorectified Landsat
dataset for land cover and land-use change monitoring. International Journal of Remote Sensing, 27,
3073–3078.
Topaloglu, R.H., Sertel, E., Musaoglu, N. (2016). Assessment of classification accuracies of Sentinel-2 and
Landsat-8 data for land cover/ use mapping. The International Archives of the Photogrammetry.
Remote Sensing and Spatial Information Sciences, Volume XLI-B8, XXIII ISPRS Congress, 12–19
July, Prague, Czech Republic
Turner, B.L., Villar, S.C., et al. (2001). Deforestation in the southern Yucatán peninsular region: an integrative
approach. Forest Ecology and Management, 154, 353-370.
Van, T.T., Tran, N.D.H., Bao, H.D.X., et al. (2017). Optical Remote Sensing Method for Detecting Urban
Green Space as Indicator Serving City Sustainable Development. Proceedings, 2(140), 1-6.
Vapnik, V., Chervonenkis, A. (1979). Theory of Pattern Recognition [in Russian]. Nauka, Moscow, 1974.
(German Translation: Wapnik, W., Tscherwonenkis, A. Theorie der Zeichenerkennung,
Akademie-Verlag, Berlin.
Xie, Y., Sha, Z., Yu, M. (2010). Remote sensing imagery in vegetation mapping: a review. Journal of Plant
Ecology, 1(1), 9-23.
Young, A. (1998). Land Resources; Now and for the Future. Cambridge University Press, 319p.
Yousefi, S., Khatami, R., Mountrakis, G., Mirzae, S., Pourghasemi, H.R. (2015). Accuracy assessment of land
cover/land-use classifiers in dry and humid areas of Iran. Environmental Monitoring and Assessment,
167(641), 1-10.

*Corresponding authors (Ali Saremi). Tel.+98-9124212672 E-mail: [email protected] ©2019 International Transaction Journal of Engineering, Management, & Applied Sciences & Technologies. Volume 10 No.12 ISSN 2228-9860 eISSN 1906-9642 CODEN: ITJEA8 Paper ID:10A12G http://TUENGR.COM/V10A/10A12G.pdf DOI: 10.14456/ITJEMAST.2019.157
13
Zhou, T., Li, Zh., Pan, J. (2018). Multi-Feature Classification of Multi-Sensor Satellite Image-y Based on
Dual-Polarimetric Sentinel-1A, Landsat-8 OLI, and Hyperion Images for Urban Land-Cover
Classification. Sensors, 13(373): 1-20
Zhu, Z., Fu, Y., Woodcock, C.E., Olofsson, P. et al., (2016). Including land cover change in the analysis of
greenness trends using all available Landsat 5, 7, and 8 images: A case study from Guangzhou, China
(2000–2014). Remote Sensing of Environment, 185, 243–257.
Zomlot, Z., Verbeiren, B., Huysma, M., Batelaan, O. (2017). Trajectory analysis of land-use and land cover
maps to improve spatiotemporal patterns and impact assessment on groundwater recharge. Journal of
Hydrology, 554, 558-569.
Seyyed Behrouz Hosseini is a Ph.D. Student at the Department of Water Science and Engineering, Science and Research Branch, Islamic Azad University, Tehran, Iran. His works involve different aspects of Hydrology, Simulation, Water Resources Engineering, Climate Change, and Artificial Neural Networks. His research interests are Hydrology, Remote Sensing, GIS, modeling the weather, Flood Mapping, Drought forecasting, and Trend in climate variables.
Dr. Ali Saremi is an Assistant Professor at the Department of Water Science and Engineering, Science and Research Branch, Islamic Azad University, Tehran, Iran. His research interests are Irrigation and Drainage, Hydrology, Optimization, and Water Resources.
Dr.Mohammad Hossein Noori Gheydari is an Assistant Professor and Head of the Department of Water Engineering, Zanjan Branch, Islamic Azad University, Zanjan, Iran. His research interests are Dams, Irrigation and Drainage, Hydrology, Drought and Flood Forecasting.
Professor Dr.Hossein Sedghi is Professor at the Department of Water Science and Engineering, Science and Research Branch, Islamic Azad University, Tehran, Iran. He was a former Head of the Water Engineering Department. His researches are in the field of Water Resources and Engineering, Irrigation and Drainage, Drought, and Hydrology.
Dr.Alireza Firoozfar is an Assistant Professor at the Department of Civil Engineering, University of Zanjan, Zanjan, Iran. Also, he is the Chancellor of the Zanjan Branch Islamic Azad University. His researches are in the fields of Civil and Hydraulic Engineering, Earthquake, Geotechniques, Dams, Remote Sensing, and Hydrology.
Note: This paper is an extended work of the previous published article entitled “Pixel based classification
analysis of land use land cover in Tarom basin” (in Persian) available from the Journal of Water and
Soil Resources Conservation (ISSN 2251-7480), V8(4), 2019, by Seyed Behrouz Hoseini, Ali Saremi,
Mohammad Hosein Nouri Ghidari, Hasan Sedghi, Alireza Firoozfar, and Jafar Nikbakht.
http://wsrcj.srbiau.ac.ir/article_14507_283bb8ad765d8e02a4b5e7ec019a2261.pdf
Trademarks Disclaimer: All product names including trademarks™ or registered® trademarks mentioned in
this article are the property of their respective owners, using for identification purposes only. The use
of them does not imply any endorsement or affiliation.

*Corresponding author (Veronika Ramilevna Ganeeva) E-mail: [email protected] ©2019 International Transaction Journal of Engineering, Management, & Applied Sciences & Technologies. Volume 10 No.12 ISSN 2228-9860 eISSN 1906-9642 CODEN: ITJEA8 Paper ID:10A12H http://TUENGR.COM/V10A/10A12H.pdf DOI: 10.14456/ITJEMAST.2019.158
1
International Transaction Journal of Engineering, Management, & Applied Sciences & Technologies
http://TuEngr.com
PAPER ID: 10A12H
ANALYSIS OF RUSSIAN MIGRATION FLOWS WITH
SOCIO-ECONOMIC DEVELOPMENT CONSIDERATION
Veronika Ramilevna Ganeeva a*
, Elena Vladimirovna Makarova a
,
Alexey Igorevich Dudochnikov a
a Kazan Federal University, RUSSIA.
A R T I C L E I N F O
A B S T R A C T Article history:
Received 03 May 2019
Received in revised form 24
July 2019
Accepted 01 August 2019
Available online 06 August
2019
Keywords:
Russian migration
policy; Demofigurey;
Labour market;
Foreign labour;
Internal migration.
Migration in the Russian Federation today is considered as one of
the main sources of further population growth. The concept of state
migration policy contains that “migration policy is an auxiliary tool for
solving demofigureic and related economic problems” [1]. In addition
to compensating for the natural population decline, immigrants increase
the supply of labor, labor productivity and ease the pressure on pension
systems in host countries. In this regard, the issues of increasing the
migration attractiveness of the Russian regions to attract qualified
personnel from abroad are of particular importance. Regulation of
internal migration flows is aimed at the development of labor mobility
of the population, its movement from labor-oversupply and
overpopulated areas to regions that experience personnel shortages. The
purpose of regulating external migration flows is the selection of
migrants to match their number and professional characteristics to the
needs of the Russian labor market, as well as to curb illegal migration.
Of particular interest is the study of the qualitative and quantitative
characteristics of external and internal migration flows, which is
necessary for the formation of directions of state migration policy. In
this paper, we analyzed migration flows in the Russian Federation and
their role in the socio-economic development of the regions, analyzed
the impact of internal and external migration gains on the
socio-economic position of the subjects of the Russian Federation, and
also offered practical recommendations for improving state migration
policy in order to fully and effective use of migration as a resource for
the country's economic development. © 2019 INT TRANS J ENG MANAG SCI TECH.
1. INTRODUCTION According to the UN, the scale of world migration has a stable upward trend. In 1980 the number
of international migrants was 102 million (M), in 2017 - 258 M, a substantial number (150.3M
people) of whom are migrant workers (58.3% of the total amount of migrants). Over the past decades,
©2019 International Transaction Journal of Engineering, Management, & Applied Sciences & Technologies

2 Veronika Ramilevna Ganeeva, Elena Vladimirovna Makarova, Alexey Igorevich Dudochnikov
the proportion of international migrants among all the citizens of the planet also rose from 2,3% in
1980 to 2,8% in 2000 and 3.4% in 2017 [2].
The UN data based on official statistics on the foreign-born, i.e., people born outside of the
country of current residence indicates that the highest number of migrants in 2017 – 49.8M (15.3% of
country’s total population) - lived in USA. Russia ranks fourth – 11.65M migrants (8.1M of Russia’s
total population) lived here [3]. The main Russian difference from the other industrial countries is that
most immigrants get here from former Soviet Republics with which it has been established that no
visa is required.
Experts note that the most developed countries seek to use international migration as an
important factor of national human capital development, growth of the economy and the entire social
sphere, using a selective approach for this. For example, in Canada and some other developed
countries, a points-based system is used for the selection of economic migrants [4]. From 2015,
applicants who already have a job offer (contract with an employer) receive an advantage when
applying for living in Canada. Such a system allows attracting the very specialists that the country's
economy needs [5].
Selective approach allows the country - the recipient of labor to receive a number of significant
advantages: solving the problem of labor shortages in certain sectors of the economy, productivity
growth, balanced regional development by resettling migrants in certain territories, stimulating
domestic demand for goods and services owing to growing number of consumers, development of
human capital and innovative activity of enterprises, etc.
2. METHOD
This study applies the systematization of theoretical and analytical data, statistical analysis,
comparative analysis, figureical analysis, regression analysis, and trend line building. This study
focuses on 12 Russian regions with positive increase in migrations.
3. RESULT AND DISCUSSION
Since 1992, in Russia has been observed extremely low birth rate while the mortality rate was
high, therefore natural growth rate over the 21 years (up to 2012 inclusive) was negative (Figure 1):
Figure 1: Natural population growth (per 1000 population), Russia [6].

*Corresponding author (Veronika Ramilevna Ganeeva) E-mail: [email protected] ©2019 International Transaction Journal of Engineering, Management, & Applied Sciences & Technologies. Volume 10 No.12 ISSN 2228-9860 eISSN 1906-9642 CODEN: ITJEA8 Paper ID:10A12H http://TUENGR.COM/V10A/10A12H.pdf DOI: 10.14456/ITJEMAST.2019.158
3
Under the circumstances, migration became a source of compensating for all population
damages. Traditionally the migration growth rate is positive and significantly higher than the natural
growth rate (Figure 2).
Figure 2: Population growth in Russia, persons [7]
It should be clarified that the Federal State Statistics Service (Rosstat) registers migration for
permanent residence or long-term stay [8]. Consequently, official statistics do not take into account
foreign migrants who do not have registration in Russia or stay for short periods.
According to the realistic scenario of the DemoFigureic forecast until 2035, compiled by Rosstat,
the natural population decrease in 2018-2035 will reach 7.3M people [9]. Thanks to migration, it will
be possible to reduce it: according to the forecast, the migration increase for the same period will be
4.43M people, and by the beginning of 2036 the population will be not 139.6 million, but 144M
people [10]. Accordingly, migration in Russia is considered to be one of the most important sources
of stabilization of the demofigureic situation [11].
Figure 3: Net immigration in Russia in 2017 by countries
The majority of immigrants — in 2017, only 589,033 people arrived in the country — people
from the Commonwealth of Independent States (CIS) countries (89%) [12]. Migration growth was
211,878 people, the share of from the CIS countries in it - 96% (Figure 3). In this regard, the cultural
and linguistic affinity of migrants in Russia becomes meaningful. In 2017, most immigrants (89%)
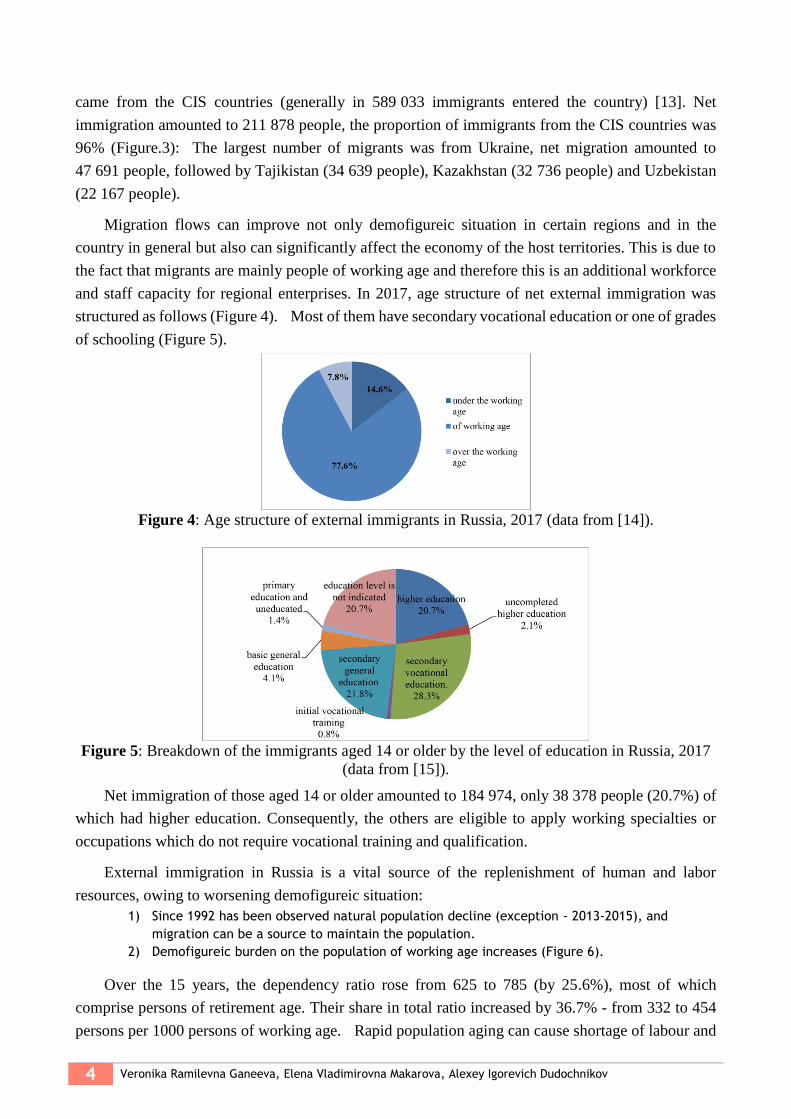
4 Veronika Ramilevna Ganeeva, Elena Vladimirovna Makarova, Alexey Igorevich Dudochnikov
came from the CIS countries (generally in 589 033 immigrants entered the country) [13]. Net
immigration amounted to 211 878 people, the proportion of immigrants from the CIS countries was
96% (Figure.3): The largest number of migrants was from Ukraine, net migration amounted to
47 691 people, followed by Tajikistan (34 639 people), Kazakhstan (32 736 people) and Uzbekistan
(22 167 people).
Migration flows can improve not only demofigureic situation in certain regions and in the
country in general but also can significantly affect the economy of the host territories. This is due to
the fact that migrants are mainly people of working age and therefore this is an additional workforce
and staff capacity for regional enterprises. In 2017, age structure of net external immigration was
structured as follows (Figure 4). Most of them have secondary vocational education or one of grades
of schooling (Figure 5).
Figure 4: Age structure of external immigrants in Russia, 2017 (data from [14]).
Figure 5: Breakdown of the immigrants aged 14 or older by the level of education in Russia, 2017
(data from [15]).
Net immigration of those aged 14 or older amounted to 184 974, only 38 378 people (20.7%) of
which had higher education. Consequently, the others are eligible to apply working specialties or
occupations which do not require vocational training and qualification.
External immigration in Russia is a vital source of the replenishment of human and labor
resources, owing to worsening demofigureic situation:
1) Since 1992 has been observed natural population decline (exception - 2013-2015), and
migration can be a source to maintain the population.
2) Demofigureic burden on the population of working age increases (Figure 6).
Over the 15 years, the dependency ratio rose from 625 to 785 (by 25.6%), most of which
comprise persons of retirement age. Their share in total ratio increased by 36.7% - from 332 to 454
persons per 1000 persons of working age. Rapid population aging can cause shortage of labour and

*Corresponding author (Veronika Ramilevna Ganeeva) E-mail: [email protected] ©2019 International Transaction Journal of Engineering, Management, & Applied Sciences & Technologies. Volume 10 No.12 ISSN 2228-9860 eISSN 1906-9642 CODEN: ITJEA8 Paper ID:10A12H http://TUENGR.COM/V10A/10A12H.pdf DOI: 10.14456/ITJEMAST.2019.158
5
it necessitates external labor resource mobilization;
3) This is confirmed by the fact that the unemployment load (the number of people officially registered
as not working per job vacancy) was only 0.6 by the end of 2017 for Russia as a whole (Figure 7). It
means the demand for labour exceeds its supply.
Figure 6: The dependency ratio in Russia (by the end of the year) [16].
Figure 7: The number of people officially registered as not working per job vacancy by the end of the
year for Russia as a whole, persons [17]
For comparison, in 1995, this indicator was 8.2, that is the number of those wishing to get a job
was significantly higher than a number of vacancies, and therefore, labour market situation could be
described as crucial. The unemployment rate at the time was 9.5%, the unemployment rate registered
was 3.3%. In 2017, similar indicators amounted to 5.2% and 1%, respectively.
The severest impacts of negative demofigureic trends (fertility decline and decrease of the
working-age population) internal interregional migration are starting to play an increasing role for
Russian regions. Over the last ten years its levels have increased rapidly (Figure 8):
In this case, according to the Rosstat methodology, only internal migration associated with a
change of permanent residence (i.e., with a change of registration) has been taking into account.
Commuting and other temporary mobility is not taken into account.
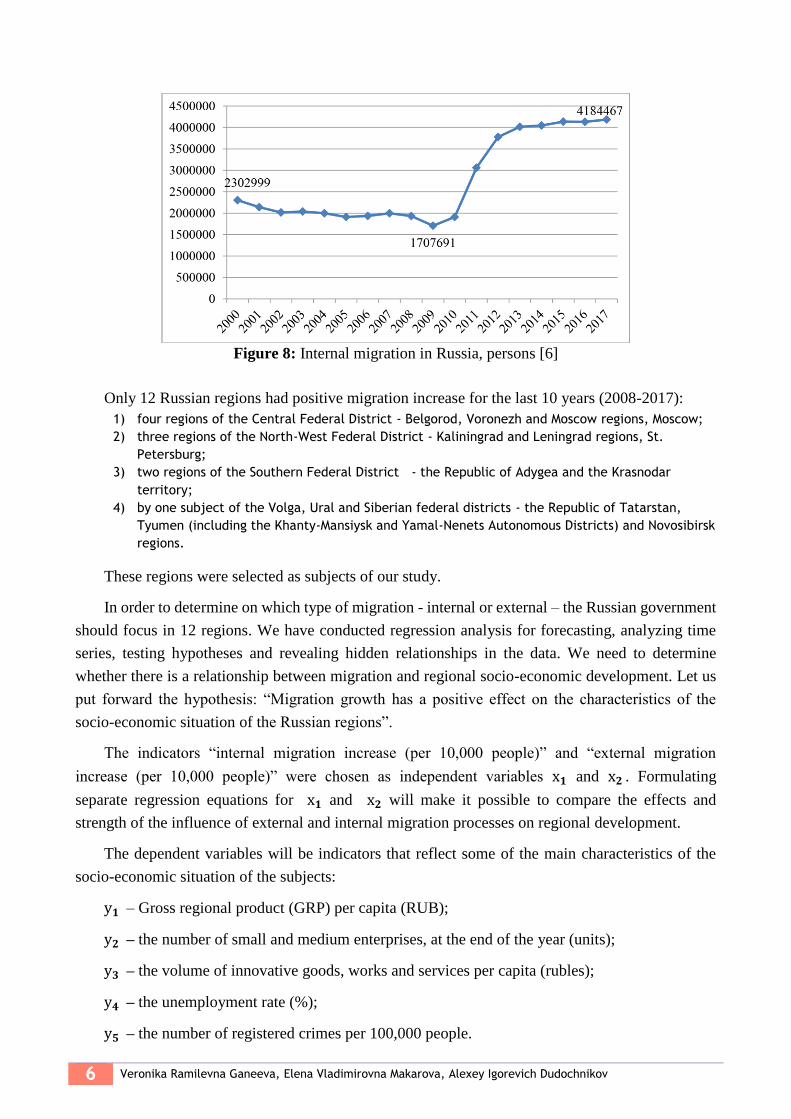
6 Veronika Ramilevna Ganeeva, Elena Vladimirovna Makarova, Alexey Igorevich Dudochnikov
Figure 8: Internal migration in Russia, persons [6]
Only 12 Russian regions had positive migration increase for the last 10 years (2008-2017):
1) four regions of the Central Federal District - Belgorod, Voronezh and Moscow regions, Moscow;
2) three regions of the North-West Federal District - Kaliningrad and Leningrad regions, St.
Petersburg;
3) two regions of the Southern Federal District - the Republic of Adygea and the Krasnodar
territory;
4) by one subject of the Volga, Ural and Siberian federal districts - the Republic of Tatarstan,
Tyumen (including the Khanty-Mansiysk and Yamal-Nenets Autonomous Districts) and Novosibirsk
regions.
These regions were selected as subjects of our study.
In order to determine on which type of migration - internal or external – the Russian government
should focus in 12 regions. We have conducted regression analysis for forecasting, analyzing time
series, testing hypotheses and revealing hidden relationships in the data. We need to determine
whether there is a relationship between migration and regional socio-economic development. Let us
put forward the hypothesis: “Migration growth has a positive effect on the characteristics of the
socio-economic situation of the Russian regions”.
The indicators “internal migration increase (per 10,000 people)” and “external migration
increase (per 10,000 people)” were chosen as independent variables х𝟏 and х𝟐 . Formulating
separate regression equations for х𝟏 and х𝟐 will make it possible to compare the effects and
strength of the influence of external and internal migration processes on regional development.
The dependent variables will be indicators that reflect some of the main characteristics of the
socio-economic situation of the subjects:
у𝟏 – Gross regional product (GRP) per capita (RUB);
у𝟐 – the number of small and medium enterprises, at the end of the year (units);
у𝟑 – the volume of innovative goods, works and services per capita (rubles);
у𝟒 – the unemployment rate (%);
у𝟓 – the number of registered crimes per 100,000 people.
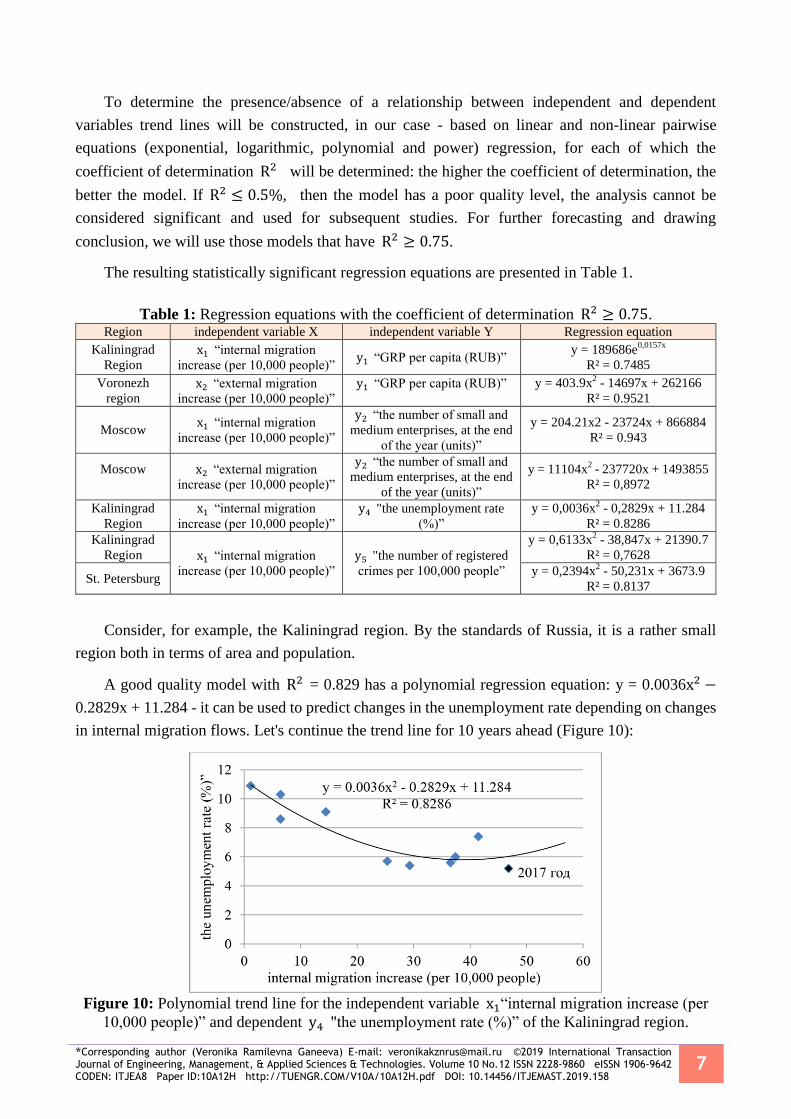
*Corresponding author (Veronika Ramilevna Ganeeva) E-mail: [email protected] ©2019 International Transaction Journal of Engineering, Management, & Applied Sciences & Technologies. Volume 10 No.12 ISSN 2228-9860 eISSN 1906-9642 CODEN: ITJEA8 Paper ID:10A12H http://TUENGR.COM/V10A/10A12H.pdf DOI: 10.14456/ITJEMAST.2019.158
7
To determine the presence/absence of a relationship between independent and dependent
variables trend lines will be constructed, in our case - based on linear and non-linear pairwise
equations (exponential, logarithmic, polynomial and power) regression, for each of which the
coefficient of determination R2 will be determined: the higher the coefficient of determination, the
better the model. If R2 ≤ 0.5%, then the model has a poor quality level, the analysis cannot be
considered significant and used for subsequent studies. For further forecasting and drawing
conclusion, we will use those models that have R2 ≥ 0.75.
The resulting statistically significant regression equations are presented in Table 1.
Table 1: Regression equations with the coefficient of determination R2 ≥ 0.75. Region independent variable X independent variable Y Regression equation
Kaliningrad
Region
х1 “internal migration
increase (per 10,000 people)” у1 “GRP per capita (RUB)”
y = 189686e0,0157x
R² = 0.7485
Voronezh
region х2 “external migration
increase (per 10,000 people)”
у1 “GRP per capita (RUB)”
y = 403.9x2 - 14697x + 262166
R² = 0.9521
Moscow х1 “internal migration
increase (per 10,000 people)”
у2 “the number of small and
medium enterprises, at the end
of the year (units)”
y = 204.21x2 - 23724x + 866884
R² = 0.943
Moscow
х2 “external migration
increase (per 10,000 people)”
у2 “the number of small and
medium enterprises, at the end
of the year (units)”
y = 11104x2 - 237720x + 1493855
R² = 0,8972
Kaliningrad
Region
х1 “internal migration
increase (per 10,000 people)”
у4 "the unemployment rate
(%)”
y = 0,0036x2 - 0,2829x + 11.284
R² = 0.8286
Kaliningrad
Region х1 “internal migration
increase (per 10,000 people)”
у5 "the number of registered
crimes per 100,000 people”
y = 0,6133x2 - 38,847x + 21390.7
R² = 0,7628
St. Petersburg y = 0,2394x
2 - 50,231x + 3673.9
R² = 0.8137
Consider, for example, the Kaliningrad region. By the standards of Russia, it is a rather small
region both in terms of area and population.
A good quality model with R2 = 0.829 has a polynomial regression equation: y = 0.0036х2 −
0.2829x + 11.284 - it can be used to predict changes in the unemployment rate depending on changes
in internal migration flows. Let's continue the trend line for 10 years ahead (Figure 10):
Figure 10: Polynomial trend line for the independent variable х1“internal migration increase (per
10,000 people)” and dependent у4 "the unemployment rate (%)” of the Kaliningrad region.

8 Veronika Ramilevna Ganeeva, Elena Vladimirovna Makarova, Alexey Igorevich Dudochnikov
If internal migration growth increases by 10%, the projected unemployment rate with a
probability of 82.9% will be: 0.0036 ∗ (46.8 ∗ 1.1)2 − 0.2829 ∗ (46.8 ∗ 1.1) + 11.284 = 6.3 ,
which is 20.4% more than the unemployment rate in 2017 by 5.2%.
4. DISCUSSION
The hypothesis about the positive effect of positive migration growth on the socio-economic
situation of the regions was only partially confirmed: the nonlinear regression equations for a number
of subjects showed that a further increase in migration growth could lead to faster growth of GRP (in
the Voronezh and Kaliningrad regions) and small and medium-sized enterprises (in Moscow), and to
the growth of unemployment (in the Kaliningrad region) and crime (in St. Petersburg and the
Kaliningrad regions). Therefore, there is a need to regulate migration processes and their “retention”
in an acceptable framework for the region.
Thus, we conclude that it is necessary to attract labour migrants to Russia as one of the most
important sources for replenishing demofigureic and labor resources and economic development. But
also important are the protection of the national labour market and the maintaining inter-ethnic and
inter-religious peace and harmony in Russian society, which are declared in the Concept of the State
Migration Policy of the Russian Federation for 2019-2025.
Implementing of labour patents in Russia for citizens from “visa-free” countries allows an
unlimited number of migrants to come to Russia to work. Such systems, in our opinion, should work
in all CIS countries: Armenia, Azerbaijan, Belarus, Kazakhstan, Kyrgyzstan, Moldova, Tajikistan,
Turkmenistan, Uzbekistan, and Ukraine. This project will provide the following benefits:
o recruitment of labor adopted in quantitative and qualitative characteristics to the requirements of
the Russian economy;
o formation of “transparent rules of the game” on the Russian labor market — workers who are best
prepared for a specific type of work activity will receive a job;
o quotas distribution for attracting labor by country depending on their cultural and linguistic
similarity with Russia;
o minimizing the number of illegal migrants;
o protection of labor and social rights of migrant workers;
o legal preparedness of migrants;
o minimizing interracial conflicts between labor migrants and the local population.
Therefore, the implementation of the proposed system will become an effective mechanism for
regulating external migration processes.
5. CONCLUSION The article presents an overview of the detailed qualitative and quantitative characterization of
migration flows in the Russian Federation, an analysis of their meaning and degree of influence on
the Russian regions’ socio-economic situation. From this study, the following main problems of
migration management were identified: disproportions in the internal movement of the population -
concentration of “internal” migrants in the central part of Russia and outflow of the population from
its eastern part; lack of skilled labor migrants - only one fifth of migrants have higher education;
*Corresponding author (Veronika Ramilevna Ganeeva) E-mail: [email protected] ©2019 International Transaction Journal of Engineering, Management, & Applied Sciences & Technologies. Volume 10 No.12 ISSN 2228-9860 eISSN 1906-9642 CODEN: ITJEA8 Paper ID:10A12H http://TUENGR.COM/V10A/10A12H.pdf DOI: 10.14456/ITJEMAST.2019.158
9
exceeding the number of labor migrants over the real demand of the Russian economy and the
subsequent increase of unemployment rate among the local population in some regions of the Russian
Federation; high level of illegal migration. Russian regions have a different need to attract foreign
labor, and it must be taken into account when developing migration policy.
The most interesting for Russia are the practices applied in the migration policy of the United
States, Canada, and the EU countries and related to the selective mechanisms in the field of economic
class immigration, which can contribute to the overall progress of the country, using immigration as
one of the development resources.
6. AVAILABILITY OF DATA AND MATERIAL Data can be made available by contacting the corresponding authors
7. ACKNOWLEDGEMENT The work is performed according to the Russian Government Program of Competitive Growth of
Kazan Federal University.
8. REFERENCES [1] Migration Policy Concept Framework of the Russian Federation for the period up to 2025. URL:
http://kremlin.ru/events/president/news/58986
[2] Global Migration in InfoFigureics. URL:
https://www.imf.org/external/russian/pubs/ft/fandd/2018/12/pdf/picture.pdf
[3] Top 25 Destinations of International Migration / Migration Policy Institute. URL:
https://www.migrationpolicy.org/programs/data-hub/charts/top-25-destinations-international-migrants.
[4] Grebenjuk, A. (2018). How does labor migration affect the economies of recipient countries?.
Migracija kak instrument sodejstvija torgovle i ustojchivomu razvitiju. Mosty: ICTSD Mezhdunarodnyj centr po torgovle i ustojchivomu razvitiju, 1: p. 9.
[5] Migration policy: diagnostics, challenges, suggestions. CSD. URL: https://www.hse.ru/mirror/pubs/share/218427665
[6] Natural population change. Federal State Statistics Service. URL: http://www.gks.ru/wps/wcm/connect/rosstat_main/rosstat/ru/statistics/population/demoFigurey/#
[7] Population and migration in the Russian Federation. Federal State Statistics Service. URL:
http://www.gks.ru/wps/wcm/connect/rosstat_main/rosstat/ru/statistics/publications/catalog/doc_1140096034906
[8] Methodological notes. Federal State Statistics Service. URL:
http://www.gks.ru/free_doc/new_site/population/demo/metod/met-dem.htm
[9] DemoFigureic forecast until 2035. URL:
http://www.gks.ru/wps/wcm/connect/rosstat_main/rosstat/ru/statistics/population/demoFigurey/
[10] Regions of Russia. Socio-economic indicators. Federal State Statistics Service. URL:
http://www.gks.ru/wps/wcm/connect/rosstat_main/rosstat/ru/statistics/publications/catalog/doc_1138623506156
[11] Federal Law "On the Legal Status of Foreign Citizens in the Russian Federation" dated July 25, 2002 No. 115-FZ. URL: http://www.consultant.ru/document/cons_doc_LAW_37868/
10 Veronika Ramilevna Ganeeva, Elena Vladimirovna Makarova, Alexey Igorevich Dudochnikov
[12] Comba, M.B., Mangione, M.I., Suárez, A.G., Sarotti, A.M., & Spanevello, R.A. (2018). A
Domino Epoxide Ring-Opening Xanthate Migration Reaction: An Alternative Entry to Thiosugars. European Journal of Organic Chemistry, 48: 6848-6856.
[13] Davitti, D. (2018). Biopolitical Borders and the State of Exception in the European Migration 'Crisis'. European Journal of International Law, 29(4): 1173-1196.
[14] Zoomers, A. (2018). Development at the crossroads of capital flows and migration: Leaving no one behind?. Sustainability (Switzerland), 10(12): 4807.
[15] Pedersen, M.H., & Rytter, M. (2018). Rituals of migration: an introduction. Journal of Ethnic and Migration Studies, 44(16): 2603-2616.
[16] Bhagat, R.B. (2018). Development impacts of migration and urbanization. Economic and Political Weekly, 53(48): 15-19.
[17] Janská, E., & Bernard, J. (2018). Mobility and the assimilation of immigrants: Variationsin
migration patterns of Ukrainians and Vietnamesein the Czech Republic. Moravian GeoFigureical
Reports, 26(4): 244-254.
Veronika Ramilevna Ganeeva is a first-year undergraduate student at Department of State and Municipal Government, Kazan Federal University. She is a student laureate with an academic rating of 89-94. She is interested in Economic, and Policy Management.
Dr. Elena Vladimirovna Makarova is an Associate Professor, Department of Territorial Economics, Institute of Management and Territorial Development, Kazan Federal University, Russia. She has a PhD in Economics. She is also Head of the Department of Scientific Activities of Kazan Federal University (Institute of Management, Economics, and Finance). She is interested in Modern Economic Multifactors Analysis.
Alexey Igorevich Dudochnikov is a Master’s degree student, Department of State and Municipal Management Department, Kazan (Volga region) Federal University. He is interested in Economic and Management.

*Corresponding author (A.Sanusi Hassen) E-mail: [email protected] ©2019 International Transaction Journal of Engineering, Management, & Applied Sciences & Technologies. Volume 10 No.12 ISSN 2228-9860 eISSN 1906-9642 CODEN: ITJEA8 Paper ID:10A12I http://TUENGR.COM/V10A/10A12I.pdf DOI: 10.14456/ITJEMAST.2019.159
1
International Transaction Journal of Engineering, Management, & Applied Sciences & Technologies
http://TuEngr.com
PAPER ID: 10A12I
THE INFLUENCE OF MUGHAL ARCHITECTURE ON MASJID
ZAHIR: CASE STUDY ON FIVE RURAL MOSQUES IN KEDAH,
MALAYSIA
Ahmad Sid Hijaz Md Saaid a,b, Ahmad Sanusi Hassan b*
a Politeknik Sultan Abdul Halim Mu’adzam Shah (POLIMAS), 06000 Jitra, Kedah, MALAYSIA b School of Housing, Building & Planning, Universiti Sains Malaysia, MALAYSIA
A R T I C L E I N F O
A B S T R A C T Article history:
Received 06 April 2019
Received in revised form 19
June 2019
Accepted 28 June 2019
Available online 10 July 2019
Keywords:
Architecture history;
Mughal architecture;
Mosque elements;
Mosques in Malaysia;
Mosque renovation;
Masjid Zahir.
Masjid Zahir in Alor Setar is a prominent mosque in Malaysia. Its
architecture is a century years old and arguably one of the most beautiful
mosques in the world. This study looks at the elements of the Zahir
Mosque architecture that are heavily influenced by Mughal architecture
originating in Northern India. A structured observation survey had been
conducted on five rural mosques in Kedah to study the mosque
architectural attributes. These mosques have adapted many elements
such as onion domes, domed-kiosks, pishtaqs and arches. Significantly,
these elements can also be seen on Masjid Zahir. The study found that
the Masjid Zahir has acted as a reference point for the construction of
many other mosques, especially in Kedah, Malaysia. Among the five
mosques, the most elaborated detail elements were highlighted on Masjid
Ar-Rahmah. Meanwhile, Masjid Nurul Ehsan has been chosen as the
mosque with the most identical identity with its parent Masjid Zahir.
However, this mosque is no longer a prestigious mosque due to the
renovation work which has been seen to disturb the true identity of the
mosque. This study can attract the public interest to appreciate
architectural history and mosques architecture in Kedah, Malaysia. © 2019 INT TRANS J ENG MANAG SCI TECH.
1. INTRODUCTION One of the most significant mosques in Malaysian architectural history is undoubtedly Masjid
Zahir, which was built on a riverbank known as Sungai Kedah in Alor Setar, the capital city of Kedah
Darul Aman. According to India TV News (2014), Masjid Zahir was ranked as the fourth in the list
of ten most beautiful mosques in the world. The construction of this mosque was completed on
March 11, 1912. Ten years earlier a similar and identical mosque had been built in Tanjung Pura,
Langkat, Sumatera, Indonesia. It was known as Masjid Azizi.
Both Zahir and Azizi have shown a strong influence of Mughal architecture. Evidently, very
©2019 International Transaction Journal of Engineering, Management, & Applied Sciences & Technologies

2 Ahmad Sid Hijaz Md Saaid, Ahmad Sanusi Hassan
few academic articles discussed the Indian characters portrayed in the architecture of these two
mosques. These mosques were also known as a royal symbol for Langkat and Kedah Sultanates.
However, the Langkat Sultanate is no longer existed, and the building is only considered as a
historical heritage. The Azizi mosque has passed its golden age. An evident of dissatisfactory can
be seen on its surrounding (Figure 1B). Meanwhile, the Zahir mosque is still intact as a royal mosque
for Kedah State (Figure 1A).
Figure 1A: Masjid Zahir, Alor Setar,
Kedah, Malaysia
Figure 1B: Masjid Azizi, Langkat, Sumatera
Source:
http://visitlangkat.wordpress.com/2014/02/24/jejak
-peninggalan-melayu-langkat
2. LITURATURE REVIEW
Mosque architecture in Malaysia falls into two categories, namely traditional mosque and
colonial mosque. Traditional category mosques are mosques built with regional and local identity.
Whereas the colonial category mosques consist of architectural identities influenced by the Middle
East, Morocco and India (Ahmad, 1999; Basri, 2002). Khazaee et al. (2015) in their study have
categorised Masjid Zahir as a mosque with colonial identity. This study had also observed the
difference between Moorish and Mughal architecture adorned on early Malaysian mosques.
According to Mohamad Rasdi (2007), Islamic architecture found on the mosques was derived
from various forms and terms across the ages. Multiple factors such as climate, technology and
socio-political would decide the architectural characters of the mosques. Although there are plenty
of studies on the mosque as an Islamic institution, however, most of them lack on architectural
aspects. This opinion is recognised by Prof. Mohamad Tajuddin and Dr. Nangkula in their
statement: Islamic architecture in Malaysia such as the National Mosque building is not much studied
from the aspect of thinking and theoretical framework behind its design (Mohamad Rasdi & Utaberta,
2007).
Ali and Hassan (2017) have conducted studies on the elements of Mughal architecture found in
Malaysia through case studies in three mosques namely, Masjid Kapitan Keling in Georgetown,
Penang, Masjid Alwi in Perlis and Masjid Jamek in Kuala Lumpur. This study had also compared
the original elements found in India such as the Jami Mosque of Delhi and Taj Mahal in Agra. The
researchers believed this study was not completed because the Mughal architectural elements
recorded in the local context did not include the Masjid Zahir. A study by Ibrahim and Abdullah

*Corresponding author (A.Sanusi Hassen) E-mail: [email protected] ©2019 International Transaction Journal of Engineering, Management, & Applied Sciences & Technologies. Volume 10 No.12 ISSN 2228-9860 eISSN 1906-9642 CODEN: ITJEA8 Paper ID:10A12I http://TUENGR.COM/V10A/10A12I.pdf DOI: 10.14456/ITJEMAST.2019.159
3
(2010) had detailed out the elements found on Masjid Zahir, but this study did not look at its affinity
with other ordinary mosques, especially in Kedah.
Through a case study of mosques, the researchers can also appreciate the dual-layer space that
provides passive cooling effects. This opinion was supported by Asif Ali (2012); his studies had
shown the advantages of passive cooling space inherent in the major buildings of the Mughal dynasty.
For local mosques, passive cooling architecture should have a fanless airflow system and natural
lighting without lights (Mansor & Mokhtar, 2016).
3. METHODOLOGY
As the oldest, a royal mosque and the pride of its people; Masjid Zahir has always been a
reference to the construction of other mosques found everywhere in the State of Kedah. This
research will discuss five mosques that have similar architectural identities with the Zahir Mosque.
These mosques are as follows:
Table 1: The Mosques involved in this study
The researchers will conduct case studies and structured observations on the five mosques.
Then, they will make comparisons on the architectural elements collected from the five mosques and
compare them with the original elements found in the Zahir Mosque. The findings will then be
recorded in the form of facts and collections of pictures. Next, the researchers will construct a
summary table, and it will become as the most important note for this survey. Finally, analysis and
discussion and conclusions will be made by referring to the summary table.
3.1 ARCHITECTURAL ANALYSIS OF MASJID ZAHIR A general explanation of Masjid Zahir just described the construction of this building is similar
to the architecture of the Azizi Mosque in Sumatera. The researchers argue that more detailed studies
need to be made as comparing how this building has embedded architectural elements based on the
characteristics of Mughal architecture, most of which are found in Northern India. The researchers
have analysed the visual architecture of the Masjid Zahir (Figure 2). There are a lot of architectural
elements in this building. The most prominent Mughal element can be seen on the main dome with
inverted lotus-shaped decoration, domed kiosk or chhatri and guldasta, which is a small dome-spear
that adorns every major corner of the mosque.
Masjid Zahir is a state mosque in Alor Setar City. It is also a landmark and symbol of Islamic
architecture in the State of Kedah. This mosque is visited by all walks of life from both inside and
outside the country. To provide more perfection and increase the capacity of the users, the mosque
was renovated twice in 1960 and 1975. However, the renovation of the mosque has occurred 3-4
times. The mosque prayer hall originally only accommodated 600 prayers had been extended to 2200
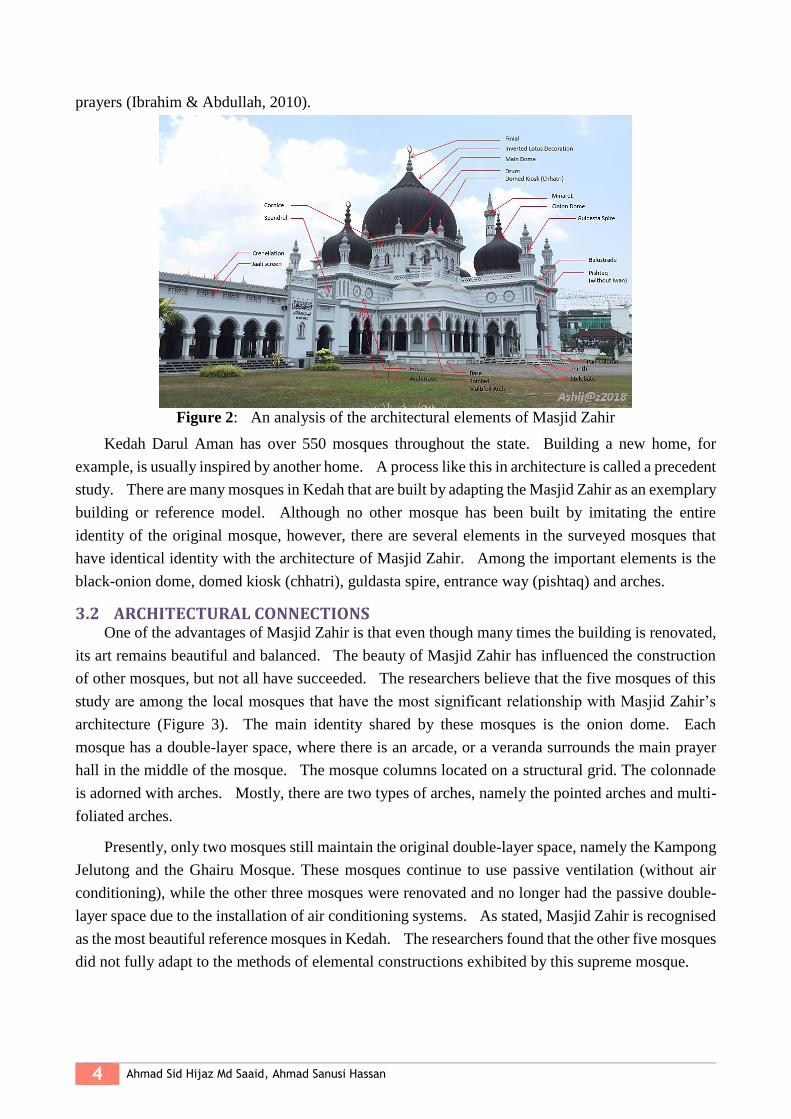
4 Ahmad Sid Hijaz Md Saaid, Ahmad Sanusi Hassan
prayers (Ibrahim & Abdullah, 2010).
Figure 2: An analysis of the architectural elements of Masjid Zahir
Kedah Darul Aman has over 550 mosques throughout the state. Building a new home, for
example, is usually inspired by another home. A process like this in architecture is called a precedent
study. There are many mosques in Kedah that are built by adapting the Masjid Zahir as an exemplary
building or reference model. Although no other mosque has been built by imitating the entire
identity of the original mosque, however, there are several elements in the surveyed mosques that
have identical identity with the architecture of Masjid Zahir. Among the important elements is the
black-onion dome, domed kiosk (chhatri), guldasta spire, entrance way (pishtaq) and arches.
3.2 ARCHITECTURAL CONNECTIONS One of the advantages of Masjid Zahir is that even though many times the building is renovated,
its art remains beautiful and balanced. The beauty of Masjid Zahir has influenced the construction
of other mosques, but not all have succeeded. The researchers believe that the five mosques of this
study are among the local mosques that have the most significant relationship with Masjid Zahir’s
architecture (Figure 3). The main identity shared by these mosques is the onion dome. Each
mosque has a double-layer space, where there is an arcade, or a veranda surrounds the main prayer
hall in the middle of the mosque. The mosque columns located on a structural grid. The colonnade
is adorned with arches. Mostly, there are two types of arches, namely the pointed arches and multi-
foliated arches.
Presently, only two mosques still maintain the original double-layer space, namely the Kampong
Jelutong and the Ghairu Mosque. These mosques continue to use passive ventilation (without air
conditioning), while the other three mosques were renovated and no longer had the passive double-
layer space due to the installation of air conditioning systems. As stated, Masjid Zahir is recognised
as the most beautiful reference mosques in Kedah. The researchers found that the other five mosques
did not fully adapt to the methods of elemental constructions exhibited by this supreme mosque.

*Corresponding author (A.Sanusi Hassen) E-mail: [email protected] ©2019 International Transaction Journal of Engineering, Management, & Applied Sciences & Technologies. Volume 10 No.12 ISSN 2228-9860 eISSN 1906-9642 CODEN: ITJEA8 Paper ID:10A12I http://TUENGR.COM/V10A/10A12I.pdf DOI: 10.14456/ITJEMAST.2019.159
5
Figure 3: Five mosques that have connections with the Masjid Zahir
In architectural design, this situation is expected due to the existence of various factors such as
the construction cost and the status of each mosque. For example, a rural mosque with low financial
allocation is unlikely to be beautifully built like the Zahir Mosque. However, there are still some
interesting characters and identities found in the architecture of the surveyed mosques. This finding
can be seen in the comparative and analysis table (Table 2).
3.3 DATA ANALYSIS The following table is provided as a reference of the conclusions from the study and observations
made on the six mosques (including Masjid Zahir). The analysis of the study is described by this
table.
Table 2: Analysis of the architectural elements of study mosques Mosque Zahir Ghairu
Jamek
Ar-Rahmah Rayatul
islam
Kampung
Jelutong
Nurul
Ehsan
Completion/
*officially opened
11.3.1912
*15.10.
1915
1960**
(estimated)
*
30.4.1965
1966
1993
*
08.12.1966
The capacity of prayers in the Main Prayer Hall
365 pax 360 pax 150 pax 162 pax 225 pax 128 pax
Element
Dome 4 1 3 3 2 4
Chhatri 3 0 1 1 0 3
Minaret 1 0 0 0 1 1
Turret 6 0 0 0 0 0
Guldasta 32 12 10 12 28 18
Crenellation yes yes yes yes yes no
Pyramidal Roof 11 0 0 0 0 0
Pishtaq 3(2) 2 1 2 (1) 1 3
Arches (internal) 64 23 11 (44) 6 (21) 34 6 (25)
Spiral Staircase 1 0 1 1 1 1

6 Ahmad Sid Hijaz Md Saaid, Ahmad Sanusi Hassan
3.3.1 MAIN PRAYER HALL AREA
As a royal-state mosque, Masjid Zahir is provided with the largest main prayer hall. The whole
space is 289 m2. But this area can only accommodate about 365 congregants, taking into
consideration the space of the pulpit, eight pillars and pentagon-shaped walls. The pentagonal
structure was built to support the mosque's main dome made of concrete. The Zahir Mosque has
twice undergone renovations carried out in 1960 and 1975. The mosque originally had three parts
of the entrance ways (pishtaq). The pishtaq space on the left side of the mosque has now been added
and combined with a larger open prayer hall. There is a concrete dome on the rooftop of this pishtaq
space. Entirely, Masjid Zahir has four domes. Three domes are located above the pishtaq spaces,
and the main dome with a diameter of 13.7 meters is placed on the top-centre of the mosque space.
Masjid Ghairu Jamek is an old mosque for Jitra city. The mosque can accommodate as many
as 360 people in the main prayer hall. Masjid Ghairu had served as the main mosque for residents
in Jitra until 1985. A new mosque named Masjid A'ala that accommodate up to 8000 congregants had
been built to replace the Ghairu Mosque as the main mosque in Jitra.
Meanwhile, Masjid Kampong Jelutong is capable of accommodating 225 congregants in the
main prayer hall. It is the most recent mosque built compared to four other mosques studied by the
researchers. Three more mosques have a lower capacity of only about 150 people. These three
mosques have been through several renovations and enlargements. Although the original forms of
the mosques remain, there is no double layer passive space that promotes arches on the outside of the
mosques. Most of the arches have been covered with glass walls.
A similar problem happens to the entrance way or the pishtaq space. The entrance ways located
at Masjid Rayatulislam and Nurul Ehsan have been covered with glass walls. There is no more
architectural language that this space works as a welcoming space as well as bringing users into the
main prayer hall in the middle of the mosques.
3.3.2 DOME, CHHATRI AND MINARET
As the most magnificent mosque, Masjid Zahir has four concrete domes. This means every
visitor under the domes will be able to see the dome-shaped decorative concrete ceiling. On the
contrary, the other five mosques only use dome made of black zinc sheets. The dome that made of
zinc metal is an artificial architecture. It is just a cosmetic element to reveal a similar identity like
Masjid Zahir. There are decorative concrete vaulted ceilings in the Zahir Mosque; the other five
mosques only use zinc metal dome with flat-type suspended ceilings underneath. Compared to
decorative vaulted ceilings, the flat type suspended ceilings cannot provide architectural appreciation
to the public. Users underneath the flat ceiling may not know that there is a dome on the rooftop.
Masjid Kampong Jelutong and Ghairu Jamek still use natural ventilation as well as fans. The
high ceiling position does not have a positive effect on the three mosques, namely Masjid Ar-Rahmah,
Rayatulislam and Nurul Ehsan as they use mechanical ventilation (air conditioning). Chhatri or
domed kiosk is a unique and attractive element of Indian architecture. Three concrete chhatries at
Masjid Nurul Ehsan are almost equal to the chhatri built at Masjid Zahir (Figure 4) whereas the only
chhatri found at Masjid Al-Rahmah is similar to the chhatri of Masjid Rayatulislam. These chhatries
are covered with glass windows. Both have a spiral staircase inside the mosque that serves as a place
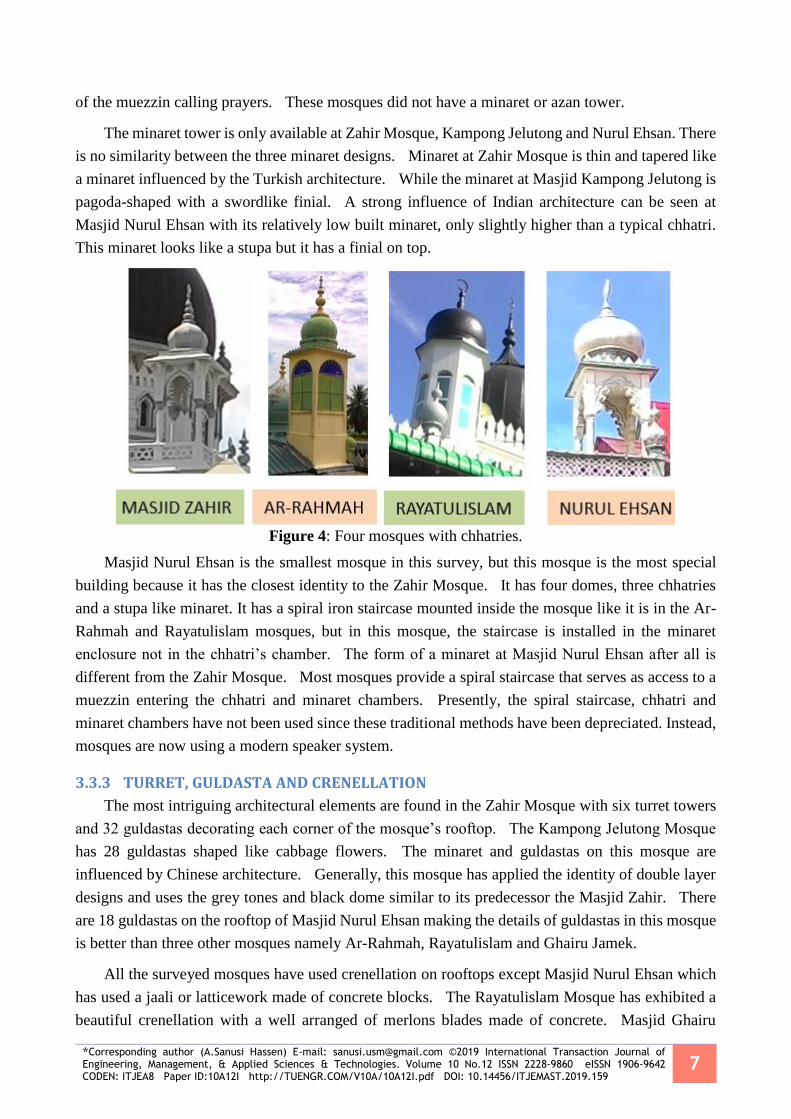
*Corresponding author (A.Sanusi Hassen) E-mail: [email protected] ©2019 International Transaction Journal of Engineering, Management, & Applied Sciences & Technologies. Volume 10 No.12 ISSN 2228-9860 eISSN 1906-9642 CODEN: ITJEA8 Paper ID:10A12I http://TUENGR.COM/V10A/10A12I.pdf DOI: 10.14456/ITJEMAST.2019.159
7
of the muezzin calling prayers. These mosques did not have a minaret or azan tower.
The minaret tower is only available at Zahir Mosque, Kampong Jelutong and Nurul Ehsan. There
is no similarity between the three minaret designs. Minaret at Zahir Mosque is thin and tapered like
a minaret influenced by the Turkish architecture. While the minaret at Masjid Kampong Jelutong is
pagoda-shaped with a swordlike finial. A strong influence of Indian architecture can be seen at
Masjid Nurul Ehsan with its relatively low built minaret, only slightly higher than a typical chhatri.
This minaret looks like a stupa but it has a finial on top.
Figure 4: Four mosques with chhatries.
Masjid Nurul Ehsan is the smallest mosque in this survey, but this mosque is the most special
building because it has the closest identity to the Zahir Mosque. It has four domes, three chhatries
and a stupa like minaret. It has a spiral iron staircase mounted inside the mosque like it is in the Ar-
Rahmah and Rayatulislam mosques, but in this mosque, the staircase is installed in the minaret
enclosure not in the chhatri’s chamber. The form of a minaret at Masjid Nurul Ehsan after all is
different from the Zahir Mosque. Most mosques provide a spiral staircase that serves as access to a
muezzin entering the chhatri and minaret chambers. Presently, the spiral staircase, chhatri and
minaret chambers have not been used since these traditional methods have been depreciated. Instead,
mosques are now using a modern speaker system.
3.3.3 TURRET, GULDASTA AND CRENELLATION
The most intriguing architectural elements are found in the Zahir Mosque with six turret towers
and 32 guldastas decorating each corner of the mosque’s rooftop. The Kampong Jelutong Mosque
has 28 guldastas shaped like cabbage flowers. The minaret and guldastas on this mosque are
influenced by Chinese architecture. Generally, this mosque has applied the identity of double layer
designs and uses the grey tones and black dome similar to its predecessor the Masjid Zahir. There
are 18 guldastas on the rooftop of Masjid Nurul Ehsan making the details of guldastas in this mosque
is better than three other mosques namely Ar-Rahmah, Rayatulislam and Ghairu Jamek.
All the surveyed mosques have used crenellation on rooftops except Masjid Nurul Ehsan which
has used a jaali or latticework made of concrete blocks. The Rayatulislam Mosque has exhibited a
beautiful crenellation with a well arranged of merlons blades made of concrete. Masjid Ghairu

8 Ahmad Sid Hijaz Md Saaid, Ahmad Sanusi Hassan
Jamek has shown a unique combination of crenellation and jaali on its rooftop. However, the
mosque is currently in a state of ill-health because it has not been properly maintained and no longer
used as the main mosque for the residents of Jitra.
Overall, the best decorations on the building facades have been exhibited by the Masjid Zahir.
In this supreme mosque, there are elements of horizontal decoration consist of crenellation, jaali,
cornice and architrave that have provided a balance against the vertical elements such as columns,
minaret, turrets, guldastas and finial.
3.3.4 PYRAMIDAL ROOF AND DOME
Masjid Zahir has also used another special decoration on its rooftop. There are 11 square
pyramidal roofs flanked on four corners of the mosque. This character is found only on its precedent
mosque the Masjid Azizi of Tanjung Pura, Langkat (Figure 1A and 1B). The researchers found that
neither the surveyed mosques nor mosques elsewhere were using this pyramidal roof element. The
main dome of Masjid Zahir is made of concrete. Hence, visitors can appreciate the beauty of the dome
ceiling decoration when they are praying in the main prayer hall. All of the roofs in the other
mosques were found using painted zinc-metal domes. Therefore, there is no purpose to highlight a
typical steel structure to visitors who are sitting underneath of the domes. All the surveyed mosques
only use asbestos flat ceilings. They did not use any special decoration such as a chandelier or pendant
lamps to highlight the interior of the mosques.
3.3.5 PISHTAQ AND ARCHES
Pishtaq is a welcoming space or porch to enter a mosque. In the pishtaq area, there will be at
least one arch that highlights the decoration style of the mosque. Typically, the pishtaq space also
has an iwan or arch that is projected to the inside of the mosque. This element is also known as a
barrel vault). However, the researchers did not find any iwan because there was no vaulted space
(barrel arches) in all the surveyed mosques. There are many types of arches. The most special
pointed-multi-foliated arch type can be found at Masjid Zahir. Masjid Kampong Jelutong is
furnished with an ogee arch type; meanwhile, the other four mosques are fitted with a multi-foliated
arch.
Figure 5: The pishtaq spaces for the six studied mosques.
There are 64 external aches found at Masjid Zahir. This rank is followed by 34 and 23 external
arches located at Kampong Jelutong and Ghairu Jamek Mosques. Three more mosques have only
less than 12 arches since these mosques have been heavily renovated: Passive double-layer space
has been fitted with glass-windows and serves as an air-conditioned prayer hall for the mosques. The
researchers found all the surveyed mosques are simply unique because even without the iwan
(excluded the Masjid Ghairu Jamek), they have domes on their pishtaq spaces (Figure 5). With
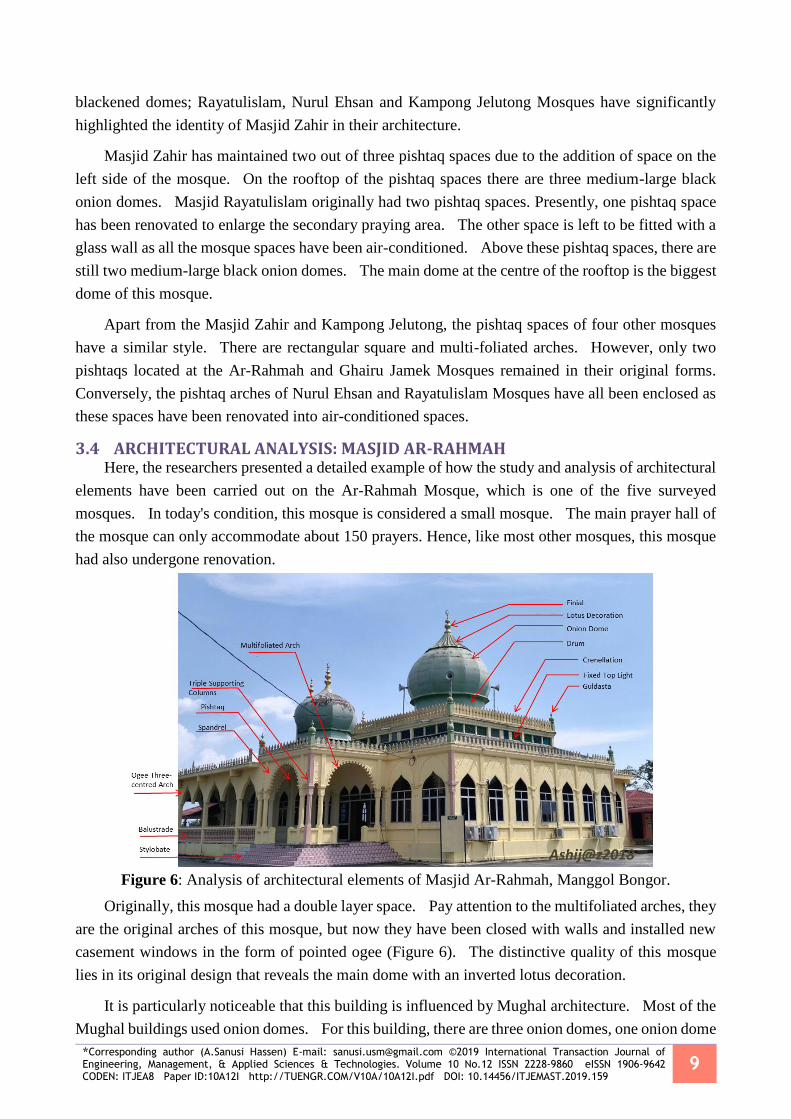
*Corresponding author (A.Sanusi Hassen) E-mail: [email protected] ©2019 International Transaction Journal of Engineering, Management, & Applied Sciences & Technologies. Volume 10 No.12 ISSN 2228-9860 eISSN 1906-9642 CODEN: ITJEA8 Paper ID:10A12I http://TUENGR.COM/V10A/10A12I.pdf DOI: 10.14456/ITJEMAST.2019.159
9
blackened domes; Rayatulislam, Nurul Ehsan and Kampong Jelutong Mosques have significantly
highlighted the identity of Masjid Zahir in their architecture.
Masjid Zahir has maintained two out of three pishtaq spaces due to the addition of space on the
left side of the mosque. On the rooftop of the pishtaq spaces there are three medium-large black
onion domes. Masjid Rayatulislam originally had two pishtaq spaces. Presently, one pishtaq space
has been renovated to enlarge the secondary praying area. The other space is left to be fitted with a
glass wall as all the mosque spaces have been air-conditioned. Above these pishtaq spaces, there are
still two medium-large black onion domes. The main dome at the centre of the rooftop is the biggest
dome of this mosque.
Apart from the Masjid Zahir and Kampong Jelutong, the pishtaq spaces of four other mosques
have a similar style. There are rectangular square and multi-foliated arches. However, only two
pishtaqs located at the Ar-Rahmah and Ghairu Jamek Mosques remained in their original forms.
Conversely, the pishtaq arches of Nurul Ehsan and Rayatulislam Mosques have all been enclosed as
these spaces have been renovated into air-conditioned spaces.
3.4 ARCHITECTURAL ANALYSIS: MASJID AR-RAHMAH Here, the researchers presented a detailed example of how the study and analysis of architectural
elements have been carried out on the Ar-Rahmah Mosque, which is one of the five surveyed
mosques. In today's condition, this mosque is considered a small mosque. The main prayer hall of
the mosque can only accommodate about 150 prayers. Hence, like most other mosques, this mosque
had also undergone renovation.
Figure 6: Analysis of architectural elements of Masjid Ar-Rahmah, Manggol Bongor.
Originally, this mosque had a double layer space. Pay attention to the multifoliated arches, they
are the original arches of this mosque, but now they have been closed with walls and installed new
casement windows in the form of pointed ogee (Figure 6). The distinctive quality of this mosque
lies in its original design that reveals the main dome with an inverted lotus decoration.
It is particularly noticeable that this building is influenced by Mughal architecture. Most of the
Mughal buildings used onion domes. For this building, there are three onion domes, one onion dome
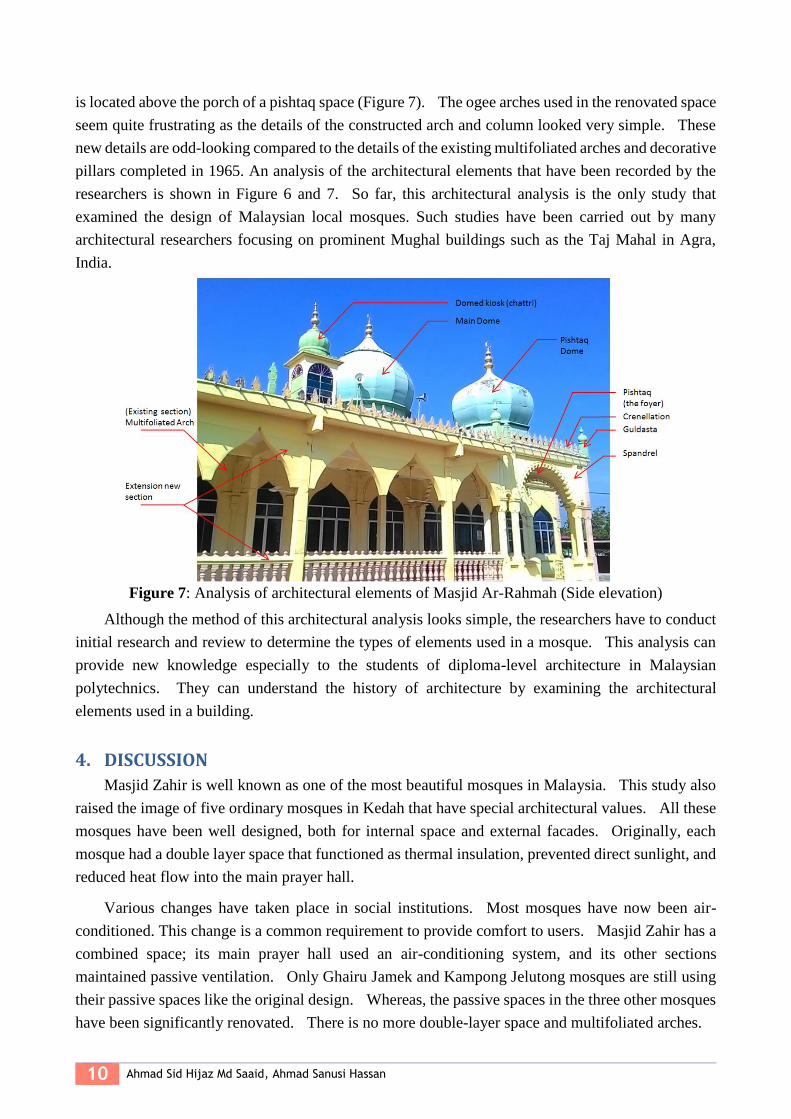
10 Ahmad Sid Hijaz Md Saaid, Ahmad Sanusi Hassan
is located above the porch of a pishtaq space (Figure 7). The ogee arches used in the renovated space
seem quite frustrating as the details of the constructed arch and column looked very simple. These
new details are odd-looking compared to the details of the existing multifoliated arches and decorative
pillars completed in 1965. An analysis of the architectural elements that have been recorded by the
researchers is shown in Figure 6 and 7. So far, this architectural analysis is the only study that
examined the design of Malaysian local mosques. Such studies have been carried out by many
architectural researchers focusing on prominent Mughal buildings such as the Taj Mahal in Agra,
India.
Figure 7: Analysis of architectural elements of Masjid Ar-Rahmah (Side elevation)
Although the method of this architectural analysis looks simple, the researchers have to conduct
initial research and review to determine the types of elements used in a mosque. This analysis can
provide new knowledge especially to the students of diploma-level architecture in Malaysian
polytechnics. They can understand the history of architecture by examining the architectural
elements used in a building.
4. DISCUSSION
Masjid Zahir is well known as one of the most beautiful mosques in Malaysia. This study also
raised the image of five ordinary mosques in Kedah that have special architectural values. All these
mosques have been well designed, both for internal space and external facades. Originally, each
mosque had a double layer space that functioned as thermal insulation, prevented direct sunlight, and
reduced heat flow into the main prayer hall.
Various changes have taken place in social institutions. Most mosques have now been air-
conditioned. This change is a common requirement to provide comfort to users. Masjid Zahir has a
combined space; its main prayer hall used an air-conditioning system, and its other sections
maintained passive ventilation. Only Ghairu Jamek and Kampong Jelutong mosques are still using
their passive spaces like the original design. Whereas, the passive spaces in the three other mosques
have been significantly renovated. There is no more double-layer space and multifoliated arches.

*Corresponding author (A.Sanusi Hassen) E-mail: [email protected] ©2019 International Transaction Journal of Engineering, Management, & Applied Sciences & Technologies. Volume 10 No.12 ISSN 2228-9860 eISSN 1906-9642 CODEN: ITJEA8 Paper ID:10A12I http://TUENGR.COM/V10A/10A12I.pdf DOI: 10.14456/ITJEMAST.2019.159
11
The original mosque buildings have shown some impressive details. Special architectural
elements can be found in all mosques, including small mosques such as Al-Rahmah and Nurul Ehsan.
However, the situation has gone bad once the renovation works have been carried out. The
appearance of the mosque seemed unmanageable. The architectural language of the building facade
has been damaged. The most noticeable example can be seen at Masjid Nurul Ehsan; the mosque
management have done a lot of additional works, but all renovations look inconsistent. The red and
green awning roofs and the installation of rainwater downpipes look very disturbing the facade of the
building (Figure 8).
Figure 8: Arrows show the facade defects caused by improper renovation works
These mosques have no longer exhibit the uniqueness of their multifoliated arches. If any, it is
just an additional arch, such as the ogee arch that is found in Masjid Ar-Rahmah. The arch here is
simple without any details and uninspiring. There are also broken pieces of merlons (crenellation)
and replaced with improper tombstone pieces. The installation of this inappropriate element has
defaced the authenticity of the mosque architecture. At the time of this study, Masjid Rayatulislam
was undergoing renovation and expansion of its left side prayer hall. The researchers found that the
additional work was carried out adequately because it involved contractors, architect and engineers.
When the renovation is completed, it is hoped that the mosque will be more comfortable and will
retain the originality of the existing design.
There are many studies on mosque institutions in Malaysia. However, very few past studies
focused on local mosques architecture. The principle objective of this study is to see the relationship
between Masjid Zahir and other local mosques in Kedah. This study is also important to promote
more research in Malaysia about the appreciation of architectural elements. The five masjids that
have been studied are typical mosques commonly seen in rural areas. But, when the researchers
closely examined their details, these common mosques have some special characters. The surveyed
buildings seemed to be influenced by the Mughal architecture. These buildings appeared similar to
Masjid Zahir regarding elements, designs and colours. Previously, perhaps not many community
members concerned about architectural issues, identity and design of local mosques. This study can
open up new ideas and encourage the public to appreciate the architecture in their surroundings.
5. CONCLUSION
On the detail parts and building finishes, this study found that ordinary mosques built in the past

12 Ahmad Sid Hijaz Md Saaid, Ahmad Sanusi Hassan
look better than today’s typical mosques. There are three beautiful mosques namely Masjid Ar-
Rahmah, Rayatulislam and Nurul Ehsan which were built around 1965 respectively. It was a few
years after Malaysia gained their independence. Surely, the country still lacked qualified and
professional expertise in design and construction aspects. However, these mosques have been
successfully built, and since then, they have been used by the villagers as a community centre and for
congregational prayers.
A long-used building needs to be maintained and upgraded. This obligation will ensure the
building to continue functioning adequately. However, the researcher was very disappointed when
seeing most of the extra work carried out was not in line with the theme and the existing designs
found on the mosque buildings. In today's world of information technology, the mosque
management should at least conduct some research to find out about the intricacies of architectural
designs before undertaking any modification work.
This study found that Masjid Nurul Ehsan is a mosque with the closest identity to Masjid Zahir.
As a royal-state mosque, Masjid Zahir is managed by an administrative department. Masjid Nurul
Ehsan on the other hand is just a rural mosque for Kubang Rotan village community. Seeing this
mosque today, a researcher can still admire the original architectural values found in the mosque
building, but the admiration has slightly been scratched as the mosque seems to have lost its identity;
the mosque's facade and architectural style look disarray due to unsystematic modification of the
mosque. In this context, the architectural appreciation of the mosque seems less important compared
to the comfort of prayers who need to pray on the soft carpeted floors. They also want cooler interior
space and air-conditioned prayer hall.
As a conclusion, we must appreciate the architectural history displayed by the existing buildings
in our built environment. Although our country has a much younger architectural history than other
civilisations such as the Mughal Dynasty that provides Taj Mahal as well as nearly 400 monuments
found throughout the Indian subcontinent; every building like a mosque is a national treasure and
future historical documentation. If we as the society fail to appreciate all this? Forever we will not
have a great history.
6. AVAILABILITY OF DATA AND MATERIAL All data involved in this study are already available in this article.
7. REFERENCES Abdel-Hady, Z.M. (2010). The Masjid, Yesterday and Today. The Center for International and Regional
Studies; Georgetown University School of Foreign Service in Qatar, 2, 1-18.
Ahmad, A. G. (1999). The Architectural Styles of Mosques in Malaysia: From Vernacular to Modern
Structures. In Proceedings of the Symposium on Mosque Architecture: The Historic and Urban
Developments of Mosque Architecture. King Saud University, Riyadh, Saudi Arabia, 2, 147-163.
Ahmed, S.A. (2012). The adaab (etiquettes) of masjid: 1-6. Retrieved March 11, 2018, from
http://www.islameasy.org/pdf/MasjidAdaab.pdf
Ali, A. (2012). Passive Cooling and Vernacularism in Mughal Buildings in North India: A Source of
Inspiration for Sustainable Development. International Transaction Journal of Engineering,
Management, & Applied Sciences & Technologies, 4 (1), 15-27.
*Corresponding author (A.Sanusi Hassen) E-mail: [email protected] ©2019 International Transaction Journal of Engineering, Management, & Applied Sciences & Technologies. Volume 10 No.12 ISSN 2228-9860 eISSN 1906-9642 CODEN: ITJEA8 Paper ID:10A12I http://TUENGR.COM/V10A/10A12I.pdf DOI: 10.14456/ITJEMAST.2019.159
13
Ali, A. & Hassan, A.S. (2017). Influence of Mughal Architectural Style on Malaysian Mosques.
Proceeding of 3rd International Conference-Workshop on Sustainable Architecture and Urban
Design (ICWSAUD2017), 30-44.
Bagby, I. (2012). The American Mosque 2011: Report Number 1 from the US Mosque Study 2011.
Activities, Administration and Vitality of the American Mosque: Retrieved Feb 11, 2018, from
https://www.cair.com/images/pdf/The-American-Mosque-2011-part-1.pdf
Basri, F. (2002). Seni Bina Masjid di Malaysia: Jurnal Tasawwur Islam, 5(8), 61-74.
Bernama (2014, 4 Jun). Masjid Tak Perlu Besar, Tapi Berhawa Dingin. Retrieved March 13, 2018, from
http://www.sinarharian.com.my/edisi/utara/masjid-tak-perlu-besar-tapi-berhawa-dingin-
1.288147
Collins, K.M.T., Onwuegbuzie, A.J. & Jiao, Q.G. (2007). A Mixed Methods Investigation of Mixed
Methods Sampling Designs in Social and Health Science Research, Journal of Mixed Methods
Research, 1(3), 267-294.
Dana, K., Barreto, M.A. & Oskooii, K.A.R. (2011). Mosques as American Institutions: Mosque
Attendance, Religiosity and Integration into the Political System among American Muslim,
Religions, 2, 504-524.
Darmayanti, T.E. (2015). Kajian Aspek Budaya pada Seni Bina Masjid Agung Banten, Banten, Indonesia
[Tesis Sarjana Sains]. Universiti Sains Malaysia.
Ibrahim, M. & Abdullah, F. (2010). Masjid Zahir: A Heritage Masjid as a Traditional Landmark in a
City, Chapter 10, 163-182. Retrieved June 7, 2018, from
http://irep.iium.edu.my/53193/3/Chapter%2010.pdf
Independent News Service Private Ltd (India TV) (2014, 14 July) Top 10 most beautiful mosques in the
world. https://www.indiatvnews.com/news/india/top-10-most-beautiful-mosques-in-the-world-
29415.html
Jabatan Hal Ehwal Agama Islam Negeri Kedah (JHEAIK, 2018). Bahagian Pengurusan Masjid dan
Surau (Function and activity of JHEAIK, information was updated on 15 February 2018).
Retrieved March 13, 2018, from http://www.jaik.gov.my/?page_id=168
Kedar, M. & Yerushalmi, D. (2011). Sharia Adherence Mosque Survey: Correlations between Sharia
Adherence and Violent Dogma in U.S. Mosques: Perspectives on Terrorism, 5(5-6),81-138.
Khazaee, M., Yaakob, N., Awad, Z.A.M. & Md Ali, Z. (2015) Mughal or Moorish architecture: The
origins of Malaysian mosques during colonial periods. Pertanika J. Soc. Sci. & Hum., 23(3), 639–
654.
Mansor, N. & Mokhtar, N.A. (2016). Masjid UlulAlbab. ISBN 978-967-0962-21-4. Universiti Malaysia
Terengganu:Penerbit UMT.
Mohamad Rasdi, M.T. & Utaberta, N. (2007). Pemikiran dan Ide Seni Bina Islam di Malaysia Pada Era
Moden (1950-2000). Research Vot, 78137, UTM, 3-180.
Mohamad Rasdi, M.T. (2007). Mosque Architecture in Malaysia: Classification of Styles and Possible
Influence, Journal Alam Bina, 9(3), 1-37.
Mohd Nawawi, N. (2006). Sejarah dan Konsep Senibina Masjid [PowerPoint Slides]. Kursus Pemandu
Pelancong Masjid: 23 December 2006, Masjid Negara, Kuala Lumpur.
Nasir, A. H. (1984). Masjid-masjid di Semananjung Malaysia. Kuala Lumpur, Berita Publishing
Nik Dahalan, N.N. & Ramli, N.M. (2014). Seni Bina Masjid Dalam Islam, Jurnal Al-Muqaddimah, 2(1),
39-47.

14 Ahmad Sid Hijaz Md Saaid, Ahmad Sanusi Hassan
Utaberta, N. (2007). Seni Bina Islam Moden di Malaysia: Studi Terhadap Pemikiran, Falsafah dan Idea
Rekabentuk: Kertas Penyelidikan PhD; Jabatan Seni Bina, Fakulti Alam Bina, Universiti
Teknologi Malaysia, 24-56.
Utaberta, N., Surat, M. &Spalie, N. (2011). Isu dan Kepentingan Dokumentasi Serta Klasifikasi Dalam
Kajian, Pendekatan dan Interpretasi Terhadap Seni Bina Islam Moden Di Nusantara: Journal
Design + Built; Seni Bina Islam Moden Nusantara, 4(1), 85-97.
Ahmad Sid Hijaz is a Senior Lecturer at POLIMAS, Malaysia, and has served in several polytechnics in Malaysia and Brunei. He graduated with a diploma (from UTM, Malaysia), a double-degree in architecture and a master of science in architectural design (all from USM, Malaysia). Currently, he is pursuing his PhD study in Islamic Architecture at USM, Malaysia.
Professor Dr.Ahmad Sanusi Hassan is a Professor in Architecture Programme at the School of Housing, Building and Planning, Universiti Sains Malaysia (USM), Penang, Malaysia. He obtained a Bachelor and Master of Architecture degrees from University of Houston, Texas, USA, and Doctor of Philosophy (PhD) degree focusing on sustainable architecture and urban design development for Southeast Asia from University of Nottingham, United Kingdom. His research encompasses to Urban Design, Studio Architecture and History and Theory of Architecture, as well as Computer Aided Design (CAD) and Computer Animation.
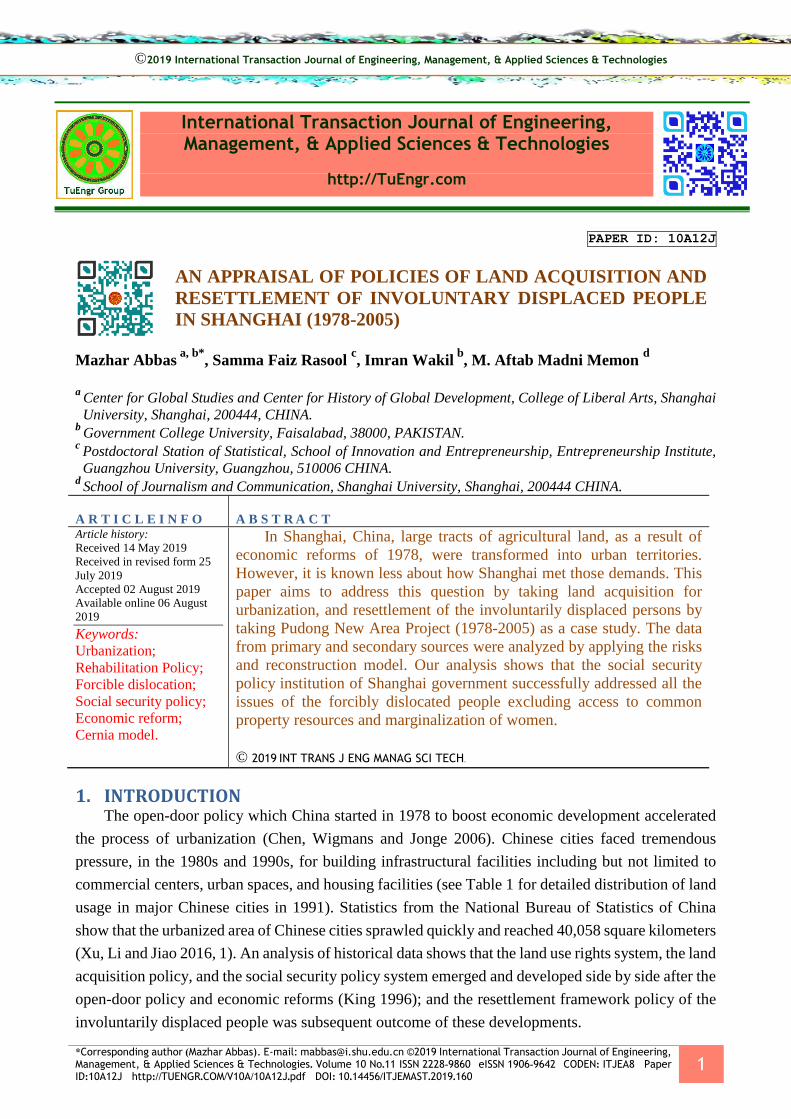
*Corresponding author (Mazhar Abbas). E-mail: [email protected] ©2019 International Transaction Journal of Engineering, Management, & Applied Sciences & Technologies. Volume 10 No.11 ISSN 2228-9860 eISSN 1906-9642 CODEN: ITJEA8 Paper ID:10A12J http://TUENGR.COM/V10A/10A12J.pdf DOI: 10.14456/ITJEMAST.2019.160
1
International Transaction Journal of Engineering, Management, & Applied Sciences & Technologies
http://TuEngr.com
PAPER ID: 10A12J
AN APPRAISAL OF POLICIES OF LAND ACQUISITION AND
RESETTLEMENT OF INVOLUNTARY DISPLACED PEOPLE
IN SHANGHAI (1978-2005)
Mazhar Abbas a, b*
, Samma Faiz Rasool c, Imran Wakil
b, M. Aftab Madni Memon
d
a
Center for Global Studies and Center for History of Global Development, College of Liberal Arts, Shanghai
University, Shanghai, 200444, CHINA. b
Government College University, Faisalabad, 38000, PAKISTAN. c
Postdoctoral Station of Statistical, School of Innovation and Entrepreneurship, Entrepreneurship Institute,
Guangzhou University, Guangzhou, 510006 CHINA. d
School of Journalism and Communication, Shanghai University, Shanghai, 200444 CHINA.
A R T I C L E I N F O
A B S T R A C T Article history:
Received 14 May 2019
Received in revised form 25
July 2019
Accepted 02 August 2019
Available online 06 August
2019
Keywords:
Urbanization;
Rehabilitation Policy;
Forcible dislocation;
Social security policy;
Economic reform;
Cernia model.
In Shanghai, China, large tracts of agricultural land, as a result of
economic reforms of 1978, were transformed into urban territories.
However, it is known less about how Shanghai met those demands. This
paper aims to address this question by taking land acquisition for
urbanization, and resettlement of the involuntarily displaced persons by
taking Pudong New Area Project (1978-2005) as a case study. The data
from primary and secondary sources were analyzed by applying the risks
and reconstruction model. Our analysis shows that the social security
policy institution of Shanghai government successfully addressed all the
issues of the forcibly dislocated people excluding access to common
property resources and marginalization of women.
© 2019 INT TRANS J ENG MANAG SCI TECH.
1. INTRODUCTION The open-door policy which China started in 1978 to boost economic development accelerated
the process of urbanization (Chen, Wigmans and Jonge 2006). Chinese cities faced tremendous
pressure, in the 1980s and 1990s, for building infrastructural facilities including but not limited to
commercial centers, urban spaces, and housing facilities (see Table 1 for detailed distribution of land
usage in major Chinese cities in 1991). Statistics from the National Bureau of Statistics of China
show that the urbanized area of Chinese cities sprawled quickly and reached 40,058 square kilometers
(Xu, Li and Jiao 2016, 1). An analysis of historical data shows that the land use rights system, the land
acquisition policy, and the social security policy system emerged and developed side by side after the
open-door policy and economic reforms (King 1996); and the resettlement framework policy of the
involuntarily displaced people was subsequent outcome of these developments.
©2019 International Transaction Journal of Engineering, Management, & Applied Sciences & Technologies

2 Mazhar Abbas, Samma Faiz Rasool, Imran Wakil, M. Aftab Madni Memon
Shanghai’s Pudong New Area is one of those regions where land acquisition and development
between 1978 and 2005 wasn’t possible without involuntary displacement of the people. It is
imperative, then to know: How Shanghai Government reacted to these demands? Besides exploring
the land acquisition policy for urbanization in the Pudong New Area, this study aims to analyze the
resettlement policy of the Shanghai government for the relocation of the involuntarily displaced
people through application of the risks and reconstruction model. The subsequent parts of this paper
are built on in-depth analyses of the Constitutions of the People’s Republic of China; regulations
governing land ownership; land use rights and land management system; reports of Shanghai
Municipal Statistics Bureau; and documents of Ministry of Commerce.
Table 1: Land Use in Major Chinese Cities Including Shanghai in 1991 (%). City Residential Industrial Infrastructure Green Space Special Uses
Shanghai 49.63 30.54 7.28 0 12.55
Beijing 39.09 20.11 5.54 0 35.3
Tianjin 26.07 35.04 29.56 4.27 4.27
Guangzhou 35.94 37 17.12 0 9.94
Shenzhen 59.86 22.12 14.09 3.02 0.42
Shenyang 29.56 27.95 23.08 6.89 11.79
Chongqing 34.04 33.41 26.99 3.12 5.44
Wuhan 26.84 30.38 24.96 7 8.75
Zhenzhou 25.51 28.26 37.76 7.89 0.57
Nanjing 36.79 23.08 9.55 1.85 28.73
Hangzhou 36.17 29.89 15.78 14.94 3.21
Kunming 28.69 23.06 38.47 3.08 6.7
Taiyuan 20.96 26.73 32.83 19.47 -
Xi’an 44.51 29.31 25.91 0.08 0.16
Harbin 38.01 26.34 26.61 6.64 1.84
Source: Nanjing University of Geography and Lake Study, 1999 (Ding 2003, 2)
2. AN HISTORICAL EVOLUTION OF LAND MANAGEMENT SYSTEM IN
SHANGHAI
Between 1949 and 1978 appropriation of land from the landlords and its allocation to the peasant
cultivators was mainland China’s, including Shanghai, principle land policy (Ding 2003). The urban
land was allocated to danweis (state-owned business), and farmland was allocated to village
communes for collective farming (Ministry of Commerce 1991). Whenever it was required, the state
was responsible for acquiring collectively owned land by the village communes in rural areas to
transform it into state-owned land (Ding 2003, 110-111). On the other hand, the constitution
prohibited danweis for any transaction in land including leasing out of land to the foreign and
private companies and corporations (Yuan 2004).
Economic reforms, initiated by Deng Xiaoping, accelerated the pace of urbanization in Shanghai,
like other Chinese cities, which required more and better housing, infrastructure, and industry. To
meet the increasing need for land, Shanghai government extensively examined legal framework and
operational procedures and adopted Hong Kong’s land leasehold system as a model. Besides meeting
up the increasing demand for land, Shanghai’s leadership and administration expected that this model

*Corresponding author (Mazhar Abbas). E-mail: [email protected] ©2019 International Transaction Journal of Engineering, Management, & Applied Sciences & Technologies. Volume 10 No.11 ISSN 2228-9860 eISSN 1906-9642 CODEN: ITJEA8 Paper ID:10A12J http://TUENGR.COM/V10A/10A12J.pdf DOI: 10.14456/ITJEMAST.2019.160
3
would help provide them essential revenues to feed the infrastructural development projects (Chen,
Wigmans and Jonge 2006, 95). Thus, the Shanghai government either introduced new laws or
amended the existing laws related to the land management system, land use rights, and land
acquisition policies. For example, as a result of the approval of ‘the Transfer of Land-use Rights in
Shanghai Regulations’ on November 29, 1987, the procedure to acquire the land use rights and
obligations of the investors to use those rights were yielded. Implementation of the regulations on
January 1, 1988, paved the way for the first successful land lease auction, on Hong Kong’s
footprints, in Shanghai’s Hongqiao district (Chen, Wigmans and Jonge 2006, 95-97). Before
expanding land leasing on a wider scale another pilot project, termed as ‘Pudong New Area’
(Ministry of Commerce 1991), was launched in Pudong district of Shanghai to grant land leasing
procedures to the private investors up to seventy years (Ministry of Commerce 1990).
Not only the private and foreign companies and corporations were allowed to acquire land on the
lease; also, they were allowed to transfer land use rights of the leased land (Chan 1999, 54). Private
lease rights were the recognition of the role of the private sector in the process of the country’s
urban development. Together these developments gave birth to the real estate sector (Sang 1993),
which replaced the traditional land allocation system. On the one hand, it attracted global investment
which further fueled the process of urbanization (Chen, Wigmans and Jonge 2006); on the other hand,
many people were not only deprived of the farmland but also relocated as a result of compulsory land
acquisition (Cernea 1997). Private sector or real estate companies, who get land on lease, after
appropriation by the local or municipal government, were responsible for the resettlement of the
involuntarily displaced people. Thus, land use rights system and land acquisition policy, and real
estate and social security policy—resettlement of the forcibly displaced people, emerged and
developed side by side after the economic reforms (King 1996).
Shanghai city witnessed massive population growth, followed by extensive world-class
reconstruction characterized. The city’s population doubled from 8.61 to 17.06 million between 1991
and 2005, out of which 13.6 million were registered under ‘the Hukou System’—the residents of
Shanghai (Chiu 2008). Note that Hukou is an indigenous residence permit for social welfare
services that allows the hukou holder, indigenously registered person, to have access to social
benefits and social welfare services (including schools, health insurance, housing, job, and retirement
plans) and subsidized agricultural goods. The overall spatial pattern of housing distribution in
Shanghai underwent greater changes in this one-and-a-half decade (see Table 2 for details regarding
the land area, registered population, and housing floor area in Shanghai between 1990 and 2005)
(Bureau 2006). In response to the population growth, a constructed area of urban Shanghai increased
from 699 square kilometers in 1987 to 1815 square kilometers in 2008, which was 29 percent of the
total area of Shanghai in 2008 (in 2008, total area of Shanghai was 6341 square kilometers). However,
cropland decreased from 5043.9 square kilometers in 1987 to 4087.6 square kilometers in 2008 (Chiu
2008). Thus, cropland, forest, and tidal land decreased (see Table 3 for land use dynamic degree
during different periods in Shanghai). Around 84% of the newly urbanized area between 1979 and
2008 came from 67% of the cropland, 9% of the forest and shrubs, and 2% of the tidal land. All these
developments diminished the farming population by 14% (see Table 4 for changes of cropland and
proportion of the population engaged in farming in Shanghai between 1979 and 2008) (Zhang et al.

4 Mazhar Abbas, Samma Faiz Rasool, Imran Wakil, M. Aftab Madni Memon
2011, 1794).
Table 2: Land Area, Registered Population, and Housing Floor Area in Shanghai between 1990
and 2005 District Land Area (Sq.
Km.)
Year-end Registered Population
(1000 Persons)
Housing Floor Area
(1000 Sq. Meter)
1990 2005 1990 2005 1990 2005
Central City
Changing 29 38 565 618 7500 18280
Hongkou 23 23 848 785 8910 17790
Huangpu 20 12 699 599 7560 8210
Nanshi 28 - 798 - 9070 -
ing’an 8 8 461 310 4890 8080
Luwan 8 8 452 317 4510 7160
Putuo 30 55 763 858 8950 28870
Xuhui 47 55 717 887 9680 29020
Yangpu 60 61 1076 1082 1085 26110
Zhabei 43 29 682 705 7180 14450
Subtotal/Average 296 289 6496 6161 - -
Inner Suburbs
Baoshan 425 271 623 808 5460 30550
Jiading 484 459 509 527 - 16540
Minhang 43 372 151 825 2960 44260
Shanghai Xian 378 - 417 - - -
Pudong - 523 - 1848 - 64310
Chuansha 446 - 617 - - -
Subtotal/Average 1776 1625 2317 4008 - -
Outer Suburbs
Chongming 1041 1185 734 701 - 3730
Fengxian 687 687 521 512 - 8510
Jinshan 586 586 549 524 - 8260
Nanhui 688 688 698 719 - 12650
Qingpu 676 767 454 455 - 7080
Songjiang 606 605 499 522 - 26110
Subtotal/Average 4284 4518 3455 3433 - -
Total 6341 6341 12833 13603 - -
Sources: Shanghai Municipal Statistics Bureau (Bureau 2006); Shanghai Municipal Statistics Bureau
(Bureau 1991); and (Chiu 2008).
Table 3: Land Use Dynamic Degree during Different Periods in Shanghai (Unit: Sq. Km.) Class 1979 1987 1997 2008
Urban/Built-up 585.3 698.9 929.2 1815.7
Cropland 5040.1 5043.9 5197 4087.6
Forest and Shrub 582.1 271.5 101.6 196.1
Tidal Land 219.5 408.8 169.9 127.2
Bare Land 28 214 55.2 490.5
Source: Land Use Dynamics of the Fast-Growing Shanghai Metropolis, China (1979–2008) and its
Implications for Land Use and Urban Planning Policy (Zhang et al. 2011)
Table 4: Changes of Cropland and Proportion of Population Engaged in Farming (PPEF) in Shanghai Year Cropland (Square Kilometer) PPEF (%)
1979 5040.1 25.02
1987 5043.9 18.74
1997 5197 17.72
2008 4087.6 11.18
Source: Land Use Dynamics of the Fast-Growing Shanghai Metropolis, China (1979–2008) and its Implications for Land
Use and Urban Planning Policy (Zhang et al., 2011)

*Corresponding author (Mazhar Abbas). E-mail: [email protected] ©2019 International Transaction Journal of Engineering, Management, & Applied Sciences & Technologies. Volume 10 No.11 ISSN 2228-9860 eISSN 1906-9642 CODEN: ITJEA8 Paper ID:10A12J http://TUENGR.COM/V10A/10A12J.pdf DOI: 10.14456/ITJEMAST.2019.160
5
3. ‘PUDONG NEW AREA’: EVOLUTION AND DEVELOPMENT
The East Bank of Huangpu River, which stretches across 2,000 square kilometers and
constitutes around 30% of Shanghai’s territory, is referred to as ‘Pudong New Area’ (Chen 2007,
45). Sun Yat-sen is credited for pressing for the development and modernization of Shanghai,
particularly in the global context, in the 1920s and 1930s. Another notable attempt was made in the
1980s when the population from Puxi, a district in the downtown, was relocated to other areas in
Shanghai. It was done because Puxi was one of the most congested areas of the city and could not
accommodate the amassing population and increasing business center (Zhai 2012, 35-40). Finally,
the People’s Congress officially approved the proposed project of Pudong on April 18, 1990 (Chen
2007, 59) and “Comprehensive plan of the new district of Pudong” was published in 1991
encompassing the extension of the urban territory of Shanghai (for detailed urban structure of
Pudong see Table 5) (Zhai 2012, 71).
Table 5: Designated Area and Population of Five Sub-districts of Pudong New Area (2012) Sr. No. Name of the District Designated Area (Square Kilometer) Population (in Million)
1 Lujiazui-Huamu 30 .5
2 Waigaoqiao-Gaoqiao 62 .3
3 Qingningsi-Jinquao 33 .45
4 Zhoujiadu-Liuli 35 .55
5 Beicai-Zhangjiang 17 .22
4. THE RISKS AND RECONSTRUCTION MODEL
Meeting the investment and labor demands of economic reforms and industrial transformations
require more urbanizations (Zhang et al. 2011) which might result in the involuntary displacement of
people. Amongst the available remedial models of these issues that are confronted by the municipal
and local governments (Chambers and Morris 1973, Nelson 1973, Scudder and Colson 1982, Cernea
1997), Michael Cernia’s ‘the risks and reconstruction model’ seems the most suitable, satisfactory
and effective model or proposed solution for the reconstruction of the involuntarily displaced people,
whose lands are acquired for urbanization. Cernea (1997) argues that involuntarily displaced people
by development projects are more than refugees of wars and natural disasters. This forcible
dislocation causes poverty among dislocated people worldwide and promotes social injustice which,
according to Wolfensohn (1995), “can abolish socio-political and economic advances” (Wolfensohn
1995). Cernia’s model provides the conceptual tools to ensure the rehabilitation of involuntarily
displaced people along with problem diagnostic, predictive, and resolution capacities.
The predictive capacity of the model is based on turning the diagnostic identification into a
forecast for effective and improved planning—model’s this capacity is referred to as
‘predictive-cum-planning capacity.’ By collecting information on the results of many previous
displacements, the model forecasts that future results will occur if its warnings are ignored. This
model predicts possible impoverishment risks and helps planners and managers of the project in
planning and managing a useful policy. For example, this model was attempted by India (Thangaraj
1996) and the Philippines (Cernea 1997) as an instrument for planning and development.
The ability to solve problems rests on the scope of the model and its orientation towards action.
6 Mazhar Abbas, Samma Faiz Rasool, Imran Wakil, M. Aftab Madni Memon
Besides diagnosing, analyzing, and predicting the risks of a social movement, this model can also
propose solutions to the problems. For example, the danger of landlessness is addressed through land
rearrangement policies; unemployment through sustainable re-employment; homelessness through
reconstructing homes; and so on. It also comprises risk vindication but continues to build a new
socio-political and economic base on which the livelihoods of the resettled can be reestablished and
then upgraded in a lasting way.
4.1 IDENTIFICATION OF THE KEY RISKS AND IMPOVERISHMENT PROCESS
This model identifies following key risks and processes of impoverishment in displacement.
4.1.1 Landlessness
Land expropriation deprives people of their capital source of income coupled with other attached
economic and commercial activities. Kiambere Project in Kenya and Rengali Project in India are
typical examples of such expropriation which diminished people’s basic income and increased
overall poverty in these regions (Mburugu 1994, Ota 1996).
4.1.2 Joblessness
The damage of salaried service occurs in both rural and urban movements. Lost jobs include
dispossessed workers, business or service workers, and artisans or small commercial owners. It
causes unemployment and a change of profession. Unlike urban areas, people in rural areas do not
lose their jobs in the industrial and commercial sector, but access to work in the agricultural land—a
capital source of income in rural areas. For example, people lost their jobs as a result of the Coal
Mining Project of Talcher, Orissa and Hydro Project in Manitoba and Churchill-Nelson, Canada
(Cernea, 1997; Pandey, 2000).
4.1.3 Homelessness
Homeless might be temporary and last long as well. Relocation of more than 2,000 families in the
urban area was disrupted in Cameroon-Douala Project (completed in 1989), reported by the World
Bank. Chines government reported that over 20 percent households were homeless as a result of
Danjiangkou Reservoir—Dam Project (Cernea 1997).
4.1.4 Marginalization
The decrease in economic power i.e. “downward mobility” among the affected households
causes marginalization. Subsequently, middle-income households slip to the small landholders’
category, and small income traders and artisans fall below poverty line. The marginalization is also
gauged as a decline in social position and self-confidence of the resettled people in the social fabric,
coupled with a sense of injustice, and unstable behavior. Social and economic relegation in Nepal’s
Kulekhani Hydroelectric Project (Cernea 1997) and Sri Lanka’s Kotmale Project (Søftestad 1990),
and sometimes psychological marginalization (Appell 1985) are best examples to illustrate this kind
of impoverishment.
4.1.5 The Increased Morbidity and Mortality
Another outcome of displacement is losing in citizens’ physical and mental health, increase in
social stress, and expansion in their insecurity. Malaria and schistosomiasis, which are parasitic and
*Corresponding author (Mazhar Abbas). E-mail: [email protected] ©2019 International Transaction Journal of Engineering, Management, & Applied Sciences & Technologies. Volume 10 No.11 ISSN 2228-9860 eISSN 1906-9642 CODEN: ITJEA8 Paper ID:10A12J http://TUENGR.COM/V10A/10A12J.pdf DOI: 10.14456/ITJEMAST.2019.160
7
vector-borne diseases, cause serious declines in health among the involuntarily displaced people.
Vulnerability to epidemics and chronic diseases including diarrhea and dysentery, among involuntary
dislocated people, increases due to polluted water, unhygienic food, and poor sewerage system. For
example, Scudder (1982) claims that indigenous rates of morbidity among displaced people of Nam
Pong Reservoir, Thailand, were comparatively higher. In Akosombo Dam Project of Ghana,
schistosomiasis among both adult and children from 1.8 percent before resettlement rose to 75
percent among adult and 100 percent among children after few years of their rehabilitation near Dam
Lake (Cernea 1997).
4.1.6 Food Insecurity
Along with other impoverishments, forced migration also causes diminishes calorie-protein
intake levels, and engenders undernourishment. It happens due to either non-availability of food or
scarcity of food to the dislocated people. Urbanization is consequential for promoting food insecurity:
more the land for urbanization, the less of it is available for cultivation of food items. For example,
agricultural land among the rehabilitated people, in the Bailiambe Reservoir Project in China,
decreased from 1.3 hectares to 0.4 mu per household after relocation. Subsequently, local food
production decreased. Forum-Gleita irrigation project of Mauritania also caused decrease in
agricultural land per household, and subsequently, undernourishment due to food shortage, among
the relocated (Cernea 1997).
4.1.7 Loss of Common Property Resources Access
Loss of common property means a decrease in income and livelihood of those who are dependent
upon forest lands, water bodies, grazing land, parks, and burial grounds. In the majority of the
government-funded relocation programs, loss or lack of access to the common property resources is
not compensated (Cernea 1997). For example, a thorough study of seven projects of relocation of the
households in Orissa (India), between 1950 and 1994, suggests that there was no compensation for
common properties by the project planners (Pandey et al. 1997).
4.1.8 Social Disarticulation
Last but not least, involuntary displacement deconstructs and destroys arrays of social
organization, interpersonal ties, and kinship bonds by dispersing and fragmenting communities. Loss
of compensation for social disarticulation goes unnoticed despite the fact that this loss has long and
detrimental effects on the dislocated people. Historians of migration conclude that the loss of social
articulation in relocation is much higher than the financial loss: “among the highest costs of all is the
serving of personal ties in familiar surroundings, to face new economic and social uncertainties in a
strange land” (Sowell 1996). A detailed sociological study of various Indian schemes shows several
appearances of social displacement within the kinship scheme, such as the undoing of intimate ties,
growing estrangement, and anomie (Cernea 1997).
Although it is one of the most impeccable and suitable models for the rehabilitation of the
involuntarily displaced people, however, this model fails to focus on or address women
impoverishment, who suffer more as compared to men. Moreover, this model does not highlight and
address children educational loss.

8 Mazhar Abbas, Samma Faiz Rasool, Imran Wakil, M. Aftab Madni Memon
5. LAND USE RIGHTS AND LAND ACQUISITION POLICY IN SHANGHAI—AN
HISTORICAL ANALYSIS
Both individuals and enterprises, similar to the tenants, have limited land use rights in China,
unlike the United States and other Western states. In China, urban land is state-owned, while
agricultural land is owned by the village communes. Thus, individual (private) property ownership
does not exist (China 2004).
In pre-reform China, for land acquisition, in the absence of land markets, municipal governments
were bound to compensate peasants for the loss of jobs, housing, and crops. Besides, the residency
status of farmers was transformed from peasantry to urban, which entitled them to enjoy social
welfare benefits under hukou system (Ding 2003, 110-111). On the other hand, leasing of land to the
private and foreign companies and corporations was not allowed. Transfer of land use rights was
strictly forbidden (China 2004).
What followed economic reforms was the replacement of the traditional allocation system of
land with the market mechanism. Subsequently, the private sector was allowed to play its role
through investment in the real estate market and urban development (Chen, Wigmans and Jonge
2006). Shanghai borrowed leasehold tenure system of land from Hong Kong (Chan 1999). The
rationale behind the introduction of land leasehold was to attract foreign investment to enhance
economic efficiency and to generate maximum revenue from the land.
However, reinforcing new system required Shanghai government to introduce new regulations
besides amending the existing laws about land management and land use rights. The examples of
these new regulations and amendments in the existing regulations were: Land Administration Law
(LAL) of 1986, Constitutional Amendment in Land Administration Law (LAL) in 1998, Republic of
China Assignment and Transfer Use Rights of State-Owned Land in Urban Areas Temporary
Regulation of 1990, Provisional Regulation on the Granting and Transferring of the Land Rights
over State-owned Land in Cities and Towns in 1991, Transfer of Land-use Rights in Shanghai, and
Draft Regulation on Pudong New Area Planning and Construction Administration and the
Regulation on Pudong New Area Land Administration of 1999.
As a result of these regulations, leasing of land up to 50 years in Shanghai (Ministry of
Commerce 1991) and up to seventy years in ‘Pudong New Area’ (Ministry of Commerce 1990) was
allowed through bidding, auction or negotiation process.
Moreover, it was essential to convert non-state-owned land, for example, the village commune
and farmland, into a state-owned one to commence the developmental work because development on
non-state-owned was prohibited (Ding 2007). The actual owner of the land was state. However,
people or organizations were entitled to enjoy land use rights until the withdrawal or cancellation of
those rights by the state—the real owner. This was called zhengdi (the compulsory acquisition of
land). The constitution of 1978 of the People’s Republic of China authorized the state for compulsory
acquisition of land—zhengdi. Land Administration Law (LAL), containing compensation for
compulsory land acquisition and resettlement of involuntarily displaced people, was passed in 1986
but was amended in 1998. Other relevant laws included ‘Real Estate Administration Act,’ and
‘Tentative Provisional Regulation on the Grant and Transfer of Land-use Rights on State-owned
*Corresponding author (Mazhar Abbas). E-mail: [email protected] ©2019 International Transaction Journal of Engineering, Management, & Applied Sciences & Technologies. Volume 10 No.11 ISSN 2228-9860 eISSN 1906-9642 CODEN: ITJEA8 Paper ID:10A12J http://TUENGR.COM/V10A/10A12J.pdf DOI: 10.14456/ITJEMAST.2019.160
9
Land in Cities and Towns’ (Chen 2007, 126). After the acquisition of land, the local government was
authorized to sell this state-owned land to the developers. These developers were given the right to
sublease, sell, mortgage, or rent the land to the third party. This third party was obligatory to pay land
transfer fee depending upon the leasing period and land use strength. In this two-step system, the
government expropriated land from the farmers at a low cost; however, sold the developers at much
higher prices. In this way, the local government generated a lot of revenue to meet the increasing need
for infrastructure, urban development, and other financial challenges (Ding 2004).
6. COMPENSATION AND RESETTLEMENT POLICY FRAMEWORK: RESULTS
AND DISCUSSION
Rapid urbanization could be gauged from the fact that the urban area of Shanghai increased
five-fold between 1990 and 2000 as compared to ten-fold between 1950 and 1990. Subsequently,
plenty of rural households were relocated for the development of ‘Pudong New Area’. It is
estimated that 178,663 farmers’ households were relocated between 1990 and 2002. Besides,
Shanghai demolished 26 million square meters in urban areas and relocated 0.66 million households
between 1991 and 2000. Thus, the development of ‘Pudong New Area’ required both
commercialization of urban land and the expropriation of rural land (Chen 2007).
As a result of ‘Pudong New Area’ project, increasing numbers of forcibly dislocated people
were a matter of serious concern and alarmed the concerned authorities (Sha et. al 2014); and already
existing social security policy institutions were restructured and strengthened to relocated and resettle
these involuntarily displaced people. For the relocation of the inhabitants, any of the Shanghai Land
Development Company (SLDC) was supposed to develop a project and prepare plans to acquire
time limit for land use rights, in addition to the expropriation of farmland and permission to lease
out state-owned land. After this, a relocation company used to step in as a sub-contractor for the
relocation project. Assessment of the value of the whole area to be redeveloped and estimated
payment for the entire relocation scheme, to the subsidiary company by the SLDC, was done by an
independent auditor. The subsidiary payment was assessed based on number of households and
business relocated and was to be paid by the real estate developer. At the time of expropriation of
farmland, it was the responsibility of the company to chalk out a comprehensive and appropriate
plan for compensation and fresh employment for the expected relocated households. A new
subsidiary company, for job training and providing fresh jobs, was hired by the real estate developer
(Chen 2007, 105-106).
Shanghai’s compensation and resettlement system for the involuntarily displaced people, as a
result of compulsory land acquisition, is unique because along with economic and financial
compensations, it also compensates for social disarticulations. According to Shanghai government’s
policy, people expected to be relocated as a result of compulsory land acquisition are consulted for
compensation and resettlement before their displacement. Forcibly displaced people are compensated
for the land loss, home loss, job loss, food insecurity, morbidity and mortality, marginalization, and
social disarticulation. Displaced people are not only compensated but also, through special
arrangements, rehabilitated and re-established to the equal or higher level before the displacement

10 Mazhar Abbas, Samma Faiz Rasool, Imran Wakil, M. Aftab Madni Memon
(Ding 2004).
Only a few residents of urban Pudong had their own houses. However, the majority was living
as a tenant in houses built by their employers. At the time of their relocation, notices or handout
leaflets were put up to explain the procedure of relocation and expected level of compensation,
followed by consultative meetings to deal with queries. It was up to the household whether to
choose a new house or cash as compensation. A negotiated amount of compensation was paid to the
relocated households in case of non-availability of houses until housing became available. The
compensation was increased in case of delay in housing availability within the prescribed period,
i.e. three to twelve months (Chen 2007, 134).
Since the land was considered their living capital, Chen, Wigmans, and Jonge (2006) argue that
land-for-land was the most preferred compensation for expropriation of farmland for urbanization in
‘Pudong New Area’. Only a few of the dislocated farmers were given farmland in nearly available
places. However, due to non-availability of farmland, the majority of the affected households was
compensated with cash and jobs for the loss of their land. Also, they were compensated for the loss of
young crops and other land attachments as prescribed in the LAL of 1986 and amended in 1998.
Yawei Chen (2007) holds that compensation for the expropriated farmland includes both social and
economic compensation for the relocated households. The LAL stipulated that compensation for
acquired land and subsidies for resettlement were given to village communes. However,
compensation for young crops and land attachments were given to the farmers. Two amendments
were made to LAL in 1998: Frist was about the increase in the compensation of land from 3-6 times to
6-10 times; Second, amount of resettlement was increased from 2-3 times to 4-6 times the average
annual output value of acquired land in the preceding 3 years (however, measures were taken that the
maximum payment per hectare should not cross 15 times the average production value) (Ding 2004).
The local government was directed and authorized to increase the resettlement subsidy if the
relocated households were not able to maintain their original quality of life with the given
resettlement subsidy (Chen 2007, 130-131). The purpose of this increase in resettlement subsidy
was to rehabilitate and re-establish the displaced people, through special arrangements, either to the
equal or higher level before the displacement (Ding 2004).
As mentioned above, forcibly dislocated farmers were compensated with farmland for the loss
of their farmland, if available. Alternatively, these farmers were provided with fresh jobs. They
were trained for jobs at the job training center until they find new jobs. Besides, they were paid a
handsome amount to compensate for the period between the loss of their land and new employment
(Chen 2007, 131-135). Explaining the relocation of farmers in an interview given in October 2002,
Gong Qiuxia, a planner with SLDC opined that the company had to deal with both expropriations of
land and relocation of the farmers. She further added that the company had to find new jobs for the
relocated farmers since they had lost land. To deal with this problem, a job center, to provide a
variety of training programs, was set up. The government gave a special fund to establish new
enterprises to reemploy the relocated peasants. Due to either little or no technical knowledge, these
relocated farmers were given jobs in security companies, cleaning, factories, traffic assistance,
property management, and maintenance of green spaces (Chen 2007, 134-135).
Relocation of the farmers of a single village, as a result of the expropriation of their farmland, to

*Corresponding author (Mazhar Abbas). E-mail: [email protected] ©2019 International Transaction Journal of Engineering, Management, & Applied Sciences & Technologies. Volume 10 No.11 ISSN 2228-9860 eISSN 1906-9642 CODEN: ITJEA8 Paper ID:10A12J http://TUENGR.COM/V10A/10A12J.pdf DOI: 10.14456/ITJEMAST.2019.160
11
another farmland was the preferred way of compensation. In case of lack or absence of farmland, they
were relocated in urban areas. These areas were specifically built for the resettlement of the relocated
farmers. Free of cost apartment(s) were given to the relocated households. And the size and number
of apartments depended upon both the size of the household and size of the previous farmhouse,
coupled with some other criterion (Xu, Li and Jiao 2016, 4). Although involuntary displacement of
those, whose houses were demolished, met with a severe criticism from various circles including
academia; however, independent observers, Li and Song (2009), claimed that newly rehabilitated
residents were living in houses with better conditions and facilities as compared to other residents of
Shanghai.
Under hukou system, urban residents were offered with several welfare services including health
insurance, job opportunities, education, old-age pensions, and the like. Contrary to this, the rural
residents were denied these social welfare services. However, same services were offered to the
relocated rural farmers after the change of their residency permit from peasantry to urbanites, as a
result of acquisition of their farmland (Chen 2007, 130-131). Change of their registration identity,
from rural peasantry to urban residents, also meant the availability of good food, improved
sewerage system along with new and cleaned apartments, and better educational opportunities for
their children. Resultantly, these forcibly dislocated people did not fall a prey either to food
insecurity or poor sewerage and dirty residences. Thus, undernourishment and morbidity and
mortality did not increase among them, unlike displaced households of other countries like
Thailand, India, and Kenya.
Special measures were taken to avoid social disarticulation among the displaced households. For
example, it was taken into account to relocate the displaced households to the nearby of their
previous residence and that too among the neighbors from the previous residence. Relocated people
were provided with a house of two rooms. These houses were constructed by keeping in mind that
both the rooms should face south so that guests could meet up in the grandparents’ bedrooms. The
previous or original neighborhood was in principal entitled to return in case of demolition and
rebuilding of the residential neighborhood (Chen 2007, 134-135).
There were different mechanisms to address involuntarily displaced people in Shanghai. For
loss of land either with land or job and cash along; for loss of crops and other land attachments with
cash; for loss of job with job to the energetic and young workers, and pensions and retirement to the
old and retired peasants; for loss of house with apartment depending upon the size of households
and size of previous housing; and for loss of rural peasantry registration with urban social security
registration. This kind of better compensation and rehabilitation policy did not pave the way for
marginalization among the dislocated farmers. Even in the majority of the cases, they were living a
better life as compared to their urban counterparts (Chen 2007, Li and Song 2009).
7. CONCLUSION
This paper was aimed at understanding how the Shanghai Government dealt with the post-1978
open-door economic policy reforms that resulted in outgrowth of urban territory and displacement of
people from their land for urbanization. These reforms also brought about several changes in land

12 Mazhar Abbas, Samma Faiz Rasool, Imran Wakil, M. Aftab Madni Memon
management system and land acquisition policy in mainland China in general and Shanghai in
particular.
This paper concludes that Shanghai Government borrowed some provisions from Hong Kong’s
land leasing system and incorporated them in the Constitution and laws governing the leasing system.
The purpose of these adoptions was to attract maximum investment from private as well as foreign
companies. Resultantly, private sector was allowed to participate in the process of urbanization.
These developments attracted not only global investment, which further accelerated the pace of
urbanization but also deprived several households of the farmland through land appropriation. Thus,
rehabilitation of the involuntarily displaced people became a matter of serious concern for the
authorities, which was addressed through the already existing system of social security institutions.
Yet another important conclusion is that Shanghai government successfully addressed the issues
of landlessness, joblessness, homelessness, food insecurity, increased morbidity and mortality,
community disarticulation, and education of children. However, the issues of loss of access to
common property resources and marginalization of women were either ignored or not given proper
attention; thus, remained unaddressed. Despite being under the rule of the one-party system, unlike
democratic and developed Western countries, China is the only country which addresses the issues of
community disarticulation and education of children during the resettlement of involuntarily
displaced people.
The development of ‘Pudong New Area’ would not have been possible in the absence of smooth
handling of land acquisition and rehabilitation of the dislocated households. Had there been
mismanagement of the land acquisition and relocation of the dislocated people, there would have
been resistance at the local level, and subsequent, delay in the development process of ‘Pudong New
Area.’
8. AVAILABILITY OF DATA AND MATERIAL Used or generated data already present in this study.
9. REFERENCES
Appell, George N. "Resettlement of People in Indonesian Borneo: The Social Anthropology of
Administered Peoples." Borneo Research Bulletin, Vol. 17, no. 1, 1985: 3-30.
Bureau, Shanghai Municipal Statistics. Shanghai Statistical Year Book (1991). Official Report, Beijing:
China Statistics Press, 1991.
Bureau, Shanghai Municipal Statistics. Shanghai Statistical Yearbook (2006). Official Report, Beijing:
China Statistics Press, 2006.
Cernea, Michael. "The Risks and Reconstruction Model for Resettling Displace Populations." World Development, Vol. 25, No. 10, 1997: 1569-1587.
Chambers, Robert, and Jon Morris. "Mwea: An Irrigated Rice Settlement in Kenya." München: Weltsforum Verlag, 1973.
Chan, Nelson. "Land-Use Rights in Mainland China: Problems and Recommendations for Improvement." Journal of Real Estate Literature, Vol. 7, no. 1, 1999: 53-64.

*Corresponding author (Mazhar Abbas). E-mail: [email protected] ©2019 International Transaction Journal of Engineering, Management, & Applied Sciences & Technologies. Volume 10 No.11 ISSN 2228-9860 eISSN 1906-9642 CODEN: ITJEA8 Paper ID:10A12J http://TUENGR.COM/V10A/10A12J.pdf DOI: 10.14456/ITJEMAST.2019.160
13
Chen, Yawei. Shanghai Pudong: Urban Development in an Era of Global-Local Interaction, Volume 14. Amsterdam: IOS Press, 2007.
Chen, Yawei, Gerard Wigmans, and Hans De Jonge. "Land Reform and Development in Shanghai's
Transformation." The CRIOCM 2006 International Symposium on “Advancement of
Construction Management and Real Estate”. Amsterdam: Department of Real Estate and Housing, Faculty of Architecture, Delft University of Technology, 2006. 1-10.
China, Tha National People's Congres of the People's Republic of. Constitution. March 14, 2004.
http://www.npc.gov.cn/zgrdw//englishnpc/Constitution/2007-11/15/content_1372963.htm
(accessed March 26, 2017).
Chiu, Rebecca L. H. "Shanghai’s Rapid Urbanization: How Sustainable?" Built Environment, Vol. 34, No.
4, 2008: 532-546.
Ding, Chengri. "Land Policy Reform in China: Assessment and Prospects." Land Use Policy, Vol 20, no.
2, 2003: 109-120.
Ding, Chengri. "Policy and Praxis of Land Acquisition in China." Land Use Policy, 2007: 1-13.
Ding, Chengri. "The Effects of Land Acquisition on China's Economic Future." Land Lines, 2004.
King, C. W. Kenneth. "China's Land Disposition System." Journal of Contemporary China, Vol. 5, no.
13, 1996: 325-345.
Li, Si-ming, and Yu-ling Song. "Redevelopment, Displacement, Housing Conditions, and Residential
Satisfaction: A Study of Shanghai." Environment and Planning, volume 41,, 2009: 1090 -1108.
Mburugu, Edward K. "Dislocation of Settled Communities in the Development Process: The Case of
Kiambere Hydroelectric Project." In Involuntary Resettlement in Africa, by C. C. Cook (ed.). Washington DC: World Bank, 1994.
Ministry of Commerce, People's Republic of China. Measures of Shanghai Municipality on the
Compensatory Transfer of Land Use Rights. November 29, 1991.
http://english.mofcom.gov.cn/article/lawsdata/chineselaw/200211/20021100050878.shtml (accessed March 26, 2017).
—. Provisions of Land Administration in Shanghai Pudong New Area. September 10, 1990.
http://english.mofcom.gov.cn/aarticle/lawsdata/chineselaw/200211/20021100050586.html
(accessed March 26, 2017).
Nelson, Michael. The Development of Tropical Lands: Policy Issues in Latin America. Baltimore: John
Hopkins University Press, 1973.
Ota, Akhil B. "Countering the Impoverishment Risk: The Case of the Rengali Dam Project." In
Involuntary Displacement in Dam Projects, by Akhil B. Ota and A. Agnihotri, 150-178. New Delhi: Prachi Prakashan, 1996.
Pandey et al., B. Development, Displacement and Rehabilitation in Orissa 1950-1990. Bhubanesewar: Institute for Socio-economic Development, 1997.
Pandey, B. "Impoverishing Effects of Coal Mining Projects: A Case Study of Five Villages in Orissa." In
Development Projects and Impoverishment Risks: Resettling Project-Affected People in India, by Hari Mohan Mathur and David Marsden. New Delhi: Oxford University Press, 2000.
Sang, Bin Xue. "Pudong: Another Special Economic Zone in China?-An Analysis of the Special
Regulations and Policy for Shanghai's Pudong New Area." Northwestern Journal of International Law & Business, Vol. 14, no. 1, 1993: 130-160.
Scudder, Thayer, and Elizabeth Colson. "From Welfare to Development a Conceptual Framework for the
Analysis of Dislocated People." In Involuntary Migration and Resettlement: The Problems and

14 Mazhar Abbas, Samma Faiz Rasool, Imran Wakil, M. Aftab Madni Memon
Responses of Dislocated People, by Art Hansen and Anthony Oliver-Smith, 267-287. Boulder:
Westview Press, 1982.
Sha et. al, Yongjie,. "Evolution of Urban Planning and City Development of Shanghai: The Past Three
Eras and the Present." In Shanghai Urbanism at the Medium Scale, by Yongjie, Sha et. al (eds.), 9-18. Berlin: Springer Berlin Heidelbers, 2014.
Søftestad, Lars T. "On Evacuation of People in the Kotmale Hydro Power Project: Experience from a Socio- economic Impact Study." Biståndsantropologen, no. 15, 1990: 22-32.
Sowell, Thomas. Migrations And Cultures: A World View. New York: Basic Books, 1996.
Thangaraj, S. "Impoverishment Risk Analysis: A Methodological Tool for Participatory Settlement
Planning." In Understanding Impoverishment: The Consequences of Development-induced Displacement, by Christopher McDowell (ed.), 193-232. Oxford: Berghahn Books, 1996.
Wolfensohn, James D. Address at the Annual Meeting of the World Bank and IMF. Official, Washington DC: World Bank, 1995.
Xu, Ying, Jing Li, and Sheng Jiao. "Impacts of Chinese Urbanization on Farmers’ Social Networks:
Evidence from the Urbanization Led by Farmland Requisition in Shanghai." Journal of Urban
Planning and Development, Vol. 142, No. 2, 2016: 1-8.
Yuan, Zhenhuan. "Land Use Rights in China." Cornell Real Estate Review, Vol. 3, no. 6, 2004: 73-78.
Zhai, Hailin. Shanghai Pudong: A Missed Opportunity for Metropolitan China. LAP Lambert Academic
Publishing, 2012.
Zhang et al., Hao,. "Land Use Dynamics of the Fast-Growing Shanghai Metropolis, China (1979-2008)
and its Implications for Land Use and Urban Planning Policy." Sensors, Vol. 11, no 2, 2011: 1794-1809.
Mazhar Abbas is a PhD Candidate in World History at the Center for Global Studies and researcher at the Center for History of Global Development, College of Liberal Arts, Shanghai University, Shanghai, P. R. China. He is working as a Lecturer at the Department of History and Pakistan Studies, Government College University Faisalabad, Pakistan.
Dr. Samma Faiz Rasool is a Post-doctoral fellow at School of Innovation and Entrepreneurship, Entrepreneurship Institute, Guangzhou University, Guangzhou, P.R.China. He has his Master’s degree in Human Resource Management from University of the Punjab, Lahore, Pakistan. He received his PhD degree from School of Management, Shanghai University, P.R.China. His researches are Human Resource Management and Innovation Management.
Imran Wakil is a lecturer and PhD Candidate at the Department of Political Science and International Relations, Government College University Faisalabad, Pakistan.
Muhammad Aftab Madni Memon is a PhD Candidate in Communication Science at School of Journalism and Communication, Shanghai University, Shanghai, P. R. China

*Corresponding author (A.E. Kravchenko). E-mail: [email protected] ©2019 International Transaction Journal of Engineering, Management, & Applied Sciences & Technologies. Volume 10 No.12 ISSN 2228-9860 eISSN 1906-9642 CODEN: ITJEA8 Paper ID:10A12K http://TUENGR.COM/V10A/10A12K.pdf DOI: 10.14456/ITJEMAST.2019.161
1
International Transaction Journal of Engineering, Management, & Applied Sciences & Technologies
http://TuEngr.com
PAPER ID: 10A12K
EFFICIENCY IMPROVEMENT ON FUNCTIONING AND
DEVELOPMENT OF PASSENGER MOTOR TRANSPORT
SERVICES IN URBAN AGGLOMERATIONS
A.E. Kravchenko a*, D.A. Gurа b
a Department of Transport Facilities, Krasnodar, Moskovskaya, Kuban State Technological University, RUSSIA. b Department of Cadastre and Geoengineering, Krasnodar, Moskovskaya, Kuban State Technological University,
RUSSIA.
A R T I C L E I N F O
A B S T R A C T Article history: Received 24 May 2019
Received in revised form 15
July 2019
Accepted 29 July 2019
Available online 06 August 2019
Keywords: Market of transportation
services; Passenger
Transportation Services;
Urban crowding;
Passenger trip; Time spent
on a trip, Route
Performance evaluation.
This article reflects the features of the provision of passenger road
transport services in urban areas. It also presents the distribution of
traffic between different types of passenger transport, taking into
account the level of motorization. The comparative indicators of the
time spent by the population on a trip are given by types of passenger
transports. The factors and signs of dividing the consumer market into
segments of passenger traffic are identified. Moreover, the optimal
time spent by the population on a trip for urban agglomerations is
recommended. This study proposes an indicator for evaluating the
effectiveness of the route.
© 2019 INT TRANS J ENG MANAG SCI TECH.
1. INTRODUCTION The general condition of the issue
Underdevelopment of the markets for passenger transportation services (PTS), especially
in urban agglomerations (including resort ones), leads to the territorial social injustice of
residents of peripheral and sleeping neighborhoods, which significantly affects the decline in
quality of their life and residence in the urban environment [1]. Cities and agglomerations
formed on their basis have recently become the most significant elements of the resettlement
system in Russia. They provide the emergence of new growth points, economic coherence of
the territories, and integrated development of transport and service infrastructure and serve to
achieve the main goal, i.e. creating comfortable conditions for life and leisure of Russians [2].
City agglomeration is a combination of municipalities (settlements and urban districts) within
whose territory a number of settlements are compactly located, mainly urban, united in a complex
dynamically developing system with intensive transport, industrial, infrastructural, social and economic
ties, with common use of adjacent territories and development resources [2, 3].
©2019 International Transaction Journal of Engineering, Management, & Applied Sciences & Technologies

2 A.E. Kravchenko , D.A. Gurа
There are two main types of agglomerations: mono-centric and polycentric. The largest number of
existing and emerging mergers belong to the first type. Polycentric agglomerations are rather the
exception, they unite several cities, each of which is an independent core and absorbs nearby
settlements. Mono-centric agglomerations are formed according to the principle of the dominance of one
main city. There is a core, which during growth includes other settlements in its territory and forms the
direction of their further development in symbiosis with its potential. The largest urban agglomerations
(the vast majority) are created precisely by monotype. An example is the Moscow agglomeration [3,4].
Agglomeration of the municipality of Krasnodar also belongs to the mono-centric type. The city of
Krasnodar is characterized by the presence of all the conditions for the agglomeration of territories
within its zone of influence. It is located on the most important highways connecting the center of Russia
with the ports of the Black and Azov Seas, as well as the resorts of the Black Sea coast of the North
Caucasus. The city has all types of transport: air, road, rail (four directions, three railway stations), water
(transportation of goods by river-sea vessels). The economic situation of Krasnodar is determined by the
concentration of human, investment, financial, intellectual and other resources. Krasnodar is a center of
science and higher education: more than 80% of scientific workers in the region and about 90% of all
students are concentrated in the city [5].
In the Krasnodar city agglomeration, in addition to the city of Krasnodar, they include partly
Dinskoy, Krasnoarmeysky, and Seversky districts.
The area of agglomeration is 2200 km2. On the territory of the agglomeration, there are 60
settlements in which more than 1.1 million people live (according to the latest population census), and
taking into account the estimated data of the Krasnodar administration - more than 1.4 million people.
The effective economic development of the Krasnodar agglomeration is impossible without
creating favorable conditions for high-quality functioning of the markets for passenger road transport
services (PRTS) in terms of a balance of benefits for all stakeholders (Customer - Carrier - Consumer)
[6-9].
2. CHARACTERISTICS OF PASSENGER VEHICLES
Modern principles of management, associated with complete economic independence of
economic organizations, self-government, self-financing, and self-development, have
predetermined a marketing approach to the strategic management of business processes,
designed to ensure effective management in a dynamically changing market environment. No
exception is the scope of passenger vehicles. Passenger road transport is an integral part of the
passenger transport system of regions and cities, is a major factor in the effective development
of the economy, whose role is enhanced in the conditions of market relations. With the direct
participation of passenger transport, markets for motor transport services are being formed.
In a market economy, the main task of transport becomes urgent - the acceleration of the turnover of
material values on the terms of the complete satisfaction of transportation needs of the population, as it
directly affects the economic interests of not only carriers but also consumers. According to the existing
concepts, services include all types of labor that are not directly related to the change and transformation
of forms of matter and natural phenomena and produce a special use value, which is expressed in the

*Corresponding author (A.E. Kravchenko). E-mail: [email protected] ©2019 International Transaction Journal of Engineering, Management, & Applied Sciences & Technologies. Volume 10 No.12 ISSN 2228-9860 eISSN 1906-9642 CODEN: ITJEA8 Paper ID:10A12K http://TUENGR.COM/V10A/10A12K.pdf DOI: 10.14456/ITJEMAST.2019.161
3
socially useful activity of labor itself in various sectors of the public economy. Services also include
those types of labor that do not materialize in a substantively tangible, isolated product of labor
(transport, communication).
Features of the provision of transport services are as follows [9]:
- Services cannot exist outside the process of their provision (i.e. they cannot be accumulated);
- Sale of services is, in fact, the sale of the labor process itself, therefore the quality of services is
determined by the quality of the labor process itself;
- Services represent a specific use-value only at a certain time and in a specific place or direction,
which significantly limits the possibility of their replacement in the market of services;
- Transport services are those which complete and (or) anticipate the process of material production.
Passenger transport services are a sub-activity of public transport, aimed at meeting the needs of
people and characterized by the availability of the necessary technological, economic, informational,
legal and resource support. Consequently, the transport service means not only the transportation of
passengers but any operation that is not part of the transportation process but is associated with its
preparation and implementation. Based on the analysis of domestic and foreign experience, transport
services are classified:
- On the basis of relationship with the main activity of transport enterprises - for transportation (that
is, including in one form or another element of transportation) and not transportation;
- By the type of consumer for whom the service is provided, - to external (provision to non-transport
enterprises and organizations) and internal, i.e. provided to other enterprises and organizations of
transport or other industries. For example, internal services are the provision of rolling stock by a
transport company to carry out transportation on a regular and customized basis;
- By nature of the activity - technological, commercial, informational, legal, etc.
Other services include:
- Activities on planning, organizing and executing the delivery of passengers from places of
residence to destinations and additional services for preparing for and after transportation;
- Registration of the necessary shipping documents;
- Conclusion of a contract for transportation with transport enterprises;
- The calculation for the carriage of passengers;
- Information Support;
- Insurance, financial and customs services using the best methods and methods, subject to the full
satisfaction of the requirements of passengers and others.
4 A.E. Kravchenko , D.A. Gurа
3. MOTOR TRANSPORT SERVICES FOR PASSENGERS IN URBAN
AGGLOMERATIONS
Motor transport services are defined as activities related to the process of moving
passengers in space and time, the provision of transportation, storage, and transportation of
baggage, as well as other additional services. Passenger transport services are carried out on
various types of passenger transport services markets in urban agglomerations, which are
characterized by different transportation potential, uneven development of transport
infrastructure, as well as consumer demand.
At the suggestion of the authors, the PTS markets in urban agglomerations are proposed to be
classified and characterized as [10, 11]:
1. A saturated market is a PTS market with a developed service and transport infrastructure, in
which the probability of obtaining planned profit from passenger transportation is 0.90-0.99, which is
caused by stable passenger traffic, greater transport mobility of the population, availability of transport
services, regularity of traffic , greater density of the route network in the city districts, tariff setting, the
possibility of choosing a ground type of passenger transport to move to the target, a higher level
development of transport service, high population density, direct travel, more developed system of
situational control centers for transportation processes, and higher motivational interest of business
entities to the development of transport business due to the small payback period.
2. The developing (emerging) market is PTS, in which the probability of obtaining planned profit
from passenger transportation is 0.61 ... 0.89, which is caused by less stable passenger traffic, lower
density of the route network of villages, insufficient development of transport service, the need to make
transplants on the periphery of the city, lower (in relation to urban) frequency of movement of rolling
stock, lower density of population in relation to the saturated market PTS, higher transport fatigue due to
the greater length of the route and time of correspondence to the object of the target.
3. The PTS market with limited growth potential is a market in which the probability of obtaining
planned profit from passenger transportation is 0.31 ... 0.60, which is determined by the seasonal factor
in the transport activity of the population, the limited development potential of the residential area, and
as a result the route network , lower (in comparison with the developing market) frequency of rolling
stock movement, low population density in relation to the developing market PTS, higher transport
fatigue due to higher the length of the route and the time of correspondence to the target object, the low
level of development of the transport service, the underdeveloped transport infrastructure, the lesser
interest of business entities to the development of the transport business due to high unit production costs
and longer payback periods.
The volume of motor transport services provided in various types of markets PTS depends to a large
extent on the level of automobilization of urban agglomerations (with a different number of inhabitants),
as well as the demand for street passenger public transport (SPPT), as well as express and individual
transport. Table 1 shows their optimal values, which are recommended to be used in real agglomeration
conditions (the authors' research data and Recommendations for the modernization of the urban
transport system were used, according to MDS 30-2.2008, Central Research Institute of Urban Planning,
RAACS, Moscow). The selected type of SPPT (Science, Pollution Prevention and Technology)

*Corresponding author (A.E. Kravchenko). E-mail: [email protected] ©2019 International Transaction Journal of Engineering, Management, & Applied Sciences & Technologies. Volume 10 No.12 ISSN 2228-9860 eISSN 1906-9642 CODEN: ITJEA8 Paper ID:10A12K http://TUENGR.COM/V10A/10A12K.pdf DOI: 10.14456/ITJEMAST.2019.161
5
directly affects the speed of the message and the time spent by passengers on movement to the target
object in the urban agglomeration.
Table 2 reflects their actual and recommended values for the future, which are set on the basis of the
conducted research in comparison with the standards reflected in the “Recommendations for the
modernization of the urban transport system” MDS 30-2.2008, Central Research Institute of Urban
Planning of the Russian Academy of Architecture and Construction Sciences, Moscow.
Table 1: Estimated distribution of passenger traffic between various types of passenger transport (in%,
taking into account the level of motorization of the settlement) Population with
population,
thous.
Level of motorization, auth. / Thousand people
100 150 300 450 200 300 500 200 400 600 900
Street
SPPT
High-speed
SPPT
Individual
transport
up to 50 40 50 5 60 - - - 45 55 65 70
51-100 70 60 50 30 - - - 40 50 70 80
101-300 60 65 45 40 - - - 35 55 60 70
301-500 75 70 60 50 - - - 30 40 50 60
501-1000 70 60 50 40 10 15 20 30 35 40 45
1001-1500 70 60 50 40 15 20 25 25 30 35 40
1501-3000 60 65 55 40 15 20 30 20 25 30 35
Over 3000 65 50 40 35 30 35 40 20 20 25 30
Table 2: Comparative indicators of the time spent by passengers to move to the target with the
use of public passenger transport (weighted average)
Types of public passenger transport to move in the urban agglomeration Message speed
km/h
Travel time
1 km, min.
1. Bus 18.2/20.0 3.34/3.31
2. Trolley bus 17.5/19.1 3.43/3.12
3. Tram 16.9/18.2 3.57/3.29
4. Bus and trolleybus on partially insulated lanes 19.5/20.1 3.08/2.98
5. Bus-espresso 23.5/26.0 2.55/2.98
6. Trolleybus and tram accelerated 22.0/24.5 2.72/2.41
7. Bus and trolleybus on a separate lane 25.0/27.0 2.40/2.21
8. High-speed tram on partially insulated canvas 25.5/27.5 2.35/2.17
9. High-speed bus and trolleybus on an isolated automatic control strip. 28.0/30.1 2.14/1.98
10. High-speed tram on an insulated canvas 31.0/34.0 1.93/1.74
11. Underground 41.6/- 1.44/-
12. Electrified railway 45.0/- 1.33/-
Note: in the numerator - the existing values; denominator - recommended values for the future.
To study the transportation needs of the population, they conduct marketing research of
passenger transport services markets on various grounds: purpose of travel, transport to move,
range of travel, frequency of trips, type of activity, age, gender, average income of consumers,
consumer attitudes to quality and other parameters of transportation service and related
services kits. All these signs can be used to segment the markets for transport services.
A market segment is a part of a market that is allocated in some way and has a certain one or more
similar characteristics. Signs - a way to select a segment. As one of the methods for identifying a
segment, they use the methods of questioning passengers, processing statistical data on types of
transport, cities, and subjects. Consumer segmentation makes it possible to determine the structure,

6 A.E. Kravchenko , D.A. Gurа
capacity, sustainability, solvency of consumers, etc. Segmentation of transport service providers allows
them to determine their resource capabilities in the required volumes, price of services, and how they
will affect the development of passenger traffic and competitiveness in the transport market.
As a result, according to the results of passenger traffic survey, various types of SPPT messages
reveal their structure, solvency of the population, as well as key components of a trip to working and
non-working days: convenience of the timetable, time and distance of the trip, convenience of the route,
fare comfort and technical equipment of rolling stock (air-conditioners, Internet) and potential solvency
of discerning passengers, etc. Practical methods of market partitioning transfer service have varied. Most
often they are divided into geographical, demographic and behavioral factors.
4. ORGANIZATIONAL ASPECTS IN ENSURING THE STANDARD TIME OF TRANSPORT SERVICES FOR THE POPULATION USING TRANSPORT INTERCHANGE HUBS
The interaction of various types of passenger transport is manifested primarily in the network and
integrated transport interchange hubs (TPU), which are involved in shaping the structure of route
communications of the SPPT and are a reasonable factor for a particular urban situation (network
density, roadway width, etc.). The transport-planning and spatial organization of the TPU is determined
not only by the number of interacting types of passenger transport, but also by the location of stations,
stopping points, lines, tracks and other transport facilities, various devices and communication elements,
as well as the location of the node on the urban agglomeration plan and its architectural -planned
communication with adjacent buildings. The simplest TPU arise from the interaction of various types of
street urban transport (approaching or crossing bus, trolleybus, and tram routes in different
combinations). Complex TPU arise in the interaction of rail transport.
A complex indicator, reflecting the degree of compactness of the territory, the level of development
of the road and transport network, is the time spent by the population to move from their place of
residence to the place of destination. According to the research, the average time of population to move,
on the example of the Krasnodar urban agglomeration, for the purpose of the trip “home-work” at peak
hours is 60 minutes, which is at least 20 minutes, which exceeds the regulatory requirements reflected in
the joint venture 42.13330.2016 – «Urban planning. Planning and development of urban and rural
settlements».
The document states that only for workers who daily come to work in the city from other
settlements, the time spent is allowed to increase no more than twice. MDS 30-2.2008
“Recommendations for the modernization of the transport system of cities” set even more stringent
requirements for the allowable time spent on moving to the place of destination (Table 3). Compliance
with the recommended time spent on the movement of the population (Table 3) suggests that the regular
route SPPT network is customer-oriented and highly productive, although, in this case, with increased
costs for high-quality transport services to the population, which are offset by a systematic increase in
consumer demand.
Table 3: Recommended time costs for the population to move City, agglomeration,
thousand people
The time spent on movement to
the place of work for 90% of
workers, min
Time spent on car availability of
the center, min
100 30 15
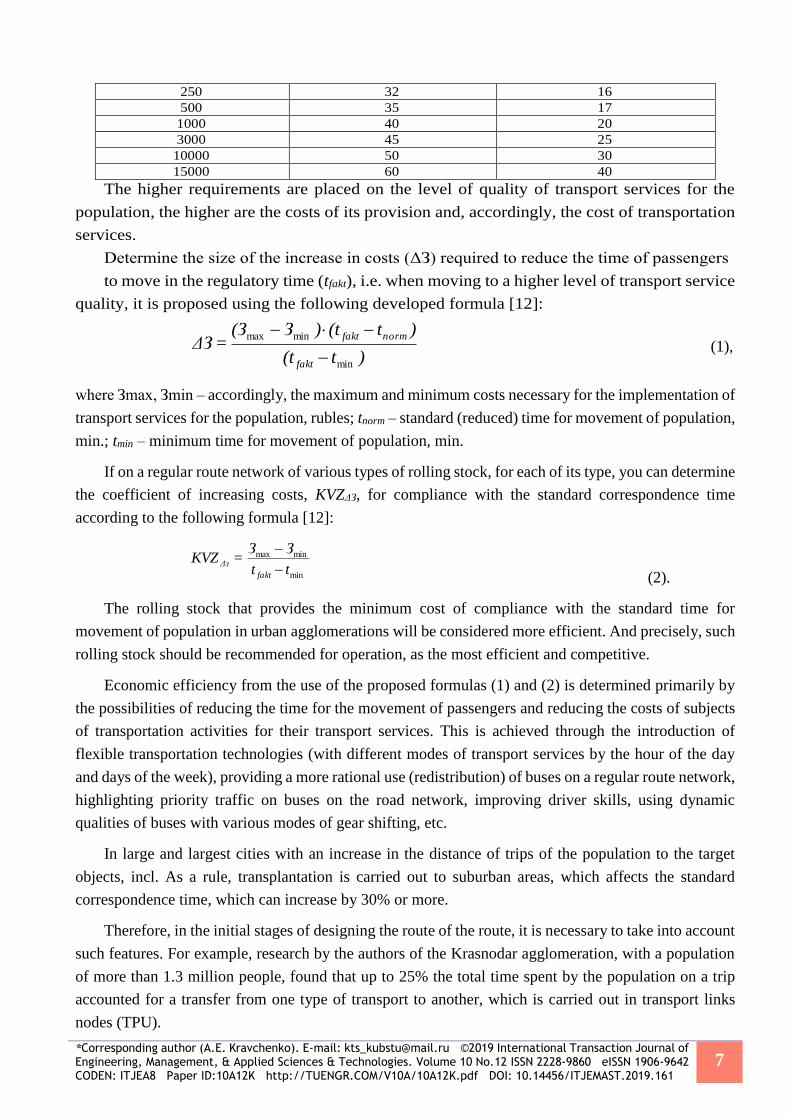
*Corresponding author (A.E. Kravchenko). E-mail: [email protected] ©2019 International Transaction Journal of Engineering, Management, & Applied Sciences & Technologies. Volume 10 No.12 ISSN 2228-9860 eISSN 1906-9642 CODEN: ITJEA8 Paper ID:10A12K http://TUENGR.COM/V10A/10A12K.pdf DOI: 10.14456/ITJEMAST.2019.161
7
250 32 16
500 35 17
1000 40 20
3000 45 25
10000 50 30
15000 60 40
The higher requirements are placed on the level of quality of transport services for the
population, the higher are the costs of its provision and, accordingly, the cost of transportation
services.
Determine the size of the increase in costs (ΔЗ) required to reduce the time of passengers
to move in the regulatory time (tfakt), i.e. when moving to a higher level of transport service
quality, it is proposed using the following developed formula [12]:
)t(t
)t(t)З(З=ΔЗ
fakt
normfakt
min
minmax
(1),
where Зmax, Зmin – accordingly, the maximum and minimum costs necessary for the implementation of
transport services for the population, rubles; tnorm – standard (reduced) time for movement of population,
min.; tmin – minimum time for movement of population, min.
If on a regular route network of various types of rolling stock, for each of its type, you can determine
the coefficient of increasing costs, KVZΔЗ, for compliance with the standard correspondence time
according to the following formula [12]:
min
minmax
tt
ЗЗ=KVZ
fakt
Δз
(2).
The rolling stock that provides the minimum cost of compliance with the standard time for
movement of population in urban agglomerations will be considered more efficient. And precisely, such
rolling stock should be recommended for operation, as the most efficient and competitive.
Economic efficiency from the use of the proposed formulas (1) and (2) is determined primarily by
the possibilities of reducing the time for the movement of passengers and reducing the costs of subjects
of transportation activities for their transport services. This is achieved through the introduction of
flexible transportation technologies (with different modes of transport services by the hour of the day
and days of the week), providing a more rational use (redistribution) of buses on a regular route network,
highlighting priority traffic on buses on the road network, improving driver skills, using dynamic
qualities of buses with various modes of gear shifting, etc.
In large and largest cities with an increase in the distance of trips of the population to the target
objects, incl. As a rule, transplantation is carried out to suburban areas, which affects the standard
correspondence time, which can increase by 30% or more.
Therefore, in the initial stages of designing the route of the route, it is necessary to take into account
such features. For example, research by the authors of the Krasnodar agglomeration, with a population
of more than 1.3 million people, found that up to 25% the total time spent by the population on a trip
accounted for a transfer from one type of transport to another, which is carried out in transport links
nodes (TPU).

8 A.E. Kravchenko , D.A. Gurа
Network TPUs play an important role in the design of efficient routes, especially for regular public
bus transport, and are also important infrastructure elements of the urban metropolitan transport system
that determine its sustainable operation and development.
To assess the effectiveness of the designed route for regular public buses, it is proposed to use the
following developed formula [13-18]:
00,19 RМVВESPUNэ ККККKKKKКК
(3),
where кN – coefficient of efficiency of use of stopping points on the route. Defined as the ratio of
actually used stopping points in the forward and reverse directions of the route (Nf) to the total (planned)
number of stopping points on the route in the forward and reverse direction (Nо). The actually used
stopping points in the forward and reverse the direction of the route is the number of stops with the actual
passenger transfer (that is, without taking into account the zero-passenger exchange), where both the
embarkation and the disembarkation of passengers take place.
KU represents the efficiency ratio of the development of passenger traffic by the stated number of
buses. It is defined as the ratio of the actual (based on survey materials) Uf to the planned Upl number of
passengers transported per shift (or the work time on the route of the bus (s)). If the capacity of buses on
the route is used by passengers less than 25% per shift, then this route is closed and combined.
KP is the ratio of the efficiency of transport work on the flight time, which is recommended to
determine from
т
к=
f
p
f
cpi
BA
н
p
r
cpсм
n
AiP tlf
QtlηB=K1 , where к – the number of flights made by all
buses of the i-th type on the route, per shift; n, f – respectively nominal and actual values of
indicators; QBAi – number of passengers carried by all buses of type i per flight; tHр, tf
р –
respectively, the standard (Table 3) and the actual (according to the results of the survey) the
bus journey time on the route, min.; 𝑙𝑐𝑝𝑓
, 𝑙𝑐𝑝𝑟 , respectively, the actual and estimated average
distance of the journey of passengers on the route, km.; ВАi – average nominal capacity of
buses passing the route, Ai
n
=i
iiAi NmA=B 1 (Аi – the number of buses of the i-th type on the route,
units; mi – nominal capacity of buses of i-th type, pass.; NAi – total number of buses on the
route, units.); ηсм – the turnover rate of passengers on a route per flight (determined by the ratio
of the length of the route to the average distance of the journey of passengers or the number of
passengers carried per flight to the nominal capacity of the bus).
KS – coefficient of efficiency of use of the structure of the bus fleet by capacity. Defined as
the ratio of the actual Sf to theoretical St (or regulatory, defined with reference to a group of
cities) capacity of working buses on the route network. When using different types of rolling
stock on the route network of the city (especially small, small, medium, large and very large
capacity), the coefficient of efficiency of use of the bus fleet structure is defined as
n
=i
n
i
n
i
n
=i
f
i
f
iS mNmN=K11 , where Ni – the number of units of rolling stock of the i-th brand
and type (f - actual; n - normative); mi is the nominal capacity of buses of i-th brand and type.
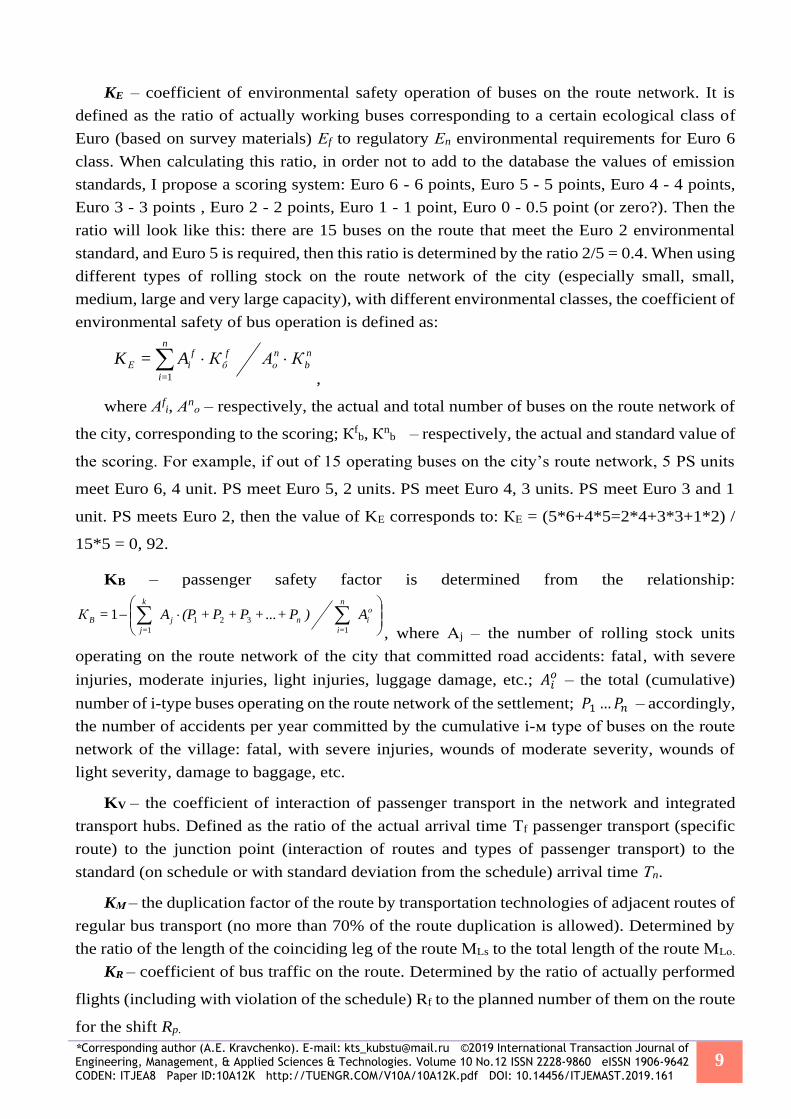
*Corresponding author (A.E. Kravchenko). E-mail: [email protected] ©2019 International Transaction Journal of Engineering, Management, & Applied Sciences & Technologies. Volume 10 No.12 ISSN 2228-9860 eISSN 1906-9642 CODEN: ITJEA8 Paper ID:10A12K http://TUENGR.COM/V10A/10A12K.pdf DOI: 10.14456/ITJEMAST.2019.161
9
KE – coefficient of environmental safety operation of buses on the route network. It is
defined as the ratio of actually working buses corresponding to a certain ecological class of
Euro (based on survey materials) Еf to regulatory Еn environmental requirements for Euro 6
class. When calculating this ratio, in order not to add to the database the values of emission
standards, I propose a scoring system: Euro 6 - 6 points, Euro 5 - 5 points, Euro 4 - 4 points,
Euro 3 - 3 points , Euro 2 - 2 points, Euro 1 - 1 point, Euro 0 - 0.5 point (or zero?). Then the
ratio will look like this: there are 15 buses on the route that meet the Euro 2 environmental
standard, and Euro 5 is required, then this ratio is determined by the ratio 2/5 = 0.4. When using
different types of rolling stock on the route network of the city (especially small, small,
medium, large and very large capacity), with different environmental classes, the coefficient of
environmental safety of bus operation is defined as:
n
b
n
о
n
=i
f
б
f
iЕ КАКA=K 1 ,
where Аfi, А
nо – respectively, the actual and total number of buses on the route network of
the city, corresponding to the scoring; Кfb, К
nb – respectively, the actual and standard value of
the scoring. For example, if out of 15 operating buses on the city’s route network, 5 PS units
meet Euro 6, 4 unit. PS meet Euro 5, 2 units. PS meet Euro 4, 3 units. PS meet Euro 3 and 1
unit. PS meets Euro 2, then the value of KE corresponds to: КЕ = (5*6+4*5=2*4+3*3+1*2) /
15*5 = 0, 92.
KB – passenger safety factor is determined from the relationship:
о
i
n
=i
nj
k
j=
B A)P++P+P+(PA=К1
321
1
...1
, where Аj – the number of rolling stock units
operating on the route network of the city that committed road accidents: fatal, with severe
injuries, moderate injuries, light injuries, luggage damage, etc.; 𝐴𝑖𝑜 – the total (cumulative)
number of i-type buses operating on the route network of the settlement; 𝑃1…𝑃𝑛 – accordingly,
the number of accidents per year committed by the cumulative i-м type of buses on the route
network of the village: fatal, with severe injuries, wounds of moderate severity, wounds of
light severity, damage to baggage, etc.
KV – the coefficient of interaction of passenger transport in the network and integrated
transport hubs. Defined as the ratio of the actual arrival time Тf passenger transport (specific
route) to the junction point (interaction of routes and types of passenger transport) to the
standard (on schedule or with standard deviation from the schedule) arrival time Тn.
KМ – the duplication factor of the route by transportation technologies of adjacent routes of
regular bus transport (no more than 70% of the route duplication is allowed). Determined by
the ratio of the length of the coinciding leg of the route МLs to the total length of the route МLо.
KR – coefficient of bus traffic on the route. Determined by the ratio of actually performed
flights (including with violation of the schedule) Rf to the planned number of them on the route
for the shift Rp.
10 A.E. Kravchenko , D.A. Gurа
The developed route efficiency indicator of the route allows a comprehensive approach to
the formation of a regular route network in urban agglomerations, and to determine ways of its
effective functioning and development with the stated level of quality of transport services to
the population.
5. CONCLUSION
In urban agglomerations, quality of life of the local population and the comfortable stay of
vacationers and tourists are closely related to the scope of public passenger transport services
in general and automobile transport in particular, around which a certain infrastructure is
created, marketing communications, financial and credit relations, and a certain format is
formed transport technology services to consumers. The needs of the population in passenger
transport services are related both to the production activities of the local population (trips to
the place of work, business trips, etc.) and cultural and everyday necessities (tourist and
sightseeing trips, trips to sanatoriums and boarding houses, rest houses, to the beach, etc.).
Passenger motor transport is at the same time the most important component of the territorial
structure of the economy and an integral part in the organization of cultural and economic
relations, ensures the process of population movement for production and personal needs,
unites distant cities and large metropolitan areas into a single complex, contributing to their
sustainable social-economic development.
The efficiency of passenger transport also determines the level of quality and culture of transport
services in accordance with modern requirements of consumer demand to their level of quality, taking
into account the territorial and planning features of the development of urban agglomerations, taking
into account the resource potential of transport operators. In market conditions of management, it is
important to take into account the ratio of the cost of transporting passengers and ensuring the stated
level of quality of transport services to the population. And with the annual growth of passenger cars in
cities (agglomerations), which have a significant impact on the above ratio, more attention should be
paid to improving the organization of transport services for the population, traffic, with special lanes for
route vehicles to ensure the standard time of the population to travel to the target objects as well as the
development of alternative types of passenger transportation.
6. CONCLUSION
A new classification of passenger transportation services markets in urban agglomerations is
proposed: a saturated market, an emerging market, a market with limited growth potential. This
classification of markets PTS takes into account the territorial segment and the dynamics of consumer
demand, which have a significant impact on the efficiency of socio-economic development of urban
agglomeration in general and determine the need to optimize the regular route network for public
passenger transport in particular.
It was revealed that the volume of motor transport services provided in various types of markets for
PATS depends to a large extent on the level of automobilization of urban agglomerations (with a
different number of inhabitants), as well as the demand for street passenger public transport (PTOP), as
well as high-speed and individual transport.

*Corresponding author (A.E. Kravchenko). E-mail: [email protected] ©2019 International Transaction Journal of Engineering, Management, & Applied Sciences & Technologies. Volume 10 No.12 ISSN 2228-9860 eISSN 1906-9642 CODEN: ITJEA8 Paper ID:10A12K http://TUENGR.COM/V10A/10A12K.pdf DOI: 10.14456/ITJEMAST.2019.161
11
A formula has been developed that makes it possible to determine the size of the increase in costs
required to reduce the time for passengers to move within the regulatory time frame, i.e. in the transition
to a higher level of transport service quality. If different types of rolling stock are operating on a regular
route network, then for each of its types it is possible to determine the coefficient of increase in costs for
compliance with the standard correspondence time. The rolling stock that provides the minimum cost of
compliance with the standard time for movement of population in urban agglomerations will be
considered more efficient. And precisely, such rolling stock should be recommended for operation, as
the most efficient and competitive.
An indicator has been developed to assess the effectiveness of the route, which allows a
comprehensive approach to the formation of a regular route network for public passenger vehicles in
urban agglomerations, and to determine ways of its effective functioning and development with the
stated level of quality of public transport services.
7. ACKNOWLEDGMENT
The reported study was funded by the Russian Foundation for Basic Research and Administration of
Krasnodar Region of the Russian Federation according to the research project № 19-48-233020
8. REFERENCES
[1] Kravchenko, A. E., Kravchenko, E. A., Osennyaya, A. V. (2018). Geographic information systems in
logistics processes in passenger transport: theory and practice: monograph - Krasnodar: Izd. KubGTU,
228 p.
[2] Kravchenko, E. A., & Kravchenko, A. E. (2011). Quality management of passenger transport service:
theory, methodology, technology: monograph - Krasnodar: Ed. KubGTU, 320 p.
[3] Kravchenko, E. A. (2015). Passenger motor transportation complex of resort areas of the Krasnodar
Territory: methodology of organization, technology, evaluation, management: monograph. - Krasnodar:
Ed. KubGTU, 2015.- 376 p.
[4] Kravchenko, E. A. (2011). Theory of passenger transport systems in road transport in resort areas: a
monograph. - Krasnodar: Izd. KubGTU, 400 p.
[5] Kravchenko, E. A. (2010). Formation of the system of transportation processes by passenger road
transport in resort areas: a monograph. - Krasnodar: Ed. Publishing House - SOUTH, 468 p.
[6] Kravchenko, E. A. (2010). The main directions of sustainable development and functioning of passenger
road transport. Freight and passenger vehicle fleet, 10, 85-90.
[7] Kravchenko, E. A., & Kravchenko, A. E. (2011). Modern problems of transport science, technology, and
technology: studies. allowance - Krasnodar: Ed. House - South, 154 p.
[8] Kravchenko, E. A., & Kravchenko, A. E. (2008). Fundamentals of quality management of transport
services to the public. Part 1. Estimated indicators of the quality of public service passenger transport:
textbook. allowance stamped UMO. Krasnodar: Ed. KubGTU, 103 p.
[9] Kravchenko, E. A., & Kravchenko, A. E. (2008). The main directions for improving the quality of public
services. Problems and achievements of the motor transport complex: materials of scientific and
technical. conf. - Yekaterinburg: USTU-UPI, 133-136.

12 A.E. Kravchenko , D.A. Gurа
[10] Kravchenko, E. A. & Schepakin, M. B. Dernovoy, A. Yu. (2018). Functional optimization of bus
transport route network in the city of Krasnodar. Management in Russia and abroad, 6, 48-56.
[11] Kravchenko, E. A. & Schepakin, M. B. Dernovoy, A. Yu. (2018). Integrated approach to the
management of passenger transport services markets in the Krasnodar agglomeration. Management in
Russia and Abroad, 5, 42-50.
[12] Kravchenko, E. A. & Schepakin, M. B. Dernovoy, A. Yu. (2018). Building a logistic model of the
attractiveness of urban transport routes for establishing the passenger demand for services. Vestnik
ASTU. Series: Economy, 4, 113-123.
[13] Kravchenko, E. A., & Shchepakin, M. B. (2016). Formation and development of passenger
transport business infrastructure in resort municipalities. Economy and Entrepreneurship, 10-1 (75-1),
741-747.
[14] Kravchenko, E. A., & Kravchenko, A. E. (2015). The concept of improving the logistics efficiency
of passenger transport in municipalities. 97-104.
[15] Kravchenko, E. A., & Kravchenko, A. E. (2015). The competitiveness of modes of transport in the
resort area based on the logistic theory of the quality of public transport services by bus. International
Journal of Experimental Education, 6, 28-34.
[16] Kravchenko, E. A., & Kravchenko, A. E. (2014). Modernization of the strategy of development of
the system of organization of passenger transportation in municipalities and their management in terms
of seasonality (on the example of the Krasnodar Territory) / Problems of quality and operation of
vehicles: materials VIII int. in absentia scientific and technical conf. - Penza: PGUAS, 2014. P. 57-64
[17] Kravchenko A.E. Gura, D. A. & Dernovoy, A. Yu. (2018). Dernovoy Agglomerations based on
integrated approach. Amazonia investiga, 7(13), 331-350.
[18] Kravchenko, A. E. & Gura, D.A. (2018). Motor transport development agglomerations: theoretical
and methodological aspects. Orbis, 14(41), 35-45.
Dr.Kravchenko Alexey is an Associate Professor at the Department of Transport Constructions, Kuban State Technological University, Krasnodar, Russian Federation. His research is related to the management of the functioning and development of passenger vehicles in the cities of municipalities.
Dr.Gura Dmitry is an Associate Professor at the Cadastre and Geoengineering Department, Kuban State Technological University, Krasnodar City, Russian Federation. His research is related to the fields of spatial data and geographic information technologies in the cadastre and territory management.
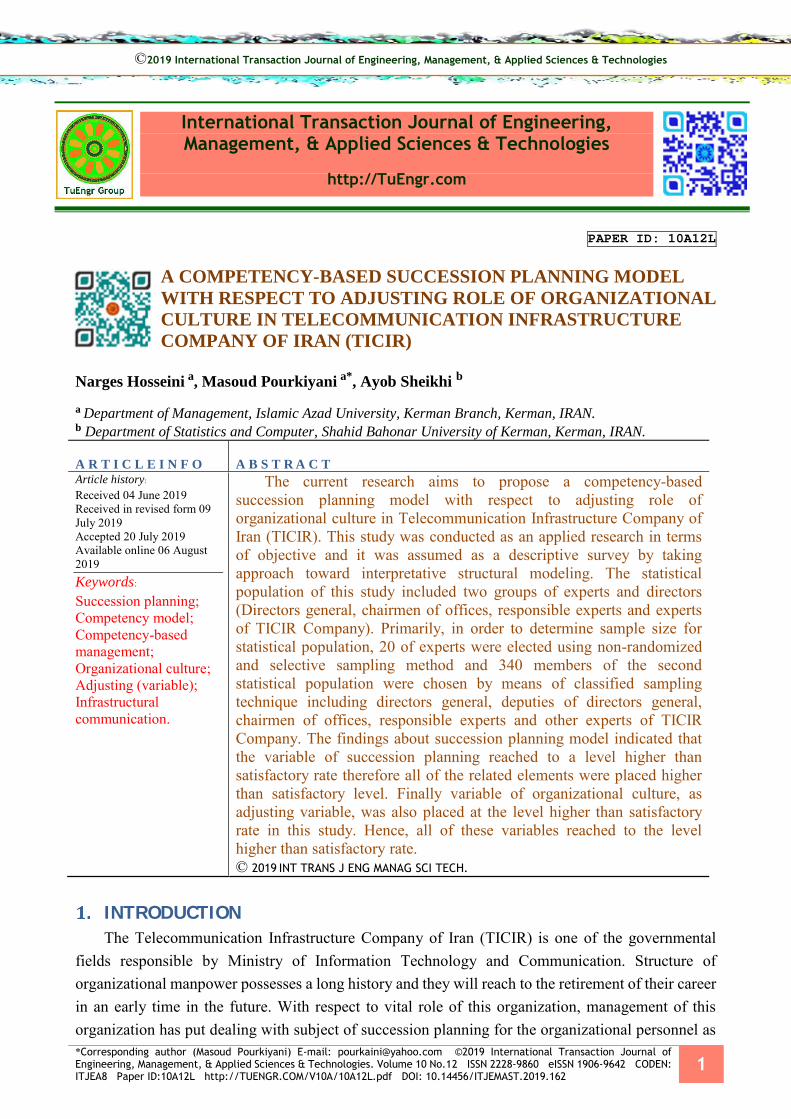
*Corresponding author (Masoud Pourkiyani) E-mail: [email protected] ©2019 International Transaction Journal of Engineering, Management, & Applied Sciences & Technologies. Volume 10 No.12 ISSN 2228-9860 eISSN 1906-9642 CODEN: ITJEA8 Paper ID:10A12L http://TUENGR.COM/V10A/10A12L.pdf DOI: 10.14456/ITJEMAST.2019.162
1
International Transaction Journal of Engineering, Management, & Applied Sciences & Technologies
http://TuEngr.com
PAPER ID: 10A12L
A COMPETENCY-BASED SUCCESSION PLANNING MODEL
WITH RESPECT TO ADJUSTING ROLE OF ORGANIZATIONAL
CULTURE IN TELECOMMUNICATION INFRASTRUCTURE
COMPANY OF IRAN (TICIR)
Narges Hosseini a, Masoud Pourkiyani a*, Ayob Sheikhi b a Department of Management, Islamic Azad University, Kerman Branch, Kerman, IRAN. b Department of Statistics and Computer, Shahid Bahonar University of Kerman, Kerman, IRAN.
A R T I C L E I N F O
A B S T R A C T Article history: Received 04 June 2019 Received in revised form 09 July 2019 Accepted 20 July 2019 Available online 06 August 2019 Keywords: Succession planning; Competency model; Competency-based management; Organizational culture; Adjusting (variable); Infrastructural communication.
The current research aims to propose a competency-based succession planning model with respect to adjusting role of organizational culture in Telecommunication Infrastructure Company of Iran (TICIR). This study was conducted as an applied research in terms of objective and it was assumed as a descriptive survey by taking approach toward interpretative structural modeling. The statistical population of this study included two groups of experts and directors (Directors general, chairmen of offices, responsible experts and experts of TICIR Company). Primarily, in order to determine sample size for statistical population, 20 of experts were elected using non-randomized and selective sampling method and 340 members of the second statistical population were chosen by means of classified sampling technique including directors general, deputies of directors general, chairmen of offices, responsible experts and other experts of TICIR Company. The findings about succession planning model indicated that the variable of succession planning reached to a level higher than satisfactory rate therefore all of the related elements were placed higher than satisfactory level. Finally variable of organizational culture, as adjusting variable, was also placed at the level higher than satisfactory rate in this study. Hence, all of these variables reached to the level higher than satisfactory rate. © 2019 INT TRANS J ENG MANAG SCI TECH.
INTRODUCTION
The Telecommunication Infrastructure Company of Iran (TICIR) is one of the governmental fields responsible by Ministry of Information Technology and Communication. Structure of organizational manpower possesses a long history and they will reach to the retirement of their career in an early time in the future. With respect to vital role of this organization, management of this organization has put dealing with subject of succession planning for the organizational personnel as
©2019 International Transaction Journal of Engineering, Management, & Applied Sciences & Technologies

2 Narges Hosseini, Masoud Pourkiyani, Ayob Sheikhi
high on the agenda. On the other hand, some new and young workforces have jointed to the organization where they are assumed as the best and most available capital and resource to meet this vital requirement. Accordingly, it necessitates for design and execution of a process to realize key goal of providing appropriate directors to avoid from cessation in playing this role and realization of organizational objectives which can be drawn within process of succession planning. Advancement in various cultural, political, economic, and social fields and especially technology has made the existing competitive environment as ambiguous, unstable, and extremely variant. Planning may provide suitable conditions for exposure to these uncertain conditions for the organizations. Many organizations employ planning of directors to cope with potential for destruction and ruining in organization and to meet environmental requirements and occurring events. Finally, organizations try to improve their own positions smartly and address development and recognition of administrative talents in their planning and assume them their growth and achievement in systematic and serious planning to manage talents and succession planning (Basiri and Sabegh, 2014).
Succession planning is a program through which appropriate persons are elected for incumbency of high-ranking administrative and major posts among qualified and talented personnel. The human talents in organization are identified for incumbency of major positions and jobs in subsequent years and they are gradually prepared to assume these jobs and tasks (Bidmeshki et al., 2014).
Competency is defined according to this point that how a person is selected, what s/he knows and what s/he does. And some other important factors are knowledge, communication, technical skills, distinct thought, emotion, values and activities which are led to an efficient function (Cross, 2010). In fact, competency describes characteristics of personnel they need to them for doing of their tasks properly (Kotonen et al., 2012). Competency management comprises of a group of merits or a list of tasks for apprentice who needs to acquire or execute them so that to be considered as a superior or competent person in terms of occupational aspect. Creation of competency-based management includes several advantages at individual and organizational level. The value-added advantage for an organization is owed to enhance competitive position of the organization, possession of suitable personnel for different jobs, facilitation of employment process, and constant development of personnel according to their requirements. This, in turn, leads to better performance of personnel, improvement of commitment in personnel, and finally enhancement of performance in personnel (Sanghi, 2007).
According to the conducted studies, competency model is an important member in changing if individual and organizational structure which supports from training empowerment plan, performance management, the plan of jobs description, and succession planning (Ennis, 2008). It has been moved toward international occupational standards or competency models as a result of rising number of retired personnel and it aimed to cover the gap of skill and knowledge, nationalization of workforce, and attraction and maintenance of talented forces (Conner et al., 2014). The competency models are assumed as important in terms of succession planning because regardless of this process it is difficult to do several tasks including creating of relationship among main organizational competencies to occupational competencies, giving a transparent definition about talented personnel, accurate determination of competencies needed for present and future in organization, preparation of a basis for performance management by creation of a favorable workplace that is followed by
*Corresponding author (Masoud Pourkiyani) E-mail: [email protected] ©2019 International Transaction Journal of Engineering, Management, & Applied Sciences & Technologies. Volume 10 No.12 ISSN 2228-9860 eISSN 1906-9642 CODEN: ITJEA8 Paper ID:10A12L http://TUENGR.COM/V10A/10A12L.pdf DOI: 10.14456/ITJEMAST.2019.162
3
favorable performance of personnel, creation of clear occupational expectations for the present and future, perfect job evaluation, and development of individual plan to contribute to the personnel to decrease the gap between the needed competencies for achievement (Rothwell, 2005).
There are some organizations which possess powerful directors where they could not survive without such personnel at all; however, these organizations may unwantedly lose these workforces because of several reasons including retirement, resignation, death and or even job promotion. Thus, it is required for prevention from creation of disruption in organizational processes to employ plans to provide competent forces. However, many organizations ignore this issue unfortunately and as they are aware of importance of this subject when it is in vain to do anything and organization is losing the valuable workforces. Therefore, it is necessary for existing of a systematic and purposive method and plan to upgrade scientific awareness to implement succession management and planning to determine key roles by talented and competent personnel. It has been proved those succession plans which are tied with occupational path for personnel, may improve spirit of personnel and their productivity. Those organizations, which support from occupational development by creating of chances for personnel to find new opportunities inside the organization and encouraging them to job motion, will more unlikely share them in developing of their job.
Whereas these personnel more unlikely look for several opportunities in organization if maintenance process is done duly in organization; overall, this is led to increase in job satisfaction among personnel. Nevertheless, there is problem in succession planning models in which despite effect of organizational culture on succession planning, succession planning models have ignored effect of this variable. Thus, designing of a model that can fill this gap may create more suitable structure for the organization and for this reason current research is intended to deal with this important subject. In today world competition, the companies which are active in ICT field especially TICIR Company can remarkably contribute to the country to achieve a position proportional to their valuable level. In this regard, human resources play a crucial role. Alternately, experiences and skills of personnel are considered as a source for which organization spend a lot of costs to acquire them. Nonetheless, organizational directors have forgotten role of these workforces because they think the experienced and skillful personnel always attend in the organization and they may not need to plans for human resource development while exiting of human resources imposes some costs to the organization since organization is required again to spend more time and cost for training of personnel. Hence, presentation of a competency-based succession planning model may provide this opportunity for organizations to train a competent person as future director before retirement of current manager and after retirement of previous manager a person is substituted with him/ her that organization ensures from competency and skill of such a person and thereby organization could continue their proper path. With respect to aforementioned subjects, the current research tends to present a competency-based succession planning model given adjusting role of organizational culture in TICIR Company.
RESEARCH QUESTIONS These questions are raised in this study as follows:
1- What are the indices for succession planning in TICIR Company? 2- Which are parameters of competency in TICIR Company?

4 Narges Hosseini, Masoud Pourkiyani, Ayob Sheikhi
Competency
- Personal dimension - Occupational knowledge and information - Skills - Personality characteristics - Attitude and insight - Social dimension - Occupational reputation - Public reputation
Organizational culture - Engagement in work - Empowerment - Team- making - Developing of capabilities - Adaptation - Fundamental values - Agreement - Coordination and continuity - Adaptability - Change creation - Customer- centrism - Organizational learning - Mission - Strategic tendency and direction - Goals and destinations - Outlook
3- How is the condition of succession planning in TICIR Company? 4- How is the status of competency in TICIR Company? 5- How is the condition of organizational culture in TICIR Company? 6- What is the relationship among competency and succession planning in TICIR Company? 7- Is there any relationship among competency and succession planning with respect to
adjusting role of organizational culture in TICIR Company? 8- What are the characteristics of succession planning in TICIR Company and how much the
validity of succession planning model in TICIR Company?
Figure 1: Research conceptual model
METHODOLOGY
This study is an applied research in terms of objective and it is descriptive survey in terms of method and it has been carried out by taking approach toward interpretative structural modeling. The statistical population of this study was composed of two groups: The first group was the experts who quantity was uncertain and dispersed and the second group comprised of all directors general, deputies of directors general, chairmen of offices, responsible experts and also other experts in TICIR Company throughout Iran where they were totally 2217 members. Using of non-randomized selective
Succession planning
- Creation of commitment
- Creation of satisfaction - Attachment - Job identity - Evaluation of requirements of
future work
- Recognition of strong points - Identification of weaknesses - Review on capabilities - Recognition of threat and opportunity - Evaluation of personal
performance - Identification of personnel - Determination of parameters - Recognition of talents - Assessment of individual talents
- Recognition of characteristics of personnel
- Testing of personnel - Ranking of individuals - Training programs for personnel
- Training of talents - Training of personnel - Evaluation of requirements of
current business - Measurement of job - Scoring of job - Using of time - Goal determination - Order preference - Planning and time allocation - Occupational values
- Fulfillment of promises - Expertise - Well-morality
*Corresponding author (Masoud Pourkiyani) E-mail: [email protected] ©2019 International Transaction Journal of Engineering, Management, & Applied Sciences & Technologies. Volume 10 No.12 ISSN 2228-9860 eISSN 1906-9642 CODEN: ITJEA8 Paper ID:10A12L http://TUENGR.COM/V10A/10A12L.pdf DOI: 10.14456/ITJEMAST.2019.162
5
sampling method to determine sample size for first statistical population, we elected 20 respondents of experts by considering some criteria such as accessibility, scholar expertise in university and academic centers where they studied, having the relevant educational degrees concerning book or paper. To determine sample size for the second statistical population i.e. directors general, deputy of directors general, chairmen of offices, and responsible experts and other experts of TICIR Company, they were chosen by classified sampling method with 340 members.
3.1 DATA COLLECTION TOOLS The questionnaire items are interpreted by Delphi technique out of focus group (experts) to
determine and prioritization of dimensions and indices of competency-based succession planning in TICIR Company. The quantity of these questionnaires was 5.
1- The first questionnaire was utilized to identify dimensions and indices of succession planning in TICIR Company. This questionnaire is completed by the experts.
2- The second questionnaire will be used for determination of dimensions and variables of competency in TICIR Company. This questionnaire is filled out by experts.
3- Third questionnaire will be utilized for measurement of succession planning status in TICIR Company. This questionnaire is completed by operational directors and corporate experts.
4- The fourth questionnaire will be employed for measurement of competency status in TICIR Company. This questionnaire is completed by operational directors and corporate experts.
5- The fifth questionnaire will be utilized for measurement of status of organizational culture in TICIR Company. This questionnaire is completed by operational directors and corporate experts.
Both content validity and construct validity were employed in this study to determine validity of questionnaires. After reading of books and essays regarding the research subject and study on questionnaires in other papers and researches, the needed items were designed for research variables to determine content validity and the codified questionnaires for research variables were examined by research masters. The exploratory factor analysis and confirmatory factor analysis were employed for review of construct validity of measurement tool (questionnaire) as well as appropriateness of psychometric criteria of questionnaires which were assumed as important defaults in structured equations. In order to determine internal reliability, rate of internal reliability was calculated for questionnaires of succession planning, competency, and organizational culture using Cronbach’s alpha coefficient and given that the Cronbach’s alpha coefficients were higher than (0.7) the internal reliability was confirmed for all three questionnaire. The questionnaires were distributed gathered by attendance and electronically at any phase.
RESEARCH FINDING
SPSS and IMOS software, Pearson’s correlation test, Kolmogorov-Smirnov test, binominal test, frequency tables, Bazargan Standard table, factor analysis, modeling of structured equations with path analysis were utilized for statistical description and analysis and structural relations. Among total 340 participants in this study 69.1% of them were males and 30.9% were females in section of demographic data. The highest numbers for educational degrees in participants, BA degree (51.5%) and high school diploma (47.1%) were the most frequent rates among the participants. Similarly, 35 participants were chairmen of offices, 282 members were experts and responsible experts, and 23 participants included directors general and their deputies out of them 81.5% have been employed by official system and 18.5% of them were as contractual personnel.

6 Narges Hosseini, Masoud Pourkiyani, Ayob Sheikhi
Table 1, normality of studied variables was examined before analysis of research hypotheses. Kolmogorov-Smirnov test was employed for determination of assumption of normality of variables.
Table 1: Analysis on normality of research variables Variable Kolmogorov-Smirnov p-value
Succession planning 0.068 0.077 Competency 0.074 0.083 Organizational culture 0.051 0.064
Table 2: Analysis on relationship between variables.
Variable Kolmogorov-Smirnov Value (-p) Succession planning 1 0.860** Competency 0.860** 1
* Significant at level 0.05 (p<0.05); ** Significant at level 0.01 (p<0.01)
Likewise, Pearson’s correlation coefficient was utilized to determine relationship between variables. The resultant findings from correlation test are given in Table 2. Given the Pearson’s correlation coefficient and also this quantity (p-value<=0.001), there is significant and direct relationship among competency and succession planning in TICIR Company at level 0.01.
The multivariate regression was utilized to review relationship between competency factors with succession planning in TICIR Company. The given results from regressive analysis and determination coefficient indicated variables of knowledge and information, skills, personality characteristics, attitude and insight, and public reputation affected significantly succession plan as predictors (p-value <0.05). Similarly, according to parameter of partial correlation coefficient among effective factors of competency on succession planning in TICIR Company, variable of public reputation has the maximum relationship with succession planning.
Table 3: Regression coefficients for effective factors of competency on succession planning
Variable Standardized coefficient t-statistic p-value Partial correlation coefficient Knowledge and information 0.245 6.488 0 0.335 Skills 0.322 8.074 0 0.405 Personality characteristics 0.191 5.620 0 0.294 Attitude and insight -0.109 -2.813 0.005 -0.152 Professional reputation 0.034 0.932 0.352 0.051 Public reputation 0.354 8.618 0 0.427
Table 4: Fitness indices for succession planning model.
Index Favorable statistic value Reported value RMSEA ≤0.08 0.036 Chi2 ratio (x2/df) <3 2.024 GFI ≥0.90 0.921 AGFI ≥0.90 0.945 CFI >0.90 0.910 NFI >0.90 0.987 TLI >0.90 0.941 IFI >0.90 0.956
With respect to adjusting role of organizational factor, goodness of fit indices in succession planning model, competency model, and the model among competency and succession planning is given in Tables 5, 6, and 7. There are several techniques for estimation of general goodness o fit with the observed data. The criteria of Goodness of Fit Index (GFI), Adjusted Goodness of Fit Index (AGFI), Root Mean Square Error of Approximation (RMSEA), Normed Fit Index (NFI), Tucker

*Corresponding author (Masoud Pourkiyani) E-mail: [email protected] ©2019 International Transaction Journal of Engineering, Management, & Applied Sciences & Technologies. Volume 10 No.12 ISSN 2228-9860 eISSN 1906-9642 CODEN: ITJEA8 Paper ID:10A12L http://TUENGR.COM/V10A/10A12L.pdf DOI: 10.14456/ITJEMAST.2019.162
7
Lewis index (TLI), Incremental Fit Index (IFI), Non-Normed Fit Index (NNFI), and Comparative Fit Index (CFI) were used for assessment of goodness of fit in all models at this study. Figure 2 show path analysis diagram.
Table 5: Fitness indices for competency model. Index Favorable statistic value Reported value
RMSEA ≤0.08 0.059 Chi2 ratio (x2/df) <3 2.280 GFI ≥0.90 0.898 AGFI ≥0.90 0.923 CFI ≥0.90 0.901 NFI ≥0.90 0.924 TLI ≥0.90 0.996 IFI ≥0.90 0.909
Table 6: Fitness indices for model among competency and succession planning with respect to
adjusting role of organizational culture Index Favorable statistic value Reported value
RMSEA ≤0.08 0.061 Chi2 ratio (x2/df) <3 1.924 GFI ≥0.90 0.942 AGFI ≥0.90 0.980 CFI ≥0.90 0.911 NFI ≥0.90 0.965 TLI ≥0.90 0.897 IFI ≥0.90 0.899
With respect to the given indices, these models are suitable fitted.
Figure 2: Diagram for path analysis of variable of succession planning.

8 Narges Hosseini, Masoud Pourkiyani, Ayob Sheikhi
Table 7: Indices of succession planning. Dimension Component Indicator
Commitment
Satisfaction The nature of the work(e1) Consult with staff(e2) Satisfaction with promotion(e3) Increase salary(e4)
Attachment Job attachment(e5) Endure hard work (e6) Job rotation (e7) Doing better (e8)
Job identity Good sense of work (e9) Social site (e10) Introduction to Jobs (e11) Satisfaction with promotion (e12)
Evaluation of current work requirements
Job evaluation Evaluation criteria (e13) Dimensions of competence (e14) Occupation based on expertise (e15) Enterprise Management Post (e16)
Job Scoring Scoring system (e17) Periodic evaluation of jobs (e18) Job score breakdown (e19)
Evaluation of individual performance
Getting to know people Recognize the skill of the staff (e20) Know the talent of the staff (e21) Undertaking posts with recognition (e22)
Indicators Definition of job indicators (e23) Revision of indicators (e24) People's job performance (e25)
Recognizing talents Determining career path (e26) Recruitment tests (e27) Matching jobs (e28)
Evaluation of future work requirements
Recognize strengths Dimensions of competence of each job (e29) Competent Appointment (e30) Identify people's strengths (e31)
Recognizing weaknesses Identifying weaknesses (e32) Evaluation system (e33) Appropriate training (e34)
Exploring abilities Ability to upgrade (e35) Appropriate job position (e36) Ability to hire (e37)
Recognizing threats and opportunities
Ability recognition test (e38) Recognizing job opportunities (e39) Identifying Threats and Opportunities (e40)
Use time
Goal Determination Use experiences in purpose (41) Know the goals (e42) Objective Evaluation (e43) Compatibility between goals (e44)
Prioritization
Prioritize goals (e45) Effective time and resource management (e46) Setting work priorities (e47)
Planning and time allocation Daily Checklist (e48) Preparation of work plan (e49) Daily Schedule (e50)
Employee training programs
Nurturing talents Strengthening staff skills (e51) Educational Planning (e52) Pay attention to nurturing talent (e53) Training course (e54)
Staff training The Role of Training in Promotion (e55) Recognize skills and talents (e56) Specialization course (e57) Staff Skills Training (e58)
Work Values
Fulfilling the covenant Doing the job to the end (e59) Perform assigned tasks (e60) Staff promises (e61) Doing the job best (e62)
specialty Knowledge transfer day (e63) Level of education (e64) Increasing knowledge and experience (e65) Apply appropriate techniques (e66)
Good mood Lack of staff deviance (e67) No militancy (e68) Client tolerance (e69) Staff promises (e70)
Evaluating individual talents
Understanding individual characteristics
Pay attention to individual characteristics (e71) Managers' perception of individual characteristics (e72) Pay special attention to hiring (e73)
Staff Test Test for upgrade (e74) Test for employment (e75) Periodic evaluation of ability (e76) Test for ability recognition (e77)
Ranking of people Ranking of people (e78) Role in promotion (e79) The importance of rank of staff (e80)
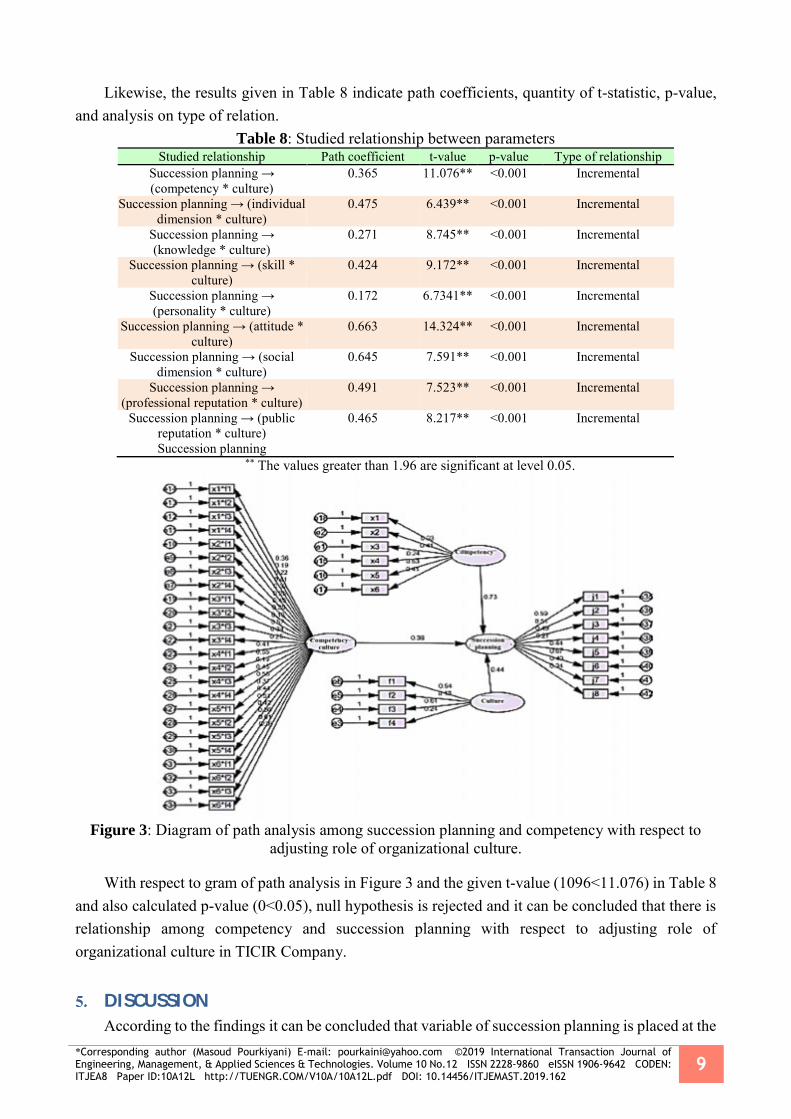
*Corresponding author (Masoud Pourkiyani) E-mail: [email protected] ©2019 International Transaction Journal of Engineering, Management, & Applied Sciences & Technologies. Volume 10 No.12 ISSN 2228-9860 eISSN 1906-9642 CODEN: ITJEA8 Paper ID:10A12L http://TUENGR.COM/V10A/10A12L.pdf DOI: 10.14456/ITJEMAST.2019.162
9
Likewise, the results given in Table 8 indicate path coefficients, quantity of t-statistic, p-value, and analysis on type of relation.
Table 8: Studied relationship between parameters Studied relationship Path coefficient t-value p-value Type of relationship
Succession planning → (competency * culture)
0.365 11.076** <0.001 Incremental
Succession planning → (individual dimension * culture)
0.475 6.439** <0.001 Incremental
Succession planning → (knowledge * culture)
0.271 8.745** <0.001 Incremental
Succession planning → (skill * culture)
0.424 9.172** <0.001 Incremental
Succession planning → (personality * culture)
0.172 6.7341** <0.001 Incremental
Succession planning → (attitude * culture)
0.663 14.324** <0.001 Incremental
Succession planning → (social dimension * culture)
0.645 7.591** <0.001 Incremental
Succession planning → (professional reputation * culture)
0.491 7.523** <0.001 Incremental
Succession planning → (public reputation * culture) Succession planning
0.465 8.217** <0.001 Incremental
** The values greater than 1.96 are significant at level 0.05.
Figure 3: Diagram of path analysis among succession planning and competency with respect to
adjusting role of organizational culture.
With respect to gram of path analysis in Figure 3 and the given t-value (1096<11.076) in Table 8 and also calculated p-value (0<0.05), null hypothesis is rejected and it can be concluded that there is relationship among competency and succession planning with respect to adjusting role of organizational culture in TICIR Company.
DISCUSSION
According to the findings it can be concluded that variable of succession planning is placed at the

10 Narges Hosseini, Masoud Pourkiyani, Ayob Sheikhi
level higher than satisfactory rate. Therefore all elements of this variable are placed at the position higher than satisfactory level, except variable of commitment which is placed at good level. Accordingly, it is suggested about factor of organizational commitment to the directors to provide personnel’s satisfaction by employing improvement and progress in li line with their occupational path because job satisfaction causes organizational commitment. Namely, job satisfaction is assumed as precondition for organizational commitment. Thus, they should pay due attention to way of promotion of personnel and prepare the ground to achieve individual and organizational goal by implementation of accurate management on processes of occupational promotion for personnel logically and precisely.
Based on the results of this study, it can be concluded that variable of competency has been placed at the level higher than satisfactory condition. Therefore, all elements of this variable are in the position higher than satisfactory level. According to the given results about individual dimension, the mean value of this variable is (3.56) which is higher than satisfactory level. Thus, it is suggested to the organization to improve related education and expert trainings for personnel in order to increase their professional knowledge and information for doing of occupational activities. To this end, various training courses should be held with respect to expertise in personnel in organization. Based on the findings from this study, it can be concluded that variable of organizational culture has been also at the level higher than satisfactory position. Therefore, all elements of this variable are placed as high level than satisfactory rate. Variable of mission is placed at level higher than satisfactory position. Thus, it is suggested to leaders to clarify organizational objectives perfectly for this personnel so that organizational personnel to be aware of the tasks which should be done thereby the organization to achieve in the long run. Similarly, organization needs to codify clear strategies for the future so that strategic path of the organization not to be ambiguous to personnel.
CONCLUSION
Finally, given that the presented model in this study enjoys favorable validity and it is aligned with theoretical patterns and scientific bases; accordingly, whereas organizational culture totally forms behavior of organizational members including directors and personnel at different levels thus it can affect organization in creation of change and strategic orientation noticeably and alternately the basis and framework for determination of competent subject is relatively affected by organizational culture to great extent their elements should be improved. Therefore, certain efforts and planning should be taken for upgrading and improvement in each of dimensions and parameters of organizational culture because organizational culture directly and indirectly intervenes in determination of competency level in individual and it plays an important role in creation of consistency in the given behaviors of personnel. The studies have indicated that rather than this point election of personnel for incumbency of future positions is assumed as one of the foremost success factors in succession planning, organizational culture should be also developed and a type of positive attitude should be taken toward able personnel and it should not be only focused on their background. Thus, attention should be more paid to implementation of meritocracy culture in organization so that to prepare suitable platform to train competent personnel in the organization since organizational culture is composed of a system of common values which guide behavior in personnel and acts as an important factor in achievement for execution of succession planning. Moreover, specific legal

*Corresponding author (Masoud Pourkiyani) E-mail: [email protected] ©2019 International Transaction Journal of Engineering, Management, & Applied Sciences & Technologies. Volume 10 No.12 ISSN 2228-9860 eISSN 1906-9642 CODEN: ITJEA8 Paper ID:10A12L http://TUENGR.COM/V10A/10A12L.pdf DOI: 10.14456/ITJEMAST.2019.162
11
criteria and methods should be employed in systems of attraction of workforces, appointment and promotion thereby to pave the way needed for establishment of a meritocratic system and developing of meritocracy in organization.
AVAILABILITY OF DATA AND MATERIAL
The used or generated data in this study is available upon request to the corresponding author.
REFERENCES
Basiri, A., Sabegh, Z.A. (2014). Organizational Factors Influencing Succession Planning Managers in Khuzestan Province.
Cross, J. 2010. Engaging the paradox of competence: business and education research, develop a master
of business competence model. Doctoral Thesis. Capella University.
Ennis, M.R. (2008). Competency models: a review of the literature and the role of the employment and
training administration (ETA). U. S. Department of labor.
Kotonen, U., Savonen M-L., Tuominen, U., Lahtinen, H. & Suomrki, A. 2012. Process and methods of competence management and development. In -Kotonen, U. & Suomrki, A. (ed.) Competence development of logistics centers: development of logistics centers in Southern Finland. The publication series of Lahti University of Applied Sciences. 22-28.
Rothwell, W.J. (2005), Effective Succession Planning: Ensuring Leadership Continuity and Building
Talent from Within. American Management Association (AMACOM). New York. 3rd Ed.
Sanghi, S. 2007. The Handbook of Competency Mapping. New Delhi: Vivek Mehra for SAGE Publications India Pvt Ltd.
Zeinolabedin Bidmeshki Zohreh, Adli Fariba, Vaziri Mojdeh (2014). Comparison of status quo of succession planning and talent management with the favorable status in higher education, Journal of research and planning in higher education, series 20, vol. 2 (serial 72): 51-72.
Narges Hosseini is a PhD student at Department of Management, Islamic Azad University,Kerman Branch, Kerman,Iran. She is working at the Telecommunication Infrastructure Company of Iran (TICIR). Her research interest focuses on Succession Planning.
Dr Masoud Pourkiyani is Assistant professor, Department of Management, Islamic Azad University, Kerman Branch,Kerman, Iran. He got his Ph.D. in Government Management. His researches include Strategic and Public Policy Orientation, Succession Planning, and Competency
Dr. Ayob Sheikhi is an Assistant Professor in Statistics Group, Department of Statistics and Computer, Shahid Bahonar University of Kerman,Kerman,Iran. He got his Ph.D. in Statistics. His researches include Statistics and Applied Probability, Descriptive Statistics and Linear measurement models.
Trademarks Disclaimer: All products names including trademarks™ or registered® trademarks mentioned in this article are the property of their respective owners. using for identification purposes only. Use of them does not imply any endorsement or affiliation.

*Corresponding author (I.P. Bogomolova). Tel: +7 (473) 255-27-10 Email: [email protected] ©2019 International Transaction Journal of Engineering, Management, & Applied Sciences & Technologies. Volume 10 No.12 ISSN 2228-9860 eISSN 1906-9642 CODEN: ITJEA8 Paper ID:10A12M http://TUENGR.COM/V10A/10A12M.pdf DOI: 10.14456/ITJEMAST.2019.163
1
International Transaction Journal of Engineering, Management, & Applied Sciences & Technologies
http://TuEngr.com
PAPER ID: 10A12M
RESOURCE-SAVING WASTE-FREE PRODUCTION AS AN
INNOVATIVE METHOD OF IMPROVING ENTERPRISES’
BUSINESS PERFORMANCE IN THE MEAT PRODUCTION
I.P. Bogomolova a*, A.V. Kotarev b, A.N. Prostenko c, A.I. Dobrunova c, D. Yu. Chugay c a Department of Management, Production Organization and Sectoral Economics, Federal State Budgetary
Educational Institution of Higher Education “Voronezh State University of Engineering Technologies”,
394036, 19, Revolutsii str., Voronezh, RUSSIA b Department of Management and Marketing in the Agro-Industrial Complex, Federal State Budgetary
Educational Institution of Higher Education “Voronezh State Agrarian University named after Emperor
Peter I”, 394087, 1, Michurina st., Voronezh, RUSSIA c Department of Economic Theory and Economics of the Agro-Industrial Complex, Federal State Budgetary
Educational Institution of Higher Education “Belgorod State Agrarian University named after V.Ya. Gorin”,
308503, 1, Vavilova st., Maysky settlement, Belgorod district, Belgorod region, Russia of the Rodinsky
District of the Altai Territory, RUSSIA
A R T I C L E I N F O
A B S T R A C T Article history: Received 09 May 2019
Received in revised form 22 July 2019
Accepted 30 July 2019
Available online 07 August 2019
Keywords: Meat management;
food security; Meat
production subcomplex;
Food industry
resource-saving;
Innovative meat
production; Resource
efficiency management.
This work explores the issues on the development of resource-saving
methods and approaches of meat production, taking into account the
innovation and efficiency factors. Using the synthesis, analysis,
comparisons, as well as logical, process and system approaches, it is found
that many scientists define the "resource-saving" concept often too narrow
and trivial, using limited one-way approach to the interpretation of the
substantive essence of the definitions and explications of this category.
Many scientists consider only the material and financial components,
without taking into account the fact the process of resource management
and the very essence of a lean approach to the production management
system. The resource efficiency management process can improve the
quality management system of finished products and the technological
process, organizing the transport and logistics and storage conditions (raw
materials, food, products), as well as environmental measures. This work
highlights and systematizes the main indicators of enterprise resource
efficiency, and formulates the conditions for improving the resource
efficiency. This study finds that modern enterprises are required to
implement the principles of resource-saving: scientific substantiation,
complexity, and cost-effectiveness. The resource-saving strategy gives a
permanent reduction in resource consumption per unit of the resulting
beneficial effect. Also, this paper elaborates the main areas of
resource-saving in the agro-industrial sector. The most promising areas of
processing and practical use of waste and secondary raw materials of meat
production and international experience are proposed.
©2019 INT TRANS J ENG MANAG SCI TECH.
© 2019 International Transaction Journal of Engineering, Management, & Applied Sciences & Technologies

2 I.P. Bogomolova, A.V. Kotarev, A.N. Prostenko, A.I. Dobrunova, D. Yu. Chugay.
1. INTRODUCTION Under the conditions of a modern market economic system, enterprises of the
agro-industrial complex of the Russian Federation function under restrictions of tough
competition, high cost of material, raw materials and labour resources, as well as their
limitations. At the moment, despite the implemented set of measures in the field of import
substitution, a significant niche in the market of food raw and other materials is occupied by
foreign producers, which reduces the indicator of food security in our country. This is
especially relevant in terms of the technical and technological infrastructure of industrial
enterprises of the agro-industrial complex, providing heavily processed products from food
stock, production of initial components for composite meat, dairy, and grain products, as
well as feed mixtures for the livestock farming.
Taking into account the economic and innovative aspects, we can say that
resource-oriented methods and approaches to the food production management system are
the most effective and efficient from the standpoint of achieving the most sustainable
socio-economic growth and development of the entire domestic AIC at the current moment
and in the future. The introduction of effective resource-saving mechanisms in the food
production industry will reduce waste, successfully carry out product diversification,
reduce direct and indirect costs, including the resource intensity and resource consumption
indicators, and ultimately increase the level of profitability, capitalization and
competitiveness. It is worth noting that the quality and intensity of the technical and
technological development of food industry enterprises, including those of meat
production, are highly determined with many social, economic, financial, environmental
and organizational factors. The success of adaptation and the application effectiveness of
new technical and technological solutions depend not only on the level of their industrial
feasibility but also on the degree of provision with "long" investments that can be justified
only within the framework of the innovative resource-saving strategy. The transition to
market relations at the beginning of the XXI century predetermined the difficult financial
situation of research organizations and enterprises of the food industry, which were earlier
engaged in the development of advanced resource-saving technologies. In the end, the
introduction of developed technologies slowed down and ceased; this currently
characterizes the situation of a significant underrun of domestic science and practice
compared to foreign food industry enterprises in the field of resource-saving and resource
consumption.
Thus, in our opinion, the basis for improving economic efficiency and sustainability
should be a mechanism for enhancing the actual and potential capabilities of a business
entity (labor, financial and economic, organizational and managerial, social and legal,
information technology, research, intellectual) aimed at improving the socio-economic
situation and its competitiveness. One of such important reserves is the careful attitude to
all types of resources used and the deep processing of all by-products and waste of
meat-processing production. As the result of our study, we have established that the loss of
resources depends on endogenous and exogenous factors: inefficient methods of raw
materials transportation and storage; low rates of intra- and inter-sectoral cooperation

*Corresponding author (I.P. Bogomolova). Tel: +7 (473) 255-27-10 Email: [email protected] ©2019 International Transaction Journal of Engineering, Management, & Applied Sciences & Technologies. Volume 10 No.12 ISSN 2228-9860 eISSN 1906-9642 CODEN: ITJEA8 Paper ID:10A12M http://TUENGR.COM/V10A/10A12M.pdf DOI: 10.14456/ITJEMAST.2019.163
3
between enterprises with raw materials and technological ties; the imperfection of
technological processes for processing and reprocessing of raw materials (high energy and
resource intensity); the technical and technological development level does not comply
with the principles and approaches of material, labor, energy-saving; lack of staff
motivation in the implementation of resource-oriented methods of labor organization and
production process (material resources and raw materials saving and prudent attitude to
them); low organization and production culture; the lack of effective methods and
approaches from state authorities aimed at stimulating modern food production to
resource-saving, introducing resource-saving technologies, and also technologies for the
deep processing of raw materials.
Thus, the foregoing proves the high degree of relevance of the subject area under study
and determines the need to solve practical problems aimed at improving the efficiency of
the meat production subcomplex enterprises based on the application of scientifically
grounded methods and approaches to resource-saving.
2. GOALS AND TASKS
The aim of the study is a comprehensive exploration of theoretical and applied
achievements in the field of resource-saving and waste-free production of meat products.
The main conceptual provisions are based on the processing of secondary raw materials and
meat processing resources in the aspect of improving the efficiency and innovativeness of
the business subjects in the sector. The stated goal determined the basis for the objectives: to
conduct a study of the essence and content of the category “resource-saving”, taking into
account domestic and foreign experience of setting and interpreting problematic issues in
the field of resource-saving and resource consumption; to determine the basic aspects of the
resource-saving mechanism formation; to analyze the main problem points that restrain the
innovative development of domestic meat production in the conditions of development,
adaptation and application of low-cost and waste-free technologies within the entire
functional and technological vertical of the meat production subcomplex; to explore the
most promising areas of the integrated raw meat, by-products, and waste use, taking into
account technological, organizational and managerial components.
3. METHOD AND MATERIAL
A theoretical and methodological basis for the scientific research were the theories,
methods, concepts, as well as applied research of domestic and foreign scientists in the field
of efficient management of meat processing production under the conditions of innovative
type resource-oriented approach application. In the process of achieving the goal and
solving the designated tasks, the following methods of understanding the production and
economic processes in the meat processing industry of the agro-industrial complex were
applied: synthesis, analysis, comparisons, and also logical, systemic and process
approaches.
4 I.P. Bogomolova, A.V. Kotarev, A.N. Prostenko, A.I. Dobrunova, D. Yu. Chugay.
4. RESULTS AND DISCUSSION
In modern economic conditions, the organization of resource-saving has undergone
very significant changes (transformations), and in some cases, the nature and forms of these
changes have extraordinary manifestations. This is due, first of all, to changes in the
production and business process management model, the formative development of the
market environment, changes in principles and approaches to property management and
business, violation of well-established intra- and inter-industry cooperation links. Modern
risks and uncertainties of the market business model (imperfect competition; shortage and
high cost of financial resources and long-term investments; problems associated with
monopolization of industry markets; lack of an effective mechanism for managing product
quality based on the application of safety and utility principles; distribution of profits
between participants in market relations (procurers, producers, consumers, intermediaries,
end-users, suppliers); imperfection of regulatory and legal regulation by supervisory
authorities; problematic issues in the field of fiscal support), set the trend and future need for
the development and application in practice of advanced achievements in resource-saving,
as well as organizational and management decisions aimed at activation of measures to
improve the resource efficiency of industry actors, taking into account the innovation,
permanence and utility factors [16, 21].
At the present stage, there are still discussions in scientific circles and there are
inconsistencies on individual issues regarding the organization, planning, accounting,
control, evaluation and implementation of resource-saving methods and approaches. All
this proves once again the need and relevance of conducting scientific research in the
resource-saving and resource consumption area in the relevant specialized fields and areas
of entrepreneurial activity. At the same time, it must be emphasized that even today many
scientists characterize the “resource-saving” concept often too narrowly and trivially,
applying a limited one-sided approach to interpreting the substantive essence of the
definitions and explications of this category. Many scientists focus only on the material
and financial components, not taking into account that the resource management process
and the very essence of a lean approach to the production management system has a much
deeper meaning and logic of understanding [1, 4, 6, 19, 22].
Material consumption and raw materials consumption indicators for manufactured
products depend on various kinds of factors which are characterized by a high degree of
uncertainty and imitability. The main quantitative and qualitative indicators of resource
efficiency in an enterprise are illustrated in Figure 1.
To increase the resource efficiency level of an enterprise, it is necessary to fulfill the
following requirements: to ensure a high level of qualification of the company's
employees; achieve high intellectual potential of employees; ensure the technical and
technological independence of the enterprise; achieve a high level of competitiveness;
ensure the legal security of the enterprise and the protection of enterprise information
security.

*Corresponding author (I.P. Bogomolova). Tel: +7 (473) 255-27-10 Email: [email protected] ©2019 International Transaction Journal of Engineering, Management, & Applied Sciences & Technologies. Volume 10 No.12 ISSN 2228-9860 eISSN 1906-9642 CODEN: ITJEA8 Paper ID:10A12M http://TUENGR.COM/V10A/10A12M.pdf DOI: 10.14456/ITJEMAST.2019.163
5
Figure 1. The main indicators of resource efficiency at an enterprise [12, 20]
In the process of organizing an economic activity in modern enterprises, it is required
to implement the following resource-saving principles:
o scientific substantiation and provability which imply a balance and proportions
between the various interests of society and the environment;
o a complexity which assumes a variety and multiplicity of directions in terms of rational
use of material and non-material resources on the basis of low-waste and/or
waste-free production;
o permanence which is the process of resource-saving that must be continuous and
constant;
o expediency and flexibility which mean that resource-saving should be reasonable and
logical;
o determinism and ubiquity which mean that resource-saving as a process should be
interconnected with other processes of endogenous and exogenous nature, as well as
cover all major areas of production and economic activity in order to obtain the
maximum synergistic effect throughout the production and technological chain [18].
Thus, summarizing the results of research carried out by domestic and foreign
scientists in the field of formation and ensuring the organization of production on the basis
of resource-saving approaches, we came to the conclusion that the resource-saving strategy
is a set of principles, factors, methods, models, and measures ensuring a permanent
reduction in resource consumption per unit of the resulting beneficial effect.
Turning to the sectoral level, it is worth noting that the issues of resource-saving and
resource consumption are very relevant for agricultural production, including for meat
processing, since most of them do not receive close enough attention in terms of
organizational, economic, production and technological measures aimed at reducing

6 I.P. Bogomolova, A.V. Kotarev, A.N. Prostenko, A.I. Dobrunova, D. Yu. Chugay.
resource consumption and resource intensity production. This situation has a negative
impact on the stability and balance of the meat production development. In this regard, let
us present the main directions of resource-saving based on the main resource efficiency
principles (table 1).
Table 1. The main directions of resource-saving for the field of agriculture [5, 15] Direction Implementation and effect
The introduction of advanced
technology
Energy-efficient machinery and equipment; reducing raw material losses
and increasing the yield of finished products; reduced resource
consumption; increase the shelf life and sales of food products
Interchangeability of used
resources and production factors
The use of substitute materials, as well as more cost-effective production
factors; the widespread use of alternative energy sources and recycling
energy; improving the quality and safety of raw materials and finished
products
Methods and models of
economic and mathematical
software
Solving problems in the field of linear and dynamic programming:
optimization of the mixtures and multi-component production cycles,
transport and logistics facilities; application of valid models in the process
of rationalization of the natural-economic balance
Processes of control and
rationing of production
indicators
Standard indicators of procurement, transportation, pre-processing,
processing and reprocessing of raw materials and materials: the degree of
resource utilization, conditional consumption, stock, output, price.
Natural resources and
environment conservation
Intensification of the integrated use of raw materials, secondary resources,
waste, intermediate components; loss and waste reduction; reduction of
specific consumption and consumption rates
For a general understanding of the resource-saving process, it can be noted that this
technology orients the production and sales of products (services) process to perform
technological and trade operations with minimal costs at all stages of the life cycle. The
degree of environmental impact should be minimal. It is also important to comply with the
requirements for a full accounting of the primary material and labour components
consumption during the entire production process, transportation and storage, referred to
the unit of the finished product [2].
The analysis shows that the most important areas for improving the activities of meat
production enterprises were and remain the reduction of direct and indirect production
costs; adaptation and active use of resource-saving technologies; increasing the output of
finished products from the unit of processed raw materials; production and product
diversification; improving the quality of raw materials and finished products;
manufacturing of packaged and packed products with high consumer properties and
meeting the safety criteria; increasing the competitiveness of products and business
entities; increasing integration and cooperation processes; formation of own raw material
base; improving the technology of raising and slaughtering livestock; technical and
technological modernization; adaptation and application of modern standards in the field
of product quality management, technological process, and environmental management;
solving problems of the shortage of highly qualified personnel; introduction of modern
software systems for automation and robotization in the field of production, organization,
planning, accounting and control; development of new market niches and expansion of
distribution channels for finished meat products and semi-finished products.
Practical experience shows that the quality of raw materials and finished meat products

*Corresponding author (I.P. Bogomolova). Tel: +7 (473) 255-27-10 Email: [email protected] ©2019 International Transaction Journal of Engineering, Management, & Applied Sciences & Technologies. Volume 10 No.12 ISSN 2228-9860 eISSN 1906-9642 CODEN: ITJEA8 Paper ID:10A12M http://TUENGR.COM/V10A/10A12M.pdf DOI: 10.14456/ITJEMAST.2019.163
7
remains the most problematic issue. The lack of high-quality food at a reasonable price
does not allow for the effective implementation of preventive measures to improve the
quality of life, which is aggravated by the adverse environmental conditions [12, 18, 8, 9,
21].
In these circumstances, modern experts in the food industry, foodservice industry, and
dietetics today are tasked to improve the structure of nutrition, including by improving the
technologies for processing secondary raw materials and main production waste and
creating new products with high nutritional and biological value, dietary and prophylactic
purposes [17].
In our opinion, in solving this problem, especially in obtaining complete protein, much
attention should be focused on the rational use of raw material potential and reserves of
secondary resources, first of all, the reserves of the meat and dairy industry. The solution
to this type of problem depends largely on the degree of development of low- and
non-waste technologies. In this context, new methods of extracting animal protein from
waste and meat-based secondary raw materials and their use in recipes of finished meat
products are becoming highly significant.
The analysis showed that the leading foreign companies in the food industry today
focused on the development of functional products, the use of secondary products, as well
as special and health products based on traditional products. One of the most important
and most valuable products of animal slaughtering is blood. Every year more than 500
thousand tons of this “by-product” is formed at sectoral enterprises. The total amount of
rational use is less than 5%; however, there are a lot of options for using blood due to its
chemical composition and properties [4]. At the same time, abroad, in the meat industry of
the EU countries and the USA, the whole blood of animals, as well as all its components,
are very successful. About 1/3 of the blood is used in the production of food products.
Plasma and serum are mostly used. In particular, serum and plasma are used in the recipe
of boiled sausages, chopped semi-finished products, dietetic products, and liver sausages
[12]. The only problem with blood use is its colour, but today there are a significant
number of ways to bleach it [8]. Thus, foreign meat-oriented enterprises are interested in
the production of this raw material and do not allow the wasteful attitude to such a
valuable by-product as blood [11].
In the context of the rational use of recycled food raw materials and food waste it is
worth noting that on the basis of the All-Russian Scientific Research Institute of the Meat
Industry (VNIIMP) named after V.M. Gorbatov highly efficient biotechnological solutions
in the processing of cattle proventriculus followed obtaining fodder fortifier, dry vegetable
and animal, vegetable and protein, and protein-carbohydrate feed (BUK) were developed.
In continuation of the study, we note that at St. Petersburg University of
Low-Temperature Technologies a unique scheme has been developed for the processing of
hard and soft wastes from meat production based on the use of safe food solvents. Note
that the obtained organic mass can be dried on spray type plants at 200 ° C and get pure

8 I.P. Bogomolova, A.V. Kotarev, A.N. Prostenko, A.I. Dobrunova, D. Yu. Chugay.
protein in the form of a white dry powder. In the future, this food ingredient can be used in
sausage production without any restrictions and improve the nutritional and biological
value of meat products, which is an important competitive advantage in terms of import
substitution and resource-saving strategies in the food industry [7].
Also in modern meat production, a sufficiently large amount of so-called fat mass is
formed, which is quite widely used as the technical products in the production of technical
products (feed meal).
Currently, VNIIMP has developed a method for utilization of flotation concentrate. As
a result of applying this method, fodder fat of the 2nd or 3rd grade is obtained; all depends
on the time when the processing of raw materials begins (after 10-12 hours, only technical
fat of the 3rd grade can be produced). This method also makes it possible to produce high
nutritional value from solid food waste.
Also, using a flotation cell, about 80% of fat and 75% of suspended solids can be
extracted from wastewater containing fat, which is an important criterion in improving the
environmental friendliness and wastelessness of meat production [3].
Further, we note that AnstaProInternational (USA) has successfully tested the
developed technology for processing whole carcasses of dead and culled animals and
poultry, as well as reprocessing hard and soft food waste based on the dry extrusion
method. The basic initial technological condition for the application of this method is that
the moisture content of the feedstock should not be higher than 40%. This produces a
sterilized and stabilized animal feed. Grain and leguminous crops, oilcake, oilseed, and
industrial oilseed products, and also bran are used as filler ingredients.
Recently, the microbial-enzymatic conversion methods for reprocessing meat waste
generated after wastewater treatment are becoming more and more relevant and
widespread. This method is based on the use of the biological product
MicrozimWeightTrit developed by RSE-Trading LLC [11]. The main advantages of this
technology include the fact that the fermentation process takes place without the formation
of reactive gases and heavy volatile compounds; the mass of processed food waste is
reduced by 50-70%. This preparation can be used for the process of deodorization of
sewage sludge, aero tanks, silt detention ponds, solid waste storage tanks, and composting
sites.
Also, the studies conducted by the State Research Institute "Sintezblok" proved the
real possibility of processing sand and fatty sediments with the help of vermiculture (earth
and manure worms, including California worms) into humus. This type of production can
be organized on the basis of a sectoral enterprise with little or no organizational and
operational costs.
Today, many authors have described scientific ways to improve the nutritional
properties of low-grade raw meat and food waste of meat production based on lactic acid
bacteria. Many other probiotic microorganisms are also used in this method. Among the
most well-known drugs, it is worth highlight the following: "Bifidobakter", "Bacteria",
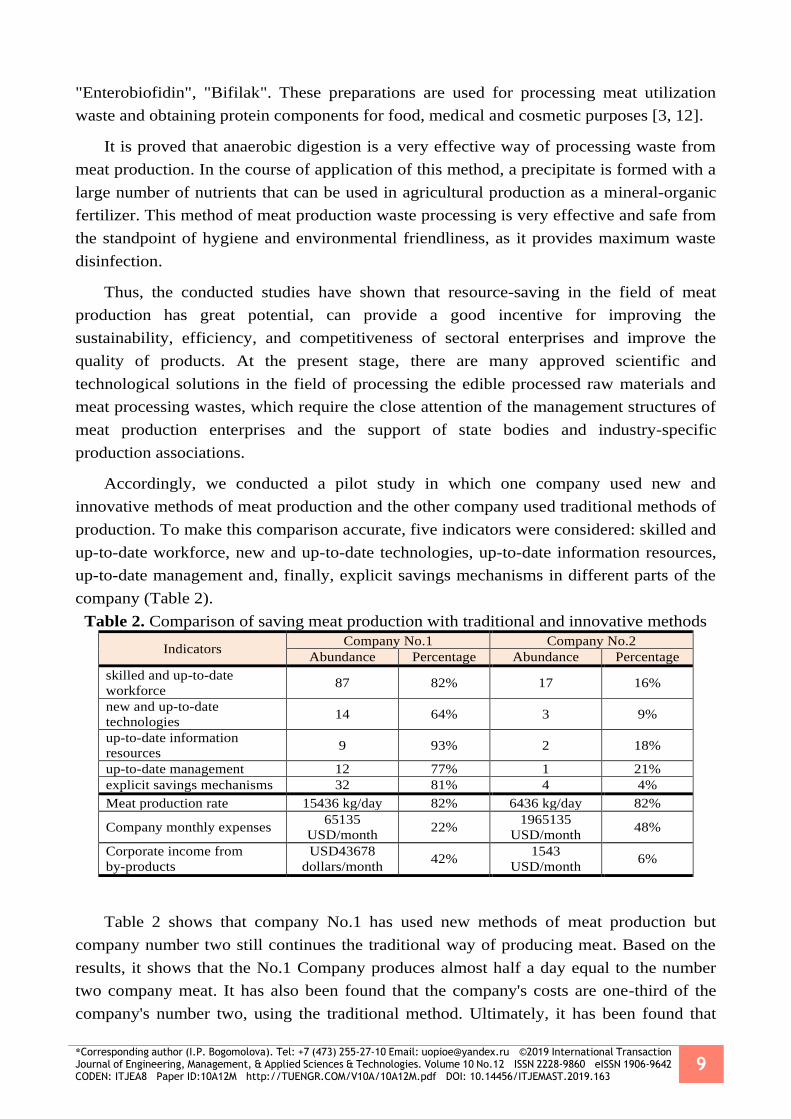
*Corresponding author (I.P. Bogomolova). Tel: +7 (473) 255-27-10 Email: [email protected] ©2019 International Transaction Journal of Engineering, Management, & Applied Sciences & Technologies. Volume 10 No.12 ISSN 2228-9860 eISSN 1906-9642 CODEN: ITJEA8 Paper ID:10A12M http://TUENGR.COM/V10A/10A12M.pdf DOI: 10.14456/ITJEMAST.2019.163
9
"Enterobiofidin", "Bifilak". These preparations are used for processing meat utilization
waste and obtaining protein components for food, medical and cosmetic purposes [3, 12].
It is proved that anaerobic digestion is a very effective way of processing waste from
meat production. In the course of application of this method, a precipitate is formed with a
large number of nutrients that can be used in agricultural production as a mineral-organic
fertilizer. This method of meat production waste processing is very effective and safe from
the standpoint of hygiene and environmental friendliness, as it provides maximum waste
disinfection.
Thus, the conducted studies have shown that resource-saving in the field of meat
production has great potential, can provide a good incentive for improving the
sustainability, efficiency, and competitiveness of sectoral enterprises and improve the
quality of products. At the present stage, there are many approved scientific and
technological solutions in the field of processing the edible processed raw materials and
meat processing wastes, which require the close attention of the management structures of
meat production enterprises and the support of state bodies and industry-specific
production associations.
Accordingly, we conducted a pilot study in which one company used new and
innovative methods of meat production and the other company used traditional methods of
production. To make this comparison accurate, five indicators were considered: skilled and
up-to-date workforce, new and up-to-date technologies, up-to-date information resources,
up-to-date management and, finally, explicit savings mechanisms in different parts of the
company (Table 2).
Table 2. Comparison of saving meat production with traditional and innovative methods
Indicators Company No.1 Company No.2
Abundance Percentage Abundance Percentage
skilled and up-to-date
workforce 87 82% 17 16%
new and up-to-date
technologies 14 64% 3 9%
up-to-date information
resources 9 93% 2 18%
up-to-date management 12 77% 1 21%
explicit savings mechanisms 32 81% 4 4%
Meat production rate 15436 kg/day 82% 6436 kg/day 82%
Company monthly expenses 65135
USD/month 22%
1965135
USD/month 48%
Corporate income from
by-products
USD43678
dollars/month 42%
1543
USD/month 6%
Table 2 shows that company No.1 has used new methods of meat production but
company number two still continues the traditional way of producing meat. Based on the
results, it shows that the No.1 Company produces almost half a day equal to the number
two company meat. It has also been found that the company's costs are one-third of the
company's number two, using the traditional method. Ultimately, it has been found that
10 I.P. Bogomolova, A.V. Kotarev, A.N. Prostenko, A.I. Dobrunova, D. Yu. Chugay.
using innovative, innovative meat production methods has boosted the number one
earnings of the byproducts so that 42% of the company's total revenue is from the
byproducts, while the number two is only 6% of its revenue comes from by-products.
5. CONCLUSION
It follows from the above that in the current market conditions the problem of increasing
the resource efficiency level in the food industry and in particular at meat production
enterprises is very important and relevant. Maintaining a focus on the advantages of high
resource provision (availability of cheap labor; significant reserves of natural resources;
lack of obvious competition in the aspect of this system of organization of the production
process; lack of funds and interest of company management; low level of interaction and
cooperation between production systems and scientific organizations; low indicators of
approbation and assimilation of advanced technologies by enterprises in the field of
innovative resource-saving) may have a negative synergistic effect on the stability and
efficiency of functioning of the whole meat production, as well as the entire agro-industrial
complex of the Russian Federation. In the end, all this can lead to significant social,
economic and environmental tensions throughout the national economy. In these
circumstances, a transition to a resource-saving innovative type of development in all
industry segments of the agro-industrial complex is required. This approach should be based
on such tools as scientific developments and knowledge, labour, technical and
technological, innovation and investment, informational, organizational and managerial
resources. All this, ultimately, will activate innovative solutions that are directly related to
the priority role of developing a resource-saving mechanism and solving current social and
economic problems of modern meat production.
6. REFERENCES
[1] Avtonomov, V. Ananyina, O. & Makasheva, N. (2000). Features of the resource-saving system
development: a tutorial. Moscow. : INFRA-M, 784 p.
[2] Alabugin, A., & Topuzov, N. (2008). Principles of the resource saving mechanism formation.
Bulletin of the Chelyabinsk State University, 29,11-13.
[3] Bogomolova, I. P. & Pasynkova, O. M. (2004). Organizational and Economic Aspects of
Sustainable Development of Enterprises Based on Resource Saving. Voronezh: Voronezh State
Technical Academy Publishing House, 175 p.
[4] Bogomolova, I. P. & Pigunova, M. V. (2005). Increasing the efficiency of small enterprises
through the optimization of resource provision (using public catering enterprises as an
example). Voronezh: municipal educational institution “Voronezh Economics and Law
Institute”, 160 p.
[5] Bogomolova, I. P., Kulneva, N. G., & Mantulin, A. M. (2012). Scientific and methodological
approaches to the management of resource saving in the sugar industry: monograph. Voronezh:
Center of Scientific and Technical Information, 185 p.

*Corresponding author (I.P. Bogomolova). Tel: +7 (473) 255-27-10 Email: [email protected] ©2019 International Transaction Journal of Engineering, Management, & Applied Sciences & Technologies. Volume 10 No.12 ISSN 2228-9860 eISSN 1906-9642 CODEN: ITJEA8 Paper ID:10A12M http://TUENGR.COM/V10A/10A12M.pdf DOI: 10.14456/ITJEMAST.2019.163
11
[6] Vorotnikov, I. L., Petrov, K. A., & Kononykhin, V. V. (2010). Resource-Saving Development
of Processing Industries in the Agro-Industrial Complex. Economics of Agricultural and
Processing Enterprises, 10, 21-23
[7] Gizyatov, I. (2011). Resource Saving and Transparency of the Economy in the Context of the
Institutional Paradigm. Problems of the modern economy, 1, 27-28.
[8] Dobrunova, A. I., Oliva, L. V., & Sidorenko, A. A. (2015). From the greening of land use to the
production of environmentally friendly products and to the sustainable development of rural
areas. Kazanskaya nauka, 10, 127-130.
[9] Turyansky, A. V., Uzhik, V. I., Dobrunova, A. I., & Dorofeev, A. F. (2011). Program and
model of development for the natural products sector in the Belgorod region. Guidelines.
Belgorod: Federal State Educational Establishment of Higher Professional Education
“Belgorod State Agricultural Academy”, 112 p.
[10] Shindin S. А. (2011). The efficiency of complex use of secondary raw materials in the meat
processing industry. Economy of agricultural and processing enterprises, 5, 40-42.
[11] Shumak, Zh. G., & Oreshnikova, O. V. (2011). Problems of resource saving in enterprises of
the meat processing industry in the context of their innovative development. Young Scientist,
5, 427-430. - URL: https://moluch.ru/archive/52/6783.
[12] Shugurova, T. B. (2011). Resource-saving technologies in meat processing, Meat technologies,
11. - URL: http://www.meatbranch.com/publ/view/497.html.
[13] Andrizhievskii, A. A., & Volodin, V. I. (2005). Energy saving and energy control. Minsk,
Vysheishaia shkola Publ, 294 p.
[14] Danilov, O. L., & Kostiuchenko, P. A. (2006). Practical manual on selection and development
of energy saving projects. Moscow, ZAO «Tekhnopromstroi», 668 p.
[15] Gorshenin, V. P., Rezanovich, I. V. Management of resource-saving behavior of personnel at
industrial enterprises // Scientific journal Modern problems of science and education.
[Electronic resource]. URL: https://science-education.ru/en/article/view?id=15178.
[16] Iarullina G. R. Control of energy saving at an industrial enterprise. Kazan, 2003. 111 p.
[17] Ashmarina, S., Lubnina, A., Shinkevich, M., Zaitseva, N., Sayfutdinova, G., & Ishmuradova, I.
(2016). Resource saving innovative forms of the industrial enterprises. International Journal of
economics and financial issues, 6(2), 479-483.
[18] Mataras, E. V., & Olekhnovich L. V. (2007). Realization of the basic processes of energy
conservation in the Republic of Belarus. Studencheskii Vestnik, no. 10:
http://www.bru.mogilev.by.
[19] Novikova, L. V. (2012). Methods of assessment of resource-saving potential in the food
industr. Izvestiya Tulgu. Economic and Legal Sciences, 1, 748-754 p.
[20] Zakharchenko, O. V. (2015). Management of resource saving at the enterprise. Ринкова
економіка: сучасна теорія і практика управління, (14, вип. 2), 134-139.
[21] Merenkov, I. N., Turyansky, A. V., Dobrunova, A. I., Prostenko, A. N., & Oliva, L. V. (2018).
State support improvement for ecological land-use in terms of transition to rural territory

12 I.P. Bogomolova, A.V. Kotarev, A.N. Prostenko, A.I. Dobrunova, D. Yu. Chugay.
sustainable development. Revista Amazonia Investiga, 7(15), 13-19.
[22] Zhizhin, A. A. (2006). Management of investments into new energy-saving technologies in the
industry. Oryol, OrelGTU. 22 p.
Professor Dr.Irina Bogomolova is Professor and Head of the Department of Management, organization of production and industry economy, Voronezh state University of engineering technologies (VSUIT), Russia. She has a Doctor of Economic Sciences degree. She is a Member of the academic Council of VSUIT, a member of the scientific and methodological Council of the University, Chairman of the editorial and publishing economic section, a member of the faculty of Economics and management. She is a co-executor of the grant "inter-Sectoral economic cooperation of enterprises (organizations) of grain products subcomplex in the conditions of modern agro-industrial policy" (NAO "Kazakh National Agrarian University"), the Republic of Kazakhstan.
Alexander Kotarev is an Associate Professor of the Department of Management and marketing in the Agroindustrial Complex, Voronezh State Agrarian University named after Emperor Peter I (Voronezh State Agrarian University), Russia. He is a Candidate of Economic Sciences He is the Head of the Center of Distance Educational Technologies of Voronezh State Agrarian University. His specialization is in International Business.
Dobrunova Alina I. is an Associate Professor at the Department of Economic Theory and Economics of Agriculture, Belgorod State Agricultural University named after V. Gorin. She is a Candidate of Sociological Sciences. She engaged in scientific activities with a focus on Management of Sustainable Rural Development.
Prostenko Alexander N. is an Associate Professor at the Department of Economic Theory and Economics of agriculture, Federal State Budgetary Educational Institution of Higher Education «Belgorod State Agricultural University named after V. Gorin, Russia. He is a Candidate of Economic Sciences. Не holds the position of First Vice-Rector. He is an expert in the field of Economics and Management of Rural Development.
Dmitriy Chugay is an Associate Professor at the Department of Economic Theory and Economics of the Agro-Industrial Complex, Belgorod State Agrarian University named after V.Ya. Gorin, Russian Federation. He is a specialist in Economics and Management and an Expert in the Dairy-Productive Subcomplex.
*Corresponding author (Khalid Mahmood). Tel: +92-3067939087. E-mail: [email protected] ©2019 International
Transaction Journal of Engineering, Management, & Applied Sciences & Technologies. Volume 10 No.12 ISSN 2228-9860 eISSN 1906-9642 CODEN: ITJEA8 Paper ID:10A12N http://TUENGR.COM/V10A/10A12N.pdf DOI: 10.14456/ITJEMAST.2019.164
1
International Transaction Journal of Engineering, Management, & Applied Sciences & Technologies
http://TuEngr.com
PAPER ID: 10A12N
PERSONALITY AND POST-PURCHASE CONSUMER
REGRET EXPERIENCED AFTER IMPULSE BUYING:
A CROSS-THEORETICAL APPROACH WITH
INDIVIDUAL DIFFERENCES MODERATOR
Khalid Mahmood a*, Muhammad Amir Rashid a, Ghulam Hussain a
a COMSATS University Islamabad, Lahore Campus, PAKISTAN.
A R T I C L E I N F O
A B S T R A C T Article history: Received 24 May 2019
Received in revised form 22
July 2019
Accepted 01 August 2019
Available online 07 August
2019
Keywords: Five-factor model;
Impulse buying;
Personality traits;
Neuroticism;
Maximization consumer;
Post-purchase regret;
Consumer buying regret.
This study assessed that how five-factor model (FFM) can assume
an important role in elaborating the relationship between impulse buying
and post-purchase regret by incorporating assumptions from theory of
social learning and imitation, social judgment theory and theory of
collectivistic culture. Consumer literature and marketing categorize
impulse buying behavior (IBB) as fragmented concept which needs to
be mustered cross theoretically at post-purchase phase. The literature
regarding personality, impulse buying behavior and Post-Purchase
Consumer Regret (PPCR) is reviewed and the research revealed
relationship between personality traits, impulse buying behavior and
post- purchase regret. But there is a little evidence for individual
differences variables exploited as moderators between personality traits
and post-purchase consumer regret. The study adopted convenience
sampling and was concluded by suggesting relationship between FFM
and post-purchase consumer regret moderated by maximization.
© 2019 INT TRANS J ENG MANAG SCI TECH.
SYMBOLS AND ABBREVIATIONS Ag Agreeableness,
Cons Conscientiousness,
DD Decision difficulty (Max),
Ex Extraversion,
FFM Five factor model,
HS High standards,
IBB Impulse buying behavior,
Max Maximization, (Max),
Neuro Neuriticism,
Open Openness to experience,
PPCR Post-purchase consumer regret,
PPCRFA Post-purchase consumer regret due to forgone alternatives.
©2019 International Transaction Journal of Engineering, Management, & Applied Sciences & Technologies
2 Khalid Mahmood, Muhammad Amir Rashid, Ghulam Hussain
1. INTRODUCTION Post-purchase consumer regret (PPCR) is described as psychological discomfort of consumer
based on consequence of purchase decision (Sweeney et al., 2000). Baumeister (2002) found that
post-purchase regret might be induced in the consumers within same day or later after impulse buying
because they were unable to resist the factors which caused impulsive buying behavior. Post-
purchase regret has been of major interest to marketers because they are always keen to know the
influential factors which trigger consumers to buy more(Bui et al., 2011). Regret theory was initially
developed by considering negative emotion theories explaining that the regret is an outcome of
choosing among plenty of available alternatives (Zeelenberg & Pieters, 2004). In fact, regret theory
concentrated on a process of decision making which is marked as irrational (Loomes & Sugden,
1982). Negative problems were observed in 80 percent consumers after impulse buying Rook (1987).
Kalla and Arora (2011) suggested that existing theories in psychology, marketing and economics did
not provide a complete insight about impulse buying behavior and the phenomenon becomes more
complex in South Asia. The scholars were also of the view that it needed to be explored in sub-
continent as most of the studies are conducted in the West. Further, the post-purchase behavioral
phase calls for more work in impulse buying literature to better understand it as predictor, process
and outcome based on inter-disciplinary theoretical perspective. It is a viable initiative which is
required to be expanded and tested in real life situations (Xiao & Nicholson, 2013). Hence, this study
has drawn assumption form theory of social learning and imitation Miller and Dollard (1941), social
judgment theory Sherif and Hovland (1961) and theory of collectivistic culture (Triandis, 1995).
Personality traits have attained much importance in the area of consumer behavior as researchers are
trying to discover the relationship between excessive buying and personality traits (Mueller et al.,
2010; Rose, 2007). Hence, Otero-López and Villardefrancos (2013) has used FFM personality traits
as antecedents of excessive buying based on impulsiveness. Dispositions and personality affect
maximization tendency of an individual and positive or negative life outcomes have been attributed
to personality traits in different previous studies (Purvis et al., 2011). The scholars proposed that
maximization reflected the dimensions of FFM model. Similarly, while determining the predictors of
maximization with reference to personality, it was interesting to note that conscientiousness did not
appear as a valid predictor of maximization as it was supposed to be. Rather, the strongest predictor
was neuroticism along with openness. Moreover, maximizers also suffer emotional cost due to stress
and anxiety induced choices (Purvis et al., 2011; Shiloh et al., 2001). But the question remains that
which personality trait accounts for more poorer life consequences (Dar-Nimrod et al., 2009). This
provided sufficient evidence to state the research objective as to establish maximization as moderator
between personality and post-purchase consumer regret experienced after impulse buying
simultaneously with cross-theoretical underpinning. Beatty and Ferrell (1998) laid down the basic
definition of impulse buying as instant purchasing activity without any planning, irrelevant of
realizing or satisfying a desire. Consequently, this type of regret experienced after an impulsive
purchase needs to be further explored (Ozer & Gultekin, 2015).
But literature of the last decade shows that impulsivity is deeply rooted in personality of the
people (Verplanken & Herabadi, 2001). So, a great attention is being paid to the psychological
constructs in the recent years which may affect impulse buying behavior and a huge research volume
is available in this regard (Dhaundiyal & Coughlan, 2009; Franken et al., 2008; Russo et al., 2008;
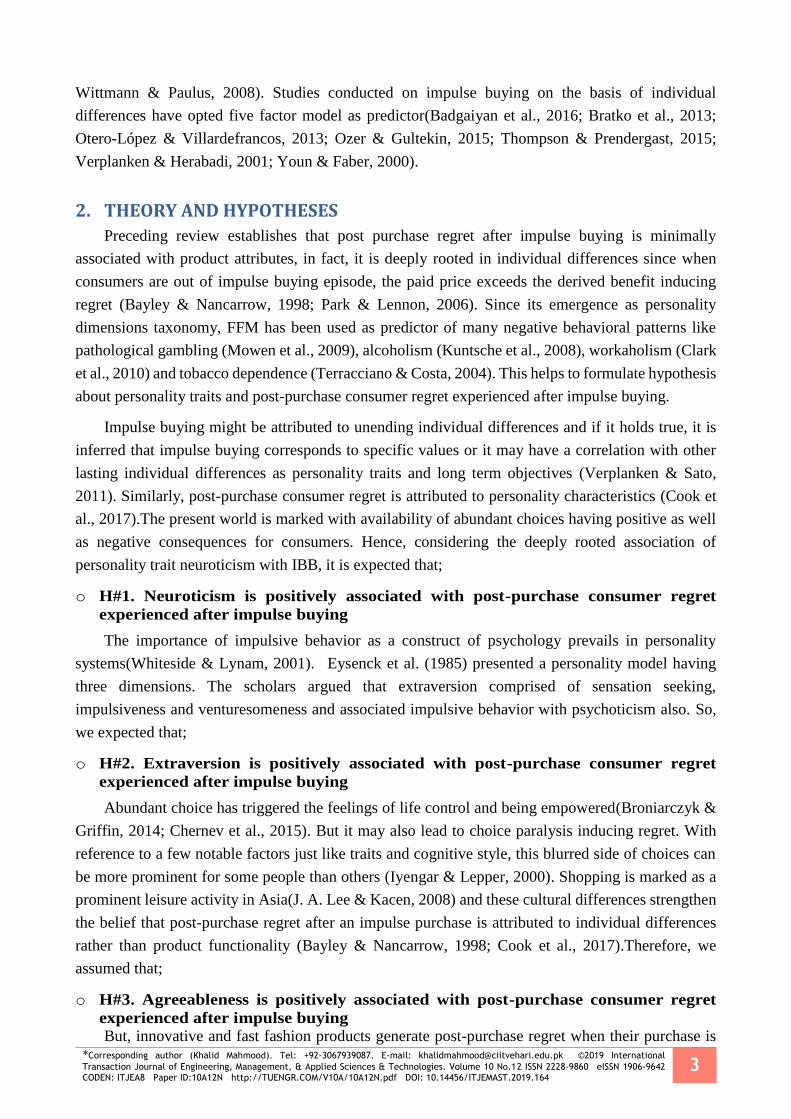
*Corresponding author (Khalid Mahmood). Tel: +92-3067939087. E-mail: [email protected] ©2019 International
Transaction Journal of Engineering, Management, & Applied Sciences & Technologies. Volume 10 No.12 ISSN 2228-9860 eISSN 1906-9642 CODEN: ITJEA8 Paper ID:10A12N http://TUENGR.COM/V10A/10A12N.pdf DOI: 10.14456/ITJEMAST.2019.164
3
Wittmann & Paulus, 2008). Studies conducted on impulse buying on the basis of individual
differences have opted five factor model as predictor(Badgaiyan et al., 2016; Bratko et al., 2013;
Otero-López & Villardefrancos, 2013; Ozer & Gultekin, 2015; Thompson & Prendergast, 2015;
Verplanken & Herabadi, 2001; Youn & Faber, 2000).
2. THEORY AND HYPOTHESES
Preceding review establishes that post purchase regret after impulse buying is minimally
associated with product attributes, in fact, it is deeply rooted in individual differences since when
consumers are out of impulse buying episode, the paid price exceeds the derived benefit inducing
regret (Bayley & Nancarrow, 1998; Park & Lennon, 2006). Since its emergence as personality
dimensions taxonomy, FFM has been used as predictor of many negative behavioral patterns like
pathological gambling (Mowen et al., 2009), alcoholism (Kuntsche et al., 2008), workaholism (Clark
et al., 2010) and tobacco dependence (Terracciano & Costa, 2004). This helps to formulate hypothesis
about personality traits and post-purchase consumer regret experienced after impulse buying.
Impulse buying might be attributed to unending individual differences and if it holds true, it is
inferred that impulse buying corresponds to specific values or it may have a correlation with other
lasting individual differences as personality traits and long term objectives (Verplanken & Sato,
2011). Similarly, post-purchase consumer regret is attributed to personality characteristics (Cook et
al., 2017).The present world is marked with availability of abundant choices having positive as well
as negative consequences for consumers. Hence, considering the deeply rooted association of
personality trait neuroticism with IBB, it is expected that;
o H#1. Neuroticism is positively associated with post-purchase consumer regret
experienced after impulse buying
The importance of impulsive behavior as a construct of psychology prevails in personality
systems(Whiteside & Lynam, 2001). Eysenck et al. (1985) presented a personality model having
three dimensions. The scholars argued that extraversion comprised of sensation seeking,
impulsiveness and venturesomeness and associated impulsive behavior with psychoticism also. So,
we expected that;
o H#2. Extraversion is positively associated with post-purchase consumer regret
experienced after impulse buying
Abundant choice has triggered the feelings of life control and being empowered(Broniarczyk &
Griffin, 2014; Chernev et al., 2015). But it may also lead to choice paralysis inducing regret. With
reference to a few notable factors just like traits and cognitive style, this blurred side of choices can
be more prominent for some people than others (Iyengar & Lepper, 2000). Shopping is marked as a
prominent leisure activity in Asia(J. A. Lee & Kacen, 2008) and these cultural differences strengthen
the belief that post-purchase regret after an impulse purchase is attributed to individual differences
rather than product functionality (Bayley & Nancarrow, 1998; Cook et al., 2017).Therefore, we
assumed that;
o H#3. Agreeableness is positively associated with post-purchase consumer regret
experienced after impulse buying
But, innovative and fast fashion products generate post-purchase regret when their purchase is
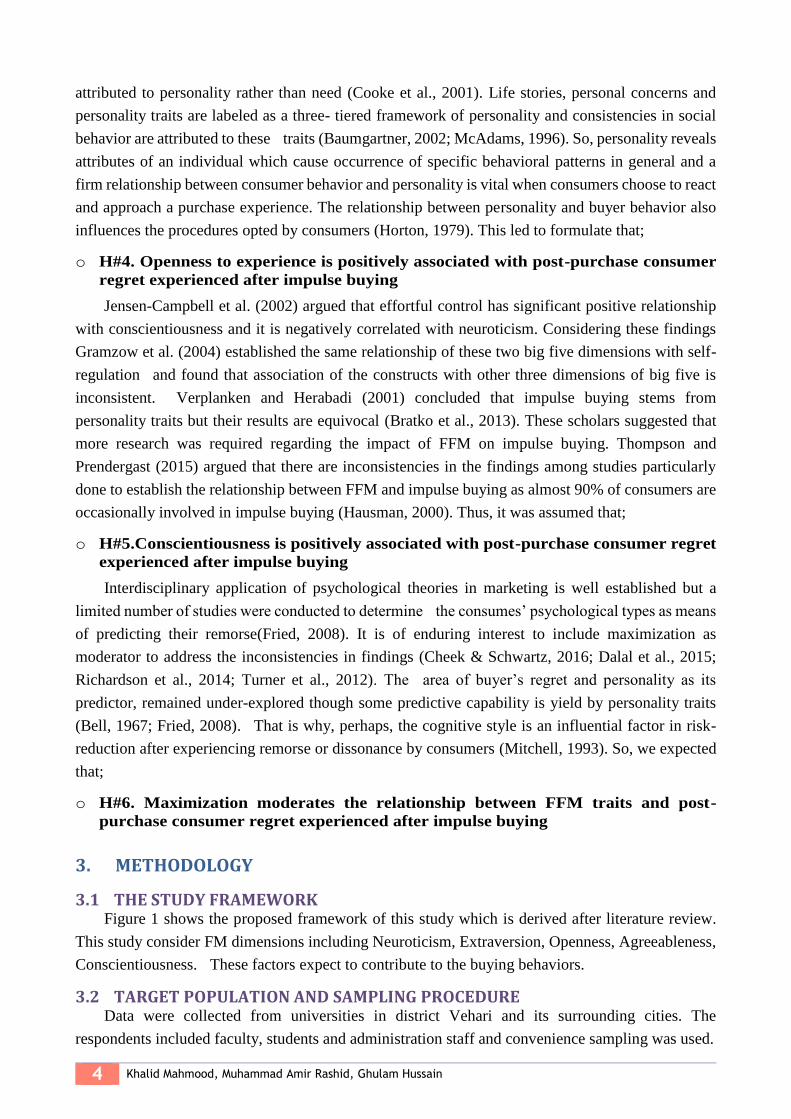
4 Khalid Mahmood, Muhammad Amir Rashid, Ghulam Hussain
attributed to personality rather than need (Cooke et al., 2001). Life stories, personal concerns and
personality traits are labeled as a three- tiered framework of personality and consistencies in social
behavior are attributed to these traits (Baumgartner, 2002; McAdams, 1996). So, personality reveals
attributes of an individual which cause occurrence of specific behavioral patterns in general and a
firm relationship between consumer behavior and personality is vital when consumers choose to react
and approach a purchase experience. The relationship between personality and buyer behavior also
influences the procedures opted by consumers (Horton, 1979). This led to formulate that;
o H#4. Openness to experience is positively associated with post-purchase consumer
regret experienced after impulse buying
Jensen-Campbell et al. (2002) argued that effortful control has significant positive relationship
with conscientiousness and it is negatively correlated with neuroticism. Considering these findings
Gramzow et al. (2004) established the same relationship of these two big five dimensions with self-
regulation and found that association of the constructs with other three dimensions of big five is
inconsistent. Verplanken and Herabadi (2001) concluded that impulse buying stems from
personality traits but their results are equivocal (Bratko et al., 2013). These scholars suggested that
more research was required regarding the impact of FFM on impulse buying. Thompson and
Prendergast (2015) argued that there are inconsistencies in the findings among studies particularly
done to establish the relationship between FFM and impulse buying as almost 90% of consumers are
occasionally involved in impulse buying (Hausman, 2000). Thus, it was assumed that;
o H#5.Conscientiousness is positively associated with post-purchase consumer regret
experienced after impulse buying
Interdisciplinary application of psychological theories in marketing is well established but a
limited number of studies were conducted to determine the consumes’ psychological types as means
of predicting their remorse(Fried, 2008). It is of enduring interest to include maximization as
moderator to address the inconsistencies in findings (Cheek & Schwartz, 2016; Dalal et al., 2015;
Richardson et al., 2014; Turner et al., 2012). The area of buyer’s regret and personality as its
predictor, remained under-explored though some predictive capability is yield by personality traits
(Bell, 1967; Fried, 2008). That is why, perhaps, the cognitive style is an influential factor in risk-
reduction after experiencing remorse or dissonance by consumers (Mitchell, 1993). So, we expected
that;
o H#6. Maximization moderates the relationship between FFM traits and post-
purchase consumer regret experienced after impulse buying
3. METHODOLOGY
3.1 THE STUDY FRAMEWORK Figure 1 shows the proposed framework of this study which is derived after literature review.
This study consider FM dimensions including Neuroticism, Extraversion, Openness, Agreeableness,
Conscientiousness. These factors expect to contribute to the buying behaviors.
3.2 TARGET POPULATION AND SAMPLING PROCEDURE Data were collected from universities in district Vehari and its surrounding cities. The
respondents included faculty, students and administration staff and convenience sampling was used.
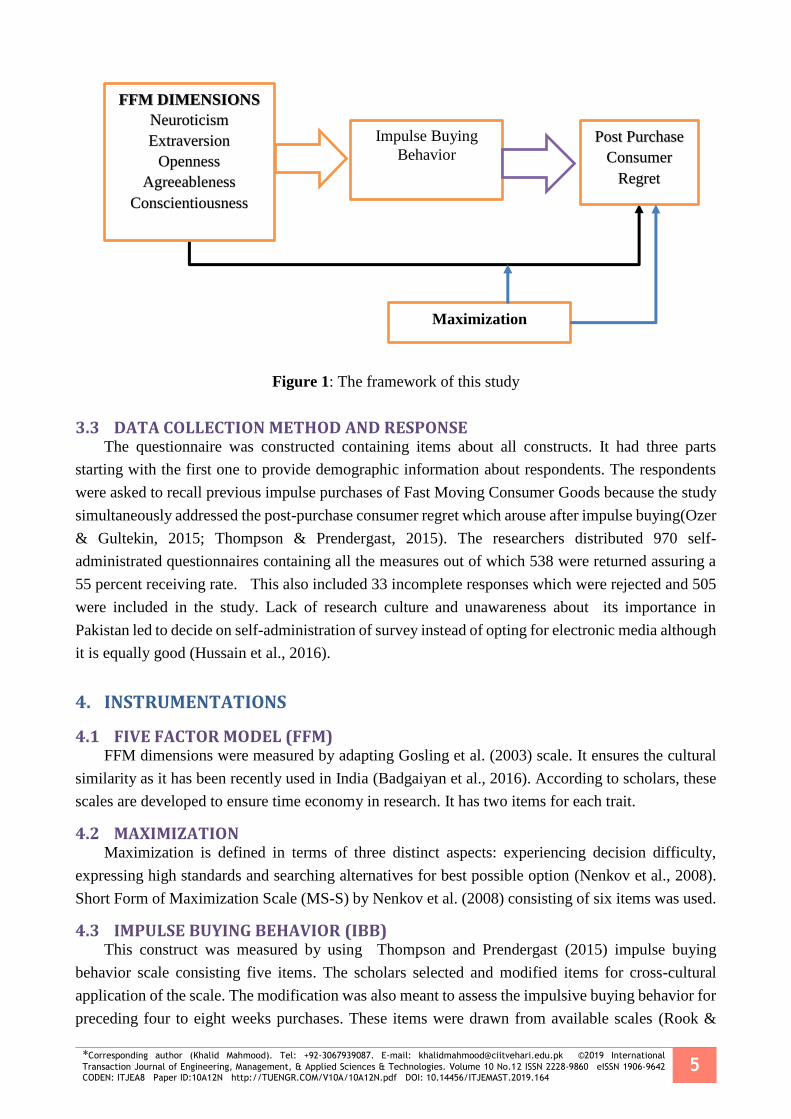
*Corresponding author (Khalid Mahmood). Tel: +92-3067939087. E-mail: [email protected] ©2019 International
Transaction Journal of Engineering, Management, & Applied Sciences & Technologies. Volume 10 No.12 ISSN 2228-9860 eISSN 1906-9642 CODEN: ITJEA8 Paper ID:10A12N http://TUENGR.COM/V10A/10A12N.pdf DOI: 10.14456/ITJEMAST.2019.164
5
Figure 1: The framework of this study
3.3 DATA COLLECTION METHOD AND RESPONSE The questionnaire was constructed containing items about all constructs. It had three parts
starting with the first one to provide demographic information about respondents. The respondents
were asked to recall previous impulse purchases of Fast Moving Consumer Goods because the study
simultaneously addressed the post-purchase consumer regret which arouse after impulse buying(Ozer
& Gultekin, 2015; Thompson & Prendergast, 2015). The researchers distributed 970 self-
administrated questionnaires containing all the measures out of which 538 were returned assuring a
55 percent receiving rate. This also included 33 incomplete responses which were rejected and 505
were included in the study. Lack of research culture and unawareness about its importance in
Pakistan led to decide on self-administration of survey instead of opting for electronic media although
it is equally good (Hussain et al., 2016).
4. INSTRUMENTATIONS
4.1 FIVE FACTOR MODEL (FFM) FFM dimensions were measured by adapting Gosling et al. (2003) scale. It ensures the cultural
similarity as it has been recently used in India (Badgaiyan et al., 2016). According to scholars, these
scales are developed to ensure time economy in research. It has two items for each trait.
4.2 MAXIMIZATION Maximization is defined in terms of three distinct aspects: experiencing decision difficulty,
expressing high standards and searching alternatives for best possible option (Nenkov et al., 2008).
Short Form of Maximization Scale (MS-S) by Nenkov et al. (2008) consisting of six items was used.
4.3 IMPULSE BUYING BEHAVIOR (IBB) This construct was measured by using Thompson and Prendergast (2015) impulse buying
behavior scale consisting five items. The scholars selected and modified items for cross-cultural
application of the scale. The modification was also meant to assess the impulsive buying behavior for
preceding four to eight weeks purchases. These items were drawn from available scales (Rook &
FFM DIMENSIONS
Neuroticism
Extraversion
Openness
Agreeableness
Conscientiousness
Impulse Buying
Behavior
Post Purchase
Consumer
Regret
Maximization
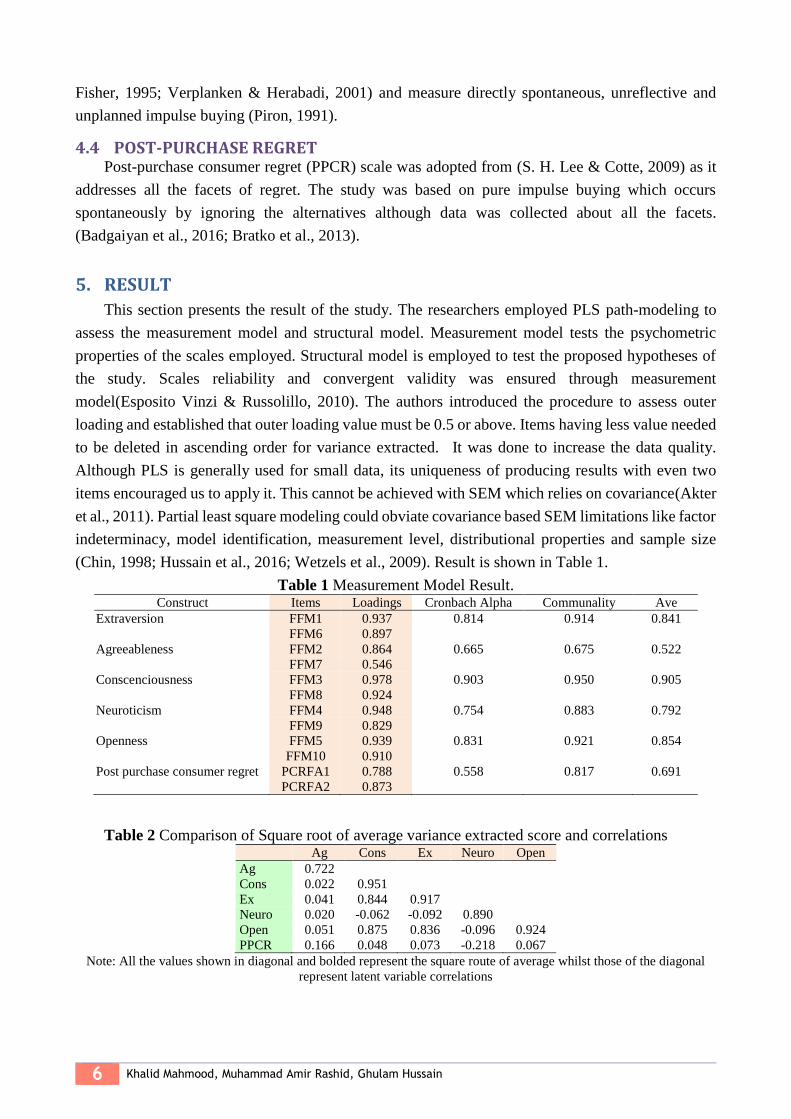
6 Khalid Mahmood, Muhammad Amir Rashid, Ghulam Hussain
Fisher, 1995; Verplanken & Herabadi, 2001) and measure directly spontaneous, unreflective and
unplanned impulse buying (Piron, 1991).
4.4 POST-PURCHASE REGRET Post-purchase consumer regret (PPCR) scale was adopted from (S. H. Lee & Cotte, 2009) as it
addresses all the facets of regret. The study was based on pure impulse buying which occurs
spontaneously by ignoring the alternatives although data was collected about all the facets.
(Badgaiyan et al., 2016; Bratko et al., 2013).
5. RESULT
This section presents the result of the study. The researchers employed PLS path-modeling to
assess the measurement model and structural model. Measurement model tests the psychometric
properties of the scales employed. Structural model is employed to test the proposed hypotheses of
the study. Scales reliability and convergent validity was ensured through measurement
model(Esposito Vinzi & Russolillo, 2010). The authors introduced the procedure to assess outer
loading and established that outer loading value must be 0.5 or above. Items having less value needed
to be deleted in ascending order for variance extracted. It was done to increase the data quality.
Although PLS is generally used for small data, its uniqueness of producing results with even two
items encouraged us to apply it. This cannot be achieved with SEM which relies on covariance(Akter
et al., 2011). Partial least square modeling could obviate covariance based SEM limitations like factor
indeterminacy, model identification, measurement level, distributional properties and sample size
(Chin, 1998; Hussain et al., 2016; Wetzels et al., 2009). Result is shown in Table 1.
Table 1 Measurement Model Result. Construct Items Loadings Cronbach Alpha Communality Ave
Extraversion FFM1 0.937 0.814 0.914 0.841
FFM6 0.897
Agreeableness FFM2 0.864 0.665 0.675 0.522
FFM7 0.546
Conscenciousness FFM3 0.978 0.903 0.950 0.905
FFM8 0.924
Neuroticism FFM4 0.948 0.754 0.883 0.792
FFM9 0.829
Openness FFM5 0.939 0.831 0.921 0.854
FFM10 0.910
Post purchase consumer regret PCRFA1 0.788 0.558 0.817 0.691
PCRFA2 0.873
Table 2 Comparison of Square root of average variance extracted score and correlations Ag Cons Ex Neuro Open
Ag 0.722
Cons 0.022 0.951
Ex 0.041 0.844 0.917
Neuro 0.020 -0.062 -0.092 0.890
Open 0.051 0.875 0.836 -0.096 0.924
PPCR 0.166 0.048 0.073 -0.218 0.067
Note: All the values shown in diagonal and bolded represent the square route of average whilst those of the diagonal
represent latent variable correlations

*Corresponding author (Khalid Mahmood). Tel: +92-3067939087. E-mail: [email protected] ©2019 International
Transaction Journal of Engineering, Management, & Applied Sciences & Technologies. Volume 10 No.12 ISSN 2228-9860 eISSN 1906-9642 CODEN: ITJEA8 Paper ID:10A12N http://TUENGR.COM/V10A/10A12N.pdf DOI: 10.14456/ITJEMAST.2019.164
7
5.1 MODEL EVALUATIONS
5.1.1 MEASUREMENT MODEL
Discriminant validity was observed for assurance of external consistency of this model. In this
context, Table 2 shows the latent variable comparison where AVE of variables is computed:
agreeableness (Ag) = 0.722, conscientiousness (Cons) = 0.951, extraversion (Ex) = 0.917,
neuroticism (Neuro)= 0.890, openness (Open)= 0.924.
5.1.2 STRUCTURAL MODEL
Direct relationship of the study constructs is computed in PLS. It reveals analysis of inner
modeling. It tells about relationship dependency in hypothesized model under study(Hair et al., 2006).
Agarwal and Karahanna (2000) suggested that path coefficients were equal to regression and beta
coefficients. Model significance is decided on the premise of t-values and regression beta values and
if it is above 1.64, it is assumed to be significant (Henseler et al., 2014). This value helps in deciding
on suggested hypothesis (Figure 1).
Figure 2: Measurement Model
All the rejected hypothesis contain t-value less than 1.64and accepted hypothesis have a t-value
of above1.64. It is illustrated in Table 3. Figure 2 demonstrates t-values subsequent to bootstrapping.
Table 3: Hypothesis (Direct Effects). Path Coeeficients Standard Error (STERR) T Statistics (|O/STERR|) Decision
Ag -> PPCR 0.168 0.049 3.309 Supported
Cons -> PPCR -0.036 0.116 0.313 Not supported
Ex -> PPCR 0.062 0.083 0.747 Not supported
Neuro -> PPCR -0.217 0.041 5.502 Supported
Open -> PPCR 0.017 0.098 0.173 Not supported

8 Khalid Mahmood, Muhammad Amir Rashid, Ghulam Hussain
Figure 3: Structural Model.
5.1.3 MODERATING EFFECTS
Smart PLS 2.0 M3 requires to create direct relationship between moderator and criterion variable
which are maximization and post-purchase consumer regret respectively. This led to calculating
both direct effect and moderating effect for improving the study. Beta coefficients were obtained by
running PLS algorithm and results are shown in Table 4. Regarding the hypothesis testing the
researchers applied method of bootstrapping. As depicted in Table 4, out of five interaction
hypothesis two hypothesis are significant at t-value above 1.64 and three hypothesis are in- significant
having t-value below 1.64. Comparison of Figures 2 and 5 reveals that the value of post purchase
consumer regret is increased from 0.134 to 0.155 after induction of maximization as moderator
between FFM personality traits and post-purchase consumer regret. Figure 4 shows interaction term.
Table 4 Hypothesis (Indirect)
Path
Coefficients
Standard Error
(STERR)
T Statistics
(|O/STERR|) Decision
Ag * Max PPCR -0.121 0.176 0.691 Not supported
Cons * Max PPCR -1.142 0.559 2.043 Supported
Ex * Max PPCR 0.280 0.428 0.654 Not supported
Neuro * Max PPCR 0.055 0.118 0.463 Not Supported
Open * Max PPCR 1.205 0.590 2.040 Supported
Figure 4: Interaction Term

*Corresponding author (Khalid Mahmood). Tel: +92-3067939087. E-mail: [email protected] ©2019 International
Transaction Journal of Engineering, Management, & Applied Sciences & Technologies. Volume 10 No.12 ISSN 2228-9860 eISSN 1906-9642 CODEN: ITJEA8 Paper ID:10A12N http://TUENGR.COM/V10A/10A12N.pdf DOI: 10.14456/ITJEMAST.2019.164
9
Figure 5: Bootstrapping Model.
6. DISCUSSION
FFM has particularly been used and proved as an antecedent of excessive buying and other
negative behavioral outcomes (Clark et al., 2010; Kuntsche et al., 2008; Otero-López &
Villardefrancos, 2013).Further, FFM personality traits particularly neuroticism and conscientiousness
and generally the remaining three are predictors of maximization which is negatively associated with
customer satisfaction (Cheek & Schwartz, 2016; Nenkov et al., 2008; Purvis et al., 2011). FFM
successfully predicted the impulse buying when studied with trait affect having positive or negative
dimensions (Stafford et al., 2010). A relationship by simultaneously linking five factor model with
impulse buying behavior and post-purchase consumer regret experienced after it might be influential
as buyers within the same day or long after an impulse purchase may experience post-purchase
regret because they were unable to resist stimuli causing impulse buying. Dispositions and personality
affect maximization tendency of an individual and positive or negative life outcomes have been
attributed to personality traits in different previous studies (Purvis et al., 2011). Among individual
differences factors, maximization (choosing the best) has emerged as important measures associated
with personality in the contemporary era (Cheek & Schwartz, 2016; Schwartz et al., 2002). Recent
studies suggested exploiting individual differences moderators while using FFM as predictor of IBB
and negative behavioral outcomes at post-purchase level considering cross-theoretical perspective.
The theory of social learning and imitation argues that occurrence of observable behavior is not
possible in the absence of certain drives which are categorized as primary or secondary in nature.
During socialization process, imitation drive becomes its base. Hence, it is assumed that response
matching with others gains reward properties in itself and frequency of this reward determines the
intensity of occurrence of behavior. The consistency of the reward strongly maintains the imitation
drive. The theory established that other person’s behavior is a cue which induces internal response
resulting in a drive to act on the basis of previous reward strength. Drive reduction is achieved through
this imitative process(Miller & Dollard, 1941).
10 Khalid Mahmood, Muhammad Amir Rashid, Ghulam Hussain
Now considering Triandis (1995) definition of collectivism which categorized it as a social
pattern comprising of people who view themselves as bonded with groups, families and coworkers in
society, it is not surprising to note that personal attributes are withheld or repressed in collectivistic
cultures leading to create a weaker attitude–behavior and attitude-intention relationship and it remains
so for impulsivity also (Bagozzi et al., 2000; Kashima et al., 1992). But, individuals living in
collectivistic cultures rapidly change their impulse buying behavior driven by such social patterns as
normative evaluations and high standards (in-group goals and duties) in different situational contexts
(Triandis, 1995). Assumption from social judgment theory Sherif and Hovland (1961) is used here to
support the relationship between FFM and post-purchase consumer regret followed by impulse
buying. The theory assumes that individuals categorize and discriminate among stimuli either these
are attitudinal or neutral in nature. Sherif and Hovland (1961) proposed that “persons who are strongly
committed to positions use fewer categories than less involved persons and highly involved people
place a large number of items in unacceptable category”.
The literature review section supported the assumption by confirming realization of severe post-
purchase regret when there was sudden onset of impulse buying behavior. Thus, the study found
positive relationship between openness to experience and post-purchase consumer regret. This trait
has a comfortable tolerance characteristic accompanied by capability to accommodate information
and being impulsive(Costa & McCrae, 2008). Openness to experience is marked by being emotionally
rich and having a complex life due to deeply rooted sensitivity for beauty and art. These people are
undogmatic in their values and attitudes, they are behaviorally supple and curious in their intellect
(Costa Jr & McCrae, 1995). Their curiosity leads them to experience both positive and negative
emotional states more deeply in comparison with the people low on this dimension and who always
think conventionally (Lakhal et al., 2012; Matzler et al., 2006). They firmly consider the hedonic
values of products being purchased and their decision making styles are indicative of their motivation
and shopping behavior (DeYoung et al., 2005; Zurawicki, 2010). The relationship between
personality trait “openness to experience” and impulsive tendency buying is equivocal,(Badgaiyan
et al., 2016), so its relationship with post-purchase consumer regret was not only induced due to
what was purchased but also corresponded to what could have been purchased(S. H. Lee & Cotte,
2009). Purvis et al. (2011) explored that openness to experience was the strongest predictor of
maximization that is why the direct and interaction hypothesis are proved in the present study.
Following the scholars, maximization was aggregated into a single composite score and it is
positively associated with post- purchase consumer regret.
People high in conscientiousness are diligent and organized (Costa Jr & McCrae, 1995). Instead
of being spontaneous, these people exhibit controlled and planned social behavior and also try to be
perfect. They have the tendency to postpone emotional impulses and do not like to be impulsive
shoppers. But, at moments, these people are also involved in impulse purchases and feeling regret
emotions (Gohary & Hanzaee, 2014; Joshanloo et al., 2012; Zurawicki, 2010). Likely,
conscientiousness was also found positively correlated with post-purchase consumer regret although
consumers with this trait show a greater self-control yet the assumption from collectivistic culture
theory is proved that people in such culture change their impulsive behavior swiftly which results in
remorse(Novliadi et al., 2018).

*Corresponding author (Khalid Mahmood). Tel: +92-3067939087. E-mail: [email protected] ©2019 International
Transaction Journal of Engineering, Management, & Applied Sciences & Technologies. Volume 10 No.12 ISSN 2228-9860 eISSN 1906-9642 CODEN: ITJEA8 Paper ID:10A12N http://TUENGR.COM/V10A/10A12N.pdf DOI: 10.14456/ITJEMAST.2019.164
11
Neuroticism depicts psychiatric conditions of distress. People who score high on this dimension
are emotionally inconsistent and they frequently express worries and anxieties along with aches in
the body also. They also exhibit inappropriate behavior in social situations (Costa & Mccrae, 1992).
Johnson and Attmann (2009) revealed that neuroticism is also characterized by compulsive buying
which was a disturbing behavior. Further, as the level of neuroticism increases, the vulnerability to
impulsiveness and depression also increases leading to inappropriate decision making (Costa Jr &
McCrae, 1995). Thus, people who are oriented towards neuroticism remain preoccupied with the
current situation rather that rationalizing the decisions by considering past experiences or future
consequences (Chetthamrongchai & Davies, 2000). Hence, they are more likely to experience post-
purchase consumer regret but interaction hypothesis is rejected in this study while direct effect is
confirmed. The reason might be it emerged as a strongest predictor of searching alternatives in
literature (Purvis et al., 2011).
People high on agreeableness may form harmonious relations and in doing so they reject the
domineering perspective. They do not be suspicious, in fact they rely on others (Zurawicki, 2010).
People who are on the lower side of this dimension, they doubt unfamiliar things (Wang & Yang,
2008). They also possess tendencies to fall prey to negative emotional states (Ho et al., 2004).
Duijsens and Diekstra (1996) discovered that agreeableness and impulse buying are negatively
correlated but this claim lacks sufficient literature support (Balabanis, 2002; Wang & Yang, 2008).
Hence, its direct relationship with PPCR is supported but indirect relationship is not supported.
Pleasure and enjoyment are the most prominent in traits cluster which explains extraversion
dimension of personality (Costa Jr & McCrae, 1995; Costa & McCrae, 2008). Guido et al. (2007)
concluded that extraversions showed hedonic shopping attributes in their personality resulting in
abrupt decision-making. Extraversion is positively associated with impulsive buying tendency in
most of the studies (Badgaiyan et al., 2016). But surprisingly, Gohary and Hanzaee (2014) discovered
negative correlation between impulse buying and extraversion which needed to be tested in real life
situations. So, both direct as well as indirect relationship with PPCR is not supported.
7. CONCLUSION
Initially observed as exciting and enthusiastic activity providing feelings of happiness and delight
Weinberg and Gottwald (1982), IBB has gradually emerged as an uncontrollable regret inducing
phenomenon (Baumeister, 2002; Ozer & Gultekin, 2015). The focus has also shifted from product
characteristics to personality and individual differences as predictors and antecedents (Peck &
Childers, 2006; Rook & Gardner, 1993; Thompson & Prendergast, 2015; Verplanken et al., 2005).
Moreover, maximizers also suffer emotional cost due to stress and anxiety induced choices (Purvis
et al., 2011; Shiloh et al., 2001). Maximizers experienced more regret and post-decisional anxiety.
Poorer life consequences are attributable to traits (Dar-Nimrod et al., 2009). So, along with personal
fear of invalidity, personal need for structure and need for evaluation at antecedent level Badgaiyan
et al. (2016), it is expected that maximization intervenes as moderator between five factor model
personality traits and post-purchase consumer regret experienced after an impulse purchase. Facets
of maximization may generate matched-dependent behavior. Deep connectivity and social
embededness of consumers in collectivistic culture was witnessed by following high standards (HS)

12 Khalid Mahmood, Muhammad Amir Rashid, Ghulam Hussain
which are socially learned and consumers are in a state of decision difficulty(DD) by putting a large
number of items in unacceptable category during the purchase situation, and to avoid this difficulty,
drive reduction is achieved by matching the behavior (impulsively buying the product in this case)
which results in post-purchase consumer regret later on.
8. DATA AVAILABILITY AND MATERIAL
Data involved in this study can be requested to the corresponding author.
9. REFERENCES
Agarwal, R., & Karahanna, E. (2000). Time flies when you're having fun: Cognitive absorption and beliefs
about information technology usage. MIS quarterly, 665-694.
Akter, S., D'Ambra, J., & Ray, P. (2011). An evaluation of PLS based complex models: the roles of power
analysis, predictive relevance and GoF index.
Badgaiyan, A. J., Verma, A., & Dixit, S. (2016). Impulsive buying tendency: Measuring important
relationships with a new perspective and an indigenous scale. IIMB Management Review, 28(4),
186-199.
Balabanis, G. (2002). The relationship between lottery ticket and scratch-card buying behaviour,
personality and other compulsive behaviours. Journal of Consumer Behaviour.
Baumeister, R. F. (2002). Yielding to temptation: Self-control failure, impulsive purchasing, and
consumer behavior. Journal of consumer Research, 28(4), 670-676.
Baumgartner, H. (2002). Toward a personology of the consumer. Journal of consumer Research, 29(2),
286-292.
Bayley, G., & Nancarrow, C. (1998). Impulse purchasing: a qualitative exploration of the phenomenon.
Qualitative Market Research: An International Journal, 1(2), 99-114.
Beatty, S. E., & Ferrell, M. E. (1998). Impulse buying: Modeling its precursors. Journal of retailing,
74(2), 169-191.
Bell, G. D. (1967). The automobile buyer after the purchase. The Journal of Marketing, 12-16.
Bratko, D., Butkovic, A., & Bosnjak, M. (2013). Twin study of impulsive buying and its overlap with
personality. Journal of Individual Differences.
Broniarczyk, S. M., & Griffin, J. (2014). Decision difficulty in the age of consumer empowerment.
Bui, M., Krishen, A. S., & Bates, K. (2011). Modeling regret effects on consumer post-purchase decisions.
European Journal of Marketing, 45(7/8), 1068-1090.
Cheek, N. N., & Schwartz, B. (2016). On the meaning and measurement of maximization. Judgment and
Decision Making, 11(2), 126.
Chernev, A., Böckenholt, U., & Goodman, J. (2015). Choice overload: A conceptual review and meta-
analysis. Journal of Consumer Psychology, 25(2), 333-358.
Chetthamrongchai, P., & Davies, G. (2000). Segmenting the market for food shoppers using attitudes to
shopping and to time. British Food Journal, 102(2), 81-101.
Chin, W. W. (1998). The partial least squares approach to structural equation modeling. Modern methods
for business research, 295(2), 295-336.
*Corresponding author (Khalid Mahmood). Tel: +92-3067939087. E-mail: [email protected] ©2019 International
Transaction Journal of Engineering, Management, & Applied Sciences & Technologies. Volume 10 No.12 ISSN 2228-9860 eISSN 1906-9642 CODEN: ITJEA8 Paper ID:10A12N http://TUENGR.COM/V10A/10A12N.pdf DOI: 10.14456/ITJEMAST.2019.164
13
Clark, M. A., Lelchook, A. M., & Taylor, M. L. (2010). Beyond the Big Five: How narcissism,
perfectionism, and dispositional affect relate to workaholism. Personality and Individual
Differences, 48(7), 786-791.
Cook, S. C., Cook, S. C., Yurchisin, J., & Yurchisin, J. (2017). Fast fashion environments: consumer’s
heaven or retailer’s nightmare? International Journal of Retail & Distribution Management,
45(2), 143-157.
Cooke, A. D., Meyvis, T., & Schwartz, A. (2001). Avoiding future regret in purchase-timing decisions.
Journal of consumer Research, 27(4), 447-459.
Costa Jr, P. T., & McCrae, R. R. (1995). Domains and facets: Hierarchical personality assessment using
the Revised NEO Personality Inventory. Journal of personality assessment, 64(1), 21-50.
Costa, P. T., & Mccrae, R. R. (1992). Normal Personality Assessment in Clinical Practice. Psychological
Assessment, 4(1), 5-13.
Costa, P. T., & McCrae, R. R. (2008). The revised neo personality inventory (neo-pi-r). The SAGE
handbook of personality theory and assessment, 2, 179-198.
Dalal, D. K., Diab, D. L., Zhu, X. S., & Hwang, T. (2015). Understanding the construct of maximizing
tendency: A theoretical and empirical evaluation. Journal of Behavioral Decision Making, 28(5),
437-450.
Dar-Nimrod, I., Rawn, C. D., Lehman, D. R., & Schwartz, B. (2009). The maximization paradox: The
costs of seeking alternatives. Personality and Individual Differences, 46(5), 631-635.
DeYoung, C. G., Peterson, J. B., & Higgins, D. M. (2005). Sources of openness/intellect: Cognitive and
neuropsychological correlates of the fifth factor of personality. Journal of personality, 73(4), 825-
858.
Dhaundiyal, M., & Coughlan, J. (2009). The effect of hedonic motivations, socialibility and shyness on
the implusive buying tendencies of the Irish consumer.
Duijsens, I. J., & Diekstra, R. W. (1996). DSM-III-R and ICD-10 personality disorders and their
relationship with the big five dimensions of personality. Personality and Individual Differences,
21(1), 119-133.
Esposito Vinzi, V., & Russolillo, G. (2010). Partial least squares path modeling and regression. Wiley
interdisciplinary reviews: computational statistics. New York: Wiley.
Eysenck, S. B., Pearson, P. R., Easting, G., & Allsopp, J. F. (1985). Age norms for impulsiveness,
venturesomeness and empathy in adults. Personality and Individual Differences, 6(5), 613-619.
Franken, I. H., van Strien, J. W., Nijs, I., & Muris, P. (2008). Impulsivity is associated with behavioral
decision-making deficits. Psychiatry research, 158(2), 155-163.
Fried, T. A. (2008). The relationship between psychological types, demographics and post-purchase
buyer's remorse (Vol. 69).
Gohary, A., & Hanzaee, K. H. (2014). Personality traits as predictors of shopping motivations and
behaviors: a canonical correlation analysis. Arab Economic and Business Journal, 9(2), 166-174.
Gosling, S. D., Rentfrow, P. J., & Swann, W. B. (2003). A very brief measure of the Big-Five personality
domains. Journal of Research in Personality, 37(6), 504-528.
Gramzow, R. H., Sedikides, C., Panter, A., Sathy, V., Harris, J., & Insko, C. A. (2004). Patterns of self‐regulation and the Big Five. European Journal of personality, 18(5), 367-385.
14 Khalid Mahmood, Muhammad Amir Rashid, Ghulam Hussain
Guido, G., Capestro, M., & Peluso, A. M. (2007). Experimental analysis of consumer stimulation and
motivational states in shopping experiences. International Journal of Market Research, 49(3),
365.
Hair, J. F., Black, W. C., Babin, B. J., Anderson, R. E., & Tatham, R. L. (2006). Multivariate data analysis
. Uppersaddle River: NJ: Pearson Prentice Hall.
Hausman, A. (2000). A multi-method investigation of consumer motivations in impulse buying behavior.
Journal of consumer marketing, 17(5), 403-426.
Henseler, J., Dijkstra, T. K., Sarstedt, M., Ringle, C. M., Diamantopoulos, A., Straub, D. W., . . .
Calantone, R. J. (2014). Common beliefs and reality about PLS: Comments on Rönkkö and
Evermann (2013). Organizational Research Methods, 17(2), 182-209.
Ho, V. T., Weingart, L. R., & Rousseau, D. M. (2004). Responses to broken promises: does personality
matter? Journal of Vocational Behavior, 65(2), 276-293.
Horton, R. L. (1979). Some relationships between personality and consumer decision making. Journal of
Marketing Research, 233-246.
Hussain, G., Wan Ismail, W. K., Rashid, M. A., & Nisar, F. (2016). Substitutes for leadership: alternative
perspectives. Management Research Review, 39(5), 546-568.
Iyengar, S. S., & Lepper, M. R. (2000). When choice is demotivating: Can one desire too much of a good
thing? Journal of personality and social psychology, 79(6), 995.
Jensen-Campbell, L. A., Rosselli, M., Workman, K. A., Santisi, M., Rios, J. D., & Bojan, D. (2002).
Agreeableness, conscientiousness, and effortful control processes. Journal of Research in
Personality, 36(5), 476-489.
Johnson, T., & Attmann, J. (2009). Compulsive buying in a product specific context: clothing. Journal of
Fashion Marketing and Management: An International Journal, 13(3), 394-405.
Joshanloo, M., Rastegar, P., & Bakhshi, A. (2012). The Big Five personality domains as predictors of
social wellbeing in Iranian university students. Journal of Social and Personal Relationships,
29(5), 639-660.
Kalla, S. M., & Arora, A. (2011). Impulse buying: A literature review. Global Business Review, 12(1),
145-157.
Kuntsche, E., von Fischer, M., & Gmel, G. (2008). Personality factors and alcohol use: A mediator
analysis of drinking motives. Personality and Individual Differences, 45(8), 796-800.
Lakhal, S., Frenette, É., Sévigny, S., & Khechine, H. (2012). Relationship between choice of a business
major type (thing-oriented versus person-oriented) and Big Five personality traits. The
International Journal of Management Education, 10(2), 88-100.
Lee, J. A., & Kacen, J. J. (2008). Cultural influences on consumer satisfaction with impulse and planned
purchase decisions. Journal of business Research, 61(3), 265-272.
Lee, S. H., & Cotte, J. (2009). Post-purchase consumer regret: Conceptualization and development of the
PPCR scale. NA-Advances in Consumer Research Volume 36.
Loomes, G., & Sugden, R. (1982). Regret theory: An alternative theory of rational choice under
uncertainty. The economic journal, 92(368), 805-824.
Matzler, K., Bidmon, S., & Grabner-Kräuter, S. (2006). Individual determinants of brand affect: the role
of the personality traits of extraversion and openness to experience. Journal of Product & Brand
Management, 15(7), 427-434.
*Corresponding author (Khalid Mahmood). Tel: +92-3067939087. E-mail: [email protected] ©2019 International
Transaction Journal of Engineering, Management, & Applied Sciences & Technologies. Volume 10 No.12 ISSN 2228-9860 eISSN 1906-9642 CODEN: ITJEA8 Paper ID:10A12N http://TUENGR.COM/V10A/10A12N.pdf DOI: 10.14456/ITJEMAST.2019.164
15
McAdams, D. P. (1996). Personality, modernity, and the storied self: A contemporary framework for
studying persons. Psychological Inquiry, 7(4), 295-321.
Miller, N. E., & Dollard, J. (1941). Social learning and imitation.
Mitchell, V.-W. (1993). Factors affecting consumer risk reduction: A review of current evidence.
Management Research News, 16(9/10), 6-20.
Mowen, J. C., Fang, X., & Scott, K. (2009). A hierarchical model approach for identifying the trait
antecedents of general gambling propensity and of four gambling-related genres. Journal of
business Research, 62(12), 1262-1268.
Mueller, A., Claes, L., Mitchell, J. E., Wonderlich, S. A., Crosby, R. D., & De Zwaan, M. (2010).
Personality prototypes in individuals with compulsive buying based on the Big Five Model.
Behaviour Research and Therapy, 48(9), 930-935.
Nenkov, G. Y., Morrin, M., Schwartz, B., Ward, A., & Hulland, J. (2008). A short form of the
Maximization Scale: Factor structure, reliability and validity studies.
Novliadi, F., Zahreni, S., & Iskandar, L. M. (2018). Consumer purchase regret: how personality influences
outcome regret and process regret. Journal of Business and Retail Management Research, 13(1).
Otero-López, J. M., & Villardefrancos, E. (2013). Five-Factor Model personality traits, materialism, and
excessive buying: A mediational analysis. Personality and Individual Differences, 54(6), 767-
772.
Ozer, L., & Gultekin, B. (2015). Pre-and post-purchase stage in impulse buying: The role of mood and
satisfaction. Journal of retailing and consumer services, 22, 71-76.
Park, J., & Lennon, S. J. (2006). Psychological and environmental antecedents of impulse buying
tendency in the multichannel shopping context. Journal of consumer marketing, 23(2), 56-66. doi:
10.1108/07363760610654998
Peck, J., & Childers, T. L. (2006). If I touch it I have to have it: Individual and environmental influences
on impulse purchasing. Journal of business Research, 59(6), 765-769. doi:
http://dx.doi.org/10.1016/j.jbusres.2006.01.014
Piron, F. (1991). Defining impulse purchasing. NA-Advances in Consumer Research Volume 18.
Purvis, A., Howell, R. T., & Iyer, R. (2011). Exploring the role of personality in the relationship between
maximization and well-being. Personality and Individual Differences, 50(3), 370-375.
Richardson, C. M., Ye, H. J., Ege, E., Suh, H., & Rice, K. G. (2014). Refining the measurement of
maximization: Gender invariance and relation to psychological well-being. Personality and
Individual Differences, 70, 229-234.
Rook, D. W. (1987). The buying impulse. Journal of consumer Research, 14(2), 189-199.
Rook, D. W., & Fisher, R. J. (1995). Normative influences on impulsive buying behavior. Journal of
consumer Research, 22(3), 305-313.
Rook, D. W., & Gardner, M. P. (1993). In the mood: Impulse buying’s affective antecedents. Research in
consumer behavior, 6(7), 1-28.
Rose, P. (2007). Mediators of the association between narcissism and compulsive buying: the roles of
materialism and impulse control. Psychology of addictive behaviors, 21(4), 576.
Russo, P. M., De Pascalis, V., Varriale, V., & Barratt, E. S. (2008). Impulsivity, intelligence and P300
wave: an empirical study. International Journal of Psychophysiology, 69(2), 112-118.

16 Khalid Mahmood, Muhammad Amir Rashid, Ghulam Hussain
Schwartz, B., Ward, A., Monterosso, J., Lyubomirsky, S., White, K., & Lehman, D. R. (2002).
Maximizing versus satisficing: happiness is a matter of choice. Journal of personality and social
psychology, 83(5), 1178.
Sherif, M., & Hovland, C. I. (1961). Social judgment: Assimilation and contrast effects in communication
and attitude change.
Shiloh, S., Koren, S., & Zakay, D. (2001). Individual differences in compensatory decision-making style
and need for closure as correlates of subjective decision complexity and difficulty. Personality
and Individual Differences, 30(4), 699-710.
Stafford, L. D., Ng, W., Moore, R. A., & Bard, K. A. (2010). Bolder, happier, smarter: The role of
extraversion in positive mood and cognition. Personality and Individual Differences, 48(7), 827-
832.
Sweeney, J. C., Hausknecht, D., & Soutar, G. N. (2000). Cognitive dissonance after purchase: A
multidimensional scale. Psychology and Marketing, 17(5), 369-385.
Terracciano, A., & Costa, P. T. (2004). Smoking and the Five‐Factor Model of personality. Addiction,
99(4), 472-481.
Thompson, E. R., & Prendergast, G. P. (2015). The influence of trait affect and the five-factor personality
model on impulse buying. Personality and Individual Differences, 76, 216-221.
Triandis, H. C. (1995). Individualism & collectivism: Westview press.
Turner, B. M., Rim, H. B., Betz, N. E., & Nygren, T. E. (2012). The maximization inventory. Judgment
and Decision Making, 7(1), 48.
Verplanken, B., & Herabadi, A. (2001). Individual differences in impulse buying tendency: Feeling and
no thinking. European Journal of personality, 15(S1), S71-S83.
Verplanken, B., Herabadi, A. G., Perry, J. A., & Silvera, D. H. (2005). Consumer style and health: The
role of impulsive buying in unhealthy eating. Psychology & Health, 20(4), 429-441. doi:
10.1080/08870440412331337084
Verplanken, B., & Sato, A. (2011). The psychology of impulse buying: An integrative self-regulation
approach. Journal of Consumer Policy, 34(2), 197-210.
Wang, C.-C., & Yang, H.-W. (2008). Passion for online shopping: The influence of personality and
compulsive buying. Social Behavior and Personality: an international journal, 36(5), 693-706.
Weinberg, P., & Gottwald, W. (1982). Impulsive consumer buying as a result of emotions. Journal of
business Research, 10(1), 43-57.
Wetzels, M., Odekerken-Schröder, G., & Van Oppen, C. (2009). Using PLS path modeling for assessing
hierarchical construct models: Guidelines and empirical illustration. MIS quarterly, 177-195.
Whiteside, S. P., & Lynam, D. R. (2001). The five factor model and impulsivity: Using a structural model
of personality to understand impulsivity. Personality and Individual Differences, 30(4), 669-689.
Wittmann, M., & Paulus, M. P. (2008). Decision making, impulsivity and time perception. Trends in
cognitive sciences, 12(1), 7-12.
Xiao, S. H., & Nicholson, M. (2013). A multidisciplinary cognitive behavioural framework of impulse
buying: a systematic review of the literature. International Journal of Management Reviews,
15(3), 333-356.

*Corresponding author (Khalid Mahmood). Tel: +92-3067939087. E-mail: [email protected] ©2019 International
Transaction Journal of Engineering, Management, & Applied Sciences & Technologies. Volume 10 No.12 ISSN 2228-9860 eISSN 1906-9642 CODEN: ITJEA8 Paper ID:10A12N http://TUENGR.COM/V10A/10A12N.pdf DOI: 10.14456/ITJEMAST.2019.164
17
Zeelenberg, M., & Pieters, R. (2004). Beyond valence in customer dissatisfaction: A review and new
findings on behavioral responses to regret and disappointment in failed services. Journal of
business Research, 57(4), 445-455.
Zurawicki, L. (2010). Neural Bases for Segmentation and Positioning Neuromarketing (pp. 163-210):
Springer.
Khalid Mahmood is a Lecturer (in Marketing) at Department of Management Sciences,COMSATS University Islamabad, Vehari Campus & a Ph.D fellow at COMSATS University Lahore Campus. He has a decade of corporate sector experience in marketing & sales. His area of interest is Marketing & Psychology
Dr.Muhammad Amir Rashid is an Associate Professor & Head of HR at COMSATS Institue of Information Technology, Lahore, Pakistan. He holds an Master degree in Business Administration from University of the Lyceum, Philippines and a PhD degree in Management from Universiti Teknologi Malaysia. His researches are in the areas of Entrepreneurship, Marketing, Corporate Governance and Leadership.
Dr. Ghulam Hussain is an Assistant Professor at the Department of Management Sciences, COMSATS University Islamabad, Lahore Campus, Pakistan. His research interest includes leadership, entrepreneurship and quantitative analysis. He has published his research in reputed journals. He lectures on research methodology and quantitative analysis.
Trademarks Disclaimer: All products names including trademarks™ or registered® trademarks mentioned
in this article are the property of their respective owners, using for identification and educational
purposes only. The use of them does not imply any endorsement or affiliation.
*Corresponding author (Masoud Hajialilue Bonab). E-mail: [email protected] ©2019 International Transaction Journal of Engineering, Management, & Applied Sciences & Technologies. Volume 10 No.12 ISSN 2228-9860 eISSN 1906-9642 CODEN: ITJEA8 Paper ID:10A12O http://TUENGR.COM/V10A/10A12O.pdf DOI: 10.6084/m9.figshare.10011650
1
International Transaction Journal of Engineering, Management, & Applied Sciences & Technologies
http://TuEngr.com
PAPER ID: 10A12O
DETERMINATION OF SUB-SOIL SHEAR WAVE VELOCITY
( 𝑽𝑺 30) IN LAYERED SOIL WITH FEM IN RELATION TO
APPROXIMATED AND ANALYTICAL RESULTS
Masoud Motalebian a, Masoud Hajialilue Bonab
b*, Mohammad Davoudi
c
a Department of Civil Engineering, Science and Research Branch, Islamic Azad University, Tehran, IRAN. b Department of Civil Engineering, University of Tabriz, Tabriz, IRAN. c International Institute of Earthquake Engineering and Seismology, Tehran, IRAN.
A R T I C L E I N F O
A B S T R A C T Article history:
Received 08 April 2019
Received in revised form 19
July 2019
Accepted 30 July 2019
Available online 07 August
2019
Keywords:
Iranian Code of
Practice; Standard2800;
Modal Analysis; FEM;
Evolutionary
Polynomial Regression
(EPR); Numerical
geotechnical analysis;
Two-layered soil
profile; Three-layered
soil profile.
Determining the shear wave velocity of subsoil (Vs) is one of the
important parameters in the seismic design of structures. To determine the
equivalent shear wave velocity in layered soil (𝑉��), several approximated
relations and, in some cases, analytical ones have been proposed. The present
study aims to determine the equivalent shear wave velocity in the top 30
meters (𝑉��30) in single layer soil with variable shear modulus, and also in
two- and three-layered soil using numerical analysis. For the numerical
investigation, ABAQUS based on finite element method (FEM) was used
and modal analysis was performed by calculating the eigenvalues. The
obtained values were compared with analytical and other approximated
relations including the presented relation by the Iranian Code of Practice for
Seismic Resistant Design of Buildings (Standard2800). The results show
that, when the upper layers have smaller Vs than that of the lower layers,
Standard2800 relation presents smaller values than that of the numerical
results for the 𝑉��30. Also, when the lower layers have smaller Vs than that of
the upper layers, Standard2800 relation presents larger values. Also, an
absolute agreement was observed between numerical and analytical results
and Standard2800 relation has better consistency with numerical and
analytical results compared with other similar cases. In addition,
Evolutionary Polynomial Regression (EPR) was used to derive an accurate
model expressing 𝑉��30 in terms of dimensionless parameters in two-layered
soil.
© 2019 INT TRANS J ENG MANAG SCI TECH.
1. INTRODUCTION It is obviously recognized that the effect of the site is the most important characteristic of ground
motion and has a well-known influence on the earthquake damage. During an earthquake, the ground
motion traits of the site are specifically affected by the soil deposits (Maheswari et al. 2008, Trifunac et
al. 2016). Shear wave velocity of soil (Vs) is regarded as the main parameter for site classification and
©2019 International Transaction Journal of Engineering, Management, & Applied Sciences & Technologies
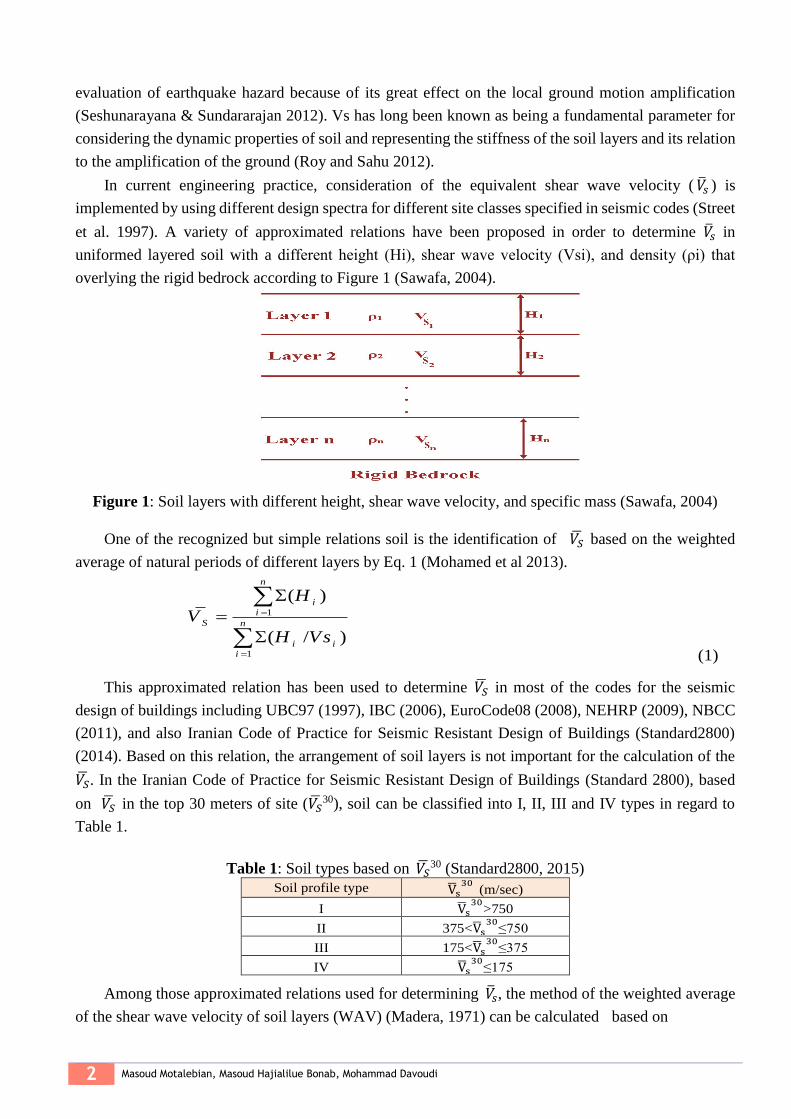
2 Masoud Motalebian, Masoud Hajialilue Bonab, Mohammad Davoudi
evaluation of earthquake hazard because of its great effect on the local ground motion amplification
(Seshunarayana & Sundararajan 2012). Vs has long been known as being a fundamental parameter for
considering the dynamic properties of soil and representing the stiffness of the soil layers and its relation
to the amplification of the ground (Roy and Sahu 2012).
In current engineering practice, consideration of the equivalent shear wave velocity ( ��𝑠 ) is
implemented by using different design spectra for different site classes specified in seismic codes (Street
et al. 1997). A variety of approximated relations have been proposed in order to determine ��𝑠 in
uniformed layered soil with a different height (Hi), shear wave velocity (Vsi), and density (ρi) that
overlying the rigid bedrock according to Figure 1 (Sawafa, 2004).
Figure 1: Soil layers with different height, shear wave velocity, and specific mass (Sawafa, 2004)
One of the recognized but simple relations soil is the identification of 𝑉�� based on the weighted
average of natural periods of different layers by Eq. 1 (Mohamed et al 2013).
1
1
( )
( / )
n
ii
S n
i ii
H
V
H Vs
(1)
This approximated relation has been used to determine 𝑉�� in most of the codes for the seismic
design of buildings including UBC97 (1997), IBC (2006), EuroCode08 (2008), NEHRP (2009), NBCC
(2011), and also Iranian Code of Practice for Seismic Resistant Design of Buildings (Standard2800)
(2014). Based on this relation, the arrangement of soil layers is not important for the calculation of the
𝑉��. In the Iranian Code of Practice for Seismic Resistant Design of Buildings (Standard 2800), based
on 𝑉�� in the top 30 meters of site (𝑉��30), soil can be classified into I, II, III and IV types in regard to
Table 1.
Table 1: Soil types based on 𝑉��30 (Standard2800, 2015)
Soil profile type Vs30
(m/sec)
I Vs30
>750
II 375<Vs30
≤750
III 175<Vs30
≤375
IV Vs30
≤175
Among those approximated relations used for determining ��𝑠, the method of the weighted average
of the shear wave velocity of soil layers (WAV) (Madera, 1971) can be calculated based on

*Corresponding author (Masoud Hajialilue Bonab). E-mail: [email protected] ©2019 International Transaction Journal of Engineering, Management, & Applied Sciences & Technologies. Volume 10 No.12 ISSN 2228-9860 eISSN 1906-9642 CODEN: ITJEA8 Paper ID:10A12O http://TUENGR.COM/V10A/10A12O.pdf DOI: 10.6084/m9.figshare.10011650
3
1
1
1i
n
S ini
ii
Vs V H
H
(2).
This approximated relation has been used in Building Japanese Code (Estrada, 2004).
Another approximated relation used for determining ��𝑠 is based on the method of the weighted
average of the shear wave velocity of soil layers (WAV) (Vijayendra et al. 2015) can be calculated by
s
s
GVs
(3),
where ��𝑆 and ��𝑆 are the equivalent shear modulus and the equivalent density of soil, which
can be determined by Equations (4) and (5), respectively.
1
1
1 n
S i ini
ii
Gs G H
H
(4).
1
1
1 n
s si ini
ii
H
H
(5).
The term S iGis the shear modulus of each layer.
2. FINITE-ELEMENT MODELING AND BASELINE ANALYSIS MODEL
The present study aims to estimate the numerical value of the 𝑉��30 and compare the values obtained
from the relation proposed by Standard2800 (Eq. 1) for different soil layers. In some cases, some
analytical relations have been presented by researchers, which were also compared in order to give better
validation. Moreover, the results obtained from the approximated methods including WAM and WAV
were compared with the numerical and analytical results. Also, Evolutionary Polynomial Regression
(EPR) is used to derive an equation indicating 𝑉��30 in terms of dimensionless parameters for two-layered
soil.
For numerical investigation of the problem, finite elements software ABAQUS 6.12-3 was used.
The modal analysis was conducted by calculating the eigenvalues. Accordingly, the fundamental period
of the site including different layers (��) can be determined and the required 𝑉�� can be estimated by Eq.
6 (Roser and Gosar, 2010).
4S
HV
T
(6).
Parameter H is the total height of all the layers. In all the investigated cases in this paper, the total
height of the layers is assumed 30m and overlying rigid bedrock.
This research was conducted based on a two-dimensional model (plane strain). According to the
modal analysis, soil behavior was assumed as a linear elastic one. Figure 2a shows the meshed model of
the three-layered soil that is developed for modal analysis and the first vibration mode and the
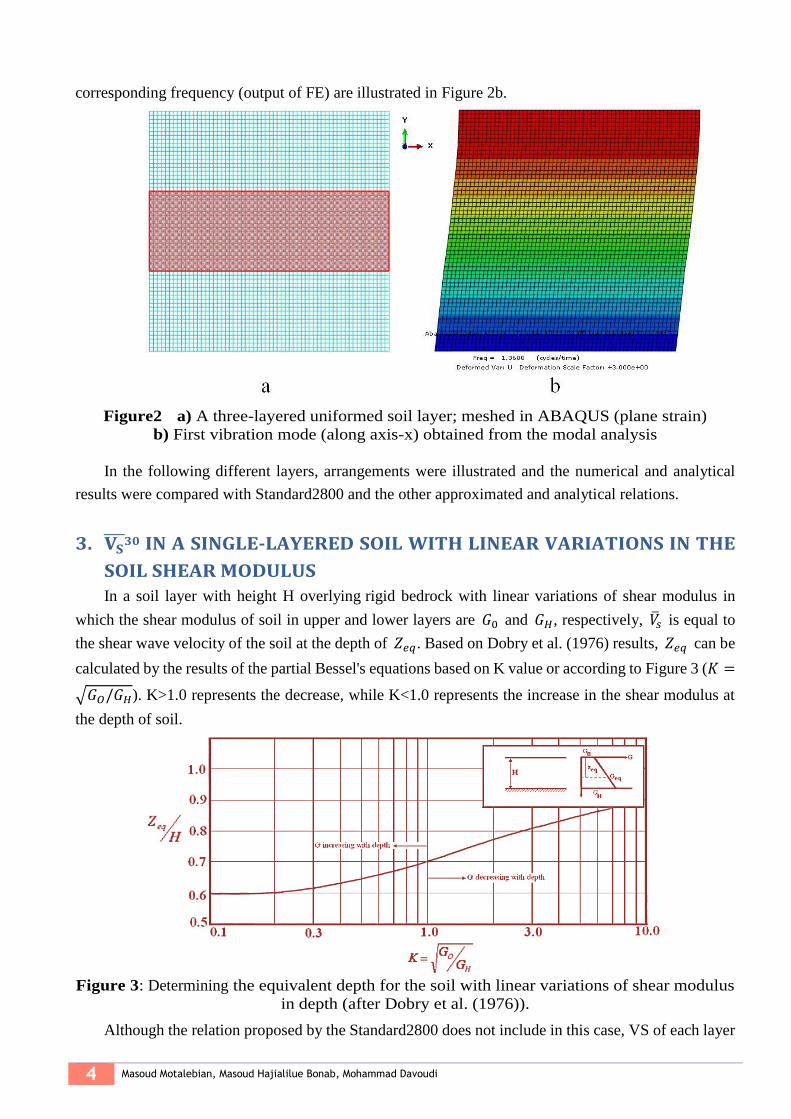
4 Masoud Motalebian, Masoud Hajialilue Bonab, Mohammad Davoudi
corresponding frequency (output of FE) are illustrated in Figure 2b.
Figure2 a) A three-layered uniformed soil layer; meshed in ABAQUS (plane strain)
b) First vibration mode (along axis-x) obtained from the modal analysis
In the following different layers, arrangements were illustrated and the numerical and analytical
results were compared with Standard2800 and the other approximated and analytical relations.
3. 𝐕𝐒 30 IN A SINGLE-LAYERED SOIL WITH LINEAR VARIATIONS IN THE
SOIL SHEAR MODULUS
In a soil layer with height H overlying rigid bedrock with linear variations of shear modulus in
which the shear modulus of soil in upper and lower layers are 𝐺0 and 𝐺𝐻, respectively, ��𝑠 is equal to
the shear wave velocity of the soil at the depth of 𝑍𝑒𝑞. Based on Dobry et al. (1976) results, 𝑍𝑒𝑞 can be
calculated by the results of the partial Bessel's equations based on K value or according to Figure 3 (𝐾 =
√𝐺𝑂/𝐺𝐻). K>1.0 represents the decrease, while K<1.0 represents the increase in the shear modulus at
the depth of soil.
Figure 3: Determining the equivalent depth for the soil with linear variations of shear modulus
in depth (after Dobry et al. (1976)).
Although the relation proposed by the Standard2800 does not include in this case, VS of each layer

*Corresponding author (Masoud Hajialilue Bonab). E-mail: [email protected] ©2019 International Transaction Journal of Engineering, Management, & Applied Sciences & Technologies. Volume 10 No.12 ISSN 2228-9860 eISSN 1906-9642 CODEN: ITJEA8 Paper ID:10A12O http://TUENGR.COM/V10A/10A12O.pdf DOI: 10.6084/m9.figshare.10011650
5
can be calculated and 𝑉�� can be estimated through the stairway classification of soil into several layers.
To this end, the soil with 30m high and linear variable shear modulus consists of 10 layers with 3m high
is considered and 𝑉��30 is estimated based on the Standard2800. The same process is also carried out in
numerical modeling. For different K values, the equivalent depth ratio (Zeq/H) is compared based on the
analytical and numerical methods, Standard2800 relation, WAM and WAV methods in Figure 4.
The results show an appropriate agreement between numerical and analytical results. Minor
differences between the results could be related to the linear variations of the shear modulus in the
analytical method and the stairway variations in the numerical modeling. The proposed relation by
Standard2800 predicts the equivalent depth, particularly due to the increase in the shear modulus at
depth which is not significantly lower than the obtained results of the numerical and analytical methods.
Figure4: Zeq/H with linear variations of shear modulus by different methods.
Figure 5: Soil profile with two different uniformed layers (ρA=ρB).
4. 𝐕𝐒 30 IN TWO-LAYERED SOIL
According to the analytical results the fundamental period (��) for a site consisting of two layers A
and B located on the rigid bedrock (Figure 5), with height and shear wave velocity of HA, HB, and VsA,
VsB respectively, can be calculated by Equation (7) (Oskay and Zeghal, 2011).
B
A
A
BBA
T
T
H
H
T
T
T
T)
2tan()
2tan(
(7),
where 𝑇𝐴 =4𝐻𝐴
𝑉𝐴 and 𝑇𝐵 =
4𝐻𝐵
𝑉𝐵 are respectively the fundamental period of layers A and B, in the
absence of other layers, and �� is the fundamental period of the two-layered soil, respectively. Having
T from the above equation and given Equation (6), 𝑉��30 can be calculated using Equation (8).
30 30
tan( ) tan( )2 2
B
A B A
SA B
S A B S A B S
VVs H Vs H
V H H V H H V
(8),

6 Masoud Motalebian, Masoud Hajialilue Bonab, Mohammad Davoudi
where HA+HB = H = 30m. Results obtained by the numerical method, analytical methods, the relation
proposed by the Standard2800, and other approximated methods are calculated and compared for a
two-layered soil for the following cases. Finally, Evolutionary Polynomial Regression (EPR) was used
to derive an accurate equation expressing 𝑉��30 in terms of dimensionless parameters. These results are
based on VsA=200m/s and can be generalizable for other dimensionless ratios.
4.1 A WEAK SOIL LAYER ON A STRONG LAYER WITH VARIABLE HEIGHT In this case, two soil layers with different heights with the total height of 30m were considered and
the effect of 𝐻𝐴
𝐻𝐴+𝐻𝐵 on
𝑉𝑆 30
𝑉𝑠𝐴 was investigated. Also, it was assumed that 𝑉𝑠𝐴 = 0.2𝑉𝑠𝐵.
The results (Figure 6) showed Srandard2800 which produced lower values for 𝑉��30, especially for
lower values of the ratio 𝐻𝐴
𝐻𝐴+𝐻𝐵. Moreover, there was an absolute agreement between results of the
numerical finite element method and the results of analytical analysis. The approximated relation in
Standard2800 had better consistency with the analytical results compared to the approximated methods
of WAM and WAV.
Figure 6: 𝑉𝑆 30
𝑉𝑠𝐴 with variable height.
HA=HB=15m and VsB= α×VsA
Results obtained for 𝑉𝑆 30
𝑉𝑠𝐴 showed that for α>1.0 (the weak layer on top), the Standard2800
provided lower values for the ratio of 𝑉��30 than those provided by analytical and numerical results and,
for α<1.0 (the weak layer in the bottom), the Standard2800 would result in higher values than those for
the analytical and numerical results. Also, the numerical results were completely in agreement with the
analytical results and the approximated relation proposed by the standard2800 had better consistency
compared to the approximated methods of WAV and WAM. (Figure 7).
HA=10m, HB=20m and VsB= α×VsA
The findings for 𝑉𝑆 30
𝑉𝑠𝐴 were in line with those of the previous case, however, the difference
between the results of the Standard2800 relation and the numerical analysis as well as analytical results
were more obvious for α >1.0 (Figure 8). In the present case, the approximated relation in the
Standard2800 had better consistency compared to the approximated WAV and WAM methods.
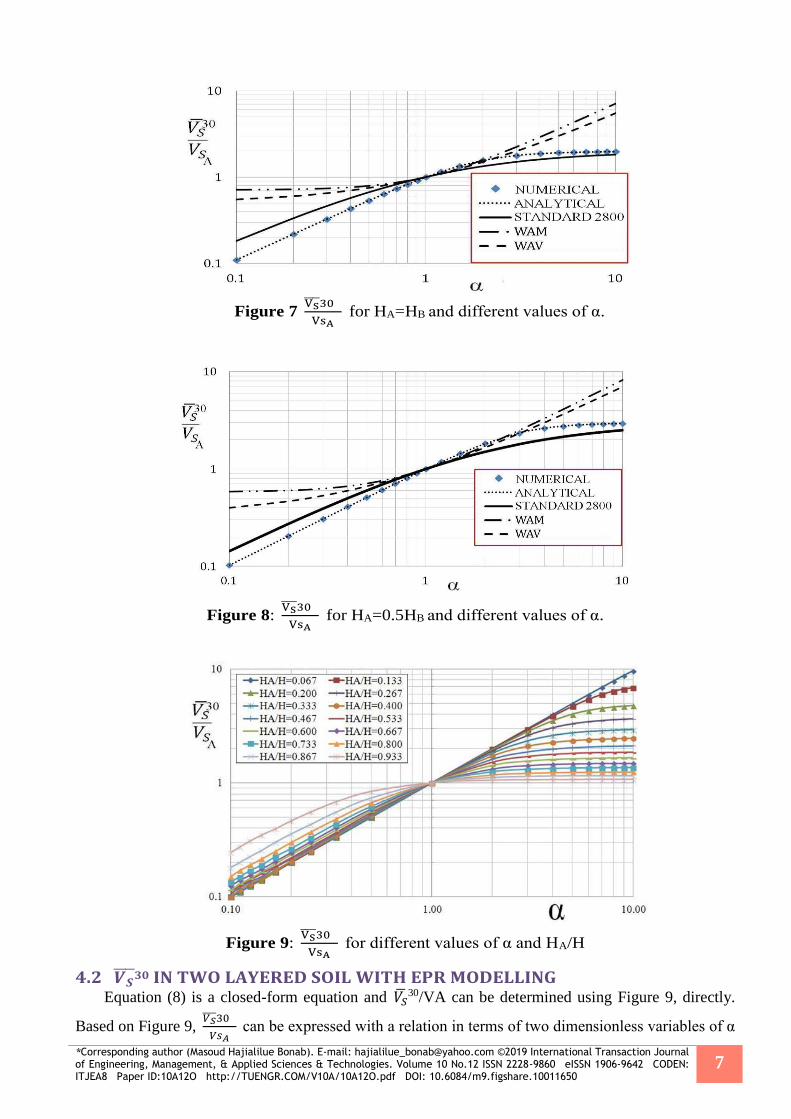
*Corresponding author (Masoud Hajialilue Bonab). E-mail: [email protected] ©2019 International Transaction Journal of Engineering, Management, & Applied Sciences & Technologies. Volume 10 No.12 ISSN 2228-9860 eISSN 1906-9642 CODEN: ITJEA8 Paper ID:10A12O http://TUENGR.COM/V10A/10A12O.pdf DOI: 10.6084/m9.figshare.10011650
7
Figure 7 VS 30
VsA for HA=HB and different values of α.
Figure 8: VS 30
VsA for HA=0.5HB and different values of α.
Figure 9: VS 30
VsA for different values of α and HA/H
4.2 𝑽𝑺 30 IN TWO LAYERED SOIL WITH EPR MODELLING
Equation (8) is a closed-form equation and 𝑉��30/VA can be determined using Figure 9, directly.
Based on Figure 9, 𝑉𝑆 30
𝑉𝑠𝐴 can be expressed with a relation in terms of two dimensionless variables of α
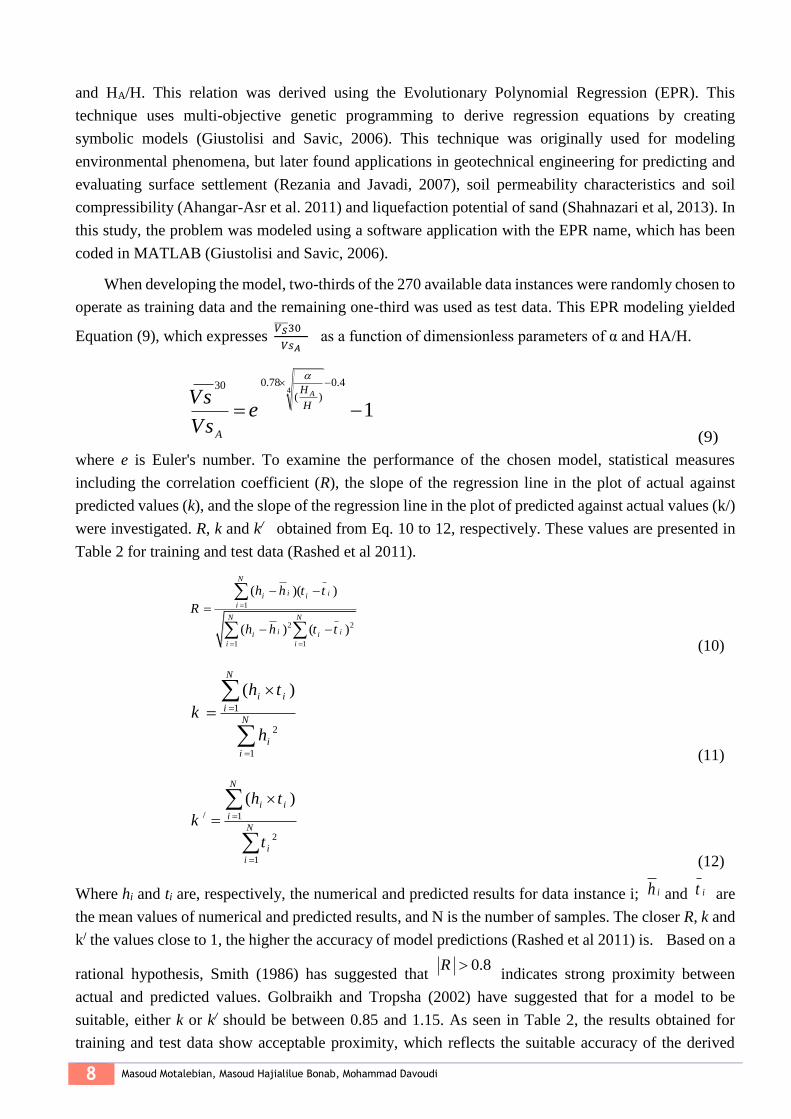
8 Masoud Motalebian, Masoud Hajialilue Bonab, Mohammad Davoudi
and HA/H. This relation was derived using the Evolutionary Polynomial Regression (EPR). This
technique uses multi-objective genetic programming to derive regression equations by creating
symbolic models (Giustolisi and Savic, 2006). This technique was originally used for modeling
environmental phenomena, but later found applications in geotechnical engineering for predicting and
evaluating surface settlement (Rezania and Javadi, 2007), soil permeability characteristics and soil
compressibility (Ahangar-Asr et al. 2011) and liquefaction potential of sand (Shahnazari et al, 2013). In
this study, the problem was modeled using a software application with the EPR name, which has been
coded in MATLAB (Giustolisi and Savic, 2006).
When developing the model, two-thirds of the 270 available data instances were randomly chosen to
operate as training data and the remaining one-third was used as test data. This EPR modeling yielded
Equation (9), which expresses 𝑉𝑆 30
𝑉𝑠𝐴 as a function of dimensionless parameters of α and HA/H.
40.78 0.430
( )
1AH
H
A
Vse
Vs
(9)
where e is Euler's number. To examine the performance of the chosen model, statistical measures
including the correlation coefficient (R), the slope of the regression line in the plot of actual against
predicted values (k), and the slope of the regression line in the plot of predicted against actual values (k/)
were investigated. R, k and k/ obtained from Eq. 10 to 12, respectively. These values are presented in
Table 2 for training and test data (Rashed et al 2011).
1
2 2
1 1
( )( )
( ) ( )
N
i ii i
i
N N
i ii i
i i
h h t t
R
h h t t
(10)
1
2
1
( )N
i i
i
N
i
i
h t
k
h
(11)
/ 1
2
1
( )N
i i
i
N
i
i
h t
k
t
(12)
Where hi and ti are, respectively, the numerical and predicted results for data instance i; ih and it are
the mean values of numerical and predicted results, and N is the number of samples. The closer R, k and
k/ the values close to 1, the higher the accuracy of model predictions (Rashed et al 2011) is. Based on a
rational hypothesis, Smith (1986) has suggested that 0.8R
indicates strong proximity between
actual and predicted values. Golbraikh and Tropsha (2002) have suggested that for a model to be
suitable, either k or k/ should be between 0.85 and 1.15. As seen in Table 2, the results obtained for
training and test data show acceptable proximity, which reflects the suitable accuracy of the derived
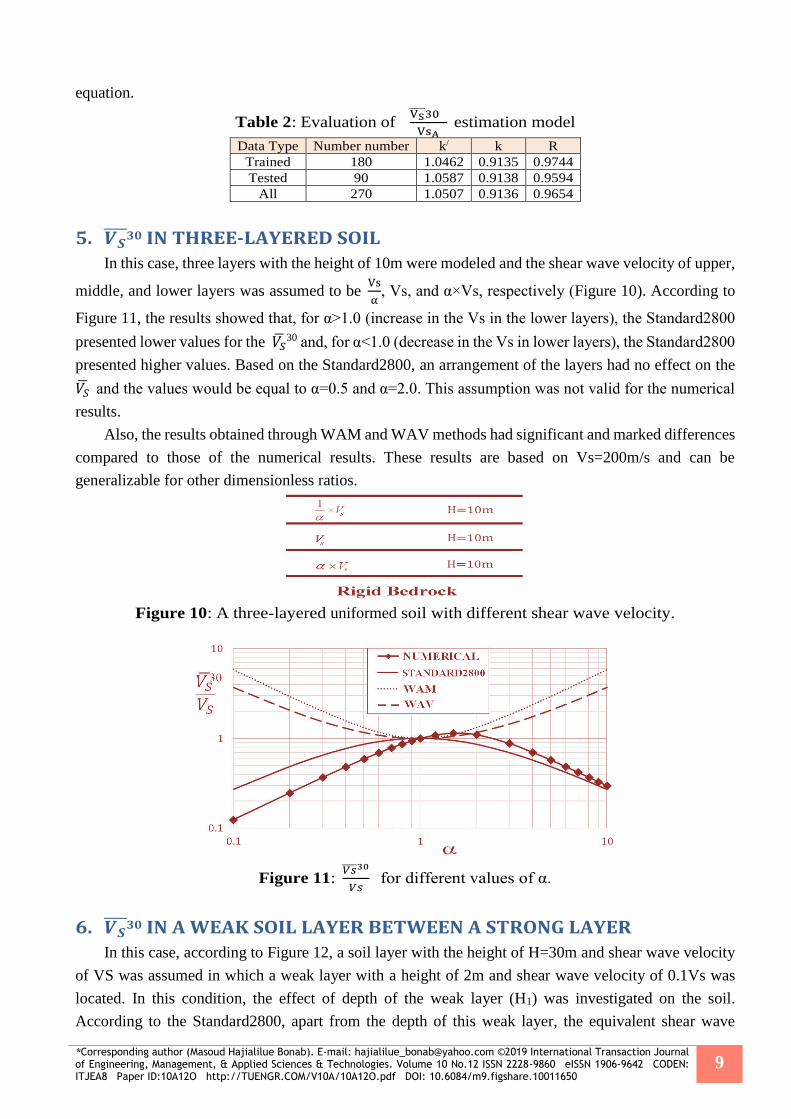
*Corresponding author (Masoud Hajialilue Bonab). E-mail: [email protected] ©2019 International Transaction Journal of Engineering, Management, & Applied Sciences & Technologies. Volume 10 No.12 ISSN 2228-9860 eISSN 1906-9642 CODEN: ITJEA8 Paper ID:10A12O http://TUENGR.COM/V10A/10A12O.pdf DOI: 10.6084/m9.figshare.10011650
9
equation.
Table 2: Evaluation of VS 30
VsA estimation model
Data Type Number number k/ k R
Trained 180 1.0462 0.9135 0.9744
Tested 90 1.0587 0.9138 0.9594
All 270 1.0507 0.9136 0.9654
5. 𝑽𝑺 30 IN THREE-LAYERED SOIL
In this case, three layers with the height of 10m were modeled and the shear wave velocity of upper,
middle, and lower layers was assumed to be Vs
α, Vs, and α×Vs, respectively (Figure 10). According to
Figure 11, the results showed that, for α>1.0 (increase in the Vs in the lower layers), the Standard2800
presented lower values for the 𝑉��30 and, for α<1.0 (decrease in the Vs in lower layers), the Standard2800
presented higher values. Based on the Standard2800, an arrangement of the layers had no effect on the
𝑉�� and the values would be equal to α=0.5 and α=2.0. This assumption was not valid for the numerical
results.
Also, the results obtained through WAM and WAV methods had significant and marked differences
compared to those of the numerical results. These results are based on Vs=200m/s and can be
generalizable for other dimensionless ratios.
Figure 10: A three-layered uniformed soil with different shear wave velocity.
Figure 11: 𝑉𝑠 30
𝑉𝑠 for different values of α.
6. 𝑽𝑺 30 IN A WEAK SOIL LAYER BETWEEN A STRONG LAYER
In this case, according to Figure 12, a soil layer with the height of H=30m and shear wave velocity
of VS was assumed in which a weak layer with a height of 2m and shear wave velocity of 0.1Vs was
located. In this condition, the effect of depth of the weak layer (H1) was investigated on the soil.
According to the Standard2800, apart from the depth of this weak layer, the equivalent shear wave

10 Masoud Motalebian, Masoud Hajialilue Bonab, Mohammad Davoudi
velocity in the top 30 meters was equal to 𝑉��30= 0.625𝑉. It represented 𝑉��
30 = 0.940𝑉 and 𝑉��30 =
0.966𝑉 for WAV and WAM methods, respectively. However, the obtained numerical results revealed
that 𝑉𝑠 30
𝑉𝑠 decreases with an increase in
𝐻1
𝐻 (Figure 13). To put simply, when the weak layer was near
the surface of the ground, the numerical results led to lower values, while in the case in which the weak
layer was at the depth of the soil, the results presented higher values for the 𝑉��30 . Also, WAV and WAM
methods produced higher values for the 𝑉��30. These results are based on Vs=200m/s and can be
generalizable for other dimensionless ratios.
Figure 12: A weak layer in the middle of the strong layer.
Figure 13: 𝑉𝑠 30
𝑉𝑠 for different values of
𝐻1
𝐻.
7. 𝑽𝑺 30 IN THREE-LAYERED SOIL PROFILE WITH DIFFERENT
ARRANGEMENTS
In order to investigate the soil arrangement in 𝑉��30 in regard to Figure 14, three-layered soil profile
with 3 various arrangements a, b, and c was modeled. The only existed difference between these three
cases was an alteration in arrangement of them. Also, the height of each layer was assumed 10m in all
cases. According to standard2800, in each case 𝑉��30 = 284 𝑚/𝑠 and in these three cases, the site is
TYPE III (Table 3). However, based on the findings of numerical analysis, 𝑉��30 was distinct for every
type and presented different site types for each of them. In line with the results obtained from numerical
analysis, to what extent a softer layer was in the depth of soil, 𝑉��30 would provide lower value.

*Corresponding author (Masoud Hajialilue Bonab). E-mail: [email protected] ©2019 International Transaction Journal of Engineering, Management, & Applied Sciences & Technologies. Volume 10 No.12 ISSN 2228-9860 eISSN 1906-9642 CODEN: ITJEA8 Paper ID:10A12O http://TUENGR.COM/V10A/10A12O.pdf DOI: 10.6084/m9.figshare.10011650
11
Figure 14: Three-layered soil profile with different arrangements.
Table 3. comparing the 𝑉𝑆 30 based on Standard2800 and numerical results.
Numerical Standard2800 (Equation (1)) Case
Ground Type 𝑉𝑆30 (m/s) Ground Type 𝑉𝑆
30 (m/s)
II 378 III 284 a
III 230 III 284 b
IV 173 III 284 c
8. CONCLUSION The numerical investigation of the conducted research for determining 𝑉��
30 based on the finite
element method and the comparison with the proposed relation by Standard2800, analytical results, and
other approximated methods showed that:
o In soil with linear variable shear modulus, comparison of the results obtained from the analytical
method and the proposed relation by most of the building codes including Standard2800 indicated a
significant difference in the 𝑉��30 values, particularly for increasing high linear variations in the shear
modulus.
o For a two- (three-) layered soil where the Vs increased in low layer(s), 𝑉��30 obtained from
Standard2800 was lower than that of the numerical and analytical results. But, by assuming a
decrease in Vs in the lower layers, the proposed relation in Standard2800 presented lower values for
𝑉��30 than that of the numerical and analytical results.
o For the case when a weak soil layer was assumed, according to the Standard2800, the depth of this
layer had no effect on 𝑉��30. But, the numerical results showed that the closer this layer was to the
surface, the higher the 𝑉��30 would be shown and location of this layer at the depth of the ground
would decrease 𝑉��30. A comparison of the numerical results with the values obtained from the
relation in the Standard2800 showed a significant difference in this case.
o Although approximated methods of determining 𝑉��30 using the weighted average of shear wave
velocity (WAV) and modulus (WAM) have relatively simple relations, same as the weighted
average of periods (proposed relation in Standard2800), this relation had better consistency with
numerical and analytical results in above cases.
o In this paper, a complete agreement was observed between the numerical and analytical results. The
only minor difference was observed in the soil with variable shear modulus, which could be
attributed to the linear variations of the shear modulus in the analytical method and the stairway
variations in the numerical method. Obviously, it is possible to achieve a complete agreement
between the numerical and analytical results by increasing the number of layers in this case.
Evolutionary Polynomial Regression (EPR) was used to derive an equation expressing 𝑉��30 in
terms of dimensionless parameters for two-layered soil. The statistical measures showed an acceptable
12 Masoud Motalebian, Masoud Hajialilue Bonab, Mohammad Davoudi
correlation for the derived model.
9. AVAILABILITY OF DATA AND MATERIAL
Relevant information is available by contacting the corresponding author.
10. REFERENCES
Ahangar-Asr. A., Faramarzi., A. Mottaghifard. and Javadi. A.A. (2011). Modeling of Permeability and
Compaction Characteristics of Soils Using Evolutionary Polynomial Regression. Computers and
Geosciences, 37(11), 1860-1869.
Dobry, R., Oweis, I., Urzua, A. (1976). Simplified Procedure for Estimating the Fundamental Period of a
Soil Profile. Bulletin of the Seismological Society of America, 66(4), 1293-1321.
Estrada, G. (2004). Analysis Of Earthquake Site Response And Site Classification For Seismic Design
Practices. Proceeding of the 5th World Conference on Conference on Recent Advances in
Geotechnical Earthquake Engineering and Soil Dynamics, San Diego.
Eurocode08. (2008). Seismic Design of Buildings Worked examples, European Commission Joint Research
Centre; Ispra, Italy.
Giustolisi. O. and Savic. D. (2006). A Symbolic Data-Driven Technique Based on Evolutionary
Polynomial Regression. Journal of Hydroinformatics, 8(3), 207-222.
Golbraikh. A. and Tropsha. A. (2002). Beware of q2!. Journal of Molecular Graphics and Modelling, 20(4),
269–276.
IBC (2006), International Building Code. International Code Council; Illinois, USA.
Madera, G. A. (1971). Fundamental Period and Amplification of Peak Acceleration in Layered Systems.
Report No. R70-37; Department of Civil Engineering, Massachusetts Institute of Technology,
Cambridge, USA.
Maheswari, U., Boominathan, A. and Dodagoudar, G. (2008). Development of Empirical Correlation
Between Shear Wave Velocity and Standard Penetration Resistance in Soils of Chennai City.
Proceeding of the 14th World Conference on Earthquake Engineering, Beijing, China, October.
Mohamed. A., Abuelata, A., Abdelazim. F. and Tahaa. M. (2013). Site-specific shear wave velocity
investigation for geotechnical engineering applications using seismic refraction and 2D
multi-channel analysis of surface waves. NRIAG Journal of Astronomy and Geophysics, 2(1),
88-101.
NBCC. (2011). National Building Code of Canada, National Research Council Canada; Ottawa Canada.
NEHRP. (2009). National Earthquake Hazards Reduction Program, Recommended Seismic Provisions for
Seismic Regulations for New Buildings and Other Structures. Building Seismic Safety Council of
the National Institute of Building Sciences; Washington, USA.
Oskay, C. and Zeghal, M. (2011). A survey of geotechnical system identification techniques. Soil Dynamics
and Earthquake Engineering, 31(4), 568–582.
Rashed, A., Bolouri. B. and Alavi. H. (2011). Nonlinear modeling of soil deformation modulus through
LGP-based interpretation of pressuremeter test results. Engineering Applications of Artificial
Intelligence, 25(2), 1437-1449.
Rezania, M. and Javadi, A. A. (2007). A New Genetic Programming Model for Predicting Settlement of
Shallow Foundations. Canadian Geotechnical Journal, 44(12), 1462-1473.
Roser, J. and Gosar. A., (2010). Determination of VS30 for Seismic Ground Classification in Ljubljana
Area, Slovenia. Geotechnica Slovenia, 1(2), 61-67.
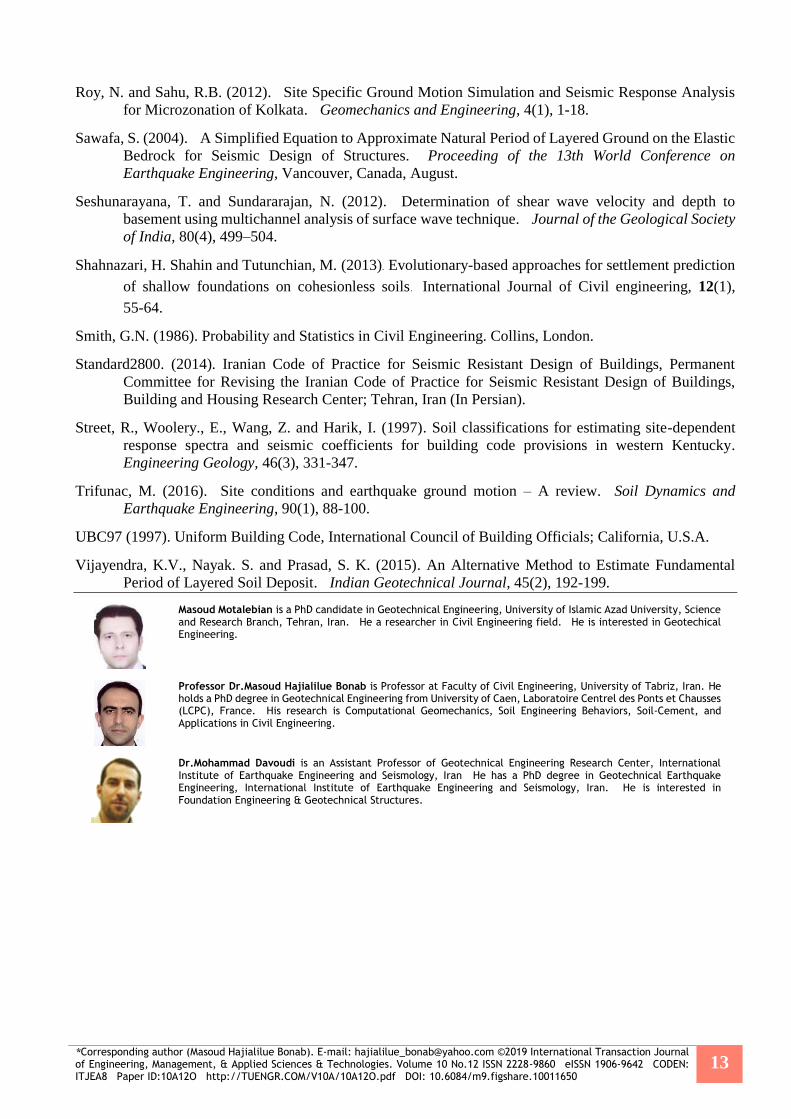
*Corresponding author (Masoud Hajialilue Bonab). E-mail: [email protected] ©2019 International Transaction Journal of Engineering, Management, & Applied Sciences & Technologies. Volume 10 No.12 ISSN 2228-9860 eISSN 1906-9642 CODEN: ITJEA8 Paper ID:10A12O http://TUENGR.COM/V10A/10A12O.pdf DOI: 10.6084/m9.figshare.10011650
13
Roy, N. and Sahu, R.B. (2012). Site Specific Ground Motion Simulation and Seismic Response Analysis
for Microzonation of Kolkata. Geomechanics and Engineering, 4(1), 1-18.
Sawafa, S. (2004). A Simplified Equation to Approximate Natural Period of Layered Ground on the Elastic
Bedrock for Seismic Design of Structures. Proceeding of the 13th World Conference on
Earthquake Engineering, Vancouver, Canada, August.
Seshunarayana, T. and Sundararajan, N. (2012). Determination of shear wave velocity and depth to
basement using multichannel analysis of surface wave technique. Journal of the Geological Society
of India, 80(4), 499–504.
Shahnazari, H. Shahin and Tutunchian, M. (2013). Evolutionary-based approaches for settlement prediction
of shallow foundations on cohesionless soils. International Journal of Civil engineering, 12(1),
55-64.
Smith, G.N. (1986). Probability and Statistics in Civil Engineering. Collins, London.
Standard2800. (2014). Iranian Code of Practice for Seismic Resistant Design of Buildings, Permanent
Committee for Revising the Iranian Code of Practice for Seismic Resistant Design of Buildings,
Building and Housing Research Center; Tehran, Iran (In Persian).
Street, R., Woolery., E., Wang, Z. and Harik, I. (1997). Soil classifications for estimating site-dependent
response spectra and seismic coefficients for building code provisions in western Kentucky.
Engineering Geology, 46(3), 331-347.
Trifunac, M. (2016). Site conditions and earthquake ground motion – A review. Soil Dynamics and
Earthquake Engineering, 90(1), 88-100.
UBC97 (1997). Uniform Building Code, International Council of Building Officials; California, U.S.A.
Vijayendra, K.V., Nayak. S. and Prasad, S. K. (2015). An Alternative Method to Estimate Fundamental
Period of Layered Soil Deposit. Indian Geotechnical Journal, 45(2), 192-199.
Masoud Motalebian is a PhD candidate in Geotechnical Engineering, University of Islamic Azad University, Science and Research Branch, Tehran, Iran. He a researcher in Civil Engineering field. He is interested in Geotechical Engineering.
Professor Dr.Masoud Hajialilue Bonab is Professor at Faculty of Civil Engineering, University of Tabriz, Iran. He holds a PhD degree in Geotechnical Engineering from University of Caen, Laboratoire Centrel des Ponts et Chausses (LCPC), France. His research is Computational Geomechanics, Soil Engineering Behaviors, Soil-Cement, and Applications in Civil Engineering.
Dr.Mohammad Davoudi is an Assistant Professor of Geotechnical Engineering Research Center, International Institute of Earthquake Engineering and Seismology, Iran He has a PhD degree in Geotechnical Earthquake Engineering, International Institute of Earthquake Engineering and Seismology, Iran. He is interested in Foundation Engineering & Geotechnical Structures.
*Corresponding author (Saeid Abbasbandy). Tel: +98-912-1305326 Email: [email protected] ©2019 International
Transaction Journal of Engineering, Management, & Applied Sciences & Technologies. Volume 10 No.12 ISSN 2228-9860 eISSN 1906-9642 CODEN: ITJEA8 Paper ID:10A12P http://TUENGR.COM/V10A/10A12P.pdf DOI: 10.6084/m9.figshare.11110514
1
International Transaction Journal of Engineering, Management, & Applied Sciences & Technologies
http://TuEngr.com
PAPER ID: 10A12P
SOLVING FUZZY FRACTIONAL DIFFERENTIAL
EQUATIONS BY ADOMIAN DECOMPOSITION
METHOD USED IN OPTIMAL CONTROL THEORY
Sahar Askari a
, Tofigh Allahviranloo b
, Saeid Abbasbandy c*
a Department of Mathematics, Science and Research Branch, Islamic Azad University, Hamedan, IRAN.
b Faculty of Engineering and Natural Sciences, Bahcesehir University, Istanbul, TURKEY.
c Department of Mathematics, Faculty of Science, Imam Khomeini International University, Gazvin 34194-288, IRAN.
A R T I C L E I N F O
A B S T R A C T
Article history: Received 20 May 2019 Received in revised form 23
July 2019
Accepted 30 July 2019
Available online 07 August 2019
Keywords: Fuzzy Caputo fractional
differential equation; Fractional calculus; Convergence theorem; Fuzzy fractional differential equation (FFDE).
In this paper, the Adomian decomposition method (ADM) is used to
solve the fractional differential equations under Caputo derivative. This
study reviews basic definitions of fuzzy set and fractional calculus. This
work studies and discusses Adomian decomposition method under Fuzzy
fractional Caputo derivative. Since the ADM approximates the exact
solution as an infinite series, then the convergence theorem is considered
with successive iterations. For illustration, an example is given to
compare between exact and approximate solutions. The uniformly
convergence of sequence {𝑦𝑖(𝑡)} with various types of differentiability to
the exact solution is proved.
© 2019 INT TRANS J ENG MANAG SCI TECH.
INTRODUCTION 1.Fractional calculus is a benefit branch in mathematics, chemistry, optics, control theory,
engineering and etc that have studied in recent years. Fractional calculus was slowly prepared at first, but
it has been a powerful implement in various applications. Fuzzy fractional differential equations is
casted by Agarwal et al. (2010). They have drafted the Riemann-Liouville differentiability concept
under the Hukuhara differentiability to solve fuzzy fractional differential equations. In Arshad &
Lupulescu (2011) and Allahviranloo (2005), the existence and uniqueness are proved for solutions of
fuzzy fractional differential equations under Riemann-Liouville differentiability. Allahviranloo et al.
(2014) proved the existence and uniqueness results for fuzzy fractional integral and Integra-differential
equations involving Riemann-Liouville differential operators. The famous used method in solving
fractional differential equations is the Caputo fractional derivative. Based on generalized Hukuhara
derivative (2001), the opinion of fractional Caputo derivative is introduced in Armand & Gouyandeh
(2013), afterwards fuzzy fractional differential equations are investigated under this kind of
©2019 International Transaction Journal of Engineering, Management, & Applied Sciences & Technologies

2 Sahar Askari, Tofigh Allahviranloo, Saeid Abbasbandy
differentiability. Allahviranloo et al. in 2009 proved the existence and uniqueness solution of fuzzy
fractional differential equations (FFDEs) under Caputo’s gH-differentiability.
In the present paper, we attempt an analytical method to solve FFDEs. To this end, we adopted the
Adomian decomposition method (ADM) to solve FFDEs. The Adomian decomposition method (ADM)
can be used to solve various mathematical models or system of equations involving algebraic equations,
differential equations, Integra-differential equations and linear or non-linear equations (Adomian 1988;
Adomian, 1994; Abbaoui & Cherruault, 1994; Wazwaz, 2001; Wazwaz, 2005). In Wazwaz (2001)
ADM has employed for solving non-linear fractional differential equations. Specifically, in
Daftardar-Gejji & Jafari (2005) and Jafari & Daftardar-Gejji (2006) ADM has used for solving systems
of fractional differential equations (linear and nonlinear). Convergence of Adomians method has been
studied in (Abdelrazec & Pelinovsky, 2011; Abbaoui & Cherruault, 1994; Ghanbari & Nuraei, 2014;
Hosseini & Nasabzadeh, 2006).
PRELIMINARIES 2.
In this section we present some definitions and useful concepts of fractional calculus and fuzzy set.
Let us consider ℜ𝐹 be a set of all fuzzy numbers on ℜ.
Definition 2.1. A fuzzy number is a map 𝑢: ℜ → [0,1] which satisfies (Zimmermann, 1991)
i. u is upper semi-continuous.
ii. u is fuzzy convex, i.e., 𝑢(𝜆𝑥 + (1 − 𝜆)𝑦) ≥ 𝑚𝑖𝑛{𝑢(𝑥), 𝑢(𝑦)}for all 𝑥, 𝑦 ∈ ℜ, 𝜆 ∈
[0,1].
iii. u is normal, i.e., ∃𝑥0 ∈ ℜ; 𝑢(𝑥0) = 1.
iv. 𝑠𝑢𝑝𝑝 𝑢 = {𝑥 ℜ|𝑢(𝑥) > 0} is the support of the 𝑢 , and its closer (𝑠𝑢𝑝𝑝 𝑢) is
compact.
The metric structure is given by the Hausdorff distance.
𝐷: ℜ𝐹 × ℜ𝐹 → ℜ+⋃{0},
𝐷(𝑢, 𝑣) = 𝑠𝑢𝑝𝛼∈[0,1]𝑚𝑎𝑥{|𝑢(𝛼) − 𝑣(𝛼)|, |𝑢(𝛼) − 𝑣(𝛼)|}.
(ℜ𝐹, 𝐷) is a complete metric space and the following properties are well known: (Ghanbari &
Nuraei, 2014).
i. 𝐷(𝑢⨁𝑤, 𝑣⨁𝑤) = 𝐷(𝑢, 𝑣) ∀ 𝑢, 𝑣, 𝑤 ∈ ℜ𝐹
ii. 𝐷(𝑢⨁𝑤, 0) = 𝐷(𝑢, 0) + 𝐷 (𝑣, 0 ) ∀𝑢, 𝑣 ∈ ℜ𝐹
iii. 𝐷(𝑢⨁𝑤, 𝑤⨁𝑧) ≤ 𝐷(𝑢, 𝑤) + 𝐷(𝑣, 𝑧) ∀ 𝑢, 𝑣, 𝑤, 𝑧 ∈ ℜ𝐹
iv. 𝐷(𝜆. 𝑢 , 𝜆. 𝑣) = |𝜆|𝐷(𝑢, 𝑣) ∀ 𝑢, 𝑣 ∈ ℜ𝐹 𝜆 ∈ ℜ𝐹
Definition 2.2. The generalized Hukuhara difference of two fuzzy numbers
(gH-difference for short) is defined as follows (Bede & Stefanini, 2013):
𝑢 ⊖𝑔𝐻𝑣=𝑤 ⇔{
(𝑖) 𝑢=𝑣⊕𝑊,(𝑖𝑖) 𝑣=𝑢⨁(−1)𝑤.
Definition 2.3. The generalized Hukuhara derivative of a fuzzy-valued function 𝑓: (𝑎, 𝑏) → ℜ𝐹 at
𝑥0 is defined as (Stefanini & Bede, 2009)
Fvu ,

*Corresponding author (Saeid Abbasbandy). Tel: +98-912-1305326 Email: [email protected] ©2019 International
Transaction Journal of Engineering, Management, & Applied Sciences & Technologies. Volume 10 No.12 ISSN 2228-9860 eISSN 1906-9642 CODEN: ITJEA8 Paper ID:10A12P http://TUENGR.COM/V10A/10A12P.pdf DOI: 10.6084/m9.figshare.11110514
3
00 lim)()( hgH xf
�)( 0 hxf
⊖)( 0xfgH
ℎ
Also, we say that
i. f is [(𝑖) − 𝑔𝐻] differentiable at 𝑥0 if
(𝑓)𝑔𝐻′ (𝑥0; 𝛼) = [𝑓−
′ (𝑥0, 𝛼), 𝑓+′ (𝑥0, 𝛼)], 0 ≤ 𝛼 ≤ 1.
ii. f is [(𝑖𝑖) − 𝑔𝐻] differentiable at 𝑥0 if
o (𝑓)𝑔𝐻′ (𝑥0; 𝛼) = [𝑓∓
′ (𝑥0, 𝛼), 𝑓−′ (𝑥0, 𝛼)], 0 ≤ 𝛼 ≤ 1.
Definition2.4. Let 𝑃𝑘(ℜ𝐹) denote the family of all nonempty, compact and convex
subsets of and define the addition and scalar multiplication in 𝑃𝑘 (ℜ𝑛) is usual (Armand
& Gouyandeh, 2013). A mapping 𝑓: 𝐼 → ℜ𝑛 is strongly measurable, if for all 𝛼 ∈ [0,1] the
set-valued mapping 𝑓𝑛: 𝐼 → 𝑃𝑘(ℜ𝑛) defined by
𝑓𝛼(𝑡) → [𝑓(𝛼)]𝑡
Is Lebesgue measurable, when 𝑃𝑘 (ℜ𝑛) is endowed with the topology generated by the Hausdorff
metric D.
Definition 2.5. A mapping 𝑓: 𝐼 → ℜ𝑛 is called integrably bounded if there exists an
integrable function h such that ‖𝑥‖ ≤ ℎ(𝑡) for all 𝑥 ∈ 𝑓0(𝑡) (Armand & Gouyandeh, 2013).
Definition 2.6. A strongly measurable and integrably bounded mapping 𝑓: 𝐼 → ℜ𝑛 is said
to be integrable over I if ∫ 𝑓(𝑡)𝑑𝑡 ∈ ℜ𝐹𝑡 (Armand & Gouyandeh, 2013).
Definition 2.7. Let 𝑓: [𝑎, 𝑏] → ℜ𝑛 . The fuzzy fractional Riemann-Liouville integral of
fuzzy-valued function f is defined as follows (Abasbandy et al., 2012)
(𝐽𝑎𝑣𝑓)(𝑥) =
1
Γ(𝑣)∫ (𝑥 − 𝑡)𝑣−1𝑥
𝑎𝑓(𝑡)𝑑𝑡,
for 0 ≤ 𝑉 ≤ 1. For V=1, we set 𝐼𝑎𝑙 = 𝐼, the identity operator.
Let us denote 𝐶𝐹[𝑎, 𝑏] as the space of all continuous fuzzy-valued functions on[𝑎, 𝑏].
Also, we denote the space of all integrable fuzzy-valued functions on interval [𝑎, 𝑏] by
𝐿𝐹[𝑎, 𝑏]Let 𝑓𝑔𝐻(𝑛)
∈ 𝐶𝐹[𝑎, 𝑏] ∩ 𝐿𝐹[𝑎, 𝑏], thus the fuzzy gH -fractional Caputo differentiable of
fuzzy-valued function 𝑓(𝐶𝐹 [𝑔𝐻]-differentiable for short) is defined as following.
Definition 2.8. Consider 𝑓: [𝑎, 𝑏] → ℜ𝑛 . Fractional derivative of under generalized
Hukuhara differentiability in the Caputo sense is defined as (Abasbandy et al., 2012)
(gH𝐷∗𝑣𝑓)(𝑥) =
1
Γ(𝑛−𝑣)∫ (𝑥 − 𝑡)𝑛−𝑣−1𝑓𝑔𝐻
(𝑛)(𝑡)𝑑𝑡, 𝑛 − 𝑖 < 𝑣 ≤ 𝑛, 𝑛 ∈ 𝑁, 𝑥 > 𝑎𝑥
𝑎
Also we say that f is CF
[(𝑖) − 𝑔𝐻]-differentiable at if
(gH𝐷∗𝑣𝑓)(𝑥0; 𝛼) = [(𝐷∗
𝑣𝑓−)(𝑥0; 𝛼), (𝐷∗𝑣𝑓+)(𝑥0; 𝛼)] 0 ≤ 𝛼 ≤ 1 (1)
And so f is CF
[(𝑖𝑖) − 𝑔𝐻]-differentiable at 𝑥0 if
(gH𝐷∗𝑣𝑓)(𝑥0; 𝛼) = [(𝐷∗
𝑣𝑓+)(𝑥0; 𝛼), (𝐷∗𝑣𝑓−)(𝑥0; 𝛼)] 0 ≤ 𝛼 ≤ 1 (2)
In this paper, we only consider CF
[𝑔𝐻]-differentiable of order 0 ≤ 𝑉 ≤ 1 for fuzzy-valued
n
f
0x

4 Sahar Askari, Tofigh Allahviranloo, Saeid Abbasbandy
function f. Furthermore
(𝐷∗𝑣𝑓−)(𝑥0; 𝛼)=
1
Γ(1−𝑣) ∫
(𝑓−)′(𝑡,𝛼)𝑑𝑡
(𝑥−𝑡)𝑣
𝑥
𝑎
And
(𝐷∗𝑣𝑓+)(𝑥0; 𝛼)=
1
Γ(1−𝑣) ∫
(𝑓+)′(𝑡,𝛼)𝑑𝑡
(𝑥−𝑡)𝑣
𝑥
𝑎
So
(gH𝐷∗𝑣𝑓)(𝑥; 𝛼) =
1
𝛤(1−𝑣)[min {∫
(𝑓−)′(𝑡,𝛼)𝑑𝑡
(𝑥−𝑡)𝑣
𝑥
𝑎, ∫
(𝑓+)′(𝑡,𝛼)𝑑𝑡
(𝑥−𝑡)𝑣
𝑥
𝑎} , 𝑚𝑎𝑥 {∫
(𝑓−)′(𝑡,𝛼)𝑑𝑡
(𝑥−𝑡)𝑣
𝑥
𝑎, ∫
(𝑓+)′(𝑡,𝛼)𝑑𝑡
(𝑥−𝑡)𝑣
𝑥
𝑎}]
Lemma 2.1. Suppose that 𝑓: [𝑎, 𝑏] → ℜ𝐹 be a fuzzy-valued function and 𝑓𝑔𝐻′ ∈ 𝐶𝐹[𝑎, 𝑏] ∩
𝐿𝐹[𝑎, 𝑏] Then (Allahviranloo et al., 2013) 𝐽𝑎𝑣(gH𝐷∗
𝑣𝑓(𝑥))(𝑥) = 𝑓(𝑥) ⊝ 𝑔𝐻𝑓(𝑎), 0 ≤ 𝛼 ≤ 1.
ADOMIAN DECOMPOSITION METHOD UNDER FUZZY FRACTIONAL 3.
CAPUTO DERIVATIVE
Consider a fuzzy Caputo fractional differential equation with fuzzy initial value as follows
{( 𝑔𝐻𝐷∗
𝑣𝑦(𝑡)) = 𝐹(𝑡, 𝑦(𝑡)) = 𝐿𝑦(𝑡) + 𝑁𝑦(𝑡)
𝑦(𝑡0) = 𝑦0 ∈ ℜ𝐹
(3)
So that 0 ≤ 𝑉 ≤ 1 and 𝐹: [𝑎, 𝑏] × ℜ𝐹 → ℜ𝐹 is supposed to be continuous. Also gH𝐷∗𝑣
denote the generalized Hukuhara Caputo derivative of y(t) which must be determined. Also
is a linear operator and N represents the nonlinear operator.
The Adomian supposes that the unknown function y(t) can be written by a sum of
components as
𝑦(𝑡) = ∑ 𝑦𝑖 ,∞𝑖=0
And so, the nonlinear operator is represented by an in finite series as
𝑁(𝑡) = 𝐴(𝑡) = ∑ 𝐴𝑖,
∞
𝑖=0
Such that 𝐴𝑖(𝑡) are called Adomian’s polynomials, given as
𝐴𝑖 =1
𝑖!
𝑑𝑖
𝑑𝜆𝑖[𝑁(∑ 𝜆𝑗𝑦𝑗
∞𝑗=0 )]
𝜆=0 𝑖 = 0,1,2, ….
Finally to calculate terms of series∑ 𝑦𝑖∞𝑗=0 , we use the iterated scheme that explain in
theorem 3.1.
Lemma3.1. Let 𝑦𝑖, 𝑖 = 0,1,2, … , 𝑛 be fuzzy continuous functions. Thus
(gH 𝐷∗𝑣 ∑ 𝑦𝑖
𝑛𝑖=0 (𝑡)) = ∑ 𝐷∗
𝑣𝑦𝑖(𝑡).𝑛𝑖=0
Proof: We prove this lemma by mathematical induction and (i) -gH-differentiability.
L
)(tNy
.)()(
)(,)()(,)(
)()(,)()(
)()(,)()()()(
1*0*
11*00*
1*0*1*0*
10*10*10*
tyDtyD
tytyDtytyD
tyDtyDtyDtyD
tytyDtytyDtytyD
v
gH
v
gH
vv
vvvv
vvv
gH

*Corresponding author (Saeid Abbasbandy). Tel: +98-912-1305326 Email: [email protected] ©2019 International
Transaction Journal of Engineering, Management, & Applied Sciences & Technologies. Volume 10 No.12 ISSN 2228-9860 eISSN 1906-9642 CODEN: ITJEA8 Paper ID:10A12P http://TUENGR.COM/V10A/10A12P.pdf DOI: 10.6084/m9.figshare.11110514
5
Suppose that
Thus
Theorem 3.1. Assume that 𝑦(𝑡) = ∑ 𝑦𝑖∞𝑖=0 in Eq.(3.1), so that terms of series can be in the
various types of differentiability. We consider four cases in this theorem.
Case (I). Let 𝑦𝑖(t), ∀i (i = 0,1, … ) is (i)-gH-differentiable, then
𝑦0(𝑡) = 𝑦0(𝑡0)
𝑦𝑖(𝑡) = 𝐽𝑡0
𝑣 𝐿𝑦𝑖−1(𝑡)⨁ 𝐽𝑡0
𝑣 𝐴𝑖−1(𝑡). 𝑖 = 1,2, … (4)
Case (II). Let 𝑦𝑖(t), ∀i (i = 0,1, … ) is (ii)-gH-differentiable, then
𝑦0(𝑡) = 𝑦0(𝑡0)
𝑦𝑖(𝑡) = 0 ⊖ (−1)𝐽𝑡0
𝑣 𝐿𝑦𝑖−1(𝑡) ⊖ (−1) 𝐽𝑡0
𝑣 𝐴𝑖−1(𝑡). 𝑖 = 1,2, … (5)
Case (III). Let i is even, 𝑦𝑖(𝑡) is (i)-gH-differentiable and j is odd, 𝑦𝑗(𝑡) is
(ii)-gH-differentiable, then
(6)
Proof: Assume that 𝑦𝑖(t) 𝑖 = 0,1,2, … is continues function.
(I) Let 𝑦𝑖(t), ∀i (i = 0,1, … ) is differentiable as in Definition 2.3 (i).Thus
By the Riemann-Liouville integral of two side of above equation we have
).()(
)()(
))(())((
))(,())((
))(())((
00
*
1
0*
*
0,
0
*
0
*
00
0
00
00
00
tAJtLyJ
tNytLyJ
tyDJtyDJ
tytFJtyDJ
tyDJtyDJ
i
i
ti
i
t
t
igHt
i
gHt
tigHt
i
i
i
gHti
i
gHt
Now by Lemma (2.1) we obtain ⊝ ⊝
1
0
*
1
0
* ).()(n
i
i
v
gH
n
i
i
v
gH tyDtyD
n
i
i
v
gH
n
i
ni
v
gH
n
i
i
v
gH tyDtytyDtyD0
*
1
0
*
0
* ).()()()(
))(,()()(00
**
i
i
i
igHgH tytFtyDtyD
)(( 0 ty)([))(
1
00 tyty i
i
)]( 0tyi
),()(00
00tAJtLyJ i
i
ti
i
t

6 Sahar Askari, Tofigh Allahviranloo, Saeid Abbasbandy
Thus by suppose that we find
𝑦0(𝑡) = 𝑦0(𝑡0)
𝑦𝑖(𝑡) = 0 ⊖ (−1)𝐽𝑡0
𝑣 𝐿𝑦𝑖−1(𝑡) ⊖ (−1) 𝐽𝑡0
𝑣 𝐴𝑖−1(𝑡). 𝑖 = 1,2, …
(II) Suppose that is differentiable as in Definition 2.3(ii).similar to proof
of (i), we have
,
Thus
⊝ ⊝
Therefor
𝑦0(𝑡) = 𝑦0(𝑡0)
𝑦𝑖(𝑡) = 0 ⊖ (−1)𝐽𝑡0
𝑣 𝐿𝑦𝑖−1(𝑡) ⊖ (−1) 𝐽𝑡0
𝑣 𝐴𝑖−1(𝑡). 𝑖 = 1,2, …
(III) Suppose that i is even, 𝑦𝑖 (𝑡) is differentiable according to Definition 2.3(i) and j is odd,
𝑦𝑗(𝑡) is differentiable as in Definition 2.3(ii). Thus
⊝ ⊝ ⊝
𝐽𝑡0
𝑣 ∑ 𝐿𝑦𝑗(𝑡)∞𝑗=0 ⨁𝐽𝑡0
𝑣 ∑ 𝐴𝑗∞𝑗=0 (𝑡).
Now we give
0~
)( ty j ⊝)()1( 10
tLyJ jt
⊝oddisjtAJ jt ).()1( 10
Therefor the proof is completed for even and odd indexes.
ADOMIAN DECOMPOSITION METHOD FOR SOLVING FUZZY CAPUTO’S 4.
FRACTIONAL DIFFERENTIAL EQUATIONS
Convergence of the ADM to the exact solution is established for many kinds of problems. For
instace, Fuzzy initial-value problems, Fuzzy linear systems, Boundary value problems, Partial
differential equations and etc. (Abdelrazec & Pelinovsky, 2011; Adomian, 1988; Adomian, 1994;
Abbaoui & Cherruault, 1994; Agarwal et al., 2010)
In this section we are going to show the uniformly convergence of the successive iterations in
theorem 3.1. into as an application of ADM. To this end, we need some Lemmas.
0~
)( 0 tyi
,...)1,0(,)( iityi
)()())(())(( 0*
1
0* 00tNytLyJtyDJtyDJ tigHt
i
gHt
)()1(( 00 ty)([))()1( 0
1
0 tyty i
i
)]()1( tyi
).()(00
00tAJtLyJ i
i
ti
i
t
)()(...))(())(())((00
2*1*0* 00000tAJtLyJtyDJtyDJtyDJ i
i
ti
i
tgHtgHtgHt
)(( 0 ty )()1(())( 0100 tyty ))()1( 1 ty )(( 2 ty ...))( 02 ty
)(ty
evenisitAJtLyJty
tyty
ititi ,)()(0~
)(
),()(
11
000
00

*Corresponding author (Saeid Abbasbandy). Tel: +98-912-1305326 Email: [email protected] ©2019 International
Transaction Journal of Engineering, Management, & Applied Sciences & Technologies. Volume 10 No.12 ISSN 2228-9860 eISSN 1906-9642 CODEN: ITJEA8 Paper ID:10A12P http://TUENGR.COM/V10A/10A12P.pdf DOI: 10.6084/m9.figshare.11110514
7
Lemma 4.1. Adomian’s polynomials are bounded. It means , that 𝐷 is Hausdorff
metric.
Proof:
𝑑𝑖
𝑑𝜆𝑖[𝑁(∑ 𝜆𝑗𝑦𝑗
∞𝑗=0 )]
𝜆=0 is a polynomial that for is bounded. Thus the proof is completed.
Remark 4.1. (𝑥 − 𝑠)𝑣−1 in fuzzy Riemann-Liouville integral is continuous and bounded. Thus we
suppose that ∫ |𝑥 − 𝑠|𝑣−1𝑡
𝑡0𝑑𝑠 ≤ 𝑁.
Theorem 4.1. Assume that Eq. (3.1) satisfies the following conditions
(i) In the linear terms for 𝑖 ≥ 1, 𝐷(𝐿𝑦𝑖(𝑡), 𝐿𝑦𝑖−1
(𝑡)) ≤ 𝑃 and 1 < 𝑃 < 𝑁−1 such that N is
explained in Remark 4.1 .
(ii) In the nonlinear terms for 𝑖 ≥ 1, 𝐷(𝐴𝑖(𝑡), 𝐴𝑖−1(𝑡)) ≤ 𝑀, and 1 < 𝑀 < 𝑃−1.
Then the successive iterations in theorem 3.1. are uniformly convergent to 𝑦(𝑡) on [t0, a].
Proof:
We prove the theorem for case (I). The proof of other cases is similar to case (I) that omitted here.
By hypothesis, for case (I) we get
(7).
Thus we get
(8).
With this manner we have
MtAD i )0~
),((
0~
,)(!
1
0~
,)(!
1)0
~),((
00
00
j
j
j
i
i
j
j
j
i
i
i
yNd
dD
i
yNd
d
iDtAD
0
.)(),(sup)(
)()(),()(sup)(
1
)()(),()()(
1
)()()(,)()()()(
1
)))()(()()(
1,))()(()(
)(
1))(),((
1
1
11
11
1
11
11
11
11
1
0
00
0
0
00
tytyDN
dssxtAtLytAtLyD
dssAsLysAsLyDsx
dssAsLysxsAsLysxD
dssAsLysxdssAsLysxDtytyD
nnatt
t
tnnnn
att
nnnn
t
t
nnnn
t
t
nn
t
tnn
t
tnn
)).(),((sup)(
))(),((sup 11
00
tytyDN
tytyD nnatt
nnatt

8 Sahar Askari, Tofigh Allahviranloo, Saeid Abbasbandy
(9)
For , we get
(10)
From (4.4) and by hypothesis, we obtain
(11)
If we substitute (4.5) to (4.3) we will get
By hypothesis and since and , we can write
So this guarantee that the sequence {yn (t)} is convergence and if we denote 𝑦(𝑡) = lim𝑛→∞ 𝑦𝑛 (𝑡).
Then 𝑦(𝑡) satisfies Equation (3).
By reasoning similar to case (I) the uniformly convergence of sequence {yi (t)} to 𝑦(𝑡) is
established.
EXAMPLE 5.
We consider example has nonlinear part to illustrate the ADM.
Example: Let us consider the nonlinear FFDE
.]2,[)0(
0),()( 225.0
*
F
gH
y
ttttytD
The exact ])[( gHiCF -differentiable solutions is .)( tty
)).(),((sup)(
...))(),((sup)(
))(),((sup)(
))(),((sup
121
1
322
2
211
00
00
tytyDN
tytyDN
tytyDN
tytyD
attn
n
nnatt
nnatt
nnatt
1n
,)(),()(),()(
1
)()()(,)()()()(
1
))()(()()(
1,))()(()(
)(
1))(),((
0101
1
00
1
11
1
00
1
11
1
12
0
0
00
dssAsADsLysLyDsx
dssAsLysxsAsLysxD
dssAsLysxdssAsLysxDtytyD
t
t
t
t
t
t
t
t
.
)())(),((sup 12
0
NMPtytyD
att
).()(
)()())(),((sup
1
1
1
0
MPN
NMPNtytyD
n
n
n
n
nnatt
nPP nMM
,0)(
)()(lim
)()(
lim))(),((suplim 01
0
n
nn
n
nn
n
n
nnatt
n
MPNP
MPN
tytyD
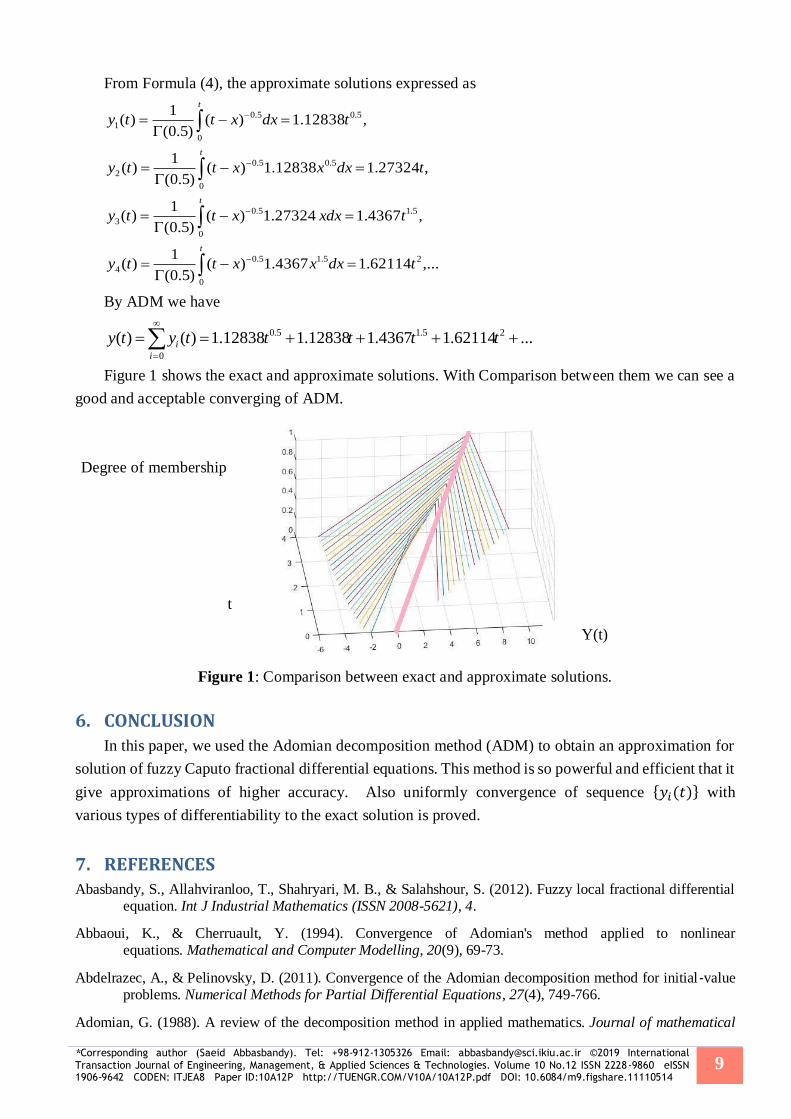
*Corresponding author (Saeid Abbasbandy). Tel: +98-912-1305326 Email: [email protected] ©2019 International
Transaction Journal of Engineering, Management, & Applied Sciences & Technologies. Volume 10 No.12 ISSN 2228-9860 eISSN 1906-9642 CODEN: ITJEA8 Paper ID:10A12P http://TUENGR.COM/V10A/10A12P.pdf DOI: 10.6084/m9.figshare.11110514
9
From Formula (4), the approximate solutions expressed as
,...62114.14367.1)()5.0(
1)(
,4367.127324.1)()5.0(
1)(
,27324.112838.1)()5.0(
1)(
,12838.1)()5.0(
1)(
25.1
0
5.0
4
5.1
0
5.0
3
5.0
0
5.0
2
5.0
0
5.0
1
tdxxxtty
txdxxtty
tdxxxtty
tdxxtty
t
t
t
t
By ADM we have
0
25.15.0 ...62114.14367.112838.112838.1)()(i
i tttttyty
Figure 1 shows the exact and approximate solutions. With Comparison between them we can see a
good and acceptable converging of ADM.
Figure 1: Comparison between exact and approximate solutions.
CONCLUSION 6.
In this paper, we used the Adomian decomposition method (ADM) to obtain an approximation for
solution of fuzzy Caputo fractional differential equations. This method is so powerful and efficient that it
give approximations of higher accuracy. Also uniformly convergence of sequence {𝑦𝑖(𝑡)} with
various types of differentiability to the exact solution is proved.
REFERENCES 7.
Abasbandy, S., Allahviranloo, T., Shahryari, M. B., & Salahshour, S. (2012). Fuzzy local fractional differential equation. Int J Industrial Mathematics (ISSN 2008-5621), 4.
Abbaoui, K., & Cherruault, Y. (1994). Convergence of Adomian's method applied to nonlinear equations. Mathematical and Computer Modelling, 20(9), 69-73.
Abdelrazec, A., & Pelinovsky, D. (2011). Convergence of the Adomian decomposition method for initial‐value problems. Numerical Methods for Partial Differential Equations, 27(4), 749-766.
Adomian, G. (1988). A review of the decomposition method in applied mathematics. Journal of mathematical
Y(t)
t
Degree of membership

10 Sahar Askari, Tofigh Allahviranloo, Saeid Abbasbandy
analysis and applications, 135(2), 501-544.
Adomian, G. (1994). Solving Frontier Problems Decomposition Method.
Agarwal, R. P., Lakshmikantham, V., & Nieto, J. J. (2010). On the concept of solution for fractional differential equations with uncertainty. Nonlinear Analysis: Theory, Methods & Applications, 72(6), 2859-2862.
Allahviranloo, T. (2005). The Adomian decomposition method for fuzzy system of linear equations. Applied mathematics and computation, 163(2), 553-563.
Allahviranloo, T., Kiani, N. A., & Motamedi, N. (2009). Solving fuzzy differential equations by differential transformation method. Information Sciences, 179(7), 956-966.
Allahviranloo, T., Armand, A., Gouyandeh, Z., & Ghadiri, H. (2013). Existence and uniqueness of solutions for fuzzy fractional Volterra-Fredholm integro-differential equations. Journal of Fuzzy Set Valued Analysis, 2013, 1-9.
Allahviranloo, T., Armand, A., & Gouyandeh, Z. (2014). Fuzzy fractional differential equations under generalized fuzzy Caputo derivative. Journal of Intelligent & Fuzzy Systems, 26(3), 1481-1490.
Armand, A., & Gouyandeh, Z. (2013). Solving two-point fuzzy boundary value problem using the variational iteration method. Communications on Advanced Computational Science with Applications, 2013, 1-10.
Arshad, S., & Lupulescu, V. (2011). On the fractional differential equations with uncertainty. Nonlinear Analysis: Theory, Methods & Applications, 74(11), 3685-3693.
Arshad, S., & Lupulescu, V. (2011). Fractional differential equation with the fuzzy initial condition. Electronic Journal of Differential Equations.
Bede, B., & Stefanini, L. (2013). Generalized differentiability of fuzzy-valued functions. Fuzzy Sets and Systems, 230, 119-141.
Daftardar-Gejji, V., & Jafari, H. (2005). Adomian decomposition: a tool for solving a system of fractional differential equations. Journal of Mathematical Analysis and Applications, 301(2), 508-518.
Ghanbari, M., & Nuraei, R. (2014). Convergence of a semi-analytical method on the fuzzy linear systems. Iranian Journal of Fuzzy Systems, 11(4), 45-60.
Goetschel Jr, R., & Voxman, W. (1986). Elementary fuzzy calculus. Fuzzy sets and systems, 18(1), 31-43.
Hosseini, M. M., & Nasabzadeh, H. (2006). On the convergence of Adomian decomposition method. Applied mathematics and computation, 182(1), 536-543.
Jafari, H., & Daftardar-Gejji, V. (2006). Solving linear and nonlinear fractional diffusion and wave equations by Adomian decomposition. Applied Mathematics and Computation, 180(2), 488-497.
Mohammed, O. H., & Khaleel, O. I. (2016). Fractional differential transform method for solving fuzzy integro-differential equations of fractional order. basrah journal of science, 34(2 A), 31-40.
Park, J. Y., & Han, H. K. (1999). Existence and uniqueness theorem for a solution of fuzzy differential equations. International Journal of Mathematics and Mathematical Sciences, 22(2), 271-279.
Park, J. Y., & Jeong, J. U. (1999). A note on fuzzy integral equations. Fuzzy Sets and Systems, 108(2), 193-200.
Puri, M. L., Ralescu, D. A., & Zadeh, L. (1993). Fuzzy random variables. In Readings in Fuzzy Sets for Intelligent
Systems(pp. 265-271). Morgan Kaufmann.
Shawagfeh, N. T. (2002). Analytical approximate solutions for nonlinear fractional differential equations. Applied Mathematics and Computation, 131(2-3), 517-529.
Stefanini, L., & Bede, B. (2009). Generalized Hukuhara differentiability of interval-valued functions and interval
differential equations. Nonlinear Analysis: Theory, Methods & Applications, 71(3-4), 1311-1328.
Wazwaz, A. M. (2001). Exact solutions to nonlinear diffusion equations obtained by the decomposition method. Applied Mathematics and Computation, 123(1), 109-122.
Wazwaz, A. M. (2005). Adomian decomposition method for a reliable treatment of the Emden–Fowler

*Corresponding author (Saeid Abbasbandy). Tel: +98-912-1305326 Email: [email protected] ©2019 International
Transaction Journal of Engineering, Management, & Applied Sciences & Technologies. Volume 10 No.12 ISSN 2228-9860 eISSN 1906-9642 CODEN: ITJEA8 Paper ID:10A12P http://TUENGR.COM/V10A/10A12P.pdf DOI: 10.6084/m9.figshare.11110514
11
equation. Applied Mathematics and Computation, 161(2), 543-560.
Cong-Xin, W., & Ming, M. (1991). Embedding problem of fuzzy number space: Part I. Fuzzy Sets and Systems, 44(1), 33-38.
Zimmermann, H. J. (1991). Fuzzy set theory–Its application, 2nd Editions. Dordercht: Kluwer Academic
Publishers.
Sahar Askari is a PhD. Student in Mathematics at IAU, Iran, Hamedan. Her recent research interests numerical solution
of Fuzzy Optimal Control.
Dr. Tofigh Allahviranloo is a professor of applied Mathematics at SRB-IAU,.Iran. He got his BS in Pure Mathematics from Tabriz University. He received his MS. And PhD in Computational and Applied Mathematics, from Azad University. His
research is related to Uncertain Mathematics, Uncertain Dynamical Systems, Decision Science, Fuzzy Systems.
Professor Dr. Saeid Abbasbandy is Professor at the Department of Mathematics, Imam Khomeini International University, Gazvin, Iran. He received a Master of Science degree and a PhD from Kharazmi University. His researches
encompasses Numerical Analysis, Homotopy Analysis Method.

*Corresponding author (S. Salajeghe). Email: [email protected] ©2019 International Transaction Journal of
Engineering, Management, & Applied Sciences & Technologies. Volume 10 No.12 ISSN 2228-9860 eISSN 1906-9642 CODEN:
ITJEA8 Paper ID:10A12Q http://TUENGR.COM/V10A/10A12Q.pdf DOI: 10.6084/m9.figshare.10316012 1
International Transaction Journal of Engineering, Management, & Applied Sciences & Technologies
http://TuEngr.com
PAPER ID: 10A12Q
AN EDUCATIONAL EFFECTIVENESS MODEL DEVELOPMENT
BASED ON HUMAN RESOURCE STRATEGIES BY GROUNDED
THEORY IN DISTRICT 7 OF IRANIAN GAS TRANSMISSION
COMPANY
Behrooz Bigdeli Mojarad a*
, Sanjar Salajegheh b
a Department of Human Resources Management, Faculty of Public Administration, Kerman Branch, Islamic Azad University, Kerman, IRAN.
b Department of Governmental Management, Kerman Branch, Islamic Azad University, Kerman, IRAN.
A R T I C L E I N F O
A B S T R A C T
Article history:
Received 20 May 2019 Received in revised form 03
June 2019
Accepted 26 July 2019
Available online 07 August
2019
Keywords:
HRM; HR strategies;
Continuous education;
Educational
effectiveness; Practical
training; Teaching
methods; Grounded
theory.
This study developed an educational effectiveness model based on
human resource strategies by grounded theory in District 7 of the
Iranian Gas Transmission Company. In the qualitative section, 13
experts in District 7 were interviewed to collect data. The statistical
population included 221 employees and managers of District 7 of the
Iranian Gas Transmission Company. The results showed a positive and
significant relationship between organizational communication,
practical training, teaching methods, and continuous education and
educational effectiveness. There was a positive and significant
relationship between HR strategies and organizational communication.
There was a positive and significant relationship between HR strategies
and practical training. There was no significant relationship between
HR strategies and teaching methods. There was a positive and
significant relationship between HR strategies and continuous
education.
©2019 INT TRANS J ENG MANAG SCI TECH.
1. INTRODUCTION
One of the most important organizational components which can be effective in adapting,
surviving and developing organizations to achieve strategic goals is the training and improvement of
knowledge capital or human resources to provide an acceptable level of cognitive knowledge
(knowledge of what), advanced skills (knowledge of how) and systemic understanding (knowledge of
why) in human resources of the organization to address the problems limiting strategic goals
(Navehebrahim & Eidi, 2006). Training and improvement is a set of programmed efforts of an
organization to facilitate the learning of employees about their job competences in line with strategic
©2019 International Transaction Journal of Engineering, Management, & Applied Sciences & Technologies

2 Behrooz Bigdeli Mojarad, Sanjar Salajegheh
goals (Noe, 2002). In order to estimate the educational needs and formulate the curriculum, the
questioning approach and an examination of what training people and departments need can be
transformed into the approach to address the problems of people and departments, and this is due to
the fact that people and departments should exactly estimate and suggest teachings based on the
problem. Thus, when need assessment begins with a strategic approach, educational effectiveness can
be determined in solving the problems which are based on training content and course (Bamberger et
al., 2014). Currently, organizations emphasize the provision of learning opportunities for employees
at different organizational levels; with increasing attention to education, expectations and demands
have also been promoted simultaneously. If previously training courses and employee attendance
appeared to be persuasive, currently training is expected to facilitate organizational goals. In addition
to training, therefore, educational system of organizations should consider the effectiveness of these
courses (Snell et al., 2015). In this regard, a curriculum can only explain its worth when it provides
credible and valid evidence of the effect of training in improving the performance of participants.
This refers to an important aspect of education, often referred to as educational effectiveness
(Ghahremani, 2003). In other words, value of education is measured as other organizational activities
through determining it to achieve organizational goals.
Currently, effectiveness is particularly important in administrative and educational
organizations, because in the current fast-paced world, organizations are able to survive which are
effective enough and able to achieve their predetermined goals more than ever. Most experts consider
effectiveness as the degree to which a goal is achieved; that is, in every action that is purposeful and
based on predetermined goals. Whatever it is closer to the predetermined goal and has been able to
achieve the goals, it will have a higher effectiveness than achieving the goals.
Unfortunately, most organizations greatly focus on and invest in educational effectiveness at the
final stage of the course; the greatest attention should be paid when education is considered as a
solution to the identified problem. Is teaching a solution? If the answer is yes, what requirements
should be taken into consideration for the more effective education from the first step? (Abili, 2009).
There are some conditions and factors which can affect the effective reduction or increase of training
courses. These factors include training course duration, training course content, training course
quality, learner experiences, job attitude, desire to learn new things, study skills, learner attitudes, job
counseling, equipment and facilities of training courses. Given the importance and place of education
and effort and desire to invest in the past and future plans, it is logical to present these training when
they are effective; it is essential to consider the effective factors, both positive and negative, to
promote them. It should be noted that the courses are effective when the content of these training
courses is consistent with needs of the organization. Hence, this study tends to develop an educational
effectiveness model based on human resources strategies in order to present and propose a suitable
and comprehensive model.
2. LITERATURE REVIEW
Human resource strategies: HR Strategy is defined as the arrangement and activities of the
planned human resources model for empowering the organization to achieve its goals.
Education: Education is an experience based on learning to make gradual and relatively stable
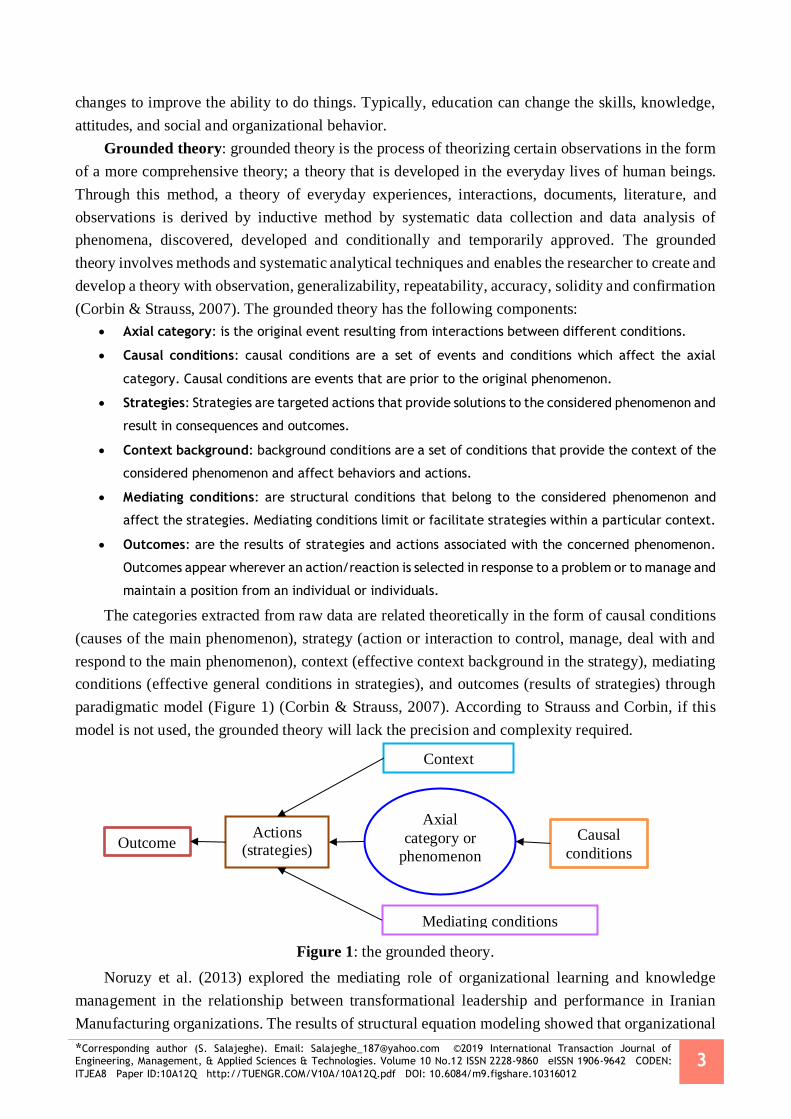
*Corresponding author (S. Salajeghe). Email: [email protected] ©2019 International Transaction Journal of
Engineering, Management, & Applied Sciences & Technologies. Volume 10 No.12 ISSN 2228-9860 eISSN 1906-9642 CODEN:
ITJEA8 Paper ID:10A12Q http://TUENGR.COM/V10A/10A12Q.pdf DOI: 10.6084/m9.figshare.10316012 3
changes to improve the ability to do things. Typically, education can change the skills, knowledge,
attitudes, and social and organizational behavior.
Grounded theory: grounded theory is the process of theorizing certain observations in the form
of a more comprehensive theory; a theory that is developed in the everyday lives of human beings.
Through this method, a theory of everyday experiences, interactions, documents, literature, and
observations is derived by inductive method by systematic data collection and data analysis of
phenomena, discovered, developed and conditionally and temporarily approved. The grounded
theory involves methods and systematic analytical techniques and enables the researcher to create and
develop a theory with observation, generalizability, repeatability, accuracy, solidity and confirmation
(Corbin & Strauss, 2007). The grounded theory has the following components:
Axial category: is the original event resulting from interactions between different conditions.
Causal conditions: causal conditions are a set of events and conditions which affect the axial
category. Causal conditions are events that are prior to the original phenomenon.
Strategies: Strategies are targeted actions that provide solutions to the considered phenomenon and
result in consequences and outcomes.
Context background: background conditions are a set of conditions that provide the context of the
considered phenomenon and affect behaviors and actions.
Mediating conditions: are structural conditions that belong to the considered phenomenon and
affect the strategies. Mediating conditions limit or facilitate strategies within a particular context.
Outcomes: are the results of strategies and actions associated with the concerned phenomenon.
Outcomes appear wherever an action/reaction is selected in response to a problem or to manage and
maintain a position from an individual or individuals.
The categories extracted from raw data are related theoretically in the form of causal conditions
(causes of the main phenomenon), strategy (action or interaction to control, manage, deal with and
respond to the main phenomenon), context (effective context background in the strategy), mediating
conditions (effective general conditions in strategies), and outcomes (results of strategies) through
paradigmatic model (Figure 1) (Corbin & Strauss, 2007). According to Strauss and Corbin, if this
model is not used, the grounded theory will lack the precision and complexity required.
Figure 1: the grounded theory.
Noruzy et al. (2013) explored the mediating role of organizational learning and knowledge
management in the relationship between transformational leadership and performance in Iranian
Manufacturing organizations. The results of structural equation modeling showed that organizational
Context
Mediating conditions
Actions (strategies) Outcome
Causal
conditions
Axial
category or
phenomenon

4 Behrooz Bigdeli Mojarad, Sanjar Salajegheh
learning processes have a direct, significant effect on organizational performance and have a
mediating role in the relationship between transformational leadership and organizational
performance.
3. MATERIALS AND METHODS
In terms of objective, this study can be considered a type of applied research. In the quantitative
section, the statistical population included 570 personnel and managers of the 7th district of the
Iranian Gas Transportation Company. Purposive and snowball sampling were used. In the qualitative
section, the statistical sample included 13 experts in District 7 of the Iran Gas Transportation
Company. The Cochran formula was used to determine the sample size. According to the Cochran
formula and statistical population (570 people), the sample consisted of 230 employees and managers
of 7th
district. A researcher-made questionnaire based on components extracted from the interviews
was used to measure variables of the grounded theory. In this study, α>0.7 was considered as a
suitable level for reliability of the instrument. Due to the application of mixed heuristic methods,
qualitative and quantitative data analyses were used according to requirements of the study. In the
qualitative section, data analysis involved theoretical coding (derived from grounded theory).
Analysis of the data obtained in this study was carried out separately. In other words, qualitative data
were analyzed using open, axial and selective coding and requirements for each of these steps. The
questionnaire was developed and used as a study tool distributing to collect quantitative data. To
analyze quantitative data, confirmatory factor analysis (CFA) was used to determine validity; path
analysis and Structural Equation Modeling (SEM) were used to test the model. In the quantitative
section, data was analyzed by CFA and path analysis using LISREL software as shown in
Chehrehpak et al. (2018). All three types of coding, including open coding based on the extracted
categories, axial coding and selective coding were used. The coding steps used included open coding
based on the categories extracted from the preliminary review of literature, axial coding, and selective
coding.
According to the conceptual model, the hypotheses included:
H1: there is a relationship between educational need assessment and HR strategies.
H2: there is a relationship between learner characteristics and HR strategies.
H3: there is a relationship between planning and HR strategies.
H4: there is a relationship between educational fit and HR strategies.
H5: there is a relationship between talent management and HR strategies.
H6: there is a relationship between job development and HR strategies.
H7: there is a relationship between employee motivation and HR strategies.
H8: there is a relationship between assessment, organizational communication, practical training,
teaching methods and continuous education.
H9: there is a relationship between employee participation and organizational communication,
practical training, teaching methods and continuous education.
H10: there is a relationship between organizational climate and organizational communication,
practical training, teaching methods and continuous education.
H11: there is a relationship between education support and organizational communication, practical
training, teaching methods and continuous education.
H12: there is a relationship between benchmarking and organizational communication, practical
training, teaching methods and continuous education.
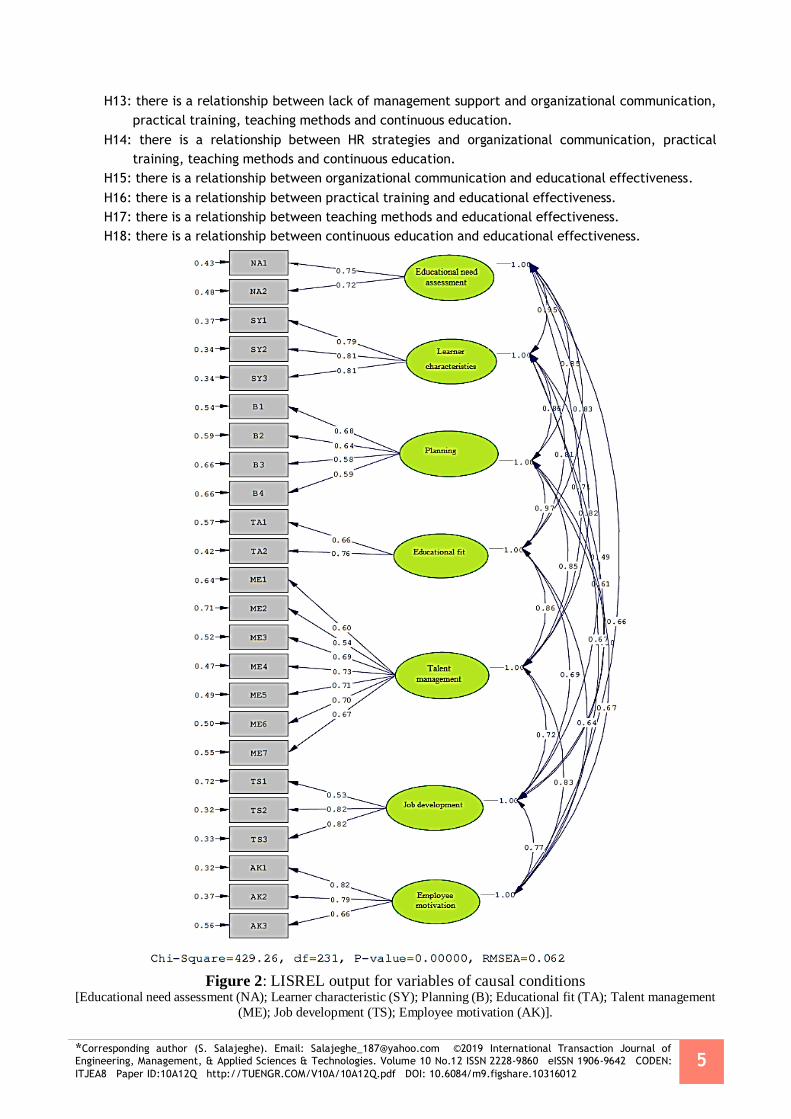
*Corresponding author (S. Salajeghe). Email: [email protected] ©2019 International Transaction Journal of
Engineering, Management, & Applied Sciences & Technologies. Volume 10 No.12 ISSN 2228-9860 eISSN 1906-9642 CODEN:
ITJEA8 Paper ID:10A12Q http://TUENGR.COM/V10A/10A12Q.pdf DOI: 10.6084/m9.figshare.10316012 5
H13: there is a relationship between lack of management support and organizational communication,
practical training, teaching methods and continuous education.
H14: there is a relationship between HR strategies and organizational communication, practical
training, teaching methods and continuous education.
H15: there is a relationship between organizational communication and educational effectiveness.
H16: there is a relationship between practical training and educational effectiveness.
H17: there is a relationship between teaching methods and educational effectiveness.
H18: there is a relationship between continuous education and educational effectiveness.
Figure 2: LISREL output for variables of causal conditions
[Educational need assessment (NA); Learner characteristic (SY); Planning (B); Educational fit (TA); Talent management
(ME); Job development (TS); Employee motivation (AK)].

6 Behrooz Bigdeli Mojarad, Sanjar Salajegheh
4. RESULTS
4.1 CFA FOR VARIABLES OF CAUSAL CONDITIONS
CFA was used to validate the variables of causal conditions. Figure 2 reports factor loading. The
numbers on the paths are factor loads; all factor loads are greater than 0.3 with p-value<0.01.
According to LISREL output, the calculated χ2/df=1.86; χ
2/df<3 indicates fit of the model. Moreover,
root mean square error approximation (RMSEA) should be less than 0.08; in the presented model,
RMSEA=0.062. GFI, AGFI, CFI, and NFI should be more than 0.9, which are higher than 0.9 in the
model. Therefore, data is well fitted to factor structure of this scale, suggesting consistency of the
questions with variables of causal conditions.
4.2 CFA OF STRATEGIES
CFA was used to validate strategies. All factor loadings (Organizational communication;
Practical training; Teaching methods; Continuous education) was greater than 0.3 with p-value<0.01
(Figure 3). According to LISREL output, the calculated χ2/df=1.72; χ
2/df<3 indicates fit of the model.
Moreover, RMSEA should be less than 0.08; in the presented model, RMSEA=0.057. GFI, AGFI,
CFI, and NFI should be more than 0.9, which are higher than 0.9 in the model. Therefore, data is well
fitted to factor structure of this scale, suggesting consistency of the questions with strategies.
Figure 3: LISREL output for strategies
[Organizational communication (ES); Practical teaching (AM); Teaching methods (RA); Continuous education (AS)].

*Corresponding author (S. Salajeghe). Email: [email protected] ©2019 International Transaction Journal of
Engineering, Management, & Applied Sciences & Technologies. Volume 10 No.12 ISSN 2228-9860 eISSN 1906-9642 CODEN:
ITJEA8 Paper ID:10A12Q http://TUENGR.COM/V10A/10A12Q.pdf DOI: 10.6084/m9.figshare.10316012 7
4.3 CFA OF VARIABLES OF CONTEXT
CFA was used to validate strategies. All factor loads (Assessment; Employee participation;
Education support; Organizational climate) was greater than 0.3 with p-value<0.01 (Figure 4). Fit
indices also were valid. According to LISREL output, the calculated χ2/df=1.79; χ
2/df<3 indicates fit
of the model. Moreover, RMSEA should be less than 0.08; in the presented model, RMSEA=0.060.
GFI, AGFI, CFI, and NFI should be more than 0.9, which are higher than 0.9 in the model. Therefore,
data is well fitted to factor structure of this scale, suggesting consistency of the questions with
variables of context.
Figure 4: LISREL output for variables of context
[Assessment (A); Employee participation (HA); Educational Support (MK); Organizational Climate (JS)].
Figure 5: LISREL output for mediating factors
[Benchmarking (OL); Lack of management support (AHM)].

8 Behrooz Bigdeli Mojarad, Sanjar Salajegheh
4.4 CFA OF MEDIATING FACTORS
CFA was used to validate mediating factors. All factor loads (Benchmarking and Lack of
management support) are greater than 0.3 with p-value<0.01 (Figure 5). Findings related to fit indices
of mediating factors indicate that CFI=1, GFI=0.96, NFI=0.99 and RMSEA=0.052 are acceptable.
These indices show that the data is well fitted to factor structure of this scale, suggesting consistency
of the questions with mediating factors.
Figure 6: Standardized coefficients of the tested model (*p<0.05; **p<0.01).
4.5 FINAL MODEL
By validating the measurement instruments to identify the relationship between variables, the
next step is path analysis. Pearson correlation coefficient was used to identify the relationship
between variables in the model. Findings related to the correlation coefficient between the variables
indicate a positive and significant correlation between the variables. Figure 6 shows the tested model
with standardized values on each of the paths. Red numbers indicate insignificance of the paths. The
remaining coefficients are positive and significant.
Table 1 shows path coefficients and variance explained of the variables. As shown in Table 1, the
effect of organizational communication, practical training, teaching methods and continuous
education is positive and significant on educational effectiveness. The effect of educational needs
assessment, planning, educational fit, talent management, job development and employee motivation
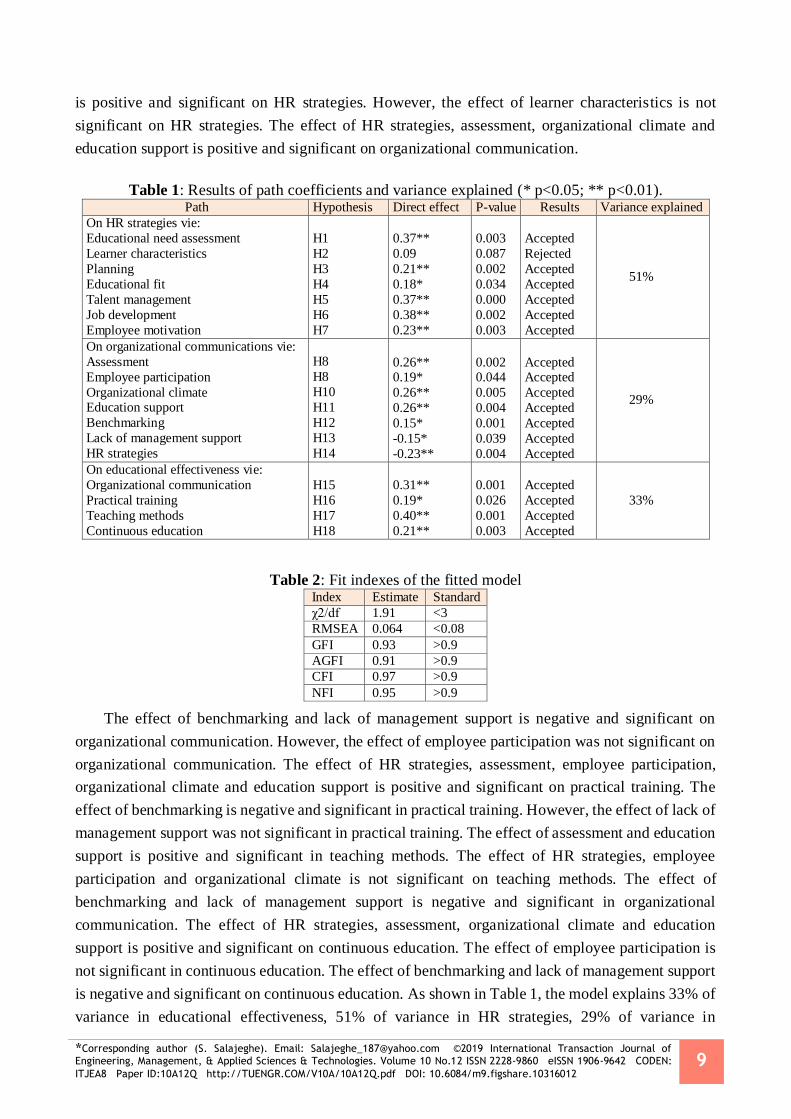
*Corresponding author (S. Salajeghe). Email: [email protected] ©2019 International Transaction Journal of
Engineering, Management, & Applied Sciences & Technologies. Volume 10 No.12 ISSN 2228-9860 eISSN 1906-9642 CODEN:
ITJEA8 Paper ID:10A12Q http://TUENGR.COM/V10A/10A12Q.pdf DOI: 10.6084/m9.figshare.10316012 9
is positive and significant on HR strategies. However, the effect of learner characteristics is not
significant on HR strategies. The effect of HR strategies, assessment, organizational climate and
education support is positive and significant on organizational communication.
Table 1: Results of path coefficients and variance explained (* p<0.05; ** p<0.01). Path Hypothesis Direct effect P-value Results Variance explained
On HR strategies vie:
Educational need assessment
Learner characteristics
Planning
Educational fit
Talent management
Job development
Employee motivation
H1
H2
H3
H4
H5 H6
H7
0.37**
0.09
0.21**
0.18*
0.37**
0.38**
0.23**
0.003
0.087
0.002
0.034
0.000
0.002
0.003
Accepted
Rejected
Accepted
Accepted
Accepted
Accepted
Accepted
51%
On organizational communications vie:
Assessment
Employee participation
Organizational climate Education support
Benchmarking
Lack of management support
HR strategies
H8
H8
H10
H11
H12
H13
H14
0.26** 0.19*
0.26**
0.26**
0.15*
-0.15*
-0.23**
0.002 0.044
0.005
0.004
0.001
0.039
0.004
Accepted Accepted
Accepted
Accepted
Accepted
Accepted
Accepted
29%
On educational effectiveness vie:
Organizational communication
Practical training
Teaching methods
Continuous education
H15
H16
H17
H18
0.31**
0.19*
0.40**
0.21**
0.001
0.026
0.001
0.003
Accepted
Accepted
Accepted
Accepted
33%
Table 2: Fit indexes of the fitted model Index Estimate Standard
χ2/df 1.91 <3
RMSEA 0.064 <0.08
GFI 0.93 >0.9
AGFI 0.91 >0.9
CFI 0.97 >0.9
NFI 0.95 >0.9
The effect of benchmarking and lack of management support is negative and significant on
organizational communication. However, the effect of employee participation was not significant on
organizational communication. The effect of HR strategies, assessment, employee participation,
organizational climate and education support is positive and significant on practical training. The
effect of benchmarking is negative and significant in practical training. However, the effect of lack of
management support was not significant in practical training. The effect of assessment and education
support is positive and significant in teaching methods. The effect of HR strategies, employee
participation and organizational climate is not significant on teaching methods. The effect of
benchmarking and lack of management support is negative and significant in organizational
communication. The effect of HR strategies, assessment, organizational climate and education
support is positive and significant on continuous education. The effect of employee participation is
not significant in continuous education. The effect of benchmarking and lack of management support
is negative and significant on continuous education. As shown in Table 1, the model explains 33% of
variance in educational effectiveness, 51% of variance in HR strategies, 29% of variance in

10 Behrooz Bigdeli Mojarad, Sanjar Salajegheh
organizational communications, 36% of variance in practical training, 42% of variance in teaching
methods, and 56% of variance in continuing education. Fit indices show that RMSEA=0.064,
CFI=0.97, GFI=0.93, NFI=0.95 and AGFI=0.91 are acceptable and these goodness of fit indices
show that the data is well fit the model (Table 2).
5. HYPOTHESES RESULTS
Hypothesis 1: The results showed a positive and significant relationship between educational
needs assessment and HR strategies (p-value<0.01). Therefore, training needs assessment leads to the
improvement of HR strategies.
Hypothesis 2: The results showed no relationship between recognizing learner characteristics
and HR strategies (p-value>0.05). Therefore, recognizing learner characteristics does not lead to
improved HR strategies.
Hypothesis 3: The results showed a positive and significant relationship between planning and
HR strategies (p-value<0.01). Therefore, planning leads to improved HR strategies. This finding
indicates that educational planning, career path planning, scheduling of training implementation, and
human resource planning lead to improved HR strategies.
Hypothesis 4: The results showed a positive and significant relationship between educational fit
and HR strategies (p-value<0.05). Therefore, educational fit leads to improved HR strategies.
Hypothesis 5: The results showed a positive and significant relationship between talent
management and HR strategies (p-value<0.01). Therefore, talent management leads to improved HR
strategies.
Hypothesis 6: The results showed a positive and significant relationship between job
development and HR strategies (p-value<0.01). Thus, job development results in improved HR
strategies.
Hypothesis 7: The results showed a positive and significant relationship between employee
motivation and HR strategies (p-value<0.01). Employee motivation, therefore, leads to improved HR
strategies.
Hypothesis 8: The results showed a positive and significant relationship between assessment and
organizational communication, practical training, teaching methods and continuing education
(p-value<0.01). Therefore, evaluation leads to improved organizational communication, practical
education, teaching methods and continuing education.
Hypothesis 9: The results showed a positive and significant relationship between employee
participation and practical education (p-value<0.01) but there was no significant relationship between
employee participation and organizational communication, practical education and continuing
education. Therefore, employee participation leads to improved practical education.
Hypothesis 10: The results showed a positive and significant relationship between organizational
climate and organizational communication, practical education and continuing education
(p-value<0.01). Therefore, organizational climate leads to improved organizational communication,
practical education, and continuing education.
Hypothesis 11: The results showed a positive and significant relationship between support for
education and organizational communication, practical education and continuing education
(p-value<0.05). Therefore, support for education leads to improved organizational communication,

*Corresponding author (S. Salajeghe). Email: [email protected] ©2019 International Transaction Journal of
Engineering, Management, & Applied Sciences & Technologies. Volume 10 No.12 ISSN 2228-9860 eISSN 1906-9642 CODEN:
ITJEA8 Paper ID:10A12Q http://TUENGR.COM/V10A/10A12Q.pdf DOI: 10.6084/m9.figshare.10316012 11
practical education, and continuing education.
Hypothesis 12: The results showed a negative and significant relationship between
benchmarking and organizational communication, practical education and continuing education
(p-value<0.01). Therefore, benchmarking leads to reduced organizational communication, practical
education, and continuing education.
Hypothesis 13: The results showed a negative and significant relationship between the lack of
management support and organizational communication and continuing education (p-value<0.01).
Therefore, lack of management support leads to reduced organizational communication and
continuing education.
Hypothesis 14: The results showed a positive and significant relationship between HR strategies
and organizational communication, practical education and continuing education (p-value<0.01).
Therefore, HR strategies lead to improved organizational communication, practical education, and
continuing education.
Hypothesis 15: The results showed a positive and significant relationship between organizational
communication and educational effectiveness (p-value<0.01). Therefore, organizational
communication leads to increased educational effectiveness.
Hypothesis 16: The results showed a positive and significant relationship between practical
training and educational effectiveness (p-value<0.05). Therefore, practical education leads to
increased educational effectiveness.
Hypothesis 17: The results showed a positive and significant relationship between teaching
methods and educational effectiveness (p-value<0.01). Therefore, teaching methods leads to
increased educational effectiveness.
Hypothesis 18: The results showed a positive and significant relationship between continuous
education and educational effectiveness (p-value<0.01). Therefore, continuous education leads to
increased educational effectiveness.
6. DISCUSSION
The most important activity of improvement and development of human resources is through
employee training. Therefore, the present study tended to present an educational effectiveness model
based on HR strategies by grounded theory in District 7 of the Iranian Gas Transportation Company.
To achieve this objective, the mixed method was used which consists of two qualitative and
quantitative parts. In the qualitative section, data was collected using interviews with experts; then,
data were analyzed using the grounded theory. The conceptual model was developed by Corbin and
Strauss (2007) approach. This model consists of focal phenomenon, causal conditions, context,
mediating factors, strategies, and outcomes. In response to causal conditions, educational need
assessment, learner characteristics, planning, educational fit, talent management, job development,
and employee motivation were extracted. In response to categories of assessment, employee
participation, organizational climate, and education support were extracted. In response to mediating
factors, benchmarking and lack of management support were extracted. In response to strategies,
organizational communication, practical training, continuous education, and teaching methods were

12 Behrooz Bigdeli Mojarad, Sanjar Salajegheh
extracted. In response to outcomes, educational effectiveness was extracted. Then, the hypotheses
were developed based on the model.
In the quantitative section, SEM was used to test and validate the hypotheses and the model by
LISREL software. The model showed that the effect of organizational communication, practical
training, teaching methods, and continuous education is positive and significant on educational
effectiveness. The effect of educational needs assessment, planning, educational fit, talent
management, job development, and employee motivation is positive and significant on HR strategies.
However, the effect of learner characteristics is not significant in HR strategies. The effect of HR
strategies, assessment, organizational climate and education support is positive and significant on
organizational communication. The effect of benchmarking and lack of management support is
negative and significant in organizational communication. However, the effect of employee
participation is not significant in organizational communication. The effect of HR strategies,
assessment, employee participation, organizational climate and education support is positive and
significant on practical training. The effect of benchmarking is negative and significant in practical
training. However, the effect of lack of management support was not significant in practical training.
The effect of assessment and education support is positive and significant in teaching methods. The
effect of HR strategies, employee participation and organizational climate is not significant on
teaching methods. The effect of benchmarking and lack of management support is negative and
significant in organizational communication. The effect of HR strategies, assessment, organizational
climate and education support is positive and significant on continuous education. The effect of
employee participation is not significant in continuous education. The effect of benchmarking and
lack of management support is negative and significant on continuous education. Comparison of the
results with previous studies shows that these findings are consistent with Nassiri et al (2013), Hojjati
et al (2013), Ahanchian and Zohourparandeh (2010), Aragon, James and Walle (2014), Cho, Song,
Yun, and Lee (2013) and Winfred et al (2003).
Finally, the fit indices obtained for evaluating the tested model showed that RMSEA=0.056,
CFI=0.97, GFI=0.93, NFI=0.95 and AGFI=0.91 are acceptable and these goodness of fit indices
show that the data well fit the model and the educational effectiveness model based on HR strategies
can be applied in the District 7 of the Iranian Gas Transportation Company.
Results showed that educational need assessment had a positive and significant effect on HR
strategies. Therefore, officials and managers of District 7 of the Iranian Gas Transmission Company
are suggested to identify the weaknesses in the areas in need of training and examine the training
needs of employees. Moreover, planning has a positive and significant effect on HR strategies.
Therefore, officials and managers are suggested to plan for education, career path, training time and
human resources.
7. CONCLUSION
From this study, it finds that there is a positive and significant relationship between
organizational communication, practical training, teaching methods and continuous education and
educational effectiveness. There is a positive and significant relationship between HR strategies and
organizational communication. There is a positive and significant relationship between HR strategies

*Corresponding author (S. Salajeghe). Email: [email protected] ©2019 International Transaction Journal of
Engineering, Management, & Applied Sciences & Technologies. Volume 10 No.12 ISSN 2228-9860 eISSN 1906-9642 CODEN:
ITJEA8 Paper ID:10A12Q http://TUENGR.COM/V10A/10A12Q.pdf DOI: 10.6084/m9.figshare.10316012 13
and practical training. There is no significant relationship between HR strategies and teaching
methods. There is a positive and significant relationship between HR strategies and continuous
education.
8. AVAILABILITYOF DATAANDMATERIAL
Relevant information is available by contacting the corresponding author.
9. REFERENCES
Abili, K. H. (2009). A Critique of the Experience of Training Effectiveness and its Evaluation in Organizations (Firms and Solutions), First International Conference of Training Managers,
Tehran, Iran.
Chehrehpak, M., Alizadeh, A., & Nazari-Shirkouhi, S. (2018). An empirical study on factors influencing
technology transfer using structural equation modelling. International Journal of Productivity and
Quality Management, 23(3), 273-288.
Corbin, J., & Strauss, A. (2007). Basics of qualitative research: Techniques and procedures for developing
grounded theory. Thousand Oaks.
Ghahremani, M. (2003). Evaluating the Effectiveness of Master's Degree Programs in Operations and
Operations Management, Quarterly Journal of Management and Development, 11(1), 2-14.
Navehebrahim, Abdolrahim and Eidi, Akbar (2006). Measurement, An Approach to Create Learning
Universities. First Conference in Organization Management and Leadership, Tehran, Iran.
Noe, R. A. (2002). Trainee’s attributes and attitudes: Neglected influences on training effectiveness. Academy of management Review, 11, 736–749. www.jstor.org/stable/258393
Noruzy, A., Dalfard, V. M., Azhdari, B., Nazari-Shirkouhi, S., & Rezazadeh, A. (2013). Relations
between transformational leadership, organizational learning, knowledge management,
organizational innovation, and organizational performance: an empirical investigation of manufacturing firms. The International Journal of Advanced Manufacturing Technology, 64(5-8),
1073-1085.
Snell, S., Morris, S., & Bohlander, G. (2015). Managing human resources. Cengage Learning.
Behrooz Bigdeli Mojarad is a Ph.D. student, Faculty of Public Administration, Department of Human Resources
Management, Kerman Branch, Islamic Azad University, Kerman, IRAN. His research includes Human Resources
Management, Education Management, Qualitative Analysis.
Dr.Sanjar Salajegheh is an Associate Professor, Department of Management, IslamicAzad University, Kerman
Branch, Kerman, Iran. His main interest includes Succession Planning System, Government Management,
Compensation System, and related topics
Trademarks Disclaimer: All product names including trademarks™ or registered® trademarks
mentioned in this article are the property of their respective owners, using for identification
purposes only. Use of them does not imply any endorsement or affiliation.
*Corresponding author (H. Ajam Norouzi). Email: [email protected] ©2019 International Transaction Journal of Engineering, Management, & Applied Sciences & Technologies. Volume 10 No.12 ISSN 2228-9860 eISSN 1906-9642 CODEN: ITJEA8 Paper ID:10A12R http://TUENGR.COM/V10A/10A12R.pdf DOI: 10.6084/m9.figshare.11301749
1
International Transaction Journal of Engineering, Management, & Applied Sciences & Technologies
http://TuEngr.com
PAPER ID: 10A12R
EFFECTS OF SEED PLANTS ON QUANTITATIVE
AND QUALITATIVE YIELDS OF VETCH AND
BARLEY IN DIFFERENT MIXING RATIOS
Mehrdad Jilani a
, Hossein Ajam Norouzi a*
, Abolfazl Faraji b
a Department of Agronomy and Plant Breeding, Faculty of Agriculture, Gorgan Branch, Islamic Azad University,
Gorgan, IRAN. b Golestan Agricultural and Natural Resources Research and Education Center, Agricultural Research,
Education and Extension Organization (AREEO), Gorgan, IRAN.
A R T I C L E I N F O
A B S T R A C T Article history: Received 20 May 2019
Received in revised form 10
July 2019
Accepted 26 July 2019
Available online 07 August 2019
Keywords: Intercropping; Seed
plant; Forage yield;
Protein yield; Land
equivalent ratio; Forage
protein content; Rice
husk treatment; Traits of
seed plant.
Cereal-legume intercropping is one of the ways to achieve greater
forage production. In order to evaluate the effects of seed plants on
quantitative and qualitative yields of vetch and barley forage, a factorial
experiment was conducted in a completely randomized block design in
paddy fields of Rice Research Institute of Iran (Rasht) during two seasons
of 2013-2015. Experimental factors included application of seed plant in
two levels (control without vetch and rice husk) and seed ratio (vetch
monoculture; barley monoculture; conventional 25% vetch + 75% barley as
replacement intercropping; 20% vetch to barley as additive intercropping;
40% vetch to barley as additive intercropping; and 60% vetch to barley as
additive intercropping). The traits evaluated included qualitative traits
(WSC, ADF and NDF, crude protein, DDM, and RNV) and quantitative
traits (forage yield and forage protein yield). The results indicated that
forage yield was higher in rice husk treatment (mean 10117 kg/ha) than
non-rice husk treatment (9225 kg/ha). The highest forage protein content
was obtained from vetch monoculture treatment. The highest forage and
protein yield was obtained from additive 40% vetch to barley (11189 kg/ha,
1845 kg/ha, respectively). Among treatments, the additive 40% vetch to
barley (mean 1.66) was better in terms of treatment land equivalent ratio.
Overall, it seems that additive 40% vetch to barley and rice husk seed plant
can be recommended due to increase in most qualitative and quantitative
factors in Rasht.
© 2019 INT TRANS J ENG MANAG SCI TECH.
INTRODUCTION 1.Das et al. (2018) in a two-year study of seed plant (none, soil and living mulch) on three forage
plants reported that dry weight of three plants increased in mulch treatment and living mulch gained
more yield due to increased height and better growth. In an experiment of non-seed plants and straw seed
©2019 International Transaction Journal of Engineering, Management, & Applied Sciences & Technologies

2 Mehrdad Jilani, Hossein Ajam Norouzi, Abolfazl Faraji
plants of three different plants on maize yield, it was found that application of each of the three plants
resulted in higher yield than control (Awopegba et al., 2017). In another experiment in China, seed
plants increased corn forage yield (40-60%) compared to control treatment (Zhou et al., 2018). Other
scientists have shown that additive intercropping and monoculture of forage grain (Guinea grass) and
forage beetle (Sesbania grandiflora) in Indonesian salty and poor soils and mulch (3 ton + 6 ton mulch
straw rice per ha) and without mulch (3 ton/ha) increased plant growth, forage yield and forage quality of
Guinea grass. On the other hand, additive forage guinea treatment on Guinea grass as well as 6 ton per
hectare mulch and without mulch treatment did not affect the quantity and quality of forage (Guinea
grass) in saline soil (Kasmati et al., 2007). Experimental results of two types of leaf seed plants (both
surface and mixed with soil) on barley in Kenya showed that plant height and biomass weight of the
plant increased when using surface seed plants. Mixing mulch increased nitrate release in the soil during
the first 4 weeks, although it decreased sharply by week 6. On the other hand, surface mulch caused
gradual release of soil nitrate during the barley growth period (Kimiti & Gordon, 2013). Further research
has shown that quality and quantity of sorghum forage is affected by the type of sowing (Chattha et al.,
2017). Based on a study on monoculture and additive intercropping of triticale with forage vetch (100 to
30, 100 to 40 and 100 to 50 and 100 to 60 and 100 to 70%) in dryland condition, it was reported that
maximum dry forage yield was obtained from 70% to 100% triticale (5445 kg/ha) and 60% vetch +
100% triticale (5248 kg/ha) treatment. The highest forage crude protein content was obtained from 70 to
100% triticale. The highest percentage of NDF also belonged to the above treatment. They reported that
increasing triticale content in intercropping led to increase in final forage yield. On the other hand,
increased intercropping of two plants decreased digestibility and increased fiber. The highest soil
equivalence ratio was obtained from 60% vetch to 100% triticale (1.61) intercropping (Nasiri et al.,
2015). In an experiment comparing six replacement intercropping treatments with 20% fenugreek/barley
additive ratio, it was shown that the highest forage yield (12.8 ton/ha) and land equivalence ratio (1.15)
was obtained from 20% fenugreek/barley additive treatment (Tarifi, et al., 2018). Results of
intercropping of maize and vetch showed that 25% maize to 75% vetch achieved the highest forage yield
and the land equivalence ratio was 1.16 (Mousavian & Seyed Mohamadi, 2015). Due to the lack of
documented research on the effect of seed plant in paddy field on autumn forage crops, this study tends
to investigate the effect of rice husk seed plant on quantitative and qualitative yield of monoculture and
intercropping of barley and vetch forage in paddy fields of Rasht.
MATERIALS AND METHODS 2.
This factorial experiment was conducted through randomized complete block design with three
replications during 2014-2015 and 2015-2016 in Rice Research Institute of Iran in Rasht (coordinates:
37°16′51″N 49°34′59″E, 7 m above sea level). Rasht has a humid climate and annual rainfall is based on
a 30-year average of 1320 mm. The mean annual rainfall between planting and harvesting was 1014 mm
and the average growth temperature was 11.4°C. Soil texture was clay. Experimental factors at two
levels (control without rice husk and with rice husk seed plant) as the first factor as well as different seed
ratios at six levels: (vetch monoculture, barley monoculture, conventional 25% vetch + 75% barley
replacement intercropping, 20% vetch to barley additive intercropping, 40% vetch to barley additive
intercropping, 60% vetch to barley additive intercropping) were considered. Barley seed ratio in additive
intercropping was 100% and vetch was added to the treatments in additive ratios. Vetch and barley seed

*Corresponding author (H. Ajam Norouzi). Email: [email protected] ©2019 International Transaction Journal of Engineering, Management, & Applied Sciences & Technologies. Volume 10 No.12 ISSN 2228-9860 eISSN 1906-9642 CODEN: ITJEA8 Paper ID:10A12R http://TUENGR.COM/V10A/10A12R.pdf DOI: 10.6084/m9.figshare.11301749
3
ratio was 110 and 170 kg/ha, respectively. The cultivars used were Behrokh (suitable for temperate
regions) for barley and Maragheh for vetch (Vicia sativa L.). Each experimental plot had 8 sowing lines
and the distance between the rows was 20 cm. The amount of rice husk was calculated in 5 ton/ha and
added to the treatments. Forage harvesting was done from the lowest part of the stem to the soil. At
harvest time to determine forage yield per unit area by removing sidelines and one meter above and
below each plot as a marginal effect, six-line forage in the middle and four meters per plot were
harvested and immediately weighed. One kilogram of wet forage was randomly selected to measure
forage yield and samples were dried in an oven at 75°C for 48 h and weighed. For measuring qualitative
traits such as water-soluble carbohydrate (WSC), acid and neutral detergent fiber (ADF and NDF),
digestible dry matter (DDM), relative nutritional value (RNV) and crude protein, near-infrared
spectroscopy (NIR) of Forests and Rangelands Research Organization were used. Forage protein yield
was also calculated by multiplying the forage crude protein by forage yield. To evaluate usefulness of
intercropping, land equivalence ratio (LER) was calculated using the following formula.
LER =𝑌𝑖𝑗
𝑌𝑖𝑖+
𝑌𝑗𝑖
𝑌𝑗𝑗 (1),
where 𝑌𝑖𝑗 is yield of first plant in intercropping; 𝑌𝑖𝑖 is yield of first plant in monoculture; 𝑌𝑗𝑖 is
yield of second plant in intercropping; 𝑌𝑗𝑗 is yield of second plant in monoculture.
SAS software (version 9.1) was used for statistical analysis of data and drawing charts. LSD test
(p<0.05) was also used to compare the mean.
RESULTS AND DISCUSSION 3.
3.1 WATER SOLUBLE CARBOHYDRATES
The results of the two-year composite analysis showed that seed plant × mix ratio interaction was
significant on soluble carbohydrate traits (Table 1). Comparison of means indicated that control
treatment without rice husk seed plant and 40% vetch to barley (21.04%) recorded the highest and the
treatment with rice husk seed plant and vetch monoculture (13.14%) recorded the lowest soluble
carbohydrate (Table 2). Soluble carbohydrates, which constitute a large part of unstructured
carbohydrates, are one of the most important components of forage quality, whose task is to provide
energy to rumen microorganisms and maintain digestive health of livestock (Tufail et al., 2019). In the
study of maize + mungbean intercropping, the researchers reported that the cereal family had more
water-soluble carbohydrates than legumes. Therefore, vetch ratio appears to decrease carbohydrates in
intercropping (Nakhzari Moghadam, et al., 2009). The results of experimental maize and poplar
intercropping showed that intercropping reduces WSCs compared to maize monoculture (Naghizadeh &
Galavi, 2012). Similar results were reported regarding the effects of legumes on forage carbohydrate in
intercropping (Najafabadi, et al., 2017; Fatminic, 2017). In another experiment the highest (71.6%)
soluble carbohydrate content was obtained from barley monoculture and the lowest content (49.7%) was
obtained from fenugreek monoculture (Tarifi, et al., 2018). One study found that intercropping cereals
and legumes increased concentration of soluble carbohydrates compared to monoculture (Fathminick,
2017).

4 Mehrdad Jilani, Hossein Ajam Norouzi, Abolfazl Faraji
Table 1: Composite analysis of the calculated traits of seed plant and vetch and barley seed ratios in
agricultural farms of Rasht during 2014-2015.
Source of variation Df WSC ADF NDF DDM RNV Crude
protein Forage yield
Forage protein
yield
Year 1 0.43ns 5.55ns 0.48ns 15.7* 199.4** 39.26** 151617ns 454517.6*
Repetition/Year 4 54.76 0.03 52.5 0.94 933.8 6.30 1377456 59088.6
Seed plant 1 104.1** 0.08ns 14.7ns 1.08ns 163.7ns 2.89ns 14311250** 260184.9ns
Seed ratio 5 11.07** 6.37** 37.6** 22.8** 1593.8** 75.33** 62953463** 1088928.2**
seed plant×seed ratio 5 43.73** 4.62* 16.0* 3.44ns 250.4* 4.36ns 1271474ns 70233.2ns
Year×seed plant 1 1.82ns 0.02ns 0.21ns 0.37ns 0.39ns 1.0ns 4966ns 7474.6ns
Year×seed ratio 5 0.21ns 0.02ns 0.20ns 0.24ns 2.36ns 0.46ns 192575ns 25394.6ns
Year×seed plant×seed
ratio 5 0.94ns 0.02ns 0.17ns 0.30ns 8.1ns 1.54ns 270275ns 25669.6ns
Error 44 1.27 1.67 4.79 2.27 106.9 5.50 1157305 10599.2
Coefficient of variation - 6.48 3.11 6.23 2.66 6.84 14.26 11.47 20.91
ns: non-significant; * and ** significant at 5% and 1%.
Table 2: Comparison of mean of effect of seed plant and vetch and barley seed ratios on calculated traits
in agricultural farms of Rasht during 2014-2015
Treatment WSC
(%)
ADF
(%)
NDF
(%)
DDM
(%)
RNV
(%)
Crude
protein (%)
Forage
yield
(kg/ha)
Protein
yield
(kg/ha)
LER
Year
2014-2015 17.32 41.87 35.05 57.05a 152.80a 17.18a 97.17 1633.9a -
2015-2016 17.47 41.31 35.21 56.12b 149.48a 15.70b 9625 1475.0b -
Seed plant
Without seed plant 18.60a 41.56 35.58 56.71 149.64 16.63 9225b 1494.3 1.57
With seed plant 16.19b 41.62 34.68 56.46 152.65 16.24 10117a 1614.5 1.67
Seed ratio
Vetch monoculture 15.93 40.82 32.90 58.94a 168.77 20.97a 5129c 1075.1b -
Barley monoculture 16.60 41.77 36.97 55.15c 139.30 13.29c 9820b 1301.0b -
25% vetch + 75% barley
replacement 17.82 42.23 33.49 57.41b 160.93 16.25b 10275b 1680.8a 1.52
20% vetch added to barley 17.71 42.18 36.03 55.86c 144.62 15.80b 10400ab 1644.1a 1.54
40% vetch added to barley 17.72 42.0 36.96 56.34bc 142.39 16.57b 11189a 1844.6a 1.66
60% vetch added to barley 16.61 40.54 34.44 55.80c 150.96 15.76b 11214a 1781.3a 1.66
In each column, the treatments having at least one letter in common do not have a significant difference in LSD at 5%
probability level.
3.2 ACID AND NEUTRAL DETERGENT FIBER
Composite analysis of soluble fibers showed that the effect of year and seed plant was not
significant. The interaction of seed plants was significant in the mixing ratios (Table 1). The highest
ADF was obtained from rice husk seed plant and mixing ratio of 25% vetch and 75% barley (mean
43.20%), while rice husk seed plant and mixing ratio of 60% vetch to barley (mean 39.95%) recorded the
lowest content of ADF (Table 3). One of the important factors affecting energy or total digestible
nutrients is ADF, the percentage of which is commonly used to estimate digestibility (Tarifi, et al.,
2018). Experimental results showed that monoculture had higher content of ADF (Aqababa Dastjerdi, et
al., 2014). As content of barley increases, forage digestibility decreases, so that pea monoculture often
has the least ADF content and is milder. In the study of replacement and additive intercropping of
fenugreek to barley, it was reported that the highest ADF was obtained in barley monoculture and the
least content was obtained in fenugreek monoculture (Tarifi, et al., 2018).
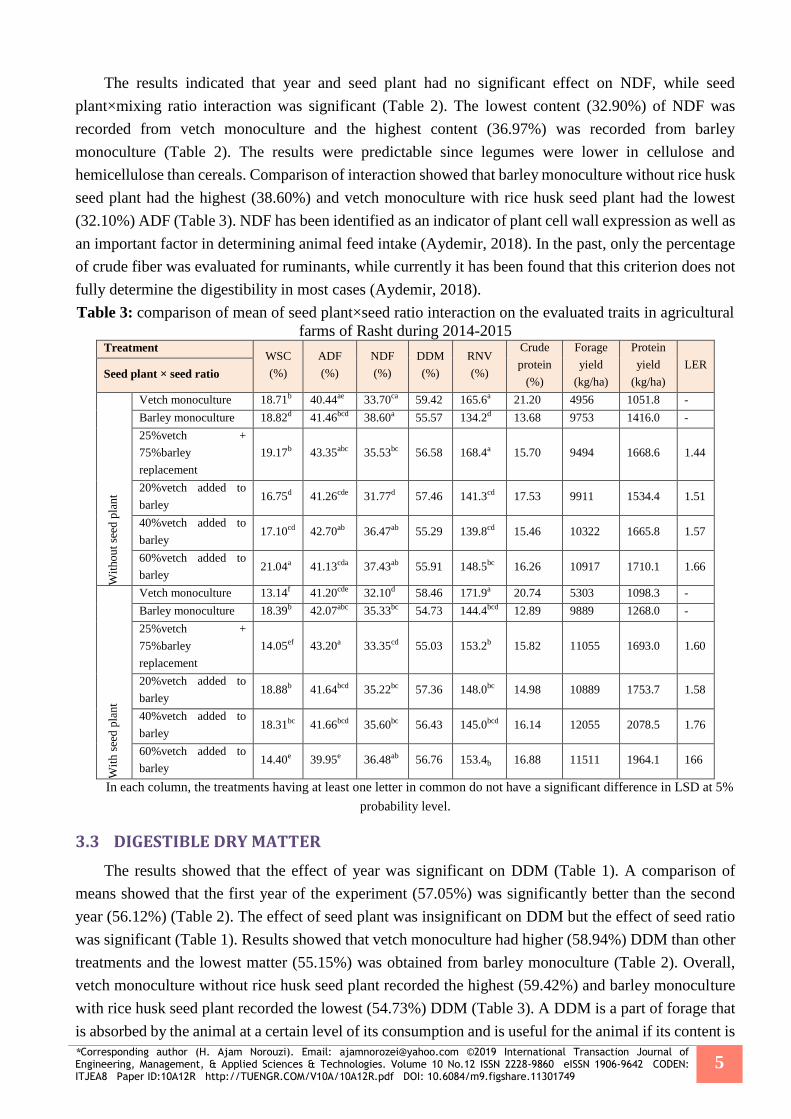
*Corresponding author (H. Ajam Norouzi). Email: [email protected] ©2019 International Transaction Journal of Engineering, Management, & Applied Sciences & Technologies. Volume 10 No.12 ISSN 2228-9860 eISSN 1906-9642 CODEN: ITJEA8 Paper ID:10A12R http://TUENGR.COM/V10A/10A12R.pdf DOI: 10.6084/m9.figshare.11301749
5
The results indicated that year and seed plant had no significant effect on NDF, while seed
plant×mixing ratio interaction was significant (Table 2). The lowest content (32.90%) of NDF was
recorded from vetch monoculture and the highest content (36.97%) was recorded from barley
monoculture (Table 2). The results were predictable since legumes were lower in cellulose and
hemicellulose than cereals. Comparison of interaction showed that barley monoculture without rice husk
seed plant had the highest (38.60%) and vetch monoculture with rice husk seed plant had the lowest
(32.10%) ADF (Table 3). NDF has been identified as an indicator of plant cell wall expression as well as
an important factor in determining animal feed intake (Aydemir, 2018). In the past, only the percentage
of crude fiber was evaluated for ruminants, while currently it has been found that this criterion does not
fully determine the digestibility in most cases (Aydemir, 2018).
Table 3: comparison of mean of seed plant×seed ratio interaction on the evaluated traits in agricultural
farms of Rasht during 2014-2015 Treatment
WSC
(%)
ADF
(%)
NDF
(%)
DDM
(%)
RNV
(%)
Crude
protein
(%)
Forage
yield
(kg/ha)
Protein
yield
(kg/ha)
LER Seed plant × seed ratio
Wit
ho
ut
seed
pla
nt
Vetch monoculture 18.71b 40.44ae 33.70ca 59.42 165.6a 21.20 4956 1051.8 -
Barley monoculture 18.82d 41.46bcd 38.60a 55.57 134.2d 13.68 9753 1416.0 -
25%vetch +
75%barley
replacement
19.17b 43.35abc 35.53bc 56.58 168.4a 15.70 9494 1668.6 1.44
20%vetch added to
barley 16.75d 41.26cde 31.77d 57.46 141.3cd 17.53 9911 1534.4 1.51
40%vetch added to
barley 17.10cd 42.70ab 36.47ab 55.29 139.8cd 15.46 10322 1665.8 1.57
60%vetch added to
barley 21.04a 41.13cda 37.43ab 55.91 148.5bc 16.26 10917 1710.1 1.66
Wit
h s
eed
pla
nt
Vetch monoculture 13.14f 41.20cde 32.10d 58.46 171.9a 20.74 5303 1098.3 -
Barley monoculture 18.39b 42.07abc 35.33bc 54.73 144.4bcd 12.89 9889 1268.0 -
25%vetch +
75%barley
replacement
14.05ef 43.20a 33.35cd 55.03 153.2b 15.82 11055 1693.0 1.60
20%vetch added to
barley 18.88b 41.64bcd 35.22bc 57.36 148.0bc 14.98 10889 1753.7 1.58
40%vetch added to
barley 18.31bc 41.66bcd 35.60bc 56.43 145.0bcd 16.14 12055 2078.5 1.76
60%vetch added to
barley 14.40e 39.95e 36.48ab 56.76 153.4b 16.88 11511 1964.1 166
In each column, the treatments having at least one letter in common do not have a significant difference in LSD at 5%
probability level.
3.3 DIGESTIBLE DRY MATTER
The results showed that the effect of year was significant on DDM (Table 1). A comparison of
means showed that the first year of the experiment (57.05%) was significantly better than the second
year (56.12%) (Table 2). The effect of seed plant was insignificant on DDM but the effect of seed ratio
was significant (Table 1). Results showed that vetch monoculture had higher (58.94%) DDM than other
treatments and the lowest matter (55.15%) was obtained from barley monoculture (Table 2). Overall,
vetch monoculture without rice husk seed plant recorded the highest (59.42%) and barley monoculture
with rice husk seed plant recorded the lowest (54.73%) DDM (Table 3). A DDM is a part of forage that
is absorbed by the animal at a certain level of its consumption and is useful for the animal if its content is

6 Mehrdad Jilani, Hossein Ajam Norouzi, Abolfazl Faraji
above 50% (Najafabadi, et al., 2017). According to results of an experiment, the lowest content of DDM
was obtained from forage maize monoculture and increased with increasing vetch ratio, so that the
highest content (53.4%) was obtained from forage maize×vetch (Javanmard, et al., 2014). The above
results indicated higher vetch digestibility and the higher the vetch contribution to forage, the higher
forage digestibility.
3.4 RELATIVE NUTRITIONAL VALUE
Results indicated that seed plant×seed ratio interaction was significant on RNV (Table 1). Overall,
vetch monoculture without rice husk seed plant (171.9%) recorded the highest and barley monoculture
without rice husk seed plant (134.2%) recorded the lowest values (Table 2). The results also showed that
there was no significant statistical difference between most of the intercropping treatments. RNV is one
of the important factors for qualitative evaluation of forage. It was reported that the increase in RNV of
forage in intercropping compared to monoculture was 3 to 22.7% (Wang et al., 2012). In another
experiment, it was noted that forages with RNV>151% had premium quality (Majidi Dizaj, et al., 2014).
Therefore, it can be concluded that most intercropping forage obtained from the above study is of high
quality.
3.5 CRUDE PROTEIN
The results of the composite analysis showed significant effect of crude protein on year and the first
year (17.18%) was better than the second year (15.70%) (Table 2). Among the experimental factors,
only seed ratio had a significant effect (Table 1). Among the tested ratios, vetch monoculture provided
the highest protein content (20.97%) and the lowest crude protein content (13.29%) was obtained from
barley monoculture (Table 2). Given that the leaves were more plentiful and edible and stems were
thinner, increased crude protein content was not unexpected in the vetch monoculture. Crude protein is a
combination of real protein and non-protein nitrogen compounds that are essential for growth and
lactation. Other studies also observed an increase in crude protein in intercropping than monoculture
(Klimek Kopyra et al., 2015). Since crude protein has a direct relationship with nitrogen content of the
plant, more stabilization, and availability of nitrogen may increase nitrogen uptake for barley
intercropping. Reportedly percentage of nitrogen stabilized by legumes was transferred to maize in
intercropping (Khalesi, 2017). Another experiment showed that intercropping legumes and grains such
as wheat and triticale increased forage protein content and ultimately improved feed quality. In their
study, adding lentils to forage composition increased protein content (Wang et al., 2012).
3.6 DRY FORAGE YIELD
Dry forage yield is one of the most important indices in forage cultivation, with many of the results
such as successfulness being measured based on that. Results showed that the effect of year was not
significant on dry matter yield (Table 1). The effect of seed plant was significant on dry forage yield and
dry forage yield was better in rice husk seed plant treatment (10117 kg/ha) compared to the treatment
without rice husk seed plant (9225 kg/ha) (Table 2). There was also a significant difference between seed
ratio treatments; as expected, vetch monoculture with average forage yield of 5129 kg/ha had the lowest
and 40% vetch + 60% barley additive intercropping had the highest dry forage yield (Table 2 ). Overall,
40% vetch added to barley with mulch (12055 kg/ha) obtained the highest and vetch monoculture
without rice husk seed plant (4956 kg/ha) obtained the lowest dry forage yield (Table 3).

*Corresponding author (H. Ajam Norouzi). Email: [email protected] ©2019 International Transaction Journal of Engineering, Management, & Applied Sciences & Technologies. Volume 10 No.12 ISSN 2228-9860 eISSN 1906-9642 CODEN: ITJEA8 Paper ID:10A12R http://TUENGR.COM/V10A/10A12R.pdf DOI: 10.6084/m9.figshare.11301749
7
Increase of dry forage yield in 40% forage vetch + barley additive treatment indicated that
environmental factors such as sunlight were used better in this composition and the light passing through
at early stages of growth from barley canopy because of proper distance between the leaves penetrated
into the vegetation and well used by the clover to spread the canopy. In the study of monoculture and
intercropping of triticale and Vicia villosa, it was also reported that 50% vetch + 50% intercropping had
better forage yield than monoculture in an experiment on maize and clover (Nasiri, et al., 2015). Triticale
had the highest dry matter yield (8850 kg/ha) and protein yield (1412.2 kg/ha) (Shobairi, et al., 2011).
Researchers have attributed the increase in dry forage production in intercropping treatments to
complimentary use of water, nutrients, and light due to differences in morphology and physiology of
these plants such as height, depth of root development, and thin and broadleaf and photosynthesis of the
plants (Moradi, et al., 2015).
3.7 FORAGE PROTEIN YIELD
The results of the composite analysis of data indicated that forage protein yield was not significant
in additive or replacement intercropping, but there was a significant difference between years of
experiment (Table 1). The first year (1633.9 kg/ha) was better than the second year (Table 2). There was
a significant difference between seed ratios (Table 1). Monoculture of vetch and barley had the lowest
forage protein yield due to lack of forage yield and crude protein deficiency, respectively. There was no
significant difference between intercropping treatments. Overall, the highest forage protein yield was
obtained from 40% vetch added to barley with rice husk seed plant (2078.5 kg/ha) and the lowest yield
was obtained from vetch monoculture with control without mulch (1051.8 kg/ha) (Table 3). In another
experiment, the highest forage protein yield was obtained from 30% vetch + 100% triticale additive
intercropping (Nasiri, et al., 2015). A similar report has found a dramatic increase in crude protein yield
due to legume-grass intercropping (Yang et al., 2018). Since forage protein yield is obtained by
multiplying the crude protein by forage yield, the increase in protein yield in intercropping may be
related to their better dry forage yield. Because dry forage yields appear to have a greater contribution in
protein yield. One of the major advantages of legume-grass intercropping is the increase in crude protein
yield over grass monoculture (Najafabadi, et al., 2017). In the experiment of the effect of monoculture
and different ratios of maize-bean intercropping on quantitative and qualitative yield of forage, it was
reported that crude protein yield was better in intercropping than monoculture and the highest dry forage
yield was obtained from 65% vetch + 35% oat (Nazari et al., 2014). It was also reported that the highest
crude protein yield was obtained from 50% barley + 50% fennel intercropping (1528.2 kg/ha) (Kiani, et
al., 2014). Another study also showed that 50% vetch + 50% barley treatment obtained higher protein
yields than monoculture (Molla et al., 2018).
3.8 LAND EQUIVALENCE RATIO
The treatment with mulch (1.67) was also higher than the treatment without mulch (1.5) (Table 2).
Among the intercropping treatments, 40% and 60% additive intercropping (1.66) obtained the highest
and thus it is recommended. Overall, rice husk seed plant and 40% vetch + 60% barley additive
intercropping is better and recommended. The results showed that the land equivalence ratio of dry
matter showed the superiority of two 40% + 60% additive treatments. The results showed ecological
superiority of intercropping and efficient use of growth resources. The superiority due to inter-species

8 Mehrdad Jilani, Hossein Ajam Norouzi, Abolfazl Faraji
competition is less than intra-species competition. An experiment reported that 75% barley + 25% vetch
intercropping (1.51) achieved the highest land equivalence index (Hervani & Dizaj, 2012). In another
study, the highest land equivalence ratio was obtained from 60% vetch to 100% triticale (1.61)
intercropping (Nasiri, et al., 2015).
CONCLUSION 4.
In the present study, the results showed that seed plants had no effect on most qualitative traits.
Based on the results, higher ratio of vetch improved forage quality due to higher quality traits. Among
seed ratios, 40% vetch + 60% barley recorded the highest land equivalence ratio for the calculated
yields. In the present study, land equivalence ratio was higher in the treatment with rice husk seed plant
due to better seedling establishment. The results also indicated that all intercropping treatments had
higher forage protein yield than monoculture and were divided into separate statistical groups. However,
no significant differences were observed between the intercropping treatments. Since the highest forage
yield was obtained from 40% vetch + barley with rice husk seed plant, this treatment achieved the
highest land equivalence ratio. In addition, 40% vetch + barley with rice husk seed plant can be
introduced as a better treatment due to most quantitative traits. Regarding the importance of sustainable
agriculture and quality of forage source and the importance of availability of forage for livestock feeding
and the importance of comparative indices, additive intercropping and intercropping in rice husk seed
plant is recommended for cultivation in paddy fields of Rasht.
ACKNOWLEDGEMENT 5.
The authors gratefully acknowledge the Rice Research Institute of Iran for their contributions.
REFERENCES 6.
Aqababa Dastjerdi, M., Amini Dehghi, M., Chaichi, M. & Basaghzadeh, Z. (2014). The effect of different
fertilizer systems on nutritional and qualitative traits of forage and intercropping of perennial alfalfa
(Medicago Sativa L.) and fennel (Foeniculum Vulgare L.). Journal of crop improvement, 16(1), 111-125.
Awopegba, M., Oladele, S., & Awodun, M. (2017). Effect of mulch types on nutrient composition, maize
(Zea mays L.) yield and soil properties of a tropical Alfisol in Southwestern Nigeria. Eurasian
Journal of Soil Science, 6(2), 121-133.
Aydemir, S. K. (2019). Maize and soybean intercropping under different seed rates of soybean under the
ecological condition of Bilecik, Turkey. International Journal of Environmental Science and Technology, 16(9), 5163-5170.
Chattha, M. U., Iqbal, A., Hassan, M. U., Chattha, M. B., Ishaque, W., Usman, M., & Ullah, M. A. (2017).
Forage yield and quality of sweet sorghum as influenced by sowing methods and harvesting
times. Journal of Basic and Applied Sciences, 13, 301-306.
Das, H., Kundu, C. K., Bandyopadhyay, P. K., Bandyopadhyay, S., & Bandopadhyay, P. (2018). Effect of
mulching practices on growth and yield of forage crops under rainfed ecosystem. Journal of Applied and Natural Science, 10(1), 266-271.
Fateminick, F. (2017). Investigating the effect of corn and mung intercropping on the yield and quality of Vigna Radiata in the climate of Shoush city. Journal of Research in Ecology, 5 (1), 582-592.

*Corresponding author (H. Ajam Norouzi). Email: [email protected] ©2019 International Transaction Journal of Engineering, Management, & Applied Sciences & Technologies. Volume 10 No.12 ISSN 2228-9860 eISSN 1906-9642 CODEN: ITJEA8 Paper ID:10A12R http://TUENGR.COM/V10A/10A12R.pdf DOI: 10.6084/m9.figshare.11301749
9
Javanmard, A. et al. (2014). Evaluation of cell concentration, cell wall without hemicellulose, total digestible
nutrient content, dry matter intake and specific lactation energy of forage maize in intercropping.
Journal of Crop Production and Processing, 14(4), 175-189.
Khalesi, A. (2017). Effect of different intercropping patterns on dry matter production as well as forage quality of corn and cowpea. Studies of Biological Sciences and Biotechnology, 3(1), 21-29.
Kiani, S. M. et al. (2014). Evaluation of quantitative and qualitative yield of forage in intercropping of barley and fennel at different nitrogen levels. Journal of crop improvement, 15(4), 973-986.
Kimiti, J. M., & Gordon, A. M. (2013). Mulch inoculation and placement influenced barley (Hordeum Vulgare) growth and soil nitrate levels.
Klimek-Kopyra, A., Kulig, B., Oleksy, A., & Zajac, T. (2015). Agronomic performance of naked oat (Avena nuda L.) and faba bean intercropping. Chilean Journal of agricultural research, 75(2), 168-173.
Kusmiyati, F., Sumarsono, S., Karno, K., & Pangestu, E. (2013). Effect of mulch and mixed cropping
grass-legume at saline soil on growth, forage yield and nutritional quality of guinea grass. Journal of the Indonesian Tropical Animal Agriculture, 38(1), 72-78.
Lamei Hervani, J., & Alizadeh Dizaj, K. (2012). Selecting the best Vicia villosa+barley+Triticale intercropping under dryland conditions of zanjan. Dryland agriculture, 1(1), 17-39.
Majidi Dizaj, H., Mazaheri, D., Sabahi, G., & Mirabzadeh, M. (2014). Evaluation of forage yield and quality
in alfalfa and sainfoin intercropping. Iranian Journal of Crop Sciences, 16(1), 51-61.
Molla, E. A., Wondimagegn, B. A., & Chekol, Y. M. (2018). Evaluation of biomass yield and nutritional
quality of oats–vetch mixtures at different harvesting stage under residual moisture in Fogera District, Ethiopia. Agriculture & Food Security, 7(1), 88.
Moradi, P., Asghari, J., Mohsenabadi, G. & Samizadeh, H., 2015. Evaluation of quantitative and qualitative
yield of forage in maize + wax bean + cucurbita pepo intercropping. Journal of crop improvement, 17(3), 683-699.
Mousavian, N., & Seyed Mohamadi, A. (2015). Effect of nitrogen and cultivation patterns on morphological traits and growth index in intercropping corn and sunflower. Crop Physiology, 26, 105-120.
Naghizadeh, M., & Galavi, M. (2012). Evaluation of forage quality in intercropping of maize (Zea mays L.)
and poplar (Lathyrus sativus L.) affected by bio-chemical phosphorus fertilizers. Agricultural Ecology, 4(1), 52-62.
Najafabadi, A., Jalilan, J., & Zardoshti, M. (2017). The effect of intercropping patterns on some quantitative
and qualitative traits of safflower and cattle fodder in high and low input systems. Journal of crop
improvement, 19(2), 445-460.
Nakhzari Moghadam, A. et al. (2009). Effect of intercropping corn and green mung on yield, land
equivalence ratio and some quality traits of forage. Iranian Journal of Field Crop Science, 40(4), 151-159.
Nasiri, B., Darai-Mofrad, A., & Hosseinian, H. (2015). Evaluation of quantity and quality of forage in
intercropping of triticale and vetch in rainfed conditions. Research in agronomic ecosystems, 1(2), 37-48.
Nazari, S. et al. (2014). Effect of different harvesting times on yield and quality of corn forage under
intercropping conditions with leguminous plants. Journal of Iranian Field Crop Research, 12(2), 237-245.
Shobairi, S. S. et al. (2011). Evaluation of yield and quality of forage in monoculture and intercropping of
vicia villosa and triticale. Iranian Journal of Crop Sciences, 13(2), 269-281.
Tarifi, S., Fateh, A., & Aynehband, A. (2018). The effect of different ratios of intercropping barley

10 Mehrdad Jilani, Hossein Ajam Norouzi, Abolfazl Faraji
(Hordeum vulgare) and fenugreek (Trigonella foenum- graecum L.) under nitrogen fertilizer effects
on dry matter quantity and quality. Crop production, 11(1), 23-35.
Tufail, M. S., Krebs, G. L., Southwell, A., Piltz, J. W., & Wynn, P. C. (2019). Seeding rate effects on yield
components and forage quality of Agaitti Berseem-2002–an improved variety of berseem clover. Journal of Crop Improvement, 1-14.
Wang, L., Gruber, S., & Claupein, W. (2012). Optimizing lentil-based mixed cropping with different
companion crops and plant densities in terms of crop yield and weed control. Organic Agriculture, 2(2), 79-87.
Yang, C., Fan, Z., & Chai, Q. (2018). Agronomic and economic benefits of pea/maize intercropping systems in relation to N fertilizer and maize density. Agronomy, 8(4), 52.
Zhou, Y., Xiong, D., Jizong, Z., Fenglu Z., and Lifeng. Z. (2018). Effects of plastic film mulching on rainfall
storage and water use in forage maize fields in the cold and arid areas of Northern China. Academia
Journal of Agricultural Research, 6 (10), 1-9.
Mehrdad Jilani is a PhD Candidate in Agronomy at the Faculty of Agriculture, Gorgan Branch at Islamic Azad University, Gorgan, Iran. He received his Master’s degree in same major from Takestan Branch at Islamic Azad University, Takestan, Iran. He is interested in Plant and Crop Research.
Dr. Hossein Ajam Norouzi is an Assistant Professor at the Department of Agronomy and Plant Breeding, Gorgan Branch, Faculty of Agriculture, Islamic Azad University Gorgan, IRAN. He is interested in Crop, Plant, and Soil.
Dr.Abolfazl Faraji is a Researcher (Academic) at Golestan Agricultural and Natural Resources Research and Education Center, Agricultural Research, Education and Extension Organization (AREEO). He earned his PhD from the University of the Philippines Los Baños.
Note: This article is extracted from a doctoral dissertation of the first author.
Trademarks Disclaimer: All product names including trademarks™ or registered® trademarks mentioned
in this article are the property of their respective owners, using for identification purposes only. Use
of them does not imply any endorsement or affiliation.

:: International Transaction Journal of Engineering, Management, & Applied Sciences & Technologies
http://TuEngr.com
Call-for-Papers:
ITJEMAST invites you to submit high quality papers for full peer-review and possible publication in areas pertaining to our scope including engineering, science, management and technology, especially interdisciplinary/cross-disciplinary/multidisciplinary subjects.

More Research Publication Available at
http://TUENGR.COM
Submit your science research today.
:: International Transaction Journal of Engineering, Management, & Applied Sciences & Technologies