Vol.43 No.1 www .ilee.org.in
145
March, 2020 Vol.43 No.1 www.ilee.org.in March, 2020 Vol. 43 No.1
-
Upload
khangminh22 -
Category
Documents
-
view
0 -
download
0
Transcript of Vol.43 No.1 www .ilee.org.in

March, 2020
Vol.43No.1
ww
w.i
lee.o
rg.i
n
Marc
h, 2
020 V
ol. 4
3 N
o.1

NO. 1 INDIAN JOURNAL OF LANDSCAPE SYSTEMS AND ECOLOGICAL STUDIES 1
Indian Journal ofLandscape Systems and Ecological Studies
Volume : 43 No.1 March, 2020
INSTITUTE OFLANDSCAPE, ECOLOGY & EKISTICS, KOLKATA
Founded ByShibaprasad Chatterjee
ISSN 0971-4170

2 INDIAN JOURNAL OF LANDSCAPE SYSTEMS AND ECOLOGICAL STUDIES VOL. 43
Acknowledgement
Grant-in-aid for maintenance and development to theInstitute of Landscape, Ecology and Ekistics, Kolkata-700 019, especially for its Journal – Indian Journal ofLandscape Systems and Ecological Studies, receivedfrom Indian Council of Social Science Research (ICSSR),Government of India, New Delhi 110 067, is thankfullyacknowledged.

NO. 1 INDIAN JOURNAL OF LANDSCAPE SYSTEMS AND ECOLOGICAL STUDIES 3
Indian Journal ofLandscape Systems and Ecological Studies
Volume : 43 No.1 March, 2020
CONTENTS
GREEN PEACE VISIONARIES: RABINDRANATH Arunendu Banerjee 5AND GEDDES
LAND USE CHANGE UNDER THE CONDITION OF HIGH Vivek Kumar Shukla, 19POPULATION PRESSURE: A GEOGRAPHICAL STUDY OF SikandarAYODHYA DISTRICT, UTTAR PRADESH V. K. Tripathi
CHANGING URBAN DYNAMICS IN AND AROUND Alpana Ray 32BARANAGAR MUNICIPALITY, WEST BENGAL
INTERACTION BETWEEN ROAD NETWORK Biswajit Paul 45CONNECTIVITY PATTERN AND DEVELOPMENT IN Subir SarkarDARJEELING DISTRICT OF WEST BENGAL, INDIA
AN ACCOUNT OF ECONOMIC BACKGROUND OF Gourab Bera 57STREET CHILDREN IN SELECTED WARDS OF KOLKATA, Subodh SealWEST BENGAL Sudhir Malakar
URBANISATION AND SPATIAL ORGANISATION OF Pijus Kanti Ghosh 68URBAN CENTRES OF NADIA DISTRICT WITH REFERENCE Sahina KhatunTO CENSUS TOWNS (1961-2011)
GEO-SPATIAL ANALYSIS OF ALTERATION IN URBAN Sandesh Yadav 82BIOPHYSICAL COMPOSITION AND ITS IMPACT ONMICRO-CLIMATE OF DELHI, INDIA

4 INDIAN JOURNAL OF LANDSCAPE SYSTEMS AND ECOLOGICAL STUDIES VOL. 43
SINGLE BEAM BATHYMETRIC DATA MODELLING FOR Samrat Majumdar 99IDENTIFICATION OF RIVER BANK EROSION PRONE SITES Sujit MandalNEAR MANIKCHAK REGION IN MALDA DISTRICT,WEST BENGAL
TRENDS AND PATTERNS OF FEMALE WORK Sangita Karmakar 114PARTICIPATION IN KOCH BIHAR DISTRICT, Ranjan RoyWEST BENGAL: A GEOGRAPHICAL ANALYSIS
ORGANIZATIONAL CLIMATE OF TEACHER EDUCATION Anusri Kundu 127INSTITUTIONS IN AND AROUND KOLKATA Anindya Basu

NO. 1 GREEN PEACE VISIONARIES: RABINDRANATH AND GEDDES 5
Green Peace Visionaries: Rabindranath and GeddesArunendu Banerjee*
Abstract : Practiced knowledge with site specific understanding of land, people and environment are necessaryto build up integrated-interdisciplinary eco-friendly culture on development and human environment especiallyin the contemporary context. Some practiced models (best tested first in site specific micro levels) of reconstructionand conservation of ecologic - environment as culture, may help the futuristic initiatives of renewal of life andliving with nature. Rabindranath Tagore in Santiniketan- Sriniketan, India and Patrick Geddes in Scotland andFrance, had pioneered important link between quality of environment, quality of education and better ecologicalapproach to living design , as an envoi-bridge of East and West. School with essential nature study, ruralstudies, at-site training on public health welfare and humane habitation work, were harmonised with activelocal level participation towards environmental development and betterliving condition especially on villagerenewal with knowledge of ecological cultural appreciation, which were the main stays of their innovativeliving environment design- culture. As long as truthful humanistic environmentalism in our futuristic, sustainablelife and practice in daily life and livelihood will be measured as essential dimension; Rabindranath and Geddeswill continue as our ecologic- cultural heroes of green-peace world.
Keywords : Living- environment, Creative- landscape, Futuristic-life, Rabinindranath, Geddes
Dual Heritage – Man and NatureEnvironmental design and culture to develop individual, societal green values and ethics for
the globe, will be essential to face up present critical situation of ecological disorders, environmental(life-threatening) pollution and recent global endemic seaseondition. Awareness to balanced lifeand living with nature, around us will be our prime strength towards development of sustainableliving pattern. Interdisciplinary system-education to live better and learning of life in this century –will be essential for our caring use of this planet and its resources. Practical knowledge and sitespecific understanding of land, people and environment will also be necessary to build up integreted-interdisciplinary studies and eco-friendly culture on development and environment.
Rabindranath Tagore and Patrick Geddes are the united envoi-educational hope, moral andliving environment cultural bridge of the dual heritage – man and nature. Rabindranath believedthrough his realized and practiced green truth that ‘river carries eternal message of country’. Goddeswas river sheltered bio-centric personality, believed in ‘by leaves we live’.
* Engineer, Environmental Designer, Conservation Consultant, Writer, Artist,E-mail: [email protected]
Ind. J. of Landscape Systems and Ecological Studies 43 (1) March - 2020, 5- 18 ISSN 0971-4170

6 INDIAN JOURNAL OF LANDSCAPE SYSTEMS AND ECOLOGICAL STUDIES VOL. 43
As a great creative innovator and superb artist in life, Rabindranath Tagore (1861-1941) alwaysextended himself to other creative avenues of expressions. Santiniketan envoi-habitation design isperhaps one of his finest experimentations to improve humanistic environmental future. Santiniketan-Sriniketan, life-living culturefor eternal expression of education-habitat with nature, the landscapeand man-nature settlement planning, do have the creative strength for spreading global communityconsciousness and neo-environmental activism. Concerted natural spring of applied art and sciencemovement and creative urges for cultural identity in the form of idea-action centre emerged into thisspirit of synthesis. The complete environmental knowledge as imparted by Rabindranath is thefuturistic light for improvement of quality of life; which fully uses low cost but ecological remedialoptions, towards a new humanistic order, the future health-world without borders, for better livingconditions, based on teh experience in the theory of life in environment, modern village communities,rural reconstructions, city-village interactions, co-operative principles and the migrations to thecommon plane of environmental sustainability.
Patrick Geddes (1854-1932), famous biologist (able student of famous scientist Prof. ThomasHuxley), environmentalist and father figure of modern regional planning from Scotland, UK, founded‘Environment Society’ in 1884. He had also published ‘Evergreen Journal’ during 1885, one of thefinest pioneering movements of environmental activism and green education in West. Patrick Geddeswith his ‘Students hall residence in Scotland’ (1887) had developed environmental movement forbetter living environment, with the help of students and regional workers. Geddes had provided theleadership for better environmental sanitation, development of potable water supply system andredesigning humanistic-hyginic habitation for the poor people at Rosenberg.
During 1892 Geddes and his wife anna Morton Geddes (gifted musician, married in 1886) alongwith the college students, (University Extension Movement) initiated small scale green villagereconstruction in various scales, to fight against the environmental disorders and also to enhanceecological and biological vitality of the living community. They had visited Cyprus (1896) to solvethe problem of integrating Armenian refugees, with the creation of small self-managed agricalturalcommunities. Patrick was very active in the living environment movement in Europe. anna Geddeswas the central force in planning Darjeeling-Summer camp (much later in India, 1917) involvingRabindranath, Jagadishchandra, Brojen Seal and Patrick Geddes.
Exposition UniversellePatrick Geddes and Nivedita – joined in Exposition universelle held in Paris in 1900 and
designed great globe project. This is the period Patrick had spent must of his time with SwamiVivekananda. Almost daily he was accompanying Vivekananda in the engineering fair in this festival,near Eiffel Tower. World’s great intellectual personalities were assembled in this occasion, in‘Exposition Universelle’. Latest work on creativity and philosophy, art and culture, science andtechnology were assembled in this historical spread of built environment. Theme Pavilion, exhibitionswere organized near Effel Tower.
Jagadish Chandra Bose, famous Scientist from India had presented his paper in ScienceCongress. Vivekananda was invited as a speaker in the religious philosophy section. Nivedita was

NO. 1 GREEN PEACE VISIONARIES: RABINDRANATH AND GEDDES 7
very much there presenting unique bridge of India and the Western world. Geddes was earlierknown to Nivedita. In great globe project pavilion, Geddes wanted Nivedita’s assistance forintellectual coordination to East-West design- convergence. India was coming more and more closeto the hearts of Geddes family. In the coffee sessions near Eiffel Tower outstanding personalitieswere interacting- Vivekananda, Jagadish Chandra Bose, Abola Bose, Patrick Geddes, Anna Geddes,Nivedita, Paul doyson, Ema Calve, Rodain. Geddes was straightening his concept more perfectly on‘Plance, Work, Folk–a Triad’, This was the time, Vivekananda was appreciating and explainingGeddes’ concept of triad in an interesting-symbolic– poetic, narrative letter written to Mrs. Legget,September 3, 1900 from Paris. (Much later Patrick had developed his figurative diagram)
Geddes from now on, was more interested with India. The meeting was everlasting in his mind.He was adding in his theory of harmonization of life (1903), the elements of humanistic and scientifictruth. He was working on ‘Region and sub-region be developed harmoniously by own naturalresources’ in his, ‘City Developments’ (1904).
There are some outstanding common grounds of Geddes and Rabindranath. Both were pioneerin ecologic environmental ideas and ideals in their own way of life and work. Both were concernedon the aspects of broader humanity, believed building of one – world intellectual unity, in spite ofmaintaining creative diversities and identifies. They were looking for creative unity in the making ofbetter living world through the active participation of East and West. Modern world of environmentaleducation and eco ethical living design will always be indebted to the outstanding envoi-educationcentres, created by Geddes and Rabindranath. (Santiniketan in India by Tagore and Outlook Towerin Edinburgh by Geddes)
In spite of their different paths of educational and interactive practice, they had many greatconveyances mostly centering to Land, People and Environmental relations. They were also championof interwar years with their revolutionary vision of relatedness of technological civilization andhumane civilization. They were bold speakers and environmental activist against the moneydominated dis-balanced materialistic consumerism.
Modern environmental Designers largely attribute the founding of environmental educationand built environmental culture in Europe to Scottish professor of Botany and an originator ofTown and Country planning, Patrick Geddes. Through his original field-study-centre the ‘OutlookTower’ (1890-laboratory to develop regional museum and studies on sociological realities) inEdinburgh, unique centre of environmental throughts and practice were elevated into land-people-environment movement, during early part of twentieth century. Patrick was believer of the theory offamous social scientist (Mining Engineer from France) Frederic Le Play. Le Play, the positivist wasinspired by philosophies of Komte.
Meeting of Two Great Minds and Reception of Dwarkanath TagorePatrick Geddes was invited, as Town Planning Consultant in 1914, by Lord Pentland, governor
of Madras, India (he was earlier known to Geddes). Lord Pentland was the former secretary of statefor Scotland. During 18 January 1915, his famous Town and Country Planning exhibition was held

8 INDIAN JOURNAL OF LANDSCAPE SYSTEMS AND ECOLOGICAL STUDIES VOL. 43
in Madras. This exhibition was very famous in Europe (1910), travelled in many cities showing idealhumanistic relations of urban – rural scoeity, urban planning and environmental analysis of theplace – work – folk as : ‘a family as social units’ in micro and macro levels. He had received ‘GoldMedal recognition’ in 1913 (interestingly the same year of Rabindranath’s Nobel Prize).
He then especially renewed and re-casted Town & Country Planning Exhibition, almost in fullscale and brought to Calcutta (Kolkata). This first of its kind exhibition was opened in Town Hall,Calcutta during November 1915.
Rabindranath came to this exhibition with his deep interest and met Patrick Geddes. Historywas made. This relation of two great minds would be long lasting and contributory to broaderhumanity. This is interesting, for meeting of two friends of the earth. This was the time whenRabindranath had established his ecologic vision – ‘Forces of man and forces of nature in harmony’,also through built environmental realities of Santiniketan forest school (Tapovana). Arthur Geddeshad written on this historic convergence of two minds, ‘...and so on, when in 1915, Geddes came toCalcutta, bringing the cities and Town Planning Exhibition, it was natural that Tagore should cometo see it and meet its maker, and that Geddes should seek Tagore. They met and their friendshipbegan and grew.’ Arthur had also mentioned in his published article (Annual of Architecture,Structure and Town Planning 1961), that ‘... wide reader, Geddes had long studied the philosophy,arts and architecture of India with the mingling of sympathetic respect and of criticism with whichhe viewed the religion of the future, a religion for life. hence it was natural that he should sent meTagore’s Sadhana: the relization of life, deeply impressed by the vision it offered for India and theWorld, toward an affirmative and leaving faith. Always a lover of poetry, in Scots, English, Frenchand German. Geddes enjoyed and admired not only Rabindranath’s prose renderings of his poemsbut his great gift of son...’
House of Tagore and Scotland had long relation even before Rebindranath. Dwarkanath Tagore,the multi dimensional pioneer of India, grandfather of the poet, had arrived Edinburgh on 29 August,1842 (his first voyage to Europe and Britain). A special meeting of the town council was organizedfor the reception of Dwarkanath. He was honoured with the ‘Freedom of the City’ – citation. ‘TheScotsman’, Edinburgh’s leading daily, described with appreciation with full column news onDwarkanath’s many distinctions. ‘The Scotsman’, desscribed this ‘event unprecedented in theannals of Great Britain the presentation of the Freedom of the City to a Hindoo gentleman.’ LordProvost, James Forrest, Bart, had said, presenting this first honor to an Indian, ‘This is an honorwhich we highly value and which we have not been lavish in conferring. Those upon whom it hasbeen bestowed have been those who have conferred important benefits upon this community orthe country at large – who have distinguished themselves by their attainments in service andliterature-and those illustrious strangers of high rank who from time to time have visited our shores.you, Sir, are the first of the Hindoo race upon whom this honor has been conferred; ...’. fullproceedings on the charter of the Freedom of the City, was published in ‘The Scotsman’, onAugust 31, Wednesday, 1842. It may be mentioned that on arrival of the Queen in Edinburgh(probably her first visit to the city), she graciosuly invited Dwarkanath in the Castly. Unitarian

NO. 1 GREEN PEACE VISIONARIES: RABINDRANATH AND GEDDES 9
Association of the Edinburgh presented Dwarkanath with an Address on 5, September 1842. Afterfew days Edinburgh Emigration and Aborigines Protection Society (society against Negro slaveryin the West Indies, interest in the welfare of the Indian peasant ...) presented Address to Dwarkanathand invited him for his counsel and guidance in the promotion of the society’s objectives in relationto the people of India, ‘... we recognize in you a friend of that knowledge which confers dignity andpower on its possessor, and also a liberal promoter of the most extended plans for the education ofthe youth of your country....’
Outstanding scholars educators (like David Hare, Hindu College and creative relations withDwarkanath) scientists like William Roxburgh founder father of Indian Botanic, Dr. Thomes Andersonstarted cinchona plantation in Mungpoo, Darjeeling etc., from Scotland had worked in India withtheir mind minded contributions for Scotland-India brotherhoods. Dwipendranath Tagore andnarendranath Dutta (Vivekananda) were the classmates (Brojen Sil was one year senior in class) inGeneral Assembly (Scottish Church College) studied under outstanding scholar-teacher, WilliamHasty. Vivekananda’s concept triad of active hand harmonizing head and heart, were inspired fromthis period. This applied work concept was appreciated with high regards during his lectures inEuro- America. Patrick Geddes was very much touched and acted on this triad in later years, aftermeeting Vivekananda.
Now coming back onto the period of 1915-meeting of Patrick Geddes and Rabindranath Tagore.
After this meeting, Patrick Geddes had, worked in India for various Town and Regional planningprojects as well as in the initial period of campus-design, planning in Santiniketan. Tagore wasdeeply interested in Patrick Geddes’ concept of triad: Place-Work-folk, as well as in their commonconcept of the development into the theory of environmental link learning, through the generations.Patrick Geddes, as a planner and bio-centric designer, could realise Tagore’s vision of leaving androle of Indian arts. The philosophies of Geddes and Rabindranath, matched and the universalhumanistic creative directions were renewed in Santiniketan. Land-people-environmental relationswere harmonized into neo-built environment culture. During this period, conscious attempts weremade to live in tune with nature and the environment, and to shed unnecessary expenses anddiscard wasteful construction.
Patrick Geddes had also admired the Poet’s Santiniketan built environment, the ecologicallaboratory, modern green centre of learning, the forest school. Perhaps he did realize Santiniketanbuilt form is almost of built- reality of ‘Sadhana’ (Gitanjali Tour, Rabindranath’s lecture in USA,1912-13): ‘The Relation of the Individual to the Universe’. Visva-Bharati, the synthesis and unificationof a universal learning centre, was created by Rabindranath with the able support from multidisciplinary creative personalities with green hands-green minds of East and West. Santiniketan –Sriniketan (twin centre of life and living), onto the lap of man – nature harmony, were probably thefirst futuristic envoi-education and living design combined– model of twentieth century, morerelevant now, to this present century of the deep ecological crisis. Environmental philosophies ofPatrick Geddes and Rabindranath Tagore had matched with their common mission of green peace –living environment culture.

10 INDIAN JOURNAL OF LANDSCAPE SYSTEMS AND ECOLOGICAL STUDIES VOL. 43
Geddes had worked in India for various regional planning projects between 1915 and 1925. Hehad travelled widely with the travel-worn briefcase inscribed. “To P. Geddes from his friend R.Tagore” (leather folio bag specially designed by Rathindranath Tagore, and presented byRabindranath to Patrick Geddes). Prepared reports on over fifty Indian Towns (planning report-project like Ahmadabad, Indore, Deccan village, Bombay urban design reports, university-culturecity planning in Lucknow, Nizam’s Hyderabad, town planning for Coimbatore, Guntur, Madura,Tanjor, also the twon planning office in Calcutta etc. as Consultant. Patrick was very active infunding department of sociology and civics for Bombay University (1920-23). This was the timewhen he was discussing with Rabindranath and taking his opinions for better setting of the centre.In a letter he was asking Rabindranath on his philosophy of creation of Santiniketan and Rabindranathopened his mind of mission to his friend in a rare letter May 9, 1922, ‘...you asked me for my opinionabout the scheme of your Department. I find it rather difficult to answer your question because myown work in Santiniketan has been first to last a growth, which has had to meet all this obstaclesand obstructions due to shortage of funds, paucity of workers, obtuseness in those who are calledupon to carry out my ideal ... It was an incessant lesson to me and the institution grew with thegrowth of my own mind and life ... All my activities have the character of play in them – they aremore or less like writing poems only in different medium of expression ...’. Patrick realized theunwritten but built form script of the Poet’s as built auto biography – the Visva Bharati. In this thisperiod, patrick and told C.F. Andrews that Santiniketan ecologic experimentation is the most hopefulone. He wanted to see full energy to be invested towards the aspired world environmental hopes –‘If I were 51, instead of 68 and nearing 70 years of age, I would throw in my lot with you- Um. – ForI think your’s the most hopeful thing – Um. – that I’ve never seen in India’.
Geddes had also contributed in the initial period of campus planning of Santiniketan-Sriniketan.Relationship of the modern Town and Country planner of the West, Patrick Geddes and and Easternlight of creative unity Rabindranath Tagore, creator of Santiniketan-Sriniketan, will require deepstudies for better understanding of futuristic global green built and safe environmental designs,inclusive eudcation in practice and urban-rural renewal work.
Rabindranath, Patrick and Arthur Geddes – Environmental ProjectsTo show gratitude towards Santiniketan, Geddes sent his son Arthur Geddes (1895-1968) and
then an able young Indian architect Vaman Rao to work there. Arthur Geddes (working fromSriniketan- Rural Re-construction project), inspired by Rabindranath had made detailed study andregional survey of rural Bengal and related field study of human geography with river studies andalso for regional water level-water table, soil settlement, weather study, wind movement and habitatstudy of the rural folk. His work on habitat study, re-design of rural market, specially Bolpur marketdesign and also report-on Visva-Bharati’s land and building details with photography, received wellappreciation. Arthur Geddes was touched by the learning atmosphere of Santiniketan-Sriniketan,and he wrote, “The olive grove under which Socrates spoke with Plato, Aristotle and their fellowdisciples, was as it were, re-planted at Santiniketan with tall and robust Sal trees and floweringevergreen Amlaki”.
NO. 1 GREEN PEACE VISIONARIES: RABINDRANATH AND GEDDES 11
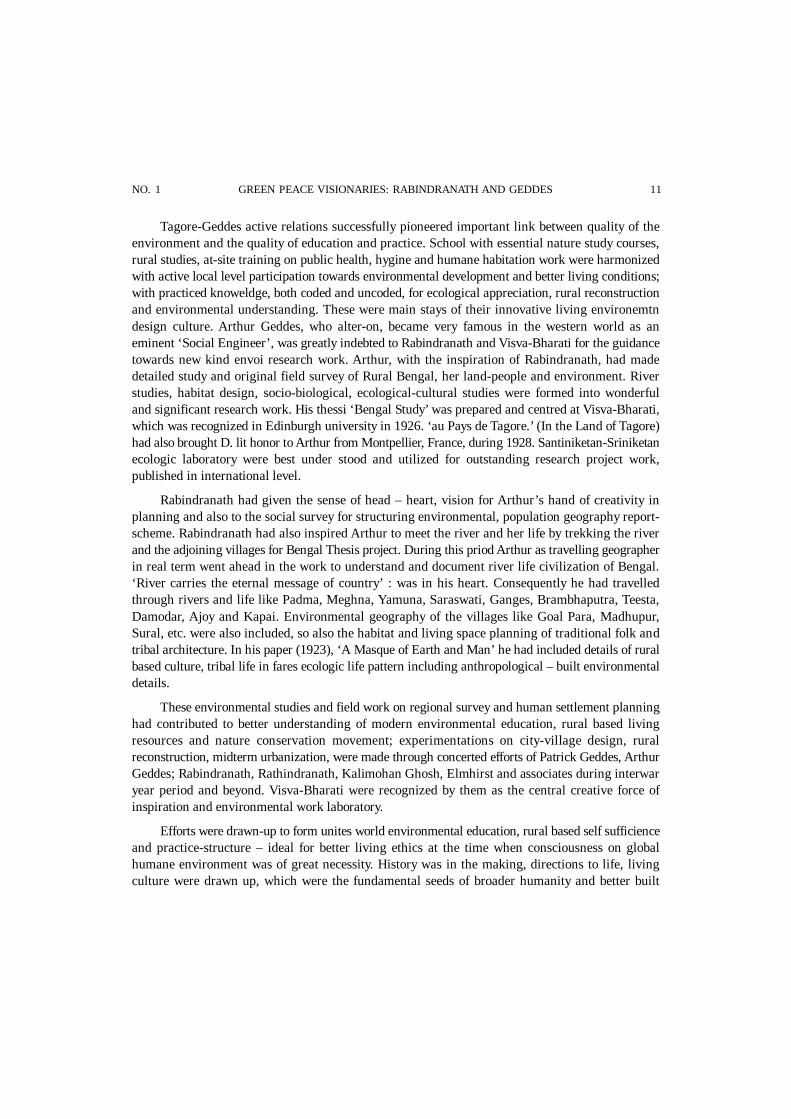
Tagore-Geddes active relations successfully pioneered important link between quality of theenvironment and the quality of education and practice. School with essential nature study courses,rural studies, at-site training on public health, hygine and humane habitation work were harmonizedwith active local level participation towards environmental development and better living conditions;with practiced knoweldge, both coded and uncoded, for ecological appreciation, rural reconstructionand environmental understanding. These were main stays of their innovative living environemtndesign culture. Arthur Geddes, who alter-on, became very famous in the western world as aneminent ‘Social Engineer’, was greatly indebted to Rabindranath and Visva-Bharati for the guidancetowards new kind envoi research work. Arthur, with the inspiration of Rabindranath, had madedetailed study and original field survey of Rural Bengal, her land-people and environment. Riverstudies, habitat design, socio-biological, ecological-cultural studies were formed into wonderfuland significant research work. His thessi ‘Bengal Study’ was prepared and centred at Visva-Bharati,which was recognized in Edinburgh university in 1926. ‘au Pays de Tagore.’ (In the Land of Tagore)had also brought D. lit honor to Arthur from Montpellier, France, during 1928. Santiniketan-Sriniketanecologic laboratory were best under stood and utilized for outstanding research project work,published in international level.
Rabindranath had given the sense of head – heart, vision for Arthur’s hand of creativity inplanning and also to the social survey for structuring environmental, population geography report-scheme. Rabindranath had also inspired Arthur to meet the river and her life by trekking the riverand the adjoining villages for Bengal Thesis project. During this priod Arthur as travelling geographerin real term went ahead in the work to understand and document river life civilization of Bengal.‘River carries the eternal message of country’ : was in his heart. Consequently he had travelledthrough rivers and life like Padma, Meghna, Yamuna, Saraswati, Ganges, Brambhaputra, Teesta,Damodar, Ajoy and Kapai. Environmental geography of the villages like Goal Para, Madhupur,Sural, etc. were also included, so also the habitat and living space planning of traditional folk andtribal architecture. In his paper (1923), ‘A Masque of Earth and Man’ he had included details of ruralbased culture, tribal life in fares ecologic life pattern including anthropological – built environmentaldetails.
These environmental studies and field work on regional survey and human settlement planninghad contributed to better understanding of modern environmental education, rural based livingresources and nature conservation movement; experimentations on city-village design, ruralreconstruction, midterm urbanization, were made through concerted efforts of Patrick Geddes, ArthurGeddes; Rabindranath, Rathindranath, Kalimohan Ghosh, Elmhirst and associates during interwaryear period and beyond. Visva-Bharati were recognized by them as the central creative force ofinspiration and environmental work laboratory.
Efforts were drawn-up to form unites world environmental education, rural based self sufficienceand practice-structure – ideal for better living ethics at the time when consciousness on globalhumane environment was of great necessity. History was in the making, directions to life, livingculture were drawn up, which were the fundamental seeds of broader humanity and better built

12 INDIAN JOURNAL OF LANDSCAPE SYSTEMS AND ECOLOGICAL STUDIES VOL. 43
envoi-culture for green future. This is also so very relevant now in strained, fractured world-healthsituation.
Patrick had structured his famous work: ‘Cities in Evolution’ during his stay in Calcutta (Kolkata).He had considered the ideals of organic life – living cultural philosophy of the Poet (Good- Beautiful0True) as an important pedestal for the balance between technology and human civilization and hadmentioned that Raindranath is the moral like between Eastern and Western civilization.
Built environmental initiatives of Visva-Bharati and the rural reconstruction movement hadpractically inspired Arthur Geddes to develop important human geography – projects. Land-peopleand environmental aspects of Bengal harmonizing with Rabindranath’s visions of ‘City and Village’,‘Co Operative Principle’ for inclusive development and relevant Poet’s songs were enveloped intoremarkable research paper and comprehensive work: ‘A Masque of Earth and Man’ (Song of Tagorewere used as envio-research component, Arthur wrote, ‘There is need for, and there are signs theworld over of such renewed and living drama which shall fearlessly play the great realities of Earth,of the Elements and of Life; of Nature and Humanity) and ‘Bengal Study: study of soil and civilizationof Bengal’ (1924 - 25). Rabindranath and Patrick Geddes had inspired Arthur to study at site riverand man relation, as travelling geographer. His D. Lit work was outstanding human geography,environment project work (1928), based on Tagore and his creative- inspired land: ‘Au Pays deTagore’ (In the Land of Tagore), where Bard’s melodies were at the centre. First of its kindenvironmental cultural research project appeared in the modern world based on the united hopes ofScotland – India and world brotherhood. Geddes- Tagore relations took historical turn towards thecommon goal in search of green peace habitation. Patrick (also the biographer of Jagadish Ch.Bose– ‘An Indian Pioneer-The Life and Work of J. C. Bose’, and then translated this book intoGerman language by himself) had created design of nature’s own amphi theatre (Surul Theatre)fitting to Poet’s drama ‘Muktadhara’ (The Water Fall), structured ‘Planning Civilization of India’,‘Education and Re construction a review of Science and Sanctity’ was published in Visva BharatiQuarterly (April, 1924), with introductory note from Rabindranath. ‘The Indian Temple of Science’on J. C. Bose’s institute was also written by Patrick and many significant environmental planningwork in India by him.
Rabindranath dedicated his special edition-book : ‘The Parrot’s Training’ (1918) to his friend,Patrick Geddes. This collector’s item-book was specially illustrated by Abanindranath Tagore, coverdesign by Nandalal Bose. Geddes was delighted with this timely gift, written to Rabindranath fromIndore, 11 January 1918 – ‘Admirable ! The parrot is being avenged! ... it would have pleased you... the delight with which my friend C.F.Dobson here, rector of the big High School ... carried off thisand gloated over it ... and showed it to the very people it is meant to kill (or cure?). I am sure it willhelp the cause everywhere...’. Patrick collected additional copies of this book for sending toeducational institutes in Europe and America.
On July 24, 1922, Mohendranath Dutta, outstanding art scholar, brother of Vivekananda,presented his book ‘Dissentation of Painting’ to Patrick Geddes, foreword note was written byAbanindranath Tagore.

NO. 1 GREEN PEACE VISIONARIES: RABINDRANATH AND GEDDES 13
Rabindranath wrote important forward note in the biography of Pat rick Geddes, ‘The InterpreterGeddes: ‘The man and his Gospels’ (1927) by Amelia Defres. Mumford had written the introductionnote. Rabindranath wrote, ‘what so strongly attracted me in Dr. Patrick Geddes when I came toknow him in India, was not his scientific achievements, but on the contrary the rare fact of thefullness of his personality rising far above his Science. His love of man has given him the insightto see the truth of man, and imagination to realize in the world the infinite my stery of life, notmerely its mechanical aspects ...’
Arthur was the staff of Edinburgh University from 1929 upto 1967. He was a specialist inHuman Geography, became quite famous both in East and West as eminent social engineer. He wasa staff and research scholar at Visva-Bharati; known for his abilities in environmental work. Arthuralways had great admiration for Rabindranath, he used to write on himself as ‘student-disciple ofRabindranath’. He had worked with Tagore during 1921-22 through 1924-25 and again in 1939. Hewas a great admirer of India’s rich cultural heritage, her vast green nature and creative people. Lasttime he came to India during 1956 for the national planning programme of free India. Arthur Geddeswas the Chairman of Scottish committee for Tagore centenary celebration at Scotland. Through hispersonal understanding of India and Rabindranath, he could present illuminated projects, onRabindranath with great success (1961, Edinburgh).
Scots College – Indian College (Plan Des Quatre Seigneurs, Montpellier)Environmental philosophies of Geddes and Rabindranath had matched with the creative
direction that was started in Santiniketan as well as on the making of Scots College (1925-26), andIndian College in France. Patrick wrote to Rabindranath from Scots College on 12, March 1927, ‘...Here our college is already modifying place, work, and so far reaching people. In this suburbanvillage, just outside the city; while our Chateau further out, has been for a thousand years thecentre of its typical rural village – and is now beginning to change from heavy burden on it tohelpful group, one increasingly wrothy, we hope, of visitors from Santiniketan and Surul, and ifpossible here and there suggestive to them in turn. For this reach out, in small beginnings, but largeprinciples, towards the valorization of rural France, as yours to the corresponding renewal ofBengal...’
Indian college was established at Mortpellier in 1929. Studies’ on Indian Art and Culture, herenvironmental education, cultural relations of place, work and folk, both traditional and modernwere taken into the strides of centre of practice in France at the time when India was struggling forpolitical freedom. India’s eternal message of peace and culture, work and education, life and beautywere coming up as the great inspiration in built ideals in this centre in Europe.
This College was founded by the Director, Patrick Geddes; he had with im, another friend ofIndian Art and Culture Prof E.B.havel. The Secretary was Dr. G.g. Advani. Rabindranath Tagore wasinvited as President. Jagadish Chandra Bose, Brojendranath Seal and Michael Sadler were the vicePresidents. It was the dream towards deed; throught and action to create great globe envio-culture.

14 INDIAN JOURNAL OF LANDSCAPE SYSTEMS AND ECOLOGICAL STUDIES VOL. 43
On 22 August, 1929 Geddes writes to Rabindranath– ‘Last night I was reading your ‘CreativeUnity with fresh interest and renewed pleasure...’. ‘... so will you (our President) send us a worldbenediction – a verse – a students’ song or what you will – whatever may come to you? I need notsay how it will be valued...’ ‘... migration of students between universities to universities-culturalintercourse ... but the essential claim is that we are all have far less dominated by urban thoughtand mechanistic science and far more by rural thought and biologic science and this in its humanizedand social forms-and increasingly in application: as already in two villages.’
On 16 September 1929, Indian College was inaugurated with Rabindranath’s musical melody.Music was presented by the able student of Rabindranath, Arthur Geddes, who was also known asoutstanding violinist, trained with Tagorien music, while he was closely working with Rabindranathin India.
The Song was–
“The eternal dreamis borne on the wings of ageless lightthat rends the veil of the vagueand goes across timeweaving ceaseless patterns of Being...”
Tagore Centenary, EdinburghWith the initiative of Arthur Geddes, Tagore centenary was celebrated as a part of famous
Edinburgh festival with creative support of Edinburgh University. This festival do have greatimportance from cultural presentation point of view in the world, even today.
On 13 May, 1961, interesting news came up at ‘The Scotsman’, Weekend Magazine – on“Presenting Tagore in sound and sight”. Theme pavilion was constructed. This kind of themepavilion based on Rabindranath’s life and work was very unique. Even today such type of themedesign presentation encircling life of Rabindranath and his Santiniketan-Sriniketan are unique andrare. Even in spite of archival material advantage, presenting Tagore in a theme design pavilion aredifficult, because of immense varieties and dimensions of multilayered creative life and personalityof Rabindranath.
Finally, the exhibition was organized in Adam House in Chamber Street during 28 Augustthrough 9 September, 1961. Painting, literature, music and cultural creativity of Rabindranath alongwith his ideas and ideals on environment (Santiniketan-Srinikatan model) were presented here.Basic Theme Pavilion was constructed using stabilized mud architecture in tune to folk architectureof Bengal; also using the flavor of Tagoriean land of aesthetics and her culture. Varieties of naturalplants, shrubs, flowers and leaves were taken from India to create such presentation. Bengal’sgeographical spread and geo-political expressions were also presented along with river linkedcivilization which were very close to the Poet’s heart.

NO. 1 GREEN PEACE VISIONARIES: RABINDRANATH AND GEDDES 15
Such envio-architectural expressions had the rare abstraction of poet’s life in light and shades,sound and music. Rabindranath’s song “Deep in my heart he lives everywhere” was flowing-in atthis sound and light theme pavilion. Santiniketan and Sriniketan’s objectives and expressions werenarrated in visual design panels at the first floor of Adam House.
Indian’s rich handloom – handicraft, art and craft, rural art heritage and rural glories were alsoadded. During long period of socio-economic oppression, our national ecologic life were grosslyaffected. This exhibition had also narrated such information. How seriously Rabindranath in adefined scale had attempted to encounter such negative forces through his positive creativity ofrural environmental reconstruction were also expressed with methodical distinction. His positiveattitude towards human welfare-culture was described in a rational form. Such logical form also hadexpressed Rabindranath as father figure of India’s own initiative towards co-operative movementand rural environmental reconstruction with people’s participatory model in real sense. During thisfestival, interesting article came up at ‘The Scotsman’, titled: “Rabindranath Tagore–Bard, Musicianand seer.”
This article written by Arthur Geddes had contained detail– outlines of life and work ofRabindranath, his physical feature and outstanding creative personality, his vision towards betterhumanistic welfare. Focus on how East- West creative unity had converged and acted on his life anwork, were interestingly formed as a part of presentation. Rabindranath was also coming up as adynamic light of hope for better living design who had fully expressed the ideals of dual heritagethrough his practiced life and creativity during the most difficult period of time. His creativity wascentred with humanistic spiritual and scientific dimension; such logical models were also narratedin this project with documentary support. Dress design of Rabindranath, its specialty and uniquenesswere also within this exhibition. How he had single handedly innovated the idea of informal materialfor formal design presentation, using Indian ethos, were so very effectively documented andpresented in visual format. It was also said that Rabindranath was fully aware on the seriousnessand importance of Nobel award. he was always read with his untiring work for global human unityand of nature’s unity, as inseparable part of his life’s mission – Sadhana.
On August 27, 1961, a musical programme was organized. It had rare composition of Tagoreconcept and construction of music. Creative melodies in English were presented; the program mewas titled, as “Songs by Rabindranath Tagore with their own melodies”. Some of the Englishversion of his songs was presented live, in melodies-in-staff.
Introduction was written with fifteen Tagore Songs as – “Tagore’s purpose in first asking meat Santiniketan and in the hills in 1923 to write down his melodies in staff, play them on the violinfor his own and his friends enjoyment and publish them (Paris 1928) was first, to recal them inpermanent form in staff as an international notations” Tagore was no merely a ‘poet’ but singer –melodist-poet in one, truly a ‘Bard’. His second purpose was that his songs should be sung in analmost international tongue, English...”
It may be mentioned here, earlier Rabindranath was delightfully inspired and got interested toArthur Geddes’ work using poet’s songs and translating into western presentation during Arthur’s

16 INDIAN JOURNAL OF LANDSCAPE SYSTEMS AND ECOLOGICAL STUDIES VOL. 43
stay at Visva-Bharati. He was writing to his ‘Dear Arthur’ in a letter of February 18, 1926 as – ‘...How delighted to have your letter. Do whatever you like with my songs’ only do not ask me to dothe impossible. To translate Bengali poems into English verse-form reproducing the original rhythmso that the words may fit in with tune would be foolish for me to attempt. All that I can venture todo is to render them in simple prose making, if possible for a worthier person than myself to verifythem. Please write the accompaniment ourself I can trust you, for you are modest and are not likelyto smother my tunes with a ruthless display of your own musical talent. I shall be able to give theoutline of the play from which the songs are taken in order to give them their proper background...’It may be mentioned that Arthur was talented violinist. He was specialist in presentation of Gaelicmelodies, quite conversant with western staff notations and highland music.
Arthur had also went into the details of Tagore melodies (as broader life culture) since he hadthe personal guidance and listening poet’s song from the band himself. This was quite interestingthat Rabindranath had asked Arthur to play his music in violin and write down the melodies in staffduring summer in Shillong hills (1923), when poet was writing the drama – ‘Rakta Karabi’ (RedOleander). Arthur had used fifteen songs of Rabindranath in his environmental D.Litt. work as wellas in separate publication in Paris, 1928. Understanding Tagore’s melody was very essential torealize Tagoriean culture. The relation between Geddes family and Rabindranath were also encircledinto layers of creativity. it was well realized that poet’s songs were very essential component toreconstructing global environmental cultural relations.
With such background of deep understanding, Arthur had well utilized his first of its kindwork on Tagore’s studies, which still stand out with glory. he than translated and had preparedmelodies in staff of some of the selected songs of Rabindranath, like :
Deep in my Heart (Ontare jagicha ontarjami)
Ah, my master! I know not try own singing (Tumi kaemon kore gan kore he guni!)
Road that lures away (Gram chara)
Ah, my soul searches after – seeks the distance
(Ami chan challo he, ami sudurer piashi)
O, we’re Raja’s-Royal, one and all! (Amra sabai raja)
March Alone! Stand Alone! (akla chalo re !)
Call me, ah ! Call me nevermore! (Deko na !)
Silent Art thou, why~ (Nirobe acho kaeno?)
Though my time has come to leave now, still they call me (Pi-chu-da-ke)
O the gateways of the sound – Let fling! (Basanta-eso he)
Ours is she-Santiniketan (Amader Santiniketan)

NO. 1 GREEN PEACE VISIONARIES: RABINDRANATH AND GEDDES 17
Arthur was working on ‘Songs by Rabindranath Tagore with their own Melodies’, alsotranslation work of selected songs of his ‘Gurudev-Bard, Musician and Seer’, with appreciation ofGaelic and Tagorean melodies, while ‘Presenting Tagore in Sound and Light’ (Tagore CentenaryCelebration, part of Edinburgh Festival), and later years– ‘Half a century of Population Trends inIndia’, ‘The Alluvial Morphology of the Indo-Gangetic Plain...’ etc. Arthur was also actively associatedwith the working of Five year Plan of free India, with Prof P. C. Mahalanobis.
Arthur wrote in Annual of Architecture, Structure and Town Planning (1961), the meaningfularticle on the relation of: ‘Two Friends: Rabindranath Tagore and Patrick Geddes’ – ‘Both Tagoreand Geddes were at one in their love for the wide space of a great horizon such as is commandedby the site of Santiniketan, and of the welcome shade of a living grove, the original meaning (asGeddes wanted to remind us) of the pregnant Grecian word academy.’ During one of the many ofhour long talks together, Tagore spoke of what he meant by the word relationship, ‘when you andI are together we are more than merely one plus one: together we make a third thing, somethingnew, a relationship, – the green peace.
Arthur had struck the most important dimension through their own experience (himself andhis father) of working in India: ‘Tagore will be seen as the Fore Father of India’s Five year plans toovercome Tyranny of Want.’ In ‘Weekend Magazine’ : The Scotsman: May 13, 1961, Arthur hadpresented Rabindranath as three fold power, leader of dual heritage, visionary of freedom, together,pained personality on the tyranny of want and above all receptiveness by all.
Environmental knowledge and practiced avenues of Rabindranath – Geddes reached to theplane of cultural convergence, in search of broader humanity and revival of eco-ethicalenvironmentalism. Arthur Geddes’s tribute is meaningful even today – on three fold human, thepower- ‘Remembering Rabindranath’s compelling, threefold power of creating word-and-melodyand singing his own songs; his own sense that this was his most real ttainment; and though herarely spoke of this the way in which his songs have gripped his fellow countrymen and women,young and old, I feel that the word ‘Poet’ is inadequate when applied to him. A better, truer word isthat which many a Scot and every Gael would use in daily speech among friends-the ancient andliving word ‘bard’. bard we, should surely call him, as I often did when I knew him.’
Futuristic Light: The Green PeaceNow we need to redesign the cultural continuity of Tagore – Geddes relations, which inventive
contemporary built environmental models in actions, for the revival of their practiced experienceand structure of expressions of Santiniketan – Sriniketan, Outlook Tower and Scots college – Indiancollege, to regenerate the vital norms and spirit of life and living, art-in-action, city-village interactions,urban-rural renewals, environmental cleaning, rural reconstruction and river centric habitation intoour global stream of green peace life. Their humanistic, spiritual and scientific built environmental(survey before plan, civility is beauty of behavior) language of hopes and human aspirations dohave the strength for making future of humane living culture. This will be as important to India, asfor the flame to live for the mankind. Their common concept of environment design, ecologicarchitecture and the complete environmental knowledge will be the futuristic light for improvement

18 INDIAN JOURNAL OF LANDSCAPE SYSTEMS AND ECOLOGICAL STUDIES VOL. 43
of quality of life and shaping our living space to a green character which fully uses low cost,environment friendly remedial options, towards new humanistic order, the world without borders,for better living conditions, based on the experience in the theory of life in environment, co-operative principles and the migration to the common plane of ecologic maximum.
Both Raindranath and Geddes had worked for bio-centric living civilization through theircreative dreams to green deeds. Their humanistic cultural relations-the united creativity, are thestrength for our better living world, now most relevant to environment- concerned global ecologicsociety. Complete environmental knowledge and ecological visions as imparted by Tagore – Geddesare the futuristic light for holistic improvement of quality fo life and living.
ReferencesTagore Rabindranath (1988). Creative Unity: Macmillan India Ltd., pp 3, 31.Tagore Rabindranath (1988). Sadhana: Macmillan India Ltd., pp 3, 93.Kripalini Krishna (2002). Dwarkanath Tagore, A Forgotten Pioneer: A Life, National Book Trust, India, pp.
191, 192.Geddes Patrick (1920). An Indian Pioneer – The Life and Work of Sir J. C. Bose: Longman Green: London,
New York, pp. 15. 30.Geddes Patrick (1924). Education and Reconstruction: A Review, Visva- Bharati Quaterly .os. Visva- Bharati,
pp. 81, 83.Geddes Arthur (1923). A Masque of Earth and Man, Visva- Bharati Quaterly. os. Visva – Bharati, Santiniketan.Geddes Arthur (1961). Two Friends: Rabindranath Tagore and Patrick Geddes, Annual of Architecture, Structure
and Town Planning, UK, May 1961.Banerjee Arunendu (2005). Rabindranath Tagore and Patrick Geddes: The Ecological Cultural Visionaries,
The Asiatic Society, Kolkata; pp. 16,22,26,32,42,66,91.Banerjee Arunendu (2005). Madhu Bata Ritawate: Collection of Essays on Tagore’s Thoughts on Architecture
and Environment ( in Bengali), Paschimbanga Bangla Academy, Kolkata; pp. 168,171,185,192.Banerjee Arunendu (2015). Santiniketan Built Environment and Rabindranath Tagore; Sandhi, A Journal of
Science and Heritage Initiatives, Indian Institute of Technology Kharagpur, pp. 131, 132.Banerjee Arunendu (2017). Space in Performance and Rabindranath Tagore; Stage and Screen: Representations
and Self-Discoveries; Dasgupta &Co. (P) Ltd., Kolkata, pp. 46, 60,61.

NO. 1 LAND USE CHANGE UNDER THE CONDITION OF HIGH POPULATION PRESSURE 19
Land Use Change under the Condition of High PopulationPressure: A Geographical Study of Ayodhya District,
Uttar PradeshVivek Kumar Shukla1, Sikandar2, V. K. Tripathi 3*
Abstract : This paper aims to analyze the impact of population growth and density on land use change during1991-2019 in Ayodhya district of Uttar Pradesh. Population density is considered as the main driving force ofland use change; and apart from this, there are some other factors i.e. urbanization, industrial developmentetc., which also affect the land use of any region. In this paper Ayodhya district has been selected as the studyarea to understand impact of population growth on land use change. Data was collected from secondarysources, tabulated and calculated in MS Excel sheet. Map was prepared with the help of ArcGIS software.Changes in spatial land use in the district were also analyzed using regression and correlation techniques. Theresults showed that the area under cultivable waste land has decreased, and the area under forest, net sownarea and non-agricultural use have increased. The area under forest has increased due to plantation inreserved forest areas. Area under cultivable waste land has decreased due to reclamation of the waste land forthe agricultural and residential purposes.
Keywords : Land use change, population growth, population density, agriculture
IntroductionLand is the platform which supports all the anthropogenic activities; it embodies all natural as
well as cultural landscape over the earth surface. With the development of medical sciences andgovernment initiatives to ensure the food security in 20th century, human population have registereda rapid increase and to meet the demand of food and shelter of this growing population, global landuse pattern, especially agricultural land use pattern, have gone through some drastic changes.Land use is the surface utilization of all developed and vacant land on specific point at given timeand space (Mandal, 1982).The area under forest, grassland and water bodies has been convertedinto cropland and built-up land all over the world. Land use can be defined as man’s activities andvarious usages which are carried on land (Clawson and Stewart, 1965). The geographicalinterpretation and understanding of land use change and driving forces are important in order toassess the socio-economic and environmental processes taking place in a given area.The pattern of
1, 2 Junior Research Fellow, 3ProfessorDepartment of Geography, Banaras Hindu University, Varanasi-221005.* Corresponding author: [email protected]
Ind. J. of Landscape Systems and Ecological Studies 43 (1) March - 2020, 19- 31 ISSN 0971-4170

20 INDIAN JOURNAL OF LANDSCAPE SYSTEMS AND ECOLOGICAL STUDIES VOL. 43
land use change is an important parameter to understand the land use planning, management andits sustainability. Historically, the most important driving force for most of the land use changes ispopulation growth (Meyer and Turner, 1992). Pressure of population on land use is the biggestchallenge in the present day scenario. Borah (2003) concluded that population pressure by increasingfood demand intensifies agricultural land use. Depending upon social, cultural, political and economicactivities the purpose of land use differs from one country to other. Developed and developingcountries have different land use pattern. The changes in land use in developed countries aremainly driven by economic reasons: such as large scale farming, urban development and industrialestablishments. But, in the developing countries poverty and rapid population growth are the majordriving forces (Ramankutty and foley, 1999) in this regard. Countries, like India, face immensepressure on land. Although India recognized the problem of rapid population growth soon after theindependence, it has limited success in controlling its growth rate (International Institute forPopulation Sciences and ORC Macro, 2000).
In this paper, an attempt has been made to highlight the nature of population pressure and itsimpact on land use change in Ayodhya district for the period from 1991 to 2019. The main objectivesof the study are:
(i) To analyze the changing land use pattern in Ayodhya district, and
(ii) To assess the impact of population growth on land use pattern of the district.
The Study AreaAyodhya district, is situated in the eastern part of the state of Uttar Pradesh. The official name
of district was changed from Faizabad to Ayodhya in November 2018 by the Uttar PradeshGovernment. It stretches from 26°24’ to 26°52’N of latitudes and in terms of longitude, it liesbetween 81°42’ and 82°28’E. The district has an area of 2764 sq. km. Ayodhya had a population of2,470,996 persons (Census of India, 2011). The district is surrounded by Basti and Ambedkar Nagarin the east, district Barabanki in the west, district Gonda in the north, and Sultanpur in the south. Itis part of the Middle Ganga Plain and covered by alluvial soil.
Data base and MethodologyThe data for this study have been collected from various secondary sources such as Directorate
of Economics and Statistics of Ayodhya district, and District Census Handbook, Ayodhya. Landuse data of 1999-2000, 2009-10 and 2018-19 have been used for the analysis of changes in land use.However, the changes in population pressure are analyzed on the basis of 1991, 2001 and 2011census data. GIS mapping and other cartographic techniques have been used for interpretation andanalysis of data. The technical committee on Co-ordination of Agricultural Statistics, setup in 1948,by the Ministry of Food and Agriculture, recommended a nine fold land use i.e. (i) Forests (ii)Barren cultivable waste, (iii) Present fallow land, (iv) other fallow land, (v) Barren & uncultivableland, (vi) Land put to non-agriculture use, (vii) Pastures, (viii) Area under bush & garden, and (ix)Net Area sown. On account of general understanding and requirement of this study, land use hasbeen classified only in four categories namely: (i) Forests (ii) area under non-agricultural use (Barren

NO. 1 LAND USE CHANGE UNDER THE CONDITION OF HIGH POPULATION PRESSURE 21
Fig. 1: Location Map of the Study Area

22 INDIAN JOURNAL OF LANDSCAPE SYSTEMS AND ECOLOGICAL STUDIES VOL. 43
& uncultivable land and Land put to non-agriculture use) (iii) Cultivable waste land (Barren cultivablewaste, present fallow land, other fallow land, Pastures and Area under bush & garden) (iv) Net Areasown. The area under non-agricultural use refers to the area not available for cultivation whichincludes all such lands which naturally or otherwise cannot be brought under cultivation. It comprisesthe land occupied by water bodies, human settlements, roads and streets and otherwise barrenlands etc. (Chandel, 1991).
Result and discussionsPopulation growth of Ayodhya district has been analyzed with the help of the census data
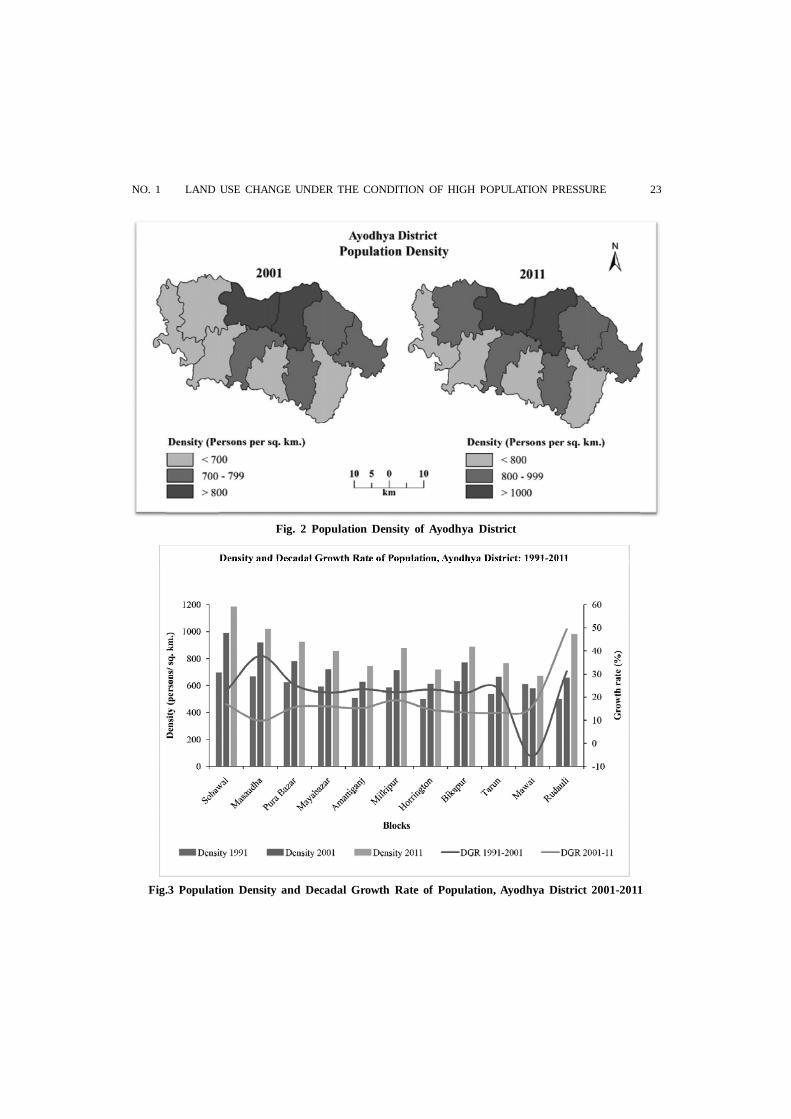
available from 1991 onwards. In 2001-2011, the population of Ayodhya district increased from 14,57,016to 24,70,996 persons with 18.07% growth of population and the highest decadal growth was seen inthe Rudauli (49.33%), Milkipur (18.56%) and Sohawal (16.85%) blocks and the lowest decadal growthwas in Masaudha (9.76%) block. In 2001, the highest population density was found in Sohawal(986), Masaudha (920) and Purabajar (782) blocks while the lowest density was found in Mawai(578) block. In 2011, the highest density was recorded again in Sohawal (1186), Masaudha (1019)and Rudauli (980) blocks, while Rudauli registered the high density due to rapid population growth(49.33%) during 2001-11. The lowest density was found in Mawai (672) block (Table-1, Fig. 2&3).
Table 1. Population density of the district
Blocks Area Population Density Decadal Growth(Sq.km.) Rate (%)
1991 2001 2011 1991 2001 2011 91-01 2001-11
Sohawal 178.62 143643 176179 211891 697 986 1186 22.65 16.85
Masaudha 206.13 137493 189536 210054 667 920 1019 37.85 9.76
Pura Bazar 203.59 127132 159271 188686 624 782 927 25.28 15.58
Mayabazar 214.59 126869 154666 183935 591 721 857 21.91 15.91
Amaniganj 247.50 126062 155532 183618 509 628 742 23.37 15.29
Milkipur 219.69 128526 156881 192651 585 714 877 22.06 18.56
Horrington 218.90 109151 134497 157544 499 614 720 23.22 14.62
Bikapur 195.14 123452 150353 173629 633 771 890 21.79 13.4
Tarun 271.03 145828 180101 207576 538 665 766 23.50 13.23
Mawai 238.60 146119 1,37,909 160332 612 578 672 -5.62 16.26
Rudauli 266.10 133193 1,74,661 260827 501 656 980 31.13 49.33
District 2459.89 1447468 1457016 2470996 587 730 876 22.47 18.07
Source: District Census Handbook of Faizabad, 1991-2011
NO. 1 LAND USE CHANGE UNDER THE CONDITION OF HIGH POPULATION PRESSURE 23
Fig. 2 Population Density of Ayodhya District
Fig.3 Population Density and Decadal Growth Rate of Population, Ayodhya District 2001-2011

24 INDIAN JOURNAL OF LANDSCAPE SYSTEMS AND ECOLOGICAL STUDIES VOL. 43
Land Use PatternLand use is the management and modification of natural environment into built-up environment
such as settlements and semi-natural habitats such as arable fields, pastures, and managed woods(FAO, 1999). The area of which data on land use classification are available, is known as the‘reported area’.
ForestAccording to the latest available data (2018-19) the total reported area of district is 2,
58,969 hectares which includes nearly 1.2% area under forest. In 1999-2000, 0.9 % of the totalreported area of the district was under forests which were less than 33%, the targeted percentagearea in the National Forest Policy, 1986. The area under forest in 2009-10 increased to 1.19% of thereported area due to expansion of forest into some barren land which further decreases to 1.16%of the reported area in 2018-19. The perusal of area under forest at block level in 2018-19 shows thatMawai block (26.01%) has the highest share of forest area followed by Rudauli (22.23%) and MayaBazar (07.31%). Masaudha (4.57%), Bikapur (4.66%) and Sohawal (4.73%) blocks registered thelowest area in forest cover (Table-2, Fig.4).
Non-Agricultural Land UseArea under non-agricultural use in the district was 6.73 percent area of the total reported area
in 1999-2000 which increased to 16.23 % in 2009-10 and further decreased to 15.78 percent in 2018-19. Area under non-agricultural use was very high in Rudauli block (12.52%) in 2018-19 followed byMaya Bazar (10.69%) Sohawal (9.78 %) and Masaudha (9.54%) and it was lowest in the Mawai(7.80%) and Bikapur block (7.29%) (Table-2, Fig.4).
Cultivable Waste LandCultivable waste land includes that land which may be brought under cultivation. This category
comprised 17.06 percent in 1999-2000 of the total reported area which slightly decreased to (15.86%)in 2009-10 and further declined to (12.48%) in 2018-19. The highest area under cultivable waste landwas found in Tarun block (12.48%), Rudauli (9.83%) and Amaniganj (10.38%), whereas Horringtongunjblock (6.51%) had the lowest area under cultivable waste land in 2018-19 (Table-2, Fig.4).
Net Area SownThe land use pattern in Ayodhya district is dominated by net area sown because of better
irrigation facilities. Net area sown represents to the total cultivated area which accounted for 67.25%of the total reported area in 1999-2000. This area decreases to 66.73% in 2009-10, but again increasesto 69.19 % in 2018-19. There is variation in distribution of net sown area at block level. In 1999-2000,it was the highest in Rudauli block (13.50 %) followed by Tarun (10.50 %), Horringtongunj (09.70%)and Amaniganj (09.38 %) blocks, whereas the lowest net area sown was in Pura Bazar block (07.39%). In 2018-19, land under this category was the highest in Rudauli block (13.27%) followed byTarun (09.42 %) and Milkipur block (09.41%) whereas the lowest net area sown was registered inPura Bazar block (07.62 %) (Table-2, Fig.4).

NO. 1 LAND USE CHANGE UNDER THE CONDITION OF HIGH POPULATION PRESSURE 25
Table. 2: Block Wise Land Use Pattern
CD Block Land Use Classes (Area in ha and percent)
Forest Net Sown Area Cultivable Waste Area under non-Land agricultural use
1999- 2009- 2018- 1999- 2009- 2018- 1999- 2009- 18-19 1999- 2009 20182000 2010 2019 2000 2010 2019 2000 2010 2019 2000 2010 2019
Sohawal 5 143 143 13566 14151 14691 3091 2791 2370 3340 3956 4342
0.21 4.72 4.73 7.91 8.19 8.20 7.10 6.79 7.33 8.87 9.41 9.78
Masaudha 3 138 138 13899 14402 14623 3379 3078 2690 3736 4178 4237
0.13 4.56 4.57 8.10 8.33 8.16 7.76 7.49 8.32 9.92 9.93 9.54
PuraBajar 4 178 178 12691 13158 13667 5274 3959 3111 3173 3838 3980
0.17 5.88 5.89 7.40 7.61 7.63 12.11 9.64 9.62 8.43 9.13 8.96
Mayabajar 5 221 221 14949 14711 15279 3008 2942 2537 3980 4590 4749
0.21 7.30 7.31 8.71 8.51 8.53 6.91 7.16 7.85 10.57 10.91 10.69
Amaniganj 524 188 188 16101 16248 16878 4606 4656 3355 3151 4067 4137
22.35 6.21 6.22 9.38 9.40 9.42 10.58 11.33 10.38 8.37 9.67 9.31
Milkipur 10 204 204 15274 15496 16095 3538 3528 2770 2722 3151 3572
0.43 6.73 6.75 8.90 8.96 8.98 8.12 8.59 8.57 7.23 7.49 8.04
Horrington 26 189 189 16647 15783 16395 2835 3897 2970 2615 3200 3468
1.11 6.24 6.25 9.70 9.13 9.15 6.51 9.49 9.19 6.94 7.61 7.81
Bikapur 5 141 141 13351 16255 16886 4126 3566 2657 2315 2965 3239
0.21 4.66 4.66 7.78 9.40 9.42 9.47 8.68 8.22 6.15 7.05 7.29
Tarun 14 164 164 18031 15629 16234 5287 5017 4034 2834 3598 3669
0.60 5.41 5.43 10.51 9.04 9.06 12.14 12.21 12.48 7.53 8.56 8.26
Mawai 1581 788 788 13904 14120 14660 4026 3811 2654 3856 2858 3464
67.42 26.02 26.07 8.10 8.17 8.18 9.24 9.28 8.21 10.24 6.80 7.80
Rudauli 168 675 669 23174 22898 23794 4380 3837 3178 5939 5640 5561
7.16 22.28 22.13 13.51 13.25 13.28 10.06 9.34 9.83 15.77 13.41 12.52
District 2345 3029 3023 171587 172851 179202 43550 41082 32326 37661 42055 44418
100.00 100.00 100.00 100.00 100.00 100.00 100.00 100.00 100.00 100.00 100.00 100.00
Source: Based on district statistical dairy (Economics & Statistical department, Ayodhya) 1999, 2009, 2019

26 INDIAN JOURNAL OF LANDSCAPE SYSTEMS AND ECOLOGICAL STUDIES VOL. 43
Land Use Changes
ForestDeforestation is an important process of land use/ land cover change(Lambin, 2001), but in
study area the change in land use structure during past 18 years (1999-2019) depicts that forestland increased in 9 blocks namely in Sohawal (2760%), Masaudha (4500%), Pura Bazar (4350%),Maya Bazar (4320%), Milkipur (1940%), Horringtongunj (626%), Bikapur (2720%), Tarun (1071%),and Rudauli (298.21%) but forest land in Amaniganj (-64.12%), Mawai (50.16%) declined due toincrease in agricultural and non-agriculture utilization of forests i.e. road and building construction,urbanization, industrial development and use of wood as industrial and domestic fuel etc. TheInternational Panel on Climate Change (IPCC) emphasized that the conversion between forest andother land-use types (e.g., forest to cropland, grassland, or other land-use types) is frequentlyreferred as deforestation. In contrast, afforestation “occurs when forest cover expands with theplantation of trees on lands without trees” (Rudel, 2005). In the district 28.91% increase has beenregistered during recorded period due to afforestation programs (Table-3)
Fig. 4: General Land Use Pattern in the District.

NO. 1 LAND USE CHANGE UNDER THE CONDITION OF HIGH POPULATION PRESSURE 27Ta
ble-
3: B
lock
Wise
Lan
d U
se C
hang
es (
area
in
ha)
Blo
ckFo
rest
Net
Sow
n A
rea
Cul
tivab
le W
aste
Lan
dA
rea
unde
r no
n-ag
ricu
ltura
l us
e
1999
-20
18-
Perc
ent
1999
-20
18-
Perc
ent
1999
-20
18-
Perc
ent
1999
-20
18-
Perc
ent
2000
2019
Cha
nge
2000
2019
Cha
nge
2000
2019
Cha
nge
2000
2019
Cha
nge
Soha
wal
514
327
60.0
013
566
1469
18.
2930
9123
70-2
3.33
3340
4342
30.0
0
Mas
audh
a3
138
4500
.00
1389
914
623
5.21
3379
2690
-20.
3937
3642
3713
.41
Pura
Baz
ar4
178
4350
.00
1269
113
667
7.69
5274
3111
-41.
0131
7339
8025
.43
May
aBaz
ar5
221
4320
.00
1494
915
279
2.21
3008
2537
-15.
6639
8047
4919
.32
Am
anig
anj
524
188
-64.
1216
101
1687
84.
8346
0633
55-2
7.16
3151
4137
31.2
9
Milk
ipur
1020
419
40.0
015
274
1609
55.
3835
3827
70-2
1.71
2722
3572
31.2
3
Hor
ringt
ongu
nj26
189
626.
9216
647
1639
5-1
.51
2835
2970
4.76
2615
3468
32.6
2
Bik
apur
514
127
20.0
013
351
1688
626
.48
4126
2657
-35.
6023
1532
3939
.91
Taru
n14
164
1071
.43
1803
116
234
-9.9
752
8740
34-2
3.70
2834
3669
29.4
6
Maw
ai15
8178
8-5
0.16
1390
414
660
5.44
4026
2654
-34.
0838
5634
64-1
0.17
Rud
auli
168
669
298.
2123
174
2379
42.
6843
8031
78-2
7.44
5939
5561
-6.3
6
Tota
l23
4530
2328
.91
1715
8717
9202
4.44
4355
032
326
-25.
7737
661
4441
817
.94
Sour
ce: C
ompu
ted
by A
utho
rs b
ased
on
Land
Use
dat
a, 1
999-
2019

28 INDIAN JOURNAL OF LANDSCAPE SYSTEMS AND ECOLOGICAL STUDIES VOL. 43
Area under Non Agricultural useFrom 1999-2019, area under non-agricultural use registered 17.94% increase in the district.
Highest increase observed in Bikapur (39.91%) block, other blocks such as Horringtongunj (32.62%),Amaniganj (31.29%), Milkipur (31.23%), Sohawal (30.00%), Tarun (29.46%), Pura Bazar (25.43%),MayaBazar (19.32%) and Masaudha (13.41%) also witnessed positive change in area under non-agricultural use due to economic activities as well as increase in built-up area however lowest areaunder non-agricultural use was found in Mawai (-10.17%) and Rudauli (-6.36%) blocks (Table-3).
Cultivable Waste LandA cultivable wasteland is a degraded land with minimum or no vegetation. Waste lands can be
brought under vegetation with appropriate effort (Balasubramanian, 2015). Cultivable waste landregistered a decrease of about 25.77 % in the district during 1999-2000 to 2018-19. This has beenpossible due to application of scientific techniques to an impressive enhancement in current fallow.Cultivable waste land registered an increased between 1999-2010, but declined in 2018-19 in most ofthe blocks because of significant increase in area under bushes, garden/horticulture and plantationalong with increase in current fallow. Horringtongunj (4.76%) is the only block where slight increaseof cultivable waste land was seen (Table-3).
Net Sown AreaNet Area Sown represents the total cultivated area during the reference year without considering
the number of times it has been cultivated in a year (Agricultural Census Division). This is the mostimportant category of land use, and is directly related to the crop cultivation and production offood for the human consumption. Net sown area registered an increase of 04.44 % during 1999-00to 2018-19 in the district. But at block level there are significant variations in net area sown duringthis period as in Tarun (-9.97%) and Horringtongunj (-1.51%) blocks registered decrease in netsown area and remaining nine blocks i.e. Bikapur (26.48%), Sohawal (8.29%), PuraBazar (7.69%),Mawai (5.44%), Milkipur (5.38%), Masaudha (5.21%), Amaniganj (4.38%), Rudauli (2.68%) andMayabazar registered positive change in net area sown in Ayodhya (Table-3)
Per Capita Land AvailabilityHigh population growth results into high population pressure on land due to reduction in the
per capita availability of the land. Table-4 shows the per capita land availability under major fourcategories in the district. The per capita forest land availability was negligible (0.00 ha) in 1999-2000which remained unchanged in 2018-19. This clearly indicates the pressure of population on theforest resource. The highest per capita forest land availability is recorded in Mawai block (0.01 ha),followed by Rudauli (0.00 ha) in 2018-19. The other blocks have very poor forest cover due to hugepopulation pressure and poor forest policy. Area under non-agricultural use decreased from 0.03 hain 1999-2000 to 0.02 ha per person in 2018-19 due to urban infrastructure development which is nota good sign from agricultural point of view. Almost all the blocks depicted a shift towards conversion

NO. 1 LAND USE CHANGE UNDER THE CONDITION OF HIGH POPULATION PRESSURE 29
of agricultural land for urban activities.Per capita availability of cultivable waste land in the districtdecreased from 0.03 ha in 1999-00 to 0.01 ha in 2018-19 which may be considered as a positivechange, because farmers started using fertilizers, pesticides and other technological innovations toreclaim the waste land for agricultural purposes. The real population pressure is noticed on percapita availability of arable land which was 0.12 ha in 1999-00, but continuously it shrank to 0.07 hain 2018-19. Block wise analysis shows that the highest per capita availability of arable land wasnoticed in Horringtonganj block (0.10 ha) in 2018-19 followed by Bikapur (0.10 ha), Amaniganj (0.09ha), Mawai (0.09 ha) and Rudauli (0.09 ha) blocks where per capita area was higher than otherblocks.
Table-4 : Per Capita Land Availability (in ha)
Block Forest Net Area Sown Cultivable Area Under NonWaste Land Agricultural Use
1999 2019 1999 2019 1999 2019 1999 2019
Sohawal 0.00 0.00 0.09 0.07 0.02 0.01 0.02 0.02
Masaudha 0.00 0.00 0.10 0.07 0.02 0.01 0.03 0.02
Pura Bazar 0.00 0.00 0.10 0.07 0.04 0.02 0.02 0.02
MayaBazar 0.00 0.00 0.12 0.08 0.02 0.01 0.03 0.03
Amaniganj 0.00 0.00 0.13 0.09 0.04 0.02 0.02 0.02
Milkipur 0.00 0.00 0.12 0.08 0.03 0.01 0.02 0.02
Horringtonganj 0.00 0.00 0.15 0.10 0.03 0.02 0.02 0.02
Bikapur 0.00 0.00 0.11 0.10 0.03 0.02 0.02 0.02
Tarun 0.00 0.00 0.12 0.08 0.04 0.02 0.02 0.02
Mawai 0.01 0.00 0.10 0.09 0.03 0.02 0.03 0.02
Rudauli 0.00 0.00 0.17 0.09 0.03 0.01 0.04 0.02
Total 0.01 0.00 0.12 0.07 0.03 0.01 0.03 0.02
Source: Computed by Authors based on Census of India 1991, 2011 & District Statistical Hand Book, 1999and 2019
Correlation between Population Density and Different Land UsesIf we see correlation between forest area and population density (Fig. 5A) then the equation
of the regression line is y = -0.4095x + 633.56, whose coefficient of correlation is 0.271, whichindicates that the forest area is decreasing with increasing population density. The coefficient ofdetermination R2 is 0.0735, indicating that the figure is determined by 49.47 percent of the regressionline of diversity. Similarly, Fig. 5B, 5C and 5D which are showing correlation of population density

30 INDIAN JOURNAL OF LANDSCAPE SYSTEMS AND ECOLOGICAL STUDIES VOL. 43
with area under non Agricultural use, cultivable waste land and net area sown, whose correlationcoefficient is 0.47, 0.42 and 0.44 respectively. On the basis of the Fig. 5C & 5D we can say that asthe population density increased in Ayodhya district cultivable waste land and net area sown alsoincreased.
Fig 5: correlation between population densities with different land uses
Fig. A Fig. B Fig. C Fig. DForest Area Vs Area under non Cultivable Waste land Net Area Sown Vs.Population Density Agricultural use Vs Vs Population Density Population Density
Population Densityy = -0.4095x + 633.56 y = 2.1468x + 2157.4 y = -1.3143x + 4090.1 y = 0.8098x + 15582R² = 0.0735 R² = 0.2262 R² = 0.1782 R² = 0.002
Summary and ConclusionPopulation pressure caused by rapid population growth is the key to all changes i.e. land use
system, pattern, structure and demand etc. On the basis of the present study the followingconclusions have drawn.
In 2018-19, forest cover was the maximum in Mawai block followed by Rudauli and Bikapurblock. Sohawal, and Masaudha had very poor forest cover. The share of net area sown was found

NO. 1 LAND USE CHANGE UNDER THE CONDITION OF HIGH POPULATION PRESSURE 31
the highest in Rudauli followed by Amanigunj block, while the lowest in Pura bazar block. Cultivablewaste land was the highest in Tarun and Amanigunj the lowest in Maya bazar. In terms of landavailability (ha/person), block wise analysis shows that the highest availability was noticed inHorringtonganj block (0.10 ha) followed by Bikapur (0.09 ha), Amaniganj (0.09 ha), Mawai (0.09 ha)and Rudauli (0.09 ha) blocks, where percentage of per capita area was higher than other blocks.Forest availability found the maximum in Mawai, followed by Amanigunj. The availability of cultivablewaste land was found the highest in Horringtonganj and Tarun block followed by Amanigunj andMawai and it was the lowest in Sohwal block. Availability of area under non-agricultural use wasfound the highest in Mayabazar, while it was the lowest in Tarun Block.
The above analysis clearly reveal that population pressure had been increasing at considerablerate which resulted into decline of per capita land availability i.e. land available for cultivation from0.12 to 0.07 ha/person during the mentioned periods. To maintain the carrying capacity of landunder cultivation, cultivable waste land can be used with suitable land reclamation technique andexpansion of irrigation facilities. In this regard, Horringtonganj and Tarun block should be givenpriority, since these blocks have the highest share of cultivable waste land. There is also need tocurb the high growth of population, so that fast decline in per capita land availability could bechecked.
ReferencesBatunacun, C., Nendel, H., and Lakes, T. (2018). Land-use change and land degradation on the Mongolian
Plateau from 1975 to 2015- a case study from Xilingol, China, Land Degradation & Development,29: pp. 1595–1606.
Census of India (1991). Primary Census Abstract, Office of the Registrar General of India, Ministry of HomeAffairs, New Delhi
Chandel, R. S. (1991). Agricultural Change in Bundelkhand Region, Star Distributer: pp.67, 79.Clark, C. (1967). Population Growth and Land Use, MacMillan, London.Clawson, M., and Stewart, C.L. (1965). Land use information. A critical survey of U.S. statistics including
possibilities for greater uniformity.Lambin, E. F., Turner, B.L., and Geist, H.J. (2001). The causes of land use and land cover change: Moving
Beyond the Myths, Global Environment Change, 11(4): pp. 261-269.Liu, J., Liu, M., and Zhuang, D. (2003). Study on spatial pattern of land use change in China during 1995-
2000, Earth Sciences, 46(4): pp. 378-384.Mandal, R. B. (1982). Land Utilization, Concept Publishing Company, New Delhi: pp.1-21.Ramankuty, N., and Foley, J.A. (1999). Estimating Historical Changes in Global Land Cover: Croplands from
1700 to 1952, Global Biogeochemical Cycles, 13(4): pp.997-1027.Rudel, T.K.,et al. (2005). Forest transitions: towards a global understanding of land use change. Global
Environmental Change,15: pp. 23–31.Shafi, M., (1972). Measurement of agricultural productivity of the great Indian plains, The Geographer,
19(1): pp. 7-9.Tekle, K., and Hedlund, L. (2000). Land cover changes between 1958 and 1986 in Kallu District, Ethopia,
Mountain Research and Development, 20(1): pp. 42-51.

32 INDIAN JOURNAL OF LANDSCAPE SYSTEMS AND ECOLOGICAL STUDIES VOL. 43
Changing Urban Dynamics In and Around BaranagarMunicipality, West Bengal
Alpana Ray*
Abstract : Urbanization is one of the important anthropogenic components in changing the physical andenvironmental framework in a region. It is the method of understanding the growth of urban areas, theincrease of built-up area, change in density of population, and also transformation of the urban way of life ofthe population. Baranagar Municipality, located in the North 24 Parganas District of West Bengal, has 34wards spreading in a 7.12 sq. km. area with a population of 245213 persons. It has been found that the built-up area of the municipality increased significantly, and also the areas under water bodies and bare landdecreased in the study period to accommodate the huge population. The relationship between urbanization andgrowth of population had been positive at the eastern part of it, whereas the rate of urbanization was less inits western portion. So, it is clear that urbanization at the eastern part had been more accelerated than thewestern part due to availability of vacant land, and this also invited many urban problems like haphazardunplanned growth, crowding, poor drainage facilities, and water logging. The research concludes that there isa need for systematic and comprehensive planning for sustainable development with a healthy urban environmentand proper conservation of existing natural resources.
Keywords : Urbanization, Urban development and planning, Urban infrastructure, Land Use/ Land Coverchange
IntroductionUrbanization is the method of urban area growth, which results in population growth, an
increase of built-up area, high density of population, and it also the psychological stage of theurban way of life. Urbanization is one of the important components in changing the demographiccharacteristics, urban dynamics, and plays an important role in transferring the physical-culturallandscape of a region. The developing countries, located within the tropics are currently facingrapid urbanization at a faster rate (Gupta, 1999). A detailed understanding of the dynamics ofurbanization is very much essential for the sustainability of the urban environment.
Urbanization is one of the serious issues at present because uncontrolled urbanization mayinvite many environmental and urban issues which might have both positive and negative impactslike unauthorized urban sprawl, loss of productive agricultural land, forest, and water bodies, and
* Assistant Professor in Geography, Prasanta Chandra Mahalanobis Mahavidyalaya, KolkataEmail : [email protected]
Ind. J. of Landscape Systems and Ecological Studies 43 (1) March - 2020, 32- 44 ISSN 0971-4170

NO. 1 CHANGING URBAN DYNAMICS IN AND AROUND BARANAGAR MUNICIPALITY 33
other related problems (Bhagat 2005, 2011). The monitoring of urbanization is very much crucial forregional planning and management of cities for implementing policies to optimize the use of naturalresources.
In the Baranagar area, which is located in the northern part of the Kolkata urban agglomeration,it is found that not only the concentration of population has been increased in the last thirty yearsdue to its proximity of Kolkata Metropolis but also there is a spatial shift in population concentrationfrom the western part to the eastern part. The study area is suffered by the immense pressure ofpopulation. After Partition in 1947 and the Bangladesh war in 1971, there was a very huge influx ofrefugees in the Baranagar area due to the proximity of this area and was found that most of thepopulation concentration was confined in the western part only and the northern part and theeastern part were mostly uninhabited. This research finds an interesting character of urbanizationto portray the spatial shift of population growth and urbanization in the eastern part from theoriginal western part which invite many urban problems in the region and also needs proper planningin the coming future for sustainable urban development.
The Study AreaBaranagar Municipality situated on both sides of Barackpur Trunk Road is one of the pivotal
regions of KMA (Kolkata Metropolitan Region) as it connects three important districts of WestBengal namely Hooghly, North 24 Parganas, and Kolkata (Human Development Report 2010). It is ahub of urbanization in recent years because of its close connectivity and proximity to KolkataMetropolis and acts as an important center of socio-cultural religious setup. It is located at 22.64ºNand 88.37ºE and has an elevation of 12 meters (39feet) from Mean sea Level. There are 34 wards inBaranagar Municipality spreading in 7.12 sq. km area with a population of 245213 (Census 2011). Itis the fourth-most densely populated city proper in the world. The Municipality is bounded byKMC in its south, Kamarhati Municipality in the east, River Hooghly in its west (Fig.1).
Objectives and MethodologyThe main objective of this present research work is to assess the population growth between
2001and 2011in different wards of Baranagar Municipality and to compare the population growthbetween the eastern and western parts of the study area and its relation to urban planning for asustainable urban environment.
The study is based on secondary sources of information. The data relating to areal andpopulation growth of the Baranagar Municipality has been collected from Baranagar Municipalityand District Census Hand Book. This study is based on secondary and primary information. Bothqualitative and quantitative methods have been applied to this research. The present research workis based on the application of modern as well as a conventional methodology with intensive work.The analytical part of the research is based on the compilation of various secondary data and alsoan analysis of primary data from field visits to fulfill the objective. Secondary data obtained fromthe Municipality offices, archival sources, downloaded information through websites, and the

34 INDIAN JOURNAL OF LANDSCAPE SYSTEMS AND ECOLOGICAL STUDIES VOL. 43
suggestions and recommendations made by interviewing the people who are the residents and alsoto analyze the research problems. The nature of the present research work is explorative and thewhole work has been done by descriptive as well as analytical methods.
Fig.1: The Study Area

NO. 1 CHANGING URBAN DYNAMICS IN AND AROUND BARANAGAR MUNICIPALITY 35
Population Growth and Urban ExpansionBaranagar Municipality was established in 1869, is one of the oldest municipalities in India. It
became the center for the extensive jute manufacturing gunny bags. M/s. Colvin Cow II Co. was thepioneer of industrial Baranagar (Som 1989). They founded a Sugar mill near Alambazaar. LaterGeorge Henderson founded Borneo Jute Factory at that site in 1859 and the factory was renamedBaranagar Jute Factory and till date in existence and it was the first mechanical jute factory in India.During the two world wars many engineering factories were set up in Baranagar and the townbecame famous as an Industrial city (Paul 2014). To provide the civic amenities North SuburbanMunicipality was formed in 1869 consisting of Chitpur and Cassipore (presently under KMC), allmouzas of the present Baranagar Municipal area along with Kamarhati, Ariadaha, and DakshineshwarMouzas of present Kamarhati Municipality. In 1881 North Suburban Municipality was divided intotwo parts 1. Cassipur-Chitpur Municipality 2. Baranagar Municipality. On 1st August, 1899 KamarhatiMunicipality was formed parting Kamarhati and Ariadaha Mouzas from Baranagar. In 1949Dakhneswar Mouzas was parted from Baranagar and merged with Kamarhati Municipality (Guha2016; Guin 2016).
1901 Baranagar had a population of 25,435 persons which was increased to 37,050 in 1931,77,126 in 1951, and 136,842 in 1971 (Fig. 2). Between 1901 and 1971 the population of Baranagarincreased by more than five times. According to West Bengal District Gazeteer in the decade of1951-61, the inflow of refugees from East Pakistan was the main reason to increase the huge growthof the population in the Baranagar area (Som 1989). According to West Bengal District Gazeteer, the
Fig. 2: Population growth in Baranagar Municipality 1901-2011

36 INDIAN JOURNAL OF LANDSCAPE SYSTEMS AND ECOLOGICAL STUDIES VOL. 43
demographic growth of the North 24 Parganas along with Calcutta began to attract immigrants fromthe distant parts of India. It highlights the beginning of the large scale of manufacturing units andnewly created employment opportunities encouraged the huge inflow from all over India. Immigrationfrom East Pakistan and an increase in birth rate over death rate pushed up the population growth inthe region. Between 1950-65 the population of Baranagar Municipality was increasing highly byimmigration than that by birth. From Fig. 2 it is observed that population growth in BaranagarMunicipality was inconsistent over the century. After the Partition in 1947 and Bangladesh war in1971, there was a very huge influx of refugees in the Municipality (Ahmed 2006). Secondly, theproximity of this Municipality in the KMC area is another reason for high population growth.
Fig. 3: Ward wise population in Baranagar Municipality 2001&2011
In the early twentieth century, some areas (Ward no. 12,14,17) of the municipality had a lowmarshy land covered with hola forest. Dr B C. Roy, Chief Minister of West Bengal had planned toreclaim this marshy low land for settling refugees from East Bengal in 1960 (Guha 2016). It was thendeveloped very haphazardly to accommodate large refugee population and government-built Refugeeindustrial complex, hospitals, tents by filing up this marshy land under Refugee RehabilitationProgramme (Plate 3). The region became popularly known as Refugee Colony in the district until1990 but in the second half of the twentieth century the extension of Metro railway Projects fromDumdum to Barrackpur via Baranagar area and Urban Renewal Programme by West Bengal Govt.has widened the scope of Urbanization in this area.

NO. 1 CHANGING URBAN DYNAMICS IN AND AROUND BARANAGAR MUNICIPALITY 37
Fig.
4:
War
d w
ise p
opul
atio
n in
Bar
anag
ar M
unic
ipal
ity 2
001&
2011

38 INDIAN JOURNAL OF LANDSCAPE SYSTEMS AND ECOLOGICAL STUDIES VOL. 43
According to the 1991census, the total population of Baranagar Municipality was 2,24,821 ofwhich the male population was 120134 (53.44%) and the female population was 104687 (46.56%).The highest population was found in ward number 29 followed by ward number 26. Ward no 14, 01,03 and 10 were under the low population category.
According to the 2001census, the total population increased to 2,50,768 among which themale and female population was 132559 and 118209 respectively (Census 2001, 2011). The highestpopulation was found in ward 33 followed by wards 12, 25, and 8, and wards 14,1, 03, etc. areconsidered under a smaller number of populations. In the 2011Census, the total population inBaranagar Municipality is 2,45,213 of which the male population was 126187 (53.44%) and thefemale population was 119026 (46.56%). The highest population was found in ward 1 followed byward 19, 16, and 20, and ward 34,11,12 &15, etc. are considered under less number of population(Fig. 4).
The urban growth in the study area has been greatly stimulated by Industrialization andCommercialization. The establishment of different manufacturing plants especially Baranagar JuteMill in Baranagar and the concentration of workers in and around the area has triggered theurbanization in Baranagar Municipality (Guha 2016). Development of Transport and Communicationis the key factor for the urbanization in the Baranagar Municipality as it is well connected not onlywith Kolkata City but through developed means of local transportation the different parts of thedistricts of West Bengal namely Hooghly and North 24 Parganas. At the time the factory wasintroduced, local transportation facilities were poor. The factory workers were compelled to livenear their place of employment. Congestion of housing resulted. The development in modes oftransportation and communication and the facilities that cities offer for satisfying the desire forcommunication also explain urban growth. Industrialization depends upon transportation so thatraw material and manufactured goods can be carried in large volumes. Baranagar area is wellconnected with railways, roadways, metro railways and ferry services with other districts of WestBengal. Baranagar Road Railway Station is one of the oldest railway stations and BelghariaExpressway and Barrackpur Trunk road pass through the Baranagar area which connects Kolkatawith northern suburban areas and Howrah and Hooghly.
Modern business and commerce pull young men to Baranagar Area where they are paidmunificent salaries. People live here not because they like it as a place of residence but becausethey can get jobs there. Employment opportunities are one of the main factors that led to urbanizationin the study area. Moreover, the Baranagar area is also home to many schools, colleges, educationalinstitutes of national importance, libraries, recreational centers, and health and these have attractedthe population to settle here and results in high population growth.
Two data sets (census data 2001& 2011) have been used to find out the decadal growth ratesof the population of different wards in Baranagar Municipality. Among 34 wards 17 wards (2,4,5,8,11,12,15,18,22,24,25,26,27,28,29,30,33) have negative growth of population whereas rest of the

NO. 1 CHANGING URBAN DYNAMICS IN AND AROUND BARANAGAR MUNICIPALITY 39
Fig.
5:
Dec
adal
gro
wth
of
popu
latio
n (in
per
cen
t) am
ong
the
mun
icip
al w
ards
of
Bar
anag
ar M
unic
ipal
ity
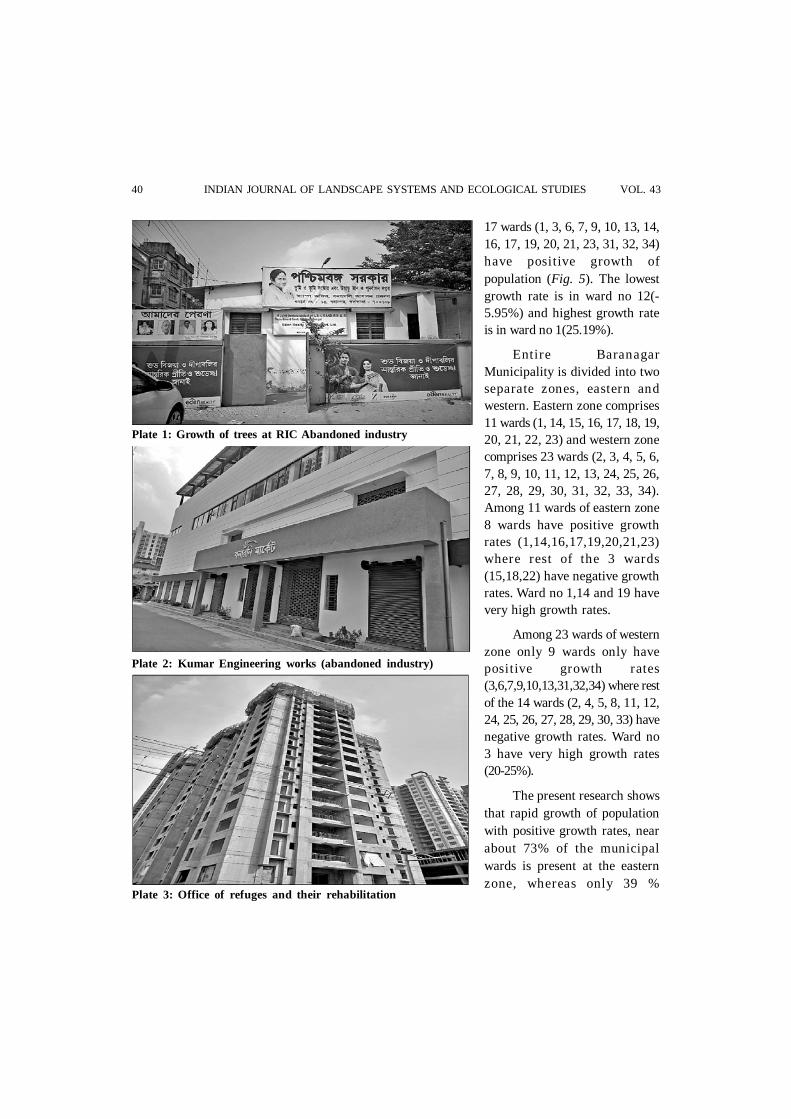
40 INDIAN JOURNAL OF LANDSCAPE SYSTEMS AND ECOLOGICAL STUDIES VOL. 43
17 wards (1, 3, 6, 7, 9, 10, 13, 14,16, 17, 19, 20, 21, 23, 31, 32, 34)have positive growth ofpopulation (Fig. 5). The lowestgrowth rate is in ward no 12(-5.95%) and highest growth rateis in ward no 1(25.19%).
Entire BaranagarMunicipality is divided into twoseparate zones, eastern andwestern. Eastern zone comprises11 wards (1, 14, 15, 16, 17, 18, 19,20, 21, 22, 23) and western zonecomprises 23 wards (2, 3, 4, 5, 6,7, 8, 9, 10, 11, 12, 13, 24, 25, 26,27, 28, 29, 30, 31, 32, 33, 34).Among 11 wards of eastern zone8 wards have positive growthrates (1,14,16,17,19,20,21,23)where rest of the 3 wards(15,18,22) have negative growthrates. Ward no 1,14 and 19 havevery high growth rates.
Among 23 wards of westernzone only 9 wards only havepositive growth rates(3,6,7,9,10,13,31,32,34) where restof the 14 wards (2, 4, 5, 8, 11, 12,24, 25, 26, 27, 28, 29, 30, 33) havenegative growth rates. Ward no3 have very high growth rates(20-25%).
The present research showsthat rapid growth of populationwith positive growth rates, nearabout 73% of the municipalwards is present at the easternzone, whereas only 39 %
Plate 1: Growth of trees at RIC Abandoned industry
Plate 2: Kumar Engineering works (abandoned industry)
Plate 3: Office of refuges and their rehabilitation

NO. 1 CHANGING URBAN DYNAMICS IN AND AROUND BARANAGAR MUNICIPALITY 41
municipal wards in the westernpart have positive growth rates.The rapid growth of populationin the eastern zone is due to rapidurbanization at the bare lands.The western zone was mainlyoccupied by the refugees ofEastern Pakistan at the post-independence time. Now with theclosing of industrial activities, thesettlement of the labours at thewestern zone becomes less dense.Only one ward (ward no 3) hasthe same character ofurbanization and populationgrowth as the wards of theeastern zone.
Urban Problems and Planning
As the present researchhighlights the changing nature ofurbanization and populationgrowth in Baranagar Municipality,it encompasses for spatialplanning, urban infrastructuraldevelopment, and improvement oflocal governance. The peopleshould be made aware of the factthat social, economic, andenvironmental changes over theyears in the area have largely beencaused by rapid, unplanned, andhaphazard urbanization leading toimproper use of natural resources.A number of individual landproperties have been convertedinto high rise apartments whichare commonly practiced in theeastern part of the Municipality
Plate 6: High rise building in Eastern part of BaranagarMunicipality
Plate 4: Bonorani Market, a new shopping complex at SiddhaLake View project
Plate 5: Siddha Lake View project

42 INDIAN JOURNAL OF LANDSCAPE SYSTEMS AND ECOLOGICAL STUDIES VOL. 43
as the open spaces and waterbodies are available in this part than the western part of thearea.
A very complex pattern of drainage and sewerage line has been developed in this area toaccommodate huge concentration of population and the condition of roads are very poor due to alarge number of vehicles and congestion. Slum population is also increasing in an alarming rate.Few numbers of small factories are found in the north-western corner of Baranagar and it leads thepollution level in an increasing rate. Residential areas have been developed in an extremely haphazardmanner and unplanned way. Another major problem is that there is total absence of fire brigade inthis area. So, it is very dangerous to live in this Municipality because there are a number offactories and residential places are also situated in a congested pattern. There are also found anumber of roads which have no footpath. The entire area was reclaimed from the marshy land sothe waterlogging problem is very acute in this area during monsoon months. Besides the majormarkets like Baranagar bazaar, Alam bazaar, Palpara bazaar etc. there are a lot of small markets foundin almost each and every ward and make area very congested and extremely unfavorable for living.
The huge pressure of population concentration must be decentralized and availability of basiccivic amenities like electricity, gas supply, drinking water supply, number of academic institutionsand health centres should be increased significantly for living in the urban environment. Firebrigade service must also be provided in this Municipality. After all, it can be said that BaranagarMunicipality enjoys an important and very significant place in the territory of North 24 Parganasdistrict because of its historical point of view and its adjacency to Kolkata metropolis. So propercapacity building, awareness programme should be evoked by the state and local government anddifferent NGOs to spread and share information about the adverse effects of rapid urbanization onvarious socio-economic and environmental aspects.
ConclusionsThe present research is a maiden attempt to show the impact of urbanization in the study area
and found that Baranagar Municipality has experienced rapid changes in high positive growth ofpopulation in the eastern part than that of the western part. The present research shows that rapidgrowth of population with positive growth rates (near about 73%) of the municipal wards is presentat the eastern zone of the Baranagar Municipality and only 39 % of municipal wards have positivegrowth rates in the western part. The rapid growth of the population in the eastern part had takenplace at the bare lands. In early, the western part had high built-up areas as it was developed toaccommodate the huge population that came from Eastern Pakistan and small scale to medium scaleindustries. Now with the closing of these industrial activities, the labour population is shifting fromthis area and the eastern part attracts new migrants from Kolkata city as Baranagar municipality isvery close to Kolkata Metropolis.
The haphazard urban expansion in the study area brings negative consequences to societyand on the natural environment. It has posed the most serious livelihood challenge to the original

NO. 1 CHANGING URBAN DYNAMICS IN AND AROUND BARANAGAR MUNICIPALITY 43
populations, fishing communities, and the industrial workers of the area. The massive expansion ofurban structures has led to an increase in the surface air temperature, increase in pollution level,overcrowding, poor sanitation problem, poor road connectivity, unwanted and haphazarddevelopment of some areas, and the adverse ratio of public amenities and population. All leads tothe unsustainable urban development of the area.
To overcome this problem, there is a need for systematic and comprehensive planning forsustainable development with a healthy urban environment and proper conservation of naturalresources. The monitoring of urbanization is very much needed for planning and managementpurposes by governmental and non-governmental organizations. It will help implement policies tooptimize the use of natural resources and accommodate development at the same time minimizingthe impact on the environment.
ReferencesAhmed. A., and Ali. M. J. (2006). Levels of urbanization in West Bengal: A quantitative approach, Geographical
Review of India, 68: 407- 416.Alberti. M., Marzluff. J. M., Shulenberger. E., Bradley. G., Rayan. C. & Zumbrunnen. C. (2003). Integrating
humans into ecology: Opportunities and Challenges for Studying Urban Ecosystems, AIBS Bulletin,53: (12): 1169-1179.
Anderson. E. (2006). Urban Landscapes and Sustainable cities, Ecology and Society, 11:(1): 34.Bhagat. R. B. (2005). Rural-Urban Classification and Municipal Governance in India, Singapore Journal of
Tropical Geography, 26: (1): 61–74.Bhagat. R. B. (2011). Emerging Pattern of Urbanization in India, Economic and Political Weekly, 46: (34): 10-
12.Census of India (2001). Demographic Data of Kolkata City 2001, Kolkata.Census of India (2011). Provisional Demographic Data of Kolkata City 2011, Kolkata.Cohen. B. (2004). Urban Growth in Developing Countries, A Review of Current Trends and Caution Regarding
Existing Forecast. World Development, 32: (1): 23–51.Davis. K. (1962). Urbanisation in India: Past and Future, in Roy. Turner. (ed.) Indian Urban Future. University
of California Press: 123-134.v mDistrict Human Development Report: North 24 Parganas, (2010), Development and Planning Department,
Government of West Bengal. [doi: 10.4236/jgis.2016.83031]Guha. S., Dey. A. (2016). Demographical View of Baranagar Municipality from 1991-200, International
Journal of Research in Applied, 4:(4):115-123.Guin. D., (2016). Urban Transitions in West Bengal, Journal of Asian and African Studies: 1 –19Gupta. A. and Ahmed. Rafi., (1999), Geomorphology and the Urban Tropics: Building an Interface between
Research and Usage, Geomorphology, 31:(1): 133-149.Heilig. G. K., (2012). World Urbanization Prospects: The 2011 Revision, United Nations, Department of
Economic and Social Affairs (DESA), Population Division, Population Estimates and ProjectionsSection, New York.

44 INDIAN JOURNAL OF LANDSCAPE SYSTEMS AND ECOLOGICAL STUDIES VOL. 43
Kantakumar. L. N., Kumar. S. & Schneider. K., (2016). Spatiotemporal Urban Expansion in Pune Metropolis,India using remote, Habitat International, 51:11–22.
Patra. S., Sahoo. S., Mishra. P., Mahapatra. S. C., (2018). Impacts of Urbanization on Land Use/ CoverChanges and its probable implications on Local Climate and Ground Water level, Journal of UrbanManagement, 7: 70-84.
Paul. S., (2014), Emerging Urban Centres–status and possibilities: A case study of the district of North 24Parganas, West Bengal’. Unpublished Ph. D. thesis, University of Calcutta.
Som, N., (1989),. Spatial Explosion towards the Metropolis-A historical account, Journal of Institution ofEngineers India, Architectural Division: 25-35.

NO. 1 INTERACTION BETWEEN ROAD NETWORK CONNECTIVITY PATTERN 45
Interaction between Road Network Connectivity Patternand Development in Darjeeling District of
West Bengal, IndiaBiswajit Paul1* and Subir Sarkar2
Abstract : Road transportation system is one of the key elements of a society that directly or indirectly affectsthe developmental process of any place or region. An efficient road network links the resource deficient areaswith resource surplus areas. Thus, making it a necessary consideration to understand the connectivity patternof the road network of any place. The northernmost district of West Bengal, Darjeeling is been selected toperform the analysis of road network connectivity, to understand the level of regional development within thedistrict and to find the prevailing correlation between them. Four network connectivity indices (Beta, Alpha,Gamma, and Cyclomatic Number) and levels of regional development are computed depending on ten selecteddemographic and socio-economic parameters such as household density, population density, effective literacyrate, total work participation rate, level of urbanization, villages electrified, road density, health facilities, thedensity of the educational institutes, and percentage share of net sown area. The study is primarily based onsecondary information analyzed in the SPSS platform and finally presented by cartographic techniques usingArcGIS. To examine the relationship between road connectivity and regional development, Spearman's RankCorrelation technique is used, prior to that, all the parameters of regional development are normalized usingthe z-score method. The result shows, there is a positive correlation (Spearman's rho = 0.683) between theroad connectivity and the regional development in the study area although the relationship is moderatelystrong.
Keywords : Road connectivity, Development, Z-Score, Spearman's Rank Correlation, Composite score.
IntroductionRoad transportation network is considered as the lifeline of human civilization because it
helps to distribute the natural resources as well as the human resources from a resource surplusarea to deficient areas. Transportation is referred to the movement of people, goods, services, andinformation between places. (Kansky, 1963) has defined the transport network as ‘a set of graphicallocations inter-connected in a system by several routes’. As per the India Transport Report: MovingIndia to 2032 of the National Transport Development Policy Committee (NTDPC) transport system
1 Junior Research Fellow, 2Professor, Department of Geography & Applied Geography, University of NorthBengal, West Bengal, India
* Corresponding author: [email protected]
Ind. J. of Landscape Systems and Ecological Studies 43 (1) March - 2020, 45- 56 ISSN 0971-4170

46 INDIAN JOURNAL OF LANDSCAPE SYSTEMS AND ECOLOGICAL STUDIES VOL. 43
are of five types : Railways, Roads and Road Transport, Civil Aviation, Port and Shipping, andUrban Transport. India is one of the leading countries in the world in terms of its total road networkhaving 5.6 million kilometers of road length (Basic Road Statistics of India, 2015-16) and jointly thestates of West Bengal, Maharashtra, Uttar Pradesh, Karnataka and Assam shares 43.11% of totalroad length of the country. Road network directly or indirectly affects the developmental process ofa place. The huge cost of road construction demands an effective utilization and it is possible bythe proper connectivity and orientation (Sreelekha, Krishnamurthy, & Anjaneyulu, 2016). Thus, it isnecessary to understand the connectivity pattern of the road network of a place. Connectivitygenerally means the degree of completeness of the arcs between the vertices (Robinson & Bamford,1978). The network connectivity evaluates the intensity of the connections between the roadsegments. A well-connected road network will have numerous nodes, short links, and the minimumnumber of dead-ends (Sreelekha, Krishnamurthy, & Anjaneyulu, 2016), (Hurst, 1974). Connectivityof a network can be measured by the uses of ‘graph theory’-a branch of typology which is concernedwith the elementary structure in which the ‘locations (nodes) are reckoned in terms of their positionon the geometric net and not by their actual locations. There are several measures or indicesavailable in the literature for the evaluation of the road network connectivity such as Beta, Alpha,Gamma, and Cyclomatic Number (Kansky, 1963). Whereas, development is a positive change in theeconomy, infrastructure, and society of a region, regional development is the provision of aid andother assistance to regions that are less developed. The transportation/development relationship isa two-way interaction process, and the results of the interaction depend upon the type of economyinvolved and upon the level of development at which transport improvements are affected (Hoyle,1973).
Literature ReviewSince the year 1960, many works have been done by various researchers and several indicators
are introduced for analyzing the transport network including the connectivity, accessibility, efficiencyand cyclic properties. Garrison(1960), has investigated the connectivity of the highway system.Kansky (1963), has studied the structural properties of the transportation network and developedgraph-theoretical measures. He has also analysed the interaction between regional character andtransport geometry. In the year 2009, an analysis of the Swiss road and railway networks werecarried out using graph theoretical measures (Erath, Löchl, & Axhausen, 2009). Similar works havealso been done by Xie, F., & Levinson, D. in the year 2007 and Sarkar in 2013.Saxena (1980),hasexamined the relationship of road connectivity of Rajasthan with the economic development of thestate. In the year 1983, the level of urbanization has been analysed in relation to the roadtransportation system of Rajasthan. Sreelekha, Krishnamurthy, & Anjaneyulu (2016),have emphasizedthe interaction of road network connectivity and spatial pattern of the roads in Calicut city.Thespatial analysis has been carried out by Dorosh, Wang, You, & Schmidt (2010) in theSub-SaharanAfrican region to correlate crop production and road connectivity. Similarly,Mukerji (1974), hasmade an attempt to correlate road connectivity and level of urbanisation in Rajasthan.

NO. 1 INTERACTION BETWEEN ROAD NETWORK CONNECTIVITY PATTERN 47
Fig.
1: L
ocat
ion
map
of
Dar
jeel
ing
dist
rict

48 INDIAN JOURNAL OF LANDSCAPE SYSTEMS AND ECOLOGICAL STUDIES VOL. 43
The Study AreaDarjeeling district is selected as a study area to carry out the present research. It is the
northernmost district of the state of West Bengal having an elongated shape, geographically thenorthern part of the district is of Great Himalayas (300 – 12000 ft. above MSL) and the southern partlies in the Tarai region.
The district extends between 26°26’47" to 27°13’17" north latitude and 87°59’27" to 88°29’30"east longitude and measures about 86 km in the north to south and 50 km in the west to east. Thetotal area of the district is 2040 square kilometers with 9 blocks ; Darjeeling Pulbazar, RangliRangliot,Jorebunglow Sukiapokhri, Mirik, Kurseong, Phansidewa, Naxalbari, Matigara and Kharibari. Thedistrict has 4 urban local bodies which consist of 2 municipalities (Darjeeling, and Kurseong), onenotified area (Mirik), and one municipal corporation (Siliguri). The district shares its common boundarywith two neighbouring nations Nepal to the west, and Bangladesh to the south-east. According toLSS O’Malley, historically the hilly areas of Darjeeling district were inhabited by the Lepchas,Limbus, Bhutias, Tibetans, and various Nepalese castes and tribes since ancient time. Whereas, theplain region is covered by dense forest and inhabited by the indigenous tribal group of thepopulation like Rajbangshi, Koch, Meche, Dhimal.
ObjectivesThe major objectives of the present study include: (1) to measure the road network connectivity
and level of development in the blocks of Darjeeling district, and (2) to find out the relation betweenthem.
Data and MethodsThe present study is based on the secondary sources of information collected from different
government reports such as the District Information System for Education (DISE) report (2011-12),All India Survey on Higher Education (AISHE) report (2011-12), District Census Handbook (2011),and District Statistical Handbook (Department of Planning and Statistics (2010-11).
Road connectivity indices are calculated using different formulae explained in Table 1: Formulaeused in the study from a transport map collected from Natural Resources Data Management System(NRDMS) centerJalpaiguri. To identify block-wise levels of development in the study area tenvariables are selected and transformed into a standardized form using the z-score technique andfinally, the Spearman’s Rank Correlation technique is applied to identify the relationship betweenconnectivity and development in the study area.
Results and Discussion
Road Network ConnectivityThe district is well connected with the rest part of the country by several National and State
Highways namely NH 31, NH 31A, NH 31C, NH 55, SH 12, and SH 12A (Old Numbering). The NH31begins at Barhi in Jharkhand further more, goes through Darjeeling district to eventually end at

NO. 1 INTERACTION BETWEEN ROAD NETWORK CONNECTIVITY PATTERN 49
Guwahati, in Assam. NH 31 has two tributaries namely NH31A and NH31C. The first one extendfrom Gangtok in Sikkim to NH 31 at Sevoke of Matigara block (Darjeeling district) and the secondone connects Galgalia in Kharibari block of Darjeeling district to Bijni in Assam. NH31 meets withNH 34 at Dalkhola in Uttar Dinajpur and NH 34 stretches up to Dum Dum near Kolkata, the statecapital of West Bengal. Besides these, there are NH 55 (connecting Siliguri city and Darjeelingtown), West Bengal State Highways 12 (connecting Alipurduar and Galgalia), 12A (connectingAlipurduar and Siliguri), and numerous other roads maintained by Zila Parisad and Gram Panchayats.The average road density of the district is 1.19 kilometers per square kilometer (District StatisticalHandbook, 2010-11). Road connectivity indices (, , , and ) for all the blocks are calculatedusing a detailed transportation map of Darjeeling district collected from Natural Resources DataManagement System (NRDMS) centre Jalpaiguri.
Beta index () is the ratio of edges and vertices of a network. Whereas the alpha index () isthe ratio of an actual number of circuits i.e. the number of cycles () or a cyclomatic number and themaximum possible number of a circuit in a graph. Gamma index () measures the relation of the
Table 1: Formulae used in the study
Measurements Equations Description
Beta index ()ev
e = Number of edges or links
between the nodes.
Alpha Index ()e v 12v 5
v = Number of vertices in the
road network.
Gamma Index ()e
3(v 2)
g = Number of not-connected
subgraphs in the network.
Cyclomatic Number () e v g
Z-Score x x
Z
x = Individual observation
x = Mean. = Standard deviation
Spearman’s Rank Correlation2
s 36 dr 1n n
2d = Sum square of the
(rs) difference between ranksn = Number of variables

50 INDIAN JOURNAL OF LANDSCAPE SYSTEMS AND ECOLOGICAL STUDIES VOL. 43
actual number of edges present in a graph and the maximum possible number of edges in the samegraph. The descriptive figures of different connectivity indices are given in Table 2.
Table 2: Descriptive Statistics of road connectivity in Darjeeling district
Minimum 1.00 (Phnasidewa) 0.02 (Phnasidewa) 0.35 (Phnasidewa) 1.00 (Mirik)
Maximum 1.24 (Darjeeling Pulbazar) 0.15 (Mirik) 0.48 (Mirik) 11.00 (Matigara)
Average 1.15 0.10 0.41 6.11
Std. Deviation 0.07 0.04 0.04 3.03
Source: Computed by the authors
A Composite Connectivity Score (CCS) for all the blocks have been computed by summing upthe calculated index values of , , , and (Saxena H. M., 1980). All the blocks are ranked in orderfrom the highest level of connectivity to the lowest. According to composite connectivity scores,the district has been categorized (Figure 2 Figure 3) into three zones, based on Natural Breaks(Jenks).
High Connectivity Zone:The highest connectivity is observed in Matigara block (12.75)followed by Darjeeling Pulbazar block (11.82). The early settlement had come up in Darjeeling andSiliguri, and the access to the Darjeeling town located in the Darjeeling Pulbazar block was through
Table 3: Block-wise levels of road connectivity
Sl . Name of the Blocks Beta Alpha Gamma Cyclomatic Composite RanksNo. Index Index Index Number Connectivity (r1)
( ) () ( ) () Score (CCS)
1 Darjeeling Pulbazar 1.24 0.14 0.44 10.00 11.82 2
2 Rangli Rangliot 1.18 0.13 0.43 4.00 5.74 6
3 Jorebunglow Sukiapokhri 1.16 0.10 0.41 6.00 7.66 5
4 Mirik 1.11 0.15 0.48 1.00 2.74 9
5 Kurseong 1.06 0.04 0.37 4.00 5.48 7
6 Matigara 1.21 0.12 0.42 11.00 12.75 1
7 Naxalbari 1.14 0.09 0.40 7.00 8.63 4
8 Phansidewa 1.00 0.02 0.35 4.00 5.37 8
9 Kharibari 1.21 0.12 0.42 8.00 9.75 3
Source: Computed by the authors

NO. 1 INTERACTION BETWEEN ROAD NETWORK CONNECTIVITY PATTERN 51
Figu
re 2
Figu
re 3

52 INDIAN JOURNAL OF LANDSCAPE SYSTEMS AND ECOLOGICAL STUDIES VOL. 43
Matigara block as a result of which they had built roadways connecting the plains to the hills tocarry them and their goods to the hills.
Medium Connectivity Zone: In the blocks of Jorebunglow Sukiapokhri (7.66), Naxalbari (8.63),and Kharibari (9.75) moderate connectivity scores are observed.
Low Connectivity Zone: The lowest road connectivity is observed in Mirik block (2.74), andthe other three blocks of this low connectivity zone include Rangli Rangliot (5.74), Kurseong (5.48),and Phansidewa block (5.37).
Levels of DevelopmentDevelopment is a process of growth, expansion, or realization of potential, bringing regional
resources to full productive use. It is a kind of positive change in the economy, infrastructure andsociety. To determine the level of development in the blocks of Darjeeling district ten parameters areselected including socio-demographic and infrastructural aspects because the development is amultidimensional approach. The selected indicators include:
a) X1= Household density / sq. Km.
b) X2= Population density / sq. km.
c) X3= Effective literacy rate (%)
d) X4= Total work participation rate (%)
e) X5= Rate of urbanization (%)
f) X6=Electrified villages (%)
g) X7= Road density / sq. km.
h) X8= Health facility / 1000 population
i) X9= Number of educational institutes / 1000 population
j) X10= Net sown area (%)
The levels of development in each block are calculated using a Composite Development Scoreobtained through the z-score method and ranked into order to perform Spearman’s Rank Correlation.Considerable disparities are found in the levels of development across the blocks of the Darjeelingdistrict. The extent of disparities is portrayed by three distinct categories of the high, medium andlow and the categorization (Figure 4) is carried out by following Natural Break (Jenks) Method in aGIS platform.
Highly Developed Zone:Based on the composite development score only the Matigara block(10.52) is recorded a high level of development and the reason include positive performance inHousehold and Population Density, Literacy Rate, Total Work Participation Rate, Rate of Urbanization,Village Electrification, Road Density, and concentration of Healthcare facilities. The block comes

NO. 1 INTERACTION BETWEEN ROAD NETWORK CONNECTIVITY PATTERN 53
under the proximity zone of Siliguri city resulting high rate of urbanization and the block is alsoconnected by several important roads.
Moderately Developed Zone:In the moderate zone, there are three blocks from the plain i.e.Kharibari (-0.16), Naxalbari (1.91),Phansidewa (-0.79) and one block from the hill i.e. DarjeelingPulbazar (1.60).
Least Developed Zone: Except Darjeeling Pulbazar block, all the other four blocks in thenorthern hilly part of the district namely Rangli Rangliot (-3.79), JorebunglowSukiapokhri (-3.09),Mirik (-2.45), and Kurseong (-3.75) which recorded the lowest performance in almost all the indicatorsbecause of the natural constraints. The blocks are mostly backward as far as transportation, healthfacilities, work participation rate, and electrification is concerned.
Table 4: Block-wise normalized measurements of selected parameters (Z-Score)
Sl. Blocks X1 X2 X3 X4 X5 X6 X7 X8 X9 X10 Com- RanksNo. posite (r2)
Z-score
1 DarjeelingPulbazar -0.81 -0.81 0.70 1.37 -0.04 -0.58 1.09 0.19 0.88 -0.40 1.60 3
2 Rangli Rangliot -0.93 -0.94 0.66 -0.40 -0.94 -1.12 -0.67 -0.15 1.18 -0.48 -3.79 9
3 JorebunglowSukiapokhri -0.21 -0.26 0.99 -1.77 0.17 -0.31 -0.46 -0.58 0.03 -0.70 -3.09 7
4 Mirik -0.59 -0.59 0.71 -0.52 -0.94 -1.58 -0.20 0.42 1.69 -0.85 -2.45 6
5 Kurseong -0.95 -0.96 0.76 -0.98 -0.34 -0.15 -0.83 0.18 0.13 -0.61 -3.75 8
6 Matigara 2.35 2.33 -0.27 0.65 1.61 0.31 2.39 2.49 -0.66 -0.68 10.52 1
7 Naxalbari 0.72 0.72 -0.16 -0.25 1.86 0.96 -0.23 -0.80 -1.09 0.18 1.91 2
8 Phansidewa 0.04 0.12 -1.94 0.55 -0.94 1.85 -0.76 -0.93 -0.95 2.15 -0.79 5
9 Kharibari 0.37 0.38 -1.47 1.36 -0.45 0.62 -0.33 -0.82 -1.20 1.38 -0.16 4
Source: Computed by authors based on District Census Handbook (2011), DISE and AISHE report(Darjeeling and Siliguri, 2011) and District Statistical Handbook (Department of Planning and Statistics(2010-11).
Correlation analysis: The correlation coefficient of Spearman’s rho between the levels ofroad connectivity and the levels of development of Darjeeling district is 0.683 indicating a moderatelypositive correlation. Hence the result exhibit that the level of development in the study area isclosely associated with the degree of road connectivity and the correlation is statisticallysignificant.

54 INDIAN JOURNAL OF LANDSCAPE SYSTEMS AND ECOLOGICAL STUDIES VOL. 43
Figure 4

NO. 1 INTERACTION BETWEEN ROAD NETWORK CONNECTIVITY PATTERN 55
Table 5: Spearman’s rank correlation
Correlationsa
Road RegionalConnectivity Development
Spearman’s rho Road Connectivity Correlation Coefficient 1.000 .683*
Sig. (2-tailed) . .042
Regional Development Correlation Coefficient .683* 1.000
Sig. (2-tailed) .042 .
*. Correlation is significant at the 0.05 level (2-tailed).a. List wise N = 9
Source: Computed by authors
ConclusionThe analysis reveals that the levels of development in Darjeeling district are directly varying
with respect to the road network connectivity in the majority of the blocks. From the comparativeobservation of Figure 2, Figure 3 and Figure 4, it is found that only the Matigara block accountedfor high performance in road connectivity as well as in the development score. Similarly, RangliRangliot, Kurseong and Mirik block is recorded a low level of development as well as low connectivityscore and for the medium category of road connectivity, Naxalbari and Kharibari block recordmoderate level of development. But in the blocks of Darjeeling Pulbazar, Jorebunglow Sukiapokhri,and Phansidewa block there is no such one to one relationship between connectivity anddevelopment. The study also reveals thatmost of the hilly blocks comeunder the low category ofdevelopment as well as the lower category of road connectivity because of the natural limitations.Within the blocks of the plain region also the inequalities are considerable. Naxalbari, KharibariPhansidewa blocks come under the medium category of development due to poor rural transportation,low literacy rate, the inadequacy of Health and educational infrastructural facilities. Although thesethree blocks are in the first row in terms of Agricultural production and net sown area but otherinfrastructural and socio-economic facilities are lacking. Thus, the improvement in other socio-economic, and infrastructural facilities are expected to ensure balanced development.
ReferencesDorosh, P., Wang, H. G., You, L., & Schmidt, E. (2010). Crop production and road connectivity in Sub-
Saharan Africa: a spatial analysis. World Bank Policy Research Working Paper.Erath, A., Löchl, M., & Axhausen, K. W. (2009). Graph-theoretical analysis of the Swiss road and railway
networks over time. Networks and Spatial Economics, 9, 379–400.Garrison, W. L. (1960). Connectivity of the interstate highway system. Papers in Regional Science, 6, 121–
137.

56 INDIAN JOURNAL OF LANDSCAPE SYSTEMS AND ECOLOGICAL STUDIES VOL. 43
Haggett, P., & Chorley, R. J. (1969). Network analysis in geography (Vol. 1). Hodder Education.Hoyle, B. S. (1973). Transport and development. Springer.Hurst, M. (1974). Transportation Geography: Comments and Readings. New York: McGraw Hill.Kansky, K. J. (1963). Structure of transportation networks: relationships between network geometry and
regional characteristics.Mukerji, A. B. (1974). Road transportation network structure and levels of urbanization in Rajasthan. Nat.
Geogr. J. of India, 20.Robinson, H., & Bamford, C. G. (1978). Geography of transport. Macdonald & Evans.Rodin, V., & Rodina, E. (2000). The fractal dimension of Tokyo’s streets. Fractals, 8, 413–418.Rodrigue, J.-P. (2016). The geography of transport systems. Taylor & Francis.Sarkar, D. (2013). Structural analysis of existing road networks of Cooch Behar district, West Bengal, India:
a transport geographical appraisal. Ethiopian Journal of Environmental Studies and Management, 6,74–81.
Saxena, H. M. (1980). Road Transport Connectivity Pattern and Economic Development in Rajasthan.Geographical Revieio of India, 183–187.
Saxena, H. M. (2005). Transport geography. Rawat Publications.Sreelekha, M. G., Krishnamurthy, K., & Anjaneyulu, M. V. (2016). Interaction between road network
connectivity and spatial pattern. Procedia technology, 24, 131–139.Xie, F., & Levinson, D. (2007). Measuring the structure of road networks. Geographical analysis, 39, 336–
356.

NO. 1 AN ACCOUNT OF ECONOMIC BACKGROUND OF STREET CHILDREN ... 57
An Account of Economic Background of Street Children inSelected Wards of Kolkata, West Bengal
Gourab Bera1*, Subodh Seal2 and Sudhir Malakar3
Abstract : It is generally believed that urbanization and economic expansion are associated and they aretreated as significant features of national economic growth and progress. Though, quick urbanization alsoposes huge challenges for the social and physical environment, particularly through the extensive poverty thatresults from the rapid urbanization process. It is estimated that the total number of households in slums andpavements areas of Kolkata are living in poverty. Many of the urban poor of Kolkata live in slum and squattersettlements with congested, unhealthy shelter and a lack of basic services. The present article states theeconomic background of the families of street children in some parts of Kolkata. The work also is an effortto determine the elementary causes responsible for the growth of street children. The paper also evaluates theworking scenario and economic activities of street children in the study area.
Keywords : Urbanization, Economic expansion, Pavement areas, Slum, Working environment
IntroductionStreet children are the sufferers of economic development, poverty, disparity, and domestic
violence, physical and psychological abuse. Every street child has a reason for being on the streetsin urban areas. While some children are lured by the assurance of enthusiasm and liberty, themajority are pushed onto the street by extreme anxiety and a realization that they have nowhere elseto go. In many countries, street children are considered after their main survival activities. Forexample, vendors, street gangs, juvenile prostitutes.Street Children is a widely used term in theEnglish language and has other names in other countries such as in Kenya they are known as‘Parking Boys,’ the Philippines as ‘Pogey Boys,’ Brazil as ‘Pivets’ and India as ‘Ragpickers’(UNICEF,2005). What is noticeable is that street children are deprived and their requirements and problemsareoutcomes of inadequate basic needs for survival. Street children go through the struggle ofproviding themselves with basic things such as food, clothing, and shelter.The requirements ofstreet children need an understanding of who they are, what they want, what they do, and howthey can be recognized (Lusk, 1989). A street child may be a ‘child of the streets’ whohave no home
1, 2 Research Scholar, Department of Geography, University of Calcutta (India).3 Associate Professor (Rtd.) Department of Geography, University of Calcutta (India).* Corresponding author: [email protected]
Ind. J. of Landscape Systems and Ecological Studies 43 (1) March - 2020, 57- 67 ISSN 0971-4170

58 INDIAN JOURNAL OF LANDSCAPE SYSTEMS AND ECOLOGICAL STUDIES VOL. 43
but the streets. The family may have neglected them or may have no members left alive. Such achild has to fight for survival and might move from friend to friend, or live in shelters such asabandoned buildings. A child ‘on the street’ who is visiting his or her family regularly. The childmight even return every night to sleep at home but spends most days and some nights on thestreet because of poverty, overcrowding, and physicalmistreatment at home. A part of a streetfamily who lives on the sidewalks or city squares with the rest of their families. Families displacedbecause of poverty, natural disasters, poor economic conditions of the nation and large family sizemay be forced to live on the streets. They move their goodsand poor wealth from one place toanother place when necessary.Thechildren in thiscategory work on the streets with other membersof their families (Shroff, 1987).
ObjectivesThe main objectives of the present work are:
1. To find out the economic causes or factors responsible for the growth of street children inthe study area.
2. To assess the economic conditions as well as the background of the families of streetchildren
3. To determine the economic livelihood pattern of street children in selected wards of KolkataMetropolitan Areas.
MethodologyThe study targeted street children in Kolkata covering 24 Wards as divided into five parts
such as North Kolkata (Ward No. 1 to 6), East Kolkata (Ward No. 57 & 58), Central Kolkata (WardNo. 69 to72); Westernpart of Kolkata (Ward No. 133 to 139) and South Kolkata(Ward No. 97 to 101)involved interviewing a total sample of 604 street children (n) in the urban areas. 144 street childrenhave interviewed in North, 155 respondents in Eastern Kolkata, 109 samples in Central, 82 childrenin West and 114 samples in South respectively. Their ages ranged from less than 6 to 16 years andaveraged 12 years. There are 353 numbers of street children who are males and 251 are females and345 street children are engaged in work and 259 are unemployed. The major techniques used in thestudy are interview schedules designed to investigate the situation of street children in differentparts of Kolkata.
Street Children in KolkataThe urban life of Kolkata has been attracted by the poor rural families, but they discover
themselves dissatisfied because the city of Kolkata has failed to fulfill their aspirations. There is noway for these depressed and poor people to return. All these have been adding to the populationof the pavements and slums. Many of them are eventually forced to look for shelter on the streets,

NO. 1 AN ACCOUNT OF ECONOMIC BACKGROUND OF STREET CHILDREN ... 59
under the over bridge of Kolkata with their families. They cannot exist together, the children, whoare half-fed and half-naked, must essentially wander about anywhere. These boys and girls whosurvive and work on the street are vulnerable to broad and tremendous violations of their rights. Inthe city of Kolkata, the gigantic numbers of children from these families, who have lost theirchildhood and are forced to exist in the world of offense, sadness, mistreatment and abuse. Theyhave difficulties in accessing basic services and are physically and mentally abused. Rapidurbanization, high unemployment and poverty resulted in the increase of
the number of children on the street. Although, these children have a variety of skills relatedto survival and casual income generation. Their workforce remains unspoken and unrecognized bymainstream society. Due to difficulty in producing money legally, they are forced into the world ofcrime and conflict with local people several times. They are trapped in a cycle of poverty-violence-abuse.
Economic Factors behind the Origin of Street ChildrenChildren may be forced to the streets due to several controlling factors, some of which are
discussed below-
Poverty: Poor economic conditions are the prime factor contributing to the difficulty of streetchildren. Poverty, job loss, high prices, declining national income, poor allocation of wealth withinsociety and the increasing difference between the rich and the poor are all factors with a straightimpact on the increase of the phenomenon of street children.
Family Crisis: Poverty and other connected life events may result in dysfunctional parentingstyles.These weaken family bonds and result in an environment where parents become physicallyandsensitivelyrude to their children or towards each other.
Overcrowding: Lack of living space, poor house ventilation and unplanned population growth,etc. under which children areforced to live in slum areas without food, and other basic amenitieshas forced numerous childrento the streets of cities (WHO, 2000).
Work Load: Abusive work in homes where domestic workers are enforced to run away as aresult of beingoverworkedpoorly paid or even subjected to other forms of mistreatment. They endup on the streetstrying to earn a living.
Rural to Urban Migration: Population migrates from the rural areas in large numbers andsettles down in slums, shantytowns, squatter, or wherever there is vacant land available. Some ofthem live their life on city streets, religious centers, pavements, public places, below footbridges,parks, etc at night. The consequences of migration to the cities create a population boom in theurban area (UMP, 2000).

60 INDIAN JOURNAL OF LANDSCAPE SYSTEMS AND ECOLOGICAL STUDIES VOL. 43
Economic Background of the Family of Street Children in KolkataThe data collected about the employment status of the parents of the street children, as given
in (Table 1) shows that the percentage of the parents employed is more than that of unemployedparents, that is about 66.1 percent of children’s parents are employed whereas 33.9 parents are
Table 1: Parents’ Employment Status
Parents Employment Number of Children Percentage
EmployedUnemployed 399205 66.133.9
Total 604 100
Source: Prepared from Primary Survey (August, 2019)
unemployed. Regarding earning members in the family, (Table 2) shows that about 25.7 percent ofthe families have one earning members in their families, 8.6 percent have three earning members, 6.3percent of the families have four earning members, 1.7 percent have five earning members, 0.5percent have more than five earning members in their families. 17.2 percent of the families have onlytwo earning members in their families, and regarding the rest, 6.1 percent of the family’s informationwas not available. (Table 3) analyze the monthly household income of street children. It shows thatthe majority, i.e. 34.6 percent of the families’ monthly household income is above Rs. 1,000. Thesecond largest group, i.e. 21.3 percent has a monthly household income between Rs. 751 to Rs.1,000. 13.7 percent hasa monthly household income of Rs. 501 to Rs. 750. 13.2 percent of thefamilies are earning between Rs. 251 to Rs. 500 per month and the rest 9.3 percent monthly householdincome is only below Rs. 251 only.
Table 2: Earning Members of the Family
Number of Earner Number of Children Percentage
One 155 25.7
Two 104 17.2
Three 52 8.6
Four 38 6.3
Five 10 1.7
Six 3 0.5
Indifferent 37 6.1
Total 399 66.1
Source: Prepared from Primary Survey (August, 2019)

NO. 1 AN ACCOUNT OF ECONOMIC BACKGROUND OF STREET CHILDREN ... 61
Table 3: Monthly Household Income
Income group(in Rs) Number of Children Percentage
<251 56 9.3
251-500 80 13.2
501-750 83 13.7
751-1000 128 21.3
>1000 209 34.6
Indifferent 48 7.9
Total 604 100
Source: Prepared from Primary Survey (August, 2019)
Economic Conditionsof Street ChildrenThe street children are mostly engaged in the informal sector in the city regions of India. They
are engaged in a variety of works, like working at tea stalls, hotels, garages, domestic services, etc.Besides, a number of them are self-employed like in boot polishing, street vendors, hawkers, etc. Afew of them work as laborers. Begging and rag-picking is another type of activity thatmost of themlive on. The study (Table 4) shows the involvement in the work situations of street children in thestudy area. Among the surveyed children 57.2 percent engaged in work whereas 42.8 percent ofstreet children are not involved in any kind of work situation.
Table 4: Work Involvement of Street Children
Engaged in Work Number of Children Percentage
YesNo 345259 57.142.9
Total 604 100
Source: Prepared from Primary Survey (August, 2019)
Work Situations(Table 5) gives the idea of the distribution of 345 respondents engaged in different types of
work category. Tea stall, garages, and hotels account for 9.6, 1.2, 6.5 percent respectively, and rag-picking and begging are undertaken by 4.2, 11.7 percent respectively and then nearly 1.5 percentare engaged in other types of works which they keep on changing, depending upon the availability.The above analysis represents that tea stall child workers have the maximum daily income of Rs.37.9 and boot polish child workers havea minimum income of Rs. 19.3 per day.A Lorenz Curveinterpreting the inequality in the distribution of income with a Gini Coefficient value of only 0.11indicating the low degree of disparity in the income group.Although a large number of street

62 INDIAN JOURNAL OF LANDSCAPE SYSTEMS AND ECOLOGICAL STUDIES VOL. 43
children are illiterate, that is 24 percent. The number of those who have passed the secondary levelis 3.1 percent, and 24.3 percent of street children have passed their primary level (Table 6).
Table 6: Linkage between Levels of Education and Daily Income
Income(in Rs)Levels ofEducation 1-10 11-20 21-30 31-40 40-50 Total Indifferent Total
Illiterate 9 13 57 31 35 145 104 249(1.5) (2.2) (9.4) (5.1) (5.8) (24.0) (17.2) (41.2)
Primary 16 14 43 45 29 147 136 283(2.6) (2.3) (7.1) (7.5) (4.8) (24.3) (22.5) (46.9)
Secondary 6 13 15 7 12 53 19 72(1.0) (2.2) (2.5) (1.2) (2.0) (8.8) (3.1) (11.9)
Total 31 40 115 83 76 345 259 604(5.1) (6.6) (19.0) (13.8) (12.6) (57.1) (42.9) (100)
Source: Prepared from Primary Survey (August 2019)
Table 5: Daily Wages of the Street Children
Work Category Number of Children Percentage Mean Daily Income(in Rs)
Organized Sector 2 0.3 35.5
Boot Polish 17 2.8 19.3
Hawker 25 4.1 25.3
Street Vendor 23 3.8 25.4
Rag Picking 25 4.2 25.1
Begging 71 11.7 25.6
Coolie 3 0.5 23.8
Labourer 36 6.0 36.9
Tea Stall 58 9.6 37.9
Garage 7 1.2 27.5
Hotel 39 6.5 30.9
Domestic Sources 30 4.9 23.0
Others 9 1.5 38.3
Total 345 57.1 -
Source: Prepared from Primary Survey (August, 2019)

NO. 1 AN ACCOUNT OF ECONOMIC BACKGROUND OF STREET CHILDREN ... 63
Distribution of IncomeAnother useful analysis was thought to be the amount spent by the street children on
themselves. Most of the children, who are in the category of the children on the street, may supporttheir respective families. Nearly, 34.9 percent have said that they give their earnings to their parent(Table 7), 0.5 percent of street children earned money for friends, 6.8 percent earned for relativesand 3.0 percent for brothers or sisters. Only 11.9 percent have said that they earned the amount onthemselves. (Table 8) representshow street children spend their income. In this figure, the maximumnumber of street children spends the amount of less than 20 percent. Again a minimum number of
Table 7: Sharing of Income
Distribution Number of children Percentage
For Self 72 11.9
For Friend 3 0.5
For Parent 211 34.9
For Relatives 41 6.8
For Brother or Sister 18 3.0
Total 345 57.1
Source: Prepared from Primary Survey (August, 2019)
Table 8: Amount Spent by Street Children
Amount (in Percent) Number of Children Percentage
<20 89 14.7
20-30 66 10.9
30-40 52 8.6
40-50 37 6.1
50-60 31 5.1
60-70 19 3.2
70-80 16 2.7
>80 18 3.0
Indifferent 17 2.8
Total 345 57.1
Source: Prepared from Primary Survey (August, 2019)

64 INDIAN JOURNAL OF LANDSCAPE SYSTEMS AND ECOLOGICAL STUDIES VOL. 43
children who spend on themselves are greater than 80 percent. There is inverse relationship betweenamounts spends on oneself and the number of street children.In 2012,the poverty line wasdeterminedbased onthe minimum daily income of Rs. 32 in rural and Rs. 47 in urban areas. Since thepoverty line is low, the persons below it are living in an extreme substandard of life. These poorparents are forced to send their children to beg or work on the streets to enhance or support theirfamily.(Table 9) explains the dependence of family on street children, the value indicates that 63.6percent of families are not dependent and 36.4 percent of families are dependent and they areearning to support them.(Table 10) interprets with satisfaction with income. 23.5 percent of thesamples are satisfied with their income and 33.6 percent are not satisfied with their income. In thepaid works working conditions are deplorable. Many children have to work for low or no wages andprolonged hours of work which extends sometimes even till late at night. They do not get anyweekly rest or annual holiday with pay.
Table 10: Satisfaction with Income
Level Number of Children Percentage
Satisfied 142 23.5
Dissatisfied 203 33.6
Total 345 57.1
Source: Prepared from Primary Survey (August, 2019)
Work AmbitionsThe economic independence at an early age changes the entire lifestyle of the child. Self-
employed street children, as those who are working in the shop and also those who do not earnand depend on begging to know the importance of money. They are also influenced by the moviesand start looking for the day when they would also move from rags to riches. (Table 11) deals withthe self-aspiration as of the street children.
Table 9: Family Dependent on Children
Dependency Number of Children Percentage
Yes 220 36.4
No 384 63.6
Total 604 100
Source: Prepared from Primary Survey (August, 2019)

NO. 1 AN ACCOUNT OF ECONOMIC BACKGROUND OF STREET CHILDREN ... 65
Table 11: Self Aspirations
Aspiration Number of Children Percentage
Business 255 42.2
Education 45 7.5
Film Star 7 1.2
Service 55 9.1
Any Other 170 28.1
Indifferent 72 11.9
Total 604 100
Source: Prepared from Primary Survey (August, 2019)
42.2 percent of the street children want to have their own business, 9.1 percent want to work,7.5 percent want to have a good education, 1.2 percent of the surveyed street children want tobecome a film star, 28.1 percent belong to the category of other types of aspiration and 11.9 percentdid not give any response. (Table 12) is a cross table between levels of education and workaspiration. Regarding levels of education, there are three categories, which are illiterate, primary andsecondary. 41.2 percent belong to the first category of illiterates, out of 41.2 percent, 18.7 percentwant to have their own business, 5.1 percent want to have education, 0.5 percent want to becomefilm stars, 6.0 percent want to have work, 7.0 percent aspire for one or other type and 3.9 percentbelong to the category who gave no responses. Nearly, 46.9 percent of children belong to thecategory of Primary level education. Out of the 46.9 percent, 17.7 percent want to have their ownshops and business, 1.3 percent wants to continue education, 0.2 percent want to become film
Table 12: Relation between Levels of Education and Work Ambition
No. of Children
Education Business Education Film Star Service Any Other Indifferent Total
Illiterate 113 31 3 36 42 24 249(18.7) (5.1) (0.5) (6.0) (7.0) (3.9) (41.2)
Primary 107 8 1 14 122 31 283(17.7) (1.3) (0.2) (2.3) (20.2) (5.1) (46.9)
Secondary 35 6 3 5 6 17 72(5.8) (1.0) (0.5) (0.8) (1.0) (2.8) (11.9)
Total 255 45 7 55 170 72 604(42.2) (7.5) (1.2) (9.1) (28.1) (11.9) (100)
Source: Prepared from Primary Survey (August, 2019)

66 INDIAN JOURNAL OF LANDSCAPE SYSTEMS AND ECOLOGICAL STUDIES VOL. 43
stars, 2.3 percent want to do service, 20.2 percent belong to the other category and 5.1 percentbelong to the category of indifferent.Out of 11.9 percent who had education up to secondary level,5.8 percent want to have business and shop, 1.0 percent intend to get educated, 0.8 percent wantservices, 1.0 percent belong to the other category.
Major Findings The occurrence of street children is a common economic problem in the urban region. In
Indian metropolitan cities, the fact shows an increasing tendency and the situation isalikein the case of Kolkata.
The problems of street children areresponsible for several human depriving factors such aslow per capita income, illiteracy, joblessness, etc.
The reasons for being street children are poverty, family crisis, congestion, etc. but earningincome for a family is the only notable reason that dealing the highest number of streetchildren in Kolkata.
There are different types of economic activities experienced by the working street childrenin the city of Kolkata.
Street children in Kolkata metropolitan region characterized by backward families and theyhave a very low standard of living.
The majority of the families of street children is economically segregated and continuethemselves in the crowded slum areas and footpaths.
The daily wages of street children do not have uniformity with thevalue of work. It isevaluated that the majority of the children are not satisfied with the earnings they gain fortheir work.
The maximum number of street children isconnected to different work situations. As aresult economic activity areas differing from one place to another place in the city ofKolkata.
ConclusionStreet children and the associated groupact together with various categories ofthe public in
their daily lives. On the streets, they come together with pedestrians, hawkers, citypolice, shopowners, tourists, school children, etc. To the local people,these children have been treated as anuisance. Therefore, they are associated with criminal activities such as pick-pocketing, car thefts,and various anti-social works. Whilethis happens in some areas with little time, it is wrong to guessthat all street children are involved in suchcriminal activities all the time. Extremescarcity and economicexclusion create compelled themfor criminal activities. Though, little proof exists to advise thatstreet children intentionally plan anti-social activities (Schurink and Tiba, 1993).Our attitudes towardsstreet children explain the way we interact with them. Somepeople panic and avoid street children

NO. 1 AN ACCOUNT OF ECONOMIC BACKGROUND OF STREET CHILDREN ... 67
because of their unclean looks and think them, probabletroublemaker. When they come into get intouch with them, they desire to give them a fewcoins to get free of them, although others may givemoney or help on humanitarian grounds. Existing on the street is a difficulty as well as a chance forsurvival. It is important to describe the life on the street is considered as dangerous or threateningfor a child’s welfare. The Government, as well as Non-Governmental Organizations, are working andpreparing efforts along with possible plans and prospects for the welfare of (Below Poverty Line)street children. After everything else, consciousness should be made among the general public incontemporary society.
ReferencesLusk, W. (1989). Street Children Programmes in Latin America, Journal of Sociology and Social Welfare. 16,
pp 55- 77.Schurink, E. and Tiba, M. (1993). Street Children as a world phenomenon. Pretoria, Human Sciences Research
Council.Shroff, N. (1987). They are our children too, Perspectives in Social Work III, No. 1 and 2; July-Dec.UMP (2000). Street children and Gangs in African Cities, UMP Working Paper Series 18, May, pp 3-7.UNICEF (2005). Regional Assessment on Violence against children in East and the Pacific Region, p 40.WHO (2000). Working With Street Children- World Health Organization-Mental Health Determinants &
Populations, Department of Mental Health & Substance Dependence-Geneva. Switzerland. pp 3-5.

68 INDIAN JOURNAL OF LANDSCAPE SYSTEMS AND ECOLOGICAL STUDIES VOL. 43
Urbanisation and Spatial Organisation of Urban Centres ofNadia District With Reference to Census Towns
(1961-2011)Pijus Kanti Ghosh1* and Sahina Khatun2
Abstract : The paper has intended to analyse the urbanisation from demographic perspective i.e. the growthand spatial organization of non-municipal urban especially Census Towns (CTs) using census data. Thespatial organization of CTs is assessed by nearest neighbour analysis and inter-block urbanisation is measuredby index of urbanisation using seven indicators i.e. a growth rate of the urban population, literacy rate, levelof urbanisation, urban area, household density, urban-rural population ratio and urban density. From theanalysis, it is found that most of the CTs are located in Nabadwip, Santipur, Chakdah, Ranaghat-I andRanaghat-II C.D.block. Among all size class CTs, class-III (population size-20,000-49,999) and class-IV(10,000-19,999) share maximum urban population and in term of closeness, average spacing of all size classtowns has been reduced during 1991-2011 which indicates an increase of urban centres and emergence ofthese urban centres has mainly been accentuated by nearness of municipal towns, development of transportnetwork and long history of traditional non-agricultural economy which resultant into disparity in growth ofCTs between northern and southern blocks of the district.
Keywords : Census towns, Index of urbanisation, Nearest neighbour analysis, Nadia district
IntroductionUrbanisation is a process by which society changed from traditional rural society to a modern
and prosperous society (Kumar and Rai, 2014). “Urbanisation refers to the process of concentrationof people in densely populated settlements where a majority of the people derive their livelihoodfrom non-primary occupation” (RaiChaudhuri, 2001). The urbanisation is interlinked with the degreeof industrialization, commercialization, job opportunities, a better quality of life, economic developmentand thereby, the urban centre and urban population distribution is not even (Anisujjaman, 2015). In1961, the Census of India first time adopted two-fold criteria for classifying the urban centers ofIndia i.e. statutory town (ST) which is based on administrative criteria and census town (CT) whichis defined by demographic criteria. According to 2011 census, CTs are identified based on a minimum
1 Research Scholar,2 Assistant Professor, Department of Geography, University of Kalyani, 741235, West Bengal, India.* Corresponding author: [email protected]
Ind. J. of Landscape Systems and Ecological Studies 43 (1) March - 2020, 68- 81 ISSN 0971-4170

NO. 1 URBANISATION AND SPATIAL ORGANISATION OF URBAN CENTRES 69
5000 population, 400 persons per square kilometre minimum population density and 75 per cent orabove male non-agricultural workers.
In West Bengal, according to the 2011 census, Nadia district along with some other northerndistricts (Maldah, Murshidabad, Jalpaiguri and Birbhum etc.) have experienced a growing trend ofurbanization (Chakraborty et al. 2015). In 2011, Nadia district has recorded 1438873 urban populations(27.84 per cent to total population). Out of the urban population, 40.75 per cent is recorded in non-municipal towns i.e. Census Towns (CTs). The district has registered rapid growth of census townsduring 2001-2011 census period i.e. from 15 in 2001 to 55 in 2011.Rapid emergence of CTs is changingthe characteristics of urbanisation pattern in Nadia district as well as the state (Chakraborty et al.2015). It is fact that according to the 2011 census, about half of the CT population of the districtreside in Ranaghat-I, Chakdah, Santipur and Ranaghat-II blocks which reveals the uneven growthof urbanisation throughout the district. Most of the CTs of the district are concentrated in southernpart and dispersed in northern part of the district. Such type of unbalanced urban growth amongthe blocks may create regional disparity which is common in India.
The Study areaThe study area, Nadia district lies between 22º53' 00"to 24º11' 00" north latitude and
88º9' 00"to 88º48' 00" east longitude. The district is situated in the eastern part of the state andsurrounded by Bangladesh in the east, Burdawn and Hooghly district in the west, North -24 Parganasin the south -eastern part and Murshidabad in the northern part of the district. Ganga River flowsalong the western part of the district boundary and the Tropic of Cancer divide the district into twoparts. The district is well connected by rail and roads with the surrounding district and as wellstate. According to the 2011 census, the district has 5167600 number of population of which 72.16per cent of people live in rural areas and 27.84 per cent of people live in urban areas.The averageliteracy rate is 74.97 per cent where the rural literacy rate is 70.84 per cent and the urban literacy rateis 85.35per cent. According to the 2011 census, the district has 55 census towns and ten statutorytowns and two notified areas (Figure 1).
Material and MethodsThe data are collected from the District Census Handbook of the Nadia district. The block-
wise urbanisation of the district is assessed by the level of urbanization, urban density, growth rate,the ratio of urban-rural population, changing urban area and household density. The index ofurbanisation is computed by standardised mean composite score (Chakraborty, 2016; Ghosh andKhatun, 2019) for assessing the block-wise urbanisation status.The spatial distribution of urbancentres is analysed using the nearest neighbour index (Clark and Evans, 1954).
The nearest neighbour index (NNI) was calculated by using this formula- 0
e
DR
D ( Equation
no-1)where R is the randomness index, 0D is the mean observed distance between nearest neighbour,,

70 INDIAN JOURNAL OF LANDSCAPE SYSTEMS AND ECOLOGICAL STUDIES VOL. 43
Fig.
1: T
he S
tudy
are
a

NO. 1 URBANISATION AND SPATIAL ORGANISATION OF URBAN CENTRES 71
eD is the mean expected distance between nearest neighbour and it is calculated by e NA
1D
(Equation no-2 ) where N is the number of urban centres and A is the area of the region. The valueof R ranges from 0 to 2.15, where ‘0’ denotes cluster distribution, 1 denotes random and 2.15 signifyuniform distribution. If the value of R falls between 0 and 1, the distribution pattern of the settlementsmay be explained as approaching cluster, while if the value falls between 1 and 2.15, it means theurban centres are approaching a uniform distribution pattern.
Level of urbanisation (LU): means proportion of urban population to total population (Verma,2006) and higher the value higher the degree of urbanization.
Level of urbanisation = Urban population 100Total population
Growth rate (GR): Growth rate has been measured to assess the decadal change of absoluteurban population.
Growth rate = (Pr esent year urban population – Past year urban population) 100Past year urban population
Urban Density (UD): Urban density is used to measure the concentration of urban area instudy units
Urban density = (Urban area of the study unit) / (Total area of the study unit)
Urban Rural Ratio (URR): Urban rural ratio is used to assess the increase of urban populationin compare to rural population of an area
Urban Rural Ratio = (Urban Population) / (Rural Population)
In order to assess the index of urbanisation, z- score method has been applied. At first z- scorevalue has been calculated based on individual variables (level of urbanisation, urban density etc.)thereafter to get a summed up mean value mean composite z-score has been calculated. The formulais:
Xi XZi
i(SD)
Where Zi- Z-Score (Standard score of the ith variables)
Xi -Value of the ith variable
X – Mean of the ith variable

72 INDIAN JOURNAL OF LANDSCAPE SYSTEMS AND ECOLOGICAL STUDIES VOL. 43
i -Standard deviation of the ith variable.
ZijCSN
Where, CS- Mean composite z-score
zij-Standard score of ith variable at jth unit of study
N-Number of variables.
Results and DiscussionDevelopment of CTs in Nadia District: Table 1 shows the temporal change of number of CTs
and their populations. In the census year 1961, the district had only five CTs and accounts only12.13 per cent urban population of the district and thereafter, share of CT population to total urbanpopulation continuously has increased. After 1981, the number of CTs has increases at a very rapidrate which led to an increase in the urban population of the district as well as the state.
Table 1: Temporal distribution of CTs (Number and population)
Year CTs Population Total Urban Share of CTs population topopulation total urban population*
2011 55 586393 1438873 40.75
2001 15 187947 979519 19.19
1991 19 237035 871818 27.19
1981 8 113976 639869 17.81
1971 6 53736 418059 12.85
1961 5 38263 315348 12.13
Source: Census of India, *Computed by author
Spatial distribution of CTs: Spatial distribution of urban centres (CTs) of Nadia district ishighly unequal and a wide variation has found in their spacing which is reflected in the nearestneighbour analysis. If the district is divided into a northern and southern part, it is seen that 85 percent CTs are located in the southern part which creates regionally imbalance growth. From therandom index (Rn) it is found that the distribution of the urban centre of the district is said to bemore random than dispersed up to 1981 and thereafter, mean observed distance (D0) of the urbancenters of the district gradually reduced. In 2011, the range of spacing of urban centres varies from18 kilometres between Mira and Matiari (northern part of the district) to only 1 kilometre betweenHijuli and Halalpur in southern part of the district. According to 2011 census, the distribution

NO. 1 URBANISATION AND SPATIAL ORGANISATION OF URBAN CENTRES 73
pattern of CTs is said to be more random than cluster. On the other hand, most of the CTs emergearound the eight-kilometre buffer region of statutory towns (Figure 2) and four-kilometre bufferregion of road transport (Figure 3).
Average spacing by size class of CTs: Table 3 seeks to analyse the relationship between sizesof urban centers (CTs) and the spacing among them. The distribution pattern of the CTs is assessedwith respect to nearest statutory towns (STs) and they are spotted within eight-kilometre bufferzone from the centre of the STs.
Table 2: Nature of spatial distributions of CTs
Year CTs D0* De* Rn*
2011 55 2.76 4.22 0.65
2001 15 6.40 8.09 0.79
1991 19 3.87 7.18 0.53
1981 8 11.38 11.07 1.02
1971 6 16.55 12.80 1.29
1961 5 6.61 14.02 0.47
Source: Census of India, *Calculated by author
The analysis has revealed that the average spacing of the urban centres of the district was3.87 kilometres in 1991 which is reduced to 2.76 kilometres in 2011 and it indicates the rapid growthof number of urban centres from 19 in 1991 to 55 in 2011. Table 3 has showed a significant relationshipbetween the size of urban centers and their spacing. In terms of population size, the larger the sizeof the towns, the higher the average spacing among them whereas the smaller the towns lower thespacing. This pattern is followed by all the size class except class-III in 1991 because one of themis transformed in statutory towns and another transformed into the class-II category. In terms ofcloseness, average spacing of all size class towns has reduced from 1991 to 2011 which indicatesthe growth of urban centers. The patterns of the urban centers of class-III and IV are generallymore random than dispersed while the distribution pattern of class-V towns is more random thancluster.
Class wise growth of CTs: Table 3 shows the class-wise distribution of CTs and share of theurban population. From the result, it is observed that Class-IV and V hold greater number ofpopulations than class-II, III and V. It is evident that out of total urban population of the district59.24 per cent live in statutory towns and 40.75 per cent people live in CTs in the 2011 census year.On the other hand, in case of total CTs population, most of the population is concentrated in class-IV (44.73 per cent) and class- V (31.34 per cent) and followed by class-III (11.44 per cent), class-II(9.49 per cent) and class-V (2.97 per cent). Locational advantage (Kolkata urban agglomeration) is

74 INDIAN JOURNAL OF LANDSCAPE SYSTEMS AND ECOLOGICAL STUDIES VOL. 43
Fig.
2:
Spat
ial
distr
ibut
ion
of C
Ts,
2011
.Fi
g. 3
: Lo
catio
n of
CTs
alo
ng r
oad
conn
ectio
n

NO. 1 URBANISATION AND SPATIAL ORGANISATION OF URBAN CENTRES 75
one of the main reasons for the extensive growth of CTs towards southern blocks of the districtas it has help to induce the transformation of the rural economy into an urban non-agriculturaleconomy.
Table 3: Average spacing by size class of CTs
1991 2011
Class No. of CT D0* De* Rn* No. of CT D0* De* Rn*
I – – – – – – – –
II – – – – 1 – – –
III 3 6.75 18.11 0.37 3 25.9 18.1 1.39
IV 4 21.14 15.74 1.34 20 8.74 7 1.24
V 11 8.45 9.45 0.89 27 4.54 6.03 0.75
VI 1 – – – 4 23 15.7 1.46
Source: Census of India, *Computed by author
Table 4: Class wise growth of CTs
Class of CTs I II III IV V VI
Percentage of CTs number – 1.81 5.45 36.36 49.09 7.27
Percentage of CTs population – 9.49 11.44 44.73 31.34 2.97
Source: Computed based on data of Census of India
Block-level assessment of CTs pattern: Based on 2011, the density of the urban population ofNadia district is (3397 person/sq.km). Highest density of urban population is recorded in Nakashipara(5330 person/sq.km) and fallowed by Hanskhali (4733 person/sq.km), Karimpur-I (4461person/sq.km),Nabadwip (4030 person/sq.km) Ranaghat-I (3885 person / sq.km), Chakdah (3670 person/sq.km) andChapra (3428 person/sq.km) which is much greater than the district average (Figure 4). Apart fromthese blocks, the density of the urban population of the remaining blocks is lower than the districtaverage. The growth rate of urban population of Nadia districts is 212 per cent. It is evident that thegrowth rate of the urban population of Ranaghat-II (372.72 per cent), Chakdah (362.13per cent) andNabadwip (250.31per cent) is greater than the district average and growth rate of the remainingblocks is lower than the district average (Figure 5). The highest growth rate is found in Ranaghat-II (372.12 per cent) block and followed by Chakdah (362.13 per cent), Nabadwip (250.31 per cent)and so on. The lowest growth rate is found in Nakashipara block (16.30 per cent). After 2001, mostof the census towns have been emerged in Santipur, Chakdah, and Ranaghat Blocks which lead tothe rapid growth rate of the urban population in these blocks.

76 INDIAN JOURNAL OF LANDSCAPE SYSTEMS AND ECOLOGICAL STUDIES VOL. 43
Fig.
4:
Urb
an p
opul
atio
n de
nsity
Fig.
5:
Gro
wth
rat
e of
Pop
ulat
ion

NO. 1 URBANISATION AND SPATIAL ORGANISATION OF URBAN CENTRES 77
The ratio of urban-rural population (Table 5) is helpful to identify the growth of urbanpopulation with respect to the rural population. From the result, it is revealed that the highesturban-rural ratio is recorded in Ranaghat-I (0.411) followed by Nabadwip (0.160), Ranaghat-II (0.102),and the lowest ratio is found in Krishnagar-I (0.035) in 2001. Over the decade (2001-2011) urban-rural ratio has been increased which signifies the increase of urban population to the ruralpopulation.In 2011 the highest ratio is found in Ranaghat-I (0.78) followed by Nabadwip (0.77),Santipur (0.56), Chakdah (0.29) and the lowest rate found in Krishnagar-II and Chapra (0.04).Thechange of the ratio of the urban-rural population from 2001 to 2011 is higher in Nabadwip (0.61) andfollowed by Ranaghat-I (0.36) and Santipur (0.26) So, the result indicates that urban population isincreasing at a higher rate in Ranaghat-I, Nabadwip, Santipur and Chakdah where as Nakashipara,Karimpur-I, Chapra, Krishnagar-II have registered very slow growth.
Table 5: Urban -Rural ratio
Name of Blocks Ratio Change
2001 2011
1. Karimpur-I 0.05 0.14 0.08
2. Karimpur-II - - -
3. Tehatta-I - - -
4. Tehatta-II - - -
5. Kaliganj - 0.09 0
6. Nakashipara 0.09 0.09 0
7. Chapra - 0.04 0.04
8. Krishnagar-II - 0.04 0.04
9. Nabadwip 0.16 0.77 0.61
10. Krishnagar-I 0.03 0.1 0.06
11. Krishnaganj - - -
12. Hanskhali - 0.19 0.19
13. Santipur 0.3 0.56 0.26
14. Ranaghat-I 0.41 0.78 0.36
15. Ranaghat-II 0.1 0.15 0.05
16. Chakdah 0.06 0.29 0.22
17. Haringhata - 0.11 0.11
Source: Computed based on data of Census of India

78 INDIAN JOURNAL OF LANDSCAPE SYSTEMS AND ECOLOGICAL STUDIES VOL. 43
Table 6 shows the block-wise changing urban area and changing household density from2001 to 2011.In 2001, the total urban area of all the blocks was 68.63 square kilometres in which thehighest percentage of the urban area is possessed by Santipur (23.51 per cent) and followed byRanaghat-I, (22.88 per cent), Ranaghat-II (18.80 per cent), Chakdah (11.44 per cent) and lowestpercentage of the urban area is recorded in Karimpur-I (2.50 per cent). In 2011, the total urban areahas been increased to 172.63 square kilometres. So it is cleared that total urban area becomesdouble (from 68.63 sq.km to 172.63 sq.km) in 2011 with compare to 2001 which signifies the emergenceof new census towns. In 2011, 104 square kilometres urban area has been increased in which 40.72square kilometres in the blocks which had no CTS and 63.28 square kilometres in blocks which haveCTS. In the case of the urban area, some blocks show positive changes and some negative changes.However, nine blocks have positive change i.e. Haringhata (8.21 per cent), Kaliganj (5.77 per cent),Hanskhali (5.76 per cent), Krishnagar-I (3.57 per cent), Chakdah (2.97 per cent), Chapra (2.38 per
Table 6: Changing urban area and household density
Name of the Blocks Area (Per cent) Change Household Density Change
2001 2011 (2001-2011) 2001 2011 (2001-2011)
1. Karimpur-I 2.5 2.94 0.44% 1326 1168 -158
2. Karimpur-II – – – – – –
3. Tehatta-I – – – – – –
4. Tehatta-II – – – – – –
5. Kaliganj – 5.77 5.77 – 676 676
6. Nakashipara 10.18 3.76 -6.42 968 1298 330
7. Chapra – 2.38 2.38 – 793 793
8. Krishnagar-II – 1.43 1.48 – 573 573
9. Nabadwip 7.68 8.48 0.80 788 1--5 217
10. Krishnagar-I 2/97 6.54 3.57 1083 598 -485
11. Krishnaganj – – – – – –
12. Hanskhali – 5.76 5.76 – 1130 1129
13. Santipur 23.51 15.97 -7.54 709 755 46
14. Ranaghat-I 22.88 14.05 -8.83 912 1123 211
15. Ranaghat-II 18.8 10.22 -8.58 563 737 174
16. Chakdah 11.44 14.41 2.97 670 880 210
17. Haringhata – 8.21 8.21 – 396 396
Source: Computed based on data of Census of India
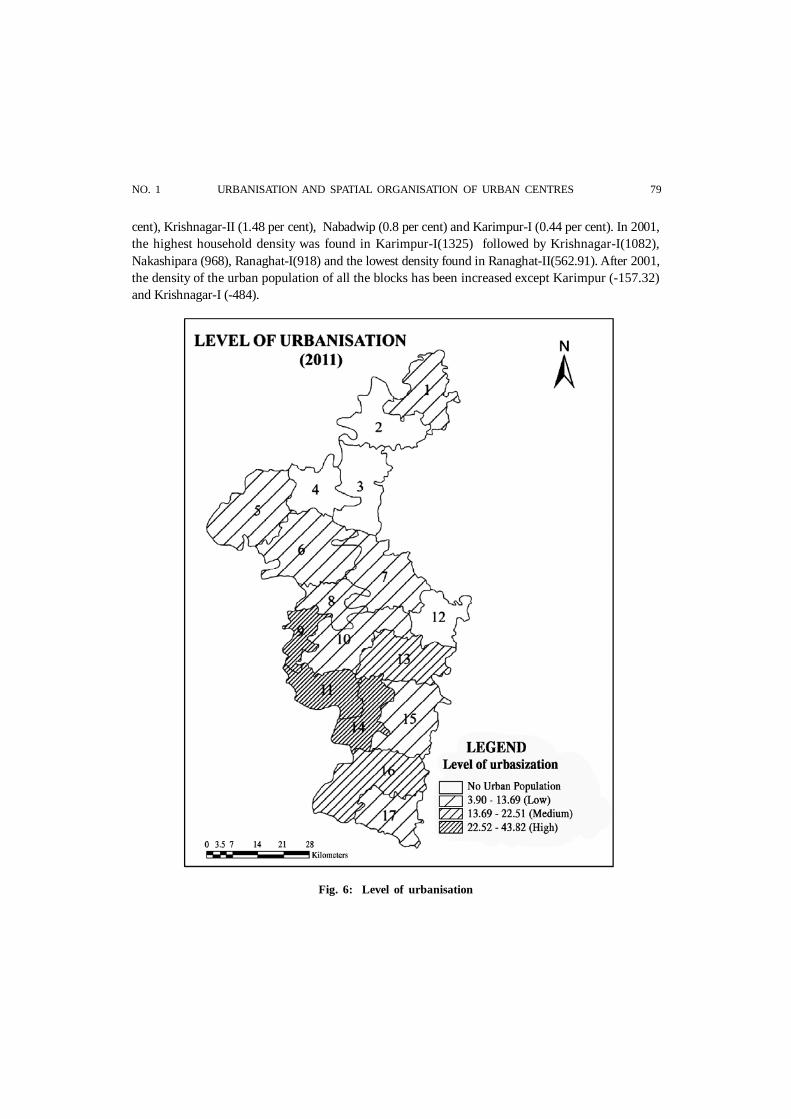
NO. 1 URBANISATION AND SPATIAL ORGANISATION OF URBAN CENTRES 79
cent), Krishnagar-II (1.48 per cent), Nabadwip (0.8 per cent) and Karimpur-I (0.44 per cent). In 2001,the highest household density was found in Karimpur-I(1325) followed by Krishnagar-I(1082),Nakashipara (968), Ranaghat-I(918) and the lowest density found in Ranaghat-II(562.91). After 2001,the density of the urban population of all the blocks has been increased except Karimpur (-157.32)and Krishnagar-I (-484).
Fig. 6: Level of urbanisation

80 INDIAN JOURNAL OF LANDSCAPE SYSTEMS AND ECOLOGICAL STUDIES VOL. 43
Level of urbanization of the district is 40.75 per cent. Only Nabadwip (43.65 per cent) andRanaghat-I (43.82 per cent) have exceeded the district average and remaining blocks have below thedistrict average. Santipur (36.01 per cent), Ranaghat-I (43.82 per cent ) and Nabadwip (43.65 percent) belongs to high density zone; Hanskhali (16.08 per cent ), Chakdah (22.51 per cent ), belongto medium density zone and Haringhata (10.21 per cent ), Krishnagar-I (9.19 per cent ), Nakashipara(8.96 per cent ), kaliganj (8.65 per cent), Chapra (4.54 per cent ), Krishnagar-II (3.90 per cent ) belongto low density zone (Figure 6).
Table 7 shows the block wise urbanisation by using composite Z- Score. Seven indicators(Growth rate, urban density, level of urbanisation, urban area, household density, ratio of urbanrural population,) have been used to find out the urbanisation. The result clearly indicates that
Table 7: Index of Urbanisation
Name of the Blocks GR LI LU UA HD URR UD Meancomposite
score
1. Karimpur-I 0.86 0.27 -0.09 -0.54 1.21 -0.23 -0.35 0.14
2. Karimpur-II - - - - - - - -
3. Tehatta-I - - - - - - - -
4. Tehatta-II - - - - - - - -
5. Kaliganj - -1.14 -0.35 -0.02 0.07 -0.42 -0.43 -0.28
6. Nakashipara -0.49 0.94 -0.33 -0.4 1.53 -0.42 -0.4 0.05
7. Chapra - -0.73 -0.63 -0.65 0.34 -0.61 -0.63 -0.36
8. Krishnagar-II - 0.47 -0.67 -0.83 -0.15 -0.61 -0.64 -0.3
9. Nabadwip 1.88 -1.17 2.05 0.48 0.83 2.19 1.98 1.03
10. Krishnagar-I 1.39 -1.91 -0.31 0.12 -0.1 -0.38 -0.35 -0.19
11. Krishnaganj - - - - - - - -
12. Hanskhali - 1.04 0.16 -0.02 1.12 -0.03 0.04 0.29
13. Santipur 0.07 -0.34 1.52 1.88 0.26 1.38 1.51 0.78
14. Ranaghat-I -0.09 -0.12 2.06 1.53 0.72 2.23 2.24 1.07
15. Ranaghat-II -0.03 0.62 -0.003 0.81 0.09 -0.19 0 0.16
16. Chakdah 2.34 0.81 0.6 1.59 0.54 0.34 0.63 0.86
17. Haringhata - 1.26 -0.24 0.43 -0.57 -0.34 -0.2 0.04
Source- Computed based on data of Census of India, GR-Growth rate, LI- Literacy rate, LU-Level ofUrbanisation, UA Urban area, HD- Household Density, URR- Urban rural ratio, UD- Urban density

NO. 1 URBANISATION AND SPATIAL ORGANISATION OF URBAN CENTRES 81
composite score of urbanisation is the highest in Nabadwip (1.03) followed by Ranaghat-I (1.07),Chakdah (0.6) and Santipur whereas the lowest is found in Chapra (-0.36) and then Krishnagar-II (-0.30). So, from standardize value of the variables it can be said that in demographic aspect, southernpart of the district is more urbanised than northern part of the district.
ConclusionA wide disparity is observed from the block-level spatio-temporal analysis of urbanisation of
Nadia district. Relatively higher-level urbanisation is found in Nabadwip, Ranaghat-I, Chakdah,Santipur and lower level in Cahpara, Krishnagar-II and Nakashipara. The census towns are highlyconcentrated in Ranaghat-I, Chakdah, Santipur and Nabadwip. Therefore, it is cleared that thedevelopment and growth of census towns is high in the southern blocks and low in the northernblocks of the district. So, such types of inter block disparity in urban development may also induceinter-block imbalance in development of infrastructures and quality of life which need to be addressedand given attention for further research and planning purpose.
ReferencesAnisujjaman, M. (2015).Urbanisation and Human Development: A Study of West BengalChakraborty, S, Chatterjee, S., Das, K., & Roy, U. (2015).Changing Pattern of Urbanization in West Bengal:
An Analysis of 2011 Census of India Data. Asian Journal of Research in Social Sciences andHumanities, 5(5), 169-181. 10-12.
Clark, P. J., Evans, F. C. (1954). Distance to nearest neighbour as a measure of spatial relationships inpopulations. Ecology, 1954:35; 445-52.
Ghosh, P.K., & Khatun S., (2019).Functional interdependency of city and villages: a case study on Krishnagarcity and its surroundings areas, West Bengal. Indian Journal of Regional Science, LI(2),81-90.
Government of India (2011).District census handbook, Primary Census, Abstract, Nadia, New Delhi:Government of India. Retrieved from censusindia.gov.in on 25.02.2018
Kumar. A. & Rai, A. K.(2014).Urbanization process, trend, pattern and its consequences in India, NeoGeographia, 3(4), 54-77.
Rai Chaudhuri, J., (2001). An Introduction to Development and Regional Planning with special reference toIndia. Kolkata. Orient Longman Limited.
Verma, L. M. (2006). Urban Geography. Jaipur: Rawat Publication

82 INDIAN JOURNAL OF LANDSCAPE SYSTEMS AND ECOLOGICAL STUDIES VOL. 43
Geo-Spatial Analysis of Alteration in Urban BiophysicalComposition and Its Impact on Micro-Climate of Delhi,
IndiaSandesh Yadav*
Abstract : The increased infrastructural and economic growths have raised issues of micro-climatic changesin the national capital territory of Delhi, India. In this paper, the land surface biophysical types, land surfacetemperature and vegetation indices retrieved from Landsat thematic mapper, enhanced thematic mapper andoperational land imager images of Delhi for 1990, 2000 and 2015 were analyzed. The images acquired wereclassified into appropriate land cover types using a supervised classification scheme and a change detectionanalysis was carried out on the classified images to evaluate the extent of modification of surface features. Aquantitative approach was used to explore the relationship among temperature, surface biophysical componentsand vegetation indices. Results showed that impervious surfaces (built-up) were positively correlated with highland surface temperatures. Conversely, vegetated areas and land surface temperatures have strong negativecorrelation.
Keywords : Surface biophysical components, Land surface temperature, Surface thermal response, Normalizeddifference vegetation index
IntroductionIndustrialization and urbanization have increased the anthropogenic stress on land use/land
cover to meet the demand of space for emerging settlements due to ever increasing human population.Urbanization altered the landscape, so land transformed from natural land to anthropogenic surfacesviz. commercial, industrial, transportation and residential lands. Thus, impervious surfaces cameinto scene and modification has taken place in terms of surface energy exchange and anthropogenicheat discharge. Consequently, there is an increase in land surface temperature which significantlyalters the micro-climate of any urban region. The alteration in micro-climate can be seen in terms ofurban heat island (UHI) effect, winter warming effect and heat wave intensification.
Land surface temperature is a key parameter in land surface processes and acts as an importantfunction of land use/land cover. In addition, land surface temperature plays a major role in evaporation
* Freelance Researcher, New Delhi, India, Email: [email protected]
Ind. J. of Landscape Systems and Ecological Studies 43 (1) March - 2020, 82- 98 ISSN 0971-4170

NO. 1 GEO-SPATIAL ANALYSIS OF ALTERATION IN URBAN BIOPHYSICAL COMPOSITION 83
models, climate models and radiative transfer models. The presence of healthy vegetative coverregulates the land surface temperature through cooling effect due to evapotranspiration.
Objectives of the Study To analyze the dynamics of urban biophysical composition (1990-2015) in the NCT of
Delhi.
To assess the impact of altered urban biophysical composition on the micro-climate withspecial reference to land surface temperature and normalized difference vegetation index(1990-2015) in the study area.
Database and MethodologyThe study looks at the city of Delhi, national capital of India (Figure 1) due to its high degree
of urbanization, dominant grey infrastructure and high density of population. It is located betweenthe latitude 28°24´17´ ́N and 28°53´00´ ́N and longitude 76°50´2´ ́E and 77°20´37´ ́E. It has an areaof about 1483 km2 with maximum length of 51.90 km and maximum width of 48.48 km. The studyemploys Landsat-4,5 TM for 7 November 1990; Landsat-7 ETM+ for 16 November 2000 and Landsat-8 OLI for 9 November 2015 (see Table 1). All imageries were obtained from the archives of UnitedStates Geological Survey (USGS). The Three scenes fell within the path 147 and row 40 of the WRS-2 (Worldwide Reference System) from which the data for the location under the study could beextracted. All bands 1-5 and 7 have spatial resolution of 30 m and the thermal infrared band (band6) has a spatial resolution of 60m for Landsat 7 and 120m for Landsat 5. For Landsat OLI, thermalinfrared band (10,11) has a spatial resolution of 100m.
Table- 1. Landsat meta-data for the study area
City Path/Row Satellite Platform Band Date Acquired Resolution
Spectral Thermal
Delhi 147/40 Landsat-4,5 TM 1-5 & 7 6 07/11/1990 30m/120m
Landsat-7 ETM+ 1-5 & 7, 8 6 16/11/2000 30m/60m
Landsat-8 OLI 1-9 10, 11 09/11/2015 30m/100m
Source: United States Geological Survey, 2016
Data SourcesThe satellite images of the NCT of Delhi for three different periods that is 1990, 2000, 2015
were obtained from the United States Geological Survey (USGS) and National Remote SensingCentre (NRSC), Hyderabad, India.

84 INDIAN JOURNAL OF LANDSCAPE SYSTEMS AND ECOLOGICAL STUDIES VOL. 43
Figu
re 1
. Loc
atio
n m
ap o
f th
e st
udy
area
.

NO. 1 GEO-SPATIAL ANALYSIS OF ALTERATION IN URBAN BIOPHYSICAL COMPOSITION 85
Tools of AnalysisTo calculate the ‘rate of change per year’, formula given byChebet(2013) was used:
Y XRT
Where, R = rate of change, Y = the area (km2) of the study area in the final year, X = the area(km2) of the study area in the initial year, T = the time difference in years.
A three-step process was followed to derive surface temperature from Landsat TM 7Image.
Step-1: Spectral radiance was calculated using following equation:
L = LMIN + (LMAX – LMIN) × DN / 255
Where, L = Spectral Radiance, LMIN = 1.238, LMAX = 15.600, DN = Digital Number.
Step-2: Spectral Radiance (L) to Temperature in Kelvin may be expressed as:
Where, K1 = Calibration Constant 1 (607.76), K2 = Calibration Constant 1 (1260.56), TB =Surface Temperature
Step-3: Surface temperature from Lands at 8 TIRS was derived using band 10 and 11 following the split-window method first proposed by McMillin(1975).
The algorithm is:
LST = TB10 + C1(TB10 – TB11) + C2(TB10 – TB11)2 + C0 + (C3 + C4W) (1 – ) + (C5 + C6W)
Where, LST = Land Surface Temperature, C0-C6 = Split Window Coefficient Values,TB10 = Brightness Temperature of Band 10, TB11 = Brightness Temperature of Band 10, = M band10 and 11, = Mean LSE of TIR Bands, W = Atmospheric Water Vapor Content and = Differencein LSE.
To calculate the ‘Normalized Difference Vegetation Index (NDVI)’, we will use the followingformula:
NDVI = (NIR – Red) / (NIR + Red)
Where, Red and NIR stand for the spectral reflectance measurements acquired in the Red andNear Infra-Red (NIR) regions respectively. NDVI itself thus varies between —1.0 and +1.0.

86 INDIAN JOURNAL OF LANDSCAPE SYSTEMS AND ECOLOGICAL STUDIES VOL. 43
Results and Discussions
Land use/land cover changes during the period 1990-2015Before carrying out the interpretation of maps, we need to understand the colour scheme
adopted in the maps (Figure 2) to understand the changes in land use/land cover during the period1990-2015 in the study area. As per the colour scheme, the water body and vegetation cover aredepicted by their natural colours that is blue and green respectively while built-up and cropland aredepicted by red and yellow colour respectively. The other categories viz. Fallow land and barrenland are represented by pink and magenta colour respectively.
The prevalence of red colour on the LULC map of 1990 shows the dominance of built-up withvariations in built-up density at the core and peripheral regions of the study area. At the core,northern part, north-eastern part, eastern part, south-eastern part, southern part and north-westernpart are regions of high built-up density while on the other hand; the rarefied concentration of thebuilt-up exists in the peripheral areas of the northern part, south-eastern part, south-western part,
Table- 2. Details of land use/land cover types
Land use/landcover types Description
Water body It refers to oceans, seas and lakes along with ponds, wetland and evenpuddles. In addition to this, rivers, streams, canals (water moves from oneplace to another) are also considered bodies of water. Broadly it includesriver, permanent open water, lakes, ponds, canals, permanent/seasonalwetlands, low lying areas, marshy land and swamps.
Vegetation It is an area notified for forestry boundary, predominantly with trees andother vegetation capable of producing either timber or other forest produce.Broadly it includes trees, natural vegetation, mixed forest, gardens, parksand playgrounds, grasslands, vegetated lands.
Cropland It is defined as the land primarily used for farming and production of foodcrops, commercial crops and horticulture crops. It includes the land underirrigation and rain-fed crops, which are growing under different seasons indifferent farming activities.
Fallow land Fallow is the stage of crop rotation in which the land is deliberately notused to raise a crop.It may refer to stream bed, the channel bottom of astream or river or creek, Wadi, a dry riverbed that contains water onlyduring times of heavy rain.
Riverbed Built-up It is a term used primarily in urban planning, real estate development, buildingand the construction industry. Broadly it includes residential, commercial,mixed use and industrial surface areas, asphalt road network, pavements,rocks, parking lots and other man-made structures.
Source: National Remote Sensing Agency Manual (2006), NRSA, Hyderabad, India

NO. 1 GEO-SPATIAL ANALYSIS OF ALTERATION IN URBAN BIOPHYSICAL COMPOSITION 87
Source: Landsat Imagery, 7th November 1990, 16th November 2000 and 9th November 2015.
Figure 2. Land Use and Land Cover, 1990, 2000 and 2015, NCT of Delhi, India

88 INDIAN JOURNAL OF LANDSCAPE SYSTEMS AND ECOLOGICAL STUDIES VOL. 43
western part and north-western part of the study area. The LULC category of cropland has its limitsin peripheral areas of northern part, south-western part and north-western part of the study area.The vegetation coverwas present in the core and peripheral areas of the eastern part and south-eastern part of the study area. The fallow land has been seen in the peripheral areas of the northernpart, south-western part and north-western part of the study area. The LULC map for the year 2000confirms an increase in the density of built-up both at the core and periphery of the study area.During the period 1990-2000, the built-up expansion took place in the south-eastern part, south-western part, western part and north-western part of the periphery while the built-up became denser
Figure 3. Gains and losses in land cover areas between (a) 1990-2000, (b) 2000-2015, (c) 1990-2015
(a)
(b)
(c)

NO. 1 GEO-SPATIAL ANALYSIS OF ALTERATION IN URBAN BIOPHYSICAL COMPOSITION 89
at the core of the study area. The LULC map for the year 2015 shows shrinkage in the arealexpansion of cropland, vegetation cover and fallow land due to built-up expansion. During theperiod 2000-2015, the cropland experienced a slight decrease in area in the peripheral parts of south-western part, western part and north-western part of the study area. On the other hand, the vegetationcover got reduced in the area drastically with huge losses at the periphery of the study area.
Table 3. Size and proportions, trend, and magnitude of LULC, 1990-2015, NCT of Delhi, India
LULC Classes 1990 2000 2015 1990-2000 2000-2015
Hectares % Hectares % Hectares % % %
Water Bodies 1899.4 1.3 1819.8 1.2 1583 1.1 -0.05 -0.15
Vegetation 26402.8 30.4 37225.5 25.1 31675.3 21.3 -5.31 -3.73
Cropland 45118.8 17.8 25012.4 16.9 22468.7 15.1 -0.936 -1.71
Fallow land 10980.9 7.4 9519.6 6.4 5308.0 3.6 -0.989 -2.83
Riverbed 1114.4 0.8 1016.2 0.7 1001.9 0.68 -0.066 -0.009
Built-up 62897.3 42.4 73819.5 49.7 86375.6 58.2 +7.539 +8.46
Source: Calculated and compiled by the scholar from Lands at imagery of 1990, 2000 and 2015
The study area has an area of 1,48,413.0 hectare (Table 3). The categories occupying majorshare include built-up area (42.4%), vegetation (30.4%), cropland (17.8%) while the minor shareoccupying categories include fallow land (7.4%), water bodies (1.3%) and riverbed (0.8%). Duringthe period 1990-2000, built-up experienced tremendous increase from 42.4% (1990) to 49.7%(2000).These categories include vegetation [30.4% (1990) and 25.1 (2000)], crop land [17.8% (1990)and 16.9% (2000)], fallow land [7.4% (1990) and 6.4% (2000)], river bed [0.8% (1990) and 0.7% (2000)]and water bodies [1.3% (1999) and 1.2% (2000)]. During the period 2000-2015, the similar trend wasobserved in land use/land cover changes. The built-up showed drastic increase in its area while theother categories (except river bed) followed similar declining trend as in the year 2000. Consequently,the built-up increased from 49.7% (2000) to 58.2% (2015) and the categories which experienceddecline in area includes water bodies [1.2% (2000) and 1.1% (2015)], vegetation [25.1% (2000) and21.3% (2015)], fallow land [6.4% (2000) and 3.6% (2015)]. Riverbed [0.7% (2000 and 2015)] did notwent any change.
Spatio-temporal Analysis of Urban Surface Biophysical ComponentThe spatial distribution of land surface temperature (Figure 4) five different temperature zones
have been taken viz. <16ºC, 16.1-18ºC, 18.1-20ºC, 20.1-22ºC and >22ºC.
The LST map of 1990 shows that major part of the study area except for the peripheral regionsin the extreme south-west, western region, north-west region and northern region lies in thetemperature zone of 18.1-20ºC followed by temperature zones of 16.1-18ºC and <16ºC in the extreme

90 INDIAN JOURNAL OF LANDSCAPE SYSTEMS AND ECOLOGICAL STUDIES VOL. 43
November 1990, 16th November 2000 and 9thNovember 2015
Figure-4. Land Surface Temperature (LST), NCT of Delhi, November 1990, 2000 and 2015

NO. 1 GEO-SPATIAL ANALYSIS OF ALTERATION IN URBAN BIOPHYSICAL COMPOSITION 91
south-west, western region, north-west region and northern region at the periphery. The temperaturezone of 20.1-22ºC covered area in the northern region, north-east region, eastern region, south-eastregion, southern region, south-west and western region of the study area. The temperature zone of>22ºC was not prevalent due to the presence of considerable vegetation cover and confined natureof built-up.
The LST map of 2000 shows that temperature zone of 16.1-18ºC becomes more prevalent in theperipheral regions and core regions of the study area. This temperature zone has acquired regionsthat were earlier under the temperature zones of <16ºC and were located in the northern, north-eastern, south-western regions at the periphery of the study area. Likewise, with the built-upexpansion, the temperature zone of 20.1-22ºC have become prevalent in northern part, north-eastern,eastern part, south-eastern part, southern part, south-western part and north-western part in theperipheral regions of the study area. The other high temperature zone >22ºC have also becomeprevalent in the north, north-eastern, south-eastern and southern parts of the study area.
The LST map of 2015 shows that temperature zones of >22ºC, 20.1-22ºC, 18.1-20ºC have becomemore prevalent in the study area. The temperature zone of <16ºC was almost absent while thetemperature zone of 16.1-18ºC have experienced shrinkage in the region due to destruction ofvegetation cover and built-up expansion. The temperature zone of >22ºC have become prevalentconfirming the rise in the land surface temperature during the period 1990-2015 in the study area.
Figure- 5. Mean values of land surface temperature during 1990, 2000, 2015
The mean values of land surface temperature (LSTmean) have shown an increasing trend.Water bodies show an increase from 17.65°C (1990) to 18.30°C (2000) confirming the slight increaseof 0.65°C while 18.30°C (2000) to 23.0°C (2015) showing an increase of 3.2°C. The overall increase inLSTmean was about 3.85°C during the period of 1990-2015.The vegetation cover shows an increase

92 INDIAN JOURNAL OF LANDSCAPE SYSTEMS AND ECOLOGICAL STUDIES VOL. 43
from 18.60°C (1990) to 19.60°C (2000) confirming the slight increase of 1.0°C while 19.60°C (2000) to23.0°C (2015) showing an increase of 3.4°C. The overall increase in LSTmean was about 4.4°C duringthe period of 1990-2015.The cropland shows an increase from 16.0°C (1990) to 17.85°C (2000)confirming the slight increase of 1.85°C while 17.85°C (2000) to 21.60°C (2015) showing the tremendousincrease of 3.75°C. The overall increase in LSTmean was about 5.6°C during the period of 1990-2015.The fallow land shows an increase from 17.50°C (1990) to 19.60°C (2000) confirming the slightincrease of 2.1°C while 19.60°C (2000) to 23.4°C (2015) showing the tremendous increase of 3.8°C.The overall increase in LSTmean was about 5.9°C during the period of 1990-2015.The riverbed showsan increase from 18.80°C (1990) to 19.60°C (2000) confirming the slight increase of 0.8°C while19.60°C (2000) to 25.11°C (2015) showing the tremendous increase of 5.5°C. The overall increase inLSTmean was about 6.3°C during the period of 1990-2015. The built-up shows an increase from18.90°C (1990) to 20.70°C (2000) confirming the slight increase of 1.8°C while20.70°C (2000) to 23.9°C(2015) showing the tremendous increase of 3.2°C. The overall increase in LSTmean was about 5.0°Cduring the period of 1990-2015.
Figure 6. Differences in mean values of land surface temperature during 1990-2000, 2000-2015, 1990-2015
Quantitative Relationship between NDVI and Land Surface Temperature
The relationship between the vegetation and land surface temperature (LST) is ‘inverse’ innature. This can be explained in terms of ‘cooling effect’ due to available healthy vegetation. Theregion with the availability of green healthy vegetation are characterized by the high rate of evapo-transpiration which adds moisture to the surrounding air making it cool air by extracting heat andconsequently producing ‘cooling effect’ and this cooling effect regulates the atmospherictemperature. Moreover, available green vegetation also serves as a hindrance in the path of incomingsolar radiation and thus, results in reduced heating of the ground surface.

NO. 1 GEO-SPATIAL ANALYSIS OF ALTERATION IN URBAN BIOPHYSICAL COMPOSITION 93
Source:Landsat Imagery, 7th November 1990, 16th November 2000 and 9th November 2015
Figure 7. Normalized Difference Vegetation Index, NCT of Delhi, November 1990, 2000 and 2015

94 INDIAN JOURNAL OF LANDSCAPE SYSTEMS AND ECOLOGICAL STUDIES VOL. 43
During the year 1990 (Figure 7), the healthy vegetation was at the periphery while the non-vegetated cover dominant at the core of the study area. During the period 1990-2000, the expansionof built-up took place in the peripheral regions marking the growth of non-vegetated cover in thestudy area. Likewise, during the period 2000-2015, urbanization catalyzed the pace of built-upexpansion which resulted in vegetation destruction in the peripheral regions of the study area.Moreover, a strip of yellow colour shows that unhealthy vegetation is present around the non-vegetated cover.
Figure 8 shows the correlation (pixel by pixel) between LST with NDVI for the study area. LSThas a negative correlation with NDVI (vegetation cover). This means wherever there is high NDVIthe surface temperature is low and vice versa.
Table 4. NDVI and LST relationship for 1990, 2000 and 2015 in the NCT of Delhi, India
Years R2 P value S value
1990 0.822** 0.73* 0.73*
2000 0.834* 0.86* 0.86*
2015 0.885** 0.91 0.91*
Source: Calculated and Compiled by the scholar
Note: P = Pearson, S = Spearman; (*)Regression analysis significant with an = 0.1; (**) Regression analysissignificant with an <0.5
A close relationship was found between land surface temperature andthe normalized differencevegetation index (R2>0.8). For the period 1990-2015, Pearson and Spearman indexes were higherthan 0.7 and ranged from 0.72 to 0.92 and 0.73 to 0.91 respectively and thus, both statisticalcorrelation measures demonstratea relation between LST and NDVI. This can be explained in termsof vegetation and thus NDVI could be used as an indicator of LST variability. In areas with vegetationcover, the radiative temperature registered by the satellite sensor has been found to better approximatethe in-situ temperature. Vegetation cover also shows high temperature variations since thermalresponses depend on the biophysical characteristics of the different species. This was observed inthe NCT of Delhi where the urban vegetation (UV) land cover presented the highest variability.However, it is worth highlighting that LST is affected by urban expansion and that vegetation isconsidered an important mitigation factor of urban heat island intensity.
Impact on Micro-climate of the Study AreaThe alteration in biophysical components due to urbanization hasa cascading impact on factors
governing micro-climate viz. local energy budget, local wind movement, local hydro-logical cycleand thus, altering the micro-climate of the study area. In case of NCT of Delhi, the urban heat islandeffect is the main cause of micro-climatic changes. The fast pace of urbanization and related

NO. 1 GEO-SPATIAL ANALYSIS OF ALTERATION IN URBAN BIOPHYSICAL COMPOSITION 95
Figure- 8. Scatter plot NDVI and LST relationship during (a) 1990 (b) 2000 (c) 2015
(a)
(b)
(c)

96 INDIAN JOURNAL OF LANDSCAPE SYSTEMS AND ECOLOGICAL STUDIES VOL. 43
developmental processes have resulted in a reduction in vegetation cover and expansion ofimpermeable and dry surfaces. Thus, urban heat island came into existence with a warmer core andcomparatively cooler periphery in the study area. The absorption of incoming solar radiationsduring day time and emission of infrared radiations from impermeable surfaces makes the corehotter and attains the temperature of 27-50ºC while surroundings remain close to air temperatures.Chandler and Lombardo identified the possible causes of urban heat island effect viz. energytransfers, reduced evapo-transpiration (vegetation destruction) and energy production fromanthropogenic sources (impermeable surfaces). Further, Voogt classified urban heat islands intothree categories based on their location and impact viz. Canopy layer heat island (CLHI), boundary
Table 5. NCT of Delhi: Overall mean values of LST and NDVI, 1990-2015
S. No. LULC Class LSTmean NDVImean(1990, 2000, 2015) (1990, 2000, 2015)
1 Water bodies 18.93 -0.03
2 Vegetation 20.48 0.53
3 Cropland 18.35 0.21
4 Fallow land 19.66 0.29
5 Riverbed 21.20 0.19
6 Built-up 21.15 0.32
Source: Calculated and compiled by the scholar from Landsat imagery 1990, 2000 and 2015.
Source: https://weather.msfc.nasa.gov/urban/urban_heat_island.htmlFigure 9: Urban heat island profile

NO. 1 GEO-SPATIAL ANALYSIS OF ALTERATION IN URBAN BIOPHYSICAL COMPOSITION 97
layer heat island (BLHI) and surface heat island (SHI). The present research study discusses thesurface heat island effect in the study area.
Source: https://ppreymond.weebly.com/urban-heat-islands-activity.html
Figure 10. Land surface temperature (LST) variations during day and night
Here, the changes in surface heat island (SHI) effect have been explained in the light of landsurface temperature, land use/land cover changes and normalized difference vegetation index forthe period 1990-2015. The land area under built-up increased from 62897.3 hectares (1990) to 86375.6(2015) while the vegetation decreased from 45118.3 hectares (1990) to 31675.3 (2015) confirming theexpansion of Grey infrastructure and destruction of vegetation cover. An increase in LSTmeantemperature (1990-2015) for various categories of land use/land cover viz. water bodies [17.65°C(1990) to 21.5°C (2015)], vegetation [18.60°C (1990) to 23.0°C (2015)], crop land [16.00°C (1990) to21.6°C (2015)], fallow land [17.50°C (1990) to 23.4°C (2015)], river bed [18.80°C (1990) to 25.1°C(2015)] and built-up [18.90°C (1990) to 23.9°C (2015)]. In other words, the LSTmean temperatureduring the period 1990-2015 increased by +3.85°C (water bodies), +4.40°C (vegetation), +5.60°C(crop land), +5.90°C (fallow land), +6.30°C (riverbed), +5.00°C (built-up) and thus, intensifying theUrban Heat Island (UHI) effect.
ConclusionThe metropolitan cities are characterized by the major portion of land under built-up and minor
portion of land under vegetation and consequently facing micro-climatic changes. For example,NCT of Delhi, Kolkata, Bangalore etc. here, major focus needs to be on mitigation of micro-climaticchanges through adoption of green building norms like green rating for integrated habitat assessment(GRIHA) and leadership in energy and environmental design (LEED) certification for built-up and

98 INDIAN JOURNAL OF LANDSCAPE SYSTEMS AND ECOLOGICAL STUDIES VOL. 43
provision of roof garden, vertical garden, track side habitat and road side habitat to increase thevegetation cover. This will help in enhancing the 'cooling effect' due to increased evapotranspirationfrom the vegetation cover and thus, facilitate the mitigation process of micro-climatic changes inthe metropolitan cities.
ReferencesChebet, C. (2013). An Assessment of Land Use and Land Cover in and Around Kakamega Forest in Kanya
Using GIS and Remote Sensing.Journal of Emerging Trends in Engineering and Applied Sciences,4(1), 46-53.
Meyer, W.B. and Turner, B.L., (eds.) (1994). Changes in Land Use and Land Cover: A Global Perspective.Cambridge University Press, Cambridge, London, UK.
Lambin, E.F., Turner, B.L., Geist, H., et.al. (2001). The Causes of Land Use and Land Cover Change: MovingBeyond the Myths. Globe Environmental Change, 11(4),261-269.
XuChao, Yang (2009). Sensitivity of Surface Air Temperature Change to Land Use/Cover Types in China.EarthSciences, 52 (8), 1207-1215.
Rhee, Jinyoung et.al. (2014). Relationship Between Land Cover Patterns and Surface Temperature in UrbanAreas.GIS Science and Remote Sensing, 51(5), 521-536.
Qian, Cheng (2014). Impact of Land Use/Land Cover Change on Changes in Surface Solar Radiation in EasternChina Since the Reform and Opening Up.Theoretical and Applied Climatology, 123 (1&2),131-139.
Liu, Fegshan et.al (2014). Effects of Land Use/Cover Change on Land Surface Energy Partitioning and Climatein Northeast China.Theoretical and Applied Climatology, 123 (1&2), 141-150.
Shen, Guangrong et.al.(2015). Spatio-Temporal Land Use/Land Cover Dynamics and Their Impacts on SurfaceTemperature in Chongming Island of Shanghai, China.International Journal of Remote Sensing, 36(15), 4037-4053.
Lambin, E.F. and Ehrlich, D. (1996).The Surface Temperature-Vegetation Index Space for Land Cover andLand Cover Change Analysis.International Journal of Remote Sensing, 17 (3), 463-487.
Yue, W. et.al. (2007). The Relationship Between Land Surface Temperature and NDVI with Remote Sensing:Application to Shanghai Landsat 7 ETM+ Data.International Journal of Remote Sensing, 28 (15),3205-3226.
Zhang, Youshui et.al.(2015). Characterizing Fractional Vegetation Cover and Land Surface Temperature onSub-Pixel Fractional Impervious Surfaces from Landsat TM/ETM+. International Journal of RemoteSensing, 36 (16), 4213-4232.

NO. 1 SINGLE BEAM BATHYMETRIC DATA MODELLING FOR IDENTIFICATION 99
Single Beam Bathymetric Data Modelling for Identificationof River Bank Erosion Prone Sites near Manikchak Region
in Malda District, West BengalSamrat Majumdar 1*and Sujit Mandal2
Abstract : River Ganga is very much dynamic in the upstream segment of Farakka barrage near the Maldadistrict. The Fluvial action of Ganga continuously eroded a large chunk of the landmass of the Diara tract ofthe Malda district every year. River Ganga is very much dynamic during the early monsoon and post-monsoonperiods of a year. As a result, numerous char lands have emerged each year within the channel in thissegment. In the present study, we have considered a specific extension of river Ganga adjacent to the Manikchakblock of the Malda district. Firstly we have pointed out the thalweg position of the river bed across the givencross-segment between the mainland and both newly emerged and old stable mature Charland becausethalweg position of channel influences on flow depth, flow velocity and flow direction of the channel whichcontrol bank erosion process and rate. Secondly, we have measured bottom relief characteristics betweenmainland and char lands along the given cross-sections through preparing river bed profiles on the basis ofchannel depth data deriving from the echo sounder survey. Basically, we have found that the maximum thalwegposition is located adjacent to the Charland along the all given cross-sections which indicate that there has achance of a large amount of erosion along Char lands compare to the mainland. Besides these abovementioning analysis, we have also tried to derive the bathymetry ofthe given river segment and point out thepossible locations of bank erosion.
Keywords : Ganga river, Thalweg position, Single beam echo sounder, Bathymetry, Char land
IntroductionThe determining factor in river development is the carrying capacity of the sediment
load.Whenthe waterway crosses a maximum value of sediment load, it becomes transformedinto abraided channelfrom a single channel meandering river (Leopold et al.,1963). Bank erosion happensmainly in meandering rivers. The rate of channel migration is increasing rapidly with the increasingarea of the meandering river.The rate of erosion and deposition depends on the size and flow of theriver and the amount of sediments which it carries. Erosion occurs most rapidly during flood
1 Research Scholar, Department of Geography, University of Gour Banga2 Professor and Head, Department of Geography, Diamond Harbour Women's University.* Corresponding author: [email protected]
Ind. J. of Landscape Systems and Ecological Studies 43 (1) March - 2020, 99- 113 ISSN 0971-4170

100 INDIAN JOURNAL OF LANDSCAPE SYSTEMS AND ECOLOGICAL STUDIES VOL. 43
season, but bank slumping can continue through the dry season in places where rapid river flowcontinues to undermine river banks.
The river bank materials can be classified into cohesive and non-cohesive materials. Thenatural river bank is made with both cohesive and non-cohesive bank materials (Grissinger et al.,1963). However, there have sharp distinctions between the erosional behaviour of cohesive andnon-cohesive sediments (Raudkivi, 1990; Mirtskhoulava1991; Mitchener andTorfs,1996; van Leddenet al., 2004). The erosionalbehaviour of non-cohesive bank sediments depends on the shape, sizeand density of soil particles. On the other hand,electrochemical bondingis a significant controllingfactor that influencesthe erosion behaviour of cohesive bank sediments. But electrochemical bondingis more significant than the shape, size and density of soil particles in the context of riverbankfailure.
India is also a significant river landamong Asian countries. Numerous major rivers along withtheir numerous tributaries construct the Indian river system. The two most significant rivers whichare subject to frequent bank erosion are the Ganga River and the Brahmaputra River which arebraided rivers (Sharma 2013; Mili et al. 2013; Phukan et al. 2012). So far, various remedies likeembankment have been constructed for flood control. The erosion problem of the embankmentsystems has been seen in somenorth-eastern states like West Bengal, Bihar, Assam, etc. (WRIS,2014).
In case of West Bengal, Farakka Barrage has its special importance due to the existence ofthe Kolkata Port. The 2.64-km long Farakka Barrage was designed to divert 40,000 cusecs (or 1,133cumecs) of Ganga water towards the Bhagirathi River to flush the sediment load into the deeperpart of the estuary and rejuvenate the navigational status of the Kolkata Port (Banerjee, 1999;Rudra, 2004). It was built with the objective of inducing the excess water into the Hugli River. Theobstruction seems to lead the river to carve out its own way, mainly in the upstream of Farakkabarrage. Basically, the construction of the Farakka Barrage has resulted in the formation of a localbase level, thereby disturbing the dynamic equilibrium of the fluvial system. Hence, the river istrying to remove the Barrage from its course. This can be done by increasing its sinuosity. In theprocess, a large chunk of land gets eroded and lost due to channel shifting (Rudra2004). The mainsufferers are the two districts of West Bengal, Malda and Murshidabad (Banerjee and Chakraborty1983; Banerjee 1999). This change in the Ganga River course and resulting river bank failure is along-term natural disaster in the state of West Bengal.
Since the river bank erosion in Malda districts has been a burning issue during the last fewdecades, a large number of papers have come out dealing with the hazard of bank erosion in the lastfew decades. Showkat (2010) studied the effect of flood and associated land erosion as well as thesocio-economic aspects of this area. In the upstream of the Farakka Barrage, a major part of fallsunder Malda district, particularly in the four blocks vizManikchak, Kaliachak-II, Kaliachak-III andRatua-I. Iqbal (2010) observed that the rate of river bank erosion is very high and frequent, whichcauses a huge amount of river bank cutting and consequent population migration from the villages

NO. 1 SINGLE BEAM BATHYMETRIC DATA MODELLING FOR IDENTIFICATION 101
near the river. Parua (2002) found that the change of river course was followed by the alteration inthe river morphometry like its total width, sinuosity, braiding characteristics, etc. It also results inthe change in the shape of the boundary between Malda and Murshidabad Districts, as well as theboundary between West Bengal and the Jharkhand States. It results in social and political conflictalso. Sincethe 1950s, the pattern ofthe river channel was more or less straight, but later it continuouslyincreases its sinuosity. The right bank of the river is underlain by erosion-resistant basalt rock ofthe Rajmahal Hills (Kent et al. 2002), which comes in eastern Jharkhand state, previously southernBihar. They consist predominantly of quartz-normative tholeiites interbedded with thin bentonitesor tuffs (Sengupta1998). Along the left bank of the river Ganga, villages like Birnagar, Panchanandapur,and Manikchak Ghat, etc. which are made by a weak alluvial loose soil structurehave becomenotorious in terms of these hazards due to channel shifting of the River Ganga and they have beenin the news for wrong reasons. A large chunk of land has been lost due to continuous bank erosionby the river Ganga.
The basic objective of the present study to assess the bottom relief character of the riverGanga along Manikchak block near Malda district and to identify the thalweg position of the riverchannel which controls the riverbank erosion process. Beside this, we are also tried to derivechannel bathymetry of the River Ganga adjacent to Manikchak Diara and identify the probable bankerosion sites within this segment.
The Study areaMalda is a central district of West Bengal which is situated Indo-Bangladesh border with
extending an area of about 3733 sq. km approximately (Census of India, 2001). The western boundaryof the district has bounded by the Ganga River where frequent bank erosion is continuouslyhappening from the last few decades to till now. Malda district has 15 numbers of blocks, amongthese blocks Manikchak, Kaliachak II and Kaliachak III blocks are located at the western side of thedistrict which are very much affected by bank erosion of Ganga. Basically, these three blocks arepart of Diara physiographic division which is basically low lying new alluvial plain. Among them,the River bank segment along the Manikchak block has taken into consideration in the presentstudy (Fig. 1). The geographical location of the study area is 24051’N to 25014’N and 87046’E to88006’E. Manikchak block comprises 89 mouzas, among them 15 riverine mouzas are very muchaffected by the dynamic action of river Ganga in this upper segment. The emerging char landswithin the river catchment are also being affected by riverbank erosion in this segment. So bothmainland and char lands are affected by the dynamicity of river Ganga in this segment. Generally,within a year, mainly two times e.g. from the end of June to middle August which indicatesthemonsoon period and the second time is from the end of September to early November whichindicates the post monsoon period. The causes of monsoon time river bank erosion has maximumwater pressure on river bank site and on the other hand, the river water enters through the gap ofthe river bank materials, increase the water pressure on the material gap and collapse the riverbanksite vertically. In this way, more or less amount of river bank erosion happened every year alongwith this Manikchak river bank site.

102 INDIAN JOURNAL OF LANDSCAPE SYSTEMS AND ECOLOGICAL STUDIES VOL. 43
Fig.
1.
Map
of
the
study
are
a

NO. 1 SINGLE BEAM BATHYMETRIC DATA MODELLING FOR IDENTIFICATION 103
Data Source and Methodology
Techniques of data collectionThe whole database in the present study has been collected through the field survey. At first,
we have subdivided the whole river segment adjacent to the Manikchak block into three stretches.The first stretch is taken on the Ganga-Fulhar river junction point near Bhutni char land and herewe have considered 4 cross sections namely AB, CD, EF and GH respectively. After the secondstretch has been considered between a narrow river catchment between Manikchak main land andits adjacent newly emerged char land, here we have taken 8 cross sections namely IJ, KL, MN, OP,QR, ST, UV and WX towards downward from previous stretch. Finally, we have taken another fourcross sections namely YZ, A’A, A’B and A’C at further downward section between Manikchak mainland and old stable char lands where channel becomes relatively wider than the second stretch. Thelocation of all given cross-sections have been shown in Fig. 1. Along each cross section, riverdepth has been measured through the single beam echo sounder instrument at 1 meter intervalhorizontally.
Fig. 2. Flow diagram of applying methodology

104 INDIAN JOURNAL OF LANDSCAPE SYSTEMS AND ECOLOGICAL STUDIES VOL. 43
Determination of thalweg position and bottom relief character of the river channelAt the time of field survey using echo sounder instrument, all collecting channel depth data
are stored as both tabular format and graph format in the internal storage of the instrument. Thegeographical location of both starting point and end point of each cross profile has been takenthrough GPS tracking. After completing the field study, we collected all tabulated channel depthdata from internal storage of instrument and recorded these on MS Excel sheet and merge with theirlocational latitudinal and longitudinal extensions. On the basis of these datas, we have preparedcross profile on the basis of channel depth value ( representing in Y axis) in respect to all points(representing on X axis) along each cross section and give suitable layout on it as required.
Preparation of channel bathymetry through single beam bathymetric data modellingSingle beam bathymetric data modelling has been applied to prepare channel bathymetry. At
first we have derived a georeferenced study area map from Google Earth. All locational values,whichare collected through GPS at the time of field survey, are merged with the georeferenced imagethrough maintaining projection system and datum in Arc GIS 10.3 software environment. After thatchannel depth values have been joined with each point id and their locational extension in theattribute table of point-based vector layer (which containing individual geographical locationalvalues) and extract the bathymetry map using Inverse Distance Weighting (IDW) method on thebasis of depth value of each given point location in Arc GIS 10.3 software and give proper layout.The whole methodology has been shown through the flow diagram in Fig. 2.
Interpretation of the Results
Assessment of thalweg position between main land and char landThe river bank erosion is closely related with the position of channel thalweg along cross
section of the river. Thalweg position influences depth, flow velocity and flow direction whichultimately promotes bank erosion processes. At Paschimnarayanpur Mouza, the thalweg positionof the channel is very close to river bank which caused steep bank slope and high velocity of waterand bank erosion (Fig.3a). Towardsthe south of Manikchak Ghat, thalweg position has been foundclose to the mid-channel bar/charland. This situation depicted the vulnerability condition of themid-channel bar /charland (Fig.3b). The bottom relief of the channel bed is not smooth. There is afluctuation of depth along the transects which revealed the variation of sediment deposition andtransportations.
Bottom relief condition of the channel and associated bank erosion
Segment 1: Upper reaches near the meeting place of Ganga- Fulhar riverSeveral cross sectional studies have been made adjacent to Manikchak mainland to assess
channel bottom relief, thalweg position and tendency of migration of channel and associated bankerosion. Bhutni Char is situated in the North West of Manikchak Block. The Fulharriver is passingbetween Bhutni Char and Manikchak mainland. From the confluence of the Fulhar river 14 transects

NO. 1 SINGLE BEAM BATHYMETRIC DATA MODELLING FOR IDENTIFICATION 105
were considered and profile studies were being completed using single beam echo sounder. Thestudy produced a significant result. The thalweg position of Fulharriver between Bhutni Char andManikchak mainland (Transect AB) is towards the Bhutni Char (Fig.4a) where erosion is found.Between Bhutni Char and Ganga river bed charland (towards Rajmahal, Transect CD), the steepslope is found close to the Bhutni Char and it showed the propensity of Bhutni char erosion(Fig.4b). Along the transect EF, between river bed charland (confluence of Fulhar River) andManikchak mainland, the position of channel thalweg is towards the charland which indicates thevulnerability of river bed charland (Fig.4c). Here, there is a tendency to develop new charland innear future. Between Manikchak mainland and River bed charland (along the profile GH), the riverbank side slope is very steep and the depth of the water is very high for a long distance from theriver bank (Fig.4d). The bed relief is not regular which depicts the continuous erosion and depositionof sediments over the river bed. The river bed is continuously increasing its height at a slow rate.
Fig. 3. River bed configuration of Ganga at a Paschim Narayanpur char, b near Manikchak

106 INDIAN JOURNAL OF LANDSCAPE SYSTEMS AND ECOLOGICAL STUDIES VOL. 43
Fig. 4. Bottom relief character near the meeting place of Ganga- Fulhar river (a AB, b CD, c EF, d GH)

NO. 1 SINGLE BEAM BATHYMETRIC DATA MODELLING FOR IDENTIFICATION 107
Segment 2: Middle reach between main land and new emerging char landsThe profile IJ between Manikchak mainland and Charland shows the regular removal of
sediments which caused the bank slope steeper in character. Just immediate of IJ, along the profileKL between mainland and char land in Manikchak the river bed is more dynamic because of largescale transport of sediments due to scouring of the channel bed. As a result of large scaletransportation of sediments the channel depth close to river bank is very high which has made thebank slope steep and making the mainland vulnerable to erosion (Fig. 5a& Fig.5b).
Along the transects of MN, OP, ORand ST, maximum depth area is being found very close tothe bank line of Manikchak Diara. The situation reveals that the land areas exist close to the bankline are more susceptible to channel migration. The velocity of running water is very high in thisarea. The bank slope is also high which promotes undercutting and scouring processes and inducebank erosion hazards in Manikchak Diara (Fig.5c, 5d, 5e&5f).
Along the transects of UV and WX, the thalweg position is situated close to the bank line andthe maximum wetted area between mainland and char land is being found towards the mainland ofManikchak Diara (Fig.5g&5h). The existence of greater depth and steep bank slope are the favorableconditions of bank erosion processes. Not only that the stratigraphie of the river bank plays animportant role in bank erosion process.
Segment 3: Lower reach between main land and stable char landsThe profile (YZ) between Manikchak and Rajmahal based on the data derived from echo
sounder survey depicted that the bottom topography of the river Ganga immediate lower section ofManikchak Ghat is characterized by sedimentation and development of several submerged chars(Fig.6a). The bank side slope is very steep and the uneven bottom relief towards the opposite bankshowed erosion and deposition which regularly changed flow direction and flow velocity and helpsto cause bank erosion. The depth is more or less uniform throughout the profile. Along the profileA/A between Manikchak mainland and towards River bed charland, there is a tendency to developa big charland and this very situation has changed flow velocity and flow direction in this sectionand helped to cause river bank erosion (Fig.6b).
Along the profile A/B the downstream of ManikchakGhat, river bank side slope is very steepwhich is one of the major reasonsfor bank failure in this section. Towards the charland there is awell-developed submerged char that depicted the river bed is characterized by an active sedimentationprocess (Fig.6c). The immediate down of A/B, it was found that a huge amount of bottom sedimentshas been transported from the river bank sides and has the bank slope steeper which has also madethe Manikchak mainland more vulnerable to the bank erosion process (Fig.6d).
Bathymetry of the River and probable locations of bank erosionThe bottom relief study with the help of echo-sounder survey along with several from north
to south between Manikchak Mainland and towards Charland depicted some ideas for introducing

108 INDIAN JOURNAL OF LANDSCAPE SYSTEMS AND ECOLOGICAL STUDIES VOL. 43
Fig.
5. B
otto
m r
elie
f ch
arac
ter
betw
een
mai
n la
nd a
nd n
ew e
mer
ging
cha
r la
nds
(a IJ
, b K
L, c
MN
, d O
P, e
QR
, f S
T, g
UV,
h W
X)

NO. 1 SINGLE BEAM BATHYMETRIC DATA MODELLING FOR IDENTIFICATION 109
Fig. 6. Bottom relief character between main land and stable char lands (a YZ, b A’A, c A’B, d A’C)

110 INDIAN JOURNAL OF LANDSCAPE SYSTEMS AND ECOLOGICAL STUDIES VOL. 43
bank erosion processes and associated land loss in Manikchak Diara of Malda district in WestBengal.
After analyzing single beam bathymetric data model, it shows that in most places the nearbank depth and the slope are high which helps in undercutting, slab failure and scouring as well asland loss in Manikchak diara of Malda District, West Bengal. The position of channel thalweg isvery close to the river bank which introduces much velocity of running water and promotes bankerosion mechanisms along Manikchak diara. The development of submerged char lands away fromthe river bank promotes and changes flow direction and flow velocity which ultimately narrowsdown the moving path of water and increases the velocity and bank erosion processes in Manikchakdiara. The existence of cohesive and non-cohesive layers in the left bank of the river Ganga inducesentrainment and piping process which causes tensional cracks on the surface and generates slabfailures and land loss in Manikchak diara.
The channel bathymetry from Fulhar confluence to the Manikchak Ghat showed the variationof depth and erosion and deposition of sediments over the river bed. In the middlemost section ofthe study area, there are two well developed submerged chars and it is continuously extendingtowards the north (Fig.7). Such submerged chars may segment the main flow of the river andchange the flow direction and flow velocity of running water. There is a probability of the formationof a narrow flow path close to the river bank and an increase in the velocity of water as well as riverbank erosion in Manikchak Diara of Malda District. At Fulhar confluence area, there is a tendencyof developing new charland which may cause the river more dynamic. The study reveals that thereis a continuous change in the deposition of sediments and its removal from the river bed as well asthe variation of depth which is caused as a result of variation of flow velocity, flow direction andsedimentology.
ConclusionIn this study, we have seen that how river encroachment is causing bank erosion problem at
Manikchak block in Malda district, and the causes behind it through the bathymetric data modelling.If the present rate of bank erosion goes on a horrible situation will arise, then the entire left bankwill be swallowed by the encroaching river. The uninterrupted encroachment of the river towardsthe left bank may outflank the barrage and open a new course through the present Ganga-Fulharroute. An indication of such a situation has been given in an unpublished report of the WestBengal state irrigation department. Along the maximum stretches, the water depth and slope ofriverbank are very high and thalweg position near to the main left bank line and these all conditionsindicate the probability of huge land loss along the left bank line of Ganga near Manikchak region.If such a situation happens in reality it is clear that the interfluves land between Ganga and Fulharwill be completely eroded. It is very necessary to combat a hazardous situation induced by bankerosion. Many measures have already taken, some of those are working well in practical, but weshould think about some more fruitful measures for combating the bank erosion. Some process-specific management strategies have been recommended here. Bank erosion in Manikchak has

NO. 1 SINGLE BEAM BATHYMETRIC DATA MODELLING FOR IDENTIFICATION 111
Fig. 7. Bathymetry map of the river Ganga adjacent to Manikchak Diara.

112 INDIAN JOURNAL OF LANDSCAPE SYSTEMS AND ECOLOGICAL STUDIES VOL. 43
taken a form of hazard across the entire block, there some time it is difficult to install the processspecific strategy in all fields and it is costly too. The deficit of funding is the major problem formanagement. Now a day’s Government is allotting the maximum possible fund for combating bankerosion in this area. But only funding will not work, besides it is necessary to whether the managementstrategies are being executed properly, and then only the remaining villages along the bank side willbe safe from the bank erosion.
ReferencesBanerjee, S.N., Chakroborty, P. (1983). Some observations on recent trends of shifting of the Ganga between
Rajmahal and Ahiron. J Geol Soc India 24:318–321Banerjee, M. (1999). A Report on the Impact of Farakka Barrage on the Human Fabric (A Study on the
Upstream and Downstream Areas of Farakka Barrage), Unpublished Report, Submitted to WorldCommission on Dams, South Asia Network on Dams, Rivers and People, New Delhi.
Census of India (2001). Provisional population totals, West Bengal, Table—4.Maldah District (06).Governmentof West Bengal.http://web.cmc.net.in/wbcensus/DataTables/02/Table4_6.htm. Retrieved 2011-07-21
Grissinger EH, Asmussen LE, Espey WH (1963). Discussion of channel stability in undisturbed cohesivesoils by EM Flaxman. JHydraulDiv ASCE 89:259–264
India-WRIS Wiki: Flood Management”, project homepage, National Remote Sensing Centre. URL (accessed18 September 2014): http://india-wris.nrsc.gov.in/wrpinfo/index.php? title =Flood_Management&oldid=38886.
Iqbal S (2010). Flood and erosion induced population displacements: a socio-economic case study in theGangetic riverine tract at Malda district, West Bengal, India. J Hum Ecol 30(3):201–211
Kent WR, Malcom SP, Muller DR, Saunders DA, Ghose CN (2002). 40Ar/39Ar geochronology of theRajmahal Basalts, India, and their relationship to the Kerguelen Plateau. J Petrol 43(7):1141–1153
Leopold, L. B. and Wolman, M. G. (1963). “River Channel Patterns: Braided, Meandering andStraight”, Geological Survey Professional Paper, 282-B, Washington, DC (USGS). Online version(accessed 18 September 2014): http://pubs.er.usgs.gov/publication/pp282B.
Mili, N., Acharjee, S. and Konwar, M. (2013). “Impact of flood and river bank erosion on socioeconomy: Acase study of Golaghat revenue circle of Golaghat district, Assam”, Int. Journal of Geology, Earth &Environmental Sciences, 3(3): 180–185. URL (accessed 18 September 2014): http://www.cibtech.org/jgee.htm.
Mirtskhoulava TE (1991). Scouring by flowing water of cohesive and noncohesive beds. J Hydraul Res29(3):341–354
Mitchener H, Torfs H (1996). Erosion of mud/sand mixtures. Coast Eng 29:1–25Parua PK (2002). Fluvial geomorphology of the river Ganga around Farakka. J Inst Eng 82:193–196Phukan, A., Goswami, R., Borah, D., Nath, A. and Mahanta, C. (2012). “River Bank Erosion and Restoration
in the Brahmaputra River in India”, Clarion, 1(1): 1–7. URL (accessed 18 September 2014): http://clarion.ind.in/index.php/clarion/article/view/17.
Raudkivi AJ (1990). Loose boundary hydraulics, chapter 9, 3rd edn. Pergamon, New York, pp 237–296Rudra, K. (2004). The encroaching Ganga and social conflicts: the case of West Bengal. India. Independent
Broadcasting Associates, Littleton, p 40.http://www.ibaradio.org/India/ganga/extra/resource/Rudra.pdf.Accessed on 11 Oct 2010

NO. 1 SINGLE BEAM BATHYMETRIC DATA MODELLING FOR IDENTIFICATION 113
Sarma, D. (2013). Rural Risk Assessment due to Flooding and Riverbank Erosion in Majuli, Assam, India,Master’s thesis, University of Twente, University of Twente. URL (accessed 18 September 2014):http://www.itc.nl/library/papers_2013/msc/gfm/sarma.pdf.
Sengupta, S, (1998). Upper Gondwana stratigraphy and paleobotany of the Rajmahal Hills, Bihar India.GeolSurvIndia Monogr Paleaontologica Indica 98:180
Showkat I (2010) Flood and erosion induced population displacements: a socio-economic case study in theGangetic riverine tract at Malda District, West Bengal, India. J Hum Ecol 30(3): 201–211. _Kamla-Raj
vanLedden M, Van Kesteren WGM, Winterwerp JC (2004) A conceptual framework for erosion behaviour ofsand-mud mixtures.Cont Shelf Res 241:1–11

114 INDIAN JOURNAL OF LANDSCAPE SYSTEMS AND ECOLOGICAL STUDIES VOL. 43
Trends and Patterns of Female Work Participation in KochBihar District, West Bengal: A Geographical Analysis
Sangita Karmakar1*and Ranjan Roy2
Abstract : Female work participation is an indicator of economic development. Females are the backbone ofour society and female work participation is nothing but the symbol of women empowerment which drives thesociety towards development. In Koch Bihar district female work participation rate is 20.67 per cent againstmale work participation of 58.24 per cent as per 2011 census. In this paper, an attempt has been made toshow the trend of female work participation, temporal variation of female work participation and genderdisparity in work participation in the district based on data collected from different secondary sources. Theblock wise female occupational structure has been shown here with some cartographic techniques. To measuredisparity Sopher's Disparity Index (modified by Kundu & Rao, 1986) has been applied. Statistical analysis likestandard deviation, CV, correlation has been done on excel to fulfil the objectives. The study reveals thatthough the female work participation is very low in the study area but it is a little bit higher than the stateaverage and has an increasing trend. There exists male-female disparity in work participation in both ruraland urban areas. Out of 12 blocks 3 blocks having high disparity. Besides this, the spatial pattern of economicactivities shows that most of the rural women are predominantly engaged in agriculture work.
Keywords : Female work participation, disparity, Sopher's Index, agricultural worker, occupational structure
IntroductionThe work participation rate is the key indicator of the growth and development of any country.
Females are the spine of any society and female work participation plays a significant role indetermining the progress of the nation. Less female work participation is the sign of stagnation ofdevelopment which counteracts the progress of any society. In our society, females are mainlyneglected and their workforce participation is controlled by various socio-economic factors. Poverty,illiteracy, lack of facilities, conservative thinking of elderly persons, rigid religious perception,etcisthe main constraints of participation of females in economic activity.On the other hand, womenrights are included in human rights, it gives the right to work with everyone on any platform. So, itis very much important to encourage and to engage them in all kinds of economic activities available
1* Research Scholar,2 Professor of Department of Geography & Applied Geography, University of North Bengal, Siliguri* Corresponding authors: [email protected]
Ind. J. of Landscape Systems and Ecological Studies 43 (1) March - 2020, 114- 126 ISSN 0971-4170

NO. 1 TRENDS AND PATTERNS OF FEMALE WORK PARTICIPATIONIN KOCH 115
in our society. The participation of women in the working sector not only reduces gender inequalitybut also promotes their economic strength(Narayan, 2016).Therefore, reducing gender disparity inthe workforce and making women empowered have been included in Millennium DevelopmentGoals by United Nation (Deshbandhu et al, 2017).In India female work participation is very lesscompared to male .The female work participation rate is directly associated with female literacy butChakraborty & Chakraborty (2010) stated that in West Bengal high work participation is noticed inareas where female literacy is comparatively low and work participation is showing low in Muslimcommunity dominating areas. Female work participation is also low among SC/ST and backwardclass people. Active participation of women in work with developed education and skill can enrichtheir status in the home and outside (Ghosh & Khatun, 2018) . Koch Bihar is a socioeconomicallypoordistrict where female work participation is 20.64 per cent (2011 census) which is quite higherthan the state average but still there exists high gender disparity in work participation in both ruraland urban areas. So in this paper, an attempt has been made to analyse the female work participationrate, gender disparity in workforce participation and variation in the occupational structure of KochBihar district.
The Study areaKoch Bihar is a district of West Bengal in the foothills of the Himalaya. Koch Bihar lies in the
North-Eastern part of West Bengal, bounded by the district of Alipurduar in the North, Jalpaiguri inthe North- West, State of Assam in the East and International border in the form of Indo-Bangladeshboundary in the South-West, South and South-East. It lies between 25o57’47" N and 26Ú36’20" Nand 88o47’44" E to 89o54’35"E with a total area of 3387 square kilometres having population of2,819,086 of which 1,451,542 are males and 1,367,544 are females. The density of population is 832persons per square kilometres and sex ratio is 942 and child sex ratio is 948 females per 1000 malesas per 2011 census. The district comprises 12 blocks namely Haldibari , Mekhliganj ,Mathabhanga-I , Mathabhanga-II, KochBihar-I , KochBihar-II ,Tufanganj-I ,Tufanganj-II , Dinhata-I , Dinhata-II ,Sitai and Sitalkuchi
Objectives1. To study the trend of female work participation in Koch Bihar district.
2. To study gender disparity in work participation rate in rural and urban areas of thedistrict.
3. To assess the block wise variation in female occupational structure in the district.
MethodologyThe study is mainly based on secondary data collected from various sources. District census
handbooks for the year 2001 & 2011, different literatures, government records have been used here.Work participation rate and disparity index have been calculated by the following formula. Statistical

116 INDIAN JOURNAL OF LANDSCAPE SYSTEMS AND ECOLOGICAL STUDIES VOL. 43
tools like standard deviation, CV, correlation has been done to fulfil the objectives. Finally, mapshave been prepared on Arc GIS 10.1 version.
Female Work participation rate
(Total female worker/ Total no. of female population)*100
Disparity Index
DI = log(X2/X1) +log (Q-X1)/ (Q-X2)
Where, X2>X1 and Q =200
This (Sopher’s Disparity Index modified by Kundu&Rao, 1986) method is most suitable tomeasure the inequality between two variables. The value of DI ‘0’ means the perfect equalitybetween two variables. Greater the value indicates higher gender inequality.
Fig 1: The Study Area

NO. 1 TRENDS AND PATTERNS OF FEMALE WORK PARTICIPATIONIN KOCH 117
Results and Discussion
Comparative analysis of work participation rate with state averageThe comparative study will help to understand the situation of the district with state average.
The following table shows that there is no such wide difference in WPR in Koch Bihar compared toWest Bengal and WPR in Koch Bihar is higher than the state average. According to 2011 censustotal WPR in West Bengal is 38.08 per cent but in Koch Bihar it was 40.01 per cent. Male andfemale WPR in the district were 58.24 per cent and 20.67 per cent respectively which is also higherthan state average.
Table 1: Work participation rate of Koch Bihar & West Bengal
Region Total Male Female
West Bengal 38.08 57.07 18.08
Koch Bihar 40.01 58.24 20.67
Source: Census of India, 2011
Fig.2: Comparative study of work participation rate,2011
Temporal change of FWPR
Table 2 shows the block wise temporal variation of FWPR in the study area. FWPR for someblocks have been increased and some blocks show a negative change during 2001 to 2011. Highest

118 INDIAN JOURNAL OF LANDSCAPE SYSTEMS AND ECOLOGICAL STUDIES VOL. 43
WPR in 2011 is recorded in Sitai block(31.77 per cent)followed by Mathabhanga I(29.85 per cent),Sitalkuchi (22.9 per cent), Koch Bihar I(22.83 per cent) etcand lowest WPR has been recorded inKoch Bihar II block(14.84 per cent) followed byHaldibari (18.06 per cent),and some other blocks.Out of 12 blocks, 5 blocks are showing positive change whereas 7 blocks are showing a negativechange in FWPR in this period.The highest positive change in FWPR has been shown in Haldibariblock but in Dinhata II block highest negative change has been recorded. In 2001 it was 37.91 percent but in 2011 it decreased to 17.82 per cent which is a matter of concern that in this block shareof non-working population has been increased during this period.
Table 2: Temporal variation of FWPR (2001-2011)
Female work participation ( per cent)
Blocks 2001 2011 Blocks 2001 2011
Haldibari 7.83 18.06 Tufanganj - I 14.17 20.2
Mekliganj 18.67 23.83 Tufanganj - II 20.79 19.92
Mathabhanga - I 32.00 29.85 Dinhata - I 23.20 19.54
Mathabhanga - II 23.22 20.33 Dinhata - II 37.91 17.82
Koch Bihar - I 16.06 22.83 Sitai 28.69 31.77
Koch Bihar - II 24.78 14.84 Sitalkuchi 28.31 22.9
Source: Census of India, 2011
Fig .3: Temporal Change in FWPR in Koch Bihar district

NO. 1 TRENDS AND PATTERNS OF FEMALE WORK PARTICIPATIONIN KOCH 119
Table 3: Measures of dispersion
Year Mean S D CV
2001 22.97 8.24 35.87
2011 21.82 4.88 22.37
Source: Census of India, 2011
There exists heterogeneity in the distribution of female work participation among the blocks.This nature of spatial distribution can be measured by using some measures of dispersion(Chattaraj & Chand, 2015). The SD value for 2001 and 2011 is 8.24 and 4.88 respectively and thevalue of the coefficient of variation is 35.84 in 2001 and 22.37 in 2011 which means that FWPR ismore consistent in 2011 in the district. It depicts no doubt a satisfactory picture in FWPR in thestudy area.
Trends of female work participation rate with compared to State
The trend of FWPR in the district with comparison to West Bengal has been shown here (Fig4). There has a fluctuation trend in FWPR. In 1951 and 1961 district FWPR was lower than the stateaverage but after 1971 district shows an increasing trends and it is noticeable that district FWPRwas higher than the state in all the decades.
Fig. 4: Trend of FWPR (West Bengal & Koch Bihar)

120 INDIAN JOURNAL OF LANDSCAPE SYSTEMS AND ECOLOGICAL STUDIES VOL. 43
Male female Disparity in work participation in rural areas of Koch Bihar district (2011)
There is a gap between male and female work participation rates in rural areas in the district.Male work participation is high in each of the block compared to female. The existing disparity inwork participation in rural areas in the district has been shown here (Fig 5). As per census 2011work participation of male is 58.24 per cent and female is 20.67. So the gender gap in work participationis 37.57 per cent which is a very much serious problem because work participation rate is a way ofmaking women empowered. Though the rate of FWPR is increasing,the disparity in work participationis a matter of concern.
Table 4: Gender disparity in WPR in rural areas of Koch Bihar district
Blocks Total Male Female Gender Disparityworker worker worker Gap Index
Haldibari 37.91 57.11 18.06 39.05 0.605
Mekliganj 41.34 57.42 24.19 33.23 0.466
Mathabhanga - I 44.94 59.12 29.85 29.27 0.379
Mathabhanga - II 39.76 58.07 20.33 37.74 0.558
Koch Bihar - I 41.50 58.51 23.34 35.17 0.496
Koch Bihar - II 37.71 58.11 15.25 42.86 0.696
Tufanganj - I 40.48 59.47 20.19 39.28 0.576
Tufanganj - II 39.91 58.43 20.21 38.22 0.565
Dinhata - I 39.77 58.67 19.67 39.00 0.580
Dinhata - II 39.69 59.97 17.82 42.15 0.641
Sitai 45.67 59.14 31.77 27.37 0.347
Sitalkuchi 39.53 55.60 22.90 32.70 0.474
Source: Census of India, 2011
Based on the calculated disparity index value the district has been categorized into 3 broadcategories i.e, high disparity zone (>0.580), moderate disparity zone (0.480-0.580) and low disparityzone (<0.480). Out of 12 blocks 3 blocks having high disparity. The highest disparity is found inKoch Bihar II block followed by Dinhata II and Haldibari block. Low disparity has been found inSitai block followed by Mekhaliganj and Sitalkuchi. The rest are the blocks fall under the moderatedisparity zone. Fig 5 reveals that the work participation rates in the blocks are heterogeneous innature.

NO. 1 TRENDS AND PATTERNS OF FEMALE WORK PARTICIPATIONIN KOCH 121
Fig.
5:
Disp
arity
in
Wor
k pa
rtici
patio
n ra
te i
n ru
ral
area
s in
Koc
h B
ihar
dist
rict

122 INDIAN JOURNAL OF LANDSCAPE SYSTEMS AND ECOLOGICAL STUDIES VOL. 43
Male female Disparity in work participation in urban centres of Koch Bihar district (2011)
Table 5: Gender disparity in WPR in urban areas of Koch Bihar district
Urban Centers work participation rate in per cent Gender Disparity
Total Male Female gap Index
Nagar Changrabandha 33.75 55.31 12.01 43.3 0.777
KharimalaKhagrabari 35.44 57.19 13.54 43.65 0.742
Guriahati 38 58.42 17.14 41.28 0.644
Dhaliabari 47.64 61.85 32.44 29.41 0.364
Baneswar 34.85 54.3 13.48 40.82 0.712
Khagrabari 34.79 56.48 12.43 44.05 0.774
Baisguri 36.33 56.69 14.85 41.84 0.693
Chakchaka 33.72 57.5 8.4 49.1 0.964
Takagach 36.62 57.05 15.06 41.99 0.690
Kamatphulbari 40.93 59.75 21.03 38.72 0.559
Chhotalaukuthi 35 58.72 10.38 48.34 0.880
Bhangriprathamkhanda 36.83 60.3 11.42 48.88 0.853
Haldibari (M) 35.76 54.97 15.99 38.98 0.640
Mekhliganj (M) 35.21 55.47 14.05 41.42 0.706
Mathabhanga (M) 36.16 57.45 14.45 43 0.714
Koch Bihar (M) 35.16 55.43 14.83 40.6 0.680
Tufanganj (M) 35.78 56.99 13.82 43.17 0.730
Dinhata (M) 33.9 56.4 10.69 45.71 0.842
Source: Census of India, 2011
Table 5 shows the gender wise disparity of work participation in urban centres in Koch Bihardistrict. In each of the urban centres disparity in WPR is a common phenomenon but the highestdisparity is found in Chakchaka whereas lowest disparity is recorded in Dhalaibari urban centres. Itis interesting to see that the range of disparity in urban centres is higher than in the rural areas.
Relationship between FWPR and Disparity index
There is a relationship between female work participation rate and the disparity index. There isa strong negative relationship between these two variables (Fig 7). If the female work participationis high then the disparity will be definitely low .

NO. 1 TRENDS AND PATTERNS OF FEMALE WORK PARTICIPATIONIN KOCH 123
Correlation between female work participation and some other socio-economic variables
Table 6: Correlation matrix showing a relation between FWPR and other socio-economic variables
Variables Female Sex Total Female per cent per cent of Urbanworker ratio literacy literacy MWPR of net Agricultural pop
shown area worker
Female worker 1
sex ratio 0.508* 1.000
Total literacy -0.687* -0.812** 1.000
Female literacy -0.418** -0.795** 0.991** 1.000
MWPR 0.407* -0.421 0.081 0.114 1.000
per cent of netshown area -0.240 -0.751** 0.762** 0.741** 0.119 1.000
per cent ofagricultural worker 0.147 0.144 -0.392 -0.317 0.430 -0.611 1.000
Urban pop -0.370 -0.655* 0.719** 0.731** 0.000 0.726** -0.369 1
Source: Census of India,2011
*Significant at the 0.05 level ( 2-tailed)**Significant at the 0.01 level ( 2-tailed)
Basically, female work participation is determined by various socio-economic factors which isdirectly or indirectly influence female work participation in any region. Here the relation between
Fig. 6: Disparity in Work participation rate in urban areas in Koch Bihar district

124 INDIAN JOURNAL OF LANDSCAPE SYSTEMS AND ECOLOGICAL STUDIES VOL. 43
female work participation and some variables have been shown (Table 6). There is a positiverelation between female work participation and sex ratio (0.508) and per cent of agricultural worker.Male work participation rate also found to be positively related with female work participation. Butfemale work participation has negative relation with , total literacy (-0.687) ,female literacy (-0.418),per cent of net shown area(-0.240) , per cent of urban population (-0.370) in the study area.
Block wise female occupational structure
A large share of women work participation in West Bengal is seen either in agricultural andtraditional rural household industries (Hussain & Siddiqui, 2013). According to census 2011,occupational structure can be classified into four broad categories i.e, cultivator, agricultural labour,household industry worker and other workers. Fig 8 shows the block wise distribution of femaleoccupational structure. In each of the block agricultural labours occupy major proportion followedby cultivator. Highest female agricultural female labour (66.36 per cent) can be found in Dinhata IIblock and lowest can be found in Tufanganj I block (37.32), but this block holds highest householdindustrial labour which is only ( 23.80 per cent). The share of industrial worker in the study area isvery much low this is mainly due to the lack of major industry, infrastructural facilities in the district.Female in the district area mainly engaged in home-based work like beedi making, tailoring, patiweaving etc.Sitai block is considered as the block having highest female cultivator. The picturedepicts that the distribution of economic activities are not homogenous. The female workparticipation in each of the block is low and most of them engaged as agricultural labour.
ConclusionFrom the above discussion, it is clear that though female work participation in the study area
is very much low but is in increasing trend. Block wise female work participation is heterogenous in
Fig.7: Relationship between FWPR and Disparity Index

NO. 1 TRENDS AND PATTERNS OF FEMALE WORK PARTICIPATIONIN KOCH 125
nature. Gender Disparity in work participation is a serious issue of concern for both rural and urbanareas. It is common in each and every block but Haldibari , Koch Bihar II , Dinhata II these 3 blockshaving high disparity in work participation.Highest FWPR in 2011 is recorded in Sitai blocks andlowest FWPR is found in Koch Bihar II block. Various socio-economic factors may effect on femalework participation rate. Total literacy and percentage of female literacy have a negative relation withFWPR. But MWPR and Sex ratio and percentage of agricultural labour have a positive relation withFWPR. The major shares of working females are mainly engaged in agricultural practices in thedistrict. Very little share of female is engaged in household industry. Overall female work participationis not as much satisfactory in the study area .So the government should make proper policies andfacilities to bring them to this platform.
ReferencesChakraborty, I., Chakraborty, A. (2010). Female Work Participation and Gender Differential in Earning in
West Bengal, India. Journal of Quantitative Economics, 8(2), 98-114.Chattaraj , K., Chand ,S . (2015). Literacy trend of West Bengal and its differentials: A district level analysis,
Journal of Humanities and Social Science, 20(9), 1-19.
Fig.8:Occupational structure of female worker in Koch Bihar District

126 INDIAN JOURNAL OF LANDSCAPE SYSTEMS AND ECOLOGICAL STUDIES VOL. 43
Deshbandhu, M., Kumar, A., and Rai, A.K. (2017). Female workforce Participation and Women Empowermentin Harayana. International Journal of Humanities and Social Science, 11(4), 1030-1035.
District Census Handbook, Koch Bihar, 2001 & 2011.Ghosh, S., Khatun , S. (2018). Trends and dynamics of Female Work Participatin in Backward class population:
A case study of scheduled caste females in Nadia district, West Bengal; Ind. J.of Landscape Systemsand Ecological Studies; 41(2),179-188.
Hussain, N., Siddiqui, F. A., (2013). Muslim Female Work Participation in West Bengal,India. Women’s Studies: An Inter-disciplinary Journal, 42(3), 291-313.Narayan, L. (2016). Womens labour force participation in Harayana: A Disaggregated Analysis. Impact Journal
of Interdisciplinary Research, 2(11), 1076-1085.Sopher, D. E. (1974). A Measure of Disparity. The Professional Geographer, 26(4): 389-392.

NO. 1 ORGANIZATIONAL CLIMATE OF TEACHER EDUCATION INSTITUTIONS 127
Organizational Climate of Teacher Education Institutionsin and Around Kolkata
Anusri Kundu1 and Anindya Basu2*
Abstract : Students' all-round development is predominantly ensured by the teachers' involvement in the job.One factor that contributes appreciably to teacher performance is the organizational climate and it also affectsthe level of satisfaction of the teachers of the particular institution. The present study involving the teachereducation institutions in Kolkata city and its outskirts investigates status of physical climate of the institutes,compares the organizational climate of government-aided and self-financed teacher education institutions andassesses the difference spatial difference in terms of organisational climate and job satisfaction of teachereducators. A sample of 317 teacher educators was drawn from 32 teacher education institutions in and aroundKolkata by using random sampling. For constructing institutional climate scale twenty-nine items have beentaken into account covering five dimensions -physical resources, co-curricular activities, inter-personalrelationship, sense of safety and satisfaction with job. Analyses have been done through five-point Likertscaling, weighted index method and chi-square test. The findings of the study that can be highlighted are - thereis much room for improvement of physical climate of the institutes; the organizational climate of the government-aided institutes are much well-off than the private counterparts and job satisfaction of the teacher educatorsare neither directly linked with spatial location of institutions nor with the quality of the organizational climate.
Keywords : Organizational climate, Job satisfaction, Teacher education institutions, Physical climate, Teachereducator
Introduction
Teachers are arguably one of the most vital pillars of education system of any country.Teachers must be physically, mentally, economically and socially balanced, to be able to offer aconstructive approach. Teachers give students purpose, set them up for success and inspire themto do well in life. For this purpose,certain degreeof autonomy has to be allowed to the teacher sothat he or she would be able to meet the numerous needs of youngsters (Panneerselvam &
1 Research Scholar, Department of Geography, Diamond Harbour Women's University,[email protected]
2 Assistant Professor, Department of Geography, Diamond Harbour Women's University,[email protected]
* Corresponding author
Ind. J. of Landscape Systems and Ecological Studies 43 (1) March - 2020, 127- 141 ISSN 0971-4170

128 INDIAN JOURNAL OF LANDSCAPE SYSTEMS AND ECOLOGICAL STUDIES VOL. 43
Muthamizhselvan, 2015). The main activities of the teachers are teaching, evaluating, communicating,guiding and counselling, organizing co-curricular activities, participating in community programmes,diagnosing and solving problems of students and so on. For fulfilling this kind of activities teachereducation is concerned with aspects like effective teaching and quality teachers (Chakraborty,2017). But the process of making quality teachers is possible only when the equal manner offreedom and flexibility are given to the teachers as well as to the students. His or her perspectivesand thoughts have to also be heard via his superiors and colleagues, who frequently take decisionsthat have an effect on the instantaneous institutional climate in the institution(Panneerselvam&Muthamizhselvan, 2015).Institutional climate can be visualized as a personalitysketch of the institution, as personality describes acharacter, so climate defines the essence of aninstitution (Sharma, 1982). A teacher will display creative, inspirational, and innovative work patternsif the work climate or the institutional climate growing in a positive direction (Gemnafle,et al., 2016).Organizational climate in depth is the perception of individuals or members of the organization onvarious aspects and activities within an organization (Owens, 2004). It is widely known reality thatthe quality of learner achievement is determined mostly by teacher competence, sensitivity andmotivation (Ghosh & Guha, 2016), above all if teachers are not satisfied and content then theholistic approach of teacher education cannot be fulfilled. The institutional climate influences thebehaviour of teachers (Akhilesh,2013). According to Tagiuri (1968) organizational climate composedof four dimensions: (I) Ecology which is related to physical factors of the institution includinginfrastructure and technology (II) Milieu refers to social environment of all the members of theinstitution including students’ motivation, teachers’ job satisfaction (III) Social System refers toadministrative structure of the institution (IV) Culture means values and belief system of the peopleengaged with the institution. So, openness of organizational climate plays a crucial role for thebetterment of any institution which largely depends on communication and interaction patternamongst its stakeholders. An open climate is characterised by teachers whoare professional, cordial,collegial, friendly and committed towards educating the students and the heads of the institutionswho are supportive, professional and does not restrict teachers with orders. On the other hand, aclosed climate is characterised by non-professional teachers who are disengaged, distant and alsowith restrictive and non-supportive head of the institute.
Previous Works
Halpin and Croft (1963) came up with six types of climates in an educational institute on acontinuum: open, autonomous, controlled, familiar, paternal, and closed. An open climate is onecharacterized by genuineness, low hindrance and high esprit of teachers along with high thrust andconsideration of the principal. In an autonomous climate, teachers tend to possess complete freedomto conduct their work and fulfil their social needs as they wish. The controlled organisationalclimate is highly task oriented with principals dominating over all activities. In the familiarorganisational climate, there is high degree of consideration and intimacy with little emphasis onproduction; a congenial and friendly atmosphere exists between principals and teachers. The paternalclimate is referred to as one in which the principal discourages the emergence of leadership acts

NO. 1 ORGANIZATIONAL CLIMATE OF TEACHER EDUCATION INSTITUTIONS 129
from the teachers and attempts to solely retain leadership while the teachers compete with oneanother. The closed climate is characterized by high disengagement, high hindrance, low spirit andaverage intimacy of teachers and high thrust of the principal with inadequate communication amongall. Sharma (1971), Sahani (1972), Tripathy (1973) and Shah (1981) through their studies on schoolsfrom various parts of India opined that open climate was more conducive for student’s success.Adifferent angle was exposed when Chopra (1982) and Ismael (1989) conducted a study onorganizational climate of schools and job satisfaction of teachers too.
Chakraborty (1990) discovered that in secondary schools of West Bengal the paternal climatewas most frequently perceived followed by controlled climate. Patel (1995) studied organizationalclimate in higher secondary schools of Gujarat and highlighted a gender-based distinction with thegirls’ schools having more of open climate. Similar views were echoed by Babu & Reddy (1998)while studying the organizational climate of schools in relation to type of school and sex of teachers.Selamat&Samsu (2013) investigated the impact of organizational climate on teachers’ overallperformance in secondary schools of place and confirmed that teachers were unable to perform wellwhen the organizational climate was not conducive. While carrying out a study on organizationalclimate of elementary schools and its resultant effect on job satisfaction of teachers Rani & Rani(2014) confirmed that organizational climate of standard schools is negligibly correlated with jobsatisfaction. Tiwary (2014) investigated organizational climate in higher education institutions ofMadhya Pradesh and derived that organizational climate had a widespread impact on job satisfactionand overall performance of the faculties.
The Study Area
In order to get a deep understanding of the selected phenomenon in Kolkata and itsneighbouring areas, a centroid on the basis of latitudinal and longitudinal extent of Kolkata hasbeen used and a circle with a radius of 14 kilometreshas been constructed to delineate the studyarea. The selected area includes parts of Haora, North 24 Parganas and South 24 Parganas districtsatthe outskirts Kolkata.
Objectives
To find out the status of physical climate in teacher education institutions.
To compare the institutional climate of government-aided and self-financed teacher educationinstitutions.
To assess the difference between Kolkata city proper (i.e. Kolkata Municipal Corporation)and its outskirts in terms of organisational climate and job satisfaction of teacher educators.
Hypothesis
HO1:There is no significant difference in the institutional climate of government-aided andself-financed institutions.

130 INDIAN JOURNAL OF LANDSCAPE SYSTEMS AND ECOLOGICAL STUDIES VOL. 43
Fig. 1: Delineating the study area - Kolkata and parts of the adjoining districts

NO. 1 ORGANIZATIONAL CLIMATE OF TEACHER EDUCATION INSTITUTIONS 131
H11: There is significant difference in the institutional climate of government-aided andself-financed institutions.
HO2: There is no significant differencein institutional climate of urban and rural teachereducation institutions.
H12: There is significant difference ininstitutional climate of urban and rural teachereducation institutions.
Methodology
The purpose of this study is to observe the institutional climate of teacher educationinstitutions and its effects on teacher educators.
Figure 2: Methodological structure of the study

132 INDIAN JOURNAL OF LANDSCAPE SYSTEMS AND ECOLOGICAL STUDIES VOL. 43
Population of the study consisted of all the teacher educators from all the teacher educationinstitutions popularly known as B.Ed. colleges of Kolkata and selected parts of Haora, North 24Parganas and South 24 Parganas.As a sample a smaller group has been obtained from the population.In this case simple random sampling has been done based on the availability of the subjects.Sample of 317 teacher educators had been selected from 32 B.Ed. colleges out of which 189 werefemale teachers and 128 were male teachers. The majority of teachers were between the ages of 30to 46years, with few outliers.
The basic instruments used for collecting the primary data regarding this issue are – semi-structured questionnaire, interview schedule, and observation. Questionnaire for teachers consistedof three sections - the first section of the questionnaire requested demographic data includingindividual information, second section consists of their perception regarding institutional climateand the last section covered various aspects to understand the level of job satisfaction amongteachers.
Secondary data was acquired from newspaper, annual reports and previous research works.For constructing institutional climate scale twenty-nine items have been taken into account coveringfive dimensions. These dimensions are: physical resources, co-curricular activities, inter-personalrelationship, sense of safety and satisfaction with job. The dimensions have been dealt by usingweighted index method and five-point likert scaling. For graphical expressions Excel v2013 and forstatistical analysis like t-test and Chi-square analysis IBM SPSS v23.0 were used.
Results and Discussion
Status of physical climate:
To know the status of institutional climate of teacher education institutions, at first conditionof all existing infrastructure was observed and related information collected through teachers’opinionfrom the particular college.All the data related to physical resources has been divided into twosections i.e. primary academic resources and other associated amenities. Initial binary values 0 and1 were allotted according to the absence and presence of the selected amenity. Then weightage wasgiven to each item as per the researcher’s discretion (higher the importance attached greater is theweight given). Eleven items under primary academic resources are: classroom (weightage-6), library(weightage-5.5), computer laboratory (weightage-5), science laboratory(weightage-4.5) socialsciencelaboratory (weightage-4), math laboratory (weightage-3.5), languagelaboratory (weightage-3), musiclaboratory (weightage-2.5), and seminar hall (weightage-2), free internet access(weightage-1.5) and auditoria lecture classroom (weightage-1) whilesix items under other associated amenitiesare: staffroom (weightage-3.5), purified drinking water (weightage-3), electricity with backup(weightage- 2.5), canteen (weightage-2), playground (weightage-1.5) and hostel (weightage-1). Aftergiving all the weightage against each item the combined score has been calculated as shown in thetable.

NO. 1 ORGANIZATIONAL CLIMATE OF TEACHER EDUCATION INSTITUTIONS 133
Table 1: Combined score of physical climate of teacher education institutions based on primaryacademic resources and other associated amenities.
Sl . Name of the Colleges District Primary Other CombinedNo. Academic Associated Score
Resources Amenities
1 Acharya Jagadish Chandra Bose Kolkata 27 10 37College, Kolkata
2 Adamas Institute of Teacher North 32.5 13.5 46Education 24 Parganas
3 Arya Bharat Sikshya Pratisthan North 16 8 2424 Parganas
4 Bijoy Krishna Girls’ College, Howrah Haora 34.5 11 45.5
5 Biswanath Institute of B.Ed. College South 16 8 2424 Parganas
6 Calcutta Girls’ B.T College, Kolkata Kolkata 32.5 10 42.5
7 Debnarayan Shiksha Sansthan South 20 8 2824 Parganas
8 Department of Education, University Kolkata 38.5 13.5 52of Calcutta
9 Dr. B.R. Ambedkar Institute of South 21 8 29Education 24 Parganas
10 El-Bethel College South 29 10.5 39.524 Parganas
11 George College Kolkata 21 8 29
12 Gopal Chandra Memorial College North 34.5 10 44.5of Education 24 Parganas
13 Institute of Education for Women, Kolkata 36 9 45Hastings House, Kolkata
14 Imperial Institute of Education and South 21 8 29Training 24 Parganas
15 Jyotirmoy School of Education South 22.5 10.5 3324 Parganas
16 K.S.S.Jain College of Education Kolkata 25 10 35
17 Lieutenant Abhishek Ray Chaudhuri South 21 11 32Teachers Training College 24 Parganas
18 Loreto College, Kolkata Kolkata 29.5 10 39.5

134 INDIAN JOURNAL OF LANDSCAPE SYSTEMS AND ECOLOGICAL STUDIES VOL. 43
19 Mass Education Teachers Training South 25 8 33Institute 24 Parganas
20 M Hossain Teachers Training Institute Kolkata 16 8 24
21 National College of Education North 25 10 3524 Parganas
22 Pailan College of Education South 33 13.5 46.524 Parganas
23 Ramkrishna Mission Sikshanmandira, Haora 37 13.5 50.5Howrah
24 Scottish Church College, Kolkata Kolkata 32.5 10 42.5
25 Shri Shiksayatan College, Kolkata Kolkata 33.5 12.5 46
26 Sishu Bikash College of Education South 21 9 3024 Parganas
27 St. Xavier’s College, Kolkata Kolkata 35 12.5 47.5
28 Sundarban Miority B.Ed. College South 16 8 2424 Parganas
29 Surendralal Das Teachers Training Haora 20 10 30College
30 Swami Vivekananda College of North 27.5 8 35.5Education for Women 24 Parganas
31 Syamaprasad Institute of Education Kolkata 21 8 29& Training
32 Viharilal College of Education Kolkata 25 11 36
Source: WBUTTEPA and primary survey, 2019
From the above scores, institutional climate based on physical resources has been dividedinto three categories: Excellent (37-55), Satisfactory (32-36) and Below par (20-31) and have beenrepresented graphically.
The above figure shows that 32% (10) and 40% (13) of teacher education institutions’ physicalclimate is low and average respectively while 28% (09) collegepossess high physical climate.
Another aspect that has been unravelled is the spatial dimension of the physical climate ofthe said institutions. In Kolkata, 77% (10 colleges, out of 13) institutions possess excellent physicalclimate followed by Haora- 66% (2 colleges, out of 3), North 24 Parganas- 40% (2 colleges, out of 5)and South 24 Parganas- 20% (2 colleges, out of 10). So, clearly the physical climate of the institutionslocated within Kolkata city proper are way ahead than its counterparts in the outskirts.
Table 1: Contd..

NO. 1 ORGANIZATIONAL CLIMATE OF TEACHER EDUCATION INSTITUTIONS 135
Institutional climate of government and self-financed teacher education institutions
Teacher education institutions are for teachers of various levels and these teacher educationinstitutions required recognition from National Council for Teacher Education. These institutionsare mainly two types; Government institutions are generally run by government authorities or getdirect government aid. The self-financed teacher education institutions are the establishments whichdo not get any financial aid from Governments. Instead, these institutions meet out their expensesfrom the fee charged from college students. However, these self-financed institutions are requiredto abide by the rules and regulations framed by the government authorities and regulatory/accreditingbodies now and again. But the flouting of regulations and rules through these establishments isnot uncommon. They are frequently accused of charging hefty rate and not offering requiredfacilities. The teachers working in there often accuse these institutions of not paying salaries as perthe government stipulated scale.
A test of significance has been run to ascertain whether there is any difference in theinstitutional climate of the above mentioned two categories of institutions.
H0:There is no significant difference in the institutional climate of government-aided and self-financed institutions.
H1: There is significant difference in the institutional climate of government-aided and self-financed institutions.
Fig. 3: Status of physical climate of the selected teacher education institutions.
Data source:Primary Survey, 2019
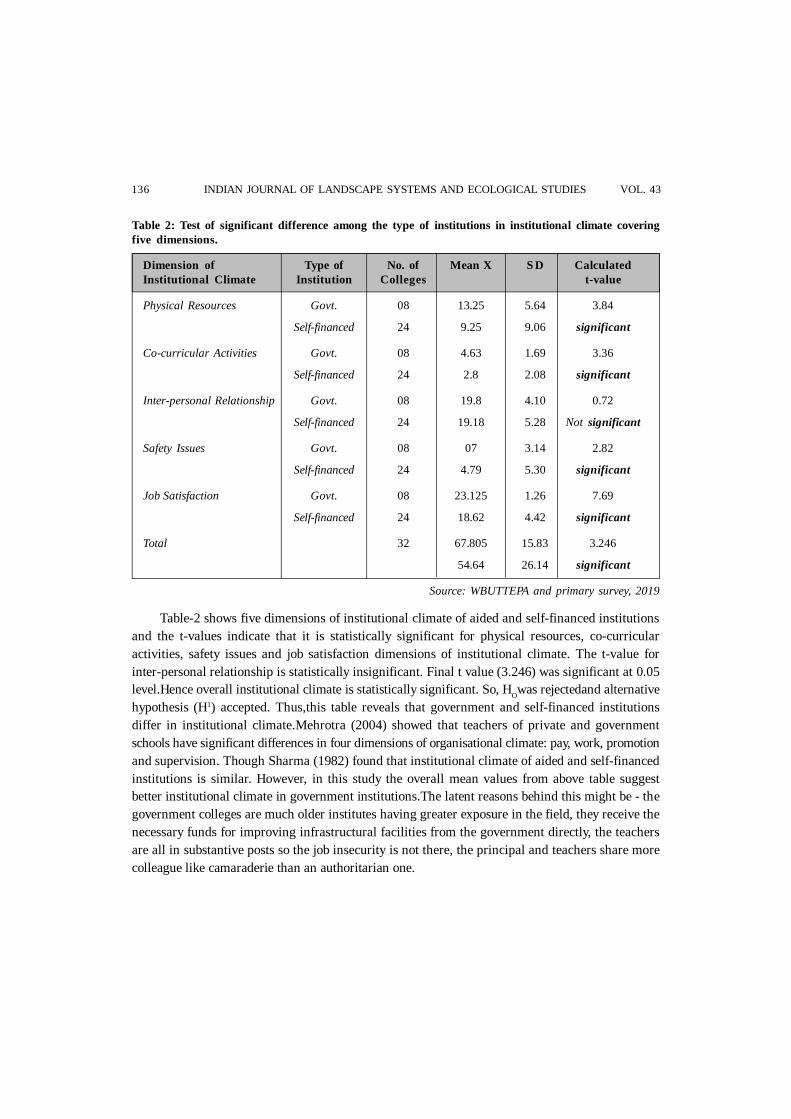
136 INDIAN JOURNAL OF LANDSCAPE SYSTEMS AND ECOLOGICAL STUDIES VOL. 43
Table 2: Test of significant difference among the type of institutions in institutional climate coveringfive dimensions.
Dimension of Type of No. of Mean X S D CalculatedInstitutional Climate Institution Colleges t-value
Physical Resources Govt. 08 13.25 5.64 3.84
Self-financed 24 9.25 9.06 significant
Co-curricular Activities Govt. 08 4.63 1.69 3.36
Self-financed 24 2.8 2.08 significant
Inter-personal Relationship Govt. 08 19.8 4.10 0.72
Self-financed 24 19.18 5.28 Not significant
Safety Issues Govt. 08 07 3.14 2.82
Self-financed 24 4.79 5.30 significant
Job Satisfaction Govt. 08 23.125 1.26 7.69
Self-financed 24 18.62 4.42 significant
Total 32 67.805 15.83 3.246
54.64 26.14 significant
Source: WBUTTEPA and primary survey, 2019
Table-2 shows five dimensions of institutional climate of aided and self-financed institutionsand the t-values indicate that it is statistically significant for physical resources, co-curricularactivities, safety issues and job satisfaction dimensions of institutional climate. The t-value forinter-personal relationship is statistically insignificant. Final t value (3.246) was significant at 0.05level.Hence overall institutional climate is statistically significant. So, HOwas rejectedand alternativehypothesis (H1) accepted. Thus,this table reveals that government and self-financed institutionsdiffer in institutional climate.Mehrotra (2004) showed that teachers of private and governmentschools have significant differences in four dimensions of organisational climate: pay, work, promotionand supervision. Though Sharma (1982) found that institutional climate of aided and self-financedinstitutions is similar. However, in this study the overall mean values from above table suggestbetter institutional climate in government institutions.The latent reasons behind this might be - thegovernment colleges are much older institutes having greater exposure in the field, they receive thenecessary funds for improving infrastructural facilities from the government directly, the teachersare all in substantive posts so the job insecurity is not there, the principal and teachers share morecolleague like camaraderie than an authoritarian one.

NO. 1 ORGANIZATIONAL CLIMATE OF TEACHER EDUCATION INSTITUTIONS 137
Varying institutional or organizational climate and job satisfaction among teacher educationinstitutionsfrom city proper and its outskirts
In proper Kolkata city, there are 5 government and 8 self-financed institutions. While thesurrounding region covers 3 government and 15 self-financed institutions. All these institutions’organizational climate considering 5 dimensions i.e. physical resources, co-curricular activities, inter-personal relationship, safety issues, and job satisfaction.
Tests of significance have been run to ascertain whether there is any difference in theinstitutional climate and job satisfaction level in the institutions due to spatial difference.
HO: There is no significant difference in institutional climate of urban and rural teacher educationinstitutions.
H1: There is significant difference in institutional climate of urban and rural teacher educationinstitutions.
Table 3: Test of significant difference of organizational climate of B.Ed. colleges from proper city andits outskirt region.
Locale variation No. of Colleges Mean X S D Calculated t-value
City Proper 13 19.9 16.08 2.39
Outskirt Region 19 16 29.04 Significant
The analysis in table-3shows that the calculated t value was 2.39 which was significant at 0.05level. Hence, the organizational climate between urban and rural institutions found to be different.So, HOwas rejected and H1 is accepted. Physical resources and safety issues are the leadingparameters which are mainly responsible for creating significant difference between Kolkata and itssurrounding region.
Table 4: Test of significant difference of job satisfaction of teacher educators of B.Ed. colleges fromproper city and its outskirt region
Locale variation No. of Colleges Mean X S D Calculated t-value
City Proper 13 40.2 42.78 1.31
Outskirt Region 19 36.8 65.04 Not significant
From the table-4 it was observed that in terms of job satisfaction of teacher educators, therewas no significant difference between urban and rural institutions because the calculated t value(1.31) was not significant at 0.05 level. So, it can be said that there was no significant differenceamong rural and urban teacher educators’ job satisfaction.

138 INDIAN JOURNAL OF LANDSCAPE SYSTEMS AND ECOLOGICAL STUDIES VOL. 43
There is a popular belief that with favourable organizational climate the degree of job satisfactionamong the teachers increases. But for the case in point, job satisfaction is not directly linked withorganizational climate; may be some other forces like pay package, working hours, transportationfacilities have more impact on the changing level of satisfaction. To ascertain the latent factorsfurther investigations are to be made.
Table 5: Chi Square test for calculating relationship between physical climate of an institute andteacher educators’ job satisfaction
Elements Value df AsymptoticSignificance (2-sided)
Pearson Chi-Square 768.000a 720 .105
Likelihood Ratio 200.306 720 1.000
Linear-by-Linear Association 15.110 1 .000
No. of Valid Cases 32
a. 775 cells (100.0%) have expected count less than 5. The minimum expected count is .03.
In this case, the value of the chi square statistic is 768.00 and the p-value which is displayedin Asymptotic Significance (2-sided) column, is greater than the standard alpha value (normally .05),so one has to accept the null hypothesis that asserts the two variables are independent of eachother. The result suggests that the two variables of institutional climate; physical climate andteacher educators’ job satisfaction are not associated with each other.
Major findings
The present study has given the following findings-
The status of physical climate is not similar across all teacher education institutions thoughthey are all affiliated under a single university and are bound to follow certain regulationsto maintain parity.
Condition of existing physical climate or supporting infrastructure of government institutionswas more favourable for teacher educators than that of self-financed institutions.
There is a significant difference in institutional climate as perceived by teacher educatorsof government and self-financed institution.
Teacher educators of self-financed institutions were less satisfied with their job than thoseof government institutions.
There is a significant difference in the status of organizational climate of teacher educationinstitutions from Kolkata city and its outskirt region. However, from the mean scores it was

NO. 1 ORGANIZATIONAL CLIMATE OF TEACHER EDUCATION INSTITUTIONS 139
revealed that the institutions from outskirt region were relatively low level than theinstitutions of Kolkata.
There was no significant difference in the level of job satisfaction of teacher educatorsfrom Kolkata and its surrounding zone. Besides, there was no significant positive associationbetween physical climate and Teacher educators’ job satisfaction. That means teachereducators’ job satisfaction does not directly depend on institution’s physical climate.
Conclusion
Finally, this study concluded that the organizational climate of teacher education institutionsdiffers formidably. Type of management influences the organizational climate significantly andspatiality also determines institutional climate because the locality of any institution affect itsinfrastructural facilities. Another facet that has come out from this study is that level of jobsatisfaction of teacher educators from government and private institutions differs remarkablyalthough this particular variable does not differ significantly with reference to locational differences.Teacher educators from self-financed institution mostly dissatisfied regarding their job. This studyindicates that every institution to enhance job satisfaction among teachers should maintain orcreate a healthy institutional climate which will not only ensure better performance of teachers butalso of students and other staff of the institution and in turn would help in the overall developmentof that institution. Further studies would reveal the factors responsible for dissatisfaction amongteacher educators of self-financed institutions and distinctness between organizational climates ofteacher education institutions from city proper and its outskirts.
References
Akhilesh, A. (2013). A comparative study of institutional climate of aided and self- financed teacher educationinstitutions, Asian Journal of Multidimensional Research, 2(7), pp.41- 46.
Amarnath, S. (1980). Comparative study of the organisational climate of government and privatelymanaged higher secondary schools in Jullunder district. Unpublished doctoral dissertation, PanUniversity.
Babu,V.R. & Reddy, A.V. (1998). Organisational climate of schools in relation to type of school and sex ofteachers. Perspective in education. 12(3), pp. 159-168.
Chakraborty, M. (1990). A study of the organisational climate of secondary schools in West Bengal and itscorrelation with other relevant variables. Calcutta University, Calcutta.
Chakraborty, T. (2017). Impact of organisational climate on effectiveness in teaching of secondary educationalinstitutions.The University of Burdwan, West Bengal, India.
Chopra, R.K. (1982). A study of the organisational climate of schools in relation to job satisfaction of teachersand students achievement. Agra University, Agra.
Das, P. (2010). Education and social inclusion in India a policy perspective. Journal of Indian Education.36(3).

140 INDIAN JOURNAL OF LANDSCAPE SYSTEMS AND ECOLOGICAL STUDIES VOL. 43
Davidson, E. (2007). The pivotal role of teacher in Tanzanian education. The Educational Forum, 71 (2), pp.157-166.
Gemnafle, M., Waimuri, S.P. &Batlolona, J.R. (2018). Organizational climate of the school and teacherperformance improvement in the 21st century. International Journal of Science and Research, 7(2),pp. 119-126.
Ghosh, M., & Guha, A. (2016). Organizational climate of teacher education institutions in West Bengal inrelation to teacher educators’ motivation to work. IRA International Journal of Education andMultidisciplinary Studies (ISSN 2455–2526), 4(1). doi:http://dx.doi.org/10.21013/jems.v4.n1.p15.
Halpin, A.W. & Croft, D.B. (1963). The organizational climate of schools. Chicago: University of Chicago.
Ismael, A.S. (1989). Organisational climate and teachers’ job satisfaction in the Bedouin elementary schools ofthe Negev in Southern Israel. Dissertation Abstract International, 50(9), pp. 2712.
Litwin, G.H. & Stringer, R.A. (2001). Motivation and organizational climate. Boston: Division of research,Harvard Business School Press.
Mehrotra, A. (2004). A comparative study of leadership styles of principals in relation to job satisfaction ofteachers and organizational climate in government and private senior secondary schools of Delhi.Indian Educational Abstracts, pp. 87-88.
Owens, R.G. (2004). Organizational behavior in education. New York: Pearson.
Panneerselvam, M. &Muthamizhselvan, M. (2015). Study on teaching competence and organisational climateof secondary school teachers. IJARIIE, 1(4), pp. 705-710.
Patel, R. (1995). A Study of organizational climate of higher secondary schools.The Progress of Education, 68(6), pp. 67-78.
Rani, R. & Rani, P. (2014). Influence of organizational climate of elementary schools on job satisfaction ofelementary teachers. International Journal of Science, Environment and Technology, 3(2), pp. 652 –658.
Raza, S.A. &Arid, M.A.S.(2010). Impact of organizational climate on performance of college teachers inPunjab. Journal of College Teaching and Learning 7(2), pp. 47-51. Retrieved from http://prr.hec.gov.pk/Thesis/201S.pdf
Rodrigues, G. & Gowda, P. (2010). A study of organizational climate in professional college librariesand information centres in Mangalore city. International Journal of Psychological Studies, 2(2),pp. 189.
Roul, S. (2007).Teacher effectiveness of autonomous and non-autonomous college. Journal of communityGuidance and Research, 24(3), pp. 326-339.
Roul, S.K. (2002). A comparative study of teacher effectiveness of autonomous and non-autonomous collegeteachers in relation to their mental health, organizational climate and students’ achievement. DoctoralDissertation. Kurukshetra University, Haryana.
Sahani, A. (1972). Organisational climate and students’ achievement in secondary schools in Delhi: A pilotstudy. Unpublished M.Ed. dissertation, New Delhi.
Selamat, N. (2013). The impact of organizational climate on teachers’ job performance. Annals of Library andInformation Studies, 2(1), pp. 24-33.

NO. 1 ORGANIZATIONAL CLIMATE OF TEACHER EDUCATION INSTITUTIONS 141
Shah, S.S. (1981). A study of the impact of school climate on students and their teacher’s in Aligarh district.Agra University, Agra.
Sharma, M.L. (1971). An investigation into organisational climate of secondary schools of Rajasthan.Unpublished Ph.D. thesis, M.S. University, Baroda.
Sharma, M. (1982). Diagnosing school climate, Naya Bas: International Consultants.
Tripathy, M.K. (1978). A study on organisational climate of some selected intermediate college of Varanasi.Unpublished M.Ed. dissertation, Banaras Hindu University, Varanasi.
Tagiuri, R. (1968). Organizational climate: explorations of a concept. Boston: Division of Research, GraduateSchool of Business Administration, Harvard University.
Volkwein, J.F. & Zhou, Y. (2003). Testing a model of administrative job satisfaction.Research in HigherEducation, 44(2), pp. 149-171.


BRIEF NOTES TO SUBSCRIBERS/ CONTRIBUTORS
• The Indian Journal of Landscape Systems and Ecological Studies (IJLS&ES) is an interdisciplinary journal devoted to the study of environment, both physical and cultural, and is published half-yearly in June and December. All correspondences regarding membership, subscription, payments & receipts are to be addressed to: Institute of Landscape, Ecology & Ekistics (ILEE), 52/2A, Hazra Road, Kolkata- 700019, West Bengal, India. All payments are to be made by Demand Draft or Account Payee Cheque drawn in favour of: INSTITUTE OF LANDSCAPE, ECOLOGY & EKISTICS.
• The subscribers/ contributors are requested to visit our website http://ilee.org.in for the rates of annual subscriptions and other relevant details.
• Correspondence regarding publication of paper(s) should be made to the Hony. Editor, IJLS&ES at the Department of Geography, University of Calcutta, Taraknath Palit Campus (4th Floor: Room No. 520), 35 Ballygunge Circular Road, Kolkata- 700019, or by E-mail: [email protected]
• Original contributions in the form of research papers, articles and book reviews of contemporary interest on earth, environment, planetary and human sciences are invited from serious researchers. Preference is given to the young scholars. Each contributor will get a copy of the journal. However, processing fees and costs towards redrawing of the figures/ maps and printing of colour pages will be charged extra, as may be applicable, with prior intimation to the contributors.
• The paper should be submitted only in electronic format (typed in font Times New Roman, TNR) in double spaced with the following specifications: Title of the paper in UPPER LOWER CASE (TNR- 16), followed by Name(s) of the author(s) along with affiliation, email, Abstract (within 200 words), 3 to 5 keywords, a brief Introduction with review of previous works and statement of the Problem, Objectives, Materials and Methods, Results, Discussions, Concluding remarks, Acknowledgement if any, and References (in the latest APA style: http://www.apastyle.org/learn/quick-guide-on-references.aspx only). Except the Title, all sub-headings need to be written in 'Upper/Lower Cases'. Tables, Figures and Maps must be properly as well as precisely captioned (in Upper/ Lower Case) and numbered. Ideally, the length of the paper should be within 3000 words and should not exceed 10 printed pages inclusive of all. The tables, figures, maps and plates should be used only in case of absolute necessity, and must be original and legibly reproducible. There should be no foot and end notes. In case of units only metric system should be used.
• Unless the paper is invited, each contributor must be a Fellow of ILEE. The editor shall not be responsible for the views expressed in the papers and any kind of infringement to copy rights or violation of academic ethics by the respective author(s). A certificate from the corresponding author with the declaration that the paper is based on original research work and has not been submitted and / or will not be submitted elsewhere for publication till a decision is received from the office of the Hony. Editor, IJLS&ES.
• Acceptance of the paper is subject to assessment by the peer reviewers and Editorial Advisory Board. The editor has the discretion to accept/ reject / modify a paper or to include it in any Vol. and No. of the journal to be published later on.
Regd. No. S/43732 of 1983-84 ISSN: 09714170 UGC Journal No. 20798
Founder editor: PROF. S. C. MUKHOPADHYAY, D. Sc.
Printed by: Sailee Press Pvt. Ltd.,
4A, Manicktola Main Road, Kolkata-700 054, E-mail : [email protected]